UNITED STATES
SECURITIES AND EXCHANGE COMMISSION
Washington, D.C. 20549
FORM 10-K
(Mark One)
| |
☒ | ANNUAL REPORT PURSUANT TO SECTION 13 OR 15(d) OF THE SECURITIES EXCHANGE ACT OF 1934 |
For the fiscal year ended December 31, 2024
OR
| |
☐ | TRANSITION REPORT PURSUANT TO SECTION 13 OR 15(d) OF THE SECURITIES EXCHANGE ACT OF 1934 |
For the transition period from to
Commission File Number 001-41828
t
Atlas Energy Solutions Inc.
(Exact name of Registrant as specified in its Charter)
| |
Delaware | 93-2154509 |
(State or other jurisdiction of incorporation or organization) | (I.R.S. Employer
Identification No.) |
5918 W. Courtyard Drive, Suite 500 Austin, Texas | 78730 |
(Address of principal executive offices) | (Zip Code) |
Registrant’s telephone number, including area code:
(512) 220-1200
Securities registered pursuant to Section 12(b) of the Act:
| | | | |
Title of each class | | Trading Symbol(s) | | Name of each exchange on which registered |
Common stock, par value $0.01 per share | | AESI | | New York Stock Exchange |
Securities registered pursuant to Section 12(g) of the Act: None
Indicate by check mark if the Registrant is a well-known seasoned issuer, as defined in Rule 405 of the Securities Act. Yes ☒ No ☐
Indicate by check mark if the Registrant is not required to file reports pursuant to Section 13 or 15(d) of the Act. Yes ☐ No ☒
Indicate by check mark whether the Registrant: (1) has filed all reports required to be filed by Section 13 or 15(d) of the Securities Exchange Act of 1934 during the preceding 12 months (or for such shorter period that the Registrant was required to file such reports), and (2) has been subject to such filing requirements for the past 90 days. Yes ☒ No ☐
Indicate by check mark whether the Registrant has submitted electronically every Interactive Data File required to be submitted pursuant to Rule 405 of Regulation S-T (§232.405 of this chapter) during the preceding 12 months (or for such shorter period that the Registrant was required to submit such files). Yes ☒ No ☐
Indicate by check mark whether the registrant is a large accelerated filer, an accelerated filer, a non-accelerated filer, a smaller reporting company, or an emerging growth company. See the definitions of “large accelerated filer,” “accelerated filer,” “smaller reporting company,” and “emerging growth company” in Rule 12b-2 of the Exchange Act.
| | | | | | |
Large accelerated filer |
| ☒ |
| Accelerated filer |
| ☐ |
Non-accelerated filer |
| ☐ |
| Smaller reporting company |
| ☐ |
Emerging growth company | | ☐ | | | | |
If an emerging growth company, indicate by check mark if the registrant has elected not to use the extended transition period for complying with any new or revised financial accounting standards provided pursuant to Section 13(a) of the Exchange Act. ☐
Indicate by check mark whether the registrant has filed a report on and attestation to its management’s assessment of the effectiveness of its internal control over financial reporting under Section 404(b) of the Sarbanes-Oxley Act (15 U.S.C. 7262(b)) by the registered public accounting firm that prepared or issued its audit report. ☒
If securities are registered pursuant to Section 12(b) of the Act, indicate by check mark whether the financial statements of the registrant included in the filing reflect the correction of an error to previously issued financial statements. ☐
Indicate by check mark whether any of those error corrections are restatements that required a recovery analysis of incentive-based compensation received by any of the registrant’s executive officers during the relevant recovery period pursuant to §240.10D-1(b). ☐
Indicate by check mark whether the Registrant is a shell company (as defined in Rule 12b-2 of the Exchange Act). YES ☐ NO ☒
The aggregate market value of the outstanding common stock held by non-affiliates of the registrant as of June 28, 2024, the last business day of the registrant's most recently completed second fiscal quarter, was approximately $1.5 billion based on the closing sale price of $19.93 per share, as reported on the New York Stock Exchange on such date.
As of February 21, 2025, the registrant had 121,740,086 shares of common stock, par value $0.01 per share, outstanding.
DOCUMENTS INCORPORATED BY REFERENCE
Portions of the registrant’s definitive proxy statement for its 2025 Annual Meeting of Stockholders (the “Proxy Statement”) are incorporated by reference into Part III of this Annual Report on Form 10-K and will be filed within 120 days of the registrant’s fiscal year end.
Table of Contents
GLOSSARY OF COMMONLY USED TERMS
Unless the context otherwise requires, all references in this Annual Report on Form 10‑K (this “Annual Report”) to:
•“2021 Term Loan Credit Facility” refer to the credit facility extended pursuant to the Credit Agreement, dated October 20, 2021, between Atlas Sand Company, LLC, as borrower, and Stonebriar Commercial Finance, LLC, as lender, as amended;
•“2023 ABL Credit Agreement” refer to the Loan, Security and Guaranty Agreement, dated as of February 22, 2023, among Atlas Sand Company, LLC, as borrower, certain of its subsidiaries, as guarantors, the lenders party thereto from time to time and Bank of America, N.A., as agent, sole lead arranger and sole bookrunner;
•“2023 ABL Credit Facility” refer to the credit facility extended pursuant to the 2023 ABL Credit Agreement;
•“2023 Term Loan Credit Agreement” refer to the Credit Agreement, dated July 31, 2023, among Atlas Sand Company, LLC, as borrower, the lender party thereto from time to time and Stonebriar Commercial Finance LLC, as administrative agent, as amended;
•“2023 Term Loan Credit Facility” refer to the credit facility extended pursuant to the 2023 Term Loan Credit Agreement;
•“ABL Amendment” refer to the First Amendment to Loan, Security and Guaranty Agreement, dated February 26, 2024, among Atlas LLC, the subsidiary guarantors party thereto, the lenders party thereto and the ABL Agent, which amends the 2023 ABL Credit Agreement;
•“ABL Agent” refer to Bank of America, N.A. the administrative agent in the 2023 ABL Credit Agreement;
•“A&R Registration Rights Agreement” refer to that certain Amended and Restated Registration Rights Agreement, dated as of October 2, 2023, among the Company, Old Atlas and certain of the Legacy Owners in connection with the consummation of the Up-C Simplification;
•“A&R Stockholders’ Agreement” refer to that certain Amended and Restated Stockholders’ Agreement, dated as of October 2, 2023, among the Company, Old Atlas and the Principal Stockholders in connection with the consummation of the Up-C Simplification;
•“ASC Incentive Plan” refer to the Atlas Sand Company, LLC Long-Term Incentive Plan;
•“ASMC” refer to Atlas Sand Management Company, LLC, a Texas limited liability company;
•“ASMC II” refer to Atlas Sand Management Company II, LLC, a Delaware limited liability company;
•“Atlas LLC” refer to Atlas Sand Company, LLC, a Delaware limited liability company and the predecessor of Old Atlas;
•“Atlas Operating” refer to Atlas Sand Operating, LLC, a Delaware limited liability company and the operating subsidiary of Old Atlas;
•“BLM” refer to the Bureau of Land Management, a federal agency within the U.S. Department of the Interior;
•“Board” refer to the Board of Directors of the Company;
•“Bylaws” refer to the Amended and Restated Bylaws of the Company;
•“CCAA” refer to the Candidate Conservation Agreement with Assurances relating to the DSL;
•“Charter” refer to the Amended and Restated Certificate of Incorporation of the Company;
•“Code” refer to the Internal Revenue Code of 1986, as amended;
•“Common Stock” refer to the common stock of the Company, par value $0.01;
•“Company,” “we,” “us,” “our” and like expressions refer to Atlas Energy Solutions Inc., a Delaware corporation and the public company successor of Old Atlas (f/k/a New Atlas HoldCo Inc.), together with its subsidiaries;
•“DDT Loan” refer to the commitments to provide up to $100.0 million of delayed draw term loan through the 2023 Term Loan Credit Facility;
•“Deferred Cash Consideration Note” refer to a secured PIK toggle seller note in an aggregate principle amount of $111.3 million as of December 31, 2024. This amount is subject to purchase price adjustments as defined in the Hi-Crush Merger Agreement, with a final maturity date of January 31, 2026;
•“DGCL” refer to the General Corporation Law of the State of Delaware;
•“DOL” refer to the U.S. Department of Labor;
•“DSL” refer to the dunes sagebrush lizard;
•“Dune Express” refer to the overland conveyor infrastructure solution;
•“E&P” refer to exploration and production;
•“EPA” refer to the Environmental Protection Agency;
•“ESA” refer to the Endangered Species Act of 1973, as amended;
•“ESG” refer to environmental, social and governance;
•“Exchange Act” refer to the Securities Exchange Act of 1934, as amended;
•“GAAP” refer to the generally accepted accounting principles in the United States of America;
•“Hi-Crush” refer to Hi-Crush Inc., a Delaware corporation;
•“Hi-Crush Merger Agreement” refer to the Agreement and Plan of Merger, dated February 26, 2024 by and among the Company, Atlas LLC, Wyatt Merger Sub 1 Inc., a Delaware corporation and direct, wholly-owned subsidiary of Atlas LLC, Wyatt Merger Sub 2, LLC, a Delaware limited liability company and direct, wholly-owned subsidiary of Atlas LLC, Hi-Crush, Clearlake Capital Partners V Finance, L.P., and HC Minerals Inc., a Delaware corporation;
•“Hi-Crush Stockholder” refer to each stockholder that had executed the Hi-Crush Merger Agreement;
•“Hi-Crush Transaction” refer to the acquisition of the Permian Basin proppant production and logistics businesses and operations of Hi-Crush, in exchange for mixed consideration totaling $456.1 million, subject to customary post-closing adjustments;
•“HoldCos” refer to Holdings, Holdings II, ASMC and ASMC II, collectively;
•“Holdings” refer to Atlas Sand Holdings, LLC, a Delaware limited liability company;
•“Holdings II” refer to Atlas Sand Holdings II, LLC, a Delaware limited liability company;
•“HSR Act” refer to the Hart-Scott-Rodino Antitrust Improvements Act of 1976, as amended;
•“Initial Term Loan” refer to the $180.0 million single advance term loan that was made on July 31, 2023 through the 2023 Term Loan Credit Facility;
•“IPO” refer to the initial public offering of Old Atlas Class A Common Stock by Old Atlas completed on March 13, 2023;
•“IPO Reorganization Agreement” refer to that certain Master Reorganization Agreement, dated March 8, 2023, among Old Atlas, Atlas Operating, Atlas LLC, ASMC, Holdings, Holdings II, ASMC II and Atlas Sand Merger Sub, LLC, a Delaware limited liability company;
•“IRS” refer to the U.S. Internal Revenue Service;
•“JOBS Act” refer to the Jumpstart Our Business Startups Act of 2012;
•“Legacy Owners” refer to holders of membership interests in Holdings, Holdings II, ASMC and ASMC II, who, prior to the IPO, directly or indirectly held membership interests in Atlas LLC;
•“Lock-Up Period” refer to the period beginning on the date of completion of the IPO, March 13, 2023, and ending 180 days from such date;
•“LTIP” refer to the Atlas Energy Solutions Inc. Long Term Incentive Plan, adopted by the Board in March 2023;
•“Master Reorganization Agreement” refer to that certain Master Reorganization Agreement, dated July 31, 2023, among the Company, Old Atlas, PubCo Merger Sub, Atlas Operating, Opco Merger Sub and Holdings;
•“Mergers” refer to the PubCo Merger and Opco Merger, collectively;
•“Moser” refer to Moser Engine Service, Inc. (d/b/a Moser Energy Systems), a Wyoming corporation and a wholly-owned subsidiary of Moser Acquisition, Inc., a Delaware corporation;
•“Moser Purchase Agreement” refer to the Stock Purchase Agreement, dated January 27, 2025 by and among the Company and among Wyatt Holdings, LLC, a Delaware limited liability company and wholly-owned subsidiary of the Company, and Moser Holdings, LLC, a Delaware limited liability company;
•“Moser Registration Rights Agreements” refer to the registration rights agreement pursuant to the terms of the Moser Purchase Agreement;
•“NYSE” refer to The New York Stock Exchange;
•“Old Atlas” refer to AESI Holdings Inc., a Delaware corporation and the Company’s public company predecessor (f/k/a Atlas Energy Solutions Inc.);
•“Old Atlas Class A Common Stock” refer to shares of Class A common stock, par value $0.01 per share, of Old Atlas;
•“Old Atlas Class B Common Stock” refer to shares of Class B common stock, par value $0.01 per share, of Old Atlas;
•“Old Atlas Common Stock” refer to the Old Atlas Class A Common Stock and Old Atlas Class B Common Stock, collectively;
•“Opco Merger” refer to the merger of Opco Merger Sub with and into Atlas Operating, with Atlas Operating continuing as the surviving company, pursuant to the Master Reorganization Agreement;
•“Opco Merger Sub” refer to Atlas Operating Merger Sub, LLC, a Delaware limited liability company;
•“OPEC+” refer to the Organization of Petroleum Exporting Countries and other oil producing nations;
•“Operating Units” refer to membership interests in Atlas Operating.;
•“Original Registration Rights Agreement” refer to that certain Registration Rights Agreement, dated March 8, 2023, by and among Old Atlas and certain Legacy Owners;
•“Original Stockholders’ Agreement” refer to that certain Stockholders’ Agreement, dated March 8, 2023, by and among Old Atlas and the Principal Stockholders;
•“Previous Atlas Operating LLC Agreement” refer to the Amended and Restated Limited Liability Company Agreement of Atlas Operating, dated March 8, 2023;
•“Principal Stockholders” refer to certain stockholders party to the A&R Stockholders’ Agreement or the Original Stockholders’ Agreement, as applicable;
•“PubCo Merger Sub” refer to AESI Merger Sub Inc., a Delaware corporation;
•“PubCo Merger” refer to the merger of PubCo Merger Sub with and into Old Atlas, with Old Atlas continuing as the surviving corporation and a wholly-owned subsidiary of the Company, pursuant to the Master Reorganization Agreement;
•“Sarbanes-Oxley Act” refer to the Sarbanes-Oxley Act of 2002, as amended;
•“Sealy Smith” refer to The Sealy & Smith Foundation;
•“SEC” refer to the U.S. Securities and Exchange Commission;
•“Second A&R Atlas Operating LLC Agreement” refer to the Second Amended and Restated Limited Liability Company Agreement of Atlas Operating, dated October 2, 2023;
•“Securities Act” refer to the Securities Act of 1933, as amended;
•“Stonebriar” refer to Stonebriar Commercial Finance LLC;
•“Term Loan Amendment” refer to the First Amendment, dated as of February 26, 2024, to Credit Agreement, among Atlas LLC, the lenders party thereto and Stonebriar Commercial Finance LLC, as administrative agent, which amends the 2023 Term Loan Credit Agreement;
•“TCEQ” refer to the Texas Commission on Environmental Quality;
•“Up-C Simplification” refer to the transactions contemplated by the Master Reorganization Agreement, including the Mergers; and
•“USFWS” refer to the U.S. Fish and Wildlife Service.
CAUTIONARY STATEMENT REGARDING FORWARD-LOOKING STATEMENTS
This Annual Report contains forward-looking statements that are subject to risks and uncertainties. All statements, other than statements of historical fact included in this Annual Report, regarding our strategy, future operations, financial position, estimated revenues and losses, projected costs, prospects, plans and objectives of management are forward-looking statements. Additionally the information in this Annual Report includes forward-looking statements related to the recently-announced Moser Acquisition (as defined in Item 7. “Management’s Discussion and Analysis of Financial Condition and Results of Operations.—Recent Developments”). When used in this Report, the words “may,” “forecast,” “continue,” “could,” “would,” “will,” “plan,” “believe,” “anticipate,” “intend,” “estimate,” “expect,” “project” and similar expressions are intended to identify forward-looking statements, although not all forward-looking statements contain such identifying words. These forward-looking statements are based on our current expectations and assumptions about future events and are based on currently available information as to the outcome and timing of future events. When considering forward-looking statements, you should keep in mind the risk factors and other cautionary statements described in Item 1A. “Risk Factors” included in this Annual Report. By their nature, forward-looking statements involve known and unknown risks and uncertainties because they relate to events and depend on circumstances that may or may not occur in the future. Although we believe that the forward-looking statements contained in this Annual Report are based on reasonable assumptions, you should be aware that many factors could affect our actual financial results or results of operations and could cause actual results to differ materially from those in such forward-looking statements, including but not limited to:
•uncertainties as to whether the Moser Acquisition will achieve its anticipated benefits and projected synergies within the expected time period or at all;
•our ability to successfully integrate the business of Moser in a successful manner and in the expected time period;
•unforeseen or unknown liabilities, future capital expenditures and potential litigation relating to the Moser Acquisition;
•the effect of the announcement or completion of the Moser Acquisition on each of Moser’s or our business relationships and business generally;
•business disruptions or loss of key employees in connection with the Moser Acquisition;
•limitations on our financial flexibility due to existing and future debt following the consummation of the Moser Acquisition;
•our ability to successfully execute our Common Stock repurchase program or implement future Common Stock repurchase programs;
•the ultimate cost and time needed to execute the desired process improvements at our production facilities following the fire that occurred at our Kermit facility on April 14, 2024;
•the ultimate impact of the Kermit facility incident on the Company’s future performance;
•higher than expected costs to operate our proppant production and processing facilities or the Dune Express;
•the amount of proppant we are able to produce, which could be adversely affected by, among other things, operating difficulties and unusual or unfavorable geologic conditions;
•the volume of proppant we are able to sell and our ability to enter into supply contracts for our proppant on acceptable terms;
•the prices we are able to charge, and the margins we are able to realize, from our sales of proppant, logistics services, or mobile power generation;
•the demand for and price of proppant and power generation, particularly in the Permian Basin;
•the success of our electric dredging transition efforts;
•fluctuations in the demand for certain grades of proppant;
•the domestic and foreign supply of and demand for oil and natural gas;
•the effects of actions by, or disputes among or between, members of OPEC with respect to production levels or other matters related to the prices of oil and natural gas;
•changes in the price and availability of natural gas, diesel fuel or electricity that we use as fuel sources for our proppant production facilities and related equipment;
•changes in the availability of grid power that would reduce the need for mobile power supply, particularly in the Permian Basin;
•the availability of capital and our liquidity;
•the level of competition from other companies;
•pending legal or environmental matters;
•changes in laws and regulations (or the interpretation thereof) or increased public scrutiny related to the proppant production and oil and natural gas industries, silica dust exposure or the environment;
•facility shutdowns in response to environmental regulatory actions;
•technical difficulties or failures;
•liability or operational disruptions due to pit-wall or pond failure, environmental hazards, fires, explosions, chemical mishandling or other industrial accidents;
•unanticipated ground, grade or water conditions;
•inability to obtain government approvals or acquire or maintain necessary permits or mining, access or water rights;
•changes in the price and availability of transportation services;
•inability of our customers to take delivery;
•difficulty collecting on accounts receivable;
•the level of completion activity in the oil and natural gas industry;
•inability to obtain necessary proppant production or power generation equipment or replacement parts;
•the amount of water available for processing proppant;
•any planned or future expansion projects or capital expenditures;
•our ability to finance equipment, working capital and capital expenditures;
•inability to successfully grow organically, including through future land acquisitions;
•inaccuracies in estimates of volumes and qualities of our frac sand reserves;
•failure to meet our minimum delivery requirements under our supply agreements;
•material nonpayment or nonperformance by any of our significant customers;
•development of either effective alternative proppants or new processes that replace hydraulic fracturing;
•our ability to borrow funds and access the capital markets;
•our ability to comply with covenants contained in our debt instruments;
•the potential deterioration of our customers’ financial condition, including defaults resulting from actual or potential insolvencies;
•unexpected changes in tariffs, trade barriers, price and exchange controls and other regulatory requirements;
•volatility in political, legal and regulatory environments in connection with the U.S. presidential transition;
•changes in global political or economic conditions, including sustained inflation as well as financial market instability or disruptions to the banking system due to bank failures, both generally and in the markets we serve;
•the impact of geopolitical developments and tensions, war and uncertainty in oil-producing countries (including the invasion of Ukraine by Russia, the Israel-Hamas war, continued instability in the Middle East, including from the Houthi rebels in Yemen, and any related political or economic responses and counter-responses or otherwise by various global actors or the general effect on the global economy);
•health epidemics, such as the COVID-19 pandemic, natural disasters or inclement or hazardous weather conditions, including but not limited to cold weather, droughts, flooding, tornadoes and the physical impacts of climate change;
•physical, electronic and cybersecurity breaches;
•the effects of litigation;
•plans, objectives, expectations and intentions described in this Annual Report that are not historical; and
•other factors discussed elsewhere in this Annual Report, including in Item 1A. “Risk Factors.”
We caution you that these forward-looking statements are subject to numerous risks and uncertainties, most of which are difficult to predict and many of which are beyond our control. These risks include, but are not limited to, the risks described in Item 1A. “Risk Factors” in this Annual Report.
You are cautioned not to place undue reliance on any forward-looking statements, which speak only as of the date of this Annual Report. Should one or more of the risks or uncertainties described in this Annual Report occur, or should underlying assumptions prove incorrect, our actual results and plans could differ materially from those expressed in any forward-looking statements. All forward-looking statements, expressed or implied, included in this Annual Report are expressly qualified in their entirety by this cautionary statement. This cautionary statement should also be considered in connection with any subsequent written or oral forward-looking statements that we or persons acting on our behalf may issue. Except as otherwise required by applicable law, we disclaim any duty to update any forward-looking statements to reflect events or circumstances after the date of this Annual Report.
SUMMARY OF RISK FACTORS
This summary briefly lists the principal risks and uncertainties facing our business, which are only a select portion of those risks. A more complete discussion of those risks and uncertainties is set forth in Item 1A. “Risk Factors.” Additional risks not presently known to us or that we currently deem immaterial may also affect us. If any of these risks occur, our business, financial condition or results of operations could be materially and adversely affected. Our business is subject to, among others, the following principal risks and uncertainties:
Risks Related to Our Business and Operations
•the level of activity in the oil and natural gas industries;
•the cyclical nature of our customers’ businesses and the oil and natural gas industry;
•decreased demand for proppant, the development of technically- and cost-effective alternative proppants or new processes to replace hydraulic fracturing;
•our ability to succeed in competitive markets and on our ability to appropriately react to market fluctuations including price volatility;
•increasing costs, lack of dependability or availability, or an oversupply of transportation services or infrastructure;
•operational hazards and inherent risks;
•potential inability to acquire adequate supplies of water for our dredging operations;
•failure to maintain effective quality control systems at our mining and production facilities;
•environmental and industrial accidents and operational breakdowns;
•the complex and challenging nature of the Dune Express;
•increased attention to ESG and conservation matters;
•loss of or inability to attract and retain members of our workforce;
•a shortage of skilled labor or rising labor costs in the excavation industry;
•inaccuracies in our estimates of sand reserves and resource deposits, or deficiencies in our title to those deposits;
•adverse developments at any of our three production facilities;
•an increase in the price or a significant interruption in the supply of natural gas and electricity or any other energy sources necessary to our continued operations;
•the loss of or a significant reduction in purchases by our largest customers;
•our and our customers’ ability to obtain and maintain necessary permits;
•our inability to take advantage of increasing prices for proppant due to the terms of our supply agreements;
•our inability to meet our minimum proppant delivery requirements under our supply agreements;
•our operational concentration in the Permian Basin;
•complexities involved in the software and technology systems that need to be developed in connection with our autonomous trucking initiative;
•undetected defects, errors or bugs in the hardware or software related to our autonomous driving technology, when deployed;
•unauthorized control or manipulation of the systems in our autonomous proppant-delivery vehicles;
•natural disasters and unusual weather conditions;
•failure of any acquisitions, dispositions and investments to result in the anticipated benefits;
•the material weakness in our internal control over financial reporting that could, if not remediated, result in material misstatements in our financial statements and cause us to fail to meet our reporting obligations;
Risks Related to Our Financial Condition
•the impact of our indebtedness on our financial flexibility and our competitive position;
•the inability to obtain needed capital or financing, on satisfactory terms, or at all;
Risks Related to Our Organizational Structure and Ownership of Our Common Stock
•our potential future reduction or suspension of our dividend;
•impact of future sales or the perception of future sales of our Common Stock;
•the Principal Stockholders’ ability to direct the voting of a significant proportion of the Common Stock;
•the loss of anticipated net cash tax savings as a result of the Up-C Simplification;
•our potential inability to offer equity consideration in acquisitive transactions on a tax-deferred basis;
•public and investor sentiment towards climate change, fossil fuels and other ESG matters;
Risks Related to Environmental, Mining and Other Regulations
•silica-related health issues and related regulation, litigation and legislation;
•legislative and regulatory initiatives relating to hydraulic fracturing and the potential for related litigation;
•environmental and natural resources regulations that impose risks of significant costs and liabilities;
•risks related to climate change, including regulatory, political, litigation and financial risks;
•operational restrictions intended to protect certain species of wildlife;
•restrictions on oil and natural gas development on federal lands;
•regulations that impose stringent occupational health and safety standards on our operations;
•risks related to obtaining, maintaining, and complying with permits necessary for the operation of our business.
Risks Related to the Moser Acquisition
•our inability to integrate the business of Moser successfully;
•potential lawsuits in connection with the Moser Acquisition;
•risks related to anticipated benefits and expectations from the Moser Acquisition;
•our ability to succeed in a new line of business;
•risks related to the market price for our Common Stock following the closing of the Moser Acquisition;
•dependency on relationships with key suppliers;
•our ability to succeed in long sales cycles;
•risks related to our customers power system needs;
•dependency on few customers for a significant portion of our power solutions revenues; and
•changes in the availability of grid power.
PART I
Item 1. Business.
Overview
Atlas Energy Solutions Inc. is a leading proppant producer, logistics, and distributed power solutions provider, primarily serving the Permian Basin of West Texas and New Mexico. We operate 14 proppant production facilities across the Permian Basin including both large-scale in-basin facilities and smaller distributed mining units. We manage a portfolio of leading-edge logistics assets, which includes our 42-mile Dune Express conveyor system (the only proppant conveyor system in the world, and the longest conveyor in the United States). In addition, we manage a fleet of over 120 trucks, including early autonomous delivery systems, which are capable of delivering expanded payloads due to our custom-manufactured trailers and patented drop-depot process. Our approach to managing proppant production, logistics, and distributed power solutions operations is intently focused on leveraging technology, automation, and remote operations to drive efficiencies.
We are a low-cost producer of various high-quality, locally sourced proppants used during the well completion process. We offer both dry and damp sand and carry various mesh sizes including 100 mesh and 40/70 mesh. Proppant is a key component necessary to facilitate the recovery of hydrocarbons from oil and natural gas wells.
Our logistics platform is designed to increase the efficiency, safety, and sustainability of the oil and natural gas industry within the Permian Basin, which is increasingly a differentiating factor affecting customer choice among proppant suppliers. The cost of delivering sand, even short distances, can be a significant component of customer spending on well completions given the substantial volumes that are utilized in modern well designs. In addition to our plant automation and our Dune Express proppant delivery system, we are also integrating autonomous driving technologies in certain of our fit-for-purpose trucks, creating the first semi-autonomous oilfield logistics network to increase the automation of the oil and gas proppant supply chain. Our investments in these leading-edge technologies, including autonomous trucking, digital infrastructure, and artificial intelligence, not only drive efficiencies in our operations to the benefit of our customers, but they also deliver beneficial environmental and community impacts. We believe the Company is uniquely positioned to automate and modernize the Permian Basin’s proppant and logistics infrastructure, making the basin a more efficient energy factory, and a better and cleaner place to live and work.
We also provide distributed power solutions through a fleet of more than 900 natural gas-powered reciprocating generators, with approximately 212 megawatts of existing power generation primarily supporting production and artificial lift operations across all major United States resource basins. Our generators are designed for heavy-duty, harsh environments for mission critical power needs. Our in-house manufacturing and remanufacturing capabilities, coupled with critical in-field service, provide quality control and standardization across the fleet with the goal of providing market-leading uptime.
Our mission is to improve human beings’ access to the hydrocarbons that power our lives, and, by doing so, we maximize the value creation for our stockholders. Value creation for our shareholders is our fundamental goal. In order to fulfill our mission and create value for our shareholders, we strive to optimize the outcomes for our broader stakeholders, including our employees and the communities in which we operate. We are proud of the fact that our approach to innovation in the hydrocarbon industry drives efficiencies creating value for our shareholders, while also delivering differentiated social and environmental progress. The Company has driven innovation designed to provide industry-leading environmental benefits by reducing energy consumption, emissions, and our aerial footprint. We call this Sustainable Environmental and Social Progress, and it is driven by shareholder value creation.
We were founded in 2017 by Ben M. "Bud" Brigham, our Executive Chairman, and are led by an entrepreneurial team with a history of constructive disruption bringing significant and complementary experience to this enterprise, including the perspective of longtime E&P operators, which provides for an elevated understanding of the end users of our products and services. Our executive management team has a proven track record with a history of generating positive returns and value creation. Our experience as E&P operators was instrumental to our understanding of the opportunity created by in-basin sand production and supply in the Permian Basin, which we view as North America's premier shale resource and which we believe will remain its most active through economic cycles.
Assets and Operations
Our Kermit facilities, Monahans facility, and OnCore distributed mining network are located in West Texas. The Kermit facilities consist of the two internally developed Kermit facilities (“K1/K2”) and the two facilities acquired in the Hi-Crush Transaction (“K115/874”). The facilities and OnCore distributed mining network encompass 45,855 gross acres in the aggregate that we own or lease. We have substantial off-dune acreage at Monahans that is not included in our estimated reserves or resources but that could be mined following our removal of material, such as soil and unusable sand, that lies above the useable sand and must be removed to excavate the useable sand, which we refer to as “overburden.”
The Dune Express was completed in December 2024. The Dune Express, which originates at our Kermit facilities and stretches into the middle of the Northern Delaware Basin, is the first long-haul proppant conveyor system in the world. The Dune Express is 42 miles in length, capable of transporting 13 million tons of proppant annually, and is strategically located to deliver proppant to the Northern Delaware Basin. We expect the Dune Express to lower legacy transportation requirements and increase safety by removing trucks from public roadways, thus reducing traffic, accidents and fatalities on public roadways in the region.
We installed two permanent loadout facilities, one located on the Texas side of the Texas-New Mexico state line approximately at the midpoint of the conveyor and one located at the end of the Dune Express right-of-way on BLM land near the Lea-Eddy County line in New Mexico. The conveyor system also utilizes one or more mobile offload systems, which can be mobilized and relocated from time to time, to maximize delivery efficiencies for customers that are proximate to the conveyor system but not proximate to one of the two permanent loadouts connected to the system.
Map of Operations
The following map shows the locations of our Kermit facilities, Monahans facility, and the OnCore distributed mining network in West Texas, as well as the Dune Express route, alongside a recent snapshot of the rig count in the Permian Basin as of December 31, 2024:
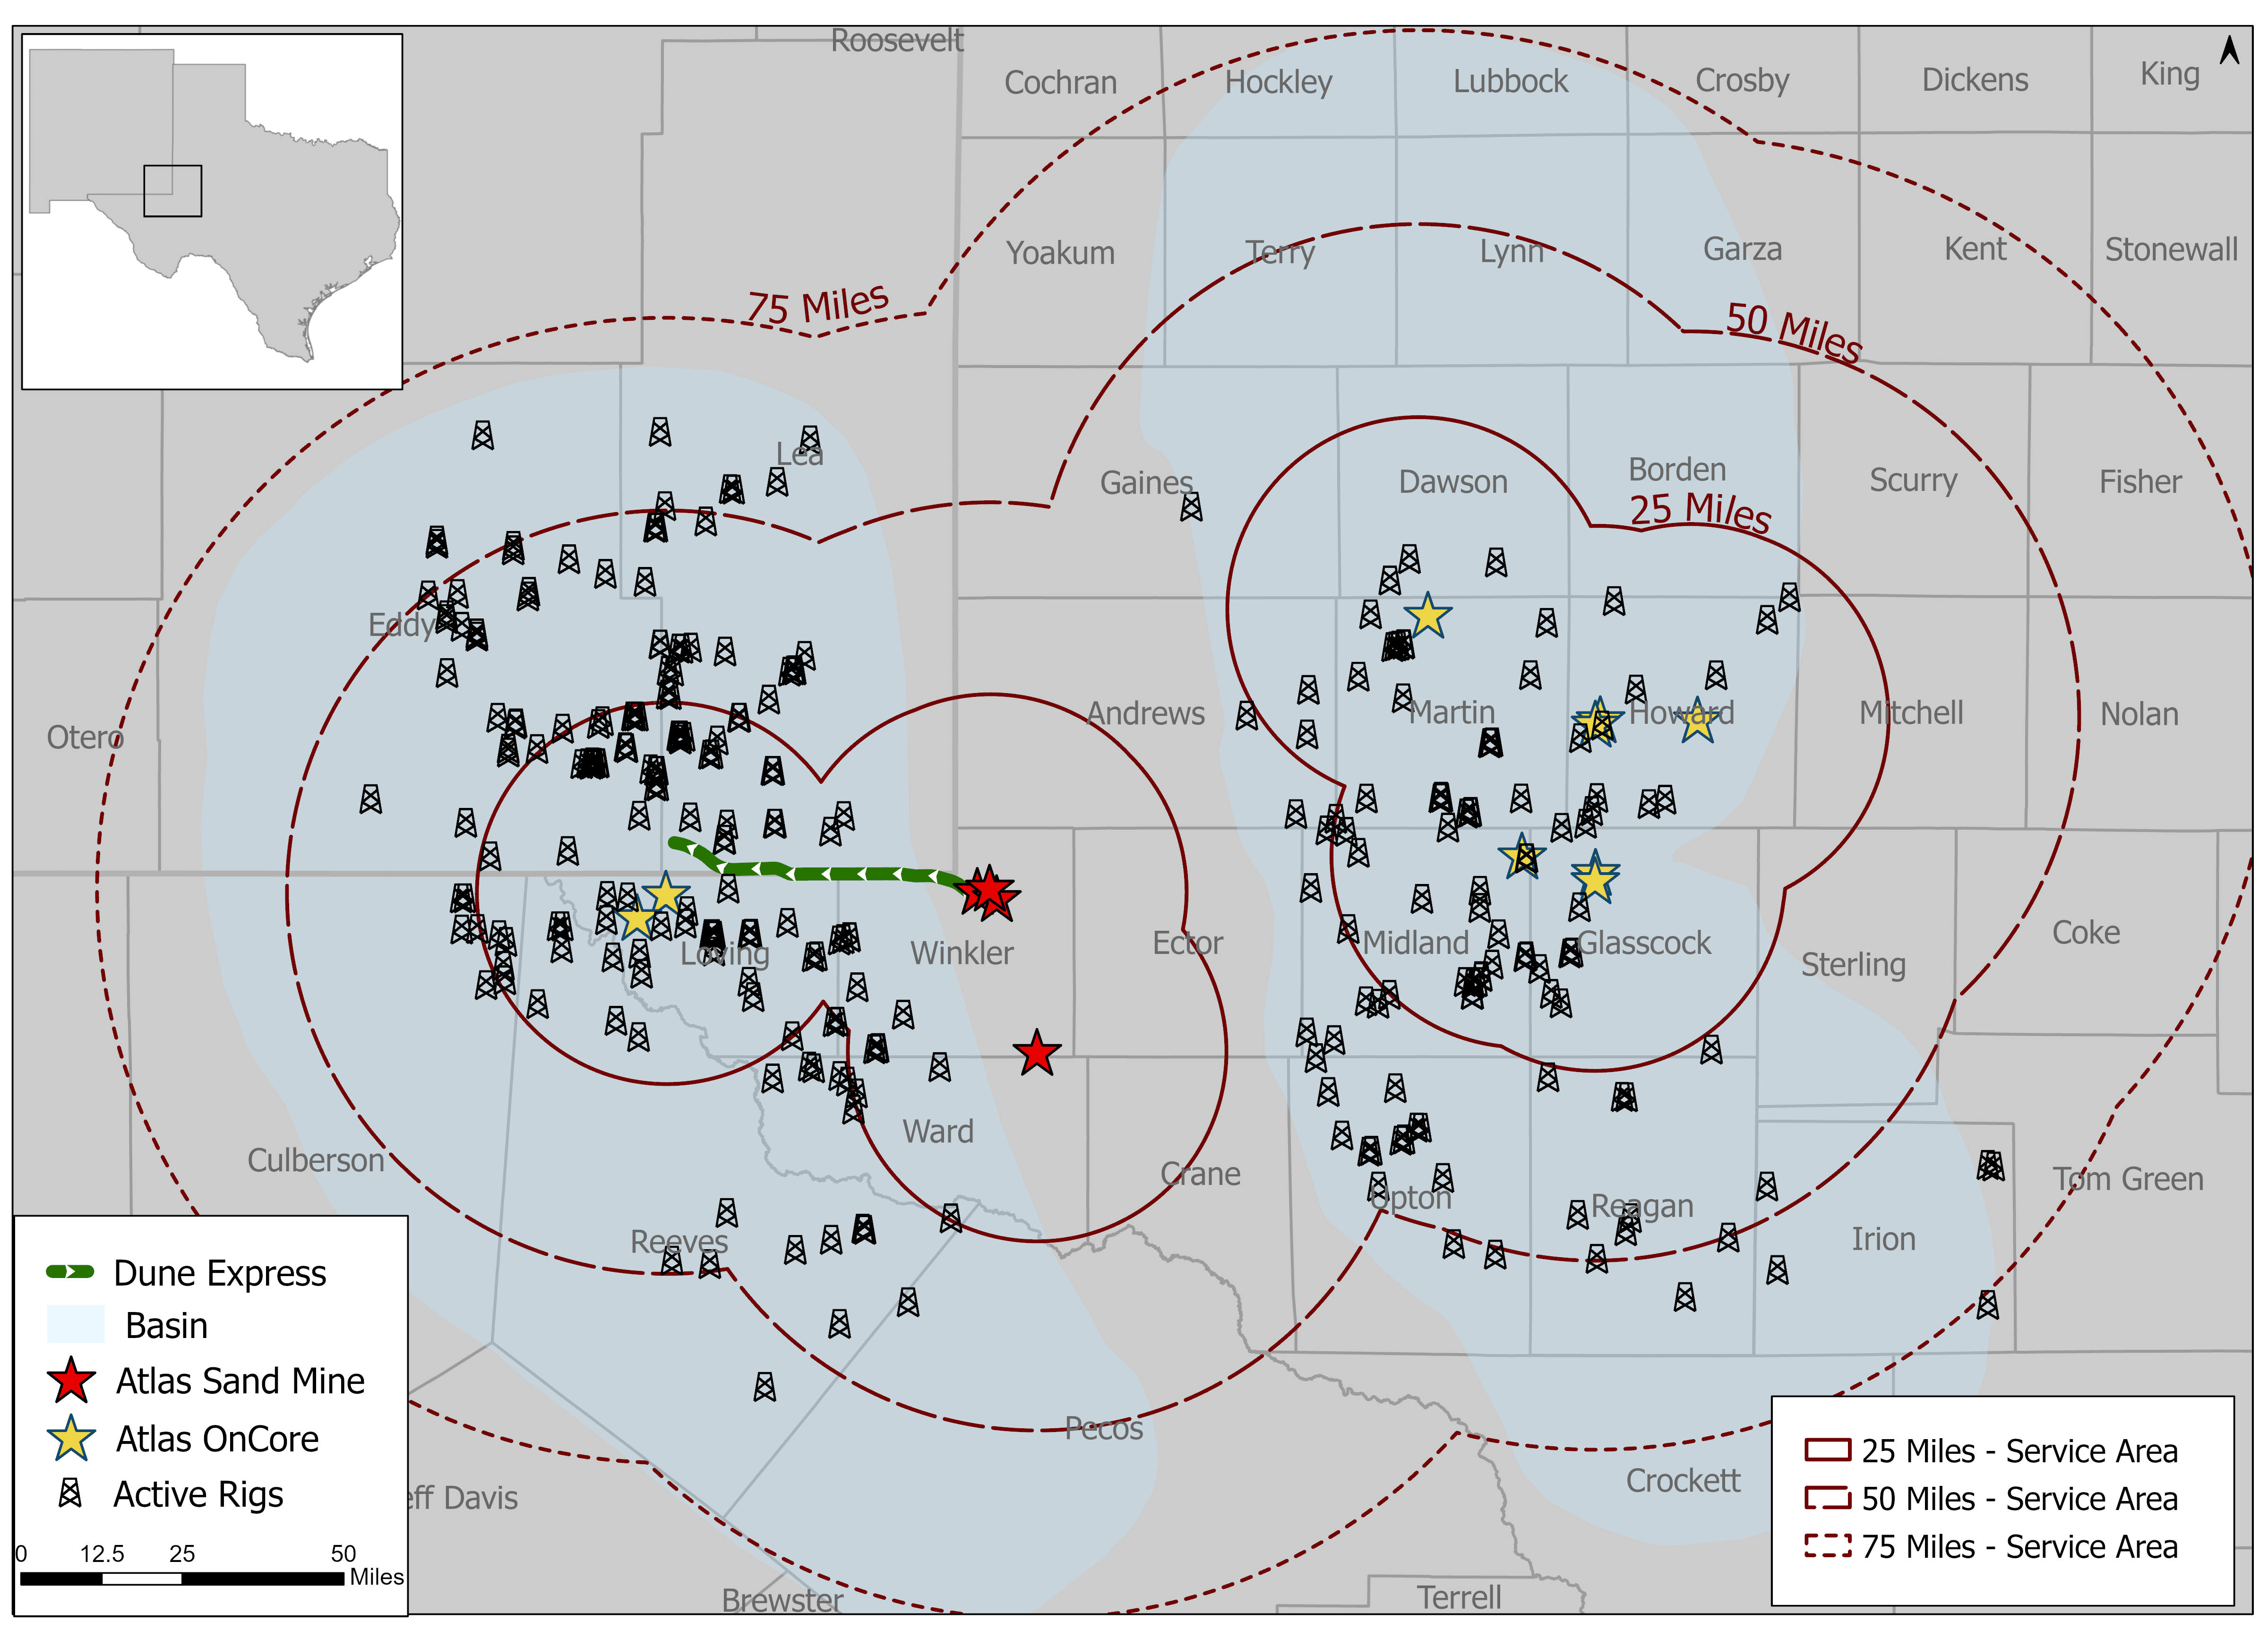
Source: Enverus.
The Kermit facilities and the Monahans facility were built to produce high quality 40/70-mesh and 100-mesh sands, each of which is used extensively in upstream operations in the Permian Basin. Innovative plant design and large-scale operations facilitate low-cost operations and continuity on site. Redundancies were designed into our facilities to remove singular points of failure that could disrupt the production process, ensuring maximum reliability of proppant production and delivery. The facilities are capable of operating year-round and feature advanced safety designs, onsite water supply, power infrastructure and access to low-cost natural gas through connections to interstate natural gas lines. Our OnCore distributed mining network is comprised of 9, built-for-purpose mobile processing plants which produce wet (i.e., undried or damp) 100-mesh sand from leased or customer-owned properties. At each OnCore site, we are responsible for mining and processing the raw sand, selling the finished frac sand products, and reclaiming the disturbed land. The mobility of the OnCore plants provides a great deal of flexibility not afforded to large-scale fixed-plant mining operations.
Further, we benefit from the strategic locations of our facilities, proximal to major highways at the south and north ends of the Winkler Sand Trend. Our Kermit facilities are bisected by two state highways, while our Monahans facility its adjacent to two highways, one of which is Interstate 20, facilitating efficient transportation of our proppant to customers located at various points within the Permian Basin. Accessibility to the western sites for the OnCore mines is via Texas state highway TX-302 or U.S. Route 285; while primary access to the eastern sites is via Interstate 20, state highways TX-137, TX-176, or TX-349.
The operations of our sand facilities are managed and monitored in a highly automated manner from our command center in Austin, Texas. The remote ecosystem allows our employees to simultaneously manage processes at all facilities, resulting in personnel productivity gains.
Our Products and Services
Product
We serve the oil and gas end markets, and our sand reserves contain deposits of fine grade 40/70-mesh and 100-mesh sizes that API specifies for use in wellsite fracturing operations. We believe that this mix of finer grade sand reserves is in higher demand and meets current industry preferences. Based on the reserve report prepared by John T. Boyd Company (“JT Boyd”), our independent mining engineers and geologists, as of December 31, 2024, we had 592.9 million tons of proven and probable sand reserves at our Kermit facilities, Monahans facility, and OnCore distributed mining network. Our reserves were composed of approximately 44% 40/70-mesh, 37% 70/140-mesh, and 19% of 40/140-mesh substrate sand. As of December 31, 2024, we estimate our reserve life to be approximately 30 years for our K1/K2 facilities, 12 years for our K115/874 facilities, 28 years for our Monahans facility, and 21 years for our OnCore distributed mining network, as may be extended or adjusted for future conversions of measured, indicated or inferred resources to proven or probable reserves or any change to our production capacity. For more information regarding our mineral reserves, see Item 2. “Property.—Our Reserves.”
Proppant is stored onsite before transport and delivery by truck to customers’ well sites located primarily in the Delaware and Midland Basins. Our proppant is offered to our customers at the mine or as an integrated mine-to-wellhead solution.
Services
We provide transportation, storage solutions and contract labor services to companies in the oil and gas industry, and with the acquisition of Moser, we will add distributed power services. Transportation services typically consist of transporting product from the plant facilities to the wellsite. The locations of our facilities are within close proximity to well activity and enable us to deliver proppant directly to our customers’ wellheads using a variety of methods, reducing handling costs and delivery lead times.
Our Permits
We have obtained numerous federal, state and local permits required for operations at our Kermit facilities, Monahans facility, and OnCore distributed mining network. Operations are predominantly regulated by the TCEQ with respect to environmental compliance. The predominant permitting requirement is an active New Source Review (“NSR”) permit for air pollution control. Our operations have a current NSR permit which is renewable next in 2028. Other permits held by our operations include Stormwater, Above Ground Storage Tank, Aggregate Production Operation, and a septic permit. A Spill Prevention, Control, and Countermeasure plan is also active at locations.
While resources invested in securing permits are significant, this cost has not had a material adverse effect on our results of operations or financial condition. We cannot be certain that existing environmental laws and regulations will not be reinterpreted or revised or that new environmental laws and regulations will not be adopted or become applicable to us. Revised or additional environmental requirements that result in increased compliance costs or additional operating restrictions could have a material adverse effect on our business.
Environmental and Occupational Health and Safety Regulations
We are subject to stringent and complex federal, state and local laws and regulations governing the discharge of materials into the environment or otherwise relating to protection of worker health, safety and the environment and natural resources (including threatened and endangered species). Compliance with these laws and regulations may expose us to significant costs and liabilities and cause us to incur significant capital expenditures in our operations. Any failure to comply with these laws and regulations may result in the assessment of administrative, civil and criminal penalties, imposition of remedial obligations and the issuance of injunctions delaying or prohibiting operations. Certain environmental laws may impose strict, joint and several liability for remediation costs. Private parties may also have the right to pursue legal actions to enforce compliance as well as to seek damages for non-compliance with environmental laws and regulations or for personal injury or property damage. In addition, the trend in environmental regulation has been to place more restrictions on activities that may affect the environment, and thus, any changes in, or more stringent enforcement of, these laws and regulations that result in more stringent and costly pollution control equipment, the occurrence of delays in the permitting or performance of projects, or waste handling, storage, transport, disposal or remediation requirements could have an adverse effect on our operations and financial position.
We do not believe that compliance by us and our customers with federal, state or local environmental laws and regulations will have an adverse effect on our business, financial position or results of operations or cash flows. We cannot assure you, however, that future events, such as changes in existing laws or enforcement policies, the enactment or promulgation of new laws or regulations or the development or discovery of new facts or conditions adverse to our operations will not cause us to incur significant costs. The following is a discussion of material environmental and worker health and safety laws, as amended from time to time, that relate to our operations or those of our customers that could have an adverse effect on our business.
Worker & Community Health and Safety
We are subject to the requirements of the federal Occupational Safety and Health Administration (“OSHA”), the federal Mine Safety and Health Administration, and comparable state statutes that regulate the protection of the health and safety of workers. In addition, the OSHA hazard communication standard requires that information be maintained about hazardous materials used or produced in operations and that this information be provided to employees, state and local government authorities and the public. Similar obligations related to community safety are codified in the Emergency Planning & Community Right to Know Act, as authorized by the Superfund Amendments and Reauthorization Act. These laws and regulations are subject to frequent changes and any failure to comply with these laws could lead to the assertion of third-party claims against us, civil or criminal fines and changes in the way we operate our facilities, which one or more events could have an adverse effect on our financial position. We have an internal program of inspection designed to monitor and enforce compliance with worker safety requirements. Historically, our worker and community health and safety compliance costs have not had an adverse effect on our results of operations.
Air Emissions
Our operations and the operations of our customers are subject to the federal Clean Air Act (“CAA”) and related state and local laws, which restrict the emission of air pollutants and impose permitting, monitoring and reporting requirements on various sources. These regulatory programs may require preconstruction permitting, best available control technology analysis, the installation of emissions abatement equipment, modification of operational practices and obtaining permits or similar authorizations for our operations. Obtaining air emissions permits has the potential to delay the development or continued performance of our operations. Over the next several years, we may be required to incur certain capital expenditures for air pollution control equipment or to address air emissions-related issues as we expand our facilities or develop new ones. Changing and increasingly stricter requirements, future non-compliance or failure to maintain necessary permits or other authorizations could require us to incur substantial costs or suspend or terminate our operations. We could be subject to administrative, civil and criminal penalties as well as injunctive relief for noncompliance with air permits or other requirements of the CAA and comparable state laws and regulations.
Climate Change
In the United States, no comprehensive climate change legislation has been implemented at the federal level. However, following the U.S. Supreme Court finding that emissions of greenhouse gases (“GHGs”) constitute a pollutant under the CAA, the EPA has adopted regulations that, among other things, establish construction and operating permit reviews for emissions from certain large stationary sources, require the monitoring and annual reporting of GHG emissions from certain petroleum and natural gas system sources in the United States, and together with the Department of Transportation (the “DOT”), implement GHG emissions limits on vehicles manufactured for operation in the United States. However, on January 20, 2025, President Trump signed an Executive Order directing the EPA to reconsider the legality of its GHG “endangerment finding,” which provides the basis for EPA’s authority to regulate GHG emissions. We cannot predict when or whether the EPA will take action regarding this finding, or the ultimate impacts on our business. Further, while the Inflation Reduction Act of 2022 (“IRA”) appropriated significant federal funding for renewable energy initiatives and, for the first time ever, imposed a fee on GHG emissions from certain facilities, and the EPA has issued a final rule in November 2024 implementing the fee, although the future of this rule is uncertain at this time. The Trump administration may also seek to challenge, repeal, or revise the emissions fee or seek to have Congress modify or repeal the IRA or certain provisions thereof; however, we cannot predict when or whether the new administration may take these actions, if at all, or the resulting impact on our business operations. Additionally, several U.S. states including California and New York, either individually or in regional collaboration, have adopted or are considering adopting legislation, policies, or regulatory initiatives focused on GHG emissions reductions, including cap and trade programs, carbon taxes, performance standards, and reporting and monitoring programs. Internationally, the United Nations-sponsored Paris Agreement (“Paris Agreement”) requires member states to individually determine and submit non-binding emissions reduction targets every five years after 2020. On January 20, 2025, President Trump signed an Executive Order once again withdrawing the United States from the Paris Agreement. While the international community continues to gather annually to develop and negotiate international climate initiatives, pledges, and frameworks, the United States’ participation in future United Nations climate-related conferences and initiatives and the impacts of these orders, pledges, agreements and any legislation or regulation promulgated to fulfill the United States’ commitments under the Paris Agreement or other international agreements cannot be predicted at this time.
Emerging climate-change focused legislation and regulation, policy directives, and related initiatives have the potential to increase our and our customers’ operating costs and reduce demand for our customers’ products and thereby our services. Further, any limitations or restrictions on the development of fossil fuel-specific infrastructure and our customers’ ability to access capital, develop their assets, and market their products may adversely affect our business and results of operations. For more information on applicable climate change-related regulatory matters, developments and risks affecting our business, please see our “Risk Factors—Risks Related to Environmental, Mining and Other Regulations—Our and our customers’ operations are subject to a number of risks arising out of the threat of climate change, including regulatory, political, litigation and financial risks, which could result in increased operating and capital costs for our customers and reduced demand for our products and services” and “Risk Factors—Risks Related to Our Business and Operations— Increased stakeholder and market attention to ESG and conservation matters may adversely impact our business and access to capital.”
Water Discharges
The federal Clean Water Act (“CWA”) and analogous state laws impose restrictions and strict controls with respect to the discharge of pollutants, including spills and leaks of oil and other substances, into waters of the United States. The discharge of pollutants into regulated waters, including jurisdictional wetlands, is prohibited, except in accordance with the terms of a permit issued by the EPA or an analogous state agency. The CWA also prohibits the discharge of dredge and fill material in regulated waters, including wetlands, unless authorized by a permit issued by the U.S. Army Corps of Engineers (the “Corps”). Federal and state regulatory agencies can impose administrative, civil and criminal penalties, as well as require remedial or mitigation measures, for non-compliance with discharge permits or other requirements of the CWA and analogous state laws and regulations. In the event of an unauthorized discharge of wastes, we may be liable for penalties and costs.
The scope of waters subject to federal jurisdiction has been subject to substantial controversy, with the Corps and EPA pursuing several rulemakings since 2015 to attempt to define the scope of Waters of the United States (“WOTUS”). Most recently, EPA issued a WOTUS rule in September 2023 that is currently only implemented in 24 states due to ongoing litigation. Thus, the operative definition of WOTUS varies by state. At this time, we cannot predict what action, if any, the Trump administration may take to clarify the definition of WOTUS and the scope of the CWA. To the extent the implementation of the final rule, results of the litigation or any action further expands the scope of the CWA’s jurisdiction in areas where we operate, we could face increased costs and delays with respect to obtaining permits for dredge and fill activities in wetland areas.
Additionally, the process for obtaining permits has the potential to delay our operations. Spill prevention, control and countermeasure requirements of federal laws require appropriate containment berms and similar structures to help prevent the contamination of navigable waters by a petroleum hydrocarbon tank spill, rupture or leak. In addition, the CWA and analogous state laws require individual permits or coverage under general permits for discharges of storm water runoff from certain types of facilities. Federal and state regulatory agencies can impose administrative, civil and criminal penalties as well as other enforcement mechanisms for non-compliance with discharge permits or other requirements of the CWA and analogous state laws and regulations. The CWA and analogous state laws provide for administrative, civil and criminal penalties for unauthorized discharges and, impose rigorous requirements for spill prevention and response planning, as well as substantial potential liability for the costs of removal, remediation, and damages in connection with any unauthorized discharges.
Hydraulic Fracturing
We supply proppant to the oil and natural gas industry. Hydraulic fracturing is an important common practice that is used to stimulate production of oil and natural gas from low permeability hydrocarbon bearing subsurface rock formations. The hydraulic fracturing process involves the injection of water, proppant and chemicals under pressure into the formation to fracture the surrounding rock, increase permeability and stimulate production. Although we do not directly engage in hydraulic fracturing activities, our customers purchase our proppant for use in their hydraulic fracturing activities. Hydraulic fracturing is typically regulated by state oil and natural gas commissions and similar agencies; however, the EPA has asserted jurisdiction over hydraulic fracturing activities in some circumstances under the Safe Drinking Water Act. Some states have adopted, and other states are considering adopting, regulations that could impose new or more stringent permitting, disclosure or well construction requirements on hydraulic fracturing operations. State and federal regulatory agencies have also recently focused on a possible connection between the operation of injection wells used for oil and natural gas waste disposal and seismic activity. Similar concerns have been raised that hydraulic fracturing may also contribute to seismic activity. Aside from state laws, local land use restrictions may restrict drilling in general or hydraulic fracturing in particular. Municipalities may adopt local ordinances attempting to prohibit hydraulic fracturing altogether or, at a minimum, allow such fracturing processes within their jurisdictions to proceed but regulating the time, place and manner of those processes. At the same time, certain environmental groups have suggested that additional laws may be needed to more closely and uniformly limit or otherwise regulate the hydraulic fracturing process, and legislation has been proposed by some members of Congress to provide for such regulation.
The adoption of new laws or regulations at the federal or state levels imposing reporting obligations on, or otherwise limiting or delaying, the hydraulic fracturing process could make it more difficult to complete natural gas wells, increase our customers’ costs of compliance and doing business and otherwise adversely affect the hydraulic fracturing services they perform, which could negatively impact demand for our proppant. In addition, heightened political, regulatory and public scrutiny of hydraulic fracturing practices could expose us or our customers to increased legal and regulatory proceedings, which could be time-consuming, costly or result in substantial legal liability or significant reputational harm. We could be directly affected by adverse litigation involving us, or indirectly affected if the cost of compliance limits the ability of our customers to operate. Such costs and scrutiny could directly or indirectly, through reduced demand for our proppant, have an adverse effect on our business, financial condition and results of operations.
Non-Hazardous and Hazardous Wastes
The Resource Conservation and Recovery Act (“RCRA”) and comparable state laws control the management and disposal of hazardous and non-hazardous waste. These laws and regulations govern the generation, storage, treatment, transfer and disposal of wastes that we generate. In the course of our operations, we generate waste that are regulated as non-hazardous wastes and hazardous wastes, obligating us to comply with applicable standards relating to the management and disposal of such wastes. In addition, drilling fluids, produced waters and most of the other wastes associated with the exploration, development and production of oil or natural gas, if properly handled, are currently exempt from regulation as hazardous waste under RCRA and, instead, are regulated under RCRA’s less stringent non-hazardous waste provisions, state laws or other federal laws. However, it is possible that certain oil and natural gas drilling and production wastes now classified as non-hazardous could be classified as hazardous wastes in the future. A loss of the RCRA exclusion for drilling fluids, produced waters and related wastes could result in an increase in our customers’ costs to manage and dispose of generated wastes and a corresponding decrease in their drilling operations, which developments could have an adverse effect on our business.
Site Remediation
The Comprehensive Environmental Response, Compensation and Liability Act (“CERCLA”) and comparable state laws impose strict, joint and several liability on certain classes of persons that contributed to the release of a hazardous substance into the environment without regard to fault or the legality of the original conduct. These persons include the owner and operator of a disposal site where a hazardous substance release occurred and any company that transported, disposed of or arranged for the transport or disposal of hazardous substances released at the site. Under CERCLA, such persons may be liable for the costs of remediating the hazardous substances that have been released into the environment, for damages to natural resources and for the costs of certain health studies. In addition, where contamination may be present, it is not uncommon for the neighboring landowners and other third parties to file claims for personal injury, property damage and recovery of response costs. We have not received notification that we may be potentially responsible for cleanup costs under CERCLA at any site.
Endangered Species
The ESA restricts activities that may affect endangered or threatened species or their habitats. Similar protections are offered to migratory birds under the Migratory Bird Treaty Act (“MBTA”) and analogous state laws. Compliance with these laws may require the implementation of avoidance or mitigation measures or time and place restrictions on certain operations during migration or breeding seasons. The listing of new species as endangered or threatened and the designation of such species’ habitat as critical under the ESA or related laws in areas where we or our customers operate, we or our customers may incur increased costs arising from required species protection measures or experience operational delays or limitations, either of which could adversely affect our and our customers operations or reduce demand for our services. For more information regarding risks associated with compliance with endangered species laws and regulations, including discussion of certain risks related to the DSL and lesser prairie chicken, please see our “Risk Factors—Risks Related to Environmental, Mining and Other Regulations—Restrictions on our operations and those of our customers intended to protect certain species of wildlife could have an adverse impact on our ability to expand some of our existing operations or limit our customers’ ability to develop new oil and natural gas wells.”
Mining and Workplace Safety
Our proppant production operations are subject to mining safety regulation. Mine Safety and Health Administration (“MSHA”) is the primary regulatory organization governing proppant mining and processing. Accordingly, MSHA regulates quarries, surface mines, underground mines and the industrial mineral processing facilities associated with and located at quarries and mines. The mission of MSHA is to administer the provisions of the Federal Mine Safety and Health Act of 1977 and to enforce compliance with mandatory miner safety and health standards. As part of MSHA’s oversight, representatives perform at least two unannounced inspections annually for each above-ground facility. Failure to comply with MSHA’s regulations could result in the imposition of civil or criminal penalties and fines.
In addition, our operations are subject to a number of federal and state laws and regulations, including the OSHA and comparable state statutes, whose purpose is to protect the health and safety of workers. Also, the OSHA hazard communication standard, the EPA community right-to-know regulations under Title III of the federal Superfund Amendment and Reauthorization Act and comparable state statutes require that information be maintained concerning hazardous materials used or produced in operations and that this information be provided to employees, state and local government authorities and citizens. Violations of OSHA can result in OSHA civil and criminal enforcement. Moreover, the inhalation of respirable crystalline silica is associated with the lung disease silicosis. There is recent evidence of an association between crystalline silica exposure or silicosis and lung cancer and a possible association with other diseases, including immune system disorders such as scleroderma. These health risks have been, and may continue to be, a significant issue confronting the silica industry. In response to these potential concerns, OSHA promulgated a new rule seeking to lower work exposure to crystalline silica. The rule became effective for general industry in 2018. In June 2022, MSHA launched a new enforcement initiative to better protect U.S. miners from health hazards resulting from repeated overexposure to respirable crystalline silica, and in April 2024, MSHA issued a final rule designed to reduce miner exposures to respirable crystalline silica, including by lowering the permissible exposure limit and establishing an action level for all miners. For more information, please see our “Risk Factors—Risks Related to Environmental, Mining and Other Regulations— Silica-related health issues and legislation, including compliance with existing or future regulations relating to respirable crystalline silica, or litigation could have an adverse effect on our business, reputation or results of operations.”
In addition, concerns over silicosis and other potential adverse health effects, as well as concerns regarding potential liability from the use of silica, may have the effect of discouraging our customers’ use of our silica products and discouraging our insurers from risk. The actual or perceived health risks of mining, processing and handling silica could adversely affect silica producers, including us, through reduced use of silica products, the threat of product liability or employee lawsuits, increased scrutiny by federal, state and local regulatory authorities of us and our customers or reduced financing sources available to the silica industry.
Environmental Reviews
If permits or other authorizations from the federal government are required, our future operations may be subject to broad environmental review under the National Environmental Policy Act, as amended (“NEPA”). NEPA requires federal agencies to evaluate the environmental impact of all “major federal actions” significantly affecting the quality of the human environment. The granting of a federal permit for a major development project, such as a proppant production operations, may be considered a “major federal action” that requires review under NEPA. As part of this evaluation, the federal agency considers a broad array of environmental impacts, including, among other things, impacts on air quality, water quality, wildlife (including threatened and endangered species), historic and archeological resources, geology, socioeconomics and aesthetics. NEPA also requires the consideration of alternatives to the project. The NEPA review process, especially the preparation of a full environmental impact statement, can be time consuming and expensive. The purpose of the NEPA review process is to inform federal agencies’ decision-making on whether federal approval should be granted for a project and to provide the public with an opportunity to comment on the environmental impacts of a proposed project. Though NEPA requires only that an environmental evaluation be conducted and does not mandate a particular result, a federal agency could decide to deny a permit or impose certain conditions on its approval, based on its environmental review under NEPA, or a third party could challenge the adequacy of a NEPA review and thereby delay the issuance of a federal permit or approval, which could have an adverse effect on our business. For more information, please see “Risk Factors—Risks Related to Environmental, Mining and Other Regulations—Any restrictions on oil and natural gas development on federal lands have the potential to adversely impact our operations and the operations of our customers.”
Motor Carrier Operations
Among the services we provide, we operate as a motor carrier and therefore are subject to regulation by the DOT and various state agencies. These regulatory authorities exercise broad powers, governing activities such as the authorization to engage in motor carrier operations; regulatory safety; hazardous materials labeling, placarding and marking; financial reporting; and certain mergers, consolidations and acquisitions. There are additional regulations specifically relating to the trucking industry, including testing and specification of equipment and product handling requirements. The trucking industry is subject to possible regulatory and legislative changes that may affect the economics of the industry by requiring changes in operating practices or by changing the demand for common or contract carrier services or the cost of providing truckload services. Some of these possible changes include increasingly stringent environmental regulations, changes in the hours of service regulations which govern the amount of time a driver may drive in any specific period and requiring onboard black box recorder devices or limits on vehicle weight and size.
Interstate motor carrier operations are subject to safety requirements prescribed by the DOT. Intrastate motor carrier operations are subject to safety regulations that often mirror federal regulations. Such matters as weight and dimension of equipment are also subject to federal and state regulations. The DOT regulations also mandate drug testing of drivers. From time to time, various legislative proposals are introduced, including proposals to increase federal, state or local taxes, including taxes on motor fuels, which may increase our costs or adversely impact the recruitment of drivers. We cannot predict whether, or in what form, any increase in such taxes applicable to us will be enacted.
State and Local Regulation
We are subject to a variety of state and local environmental review and permitting requirements. In some cases, the state environmental review may be more stringent than the federal review. Our operations may require state-law based permits in addition to federal permits, requiring state agencies to consider a range of issues, many the same as federal agencies, including, among other things, a project’s impact on wildlife and their habitats, historic and archaeological sites, aesthetics, agricultural operations and scenic areas. The development of new sites and our existing operations also are subject to a variety of local environmental and regulatory requirements, including land use, zoning, building and transportation requirements.
Demand for proppant in the oil and natural gas industry drove a significant increase in the production of proppant. As a result, some local communities expressed concern regarding silica sand mining operations. These concerns have generally included exposure to ambient silica sand dust, truck traffic, water usage and blasting. In response, certain state and local communities have developed or are in the process of developing regulations or zoning restrictions intended to minimize dust from becoming airborne, control the flow of truck traffic, significantly curtail the amount of practicable area for proppant production activities, provide compensation to local residents for potential impacts of proppant production activities and, in some cases, ban issuance of new permits for proppant production activities. To date, we have not experienced any material impact to the development of our proppant production facilities and do not anticipate an impact on future operations as a result of these types of concerns. We would expect this trend to continue as oil and natural gas production increases.
Competition
The market in which we operate is highly competitive. We compete with both public and private large, national producers and small, regional or local in-basin proppant providers, such as Iron Oak Energy Solutions, High Roller Sand, Freedom Proppants, U.S. Silica Inc., Alpine Silica, Badger Mining Corporation, Vista Proppants and Logistics and Capital Sand Company, among others. Competition in the proppant production industry is based on a number of factors, including product and service quality, reliability of the service provider, the geographic location of facilities and the associated logistics costs of transporting proppant from the supplier to the customer, innovation, etc. Following the acquisition of Moser, we will enter the distributed power industry, which is a highly fragmented market with both small and large public and private companies.
Human Capital and Employees
Our employees are a critical asset to our innovative culture and overall success. We are focused on sustaining a high-performance culture through attracting, engaging, developing, retaining and rewarding top talent. We strive to enhance the economic and social wellbeing of our employees and the communities in which we operate. We seek to provide a welcoming environment for our workforce, with best-in-class training and career development opportunities to enable employees to thrive and achieve their career goals.
As of December 31, 2024, we had a total of 1,143 employees, of which 173 service our corporate headquarter offices and 970 work in field locations. None of our employees are represented by labor unions or subject to collective bargaining agreements. We consider our employee relations to be good.
Health and Safety
The health, safety, and wellbeing of our employees is of the utmost importance. We believe that we are an industry leader with a proven track record in safety.
We provide full-time regular employees the option to participate in health and welfare plans, including medical, dental, vision, life and accidental death and dismemberment, accident, critical illness, and short-term and long-term disability insurance plans. We also offer an Employee Assistance Program which provides employees and their family members access to professional providers to help navigate challenging life events.
Available Information
Our headquarters office is located at 5918 W. Courtyard Dr., Suite 500, Austin, TX 78730, and our telephone number at that address is (512) 220‑1200. Our website address is https://atlas.energy. Our periodic reports and other information filed with or furnished to the SEC, including our Annual Reports on Form 10-K, Quarterly Reports on Form 10-Q and Current Reports on Form 8-K, as well as any amendments to such filings, are available free of charge through our website under the “Investors” link as soon as reasonably practicable after those reports and other information are electronically filed with or furnished to the SEC. The SEC also maintains an internet website at www.sec.gov that contains reports, proxy and information statements and other information regarding issuers, including us, that file electronically with the SEC. In addition to its reports filed or furnished with the SEC, the Company publicly discloses material information from time to time in its press releases, at annual meetings of shareholders, in publicly accessible conferences and Investor presentations, and through its website (principally in its Press Room and Investor Relations pages). Information on our website or any other website is not incorporated by reference into this Annual Report and does not constitute a part of this Annual Report.
Item 1A. Risk Factors.
There are numerous factors that affect our business and operating results, many of which are beyond our control. The following is a summary of significant factors that might cause our future results to differ materially from those currently expected. The risks described below are not the only risks facing our Company. Additional risks and uncertainties not presently known to us or that we currently deem immaterial may also affect our business operations. If any of these risks actually occur, our business, financial position, operating results, cash flows, reserves or our ability to pay our debts and other liabilities could suffer, the trading price and liquidity of our securities could decline and you may lose all or part of your investment in our securities.
Risks Related to Our Business and Operations
Our business operations depend on the level of activity in the oil and natural gas industries, which experience substantial volatility.
Our operations that produce and transport proppant are materially dependent on the levels of activity in oil and natural gas exploration, development and production. More specifically, the demand for the proppant we produce is closely related to the number of oil and natural gas wells completed in geological formations where sand-based proppant is used in fracture treatments. These activity levels are affected by both short- and long-term trends in oil and natural gas prices. Additionally, our distributed power operations are also tied to activity levels in the oil and gas industry, most specifically through levels of spending tied to production, gathering, and treatment activities. In recent years, oil and natural gas prices and, therefore, the level of exploration, development and production activity, have experienced significant volatility.
When oil and natural gas prices decrease, exploration and production companies may reduce their exploration, development, production and well completion activities. During such periods, demand for our products and services, which supply oil and natural gas wells, including our transportation and logistics solutions, may decline, and may lead to a decline in the market price of proppant, if the supply of proppant is not similarly reduced. When demand for proppant increases, there may not be a corresponding increase in the prices for our products or our customers may not increase use of our products, which could have an adverse effect on our business, financial condition and results of operations.
Worldwide economic, political and military events, including war, terrorist activity, events in the Middle East and initiatives by OPEC+, have contributed, and are likely to continue to contribute, to oil and natural gas price volatility. For example, the ongoing armed conflicts between Russia and Ukraine and Israel and Hamas and the continuation of, and the escalation in the severity of, these conflicts has led to extreme regional instability, caused dramatic fluctuations in global financial markets and has increased the level of global economic uncertainty, including uncertainty about world-wide oil supply and demand, which in turn has caused increased volatility in commodity prices. Further, the Houthi movement, which controls parts of Yemen, has targeted and launched numerous attacks on Israeli, American and international commercial marine vessels in the Red Sea as the ships approach the Suez Canal, resulting in many shipping companies re-routing to avoid the region altogether and worsening existing supply chain issues, including delays in supplier deliveries, extended lead times and increased cost of freight, impacts to the shipping of oil and gas, insurance and materials. The potential for conflict with Iran, a major oil producer, the Houthi movement in Yemen or the Hezbollah movement in Lebanon has increased as a result of continued, increasing hostilities in the Middle East.
Additionally, warmer than normal winters in North America and other weather patterns may adversely impact the short-term demand for natural gas and, therefore, demand for our products. Reduction in demand for natural gas to generate electricity could also adversely impact the demand for proppant. In addition, any future decrease in the rate at which oil and natural gas reserves are discovered or developed, whether due to increased governmental regulation, limitations on exploration and drilling activity, technological innovations that result in new processes for oil and natural gas production that do not require proppant or other factors, could adversely affect the demand for our products, even in a stronger oil and natural gas price environment. Moreover, the energy transition to a low carbon economy, increased deployment of renewable power generation, renewable fuels and electric vehicles all have the potential to reduce demand for oil and natural gas and consequently the services we provide. The continued or future occurrence of any of these risks could have an adverse effect on our business, financial condition and results of operations.
Our business is subject to the cyclical nature of our customers’ businesses and on the oil and natural gas industry.
Our business is directly affected by capital spending to explore for, develop and produce oil and natural gas in the United States. The oil and natural gas industry is cyclical and historically has experienced periodic downturns in activity. During periods of economic slowdown in one or more of the industries or geographic regions we serve or in the worldwide economy, our customers often reduce their production and capital expenditures by deferring or canceling pending projects, even if such customers are not experiencing financial difficulties. These developments can have an adverse effect on sales of our products and our results of operations.
Weakness in the industries we serve has had, and may in the future have, an adverse effect on our sales and results of operations. A continued or renewed economic downturn in one or more of the industries that we serve, or in the worldwide economy, could cause actual results of operations to differ materially from historical and expected results.
Industry conditions are influenced by numerous factors over which we have no control, including:
•expected economic returns to E&P companies from new well completions;
•domestic and foreign economic conditions and supply of and demand for oil and natural gas;
•the level of prices, and expectations about future prices, of oil and natural gas;
•the level of global oil and natural gas E&P and inventories;
•federal, state and local regulation of hydraulic fracturing and E&P activities;
•United States federal, tribal, state and local and non-United States governmental laws, regulations and taxes, including the policies of governments regarding the exploration for and production and development of their oil and natural gas reserves;
•changes in tariffs, trade barriers, price and exchange controls and other regulatory requirements;
•volatility in political, legal and regulatory environments in connection with the U.S. presidential transition;
•changes in the transportation industry that services our business, including the price and availability of transportation;
•political and economic conditions in oil and natural gas producing countries, including uncertainty or instability resulting from civil unrest, terrorism or war, such as the current conflicts between Russia and Ukraine, Israel and Hamas and other instability in the Middle East, including from the Houthi rebels in Yemen;
•actions by members of OPEC+ with respect to oil production levels and announcements of potential changes in such levels, including the failure of such countries to comply with supply limitation and production cuts;
•global or national health epidemics, such as the COVID-19 pandemic;
•political or civil unrest in the United States or elsewhere;
•worldwide political, military and economic conditions;
•stockholder activism or activities by non-governmental organizations to limit certain sources of funding for the energy sector or restrict the exploration, development and production of oil and natural gas;
•advances in exploration, development and production technologies or in technologies affecting energy consumption; and
•the potential acceleration of development of alternative fuels, and the impact of related energy supply and conservation policies and regulations by governmental authorities.
Decreased demand for proppant or the development of technically- and cost-effective alternative proppants or new processes to replace hydraulic fracturing would negatively impact our business.
Frac sand is the most commonly used proppant in the completion and re-completion of oil and natural gas wells through hydraulic fracturing. A significant shift in demand from frac sand to other proppants, such as ceramic proppant, the development and use of other effective alternative proppants, or the development of new processes to replace hydraulic fracturing altogether, could cause a decline in demand for frac sand that we produce and would have an adverse effect on our business, financial condition and results of operations.
In addition, fuel conservation measures, alternative fuel requirements and increasing consumer demand for alternatives to oil and natural gas could reduce demand for oil and natural gas. The impact of the reduced demand for oil and natural gas may have an adverse effect on our business, financial condition, prospects, results of operations and cash flows. Additionally, the increased competitiveness of alternative energy sources (such as wind, solar, geothermal, tidal and biofuels) could reduce demand for oil and natural gas and therefore for our products and services, which would lead to a reduction in our revenues and negatively impact our business, financial condition and results of operations.
Our future performance will depend on our ability to succeed in competitive markets and on our ability to appropriately react to potential fluctuations in demand for, and supply of, our products and services.
We operate in a highly competitive market that is characterized by a small number of large, national producers and a larger number of small, regional or local producers. Transportation costs are a significant portion of the total cost to customers of proppant (in many instances, transportation costs can represent more than 50% of delivered cost), the proppant market is typically local, and competition from beyond the local area is limited. Further, competition in the industry is based on customer relationships, reliability of supply, consistency and quality of product, customer service, site location, distribution capability, breadth of product offering, technical support and price.
Some of our competitors may have or may develop greater financial, natural and other resources than we have. Periodically, some of our competitors may reduce the pricing that they offer to our customers for a variety of reasons. One or more of our competitors may develop technology superior to ours or may have production facilities located in closer proximity to certain customer locations than we do.
When the demand for hydraulic fracturing services decreases or the supply of proppant available in the market increases, prices in the proppant market can materially decrease. Our competitors may choose to consolidate, which could provide them with greater financial and other resources than we have and improve their competitive positioning. Furthermore, oil and natural gas exploration and production companies and other providers of hydraulic fracturing services have acquired, and in the future may acquire, their own proppant reserves to fulfill their proppant requirements, and these other market participants may expand their existing proppant production capacity, all of which would negatively impact demand for our proppant. In addition, increased competition in the proppant industry could have an adverse impact on our ability to enter into long-term contracts or to enter into contracts on favorable terms.
Past performance by members of our management team, our directors or their respective affiliates may not be indicative of our future performance or an investment in us.
Information regarding performance by, or businesses associated with, our management team, our directors and their affiliates is presented for informational purposes only. Past performance of our management team, our directors and their affiliates is not a guarantee of our future success or similar results. You should not rely on the historical record of the performance of our management team, our directors or their affiliates as being indicative of the future performance of an investment in us or the returns we will, or are likely to, generate going forward.
Increasing costs, a lack of dependability or availability of transportation services or infrastructure or an oversupply of transportation services could have an adverse effect on our business, financial condition and results of operations.
The transportation industry is subject to possible legislative and regulatory changes that may affect the economics of the industry by requiring changes in operating practices or by changing the demand or the cost of providing truckload services.
Transportation and related costs tend to be a significant component of the total delivered cost to our customers purchasing our proppant. The high relative cost of transportation related expense tends to favor manufacturers located in close proximity to the customer. Additionally, increases in the price of transportation costs, including freight charges, fuel surcharges and demurrage costs, could negatively impact operating costs if we are unable to pass those increased costs along to our customers. Failure to find long-term solutions to these logistical challenges could adversely affect our ability to respond quickly to the needs of our customers or result in additional increased costs, and thus could negatively impact our business, results of operations and financial condition.
Our operations are subject to operational hazards and inherent risks, some of which are beyond our control, and some of which may not be fully covered by insurance.
Our business and operations may be affected by natural or man-made disasters and other external events, many of which are not in our control. In addition to the other risks described in these risk factors, risks include:
•unanticipated ground, grade or water conditions;
•physical facility security breaches;
•inability to acquire or maintain necessary permits or mining or water rights;
•failure to maintain dust controls and meet restrictions on, or applicable requirements with respect to, respirable crystalline silica dust;
•failures in quality control systems or training programs;
•technical difficulties or key equipment failures;
•inability to obtain necessary mining or production equipment or replacement parts;
•fires, explosions or industrial accidents or other accidents; and
•facility shutdowns in response to environmental regulatory actions.
These hazards can also cause personal injury and loss of life, severe damage to and destruction of property and equipment, pollution or environmental damage and suspension or cancellation of operations. Any prolonged downtime or shutdowns at our mining properties or production facilities could have an adverse effect on our business, financial condition and results of operations. In addition, our operations are subject to, and exposed to, employee/employer liabilities and risks such as wrongful termination, discrimination, labor organizing, retaliation claims and general human resource related matters.
Not all of these risks are reasonably insurable, and our insurance coverage contains limits, deductibles, exclusions and endorsements. Our insurance coverage may not be sufficient to meet our needs in the event of loss and any such loss may have an adverse effect on our business, financial condition and results of operations.
Our ability to produce our products economically and in commercial quantities could be impaired if we are unable to acquire adequate supplies of water for our dredging operations.
The dredging process that we currently employ to produce from our Kermit, Texas and Monahans, Texas proppant production and processing facilities requires significant quantities of water from the aquifer underlying our acreage. If in the future there is insufficient capacity available from this aquifer to provide a source of water for our dredging and associated processes as a result of drought or similar conditions affecting the environment, we will be required to obtain water from other sources that may not be readily available, or may be too costly, and we may be unable to continue our dredge mining operations entirely. The effects of climate change may also further exacerbate water scarcity in certain regions, including at the aquifer on our acreage. If an environmental, weather or other event were to require us to discontinue dredging and resume operations using traditional proppant production processes, this could impair our cost of operations and ability to economically produce our product and would have an adverse effect on our financial condition, results of operations and cash flows.
Failure to maintain effective quality control systems at our mining and production facilities could have an adverse effect on our business, financial condition and operations.
The quality and safety of our products are critical to the success of our business. These factors depend significantly on the effectiveness of our quality control systems, which, in turn, depend on a number of factors, including the design of our quality control systems, our quality-training program and our ability to ensure that our employees adhere to the quality control policies and guidelines. Any significant failure or deterioration of our quality control systems could have an adverse effect on our business, financial condition, results of operations and reputation.
Given the nature of our proppant production operations, we face a material risk of liability, delays and increased cash costs of production from environmental and industrial accidents and operational breakdowns.
Our business involves significant risks and hazards, including environmental hazards, industrial accidents and breakdowns of equipment and machinery. Our electric dredge mining operations are subject to delays and accidents associated with electrical supply, repositioning and maintenance. Furthermore, during operational breakdowns, the relevant facility may not be fully operational within the anticipated timeframe, which could result in further business losses. The occurrence of any of these or other hazards could delay production, suspend operations, increase repair, maintenance or medical costs and, due to the integration of our facilities, could have an adverse effect on the productivity and profitability of a particular facility or on our business as a whole. Although insurance policies provide limited coverage for these risks, such policies will not fully cover some of these risks.
Successful operation of the Dune Express will depend on certain factors that may be outside of our control, and the storage and transportation capacity or other anticipated benefits of our Dune Express may not be achieved.
We may encounter adverse geological conditions, regulatory procedures or other legal requirements that could impede the operation of the Dune Express. The inability to obtain any permits and other federal, state or local approvals that may be required, and any excessive delays in obtaining such permits and approvals due, for example, to litigation or third-party appeals, could potentially prevent us from successfully operating the Dune Express in a timely manner.
We could also face difficulties meeting certain delivery obligations to our customers or incur additional costs in making such deliveries by truck or other alternative means. Any material delay caused by our subcontractors could impact our ability achieve the anticipated benefits of the Dune Express and its integrated mining facilities and have an adverse effect on our business, financial condition and results of operations.
Operation of the Dune Express will depend on transmission and distribution facilities. If transmission to the Dune Express or any of its integrated mining facilities were to be interrupted physically, mechanically or with cyber means, it may hinder our ability to mine, sell or deliver proppant to our customers, satisfy our contractual obligations or otherwise operate or fully realize the expected benefits of the Dune Express.
Increased stakeholder and market attention to ESG and conservation matters may adversely impact our business and access to capital.
Businesses across all industries face scrutiny from stakeholders related to their ESG approach and practices. Businesses that are perceived to be operating in contrast to investor or stakeholder expectations and standards, which are continuing to evolve, or businesses that are perceived to have not responded appropriately to the growing concern for ESG issues, regardless of whether there is a legal requirement to do so, may suffer from reputational damage and the business, financial condition, access to capital, and/or stock price of such business entity could be materially and adversely affected. Increased societal, investor, regulator, and stakeholder attention to climate change, natural capital, and other ESG matters along with changes in consumer demand for alternative sources of energy may result in increased costs (including but not limited to increased costs related to compliance, stakeholder engagement, contracting, and insurance) and reduced demand for our customers’ hydrocarbon products and our products and services. Increased and sometimes conflicting investor, lender, and societal expectations regarding voluntary ESG-related disclosures and trends towards mandatory ESG-related disclosures could result in increased costs, heightened regulatory, judicial, and legislative scrutiny, governmental investigations, and litigation. From time to time, we may also be subject to ESG-specific activist campaigns as stockholders may attempt to effect changes to our business or governance practices.
In addition, certain organizations that provide information to investors on corporate governance and related matters have developed ratings processes for evaluating companies on their approach to ESG matters. Such ratings are used by some investors to inform their investment and voting decisions. Accordingly, we may receive pressure from certain investors, lenders or other groups to adopt climate or other ESG-related goals or participate in various voluntary frameworks or certification programs intended to improve our ESG profile. A failure or a perception (whether valid or not) of failure to adequately pursue or implement ESG strategies or adopt ESG goals or commitments which are often aspirational, including any voluntary GHG emission reduction or carbon intensity goals or commitments, could result in litigation or reputational damage, cause investors or customers to lose confidence in us, harm our ability to effectively recruit or retain employees and negatively impact our operations and goodwill, all of which may adversely affect our financial performance. Moreover, even if we voluntarily elect to pursue climate or ESG goals, we cannot guarantee that we will be able to pursue or implement such goals because of potential costs, technical or operational obstacles, uncertainty in long-term assumptions and expectations or other market or technological developments beyond our control. Similarly, we cannot guarantee that participation in any sustainability, climate-related, or ESG certification program or framework will have the intended results on our ESG profile.
Separately, some members of the investment community have increased their focus on the ESG practices and disclosures of public companies, including practices and disclosures related to climate change and sustainability, employment practices and social initiatives, and heightened governance standards. Certain large institutional investors may also evaluate companies for ESG disclosure and performance prior to investing in our Company or including our Company’s stock in their investment products, and such evaluation criteria may not be made known to us. Although this trend has waned recently, to the extent any of these large institutional investors choose not to invest in our Company on account of their evaluation of our ESG performance or a decision to allocate capital away from the fossil fuel production sector, we may lose investors, our cost of capital may increase, and our stock price may be negatively impacted.
Certain public statements with respect to ESG matters, such as emission reduction goals, other environmental targets, or other commitments addressing certain social issues, are becoming increasingly subject to heightened scrutiny from public and governmental authorities, as well as other parties, related to the risk of potential “greenwashing,” (i.e., misleading information or false claims overstating potential ESG benefits). For example, the SEC has recently taken enforcement action against companies for ESG-related misconduct, including alleged greenwashing. Certain regulators, such as the SEC and various state agencies, as well as non-governmental organizations and other private actors have also filed lawsuits under various securities and consumer protection laws alleging that certain ESG-statements, emission reduction claims, approaches to accounting for GHG emissions reductions, or other ESG-related goals, or standards were misleading, false, or otherwise deceptive. Any alleged claims of greenwashing against us or others in our industry may lead to further negative sentiment and diversion of investments. Additionally, we could face increasing costs as we attempt to comply with and navigate further ESG-related focus and scrutiny.
Additionally, certain employment practices and social initiatives are the subject of scrutiny by both those calling for the continued advancement of such policies, as well as those who believe they should be curbed, including government actors, and the complex regulatory and legal frameworks applicable to such initiatives continue to evolve. We cannot be certain of the impact of such regulatory, legal and other developments on our business.
Our business may suffer if we lose or are unable to attract and retain members of our workforce.
We depend to a large extent on the services of our senior management team and other key personnel. These employees have extensive experience and expertise in evaluating and analyzing industrial mineral properties, maximizing production from such properties, marketing industrial mineral production and developing and executing financing and hedging strategies.
Competition for management and key personnel is intense, and the pool of qualified candidates is limited. The loss of any of these individuals or the failure to attract additional personnel as needed could have an adverse effect on our operations and could lead to higher labor costs or the use of less-qualified personnel. In addition, if any of our executives or other key employees were to join a competitor or form a competing company, we could lose customers, suppliers, know-how and other personnel. Our operations also rely on skilled laborers using modern techniques and equipment to mine efficiently. We may be unable to train or attract the necessary number of skilled laborers to maintain our operating costs.
With respect to our trucking services, the industry periodically experiences a shortage of qualified drivers, particularly during periods of economic expansion, in which alternative employment opportunities are more plentiful and freight demand increases, or during periods of economic downturns, in which unemployment benefits might be extended. The trucking industry suffers from a high driver turnover rate, which requires us to continually recruit a substantial number of drivers to operate our equipment and could negatively affect our operations and expenses if we are unable to do so. Our success will be dependent on our ability to continue to attract, employ and retain highly skilled personnel at all levels of our operations.
A shortage of skilled labor together with rising labor costs in the excavation industry may further increase operating costs, which could adversely affect our business, results of operations and financial condition.
Efficient sand excavation using modern techniques and equipment requires skilled laborers, preferably with several years of experience and proficiency in multiple tasks, including processing of mined minerals. If there is a shortage of experienced labor in areas in which we operate, we may find it difficult to hire or train the necessary number of skilled laborers to perform our own operations, which could have an adverse impact on our business, results of operations and financial condition.
As a result of the volatility of the oilfield services industry and the demanding nature of the work, workers may choose to pursue employment in fields that offer a more desirable work environment at wage rates that are competitive. Increased competition for their services could result in a loss of available, skilled workers or at a price that is not as advantageous to our business, both of which could negatively affect our operating results. If we are unable to retain or meet the growing demand for skilled technical personnel, our operating results and our ability to execute our growth strategies may be adversely affected.
Inaccuracies in our estimates of sand reserves and resource deposits, or deficiencies in our title to those deposits, could result in our inability to mine the deposits or require us to pay higher than expected costs.
We base our sand reserve and resource estimates on engineering, economic and geological data assembled and analyzed by our mining engineers, which are reviewed periodically by outside firms. However, frac sand reserve estimates are by nature imprecise and depend to some extent on statistical inferences drawn from available drilling data, which may prove unreliable. There are numerous uncertainties inherent in estimating quantities and qualities of frac sand reserves and non-reserve frac sand deposits and costs to mine recoverable reserves, many of which are beyond our control and any of which could cause actual results to differ materially from our expectations. These uncertainties include:
•geological and mining conditions that may not be fully identified by available data or that may differ from experience;
•assumptions regarding the effectiveness of our mining, quality control and training programs;
•assumptions concerning future prices of frac sand, operating costs, mining technology improvements, development costs and reclamation costs; and
•assumptions concerning future effects of regulation, including the issuance of required permits and taxes by governmental agencies.
In addition, title to, and the area of, mineral properties and water rights may also be disputed. Mineral properties sometimes contain claims or transfer histories that examiners cannot verify. A successful claim that we do not have title to one or more of our properties or lack appropriate water rights could cause us to lose any rights to explore, develop and extract any minerals on that property, without compensation for our prior expenditures relating to such property. Any inaccuracy in our estimates related to our mineral reserves and non-reserve mineral deposits, or our title to such deposits, could result in our inability to mine the deposits or require us to pay higher than expected costs.
Further, the SEC has adopted amendments to its disclosure rules (the “SEC Modernization Rules”) to modernize the mineral property disclosure requirements for issuers whose securities are registered with the SEC under the Exchange Act, which are codified in Regulation S-K subpart 1300. Under the SEC Modernization Rules, the historical property disclosure requirements for mining registrants included in SEC Industry Guide 7 have been replaced. As a result of the adoption of the SEC Modernization Rules, the SEC now recognizes estimates of “measured mineral resources,” “indicated mineral resources” and “inferred mineral resources.” However, compared to mineralization that has been characterized as reserves, mineralization described using these terms has a greater amount of uncertainty as to their existence and whether they can be mined legally or economically, and investors are therefore cautioned not to assume that any reported “measured mineral resources,” “indicated mineral resources” or “inferred mineral resources” are or will be economically or legally mineable.
All of our product sales are currently generated at facilities in West Texas. Any adverse developments at those facilities could have an adverse effect on our business, financial condition and results of operations.
All of our product sales are currently derived from our Kermit and Monahans facilities located in Winkler and Ward Counties in Texas and the OnCore distributed mining network located in West Texas. Any adverse development at these facilities due to catastrophic events or weather, adverse government regulatory impacts, transportation-related constraints or any other events that could cause us to curtail, suspend or terminate operations at any of our facilities, could result in our being unable to deliver our contracted volumes and related obligations. Although we maintain insurance coverage to cover a portion of these types of risks, there could be potential risks associated with our operations not covered by insurance. There also may be certain risks covered by insurance where the policy does not reimburse us for all of the costs related to such risks. Downtime or other delays or interruptions to our future operations that are not covered by insurance could have an adverse effect on our business, results of operations and financial condition. In addition, under our supply contracts, if we are unable to deliver contracted volumes, we may be required to pay liquidated damages that could have an adverse effect on our financial condition and results of operations.
Our operations consume large amounts of natural gas and electricity. An increase in the price or a significant interruption in the supply of these or any other energy sources could have an adverse effect on our business, financial condition and results of operations.
Natural gas and electricity costs represented approximately 1.0% and 1.3%, respectively, of our total product sales in the year ended December 31, 2024, and 2.1% and 0.7%, respectively, of our total product sales in the year ended December 31, 2023. Potential climate change regulations or carbon or emissions taxes could result in higher cost of production for energy, which may be passed on to us in whole or in part. A significant increase in the price of energy that is not recovered through an increase in the price of our products and services or covered through our hedging arrangements or an extended interruption in the supply of electricity or natural gas to our production facilities could have an adverse effect on our business, results of operations and financial condition.
A large portion of our sales is generated by our top 10 customers, and the loss of or a significant reduction in purchases by our largest customers could adversely affect our business, financial condition and results of operations.
Our 10 largest customers accounted for approximately 82.0% of total sales for the year ended December 31, 2024, and approximately 86.5% of total sales for the year ended December 31, 2023. Some of our customers have exited or could exit the business, or have been or could be acquired by other companies that purchase proppant solutions or logistics services we provide from other third-party providers. Our current customers also may seek to acquire proppant or logistics services from other providers that offer more competitive pricing or capture and develop their own sources of proppant solutions or logistics services. The loss of a customer or contract, or a reduction in the amount of proppant solutions or logistics services purchased by any customer, could have an adverse effect on our business, financial condition and results of operations. Further, as a result of market conditions, competition or other factors, these customers may not continue to purchase the same levels of our products in the future, if at all. Substantial reductions in purchased volumes across these customers could have an adverse effect on our business, financial condition and results of operations.
Upon the expiration of our current contracts, our customers may not continue to purchase the same levels of proppant solutions or logistics services due to a variety of reasons. In addition, we may choose to renegotiate our existing contracts on less favorable terms or at reduced volumes in order to preserve relationships with our customers. Any renegotiation of our contracts on less favorable terms, or inability to enter into new contracts on economically acceptable terms upon the expiration of our current contracts, could have an adverse effect on our business, financial condition and results of operations.
Our business and operations depend on our and our customers’ ability to obtain and maintain necessary permits.
We and our customers hold numerous governmental, environmental, mining and other permits and approvals authorizing operations at each of our facilities. Our future success depends on, among other things, our ability, and the ability of our customers, to obtain and maintain the necessary permits and licenses required to conduct operations. In order to obtain permits and renewals of permits in the future, we may be required to prepare and present data to governmental authorities pertaining to the impact that our activities may have on the environment. Compliance with these regulatory requirements is expensive and significantly lengthens the time needed to conduct operations. Additionally, obtaining or renewing required permits is sometimes delayed, conditioned or prevented due to community opposition, opposition from other parties, the location of existing or proposed third-party operations, or other factors beyond our control. The denial of a new or renewed permit essential to our operations, delays in obtaining such a permit or the imposition of conditions in order to acquire the permit could impair our ability to continue operations at the affected facilities, delay those operations, or involve significant unplanned costs, any of which could adversely affect our business, performance and financial condition.
Our supply agreements may preclude us from taking advantage of increasing prices for proppant or mitigating the effect of increased operational costs during the term of those contracts.
The supply agreements we have may negatively impact our results of operations. Our sales contracts require our customers to pay a specified price for a specified volume of proppant. Although some of our supply agreements provide for price adjustments based on various factors, such adjustments are generally calculated on a quarterly basis and do not adjust dollar-for-dollar with adjustments in spot market prices. As a result, in periods with increasing prices our sales will not keep pace with market prices.
Additionally, if our operational costs increase during the terms of our supply agreements, we will not be able to pass some of those increased costs to our customers. If we are unable to otherwise mitigate these increased operational costs, our net income could decline.
A proppant production facility closure entails substantial costs, and if we close any of our facilities sooner than anticipated, our results of operations may be adversely affected.
We base our assumptions regarding the life of our proppant production facilities on detailed studies that we perform from time to time, but our studies and assumptions do not always prove to be accurate. If we close any of our proppant production facilities sooner than expected, sales will decline unless we are able to increase production at any of our other proppant production facilities, which may not be possible. The closure of a proppant production facility may also involve significant fixed closure costs, including accelerated employment legacy costs, severance-related obligations and potentially advance employee notice obligations and attendant costs with respect to a plant closure or mass layoff, and potentially reclamation and other environmental costs and the costs of terminating long-term obligations, including energy contracts and equipment leases. We accrue for the estimated costs to retire the assets over the expected timing of settlement. If we were to reduce the estimated time to settlement, the fixed proppant production facilities closure costs could be applied to a shorter period of production, which would increase production costs per ton produced and could adversely affect our results of operations and financial condition.
In addition, some environmental laws such as CERCLA, impose strict, retroactive and joint and several liability for the remediation of releases of hazardous substances.
Certain of our contracts contain provisions requiring us to deliver minimum amounts of sand-based proppant. If we are unable to meet our minimum requirements under these contracts, we may be required to pay penalties or the contract counterparty may be able to terminate the agreement.
In certain instances, we commit to deliver products under penalty of nonperformance. We commit to deliver products to our customers prior to production, and we are obligated to deliver a minimum volume of sand-based proppant per year or per month under our supply agreements over their respective terms. Depending on the contract, our inability to deliver the requisite volume of sand-based proppant may permit our customers to terminate the agreement or require us to pay our customers a fee, the amount of which is generally calculated by multiplying the difference between the amount of volume contracted for and the amount delivered by a per-ton penalty specified in the contract. In such events, our results of operations may be adversely affected.
Currently, a majority of our operations are concentrated in the Permian Basin, making us vulnerable to risks associated with operating in a limited geographic area.
Currently, a majority of our operations are geographically concentrated in the Permian Basin. As a result, we may be disproportionately exposed to various factors, including, among others: (i) the impact of regional supply and demand factors, (ii) delays or interruptions of completion activity in such areas caused by governmental regulation, (iii) processing or transportation capacity constraints, (iv) market limitations, (v) availability of equipment and personnel or (vi) water shortages or other drought related conditions. This concentration in a limited geographic area also increases our exposure to changes in local laws and regulations, certain lease stipulations designed to protect wildlife and unexpected events that may occur in the regions such as natural disasters, seismic events, industrial accidents or labor difficulties. Any of the risks described above could have an adverse effect on our business, financial condition, results of operations and cash flow.
An increase in the supply of proppant having similar characteristics as the proppant we produce could make it more difficult for us to renew or replace our existing contracts on favorable terms, or at all.
If significant new reserves of proppant are discovered and developed and have similar characteristics to the proppant we produce, we may be unable to renew or replace our existing contracts on favorable terms, if at all. Specifically, if proppant is oversupplied, our customers may not be willing to enter into long-term take-or-pay contracts, may demand lower prices or both, which would have an adverse effect on our business, results of operations and financial condition. Similarly, the COVID-19 pandemic caused a historic slowdown in oil and natural gas activity, which led to an increase in available proppant supply relative to the reduced demand. The foregoing events have led to increased competition among our competitors, which could lead to pressure to further reduce prices to compete effectively.
Our results of operations are significantly affected by the market price of sand-based proppant, which have been historically subject to substantial price fluctuations.
Our results of operations and financial conditions are, and will continue to be, particularly sensitive to the long- and short-term changes in the market price of sand-based proppant. Among other factors, these prices also affect the value of our reserves and inventories, and could negatively impact the market price of our Common Stock.
Market prices are affected by numerous factors beyond our control, including, among others, demand for high quality sand-based proppant, the availability and relative cost of alternate sources of sand, drilling and completion activity in the Permian Basin, prevailing commodity prices and overall economic activity.
Additionally, when demand for sand-based proppant increases, there may not be a corresponding or immediate increase in the prices for our products or our customers may choose to opt for lower-quality, lower-priced products, which could have an adverse effect on our results of operations and financial condition. For the years ended December 31, 2024, 2023, and 2022, our average price was approximately $25.26 per ton, $42.63 per ton, and $40.10 per ton, respectively.
In addition, any future decreases in the rate at which oil and natural gas reserves are discovered or developed, whether due to increased governmental regulation, limitations on exploration and drilling activity, including hydraulic fracturing or other factors, could have an adverse effect on our business and financial condition, even in a stronger oil and natural gas price environment.
Our E&P customers’ operations are subject to operating risks that are often beyond our control and could have an adverse effect on our business, financial condition and results of operations.
In addition to the sand-based proppant that we supply, the operations of our E&P customers rely on several other products and services in order to perform hydraulic fracturing activities, such as skilled laborers and equipment required for pumping proppant, water and fluids into oil and natural gas wells. Any failure by our E&P customers to obtain these other products and services could have an adverse effect on our business, financial condition and results of operations.
There are complex software and technology systems that need to be developed in coordination with our technology partner in connection with our autonomous trucking initiative, and there can be no assurance such systems will be successfully developed or implemented for use in our applications or at all.
Our autonomous trucking technology is based on an artificial intelligence (“AI”) software platform. Our autonomous proppant-delivery vehicles use a substantial amount of third-party software codes and complex hardware to operate. The development of these advanced technologies is inherently complex, and we coordinate with our technology partner in connection with the design, production and deployment of our autonomous proppant-delivery vehicles. Defects and errors may be revealed over time and our control over the performance of such third-party services and systems may be limited. Accordingly, our potential inability to successfully develop and implement the necessary software and technology systems may harm our competitive position.
The autonomous trucking technologies are emerging technologies that may not be commercially viable or may not result in an adequate return of capital when used in our planned applications or at all. There can be no assurances that our technology partner will be able to meet the technological requirements, production timing and end-use specifications required to successfully implement our planned autonomous trucking initiative. As with all AI platforms, there can be no guarantee that our technology partner will adequately train our autonomous trucking platform over time to appropriately operate within our business or provide the services and functionalities suited for our needs. Our autonomous trucking platform is dependent on our technology partner’s obligation to develop and maintain the underlying platform, and any failure by our technology partner, or any vendors it relies on, to do so may adversely impact our business and the deployment of this technology. For example, AI algorithms that we use may be flawed or may be based on datasets that are biased or insufficient. In addition, any latency, disruption, or failure in our AI systems or infrastructure could result in delays or errors in our offerings. Developing, testing, and deploying resource-intensive AI systems may require additional investment and increase our costs, while diverting management’s attention. Any material delays or cost increases may also make us unable to meet certain proppant-delivery obligations to our customers or incur additional costs in making such deliveries by traditional trucking methods or other alternative means, which could have an adverse effect on our business, financial condition and results of operations.
Our autonomous driving technology and related hardware and software, when deployed, could have undetected defects, errors or bugs in hardware or software, which could create safety or cybersecurity issues and could result in operational disruption and expose us to liability and other claims that could adversely affect our business.
Autonomous driving technology is highly technical and very complex, and has in the past and may in the future experience defects, errors or bugs at various stages of implementation. In the event of such defect, error or bug, we may incur significant additional development costs, repair or replacement costs, or more importantly, liability for personal injury or property damage caused by such errors or defects. Our insurance coverage may not be sufficient to cover all the losses or expenses that may arise in connection with the planned applications of our autonomous delivery vehicles. In accidents involving semi-trucks, most of the resulting fatalities are victims outside of the vehicle. If we experience such an event or multiple events, our insurance premiums could significantly increase or insurance may not be available to us at all. In addition, lawmakers or governmental agencies could pass laws or adopt regulations that limit the use of autonomous-trucking technology or increase liability associated with its use. Any of these events could adversely affect our reputation, relationships with our customers, financial condition and results of operations.
In addition, we could face legal claims and regulatory investigations and enforcement, penalties and fines as a result of these problems. Any such lawsuit, investigation or enforcement action may cause irreparable damage to our brand and reputation. In addition, defending a lawsuit, regardless of its merit, or complying with an investigation or enforcement action could be costly and may divert management’s attention and adversely affect the market’s perception of us and our products and services. In addition, our insurance coverage could prove inadequate with respect to a claim and future coverage may be unavailable to us on acceptable terms or at all. These product-related issues could result in claims against us and have an adverse effect on our business, financial condition and results of operations.
Any unauthorized control or manipulation of the information and operational technology systems in our autonomous proppant-delivery vehicles could result in loss of customer confidence in us and the products and services we provide.
Our autonomous proppant-delivery vehicles contain complex information and operational technology systems and built-in data connectivity to log location data and accept and install periodic remote updates to improve or update their functionality or performance. Our technology partner expects to design, implement and test security measures intended to prevent unauthorized access to its and our information and operational technology networks, the autonomous vehicle platforms it produces and related or connected systems. However, hackers may attempt to gain unauthorized access to modify, alter and use such networks, vehicles and systems to gain control of or to change our autonomous vehicles’ functionality, user interface and performance characteristics, or to gain access to data stored in or generated by our autonomous vehicles. Future vulnerabilities could be identified and manipulated and our or our technology partner’s efforts to remediate such vulnerabilities may not be successful. Any unauthorized access to or control of our autonomous proppant-delivery vehicles, or any loss of data, could result in legal claims or proceedings or regulatory investigations and enforcement against us and remediation of such problems could result in significant, unplanned capital expenditures. In addition, regardless of their veracity, reports of unauthorized access to our autonomous proppant-delivery vehicles or our or our customers’ data, as well as other factors that may result in the perception that our autonomous proppant-delivery vehicles or data are capable of being “hacked,” could negatively affect our brand and harm our business, financial condition and results of operations.
Our use of autonomous proppant-delivery vehicles is subject to evolving laws and regulations that could impose legal limitations or substantial costs on our ability to commercially deploy our vehicles.
There are a variety of local, state, and federal regulations that may apply to, and adversely affect, the design, training, and operation of autonomous vehicles in the areas in which we operate. This includes many existing vehicle standards that were not originally intended to apply to vehicles that may not be operated by a human driver. Such regulations, including their enforcement or the enforcement policy associated with the regulations, continue to rapidly change, which increases the likelihood of a patchwork of complex or conflicting regulations, or may delay, restrict or prohibit the availability of certain functionalities of our vehicles, which could adversely affect our business. There are also a growing variety of laws and regulations focused on the development, use, and provision of AI technologies, which are difficult to predict and could result in monetary penalties or other regulatory actions. We may not be able to anticipate new laws or regulations governing our use of AI-powered trucking technologies or predict how new laws or regulations will be interpreted for our business and the operation of our vehicles, which could result in adverse effects on our financial condition, reputation, and our operations.
Natural disasters and unusual weather conditions could disrupt business and result in operational delays and otherwise have an adverse effect on our business.
The occurrence of one or more natural disasters, such as tornadoes, hurricanes, tsunamis, fires, droughts, floods and earthquakes or unusual weather conditions or temperatures in the regions in which our facilities are located could result in delayed operations, repair costs or disruptions to our supply chains or similarly impact the operations of our customers. For example, in February 2021, Texas and New Mexico experienced record-setting cold temperatures from Winter Storm Uri. Proppant volumes were negatively impacted in February and March 2021 as the cold weather delayed completion schedules and pushed forecasted producer activity into the latter half of the year. Events such as this could have an adverse effect on our or our customers’ businesses and may become more frequent or intense as a result of climate change.
Our acquisitions, dispositions and investments may not result in anticipated benefits and may present risks not originally contemplated, which may have a material adverse effect on our liquidity, financial condition and results of operations.
We continually seek opportunities to maximize efficiency and value in our Company, which includes consideration of purchases or sales of assets, businesses, or investments. Such strategic transactions, among others, would be intended to (but may not) result in the realization of savings, the creation of efficiencies, the generation of cash or income, or the reduction of risk. Acquisition transactions may use cash on hand or be financed by additional borrowings or by the issuance of Common Stock. Such transactions could also affect our liquidity, financial condition and results of operations.
Such transactions would also involve risks, and we cannot ensure that:
•any acquisitions we attempt will be completed on the terms announced, or at all;
•any acquisitions would result in an increase in income or provide an adequate return of capital or other anticipated benefits;
•any acquisitions would be successfully integrated into our operations and internal controls, including those related to financial reporting, disclosure and cyber and information security;
•the due diligence conducted prior to an acquisition would uncover situations that could result in financial or legal exposure, or that we will appropriately quantify the exposure from known risks;
•any disposition would not result in decreased earnings, revenue, or cash flow;
•use of cash for acquisitions would not adversely affect our cash available for capital expenditures and other uses; or
•any dispositions, investments, or acquisitions, including integration efforts, would not divert management resources to our detriment.
We have identified a material weakness in our internal control over financial reporting that could, if not remediated, result in material misstatements in our financial statements and cause us to fail to meet our reporting and financial obligations. As a result, current and potential stockholders could lose confidence in our financial reporting, which would harm our business and the trading price of our Common Stock.
As more fully disclosed in this Annual Report under Part II, Item 9A. “Controls and Procedures,” we evaluated, under the supervision and with the participation of our management, including our principal executive officer and principal financial officer, the effectiveness of the design and operation of our disclosure controls and procedures and internal control over financial reporting as of December 31, 2024. Based on that evaluation, we concluded that our disclosure controls and procedures were ineffective as of December 31, 2024 due to a material weakness identified in our internal control over financial reporting.
A material weakness (as defined in Rule 12b-2 under the Exchange Act) is a deficiency, or a combination of deficiencies, in internal control over financial reporting, such that there is a reasonable possibility that a material misstatement of a company’s annual or interim financial statements will not be prevented or detected on a timely basis.
In February 2025, management identified deficiencies in our internal controls over financial reporting related to our information technology (“IT”) general controls (“ITGCs”) in the area of IT program change management and logical access that resulted in a material weakness. In response, we conducted a review of such control deficiencies and did not identify any related material errors in the Company’s historical financial statements.
While this material weakness did not result in a material misstatement of our financial statements, these internal control deficiencies were not remediated as of December 31, 2024 and there is a reasonable possibility that it could have resulted in a material misstatement in the Company's annual or interim financial statements that would not have been detected. Accordingly, we have determined that these internal control deficiencies constituted a material weakness in our internal control over financial reporting. While management is committed to implement a remediation plan as described more fully in Part II, Item 9A. “Controls and Procedures” of this Annual Report, the material weakness described above will not be considered remediated until the enhanced controls operate for a sufficient period of time and management has concluded, through testing, that the related controls are effective. Furthermore, we can give no assurance that the measures we take will remediate the material weakness.
We can give no assurance that additional material weaknesses will not arise in the future. Any failure to remediate this material weakness, or the development of any new material weaknesses in our internal control over financial reporting, could result in material misstatements in our consolidated financial statements and cause us to fail to meet our reporting and financial obligations, which in turn could have a negative impact on our financial condition, results of operations or cash flows, restrict our ability to access the capital markets, require significant resources to correct the material weaknesses or deficiencies, subject us to fines, penalties or judgments, harm our reputation or otherwise cause a decline in both investor confidence and the market price of our Common Stock.
Effective internal controls are necessary for us to provide reliable financial reports, prevent fraud and operate successfully as a public company. If we cannot provide reliable financial reports or prevent fraud, our reputation and operating results could be harmed. We cannot be certain that our efforts to develop and maintain our internal controls will be successful, that we will be able to maintain adequate controls over our financial reporting in the future or that we will be able to comply with our obligations under Section 404 of the Sarbanes-Oxley Act. Any failure to develop or maintain effective internal controls, or difficulties encountered in implementing or improving internal controls, could harm the Company’s operating results or cause us to fail to meet our reporting obligations. Ineffective internal controls could also cause investors to lose confidence in reported financial information, which would likely have a negative effect on the trading price of our Common Stock.
Risks Related to Our Financial Condition
Our indebtedness could adversely affect our financial flexibility and our competitive position.
We have, and expect to maintain in the near term, a significant amount of indebtedness. Under our 2023 ABL Credit Facility, including the ABL Amendment, the lenders thereunder provide revolving credit financing to Atlas LLC in an aggregate principal amount of up to $125.0 million with availability thereunder subject to a borrowing base as described in the 2023 ABL Credit Agreement. As of the date of this filing, we were using $0.2 million for outstanding letters of credit, leaving $124.8 million of borrowing availability under our 2023 ABL Credit Facility.
In accordance with the Hi-Crush Merger Agreement, the Company issued the Deferred Cash Consideration Note for an aggregate principle amount of $111.3 million as of December 31, 2024. This amount is subject to purchase price adjustments as defined in the Hi-Crush Merger Agreement. The Deferred Cash Consideration Note bears interest at a rate of 5.00% per annum if paid in cash, or 7.00% per annum if paid in kind. Interest on the Deferred Cash Consideration Note is payable quarterly in arrears beginning March 29, 2024 through the maturity date of January 31, 2026. As of the date of this filing, we had an outstanding principal balance of $10.0 million remaining under the Deferred Cash Consideration Note.
On February 21, 2025, Atlas LLC entered into a credit agreement (the “2025 Term Loan Credit Agreement”) with Stonebriar, as administrative agent and initial lender, pursuant to which Stonebriar extended Atlas LLC a term loan credit facility comprised of a $540.0 million single advance term loan that was made on February 21, 2025 (the “2025 Term Loan Credit Facility”). The Company used the proceeds from the 2025 Term Loan Credit Facility (i) to refinance the existing 2023 Term Loan Credit Facility and the ADDT Loan (as defined in Item 7. “Management’s Discussion and Analysis of Financial Condition and Results of Operations.—Recent Developments”), (ii) to finance the cash consideration for the Moser Acquisition, and (iii) for general corporate purposes.
Our debt agreements contain a number of significant covenants that may limit our ability to, among other things:
•incur additional indebtedness;
•obtain additional financing for working capital, capital expenditures general corporate and other purposes;
•acquire assets or businesses;
•make loans to or investments in others;
•hedge future production or interest rates;
•engage in certain other transactions without the prior consent of the lenders.
Our indebtedness could also have important consequences to you and significant effects on our business, including:
•increasing our vulnerability to adverse changes in general economic, industry and competitive conditions;
•requiring us to dedicate a substantial portion of our cash flow from operations to make payments on our indebtedness, thereby reducing the availability of our cash flow to fund working capital, capital expenditures and other general corporate purposes, including dividend payments;
•restricting us from exploiting business opportunities;
•making it more difficult to satisfy our financial obligations, including payments on our indebtedness;
•disadvantaging us when compared to our competitors that have less debt; and
•increasing our borrowing costs or otherwise limiting our ability to borrow additional funds for the execution of our business strategy.
We will need substantial additional capital to operate our business, and the inability to obtain needed capital or financing, on satisfactory terms, or at all, whether due to restrictions in our 2023 ABL Credit Facility, 2025 Term Loan Credit Facility or otherwise, could have an adverse effect on our growth and profitability.
Our business plan requires a significant amount of capital expenditures to maintain and grow our production levels over the long term. Although we currently use a significant amount of our cash reserves and cash generated from our operations to fund the maintenance and development of our existing sand reserves, we may need to depend on external sources of capital to fund future capital expenditures if proppant prices were to decline for an extended period of time, if the costs of our operations were to increase substantially or if other events were to occur that reduce our sales or increase our costs. Our ability to obtain bank financing or to access the capital markets for future equity or debt offerings may be limited by our financial condition at the time of any such financing or offering, adverse market conditions or other contingencies and uncertainties that are beyond our control. Our failure to obtain the funds necessary to maintain, develop and increase our asset base could adversely impact our growth and profitability.
In addition, our existing 2023 ABL Credit Facility and 2025 Term Loan Credit Facility contain, and any future financing agreements we may enter into could also contain, operating and financial restrictions and covenants that may limit our ability to finance future operations or capital needs or to engage in, expand or pursue our business activities.
Our ability to comply with these restrictions and covenants is uncertain and will be affected by the levels of cash flow from our operations and events and circumstances beyond our control. If market or other economic conditions deteriorate, our ability to comply with these covenants may be impaired. If we violate any of the restrictions or covenants in our 2023 ABL Credit Facility and 2025 Term Loan Credit Facility, a significant portion of our indebtedness may become immediately due and payable and our lenders’ commitment to make further loans to us may terminate. We might not have, or be able to obtain, sufficient funds to make these accelerated payments. In addition, our obligations under our 2025 Term Loan Credit Facility are secured by substantially all of our assets, and if we are unable to repay our indebtedness or satisfy our other obligations under these, the lenders could seek to foreclose on our assets.
Even if we are able to maintain existing financing or access the capital markets, incurring additional debt may significantly increase our interest expense and financial leverage, and our indebtedness could restrict our ability to fund future development and acquisition activities. In addition, the issuance of any additional equity interests may result in significant dilution to the holders of our Common Stock.
Risks Related to Our Organizational Structure and Ownership of the Common Stock
We may reduce or suspend our dividend and there is no guarantee that we will repurchase shares of our Common Stock in the future.
We have paid a quarterly dividend or distribution for many years, and commencing in the second quarter of 2023 we established base quarterly dividend of $0.15 per share and paid an additional variable dividend of $0.05 per share per quarter, amounting to a total dividend payment of $0.20 per share. In February 2024, we increased the base dividend to $0.16 per share, amounting to a total dividend payment of $0.21 per share. The variable dividend was increased to $0.06 in May 2024, amounting to a total dividend payment of $0.22 per share. In August 2024, we declared an increased dividend to common stockholders of $0.23 per share and elected to move away from the base plus variable dividend structure to a standalone base dividend. In October 2024, we increased the dividend to $0.24 per share and then in February 2025, we increased the dividend to $0.25 per share. Despite establishing this base dividend in 2023, our Board has not yet adopted a dividend policy, and in the future, our Board may, without advance notice, determine to reduce or suspend our dividends in order to maintain our financial flexibility and best position the Company for long‑term success. The declaration and amount of future dividends is at the discretion of our Board and will depend on our financial condition, results of operations, cash flows, prospects, industry conditions, capital requirements and other factors and restrictions our Board deems relevant. The likelihood that dividends will be reduced or suspended is increased during periods of prolonged market weakness or uncertainty, such as the economic downturn that resulted from the COVID-19 pandemic and the oil price collapse in 2020. In addition, our ability to pay dividends may be limited by agreements governing our indebtedness now or in the future. Although we do not currently have plans to reduce or suspend our dividend, there can be no assurance that we will not reduce our dividend or that we will continue to pay a dividend in the future.
In October 2024, our Board authorized a share repurchase program that allows us to repurchase up to $200.0 million of our outstanding Common Stock, but the exact number of shares to be repurchased is not guaranteed, and the program may be modified, suspended or discontinued at any time without prior notice. The Company is not obligated to repurchase any dollar amount or number of shares under the program. Any elimination of, or downward revision in, our share repurchase program could have an adverse effect on the market price of our Common Stock.
Future sales of Common Stock in the public market, or the perception that such sales may occur, could reduce the trading price of the Common Stock, and any additional capital raised by us through the sale of equity or convertible securities may dilute your ownership in our Company.
In connection with the Offering (as defined below), the Company and its executive officers and directors entered into lock-up agreements with the underwriters in which the Company and they agreed, subject to certain exceptions, not to sell, directly or indirectly, any of their shares of Common Stock without the permission of Goldman Sachs & Co. LLC and Piper Sandler & Co., the representatives for the underwriters, for a period of 45 days following the date of the prospectus supplement filed in connection with the offering (the “Lock-Up Period”). When the Lock-Up Period expires, we and our executive officers and directors will be able to sell Common Stock in the public market, subject to compliance with applicable securities laws restrictions. In addition, Goldman Sachs & Co. LLC and Piper Sandler & Co. may, in their sole discretion, release all or some portion of the Common Stock subject to lock-up agreements at any time and for any reason. In addition, pursuant to the Moser Purchase Agreement , certain former Moser stockholders are subject to a similar lock-up of 90 days following their receipt of shares of our Common Stock as consideration in the Moser Acquisition.
We also entered into the Moser Registration Rights Agreement in connection with the Moser Acquisition, which provided the holder party thereto with certain shelf registration rights with respect to the shares of our Common Stock issued to it as consideration in the Moser Acquisition, subject to certain customary thresholds and conditions. Any sales of shares of our Common Stock by such holder, or expectations thereof, could similarly have the effect of depressing the market price for our Common Stock.
In addition, subject to certain limitations and exceptions, the Legacy Owners holding shares of Common Stock may sell those shares in the future. Certain Legacy Owners who own, in the aggregate, approximately 31% of the Common Stock, are party to the A&R Registration Rights Agreement, which includes provisions pursuant to which we have agreed, after the expiration of any applicable lock-up period, to register under the U.S. federal securities laws the offer and resale of shares of Common Stock by such Legacy Owners or certain of their respective affiliates or permitted transferees under the A&R Registration Rights Agreement.
We may also sell additional shares of Common Stock in subsequent offerings. Sales of substantial amounts of our Common Stock in the public market, or the perception that these sales may occur, could cause the market price of our Common Stock to decline. In addition, the sale of such shares, or the perception that such sales may occur, could impair our ability to raise capital through the sale of additional common or preferred stock.
We cannot predict with certainty the size of future issuances of Common Stock or the effect, if any, that future issuances and sales of shares of Common Stock will have on the market price of the Common Stock. Sales of substantial amounts of Common Stock (including shares issued in connection with an acquisition, upon expiration of lock-ups, early release of these agreements or otherwise), or the perception that such sales could occur, may adversely affect prevailing market prices of the Common Stock.
Certain of the Principal Stockholders will have the ability to direct the voting of a significant proportion of the voting power of the Common Stock, and their interests may conflict with those of other stockholders.
In connection with the consummation of the Up-C Simplification, the Principal Stockholders entered into the A&R Stockholders’ Agreement with the Company. The Principal Stockholders collectively own approximately 36% of the Company’s voting stock as of February 21, 2025. As a result, on a combined basis, the Principal Stockholders have considerable influence over matters requiring stockholder approval, including the election of directors, changes to our organizational documents and significant corporate transactions. This concentration of ownership makes it unlikely that any other holder or group of holders of Common Stock will be able to affect the way the Company is managed or the direction of its business. The interests of the Principal Stockholders with respect to matters potentially or actually involving or affecting the Company, such as future acquisitions, financings and other corporate opportunities and attempts to acquire the Company, may conflict with the interests of other stockholders. Given this significant concentrated ownership, the Principal Stockholders would likely have to approve any potential acquisition of the Company.
The A&R Stockholders’ Agreement provides Mr. Brigham (or his affiliates, as applicable) with the right to designate certain numbers of nominees to the Board and the right to approve certain actions by the Company, so long as the Principal Stockholders and their affiliates collectively beneficially own specified percentages of the outstanding shares of Common Stock. Additionally, the A&R Stockholders’ Agreement provides that the Principal Stockholders agree to cause their respective shares of Common Stock to be voted in favor of the election of each of the director nominees designated by Mr. Brigham.
Accordingly, Mr. Brigham has the ability to strongly influence the election of the members of the Board, and thereby its management and affairs. In addition, the Principal Stockholders are able to strongly influence the outcome of all matters requiring stockholder approval, including mergers and other material transactions. This ownership by the Principal Stockholders may also have the effect of deterring hostile takeovers, delaying or preventing changes in control or changes in management, or limiting the ability of other stockholders to approve transactions that they may deem to be in the best interests of the Company. Moreover, this ownership by the Principal Stockholders may also adversely affect the trading price of the Common Stock to the extent investors perceive a disadvantage in owning stock of a company with such concentrated ownership.
Certain of the Principal Stockholders and members of the Board are not limited in their ability to compete with the Company, and the corporate opportunity provisions in the Charter permit certain of the Principal Stockholders and members of the Board to benefit from corporate opportunities that might otherwise be available to us.
The Charter provides that the Principal Stockholders and any member of the Board who is not at the time an officer of the Company, or their respective affiliates are not restricted from owning assets or engaging in businesses that compete directly or indirectly with the Company and that the Company renounces any interest or expectancy in any business opportunity that may be from time to time presented to the Principal Stockholders and any member of the Board who is not at the time an officer of the Company, or their respective affiliates. In particular, subject to the limitations of applicable law, the Charter, among other things:
•permits the Principal Stockholders or any member of the Board who is not at the time an officer of the Company or their respective affiliates to conduct business that competes with the Company and to make investments in any kind of property in which the Company may make investments; and
•provides that if the Principal Stockholders or any member of the Board who is not at the time an officer of the Company or their respective affiliates becomes aware of a potential business opportunity, transaction or other matter, they will have no duty to communicate or offer that opportunity to the Company.
The Principal Stockholders or any member of the Board who is not at the time an officer of the Company, or their respective affiliates, may become aware, from time to time, of certain business opportunities (such as acquisition opportunities) and may direct such opportunities to other businesses in which they have invested, in which case the Company may not become aware of or otherwise have the ability to pursue such opportunity. Further, such businesses may choose to compete with the Company for these opportunities, possibly causing these opportunities to not be available to the Company or causing them to be more expensive for the Company to pursue. In addition, the Principal Stockholders and any member of the Board who is not at the time an officer of the Company, and their respective affiliates, may dispose of mining or other properties or other assets in the future, without any obligation to offer the Company the opportunity to purchase any of those assets. As a result, the Company’s renouncing of its interest and expectancy in any business opportunity that may be from time to time presented to the Principal Stockholders and any member of the Board who is not at the time an officer of the Company, and their respective affiliates, could adversely impact the Company’s business or prospects if attractive business opportunities are procured by such parties for their own benefit rather than for the Company’s.
Certain of the Principal Stockholders or their affiliates are established participants in the oil and natural gas industry and may have resources greater than ours, which may make it more difficult for the Company to compete with the Principal Stockholders or their affiliates with respect to commercial activities as well as for potential acquisitions. We cannot assure you that any conflicts that may arise between us and our stockholders, on the one hand, and the Principal Stockholders or their affiliates, on the other hand, will be resolved in our favor. As a result, potential competition from the Principal Stockholders or their affiliates could adversely impact our results of operations.
Anti-takeover provisions in our organizational documents might discourage or delay acquisition bids or merger proposals, which may adversely affect the market price of the Common Stock and limit the price investors might be willing to pay in the future for the Common Stock.
The Charter and Bylaws contain provisions that may discourage unsolicited takeover proposals that stockholders may consider to be in their best interests. These provisions:
•authorize the issuance of undesignated preferred stock, the terms of which may be established and the shares of which may be issued without stockholder approval, and which may include super voting, special approval, dividend or other rights or preferences superior to the rights of Common Stock;
•prohibit stockholder action by written consent, which requires all stockholder actions to be taken at a meeting of the Company’s stockholders at such time as the Principal Stockholders cease to own more than a majority of the outstanding shares of the Common Stock;
•provide for the Board to be divided into three classes of directors, with each class as nearly equal in number as possible, serving staggered three-year terms, other than directors that may be elected by holders of preferred stock, if any;
•provide that the Board is expressly authorized to make, alter or repeal the Bylaws; and
•establish advance notice requirements for nominations of directors or for proposing matters that can be acted upon by stockholders at stockholder meetings.
These anti-takeover provisions could discourage, delay or prevent a transaction involving a change in control of the Company altogether, even if doing so would benefit our stockholders. These provisions could also discourage proxy contests and make it more difficult for our stockholders to elect directors of their choosing and to cause the Company to take other corporate actions our stockholders desire. Further, the A&R Stockholders’ Agreement, the staggered Board and the ability of the Board to designate the terms of and issue new series of preferred stock may make the removal of management more difficult and may discourage transactions that otherwise could involve payment of a premium over prevailing market prices for our securities.
The Charter designates the Court of Chancery of the State of Delaware and, to the extent enforceable, the federal district courts of the United States of America as the sole and exclusive forum for certain types of actions and proceedings that may be initiated by our stockholders, which could limit such stockholders’ ability to obtain a favorable judicial forum for disputes with the Company or our directors, officers, employees or agents.
The Charter provides that, unless the Company consents in writing to the selection of an alternative forum, the Court of Chancery of the State of Delaware (or, if the Court of Chancery of the State of Delaware does not have jurisdiction, the Superior Court of the State of Delaware, or, if the Superior Court of the State of Delaware does not have jurisdiction, the United States District Court for the District of Delaware, in each case, subject to that court having personal jurisdiction over the indispensable parties named defendants therein) will, to the fullest extent permitted by applicable law, be the sole and exclusive forum for any stockholder (including a beneficial owner) to bring (i) any derivative action or proceeding brought on the Company’s behalf, (ii) any action asserting a claim of breach of a fiduciary duty owed by any of the Company’s current or former directors, officers, employees or stockholders to the Company or its stockholders, (iii) any action asserting a claim arising pursuant to any provision of the DGCL, the Charter or the Bylaws (as either may be amended or restated), or as to which the DGCL confers jurisdiction to the Court of Chancery of the State of Delaware, the Charter or Bylaws, or (v) any other action asserting a claim against the Company that is governed by the internal affairs doctrine.
The Charter also provides that, unless the Company consents in writing to an alternate forum, to the fullest extent permitted by applicable law, the federal district courts of the United States will be the exclusive forum for resolving any complaint asserting a cause of action arising under the Securities Act. Notwithstanding the foregoing, the exclusive forum provision will not apply to suits brought to enforce any liability or duty created by the Exchange Act or any other claim for which the federal courts have exclusive jurisdiction. While the Delaware courts have determined that such choice of forum provisions are facially valid, a stockholder may nevertheless seek to bring a claim in a venue other than those designated in the exclusive forum provisions, and there can be no assurance that such provisions will be enforced by a court in those other jurisdictions. If a court were to find the exclusive-forum provisions contained in the Charter to be inapplicable or unenforceable in an action, the Company may incur additional costs associated with resolving such action in other jurisdictions, which could harm our business.
To the fullest extent permitted by law, any person or entity purchasing or otherwise acquiring any interest in shares of our capital stock will be deemed to have notice of, and consented to, the provisions of the Charter described in the preceding sentence. This choice of forum provision may limit a stockholder’s ability to bring a claim in a judicial forum that it finds favorable for disputes with the Company or our directors, officers, employees or agents, which may discourage such lawsuits against the Company and such persons. Alternatively, if a court were to find these provisions of the Charter inapplicable to, or unenforceable in respect of, one or more of the specified types of actions or proceedings, the Company may incur additional costs associated with resolving such matters in other jurisdictions, which could adversely affect our business, financial condition or results of operations.
We may issue preferred stock the terms of which could adversely affect the voting power or value of the Common Stock.
The Charter authorizes the Company to issue, without the approval of its stockholders, one or more classes or series of preferred stock having such designations, preferences, limitations and relative rights, including preferences over Common Stock respecting dividends and distributions, as the Board may determine. The terms of one or more classes or series of preferred stock could adversely impact the voting power or value of the Common Stock. For example, the Company might grant holders of preferred stock the right to elect some number of its directors in all events or on the happening of specified events or the right to veto specified transactions. Similarly, the repurchase or redemption rights or liquidation preferences the Company might assign to holders of preferred stock could affect the residual value of the Common Stock.
As a result of the Up-C Simplification, the anticipated net cash tax savings attributable to our prior Up-C structure are no longer available to us. The loss of these tax benefits is likely to adversely impact our future tax liability, and this adverse impact could significantly outweigh any costs savings and/or other benefits that resulted from the Up-C Simplification, which could adversely affect our liquidity or the value of our Common Stock.
Under our previous Up-C structure, exchanges of Operating Units for Old Atlas Class A Common Stock pursuant to the terms of the Previous Atlas Operating LLC Agreement generally resulted in certain tax basis increases related to Atlas Operating’s assets. These tax basis increases were expected to generate additional depreciation, depletion, and amortization deductions which in turn, would have reduced our taxable income and resulted in reduced cash tax liabilities. The Company’s exchange of Operating Units for Common Stock in connection with the tax-deferred Up-C Simplification is not expected to result in any such tax basis increases, except to the extent of the limited amount of gain that might have been recognized by the holders of Operating Units as a result of certain debt-financed deductions. Moreover, following completion of the Up-C Simplification, because no Operating Units are held by any person other than Old Atlas, there will be no future exchanges of Operating Units for shares of Old Atlas Class A Common Stock or the Company’s Common Stock. Accordingly, the net cash tax savings that were expected to be available to Old Atlas under the previous Up-C structure are no longer be available to us since the completion of the Up-C Simplification. Foregoing these potential cash tax savings attributable to the Up-C structure will likely to increase our tax liability materially, and such increased tax liability could significantly outweigh the anticipated benefits of the Up-C Simplification, reducing the amount of cash available to use in our business or distribute to our stockholders, which could adversely affect our liquidity or the value of our Common Stock.
The Company’s new structure may impact our ability to offer equity consideration in acquisitive transactions on a tax-deferred basis, which could increase the price we must pay in such acquisition or adversely affect our ability to compete with other potential acquirors.
Our previous Up-C structure permitted us to use Operating Units, rather than Old Atlas Class A Common Stock, as equity consideration in acquisitive transactions. Due to the classification of Atlas Operating as a partnership for U.S. federal income tax purpose, many sellers in potential acquisitive transactions would have been able to receive Operating Units, but not shares of Old Atlas Class A Common Stock, as tax-deferred consideration for assets or equity of a target company, making Operating Units a preferable form of equity consideration. The Up-C Simplification eliminated our ability to offer Operating Units as equity consideration, such that we may not be able to offer tax-deferred equity consideration to potential sellers, while many other companies in the energy industry are organized as partnerships and would have this ability. As such, our inability to offer tax-deferred equity consideration in acquisitive transactions could require us to pay more for assets or target companies than we previously would have or could adversely affect our ability to compete with other potential acquirors.
Risks Related to Environmental, Mining and Other Regulations
Silica-related health issues and legislation, including compliance with existing or future regulations relating to respirable crystalline silica, or litigation could have an adverse effect on our business, reputation or results of operations.
We are subject to laws and regulations relating to human exposure to crystalline silica. For example, OSHA has implemented rules establishing a more stringent permissible exposure limit for exposure to respirable crystalline silica and provided other provisions to protect employees. These rules require compliance with engineering control obligations to limit exposures to respirable crystalline silica in connection with hydraulic fracturing activities. In June 2022, the DOL’s MSHA launched a new enforcement initiative to better protect U.S. miners from health hazards resulting from repeated overexposure to respirable crystalline silica. MSHA reports that silica dust affects thousands of miners each year and, without adequate protection, miners face risks of serious illnesses, many of which can be fatal.
As part of the program, MSHA will conduct silica dust-related mine inspections and expand silica sampling at mines, while providing mine operators with compliance assistance and best practices to limit miners’ exposure to silica dust.
Specifically, the silica enforcement initiative will include:
•Spot inspections at mines with a history of repeated silica overexposures to closely monitor and evaluate health and safety conditions.
•Increased oversight and enforcement of known silica hazards at mines with previous citations for exposing miners to silica dust levels over the existing permissible exposure limit of 100 micrograms. For mines where the operator has not timely abated hazards, MSHA will issue a withdrawal order until the silica overexposure hazard has been abated.
•Expanded silica sampling at mines to ensure inspectors’ samples represent the mines, commodities, and occupations known to have the highest risk for overexposure.
•A focus on sampling during periods of the mining process that present the highest risk of silica exposure for miners.
•Reminding miners about their rights to report hazardous health conditions, including any attempt to tamper with the sampling process.
In addition, the DOL’s Educational Field and Small Mine Services staff will provide compliance assistance and outreach to mine operators, unions and other mining community organizations to promote and advance protections for miners.
The MSHA initiative is intended to take immediate action to reduce the risks of silica dust exposure as the DOL’s development of a mining industry standard continues. Then, in a related subsequent regulatory action, on April 18, 2024, MSHA published a final rule designed to reduce miner exposure to respirable crystalline silica. Under the final rule, which took effect in June 2024, the uniform permissible exposure limit for respirable crystalline silica is set at 50 micrograms per cubic meter of air and the action level is set at 25 cubic meters of air for all mines. The rule also imposes requirements for monitoring and controlling exposure to respirable crystalline silica, requires medical surveillance at certain mines, and updates existing respiratory protection requirements to match industry standards. We could face increased compliance costs as a result of this rule.
If we are unable to satisfy these obligations, or are not able to do so in a manner that is cost effective or attractive to our customers, our business operations may be adversely affected or availability or demand for our products could be significantly affected. Federal and state regulatory authorities, including OSHA and MSHA, and analogous state agencies may continue to propose changes in their regulations regarding workplace exposure to crystalline silica, such as permissible exposure limits and required controls and personal protective equipment, and we can provide no assurance that we will be able to comply with any future laws and regulations relating to exposure to crystalline silica that are adopted, or that costs of complying with such future laws and regulations or any costs arising from non-compliance would not have an adverse effect on our operating results by requiring us to modify or cease our operations.
In addition, the inhalation of respirable crystalline silica is associated with health risks, including the lung disease silicosis. There is evidence of an association between crystalline silica exposure or silicosis and lung cancer and possible association with other diseases, including immune system disorders such as scleroderma. These health risks have been, and may continue to be, a significant issue confronting the hydraulic fracturing industry. Concerns over silicosis and other potential adverse health effects, as well as concerns regarding potential liability from the use of frac sand, may have the effect of discouraging our customers’ use of frac sand. The actual or perceived health risks of handling frac sand could adversely affect hydraulic fracturing service providers, including us, through reduced use of frac sand, the threat of product liability or employee lawsuits naming us as a defendant, increased scrutiny by federal, state and local regulatory authorities of us and our customers or reduced financing sources available to the hydraulic fracturing industry.
Over the past few decades, a number of companies that utilize silica in their operations have been named as a defendant, usually among many defendants, in numerous product liability lawsuits brought by or on behalf of current or former employees or customers alleging damages caused by silica exposure. The silica-related litigation brought against us to date and associated litigation costs, settlements and verdicts have not resulted in a material liability to us, and we presently maintain insurance policies where available. However, we may continue to have silica exposure claims filed against us in the future, including claims that allege silica exposure for periods or in areas not covered by insurance, and the costs, outcome and impact to us of any pending or future claims is not certain. Any such pending or future claims or inadequacies of our insurance coverage could have a material adverse effect on our business, reputation, financial condition, and results of operations.
Federal, state and local legislative and regulatory initiatives relating to hydraulic fracturing and the potential for related litigation could result in increased costs, additional operating restrictions or delays for our customers, which could cause a decline in the demand for our proppant and negatively impact our business, results of operations and financial condition.
We supply proppant to hydraulic fracturing operators in the oil and natural gas industry. Hydraulic fracturing is an important practice that is used to stimulate production of oil and natural gas from low permeability hydrocarbon bearing subsurface rock formations. The hydraulic fracturing process involves the injection of water, proppant, and chemicals under pressure into the formation to fracture the surrounding rock, increase permeability and stimulate production.
Although we do not directly engage in hydraulic fracturing activities, our customers purchase our proppant for use in their hydraulic fracturing activities. Hydraulic fracturing is typically regulated by state oil and natural gas commissions and similar agencies. Some states have adopted, and other states are considering adopting, regulations that could impose new or more stringent permitting, disclosure or well construction requirements on hydraulic fracturing operations. Aside from state laws, local land use restrictions may restrict drilling in general or hydraulic fracturing in particular. Municipalities may adopt local ordinances attempting to prohibit hydraulic fracturing altogether or, at a minimum, allow such fracturing processes within their jurisdictions to proceed but regulating the time, place and manner of those processes. In addition, federal agencies have started to assert regulatory authority under the Safe Drinking Water Act over the process. At the same time, certain environmental groups have suggested that additional laws may be needed and, in some instances, have pursued voter ballot initiatives to more closely and uniformly limit or otherwise regulate the hydraulic fracturing process, and legislation has been proposed by some members of Congress to provide for such regulation.
The adoption of new laws or regulations at the federal, state or local levels imposing reporting obligations on, or otherwise limiting, delaying, restricting, or prohibiting the hydraulic fracturing process could make it more difficult to complete oil and natural gas wells, increase our customers’ costs of compliance and doing business, and otherwise adversely affect the hydraulic fracturing services they perform, which could negatively impact demand for our proppant. In addition, heightened political, regulatory, and public scrutiny of hydraulic fracturing practices could expose us or our customers to increased legal and regulatory proceedings, which could be time- consuming, costly, or result in substantial legal liability or significant reputational harm. We could be directly affected by adverse litigation involving us, or indirectly affected if the cost of compliance limits the ability of our customers to operate. Such costs and scrutiny could directly or indirectly, through reduced demand for our proppant, have an adverse effect on our business, financial condition and results of operations.
We and our customers are subject to extensive environmental and natural resources regulations that impose, and will continue to impose, risks of significant costs and liabilities. In addition, future regulations, or more stringent enforcement of existing regulations, could increase those costs and liabilities, which could adversely affect our results of operations.
We are subject to a variety of federal, state and local environmental laws and regulations affecting the mining and mineral processing industry, including, among others, those relating to environmental permitting and licensing, plant and wildlife protection, wetlands protection, air and water emissions, greenhouse gas emissions, water pollution, waste management, including the transportation and disposal of waste and other materials, remediation of soil and groundwater contamination, land use, reclamation and restoration of properties, hazardous materials and natural resources. These laws and regulations have imposed, and will continue to impose, numerous obligations on our operations and the operations of our customers, including the acquisition of permits or other approvals to conduct regulated activities, the imposition of restrictions on the types, quantities and concentrations of various substances that may be released into the environment or injected in non-productive formations below ground in connection with oil and natural gas drilling and production activities, the incurrence of capital expenditures to mitigate or prevent releases of materials from our equipment or facilities or from customer locations where we are providing services, the imposition of substantial liabilities for pollution resulting from our operations, and the application of specific health and safety criteria addressing worker protection. Some environmental laws impose substantial penalties for noncompliance, and others, such as CERCLA, impose strict, retroactive and joint and several liability for the remediation of releases of hazardous substances.
Further, our business activities present risks of incurring significant environmental costs and liabilities, including costs and liabilities resulting from our handling of oilfield and other wastes, because of air emissions and wastewater discharges related to our operations, and due to historical oilfield industry operations and waste disposal practices. Moreover, accidental releases or spills may occur in the course of our operations or at facilities where our wastes are taken for reclamation or disposal, and we cannot assure you that we will not incur significant costs and liabilities as a result of such releases or spills, including any third-party claims for injuries to persons or damages to properties or natural resources. Remedial costs and other damages arising as a result of environmental laws and costs associated with changes in environmental laws and regulations could be significant and have an adverse effect on our liquidity, results of operations and financial condition.
Additionally, any failure by us or by our customers to comply with applicable environmental laws and regulations may cause governmental authorities to take actions that could adversely impact our operations and financial condition, including:
•assessment of sanctions including administrative, civil or criminal penalties;
•denial, modification, or revocation of permits or other authorizations;
•occurrence of restrictions, delays or cancellations in permitting or development or performance of projects or operations;
•imposition of injunctive obligations or other limitations on our operations, including cessation of operations; and
•requirements to perform site investigatory, remedial, or other corrective actions or the incurrence of capital expenditures.
Moreover, environmental requirements, and the interpretation and enforcement of these requirements, change frequently and have tended to become more stringent over time. Future environmental laws and regulations could restrict our ability to expand our facilities or extract our mineral deposits or could require us to acquire costly equipment or to incur other significant expenses in connection with our business. The costs associated with complying with such requirements could have an adverse effect on our business, financial condition and results of operations. Additionally, our customers may not be able to comply with any new or amended laws and regulations, which could cause our customers to curtail or cease operations and thus reduce demand for our products and services. We cannot at this time reasonably estimate our costs of compliance or the timing of any costs associated with any new or amended laws and regulations, or any material adverse effect that any new or modified standards will have on our customers and, consequently, on our operations.
Our and our customers’ operations are subject to a number of risks arising out of the threat of climate change, including regulatory, political, litigation and financial risks, which could result in increased operating and capital costs for our customers and reduced demand for our products and services.
The threat of climate change continues to attract considerable attention in the United States and around the world. Numerous proposals have been made and could continue to be made at the international, national, regional and state levels of government to monitor and limit existing emissions of GHGs. These efforts have included consideration of cap-and-trade programs, carbon taxes, GHG disclosure obligations and regulations that directly limit GHG emissions from certain sources. As a result, our operations and the operations of our natural gas and crude oil exploration and production customers are subject to a series of regulatory, political, litigation, financial, and physical risks associated with the production and processing of fossil fuels and the emission of GHGs.
At the federal level, the EPA has adopted rules that, among other things, establish construction and operating permit reviews for GHG emissions from certain large stationary sources and require the monitoring and annual reporting of GHG emissions from certain industrial sources. However, on January 20, 2025, President Trump signed an Executive Order directing the EPA to reconsider the legality of its GHG “endangerment finding,” which provides the basis for EPA’s authority to regulate GHG emissions. The EPA has also adopted rules imposing new standards reducing methane emissions from oil and gas operations through limitations on venting and flaring and the implementation of enhanced emission leak detection and repair requirements. The regulation of methane emissions from oil and gas facilities has been subject to considerable attention in recent years, and the EPA recently finalized rules in December 2023 that establish new and more stringent standards for the use of emission capture and control equipment and systems, leak detection equipment and monitoring, and so-called “green well completion” requirements for both new and existing sources across the oil and gas sector. The BLM also finalized a rule on April 10, 2024 intended to curtail the waste of methane flared, vented, or leaked from oil and gas operations on federal and Tribal lands. In addition, the U.S. Congress may continue to consider and pass legislation related to the reduction of GHG emissions, including methane and carbon dioxide. For example, the IRA, which was signed into law in August 2022, appropriates significant federal funding for renewable energy initiatives The IRA also, for the first time ever, imposes a fee on GHG emissions from certain facilities. In November 2024, the EPA issued a final rule to implement this emissions charge, setting the fee for 2024 at $900 per ton of methane emitted above statutorily specified waste emissions thresholds set by Congress. The fee is set to increase to $1,200 per ton in 2025, and $1,500 in 2026 and each year thereafter. Congress and the Trump administration may take action to amend, rescind, or otherwise modify the IRA 2022 and its implementing regulations, though the impact or timing of such action, or whether action will occur at all, cannot be predicted. These regulatory actions, the emissions fee, and funding provisions of the IRA could increase operating costs within the oil and gas industry and accelerate the transition away from fossil fuels, which could in turn reduce demand for our products and services and adversely affect our and our customers’ business and results of operations.
At the international level, the United Nations-sponsored Paris Agreement, though non-binding, calls for signatory nations to limit their GHG emissions through individually determined reduction goals every five years after 2020. However, on January 20, 2025, President Trump signed an Executive Order once again withdrawing the United States from the Paris Agreement. The United States’ participation in future United Nations climate-related conferences and the impacts of these orders, pledges, agreements and any legislation or regulation promulgated to fulfill the United States’ commitments under the Paris Agreement or other international agreements cannot be predicted at this time.
Litigation risks are also increasing, as a number of cities and other entities have sought to sue various oil and natural gas companies in state or federal court, alleging, among other things, that such companies created public nuisances by producing fuels that contributed to climate change and its effects, such as rising sea levels or extreme weather events, and therefore are responsible for resulting infrastructure damages, or alleging that the companies have been aware of the adverse effects of climate change for some time but defrauded their investors by failing to adequately disclose those impacts. Our customers’ involvement in such a case, regardless of the substance of the allegations, could have adverse reputational impacts and any unfavorable ruling in any such case could significantly impact their operations and consequently could have an adverse impact on demand for our products and services.
There are also increasing financial risks for the oil and gas sector as shareholders, bondholders, and lenders may elect in the future to shift some or all of their investments into non-fossil fuel energy sectors. Certain institutional lenders have shifted their investment practices to favor non-fossil fuel energy sources, such as wind and solar, and some of them may elect not to provide funding to the oil and gas sector. Additionally, there is also a risk that financial institutions will be pressured or required to adopt policies that limit funding for the oil and gas sector, though this trend has waned in recent years. Further, the SEC finalized a rule in March 2024 that establishes a framework for the reporting of climate risks, targets, and metrics. The rule is currently stayed pending litigation, and on February 11, 2025, SEC Acting Chairman Mark T. Uyeda requested that the U.S. Court of Appeals for the Eighth Circuit not schedule argument in the case while the SEC reconsiders the March 2024 rule. Relatedly, California has enacted new laws requiring additional disclosure with respect to certain climate-related risks and GHG emissions reduction claims, and New York and other states are considering adopting similar laws. Litigation over these laws is ongoing, and we cannot predict the outcome. Enhanced climate-related disclosure requirements could result in additional legal and accounting costs and accelerate the trend of certain stakeholders and lenders restricting or seeking more stringent conditions with respect to their investments in carbon-intensive sectors. Such disclosure regulations could also lead to increased litigation risks and reputational harm. Any material reduction in the capital available to us or our customers could make it more difficult to secure funding for our growth projects or our customers’ exploration and production activities, which could reduce the demand for our products and services and impact our financial performance.
Finally, physical climate change impacts, including increased frequency and severity of storms, severe and persistent drought conditions, winter storms, floods and other climatic events, may potentially have a large impact on our operations and financial results, and our customers’ exploration and production operations. While our consideration of changing climatic conditions and inclusion of safety factors in the design and operation of our facilities is intended to reduce the uncertainties that climate change and other events may potentially introduce, our ability to mitigate the adverse impacts of these events depends in part on the effectiveness of our disaster preparedness and response and business continuity planning and those of our customers, which may have not considered or prepared for every eventuality.
Restrictions on our operations and those of our customers intended to protect certain species of wildlife could have an adverse impact on our ability to expand some of our existing operations or limit our customers’ ability to develop new oil and natural gas wells.
Various federal and state statutes prohibit certain actions that adversely affect endangered or threatened species and their habitat, migratory birds, wetlands, and natural resources. These statutes include the ESA, the MBTA and the CWA. The USFWS may designate critical habitat areas that it believes are necessary for survival of threatened or endangered species. A critical habitat designation could result in further material restrictions on federal land use or on private land use and could delay or prohibit land access or development. Where takings of or harm to species or damages to wetlands, habitat, or natural resources occur or may occur, government entities or at times private parties may act to prevent or restrict oil and natural gas exploration activities or seek damages for any injury, whether resulting from drilling or construction or releases of oil, wastes, hazardous substances or other regulated materials, and in some cases, criminal penalties may result.
The DSL is one example of a species that, if listed as endangered or threatened under the ESA, could impact our operations and the operations of our customers. On May 20, 2024, the USFWS finalized a rule listing the DSL as an endangered species under the ESA, but did not concurrently propose to designate any critical habitat. However, in the final rule, USFWS determined that designating DSL critical habitat was prudent, but not determinable at the time of issuance, thus triggering a one-year review period for the future designation of critical habitat. Legal challenges have been filed relating to the listing, and we cannot predict what actions, if any, the Trump administration may take relating to the listing of the DSL as endangered. Our operations and the operations of our customers in any area that is later designated as DSL critical habitat may be limited, delayed or, in some circumstances, prohibited, and we and our customers could be required to comply with expensive mitigation measures intended to protect the DSL and its habitat. However, to mitigate the impact of some of these risks, we are a participant in a CCAA for DSL habitat in non-federal lands in certain counties of western Texas, which was approved by the USFWS in January 2021. We have been a contributor to and supporter of the CCAA since its inception and our participation in the CCAA and our other voluntary conservation measures for the benefit of the DSL, including setting aside as much as 17,000 acres for DSL habitat, helps reduce the risk of disruptions to our business and operations in the event DSL critical habitat is designated in the areas in which we operate.
Another species recently listed that could impact the operations of our customers is the lesser prairie-chicken. In November 2022, the USFWS formally listed two Distinct Population Segments (“DPSs”) of the lesser prairie-chicken under the ESA. The Southern DPS, the habitat of which includes portions of southeast New Mexico and western Texas, was listed as endangered, while the Northern DPS, the habitat of which spans from northern Texas through eastern Oklahoma and into southeastern Colorado and southwestern Nebraska, was listed as threatened. The listed territory of the Southern DPS could overlap with the operating areas of some of our customers, who in turn may be adversely affected by any restrictions which arise as a result of the endangerment determination. The identification or designation of further previously unprotected species as threatened or endangered in areas where we or our customers operate could cause us to incur increased costs arising from species protection measures or could result in limitations on our customers that result in reduced demand for our services, adversely affecting our results of operations. There is also increasing interest from a variety of stakeholders, including investors and institutional lenders, in nature-related matters beyond protected species, such as general biodiversity, which may similarly require us to incur costs or take other measures which may materially impact our business or operations.
Any restrictions on oil and natural gas development on federal lands have the potential to adversely impact our operations and the operations of our customers.
Many of our customers possess leases in New Mexico, which are granted by the federal government and administered by the BLM. Operations conducted by our customers on federal oil and natural gas leases must comply with numerous additional statutory and regulatory restrictions. These leases contain relatively standardized terms requiring compliance with detailed regulations. Under certain circumstances, the BLM may require operations on federal leases to be suspended or terminated. Any such suspension or termination of our customers’ leases could reduce demand for our products or services and adversely impact our results of operations.
The Biden Administration has taken several actions to curtail oil and natural gas activities on federal lands including a temporary pause on new oil and gas leasing, increases in royalty rates, and a reduction in the total acreage available through lease sales. On April 10, 2024, BLM finalized a rule to reduce the waste of natural gas from venting, flaring, and leaks during oil and gas production activities on Federal and Native American leases. On April 23, 2024, BLM finalized further reforms to the federal oil and gas leasing program, including increased bonding requirements and the codification of certain IRA provisions related to minimum bids, base rental rates, and royalty rates. While we cannot predict the ultimate impact of these actions or whether the Department of Interior and BLM will implement further reforms or operating restrictions, any revisions to the federal leasing or permitting process that make it more difficult for our customers to pursue operations on federal lands and operate economically may materially adversely impact our operations. The development and implementation of a Social Cost of GHGs (“SC-GHG”) (formerly known as the Social Cost of Carbon or “SCC”) metric may also impact future regulatory decision-making and our customers’ ability to obtain federal leases. On January 20, 2025, President Trump issued an Executive Order revoking the Biden administration’s re-establishment of a working group to develop a SC-GHG metric and directing the EPA to consider eliminating the SC-GHG analysis from any federal permitting decisions. Whether and how climate change impacts will be assessed in federal environmental reviews is uncertain, and the implementation of any SC-GHG metric in agency decision-making, and the result of any related litigation, could impact the character of new regulations on certain of the federal oil and gas leases of our customers, which in turn could impact our results of operations.
Additionally, oil and natural gas operations on federal lands, and related infrastructure projects may be impacted by recent litigation regarding NEPA’s implementing regulations. In 2020, the first Trump administration made a variety of substantive and procedural changes to NEPA, including limiting the scope of review to the direct effects of a proposed project on the environment. A new “Final Rule,” introduced by the Council on Environmental Quality (“CEQ”) under the Biden administration, which took effect in May 2022, reversed several changes introduced by the 2020 rule, including the scope limitations. The 2022 Final Rule requires NEPA reviews to incorporate consideration of indirect and cumulative impacts of the proposed project, including effects on climate change and GHGs, consistent with pre-2020 requirements. The new rule also allows agencies to create stricter NEPA rules as they see fit, but left in place the 2020 rule two-year time limit to complete environmental impact statements. More recently, in January 2023, the CEQ released updated guidance for agency consideration of GHG emissions and climate change impacts in environmental reviews, which includes, among other recommendations, best practices for analyzing and communicating climate change effects, though the current Trump administration may rescind this guidance. Additionally, in May 2024, the CEQ finalized revisions to NEPA that would expand requirements to analyze the cumulative effects of the project on climate change and consider any disproportionate impact of the project on communities with environmental justice concerns as well enhance certain project obligations for implementing environmental mitigation measures. However, on November 12, 2024, the D.C. Circuit Court concluded that CEQ has no authority to issue binding NEPA regulations, and a federal district court in North Dakota reached the same conclusion on February 3, 2025. The latter court vacated the Biden administration’s 2024 CEQ NEPA revisions as to those parties, though the 2024 rule currently remains in effect (and the Biden administration’s other NEPA revisions) as to non-parties. Further, on January 20, 2025, President Trump signed an Executive Order directing CEQ to proposed rescinding all of CEQ’s existing NEPA regulations and publish non-binding guidance on how agencies should implement NEPA in federal environmental reviews. To the extent changes to or the repeal of the NEPA implementing regulations restrict or limit the ability of our customers to pursue oil and gas operations and development projects in an economical manner or create uncertainty surrounding permitting for these projects, demand for our products and services may be impacted, which could adversely affect our results of operations.
Operations on federal lands also face litigation risks. From time to time, legal challenges have been filed relating to federal leasing decisions, such as for failure to adequately assess the impact of any increase of GHG emissions resulting from increased production on federal lands. Separately, there is a risk that authorizations required for existing operations may be delayed to the point that it causes a business disruption, and we cannot guarantee that further action will not be taken to curtail oil and natural gas development on federal land. For example, certain lawmakers have proposed to reduce or ban further leasing on federal lands or to adopt further restrictions on such leasing. To the extent such legislation is passed, it may adversely impact our customers’ operations, which could negatively impact our financial performance or results of operations.
We and our customers are subject to regulations that impose stringent occupational health, safety and labor standards on numerous aspects of our operations.
Multiple aspects of our and our customers’ operations are subject to occupational health and safety standards, including our mining operations, our trucking operations, and employee exposure to crystalline silica.
Our mining operations are subject to the Mine Safety and Health Act of 1977, as amended by the Mine Improvement and New Emergency Response Act of 2006 (as amended, the “Mine Act”), which imposes stringent health and safety standards on numerous aspects of mineral extraction and processing operations, including the training of personnel, operating procedures, operating equipment and other matters. Our operating locations are regularly inspected by MSHA for compliance with the Mine Act.
The DOT and various state agencies exercise broad powers over our trucking services, generally governing matters including authorization to engage in motor carrier service, equipment operation, safety, alcohol and drug testing, and financial reporting. In addition, our operations must comply with the Fair Labor Standards Act and comparable state laws, which govern such matters as wages and overtime, and which is administered by the DOL or applicable state agencies. We may be audited periodically by the DOT or the DOL or state agencies to ensure that we are in compliance with these safety, hours-of-service, wage and other rules and regulations, and failure to comply could result in material costs.
We are also subject to laws and regulations relating to human exposure to crystalline silica. Several federal and state regulatory authorities, including MSHA and OSHA, may continue to propose changes to their regulations regarding workplace exposure to crystalline silica, such as permissible exposure limits, required controls and personal protective equipment. Most recently, in April 2024, MSHA issued a final rule designed to reduce miner exposures to respirable crystalline silica, including by lowering the permissible exposure limit and establishing an action level for all miners. Our failure to comply with existing or new health and safety standards, or changes in such standards or the interpretation or enforcement thereof, could require us or our customers to modify operations or equipment, shut down some or all operating locations, impose significant restrictions on our ability to conduct operations, impose fines or otherwise have an adverse effect on our business, financial condition, employee relations and results of operations.
We and our customers are subject extensive permitting regulations and obligations. Our or our customers’ failure to obtain, maintain, renew, or comply with the terms of the permits we require to operate may adversely affect our results of operations.
In addition to the regulatory matters described above, we and our customers are subject to extensive permitting obligations and regulations. In order to obtain permits and renewals of permits in the future, we may be required to prepare and present data to governmental authorities pertaining to the potential adverse impact that any proposed excavation or production activities, individually or in the aggregate, may have on the environment. Certain approval procedures may require preparation of archaeological surveys, endangered species studies, and other studies to assess the environmental impact of new sites or the expansion of existing sites. Compliance with these regulatory requirements is expensive and significantly lengthens the time needed to develop a site. Finally, obtaining or renewing required permits is sometimes delayed or prevented due to community opposition and other factors beyond our control.
Our future success depends on, among other things, our ability to extract our proppant deposits profitably, and our customers’ ability to operate their businesses as they currently do. The denial or cancellation of a permit essential to our or our customers’ operations or the imposition of conditions with which it is not practicable or feasible to comply could have an adverse effect on our business. Significant opposition to a permit by neighboring property owners, members of the public or other third parties or a delay in the environmental review and permitting process also could impair or delay our or our customers’ operations. Additionally, new regulations or permitting requirements could require us to modify existing permits or obtain new permits, implement additional pollution control technology, curtail operations (including our ability to extract or the pace of extraction of mineral deposits), significantly increase our operating costs or impose additional operating restrictions among our customers (including impacts that may impact our customers’ ability to use our proppant, logistics or power solutions) that reduce demand for our products or services. Such permit proceedings are often subject to public notice and comment, and third parties, including nongovernmental environmental organizations, may challenge government actions related to permits required for our operations. A failure to timely obtain the permits required for the operation of our business may adversely affect our results of operations.
Risks Related to the Moser Acquisition
We may be unable to integrate the business Moser successfully or realize the anticipated benefits of the Moser Acquisition.
The acquisition of a standalone, independent business is complex, costly and time consuming, and we will be required to devote significant management attention and resources to integrating the business practices and operations of Moser into ours. Potential difficulties that we may encounter as part of the integration process include the following:
•the inability to successfully assume Moser’s business in a manner that permits us to achieve, on a timely basis, or at all, the enhanced revenue opportunities and cost savings and other benefits anticipated to result from the Moser Acquisition;
•complexities associated with managing the combined businesses, including difficulty addressing possible differences in operational philosophies and the challenge of integrating complex systems, technology, networks and other assets of each of the companies in a seamless manner that minimizes any adverse impact on customers, suppliers, employees and other constituencies;
•the inability to retain the service of key management and other key personnel;
•the assumption of contractual obligations with less favorable or more restrictive terms;
•the inability to successfully manage the entry into a new line of business;
•potential unknown liabilities and unforeseen increased expenses or delays associated with the Moser Acquisition.
•diversion of the attention, time and resources of management; and
•the disruption of, or the loss of momentum in, either company’s ongoing businesses or inconsistencies in standards, controls, procedures and policies.
Any of these issues could adversely affect each company’s ability to maintain relationships with customers, suppliers, employees and other constituencies or achieve the anticipated benefits of the Moser Acquisition or could reduce each company’s earnings or otherwise adversely affect our business and financial results following the Moser Acquisition.
Securities class action and derivative lawsuits may be brought against us in connection with the Moser Acquisition, which could result in substantial costs.
Securities class action lawsuits and derivative lawsuits are often brought against public companies that have entered into acquisition, merger or other business combination agreements. Even if such a lawsuit is without merit, defending against these claims can result in substantial costs and divert management time and resources. An adverse judgment could result in monetary damages, which could have a negative impact on our liquidity and financial condition.
The benefits attributable to the Moser Acquisition may vary from expectations.
We may fail to realize the anticipated benefits expected from the Moser Acquisition, which could adversely affect our business, financial condition and results of operations. The success of the Moser Acquisition will depend, in significant part, on our ability to successfully integrate the acquired business, grow our revenue and realize the anticipated strategic benefits from the acquisition. We believe that the acquisition will provide operational and financial scale, increasing free cash flow and enhancing our corporate rate of return. This growth and the anticipated benefits of the transaction may not be realized fully or at all, or may take longer to realize than expected. Actual operating, technological, strategic and revenue opportunities, if achieved at all, may be less significant than expected or may take longer to achieve than anticipated. If we are not able to achieve these objectives and realize the anticipated benefits and synergies expected from the Moser Acquisition within the anticipated timing or at all, our business, financial condition and results of operations may be adversely affected.
We face a variety of risks related to our entry into a new line of business following the completion of the Moser Acquisition.
Our entry into scaled distributed power solutions is expected to enhance our position as a mobile equipment and logistics solution provider to the oil and natural gas industry as well as diversify our business.
Although the distributed power business is subject to many of the risks applicable to our existing proppant and logistics business, entry into a new line of business may also subject us to new laws and regulations with which we are not familiar and may lead to increased litigation and regulatory risk. Further, our management team has not directly engaged in the distributed power solutions business before, and its lack of experience may result in delays or further complications to the new business. If we are unable to successfully implement the acquired business of Moser, our revenue and profitability may not grow as we expect, our competitiveness may be materially and adversely affected, and our reputation and business may be harmed.
The market price for our Common Stock following the closing of the Moser Acquisition may be affected by factors different from those that historically have affected or currently affect our Common Stock.
Our results of operations following the completion of the Moser Acquisition may be affected by some factors that are different from those that have affected our results of operations in the past. Accordingly, the market price and performance of our Common Stock is likely to be different from the performance of our Common Stock in the absence of the Moser Acquisition. In addition, general fluctuations in stock markets could have a material adverse effect on the market for, or liquidity of, our Common Stock, regardless of our actual operating performance.
Our newly acquired power solutions segment is dependent on its relationships with key suppliers to obtain equipment for its business.
Our power generation business is dependent on a sole key supplier for access to the unique equipment used in the provision of our power solutions offering. If we fail to maintain an adequate relationship with this supplier, if we fail to receive equipment from this supplier in a timely manner or, if we are required to find an alternative supplier of equipment, then our competitive position may be harmed and our operations, financial conditions and/or cash flows may be negatively impacted.
In addition, the prices of certain equipment may continue to experience inflationary pressures, which may be exacerbated by our reliance on a single key supplier, that could further increase such costs. We may not be able to pass on these costs to our customers, which could have a material adverse impact on our results of operations, financial condition or cash flows.
Unavailability of, and lengthy delays in obtaining, the necessary equipment may result from a number of factors affecting our supplier including capacity constraints, labor shortages or disputes, supplier product quality issues and our supplier’s allocations to other purchasers. These risks can be magnified in a weak economic environment or following increases in demand arising from an economic downturn, but are also generally present due to the nature of our business and its dependence on highly-specialized equipment. Such disruptions could result in our inability to effectively meet the needs of our customers and could result in a material adverse effect on our operations, financial condition or cash flows.
Many of our power systems involve long sales cycles.
The sales cycle for our power systems, from initial contact with potential customers to the commencement of field delivery, may be lengthy. Customers generally consider a wide range of solutions before making a decision to rent or to purchase power systems. Before a customer commits to rent or purchase power systems, they often require a significant technical review, assessment of competitive offerings and approval at a number of management levels within their organization. During the time our customers are evaluating our power solutions offerings, we may incur substantial sales and marketing, engineering, and research and development expenses.
Our customers may not continue to outsource their power system needs.
Our customers can evaluate a wide range of applications and equipment to address standby and/or prime power generation needs. As a result of the significant resources and expertise required to develop these systems, certain of these customers have historically chosen to outsource the provision of power generation to Moser. To a significant extent, we will depend on customers continuing to outsource their power generation needs. Additionally, we may be unable to successfully maintain business relationships with customers due to difficulties integrating the acquired business or inability to provide customers with the same level of service following the Moser Acquisition. Customers may not continue to outsource as much or any of their power generation needs in the future or may seek alternative solutions.
We depend on a few customers for a significant portion of our power solutions segment revenues, and the loss of one or more significant customers could affect our ability to maintain the revenues of our power solutions segment.
In 2024, Moser derived more than 10% of its total revenues from a single customer. If, following our acquisition of Moser, we were to lose this or any of our power solutions segment’s significant customers without finding replacement customers, or if these customers were to change the terms, including pricing terms, on which they buy power solutions from us, it could have a material adverse effect on our business, financial condition, and results of operations.
Distributed power solutions in some applications compete with access to the grid.
Distributed power solutions are an alternative for customers to consider when grid access is unavailable, costly or delayed. Our distributed power service offering could be affected in the event that large-scale utility projects are completed and the associated transmission and distribution networks are established. In this case, customers may only use our service offering as bridge power until line power is received or backup power.
General Risk Factors
Pandemics, epidemics or disease outbreaks, such as the COVID-19 pandemic, may disrupt our business and operations, which could materially affect our financial condition, results of operations and forward-looking expectations.
Public health crises, pandemics and epidemics, such as the COVID-19 pandemic, may adversely impact our operations, the operations of our customers and the global economy, including the worldwide demand for oil and natural gas and the level of demand for our products and services. Fear of such events has previously altered the level of capital spending by oil and natural gas companies for E&P activities and has adversely affected global economies and financial markets, resulting in economic downturns that have affected demand for our products and services. For instance, the outbreak of COVID-19 caused governmental authorities to impose mandatory closures, seek voluntary closures and impose restrictions on, or advisories with respect to, travel, business operations and public gatherings or interactions. The impact of future health crises, pandemics and epidemics and responsive measures could adversely affect our business in a number of ways, any of which could have a material adverse effect on us.
Our business and operations could suffer in the event of cybersecurity breaches, information and operational technology system failures, network disruptions or other cyber-security risks. A cyber incident could occur and result in information theft, data corruption, operational disruption and/or financial loss.
We rely on the efficient and uninterrupted operation of both our Company’s and third-party information and operational technology systems and infrastructure to process transactions, summarize our operating results, deliver our products, perform many of our services and manage our business and operations. In the ordinary course of our business, we collect and store sensitive data, including our proprietary business information and that of our customers, vendors, suppliers and other business partners, and personally identifiable information of our employees. The secure collection, processing, maintenance, storage, and transmission of information is critical to our operations. We have implemented procedural safeguards and stringent access controls designed to protect our information and operational technology systems and data. Furthermore, we have sophisticated tools and third-party vendors monitoring our networks, email, cloud, and operational technology 24/7 against emerging cyber threats and vulnerabilities. However, our information and operational technology systems and networks, and those of our customers, vendors, suppliers and other business partners, are subject to damage or interruption from power outages, computer and telecommunications failures, computer viruses, cyberattack or other security breaches, catastrophic events, such as fires, floods, earthquakes, tornadoes, hurricanes, acts of war or terrorism, usage errors by our employees and other events unforeseen or generally beyond our control. If our information or operational technology systems are damaged or cease to function properly, we may need to make a significant investment to fix or replace them, and we may suffer loss of critical data, damage to our reputation and financial condition and interruptions or delays in our operations.
We have been the target of cyberattacks, and while to date none of these incidents have had a material impact on us, we expect to continue to be targeted in the future. Our risk and exposure to these matters remains heightened because of, among other things, the evolving nature of these threats, the current global economic and political environment, the outsourcing of some of our business operations, the ongoing shortage of qualified cybersecurity professionals and the interconnectivity and interdependence of third parties to our systems.
As cyber incidents continue to evolve, we will likely be required to expend additional resources to continue to modify or enhance our protective measures or to investigate and remediate any vulnerability to cyber incidents. In addition, any technology required by any mandate by authorities requiring the transition to remote work increases our vulnerability to cybersecurity threats, including threats to gain unauthorized access to sensitive information or to render data or systems unusable. Any material disruption in our information or operational technology systems or systems that affect our business operations, delays or difficulties in implementing or integrating new systems or enhancing current systems, or any vulnerabilities rendering data or systems unusable following any mandated remote work situations, could have an adverse effect on our business and results of operations.
We monitor our information and operational technology systems in an effort to detect cyberattacks, security breaches and unauthorized access. Our preventative and detective measures include penetration tests on externally facing systems, threat assessments, cybersecurity audits and expert consultations. However, the measures we employ to detect and prevent cyberattacks may be insufficient to protect us from an incident or to minimize the magnitude and effects of such incident for a significant period of time. Despite our security measures, the occurrence of a cyberattack, breach, unauthorized access, misuse, computer virus or other cybersecurity event could jeopardize our systems, interrupt our operations or result in the unauthorized disclosure, gathering, monitoring, misuse, corruption, loss or destruction of confidential and other information that belongs to us, our customers, our counterparties or third-party service providers that is processed and stored in, and transmitted through, our information technology systems and networks. Any such event could result in significant losses, loss of customers and business opportunities, breaches of our contractual obligations, reputational damage, litigation, regulatory fines, penalties or intervention, reimbursement or other compensatory costs, or otherwise adversely affect our business, financial condition or results of operations. Moreover, the constantly evolving global regulatory landscape surrounding data privacy and cybersecurity poses compliance challenges, and complying with such data protection obligations may be expensive. Any failure, whether real or perceived, by us to comply with applicable data privacy and protection obligations could result in significant losses, loss of customers and business opportunities, breaches of our contractual obligations, reputational damage, litigation, regulatory fines, penalties or intervention, reimbursement or other compensatory costs, or otherwise adversely affect our business, financial condition or results of operations.
We may be unable to generate sufficient cash to service all of our indebtedness and financial commitments.
Our ability to make scheduled payments on or to refinance our indebtedness and financial commitments depends on our financial condition and operating performance, which are subject to prevailing economic and competitive conditions including financial, business and other factors beyond our control. We may be unable to generate sufficient cash flow to permit us to pay the principal, premium, if any, and interest on our indebtedness.
If our cash flows and capital resources are insufficient to fund debt and other obligations, we may be forced to reduce or delay capital expenditures, sell assets, seek additional capital or restructure our indebtedness. Our ability to restructure or refinance indebtedness will depend on the condition of the capital markets and our financial condition at such time. Any refinancing of indebtedness could be at higher interest rates and may require us to comply with more onerous covenants, which could further restrict our operations. The terms of existing or future debt instruments may restrict us from adopting some of these alternatives. In addition, any failure to service our debt would likely result in a reduction of our future credit rating, if any, which could harm our ability to incur additional indebtedness. If we face substantial liquidity problems, we might be required to sell assets to meet debt and other obligations. Our debt restricts our ability to dispose of assets and dictates our use of the proceeds from such disposition. We may not be able to consummate dispositions, and the proceeds of any such disposition may be inadequate to meet our obligations.
We may be unable to access adequate funding as a result of a decrease in the borrowing base under the 2023 ABL Credit Facility due to an unwillingness or inability on the part of lending counterparties to meet their funding obligations and the inability of other lenders to provide additional funding to cover a defaulting lender’s portion. As a result, we may be unable to execute our development plan, make acquisitions or otherwise conduct operations, which would have an adverse effect on our financial condition and results of operations.
Changes to applicable tax laws and regulations, exposure to additional income tax liabilities, changes in our effective tax rates or an assessment of taxes resulting from an examination of our income or other tax returns could adversely affect our results of operations and financial condition, including our ability to repay our debt.
We are subject to various complex and evolving U.S. federal, state and local taxes. U.S. federal, state and local tax laws, policies, statutes, rules, regulations or ordinances could be interpreted, changed, modified or applied adversely to us, in each case, possibly with retroactive effect, and may have an adverse effect on our results of operations and financial condition, including our ability to repay our debt. The passage of any tax legislation or other changes in U.S. federal income tax laws could adversely affect our results of operations and financial condition.
Changes in our effective tax rates or tax liabilities could also adversely affect our results of operations and financial condition. Our future effective tax rates could be subject to volatility or adversely affected by a number of factors, including:
•changes in the valuation of our deferred tax assets and liabilities;
•expected timing and amount of the release of any tax valuation allowances;
•expansion into future activities in new jurisdictions;
•the availability of tax deductions, credits, exemptions, refunds and other benefits to reduce tax liabilities; and
•tax effects of share-based compensation.
In addition, an adverse outcome arising from an examination of our income or other tax returns could result in higher tax exposure, penalties, interest or other liabilities that could have an adverse effect on our results of operations and financial condition.
We are subject to counterparty credit risk. Nonpayment or nonperformance by our customers, suppliers or vendors could have an adverse effect on our business, liquidity, financial condition and results of operations.
We are subject to the risk of loss resulting from nonpayment or nonperformance by our customers, suppliers and vendors. Our credit procedures and policies may not be adequate to fully eliminate customer credit risk. If we fail to adequately assess the creditworthiness of existing or future customers or unanticipated deterioration in their creditworthiness, any resulting increase in nonpayment or nonperformance by them and our inability to re-market or otherwise use the production could have an adverse effect on our business, results of operations and financial condition. A decline in oil and natural gas prices could negatively impact the financial condition of our customers and sustained lower prices could impact their ability to meet their financial obligations to us. Further, our contract counterparties may not perform or adhere to our existing or future contractual arrangements. To the extent one or more of our contract counterparties is in financial distress or commences bankruptcy proceedings, contracts with these counterparties may be subject to renegotiation or rejection under applicable provisions of the United States Bankruptcy Code. Any material nonpayment or nonperformance by our contract counterparties due to inability or unwillingness to perform or adhere to contractual arrangements could adversely affect our business and results of operations. If our customers delay or fail to pay us a significant amount of our outstanding receivables, it could have an adverse effect on our business, liquidity, financial condition and results of operations.
If we fail to comply with the restrictions and covenants in our debt agreements, there could be an event of default under the terms of such agreements, which could result in an acceleration of payment.
A breach of any representation, warranty or covenant in any of our debt agreements would result in a default under the applicable agreement after any applicable grace periods. A default could result in acceleration of the indebtedness, which would have an adverse effect on us. If an acceleration occurred, it would likely accelerate all of our indebtedness through cross-default provisions and we would likely be unable to make all of the required payments to refinance such indebtedness. Even if new financing were available at that time, it may not be on terms that are acceptable to us.
Our stock prices and trading volumes could be volatile, and you may not be able to resell shares of your Common Stock when desired, at or above the price you paid, or at all.
The stock market has experienced and continues to experience extreme price and volume fluctuations that have often been unrelated or disproportionate to the operating performance of the underlying businesses. Recently, market volatility has been high due to the ongoing conflicts between Ukraine and Russia, Israel and Hamas and other instability in the Middle East, including from the Houthi rebels in Yemen, interest rate increases, rising inflation, instability of the banking sector, a softening U.S. economy and other factors. Broad market fluctuations may adversely affect the market price of the Common Stock, regardless of our actual operating performance. In addition to the other risks described in this section, the market price of our Common Stock may fluctuate significantly in response to a number of factors, many of which we cannot control, including:
•our operating and financial performance;
•quarterly variations in the rate of growth of our financial indicator;
•public reaction to our press releases, other public announcements, and filings with the SEC;
•announcements by others in or affecting our industry or our customers;
•strategic actions by our competitors;
•our failure to meet revenue or earnings estimates by research analysts or other investors;
•changes in revenue or earnings estimates, or changes in recommendations or withdrawal of research coverage, by equity research analysts;
•inaccurate or unfavorable research or ratings published by industry analysts about our business, or a cessation of coverage of our Company by industry analysts;
•speculation in the press or investment community;
•the failure of research analysts to cover our Common Stock;
•sales of Common Stock by the Company, the Legacy Owners or other stockholders, or the perception that such sales may occur;
•changes in accounting principles, policies, guidance, interpretations or standards;
•additions or departures of key management personnel;
•actions by our stockholders;
•general market conditions, including fluctuations in commodity prices, sand-based proppant or industrial and recreational sand-based products;
•our acquisition of, investment in or disposition of other businesses;
•domestic and international economic, legal and regulatory factors unrelated to our performance; and
•the realization of any of the risks described under this “Risk Factors” section.
Volatility in the market price or trading volume of the Common Stock may make it difficult or impossible for you to sell your Common Stock at or above the price at which you purchased the stock. As a result, you may suffer a loss on your investment. Securities class action litigation has often been instituted against companies following periods of volatility in the overall market and in the market price of a company’s securities. This litigation, if instituted against us, could result in substantial costs, reduce our profits, divert our management’s attention and resources and harm our business.
If securities or industry analysts do not publish research or reports or publish unfavorable research about us, the price and trading volume of our Common Stock could decline.
The trading market for our Common Stock depends in part on the research and reports that securities or industry analysts publish about us and our business. If one or more of the analysts who covers us downgrades our securities, the price of our securities would likely decline. If one or more of these analysts ceases to cover us or fails to publish regular reports on us, interest in the purchase of our securities could decrease, which could cause the price of our Common Stock and other securities and their trading volume to decline.
None.
Item 1C. Cybersecurity.
Risk Management and Strategy
We recognize the critical importance of developing, implementing, and maintaining proactive cybersecurity measures to safeguard our information and operational systems and protect the confidentiality, integrity, and availability of our data. To that end, we engage in the following cybersecurity risk management principles:
Material Risks & Integrated Overall Risk Management
We have strategically integrated cybersecurity risk management into our broader risk management framework to promote a Company-wide culture of cybersecurity risk management. This integration ensures that cybersecurity considerations are an integral part of our decision-making processes at every level. Additionally, our proactive risk management approach is formed by a variety of established cybersecurity frameworks. The security function housed within our Technology department continuously evaluates and addresses cybersecurity risks in alignment with our business objectives and operational needs and in cooperation with our broader risk management team.
Proactive Risk Mitigation & Vulnerability Management
We take a proactive approach to cybersecurity, evaluating the latest industry threats against our organization to ensure protection. This evaluation directly informs our security enhancements. For example, identified vulnerabilities or threat vectors prompt updates to firewalls, intrusion detection systems, email filtering and security training etc. We also perform real-time analyses, automate responses to suspicious activity, and maintain robust alerts. The results of these scans, along with threat intelligence, are used to prioritize vulnerability remediations and enhance long-term cyber security hardening efforts.
Third-Party Risk Management Advisors
Recognizing the complexity and the evolving nature of cybersecurity threats, we engage with a range of external experts, including cybersecurity assessors, consultants, and auditors in evaluating and testing our cybersecurity program and practices. This ecosystem enables us to leverage specialized knowledge and insights, ensuring our cybersecurity program and practices remain attuned to our Company’s particular needs and vulnerabilities. Our collaboration with these third-parties includes annual penetration tests on externally facing systems, annual external and internal risk assessments and subject matter expertise consultation on risk remediation and security enhancements.
Vendor Risk Oversight
Given the risks associated with using third-party service providers, we have developed processes to oversee and manage these risks. We aim to start the assessment right from the vendor onboarding stage, by conducting security and background assessments of vendors prior to their engagement, and we endeavor to monitor ongoing relationships to ensure compliance with our cybersecurity standards. These processes are designed to mitigate risks related to data breaches or other security incidents originating from third parties.
Risks from Cybersecurity Threats
As of the date of this Annual Report, though we and the third parties with whom we do business have experienced certain cybersecurity incidents, we are not aware of cybersecurity threats that have materially affected or are reasonably likely to materially affect the Company, including our business, financial condition or results of operations. However, we recognize that cybersecurity threats are continually evolving, and there remains a risk that a cybersecurity incident could potentially negatively impact us. Despite the implementation of our cybersecurity processes, we cannot guarantee that a significant cybersecurity attack will not occur. A successful attack on our information or operational technology systems could have significant consequences to the business, including the interruption of key services that our customers depend on. While we devote resources to our security measures to protect our operations and information, these measures cannot provide absolute security.
Governance
The Board is aware of the critical nature of managing risks associated with cybersecurity threats given the significance of these threats to our operational integrity and stakeholder confidence. As such, the Board engages with our management team, as necessary, for updates on our cybersecurity risk program and progress on remediation efforts.
Board Oversight
The Board is central to the Company's oversight of cybersecurity risks and bears the primary responsibility for this domain. The Board is composed of members with depth of experience in enterprise risk management, compliance, corporate governance, technology, finance, and the unique characteristics and vulnerabilities of the oil and gas industry, equipping them to oversee cybersecurity risks effectively.
Management’s Risk Management Role
Our VP of Technology plays a pivotal role in informing the Board on cybersecurity risks. As necessary, he provides briefings to the Board encompassing a broad range of topics, including:
•the current cybersecurity landscape and emerging threats;
•the status of ongoing cybersecurity initiatives and progress on remediation efforts; and
•compliance with regulatory requirements and industry standards.
Cybersecurity Risk Management Personnel
Our VP of Technology, Shaam Farooq, has primary responsibility for assessing, monitoring, and managing our cybersecurity risks. Mr. Farooq has over 25 years of experience in global technology leadership, having served as an enterprise CISO across multiple industries. He actively participates in the oil and gas cybersecurity community, ensuring our security strategy remains responsive to current industry threats and aligned with best practices. Shaam continues to refresh his Certified Information Systems Security Professional and Certified Information Security Manager trainings as necessary.
Cybersecurity Incident Monitoring
The VP of Technology strives to be continually informed about the latest developments in cybersecurity, including potential threats and innovative risk management techniques. This ongoing knowledge acquisition is crucial for the effective prevention, detection, mitigation, and remediation of cybersecurity incidents. The VP of Technology has implemented industry tools and oversees the processes for the regular monitoring of our information and operational technology systems. This includes the deployment of advanced security measures and regular system audits to identify potential vulnerabilities. In the event of a cybersecurity incident, the VP of Technology is equipped with an incident response plan (IRP). This comprehensive plan encompasses immediate actions like identification, containment, and eradication, mid-term objectives such as recovery, and long-term goals including forensic analysis and lessons learned. It also lists response parties as well as chain of command and reporting. We regularly test our incident preparedness through at least one annual drill and tabletop exercise. These activities simulate real-world attacks, allowing us to evaluate and refine our incident response plan. Drills focus on specific technical responses, while tabletop exercises involve key stakeholders walking through the response process to identify potential gaps. The insights gained from these exercises ensure our team is prepared to effectively respond to and recover from security incidents.
Reporting to Board
The VP of Technology regularly informs the Chief Executive Officer regarding cybersecurity risks and incidents. This ensures that the highest levels of management are kept abreast of the cybersecurity posture and potential risks facing the Company. In addition to briefings on an as-needed basis, any significant cybersecurity matters and strategic risk management decisions are escalated to the Audit Committee, ensuring that they have comprehensive oversight and can provide guidance on critical cybersecurity issues.
Item 2. Properties.
We currently operate our Kermit facilities, Monahans facility, and OnCore distributed mining network in West Texas. For the years ended December 31, 2023 and 2022, our facilities produced, in aggregate, approximately 11.0 million tons and 10.2 million tons of proppant, respectively. For the year ended December 31, 2024, we produced, in aggregate, approximately 19.9 million tons of proppant, inclusive of the production attributable to the assets acquired in the Hi-Crush Transaction. The following map shows the location of these facilities:
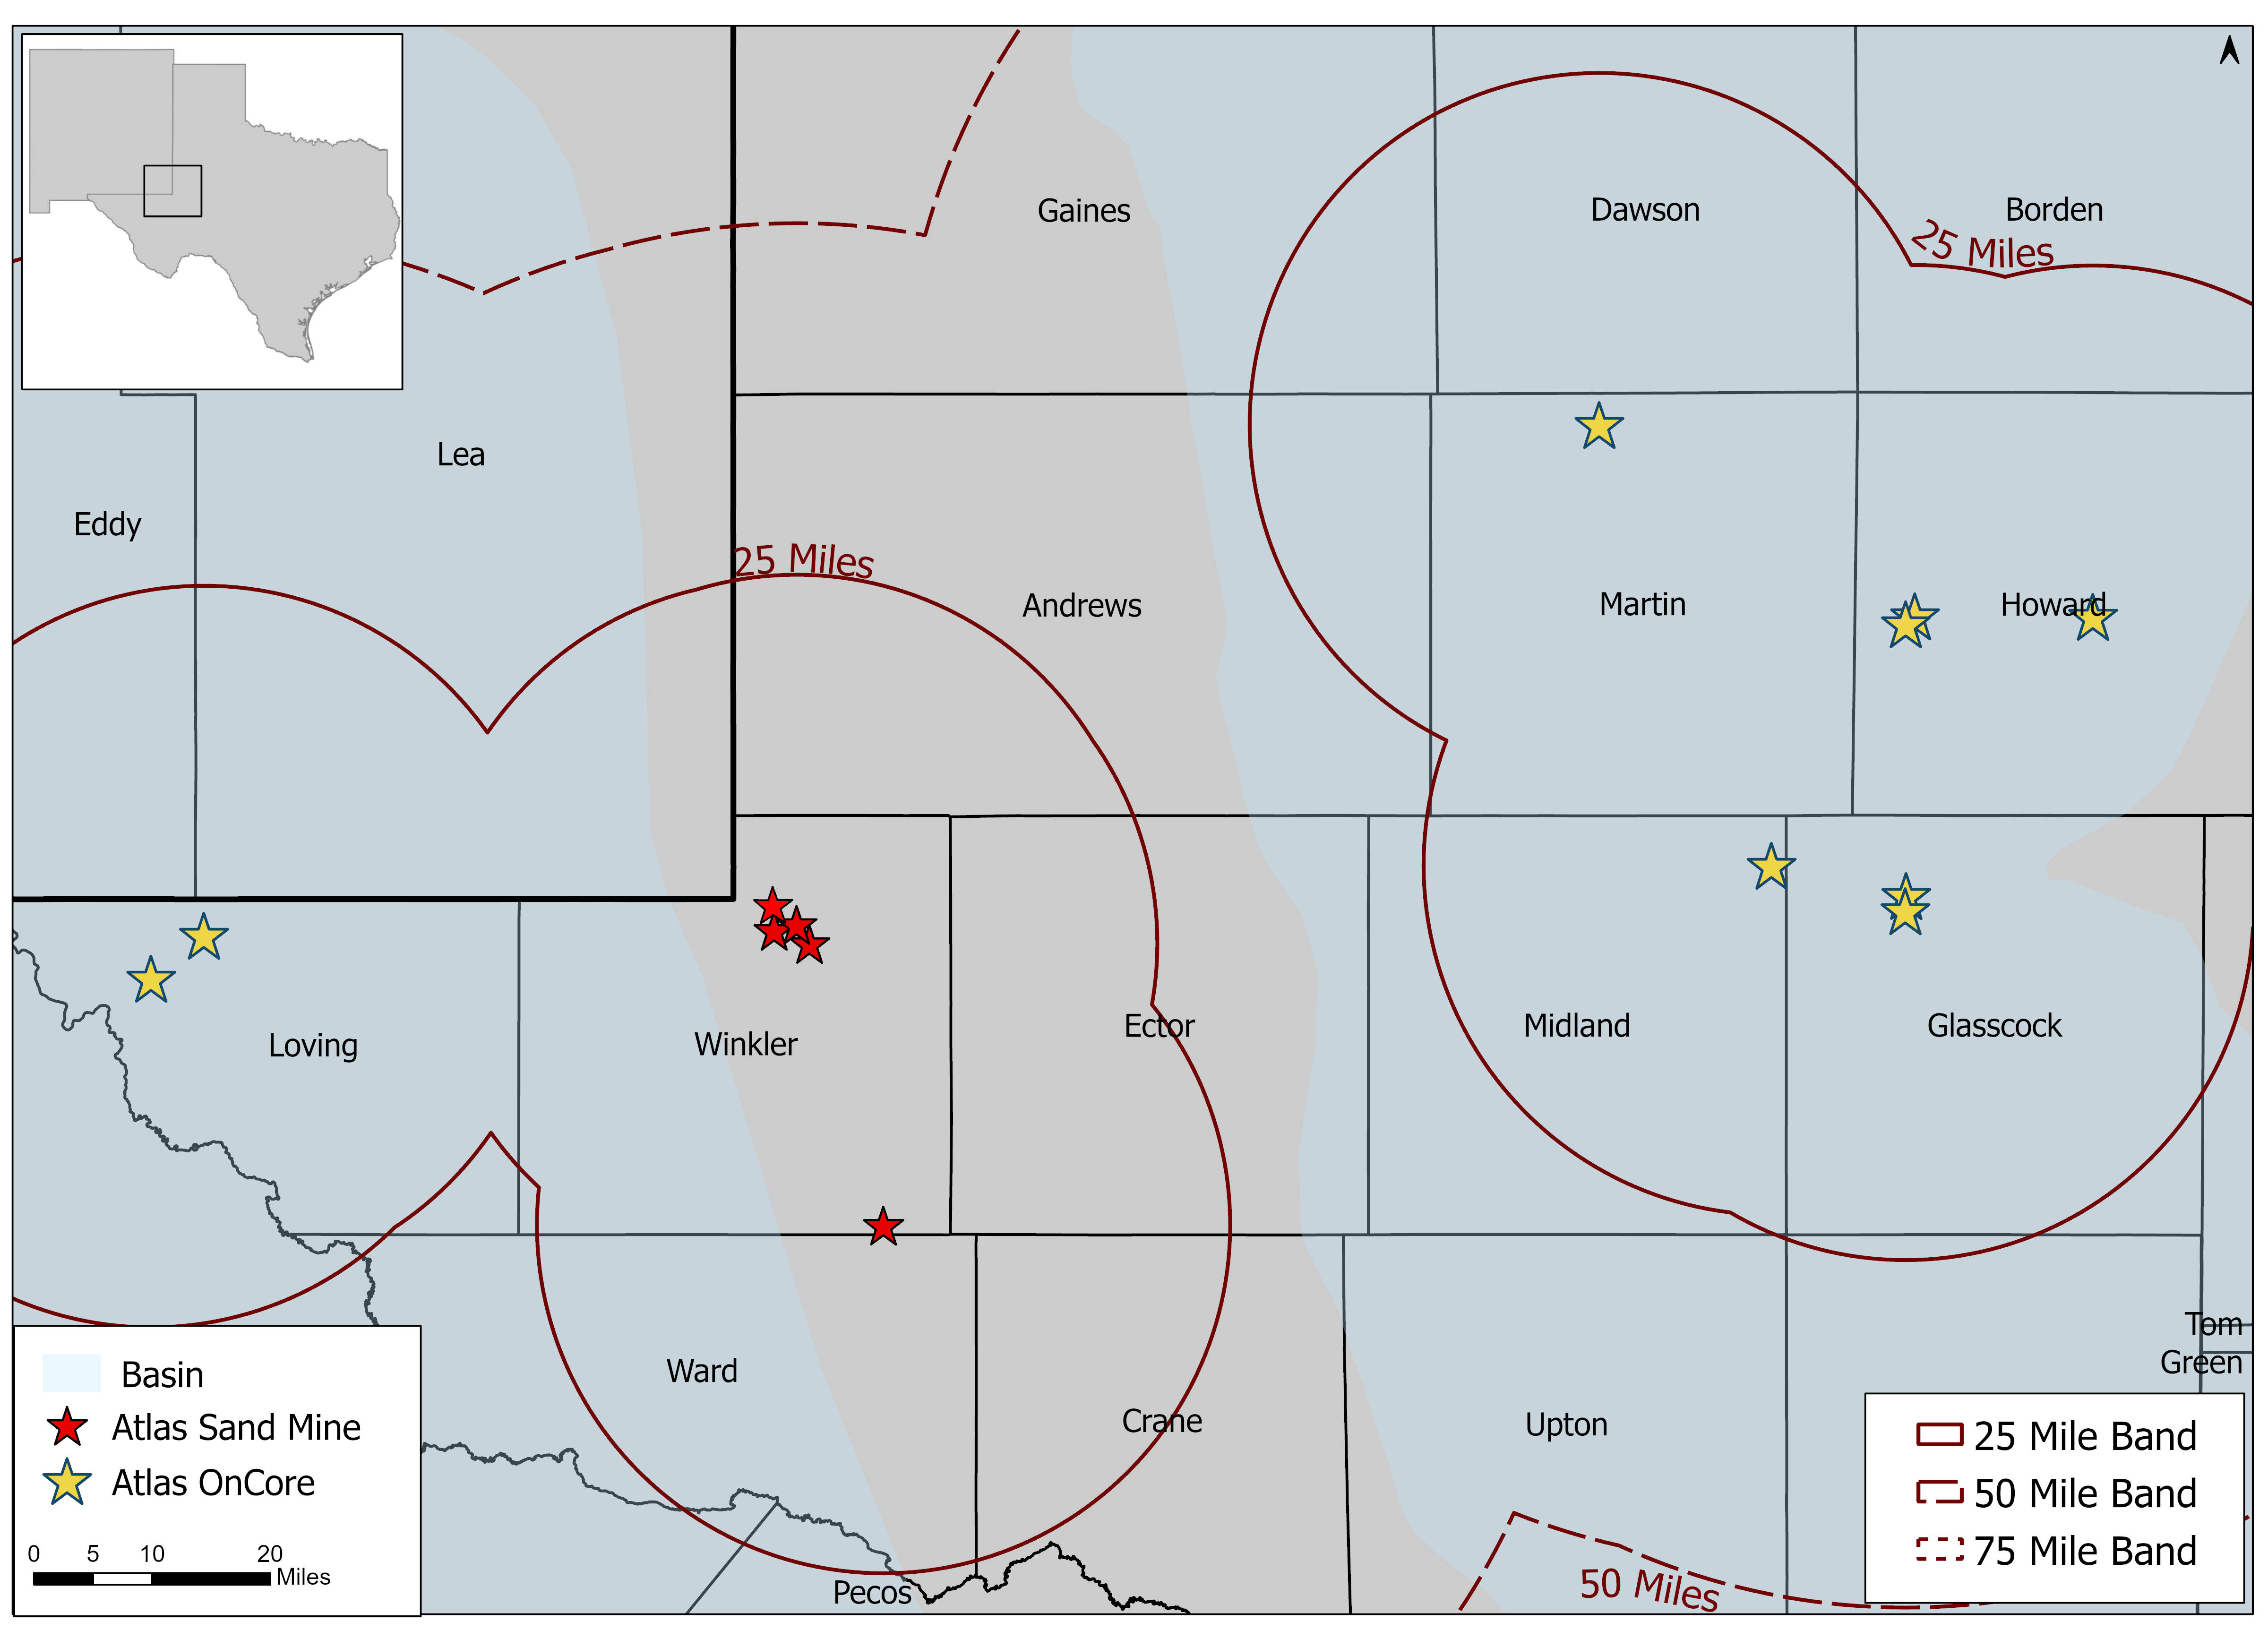
Kermit, Texas
K1/K2 Facilities
The Kermit property in the map below includes K1/K2. This map can be found in Section 1.3 of our 2023 TRS (defined below) prepared by JT Boyd, which is included as Exhibit 96.1 to this Annual Report.
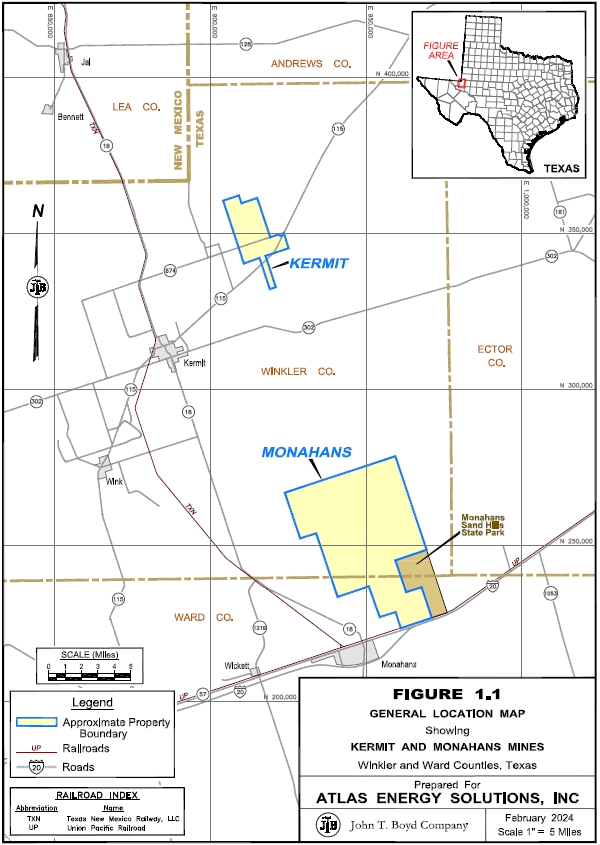
Our K1/K2 facilities are located on 5,826 gross acres of land (of which 5,341 net acres are controlled by us either through lease or fee ownership) in Winkler County, Texas, with onsite processing and truck loading facilities. We commenced construction of our first mine in October of 2017, and commenced operations in June 2018. We commenced construction of our second mine in July of 2022, which we completed in December 2023. Our K1/K2 facilities have a net book value of $405.3 million as of December 31, 2024. Geographically, our facilities are located at approximately 31° 58’ 6.29” N latitude and 103° 0’ 39.46” W longitude, are situated approximately seven miles northeast of Kermit, Texas, and are accessible via Texas State Highway 18. The Midland International Air and Space Port is located approximately 45 miles southeast of the facilities.
The K1/K2 facilities have 294.5 million tons of associated proven reserves as of December 31, 2024. The sand deposits generally range from 60 to over 100 feet thick and consist of 40/70-mesh and 100-mesh sand, with an anticipated production mix of approximately 52% 40/70-mesh and approximately 48% 100-mesh. The crush strength of the sand mined at these facilities is between 7,000 to 8,000 pounds-per-square-inch (“PSI”) for 40/70-mesh and between 10,000 to 11,000 PSI for 100-mesh.
We lease a portion of the mineral reserves and resources associated with our K1/K2 facilities. As of December 31, 2024, we owned approximately 43% and 2% of our mineral reserves and resources, respectively, and leased approximately 57% and 98% of our mineral reserves and resources, respectively, from third-party landowners at our K1/K2 facilities.
In December 2017, we entered into a royalty agreement with Sealy Smith. The royalty agreement associated with the K1/K2 facilities terminated on the date of our IPO, pursuant to the terms of the agreement.
K115/874 Facilities
The Kermit property in the map below includes K115/874. This map can be found in Section 1.2 of our 2023 TRS (defined below) prepared by JT Boyd, which is included as Exhibit 96.2 to this Annual Report.
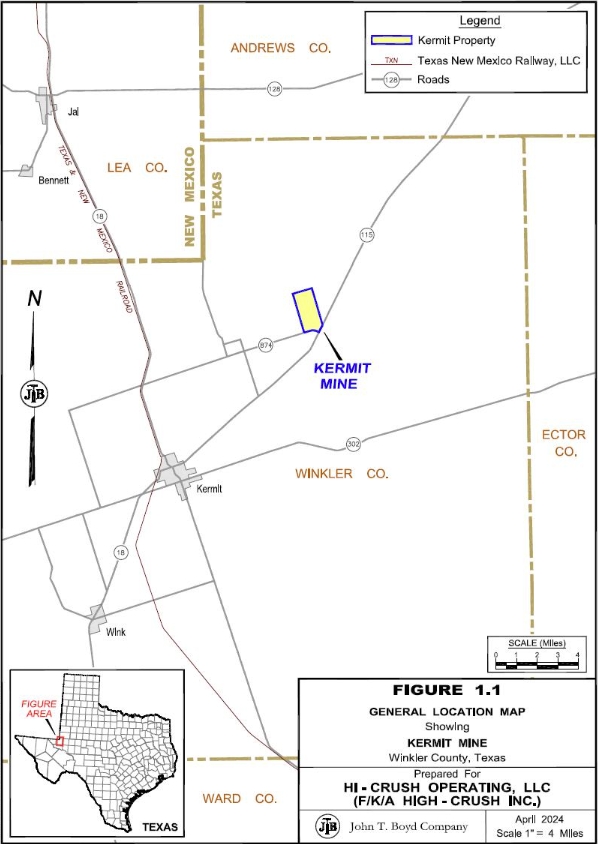
During 2024, we acquired the K115/874 facilities with the Hi-Crush Transaction. Our K115/874 facilities are located on approximately 1,226 gross acres of surface and subsurface (i.e., mineral) rights, all of which are owned by the Company. Our K115/874 facilities have a net book value of $162.6 million as of December 31, 2024. Geographically, these facilities are located at approximately 31° 57' 55" N latitude and 102° 58' 15" W longitude and are accessible via Texas State Highway 115. Several regional airports are located within an hour’s drive from the mine, and the Midland International Airport is approximately an hour and a half away by road.
The K115/874 facilities were initially explored and developed by Permian Basin Sand Company, LLC in 2016 and Hi-Crush purchased this property in early 2017. Site work and construction for the first processing facility began in February 2017 and was commissioned in July 2017. Construction of the second processing facility began in May 2018 and was fully commissioned and producing finished frac sand by January 2019.
The K115/874 facilities have 52.5 million tons of associated proven reserves as of December 31, 2024. The sand deposits generally range from 10 to over 90 feet thick, averaging approximately 60 feet across the property and consist of 100-mesh sand. The crush strength of the sand mined at these facilities is 7,000 PSI for 40/70-mesh and 12,000 PSI for 100-mesh.
Monahans, Texas
This map can be found in Section 1.3 of our 2023 TRS (defined below) prepared by JT Boyd, which is included as Exhibit 96.1 to this Annual Report.
Our Monahans facility is located on approximately 32,224 gross acres of land in Ward County, Texas, with onsite processing and truck loading facilities. We commenced construction of our Monahans mine in February of 2018 and commenced operations in October 2018. Our Monahans facility has a net book value of $217.9 million as of December 31, 2024. Geographically, our Monahans facility is located at approximately 31° 39’ 32.53” N latitude and 102° 52’ 55.46” W longitude, is situated approximately three miles northeast of Monahans, Texas, and is accessible via Texas State Highway 115 and Interstate 20. The Midland International Air and Space Port is located approximated 40 miles east of the facility.
The Monahans facility has 143.0 million tons of associated proven reserves as of December 31, 2024. The sand deposits generally range from 60 to over 100 feet thick and consist of 40/70-mesh and 100-mesh sand, with an anticipated production mix of approximately 62% 40/70-mesh and approximately 38% 100-mesh. The crush strength of the sand mined at the facility is 7,000 to 8,000 PSI for 40/70-mesh and between 10,000 to 11,000 PSI for 100-mesh.
As of December 31, 2024, we lease all of the mineral reserves and resources associated with our Monahans facilities.
The rights and access to the mineral reserves associated with our Monahans operations are secured under a lease agreement (the “Monahans Lease”) with Sealy Smith. Under the Monahans Lease, we are committed to pay royalties on product sold from that facility and are required to pay a minimum royalty of $1.0 million for any lease year following our IPO.
OnCore Distributed Mining Network
This map can be found in Section 1.2 of our 2024 TRS (defined below) prepared by JT Boyd, which is included as Exhibit 96.3 to this Annual Report.
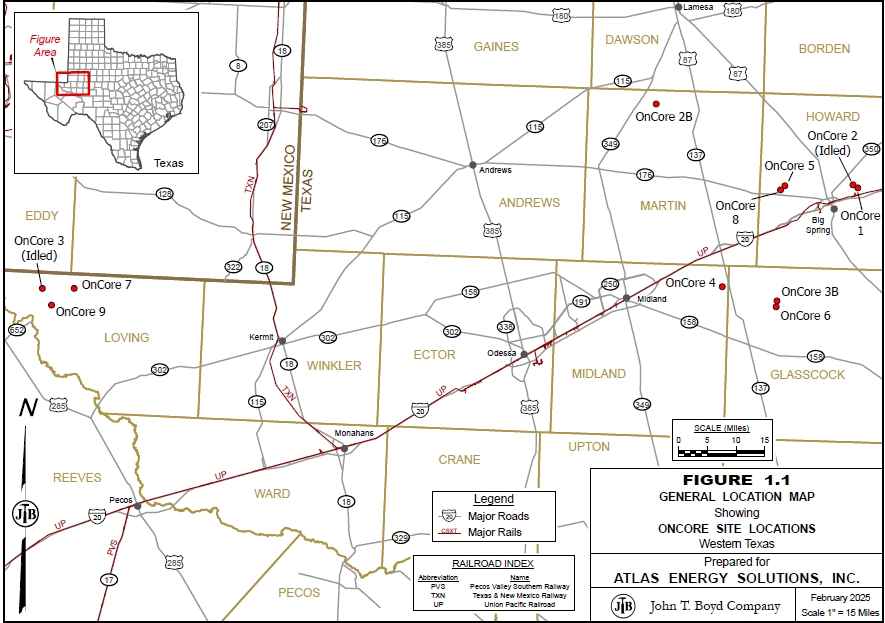
During 2024, we acquired the OnCore distributed mining network with the Hi-Crush Transaction. The OnCore sites comprise approximately 6,579 acres, including 1,172.4 acres owned in fee and 5,406.6 leased acres. The OnCore sites are primarily operated under lease agreements held between the Company and various private landowners. These agreements provide the Company the right to mine, process, and dispose (i.e., sell) of frac sand from the properties. The OnCore distributed mining network has a net book value of $112.1 million as of December 31, 2024. The OnCore Plants are located in West Texas. Most are clustered around the City of Big Spring, Texas, about 40 miles east of the Midland-Odessa metropolitan area. The OnCore 7 and 9 sites are located in the opposite direction approximately 90 miles west of Midland-Odessa.
The locations of operating and idled OnCore plants are shown in the table below. This table can be found in Section 3.1 of our 2024 TRS (defined below) prepared by JT Boyd, which is included as Exhibit 96.3 to this Annual Report.
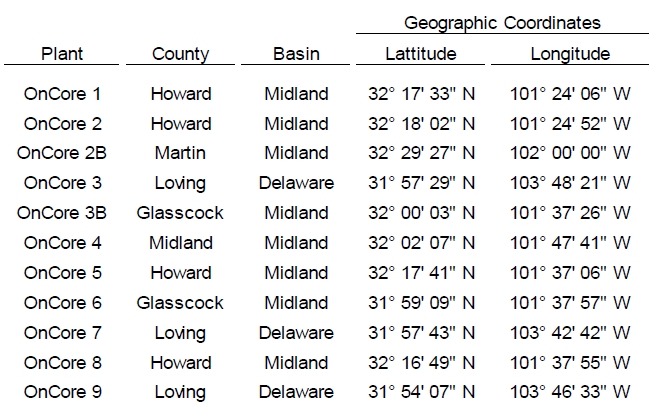
Accessibility to the western sites is via Texas state highway TX-302 or U.S. Route 285; while primary access to the eastern sites is via Interstate 20, state highways TX-137, TX-176, or TX-349. Several regional airports are located throughout the area, and the Midland International Airport is just over two-hours drive from the farthest OnCore location by road.
The OnCore distributed mining network was developed after completing a series of regional geologic exploration efforts across areas located outside of the historic Permian Basin frac sand mining activity centers. The first OnCore site opened in late-2020, and after seeing continued demand for locally sourced damp frac sand, there are now a total of 9 different producing OnCore sites.
The status of each site is provided in the table below. This table can be found in Section 3.2 of our 2024 TRS (defined below) prepared by JT Boyd, which is included as Exhibit 96.3 to this Annual Report.
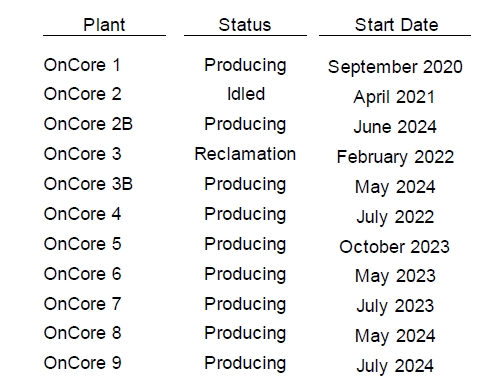
The OnCore distributed mining network has 33.3 million tons of associated proven reserves as of December 31, 2024. The sand deposits generally range from less than 5 to over 40 feet thick and consist of 100-mesh. The crush strength of the sand mined at the facility is 7,000 to 13,000 PSI for 100-mesh.
Our Reserves
Information concerning our material mining properties in this Annual Report has been prepared in accordance with the requirements of Subpart 1300 of Regulation S-K, which first became applicable to us for the fiscal year ended December 31, 2023. As used in this Annual Report, the terms “mineral resource,” “mineral reserve,” “proven mineral reserve” and “probable mineral reserve” are defined and used in accordance with Subpart 1300 of Regulation S-K.
We categorize our mineral reserves as proven or probable based on the standards set by our independent mining engineers and geologists, JT Boyd. We estimate that we had a total of approximately 592.9 million tons of proven and probable mineral reserves as of December 31, 2024. As of December 31, 2024, we had approximately 294.5 million tons of proven mineral reserves and 36.9 million tons of probable recoverable mineral reserves associated with our K1/K2 facilities, approximately 52.5 million tons of proven mineral reserves and 4.2 million tons of probable recoverable mineral reserves associated with our K115/874 facilities, approximately 143.0 million tons of proven mineral reserves and 2.2 million tons of probable recoverable mineral reserves associated with our Monahans facility, and approximately 33.3 million tons of proven mineral reserves and 26.3 million tons of probable recoverable mineral reserves associated with our OnCore distributed mining network. The quantity and nature of the mineral reserves at each of our properties are estimated by our internal geology department. We use drone surveys and three-dimensional models to regularly update our reserve estimates, making necessary adjustments for operations and mine plans at each location during the year.
Our internal reserve estimates are provided to JT Boyd for review annually so that third-party approved additions or reductions can be made to our mineral reserves and mineral resource calculations due to ore extraction, additional drilling and delineation, property acquisitions and dispositions or quality adjustments. Before acquiring new mineral reserves, we perform surveying, drill core analysis and other tests to confirm the quantity and quality of the acquired mineral reserves. JT Boyd reviewed our mineral reserves and mineral resources as of December 31, 2023 and provided technical report summaries which were filed with our Annual Report on Form 10-K for the fiscal year ended December 31, 2023. Technical report summaries for the December 31, 2023 mineral reserves and mineral resources that were acquired in the Hi-Crush Transaction were filed with our Current Report on Form 8-K on May 8, 2024, which encompasses the K115/874 facilities and the OnCore distributed mining network.
K1/K2, K115/874, and Monahans Facilities
We believe, and JT Boyd concurs, that all material assumptions and information pertaining to the disclosure of our mineral resources and mineral reserves, including material assumptions relating to all modifying factors, price estimates, and scientific and technical information, as described in the December 31, 2023 technical summary reports (the “2023 TRSs”) remain current as of December 31, 2024 for the K1/K2, K115/874, and Monahans facilities. As a result, we are relying on the 2023 TRSs for the K1/K2, K115/874, and Monahans facilities. Therefore, portions of the following information are based on assumptions, qualifications and procedures that are summarized here and are described in more detail in the 2023 TRSs.
OnCore Distributed Mining Network
Due to the expansion and removal of certain OnCore mines in 2024, we engaged JT Boyd to review our OnCore distributed mining network's mineral reserves and mineral resources as of December 31, 2024 and furnish a technical report summary (the “2024 TRS”) for this property.
Reference should be made to the full text of the technical summary reports, incorporated herein by reference and made a part of this Annual Report. JT Boyd is not affiliated with the Company nor any other entity that has an ownership, royalty, or other interest in the properties that are the subject of the technical report summaries. To opine as to the economic viability of our mineral reserves, JT Boyd reviewed our operating cost and revenue per ton data at the time of the proven reserve determination. The sand deposits at our facilities do not require crushing or extensive processing to eliminate clays or other contaminants, enabling us to cost-effectively produce high-quality proppant meeting API specifications.
Summary of Reserves
The following tables provide the tonnage and mesh size characteristics of the proven and probable mineral reserves associated with our property as of December 31, 2024, based on an average of $30.00 per ton for K1/K2 and Monahans facilities, an average of $26.04 for K115/874, and an average of $24.83 per ton for the OnCore distributed mining network. It should be noted that the achieved process yields are slightly different than the overall process yields used to estimate the frac sand resources and reserves, which are based on the results of drill hole sample testing at each property.
K1/K2 Facilities
| | | | | | | | | | | | | | | | | | | | | | | | | | | | | | | | | | | | |
| | Tons by Classification and Mesh Size (in thousands) | |
| | Proven | | | Probable | | | By Mesh Size | |
Control | | 40/70 | | | 70/140 | | | Total | | | 40/70 | | | 70/140 | | | Total | | | 40/70 | | | 70/140 | | | Total | |
Owned | | | 81,423 | | | | 61,934 | | | | 143,357 | | | | 254 | | | | 317 | | | | 571 | | | | 81,677 | | | | 62,251 | | | | 143,928 | |
Leased | | | 70,709 | | | | 80,410 | | | | 151,119 | | | | 16,215 | | | | 20,066 | | | | 36,281 | | | | 86,924 | | | | 100,476 | | | | 187,400 | |
Total | | | 152,132 | | | | 142,344 | | | | 294,476 | | | | 16,469 | | | | 20,383 | | | | 36,852 | | | | 168,601 | | | | 162,727 | | | | 331,328 | |
K115/874 Facilities
| | | | | | | | | | | | |
| | Tons by Classification and Mesh Size (in thousands) | |
| | Proven | | | Probable | | | Total | |
Control | | 40/140 | | | 40/140 | | | | |
Owned | | | 52,484 | | | | 4,245 | | | | 56,729 | |
Monahans Facility
| | | | | | | | | | | | | | | | | | | | | | | | | | | | | | | | | | | | |
| | Tons by Classification and Mesh Size (in thousands) | |
| | Proven | | | Probable | | | By Mesh Size | |
Control | | 40/70 | | | 70/140 | | | Total | | | 40/70 | | | 70/140 | | | Total | | | 40/70 | | | 70/140 | | | Total | |
Leased | | | 88,853 | | | | 54,182 | | | | 143,035 | | | | 1,372 | | | | 819 | | | | 2,191 | | | | 90,225 | | | | 55,001 | | | | 145,226 | |
OnCore Distributed Mining Network
| | | | | | | | | | | | | | |
| | | | Tons by Classification and Mesh Size (in thousands) | |
| | | | Proven | | | Probable | | | Total | |
Plant | | Control | | 40/140 | | | 40/140 | | | | |
OnCore 1 | | Leased | | | 2,028 | | | | — | | | | 2,028 | |
| | Owned | | | — | | | | 5,004 | | | | 5,004 | |
| | Subtotal | | | 2,028 | | | | 5,004 | | | | 7,032 | |
OnCore 2 | | Leased | | | 375 | | | | — | | | | 375 | |
OnCore 2B | | Leased | | | — | | | | 4,787 | | | | 4,787 | |
OnCore 3B | | Owned | | | — | | | | 2,891 | | | | 2,891 | |
OnCore 4 | | Leased | | | 1,681 | | | | 668 | | | | 2,349 | |
OnCore 5 | | Leased | | | 3,442 | | | | 7,282 | | | | 10,724 | |
OnCore 6 | | Leased | | | 4,322 | | | | — | | | | 4,322 | |
OnCore 7 | | Leased | | | 3,120 | | | | 4,692 | | | | 7,812 | |
OnCore 8 | | Leased | | | 4,660 | | | | — | | | | 4,660 | |
OnCore 9 | | Leased | | | 13,679 | | | | 1,020 | | | | 14,699 | |
Total - All OnCore Plants | | | | | 33,307 | | | | 26,344 | | | | 59,651 | |
Combined
The following table provides the tonnage and mesh size characteristics of the proven and probable mineral reserves associated with our K1/K2, K115/874, and Monahans facilities and OnCore distributed mining network operations as of December 31, 2024 on a combined basis.
| | | | | | | | | | | | | | | | | | | | | | | | | | | | | | | | |
| | Tons by Classification and Mesh Size (in thousands) | |
| | Proven | | | Probable | |
Facilities | | 40/70 | | | 70/140 | | | 40/140 | | | Total | | | 40/70 | | | 70/140 | | | 40/140 | | | Total | |
K1/K2 | | | 152,132 | | | | 142,344 | | | | — | | | | 294,476 | | | | 16,469 | | | | 20,383 | | | | — | | | | 36,852 | |
Monahans | | | 88,853 | | | | 54,182 | | | | — | | | | 143,035 | | | | 1,372 | | | | 819 | | | | — | | | | 2,191 | |
K115/874 | | | — | | | | — | | | | 52,484 | | | | 52,484 | | | | — | | | | — | | | | 4,245 | | | | 4,245 | |
OnCore | | | — | | | | — | | | | 33,307 | | | | 33,307 | | | | — | | | | — | | | | 26,344 | | | | 26,344 | |
Total | | | 240,985 | | | | 196,526 | | | | 85,791 | | | | 523,302 | | | | 17,841 | | | | 21,202 | | | | 30,589 | | | | 69,632 | |
| | | | | | | | | | | | | | | | |
| | Tons by Classification and Mesh Size (in thousands) | |
| | By Mesh Size | |
Facilities | | 40/70 | | | 70/140 | | | 40/140 | | | Total | |
K1/K2 | | | 168,601 | | | | 162,727 | | | | — | | | | 331,328 | |
Monahans | | | 90,225 | | | | 55,001 | | | | — | | | | 145,226 | |
K115/874 | | | — | | | | — | | | | 56,729 | | | | 56,729 | |
OnCore | | | — | | | | — | | | | 59,651 | | | | 59,651 | |
Total | | | 258,826 | | | | 217,728 | | | | 116,380 | | | | 592,934 | |
Drilling density utilized by us to determine proven versus probable mineral reserves is based upon the relative characteristics of the mineral resource field evaluated, including the consistency and density of the mineral resource within the drilling core sample. The target drill-hole spacing utilized by JT Boyd to estimate our proven and probable mineral reserves are as follows:
•Proven—less than or equal to 1,500 feet
•Probable—less than or equal to 2,500 feet
Material Assumptions
Estimates of frac sand reserves for our K1/K2, K115/874, and Monahans facilities and OnCore distributed mining network were derived contemporaneously with estimates of frac sand resources for each property. To derive an estimate of saleable product tons (proven and probable frac sand reserves), the following modifying factors were applied to the in-place measured and indicated frac sand resources underlying the respective mine plan areas of each operation:
•For the all the K1/K2, K115/874, and Monahans reserves, there was a 95% mining recovery factor which assumes that 5% of the mineable (in-place) frac sand resource will not be recovered for various reasons. For the OnCore distributed mining network reserves, there was a 90% mining recovery factor at each location which assumes that 10% of the mineable (in-place) frac sand resource will not be recovered for various reasons. Applying this recovery factor to the in-place resource results in the estimated run-of-mine (“ROM”) sand tonnage that will be delivered to the wet process plant.
•Processing recoveries, based on exploration sample gradation testing, are 85% for the K1/K2 mines, 83% for the K115/874 mines, and 88% for the Monahans mine. For the OnCore distributed mining network, the processing recoveries differ by location within an average of 71% across all OnCore plants. These recovery factors account for removal of out-sized (i.e., larger than 40-mesh and smaller than 140-mesh) sand and losses during processing due to minor inefficiencies.
Further information can be found in Section 6.3.1 of our 2023 TRSs, which are included as Exhibit 96.1 and 96.2, and our 2024 TRS, which is included as Exhibit 96.3, to this Annual Report.
Our Resources
A “mineral resource” is defined by Subpart 1300 of Regulation S-K as a concentration or occurrence of material of economic interest in or on the Earth’s crust in such form, grade or quality, and quantity that there are reasonable prospects for economic extraction. Further, mineral resource is a reasonable estimate of mineralization, taking into account relevant factors such as cut-off grade, likely mining dimensions, location or continuity, that, with the assumed and justifiable technical and economic conditions, is likely to, in whole or in part, become economically extractable. Subpart 1300 of Regulation S-K divides resources between “measured mineral resources” and “indicated mineral resources” and “inferred mineral resources,” which are defined as follows:
•Measured mineral resources. Resources for which quantity and grade or quality are estimated on the basis of conclusive geological evidence and sampling. The level of geological certainty associated with a measured mineral resource is sufficient to allow a qualified person to apply modifying factors, as defined in this section, in sufficient detail to support detailed mine planning and final evaluation of the economic viability of the deposit. Because a measured mineral resource has a higher level of confidence than the level of confidence of either an indicated mineral resource or an inferred mineral resource, a measured mineral resource may be converted to a proven mineral reserve or to a probable mineral reserve.
•Indicated mineral resources. Resources for which quantity and grade or quality are estimated on the basis of adequate geological evidence and sampling. The level of geological certainty associated with an indicated mineral resource is sufficient to allow a qualified person to apply modifying factors in sufficient detail to support mine planning and evaluation of the economic viability of the deposit. Because an indicated mineral resource has a lower level of confidence than the level of confidence of a measured mineral resource, an indicated mineral resource may only be converted to a probable mineral reserve.
•Inferred mineral resources. Resources for which quantity and grade or quality are estimated on the basis of limited geological evidence and sampling. The level of geological uncertainty associated with an inferred mineral resource is too high to apply relevant technical and economic factors likely to influence the prospects of economic extraction in a manner useful for evaluation of economic viability. Because an inferred mineral resource has the lowest level of geological confidence of all mineral resources, which prevents the application of the modifying factors in a manner useful for evaluation of economic viability, an inferred mineral resource may not be considered when assessing the economic viability of a mining project, and may not be converted to a mineral reserve.
The target drill-hole spacing utilized by JT Boyd to estimate our measured, indicated and inferred resources are as follows:
•Measured – less than or equal to 1,500 feet
•Indicated – greater than 1,500 feet, but less than or equal to 2,500 feet
•Inferred – greater than 2,500 feet, but less than or equal to 5,000 feet
The following tables set forth the mineral resource estimates, exclusive of mineral reserves, associated with our property as of December 31, 2024, based on an average of $30.00 per ton for K1/K2 and Monahans facilities, an average of $26.04 for K115/874, and an average of $24.83 per ton for the OnCore distributed mining network. It should be noted that the achieved process yields are slightly different than the overall process yields used to estimate the frac sand resources and reserves, which are based on the results of drill hole sample testing at each property.
K1/K2 Facilities
| | | | | | | | | | | | | | | | | | | | |
| | | | | | | | Estimated In-Place Frac Sand Tons | |
| | | | | | | | (in thousands) | |
Resource Category | | Acres | | | Average Sand Thickness (ft) | | | Owned | | | Leased | | | Total | |
Measured | | | 165 | | | | | | | 2,750 | | | | 16,636 | | | | 19,386 | |
Indicated | | | 460 | | | | | | | 563 | | | | 75,515 | | | | 76,078 | |
Measured + Indicated | | | 625 | | | | | | | 3,313 | | | | 92,151 | | | | 95,464 | |
Inferred | | | 800 | | | | | | | — | | | | 75,076 | | | | 75,076 | |
Total | | | 1,425 | | | | 74 | | | | 3,313 | | | | 167,227 | | | | 170,540 | |
K115/874 Facilities
There are no reportable frac sand resources excluding those converted to frac sand reserves for the K115/874 Mine. Quantities of frac sand controlled by the Company within the defined boundaries of the K115/874 property which are not reported as frac sand reserves, are not considered to have potential economic viability; as such, they are not reportable as frac sand resources.
Monahans Facility
| | | | | | | | | | | | | | | | | | | | |
| | | | | | | | Estimated In-Place Frac Sand Tons | |
| | | | | | | | (in thousands) | |
Resource Category | | Acres | | | Average Sand Thickness (ft) | | | Owned | | | Leased | | | Total | |
Measured | | | 487 | | | | | | | — | | | | 71,730 | | | | 71,730 | |
Indicated | | | 785 | | | | | | | — | | | | 102,755 | | | | 102,755 | |
Measured + Indicated | | | 1,272 | | | | | | | — | | | | 174,485 | | | | 174,485 | |
Inferred | | | 8,908 | | | | | | | — | | | | 1,094,030 | | | | 1,094,030 | |
Total | | | 10,180 | | | | 57 | | | | — | | | | 1,268,515 | | | | 1,268,515 | |
OnCore Distributed Mining Network
There are no reportable frac sand resources excluding those converted to frac sand reserves for all of the OnCore sites. Quantities of frac sand controlled by the Company within the defined boundaries of each OnCore site which are not reported as frac sand reserves, are not considered to have potential economic viability; as such, they are not reportable as frac sand resources.
As of December 31, 2024, our mineral resources are estimated at 1.439 billion tons (170.5 million tons at the K1/K2 facilities and 1.269 billion tons at the Monahans facility).
Material Assumptions
Estimates of in-place frac sand resources for the K1/K2, K115/874, and Monahans facilities and OnCore distributed mining network operations were prepared by performing the following tasks:
K1/K2 and Monahans
•Available drilling logs and laboratory testing results were compiled and reviewed to check for accuracy and to support development of each operation’s geologic model. The geologic databases utilized for modeling and estimation consist of results from 87 drill holes completed on the K1/K2 property, and 80 drill holes completed on the Monahans property, as is discussed in Chapter 5. The geologic data were imported into Carlson Software, a geologic modeling and mine planning software suite that is widely used and accepted by the mining industry.
•A geologic model of each deposit was created in Carlson Software using industry standard grid modeling methods well-suited for simple stratigraphic deposits. Each geologic model delineates the top and bottom of the mineable sand horizon and the distribution of the product size fractions across the deposits. The top and bottom of the mineable frac sand interval were established as follow:
•As there is minimal overburden material across the subject properties, the top of the mineable sand interval was defined as the current ground surface, as provided by a combination of originally flown aerial topographic surveys and recently surveyed active mining pits.
•The bottom of the mineable sand interval on both Atlas properties was determined by Westward geologists and geological technicians present during the various exploration and sampling campaigns. Westward defined the bottom
of the mineable sand interval as the depth at which a drilled interval no longer contained sand as either the first or second most abundant material present.
•After reviewing the continuity and variability of the deposit, suitable resource classification criteria were developed and applied.
•Estimation of the in-place frac sand resources for the K1/K2 and Monahans properties assumes mining operations will utilize a combination of standard surface excavation equipment for the near-surface initial operations (dry mining) and dredging equipment once initial excavation has reached into the water table. This sequence of operating is widely utilized for mining of similar deposit types. As such, the estimates were subject to the following setbacks and slope requirements:
•50 ft inside of property lines.
•50 ft around the wet and dry process plant areas and main access road/right of way.
•An overall pit wall slope of 3:1 (approximately 19 degrees).
•In-place volumes for each property were estimated from the geologic model within Carlson Software. A dry, in-place, bulk density of 100 pounds per cubic foot was used to calculate the in-place tonnage of frac sand.
K115/874
•The top and bottom elevations of the mineable sand interval was interpreted from drill hole records and sand particle size analyses. The sands mined at the K115/874 operation are present at the surface. As there is little-to-no overburden, the top of the mineable sand unit is considered to be the current ground surface. The bottom of the mineable sand unit is delineated by the depth at which a characteristic red clay interval was encountered.
•Interpreted drill hole records were compiled and validated. Strata thicknesses were aggregated, and sand particle size analyses of the sand unit were composited for each data point. The compiled drill hole data were then imported into Vulcan, a geologic modeling and mine planning software suite that is widely used and accepted by the mining industry.
•A geologic model of the deposit was created in Vulcan using industry-standard grid modeling methods well-suited for simple stratigraphic deposits. The geologic model delineates the top and bottom of the mineable sand horizon and the distribution of the product size fractions across the deposit.
•After reviewing the continuity and variability of the deposit, suitable resource classification criteria were developed and applied.
•Contiguous areas of remaining mineable sand within the K115/874 property were delineated using the estimation criteria, in addition to the following:
o50-ft setbacks from property boundaries.
o50-ft setbacks from pipelines.
o50-ft buffer zones around the process plant areas and main access road/right of way.
oPit wall slopes of 3:1 (approximately 19 degrees).
oAreas mined prior to December 31, 2023, were delineated from aerial imagery and excluded from the estimates of frac sand resources.
•In-place volumes for each of the remaining mining areas were calculated from the geologic model within the Vulcan software. A dry, in-place, bulk density of 100 pounds per cubic foot was used to calculate the in-place tonnage of frac sand.
OnCore Distributed Mining Network
•The top and bottom elevations of the mineable sand interval of each site was interpreted from drill hole records and sand particle size analyses. The sands mined at the various OnCore sites are generally present at the surface. As there is little-to-no overburden, the top of the mineable sand unit is considered to be the current ground surface or directly beneath a thin soil interval noted in drilling logs. The bottom of the mineable sand unit is delineated by the depth at which drilling was terminated, or an underlying caliche interval was encountered.
•Interpreted drill hole records were compiled and validated. Strata thicknesses were aggregated, and sand particle size analyses of the sand unit were composited for each data point. The compiled drill hole data were then imported into either Carlson Software or Vulcan geologic modeling and mine planning software, both of which are geologic modeling and mine planning software suites that are widely used and accepted by the mining industry.
•A geologic model of each site’s deposit was created using industry-standard grid modeling methods well-suited for simple stratigraphic deposits. The geologic models delineate the top and bottom of the mineable sand horizon and the distribution of the product size fractions across each of the OnCore site deposits.
•After reviewing the continuity and variability of each deposit, suitable resource classification criteria were developed and applied.
•Contiguous areas of remaining mineable sand within the various OnCore sites were delineated using the estimation criteria, in addition to utilizing mapping of remaining mineable areas, as well as considering the following assumptions for each OnCore site:
oPit wall slopes of 3:1 (approximately 19 degrees).
oAreas mined prior to December 31, 2024, were delineated from surveyed topography and/or aerial imagery and excluded from the estimates of frac sand resources.
•In-place volumes for each of the remaining mining areas were calculated from the geologic model within the modeling software. A dry, in-place, bulk density of 100 pounds per cubic foot was used to calculate the in-place tonnage of frac sand.
Further information can be found in Section 6.2.1 of our 2023 TRSs, which are included as Exhibit 96.1 and 96.2, and our 2024 TRS, which is included as Exhibit 96.3, to this Annual Report.
Comparisons
K1/K2 Facilities
| | | | | | | | | | | | | | |
| | Summary of Reserves (in thousands) |
| | December 31, 2024 | | | December 31, 2023 | | | Amount Change 2024 vs. 2023 | | | Percentage Change
2024 vs. 2023 |
| | Amount | | | Amount | | | | | | |
Proven | | | 294,476 | | | | 300,706 | | | | (6,230 | ) | | -2% |
Probable | | | 36,852 | | | | 36,852 | | | | — | | | 0% |
Total | | | 331,328 | | | | 337,558 | | | | (6,230 | ) | | -2% |
As shown in the table above, the frac sand reserves of the K1/K2 mines decreased by approximately 6.2 million product tons in 2024 as the result of ordinary mining production (depletion). No other year-over-year changes were noted.
| | | | | | | | | | | | | | |
| | Summary of Resources (in thousands) |
| | December 31, 2024 | | | December 31, 2023 | | | Amount Change 2024 vs. 2023 | | | Percentage Change
2024 vs. 2023 |
| | Amount | | | Amount | | | | | | |
Measured | | | 19,386 | | | | 19,386 | | | | — | | | 0% |
Indicated | | | 76,078 | | | | 76,078 | | | | — | | | 0% |
Inferred | | | 75,076 | | | | 75,076 | | | | — | | | 0% |
Total | | | 170,540 | | | | 170,540 | | | | — | | | 0% |
There were no year-over-year adjustments to the frac sand resources reported for the K1/K2 mines. As such, the Company continued to control approximately 170.5 million in-place tons of frac sand resources, exclusive of frac sand reserves, at the K1/K2 mines as of December 31, 2024, as shown in the table above.
K115/874 Facilities
| | | | | | | | | | | | | | |
| | Summary of Reserves (in thousands) |
| | December 31, 2024 | | | December 31, 2023 | | | Amount Change 2024 vs. 2023 | | | Percentage Change
2024 vs. 2023 |
| | Amount | | | Amount | | | | | | |
Proven | | | 52,484 | | | | 56,630 | | | | (4,146 | ) | | -7% |
Probable | | | 4,245 | | | | 4,245 | | | | — | | | 0% |
Total | | | 56,729 | | | | 60,875 | | | | (4,146 | ) | | -7% |
As shown in the table above, the frac sand reserves of the K115/874 mines decreased by approximately 4.1 million product tons in 2024 as the result of ordinary mining production (depletion). No other year-over-year changes were noted.
Monahans Facility
| | | | | | | | | | | | | | |
| | Summary of Reserves (in thousands) |
| | December 31, 2024 | | | December 31, 2023 | | | Amount Change 2024 vs. 2023 | | | Percentage Change
2024 vs. 2023 |
| | Amount | | | Amount | | | | | | |
Proven | | | 143,035 | | | | 148,294 | | | | (5,259 | ) | | -4% |
Probable | | | 2,191 | | | | 2,191 | | | | — | | | 0% |
Total | | | 145,226 | | | | 150,485 | | | | (5,259 | ) | | -3% |
As shown in the table above, the frac sand reserves of the Monahans mine decreased by approximately 5.3 million product tons in 2024 as the result of ordinary mining production (depletion). No other year-over-year changes were noted.
| | | | | | | | | | | | | | |
| | Summary of Resources (in thousands) |
| | December 31, 2024 | | | December 31, 2023 | | | Amount Change 2024 vs. 2023 | | | Percentage Change
2024 vs. 2023 |
| | Amount | | | Amount | | | | | | |
Measured | | | 71,730 | | | | 71,730 | | | | — | | | 0% |
Indicated | | | 102,755 | | | | 102,755 | | | | — | | | 0% |
Inferred | | | 1,094,030 | | | | 1,094,030 | | | | — | | | 0% |
Total | | | 1,268,515 | | | | 1,268,515 | | | | — | | | 0% |
There were no year-over-year adjustments to the frac sand resources reported for the Monahans mine. As such, the Company continued to control approximately 1.27 billion in-place tons of frac sand resources, exclusive of frac sand reserves, at the Monahans mine as of December 31, 2024, as shown in the table above.
OnCore Distributed Mining Network
| | | | | | | | | | | | | | |
| | Summary of Reserves (in thousands) |
| | December 31, 2024 | | | December 31, 2023 | | | Amount Change 2024 vs. 2023 | | | Percentage Change
2024 vs. 2023 |
| | Amount | | | Amount | | | | | | |
Proven | | | 33,307 | | | | 24,833 | | | | 8,474 | | | 34% |
Probable | | | 26,344 | | | | 22,339 | | | | 4,005 | | | 18% |
Total | | | 59,651 | | | | 47,172 | | | | 12,479 | | | 26% |
When comparing the OnCore plants’ estimated frac sand reserves as of December 31, 2024, with those reported as of December 31, 2023, we note a net increase of approximately 12.5 million product tons. This increase is the direct result of: (1) the addition of the OnCore 9 plant, (2) changes in property control and mine plans at the OnCore 1 plant, and (3) depletion through ordinary mining operations and inventory sales.
Our Lease and Royalty Arrangements
We lease a portion of the mineral reserves associated with our K1/K2 operations and all of the mineral reserves associated with our Monahans operations. In December 2017, we entered into a royalty agreement with Sealy Smith in connection with certain leased property at the K1/K2 facilities. The royalty agreement associated with the K1/K2 facilities terminated on the date of our IPO, pursuant to the terms of the agreement. The rights and access to the mineral reserves associated with our Monahans operations are secured under the Monahans Lease with the Sealy Smith. Under the Monahans Lease, we are committed to pay royalties on product sold from that facility and are required to pay a minimum royalty of $1.0 million for any lease year following our IPO. We have certain royalty obligations based on tonnage of sand sold under land leases associated with our OnCore distributed mining network. Our royalty payments are included in our cost of sales.
On March 1, 2024, the Company entered into a pooling agreement with the General Land Office of Texas (“GLO”) that establishes a pooled unit across our fee owned lands and leased lands at the K1/K2 property. The pooling agreement has a current effective blended royalty rate of 5.86% on K1/K2 plant sales. This pooling agreement increases our operational flexibility by establishing a framework to efficiently mine across our fee owned lands and leased lands interchangeably.
Our Permits
We have obtained numerous federal, state and local permits required for operations at our Kermit facilities, Monahans facility, and OnCore distributed mining network. Operations are predominantly regulated by the TCEQ with respect to environmental compliance. The predominant permitting requirement is an active NSR permit for air pollution control. Our operations have a current NSR permit which is renewable next in 2028. Other permits held by our operations include Stormwater, Above Ground Storage Tank, Aggregate Production Operation, and a septic permit. A Spill Prevention, Control, and Countermeasure plan is also active at the locations.
While resources invested in securing permits are significant, this cost has not had a material adverse effect on our results of operations or financial condition. We cannot be certain that existing environmental laws and regulations will not be reinterpreted or revised or that new environmental laws and regulations will not be adopted or become applicable to us. Revised or additional environmental requirements that result in increased compliance costs or additional operating restrictions could have a material adverse effect on our business.
Item 3. Legal Proceedings.
On July 2, 2024, Patrick Ayers, a purported shareholder (the Plaintiff), filed a derivative and class action complaint in the Delaware Court of Chancery against certain current and former directors of the Company and certain of the Company’s affiliates. The complaint asserts claims of breach of fiduciary duty related to the corporate reorganization that changed the Company’s Up-C structure to a customary C corporation. The complaint seeks unspecified damages from the defendants for the plaintiff individually and on behalf of the Company and other former Class A common stockholders as well as an award of attorneys’ fees and costs. We dispute these allegations and intend to vigorously defend against these claims. Given the uncertainty of litigation, the preliminary stage of the cases, and the legal standards that must be met for, among other things, derivative standing and success on the merits, we cannot estimate the reasonably possible loss or range of loss that may result from these derivative actions.
In addition to the matter above, we are currently involved in, and may in the future be involved in, legal proceedings, claims, regulatory inquiries, audits, and governmental investigations incidental to our business, including putative class actions, collective actions, employment, commercial claims and other matters. While the outcome of any litigation is inherently unpredictable, based on currently available facts and our current insurance coverages, we do not believe that the ultimate resolution of any of these matters will have a material adverse impact on our financial condition, results of operations or cash flows. We are not aware of any material legal proceedings contemplated by governmental authorities. The disclosure called for by this Part I, Item 3 regarding our legal proceedings is incorporated by reference herein from Part II, Item 8. Note 10 - Commitments and Contingencies - Litigation of the notes to the consolidated financial statements (the “Financial Statements”) in this Annual Report.
Item 4. Mine Safety Disclosures.
Information concerning mine safety violations or other regulatory matters required by Section 1503(a) of the Dodd-Frank Wall Street Reform and Consumer Protection Act and Item 104 of Regulation S-K (17 C.F.R. Section 229.104) is included in Exhibit 95.1 to this Annual Report.
PART II
Item 5. Market for Registrant’s Common Equity, Related Stockholder Matters and Issuer Purchases of Equity Securities.
Market Information
Our Common Stock is listed on the NYSE under the symbol "AESI."
Holders of Record
As of the close of business on February 21, 2025, there were 34 record holders of our Common Stock. A substantially greater number of holders of our Common Stock are “street name” or beneficial holders, whose shares of record are held by banks, brokers, and other financial institutions.
Dividend Practice
We commenced paying cash distributions in December 2021 and intend to continue to recommend to our Board that we regularly return capital to our stockholders in the future. The declaration and payment of future dividends to holders of our Common Stock will be at the discretion of our Board and will depend upon many factors, including our financial condition, earnings, legal requirements, capital allocation strategy, restrictions in our debt agreements and other factors our Board deems relevant. Although we do not currently have plans to reduce or suspend our dividend, there is no assurance that we will pay any cash dividends on our Common Stock in the future.
Performance Graph
The information contained in this Performance Graph section shall not be deemed to be "soliciting material" or "filed" or incorporated by reference in future filings with the SEC, or subject to the liabilities of Section 18 of the Exchange Act, except to the extent that we specifically incorporate it by reference into a document filed under the Securities Act or the Exchange Act. The share price performance shown on the graph is not necessarily indicative of future price performance.
The graph below compares the cumulative total stockholder return on our Common Stock to the cumulative total return on the Russell 2000 index, VanEck Oil Services index, PHLX Oil Service index, Standard and Poor’s Energy index, and the Standard and Poor’s SmallCap 600 index, in each case assuming $100 was invested on March 8, 2023. We elected to include the VanEck Oil Services index, PHLX Oil Service index, and Standard and Poor’s Energy index because a number of companies in these indexes are included in the custom peer group used to determine relative total stockholder return performance share units that we have granted to employees.
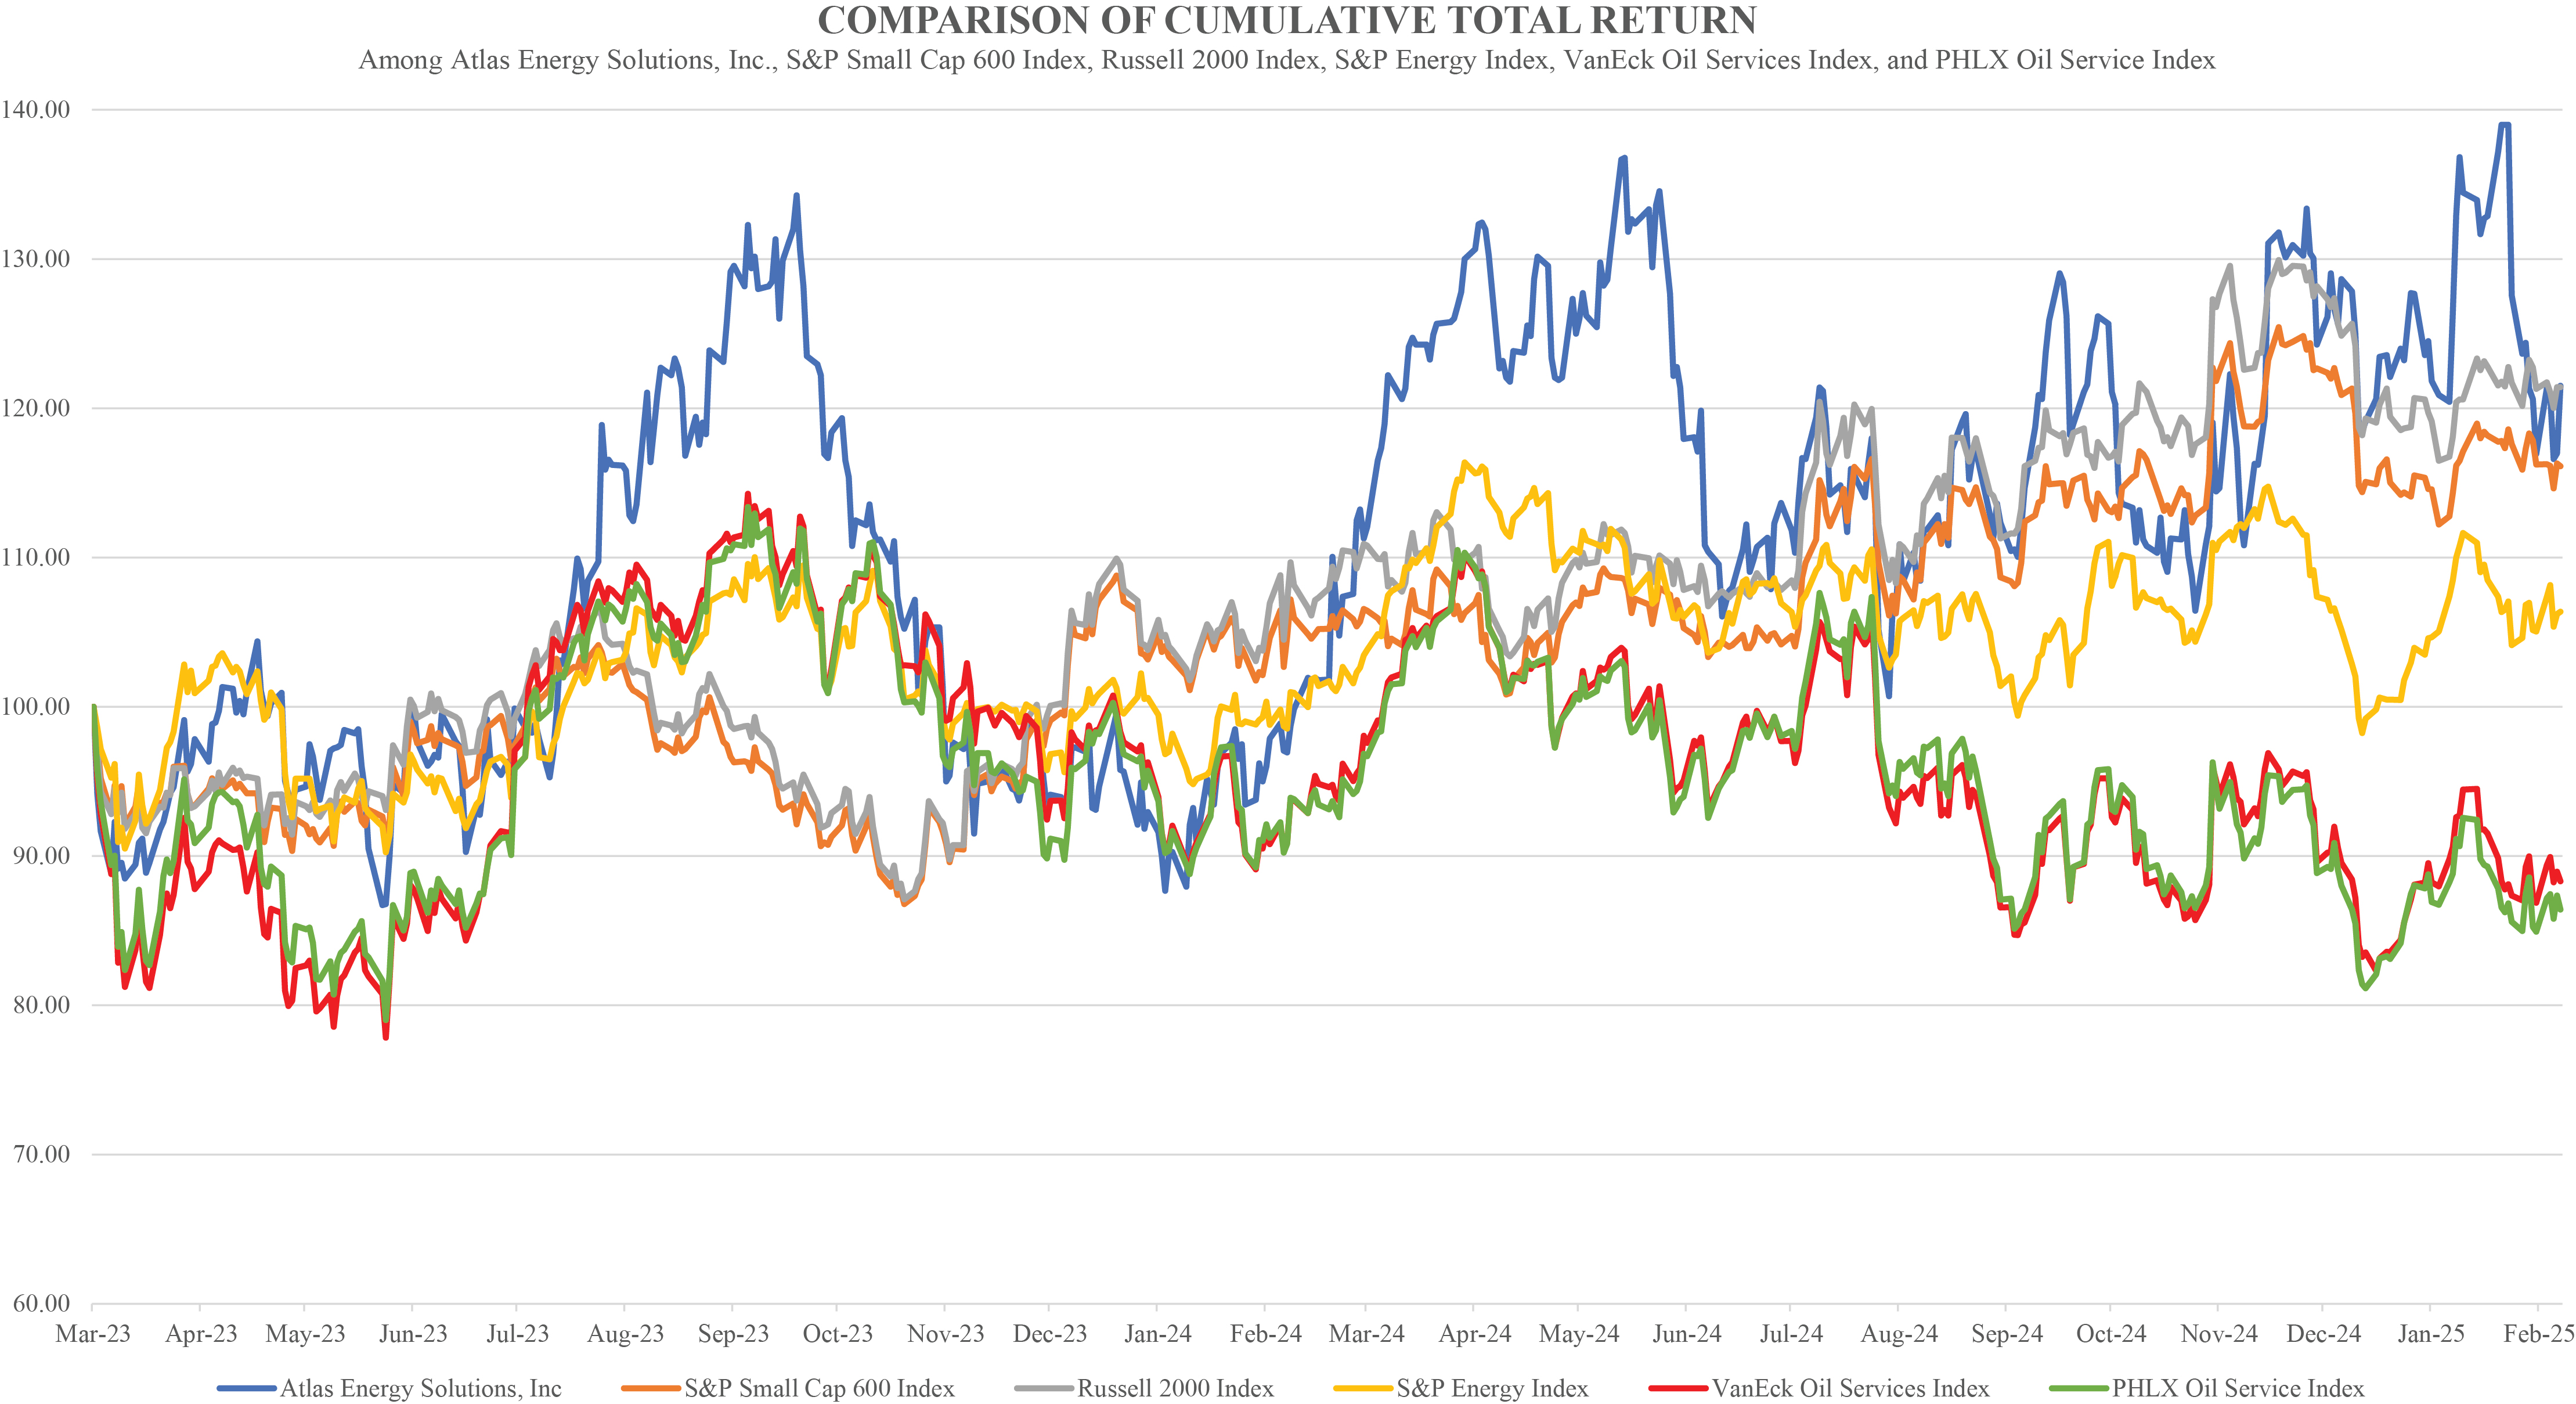
Unregistered Sales of Equity Securities
As discussed elsewhere in this Annual Report, on March 5, 2024, we consummated the Hi-Crush Transaction in accordance with the Hi-Crush Merger Agreement, pursuant to which we acquired substantially all of Hi-Crush’s Permian Basin proppant production and logistics businesses and operations in exchange for (i) cash consideration of $140.1 million, (ii) 9.7 million shares of Common Stock (the “Hi-Crush Stock Consideration”), issued at the closing of the Hi-Crush Transaction, and (iii) the Deferred Cash Consideration Note.
The issuance of the Hi-Crush Stock Consideration to the Hi-Crush Stockholders was completed in reliance upon the exemption from the registration requirements of the Securities Act of 1933, as amended (the “Securities Act”), provided by Section 4(a)(2) thereof and Rule 506 of Regulation D promulgated thereunder as a transaction by an issuer not involving any public offering.
As discussed elsewhere in this Annual Report, on February 24, 2025, we consummated the Moser Acquisition in accordance with the Moser Purchase Agreement, pursuant to which we acquired 100% of the authorized, issued and outstanding equity ownership interests in Moser AcquisitionCo and Moser in exchange for (i) cash consideration of $180.0 million and (ii) approximately 1.7 million shares of Common Stock (the “Moser Stock Consideration”), issued at the closing of the Moser Acquisition.
The issuance of the Moser Stock Consideration to the Moser Stockholders was completed in reliance upon the exemption from the registration requirements of the Securities Act of 1933, as amended (the “Securities Act”), provided by Section 4(a)(2) thereof as a transaction by an issuer not involving any public offering.
Use of Proceeds
On January 30, 2025, the Company entered into an underwriting agreement (the “Underwriting Agreement”) with Goldman Sachs & Co. LLC and Piper Sandler & Co., as representatives of the several underwriters, relating to the underwritten offering of 11.5 million shares of Common Stock, par value $0.01 per share. The Offering closed on February 3, 2025.
The Company received approximately $254.1 million of net proceeds from the sale of shares of our Common Stock, after deducting underwriting discounts and commissions. We used the net proceeds from this offering (i) to repay the $70.0 million outstanding on the 2023 ABL Credit Facility, (ii) to repay $101.3 million of the Deferred Cash Consideration Note, and (iii) the remainder for general corporate purposes.
Item 6. (Reserved)
Item 7. Management’s Discussion and Analysis of Financial Condition and Results of Operations.
The following discussion and analysis of our financial condition and results of operations should be read together with Item 1, “Business,” and the Consolidated Financial Statements and the related notes in Item 8 of this Annual Report. For the purposes of this discussion, references to “Atlas Inc.” are to AESI Holdings Inc. (f/k/a Atlas Energy Solutions Inc.) for periods prior to the completion of the Up-C Simplification, and to Atlas Energy Solutions Inc. (f/k/a New Atlas HoldCo Inc.) for periods subsequent to the Up-C Simplification. References to the “Company,” “we,” “us,” “our” and like expressions are to Atlas Inc. together with its subsidiaries.
This discussion contains forward-looking statements as a result of many factors, including those set forth under the section titled “Cautionary Statement Regarding Forward-Looking Statements” and Item 1A. “Risk Factors,” and elsewhere in this Annual Report. These statements are based on current expectations and assumptions that are subject to risks and uncertainties. Actual results could differ materially from those discussed in or implied by forward-looking statements. Factors that could cause or contribute to these differences include those discussed below and elsewhere in this Annual Report, particularly in Item 1A. “Risk Factors.” We do not undertake any obligation to publicly update any forward-looking statements except as otherwise required by applicable law.
We use Adjusted EBITDA, Adjusted EBITDA Margin, Adjusted Free Cash Flow, Adjusted EBITDA less Capital Expenditures, Adjusted Free Cash Flow Margin, Adjusted EBITDA less Capital Expenditures Margin, Adjusted Free Cash Flow Conversion, Contribution Margin, Maintenance Capital Expenditures and Net Debt herein as non-GAAP measures of our financial performance. For further discussion of Contribution Margin, EBITDA, Adjusted EBITDA and Adjusted Free Cash Flow, see the section titled “Non-GAAP Financial Measures” in this Item 7 of this Annual Report. We define various terms to simplify the presentation of information in this Annual Report. All share amounts are presented in thousands.
Overview
We are a low-cost producer of high-quality, locally sourced 100 mesh and 40/70 sand used as a proppant during the well completion process. Proppant is necessary to facilitate the recovery of hydrocarbons from oil and natural gas wells. One hundred percent of our sand reserves are located in Texas within the Permian Basin and our operations consist of proppant production and processing facilities, including four facilities near Kermit, Texas (together, the “Kermit facilities”), a fifth facility near Monahans, Texas (the “Monahans facility”), and the OnCore distributed mining network.
We also operate a differentiated logistics platform that is designed to increase the efficiency, safety and sustainability of the oil and natural gas industry within the Permian Basin. This includes our fleet of fit-for-purpose trucks, trailers, and the Dune Express, an overland conveyor infrastructure solution. We have also begun integrating autonomous driving technologies in certain of our fit-for-purpose trucks, creating the first semi-autonomous oilfield logistics network in an effort to increase our automation of the oil and gas proppant supply chain.
We also provide distributed power solutions through a fleet of more than 900 natural gas-powered reciprocating generators, with approximately 212 megawatts of existing power generation, primarily supporting production and artificial lift operations across all major United States resource basins. Our generators are designed for heavy-duty, harsh environments for mission critical power needs. Our in-house manufacturing and remanufacturing capabilities, coupled with critical in-field service, provide quality control and standardization across the fleet ensuring market-leading uptime.
Our Predecessor
The predecessor of Atlas Inc. consists of Atlas LLC and certain of its wholly-owned subsidiaries: Atlas Sand Employee Holding Company, LLC; Atlas Sand Employee Company, LLC; Atlas OLC Employee Company, LLC; Atlas Construction Employee Company, LLC; Fountainhead Logistics Employee Company, LLC; Atlas Sand Construction, LLC; OLC Kermit, LLC; OLC Monahans, LLC; and Fountainhead Logistics, LLC on a consolidated basis (all of which we refer to collectively as “Atlas Predecessor”). Historical periods for Atlas Predecessor are presented on a consolidated basis given the common control ownership. Unless otherwise indicated, the historical consolidated financial information included in this Annual Report presents the historical financial information of Atlas Predecessor. Historical consolidated financial information is not indicative of the results that may be expected in any future periods.
Recent Developments
Moser Acquisition
On January 27, 2025, the Company entered into the Moser Purchase Agreement by and among Wyatt Holdings, LLC, a Delaware limited liability company and wholly-owned subsidiary of the Company (the “Purchaser”), Moser Holdings, LLC, a Delaware limited liability company (the “Seller”), and for the limited purposes set forth therein, the Company (together with the Purchaser and the Seller, the “Parties”), pursuant to which the Purchaser will acquire (i) 100% of the authorized, issued and outstanding equity ownership interests in Moser Acquisition, Inc., a Delaware corporation (“Moser AcquisitionCo”), and (ii) Moser Engine Service, Inc. (d/b/a Moser Energy Systems), a Wyoming corporation and a wholly-owned subsidiary of Moser AcquisitionCo (such transaction, the “Moser Acquisition”).
The Moser Acquisition was completed on February 24, 2025. Under the terms and conditions of the Moser Purchase Agreement, the aggregate consideration paid to the Seller in the Moser Acquisition (the “Moser Consideration”) consisted of (i) $180.0 million in cash and (ii) the Moser Stock Consideration, issued at the closing of the Moser Acquisition, which were valued at $40.0 million based on the 20-day trailing volume-weighted average price ending at the close of trading on Friday, January 24, 2025. All or any portion of the Moser Stock Consideration is subject to redemption (the “Redemption Right”) at the option of the Company within 90 days of closing of the Moser Acquisition (the “Moser Closing”). The Moser Consideration is subject to customary post-closing adjustments.
Equity Offering
On January 30, 2025, the Company entered into the Underwriting Agreement, relating to the underwritten offering of 11.5 million shares of Common Stock at a public offering price of $23.00 per share. Under the terms of the Underwriting Agreement, the Company granted the Underwriters a 30-day option to purchase up to 1,725,000 additional shares of Common Stock (the “Option”).
The Offering closed on February 3, 2025. The Company received approximately $254.1 million of net proceeds from the sale of shares of our Common Stock, after deducting underwriting discounts and commissions. We used the net proceeds from this offering (i) to repay the $70.0 million outstanding on the 2023 ABL Credit Facility, (ii) to repay $101.3 million of the Deferred Cash Consideration Note, and (iii) the remainder for general corporate purposes.
Registration Rights Agreement
On February 24, 2025, in connection with the Moser Closing, the Company entered into a registration rights agreement (the “Moser Registration Rights Agreement”) with the Seller that provides, among other things, that the Company will, no later than (a) March 26, 2025, or (b) if the Company is and continues to be a “Well-Known Seasoned Issuer” as defined in Rule 405 of the Securities Act, May 25, 2025, file with the U.S. Securities and Exchange Commission a registration statement registering for resale the Common Stock comprising the Moser Stock Consideration that was issued in connection with the Moser Acquisition, subject to the full or partial exercise of the Redemption Right by the Company. Pursuant to the Moser Purchase Agreement, the Seller agreed not to lend, offer, sell, contract to sell, sell any option or contract to purchase, purchase any option or contract to sell, grant any option, right, or warrant to purchase, or otherwise transfer or dispose of, any of their shares of Common Stock for a period of 90 days following the Moser Closing, subject to certain exceptions. The Company also agreed to pay certain expenses of the parties incurred in connection with the exercise of their rights under the Moser Registration Rights Agreement, and to indemnify them for certain securities law matters in connection with any registration statement filed pursuant thereto.
Corporate Developments
On March 13, 2023, Old Atlas completed its initial public offering of 18,000,000 shares of Old Atlas Class A Common Stock at a price of $18.00 per share. The IPO generated $324.0 million of gross proceeds and net proceeds of approximately $291.2 million, after deducting underwriter discounts and commissions and estimated offering costs. In connection with the IPO, pursuant to the IPO Reorganization Agreement, Old Atlas and the parties thereto completed certain restructuring transactions. As a result of these restructuring transactions, Atlas Operating became the wholly-owned operating subsidiary of Old Atlas, Atlas LLC became a wholly-owned subsidiary of Atlas Operating, and Atlas LLC continued to own all of the Company’s operating assets.
On October 2, 2023, Old Atlas and the Company completed the Up-C Simplification as contemplated by the Master Reorganization Agreement in order to, among other things, reorganize under a new public holding company and eliminate Old Atlas’s “up-C” and dual-class stock structure. Pursuant to the Master Reorganization Agreement, (a) PubCo Merger Sub merged with and into Old Atlas, as a result of which (i) each share of Old Atlas Class A Common Stock then issued and outstanding was exchanged for one share of Common Stock of the Company, (ii) all of the shares of Old Atlas Class B Common Stock then issued and outstanding were surrendered and cancelled for no consideration and (iii) Old Atlas survived the PubCo Merger as a direct, wholly-owned subsidiary of the Company; and (b) Opco Merger Sub merged with and into Atlas Operating, as a result of which (i) each Operating Unit then issued and outstanding, other than those Operating Units held by Old Atlas, was exchanged for one share of Common Stock of the Company and (ii) Atlas Operating became a wholly-owned subsidiary of the Company.
After completion of the Up-C Simplification, the Company replaced Old Atlas as the publicly held entity and, through its subsidiaries, conducts all of the operations previously conducted by Old Atlas, and Old Atlas remains the managing member of Atlas Operating.
Operational Updates
Disposal of Assets
On April 14, 2024, a mechanical fire occurred at one of the Company's plants in Kermit, Texas. The fire primarily impacted the feed system of the processing facility, which transports sand from the dryers and separators to storage silos. During the second quarter of 2024, the Company utilized temporary loadout equipment at the plant to continue production. The Company was able to transition to the temporary loadout within 11 days of the fire incident. Reconstruction of the feed system was completed in June 2024 and the plant was operational by June 30, 2024. The Company performed an impairment analysis on the Kermit asset group as a result of the fire and determined that no impairment was required. The damaged assets from the fire had a net book value of $11.1 million that was recorded as a loss on disposal of assets on the consolidated statements of operations. The Company filed an insurance claim for the fire incident and has recovered the costs associated with returning the plant to production. The Company has recorded $20.1 million of insurance recovery in connection with this incident as this recovery amount is deemed collectable and legally enforceable as of December 31, 2024. The proceeds are recorded as insurance recovery (gain) on the consolidated statements of operations and as cash and cash equivalents on the consolidated balance sheets for the $14.7 million received as of December 31, 2024 and as accounts receivable on the consolidated balance sheets for the $5.4 million not received as of December 31, 2024.
During the third quarter of 2024, one of the Company's dredge mining assets was damaged during commissioning at one of the Kermit facilities. The damaged asset had a net book value of $8.6 million that was recorded as a loss on disposal of assets on the consolidated statements of operations.
The Dune Express Electric Conveyor System
The Dune Express was completed in December 2024. The Dune Express, which originates at our Kermit facilities and stretches into the middle of the Northern Delaware Basin, is the first long-haul proppant conveyor system in the world. The Dune Express is 42 miles in length, capable of transporting 13 million tons of proppant annually, and is strategically located to deliver proppant to the Northern Delaware Basin.
Share Buyback Program
In October 2024, the Board authorized a share repurchase program under which the Company may repurchase up to $200.0 million of outstanding stock through December 31, 2026. As of December 31, 2024, the Company has the ability to purchase up to $200.0 million of outstanding stock under this program. There were no shares of Common Stock repurchased during the year ended December 31, 2024.
The shares may be repurchased from time to time in open market transactions at prevailing market prices, through block trades, in privately negotiated transactions, through derivative transactions or by other means and in accordance with federal securities laws. The timing, as well as the number and value of shares repurchased under the program, will be determined by the Company at its discretion and will depend on a variety of factors including management's assessment of the intrinsic value of the Company's Common Stock, the market price of the Company's Common Stock, general market and economic conditions, available liquidity, compliance with the Company’s debt and other agreements, applicable legal requirements, and other considerations. The exact number of shares to be repurchased by the Company is not guaranteed, and the program may be suspended, modified, or discontinued at any time without prior notice. The Company expects to fund the repurchases by using cash on hand and expected free cash flow to be generated over the next two years.
Financial Developments
Deferred Cash Consideration Note
In accordance with the Hi-Crush Merger Agreement, the Company issued the Deferred Cash Consideration Note in an aggregate principle amount of $111.3 million as of December 31, 2024. The Deferred Cash Consideration Note was part of the consideration transferred and valued at fair value at the acquisition date. The Deferred Cash Consideration Note bears interest at a rate of 5.00% per annum if paid in cash, or 7.00% per annum if paid in kind. Interest on the Deferred Cash Consideration Note is payable quarterly in arrears beginning March 29, 2024 through maturity of January 31, 2026.
The Deferred Cash Consideration Note included $4.6 million of debt discount and approximately $0.1 million deferred financing costs. The discount and deferred financing costs are a direct reduction from the carrying amount of the debt obligation on the Company’s consolidated balance sheets and are amortized to interest expense using the effective interest method.
In February 2025, the Company used a portion of the proceeds from an equity offering to repay $101.3 million of the outstanding principal balance of the Deferred Cash Consideration Note.
Atlas LLC’s obligations under the Deferred Cash Consideration Note are secured by certain of the assets acquired in connection with the Hi-Crush Transaction. The Deferred Cash Consideration Note is also unconditionally guaranteed by Atlas LLC on an unsecured basis.
First Amendment to the 2023 Term Loan Credit Agreement
On February 26, 2024, the Company, Atlas LLC and certain other subsidiaries, entered the Term Loan Amendment, which provided an additional delayed draw term loan (the “ADDT Loan”), in the aggregate principal amount of $150.0 million with interest (computed on the basis of a 365-day year for the actual number of days elapsed) on the unpaid principal amount thereof from and including the date of amendment until paid in full at the rate of 10.86% per annum. The ADDT Loan is payable in 76 consecutive monthly installments of combined principal and interest, each in the amount of $2.7 million commencing April 1, 2024 and continuing up to and including August 1, 2030.
The ADDT Loan included $1.5 million of debt discount $0.5 million deferred financing costs. The discount and deferred financing costs are a direct reduction from the carrying amount of the debt obligation on the Company’s consolidated balance sheets and are amortized to interest expense using the effective interest method.
First Amendment to the 2023 ABL Credit Agreement
On February 26, 2024, Atlas LLC and certain other subsidiaries of the Company entered into the ABL Amendment. The ABL Amendment increased the revolving credit commitment to $125.0 million. The existing lenders increased their commitment by $25.0 million which resulted in a debt modification under Accounting Standards Codification (“ASC”) 470, “Debt.” The ABL Amendment also added a new lender with a $25.0 million commitment, thus creating a new debt arrangement under ASC 470, “Debt.” The deferred financing costs and debt issuance cost will be amortized on a prospective basis over the term of the agreement. The maturity date of the ABL Credit Agreement was extended from February 22, 2028 to the earliest of (a) February 26, 2029; (b) the date that is 91 days prior to the maturity date for any portion of the Term Loan Debt; or (c) any date on which the aggregate Commitments terminate hereunder.
The ABL Amendment requires that if Availability (as defined in the 2023 ABL Credit Agreement) is less than the greater of (i) 12.50% of the Borrowing Base and (ii) $12.5 million, Atlas LLC must maintain a Fixed Charge Coverage Ratio (as defined in the 2023 ABL Credit Agreement) of at least 1.00 to 1.00 while a Covenant Trigger Period (as defined in the 2023 ABL Credit Agreement) is in effect.
Under the ABL Amendment, Atlas LLC is permitted to make payments of dividends and distributions pursuant to certain limited exceptions and baskets set forth therein and otherwise generally subject to certain restrictions described therein, including that (i) no Event of Default (as defined under the 2023 ABL Credit Agreement) has occurred and is continuing, and (ii) no loans and no more than $7.5 million in letters of credit that have not been cash collateralized are outstanding, and liquidity exceeds $30.0 million at all times during the 30 days prior to the date of the dividend or distribution; provided that if any loans are outstanding or outstanding letters of credit exceed $7.5 million and no Event of Default has occurred and is continuing, then Atlas LLC is permitted to make payments of dividends and distributions if, (i) Specified Availability (as defined under the 2023 ABL Credit Agreement) is higher than the greater of (a) $20.0 million and (b) 20% of the pro forma Borrowing Base (as defined under the 2023 ABL Credit Agreement) then in effect and during the 30 days prior to the date of the dividend or distribution as if such dividend or distribution had been made at the beginning of such period, or if (ii) (a) Specified Availability is higher than the greater of (x) $15.0 million and (y) 15% of the pro forma Borrowing Base then in effect and during the 30 days prior to the date of the dividend or distributions as if such dividend or distribution had been made at the beginning of such period and (b) the Fixed Charge Coverage Ratio (as defined under the 2023 ABL Credit Agreement), as calculated on a pro forma basis, is greater than 1.00 to 1.00, as provided under the 2023 ABL Credit Agreement. Additionally, Atlas LLC may make additional payments of dividends and distributions in qualified equity interests and may make Permitted Tax Distributions (as defined under the 2023 ABL Credit Agreement).
On March 5, 2024 and November 12, 2024, the Company drew down $50.0 million and $20.0 million, respectively, under the 2023 ABL Credit Facility for general corporate purposes. The draw included $0.3 million in debt issuance costs and $0.3 million in deferred financing costs. These costs are recorded under other long-term assets on the consolidated balance sheets and are amortized on a straight-line basis over the life of the agreement.
Delayed Draw Term Loan under the 2023 Term Loan Credit Agreement
On November 8, 2024, the Company drew down $20.0 million from Stonebriar under the DDT Loan with interest (computed on the basis of a 365-day year for the actual number of days elapsed) on the unpaid principal amount hereof from and including the date hereof until paid in full at the rate per annum equal to 10.58%. This DDT Loan shall be payable in 69 consecutive monthly installments commencing on December 1, 2024 and continuing on each Payment Day up to and including August 1, 2030 and then a final installment also payable on August 1, 2030.
Second Amendment to the 2023 Term Loan Credit Agreement
On January 27, 2025, the Company entered into the Second Term Loan Amendment to the 2023 Term Loan Credit Agreement, among the Company and certain of its subsidiaries as guarantors, Atlas LLC, as borrower, the lenders party thereto and Stonebriar, as administrative agent, which amends that certain Credit Agreement, dated as of July 31, 2023, as amended (the “Second Term Loan Amendment”).
The Second Term Loan Amendment increased the existing DDT Loan by an aggregate principal amount of $100.0 million (the “Acquisition Loan”) to a total of $200.0 million, creating availability of $180.0 million, with interest (computed on the basis of a 365-day year for the actual number of days elapsed) on the unpaid principal amount thereof from and including the date of the funding on the Acquisition Loan (“Funding Date”) until paid in full. The Acquisition Loan will accrue interest at a rate equal to 5.95% plus the greater of (A) the Term SOFR and (B) 4.30%, as determined on the Funding Date the Acquisition Loan is payable in 60 consecutive monthly installments of combined principal and interest. In the event of a prepayment of the Acquisition Loan, Atlas LLC will be required to pay, and we have agreed to guaranty payment by Atlas LLC of, a premium on such prepayment amount of (A) 4%, if prepaid on or prior to the first anniversary of the Funding Date, (B) 3% if prepaid after the first, but on or prior to the second, anniversary of the Funding Date and (C) 2% if paid after the second anniversary of the Funding Date.
Second Amendment to the 2023 ABL Credit Agreement
On January 27, 2025, Atlas LLC and certain other subsidiaries of the Company entered into that certain Second Amendment to Loan, Security and Guaranty Agreement (the “Second ABL Amendment”), among Atlas LLC, as the borrower, the subsidiary guarantors party thereto, the lenders party thereto and Bank of America, N.A., as the ABL Agent. The Second ABL Amendment amends that certain Loan, Security and Guaranty Agreement dated as of February 22, 2023, as amended.
The Second ABL Amendment permitted the Company and its applicable affiliates to enter into the Second Term Loan Amendment, pursuant to which the principal amount of the existing delayed draw term loan was increased by an aggregate principal amount of $100.0 million.
2025 Term Loan Credit Facility
On February 21, 2025, Atlas LLC entered into a credit agreement (the “2025 Term Loan Credit Agreement”) with Stonebriar, as administrative agent and initial lender, pursuant to which Stonebriar extended Atlas LLC a term loan credit facility comprised of a $540.0 million single advance term loan that was made on February 21, 2025 (the “2025 Term Loan Credit Facility”).
The 2025 Term Loan Credit Facility is payable in eighty-five consecutive monthly installments, consisting of forty-eight monthly installments of combined principal and interest, thirty-seven installments of interest only payments, and a final payment of the remaining outstanding principal balance at maturity. The 2025 Term Loan Credit Facility has a final maturity date of March 1, 2032 (the “Maturity Date”). The 2025 Term Loan Credit Facility bears interest at a rate equal to 9.51% per annum.
In the event that the Leverage Ratio (as defined under the 2025 Term Loan Credit Agreement) as of the end of any fiscal quarter ending on or after June 30, 2025 is equal to or greater than 2.5:1.0, Atlas LLC will be required to prepay the 2025 Term Loan Credit Facility with 50% of Excess Cash Flow (as defined under the 2025 Term Loan Credit Agreement) for the fiscal quarter period most recently ended less the aggregate amount of optional prepayments of the Term Loan made during such period.
Atlas LLC may voluntarily redeem the loan outstanding under the 2025 Term Loan Credit Facility, provided that any such prepayment shall include a prepayment fee equal to the sum of the Make-Whole Amount (as defined in under the 2025 Term Loan Credit Agreement) plus (a) three percent (3%) of the principal amount being repaid if such prepayment occurs on or prior to February 21, 2028, (b) two percent (2%) of the principal amount being repaid if such prepayment occurs after February 21, 2028 but on or prior to February 21, 2029 and (c) one percent (1%) of the of the principal amount being repaid if such prepayment occurs thereafter. The Make-Whole Amount shall equal zero (0) when calculating any prepayment made after February 21, 2027. Upon the maturity of the 2025 Term Loan Credit Facility, the entire unpaid principal amount of the loan outstanding thereunder, together with interest, fees and other amounts payable in connection with the facility, will be immediately due and payable without further notice or demand.
Dividends and distributions to equity holders are permitted to be made pursuant to certain limited exceptions and baskets described in the 2025 Term Loan Credit Agreement and otherwise generally subject to certain restrictions set forth in the 2025 Term Loan Credit Agreement, including the requirement that no Event of Default (as defined under the 2025 Term Loan Credit Agreement) has occurred and is continuing.
The 2025 Term Loan Credit Facility includes certain non-financial covenants, including but not limited to restrictions on incurring additional debt and certain distributions. The 2025 Term Loan Credit Facility is subject to two financial covenants, which require that the Loan Parties (as defined in the 2025 Term Loan Credit Agreement) maintain a maximum Leverage Ratio of 4.0 to 1.0 and a minimum Liquidity (as defined in the 2025 Term Loan Credit Agreement) of $40,000,000. Such financial covenants are tested as of the last day of each fiscal quarter.
The Company used the proceeds from the 2025 Term Loan Credit Facility to refinance the existing term loan facilities, to fund the cash consideration in connection with the Moser Acquisition and for general corporate purposes.
The 2025 Term Loan Credit Facility is unconditionally guaranteed, jointly and severally, by Atlas LLC and its subsidiaries and secured by substantially all of the assets of Atlas LLC and its subsidiaries. The 2025 Term Loan Credit Facility is also unconditionally guaranteed on an unsecured basis by the Company.
Third Amendment to the 2023 ABL Credit Agreement
On February 21, 2025, Atlas LLC and certain other subsidiaries of the Company entered into that certain Third Amendment to Loan, Security and Guaranty Agreement (the “Third ABL Amendment”), among Atlas LLC, as the borrower, the subsidiary guarantors party thereto, the lenders party thereto and Bank of America, N.A., as administrative agent. The Third ABL Amendment amends that certain Loan, Security and Guaranty Agreement dated as of February 22, 2023, as amended.
The Third ABL Amendment permitted the Company and its applicable affiliates to enter into the 2025 Term Loan Credit Agreement, pursuant to which Atlas LLC borrowed $540.0 million from Stonebriar in a single advance term loan that was made on February 21, 2025.
Dividends and Distributions
On February 8, 2024, the Company declared a dividend of $0.21 per share (base dividend of $0.16 per share and a variable dividend of $0.05 per share) of Common Stock. The dividend was paid on February 29, 2024 to holders of record of Common Stock as of the close of business on February 22, 2024.
On May 6, 2024, the Company declared a dividend of $0.22 per share (base dividend of $0.16 per share and a variable dividend of $0.06 per share) of Common Stock. The dividend was paid on May 23, 2024 to holders of record of Common Stock as of the close of business on May 16, 2024.
On August 1, 2024, the Company declared a dividend of $0.23 per share of Common Stock. The dividend was paid on August 22, 2024 to holders of record of Common Stock as of the close of business on August 15, 2024.
On October 24, 2024, the Company declared a dividend of $0.24 per share of Common Stock. The dividend was paid on November 14, 2024 to holders of record of Common Stock as of the close of business on November 7, 2024.
On February 11, 2025, the Company declared a dividend of $0.25 per share of Common Stock. The dividend will be payable on February 28, 2025 to holders of record of Common Stock as of the close of business on February 21, 2025.
Recent Trends and Outlook
Drilling and completions activities for oil and gas are highly correlated to oil and gas prices. Despite commodity price fluctuations due to ongoing uncertainties in geopolitics, OPEC+ production plans, and Chinese economic growth, amongst other factors, North American drilling and completion activity has remained relatively flat over the past year. The price for West Texas Intermediate (“WTI”) crude oil averaged $76.63 per barrel (“Bbl”) in 2024, as compared to $77.58 per Bbl in 2023, representing a decrease of approximately 1%. Global oil prices have been stable over the past few years as the market became tighter from a supply-demand picture. Global economic growth coupled with an increased focus on energy security and large projected multi-year increases in power consumption should bolster demand, in both crude and natural gas, in the coming years.
How We Generate Revenue
We generate revenue by mining, processing and distributing proppant that our customers use in connection with their operations. We sell proppant to our customers under supply agreements or as spot sales at prevailing market rates, which is dependent upon the cost of producing proppant, the proppant volumes sold and the desired margin and prevailing market conditions.
Revenues also include charges for sand logistics services provided to our customers. Our logistics service revenue fluctuates based on several factors, including the volume of proppant transported, the distance between our facilities and our customers, and prevailing freight rates. Revenue is generally recognized as products are delivered in accordance with the contract.
Some of our contracts contain shortfall provisions that calculate agreed upon fees that are billed when the customer does not satisfy the minimum purchases over a period of time defined in each contract.
Following the acquisition of Moser, we will also generate revenue through the rental of our generators and related services, including transportation of our generators and field supervision and support. Generator rentals and provision of related services are performed under a variety of contract structures.
Costs of Conducting Our Business
We incur operating costs primarily from direct and indirect labor, freight charges, utility costs, fuel and maintenance costs and royalties. We incur labor costs associated with employees at our proppant production facilities, which represent the most significant cost of converting proppant to finished product. Our proppant production facilities undergo maintenance to minimize unscheduled downtime and ensure the ongoing quality of our proppant and ability to meet customer demands. We may incur variable utility costs in connection with the operation of our processing facilities, primarily natural gas and electricity, which are both susceptible to market fluctuations. We lease equipment in many areas of our operations, including our proppant production hauling equipment. We incur variable royalty expense and/or delay rentals related to our agreements with the owners of our reserves. In addition, other costs including overhead allocation, depreciation and depletion are capitalized as a component of inventory and are reflected in cost of sales when inventory is sold. Our logistics services incur operating costs primarily composed of variable freight charges from trucking companies' delivery of sand to customer wellsites, equipment leases, direct and indirect labor, fuel and maintenance costs and royalties.
Following the acquisition of Moser, we will also have expenses comprising our costs of sales (excluding depreciation, depletion, and accretion expense) of (i) direct labor costs, and related travel and lodging expenses, (ii) generator transportation costs and (iii) the costs of maintaining our equipment. A large portion of our costs of sales (excluding depreciation, depletion, and accretion expense) are variable based on the number of generators deployed with customers.
How We Evaluate Our Operations
Non-GAAP Financial Measures
Adjusted EBITDA, Adjusted EBITDA Margin, Adjusted Free Cash Flow, Adjusted EBITDA less Capital Expenditures, Adjusted Free Cash Flow Margin, Adjusted EBITDA less Capital Expenditures Margin, Adjusted Free Cash Flow Conversion, Contribution Margin, Maintenance Capital Expenditures and Net Debt are non-GAAP supplemental financial measures used by our management and by external users of our Financial Statements such as investors, research analysts and others, in the case of Adjusted EBITDA, to assess our operating performance on a consistent basis across periods by removing the effects of development activities, provide views on capital resources available to organically fund growth projects and, in the case of Adjusted Free Cash Flow and Adjusted EBITDA less Capital Expenditures, assess the financial performance of our assets and their ability to sustain dividends or reinvest to organically fund growth projects over the long term without regard to financing methods, capital structure or historical cost basis.
We define Adjusted EBITDA as net income before depreciation, depletion and accretion expense, amortization expense of acquired intangible assets, interest expense, income tax expense, stock and unit-based compensation, loss on extinguishment of debt, loss on disposal of assets, insurance recovery (gain), unrealized commodity derivative (gain) loss, other acquisition related costs, and other non-recurring costs. Management believes Adjusted EBITDA is useful because it allows them to more effectively evaluate our operating performance and compare the results of our operations from period to period and against our peers without regard to our financing methods or capital structure. We exclude the items listed above from net income in arriving at Adjusted EBITDA because these amounts can vary substantially from company to company within our industry depending upon accounting methods and book values of assets, capital structures and the method by which the assets were acquired. Certain prior period non-recurring costs of goods sold are now included as an add-back to adjusted EBITDA in order to conform to the current period presentation and to more accurately describe the Company’s operating performance and results period-over-period.
We define Adjusted EBITDA Margin as Adjusted EBITDA divided by total sales.
We define Adjusted Free Cash Flow as Adjusted EBITDA less Maintenance Capital Expenditures. We define Adjusted EBITDA less Capital Expenditures as Adjusted EBITDA less net cash used in investing activities. We believe that Adjusted Free Cash Flow and Adjusted EBITDA less Capital Expenditures are useful to investors as they provide measures of the ability of our business to generate cash.
We define Adjusted Free Cash Flow Margin as Adjusted Free Cash Flow divided by total sales.
We define Adjusted EBITDA less Capital Expenditures Margin as Adjusted EBITDA less Capital Expenditures divided by total sales.
We define Adjusted Free Cash Flow Conversion as Adjusted Free Cash Flow divided by Adjusted EBITDA.
We define Contribution Margin as gross profit plus depreciation, depletion and accretion expense.
We define Maintenance Capital Expenditures as capital expenditures excluding growth capital expenditures and reconstruction of previously incurred growth capital expenditures.
We define Net Debt as total debt, net of discount and deferred financing costs, plus finance right-of-use lease liabilities, less cash and cash equivalents.
Adjusted EBITDA, Adjusted EBITDA Margin, Adjusted Free Cash Flow, Adjusted EBITDA less Capital Expenditures, Adjusted Free Cash Flow Margin, Adjusted EBITDA less Capital Expenditures Margin, Adjusted Free Cash Flow Conversion, Contribution Margin, Maintenance Capital Expenditures and Net Debt do not represent and should not be considered alternatives to, or more meaningful than, net income, income from operations, net cash provided by operating activities or any other measure of financial performance presented in accordance with GAAP as measures of our financial performance. Adjusted EBITDA, Adjusted Free Cash Flow, and Adjusted EBITDA less Capital Expenditures have important limitations as analytical tools because they exclude some but not all items that affect net income, the most directly comparable GAAP financial measure. Our computation of Adjusted EBITDA, Adjusted EBITDA Margin, Adjusted Free Cash Flow, Adjusted Free Cash Flow Margin, Adjusted EBITDA less Capital Expenditures, Adjusted EBITDA less Capital Expenditures Margin, Adjusted Free Cash Flow Conversion, Contribution Margin, Maintenance Capital Expenditures and Net Debt may differ from computations of similarly titled measures of other companies.
The following table presents a reconciliation of Adjusted EBITDA, Adjusted EBITDA Margin, Adjusted Free Cash Flow, Adjusted EBITDA less Capital Expenditures, Adjusted Free Cash Flow Margin, Adjusted EBITDA less Capital Expenditures Margin, Adjusted Free Cash Flow Conversion, Contribution Margin, Maintenance Capital Expenditures and Net Debt to the most directly comparable GAAP financial measure for the periods indicated.
| | | | | | | | | | | | | |
| | | For the Year Ended | |
| | | December 31, | |
| | | 2024 | | | 2023 | | | 2022 | |
| | | (In thousands) | |
Net income (1) | | | $ | 59,944 | | | $ | 226,493 | | | $ | 217,006 | |
Depreciation, depletion and accretion expense | | | | 102,207 | | | | 41,634 | | | | 28,617 | |
Amortization expense of acquired intangible assets | | | | 12,316 | | | | — | | | | — | |
Interest expense | | | | 43,078 | | | | 17,452 | | | | 15,803 | |
Income tax expense | | | | 15,836 | | | | 31,378 | | | | 1,856 | |
EBITDA | | | $ | 233,381 | | | $ | 316,957 | | | $ | 263,282 | |
Stock and unit-based compensation | | | | 22,381 | | | | 7,409 | | | | 678 | |
Unrealized commodity derivative (gain) loss | | | | — | | | | — | | | | 66 | |
Loss on disposal of assets (4) | | | | 19,672 | | | | — | | | | — | |
Insurance recovery (gain) (5) | | | | (20,098 | ) | | | — | | | | — | |
Other non-recurring costs (6) | | | | 14,335 | | | | 4,838 | | | | — | |
Other acquisition related costs (3) | | | | 19,231 | | | | 451 | | | | — | |
Adjusted EBITDA | | | $ | 288,902 | | | $ | 329,655 | | | $ | 264,026 | |
Maintenance Capital Expenditures (2) | | | $ | 37,562 | | | $ | 38,524 | | | $ | 35,473 | |
Adjusted Free Cash Flow | | | $ | 251,340 | | | $ | 291,131 | | | $ | 228,553 | |
| | | | | | | | | | | | | |
| | | For the Year Ended | |
| | | December 31, | |
| | | 2024 | | | 2023 | | | 2022 | |
| | | (In thousands) | |
Net income (1) | | | $ | 59,944 | | | $ | 226,493 | | | $ | 217,006 | |
Depreciation, depletion and accretion expense | | | | 102,207 | | | | 41,634 | | | | 28,617 | |
Amortization expense of acquired intangible assets | | | | 12,316 | | | | — | | | | — | |
Interest expense | | | | 43,078 | | | | 17,452 | | | | 15,803 | |
Income tax expense | | | | 15,836 | | | | 31,378 | | | | 1,856 | |
EBITDA | | | $ | 233,381 | | | $ | 316,957 | | | $ | 263,282 | |
Stock and unit-based compensation expense | | | | 22,381 | | | | 7,409 | | | | 678 | |
Unrealized commodity derivative (gain) loss | | | | — | | | | — | | | | 66 | |
Loss on disposal of assets (4) | | | | 19,672 | | | | — | | | | — | |
Insurance recovery (gain) (5) | | | | (20,098 | ) | | | — | | | | — | |
Other non-recurring costs (6) | | | | 14,335 | | | | 4,838 | | | | — | |
Other acquisition related costs (3) | | | | 19,231 | | | | 451 | | | | — | |
Adjusted EBITDA | | | $ | 288,902 | | | $ | 329,655 | | | $ | 264,026 | |
Capital expenditures | | | $ | 373,983 | | | $ | 365,486 | | | $ | 89,592 | |
Hi-Crush acquisition | | | $ | 153,425 | | | $ | — | | | $ | — | |
Adjusted EBITDA less Capital Expenditures | | | $ | (238,506 | ) | | $ | (35,831 | ) | | $ | 174,434 | |
| | | | | | | | | | | | | | |
| | | | For the Year Ended | |
| | | | December 31, | |
| | | | 2024 | | | 2023 | | | 2022 | |
| | | | (In thousands) | |
Net cash provided by operating activities | | | | $ | 256,460 | | | $ | 299,027 | | | $ | 206,012 | |
Current income tax expense (2) | | | | | 834 | | | | 2,177 | | | | 1,858 | |
Change in operating assets and liabilities | | | | | (22,523 | ) | | | 6,947 | | | | 41,774 | |
Cash interest expense(2) | | | | | 39,070 | | | | 16,354 | | | | 14,904 | |
Maintenance Capital Expenditures(2) | | | | | (37,562 | ) | | | (38,524 | ) | | | (35,473 | ) |
Other non-recurring costs (6) | | | | | 14,335 | | | | 4,838 | | | | — | |
Other acquisition related costs (3) | | | | | 19,231 | | | | 451 | | | | — | |
Insurance recovery (gain) (5) | | | | | (20,098 | ) | | | — | | | | — | |
Other | | | | | 1,593 | | | | (139 | ) | | | (522 | ) |
Adjusted Free Cash Flow | | | | $ | 251,340 | | | $ | 291,131 | | | $ | 228,553 | |
| | | | | | | | | | | |
| | | | For the Year Ended | |
| | | | December 31, | |
| | | | 2024 | | | 2023 | | | 2022 | |
| | | | (In thousands, except percentages) | |
Net cash provided by operating activities | | | | $ | 256,460 | | | $ | 299,027 | | | $ | 206,012 | |
Current income tax expense (2) | | | | | 834 | | | | 2,177 | | | | 1,858 | |
Change in operating assets and liabilities | | | | | (22,523 | ) | | | 6,947 | | | | 41,774 | |
Cash interest expense(2) | | | | | 39,070 | | | | 16,354 | | | | 14,904 | |
Capital expenditures | | | | | (373,983 | ) | | | (365,486 | ) | | | (89,592 | ) |
Hi-Crush acquisition | | | | | (153,425 | ) | | | — | | | | — | |
Other non-recurring costs (6) | | | | | 14,335 | | | | 4,838 | | | | — | |
Other acquisition related costs (3) | | | | | 19,231 | | | | 451 | | | | — | |
Insurance recovery (gain) (5) | | | | | (20,098 | ) | | | — | | | | — | |
Other | | | | | 1,593 | | | | (139 | ) | | | (522 | ) |
Adjusted EBITDA less Capital Expenditures | | | | $ | (238,506 | ) | | $ | (35,831 | ) | | $ | 174,434 | |
Adjusted EBITDA Margin | | | | | 27.4 | % | | | 53.7 | % | | | 54.7 | % |
Adjusted EBITDA less Capital Expenditure Margin | | | | | (22.6 | )% | | | (5.8 | )% | | | 36.1 | % |
Adjusted Free Cash Flow Margin | | | | | 23.8 | % | | | 47.4 | % | | | 47.3 | % |
Adjusted Free Cash Flow Conversion | | | | | 87.0 | % | | | 88.3 | % | | | 86.6 | % |
| | | | | | | | | | | | |
| | For the Year Ended | |
| | December 31, | |
| | 2024 | | | 2023 | | | 2022 | |
| | (In thousands) | |
Gross Profit | | $ | 232,014 | | | $ | 313,766 | | | $ | 256,308 | |
Depreciation, depletion and accretion expense | | | 98,747 | | | | 39,798 | | | | 27,498 | |
Contribution Margin | | $ | 330,761 | | | $ | 353,564 | | | $ | 283,806 | |
(1) Atlas Inc. is a corporation and is subject to U.S. federal income tax. Atlas LLC has elected to be treated as a partnership for income tax purposes and, therefore, was not subject to U.S. federal income tax at an entity level during the periods prior to the initial public offering. As a result, the consolidated net income in our historical financial statements does not reflect the tax expense we would have incurred if we had been subject to U.S. federal income tax at an entity level during such periods.
(2) A reconciliation of the adjustment of these items used to calculate Adjusted Free Cash Flow to the Financial Statements is included below.
(3) Represents acquisition costs include fees paid to finance, legal, accounting and other advisors, employee retention and benefit costs, and other operational and corporate costs.
(4) Represents loss on disposal of one of the Company's dredge mining assets at its Kermit facility and loss on disposal of assets as a result of the fire at one of the Kermit plants that caused damage to the physical condition of the Kermit asset group.
(5) Represents insurance recovery (gain) deemed collectible and legally enforceable as of December 31, 2024 related to the fire at one of the Kermit plants.
(6) Other non-recurring costs includes costs incurred during our Up-C simplification transaction, temporary loadout, and other infrequent and unusual costs.
| | | | | | | | | | | | | |
| | | For the Year Ended | |
| | | December 31, | |
| | | 2024 | | | 2023 | | | 2022 | |
| | (In thousands) | |
Current tax expense reconciliation: | | | | | | | | | | |
Income tax expense | | | $ | 15,836 | | | $ | 31,378 | | | $ | 1,856 | |
Less: deferred tax expense | | | | (15,002 | ) | | | (29,201 | ) | | | 2 | |
Current income tax expense (benefit) | | | $ | 834 | | | $ | 2,177 | | | $ | 1,858 | |
Cash interest expense reconciliation: | | | | | | | | | | |
Interest expense, net, excluding loss on extinguishment of debt | | | $ | 38,647 | | | $ | 7,689 | | | $ | 15,760 | |
Less: Amortization of debt discount | | | | (3,573 | ) | | | (761 | ) | | | (457 | ) |
Less: Amortization of deferred financing costs | | | | (435 | ) | | | (337 | ) | | | (442 | ) |
Less: Interest income | | | | 4,431 | | | | 9,763 | | | | 43 | |
Cash interest expense | | | $ | 39,070 | | | $ | 16,354 | | | $ | 14,904 | |
Maintenance Capital Expenditures, accrual basis reconciliation: | | | | | | | | | | |
Purchases of property, plant and equipment | | | $ | 373,983 | | | $ | 365,486 | | | $ | 89,592 | |
Changes in operating assets and liabilities associated with investing activities (7) | | | | (2,948 | ) | | | 66,132 | | | | 20,747 | |
Less: Growth capital expenditures and reconstruction of previously incurred growth capital expenditures | | | | (333,473 | ) | | | (393,094 | ) | | | (74,866 | ) |
Maintenance Capital Expenditures, accrual basis | | | $ | 37,562 | | | $ | 38,524 | | | $ | 35,473 | |
| | | | | | | | | | | | |
| | For the Year Ended | |
| | December 31, | |
| | 2024 | | | 2023 | | | 2022 | |
| | (In thousands) | |
Total Debt | | $ | 510,725 | | | $ | 172,820 | | | $ | 147,174 | |
Discount and deferred financing costs | | | 10,202 | | | | 7,180 | | | | 1,821 | |
Finance right-of-use lease liabilities | | | 5,294 | | | | 422 | | | | 20,155 | |
Cash and cash equivalents | | | 71,704 | | | | 210,174 | | | | 82,010 | |
Net Debt | | $ | 454,517 | | | $ | (29,752 | ) | | $ | 87,140 | |
(7) Positive working capital changes reflect capital expenditures in the current period that will be paid in a future period. Negative working capital changes reflect capital expenditures incurred in a prior period but paid during the period presented.
Factors Affecting the Comparability of Our Results of Operations
Long-Term Incentive Plan
In order to incentivize management members, in March 2023, our Board adopted the LTIP for the benefit of employees, directors and consultants of the Company and its affiliates. The LTIP provides for the grant of all or any of the following types of awards: (1) incentive stock options qualified as such under U.S. federal income tax laws; (2) stock options that do not qualify as incentive stock options; (3) stock appreciation rights; (4) restricted stock awards; (5) restricted stock units (“RSUs”); (6) bonus stock; (7) dividend equivalents; (8) other stock-based awards; (9) cash awards; and (10) substitute awards. As such, our historical financial data may not present an accurate indication of what our actual results would have been if we had implemented the LTIP program prior to the periods presented.
M&A Activity
On March 5, 2024, the Company completed the Hi-Crush Transaction, in which the Company acquired substantially all of Hi-Crush’s Permian Basin proppant production and logistics businesses and operations in exchange for (i) cash consideration of $140.1 million, (ii) 9.7 million shares of Common Stock issued at the closing of the transaction, and (iii) the Deferred Cash Consideration Note in an aggregate principle amount of $111.3 million as of December 31, 2024. This amount is subject to purchase price adjustments as defined in the Hi-Crush Merger Agreement. This history impacts the comparability of our operational results from year to year. Additional information on these transactions can be found in Note 3 - Hi-Crush Transaction of the Financial Statements included elsewhere in this Annual Report.
Public Company Expenses
As a result of the IPO, we incurred direct, incremental selling, general and administrative expenses as a result of being a publicly traded company, including, but not limited to, costs associated with hiring new personnel, implementation of compensation programs that are competitive with our public company peer group, including stock-based compensation, preparing quarterly reports to stockholders, tax return preparation, independent and internal auditor fees, investor relations activities, registrar and transfer agent fees, incremental director and officer liability insurance costs and independent director compensation. These direct, incremental selling, general and administrative expenses are not included in our results of operations prior to the IPO.
Income Taxes
Atlas Inc. is a corporation subject to U.S. federal, state and local income taxes. Although Atlas Predecessor is subject to margin tax in the State of Texas (at less than 1% of modified pre-tax earnings), it is and historically has been treated as a pass-through entity for U.S. federal, state and local income tax purposes, and as such generally is and was not subject to U.S. federal, state or local income taxes. Rather, the tax liability with respect to the taxable income of Atlas Predecessor is and was passed through to its owners. Accordingly, the financial data attributable to Atlas Predecessor contains no provision for U.S. federal income taxes or income taxes in any state or locality (other than margin tax in the State of Texas). Atlas Inc. is subject to U.S. federal, state and local taxes at a blended statutory rate of approximately 22%.
We account for income taxes under the asset and liability method. Under this method, deferred tax assets and liabilities are recognized for the estimated future tax consequences attributable to differences between the financial statement carrying amounts of existing assets and liabilities and their respective tax bases. Deferred tax assets and liabilities are measured using enacted tax rates in effect for the year in which those temporary differences are expected to be recovered or settled pursuant to the provisions of ASC 740, Income Taxes. The effect on deferred tax assets and liabilities of a change in tax rate is recognized in earnings in the period that includes the enactment date. Valuation allowances are established when necessary to reduce deferred tax assets to the amounts more likely than not to be realized.
On March 13, 2023 (the closing date of the IPO), a corresponding deferred tax liability of approximately $27.5 million associated with the differences between the tax and book basis of the investment in Atlas LLC was recorded. The offset of the deferred tax liability was recorded to additional paid-in capital.
On October 2, 2023, the date on which the Company completed the Up-C Simplification, a corresponding deferred tax liability of approximately $64.0 million was recorded associated with the exchange of the redeemable noncontrolling interest in Old Atlas for shares of the Company's Common Stock. The offset of the deferred tax liability was recorded to additional paid-in capital.
Results of Operations
| | | | | | | | | | | | |
| | For the Year Ended | |
| | December 31, | |
| | 2024 | | | 2023 | | | 2022 | |
| | (In thousands) | |
Product sales | | $ | 515,434 | | | $ | 468,119 | | | $ | 408,446 | |
Service sales | | | 540,523 | | | | 145,841 | | | | 74,278 | |
Total sales | | | 1,055,957 | | | | 613,960 | | | | 482,724 | |
Cost of sales (excluding depreciation, depletion and accretion expense) | | | 725,196 | | | | 260,396 | | | | 198,918 | |
Depreciation, depletion and accretion expense | | | 98,747 | | | | 39,798 | | | | 27,498 | |
Gross profit | | | 232,014 | | | | 313,766 | | | | 256,308 | |
Operating expenses: | | | | | | | | | |
Selling, general and administrative expense (including stock and unit-based compensation expense of $22,381, $7,409 and $678, respectively.) | | | 106,248 | | | | 48,636 | | | | 24,317 | |
Amortization expense of acquired intangible assets | | | 12,316 | | | | — | | | | — | |
Loss on disposal of assets | | | 19,672 | | | | — | | | | — | |
Insurance recovery (gain) | | | (20,098 | ) | | | — | | | | — | |
Operating income | | | 113,876 | | | | 265,130 | | | | 231,991 | |
Interest (expense), net | | | (38,647 | ) | | | (7,689 | ) | | | (15,760 | ) |
Other income, net | | | 551 | | | | 430 | | | | 2,631 | |
Income before income taxes | | | 75,780 | | | | 257,871 | | | | 218,862 | |
Income tax expense | | | 15,836 | | | | 31,378 | | | | 1,856 | |
Net income | | $ | 59,944 | | | $ | 226,493 | | | $ | 217,006 | |
Year Ended December 31, 2024 Compared To Year Ended December 31, 2023
Product sales. Product sales increased by $47.3 million to $515.4 million for the year ended December 31, 2024, as compared to $468.1 million for the year ended December 31, 2023. An increase in sales volume contributed a $379.8 million positive impact and a decrease in proppant prices between the periods contributed to a $345.6 million negative impact. There was $13.1 million in shortfall revenue for the year ended December 31, 2024, as compared to no shortfall revenue for the year ended December 31, 2023.
Service sales. Services sales, which includes freight for last-mile logistics services, increased by $394.7 million to $540.5 million for the year ended December 31, 2024, as compared to $145.8 million for the year ended December 31, 2023. The increase in logistics revenue was due to higher sales volumes shipped to last-mile logistics customers.
Cost of sales (excluding depreciation, depletion and accretion expense). Cost of sales (excluding depreciation, depletion and accretion expense) increased by $464.8 million to $725.2 million for the year ended December 31, 2024, as compared to $260.4 million for the year ended December 31, 2023.
Cost of sales (excluding depreciation, depletion and accretion) related to product sales increased by $130.9 million to $262.7 million for the year ended December 31, 2024, as compared to $131.8 million for the year ended December 31, 2023, due to increased production as well as $13.4 million of the cost related to additional temporary loadout equipment associated with the mechanical fire at the Kermit facility.
Cost of sales (excluding depreciation, depletion and accretion expense) related to services increased by $333.9 million to $462.5 million for the year ended December 31, 2024, as compared to $128.6 million for the year ended December 31, 2023, due to higher sales volumes shipped to last-mile logistics customers during the period as well as increased production.
Depreciation, depletion and accretion expense. Depreciation, depletion and accretion expense increased by $58.9 million to $98.7 million for the year ended December 31, 2024, as compared to $39.8 million for the year ended December 31, 2023. The increase in depreciation, depletion and accretion expense was due to additional depreciable assets placed into service when compared to the prior period.
Selling, general and administrative expense. Selling, general and administrative expense increased by $57.6 million to $106.2 million for the year ended December 31, 2024, as compared to $48.6 million for the year ended December 31, 2023. The increase was primarily due to an increase of $28.5 million of employee costs, including an increase of $15.0 million of stock- and unit-based compensation expense, $9.9 million of travel, sales and other corporate expenses associated with incremental costs incurred in conjunction with our acquisition of Hi-Crush, and $19.2 million of other acquisition related costs during the year ended December 31, 2024.
Our selling, general and administrative expense includes the non-cash expense for stock-based compensation expense for equity awards granted to our employees. For the year ended December 31, 2024, stock-based compensation expense was $22.4 million, as compared to $7.4 million of stock and unit-based compensation expense for the year ended December 31, 2023.
Amortization expense of acquired intangible assets. Amortization expense of acquired intangible assets is $12.3 million for the year ended December 31, 2024, due to the Hi-Crush Transaction. See Note 3 - Hi-Crush Transaction for more information. There was no amortization expense of acquired intangible assets for the year ended December 31, 2023.
Loss on disposal of assets. Loss on disposal of assets is $19.7 million for the year ended December 31, 2024, due to $11.1 million disposal of certain assets associated with mechanical fire at the Kermit facility and the $8.6 million disposal from the damaged dredge asset. See Note 1 - Business and Organization - Operational Updates for more information. There was no loss on disposal of assets for the year ended December 31, 2023.
Insurance recovery (gain). Insurance recovery is $20.1 million for the year ended December 31, 2024, due to an insurance claim associated with the mechanical fire. See Note 1 - Business and Organization - Operational Updates for more information. There was no insurance recovery for the year ended December 31, 2023.
Interest expense, net. Interest expense, net increased by $30.9 million to $38.6 million for the year ended December 31, 2024, as compared to $7.7 million for the year ended December 31, 2023. The increase was driven by the acquisition financing for the Hi-Crush Transaction, consisting of the ADDT Loan, Deferred Cash Consideration Note, and 2023 ABL Credit Facility.
Income tax expense. Income tax expense decreased by $15.6 million to $15.8 million for the year ended December 31, 2024, as compared to $31.4 million for the year ended December 31, 2023. The decrease is primarily due to a decrease in income before income taxes.
Year Ended December 31, 2023 Compared To Year Ended December 31, 2022
Product sales. Product sales increased by $59.7 million to $468.1 million for the year ended December 31, 2023, as compared to $408.4 million for the year ended December 31, 2022. An increase in proppant prices between the periods contributed to a $27.9 million positive impact and an increase in sales volume contributed a $31.8 million positive impact.
Service sales. Services sales, which includes freight for last-mile logistics services, increased by $71.5 million to $145.8 million for the year ended December 31, 2023, as compared to $74.3 million for the year ended December 31, 2022. The increase in logistics revenue was due to higher sales volumes shipped to last-mile logistics customers.
Cost of sales (excluding depreciation, depletion and accretion expense). Cost of sales (excluding depreciation, depletion and accretion expense) increased by $61.5 million to $260.4 million for the year ended December 31, 2023, as compared to $198.9 million for the year ended December 31, 2022.
Cost of sales (excluding depreciation, depletion and accretion) related to product sales increased by $1.0 million to $131.8 million for the year ended December 31, 2023, as compared to $130.8 million for the year ended December 31, 2022, due to higher sales volumes, which increased maintenance expense and mining costs.
Cost of sales (excluding depreciation, depletion and accretion expense) related to services increased by $60.5 million to $128.6 million for the year ended December 31, 2023, as compared to $68.1 million for the year ended December 31, 2022, due to higher sales volumes shipped to last-mile logistics customers during the period.
Depreciation, depletion and accretion expense. Depreciation, depletion and accretion expense increased by $12.3 million to $39.8 million for the year ended December 31, 2023, as compared to $27.5 million for the year ended December 31, 2022. The increase in depreciation, depletion and accretion expense was due to increased units of production depletion due to higher proppant production and additional depreciable assets placed into service when compared to the prior period.
Selling, general and administrative expense. Selling, general and administrative expense increased by $24.3 million to $48.6 million for the year ended December 31, 2023, as compared to $24.3 million for the year ended December 31, 2022. The increase was primarily due to an increase of $10.7 million of employee costs, including an increase of $6.7 million of stock- and unit-based compensation expense, $8.3 million of travel, sales and other corporate expenses associated with increased opportunities to conduct commercial business development efforts, incremental costs incurred in conjunction with our transition to a publicly traded company, and broadening sales efforts due to our substantial growth in the logistics space, and $5.3 million for non-recurring transaction costs related to the Up-C Simplification and the refinancing of the 2023 Term Loan Credit Facility during the year ended December 31, 2023.
Our selling, general and administrative expense includes the non-cash expense for stock- and unit-based compensation expense for equity awards granted to our employees. For the year ended December 31, 2023, unit-based compensation expense was $0.3 million and stock-based compensation expense was $7.1 million, as compared to $0.7 million of unit-based compensation expense and no stock-based compensation expense for the year ended December 31, 2022.
Interest expense, net. Interest expense, net decreased by $8.1 million to $7.7 million for the year ended December 31, 2023, as compared to $15.8 million for the year ended December 31, 2022. The decrease was driven by an increase in interest income of $9.8 million related to interest earned on net IPO proceeds.
Income tax expense. Income tax expense increased by $29.5 million to $31.4 million for the year ended December 31, 2023, as compared to $1.9 million for the year ended December 31, 2022. The increase was primarily due to Atlas Inc. incurring U.S. federal income taxes subsequent to our IPO-related reorganization in March of 2023.
Liquidity and Capital Resources
Overview
Our primary sources of liquidity to date have been capital contributions from our owners, cash flows from operations, and borrowings under our previous term loan credit facilities, and our previous asset-based loan credit facilities. Going forward, we expect our primary sources of liquidity to be cash flows from operations, availability under our 2023 ABL Credit Facility as amended, borrowings under our 2025 Term Loan Credit Facility, or any other credit facility we enter into in the future and proceeds from any future issuances of debt or equity securities. We expect our primary use of capital will be used for the payment of any dividends to our stockholders and for investing in our business, specifically for acquisition of fit-for-purpose equipment for our trucking fleet used in our logistics platform, and power-related growth capital expenditures following the completion of the Moser Acquisition. In addition, we have routine facility upgrades and additional ancillary capital expenditures associated with, among other things, contractual obligations and working capital obligations.
As of December 31, 2024, we had working capital, defined as current assets less current liabilities, of $46.4 million, $54.8 million of availability under the 2023 ABL Credit Facility, and $80.0 million of DDT Loan. Our cash and cash equivalents totaled $71.7 million.
Cash Flow
The following table summarizes our cash flow for the periods indicated:
| | | | | | | | | | | | |
| | For the Year Ended | |
| | December 31 | |
| | 2024 | | | 2023 | | | 2022 | |
| | (In thousands) | |
Consolidated Statement of Cash Flow Data: | | | | | | | | | |
Net cash provided by operating activities | | $ | 256,460 | | | $ | 299,027 | | | $ | 206,012 | |
Net cash used in investing activities | | | (512,708 | ) | | | (365,486 | ) | | | (89,592 | ) |
Net cash provided by (used in) financing activities | | | 117,778 | | | | 194,623 | | | | (74,811 | ) |
Net increase (decrease) in cash | | $ | (138,470 | ) | | $ | 128,164 | | | $ | 41,609 | |
Year Ended December 31, 2024 Compared To The Year Ended December 31, 2023
Net Cash Provided by Operating Activities. Net cash provided by operating activities was $256.5 million and $299.0 million for the years ended December 31, 2024 and 2023, respectively. The decrease was primarily attributable to increased cost of sales (excluding depreciation, depletion and accretion expense) of $464.8 million, offset by increased revenues of $442.0 million.
Net Cash Used in Investing Activities. Net cash used in investing activities was $512.7 million and $365.5 million for the years ended December 31, 2024 and 2023, respectively. The increase is primarily attributable to $153.4 million spent on the Hi-Crush Transaction as well as capital spending at the Kermit facilities, Monahans facility, OnCore distributed mining network, Dune Express, and logistics asset during the year ended December 31, 2024, when compared to the year ended December 31, 2023.
Net Cash Provided by (Used in) Financing Activities. Net cash provided by financing activities was $117.8 million and $194.6 million for the years ended December 31, 2024 and 2023, respectively. This decrease is primarily related to $303.4 million of initial IPO proceeds raised during the year ended December 31, 2023. This was offset by an increase of $238.5 million of net proceeds from borrowings during the year ended December 31, 2024 compared to the year ended December 31, 2023.
Year Ended December 31, 2023 Compared To The Year Ended December 31, 2022
Net Cash Provided by Operating Activities. Net cash provided by operating activities was $299.0 million and $206.0 million for the years ended December 31, 2023 and 2022, respectively. The increase was attributable to increased revenues of $131.2 million, offset by a $61.5 million increase in cost of sales (excluding depreciation, depletion and accretion expense) and a $34.8 million increase in cash from changes in working capital primarily attributable to a decrease in our accounts receivable balance from December 31, 2022 to December 31, 2023.
Net Cash Used in Investing Activities. Net cash used in investing activities was $365.5 million and $89.6 million for the years ended December 31, 2023 and 2022, respectively. The increase was due to an increase in capital spending in connection with the Dune Express, plant capacity expansion at our Kermit location, and logistics assets during the year ended December 31, 2023, when compared to the year ended December 31, 2022.
Net Cash Provided by (Used in) Financing Activities. Net cash provided by financing activities was $194.6 million and net cash used in financing activities was $74.8 million for the years ended December 31, 2023 and 2022, respectively. The increase is primarily due to cash inflows of $303.4 million from net IPO proceeds during the year ended December 31, 2023. This was offset by an increase of cash outflows of $32.1 million of dividends and distributions during the year ended December 31, 2023 compared to the year ended December 31, 2022.
Capital Requirements
Our primary growth and technology initiatives include continued acquisition of fit-for-purpose equipment for our trucking fleet. Outside of our growth and technology initiatives, our business is not presently capital intensive in nature and only requires the maintenance of our facilities. In addition to capital expenditures, we have certain contractual long-term capital requirements associated with our lease and royalty payments and debt. See Note 8 - Leases, Note 9 - Debt and Note 10 - Commitments and Contingencies of the Financial Statements included elsewhere in this Annual Report. Our current level of maintenance capital expenditures is expected to remain within our cash on hand and internally generated cash flow.
We intend to fund our capital requirements through our primary sources of liquidity, which include cash on hand and cash flows from operations and, if needed, availability under our 2023 ABL Credit Facility and borrowings under our 2025 Term Loan Credit Facility.
Debt Agreements
Deferred Cash Consideration Note
In accordance with the Hi-Crush Merger Agreement, the Company issued the Deferred Cash Consideration Note in favor of the Hi-Crush Stockholders in the aggregate principal amount of $111.3 million, as of December 31, 2024. The Deferred Cash Consideration Note was part of the consideration transferred and valued at fair value at the acquisition date, which is subject to purchase price adjustments as defined in the Hi-Crush Merger Agreement and payable in cash or in kind, at Atlas LLC’s election. The Deferred Cash Consideration Note will mature on January 31, 2026 and bears interest at a rate of 5.00% per annum if paid in cash, or 7.00% per annum if paid in kind. Interest on the Deferred Cash Consideration Note is payable quarterly in arrears beginning March 29, 2024 through maturity. Interest expense associated with the Deferred Cash Consideration Note was $4.6 million for the year ended December 31, 2024.
The Deferred Cash Consideration Note included $4.6 million of debt discount and approximately $0.1 million deferred financing costs. The discount and deferred financing costs are a direct reduction from the carrying amount of the debt obligation on the Company’s consolidated balance sheets and are amortized to interest expense using the effective interest method. Interest expense associated with the discount and deferred financing costs were approximately $2.0 million in total for the year ended December 31, 2024.
Atlas LLC’s obligations under the Deferred Cash Consideration Note are secured by certain of the assets acquired in connection with the Hi-Crush Transaction. The Deferred Cash Consideration Note is also unconditionally guaranteed by Atlas LLC on an unsecured basis.
2023 Term Loan Credit Facility
On July 31, 2023, Atlas LLC entered into the 2023 Term Loan Credit Agreement with Stonebriar, as administrative agent and initial lender, pursuant to which Stonebriar extended Atlas LLC a term loan credit facility comprised of a $180.0 million Initial Term Loan that was made on July 31, 2023 and commitments to provide up to $100.0 million of DDT Loan.
The Initial Term Loan is payable in 84 consecutive monthly installments and a final payment of the remaining outstanding principal balance at maturity. The Initial Term Loan has a final maturity date of July 31, 2030 (the “Maturity Date”) and bears interest at a rate equal to 9.50% per annum. Interest expense associated with the Initial Term Loan was $17.1 million and $7.1 million for years ended December 31, 2024 and 2023, respectively, and the interest expense associated with the discount and deferred financing costs was $1.3 million and $0.5 million for the years ended December 31, 2024 and 2023, respectively.
Each DDT Loan under the 2023 Term Loan Credit Facility will be payable in equal monthly installments, with the monthly installments comprising 80% of the DDT Loan and a final payment of the remaining 20% of the outstanding principal balance due at maturity, unless earlier prepaid. The DDT Loan will bear interest at a rate equal to the applicable Term Secured Overnight Financing Rate (“SOFR”) as of each Delayed Draw Funding Date (each as defined in the 2023 Term Loan Credit Agreement) plus 5.95% per annum. All monthly installments with respect to the Initial Term Loan and the DDT Loan payable on or prior to January 1, 2025 will be interest only.
On November 8, 2024, the Company drew down $20.0 million of the available $100.0 million from Stonebriar under the DDT Loan with interest (computed on the basis of a 365-day year for the actual number of days elapsed) on the unpaid principal amount hereof from and including the date hereof until paid in full at the rate per annum equal to 10.58%. This DDT Loan shall be payable in 69 consecutive monthly installments commencing on December 1, 2024 and continuing on each Payment Day up to and including August 1, 2030 and then a final installment also payable on August 1, 2030. The Company had interest expense of $0.3 million for the year ended December 31, 2024. The DDT Loan included de minimis financing costs.
At any time prior to the Maturity Date, Atlas LLC may redeem loans outstanding under the 2023 Term Loan Credit Facility, in whole or in part, at a price equal to 100% of the principal amount being prepaid (the “Prepayment Amount”) plus a prepayment fee. The prepayment fee is equal to 8% of the Prepayment Amount for any prepayment that occurs on or prior to December 31, 2024, 4% of the Prepayment Amount for any prepayment that occurs after December 31, 2024 but on or prior to December 31, 2025, 3% of the Prepayment Amount for any prepayment that occurs after December 31, 2025 but on or prior to December 31, 2026 and 2% of the Prepayment Amount for any prepayment that occurs thereafter. Upon the maturity of the 2023 Term Loan Credit Facility, the entire unpaid principal amount of the loans outstanding thereunder, together with interest, fees and other amounts payable in connection with the facility, will be immediately due and payable without further notice or demand.
Dividends and distributions to equity holders are permitted to be made pursuant to certain limited exceptions and baskets described in the 2023 Term Loan Credit Agreement and otherwise generally subject to certain restrictions set forth in the 2023 Term Loan Credit Agreement, including the requirements that (a) no Event of Default (as defined under the 2023 Term Loan Credit Agreement) has occurred and is continuing and (b) Atlas LLC maintains at least $30.0 million of Liquidity (as defined under the 2023 Term Loan Credit Agreement) pro forma for the Restricted Payment (as defined under the 2023 Term Loan Credit Agreement).
The 2023 Term Loan Credit Facility includes certain non-financial covenants, including but not limited to restrictions on incurring additional debt and certain distributions. The 2023 Term Loan Credit Facility is subject to a maximum 4.0 to 1.0 Leverage Ratio (as defined in the 2023 Term Loan Credit Agreement) financial covenant. Such financial covenant is tested as of the last day of each fiscal quarter.
Proceeds from the 2023 Term Loan Credit Facility were used to repay outstanding indebtedness under our previous 2021 Term Loan Credit Facility with Stonebriar, to repay obligations outstanding under certain equipment lease arrangements with Stonebriar and for general corporate purposes. As of December 31, 2024, Atlas LLC was in compliance with the covenants of the 2023 Term Loan Credit Facility.
The 2023 Term Loan Credit Facility is unconditionally guaranteed, jointly and severally, by Atlas LLC and its subsidiaries and secured by substantially all of the assets of Atlas LLC and its subsidiaries. The 2023 Term Loan Credit Facility is unconditionally guaranteed on an unsecured basis by Atlas Energy Solutions Inc.
First Amendment to the 2023 Term Loan Credit Agreement
On February 26, 2024, the Company, Atlas LLC and certain other subsidiaries of the Company entered into the Term Loan Amendment.
The Term Loan Amendment provided the ADDT Loan in the aggregate principal amount of $150.0 million with interest (computed on the basis of a 365-day year for the actual number of days elapsed) on the unpaid principal amount thereof from and including the date of the amendment until paid in full at the rate per annum equal to 10.86%. The ADDT Loan is payable in 76 consecutive monthly installments of combined principal and interest each in the amount of $2.7 million commencing April 1, 2024 and continuing up to and including August 1, 2030. There was interest expense of $13.0 million the year ended December 31, 2024.
The ADDT Loan included $1.5 million of debt discount and $0.5 million in deferred financing costs. The discount and deferred financing costs are a direct reduction from the carrying amount of the debt obligation on the Company’s consolidated balance sheets and are amortized to interest expense using the effective interest method. Interest expense associated with the discount and deferred financing costs were $0.4 million in total for the year ended December 31, 2024.
2023 ABL Credit Facility
On February 22, 2023, Atlas LLC, certain of its subsidiaries, as guarantors, Bank of America, N.A., as agent, and certain financial institutions party thereto as lenders (the “2023 ABL Lenders”) entered into the 2023 ABL Credit Agreement pursuant to which the ABL Lenders provide revolving credit financing to the Company in an aggregate principal amount of up to $75.0 million, with Availability (as defined in the 2023 ABL Credit Agreement) thereunder subject to a “Borrowing Base” as described in the 2023 ABL Credit Agreement. The 2023 ABL Credit Facility includes a letter of credit sub-facility, which permits issuances of letters of credit up to an aggregate amount of $25.0 million. The scheduled maturity date of the 2023 ABL Credit Facility is February 22, 2028; provided that the 2023 ABL Credit Facility will mature on June 30, 2027 if any amount of the 2023 Term Loan Credit Facility that has a maturity date less than 91 days prior to February 22, 2028 is outstanding on June 30, 2027.
Atlas LLC may also request swingline loans under the 2023 ABL Credit Agreement in an aggregate principal amount not to exceed $7.5 million. During the years ended December 31, 2024 and 2023, Atlas LLC had no outstanding swingline loans under the 2023 ABL Credit Facility.
Borrowings under the 2023 ABL Credit Facility bear interest, at Atlas LLC’s option, at either a base rate or Term SOFR (as defined in the 2023 ABL Credit Agreement), as applicable, plus an applicable margin based on average availability as set forth in the 2023 ABL Credit Agreement. Term SOFR loans bear interest at Term SOFR for the applicable interest period plus an applicable margin, which ranges from 1.50% to 2.00% per annum based on average availability as set forth in the 2023 ABL Credit Agreement. Base rate loans bear interest at the applicable base rate, plus an applicable margin, which ranges from 0.50% to 1.00% per annum based on average availability as set forth in the 2023 ABL Credit Agreement. In addition to paying interest on outstanding principal under the 2023 ABL Credit Facility, Atlas LLC is required to pay a commitment fee which ranges from 0.375% per annum to 0.500% per annum with respect to the unutilized commitments under the 2023 ABL Credit Facility, based on the average utilization of the 2023 ABL Credit Facility. Atlas LLC is also required to pay customary letter of credit fees, to the extent that one or more letter of credit is outstanding. For the years ended December 31, 2024 and 2023, we recognized $0.4 million and $0.3 million, respectively, of interest expense, unutilized commitment fees and other fees under the 2023 ABL Credit Facility, classified as interest expense.
The Borrowing Base was initially set at $75.0 million and the amount of available credit changes every month, depending on the amount of eligible accounts receivable and inventory we have available to serve as collateral. With the ABL Amendment, discussed below, the Borrowing Base increased to $125.0 million. The Borrowing Base components are subject to customary reserves and eligibility criteria.
On March 5, 2024 and November 12, 2024, the Company drew down $50.0 million and $20.0 million, respectively, under the 2023 ABL Credit Facility for general corporate purposes. There was interest expense of $3.2 million for the year ended December 31, 2024. The draw included $0.3 million in debt issuance costs and $0.3 million in deferred financing costs. These costs are recorded under other long-term assets on the consolidated balance sheets and are amortized on a straight-line basis over the life of the agreement. Interest expense associated with the amortization of these costs was $0.3 million for the year ended December 31, 2024.
As of December 31, 2024, Atlas LLC had $70.0 million in outstanding borrowings and $0.2 million in outstanding letters of credit under the 2023 ABL Credit Facility. Additionally, as of December 31, 2024, the Borrowing Base was $125.0 million and Availability was $54.8 million.
The 2023 ABL Credit Facility requires that if Availability is less than the greater of (i) 12.50% of the Borrowing Base and (ii) $7.5 million, Atlas LLC must maintain a Fixed Charge Coverage Ratio (as defined in the 2023 ABL Credit Agreement) of at least 1.00 to 1.00 while a Covenant Trigger Period (as defined in the 2023 ABL Credit Agreement) is in effect.
Under the 2023 ABL Credit Agreement, Atlas LLC is permitted to make payments of dividends and distributions pursuant to certain limited exceptions and baskets set forth therein and otherwise generally subject to certain restrictions described therein, including that (i) no Event of Default (as defined under the 2023 ABL Credit Agreement) has occurred and is continuing, and (ii) no loans and no more than $7.5 million in letters of credit that have not been cash collateralized are outstanding, and liquidity exceeds $30.0 million at all times during the 30 days prior to the date of the dividend or distribution; provided that if any loans are outstanding or outstanding letters of credit exceed $7.5 million and no Event of Default has occurred and is continuing, then Atlas LLC is permitted to make payments of dividends and distributions if, (i) Availability (as defined under the 2023 ABL Credit Agreement) is higher than the greater of (a) $12 million and (b) 20% of the pro forma Borrowing Base then in effect and during the 30 days prior to the date of the dividend or distribution as if such dividend or distribution had been made at the beginning of such period, or if (ii) (a) Availability is higher than the greater of (x) $9 million and (y) 15% of the pro forma Borrowing Base then in effect and during the 30 days prior to the date of the dividend or distributions as if such dividend or distribution had been made at the beginning of such period and (b) the Fixed Charge Coverage Ratio (as defined under the 2023 ABL Credit Agreement), as calculated on a pro forma basis, is greater than 1.00 to 1.00, as provided under the 2023 ABL Credit Agreement. Additionally, Atlas LLC may make additional payments of dividends and distributions in qualified equity interests and may make Permitted Tax Distributions (as defined under the 2023 ABL Credit Agreement).
The 2023 ABL Credit Facility contains certain customary representations and warranties, affirmative and negative covenants, and events of default. As of December 31, 2024, the Company was in compliance with the covenants under the 2023 ABL Credit Facility.
The 2023 ABL Credit Facility is unconditionally guaranteed, jointly and severally, by Atlas LLC and its subsidiaries and secured by substantially all of the assets of Atlas LLC and its subsidiaries.
First Amendment to the 2023 ABL Credit Agreement
On February 26, 2024, Atlas LLC and certain other subsidiaries of the Company entered into the ABL Amendment, among Atlas LLC, the subsidiary guarantors party thereto, the lenders party thereto and the ABL Agent, which amends the 2023 ABL Credit Agreement.
The ABL Amendment increased the revolving credit commitment to $125.0 million. The existing lenders increased their commitment by $25.0 million which resulted in a debt modification under ASC 470, “Debt.” The ABL Amendment also added a new lender with a $25.0 million commitment, thus creating a new debt arrangement under ASC 470, “Debt.” The deferred financing costs and debt issuance cost will be amortized on a prospective basis over the term of the agreement. The maturity date of the ABL Credit Agreement was extended from February 22, 2028 to the earliest of (a) February 26, 2029; (b) the date that is 91 days prior to the maturity date for any portion of the Term Loan Debt; or (c) any date on which the aggregate Commitments terminate hereunder.
The ABL Amendment requires that if Availability is less than the greater of (i) 12.50% of the Borrowing Base and (ii) $12.5 million, Atlas LLC must maintain a Fixed Charge Coverage Ratio (as defined in the 2023 ABL Credit Agreement) of at least 1.00 to 1.00 while a Covenant Trigger Period (as defined in the 2023 ABL Credit Agreement) is in effect.
Under the ABL Amendment, Atlas LLC is permitted to make payments of dividends and distributions pursuant to certain limited exceptions and baskets set forth therein and otherwise generally subject to certain restrictions described therein, including that (i) no Event of Default (as defined in the 2023 ABL Credit Agreement) has occurred and is continuing, and (ii) no loans and no more than $7.5 million in letters of credit that have not been cash collateralized are outstanding, and liquidity exceeds $30.0 million at all times during the 30 days prior to the date of the dividend or distribution; provided that if any loans are outstanding or outstanding letters of credit exceed $7.5 million and no Event of Default has occurred and is continuing, then Atlas LLC is permitted to make payments of dividends and distributions if, (i) Specified Availability (as defined under the 2023 ABL Credit Agreement) is higher than the greater of (a) $20.0 million and (b) 20% of the pro forma Borrowing Base then in effect and during the 30 days prior to the date of the dividend or distribution as if such dividend or distribution had been made at the beginning of such period, or if (ii) (a) Specified Availability is higher than the greater of (x) $15.0 million and (y) 15% of the pro forma Borrowing Base then in effect and during the 30 days prior to the date of the dividend or distributions as if such dividend or distribution had been made at the beginning of such period and (b) the Fixed Charge Coverage Ratio (as defined under the 2023 ABL Credit Agreement), as calculated on a pro forma basis, is greater than 1.00 to 1.00, as provided under the 2023 ABL Credit Agreement. Additionally, Atlas LLC may make additional payments of dividends and distributions in qualified equity interests and may make Permitted Tax Distributions (as defined under the 2023 ABL Credit Agreement).
2021 Term Loan Credit Facility
Prior to entering into the 2023 Term Loan Credit Facility, the Company had borrowings and accrued interest of $133.4 million under the 2021 Term Loan Credit Facility. On July 31, 2023, the Company entered into the 2023 Term Loan Credit Facility. Proceeds from the 2023 Term Loan Credit Facility were used to repay $133.4 million of 2021 Term Loan Credit Facility principal and accrued interest, repay $42.8 million of finance lease liabilities as well as acquire $39.5 million of finance lease assets associated with certain equipment lease arrangements with Stonebriar.
Other Indebtedness
The Company has other indebtedness of $4.1 million of equipment finance notes as of December 31, 2024. There was de minimis interest expense for the year ended December 31, 2024. These equipment finance notes have terms ending in January 2025 through December 2029 and interest rates ranging from 1.99% to 8.45%. There was no other Indebtedness and associated interest expense as of year ended December 31, 2023.
Off Balance Sheet Arrangements
We currently have no material off-balance sheet arrangements.
Critical Accounting Policies and Estimates
The preparation of financial statements requires the use of judgments and estimates. Our critical accounting policies are described below to provide a better understanding of how we develop our assumptions and judgments about future events and related estimates and how they can impact our Financial Statements. A critical accounting estimate is one that requires our most difficult, subjective or complex estimates and assessments and is fundamental to our results of operations.
We base our estimates on historical experience and on various other assumptions we believe to be reasonable according to the current facts and circumstances, the results of which form the basis for making judgments about the carrying values of assets and liabilities that are not readily apparent from other sources. A summary of our significant accounting policies is included in Note 2 - Summary of Significant Accounting Policies to the Financial Statements included elsewhere in this Annual Report.
We prepare our Financial Statements in conformity with GAAP, which require us to make estimates and assumptions about future events that affect the amounts reported in the Financial Statements and accompanying footnotes. Actual results could differ from those estimates. We believe that the following discussion addresses our most critical accounting estimates, which require management’s most subjective and complex judgments.
Property, Plant and Equipment, Including Depreciation and Depletion
In order to calculate depreciation of our fixed assets, other than plant facilities and mine development costs, we use the best estimated useful lives at the time the asset is placed into service.
Mining property and development costs, including plant facilities directly associated with mining properties, are amortized using the units of production method on estimated measures of tons of in-place reserves. The impact to reserve estimates is recognized on a prospective basis. Drilling and related costs are capitalized for deposits where proven and probable reserves exist. These activities are directed at obtaining additional information on the deposit or converting non-reserve minerals to proven and probable reserves, with the benefit being realized over a period greater than one year. At a minimum, we will assess the useful lives and residual values of all long-lived assets on an annual basis to determine if adjustments are required. The actual reserve life may differ from the assumptions we have made about the estimated reserve life.
We evaluate long‑lived assets for potential impairment indicators whenever events or changes in circumstances indicate that the carrying amount of an asset may not be recoverable. If such a review should indicate that the carrying amount of long-lived assets is not recoverable, the Company will reduce the carrying amount of such assets to fair value.
Emerging Growth Company Status
Prior to December 31, 2024, we were an “emerging growth company” under the JOBS ACT definition, which allowed us to have an extended transition period for complying with new or revised accounting standards pursuant to Section 107(b) of the JOBS Act. We became a large accelerated filer as of December 31, 2024 and are consequently no longer an emerging growth company as of that date and for purposes of filing this Annual Report. Therefore, we are no longer able to use the extended transition period for complying with new or revised accounting standards available to emerging growth companies and we are required to adopt new or revised accounting standards as of the effective dates for public companies. All new accounting pronouncements recently adopted are discussed in Note 2 - Summary of Significant Accounting Policies to the accompanying Financial Statements included elsewhere in this Annual Report.
Business Combinations
We allocate the purchase price of any business we acquire to the identifiable assets acquired and liabilities assumed based on their estimated fair values. Any excess purchase price over the fair value of the net identifiable assets acquired is recorded as goodwill. We use all available information to estimate fair values, including quoted market prices, the carrying value of acquired assets and assumed liabilities and valuation techniques such as discounted cash flows, relief-from-royalty method, with or without method, or multi-period excess earnings method. We engage third-party appraisal firms to assist in the fair value determination of identifiable long-lived assets, identifiable intangible assets, as well as any contingent consideration that provides for additional consideration to be paid to the seller if certain future conditions are met. These estimates are reviewed during the 12-month measurement period and adjusted as soon as the necessary information becomes available but no later than one year from the acquisition date. The judgments made in determining the estimated fair value assigned to each class of assets acquired and liabilities assumed, as well as asset lives, can materially impact our financial condition or results of operations. The purchase price in the Hi-Crush Transaction included a holdback, which was measured at fair value. The holdback was subject to changes from estimated to actual net working capital amounts and other customary purchase price adjustments. This amount was paid as of the year ended December 31, 2024. For further discussion on our recently completed acquisition of Hi-Crush, see Note 3 - Hi-Crush Transaction, to the accompanying Financial Statements included elsewhere in this Annual Report.
Valuation of Goodwill and Acquired Intangible Assets
We assess our goodwill for impairment annually, or whenever events or circumstances indicate that the carrying amount of goodwill may not be recoverable. We determine whether it is more likely than not that the fair value of a reporting unit is less than its carrying value after considering qualitative, market and other factors. If it is necessary to perform the quantitative assessment to determine if our goodwill is impaired, the fair value is determined using significant unobservable inputs, or level 3 in the fair value hierarchy. If the carrying amount exceeds the fair value, an impairment loss is recognized in the current period in an amount equal to the excess.
The expected future cash flows used for impairment reviews and related fair value calculations are based on subjective, judgmental assessments of projected revenue growth, pricing, gross profit rates, SG&A rates, working capital fluctuations, capital expenditures, discount rates and terminal growth rates. The acquired definite-lived intangible assets are evaluated for impairment when events or changes in circumstances indicate that the carrying amount of an asset may not be recoverable. For further discussion on our recently completed acquisition, see Note 4 - Goodwill and Acquired Intangible Assets, to the accompanying Financial Statements included elsewhere in this Annual Report.
Recent Accounting Pronouncements
See Note 2 - Summary of Significant Accounting Policies in the notes to our Financial Statements for further discussion regarding recently issued accounting standards.
Item 7A. Quantitative and Qualitative Disclosures About Market Risk.
Commodity Price Risks
The market for our services is indirectly exposed to fluctuations in the price of crude oil and natural gas, to the extent such fluctuations impact drilling and completion activity levels and thus impact the activity levels of our customers in the exploration and production and oilfield services industries. We do not currently intend to hedge our indirect exposure to commodity price risk.
Our natural gas purchases expose us to commodity price risk. Our facility operations require natural gas consumption for equipment used in the manufacturing of proppant. Pricing for natural gas has been volatile and unpredictable for several years, and this volatility is expected to continue in the future. The cost we pay for our natural gas depends on many factors outside of our control, such as the strength of the global economy and global supply and demand for the commodities we produce. To reduce the impact of fluctuations in natural gas prices on our operational costs, we periodically enter into commodity derivative contracts with respect to certain of our forecasted natural gas usage through various transactions that reduce the impact of price volatility. For the years ended December 31, 2024 and 2023, we did not have derivatives. In the future, we will consider entering into such transactions to reduce the impact of commodity price volatility on our cash flow from operations.
Interest Rate Risks
We are subject to interest rate risk on a portion of our long-term debt under the 2023 ABL Credit Facility. The amounts owed under our 2023 ABL Credit Facility use SOFR as a benchmark for establishing the rate at which interest accrues. As of December 31, 2024, we had $70.0 million of debt outstanding under the 2023 ABL Credit Facility. The applicable margin on the borrowing ranges from 0.75% to 1.75% plus the base rate of three month SOFR plus 0.10%. If interest rates increase significantly in the future, our exposure to interest rate risk will increase. As of December 31, 2024, a hypothetical 1.0% increase or decrease in interest rates would increase or decrease our annual interest expense under the 2023 ABL Credit Facility by approximately $0.4 million. We do not currently have or intend to enter into any derivative arrangements to protect against fluctuations in interest rates applicable to our outstanding indebtedness.
Market Risks
The demand, pricing and terms for proppant and logistics services provided by us are largely dependent upon the level of drilling activity in the oil and natural gas industry in the Permian Basin. These activity levels are influenced by numerous factors over which we have no control, including, but not limited to: the supply of and demand for oil and natural gas; the level of prices, and expectations about future prices of oil and natural gas; the cost of exploring for, developing, producing and delivering oil and natural gas; the expected rates of declining current production; the discovery rates of new oil and natural gas reserves; available rail and other transportation capacity; weather conditions; domestic and worldwide economic conditions; political instability in oil-producing countries; environmental regulations; technical advances affecting energy consumption; the price and availability of alternative fuels; the ability of oil and natural gas companies to raise equity capital and debt financing; and merger and divestiture activity among oil and natural gas companies.
The level of U.S. oil and natural gas drilling is volatile. Expected trends in oil and natural gas production activities may not materialize and demand for our services may not reflect the level of activity in the industry. Any prolonged and substantial reduction in oil and natural gas prices would likely affect oil and natural gas production levels and therefore affect demand for our services. A material decline in oil and natural gas prices or Permian Basin activity levels could have an adverse effect on our business, financial condition, results of operations and cash flows.
Credit Risks
We are subject to risks of loss resulting from nonpayment or nonperformance by our customers. We examine the creditworthiness of third-party customers to whom we extend credit and manage our exposure to credit risk through credit analysis, credit approval, credit limits and monitoring procedures, and for certain transactions, we may request letters of credit, prepayments or guarantees, although collateral is generally not required. For the year ended December 31, 2024, we had 49 customers, of which 10 were investment grade. For the year ended December 31, 2023, we had 33 customers, of which six were investment grade. We perform ongoing credit evaluations of our customers and provide allowances for probable credit losses when necessary. As of December 31, 2024 and December 31, 2023, we had $0.3 million and de minimis in allowance for credit losses, respectively.
Inflation Risks
Inflationary factors such as increases in the cost of our products and overhead costs may adversely affect our results of operations. Although we do not believe that inflation has had a material impact on our financial position or results of operations to date, a high rate of inflation in the future may have an adverse effect on our ability to maintain current levels of gross margin and selling, general and administrative expenses as a percentage of net revenue if the selling prices of our products do not increase with these increased costs.
Item 8. Financial Statements and Supplementary Data.
The following Consolidated Financial Statements are filed as part of this Annual Report:
Atlas Energy Solutions Inc.
Report of Independent Registered Public Accounting Firm
To the Stockholders and the Board of Directors of Atlas Energy Solutions Inc.
Opinion on the Financial Statements
We have audited the accompanying consolidated balance sheets of Atlas Energy Solutions Inc. (the Company) as of December 31, 2024 and 2023, the related consolidated statements of operations, stockholders' and members' equity and redeemable noncontrolling interest and cash flows for each of the three years in the period ended December 31, 2024, and the related notes (collectively referred to as the “consolidated financial statements”). In our opinion, the consolidated financial statements present fairly, in all material respects, the financial position of the Company at December 31, 2024 and 2023, and the results of its operations and its cash flows for each of the three years in the period ended December 31, 2024, in conformity with U.S. generally accepted accounting principles.
We also have audited, in accordance with the standards of the Public Company Accounting Oversight Board (United States) (PCAOB), the Company’s internal control over financial reporting as of December 31, 2024, based on criteria established in Internal Control—Integrated Framework issued by the Committee of Sponsoring Organizations of the Treadway Commission (2013 framework), and our report dated February 25, 2025 expressed an adverse opinion thereon.
Basis for Opinion
These financial statements are the responsibility of the Company’s management. Our responsibility is to express an opinion on the Company’s financial statements based on our audits. We are a public accounting firm registered with the PCAOB and are required to be independent with respect to the Company in accordance with the U.S. federal securities laws and the applicable rules and regulations of the Securities and Exchange Commission and the PCAOB.
We conducted our audits in accordance with the standards of the PCAOB. Those standards require that we plan and perform the audit to obtain reasonable assurance about whether the financial statements are free of material misstatement, whether due to error or fraud. Our audits included performing procedures to assess the risks of material misstatement of the financial statements, whether due to error or fraud, and performing procedures that respond to those risks. Such procedures included examining, on a test basis, evidence regarding the amounts and disclosures in the financial statements. Our audits also included evaluating the accounting principles used and significant estimates made by management, as well as evaluating the overall presentation of the financial statements. We believe that our audits provide a reasonable basis for our opinion.
Critical Audit Matter
The critical audit matter communicated below is a matter arising from the current period audit of the financial statements that were communicated or required to be communicated to the audit committee and that: (1) relates to accounts or disclosures that are material to the financial statements and (2) involved our especially challenging, subjective or complex judgments. The communication of the critical audit matter does not alter in any way our opinion on the consolidated financial statements, taken as a whole, and we are not, by communicating the critical audit matter below, providing a separate opinion on the critical audit matter or on the accounts or disclosures to which it relates.
Accounting for Business Combinations
| | |
Description of the Matter | | As disclosed in Note 3 of the consolidated financial statements, the Company completed the acquisition of Hi-Crush during 2024 for total consideration of $456.1 million. The transaction was accounted for as a business combination. Auditing the Company's accounting for its acquisition of Hi-Crush was complex due to the significant estimation required by management to determine the fair value of the customer relationships intangible asset acquired. The Company used the income approach, through a discounted cash flow model, in estimating the initial fair value of the acquired customer relationships intangible asset. The customer relationships intangible asset valuation incorporated various estimates and assumptions, the most significant of which was the revenue growth assumption. There was a high degree of subjective auditor judgment in evaluating this assumption used in the valuation as changes to this assumption used could have a significant effect on the determination of the initial fair value. The revenue growth assumption is forward-looking and could be affected by future economic and market conditions. |
How We Addressed the Matter in Our Audit | | To test the estimated fair value of the customer relationships intangible asset, we performed audit procedures that included, among others, evaluating the Company's use of the income approach and testing the key assumption discussed above and the completeness and accuracy of the underlying data used by the Company in its analysis. In addition, we assessed the reasonableness of the revenue growth assumption by identifying and evaluating corroborative and contrary evidence. We involved our valuation specialists to assist in evaluating the appropriateness of the valuation method and the reasonableness of the key assumption discussed above. |
/s/ Ernst & Young LLP
We have served as the Company’s auditor since 2017.
Austin, Texas
February 25, 2025
Atlas Energy Solutions Inc.
Consolidated Balance Sheets
(In thousands, except share data)
| | | | | | | | |
| | December 31, | | | December 31, | |
| | 2024 | | | 2023 | |
| | | | | | |
Assets | | | | | | |
Current assets: | | | | | | |
Cash and cash equivalents | | $ | 71,704 | | | $ | 210,174 | |
Accounts receivable, net | | | 165,967 | | | | 71,170 | |
Inventories | | | 17,302 | | | | 6,449 | |
Spare part inventories, net | | | 23,248 | | | | 15,408 | |
Prepaid expenses and other current assets | | | 11,197 | | | | 15,485 | |
Total current assets | | | 289,418 | | | | 318,686 | |
Property, plant and equipment, net | | | 1,486,246 | | | | 934,660 | |
Operating lease right-of-use assets | | | 13,632 | | | | 3,727 | |
Finance lease right-of-use assets | | | 5,034 | | | | 424 | |
Goodwill | | | 68,999 | | | | — | |
Intangible assets, net | | | 105,867 | | | | 1,767 | |
Other long-term assets | | | 3,456 | | | | 2,422 | |
Total assets | | $ | 1,972,652 | | | $ | 1,261,686 | |
Liabilities and stockholders' equity | | | | | | |
Current liabilities: | | | | | | |
Accounts payable | | $ | 119,018 | | | $ | 60,882 | |
Accounts payable - related parties | | | 226 | | | | 277 | |
Accrued liabilities | | | 60,294 | | | | 28,458 | |
Current portion of long-term debt | | | 43,736 | | | | — | |
Current portion of operating lease liabilities | | | 6,622 | | | | 1,249 | |
Current portion of finance lease liabilities | | | 2,811 | | | | 158 | |
Current portion of deferred revenue | | | 7,755 | | | | — | |
Other current liabilities | | | 2,603 | | | | 1,568 | |
Total current liabilities | | | 243,065 | | | | 92,592 | |
Long-term debt, net of discount and deferred financing costs | | | 466,989 | | | | 172,820 | |
Deferred tax liabilities | | | 206,872 | | | | 121,529 | |
Operating lease liabilities | | | 7,454 | | | | 3,498 | |
Finance lease liabilities | | | 2,483 | | | | 264 | |
Asset retirement obligation | | | 7,040 | | | | 2,705 | |
Other long-term liabilities | | | 2,193 | | | | 454 | |
Total liabilities | | | 936,096 | | | | 393,862 | |
Commitments and contingencies (Note 10) | | | | | | |
Stockholders’ equity: | | | | | | |
Preferred stock, $0.01 par value; 500,000,000 authorized; no shares issued and outstanding as of December 31, 2024 and December 31, 2023. | | | — | | | | — | |
Common Stock, $0.01 par value, 1,500,000,000 shares authorized, 110,217,322 and 100,025,584 shares issued and outstanding as of December 31, 2024 and December 31, 2023, respectively. | | | 1,102 | | | | 1,000 | |
Additional paid-in-capital | | | 1,035,454 | | | | 908,079 | |
Retained earnings (Accumulated deficit) | | | — | | | | (41,255 | ) |
Total stockholders' equity | | | 1,036,556 | | | | 867,824 | |
Total liabilities and stockholders’ equity | | $ | 1,972,652 | | | $ | 1,261,686 | |
The accompanying notes are an integral part of these consolidated financial statements.
Atlas Energy Solutions Inc.
Consolidated Statements of Operations
(In thousands, except per share data)
| | | | | | | | | | | | |
| | Year Ended December 31, | |
| | 2024 | | | 2023 | | | 2022 | |
Product sales | | $ | 515,434 | | | $ | 468,119 | | | $ | 408,446 | |
Service sales | | | 540,523 | | | | 145,841 | | | | 74,278 | |
Total sales | | | 1,055,957 | | | | 613,960 | | | | 482,724 | |
Cost of sales (excluding depreciation, depletion and accretion expense) | | | 725,196 | | | | 260,396 | | | | 198,918 | |
Depreciation, depletion and accretion expense | | | 98,747 | | | | 39,798 | | | | 27,498 | |
Gross profit | | | 232,014 | | | | 313,766 | | | | 256,308 | |
Selling, general and administrative expense (including stock and unit-based compensation expense of $22,381, $7,409 and $678, respectively) | | | 106,248 | | | | 48,636 | | | | 24,317 | |
Amortization expense of acquired intangible assets | | | 12,316 | | | | — | | | | — | |
Loss on disposal of assets | | | 19,672 | | | | — | | | | — | |
Insurance recovery (gain) | | | (20,098 | ) | | | — | | | | — | |
Operating income | | | 113,876 | | | | 265,130 | | | | 231,991 | |
Interest (expense), net | | | (38,647 | ) | | | (7,689 | ) | | | (15,760 | ) |
Other income, net | | | 551 | | | | 430 | | | | 2,631 | |
Income before income taxes | | | 75,780 | | | | 257,871 | | | | 218,862 | |
Income tax expense | | | 15,836 | | | | 31,378 | | | | 1,856 | |
Net income | | $ | 59,944 | | | $ | 226,493 | | | $ | 217,006 | |
Less: Pre-IPO net income attributable to Atlas Sand Company, LLC | | | | | | 54,561 | | | | |
Less: Net income attributable to redeemable noncontrolling interest | | | | | | 66,503 | | | | |
Net income attributable to Atlas Energy Solutions, Inc. | | $ | 59,944 | | | $ | 105,429 | | | $ | 217,006 | |
| | | | | | | | | |
Net income per common share | | | | | | | | | |
Basic | | $ | 0.55 | | | $ | 1.50 | | | | |
Diluted | | $ | 0.55 | | | $ | 1.48 | | | | |
Weighted average common shares outstanding | | | | | | | | | |
Basic | | | 108,235 | | | | 70,450 | | | | |
Diluted | | | 109,176 | | | | 71,035 | | | | |
The accompanying notes are an integral part of these consolidated financial statements.
Atlas Energy Solutions Inc.
Consolidated Statements of Stockholders' and Members' Equity and Redeemable Noncontrolling Interest
(in thousands, except per share data)
| | | | | | | | | | | | | | | | | | | | | | | | | | | | | | | | | | | | | | | | | | | | |
| | Redeemable | | | Members' | | | Old Atlas | | | Old Atlas | | | New Atlas | | | | | | | | | Stockholders' | |
| | Noncontrolling | | | Equity | | | Class A | | | Class B | | | Common Stock | | | Additional | | | Retained Earnings | | | and Members' | |
| | Interest | | | Value | | | Shares | | | Value | | | Shares | | | Value | | | Shares | | | Value | | | Paid-In-Capital | | | (Accumulated Deficit) | | | Equity | |
Balance at December 31, 2021 | | $ | — | | | $ | 338,697 | | | | — | | | $ | — | | | | — | | | $ | — | | | | — | | | $ | — | | | $ | — | | | $ | — | | | $ | 338,697 | |
Member distributions | | | — | | | | (45,024 | ) | | | — | | | | — | | | | — | | | | — | | | | — | | | | — | | | | — | | | | — | | | | (45,024 | ) |
Unit-based compensation expense | | | — | | | | 678 | | | | — | | | | — | | | | — | | | | — | | | | — | | | | — | | | | — | | | | — | | | | 678 | |
Net income | | | — | | | | 217,006 | | | | — | | | | — | | | | — | | | | — | | | | — | | | | — | | | | — | | | | — | | | | 217,006 | |
Balance at December 31, 2022 | | $ | — | | | $ | 511,357 | | | | — | | | $ | — | | | | — | | | $ | — | | | | — | | | $ | — | | | $ | — | | | $ | — | | | $ | 511,357 | |
Member distributions
prior to IPO | | | — | | | | (15,000 | ) | | | — | | | | — | | | | — | | | | — | | | | — | | | | — | | | | — | | | | — | | | | (15,000 | ) |
Net income prior
to IPO and Reorganization | | | — | | | | 54,561 | | | | — | | | | — | | | | — | | | | — | | | | — | | | | — | | | | — | | | | — | | | | 54,561 | |
Effect of Reorganization and reclassification to redeemable noncontrolling interest (Note 1) | | | 771,345 | | | | (550,918 | ) | | | 39,148 | | | | 391 | | | | 42,852 | | | | 429 | | | | — | | | | — | | | | (221,247 | ) | | | — | | | | (771,345 | ) |
Issuance of Common Stock in
IPO, net of offering costs | | | — | | | | — | | | | 18,000 | | | | 180 | | | | — | | | | — | | | | — | | | | — | | | | 291,056 | | | | — | | | | 291,236 | |
Deferred tax liability arising
from the IPO | | | — | | | | — | | | | — | | | | — | | | | — | | | | — | | | | — | | | | — | | | | (27,537 | ) | | | — | | | | (27,537 | ) |
Deferred tax liability arising from Up-C Simplification | | | — | | | | — | | | | — | | | | — | | | | — | | | | — | | | | — | | | | — | | | | (62,708 | ) | | | — | | | | (62,708 | ) |
Stock-based compensation | | | — | | | | — | | | | — | | | | — | | | | — | | | | — | | | | — | | | | — | | | | 7,039 | | | | — | | | | 7,039 | |
Net income after IPO
and Reorganization | | | 66,503 | | | | — | | | | — | | | | — | | | | — | | | | — | | | | — | | | | — | | | | — | | | | 105,429 | | | | 105,429 | |
$0.55/share dividend and unit distribution | | | (14,998 | ) | | | — | | | | — | | | | — | | | | — | | | | — | | | | — | | | | — | | | | (20,005 | ) | | | (20,002 | ) | | | (40,007 | ) |
Dividend equivalent rights ($0.55 per share) | | | — | | | | — | | | | — | | | | — | | | | — | | | | — | | | | — | | | | — | | | | (421 | ) | | | (296 | ) | | | (717 | ) |
Other distributions to redeemable non-controlling interest unitholders | | | (7,158 | ) | | | — | | | | — | | | | — | | | | — | | | | — | | | | — | | | | — | | | | — | | | | — | | | | — | |
Redemption of operating units of Atlas Sand Operating, LLC for Old Atlas Class A Common Stock | | | (13,640 | ) | | | — | | | | 594 | | | | 6 | | | | (594 | ) | | | (6 | ) | | | — | | | | — | | | | 13,640 | | | | — | | | | 13,640 | |
Deferred tax liability arising
from the redemption of operating units of Atlas Sand Operating, LLC for Old Atlas Class A Common Stock | | | — | | | | — | | | | — | | | | — | | | | — | | | | — | | | | — | | | | — | | | | (176 | ) | | | — | | | | (176 | ) |
Issuance of Common Stock upon vesting of RSUs, net of shares withheld for income taxes | | | — | | | | — | | | | 25 | | | | — | | | | — | | | | — | | | | — | | | | — | | | | — | | | | — | | | | — | |
Adjustment of redeemable noncontrolling interest to redemption amount | | | 185,412 | | | | — | | | | — | | | | — | | | | — | | | | — | | | | — | | | | — | | | | (59,026 | ) | | | (126,386 | ) | | | (185,412 | ) |
Effects of Up-C Simplification | | | (987,464 | ) | | | — | | | | (57,767 | ) | | | (577 | ) | | | (42,258 | ) | | | (423 | ) | | | 100,026 | | | | 1,000 | | | | 987,464 | | | | — | | | | 987,464 | |
Balance at December 31, 2023 | | $ | — | | | $ | — | | | | — | | | $ | — | | | | — | | | $ | — | | | | 100,026 | | | $ | 1,000 | | | $ | 908,079 | | | $ | (41,255 | ) | | $ | 867,824 | |
Net Income | | | — | | | | — | | | | — | | | | — | | | | — | | | | — | | | | — | | | | — | | | | — | | | | 59,944 | | | | 59,944 | |
$0.90/share dividend | | | — | | | | — | | | | — | | | | — | | | | — | | | | — | | | | — | | | | — | | | | (78,206 | ) | | | (18,689 | ) | | | (96,895 | ) |
Dividend equivalent rights ($0.90 per share) | | | — | | | | — | | | | — | | | | — | | | | — | | | | — | | | | — | | | | — | | | | (2,427 | ) | | | — | | | | (2,427 | ) |
Stock-based compensation | | | — | | | | — | | | | — | | | | — | | | | — | | | | — | | | | — | | | | — | | | | 22,381 | | | | — | | | | 22,381 | |
Issuance of Common Stock upon vesting of RSUs, net of shares withheld for income taxes | | | — | | | | — | | | | — | | | | — | | | | — | | | | — | | | | 480 | | | | 5 | | | | (2,072 | ) | | | — | | | | (2,067 | ) |
Deferred tax liability arising from Up-C Simplification | | | — | | | | — | | | | — | | | | — | | | | — | | | | — | | | | — | | | | — | | | | (1,286 | ) | | | — | | | | (1,286 | ) |
Equity issued in connection with Hi-Crush Transaction | | | — | | | | — | | | | — | | | | — | | | | — | | | | — | | | | 9,711 | | | | 97 | | | | 188,985 | | | | — | | | | 189,082 | |
Balance at December 31, 2024 | | $ | — | | | $ | — | | | | — | | | $ | — | | | | — | | | $ | — | | | | 110,217 | | | $ | 1,102 | | | $ | 1,035,454 | | | $ | — | | | $ | 1,036,556 | |
The accompanying notes are an integral part of these consolidated financial statements.
Atlas Energy Solutions Inc.
Consolidated Statements of Cash Flows
(In thousands)
| | | | | | | | | | | | |
| | Year Ended December 31, | |
| | 2024 | | | 2023 | | | 2022 | |
Operating activities: | | | | | | | | | |
Net income | | $ | 59,944 | | | $ | 226,493 | | | $ | 217,006 | |
Adjustments to reconcile net income to net cash provided by operating activities: | | | | | | | | | |
Depreciation, depletion and accretion expense | | | 102,207 | | | | 41,634 | | | | 28,617 | |
Amortization expense of acquired intangible assets | | | 12,316 | | | | — | | | | — | |
Amortization of debt discount | | | 3,573 | | | | 761 | | | | 457 | |
Amortization of deferred financing costs | | | 435 | | | | 337 | | | | 442 | |
Loss on disposal of assets | | | 19,672 | | | | — | | | | — | |
Stock and unit-based compensation | | | 22,381 | | | | 7,409 | | | | 678 | |
Deferred income tax | | | 15,002 | | | | 29,201 | | | | (2 | ) |
Commodity derivatives gain | | | — | | | | — | | | | (1,842 | ) |
Settlements on commodity derivatives | | | — | | | | — | | | | 2,137 | |
Other | | | (1,593 | ) | | | 139 | | | | 293 | |
Changes in operating assets and liabilities: | | | | | | | | | |
Accounts receivable | | | (13,105 | ) | | | 2,172 | | | | (44,207 | ) |
Accounts receivable - related party | | | — | | | | 868 | | | | (768 | ) |
Inventories | | | (6,618 | ) | | | (835 | ) | | | (2,415 | ) |
Spare part inventories | | | (4,739 | ) | | | (4,639 | ) | | | (4,239 | ) |
Prepaid expenses and other current assets | | | 6,468 | | | | (9,959 | ) | | | (2,030 | ) |
Other long-term assets | | | (644 | ) | | | (1,450 | ) | | | (6,549 | ) |
Accounts payable | | | 22,854 | | | | 5,198 | | | | 7,881 | |
Accounts payable - related parties | | | (51 | ) | | | 123 | | | | (464 | ) |
Deferred revenue | | | (2,468 | ) | | | — | | | | (2,000 | ) |
Accrued liabilities and other liabilities | | | 20,826 | | | | 1,575 | | | | 13,017 | |
Net cash provided by operating activities | | | 256,460 | | | | 299,027 | | | | 206,012 | |
Investing activities: | | | | | | | | | |
Purchases of property, plant and equipment | | | (373,983 | ) | | | (365,486 | ) | | | (89,592 | ) |
Hi-Crush acquisition, net of cash acquired | | | (153,425 | ) | | | — | | | | — | |
Proceeds from insurance recovery | | | 14,700 | | | | — | | | | — | |
Net cash used in investing activities | | | (512,708 | ) | | | (365,486 | ) | | | (89,592 | ) |
Financing Activities: | | | | | | | | | |
Principal payments on term loan borrowings | | | (14,383 | ) | | | (16,573 | ) | | | (28,544 | ) |
Proceeds from term loan borrowing | | | 168,500 | | | | — | | | | — | |
Proceeds from ABL credit facility | | | 70,000 | | | | — | | | | — | |
Issuance costs associated with debt financing | | | (1,189 | ) | | | (4,397 | ) | | | (233 | ) |
Payments under finance leases | | | (2,625 | ) | | | (2,001 | ) | | | (1,010 | ) |
Repayment of equipment finance notes | | | (3,563 | ) | | | — | | | | — | |
Dividends and distributions | | | (96,895 | ) | | | (62,163 | ) | | | — | |
Taxes withheld on vesting RSUs | | | (2,067 | ) | | | — | | | | — | |
Net proceeds from IPO | | | — | | | | 303,426 | | | | — | |
Payment of offering costs | | | — | | | | (6,020 | ) | | | — | |
Member distributions prior to IPO | | | — | | | | (15,000 | ) | | | (45,024 | ) |
Prepayment fee on 2021 Term Loan Credit Facility | | | — | | | | (2,649 | ) | | | — | |
Net cash provided by (used in) financing activities | | | 117,778 | | | | 194,623 | | | | (74,811 | ) |
Net increase (decrease) in cash and cash equivalents | | | (138,470 | ) | | | 128,164 | | | | 41,609 | |
Cash and cash equivalents, beginning of period | | | 210,174 | | | | 82,010 | | | | 40,401 | |
Cash and cash equivalents, end of period | | $ | 71,704 | | | $ | 210,174 | | | $ | 82,010 | |
Supplemental cash flow information | | | | | | | | | |
Cash paid during the period for: | | | | | | | | | |
Interest | | $ | 38,469 | | | $ | 15,210 | | | $ | 14,904 | |
Taxes | | $ | 2,275 | | | $ | 11,403 | | | $ | 468 | |
Supplemental disclosure of non-cash investing activities: | | | | | | | | | |
Property, plant and equipment in accounts payable and accrued liabilities | | $ | 37,294 | | | $ | 44,381 | | | $ | 23,298 | |
Hi-Crush acquisition consideration, equity issuance | | $ | 189,082 | | | $ | — | | | $ | — | |
Hi-Crush acquisition consideration, Deferred Cash Consideration Note | | $ | 106,613 | | | $ | — | | | $ | — | |
Equipment assets acquired through debt | | $ | 5,455 | | | $ | — | | | $ | — | |
Redeemable noncontrolling interest cumulative adjustment to redemption value | | $ | — | | | $ | 185,412 | | | $ | — | |
Finance lease assets acquired through debt | | $ | — | | | $ | 39,454 | | | $ | — | |
Finance lease liabilities converted to debt | | $ | — | | | $ | 42,795 | | | $ | — | |
The accompanying notes are an integral part of these consolidated financial statements.
Atlas Energy Solutions Inc.
Notes to Consolidated Financial Statements
Note 1 – Business and Organization
Atlas Energy Solutions Inc., a Delaware corporation (f/k/a New Atlas HoldCo. Inc.) (“New Atlas” and together with its subsidiaries “we,” “us,” “our,” or the “Company”), was formed on June 28, 2023, pursuant to the laws of the State of Delaware, and is the successor to AESI Holdings Inc. (f/k/a Atlas Energy Solutions Inc.), a Delaware corporation (“Old Atlas”). New Atlas is a holding company and the ultimate parent company of Atlas Sand Company, LLC (“Atlas LLC”), a Delaware limited liability company formed on April 20, 2017. Atlas LLC is a producer of high-quality, locally sourced 100 mesh and 40/70 sand used as a proppant during the well completion process. Proppant is necessary to facilitate the recovery of hydrocarbons from oil and natural gas wells. One hundred percent of Atlas LLC’s sand reserves are located in Texas within the Permian Basin and operations consist of proppant production and processing facilities, including four facilities near Kermit, Texas (together, the “Kermit facilities”), a fifth facility near Monahans, Texas (the “Monahans facility”), and the OnCore distributed mining network.
We are currently building a logistics platform with the goal of increasing the efficiency, safety and sustainability of the oil and natural gas industry within the Permian Basin. This includes the Dune Express, an overland conveyor infrastructure solution, coupled with our growing fleet of fit-for-purpose trucks and trailers.
We sell products and services primarily to oil and natural gas exploration and production companies and oilfield services companies primarily under supply agreements and also through spot sales on the open market.
Initial Public Offering
On March 13, 2023, Old Atlas completed its initial public offering (the “IPO”) of 18,000,000 shares of Class A common stock, par value $0.01 per share (the “Old Atlas Class A Common Stock”) at a price of $18.00 per share. The IPO generated $324.0 million of gross proceeds and net proceeds of approximately $291.2 million. The gross proceeds were offset by $20.6 million of underwriting discounts and commissions, $5.9 million of current offering costs in 2023, and $6.3 million in offering costs paid in 2022.
Reorganization
In connection with the IPO and pursuant to a master reorganization agreement dated March 8, 2023, by and among Old Atlas, Atlas Sand Management Company, LLC, a Texas limited liability company (“ASMC”), Atlas LLC, Atlas Sand Holdings, LLC, a Delaware limited liability company (“Holdings”), Atlas Sand Operating, LLC, a Delaware limited liability company (“Atlas Operating”), Atlas Sand Holdings II, LLC, a Delaware limited liability company (“Holdings II”), Atlas Sand Management Company II, LLC, a Delaware limited liability company (“ASMC II”), and Atlas Sand Merger Sub, LLC, a Delaware limited liability company (“Merger Sub”), Old Atlas and the parties thereto completed certain restructuring transactions (the “Reorganization”). As part of the Reorganization:
•Merger Sub merged with and into Atlas LLC, with Atlas LLC surviving as a wholly-owned subsidiary of Atlas Operating;
•Holdings, Holdings II and ASMC II were formed (collectively with ASMC, the “HoldCos”), through which certain holders who previously held membership interests in Atlas LLC (the “Legacy Owners”) were issued the membership interests in Atlas Operating, as represented by a single class of common units (“Operating Units”);
•certain Legacy Owners, through the HoldCos, transferred all or a portion of their Operating Units and voting rights, as applicable, in Atlas Operating to Old Atlas in exchange for an aggregate of 39,147,501 shares of Old Atlas Class A Common Stock and, in the case of Legacy Owners that continued to hold Operating Units through the HoldCos, an aggregate of 42,852,499 shares of Class B Common Stock, par value $0.01 per share, of Old Atlas (the “Old Atlas Class B Common Stock,” and together with the Old Atlas Class A Common Stock, the “Old Atlas Common Stock”), so that such Legacy Owners that continued to hold Operating Units also held, through the HoldCos, one share of Old Atlas Class B Common Stock for each Operating Unit held by them immediately following the Reorganization;
•the 1,000 shares of Old Atlas Class A Common Stock issued to Atlas LLC at the formation of Old Atlas were redeemed and canceled for nominal consideration; and
•Old Atlas contributed all of the net proceeds received by it in the IPO to Atlas Operating in exchange for a number of Operating Units equal to the number of shares of Old Atlas Class A Common Stock outstanding after the IPO, and Atlas Operating further contributed the net proceeds received to Atlas LLC.
As a result of the Reorganization, (i) Old Atlas’s sole material asset consisted, and still consists, of Operating Units, (ii) Atlas Operating’s sole material asset consisted, and still consists, of 100% of the membership interests in Atlas LLC and (iii) Atlas LLC owned, and still owns, all of the Company’s operating assets. Old Atlas is the managing member of Atlas Operating and is responsible for all operational, management and administrative decisions relating to Atlas LLC’s business and consolidates the financial results of Atlas LLC and its subsidiaries.
As a result of the IPO and Reorganization:
•the Legacy Owners collectively owned all of the outstanding shares of Old Atlas Class B Common Stock and 39,147,501 shares of Old Atlas Class A Common Stock, collectively representing 82.0% of the voting power and 68.5% of the economic interest of Old Atlas (and 82.0% of the economic interest of Atlas LLC, including both direct and indirect ownership interests) at the closing of the IPO and Reorganization;
•Old Atlas owned an approximate 57.1% interest in Atlas Operating; and
•the Legacy Owners that continued to hold Operating Units collectively owned an approximate 42.9% interest in Atlas Operating.
On March 13, 2023, the date on which Old Atlas closed the IPO, a corresponding deferred tax liability of approximately $27.5 million was recorded associated with the differences between the tax and book basis of the investment in Atlas LLC. The offset of the deferred tax liability was recorded to additional paid-in capital. As there was no change in control of Atlas Operating, Atlas LLC, or the businesses or subsidiaries held by Atlas LLC as a result of the Reorganization, purchase accounting was not required and the Legacy Owners’ interests in Operating Units were recognized as a noncontrolling interest in Atlas Operating.
On September 13, 2023, we distributed the Operating Units and shares of Old Atlas Common Stock previously held by the HoldCos to the Legacy Owners in accordance with the distribution provisions of each respective HoldCo operating agreement. Immediately following the distribution, the Legacy Owners held shares of Old Atlas Class A Common Stock or Old Atlas Class B Common Stock (and corresponding Operating Units) directly.
Up-C Simplification
On October 2, 2023, Old Atlas and the Company completed the Up-C Simplification (as defined below) contemplated by the Master Reorganization Agreement (the “Master Reorganization Agreement”), dated as of July 31, 2023, by and among the Company, Old Atlas, Atlas Operating, AESI Merger Sub Inc., a Delaware corporation (“PubCo Merger Sub”), Atlas Operating Merger Sub, LLC, a Delaware limited liability company (“Opco Merger Sub” and, together with PubCo Merger Sub, the “Merger Subs”), and Holdings, in order to, among other things, reorganize under a new public holding company (the “Up-C Simplification”).
Pursuant to the Master Reorganization Agreement, (a) PubCo Merger Sub merged with and into Old Atlas (the “PubCo Merger”), as a result of which (i) each share of Old Atlas Class A Common Stock then issued and outstanding was exchanged for one share of Common Stock of New Atlas, par value $0.01 per share (the “New Atlas Common Stock” or the “Common Stock”), (ii) all of the shares of Old Atlas Class B Common Stock then issued and outstanding were surrendered and cancelled for no consideration and (iii) Old Atlas survived the PubCo Merger as a direct, wholly-owned subsidiary of the Company; and (b) Opco Merger Sub merged with and into Atlas Operating (the “Opco Merger” and, together with the PubCo Merger, the “Mergers”), as a result of which (i) each Operating Unit then issued and outstanding, other than those Operating Units held by Old Atlas, was exchanged for one share of New Atlas Common Stock and (ii) Atlas Operating became a wholly-owned subsidiary of New Atlas.
In connection with the Up-C Simplification:
•each share of Old Atlas Class A Common Stock issued and outstanding immediately prior to the effective time of the Mergers (the “Effective Time”) was exchanged for one share of New Atlas Common Stock and the holders of Old Atlas Class A Common Stock became stockholders of New Atlas;
•all of the Old Atlas Class B Common Stock issued and outstanding immediately prior to the Effective Time was surrendered and cancelled for no consideration;
•each Operating Unit issued and outstanding immediately prior to the Effective Time, other than Operating Units held by Old Atlas, was exchanged for one share of New Atlas Common Stock, and the holders of such Operating Units became stockholders of New Atlas;
•Old Atlas continues to hold all of the issued and outstanding Operating Units it held as of immediately prior to the Effective Time, such Operating Units were otherwise unaffected by the Up-C Simplification (including the Opco Merger), and such Operating Units, together with the Operating Units received by New Atlas in connection with the Opco Merger, constitute all of the Operating Units currently issued and outstanding;
•Old Atlas became a direct, wholly-owned subsidiary of New Atlas, and all of the Old Atlas Class A Common Stock then held by New Atlas was recapitalized into a single share;
•as of the Effective Time, New Atlas assumed (a) the Atlas Energy Solutions Inc. Long Term Incentive Plan (the “LTIP”), (b) all awards of restricted stock units and performance share units, in each case, whether vested or unvested, that were then outstanding under the LTIP, (c) the grant notices and agreements evidencing such awards, and (d) the then remaining unallocated share reserve issuable under the LTIP; and the terms and conditions that were in effect immediately prior to the Up-C Simplification under each outstanding award assumed by New Atlas continue in full force and effect after the Up-C Simplification, with certain exceptions to reflect the completion of the Up-C Simplification, such as each award denominated with reference to shares of New Atlas Common Stock instead of Old Atlas Class A Common Stock and the performance share unit awards being in reference to performance of New Atlas instead of performance of Old Atlas (with respect to the portion of the applicable performance period following the Up-C Simplification);
•as of the Effective Time, (a) New Atlas assumed Old Atlas’s existing Management Change in Control Severance Plan (and each participation agreement thereunder that was then outstanding) and (b) the terms and conditions of the director compensation program applicable to members of the board of directors of Old Atlas (and any committees thereof) were applied instead to members of the board of directors of New Atlas (the “Board”) (and, any committees thereof) (and any portion of such compensation to be granted in the form of equity-based awards will be granted in awards denominated with reference to shares of New Atlas Common Stock instead of Old Atlas Class A Common Stock); and
•Old Atlas changed its name from “Atlas Energy Solutions Inc.” to “AESI Holdings Inc.,” and New Atlas changed its name from “New Atlas HoldCo Inc.” to “Atlas Energy Solutions Inc.” New Atlas was approved to have the shares of New Atlas Common Stock listed on the New York Stock Exchange under the ticker symbol “AESI,” the trading symbol previously used by Old Atlas.
After completion of the Up-C Simplification, New Atlas replaced Old Atlas as the publicly held entity and, through its subsidiaries, conducts all of the operations previously conducted by Old Atlas, and Old Atlas remains the managing member of Atlas Operating.
The foregoing description is not complete and is qualified in its entirety by reference to the Master Reorganization Agreement, a copy of which is filed as Exhibit 2.2 to this Annual Report on Form 10-K (this “Annual Report”).
The Up-C Simplification was a common control transaction; therefore, the redeemable noncontrolling interest was acquired as an equity transaction. The redeemable noncontrolling interest was adjusted to the maximum redemption amount based on the 10-day volume-weighted average closing price of shares of Old Atlas Class A Common Stock at the redemption date. The carrying amount of the redeemable noncontrolling interest was reclassified to reflect the change in the Company’s ownership interest with an offsetting entry to additional paid-in capital. On October 2, 2023, the date the Up-C Simplification was completed, a corresponding deferred tax liability of approximately $64.0 million was recorded associated with the exchange of the redeemable noncontrolling interest in Old Atlas for shares of New Atlas Common Stock. The offset of the deferred tax liability was recorded to additional paid-in capital. As there was no change in control of Old Atlas, or the businesses or subsidiaries held by Old Atlas as a result of the Up-C Simplification, purchase accounting was not required and the carrying amount of the redeemable noncontrolling interest was removed to reflect the change in the Company’s ownership interest.
Hi-Crush Transaction
On March 5, 2024 (“Closing Date”), the Company completed the acquisition of the Permian Basin proppant production and logistics businesses and operations of Hi-Crush Inc., a Delaware corporation (“Hi-Crush”), in exchange for mixed consideration totaling $456.1 million, subject to customary post-closing adjustments (the “Hi-Crush Transaction”), pursuant to that certain Agreement and Plan of Merger, dated February 26, 2024 (the “Hi-Crush Merger Agreement”), by and among the Company, Atlas LLC, Wyatt Merger Sub 1 Inc., a Delaware corporation and direct, wholly-owned subsidiary of Atlas LLC, Wyatt Merger Sub 2, LLC, a Delaware limited liability company and direct, wholly-owned subsidiary of Atlas LLC, Hi-Crush, each stockholder that had executed the Hi-Crush Merger Agreement or a joinder thereto (each a “Hi-Crush Stockholder” and, collectively, the “Hi-Crush Stockholders”), Clearlake Capital Partners V Finance, L.P., solely in its capacity as the Hi-Crush Stockholders’ representative and HC Minerals Inc., a Delaware corporation (collectively, the “Parties”). Refer to Note 3 - Hi-Crush Transaction for further discussion.
The foregoing description of the Hi-Crush Transaction and the Hi-Crush Merger Agreement does not purport to be complete and is subject to, and qualified in its entirety by, the full text of the Hi-Crush Merger Agreement, a copy of which is filed as Exhibit 2.3 to this Annual Report.
Operational Updates
On April 14, 2024, a mechanical fire occurred at one of the Company's plants in Kermit, Texas. The fire primarily impacted the feed system of the processing facility, which transports sand from the dryers and separators to storage silos. During the second quarter of 2024, the Company utilized temporary loadout equipment at the plant to continue production. The Company was able to transition to the temporary loadout within 11 days of the fire incident. Reconstruction of the feed system was completed in June 2024 and the plant was operational by June 30, 2024. The Company performed an impairment analysis on the Kermit asset group as a result of the fire and determined that no impairment was required. The damaged assets from the fire had a net book value of $11.1 million that was recorded as a loss on disposal of assets on the consolidated statements of operations. The Company filed an insurance claim for the fire incident and has recovered the costs associated with returning the plant to production. The Company has recorded $20.1 million of insurance recovery in connection with this incident as this recovery amount is deemed collectable and legally enforceable as of December 31, 2024. The proceeds are recorded as insurance recovery (gain) on the consolidated statements of operations and as cash and cash equivalents on the consolidated balance sheets for the $14.7 million received as of December 31, 2024 and as accounts receivable on the consolidated balance sheets for the $5.4 million not received as of December 31, 2024.
During the third quarter of 2024, one of the Company's dredge mining assets was damaged during commissioning at one of the Kermit facilities. The damaged asset had a net book value of $8.6 million that was recorded as a loss on disposal of assets on the consolidated statements of operations.
Note 2—Summary of Significant Accounting Policies
Basis of Presentation
The accompanying consolidated financial statements (the “Financial Statements”) have been prepared in accordance with generally accepted accounting principles in the United States of America (“GAAP”) and the requirements of the U.S. Securities and Exchange Commission (the “SEC”). All adjustments necessary for a fair presentation of the Financial Statements have been included. Such adjustments are of a normal, recurring nature. These Financial Statements include the accounts of New Atlas, Old Atlas, Atlas Operating, Atlas LLC, and Atlas LLC’s wholly-owned subsidiaries: Atlas Sand Employee Company, LLC; Atlas OLC Employee Company, LLC; Atlas Construction Employee Company, LLC; Atlas Sand Employee Holding Company, LLC; Fountainhead Logistics Employee Company, LLC; Atlas Sand Construction, LLC; OLC Kermit, LLC; OLC Monahans, LLC; Fountainhead Logistics, LLC; Fountainhead Transportation Services, LLC; and Fountainhead Equipment Leasing, LLC.
The Company acquired Hi-Crush and certain of its wholly-owned subsidiaries on March 5, 2024. These Financial Statements include the accounts of Hi-Crush Operating, LLC (“Hi-Crush Operating”) (f/k/a Hi-Crush Inc.) and the following wholly-owned subsidiaries of Hi-Crush Operating: Hi-Crush LMS LLC; Hi-Crush Investments LLC; OnCore Processing LLC; Hi-Crush Permian Sand LLC; Hi-Crush PODS LLC; NexStage LLC; FB Logistics LLC; BulkTracer Holdings LLC; PropDispatch LLC; Pronghorn Logistics Holdings, LLC; and Pronghorn Logistics, LLC. Refer to Note 3- Hi-Crush Transaction for further discussion.
Reorganization
As discussed in Note 1 - Business and Organization, as a result of our IPO and the Reorganization and prior to the Up-C Simplification, Old Atlas became the managing member of Atlas Operating and consolidated entities in which it had a controlling financial interest. The Reorganization was considered a transaction between entities under common control. As a result, the Financial Statements for periods prior to the IPO and the Reorganization have been adjusted to combine the previously separate entities for presentation purposes. However, Old Atlas and Atlas Operating had no operations or assets and liabilities prior to our IPO. As such, for periods prior to the completion of our IPO, the Financial Statements represent the historical financial position and results of operations of Atlas LLC and its subsidiaries. For periods after the completion of our IPO through the end of the reporting period, the financial position and results of operations include those of Old Atlas and New Atlas.
Up-C Simplification
As discussed in Note 1 - Business and Organization, as a result of the Up-C Simplification, New Atlas replaced Old Atlas as the publicly held entity and, through its subsidiaries, conducts all of the operations previously conducted by Old Atlas, and Old Atlas remains the managing member of Atlas Operating. The Up-C Simplification was considered an acquisition of noncontrolling interest transaction between entities under common control. As such, the Financial Statements and results of operations of Old Atlas are included in the Financial Statements of New Atlas on the same basis as previously presented except for the acquisition of noncontrolling interest which was accounted for as an equity transaction.
Consolidation
The Financial Statements include the accounts of the Company and wholly-owned subsidiaries. All intercompany transactions and accounts have been eliminated in consolidation.
Use of Estimates
The preparation of the Financial Statements in conformity with GAAP requires management to make estimates and assumptions that affect the reported amounts of assets and liabilities and the related disclosure of contingent assets and liabilities at the date of the Financial Statements and the reported amounts of revenues and expenses during the reporting period. Significant estimates used in the preparation of these Financial Statements include, but are not limited to: the proppant reserves and their impact on calculating the depletion expense under the units-of-production method; the depreciation and amortization associated with property, plant and equipment; stock-based and unit-based compensation; asset retirement obligations; business combinations; valuation of goodwill and acquired intangible assets; and certain liabilities. The Company bases its estimates on historical experience and on various assumptions that are believed to be reasonable under the circumstances. Actual results could differ from those estimates.
Business Combination
Business combinations are accounted for using the acquisition method of accounting in accordance with the Accounting Standards Codification (“ASC”) 805, “Business Combinations.” The purchase price is allocated to the assets acquired and liabilities assumed based on their estimated fair values. Fair value of the acquired assets and liabilities is measured in accordance with the guidance of ASC 820, “Fair Value Measurement.” Any excess purchase price over the fair value of the net identifiable assets acquired is recorded as goodwill. Any acquisition-related costs incurred by the Company are expensed as incurred. Operating results of an acquired business are included in the Company’s results of operations from the date of acquisition. We use all available information to estimate fair values, including quoted market prices, the carrying value of acquired assets and assumed liabilities and valuation techniques such as discounted cash flows, relief-from-royalty (“RFR”) method, with or without method, or multi-period excess earnings method (“MPEEM”). We engage third-party appraisal firms to assist in the fair value determination of identifiable long-lived assets, identifiable intangible assets, as well as any contingent consideration that provides for additional consideration to be paid to the seller if certain future conditions are met. These estimates are reviewed during the 12-month measurement period and adjusted as soon as the necessary information becomes available but no later than one year from the acquisition date. The judgments made in determining the estimated fair value assigned to each class of assets acquired and liabilities assumed, as well as asset lives, can materially impact our financial condition or results of operations. The purchase price in the Hi-Crush Transaction included a holdback, which was measured at fair value. The holdback was subject to changes from estimated to actual net working capital amounts and other customary purchase price adjustments. This amount was paid as of the year ended December 31, 2024.
Since the Closing Date, the acquired companies have adopted all of the Company's accounting policies.
Cash and Cash Equivalents
Cash and cash equivalents consist of all highly liquid investments that are readily convertible into cash and have original maturities of three months or less when purchased. As of December 31, 2024, we have deposits of $46.2 million in an Insured Cash Sweep (“ICS”) Deposit Placement Agreement within IntraFi Network LLC facilitated by our bank. The ICS program provides the Company with access to FDIC insurance for our total cash held within the ICS. We place our remaining cash deposits with high-credit-quality financial institutions. At times, a portion of our cash may be uninsured or in deposit accounts that exceed or are not covered under the Federal Deposit Insurance Corporation limit.
Concentrations of Credit Risk
Throughout 2024 and 2023, the Company has maintained cash balances on deposit and time deposits with financial institutions in excess of federally insured amounts; however, all these financial institutions hold an investment-grade rating by one or more major rating agencies.
We sell products and services primarily to oil and natural gas exploration and production companies and oilfield services companies, this industry concentration has the potential to impact our overall exposure to market and credit risks, either positively or negatively, in that our customers could be affected by similar changes in economic, industry or other conditions. However, we believe that the credit risk posed by this industry concentration is offset by the creditworthiness of our customer base. For the year ended December 31, 2024, three customers comprised of 14.1%, 13.7%, and 12.7% of the Company's sales. For the year ended December 31, 2023, two customers comprised 25.3% and 10.4% of the Company’s sales. For the year ended December 31, 2022, one customer comprised 12.3% of the Company’s sales.
Accounts Receivable and Allowance for Credit Losses
Accounts receivable are recorded at cost when earned and represent claims against third parties that will be settled in cash. These receivables generally do not bear interest. The carrying value of our receivables, net of allowance for credit losses, represents the estimated collectable amount. If events or changes in circumstances indicate specific receivable balances may be impaired, further consideration is given to our ability to collect those balances and the allowance is adjusted accordingly. We perform credit evaluations of new customers, and sometimes require deposits and prepayments, to mitigate credit risk. When it is probable that all or part of an outstanding balance will not be collected, we establish an allowance for credit losses. For the year ended December 31, 2022, the Company did not recognize bad debt expense during the year and had no allowance for doubtful accounts.
On January 1, 2023, we adopted Accounting Standards Update (“ASU”) 2016-13, “Financial Instruments - Credit Losses (Topic 326) - Measurement of Credit Losses on Financial Instruments,” which replaced the prior incurred loss impairment model with an expected credit loss impairment model for financial instruments, including accounts receivable. The adoption of ASU 2016-13 did not result in a material cumulative-effect adjustment to retained earnings on January 1, 2023.
We are exposed to credit losses primarily through sales of products and services. We provide an allowance for credit losses, when necessary, to cover estimated credit losses. Outstanding customer receivables are reviewed regularly for possible nonpayment indicators. We analyze accounts receivable on an individual customer and overall basis through review of historical collection experience and current aging status of our customer accounts. We also consider the financial condition and economic environment of our customers in evaluating the need for an allowance. As of December 31, 2024 and December 31, 2023, we had $0.3 million and de minimis in allowance for credit losses, respectively. Allowance for credit losses is included in accounts receivable on the consolidated balance sheets. For the year ended December 31, 2024 and 2023, we recognized de minimis bad debt expense.
As of December 31, 2024, two customers represented 22.2% and 11.2% of the Company’s outstanding accounts receivable trade balance. As of December 31, 2023, four customers represented 18.7%, 15.8%, 12.3%, and 11.0% of the Company’s outstanding accounts receivable trade balance.
Inventories
Inventories include raw sand stockpiles, in-process product, and finished product available for shipment. Inventories are valued at the lower of cost or net realizable value. Cost is determined using a weighted average cost method. Production costs include direct excavation costs, production personnel and benefits costs, processing costs, rental equipment costs, other costs directly attributable to plant operations, depreciation, and depletion.
Spare Part Inventories
Spare part inventories include critical spares, materials and supplies. Spare part inventories are valued at the lower of cost or net realizable value. Cost is determined using a weighted average cost method. For both years ended December 31, 2024 and 2023, there was $0.7 million in spare parts inventory reserve.
Prepaid Expenses and Other Current Assets
Prepaid expenses consist primarily of prepaid federal tax payments, prepaid software fees, prepaid rent, delay rental payments on leased land, insurance, trade show fees and sales events. These expenses are recognized over the contract period as events occur or when the future benefit is realized. As of December 31, 2024 and 2023, prepaid expenses were $10.8 million and $15.4 million, respectively. Other current assets consist of certain short-term supplier deposits for leased equipment, which were $0.4 million and de minimis as of December 31, 2024 and 2023, respectively.
Goodwill and Acquired Intangible Assets
Goodwill represents the excess of the purchase price over the fair value of the net identifiable assets acquired in a business combination. Goodwill is not amortized, but is reviewed for impairment annually during the fourth quarter or more frequently when events or changes in circumstances indicate that the carrying value may not be recoverable. Judgments regarding indicators of potential impairment are based on market conditions and operational performance of our business. We may assess our goodwill for impairment initially using a qualitative approach to determine whether conditions exist that indicate it is more likely than not that the carrying value is greater than its fair value, and if such conditions are identified, then a quantitative analysis will be performed to determine if there is any impairment. The fair value is determined using significant unobservable inputs, or level 3 in the fair value hierarchy. These inputs are based on internal management estimates, forecasts, and significant judgment. If the carrying amount exceeds the fair value, an impairment loss is recognized in the current period in an amount equal to the excess.
The Company amortizes the cost of definite-lived intangible assets on a straight-line basis over their estimated useful lives of 3 to 10 years. These assets are evaluated for impairment when events or changes in circumstances indicate that the carrying amount of the definite-lived intangible assets may not be recoverable.
Other Intangible Assets
Other intangible assets consist of internal-use software. The Company applies the provisions of ASC 350, “Intangibles-Goodwill and Other.” Costs associated with the acquisition of an internal-use software are capitalized when incurred and amortized over the estimated useful life of the license or application, which is generally 1 to 5 years. As of December 31, 2024 and 2023, the balance of other intangible assets was $3.1 million and $1.8 million, respectively. On the consolidated balance sheets, the December 31, 2023 intangible assets balance was reclassified out of other long-term assets to intangible assets, net for comparable presentation with the current period.
Amortization associated with the other intangibles was $0.6 million, $0.3 million, and $0.1 million for the years ended December 31, 2024, 2023, and 2022, respectively. The amortization expense is recorded in depreciation, depletion and accretion expense in the consolidated statements of operations and consolidated statements of cash flows.
Property, Plant and Equipment, Including Depreciation and Depletion
Property, plant and equipment are recorded at cost and depreciated over their estimated useful lives using either the straight-line method or the units of production method. Construction in progress is comprised of assets which have not been placed into service and is not depreciated until the related assets or improvements are ready to be placed into service.
Interest incurred during the construction of plant facilities was capitalized. Capitalized interest was recorded within plant facilities associated with productive, depletable properties, until the plant facilities were placed into service, and is being amortized using the units of production method. The Company did not capitalize interest for the years ended December 31, 2024, 2023 and 2022.
Costs of improvements that extend economic life or improve service potential are capitalized and depreciated over the remaining useful life of the asset, with routine repairs and maintenance expensed as incurred.
Fixed assets are carried at historical cost. Fixed assets, other than plant facilities associated with productive, depletable properties, are depreciated using the straight-line method over the estimated useful lives of the assets as follows:
| | |
Plant facilities and equipment | | 1 – 40 years |
Furniture and office equipment | | 3 – 15 years |
Computer and network equipment | | 3 – 7 years |
Buildings and leasehold improvements | | 5 – 40 years |
Logistics equipment (1) | | 4 – 7 years |
(1) Logistics equipment consists of our fleet of fit-for-purpose trucks and trailers.
Mine development project costs are capitalized once the deposit is classified as a proven and probable reserve. Mine development costs include engineering, mineralogical studies, drilling and other related costs to develop the mine and remove the overburden to initially expose the mineral and allow for the construction of an access way. Exploration costs are expensed as incurred and classified as exploration expense.
Mining property and development costs are amortized using the units of production method on estimated recoverable tonnage, which equals estimated proven and probable reserves. The impact to reserve estimates is recognized on a prospective basis. Drilling and related costs are capitalized for deposits where proven and probable reserves exist. These activities are directed at obtaining additional information on the deposit or converting non-reserve minerals to proven and probable reserves, with the benefit being realized over a period greater than one year.
Impairment or Disposal of Property, Plant and Mine Development
The Company periodically evaluates whether current events or circumstances indicate that the carrying value of our property, plant and equipment assets may not be recoverable. If circumstances indicate that the carrying value may not be recoverable, the Company estimates future undiscounted net cash flows using estimates, including but not limited to estimates of proven and probable sand reserves, estimated future sales prices (considering historical and current prices, price trends and related factors), operating costs and anticipated capital expenditures. If the undiscounted cash flows are less than the carrying value of the assets, the Company recognizes an impairment loss equal to the amount by which the carrying value exceeds the fair value of the assets.
The recoverability of the carrying value of the Company’s mining property and development costs are dependent upon the successful development and commercial production of the Company’s mineral deposit and the related processing facilities. The Company’s evaluation of mineral properties for potential impairment primarily includes evaluating changes in the mineral reserves, or the underlying estimates and assumptions, including estimated production costs. Assessing the economic feasibility requires certain estimates including the prices of products to be produced and processing recovery rates, as well as operating and capital costs.
Asset Retirement Obligations
In accordance with ASC 410-20, “Asset Retirement Obligations,” the Company records a liability for asset retirement obligations at the fair value of the estimated costs to retire a tangible long-lived asset at the time the liability is incurred, when there is a legal obligation to incur costs to retire the asset and when a reasonable estimate of the fair value of the obligation can be made. The Company has asset retirement obligations with respect to certain assets due to various contractual obligations to clean and/or dispose of those assets at the time they are retired.
A liability for the fair value of an asset retirement obligation, with a corresponding increase to the carrying value of related long-lived assets, is recognized at the time of an obligating event. The asset is depreciated using the straight-line method, and the discounted liability is increased through accretion over the expected timing of settlement.
The estimated liability is based on third-party estimates of costs to abandon, including estimated economic lives and external estimates as to the cost to bring the land to a state required by the lease agreements. The Company utilized a discounted rate reflecting management’s best estimate of the credit-adjusted risk-free rate. Revisions to the liability could occur due to changes in the estimated costs, changes in the economic life or if federal or state regulators enact new requirements regarding the abandonment. Accretion expense was $0.7 million, $0.1 million, and $0.1 million for the years ended December 31, 2024, 2023, and 2022, respectively. Accretion is recorded on the consolidated statement of operations in depreciation, depletion and accretion expense. The current portion of the asset retirement obligation, $0.8 million, is recorded within other current liabilities and the long-term portion, $7.0 million, is recorded within asset retirement obligations on the Company's consolidated balance sheets for December 31, 2024. On the consolidated balance sheets, the December 31, 2023 asset retirement obligation balance was reclassified out of other long-term liabilities to asset retirement obligations for comparable presentation with the current period.
Changes in the asset retirement obligations are as follows (in thousands):
| | | | | | | | |
| | December 31, | |
| | 2024 | | | 2023 | |
Beginning Balance | | $ | 2,705 | | | $ | 1,245 | |
Revision of estimates | | | (1,213 | ) | | | — | |
Additions to liabilities | | | 6,743 | | | | 1,374 | |
Accretion expense | | | 661 | | | | 86 | |
Settlements | | | (1,079 | ) | | | — | |
Ending Balance | | $ | 7,817 | | | $ | 2,705 | |
Deferred Debt Discount and Financing Costs
We defer costs directly associated with acquiring third-party financing, primarily loan origination costs and related professional expenses. Deferred Financing costs associated with the Deferred Cash Consideration Note (as defined in Note 9- Debt), ADDT Loan (as defined in Note 9 - Debt), the 2023 Term Loan Credit Facility (as defined in Note 8- Leases), and the 2021 Term Loan Credit Facility (as defined in Note 9- Debt), are deferred and amortized using the effective interest rate method over the life of the associated third-party debt financing and reflected as a direct deduction from the carrying amount of the related debt obligation on the Company’s consolidated balance sheets.
Deferred financing costs associated with the 2023 ABL Credit Facility (as defined in Note 9- Debt) is recorded under other long-term assets on the consolidated balance sheets and are amortized on a straight-line basis over the life of the agreement.
Our debt discounts are reflected as a direct reduction from the carrying amount of the debt obligation on the Company’s consolidated balance sheets. Such costs are amortized to interest expense using the effective interest method. See Note 9 – Debt for more information.
Fair Value of Financial Instruments
Fair value is defined as the exchange price that would be received for an asset or paid to transfer a liability (an exit price) in the principal or most advantageous market for the asset or liability in an orderly transaction between market participants on the measurement date. Fair value is estimated by applying the following hierarchy, which prioritizes the inputs used to measure fair value into three levels and bases the categorization within the hierarchy upon the lowest level of input that is available and significant to the fair value measurement:
Level 1 – Quoted prices in active markets for identical assets or liabilities.
Level 2 – Observable inputs other than quoted prices in active markets for identical assets and liabilities, quoted prices for identical or similar assets or liabilities in inactive markets or other inputs that are observable or can be corroborated by observable market data for substantially the full term of the assets or liabilities.
Level 3 – Inputs that are generally unobservable and typically reflect management’s estimate of assumptions that market participants would use in pricing the asset or liability.
The amounts reported in the balance sheets as current assets or liabilities, including cash and cash equivalents, accounts receivable, prepaid expenses and other current assets, accounts payable, accrued liabilities and deferred revenues approximate fair value due to the short-term maturities of these instruments. The Company’s policy is to recognize transfers between levels at the end of the period. This disclosure does not impact the Company’s financial position, results of operations or cash flows.
As of the dates indicated, the Company’s long-term debt consisted of the following (in thousands):
| | | | | | | | | | | | | | | | | | |
| | At December 31, 2024 | | | At December 31, 2023 | | | |
| | Carrying Value | | | Fair Value | | | Carrying Value | | | Fair Value | | | Valuation Technique |
Financial liabilities | | | | | | | | | | | | | | |
Outstanding principal amount of the Initial Term Loan under the 2023 Term Loan Credit Facility | | $ | 174,141 | | | $ | 193,523 | | | $ | 172,820 | | | $ | 182,446 | | | Level 2 – Market Approach |
Outstanding principal amount of the ADDT Loan | | $ | 134,013 | | | $ | 149,266 | | | $ | — | | | $ | — | | | Level 2 – Market Approach |
Outstanding principal amount of the DDT Loan under the 2023 Term Loan Credit Facility | | $ | 19,994 | | | $ | 22,145 | | | $ | — | | | $ | — | | | Level 2 – Market Approach |
Outstanding principal amount of the 2023 ABL Credit Facility | | $ | 70,000 | | | $ | 70,000 | | | $ | — | | | $ | — | | | Level 1 – Quoted Prices |
Outstanding principal amount of the of the Deferred Cash Consideration Note | | $ | 108,519 | | | $ | 110,598 | | | $ | — | | | $ | — | | | Level 2 – Market Approach |
Outstanding amount of the other indebtedness | | $ | 4,058 | | | $ | 4,058 | | | $ | — | | | $ | — | | | Level 1 – Quoted Prices |
•Our Initial Term Loan under the 2023 Term Loan Credit Facility (defined in Note 8 - Leases) with Stonebriar Commercial Finance LLC (“Stonebriar”), pursuant to which Stonebriar extended a $180.0 million single advance seven-year term loan credit facility bears interest at a fixed rate of 9.50%, where its fair value will fluctuate based on changes in interest rates and credit quality. As of December 31, 2024 and 2023, the fair value of long-term debt has been determined by discounting the future cash flows using current market interest rates for similar financial instruments. These inputs are not quoted prices in active markets, but they are either directly or indirectly observable; therefore, they are classified as Level 2 inputs.
•Our ADDT Loan (defined in Note 9 - Debt) with Stonebriar in the aggregate principal amount of $150.0 million, payable in 76 consecutive monthly installments, bears interest at a fixed rate of 10.86%, where its fair value will fluctuate based on changes in interest rates and credit quality. As of December 31, 2024, the fair value of long-term debt has been determined by discounting the future cash flows using current market interest rates for similar financial instruments. These inputs are not quoted prices in active markets, but they are either directly or indirectly observable; therefore, they are classified as Level 2 inputs.
•Our DDT Loan under the 2023 Term Loan Credit Facility (defined in Note 8 - Leases) with Stonebriar in the aggregate principal amount of $20.0 million, payable in 69 consecutive monthly installments, bears interest at a fixed rate of 10.58%, where its fair value will fluctuate based on changes in interest rates and credit quality. As of December 31, 2024, the fair value of long-term debt has been determined by discounting the future cash flows using current market interest rates for similar financial instruments. These inputs are not quoted prices in active markets, but they are either directly or indirectly observable; therefore, they are classified as Level 2 inputs.
•The carrying amount of the Company’s 2023 ABL Credit Facility (defined in Note 9- Debt) approximated fair value as it bears interest at variable rates over the term of the loan. Therefore, we have classified this long-term debt as Level 1 of the fair value hierarchy.
•The Deferred Cash Consideration Note (defined in Note 9- Debt) entered into in connection with the Hi-Crush Transaction was recorded at fair value as of the acquisition date. As of December 31, 2024, the fair value of long-term debt has been determined by discounting the future cash flows using current market interest rates for similar financial instruments. These inputs are not quoted prices in active markets, but they are either directly or indirectly observable; therefore, they are classified as Level 2 inputs.
•We believe the fair value of our other indebtedness approximates the carrying value. This balance is comprised of equipment financing agreements. We considered the rates entered into for 2024 equipment financing agreements for the same equipment. Therefore we have classified this long-term debt as Level 1 of the fair value hierarchy.
See Note 9 - Debt for further discussion on our debt arrangements.
Leases
The Company leases office space, equipment, and vehicles under non-cancellable agreements. The Company’s leases may include options to extend or renew at the Company’s discretion. The measurement of the lease term includes options to extend or renew when it is reasonably certain the Company will exercise those options. Lease assets and liabilities are recognized at the commencement date based on the present value of minimum lease payments over the lease term. To determine the present value of future minimum lease payments, the Company uses the implicit rate when readily determinable; however, certain leases do not provide an implicit rate. Therefore, to determine the present value of minimum lease payments, the Company uses the incremental borrowing rate based on the information available at the commencement date of the lease. The Company’s finance lease agreements typically include an interest rate that is used to determine the present value of future lease payments. Short-term operating leases with an initial term of 12 months or less are not recorded on our balance sheet. Minimum lease payments are expensed on a straight-line basis over the lease term, including reasonably certain renewal options.
The Company periodically evaluates whether current events or circumstances indicate that the carrying value of our right-of-use assets exceeds fair value. If such a review should indicate that the carrying amount of right-of-use asset is not recoverable, the Company will reduce the carrying amount of such assets to fair value.
The Company is a lessor as we lease certain well site storage equipment to customers through operating leases as part of our logistics services that were acquired through the Hi-Crush Transaction. These agreements are short term in nature and have monthly terms with no renewal options that are reasonably certain to exercise, or early termination options based on established terms specific to the individual agreement.
On January 1, 2022, the Company adopted ASU 2016-02, Leases (Topic 842), as amended by other ASUs issued since February 2016, using the modified retrospective transition method applied at the effective date of the standard. The Company elected the package of practical expedients permitted under the transition guidance within the new standard, including the option to carry forward the historical lease classifications and assessment of initial direct costs, account for lease and non-lease components as a single lease, and to not include leases with an initial term of less than 12 months in the lease assets and liabilities.
Environmental Costs and Other Contingencies
The Company recognizes liabilities for environmental and other contingencies when there is an exposure that indicates it is both probable that a liability has been incurred and the amount of loss can be reasonably estimated. Where the most likely outcome of a contingency can be reasonably estimated, the Company accrues a liability for that amount. Where the most likely outcome cannot be estimated a range of potential losses is established and, if no one amount in that range is more likely than any other, the amount at the low end of that range is accrued.
The Company records liabilities for environmental contingencies at the undiscounted amounts on the consolidated balance sheets as accrued liabilities and other liabilities when environmental assessments indicate that remediation efforts are probable, and costs can be reasonably estimated. Estimates of the liabilities are based on currently available facts and presently enacted laws and regulations, taking into consideration the likely effects of other societal and economic factors. These estimates are subject to revision in future periods based on actual costs or new circumstances. The Company capitalizes costs that benefit future periods and recognizes a current period charge in operations and maintenance expenses when clean-up efforts do not benefit future periods.
The Company evaluates potential recoveries of amounts from third parties, including insurance coverage, separately from the liability. Recovery is evaluated based on the solvency of the third party, among other factors. When recovery is assured, the Company records and reports an asset separately from the associated liability on the consolidated balance sheets.
Management is not aware of any environmental or other contingencies that would have a material effect on the Financial Statements for the years ended December 31, 2024, 2023 and 2022.
Revenues
Under ASC Topic 606 - Revenue from Contracts with Customers (“ASC 606”), revenue recognition is based on the transfer of control, or the customer’s ability to benefit from the services and products in an amount that reflects the consideration expected to be received in exchange for those services and products. In recognizing revenue for products and services, the transaction price is determined from sales orders or contracts with customers.
The Company generates product revenues from the sale of product that customers purchase for use in the oil and gas industry. Revenues are derived from product sold to customers under supply agreements, the terms of which can extend for over one year, and from spot sales through individual purchase orders executed at prevailing market rates. The Company’s product revenues are primarily a function of the price per ton realized and the volumes sold. Pricing structures under the supply agreements are, in certain cases, subject to certain contractual adjustments and consist of a combination of negotiated pricing and fixed pricing. These arrangements may undergo periodic negotiations regarding pricing and volume requirements, which may occur in volatile market conditions.
The Company generates service revenue by providing transportation, storage solutions, and contract labor services to companies in the oil and gas industry. Transportation services typically consist of transporting product from the plant facilities to the wellsite. The amounts invoiced reflect the transportation services rendered. The amounts invoiced reflect either the contractual monthly minimum, or the length of time the equipment was utilized in the billing period. Labor services provide the customers with supervisory, logistics, or field personnel. The amounts invoiced for storage solutions and contract labor services reflect the amount of time these services were utilized in the billing period. Transportation, storage solutions, and contract labor services are contracted through formal agreements or work orders executed under established pricing terms.
The Company recognizes revenue for product at a point in time following the transfer of control and satisfaction of the performance obligation of such items to the customer, under ASC 606, which typically occurs upon customer pick-up at the facilities. The Company recognizes revenue for services when services are rendered to the customer and the performance obligation is satisfied. The Company’s standard collection terms are generally 30 days, with certain customer payment terms extending up to 60 days.
Certain of the Company’s contracts contain shortfall provisions that calculate agreed upon fees that are billed when the customer does not meet the minimum purchases over a period of time defined in each contract and when collectability is reasonably certain. As the Company does not have the ability to predict customers’ orders over the period, there are constraints around the ability to recognize the variability in consideration related to this condition. The Company recognized shortfall provision revenue of $13.1 million for the year ended December 31, 2024, which was recorded in product sales in the consolidated statements of operations. The Company did not recognize any shortfall revenue for the years ended December 31, 2023 and 2022.
The Company’s revenue was generated in Texas, New Mexico, Ohio, Oklahoma, Pennsylvania, and West Virginia for the year ended December 31, 2024. For the years ended December 31, 2023 and 2022, the Company’s revenue was generated in Texas and New Mexico. Revenue is disaggregated by product and service sales, no further disaggregation of revenue information is provided.
The Company has elected to use the ASC 606 practical expedients, pursuant to which it has excluded disclosures of transaction prices allocated to remaining performance obligations and when it expects to recognize such revenue. The remaining performance obligations are primarily comprised of unfulfilled contracts to deliver product, most of which hold a remaining duration of less than one year, and of which ultimate transaction prices will be allocated entirely to the unfulfilled contracts. The Company’s transaction prices under these contracts may be impacted by market conditions and potential contract negotiations, which have not yet been determined, and are therefore variable in nature.
The Company has elected to exclude from the measurement of the transaction price all taxes assessed by governmental authorities that are both imposed on and concurrent with a specific revenue-producing transaction and collected by the Company from a customer, such as sales tax, use tax, value-added tax and similar taxes.
Deferred Revenue
The Company occasionally receives prepayments from customers for future deliveries of product or contributions in aid of construction. Amounts received from customers in advance of product deliveries are recorded as contract liabilities referred to as deferred revenues and are recognized as revenue upon delivery of the product. Certain prepayments are secured by collateral interest in certain property, plant and equipment. In connection with the Hi-Crush Transaction, the Company acquired customer prepayments and recorded $13.2 million of deferred revenue as of March 5, 2024.
The Company recognized revenue of $8.5 million from deferred revenue for the year ended December 31, 2024. The Company did not recognize any deferred revenue for the year ended December 31, 2023.
Changes in the deferred revenues balance are as follows (in thousands):
| | | |
| December 31, 2024 | |
Beginning Balance | $ | — | |
Customer prepayment acquired in Hi-Crush acquisition | | 13,248 | |
Consideration received and deferred | | 3,025 | |
Revenue recognized | | (8,518 | ) |
Ending Balance | $ | 7,755 | |
Stock-Based Compensation
We account for stock-based compensation, including grants of incentive units, restricted stock awards, time-based restricted stock units and performance share units, under the measurement and recognition provisions of Accounting Standards Codification (“ASC”) 718, Compensation – Stock Compensation (“ASC 718”). We account for stock-based compensation by amortizing the fair value of the stock, which is determined at the grant date, on a straight-line basis unless the tranche method is required.
We account for forfeitures as they occur and reverse any previously recognized stock-based compensation expense for the unvested portion of the awards that were forfeited. The number of forfeited shares shall again be available for purposes of awards under the LTIP. Stock-based compensation expense is recognized as selling, general and administrative expense on the Company’s consolidated statements of operations.
Earnings Per Share
We use the treasury stock method to determine the potential dilutive effect of outstanding restricted stock units and performance share units. We evaluated the potential dilutive effect of Old Atlas Class B Common Stock using the “if-converted” method, noting conversion of Old Atlas Class B Common Stock to Old Atlas Class A Common Stock would not have a dilutive impact to earnings per share. Each share of Old Atlas Class B Common Stock was issued in conjunction with and only as a consequence of the issuance by Atlas Operating of an Operating Unit to a securityholder other than Old Atlas. Old Atlas was a holding company the only assets of which were equity interests in Atlas Operating. Prior to the Up-C Simplification, the earnings of Atlas Operating per unit were attributable to Old Atlas and the other Legacy Owners, as the holders of the outstanding Operating Units. Because each holder of Operating Units other than Old Atlas also held one share of Old Atlas Class B Common Stock, and because Old Atlas consolidated the results of operations of Atlas Operating, the earnings per Operating Unit attributable to the Legacy Owners for the period prior to the Up-C Simplification were derivatively attributable to the corresponding shares of Old Atlas Class B Common Stock held by such Legacy Owners. For that reason, when a Legacy Owner determined to exercise its redemption right and exchange an Operating Unit (and corresponding share of Old Atlas Class B Common Stock), for a share of Old Atlas Class A Common Stock, there was not a dilutive impact to the earnings per share of the Old Atlas Class A Common Stock.
In connection with the Up-C Simplification, each Operating Unit issued and outstanding immediately prior to the effective time of the Mergers (the “Effective Time”), other than Operating Units held by Old Atlas, was exchanged for one share of New Atlas Common Stock, the holders of such Operating Units became stockholders of New Atlas, and all of the Old Atlas Class B Common Stock issued and outstanding immediately prior to the Effective Time was surrendered and cancelled for no consideration. See Note 13 –Earnings Per Share for additional information.
Redeemable Noncontrolling Interest
Prior to the Up-C Simplification, discussed in Note 1- Business and Organization, we accounted for the Legacy Owners’ historical 42.2% economic interest in Atlas Operating through ownership of Operating Units as redeemable noncontrolling interest. The redeemable noncontrolling interest was recognized at the higher of (1) its initial fair value plus accumulated earnings associated with the redeemable noncontrolling interest or (2) the redemption value as of the balance sheet date. The redemption amount was based on the 10-day volume-weighted average closing price of shares of Old Atlas Class A Common Stock at the end of the reporting period. Changes in the redemption value were recognized immediately as they occurred, as if the end of the reporting period was also the redemption date for the instrument, with an offsetting entry to retained earnings, or additional paid-in capital in the absence of retained earnings and further to accumulated deficit in the absence of additional paid in capital.
In connection with the Up-C Simplification, each Operating Unit issued and outstanding immediately prior to the Effective Time, other than Operating Units held by Old Atlas, was exchanged for one share of New Atlas Common Stock, and the holders of such Operating Units became stockholders of New Atlas, and all of the Old Atlas Class B Common Stock issued and outstanding immediately prior to the Effective Time were surrendered and cancelled for no consideration. The Up-C Simplification was a common control transaction; therefore, the redeemable noncontrolling interest was acquired as an equity transaction. The redeemable noncontrolling interest was adjusted to the maximum redemption amount based on the 10-day volume-weighted average closing price of shares of Old Atlas Class A Common Stock at the redemption date. The carrying amount of the redeemable noncontrolling interest was reclassified to reflect the change in the Company’s ownership interest with an offsetting entry to additional paid-in capital.
For the years ended December 31, 2024 and 2023, the Company had no remaining redeemable noncontrolling interest.
Cost of Sales, Excluding Depreciation, Depletion and Accretion Expense
Cost of sales, excluding depreciation, depletion and accretion expense, related to product sales primarily consists of the cost to produce product, including direct and indirect labor, employee housing costs, excavation costs, rental equipment, maintenance expense, utilities, natural gas and royalty expense. Product related costs were $262.7 million, $131.8 million, and $130.8 million for the years ended December 31, 2024, 2023 and 2022, respectively.
Cost of sales, excluding depreciation, depletion and accretion expense, related to service sales primarily consists of direct and indirect labor, transportation costs and rental equipment. Service-related costs were $462.5 million, $128.6 million, and $68.1 million for the years ended December 31, 2024, 2023 and 2022, respectively.
Selling, General and Administrative Expense
Selling, general and administrative expense primarily consists of non-production personnel wages and benefits, insurance expense, travel and entertainment, advertising expense, professional fees, rent expense for the Company’s corporate office and office supplies, among other expenses to support the business.
Defined Contribution Plans
The Company has defined contribution plans covering substantially all employees who meet certain service and eligibility requirements. The Company’s matching contribution to defined contribution plans was approximately $1.3 million, $0.7 million, and $0.5 million for the years ended December 31, 2024, 2023 and 2022, respectively.
Income Taxes
For the purposes of this discussion, references to “Atlas Inc.” are to Old Atlas for reporting periods prior to the completion of the Up-C Simplification (the “Closing”), and to New Atlas following the Closing. Atlas Inc. is a corporation and it is subject to U.S. federal, state and local income taxes. The financial statement implications related to deferred tax liabilities of the Reorganization and Up-C Simplification referenced in Note 1 - Business and Organization and the tax impact of the Company’s status as a taxable corporation subject to U.S. federal, state and local income taxes have been reflected in the accompanying Financial Statements.
The Company, under ASC 740–Income Taxes (“ASC 740”), uses the asset and liability method of accounting for income taxes. Under the asset and liability method, deferred tax assets and liabilities are recognized for future tax consequences attributable to differences between the financial statement carrying amounts of existing assets and liabilities and their respective tax bases. Deferred tax assets and liabilities are measured using enacted tax rates in effect for the year in which those temporary differences are expected to be recovered or settled. The effect of a change in tax rate on deferred tax assets and liabilities is recognized in earnings in the period that includes the enactment date. A valuation allowance will be provided for deferred tax assets if it is more likely than not the deferred tax assets will not be realized.
Atlas LLC, the predecessor of Old Atlas, was organized as a limited liability company. As a limited liability company, Atlas LLC has either been treated as a disregarded entity or a partnership for income tax purposes and, therefore, is not subject to U.S. federal income tax. Rather, the U.S. federal income tax liability with respect to the taxable income of Atlas LLC was passed through to its owners.
ASC 740 prescribes a recognition threshold and a measurement attribute for the financial statement recognition and measurement of tax positions taken or expected to be taken in a tax return. The Company evaluates the uncertainty in tax positions taken or expected to be taken in the course of preparing the Financial Statements to determine whether the tax positions are more likely than not of being sustained by the applicable tax authority. However, the conclusions regarding the evaluation are subject to review and may change based on factors including, but not limited to, ongoing analysis of tax laws, regulations, and interpretations thereof.
Segments
The Company operates as one operating segment. Operating segments are defined as components of an enterprise for which separate financial information is evaluated regularly by the chief operating decision maker (“CODM”). The Company’s CODM is the President and Chief Executive Officer.
The CODM evaluates the Company’s financial information and performance on a consolidated basis for purposes of making operating decisions and allocating resources. The Company operates with centralized functions and delivers most of its products and services in a similar way to all customers. See Note 16 - Business Segment for more information.
Recently Issued Accounting Pronouncements
Segments- In November 2023, the Financial Accounting Standard Board (“FASB”) issued ASU 2023-07, Segment Reporting (Topic 280): Improvements to Reportable Segment Disclosures to improve reportable segment disclosure requirements, primarily through enhanced disclosures about significant segment expenses and information used to assess segment performance. The ASU is effective for fiscal years beginning after December 15, 2023 on a retrospective basis, and for interim periods within fiscal years beginning after December 15, 2024. Early adoption is permitted. The Company adopted ASU 2023-07 for this Annual Report, refer to Note 16- Business Segment.
Recently Issued Accounting Pronouncements Not Yet Effective
Income Statement Reporting Disclosures- In November 2024, the FASB issued ASU 2024-03, Income Statement-Reporting Comprehensive Income-Expense Disaggregation Disclosures (Subtopic 220-40). The amendments in this update requires additional disclosure of certain costs and expenses within the notes to the financial statements. The new standard is effective for annual periods beginning after December 15, 2026 and interim periods beginning after December 15, 2027. The Company is currently evaluating the impact on the Financial Statements and related disclosures.
Income Taxes- In December 2023, the FASB issued ASU 2023-09, Income Taxes (Topic 740): Improvements to Income Tax Disclosures. The standard requires disaggregated information about a reporting entity's effective tax rate reconciliation as well as information on income taxes paid. The standard is intended to benefit investors by providing more detailed income tax disclosures that would be useful in making capital allocation decisions and applies to all entities subject to income taxes. The new standard is effective for annual periods beginning after December 15, 2024. The Company is currently evaluating the impact on the Financial Statements and related disclosures.
Note 3 – Hi-Crush Transaction
On March 5, 2024, the Company completed the Hi-Crush Transaction and acquired 100% of Hi-Crush's ownership interest and certain of its wholly-owned subsidiaries. The Hi-Crush Transaction expanded the Company's position as a leading provider of proppant and proppant logistics in the Permian Basin to meet the needs of our large-scale customers in the Permian Basin.
The Company had adjustments to consideration from Closing Date to December 31, 2024. Refer to the table below for the acquisition-date fair value of the consideration as of March 5, 2024 and the adjustments as of December 31, 2024 (in thousands):
| | | | | | | | | | | | | |
| | March 5, 2024 | | | Adjustments | | | December 31, 2024 | | |
Cash to sellers at close | | $ | 140,146 | | | $ | — | | | $ | 140,146 | | |
Company Transaction Expenses (sellers' transaction expenses) (1) | | | 9,019 | | | | — | | | | 9,019 | | |
Stock consideration (2) | | | 189,082 | | | | — | | | | 189,082 | | |
Deferred Cash Consideration Note (1) | | | 109,253 | | | | (2,640 | ) | | | 106,613 | | |
Stockholders’ Representative Expense Fund (1) | | | 50 | | | | — | | | | 50 | | |
Estimated Adjustment Holdback Amount (1) (3) | | | 5,338 | | | | 5,852 | | | | 11,190 | | |
Total | | $ | 452,888 | | | $ | 3,212 | | | $ | 456,100 | | |
(1) Refer to the Hi-Crush Merger Agreement, a copy of which is included as Exhibit 2.3 to this Annual Report.
(2) Stock consideration is measured at fair value as of the Closing Date by taking the product of (a) the closing shares of 9,711,432 as defined in the Hi-Crush Merger Agreement and (b) the low price per share of $19.47 on March 5, 2024, which is in line with ASC 820, “Fair Value Measurement” and company policy as an accounting policy election under ASC 235, “Notes to Financial Statements.”
(3) Represents a cash holdback, which was subject to changes from estimated to actual net working capital amounts and other customary purchase price adjustments.
The Company has applied the acquisition method of accounting in accordance with ASC 805, “Business Combinations,” and recognized assets acquired and liabilities assumed at their fair values as of the date of acquisition, with the excess purchase consideration recorded to goodwill. The fair value of acquired property and equipment were based on both available market data and a cost approach. As the Company finalizes the estimation of the fair value of the assets acquired and liabilities assumed, additional adjustments may be recorded during the measurement period (a period not to exceed 12 months from the acquisition date).
The following table summarizes the preliminary allocation of the purchase price to the fair value of assets acquired and liabilities assumed as of March 5, 2024, including measurement period adjustments through December 31, 2024 (in thousands):
| | | | | | | | | | | | | |
| | Fair Value | | |
| | March 5, 2024 | | | Adjustments | | | December 31, 2024 | | |
Cash and cash equivalents | | $ | 6,982 | | | $ | — | | | $ | 6,982 | | |
Accounts receivable | | | 96,393 | | | | — | | | | 96,393 | | |
Inventories | | | 4,235 | | | | — | | | | 4,235 | | |
Spare parts inventories | | | 3,101 | | | | — | | | | 3,101 | | |
Prepaid expenses and other current assets | | | 2,180 | | | | — | | | | 2,180 | | |
Property, plant and equipment | | | 277,584 | | | | 22,842 | | | | 300,426 | | |
Intangible assets | | | 111,723 | | | | 3,353 | | | | 115,076 | | |
Operating lease right-of-use assets | | | 10,868 | | | | — | | | | 10,868 | | |
Finance lease right-of-use assets | | | 7,311 | | | | — | | | | 7,311 | | |
Other long-term assets | | | 92 | | | | — | | | | 92 | | |
Accounts payable | | | (37,736 | ) | | | — | | | | (37,736 | ) | |
Accrued liabilities | | | (13,162 | ) | | | (2,190 | ) | | | (15,352 | ) | |
Current portion of long-term debt | | | (1,914 | ) | | | — | | | | (1,914 | ) | |
Current portion of operating lease liabilities | | | (6,388 | ) | | | — | | | | (6,388 | ) | |
Current portion of finance lease liabilities | | | (3,299 | ) | | | — | | | | (3,299 | ) | |
Current portion of deferred revenue | | | (3,302 | ) | | | — | | | | (3,302 | ) | |
Other current liabilities (1) | | | (1,221 | ) | | | — | | | | (1,221 | ) | |
Long-term debt, net of discount and deferred financing costs | | | (252 | ) | | | — | | | | (252 | ) | |
Deferred tax liabilities | | | (70,378 | ) | | | 1,379 | | | | (68,999 | ) | |
Operating lease liabilities | | | (4,479 | ) | | | — | | | | (4,479 | ) | |
Finance lease liabilities | | | (4,012 | ) | | | — | | | | (4,012 | ) | |
Deferred revenue | | | (9,946 | ) | | | — | | | | (9,946 | ) | |
Asset retirement obligation | | | (2,663 | ) | | | — | | | | (2,663 | ) | |
Goodwill | | | 91,171 | | | | (22,172 | ) | | | 68,999 | | |
Net Assets Acquired (2) | | $ | 452,888 | | | $ | 3,212 | | | $ | 456,100 | | |
(1) The March 5, 2024 presentation includes the current portion of operating lease liabilities, current portion of finance lease liabilities, and current portion of deferred revenue. These balances were previously included within other current liabilities on our Quarterly Report on Form 10-Q for the quarter ended March 31, 2024, filed with the SEC on May 8, 2024.
(2) The March 5, 2024 presentation includes operating lease liabilities, finance lease liabilities, deferred revenue, and asset retirement obligation. These balances were previously included within other long-term liabilities on our Quarterly Report on Form 10-Q for the quarter ended March 31, 2024, filed with the SEC on May 8, 2024.
The preliminary purchase price allocation is subject to further refinement and may require significant adjustments to arrive at the final purchase price allocation. The above fair values of assets acquired and liabilities assumed are preliminary and are based on the information that was available as of the reporting date. The Company retained an independent appraiser to determine the fair value of assets acquired and liabilities assumed. In accordance with the acquisition method of accounting, the purchase price of Hi-Crush has been allocated to the acquired assets and assumed liabilities based on their preliminary estimated acquisition date fair values. The fair value estimates were based on income, market, and cost valuation methods. These fair values were based on inputs that are not observable in the market and thus represent Level 3 inputs. Several significant assumptions and estimates were involved in the application of these valuation methods, including discount rates, future expected cash flows and other future events that are based on the Company's best judgment from the information available. The excess of the total consideration over the estimated fair value of the amounts initially assigned to the identifiable assets acquired and liabilities assumed has been recorded as goodwill. The final determination of the fair value of certain assets and liabilities will be completed as soon as the necessary information becomes available but no later than one year from the acquisition date. The primary areas of the preliminary purchase price allocation that are not yet finalized relate to the valuation of deferred income taxes. The Company expects to continue to obtain information for the purpose of determining the fair value of the assets acquired and liabilities assumed on the acquisition date throughout the remainder of the measurement period. For the year ended December 31, 2024, we had purchase price adjustments of $3.2 million in net assets acquired and reclassifications within property, plant, and equipment. This resulted in an increase to current period depreciation, depletion and accretion expense, amortization expense, and interest expense recorded within the consolidated statements of operations for the year ended December 31, 2024.
The Company’s consolidated statement of operations includes revenue of $509.2 million and direct operating expenses of $366.7 million for the year ended December 31, 2024, respectively, attributable to the acquired Hi-Crush operations. Of the $69.0 million of goodwill recognized, $33.8 million is considered non-deductible goodwill primarily attributable to synergies and economies of scale expected from combining Hi-Crush's Permian Basin proppant production and logistics operations with the Company's operations.
The following transactions were recognized separately from the acquisition of assets and assumptions of liabilities in the Hi-Crush Transaction.
•Transaction costs consisting of legal and professional fees. For the year ended December 31, 2024, the Company incurred $18.9 million of transaction costs, which were expensed as incurred and presented in selling, general and administrative expenses in the consolidated statements of operations.
•In connection with the Hi-Crush Transaction, the Company entered into the First Amendment to Loan, Security and Guaranty Agreement (the “ABL Amendment”) and the First Amendment to Credit Agreement (the “Term Loan Amendment”). See Note 9 – Debt for further information.
Identifiable Intangible Assets Acquired
The following table summarizes key information underlying identifiable intangible assets related to the Hi-Crush Transaction (in thousands):
| | | | | | | | |
| | Useful Life (In years) | | | Fair Value
(In thousands) | |
Customer relationships | | | 10 | | | $ | 100,226 | |
Trade name | | 3 | | | | 14,850 | |
Total | | | | | $ | 115,076 | |
The preliminary estimate of the fair value of the identifiable intangible assets was determined primarily using the income approach, which requires a forecast of all of the expected future cash flows either through the with or without method or the RFR method.
•Customer relationships were valued using the with or without method. The with or without method is an approach that considers the hypothetical impact to the projected cash flows of the business if the intangible assets were not put in place.
•Trade name was valued using the RFR method. The RFR method of valuation suggests that in lieu of ownership, the acquirer can obtain comparable rights to use the subject asset via a license from a hypothetical third-party owner. The asset’s fair value is the present value of license fees avoided by owning it (i.e., the royalty savings).
Reserves
The preliminary estimate of the fair value of the reserves were valued at $43.0 million using the income approach. Reserves are recorded in property, plant and equipment, net on the Company's consolidated balance sheets. Reserves were valued using the MPEEM. The MPEEM is an approach where the net earnings attributable to the asset being measured are isolated from other “contributory assets” over the intangible asset’s remaining economic life.
Pro Forma Financial Information
The following table summarizes, on an unaudited pro forma basis, the combined results of operations of the Company for the year ended December 31, 2024 and 2023, assuming the Hi-Crush Transaction had occurred on January 1, 2023 (in thousands).
| | | | | | | | |
| | For the Year Ended | |
| | December 31, | |
| | 2024 | | | 2023 | |
| | (unaudited) | |
Revenue | | $ | 1,171,272 | | | $ | 1,201,473 | |
Net income | | $ | 81,484 | | | $ | 289,639 | |
The foregoing unaudited pro forma results are for informational purposes only and are not necessarily indicative of the actual results of operations that might have occurred had the Hi-Crush Transaction occurred on January 1, 2023, nor are they necessarily indicative of future results.
The unaudited pro forma information for all periods presented includes the following adjustments, where applicable, for business combination accounting effects resulting from the Hi-Crush Transaction: (i) additional amortization expense related to finite-lived intangible assets acquired, (ii) additional interest expense related to financing for the acquisition, (iii) depreciation or depletion expense on property, plant and equipment, (iv) depreciation and interest on finance leases, and (v) the related tax effects assuming that the acquisition occurred on January 1, 2023. No assumptions have been applied to the pro forma results of operations regarding potential operating cost savings or other business synergies expected to be achieved.
The significant nonrecurring adjustments reflected in the unaudited pro-forma consolidated information above include the reclassification of the transaction costs of $18.9 million to the earliest period presented.
Note 4 – Goodwill and Acquired Intangible Assets
Goodwill
Changes in the carrying value of goodwill (in thousands):
| | | | |
Balance at December 31, 2023 | | $ | — | |
Hi-Crush Transaction | | | 68,999 | |
Balance at December 31, 2024 | | $ | 68,999 | |
The Company has applied the acquisition method of accounting in accordance with ASC 805, “Business Combinations,” and recognized assets acquired and liabilities assumed from the Hi-Crush Transaction at their fair value as of the date of acquisition, with the excess purchase consideration recorded to goodwill. As the Company finalizes the estimation of the fair value of the assets acquired and liabilities assumed, additional adjustments to the amount of goodwill may be necessary, refer to Note 3 - Hi-Crush Transaction for further discussion.
Goodwill is not amortized, but is evaluated for impairment annually or more frequently when indicators of impairment exist. We evaluated events and circumstances since the Hi-Crush Transaction, including macroeconomic conditions, industry and market conditions, and our overall financial performance. There were no triggering events identified, therefore, no impairment charges were recorded related to goodwill for the year ended December 31, 2024.
Acquired Intangible Assets
The following table presents the detail of acquired intangible assets other than goodwill as of December 31, 2024 (in thousands):
| | | | | | | | | | | | |
| | Carrying Amount | | | Accumulated Amortization | | | Net | |
Customer relationships | | $ | 100,226 | | | $ | (8,244 | ) | | $ | 91,982 | |
Trade name | | | 14,850 | | | | (4,072 | ) | | | 10,778 | |
Total | | $ | 115,076 | | | $ | (12,316 | ) | | $ | 102,760 | |
Amortization expense recognized during the year ended December 31, 2024 was $12.3 million, and was recorded in amortization expense of acquired intangible assets on the consolidated statements of operations. Refer to Note 3 - Hi-Crush Transaction for additional information over these acquired intangible assets.
Estimated future amortization expense is as follows (in thousands):
| | | | |
2025 | | $ | 14,973 | |
2026 | | | 14,973 | |
2027 | | | 10,901 | |
2028 | | | 10,023 | |
2029 | | | 10,023 | |
Thereafter | | | 41,867 | |
Total | | $ | 102,760 | |
The Company did not recognize impairment of definite-lived intangible assets for the years ended December 31, 2024, 2023, and 2022.
Note 5—Inventories
Inventories consisted of the following (in thousands):
| | | | | | | | |
| | December 31, 2024 | | | December 31, 2023 | |
Raw materials | | $ | 2,793 | | | $ | 441 | |
Work-in-process | | | 7,641 | | | | 4,937 | |
Finished goods | | | 6,868 | | | | 1,071 | |
Inventories | | $ | 17,302 | | | $ | 6,449 | |
For the years ended December 31, 2024 and 2023, no inventory reserve was deemed necessary.
Note 6—Property, Plant and Equipment, Net
Property, plant and equipment, net, consisted of the following (in thousands):
| | | | | | | | |
| | December 31, 2024 | | | December 31, 2023 | |
Plant facilities associated with productive, depletable properties | | $ | 308,147 | | | $ | 243,618 | |
Plant equipment | | | 770,738 | | | | 489,953 | |
Land | | | 8,402 | | | | 3,197 | |
Furniture and office equipment | | | 2,587 | | | | 2,362 | |
Computer and network equipment | | | 2,047 | | | | 1,648 | |
Buildings and leasehold improvements | | | 46,738 | | | | 32,558 | |
Logistics equipment | | | 94,946 | | | | 48,139 | |
Construction in progress | | | 485,515 | | | | 248,004 | |
Property, plant and equipment | | | 1,719,120 | | | | 1,069,479 | |
Less: Accumulated depreciation and depletion | | | (232,874 | ) | | | (134,819 | ) |
Property, plant and equipment, net | | $ | 1,486,246 | | | $ | 934,660 | |
Depreciation expense recognized in depreciation, depletion and accretion expense was $87.4 million, $33.6 million, and $22.0 million for the years ended December 31, 2024, 2023, and 2022 respectively. Depletion expense recognized in depreciation, depletion and accretion expense was $10.1 million, $5.8 million, and $5.4 million for the years ended December 31, 2024, 2023, and 2022, respectively. Depreciation expense recognized in selling, general and administrative expense was $3.5 million, $1.8 million, and $1.1 million for the years ended December 31, 2024, 2023, and 2022, respectively.
Impairment or Disposal of Long-Lived Assets
The Company reviews long-lived assets for impairment whenever events or changes in circumstances indicate that the asset’s carrying amount may not be recoverable. The Company conducts its long-lived asset impairment analyses in accordance with ASC 360-10-15, “Impairment or Disposal of Long-Lived Assets.”
During the second quarter of 2024, the Company concluded it had a triggering event requiring an assessment for impairment as a result of the fire at one of the Kermit facilities that caused damage to the physical condition of the Kermit asset group. The Company groups assets and liabilities at the lowest level for which identifiable cash flows are largely independent of the cash flows of other assets and liabilities and evaluates the asset group against the sum of the undiscounted future cash flows. If the undiscounted cash flows do not indicate the carrying amount of the asset group is recoverable, an impairment charge is measured as the amount by which the carrying amount of the asset group exceeds its fair value based on discounted cash flow analysis. The Company performed a recoverability test and determined there was no impairment of the associated asset group for the year ended December 31, 2024. The Company recorded a $11.1 million loss from the disposal.
During the third quarter of 2024, the Company disposed of a dredge asset that was damaged during commissioning at one of the Kermit facilities. The Company recorded a $8.6 million loss from the disposal.
For the year ended December 31, 2024, the Company recognized a total loss on disposal of assets of $19.7 million, which is recorded as a loss on disposal of assets on the consolidated statements of operations, and did not recognize a loss on disposal of assets for the years ended December 31, 2023 and 2022. The Company did not recognize an impairment of long-lived assets for the years ended December 31, 2024, 2023, and 2022.
Note 7—Accrued Liabilities
Accrued liabilities consisted of the following (in thousands):
| | | | | | | | |
| | December 31, 2024 | | | December 31, 2023 | |
Accrued capital expenditures | | $ | 2,559 | | | $ | 7,317 | |
Accrued personnel costs | | | 7,775 | | | | 4,370 | |
Accrued production costs | | | 33,400 | | | | 5,627 | |
Accrued royalties | | | 2,899 | | | | 2,356 | |
Professional services | | | 4,139 | | | | 1,251 | |
Taxes payable | | | 4,022 | | | | 3,373 | |
Other | | | 5,500 | | | | 4,164 | |
Total accrued liabilities | | $ | 60,294 | | | $ | 28,458 | |
Note 8—Leases
Lessor Arrangements
The Company leases certain well site storage equipment to customers through operating leases as part of our logistics services that were acquired through the Hi-Crush Transaction. These agreements are short term in nature and have monthly terms with no renewal options that are reasonably certain to exercise, or early termination options based on established terms specific to the individual agreement. The revenue associated with these agreements is not material to the consolidated statement of operations for the year ended December 31, 2024.
Lessee Arrangements
The Company has operating and finance leases primarily for office space, equipment, and vehicles. The terms and conditions for these leases vary by the type of underlying asset.
Certain leases include variable lease payments for items such as property taxes, insurance, maintenance, and other operating expenses associated with leased assets. Payments that vary based on an index or rate are included in the measurement of lease assets and liabilities at the rate as of the commencement date. All other variable lease payments are excluded from the measurement of lease assets and liabilities, and are recognized in the period in which the obligation for those payments is incurred.
The components of lease cost were as follows (in thousands):
| | | | | | | | |
| For the Year Ended | | |
| December 31, | | |
| 2024 | | | 2023 | | |
Finance lease cost: | | | | | | |
Amortization of right-of-use assets | $ | 2,886 | | | $ | 4,358 | | |
Interest on lease liabilities | | 309 | | | | 1,748 | | |
Operating lease cost | | 7,952 | | | | 1,111 | | |
Variable lease cost | | 597 | | | | 651 | | |
Short-term lease cost | | 75,866 | | | | 25,763 | | |
Total lease cost | $ | 87,610 | | | $ | 33,631 | | |
Supplemental cash flow and other information related to leases were as follows (in thousands):
| | | | | | | | |
| For the Year Ended | | |
| December 31, | | |
| 2024 | | | 2023 | | |
Cash paid for amounts included in the measurement of lease liabilities: | | | | | | |
Operating cash outflows from operating leases | $ | 6,563 | | | $ | 1,312 | | |
Operating cash outflows from finance leases | $ | 309 | | | $ | 1,748 | | |
Financing cash outflows from finance leases | $ | 2,622 | | | $ | 2,001 | | |
Right-of-use assets obtained in exchange for new lease liabilities: | | | | | | |
Operating leases | $ | 16,105 | | | $ | 559 | | |
Finance leases | $ | 7,666 | | | $ | 25,063 | | |
Lease terms and discount rates were as follows:
| | | | | | | | |
| | December 31, 2024 | | | December 31, 2023 | |
Weighted-average remaining lease term: | | | | | | |
Operating leases | | 4.4 years | | | 3.6 years | |
Finance leases | | 2.0 years | | | 3.6 years | |
Weighted-average discount rate: | | | | | | |
Operating leases | | | 5.7 | % | | | 4.7 | % |
Finance leases | | | 5.6 | % | | | 5.2 | % |
Future minimum lease commitments as of December 31, 2024, are as follows (in thousands):
| | | | | | | | |
| | Finance | | | Operating | |
2025 | | $ | 3,032 | | | $ | 7,185 | |
2026 | | | 2,084 | | | | 668 | |
2027 | | | 418 | | | | 1,537 | |
2028 | | | 50 | | | | 1,460 | |
2029 | | | — | | | | 1,492 | |
Thereafter | | | — | | | | 4,061 | |
Total lease payments | | | 5,584 | | | | 16,403 | |
Less imputed interest | | | 290 | | | | 2,327 | |
Total | | $ | 5,294 | | | $ | 14,076 | |
On the consolidated balance sheets, the December 31, 2023 current portion of operating lease liabilities and current portion of finance lease liabilities were reclassified out of other current liabilities to the current portion of operating lease liabilities and current portion of finance lease liabilities, respectively, for comparable presentation with the current period. In addition, the December 31, 2023 operating lease liabilities and finance lease liabilities were reclassified out of other long-term liabilities to operating lease liabilities and finance lease liabilities, respectively, on the consolidated balance sheets for comparable presentation with the current period.
On July 31, 2023, Atlas LLC entered into a credit agreement (the “2023 Term Loan Credit Agreement”) with Stonebriar, as administrative agent and initial lender, pursuant to which Stonebriar extended Atlas LLC a term loan credit facility comprising a $180.0 million single advance term loan that was made on July 31, 2023 (the “Initial Term Loan”) and commitments to provide up to $100.0 million of delayed draw term loans (the “DDT Loan”) (collectively, the “2023 Term Loan Credit Facility”). Proceeds from the 2023 Term Loan Credit Facility were used to repay $133.4 million of 2021 Term Loan Credit Facility (defined in Note 9 - Debt) principal and accrued interest, terminate $42.8 million of finance lease liabilities, as well as acquire $39.5 million of finance lease assets associated with certain equipment lease arrangements with Stonebriar. There was no gain or loss recognized as a result of this transaction. See Note 9 - Debt for further discussion on the 2023 Term Loan Credit Facility.
On July 28, 2022, Atlas LLC entered into a master lease agreement with Stonebriar for the right, but not the obligation, to fund up to $10.0 million of purchases of dredges and related equipment. The interim financing for down payments on any purchased equipment is based on one-month Secured Overnight Financing Rate (“SOFR”), plus 8.0%. The final interest rate is set upon acceptance of the equipment based on the terms of the agreement. On July 31, 2023, in connection with entering into the 2023 Term Loan Credit Agreement, all obligations under this master lease agreement were terminated, all associated assets were acquired and this master lease agreement was terminated. There was no gain or loss recognized as a result of this transaction.
On May 16, 2022, Atlas LLC entered into a master lease agreement with Stonebriar for the right, but not the obligation, to fund up to $70.0 million of purchases of transportation and logistics equipment. The interim financing for down payments on any purchased equipment is based on one-month SOFR, plus 8.0%. The final interest rate is set upon acceptance of the equipment based on the terms of the agreement. On July 31, 2023, in connection with entering into 2023 Term Loan Credit Agreement, all obligations under this master lease agreement were terminated, all associated assets were acquired and this master lease agreement was terminated. There was no gain or loss recognized as a result of this transaction.
As of December 31, 2024, we had no additional material leases that have not yet commenced.
Note 9—Debt
Debt consists of the following (in thousands):
| | | | | | | | |
| | December 31, | | | December 31, | |
| | 2024 | | | 2023 | |
Initial Term Loan under the 2023 Term Loan Credit Facility | | $ | 180,000 | | | $ | 180,000 | |
ADDT Loan | | | 135,617 | | | | — | |
DDT Loan under the 2023 Term Loan Credit Facility | | | 20,000 | | | | — | |
2023 ABL Credit Facility | | | 70,000 | | | | — | |
Deferred Cash Consideration Note | | | 111,252 | | | | — | |
Other indebtedness | | | 4,058 | | | | — | |
Less: Debt discount, net of accumulated amortization of $4,009 and $480, respectively | | | (9,380 | ) | | | (6,769 | ) |
Less: Deferred financing fees, net of accumulated amortization of $255 and $29, respectively | | | (822 | ) | | | (411 | ) |
Less: Current portion (a) | | | (43,736 | ) | | | — | |
Long-term debt | | $ | 466,989 | | | $ | 172,820 | |
(a) The current portion of long-term debt reflects payments based on the terms of the 2023 Term Loan Credit Facility, the ADDT Loan, and other indebtedness. | |
Deferred Cash Consideration Note
In accordance with the Hi-Crush Merger Agreement, the Company issued a secured PIK toggle seller note in an aggregate principle amount of $111.3 million as of December 31, 2024. This amount is subject to purchase price adjustments as defined in the Hi-Crush Merger Agreement, with a final maturity date of January 31, 2026 (the “Deferred Cash Consideration Note”). As discussed in Note 3 - Hi-Crush Transaction, the Deferred Cash Consideration Note was part of the consideration transferred and valued at fair value at the acquisition date. The Deferred Cash Consideration Note bears interest at a rate of 5.00% per annum if paid in cash, or 7.00% per annum if paid in kind. Interest on the Deferred Cash Consideration Note is payable quarterly in arrears beginning March 29, 2024 through maturity. Interest expense associated with the Deferred Cash Consideration Note was $4.6 million for the year ended December 31, 2024.
The Deferred Cash Consideration Note included $4.6 million of debt discount and approximately $0.1 million deferred financing costs. The discount and deferred financing costs are a direct reduction from the carrying amount of the debt obligation on the Company’s consolidated balance sheets and are amortized to interest expense using the effective interest method. Interest expense associated with the discount and deferred financing costs were approximately $2.0 million in total for the year ended December 31, 2024.
Atlas LLC’s obligations under the Deferred Cash Consideration Note are secured by certain of the assets acquired in connection with the Hi-Crush Transaction. The Deferred Cash Consideration Note is also unconditionally guaranteed by Atlas LLC on an unsecured basis.
2023 Term Loan Credit Facility
On July 31, 2023, Atlas LLC entered into the 2023 Term Loan Credit Agreement.
The Initial Term Loan is payable in 84 consecutive monthly installments and a final payment of the remaining outstanding principal balance at maturity. The Initial Term Loan has a final maturity date of July 31, 2030 (the “Maturity Date”) and bears interest at a rate equal to 9.50% per annum. Interest expense associated with the Initial Term Loan was $17.1 million and $7.1 million for the years ended December 31, 2024, and 2023, respectively, and the interest expense associated with the discount and deferred financing costs was $1.3 million and $0.5 million for the years ended December 31, 2024 and 2023, respectively.
Each DDT Loan under the 2023 Term Loan Credit Facility will be payable in equal monthly installments, with the monthly installments comprising 80% of the DDT Loan and a final payment of the remaining 20% of the outstanding principal balance due at maturity, unless earlier prepaid. The DDT Loan will bear interest at a rate equal to the applicable Term SOFR Rate as of each Delayed Draw Funding Date (each as defined in the 2023 Term Loan Credit Agreement) plus 5.95% per annum. All monthly installments with respect to the Initial Term Loan and the DDT Loan payable on or prior to January 1, 2025 will be interest only.
On November 8, 2024, the Company drew down $20.0 million of the available $100.0 million from Stonebriar under the DDT Loan with interest (computed on the basis of a 365-day year for the actual number of days elapsed) on the unpaid principal amount hereof from and including the date hereof until paid in full at the rate per annum equal to 10.58%. This DDT Loan shall be payable in 69 consecutive monthly installments commencing on December 1, 2024 and continuing on each Payment Day up to and including August 1, 2030 and then a final installment also payable on August 1, 2030. The Company had interest expense of $0.3 million for the year ended December 31, 2024. The DDT Loan included de minimis financing costs.
At any time prior to the Maturity Date, Atlas LLC may redeem loans outstanding under the 2023 Term Loan Credit Facility, in whole or in part, at a price equal to 100% of the principal amount being prepaid (the “Prepayment Amount”) plus a prepayment fee. The prepayment fee is equal to 8% of the Prepayment Amount for any prepayment that occurs on or prior to December 31, 2024, 4% of the Prepayment Amount for any prepayment that occurs after December 31, 2024 but on or prior to December 31, 2025, 3% of the Prepayment Amount for any prepayment that occurs after December 31, 2025 but on or prior to December 31, 2026 and 2% of the Prepayment Amount for any prepayment that occurs thereafter. Upon the maturity of the 2023 Term Loan Credit Facility, the entire unpaid principal amount of the loans outstanding thereunder, together with interest, fees and other amounts payable in connection with the facility, will be immediately due and payable without further notice or demand.
Dividends and distributions to equity holders are permitted to be made pursuant to certain limited exceptions and baskets described in the 2023 Term Loan Credit Agreement and otherwise generally subject to certain restrictions set forth in the 2023 Term Loan Credit Agreement, including the requirements that (a) no Event of Default (as defined under the 2023 Term Loan Credit Agreement) has occurred and is continuing and (b) Atlas LLC maintains at least $30.0 million of Liquidity (as defined under the 2023 Term Loan Credit Agreement) pro forma for the Restricted Payment (as defined under the 2023 Term Loan Credit Agreement).
The 2023 Term Loan Credit Facility includes certain non-financial covenants, including but not limited to restrictions on incurring additional debt and certain distributions. The 2023 Term Loan Credit Facility is subject to a maximum 4.0 to 1.0 Leverage Ratio (as defined in the 2023 Term Loan Credit Agreement) financial covenant. Such financial covenant is tested as of the last day of each fiscal quarter.
Proceeds from the 2023 Term Loan Credit Facility were used to repay outstanding indebtedness under our previous 2021 Term Loan Credit Facility, to repay obligations outstanding under certain equipment lease arrangements with Stonebriar and for general corporate purposes. As of December 31, 2024, Atlas LLC was in compliance with the covenants of the 2023 Term Loan Credit Facility.
The 2023 Term Loan Credit Facility is unconditionally guaranteed, jointly and severally, by Atlas LLC and its subsidiaries and secured by substantially all of the assets of Atlas LLC and its subsidiaries. The 2023 Term Loan Credit Facility is unconditionally guaranteed on an unsecured basis by Atlas Energy Solutions Inc.
First Amendment to the 2023 Term Loan Credit Agreement
On February 26, 2024, the Company, Atlas LLC and certain other subsidiaries of the Company entered into the Term Loan Amendment, among Company, Atlas LLC, the lenders party thereto and Stonebriar, as administrative agent, which amends the 2023 Term Loan Credit Agreement.
The Term Loan Amendment provided an additional delayed draw term loan (the “ADDT Loan”) in the aggregate principal amount of $150.0 million with interest (computed on the basis of a 365-day year for the actual number of days elapsed) on the unpaid principal amount thereof from and including the date of the amendment until paid in full at the rate per annum equal to 10.86%. The ADDT Loan is payable in 76 consecutive monthly installments of combined principal and interest each in the amount of $2.7 million commencing April 1, 2024 and continuing up to and including August 1, 2030. There was interest expense of $13.0 million for the year ended December 31, 2024.
The ADDT Loan included $1.5 million of debt discount and $0.5 million in deferred financing costs. The discount and deferred financing costs are a direct reduction from the carrying amount of the debt obligation on the Company’s consolidated balance sheets and are amortized to interest expense using the effective interest method. Interest expense associated with the discount and deferred financing costs were $0.4 million in total for the year ended December 31, 2024.
2023 ABL Credit Facility
On February 22, 2023, Atlas LLC, certain of its subsidiaries, as guarantors, Bank of America, N.A., as administrative agent (the “ABL Agent”), and certain financial institutions party thereto as lenders (the “2023 ABL Lenders”) entered into a Loan, Security and Guaranty Agreement (the “2023 ABL Credit Agreement”) pursuant to which the 2023 ABL Lenders provide revolving credit financing to the Company in an aggregate principal amount of up to $75.0 million (the “2023 ABL Credit Facility”), with Availability (as defined in the 2023 ABL Credit Agreement) thereunder subject to a “Borrowing Base” as described in the 2023 ABL Credit Agreement. The 2023 ABL Credit Facility includes a letter of credit sub-facility, which permits issuance of letters of credit up to an aggregate amount of $25.0 million. The scheduled maturity date of the 2023 ABL Credit Facility is February 22, 2028; provided that the 2023 ABL Credit Facility will mature on June 30, 2027 if any amount of the 2023 Term Loan Credit Facility that has a maturity date less than 91 days prior to February 22, 2028 is outstanding on June 30, 2027.
Atlas LLC may also request swingline loans under the 2023 ABL Credit Agreement in an aggregate principal amount not to exceed $7.5 million. During the years ended December 31, 2024 and 2023, Atlas LLC had no outstanding swingline loans under the 2023 ABL Credit Facility.
Borrowings under the 2023 ABL Credit Facility bear interest, at Atlas LLC’s option, at either a base rate or Term SOFR (as defined in the 2023 ABL Credit Agreement), as applicable, plus an applicable margin based on average availability as set forth in the 2023 ABL Credit Agreement. Term SOFR loans bear interest at Term SOFR for the applicable interest period plus an applicable margin, which ranges from 1.50% to 2.00% per annum based on average availability as set forth in the 2023 ABL Credit Agreement. Base rate loans bear interest at the applicable base rate, plus an applicable margin, which ranges from 0.50% to 1.00% per annum based on average availability as set forth in the 2023 ABL Credit Agreement. In addition to paying interest on outstanding principal under the 2023 ABL Credit Facility, Atlas LLC is required to pay a commitment fee which ranges from 0.375% per annum to 0.500% per annum with respect to the unutilized commitments under the 2023 ABL Credit Facility, based on the average utilization of the 2023 ABL Credit Facility. Atlas LLC is also required to pay customary letter of credit fees, to the extent that one or more letter of credit is outstanding. For the years ended December 31, 2024 and 2023, we recognized $0.4 million and $0.3 million, respectively, of interest expense, unutilized commitment fees and other fees under the 2023 ABL Credit Facility, classified as interest expense.
The Borrowing Base was initially set at $75.0 million and the amount of available credit changes every month, depending on the amount of eligible accounts receivable and inventory we have available to serve as collateral. With the First Amendment to the 2023 ABL Credit Agreement, discussed below, the Borrowing Base increased to $125.0 million. The Borrowing Base components are subject to customary reserves and eligibility criteria.
On March 5, 2024 and November 12, 2024, the Company drew down $50.0 million and $20.0 million, respectively, under the 2023 ABL Credit Facility for general corporate purposes. There was interest expense of $3.2 million for the year ended December 31, 2024. The draw included $0.3 million in debt issuance costs and $0.3 million in deferred financing costs. These costs are recorded under other long-term assets on the consolidated balance sheets and are amortized on a straight-line basis over the life of the agreement. Interest expense associated with the amortization of these costs was $0.3 million for the year ended December 31, 2024.
As of December 31, 2024, Atlas LLC had $70.0 million in outstanding borrowings and $0.2 million in outstanding letters of credit under the 2023 ABL Credit Facility. Additionally, as of December 31, 2024, the Borrowing Base was $125.0 million and Availability was $54.8 million.
The 2023 ABL Credit Facility requires that if Availability is less than the greater of (i) 12.50% of the Borrowing Base and (ii) $7.5 million, Atlas LLC must maintain a Fixed Charge Coverage Ratio (as defined in the 2023 ABL Credit Agreement) of at least 1.00 to 1.00 while a Covenant Trigger Period (as defined in the 2023 ABL Credit Agreement) is in effect.
Under the 2023 ABL Credit Agreement, Atlas LLC is permitted to make payments of dividends and distributions pursuant to certain limited exceptions and baskets set forth therein and otherwise generally subject to certain restrictions described therein, including that (i) no Event of Default (as defined under the 2023 ABL Credit Agreement) has occurred and is continuing, and (ii) no loans and no more than $7.5 million in letters of credit that have not been cash collateralized are outstanding, and liquidity exceeds $30.0 million at all times during the 30 days prior to the date of the dividend or distribution; provided that if any loans are outstanding or outstanding letters of credit exceed $7.5 million and no Event of Default has occurred and is continuing, then Atlas LLC is permitted to make payments of dividends and distributions if, (i) Availability (as defined under the 2023 ABL Credit Agreement) is higher than the greater of (a) $12 million and (b) 20% of the pro forma Borrowing Base then in effect and during the 30 days prior to the date of the dividend or distribution as if such dividend or distribution had been made at the beginning of such period, or if (ii) (a) Availability is higher than the greater of (x) $9 million and (y) 15% of the pro forma Borrowing Base then in effect and during the 30 days prior to the date of the dividend or distributions as if such dividend or distribution had been made at the beginning of such period and (b) the Fixed Charge Coverage Ratio (as defined under the 2023 ABL Credit Agreement), as calculated on a pro forma basis, is greater than 1.00 to 1.00, as provided under the 2023 ABL Credit Agreement. Additionally, Atlas LLC may make additional payments of dividends and distributions in qualified equity interests and may make Permitted Tax Distributions (as defined under the 2023 ABL Credit Agreement).
The 2023 ABL Credit Facility contains certain customary representations and warranties, affirmative and negative covenants, and events of default. As of December 31, 2024, the Company was in compliance with the covenants under the 2023 ABL Credit Facility.
The 2023 ABL Credit Facility is unconditionally guaranteed, jointly and severally, by Atlas LLC and its subsidiaries and secured by substantially all of the assets of Atlas LLC and its subsidiaries.
First Amendment to the 2023 ABL Credit Agreement
On February 26, 2024, Atlas LLC and certain other subsidiaries of the Company entered into the ABL Amendment, among Atlas LLC, the subsidiary guarantors party thereto, the lenders party thereto and the ABL Agent, which amends the 2023 ABL Credit Agreement.
The ABL Amendment increased the revolving credit commitment to $125.0 million. The existing lenders increased their commitment by $25.0 million which resulted in a debt modification under ASC 470, “Debt.” The ABL Amendment also added a new lender with a $25.0 million commitment, thus creating a new debt arrangement under ASC 470, “Debt.” The deferred financing costs and debt issuance cost will be amortized on a prospective basis over the term of the agreement. The maturity date of the ABL Credit Agreement was extended from February 22, 2028 to the earliest of (a) February 26, 2029; (b) the date that is 91 days prior to the maturity date for any portion of the Term Loan Debt; or (c) any date on which the aggregate Commitments terminate hereunder.
The ABL Amendment requires that if Availability is less than the greater of (i) 12.50% of the Borrowing Base and (ii) $12.5 million, Atlas LLC must maintain a Fixed Charge Coverage Ratio (as defined in the 2023 ABL Credit Agreement) of at least 1.00 to 1.00 while a Covenant Trigger Period (as defined in the 2023 ABL Credit Agreement) is in effect.
Under the ABL Amendment, Atlas LLC is permitted to make payments of dividends and distributions pursuant to certain limited exceptions and baskets set forth therein and otherwise generally subject to certain restrictions described therein, including that (i) no Event of Default (as defined under the 2023 ABL Credit Agreement) has occurred and is continuing, and (ii) no loans and no more than $7.5 million in letters of credit that have not been cash collateralized are outstanding, and liquidity exceeds $30.0 million at all times during the 30 days prior to the date of the dividend or distribution; provided that if any loans are outstanding or outstanding letters of credit exceed $7.5 million and no Event of Default has occurred and is continuing, then Atlas LLC is permitted to make payments of dividends and distributions if, (i) Specified Availability (as defined under the 2023 ABL Credit Agreement) is higher than the greater of (a) $20.0 million and (b) 20% of the pro forma Borrowing Base then in effect and during the 30 days prior to the date of the dividend or distribution as if such dividend or distribution had been made at the beginning of such period, or if (ii) (a) Specified Availability is higher than the greater of (x) $15.0 million and (y) 15% of the pro forma Borrowing Base then in effect and during the 30 days prior to the date of the dividend or distributions as if such dividend or distribution had been made at the beginning of such period and (b) the Fixed Charge Coverage Ratio (as defined under the 2023 ABL Credit Agreement), as calculated on a pro forma basis, is greater than 1.00 to 1.00, as provided under the 2023 ABL Credit Agreement. Additionally, Atlas LLC may make additional payments of dividends and distributions in qualified equity interests and may make Permitted Tax Distributions (as defined under the 2023 ABL Credit Agreement).
2021 Term Loan Credit Facility
On October 20, 2021, Atlas LLC entered into a credit facility with Stonebriar (the “2021 Term Loan Credit Facility”). The loans outstanding under the 2021 Term Loan Credit Facility bore interest at a rate of 8.47% per annum and had an initial maturity date of October 1, 2027. The 2021 Term Loan Credit Facility was unconditionally guaranteed, jointly and severally, by Atlas LLC and certain of its subsidiaries. The 2021 Term Loan Credit Facility was guaranteed on a secured basis and interest, plus principal, was initially payable in consecutive monthly installments. Interest expense associated with the debt was $6.9 million and $14.0 million for the years ended December 31, 2023, and 2022, respectively, and the interest expense associated with the discount and deferred financing costs was $0.4 million and $0.7 million for the years ended December 31, 2023 and 2022, respectively.
At any time prior to the October 1, 2027, maturity date, Atlas LLC could redeem the 2021 Term Loan Credit Facility, in whole or in part, at a price equal to 100% of the principal amount plus a prepayment fee. The prepayment fee ranged from 3% on or before October 20, 2022, to 2% after October 20, 2022, and on or before October 20, 2023, and 1% thereafter. Upon maturity of the 2021 Term Loan Credit Facility, the entire unpaid principal amount, together with interest, fees and other amounts payable in connection with the facility, would be immediately due and payable without further notice or demand.
The 2021 Term Loan Credit Facility included certain covenants, including but not limited to restrictions on incurring additional debt and certain restricted payments. The 2021 Term Loan Credit Facility was not subject to financial covenants unless $5.0 million or more in aggregate was outstanding under the 2023 ABL Credit Agreement, at which time a minimum average liquidity balance of $20.0 million must be maintained. Dividends and distributions to equity holders were permitted to be made pursuant to certain limited exceptions and baskets as described in the credit agreement governing the 2021 Term Loan Credit Facility (the “2021 Term Loan Credit Agreement”) and otherwise generally subject to certain restrictions as described in the 2021 Term Loan Credit Agreement, including the requirements that (a) no Event of Default (as defined in the 2021 Term Loan Credit Agreement) have occurred and be continuing, (b) Atlas LLC maintaining a $30.0 million cash balance pro forma for the Restricted Payment (as defined in the 2021 Term Loan Credit Agreement), (c) an Annualized Leverage Ratio (as defined in the 2021 Term Loan Credit Agreement) not greater than 2.00 to 1.00 and (d) Atlas LLC making a concurrent prepayment of the loans outstanding under the 2021 Term Loan Credit Facility, which prepayment would not subject to a prepayment penalty fee, in an amount equal to one-third or one-forth of the total equity distributions being made, based on a pro forma leverage ratio set forth in the 2021 Term Loan Credit Agreement. Furthermore, the 2021 Term Loan Credit Facility permitted dividends and distributions in certain other circumstances subject to the terms of the 2021 Term Loan Credit Agreement, including dividends and distributions made solely in certain qualified equity interests, tax distributions, and dividends of up to 10.0% per annum of the net proceeds raised in our IPO. During 2022, Atlas LLC paid $45.0 million of equity distributions and concurrently prepaid $12.6 million of the 2021 Term Loan Credit Facility as required by the terms described above. In January 2023, prior to the Reorganization, the board of managers of Atlas LLC approved and paid $15.0 million of equity distributions, and Atlas LLC concurrently prepaid $3.8 million of the 2021 Term Loan Credit Facility as required by the terms described above. In May 2023, Atlas Operating approved and paid a distribution of $0.15 per Operating Unit, in the aggregate amount of $15.0 million, as permitted by the Amended and Restated Limited Liability Company Agreement of Atlas Operating (the “Atlas Operating LLCA”), and Atlas LLC declared and paid a quarterly variable dividend of $0.15 per share of Old Atlas Class A Common Stock. Concurrently with this distribution and dividend, Atlas LLC repaid $3.8 million of the 2021 Term Loan Credit Facility at par per the terms of the 2021 Term Loan Credit Facility.
Proceeds from the 2021 Term Loan Credit Facility were used exclusively for general corporate purposes, which included the repayment of outstanding indebtedness under the previous credit facility extended pursuant to the Credit Agreement, dated January 30, 2018, between Atlas LLC, as borrower, and BlackGold SPV I LP, as lender, as amended (“2018 Term Loan Credit Facility”), and to make permitted distributions. As of December 31, 2022, the Atlas LLC was in compliance with the covenants of the 2021 Term Loan Credit Facility.
The 2021 Term Loan Credit Facility was unconditionally guaranteed, jointly and severally, by Atlas LLC and certain of its subsidiaries and secured by substantially all of the assets of Atlas LLC and certain of its subsidiaries, excluding: OLC Kermit, LLC, OLC Monahans, LLC and Atlas OLC Employee Company, LLC.
On February 22, 2023, Atlas LLC and Stonebriar agreed to amend the 2021 Term Loan Credit Facility to, among other things, permit Atlas LLC to enter into the 2023 ABL Credit Facility with the 2023 ABL Lenders and to update certain related terms.
Repayment of the 2021 Term Loan Credit Facility
On July 31, 2023, Atlas LLC entered into the 2023 Term Loan Credit Agreement with Stonebriar, proceeds from which were used to repay $133.4 million of 2021 Term Loan Credit Facility principal and accrued interest, repay $42.8 million of finance lease liabilities, as well as acquire $39.5 million of finance lease assets associated with certain equipment lease arrangements with Stonebriar. In connection with this refinancing, on July 31, 2023, we paid the lender a prepayment fee on the 2021 Term Loan Credit Facility of $2.6 million, a senior secured term loan fee on the 2023 Term Loan Credit Facility of $2.7 million and a DDT Loan fee on the 2023 Term Loan Credit Facility of $2.7 million. As this transaction was accounted for as a modification under ASC 470 - Debt, these fees paid to the lender, as well as previously unamortized debt discount and deferred financing fees associated with the 2021 Term Loan Credit Facility of $1.4 million were deferred and recorded as a direct reduction from the carrying amount of the debt obligation on the consolidated balance sheets. These deferred costs are amortized to interest expense using the effective interest method.
Other Indebtedness
The Company has other indebtedness of $4.1 million of equipment finance notes as of December 31, 2024. There was de minimis interest expense for the year end December 31, 2024. These equipment finance notes have terms ending in January 2025 through December 2029 and interest rates ranging from 1.99% to 8.45%. There was no other indebtedness and associated interest expense as of year ended December 31, 2023.
Debt Obligations
The following table sets forth future principal payment obligations as of December 31, 2024, based on the terms of the Deferred Cash Consideration Note, the 2023 Term Loan Credit Facility, the ADDT Loan, the 2023 ABL Credit Facility, and other indebtedness (in thousands).
| | | | |
| | | |
2025 | | $ | 43,736 | |
2026 | | | 157,763 | |
2027 | | | 50,347 | |
2028 | | | 55,724 | |
2029 | | | 131,685 | |
Thereafter | | | 81,672 | |
Total | | $ | 520,927 | |
Note 10—Commitments and Contingencies
Royalty Agreements
The Company has entered into royalty agreements under which it is committed to pay royalties on sand sold from its production facilities for which the Company has received payment by the customer. Atlas LLC entered into a royalty agreement associated with its leased property at the Kermit facility and a mining agreement associated with its leased property at the Monahans facility, in each case, with The Sealy & Smith Foundation, a related party. The royalty agreement associated with the Kermit facility terminated on the date of our IPO, pursuant to the terms of the agreement. Under the mining agreement associated with the Monahans facility, we are committed to pay royalties on product sold from that facility and are required to pay a minimum royalty of $1.0 million for any lease year following our IPO. We have certain royalty obligations based on tonnage of sand sold under land leases associated with our OnCore distributed mining network.
On March 1, 2024, the Company entered into a pooling agreement with the General Land Office of Texas (“GLO”) that establishes a pooled unit across our fee owned lands and leased lands at the Kermit property. The pooling agreement has a current effective blended royalty rate of 5.86% on two of the Kermit plant sales. This pooling agreement increases our operational flexibility by establishing a framework to efficiently mine across our fee owned lands and leased lands interchangeably.
Royalty expense associated with these agreements is recorded as the product is sold and is included in costs of sales. Royalty expense associated with these agreements were less than 5% of cost of sales, less than 10% of cost of sales, and between 10% and 15% of cost of sales for the years ended December 31, 2024, 2023, and 2022, respectively.
Standby Letters of Credit
As of December 31, 2024 and 2023, we had $0.2 million and $1.1 million outstanding in standby letters of credit issued under the 2023 ABL Credit Facility, respectively.
Purchase Commitments
In connection with our normal operations, we enter short-term purchase obligations for products and services.
In October 2024, we entered into an agreement to purchase dredge equipment in the amount of approximately $9.8 million with a 25% downpayment applied at placement of the order with the remaining 75% to be paid during delivery and assembly, subject to customary terms and conditions. Delivery of equipment is expected to occur in 2026. As of December 31, 2024, we have spent $2.4 million and have $7.4 million outstanding on this commitment.
In November 2024, we entered into an agreement to purchase logistics equipment for approximately $32.8 million with a 40% downpayment, monthly progress billings, and balance due at readiness to ship, subject to customary terms and conditions. Delivery of the equipment will take place in 2025. As of December 31, 2024, we have $32.8 million outstanding on this commitment.
Litigation
We are involved in various legal and administrative proceedings that arise from time to time in the ordinary course of doing business. Some of these proceedings may result in fines, penalties or judgments being assessed against us, which may adversely affect our financial results. In addition, from time to time, we are involved in various disputes, which may or may not be settled prior to legal proceedings being instituted and which may result in losses in excess of accrued liabilities, if any, relating to such unresolved disputes. Expenses related to litigation reduce operating income. We do not believe that the outcome of any of these proceedings or disputes would have a significant adverse effect on our financial position, long-term results of operations or cash flows. It is possible, however, that charges related to these matters could be significant to our results of operations or cash flows in any single accounting period. Management is not aware of any legal, environmental or other commitments and contingencies that would have a material effect on the Financial Statements.
Note 11— Stockholders Equity
Common Stock
Holders of shares of Common Stock are entitled to one vote per share held of record on all matters to be voted upon by the stockholders. The holders of Common Stock do not have cumulative voting rights in the election of directors. Holders of shares of Common Stock are entitled to ratably receive dividends when and if declared by the Company's board of directors out of funds legally available for that purpose, subject to any statutory or contractual restrictions on the payment of dividends and to any prior rights and preferences that may be applicable to any outstanding preferred stock. Upon the Company's liquidation, dissolution, distribution of assets or other winding up, the holders of Common Stock are entitled to receive ratably the assets available for distribution to the stockholders after payment of liabilities and the liquidation preference of any outstanding shares of preferred stock.
The Company is authorized to issue 500,000,000 shares of preferred stock and 1,500,000,000 shares of Common Stock. On March 5, 2024, the Company issued 9,711,432 shares of Common Stock as consideration in the Hi-Crush Transaction. As of December 31, 2024, there were 110,217,322 shares of Common Stock issued and outstanding and no shares issued or outstanding of preferred stock.
Share Repurchase Program
In October 2024, the Board of Directors of the Company authorized a share repurchase program under which the Company may repurchase up to $200.0 million of outstanding stock through December 31, 2026. As of December 31, 2024, the Company has the ability to purchase up to $200.0 million of outstanding stock under this program. There were no shares of Common Stock repurchased during the year ended December 31, 2024.
The shares may be repurchased from time to time in open market transactions at prevailing market prices, through block trades, in privately negotiated transactions, through derivative transactions or by other means and in accordance with federal securities laws. The timing, as well as the number and value of shares repurchased under the program, will be determined by the Company at its discretion and will depend on a variety of factors including management's assessment of the intrinsic value of the Company's Common Stock, the market price of the Company's Common Stock, general market and economic conditions, available liquidity, compliance with the Company’s debt and other agreements, applicable legal requirements, and other considerations. The exact number of shares to be repurchased by the Company is not guaranteed, and the program may be suspended, modified, or discontinued at any time without prior notice.
Old Atlas Class A Common Stock
Holders of shares of Old Atlas Class A Common Stock were entitled to one vote per share held of record on all matters to be voted upon by the Old Atlas stockholders and were entitled to ratably receive dividends when and if declared by Old Atlas's board of directors. Upon liquidation, dissolution, distribution of assets or other winding up, the holders of shares of Old Atlas Class A Common Stock were entitled to receive ratably the assets available for distribution to the stockholders after payment of liabilities and the liquidation preference of any outstanding shares of preferred stock. As a result of the Up-C Simplification, each share of Old Atlas Class A Common Stock issued and outstanding immediately prior to the Effective Time was exchanged for one share of New Atlas Common Stock and the holders of Old Atlas Class A Common Stock became stockholders of New Atlas.
Old Atlas Class B Common Stock
Holders of shares of Old Atlas Class B Common Stock were entitled to one vote per share on all matters to be voted upon by the Old Atlas stockholders. Holders of Old Atlas Class A Common Stock and Old Atlas Class B Common Stock generally voted together as a single class on all matters presented to Old Atlas’s stockholders for their vote or approval. Holders of Old Atlas Class B Common Stock did not have any right to receive dividends or distributions upon a liquidation or winding up of Old Atlas.
Up-C Simplification
On October 2, 2023, Old Atlas and New Atlas completed the Up-C Simplification contemplated by the Master Reorganization Agreement.
Pursuant to the Master Reorganization Agreement, (a) PubCo Merger Sub merged with and into Old Atlas, as a result of which (i) each share of Old Atlas Class A Common Stock then issued and outstanding was exchanged for one share of New Atlas Common Stock, (ii) all of the Old Atlas Class B Common Stock then issued and outstanding was surrendered and cancelled for no consideration and (iii) Old Atlas survived the PubCo Merger as a direct, wholly-owned subsidiary of New Atlas; and (b) Opco Merger Sub merged with and into Atlas Operating, as a result of which (i) each Operating Unit then issued and outstanding, other than those Operating Units held by Old Atlas, was exchanged for one share of New Atlas Common Stock and (ii) Atlas Operating became a wholly-owned subsidiary of New Atlas.
After completion of the Up-C Simplification, New Atlas replaced Old Atlas as the publicly held entity and, through its subsidiaries, conducts all of the operations previously conducted by Old Atlas, and Old Atlas remains the managing member of Atlas Operating. See Note 1 – Business and Organization for more information.
Dividends and Distributions
On February 8, 2024, the Company declared a dividend of $0.21 per share (base dividend of $0.16 per share and a variable dividend of $0.05 per share) of Common Stock. The dividend was paid on February 29, 2024 to holders of record of Common Stock as of the close of business on February 22, 2024.
On May 6, 2024, the Company declared a dividend of $0.22 per share (base dividend of $0.16 per share and a variable dividend of $0.06 per share) of Common Stock. The dividend was paid on May 23, 2024 to holders of record of Common Stock as of the close of business on May 16, 2024.
On August 1, 2024, the Company declared a dividend of $0.23 per share of Common Stock. The dividend was paid on August 22, 2024 to holders of record of Common Stock as of the close of business on August 15, 2024.
On October 24, 2024, the Company declared a dividend of $0.24 per share of Common Stock. The dividend was paid on November 14, 2024 to holders of record of Common Stock as of the close of business on November 7, 2024.
On February 11, 2025, the Company declared a dividend. See Note 17 – Subsequent Events for additional information.
Note 12 – Stock-Based and Unit-Based Compensation
LTIP
On March 8, 2023, we adopted the LTIP for the benefit of employees, directors and consultants of the Company and its affiliates. The LTIP provides for the grant of all or any of the following types of awards: (1) incentive stock options qualified as such under U.S. federal income tax laws; (2) stock options that do not qualify as incentive stock options; (3) stock appreciation rights; (4) restricted stock awards; (5) RSUs; (6) bonus stock; (7) dividend equivalents; (8) other stock-based awards; (9) cash awards; and (10) substitute awards. The shares to be delivered under the LTIP may be made available from (i) authorized but unissued shares, (ii) shares held as treasury stock or (iii) previously issued shares reacquired by us, including shares purchased on the open market.
In connection with the closing of the Up-C Simplification, New Atlas assumed the LTIP as well as the outstanding awards granted under the LTIP, including all awards of RSUs and performance share units, in each case, whether or not vested, that were then outstanding under the LTIP, and each (i) RSU grant notice and RSU agreement and (ii) performance share unit grant notice and performance share unit agreement, in each case, evidencing then-outstanding awards under the LTIP.
In connection with the assumption of the LTIP, the Company also assumed the remaining share reserves available for issuance under the LTIP, subject to applicable adjustments to relate to the Company's Common Stock. Subject to adjustment in accordance with the terms of the LTIP, 10,270,000 shares of Common Stock have been reserved for issuance pursuant to awards under the LTIP. If an award under the LTIP is forfeited, settled for cash or expires without the actual delivery of shares, any shares subject to such award will again be available for new awards under the LTIP. The LTIP will be administered by the Compensation Committee (the “Compensation Committee”) of the Board. We had 7,093,063 shares of the Company's Common Stock available for future grants as of December 31, 2024. We account for the awards granted under the LTIP as compensation cost measured at the fair value of the award on the date of grant.
Restricted Stock Units
RSUs represent the right to receive shares of the Company's Common Stock at the end of the vesting period in an amount equal to the number of RSUs that vest. The granted RSUs vest and become exercisable with respect to employees in three equal installments starting on the first anniversary of the date of grant and, with respect to directors, on the one-year anniversary of the date of grant, so long as the participant either remains continuously employed or continues to provide services to the Board, as applicable. The RSUs are subject to restrictions on transfer and are generally subject to a risk of forfeiture if the award recipient ceases providing services to the Company prior to the date the award vests. If the participant’s employment with or service to the Company is terminated for cause or without good reason prior to the vesting of all of the RSUs, and unless such termination is a “Qualifying Termination” or due to a “Change in Control” as defined in the applicable RSU agreement, any unvested RSUs will generally terminate automatically and be forfeited without further notice and at no cost to the Company. In the event the Company declares and pays a dividend in respect of its outstanding shares of Common Stock and, on the record date for such dividend, the participant holds RSUs that have not been settled, we will record the amount of such dividend in a bookkeeping account and pay to the participant an amount in cash equal to the cash dividends the participant would have received if the participant was the holder of record, as of such record date, of a number of shares of Common Stock equal to the number of RSUs held by the participant that had not been settled as of such record date, such payment to be made on or within 60 days following the date on which such RSUs vest. The stock-based compensation expense of such RSUs was determined using the closing prices on the grant date. We recognized stock-based compensation related to RSUs of $15.5 million and $4.3 million for the years ended December 31, 2024 and 2023, respectively. Changes in non-vested RSUs outstanding under the LTIP during the year ended December 31, 2024 and 2023 were as follows:
| | | | | | | | | |
| | Number of Units | | | Weighted Average
Grant Date Fair
Value | | |
Non-vested at December 31, 2022 | | | — | | | $ | — | | |
Granted | | | 1,661,173 | | | $ | 20.96 | | |
Vested | | | (25,000 | ) | | $ | 15.99 | | |
Forfeited | | | — | | | $ | — | | |
Non-vested at December 31, 2023 | | | 1,636,173 | | | $ | 21.04 | | |
Granted | | | 790,677 | | | $ | 22.13 | | |
Vested | | | (579,770 | ) | | $ | 20.69 | | |
Forfeited | | | (112,316 | ) | | $ | 20.28 | | |
Non-vested at December 31, 2024 | | | 1,734,764 | | | $ | 21.69 | | |
The total fair value of shares vested during the year ended December 31, 2024 was $12.0 million. There was approximately $30.4 million of unrecognized compensation expense relating to outstanding RSUs as of December 31, 2024. The unrecognized compensation expense will be recognized on a straight-line basis over the weighted average remaining vesting period of 1.4 years.
Performance Share Units
Performance share units (“PSUs”) represent the right to receive one share of Common Stock multiplied by the number of PSUs that become earned, and the number of PSUs that may vest range from 0% to 200% of the Target PSUs (as defined in the Performance Share Unit Grant Agreement governing the PSUs (the “PSU Agreement”)), subject to the Compensation Committee’s discretion to increase the ultimate number of vested PSUs above the foregoing maximum level. Each PSU also includes a tandem dividend equivalent right, which is a right to receive an amount equal to the cash dividends made with respect to a share of Common Stock during the Performance Period (as defined in the PSU Agreement), which will be adjusted to correlate to the number of PSUs that ultimately become vested pursuant to the PSU Agreement. 480,783 PSUs (based on target) were granted in 2024 (the “2024 PSUs”). The Performance Goals (as defined in the PSU Agreement) for the 2024 PSUs are based on a combination of Return on Capital Employed (“ROCE”) and “Relative TSR” (each, as defined in the PSU Agreement), with 25% weight applied to ROCE and 75% weight applied to Relative TSR, each as measured during the three-year Performance Period ending December 31, 2026. The vesting level is calculated based on the actual total stockholder return achieved during the Performance Period. The fair value of such PSUs was determined using a Monte Carlo simulation and will be recognized over the applicable Performance Period. The Monte Carlo simulation model utilizes multiple input variables that determine the probability of satisfying the market condition stipulated in the award to calculate the fair value of the award. Expected volatilities in the model were estimated using a historical period consistent with the Performance Period of approximately three years. The risk-free interest rate was based on the United States Treasury rate for a term commensurate with the expected life of the grant. We recognized stock-based compensation related to PSUs of $6.9 million and $2.8 million for the years ended December 31, 2024 and 2023, respectively. Changes in non-vested PSUs outstanding under the LTIP during 2024 and 2023 were as follows:
| | | | | | | | | |
| | Number of Units | | | Weighted Average
Grant Date Fair
Value | | |
Non-vested at December 31, 2022 | | | — | | | $ | — | | |
Granted | | | 490,167 | | | $ | 20.19 | | |
Vested | | | (584 | ) | | $ | 20.19 | | |
Forfeited | | | (16,360 | ) | | $ | 20.19 | | |
Non-vested at December 31, 2023 | | | 473,223 | | | $ | 20.19 | | |
Granted | | | 480,783 | | | $ | 30.47 | | |
Vested | | | (13,021 | ) | | $ | 20.19 | | |
Forfeited | | | (24,063 | ) | | $ | 20.19 | | |
Non-vested at December 31, 2024 | | | 916,922 | | | $ | 25.58 | | |
The total fair value of shares vested during the year ended December 31, 2024 was $0.3 million. There was approximately $14.3 million of unrecognized compensation expense relating to outstanding PSUs as of December 31, 2024. The unrecognized compensation expense will be recognized on a straight-line basis over the weighted average remaining vesting period of 2.0 years.
The total income tax benefit of these share-based payment arrangements was $2.5 million and de minimis for the years ended December 31, 2024 and 2023, respectively.
Note 13 – Earnings per Share
Basic earnings per share (“EPS”) measures the performance of an entity over the reporting period. Diluted earnings per share measures the performance of an entity over the reporting period while giving effect to all potentially dilutive shares of Common Stock that were outstanding during the period. The Company uses the treasury stock method to determine the potential dilutive effect of vesting of its outstanding RSUs and PSUs. The Company does not use the two-class method as the Old Atlas Class B Common Stock, was, and the unvested RSUs, and PSU awards are nonparticipating securities. During 2023, the issuance of Old Atlas Class A Common Stock in exchange for Operating Units held by the Legacy Owners (and their corresponding shares of Old Atlas Class B Common Stock) did not have a dilutive effect on EPS and was not recognized in dilutive earnings per share calculations.
As a result of the Up-C Simplification, the Company’s previous dual class structure was eliminated and the Company now trades under a single class of Common Stock. Please see Note 2 - Summary of Significant Accounting Policies -Earnings Per Share for more information.
There were no shares of Common Stock outstanding for the year ended December 31, 2022, and therefore no earnings per share information has been presented for that period.
For the year ended December 31, 2023, the Company’s EPS calculation includes only its share of net income for the period subsequent to the IPO, and omits income prior to the IPO. In addition, the basic weighted average shares outstanding calculation is based on the actual days during which the shares were outstanding from the closing date of our IPO through December 31, 2023.
The following table reflects the allocation of net income to common stockholders and EPS computations for the period indicated based on a weighted average number of shares of Common Stock outstanding for the period (in thousands, except per share data):
| | | | | | | | | |
| | For the Year Ended | | |
| | December 31, | | |
| | 2024 | | | 2023 | | |
Numerator: | | | | | | | |
Net income | | $ | 59,944 | | | $ | 226,493 | | |
Less: Pre-IPO net income attributable to Atlas Sand Company, LLC | | | | | | 54,561 | | |
Less: Net income attributable to redeemable noncontrolling interest | | | | | | 66,503 | | |
Net income attributable to Atlas Energy Solutions Inc. | | $ | 59,944 | | | $ | 105,429 | | |
Denominator: | | | | | | | |
Basic weighted average shares outstanding | | | 108,235 | | | | 70,450 | | |
Dilutive potential of restricted stock units | | | 299 | | | | 85 | | |
Dilutive potential of performance share units | | | 642 | | | | 500 | | |
Diluted weighted average shares outstanding (1) | | $ | 109,176 | | | $ | 71,035 | | |
| | | | | | | |
Basic EPS attributable to holders of New Atlas Common Stock | | $ | 0.55 | | | $ | 1.50 | | |
Diluted EPS attributable to holders of New Atlas Common Stock (1) | | $ | 0.55 | | | $ | 1.48 | | |
(1) Shares of Old Atlas Class A Common Stock issued in exchange for Operating Units did not have a dilutive effect on EPS and were not included in the EPS calculation. | | |
| | |
The basic and diluted EPS for the year ended December 31, 2023, represents only the period from the IPO date to December 31, 2023, which represents the period wherein the Company had outstanding common stock.
Certain RSUs and PSUs were excluded from the computation of diluted earnings per share because their effect would have been anti-dilutive. Such potentially dilutive stock awards (in thousands) excluded from the calculation of diluted earnings (loss) per common share were as follows:
| | | | | | | | |
| | For the Year Ended | |
| | December 31, | |
| | 2024 | | | 2023 | |
RSUs excluded | | | 1,276 | | | | 435 | |
PSUs excluded | | | 101 | | | | — | |
Note 14—Income Taxes
Atlas Inc. is a corporation and is subject to U.S. federal, state and local income taxes. In March 2023, Atlas Inc. completed its initial public offering of 18,000,000 shares of Old Atlas Class A Common Stock at a price to the public of $18.00 per share. The tax implications of the Reorganization, the IPO and the tax impact of Atlas Inc.’s status as a taxable corporation subject to U.S. federal income tax have been reflected in the accompanying Financial Statements. On March 13, 2023, the date on which the Company completed the IPO, a corresponding deferred tax liability of approximately $27.5 million was recorded associated with the differences between the tax and book basis of the investment in Atlas LLC. The offset of the deferred tax liability was recorded to additional paid-in capital.
On October 2, 2023, the Company completed the Up-C Simplification. The tax implications of the Up-C Simplification have been reflected in the accompanying Financial Statements. On October 2, 2023, a corresponding deferred tax liability of approximately $64.0 million was recorded associated with the exchange of the redeemable noncontrolling interest in Old Atlas for shares of the Company's Common Stock. The offset of the deferred tax liability was recorded to additional paid-in capital.
For the years ending December 31, 2024, 2023, and 2022, the effective combined U.S. federal and state income tax rate was 20.9% 12.2%, and 0.8%, respectively. For the years ending December 31, 2024, 2023, and 2022, the Company recognized an income tax expense of $15.8 million, $31.4 million, and $1.9 million, respectively.
The components of the income tax provision are as follows (in thousands):
| | | | | | | | | | | | |
| | For the Year Ended | |
| | December 31, | |
| | 2024 | | | 2023 | | | 2022 | |
Current income tax provision: | | | | | | | | | |
Federal | | $ | — | | | $ | — | | | $ | — | |
State | | | 834 | | | | 2,177 | | | | 1,858 | |
Total current income tax provision | | $ | 834 | | | $ | 2,177 | | | $ | 1,858 | |
Deferred income tax provision: | | | | | | | | | |
Federal | | $ | 12,805 | | | $ | 28,627 | | | $ | — | |
State | | | 2,197 | | | | 574 | | | | (2 | ) |
Total deferred income tax provision (benefit): | | $ | 15,002 | | | $ | 29,201 | | | $ | (2 | ) |
Income tax provision | | $ | 15,836 | | | $ | 31,378 | | | $ | 1,856 | |
The effective tax rate on pre-tax income differs from the Federal statutory rate of 21% for the years ended December 31, 2024, 2023, and 2022 due to the following (in thousands, except effective tax rates):
| | | | | | | | | | | | |
| | For the Year Ended | |
| | December 31, | |
| | 2024 | | | 2023 | | | 2022 | |
Taxes at federal statutory rate | | $ | 15,914 | | | $ | 54,153 | | | $ | 45,961 | |
Less: Pre-IPO activity attributable to Atlas Sand Company, LLC | | | — | | | | (11,526 | ) | | | (45,961 | ) |
Less: noncontrolling interest | | | — | | | | (14,140 | ) | | | — | |
State income tax expense | | | 1,753 | | | | 2,173 | | | | 1,856 | |
Percentage depletion | | | (7,556 | ) | | | — | | | | — | |
Non-deductible compensation | | | 1,886 | | | | 426 | | | | — | |
Acquisition related costs | | | 1,814 | | | | — | | | | — | |
Non-deductible meals and entertainment | | | 860 | | | | 274 | | | | — | |
Prior year taxes | | | 703 | | | | — | | | | — | |
Change in applicable tax rate | | | 642 | | | | — | | | | — | |
Other | | | (180 | ) | | | 18 | | | | — | |
Income tax expense | | $ | 15,836 | | | $ | 31,378 | | | $ | 1,856 | |
Effective tax rate | | | 20.9 | % | | | 12.2 | % | | | 0.8 | % |
The tax effects of cumulative temporary differences that give rise to significant deferred tax assets and deferred tax liabilities are presented below (in thousands):
| | | | | | | | |
| | For the Year Ended | |
| | December 31, | |
| | 2024 | | | 2023 | |
Deferred tax assets | | | | | | |
Amortizable intangible assets | | $ | — | | | $ | 3,397 | |
Carryforwards | | | 54,155 | | | | 4,255 | |
Employee compensation | | | 1,864 | | | | 1,573 | |
Right-of-use liabilities | | | 4,140 | | | | — | |
Asset retirement obligations | | | 1,505 | | | | — | |
Other | | | 862 | | | | 1,417 | |
Gross deferred tax assets | | $ | 62,526 | | | $ | 10,642 | |
Valuation allowance | | | (1,632 | ) | | | — | |
Total deferred tax assets | | $ | 60,894 | | | $ | 10,642 | |
Deferred tax liabilities | | | | | | |
Amortizable intangible assets | | $ | (19,547 | ) | | $ | — | |
Inventories | | | (4,697 | ) | | | (2,700 | ) |
Property, plant and equipment | | | (235,741 | ) | | | (128,547 | ) |
Right-of-use assets | | | (3,990 | ) | | | — | |
Other | | | (3,791 | ) | | | (924 | ) |
Total deferred tax liabilities | | $ | (267,766 | ) | | $ | (132,171 | ) |
Deferred tax liability, net | | $ | (206,872 | ) | | $ | (121,529 | ) |
Deferred income tax assets and liabilities are recognized for temporary differences between the basis of assets and liabilities for financial reporting and tax purposes. Deferred tax assets are reduced by a valuation allowance if, based on all available evidence, it is more likely than not that some portion or all of the deferred tax asset will not be realized. In determining the need for a valuation allowance, the Company considers all available evidence, both positive and negative, including future reversals of existing taxable temporary differences, future taxable income exclusive of reversing temporary differences and carryforwards, taxable income in carryback years if carryback is permitted by the tax law, and the availability of prudent and feasible tax planning strategies that can be implemented, if necessary, to realize deferred tax assets.
As of December 31, 2024 and 2023, we have federal net operating loss carryforwards of approximately $210.4 million and $9.6 million, respectively. These losses are limited in usage to 80% of taxable income and can be carried forward indefinitely. These losses are limited in usage to 80% of taxable income and can be carried forward indefinitely. We have Internal Revenue Code Section 163(j) interest expense limitation carryforwards of $34.6 million as of December 31, 2024. The carryforward results in a future tax benefit of $7.4 million and has an indefinite carryforward period.
As of December 31, 2024 and 2023, the Company did not have any liabilities for uncertain tax positions or gross unrecognized tax benefits. Our income tax returns from 2021, 2022 and 2023 are subject to examinations by U.S. federal, state or local tax authorities. The Company cannot predict or provide assurance as to the ultimate outcome of any existing or future examinations.
Note 15 – Related-Party Transactions
Anthem Ventures, LLC
Anthem Ventures, LLC (“Anthem Ventures”) provides us with transportation services. Anthem Ventures is owned and controlled by our Executive Chairman, Bud Brigham. For the years ended December 31, 2024, 2023, and 2022, our aggregate payments to Anthem Ventures for these services were approximately $0.2 million, $0.3 million, and de minimis, respectively. As of December 31, 2024 and 2023, we had $0.1 million and $0.1 million of outstanding accounts payable with Anthem Ventures, respectively.
Brigham Land Management LLC
Brigham Land Management LLC (“Brigham Land”) provides us with landman services for certain of our projects and initiatives. The services are provided on a per hour basis at market prices. Brigham Land is owned and controlled by Vince Brigham, an advisor to the Company and the brother of our Executive Chairman, Bud Brigham. For the years ended December 31, 2024, 2023, and 2022, we made aggregate payments to Brigham Land equal to approximately $0.7 million, $1.0 million, and $1.0 million, respectively. As of December 31, 2024 and 2023, our outstanding accounts payable to Brigham Land were $0.1 million and $0.2 million, respectively.
Brigham Oil & Gas, LLC
Atlas LLC has sold proppant to a customer, Brigham Oil & Gas, LLC (“Brigham Oil & Gas”), which is controlled by our Executive Chairman, Bud Brigham. The Company made no sales to this related party for the years ended December 31, 2024 and 2023. The Company made $0.9 million sales to this related party for the year ended December 31, 2022. As of December 31, 2024 and 2023, we had no outstanding accounts receivable with Brigham Oil & Gas.
Earth Resources, LLC
Earth Resources, LLC (“Earth Resources”), formerly known as Brigham Earth, LLC, provides us with professional and consulting services as well as access to certain information and software systems. Earth Resources is owned and controlled by our Executive Chairman, Bud Brigham. For the years ended December 31, 2024, 2023, and 2022, our aggregate payments to Earth Resources for these services were approximately $0.5 million, $0.4 million, and $1.2 million, respectively. As of December 31, 2024 and 2023, we had de minimis accounts payable to Earth Resources.
In a Good Mood
In a Good Mood, LLC (“In a Good Mood”) provides the Company with access, at cost, to reserved space in the Moody Center in Austin, Texas for concerts, sporting events and other opportunities as a benefit to our employees and for business entertainment. In a Good Mood is owned and controlled by our Executive Chairman, Bud Brigham. For the years ended December 31, 2024, 2023, and 2022, we made payments of approximately $0.3 million, $0.2 million, and $0.2 million, respectively. As of December 31, 2024 and 2023, we did not have an outstanding accounts payable balance with this related party.
The Sealy & Smith Foundation
Refer to Note 10 – Commitments and contingencies for disclosures related to the Company’s royalty agreement and mining agreement with The Sealy & Smith Foundation, a related party.
Reorganization
Refer to Note 1 – Business and Organization for disclosures related to the Company’s transactions with affiliates including entities controlled by Bud Brigham in connection with the Reorganization.
Registration Rights Agreement
In connection with the closing of the IPO, we entered into a registration rights agreement with certain Legacy Owners (the “Original Registration Rights Agreement”) covering, in the aggregate, approximately 38.4% of the Old Atlas Class A and Class B Common Stock on a combined basis. Pursuant to the Original Registration Rights Agreement, we agreed to register under the U.S. federal securities laws the offer and resale of shares of Old Atlas Class A Common Stock (including shares issued in connection with any redemption of Operating Units) by such Legacy Owners or certain of their respective affiliates or permitted transferees under the Original Registration Rights Agreement.
On October 2, 2023, the Company entered into an amended and restated registration rights agreement (the “A&R Registration Rights Agreement”) with New Atlas and certain stockholders identified on the signature pages thereto. The A&R Registration Rights Agreement was entered into in order to, among other things, provide for the assumption of Old Atlas’s obligations under the Original Registration Rights Agreement by New Atlas. The A&R Registration Rights Agreement is substantially similar to the Original Registration Rights Agreement, but contains certain administrative and clarifying changes to reflect the transition from a dual class capital structure to a single class of common stock. We will generally be obligated to pay all registration expenses in connection with these registration obligations, regardless of whether a registration statement is filed or becomes effective. These registration rights are subject to certain conditions and limitations.
The foregoing description does not purport to be complete and is qualified in its entirety by reference to the full text of the A&R Registration Rights Agreement, which is attached as Exhibit 4.1 to this Annual Report.
Stockholders’ Agreement
In connection with the closing of the IPO, we entered into a stockholders’ agreement (the “Original Stockholders’ Agreement”) with certain of our Legacy Owners (the “Principal Stockholders”). Among other things, the Original Stockholders’ Agreement provides our Executive Chairman and Chief Executive Officer, Bud Brigham, the right to designate a certain number of nominees for election or appointment to our Board as described below according to the percentage of the Company’s Common Stock held by such Principal Stockholders.
Pursuant to the Original Stockholders’ Agreement, we are required to take all necessary actions, to the fullest extent permitted by applicable law (including with respect to any fiduciary duties under Delaware law), to cause the election or appointment of the nominees designated by Mr. Brigham or his affiliates, and each of the Principal Stockholders agreed to cause its respective shares of the Company’s Common Stock to be voted in favor of the election of each of the nominees designated by Mr. Brigham or his affiliates. Mr. Brigham or his affiliates will be entitled to designate the replacement for any of his respective board designees whose board service terminates prior to the end of such director’s term.
In addition, the Original Stockholders’ Agreement provided that for so long as Mr. Brigham or any of his affiliates is entitled to designate any members of our Board, we are required to take all necessary actions to cause each of the audit committee, compensation committee and nominating and corporate governance committee of our Board to include in its membership at least one director designated by Mr. Brigham or his affiliates, except to the extent that such membership would violate applicable securities laws or stock exchange rules.
Furthermore, so long as the Principal Stockholders collectively beneficially own at least a majority of the outstanding shares of our Common Stock, we have agreed not to take, and will cause our subsidiaries not to take, the following actions (or enter into an agreement to take such actions) without the prior consent of Mr. Brigham or his affiliates, subject to certain exceptions:
•adopting or proposing any amendment, modification or restatement of or supplement to our certificate of incorporation or bylaws;
•increasing or decreasing the size of our Board; or
•issuing any equity securities that will rank senior to our Common Stock as to voting rights, dividend rights or distributions rights upon liquidation, winding up or dissolution of the Company.
On October 2, 2023, Old Atlas entered into an amended and restated stockholders’ agreement (the “A&R Stockholders’ Agreement”) with New Atlas and certain of the Principal Stockholders. The A&R Stockholders’ Agreement was entered into in order to, among other things, provide for the assumption of Old Atlas’s obligations under the Original Stockholders’ Agreement by New Atlas. The A&R Stockholders’ Agreement is substantially similar to the Original Stockholders’ Agreement, but contains certain administrative and clarifying changes to reflect the transition from a dual class capital structure to a single class of common stock.
The foregoing description is not complete and is qualified in its entirety by reference to the full text of the A&R Stockholders’ Agreement, which is attached as Exhibit 10.1 to this Annual Report.
Up-C Simplification
Refer to Note 1 – Business and Organization for disclosures related to the Company’s Up-C Simplification.
Note 16 – Business Segment
The Company operates as one operating segment as evaluated regularly by the CODM. The CODM evaluates the Company’s financial information and performance on a consolidated basis for purposes of making operating decisions and allocating resources. The Company operates with centralized functions and delivers most of its products and services in a similar way to all customers.
The CODM reviews cost of sales as the significant segment expense when determining the profitability of the segment. Other segment expenses presented to the CODM that are not deemed significant segment expenses are disclosed within the consolidated statement of operations. The reported measures of segment profit utilized are gross profit, income before income taxes, and net income. The CODM uses these measures of segment profit to assess segment performance and decide how to allocate resources.
Summarized financial information for our reportable segment is as follows (in thousands):
| | | | | | | | | | | | |
| | Year Ended December 31, | |
| | 2024 | | | 2023 | | | 2022 | |
Product sales | | $ | 515,434 | | | $ | 468,119 | | | $ | 408,446 | |
Service sales | | | 540,523 | | | | 145,841 | | | | 74,278 | |
Total sales | | | 1,055,957 | | | | 613,960 | | | | 482,724 | |
Cost of sales (excluding depreciation, depletion and accretion expense) | | | 725,196 | | | | 260,396 | | | | 198,918 | |
Depreciation, depletion and accretion expense | | | 98,747 | | | | 39,798 | | | | 27,498 | |
Gross profit | | | 232,014 | | | | 313,766 | | | | 256,308 | |
Selling, general and administrative expense (including stock and unit-based compensation expense of $22,381, $7,409 and $678, respectively) | | | 106,248 | | | | 48,636 | | | | 24,317 | |
Amortization expense of acquired intangible assets | | | 12,316 | | | | — | | | | — | |
Loss on disposal of assets | | | 19,672 | | | | — | | | | — | |
Insurance recovery (gain) | | | (20,098 | ) | | | — | | | | — | |
Operating income | | | 113,876 | | | | 265,130 | | | | 231,991 | |
Interest (expense), net | | | (38,647 | ) | | | (7,689 | ) | | | (15,760 | ) |
Other income, net | | | 551 | | | | 430 | | | | 2,631 | |
Income before income taxes | | | 75,780 | | | | 257,871 | | | | 218,862 | |
Income tax expense | | | 15,836 | | | | 31,378 | | | | 1,856 | |
Net income | | $ | 59,944 | | | $ | 226,493 | | | $ | 217,006 | |
| | | | | | | |
| As of December 31, | |
| 2024 | | | 2023 | |
Total Assets | $ | 1,972,652 | | | $ | 1,261,686 | |
The following table reconciles interest expense for our reportable segment to interest (expense) net as presented on the consolidated statement of operations (in thousands):
| | | | | | | | | | | |
| For the Year Ended December 31, | |
| 2024 | | | 2023 | | | 2022 | |
Interest expense | $ | (43,078 | ) | | $ | (17,452 | ) | | $ | (15,803 | ) |
Interest income | | 4,431 | | | | 9,763 | | | | 43 | |
Interest (expense), net | $ | (38,647 | ) | | $ | (7,689 | ) | | $ | (15,760 | ) |
Note 17 – Subsequent Events
Dividend
On February 11, 2025, the Company declared a dividend of $0.25 per share of Common Stock. The dividend will be payable on February 28, 2025 to holders of record of Common Stock as of the close of business on February 21, 2025.
Purchase Commitments
On February 20, 2025, we entered into an agreement to purchase logistics equipment for approximately $15.8 million with progress billings, subject to customary terms and conditions. Delivery of the equipment is expected to take place in 2025.
Lease Agreements
On February 17, 2025, we entered into two master lease agreements between subsidiaries of the Company as lessees and On Your Six Capital LLC as the lessor in each case, to fund up to $65.0 million of purchases of transportation and logistics equipment. The progress rent for financing on any purchased equipment is based on the monthly equivalent lease rate factor to be determine at execution of each lease schedule.
Moser Acquisition
On January 27, 2025, the Company entered into a Stock Purchase Agreement (the “Moser Purchase Agreement”) by and among Wyatt Holdings, LLC, a Delaware limited liability company and wholly-owned subsidiary of the Company (the “Purchaser”), Moser Holdings, LLC, a Delaware limited liability company (the “Seller”), and for the limited purposes set forth therein, the Company (together with the Purchaser and the Seller, the “Parties”), pursuant to which the Purchaser will acquire (i) 100% of the authorized, issued and outstanding equity ownership interests in Moser Acquisition, Inc., a Delaware corporation (“Moser AcquisitionCo”), and (ii) Moser Engine Service, Inc. (d/b/a Moser Energy Systems), a Wyoming corporation and a wholly-owned subsidiary of Moser AcquisitionCo (such transaction, the “Moser Acquisition”).
The Moser Acquisition was completed on February 24, 2025. Under the terms and conditions of the Moser Purchase Agreement, the aggregate consideration paid to the Seller in the Moser Acquisition (the “Moser Consideration”) consisted of (i) $180.0 million in cash and (ii) approximately 1.7 million shares of the Company’s Common Stock (the “Moser Stock Consideration”), issued at the closing of the Moser Acquisition, which were valued at $40.0 million based on the 20-day trailing volume-weighted average price ending at the close of trading on Friday, January 24, 2025. All or any portion of the Moser Stock Consideration is subject to redemption (the “Redemption Right”) at the option of the Company within 90 days of closing of the Moser Acquisition (the “Moser Closing”). The Moser Consideration is subject to customary post-closing adjustments.
The Company has considered the disclosure requirements of ASC 805-10-50-2 and ASC 805-10-50-4 but has not included the required disclosures due to the timing of the transaction relative to the date of the report containing these Financial Statements.
Equity Offering
On January 30, 2025, the Company entered into the Underwriting Agreement, relating to the underwritten offering of 11.5 million shares of Common Stock at a public offering price of $23.00 per share. Under the terms of the Underwriting Agreement, the Company granted the Underwriters a 30-day option to purchase up to 1,725,000 additional shares of Common Stock (the “Option”).
The Offering closed on February 3, 2025. The Company received approximately $254.1 million of net proceeds from the sale of shares of our Common Stock, after deducting underwriting discounts and commissions. We used the net proceeds from this offering (i) to repay the $70.0 million outstanding on the 2023 ABL Credit Facility, (ii) to repay $101.3 million of the Deferred Cash Consideration Note, and (iii) the remainder for general corporate purposes.
Debt Agreements
Second Amendment to the 2023 Term Loan Credit Agreement
On January 27, 2025, the Company entered into the Second Term Loan Amendment to the 2023 Term Loan Credit Agreement, among the Company and certain of its subsidiaries as guarantors, Atlas LLC, as borrower, the lenders party thereto and Stonebriar, as administrative agent, which amends that certain Credit Agreement, dated as of July 31, 2023, as amended (the “Second Term Loan Amendment”).
The Second Term Loan Amendment increased the existing DDT Loan by an aggregate principal amount of $100.0 million (the “Acquisition Loan”) to a total of $200.0 million, creating availability of $180.0 million, with interest (computed on the basis of a 365-day year for the actual number of days elapsed) on the unpaid principal amount thereof from and including the date of the funding on the Acquisition Loan (“Funding Date”) until paid in full. The Acquisition Loan will accrue interest at a rate equal to 5.95% plus the greater of (A) the Term SOFR and (B) 4.30%, as determined on the Funding Date the Acquisition Loan is payable in 60 consecutive monthly installments of combined principal and interest. In the event of a prepayment of the Acquisition Loan, Atlas LLC will be required to pay, and we have agreed to guaranty payment by Atlas LLC of, a premium on such prepayment amount of (A) 4%, if prepaid on or prior to the first anniversary of the Funding Date, (B) 3% if prepaid after the first, but on or prior to the second, anniversary of the Funding Date and (C) 2% if paid after the second anniversary of the Funding Date.
Second Amendment to the 2023 ABL Credit Agreement
On January 27, 2025, Atlas LLC and certain other subsidiaries of the Company entered into that certain Second Amendment to Loan, Security and Guaranty Agreement (the “Second ABL Amendment”), among Atlas LLC, as the borrower, the subsidiary guarantors party thereto, the lenders party thereto and Bank of America, N.A., as the ABL Agent. The Second ABL Amendment amends that certain Loan, Security and Guaranty Agreement dated as of February 22, 2023, as amended.
The Second ABL Amendment permitted the Company and its applicable affiliates to enter into the Second Term Loan Amendment, pursuant to which the principal amount of the existing delayed draw term loan was increased by an aggregate principal amount of $100.0 million.
2025 Term Loan Credit Facility
On February 21, 2025, Atlas LLC entered into a credit agreement (the “2025 Term Loan Credit Agreement”) with Stonebriar, as administrative agent and initial lender, pursuant to which Stonebriar extended Atlas LLC a term loan credit facility comprised of a $540.0 million single advance term loan that was made on February 21, 2025 (the “2025 Term Loan Credit Facility”).
The 2025 Term Loan Credit Facility is payable in eighty-five consecutive monthly installments, consisting of forty-eight monthly installments of combined principal and interest, thirty-seven installments of interest only payments, and a final payment of the remaining outstanding principal balance at maturity. The 2025 Term Loan Credit Facility has a final maturity date of March 1, 2032 (the “Maturity Date”). The 2025 Term Loan Credit Facility bears interest at a rate equal to 9.51% per annum.
In the event that the Leverage Ratio (as defined under the 2025 Term Loan Credit Agreement) as of the end of any fiscal quarter ending on or after June 30, 2025 is equal to or greater than 2.5:1.0, Atlas LLC will be required to prepay the 2025 Term Loan Credit Facility with 50% of Excess Cash Flow (as defined under the 2025 Term Loan Credit Agreement) for the fiscal quarter period most recently ended less the aggregate amount of optional prepayments of the Term Loan made during such period.
Atlas LLC may voluntarily redeem the loan outstanding under the 2025 Term Loan Credit Facility, provided that any such prepayment shall include a prepayment fee equal to the sum of the Make-Whole Amount (as defined in under the 2025 Term Loan Credit Agreement) plus (a) three percent (3%) of the principal amount being repaid if such prepayment occurs on or prior to February 21, 2028, (b) two percent (2%) of the principal amount being repaid if such prepayment occurs after February 21, 2028 but on or prior to February 21, 2029 and (c) one percent (1%) of the of the principal amount being repaid if such prepayment occurs thereafter. The Make-Whole Amount shall equal zero (0) when calculating any prepayment made after February 21, 2027. Upon the maturity of the 2025 Term Loan Credit Facility, the entire unpaid principal amount of the loan outstanding thereunder, together with interest, fees and other amounts payable in connection with the facility, will be immediately due and payable without further notice or demand.
Dividends and distributions to equity holders are permitted to be made pursuant to certain limited exceptions and baskets described in the 2025 Term Loan Credit Agreement and otherwise generally subject to certain restrictions set forth in the 2025 Term Loan Credit Agreement, including the requirement that no Event of Default (as defined under the 2025 Term Loan Credit Agreement) has occurred and is continuing.
The 2025 Term Loan Credit Facility includes certain non-financial covenants, including but not limited to restrictions on incurring additional debt and certain distributions. The 2025 Term Loan Credit Facility is subject to two financial covenants, which require that the Loan Parties (as defined in the 2025 Term Loan Credit Agreement) maintain a maximum Leverage Ratio of 4.0 to 1.0 and a minimum Liquidity (as defined in the 2025 Term Loan Credit Agreement) of $40,000,000. Such financial covenants are tested as of the last day of each fiscal quarter.
The Company used the proceeds from the 2025 Term Loan Credit Facility to refinance the existing term loan facilities, to fund the cash consideration in connection with the Moser Acquisition and for general corporate purposes.
The 2025 Term Loan Credit Facility is unconditionally guaranteed, jointly and severally, by Atlas LLC and its subsidiaries and secured by substantially all of the assets of Atlas LLC and its subsidiaries. The 2025 Term Loan Credit Facility is also unconditionally guaranteed on an unsecured basis by the Company.
Third Amendment to the 2023 ABL Credit Agreement
On February 21, 2025, Atlas LLC and certain other subsidiaries of the Company entered into that certain Third Amendment to Loan, Security and Guaranty Agreement (the “Third ABL Amendment”), among Atlas LLC, as the borrower, the subsidiary guarantors party thereto, the lenders party thereto and Bank of America, N.A., as administrative agent. The Third ABL Amendment amends that certain Loan, Security and Guaranty Agreement dated as of February 22, 2023, as amended.
The Third ABL Amendment permitted the Company and its applicable affiliates to enter into the 2025 Term Loan Credit Agreement, pursuant to which Atlas LLC borrowed $540.0 million from Stonebriar in a single advance term loan that was made on February 21, 2025.
Registration Rights Agreement
On February 24, 2025, in connection with the Moser Closing, the Company entered into a registration rights agreement (the “Moser Registration Rights Agreement”) with the Seller that provides, among other things, that the Company will, no later than (a) March 26, 2025, or (b) if the Company is and continues to be a “Well-Known Seasoned Issuer” as defined in Rule 405 of the Securities Act, May 25, 2025, file with the U.S. Securities and Exchange Commission a registration statement registering for resale the Common Stock comprising the Moser Stock Consideration that was issued in connection with the Moser Acquisition, subject to the full or partial exercise of the Redemption Right by the Company. Pursuant to the Moser Purchase Agreement, the Seller agreed not to lend, offer, sell, contract to sell, sell any option or contract to purchase, purchase any option or contract to sell, grant any option, right, or warrant to purchase, or otherwise transfer or dispose of, any of their shares of Common Stock for a period of 90 days following the Moser Closing, subject to certain exceptions. The Company also agreed to pay certain expenses of the parties incurred in connection with the exercise of their rights under the Moser Registration Rights Agreement, and to indemnify them for certain securities law matters in connection with any registration statement filed pursuant thereto.
Item 9. Changes in and Disagreements With Accountants on Accounting and Financial Disclosure.
None.
Item 9A. Controls and Procedures.
Evaluation of Disclosure Controls and Procedures
As required by Rule 13a-15(b) under the Exchange Act, we have evaluated, under the supervision and with the participation of management, including our principal executive officer and principal financial officer, the effectiveness of the design and operation of our disclosure controls and procedures (as defined in Rules 13a-15(e) and 15d-15(e) under the Exchange Act, as amended) as of the end of the period covered by this Annual Report. Our disclosure controls and procedures are designed to provide reasonable assurance that the information required to be disclosed by us in reports that we file or submit under the Exchange Act is accumulated and communicated to management, including our principal executive officer and principal financial officer, as appropriate, to allow timely decisions regarding required disclosure and is recorded, processed, summarized and reported within the time periods specified in the rules and forms of the SEC.
Based on the evaluation of our disclosure controls and procedures, our Chief Executive Officer and Chief Financial Officer concluded that our disclosure controls and procedures were ineffective as of December 31, 2024 due to the material weakness in our internal control over financial reporting identified and described below. Notwithstanding the identified material weakness, management concluded that our financial statements contained in this Annual Report fairly present, in all material respects, our financial condition, results of operations and cash flows as of and for the periods presented in conformity with GAAP.
Management’s Annual Report on Internal Control over Financial Reporting
Our management is responsible for establishing and maintaining adequate internal control over financial reporting, as such term is defined in Rules 13a-15(f) and 15d-15(f) under the Exchange Act, as amended. Our internal control over financial reporting was designed to provide reasonable assurance regarding the reliability of financial reporting and the preparation of financial statements for external purposes in accordance with generally accepted accounting principles. Because of its inherent limitations, internal control over financial reporting may not prevent or detect misstatements. Also, projections of any evaluation of effectiveness to future periods are subject to the risk that controls may become inadequate because of changes in conditions, or that the degree of compliance with the policies or procedures may deteriorate.
In making its assessment, management has utilized the criteria set forth by the Committee of Sponsoring Organizations of the Treadway Commission (or “COSO”) in Internal Control-Integrated Framework (2013 framework). Based on this evaluation, our management concluded that our internal control over financial reporting was not effective as of December 31, 2024 as a result of the material weakness in internal control over financial reporting related to change management and logical access for financially significant applications. The material weakness did not result in any material misstatement in our Consolidated Financial Statements.
A material weakness is a deficiency, or a combination of deficiencies, in internal control over financial reporting, such that there is a reasonable possibility that a material misstatement of a company’s annual or interim financial statements will not be prevented or detected on a timely basis.
As part of our assessment of the effectiveness of our internal control over financial reporting as of December 31, 2024, management identified deficiencies related to our information technology (“IT”) general controls (“ITGCs”) in the area of IT program change management and logical access controls that, when viewed in combination, aggregated to a material weakness. Specifically, management determined that we did not maintain effective controls over program change management and logical access for financially significant applications to ensure that IT program and data changes affecting financial IT applications and underlying accounting records are identified, tested, authorized and implemented appropriately. As a result, the application controls and IT-dependent manual controls that rely upon information from the impacted IT applications were also deemed ineffective.
While we have concluded that this material weakness did not result in a material misstatement in our Financial Statements, it was not remediated as of December 31, 2024, and thus could have created a reasonable possibility that a material misstatement to the annual or interim financial statements would not have been prevented or detected on a timely basis. Accordingly, we determined that these control deficiencies constituted a material weakness.
After giving full consideration to the material weakness, and the additional analyses and other procedures we performed to ensure that our Financial Statements included in this Annual Report on Form 10-K were prepared in accordance with GAAP, our management has concluded that our Financial Statements present fairly, in all material respects, our financial position, results of operations and cash flows for the periods disclosed in conformity with GAAP.
As disclosed in Note 3 in the notes to the Financial Statements, we acquired Hi-Crush Inc. and certain of its wholly-owned subsidiaries on March 5, 2024 and accounted for this acquisition as a business combination. Hi-Crush’s total revenues constituted approximately 48% of our total consolidated revenues for the year ended December 31, 2024. Hi-Crush’s total assets constituted approximately 31% of our total consolidated assets as of December 31, 2024. We excluded Hi-Crush from management's assessment of our internal controls over financial reporting as of December 31, 2024. This exclusion is in accordance with the SEC staff’s general guidance that an assessment of a recently acquired business may be omitted from the scope of management’s assessment of internal controls over financial reporting for one year following the acquisition. We are currently finalizing the integration of the businesses and operations acquired from Hi-Crush into our internal control over financial reporting processes. In executing this integration, we are analyzing, evaluating, and, where necessary, making changes in controls and procedures related to these businesses and operations.
Ernst & Young LLP, the independent registered public accounting firm that audited the Financial Statements of the Company included in this Annual Report on Form 10-K, has issued an audit report on the effectiveness of our internal control over financial reporting as of December 31, 2024, which is included in this Item 9A.
Plan for Remediation of Material Weakness
Management is developing a remediation plan to address the material weakness and to improve the design and operating effectiveness of our ITGCs. The remediation plan includes, among other things:
•Reassessing the design and operating effectiveness of internal controls related to the program change management and access;
•Expanding the management and governance over IT system controls; and
•Implementing additional controls specific to applications that manage and process IT program changes and logical access.
We are in the process of developing the remediation activities as of the date of this report and believe that upon completion, we will have strengthened our ITGCs to address and successfully remediate the identified material weakness. However, control weaknesses are not considered remediated until new internal controls have been operational for a period of time, are tested, and management concludes that these controls are operating effectively.
Changes in Internal Control Over Financial Reporting
As discussed above in Item 9A, on March 5, 2024, we completed the acquisition of Hi-Crush. We are currently finalizing the integration of the businesses and operations acquired from Hi-Crush into our internal control over financial reporting processes. In executing this integration, we are analyzing, evaluating, and, where necessary, making changes in controls and procedures related to these businesses and operations. We have excluded Hi-Crush from our assessment of internal control over financial reporting as of December 31, 2024, as permitted by guidance provided by the staff of the SEC.
Except as described above and the unremediated material weakness described herein, there were no changes to our internal control over financial reporting that occurred during the year ended December 31, 2024 that have materially affected, or are reasonably likely to materially affect, our internal control over financial reporting.
Report of Independent Registered Public Accounting Firm
To the Stockholders and the Board of Directors of Atlas Energy Solutions Inc.
Opinion on Internal Control Over Financial Reporting
We have audited Atlas Energy Solutions Inc.’s internal control over financial reporting as of December 31, 2024, based on criteria established in Internal Control—Integrated Framework issued by the Committee of Sponsoring Organizations of the Treadway Commission (2013 framework) (the COSO criteria). In our opinion, because of the effect of the material weakness described below on the achievement of the objectives of the control criteria, Atlas Energy Solutions, Inc. (the Company) has not maintained effective internal control over financial reporting as of December 31, 2024, based on the COSO criteria.
A material weakness is a deficiency, or combination of deficiencies, in internal control over financial reporting, such that there is a reasonable possibility that a material misstatement of the company’s annual or interim financial statements will not be prevented or detected on a timely basis. The following material weakness has been identified and included in management’s assessment. Management has identified a material weakness related to the operation of information technology (IT) general controls in the areas of program change management and logical access for systems supporting the Company’s internal control over financial reporting. As a result, the application controls and IT-dependent manual controls that rely upon information from the impacted IT applications were also deemed ineffective.
As indicated in the accompanying Management’s Annual Report on Internal Control over Financial Reporting, management’s assessment of and conclusion on the effectiveness of internal control over financial reporting did not include the internal controls of Hi-Crush Inc., which is included in the 2024 consolidated financial statements of the Company and constituted 31% of total assets, as of December 31, 2024 and 48% of revenues, for the year then ended. Our audit of internal control over financial reporting of the Company also did not include an evaluation of the internal control over financial reporting of Hi-Crush Inc.
We also have audited, in accordance with the standards of the Public Company Accounting Oversight Board (United States) (PCAOB), the consolidated balance sheets of the Company as of December 31, 2024 and 2023, the related consolidated statements of operations, stockholders' and members' equity and redeemable noncontrolling interest and cash flows for each of the three years in the period ended December 31, 2024, and the related notes. This material weakness was considered in determining the nature, timing and extent of audit tests applied in our audit of the 2024 consolidated financial statements, and this report does not affect our report dated February 25, 2025, which expressed an unqualified opinion thereon.
Basis for Opinion
The Company’s management is responsible for maintaining effective internal control over financial reporting and for its assessment of the effectiveness of internal control over financial reporting included in the accompanying Management’s Annual Report on Internal Control over Financial Reporting. Our responsibility is to express an opinion on the Company’s internal control over financial reporting based on our audit. We are a public accounting firm registered with the PCAOB and are required to be independent with respect to the Company in accordance with the U.S. federal securities laws and the applicable rules and regulations of the Securities and Exchange Commission and the PCAOB.
We conducted our audit in accordance with the standards of the PCAOB. Those standards require that we plan and perform the audit to obtain reasonable assurance about whether effective internal control over financial reporting was maintained in all material respects.
Our audit included obtaining an understanding of internal control over financial reporting, assessing the risk that a material weakness exists, testing and evaluating the design and operating effectiveness of internal control based on the assessed risk, and performing such other procedures as we considered necessary in the circumstances. We believe that our audit provides a reasonable basis for our opinion.
Definition and Limitations of Internal Control Over Financial Reporting
A company’s internal control over financial reporting is a process designed to provide reasonable assurance regarding the reliability of financial reporting and the preparation of financial statements for external purposes in accordance with generally accepted accounting principles. A company’s internal control over financial reporting includes those policies and procedures that (1) pertain to the maintenance of records that, in reasonable detail, accurately and fairly reflect the transactions and dispositions of the assets of the company; (2) provide reasonable assurance that transactions are recorded as necessary to permit preparation of financial statements in accordance with generally accepted accounting principles, and that receipts and expenditures of the company are being made only in accordance with authorizations of management and directors of the company; and (3) provide reasonable assurance regarding prevention or timely detection of unauthorized acquisition, use, or disposition of the company’s assets that could have a material effect on the financial statements.
Because of its inherent limitations, internal control over financial reporting may not prevent or detect misstatements. Also, projections of any evaluation of effectiveness to future periods are subject to the risk that controls may become inadequate because of changes in conditions, or that the degree of compliance with the policies or procedures may deteriorate.
/s/ Ernst & Young LLP
Austin, Texas
February 25, 2025
Item 9B. Other Information.
Trading Plans
Transactions in our securities by our directors and executive officers, as well as transactions in our securities by the Company itself under any Board-approved stock repurchase program, are required to be made in accordance with our Insider Trading Policy, which, among other things, requires that the transactions be in accordance with applicable U.S. federal securities laws that prohibit trading while in possession of material nonpublic information. Rule 10b5-1 under the Exchange Act provides an affirmative defense that enables prearranged transactions in securities in a manner that avoids concerns about initiating transactions at a future date while possibly in possession of material nonpublic information. Our Insider Trading Policy permits our directors and executive officers to enter into trading plans designed to comply with Rule 10b5-1. Accordingly, sales under these plans may occur at any time, including possibly before, simultaneously with, or immediately after significant events involving our Company.
During the year ended December 31, 2024, none of our directors or officers (as defined in Rule 16a-1(f) under the Exchange Act) adopted or terminated a “Rule 10b5-1 trading arrangement” or a “non-Rule 10b5-1 trading arrangement,” as each term is defined in Item 408 of Regulation S-K, except as follows:
Stacy Hock, one of our directors, adopted a Rule 10b5-1 trading arrangement on March 22, 2024 for the potential sale of up to 90,000 shares of Common Stock, subject to certain conditions. The arrangement’s expiration date was December 19, 2024. In addition, Ms. Hock adopted a Rule 10b5-1 trading arrangement on September 26, 2024 for the potential sale of up to 90,000 shares of Common Stock, subject to certain conditions. The arrangement’s expiration date is June 13, 2025.
Item 9C. Disclosure Regarding Foreign Jurisdictions that Prevent Inspections.
Not applicable.
PART III
Item 10. Directors, Executive Officers and Corporate Governance.
The information required by this item (and only such information) is incorporated by reference to our Definitive Proxy Statement for our 2025 Annual Meeting of Shareholders to be filed with the SEC within 120 days of December 31, 2024 (“Proxy Statement”).
We have an insider trading policy governing the purchase, sale and other dispositions of the our securities that applies to all of our personnel, including directors, officers, employees, and other covered persons. We also follow procedures for the repurchase of its securities. We believe that our insider trading policy and repurchase procedures are reasonably designed to promote compliance with insider trading laws, rules and regulations, and listing standards applicable to the Company. A copy of the Company’s insider trading policy is filed as Exhibit 19.1 to this Annual Report.
Item 11. Executive Compensation.
The information required by this item (and only such information) is incorporated by reference to our Proxy Statement.
Item 12. Security Ownership of Certain Beneficial Owners and Management and Related Stockholder Matters.
The information required by this item (and only such information) is incorporated by reference to our Proxy Statement.
Item 13. Certain Relationships and Related Transactions, and Director Independence.
The information required by this item (and only such information) is incorporated by reference to our Proxy Statement.
Item 14. Principal Accounting Fees and Services.
The information required by this item (and only such information) is incorporated by reference to our Proxy Statement.
PART IV
Item 15. Exhibits, Financial Statement Schedules.
(a)The following documents are filed as part of this Annual Report on Form 10-K:
Reference is made to Part II, Item 8 of this Annual Report on Form 10-K.
(2)Financial Statement Schedules
The financial statement schedules have been omitted because they are either not required, not applicable or the information required to be presented is included in the Company’s consolidated financial statements and notes thereto.
The exhibits required to be filed or furnished pursuant to Item 601 of Regulation S-K are set forth below.
Exhibit Index
| | |
Exhibit Number |
| Description |
2.1 | | Master Reorganization Agreement, dated as of March 8, 2023, by and among Atlas Energy Solutions Inc., Atlas Sand Management Company, LLC, Atlas Sand Company, LLC, Atlas Sand Holdings, LLC, Atlas Sand Operating, LLC, Atlas Sand Holdings II, LLC, Atlas Sand Management Company II, LLC and Atlas Sand Merger Sub, LLC (incorporated by reference to Exhibit 2.1 to our predecessor's Current Report on Form 8-K (Commission File No. 001-41640) filed on March 8, 2023). |
2.2 | | Master Reorganization Agreement, dated as of July 31, 2023 by and among Atlas Energy Solutions Inc., Atlas Sand Operating, LLC, New Atlas HoldCo Inc., AESI Merger Sub Inc., Atlas Operating Merger Sub, LLC and Atlas Sand Holdings, LLC (incorporated by reference to Exhibit 2.1 to the Registrant’s Current Report on Form 8-K (Commission File No. 001-41640) filed on August 1, 2023). |
2.3# | | Agreement and Plan of Merger, dated as of February 26, 2024 by and among Atlas Energy Solutions Inc., Atlas Sand Company, LLC, Wyatt Merger Sub 1 Inc., Wyatt Merger Sub 2, LLC, Hi-Crush Inc., Clearlake Capital Partners V Finance, L.P. and HC Minerals Inc (incorporated by reference to Exhibit 2.1 to our Current Report on Form 8-K (Commission File No. 001-41828) filed on February 26, 2024). |
2.4# | | Stock Purchase Agreement, dated as of January 27, 2025, by and among Wyatt Holdings, LLC, Moser Holdings, LLC and Atlas Energy Solutions Inc (incorporated by reference to Exhibit 2.1 to our Current Report on Form 8-K (Commission File No. 001-41828) filed on January 27, 2025). |
3.1 | | Amended and Restated Certificate of Incorporation of the Company, as filed with the Secretary of State of the State of Delaware on October 2, 2023 (incorporated by reference to Exhibit 3.1 to the Registrant’s Current Report on Form 8-K (Commission File No. 001-41828) filed on October 3, 2023). |
3.2 | | Amended and Restated Bylaws of the Company, effective as of October 2, 2023 (incorporated by reference to Exhibit 3.2 to the Registrant’s Current Report on Form 8-K (Commission File No. 001-41828) filed on October 3, 2023). |
4.1 | | Amended and Restated Registration Rights Agreement, dated October 2, 2023, by and between the Company, Old Atlas, and the signatories thereto (incorporated by reference to Exhibit 4.1 to the Registrant’s Current Report on Form 8-K (Commission File No. 001-41828) filed on October 3, 2023). |
4.2 | | Description of Securities Registered Pursuant to Section 12 of the Securities Exchange Act of 1934 (incorporated by reference to Exhibit 4.2 to our Annual Report on Form 10-K (Commission File No. 001-41828) filed on February 27, 2024). |
10.1 | | Amended and Restated Stockholders’ Agreement, dated October 2, 2023, by and between the Company, Old Atlas, and the signatories thereto (incorporated by reference to Exhibit 10.1 to the Registrant’s Quarterly Report on Form 10-Q (Commission File No. 001-41828) filed on October 31, 2023). |
10.2 | | Second Amended and Restated Limited Liability Company Agreement of Atlas Sand Operating, LLC, dated as of October 2, 2023 (incorporated by reference to Exhibit 10.2 to the Registrant’s Current Report on Form 8-K (Commission File No. 001-41828) filed on October 3, 2023). |
10.3† | | Atlas Energy Solutions Inc. 2023 Long Term Incentive Plan (incorporated by reference to Exhibit 10.3 to our predecessor's Current Report on Form 8-K (Commission File No. 001-41640) filed on March 8, 2023). |
10.4 | | Loan, Security and Guaranty Agreement, dated as of February 22, 2023, among Atlas Sand Company, LLC, as Borrower, certain of its subsidiaries, as Guarantors, Bank of America, N.A., as Agent and Bank of America, N.A., as Sole Lead Arranger and Sole Bookrunner (incorporated by reference to Exhibit 10.5 to our predecessor's Registration Statement on Form S-1/A (Registration No. 333-269488) filed on February 24, 2023). |
10.5 | | Credit Agreement, dated as of July 31, 2023, by and between Atlas Sand Company, LLC, as borrower, and Stonebriar Commercial Finance LLC, as lender (incorporated by reference to Exhibit 10.1 to our predecessor's Current Report on Form 8-K (Commission File No. 001-41640) filed on July 31, 2023). |
10.6 | | Mining Lease Agreement, dated as of December 15, 2017, by and between the Sealy & Smith Foundation and Atlas Sand Company, LLC (incorporated by reference to Exhibit 10.12 to our predecessor's Registration Statement on Form S-1/A (Registration No. 333-269488) filed on February 8, 2023). |
10.7 | | Form of Indemnification (incorporated by reference to Exhibit 10.3 to the Registrant’s Current Report on Form 8-K (Commission File No. 001-41828) filed on October 3, 2023). |
10.8 | | Registration Rights and Lock-Up Agreement, dated as of March 5, 2024, by and between Atlas Energy Solutions Inc. and the signatories thereto (incorporated by reference to Exhibit 10.1 to our Current Report on Form 8-K (Commission File No. 001-41828) filed on March 5, 2024). |
10.9 | | First Amendment to Loan, Security and Guaranty Agreement, dated as of February 26, 2024, among Atlas Sand Company, LLC, as Borrower, certain of its subsidiaries, as Guarantors, Bank of America, N.A., as Agent and Bank of America, N.A., as Sole Lead Arranger and Sole Bookrunner (incorporated by reference to Exhibit 10.1 to our Current Report on Form 8-K (Commission File No. 001-41828) filed on February 26, 2024). |
| | |
10.10 | | First Amendment to Credit Agreement, dated as of February 26, 2024, by and between Atlas Sand Company, LLC, as borrower, and Stonebriar Commercial Finance LLC, as lender (incorporated by reference to Exhibit 10.2 to our Current Report on Form 8-K (Commission File No. 001-41828) filed on February 26, 2024). |
10.11 | | Second Amendment to Loan, Security and Guaranty Agreement, dated as of January 27, 2025, by and among Atlas Sand Company, LLC, as borrower, certain of its subsidiaries as guarantors, the financial institutions party thereto as lenders and Bank of America, N.A., as agent for the lenders (incorporated by reference to Exhibit 10.2 to our Current Report on Form 8-K (Commission File No. 001-41828) filed on January 27, 2025). |
10.12 | | Second Amendment to Credit Agreement, dated as of January 27, 2025, by and between Atlas Sand Company, LLC, as borrower, and Stonebriar Commercial Finance LLC, as lender (incorporated by reference to Exhibit 10.1 to our Current Report on Form 8-K (Commission File No. 001-41828) filed on January 27, 2025). |
10.13# | | Credit Agreement, dated as of February 21, 2025, by and between Atlas Sand Company, LLC, as borrower, and Stonebriar Commercial Finance LLC, as administrative agent and initial lender (incorporated by reference to Exhibit 10.2 to our Current Report on Form 8-K (Commission File No. 001-41828) filed on February 24, 2025). |
10.14# | | Third Amendment to Loan, Security and Guaranty Agreement, dated as of February 21, 2025, by and among Atlas Sand Company, LLC, as borrower, certain of its subsidiaries as guarantors, the financial institutions party thereto as lenders and Bank of America, N.A., as agent for the lenders (incorporated by reference to Exhibit 10.3 to our Current Report on Form 8-K (Commission File No. 001-41828) filed on February 24, 2025). |
10.15 | | Registration Rights Agreement, dated as of February 24, 2025, by and between Atlas Energy Solutions Inc. and the signatory thereto (incorporated by reference to Exhibit 10.1 to our Current Report on Form 8-K (Commission File No. 001-41828) filed on February 24, 2025). |
10.16† | | Form of Restricted Stock Unit Grant Agreement (Officers) (incorporated by reference to Exhibit 10.4 to our Quarterly Report on Form 10-Q (Commission File No. 001-41828) filed on May 8, 2024). |
10.17† | | Form of Restricted Stock Unit Grant Agreement (Section 16 Officers) (incorporated by reference to Exhibit 10.5 to our Quarterly Report on Form 10-Q (Commission File No. 001-41828) filed on May 8, 2024). |
10.18† | | Management Change in Control Severance Plan (incorporated by reference to Exhibit 10.6 to our Quarterly Report on Form 10-Q (Commission File No. 001-41828) filed on May 8, 2024). |
10.19# | | Executed Deferred Cash Consideration Note, dated March 5, 2024, by and between Atlas Sand Company, LLC, as borrower, and the Noteholders as defined in the agreement (incorporated by reference to Exhibit 10.7 to our Quarterly Report on Form 10-Q (Commission File No. 001-41828) filed on May 8, 2024). |
10.20† | | Form of Performance Share Unit Grant Agreement (Officers) (incorporated by reference to Exhibit 10.8 to our Quarterly Report on Form 10-Q (Commission File No. 001-41828) filed on May 8, 2024). |
10.21† | | Form of Performance Share Unit Grant Agreement (Section 16 Officers) (incorporated by reference to Exhibit 10.9 to our Quarterly Report on Form 10-Q (Commission File No. 001-41828) filed on May 8, 2024). |
19.1* | | Atlas Energy Solutions Inc. Insider Trading Policy. |
21.1* | | List of subsidiaries of Atlas Energy Solutions Inc. |
23.1* | | Consent of John T. Boyd Company. |
23.2* | | Consent of Ernst & Young LLP. |
31.1* |
| Certification of Principal Executive Officer Pursuant to Rules 13a-14(a) and 15d-14(a) under the Securities Exchange Act of 1934, as Adopted Pursuant to Section 302 of the Sarbanes-Oxley Act of 2002. |
31.2* |
| Certification of Principal Financial Officer Pursuant to Rules 13a-14(a) and 15d-14(a) under the Securities Exchange Act of 1934, as Adopted Pursuant to Section 302 of the Sarbanes-Oxley Act of 2002. |
32.1* |
| Certification of Principal Executive Officer Pursuant to 18 U.S.C. Section 1350, as Adopted Pursuant to Section 906 of the Sarbanes-Oxley Act of 2002. |
32.2* |
| Certification of Principal Financial Officer Pursuant to 18 U.S.C. Section 1350, as Adopted Pursuant to Section 906 of the Sarbanes-Oxley Act of 2002. |
95.1* | | Mine Safety Disclosures. |
96.1 | | John T. Boyd Company Summary of Reserves at December 31, 2023 (incorporated by reference to Exhibit 96.3 to our Annual Report on Form 10-K (Commission File No. 001-41828) filed on February 27, 2024). |
96.2 | | John T. Boyd Company Summary of Reserves of Kermit Mine as of December 31, 2023 (incorporated by reference to Exhibit 99.4 to our Current Report on Form 8-K (Commission File No. 001-41828) filed on May 8, 2024). |
96.3* | | John T. Boyd Company Summary of Reserves of OnCore Plants as of December 31, 2024. |
97.1 | | Atlas Energy Solutions Inc. Clawback Policy (incorporated by reference to Exhibit 97.1 to our Annual Report on Form 10-K (Commission File No. 001-41828) filed on February 27, 2024). |
101.INS* |
| Inline XBRL Instance Document – the instance document does not appear in the Interactive Data File because XBRL tags are embedded within the Inline XBRL document |
101.SCH* | | Inline XBRL Taxonomy Extension Schema With Embedded Linkbase Documents |
104* | | Cover page formatted as Inline XBRL and contained in Exhibit 101 |
* Filed herewith
| |
† Compensatory plan or arrangement | |
|
# Certain schedules, annexes or exhibits have been omitted pursuant to Item 601(a)(5) of Regulation S-K, but will be furnished supplementally to the SEC upon request. |
Item 16. Form 10-K Summary
None.
SIGNATURES
Pursuant to the requirements of Section 13 or 15(d) of the Securities Exchange Act of 1934, as amended, the Registrant has duly caused this Annual Report to be signed on its behalf by the undersigned, thereunto duly authorized.
| | | |
|
| ATLAS ENERGY SOLUTIONS INC. |
|
|
|
|
Date: February 25, 2025 |
| By: | /s/ John Turner |
|
|
| John Turner |
|
|
| President and Chief Executive Officer |
| | | |
| | By: | /s/ Blake McCarthy |
| | | Blake McCarthy |
| | | Chief Financial Officer |
Pursuant to the requirements of the Securities Exchange Act of 1934, as amended, this Annual Report has been signed below by the following persons on behalf of the Registrant in the capacities and on the dates indicated.
| | | | |
Name |
| Title |
| Date |
|
|
|
|
|
/s/ Ben M. Brigham |
| Executive Chairman |
| February 25, 2025 |
Ben M. Brigham |
|
|
|
|
|
|
|
|
|
/s/ John Turner |
| President, Chief Executive Officer, and Director (Principal Executive Officer) |
| February 25, 2025 |
John Turner |
|
|
|
|
| | | | |
/s/ Blake McCarthy | | Chief Financial Officer (Principal Accounting and Financial Officer) | | February 25, 2025 |
Blake McCarthy | | | | |
|
|
|
|
|
/s/ Gayle Burleson |
| Director |
| February 25, 2025 |
Gayle Burleson |
|
|
|
|
|
|
|
|
|
/s/ Stacy Hock |
| Director |
| February 25, 2025 |
Stacy Hock |
|
|
|
|
| | | | |
/s/ Mike Howard | | Director | | February 25, 2025 |
Mike Howard |
|
|
|
|
| | | | |
/s/ A. Lance Langford |
| Director |
| February 25, 2025 |
A. Lance Langford |
|
|
|
|
|
|
|
|
|
/s/ Mark P. Mills |
| Director |
| February 25, 2025 |
Mark P. Mills |
|
|
|
|
|
|
|
|
|
/s/ Douglas Rogers |
| Director |
| February 25, 2025 |
Douglas Rogers |
|
|
|
|
|
|
|
|
|
/s/ Robb L. Voyles | | Director | | February 25, 2025 |
Robb L. Voyles | | | | |