TECHNICAL REPORT SUMMARY
FRAC SAND RESOURCES AND RESERVES
ONCORE PLANTS
West Texas
Prepared For
ATLAS ENERGY SOLUTIONS INC.
By
John T. Boyd Company
Mining and Geological Consultants
Pittsburgh, Pennsylvania, USA

Report No. 3871.010
FEBRUARY 2025
| | |
| 
| John T. Boyd Company Mining and Geological Consultants |
| | | |
Chairman | | February 20, 2025 |
James W. Boyd | | File: 3871.010 |
| | | |
President and CEO | | | |
John T. Boyd II | | | |
| | | |
Managing Director and COO | | Atlas Energy Solutions Inc. 5918 West Courtyard Drive, Suite 500 Austin, TX 78730 |
Ronald L. Lewis | |
| |
Vice Presidents | |
Robert J. Farmer | | | |
Jisheng (Jason) Han | | Attention: | Mr. Blake McCarthy |
John L. Weiss | | | Chief Financial Officer |
Michael F. Wick | | | |
William P. Wolf | | | |
| | | |
Managing Director - Australia | | Subject: | Technical Report Summary |
Jacques G. Steenkamp | | | Frac Sand Resources and Reserves |
| | | OnCore Plants |
Managing Director - China | | | West Texas |
Rongjie (Jeff) Li | | | |
| | | |
Managing Director – South America | | Ladies and Gentlemen: |
Carlos F. Barrera | | | |
| | The John T. Boyd Company (BOYD) was retained by Atlas Energy Solutions Inc. (Atlas) to independently prepare estimates of mineral resources and mineral reserves—hereafter referred to as frac sand resources and frac sand reserves, respectively—for the OnCore Plants (or “OnCore”) as of December 31, 2024. |
| |
Pittsburgh | |
4000 Town Center Boulevard, Suite 300 | |
Canonsburg, PA 15317 | |
(724) 873-4400 | |
(724) 873-4401 Fax | |
jtboydp@jtboyd.com | |
| | | |
Denver | | This Technical Report Summary (TRS) has been prepared to support Atlas’ disclosure of the subject frac sand resources and frac sand reserves in accordance with Subpart 1300 and Item 601(b)(96) of Regulation S-K (collectively, “S‑K 1300”) as adopted by the U.S. Securities and Exchange Commission’s (SEC) on October 31, 2018. |
(303) 293-8988 | |
jtboydd@jtboyd.com | |
| |
Brisbane | |
61 7 3232-5000 | |
jtboydau@jtboyd.com | |
| | | |
Beijing | | | |
86 10 6500-5854 | | | |
jtboydcn@jtboyd.com | | Respectfully submitted, |
| | | |
Bogota | | JOHN T. BOYD COMPANY |
+57-3115382113 | | By: | 
|
jtboydcol@jtboyd.com | | |
| | |
www.jtboyd.com | | |
| | John T. Boyd II |
| | President and CEO |
TABLE OF CONTENTS
| | | | |
| Page |
| |
LETTER OF TRANSMITTAL | |
| | |
| | |
TABLE OF CONTENTS | |
| | |
GLOSSARY AND ABBREVIATIONS | |
| | |
1.0 | EXECUTIVE SUMMARY | 1-1 |
| 1.1 | Introduction | 1-1 |
| 1.2 | Property Description and Location | 1-1 |
| 1.3 | Geology | 1-3 |
| 1.4 | Exploration | 1-4 |
| 1.5 | Frac Sand Reserves | 1-4 |
| 1.6 | Operations | 1-5 |
| | 1.6.1 | Mining | 1-5 |
| | 1.6.2 | Processing | 1-6 |
| | 1.6.3 | Other Infrastructure | 1-7 |
| 1.7 | Financial Analysis | 1-7 |
| | 1.7.1 | Market Analysis | 1-7 |
| | 1.7.2 | Capital and Operating Cost Estimates | 1-8 |
| | 1.7.3 | Economic Analysis | 1-9 |
| 1.8 | Permitting and Compliance | 1-11 |
| 1.9 | Conclusions | 1-11 |
| | | | |
| | | | |
2.0 | INTRODUCTION | 2-1 |
| 2.1 | Registrant | 2-1 |
| 2.2 | Purpose and Terms of Reference | 2-1 |
| 2.3 | Expert Qualifications | 2-2 |
| 2.4 | Principal Sources of Information | 2-3 |
| | 2.4.1 | Personal Inspections | 2-4 |
| | 2.4.2 | Reliance on Information Provided by the Registrant | 2-4 |
| | 2.4.3 | Verification of Information | 2-5 |
| | 2.4.4 | Other Relevant Data and Information | 2-5 |
| 2.5 | Report Version | 2-5 |
| 2.6 | Units of Measure | 2-5 |
| | | | |
| | | | |
3.0 | PROPERTY OVERVIEW | 3-1 |
| 3.1 | Description and Location | 3-1 |
| 3.2 | History | 3-2 |
| 3.3 | Property Control | 3-10 |
| 3.4 | Adjacent Properties | 3-11 |
| 3.5 | Regulation and Liabilities | 3-11 |
| 3.6 | Accessibility, Local Resources, and Infrastructure | 3-11 |
TABLE OF CONTENTS - Continued
| | | | |
| Page |
| |
| 3.7 | Physiography | 3-12 |
| 3.8 | Climate | 3-13 |
| | | | |
| | | | |
4.0 | GEOLOGY | 4-1 |
| 4.1 | Regional Geology | 4-1 |
| 4.2 | Property Geology | 4-1 |
| | 4.2.1 | General Stratigraphy | 4-1 |
| | 4.2.2 | Structural Geology | 4-3 |
| | 4.2.3 | Frac Sand Geology | 4-3 |
| | | | |
| | | | |
5.0 | EXPLORATION DATA | 5-1 |
| 5.1 | Background | 5-1 |
| 5.2 | Exploration Procedures | 5-3 |
| | 5.2.1 | Drilling and Sampling Methodologies | 5-3 |
| | 5.2.2 | Proppant Sand Testing | 5-4 |
| | 5.2.3 | Other Exploration Methods | 5-5 |
| 5.3 | Laboratory Testing Results | 5-5 |
| | 5.3.1 | Grain Size Distribution | 5-6 |
| | 5.3.2 | Quality Summary | 5-6 |
| 5.4 | Data Verification | 5-7 |
| 5.5 | Adequacy of Exploration and Sampling Data | 5-8 |
| | | | |
| | | | |
6.0 | FRAC SAND RESOURCES AND RESERVES | 6-1 |
| 6.1 | Applicable Standards and Definitions | 6-1 |
| 6.2 | Frac Sand Resources | 6-2 |
| | 6.2.1 | Methodology | 6-2 |
| | 6.2.2 | Classification | 6-3 |
| | 6.2.3 | Estimation Criteria | 6-4 |
| | 6.2.4 | Frac Sand Resource Estimate | 6-5 |
| | 6.2.5 | Validation | 6-5 |
| 6.3 | Frac Sand Reserves | 6-6 |
| | 6.3.1 | Methodology | 6-6 |
| | 6.3.2 | Classification | 6-7 |
| | 6.3.3 | Frac Sand Reserve Estimate | 6-7 |
| | 6.3.4 | Significant Risks and Uncertainties | 6-8 |
| | 6.3.5 | Reconciliation with Previous Estimates | 6-9 |
| | | | |
| | | | |
7.0 | MINING OPERATIONS | 7-1 |
| 7.1 | Mining Method | 7-1 |
| 7.2 | Mine Schedule, Equipment, and Staffing | 7-1 |
| 7.3 | Engineering and Planning | 7-2 |
| 7.4 | Mining Sequence and Production | 7-2 |
| 7.5 | Mining Risks | 7-4 |
| | | | |
| | | | |
TABLE OF CONTENTS - Continued
| | | | |
| Page |
| |
8.0 | PROCESSING OPERATIONS | 8-1 |
| 8.1 | Overview | 8-1 |
| 8.2 | Processing Method | 8-2 |
| | 8.2.1 | Wet Plant | 8-2 |
| 8.3 | Production | 8-3 |
| 8.4 | Processing Risks | 8-3 |
| | | | |
9.0 | MINE INFRASTRUCTURE | 9-1 |
| 9.1 | Overview | 9-1 |
| 9.2 | Transportation | 9-1 |
| 9.3 | Utilities | 9-1 |
| 9.4 | Tailings Disposal | 9-2 |
| | | | |
| | | | |
10.0 | MARKET ANALYSIS | 10-1 |
| 10.1 | Market Overview and Outlook | 10-1 |
| 10.2 | Historical Sales | 10-5 |
| 10.3 | Market Entry Strategies | 10-6 |
| 10.4 | Future Sales | 10-6 |
| | | | |
| | | | |
11.0 | CAPITAL AND OPERATING COSTS | 11-1 |
| 11.1 | Historical Financial Performance | 11-1 |
| 11.2 | Estimated Costs | 11-1 |
| | 11.2.1 | Projected Capital Expenditures | 11-2 |
| | 11.2.2 | Projected Operating Costs | 11-3 |
| | | | |
| | | | |
12.0 | ECONOMIC ANALYSIS | 12-1 |
| 12.1 | Approach | 12-1 |
| 12.2 | Assumptions and Limitations | 12-2 |
| 12.3 | Financial Model Results | 12-3 |
| 12.4 | Sensitivity Analysis | 12-5 |
| | | | |
| | | | |
13.0 | PERMITTING AND COMPLIANCE | 13-1 |
| 13.1 | Permitting Requirements and Status | 13-1 |
| 13.2 | Environmental Studies | 13-1 |
| 13.3 | Waste Disposal and Water Management | 13-2 |
| 13.4 | Compliance | 13-3 |
| 13.5 | Plans, Negotiations, or Agreements | 13-3 |
| 13.6 | Post-Mining Land Use and Reclamation | 13-3 |
| 13.7 | Local Procurement and Hiring | 13-4 |
| | | | |
| | | | |
14.0 | INTERPRETATION AND CONCLUSIONS | 14-1 |
| 14.1 | Findings | 14-1 |
| 14.2 | Significant Risks and Uncertainties | 14-1 |
| 14.3 | Recommendations | 14-2 |
TABLE OF CONTENTS - Continued
| | |
| Page |
List of Tables | |
1.1 | Property Control | 1-3 |
1.2 | Frac Sand Reserves (as of December 31, 2024) | 1-5 |
1.3 | Financial Results | 1-10 |
1.4 | DCF-NPV Analysis | 1-10 |
3.1 | OnCore Plant Locations | 3-1 |
3.2 | Property Status | 3-2 |
3.3 | Property Control | 3-11 |
4.1 | Surficial Geologic Units of the OnCore Properties | 4-2 |
5.1 | OnCore Drilling Summary | 5-2 |
5.2 | Weighted Average Particle Size Distribution, by Site | 5-6 |
5.3 | Proppant Performance Test Results | 5-7 |
6.1 | Frac Sand Resource Classification Criteria | 6-4 |
6.2 | Mining and Processing Recoveries | 6-6 |
6.3 | Frac Sand Reserves (as of December 31, 2024) | 6-7 |
7.1 | Annual Production Requirements and Expected Mine Life | 7-3 |
8.1 | OnCore Plant Commisioning Dates | 8-1 |
10.1 | Historical Sales Data | 10-5 |
10.2 | Frac Sand Sales Forecast | 10-6 |
11.1 | Historical Financials | 11-1 |
11.2 | Capital Expenditures Budget for 2025 | 11-2 |
12.1 | Financial Results | 12-3 |
12.2 | Annual Production and Cash Flow Forecast OnCore Plants | 12-4 |
12.3 | DCF-NPV Analysis | 12-5 |
12.4 | After-Tax NPV10 Sensitivity Analysis ($ millions) | 12-5 |
13.1 | Permit/Registration Summary | 13-2 |
TABLE OF CONTENTS - Continued
| | |
| Page |
List of Figures | |
1.1 | General Location Map | 1-2 |
1.2 | Permian Basin Horizontal Oil and Gas Well Permit Submissions | 1-7 |
1.3 | Oil Production from Shale and Tight Formations | 1-8 |
3.1 | Site Layout OnCore 1 and 2 Plants | 3-3 |
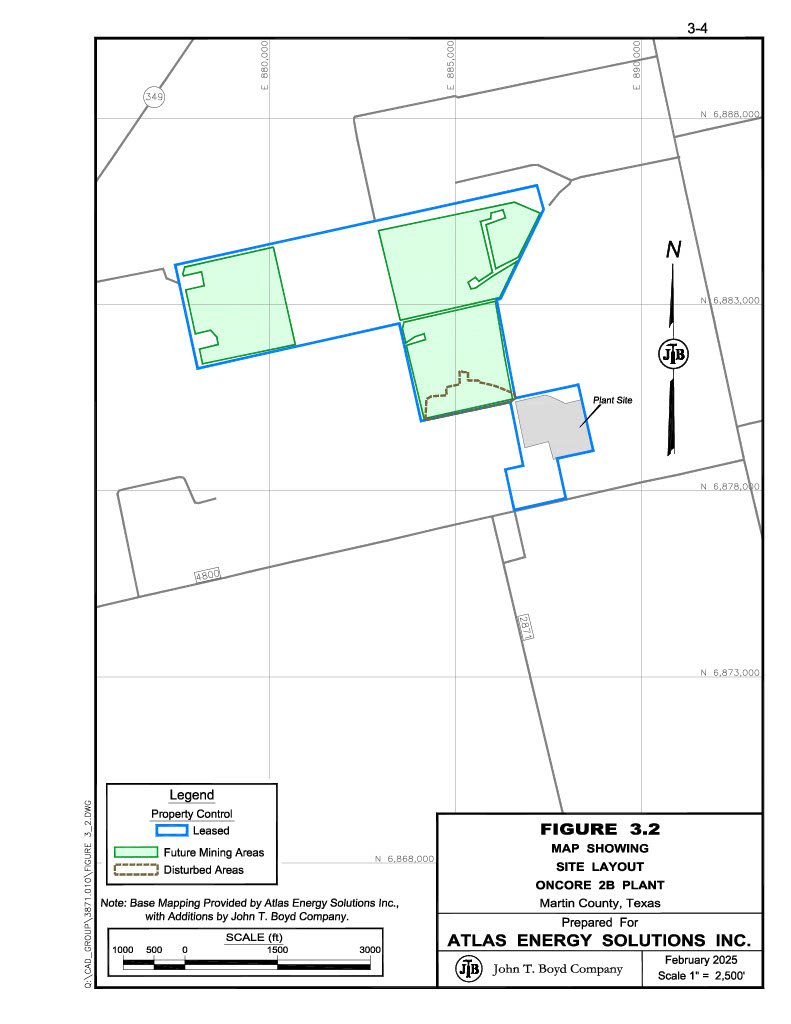
3.2 | Site Layout OnCore 2B Plant | 3-4 |
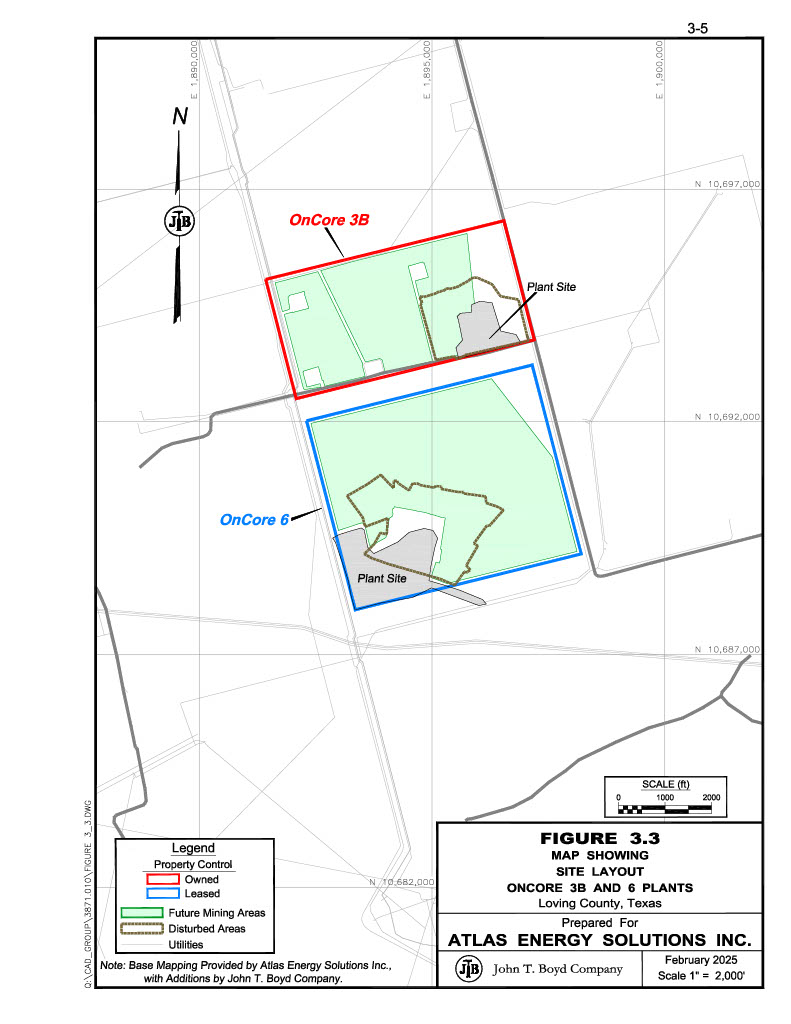
3.3 | Site Layout OnCore 3B and 6 Plants | 3-5 |
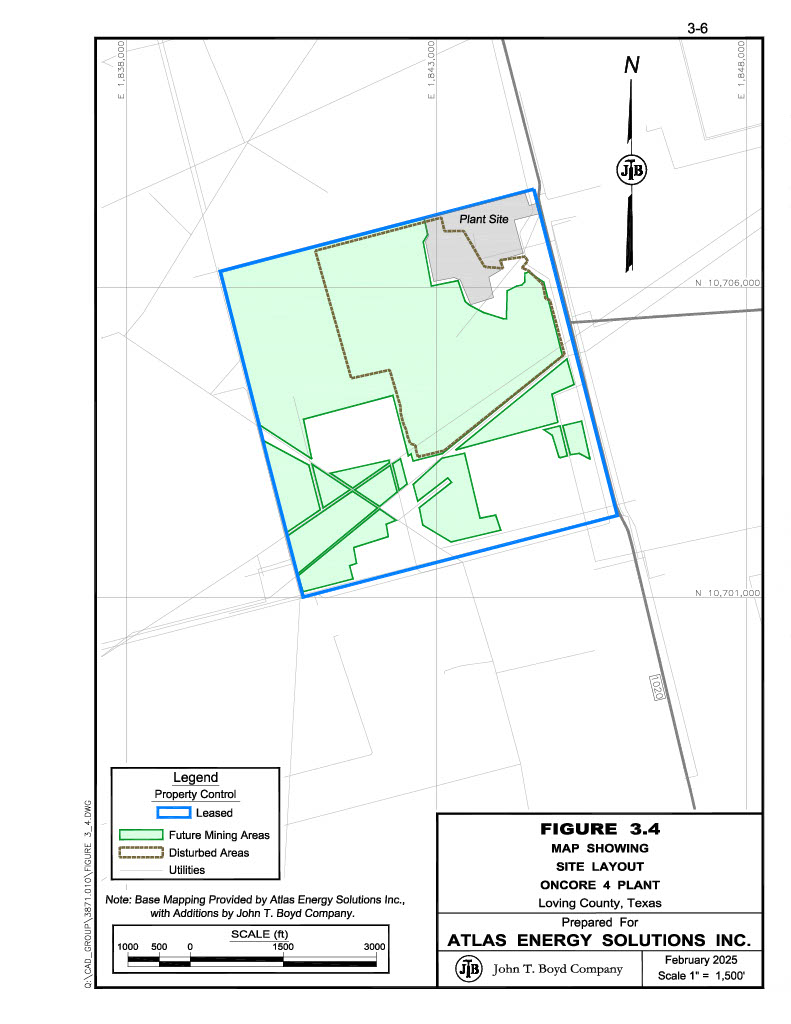
3.4 | Site Layout OnCore 4 Plant | 3-6 |
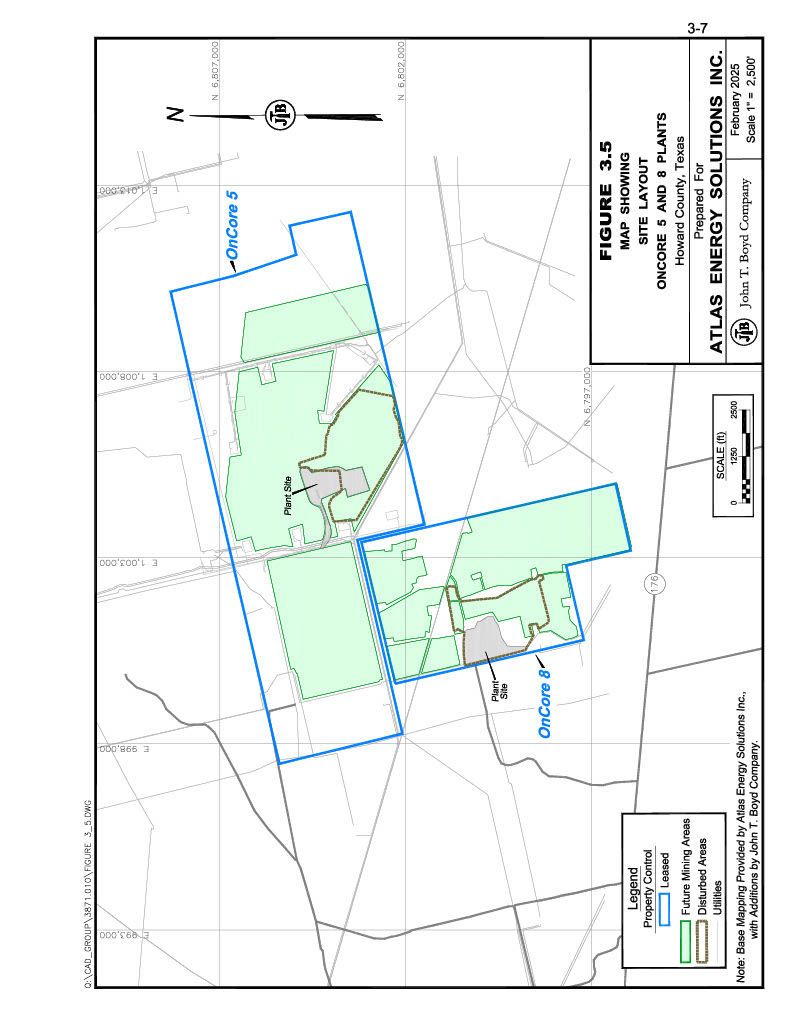
3.5 | Site Layout OnCore 5 and 8 Plants | 3-7 |
3.6 | Site Layout OnCore 7 Plant | 3-8 |
3.7 | Site Layout OnCore 9 Plant | 3-9 |
4.1 | Generalized Stratigraphic Chart, Surficial Deposits of the OnCore Properties | 4-2 |
4.2 | Frac Sand Thickness Isopachs OnCore 1 and 2 Plants | 4-6 |
4.3 | Frac Sand Thickness Isopachs OnCore 2B Plant | 4-7 |
4.4 | Frac Sand Thickness Isopachs OnCore 3B and 6 Plants | 4-8 |
4.5 | Frac Sand Thickness Isopachs OnCore 4 Plant | 4-9 |
4.6 | Frac Sand Thickness Isopachs OnCore 5 and 8 Plants | 4-10 |
4.7 | Frac Sand Thickness Isopachs OnCore 7 Plant | 4-11 |
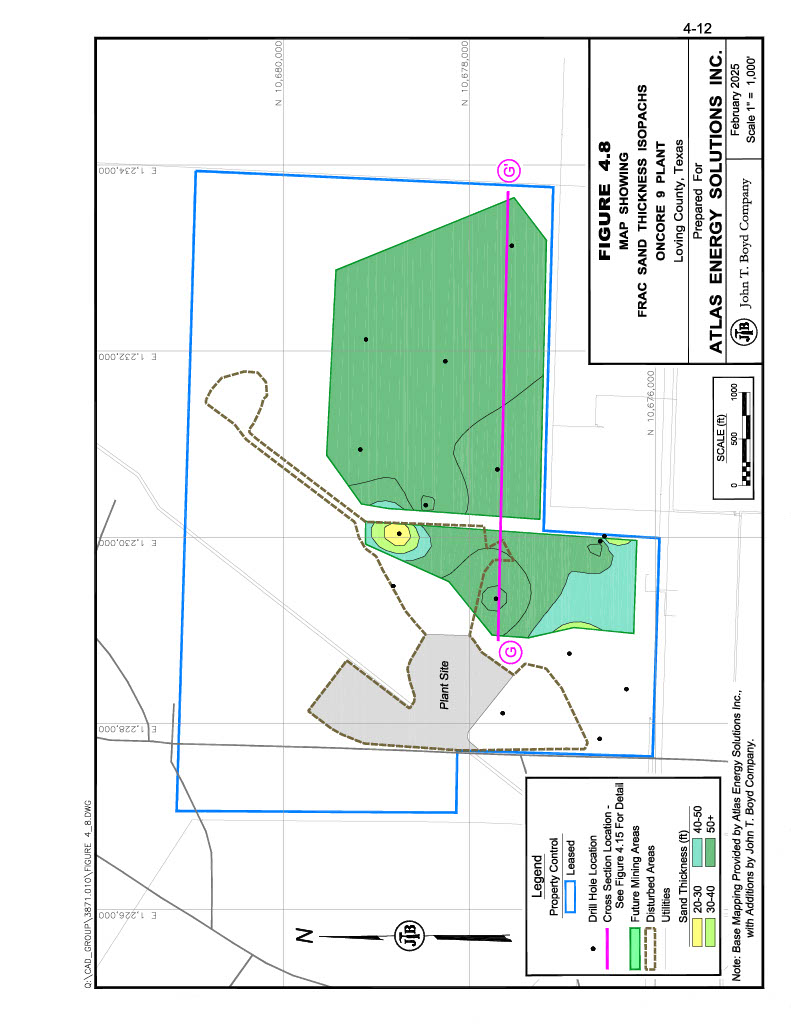
4.8 | Frac Sand Thickness Isopachs OnCore 9 Plant | 4-12 |
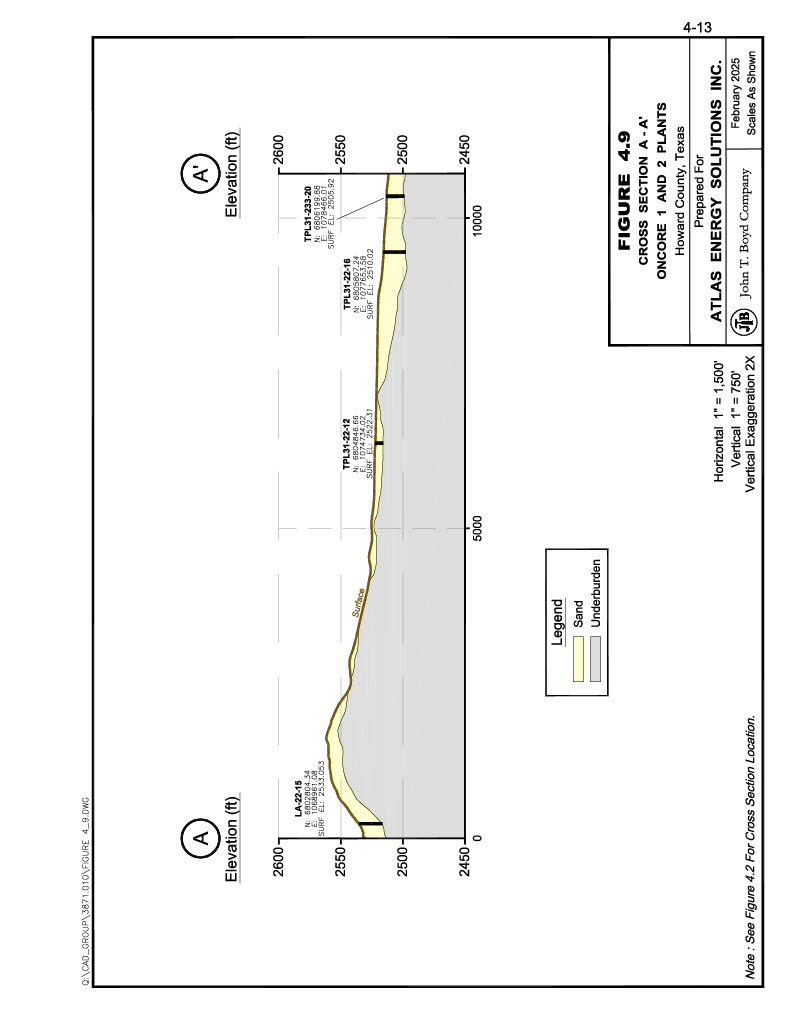
4.9 | Cross Section A-A’ OnCore 1 and 2 Plants | 4-13 |
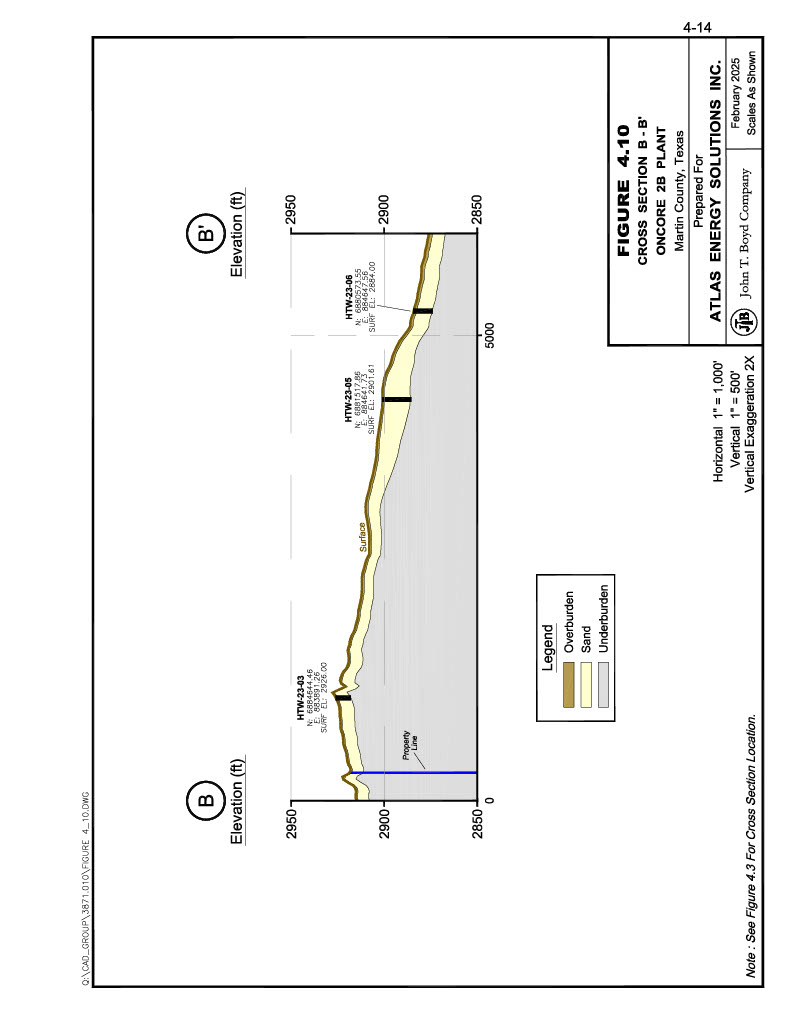
4.10 | Cross Section B-B’ OnCore 2B Plant | 4-14 |
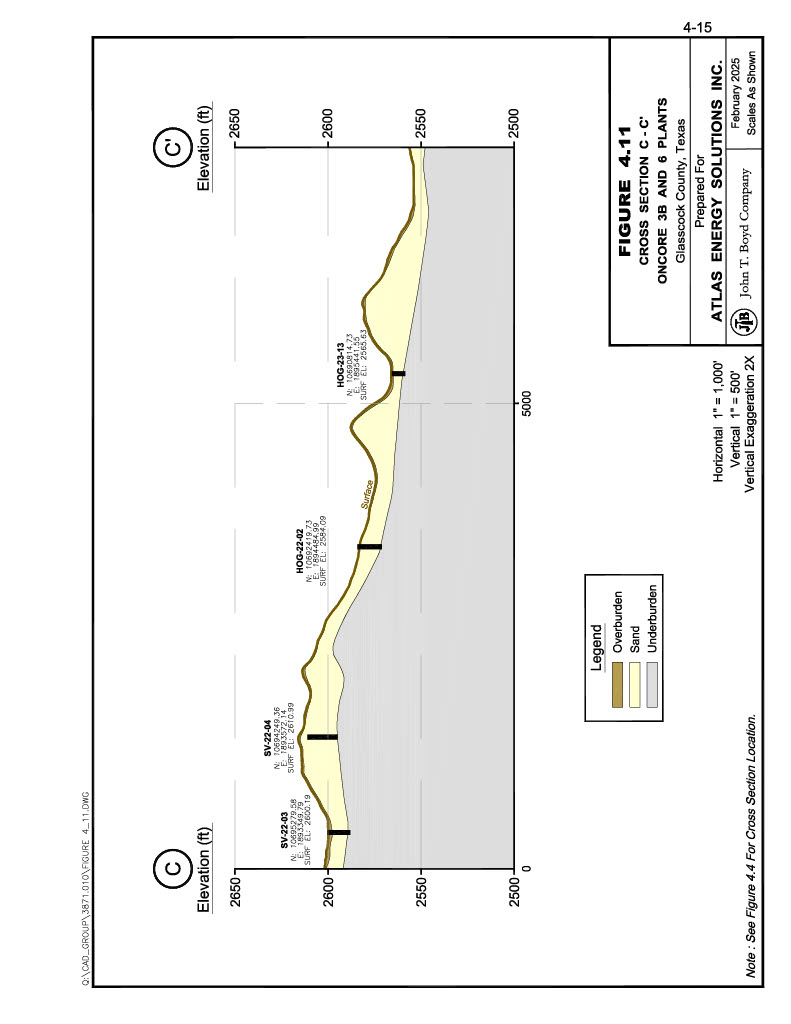
4.11 | Cross Section C-C’ OnCore 3B and 6 Plants | 4-15 |
4.12 | Cross Section D-D’ OnCore 4 Plant | 4-16 |
4.13 | Cross Section E-E’ OnCore 5 and 8 Plants | 4-17 |
4.14 | Cross Section F-F’ OnCore 7 Plant | 4-18 |
4.15 | Cross Section G-G’ OnCore 9 Plant | 4-19 |
6.1 | Relationship Between Frac Sand Resources and Frac Sand Reserves | 6-2 |
6.2 | Reserve Classification OnCore 1 and 2 Plants | 6-10 |
6.3 | Reserve Classification OnCore 2B Plant | 6-11 |
6.4 | Reserve Classification OnCore 3B and 6 Plants | 6-12 |
6.5 | Reserve Classification OnCore 4 Plant | 6-13 |
6.6 | Reserve Classification OnCore 5 and 8 Plants | 6-14 |
6.7 | Reserve Classification OnCore 7 Plant | 6-15 |
6.8 | Reserve Classification OnCore 9 Plant | 6-16 |
6.9 | Reconciliation with Previous Frac Sand Reserves Estimate | 6-9 |
7.1 | LOM Forecasted Mining Production | 7-3 |
8.1 | LOM Forecasted Processing Plant Production | 8-3 |
10.1 | WTI Crude Oil Futures Price | 10-1 |
10.2 | U.S. Horizontal Drilling Permits by Region | 10-2 |
10.3 | U.S. Oil Production from Shale and Tight Formations | 10-2 |
10.4 | U.S. Natural Gas Production from Shale and Tight Formations | 10-3 |
10.5 | U.S. Drilled but Uncompleted Wells | 10-3 |
10.6 | Permian Drilled but Uncompleted Wells | 10-4 |
10.7 | Permian In-Basin Mine Employee-Hours (Quarterly) | 10-4 |
| |
| 1 |
| |
GLOSSARY OF ABBREVIATIONS AND DEFINITIONS | |
| | |
000 | : | Thousand(s) |
$ | : | U.S. dollar(s) |
ACS | : | Average cost of goods sold |
AMSL | : | Above mean sea level |
API | : | American Petroleum Institute |
API/ISO | : | API RP 19C/ISO 13503-2, Measurement of Properties of Proppants Used in Hydraulic Fracturing and Gravel-packing Operations |
ASP | : | Average selling price |
Atlas | : | Atlas Energy Solutions Inc. and affiliated companies |
BOYD | : | John T. Boyd Company |
DCF | : | Discounted cash flow |
DDA | : | Depreciation, depletion, and amortization expenses |
EBIT | : | Earnings before interest and taxes |
EBIAT | : | Earnings before interest after taxes |
EBITDA | : | Earnings before interest, taxes, depreciation, and amortization |
E&P | : | Exploration and production |
Frac Sand | : | Frac sand is a naturally occurring, high silica content quartz sand, with grains that are generally well rounded and exhibit high compressive strength characteristics relative to other silica sand. It is utilized as a prop or “proppant” in unconventional shale frac well completions. |
Frac Sand Resource | : | A Frac Sand Resource is a concentration or occurrence of sand material of economic interest in or on the Earth’s crust in such form, grade or quality, and quantity that there are reasonable prospects for economic extraction. A Frac Sand Resource is a reasonable estimate of mineralization, taking into account relevant factors such as quality specifications, likely mining dimensions, location or continuity, that, with the assumed and justifiable technical and economic conditions, is likely to, in whole or in part, become economically extractable. It is not merely an inventory of all mineralization drilled or sampled. |
| |
| 2 |
| |
GLOSSARY OF ABBREVIATIONS AND DEFINITIONS - Continued | |
| | |
Frac Sand Reserve | : | A Frac Sand Reserve is an estimate of tonnage and grade or quality of Frac Sand Resource that, in the opinion of the qualified person, can be the basis of an economically viable project. More specifically, it is the economically mineable part of a Frac Sand Resource, which includes diluting materials and allowances for losses that may occur when the material is mined or extracted. |
Indicated Frac Sand Resource | : | An Indicated Frac Sand Resource is that part of a Frac Sand Resource for which quantity, grade or quality, densities, shape, and physical characteristics are estimated with sufficient confidence to allow the application of Modifying Factors in sufficient detail to support mine planning and evaluation of the economic viability of the deposit. Geological evidence is derived from adequately detailed and reliable exploration, sampling and testing, and is sufficient to assume geological and grade or quality continuity between points of observation. An Indicated Frac Sand Resource has a lower level of confidence than that applying to a Measured Frac Sand Resource and may only be converted to a Probable Frac Sand Reserve. |
Inferred Frac Sand Resource | : | That part of a Frac Sand Resource for which quantity and quality are estimated based on limited geological evidence and sampling. The level of geological uncertainty associated with an Inferred Frac Sand Resource is too high to apply relevant technical and economic factors likely to influence the prospects of economic extraction in a manner useful for evaluation of economic viability. Because an Inferred Frac Sand Resource has the lowest level of geological confidence of all Frac Sand Resources, which prevents the application of the modifying factors in a manner useful for evaluation of economic viability, an Inferred Frac Sand Resource may not be considered when assessing the economic viability of a mining project, and may not be converted to a Frac Sand Reserve. |
IRR | : | Internal rate-of-return |
ISO | : | International Organization for Standardization |
LOM | : | Life-of-mine |
Measured Frac Sand Resource | : | A Measured Frac Sand Resource is that part of a Frac Sand Resource for which quantity, grade or quality, densities, shape, and physical characteristics are estimated with confidence sufficient to allow the application of Modifying Factors to support detailed mine planning and final evaluation of the economic viability of the deposit. Geological evidence is derived from detailed and reliable exploration, sampling, and testing and is sufficient to confirm geological and grade or quality continuity between points of observation. A Measured Frac Sand |
| |
| 3 |
| |
GLOSSARY OF ABBREVIATIONS AND DEFINITIONS - Continued | |
| | |
| | Resource has a higher level of confidence than that applying to either an Indicated Frac Sand Resource or an Inferred Frac Sand Resource. It may be converted to a Proven Frac Sand Reserve or to a Probable Frac Sand Reserve. |
Mesh | : | A measurement of particle size often used in determining the size distribution of granular material. In the U.S., standard mesh (or sieve) size is defined as the number of openings in one square inch of a screen. For example, a 36-mesh screen will have 36 openings while a 150-mesh screen will have 150 openings. Since the size of the screen (one square inch) is constant, the higher the mesh number the smaller the screen opening and the smaller the particle that will pass through. The following table provides mesh dimensions which are commonly referenced in frac sand specifications: |
| | | | | | |
| | Opening Size |
Mesh | | inches | | mm | | microns |
| | | | | | |
20 | | 0.0331 | | 0.850 | | 850 |
30 | | 0.0232 | | 0.600 | | 600 |
35 | | 0.0197 | | 0.500 | | 500 |
40 | | 0.0165 | | 0.425 | | 425 |
50 | | 0.0117 | | 0.300 | | 300 |
70 | | 0.0083 | | 0.212 | | 212 |
100 | | 0.0059 | | 0.180 | | 180 |
140 | | 0.0041 | | 0.105 | | 105 |
200 | | 0.0029 | | 0.075 | | 75 |
| | |
Mineral Reserve | : | See “Frac Sand Reserve” |
Mineral Resource | : | See “Frac Sand Resource” |
Modifying Factors | : | The factors that a qualified person must apply to Indicated and Measured Frac Sand Resources and then evaluate to establish the economic viability of Frac Sand Reserves. A qualified person must apply and evaluate modifying factors to convert Measured and Indicated Frac Sand Resources to Proven and Probable Frac Sand Reserves. These factors include, but are not restricted to: mining; processing; metallurgical; infrastructure; economic; marketing; legal; environmental compliance; plans, negotiations, or agreements with local individuals or groups; and governmental factors. The number, type and specific characteristics of the modifying factors applied will necessarily be a function of and depend upon the mineral, mine, property, or project. |
MSHA | : | Mine Safety and Health Administration. A division of the U.S. Department of Labor. |
| |
| 4 |
| |
GLOSSARY OF ABBREVIATIONS AND DEFINITIONS - Continued | |
| | |
NTU | : | Nephelometric turbidity units |
NPV | : | Net present value |
OnCore | : | OnCore Plants and related faciltities |
Permian Basin | : | A large sedimentary shale basin in the southwestern part of the United States in mainly Texas and New Mexico. The basin produces approximately 4 million barrels per day of oil and holds some of the largest oil and gas reserves in the world. |
PropTester | : | PropTester, Inc. |
Probable Frac Sand Reserve | : | A Probable Frac Sand Reserve is the economically mineable part of an Indicated and, in some circumstances, a Measured Frac Sand Resource. The confidence in the Modifying Factors applying to a Probable Frac Sand Reserve is lower than that applying to a Proven Frac Sand Reserve. |
Proppant Sand | : | See “Frac Sand” |
Proven Frac Sand Reserve | : | A Proven Frac Sand Reserve is the economically mineable part of a Measured Frac Sand Resource. A Proven Frac Sand Reserve implies a high degree of confidence in the Modifying Factors. |
PSI | : | Pounds per square inch |
QP | : | Qualified Person |
Qualified Person | : | An individual who is: 1.A mineral industry professional with at least five years of relevant experience in the type of mineralization and type of deposit under consideration and in the specific type of activity that person is undertaking on behalf of the registrant; and 2.An eligible member or licensee in good standing of a recognized professional organization at the time the technical report is prepared. For an organization to be a recognized professional organization, it must: i.An organization recognized within the mining industry as a reputable professional association; or ii.A board authorized by U.S. federal, state, or foreign statute to regulate professionals in the mining, geoscience, or related field; b.Admit eligible members primarily based on their academic qualifications and experience; c.Establish and require compliance with professional |
| |
| 5 |
| |
GLOSSARY OF ABBREVIATIONS AND DEFINITIONS - Continued | |
| | |
| | standards of competence and ethics; d.Require or encourage continuing professional development; e.Have and apply disciplinary powers, including the power to suspend or expel a member regardless of where the member practices or resides; and f.Provide a public list of members in good standing. |
ROM | : | Run-of-mine. The as-mined including in-seam clay partings mined with the sand, and out-of-seam dilution. |
SEC | : | U.S. Securities and Exchange Commission |
S-K 1300 | : | Subpart 1300 and Item 601(b)(96) of the U.S. Securities and Exchange Commission’s Regulation S-K |
Surficial | : | Relating to the earth’s surface or the geology that is on the surface. |
TCEQ | : | Texas Commission on Environmental Quality |
Ton | : | Short ton. A unit of weight equal to 2,000 pounds-mass. |
tph | : | Tons per hour |
WIP | : | Work-in-progress |
1.0 EXECUTIVE SUMMARY
Atlas’s OnCore Plants comprise eight small, built-for-purpose mobile processing plants and one larger modular processing plant (currently under construction) which produce wet (i.e., undried or damp) “100 mesh” frac sand—generally in the 40/140 to 40/200 mesh range—from leased or customer-owned properties. At each OnCore site, Atlas is responsible for mining and processing the raw sand, selling the finished frac sand products, and reclaiming the disturbed land. The mobility of the OnCore Plants provides a great deal of flexibility not afforded to large-scale fixed-plant mining operations.
Atlas retained BOYD to independently prepare estimates of frac sand resources and frac sand reserves for the OnCore Plants. The purpose of this TRS is threefold: (1) to summarize technical and scientific information for the subject mining properties, (2) to provide the conclusions of our review of the information for the properties, and (3) to provide statements of frac sand resources and frac sand reserves for the OnCore Plants in accordance with the disclosure requirements set forth in S-K 1300.
Information used in our assessment was obtained from: (1) data, reports, and other information provided by Atlas, (2) discussions with Atlas personnel, (3) records on file with regulatory agencies, (4) data, reports, and other information from public sources, and (5) nonconfidential information in BOYD’s possession.
Unless otherwise noted, the effective date of the information provided herein, including estimates of frac sand resources and frac sand reserves, is December 31, 2024.
1.2.Property Description and Location
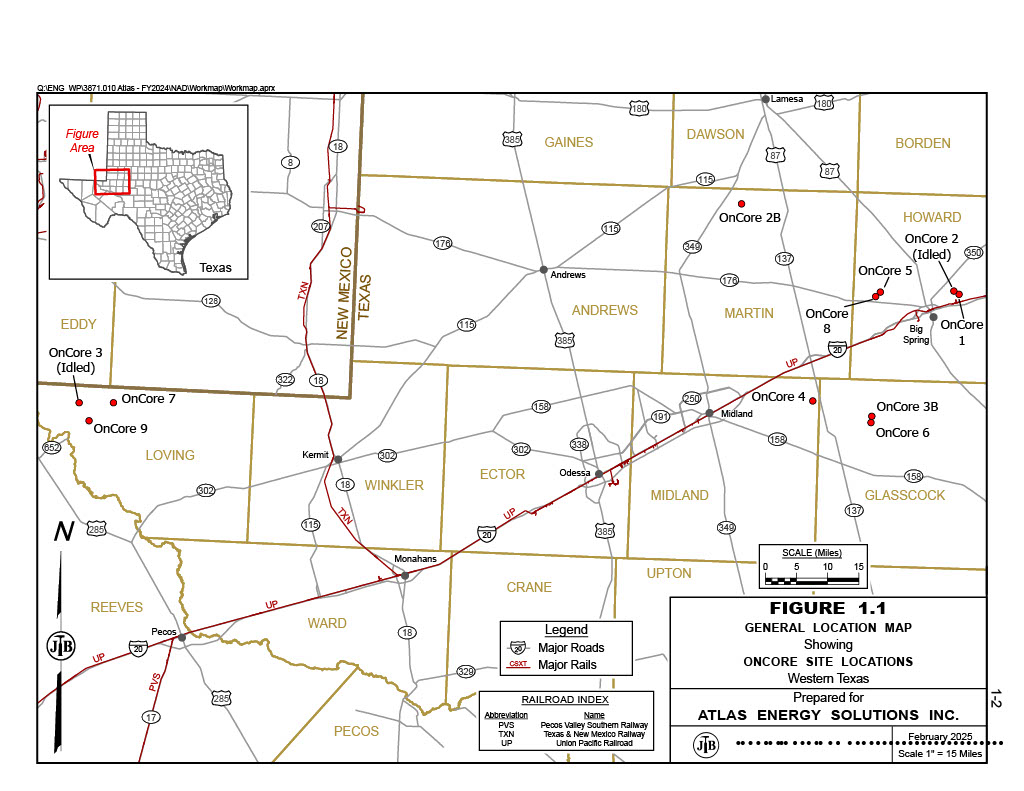
The OnCore Plants are located in West Texas. Most are clustered around the City of Big Spring, Texas, about 40 miles east of the Midland-Odessa metropolitan area. The OnCore 7 and 9 sites are located in the opposite direction, approximately 90 miles west of Midland-Odessa. The general locations of the OnCore Plants are provided in Figure 1.1, following this page.<Figure 1.1>
The OnCore sites comprise approximately 6,579 acres of surface and sand mining rights—including 1,172.4 acres owned in fee and 5,406.6 leased acres. Table 1.1, below, provides a brief overview of the property control status of each OnCore site.
| | | | |
Table 1.1 Property Control |
Plant | | Control | | Acreage |
OnCore 1 | | Owned | | 852.8 |
| | Leased | | 132.2 |
OnCore 2 | | Leased | | 391.6 |
OnCore 2B | | Leased | | 877.0 |
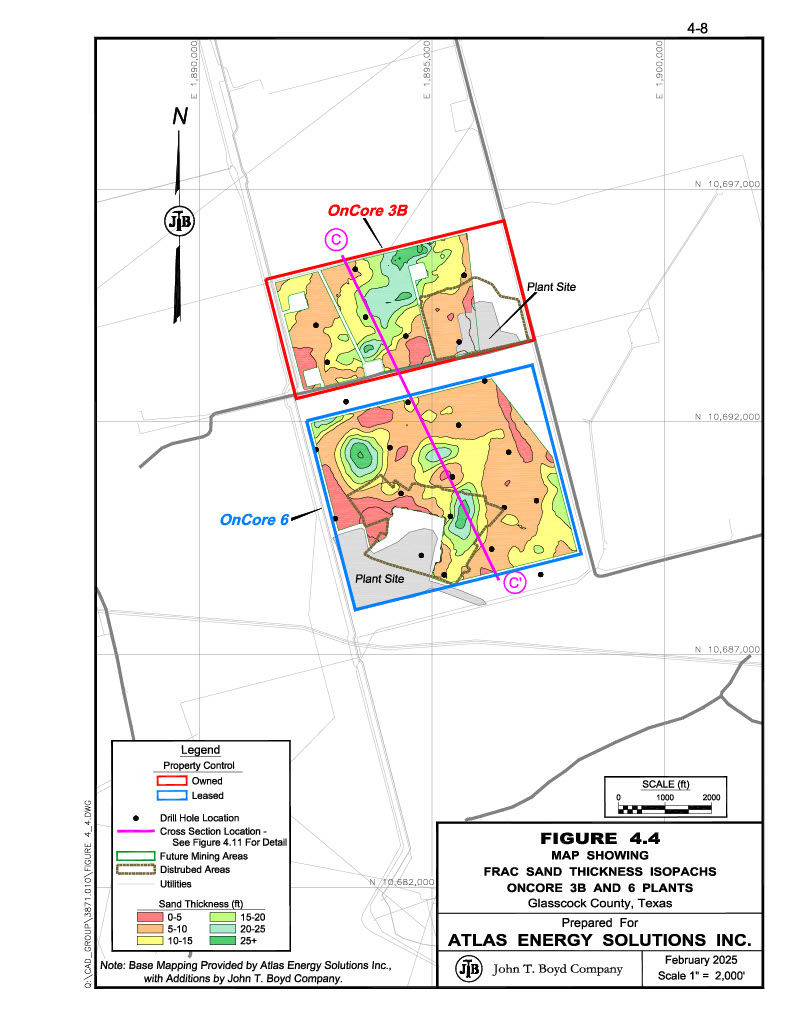
OnCore 3B | | Owned | | 319.6 |
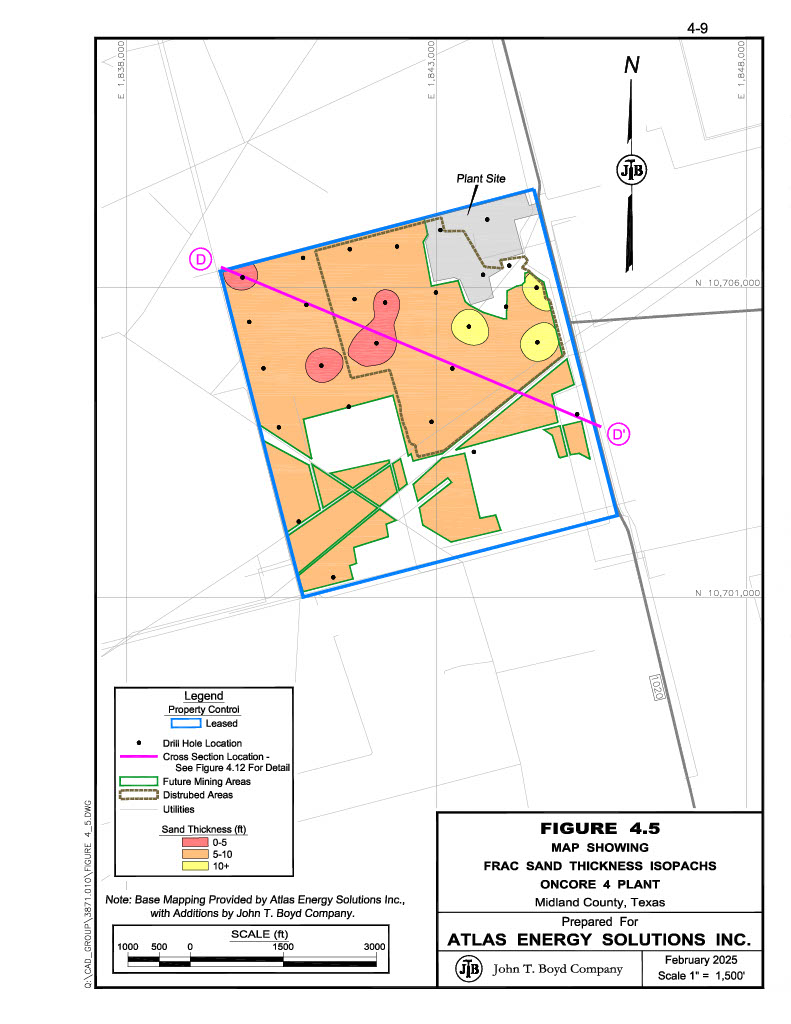
OnCore 4 | | Leased | | 640.0 |
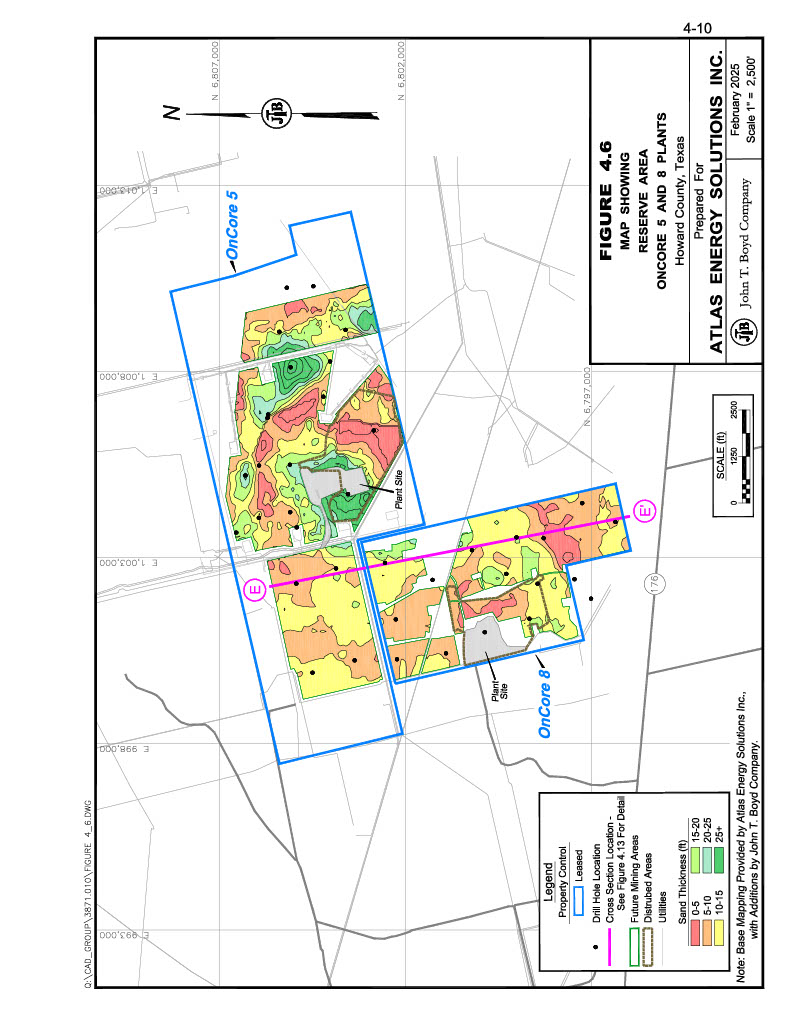
OnCore 5 | | Leased | | 1,378.8 |
OnCore 6 | | Leased | | 481.0 |
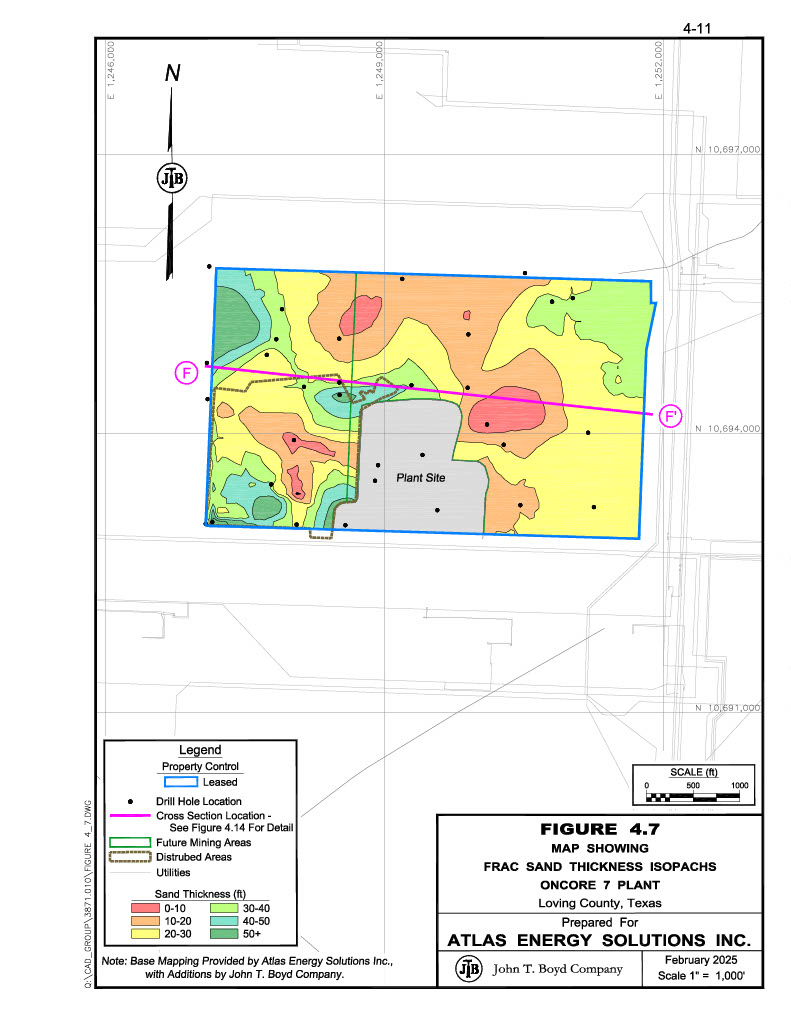
OnCore 7 | | Leased | | 297.0 |
OnCore 8 | | Leased | | 552.8 |
OnCore 9 | | Leased | | 656.2 |
Total | | | | 6,579.0 |
The OnCore Plants are all located within an active sand dune belt, in an area of West Texas where the High Plains and Trans-Pecos desert regions converge. The region’s surface is characterized by windblown Quaternary-aged sand formations, including sand dunes, undivided sand and silt deposits, and sheet sand deposits.
Most of the OnCore sites are covered by Quaternary sheet and dune sands generally consisting of fine- to medium-grained quartz sand grains mixed with varying degrees of silts, calcareous sands, and caliche nodules. Surficial sand deposition in the study areas may range in thickness from less than 5 ft to over 40 ft. Overburden (i.e., overlying waste) material is generally minimal and easily removed during mining and processing operations. Interbedded alluvial deposits consisting of pebble- to cobble-sized limestone and chert nodules, or caliche are not uncommon, but are easily segregated during mining.
The sand mined at each of the OnCore operations is processed on-site to produce frac sand. Frac sand is a naturally occurring, high silica content quartz sand with grains that are generally well-rounded. The main difference between frac sand and other sands is that frac sand grains are relatively pure in composition, consisting almost entirely of quartz; other sands have numerous impurities that may be cemented to the quartz grains. The pure quartz composition of frac sand grains, along with their homogenous size and well‑rounded and spherical shape, gives these sands the characteristics (e.g., crush strength, low acid solubility, low turbidity) that are needed by oil and gas producers for use in developing wells.
In developing the OnCore sites, Atlas has completed numerous geologic exploration campaigns. A total of 247 drill holes have been completed across the subject OnCore sites. The results of these exploration programs comprise geologic logs and subsurface sand samples, grain size analyses of the samples, and proppant sand testing of composited samples. Exploration summaries were provided to BOYD for our review, along with the collected and analyzed exploration data, which together comprise the primary geologic data used in the evaluation of the frac sand resources and frac sand reserves reported herein.
BOYD’s review indicates that the exploration data: (1) were carefully and professionally collected, prepared, and documented, (2) conform with general industry standards, and (3) are appropriate for use in evaluating and estimating frac sand resources and reserves.
This report provides estimates of frac sand reserves for Atlas’s OnCore Plants in accordance with the requirements set forth in S-K 1300. These estimates were independently prepared by BOYD for the purpose of this report. The reserve estimates are the result of a thorough geologic investigation of the properties, appropriate modeling of the deposits, development of life‑of‑mine (LOM) plans, and consideration of the relevant processing, economic, marketing, legal, environmental, socio-economic, and regulatory factors.
It is BOYD’s independent opinion that the estimated frac sand reserves for the OnCore Plants as of December 31, 2024, total approximately 59.7 million saleable product (i.e., 40/140 to 40/200 mesh frac sand) tons, which are presently controlled by Atlas.
Table 1.2, below, presents the estimated frac sand reserves by classification and mesh size, for the OnCore Plants.
| | | | | | | | | | |
Table 1.2: Frac Sand Reserves (as of December 31, 2024) |
|
Plant | | Mesh Size | | Control | | Product Tons (000) by Classification |
| | | Proven | | Probable | | Total |
| | | | | | | | | | |
OnCore 1 | | 40/140 | | Owned | | - | | 5,004 | | 5,004 |
| | | | Leased | | 2,028 | | - | | 2,028 |
| | | | Subtotal | | 2,028 | | 5,004 | | 7,032 |
OnCore 2 | | 40/140 | | Leased | | 375 | | - | | 375 |
OnCore 2B | | 40/140 | | Leased | | - | | 4,787 | | 4,787 |
OnCore 3B | | 40/140 | | Owned | | - | | 2,891 | | 2,891 |
OnCore 4 | | 40/140 | | Leased | | 1,681 | | 668 | | 2,349 |
OnCore 5 | | 40/140 | | Leased | | 3,442 | | 7,282 | | 10,724 |
OnCore 6 | | 40/140 | | Leased | | 4,322 | | - | | 4,322 |
OnCore 7 | | 40/140 | | Leased | | 3,120 | | 4,692 | | 7,812 |
OnCore 8 | | 40/140 | | Leased | | 4,660 | | - | | 4,660 |
OnCore 9 | | 40/140 | | Leased | | 13,679 | | 1,020 | | 14,699 |
Total | | | | | | 33,307 | | 26,344 | | 59,651 |
Atlas has a well-established history of mining, processing, and selling frac sand products from their regional operations. BOYD has concluded that sufficient studies have been undertaken to enable the frac sand resources to be converted to frac sand reserves based on established operating methods and forecasted costs and revenues. The forecasted sales prices used in the estimation of frac sand reserves for the OnCore Plants varies by location and year, ranging from $23.18 to $31.26 and averaging $24.83 per ton of finished frac sand over the expected life of the reserves (refer to Section 10.5 and Table 12.1 for further details).
There are no reportable additional frac sand resources, excluding those converted to reserves, for the OnCore Plants. Quantities of frac sand controlled by Atlas within the defined boundaries of the OnCore properties, which are not reported as frac sand reserves, are not considered to be technically, economically, and/or legally extractable at the time of determination; as such, they are not reportable as frac sand resources in addition to reserves.
Contractors are employed to excavate sand and overburden (i.e., overlying waste material) at each of the OnCore Plants. The target sand deposits are excavated using conventional truck and excavator surface mining techniques. Generally, the negligibly thin layer of overburden is mined with the underlying sand. The sand is unconsolidated and does not typically require drilling or blasting. Excavators and/or front-end loaders are used to load the excavated sand into articulated haul trucks. The haul trucks deliver raw sand material to run-of-mine (ROM) stockpiles located near the processing facilities.
The OnCore Plants comprise eight smaller mobile wet processing plants and one larger modular wet processing plant. The OnCore operations predominantly produce wet “100 mesh” (i.e., 40/140 to 40/200 mesh) frac sand—that is, the sand is not dried and particles larger than 40 mesh and smaller than 140-to-200 mesh are not considered finished product and are discarded as waste.
The small, built-for-purpose mobile OnCore Plants allow Atlas to move sand mining and processing operations from site to site as deposits are depleted. Indeed, Atlas moved two plants in 2024—one from the nearly exhausted OnCore 2 site to the previously unmined OnCore 2B site, and one from the recently exhausted OnCore 3 site to the previously unmined OnCore 3B site. One newly-constructed mobile plant was deployed in 2024 to the previously unmined OnCore 9 site.
The eight mobile plants were constructed by Superior Industries, Inc. (Superior). While the plants share nearly identical designs, the latter plants incorporate changes made to the early models to improve production. Each of the mobile processing plants has a nominal (or “nameplate”) capacity of 130 feed tons per hour (tph), which equates to approximately 700,000 to 900,000 tons of finished frac sand per year, depending on the expected processing yields of the sand deposits.
Atlas’s modular OnCore 8 processing plant was commissioned in May 2024. Designed by Superior, the OnCore 8 modular processing plant’s design consists of two 250-tph circuits providing a nameplate capacity of 500 tph of feed sand or approximately 3 million tons of finished frac sand per year. The parallel circuit arrangement offers a degree of flexibility as one plant circuit can be idled for maintenance, while the other is operating.
Each of the OnCore Plants’ processing operations comprise two major components which are typical in the production of wet frac sand. These components include:
•Wet Plant – ROM material from the pit is delivered to the wet plant where the coarse material (e.g., gravel) and fine material (e.g., fine sand and silt) is removed from the sand.
•Storage and Loadout – Finished damp sand products are stored in stockpiles resting on a water decant system, where the sand is allowed to dry somewhat. The frac sand is then loaded into feed hoppers, conveyed to a discharge hopper, and loaded into trucks resting on weighing scales.
1.6.3.Other Infrastructure
All of the basic infrastructure required for the ongoing operations is in place or under construction at each of the OnCore Plants. The mining and processing operations are supported by the various utilities and transportation networks needed to allow the production and transportation of finished frac sands.
BOYD is unaware of any reported interruptions, outages, shortages, or failures related to infrastructure requirements which have materially affected operations at any of the OnCore sites. Given the operation is well-established, we opine that there is low risk of such events materially affecting the estimates of frac sand reserves presented herein.
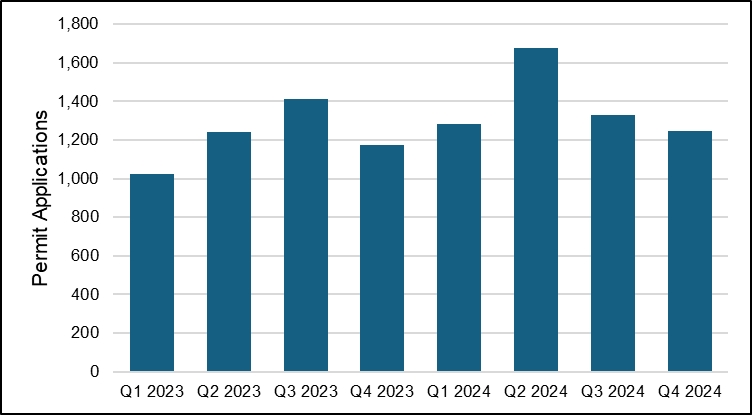
Permit submissions for horizontal oil and gas wells in the Permian Basin indicate a continuation of strong drilling ahead. Utilizing data from the Railroad Commission of
Texas (RRC), the total number of permits filed ranges between 1,200 and 1,700 per quarter in 2024, as shown in Figure 1.2, below.
Source: Enverus (provided by Atlas)
Figure 1.2: Permian Basin Horizontal Oil and Gas Well Permit Submissions
Domestic oil production continues to increase with the Permian leading the way, averaging close to 6 million barrels per day (Mbbl/d) since late 2023, as shown below in Figure 1.3.
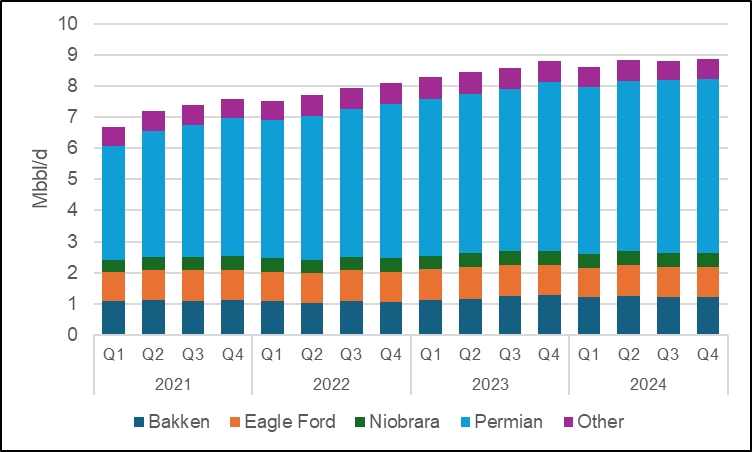
Source: EIA (U.S. Energy Information Administration)
Figure 1.3: Oil Production from Shale and Tight Formations
Current frac sand production in the Permian Basin is estimated at 65 million to 70 million tons per year with fairly balanced demand and stable pricing. BOYD anticipates stable frac sand pricing substantially above those used to estimate frac sand reserves for the OnCore Plants. Additionally, we anticipate continued upward sand consumption in the basin due to economic and geopolitical influences on energy demand.
1.7.2.Capital and Operating Cost Estimates
The OnCore Plants’ recent financial performance is summarized as follows:
•The OnCore Plants sold approximately 6.0 million tons of finished frac sand in 2024—a year-over-year increase from 2023 of 28.7%. This was primarily due to the commissioning of two additional mobile plants.
•Atlas’s average selling price (ASP) for frac sand sold from the OnCore Plants was $22.84 per ton in 2024, increasing 8.5% from 2023. The five-year historical ASP was $20.49 per ton.
•Average cost of goods sold (ACS) was $12.87 per ton sold in 2024, increasing 27.5% year-over-year.
•Gross margin (i.e., gross profit as a percentage of gross revenue) has remained positive over the past five years and was 43.6% in 2024.
•Capital expenditures totaled approximately $120.5 million (or $8.60 per ton sold) over the last five years and include all costs related to property acquisition, site preparation, and equipment purchases.
Forward-looking production and unit cost estimates are based on actual past performance and are subject to Atlas’s customary internal budget review and approvals process. In BOYD’s opinion, operating volumes are well-defined and understood, as are mining and processing productivities.
The OnCore Plants and related facilities are fully developed or nearly constructed and should not require any near-term major capital investment beyond 2025’s budgeted $4.7 million to maintain full commercial production. Historically, the timing and amount of capital expenditures have been largely discretionary and within Atlas’s control. BOYD projected sustaining capital expenditures is estimated to average $1.00 per ton sold, which includes: (1) maintenance of production equipment as well as other items needed for the ongoing operations, and (2) site reclamation costs. This unit cost is based on our judgment and experience with similar operations.
Operating cost estimates were developed based on recent actual costs and considering site specific operational activity levels and cost drivers. OnCore’s operating costs are expected to remain relatively consistent (on an uninflated basis) with 2024 results. As such, the projected total cash cost of goods sold averages $14.98 per ton sold over the life of the mine. BOYD considers the future operating cost estimates to be reasonable and appropriate.
A consolidated economic analysis of the OnCore Plants was prepared by BOYD for the purpose of confirming the commercial viability of the reported frac sand reserves. Our financial model forecasts future free cash flow from frac sand production and sales over the life cycle of the operation using annual forecasts of production, sales revenues, and operating and capital costs.
Table 1.3, on the following page, provides a summary of the estimated financial results (on an aggregate basis) for the remaining life of the OnCore Plants.
| | | | |
Table 1.3: Financial Results |
|
| | Units | | Remaining Life of Reserves Total |
|
Expected Remaining Life | | years | | 21 |
| | | | |
Production: | | | | |
ROM Production | | 000 tons | | 83,742 |
Product Sales | | 000 tons | | 59,651 |
Total Revenues | | $ milllions | | 1,481.0 |
Average Selling Price | | $/t sold | | 24.83 |
Total Cost of Goods Sold | | $ milllions | | 893.8 |
Average Cost of Goods Sold | | $/t sold | | 14.98 |
Capital Expenditures | | $ milllions | | 57.4 |
Average Capital Expenditures | | $/t sold | | 0.96 |
Pre-Tax: | | | | |
Cash Flow | | $ milllions | | 529.8 |
NPV10 | | $ milllions | | 342.5 |
After-tax: | | | | |
Cash Flow | | $ milllions | | 436.8 |
NPV10 | | $ milllions | | 280.4 |
Table 1.4 summarizes the results of the pre-tax and after-tax discounted cash flows (DCF) and net present value (NPV) analyses for the OnCore Plants.
| | | | | |
Table 1.4: DCF-NPV Analysis |
| NPV ($ millions) |
| 8% | | 10% | | 12% |
Pre-Tax | 368.8 | | 342.5 | | 319.8 |
After-Tax | 302.2 | | 280.4 | | 261.6 |
The NPV estimate was made for the purpose of confirming the economic viability of the reported proppant sand reserves and not for purposes of valuing Atlas, any of the OnCore operations, or their assets. Internal rate-of-return (IRR) and project payback were not calculated, as there was no initial investment considered in the financial analysis presented herein.
It is BOYD’s opinion that the financial model provides a reasonable and accurate reflection of the OnCore Plants’ expected economic performance based on the assumptions and information available at the time of our review.
1.8.Permitting and Compliance
Several permits are required by federal and state law for mining, processing, and related activities at each of the OnCore operations. BOYD reviewed the permits necessary to support continued operations at each of the OnCore sites. Such required permits appear to be valid and in good standing. The approved permits and certifications are adequate for the continued operation of the mine and processing facilities. New permits, permit revisions, and/or renewals may be necessary from time to time to facilitate future operations. Given sufficient time and planning, Atlas should be able to secure new permits, as required, to maintain its planned operations within the context of current regulations.
Mine safety is regulated by the U.S. Department of Labor’s Mine Safety and Health Administration (MSHA). MSHA inspects the facilities a minimum of twice yearly.
Atlas’s safety record compares favorably with its regional peers.
BOYD is not aware of any regulatory violation or compliance issue which would materially impact the reported frac sand reserves.
It is BOYD’s overall conclusion that the estimates of frac sand reserves, as reported herein: (1) are reasonably supported by sufficient and reliable exploration data, and (2) are reasonably and appropriately supported by technical evaluations, which consider all relevant modifying factors. We are not aware of any other relevant data or information material to the OnCore Plants that would render this report misleading. Our conclusions represent only informed professional judgment.
Given the operating history and status of evolution, residual uncertainty (future risk) for this operation is considered minor under the current and foreseeable operating environment. It is BOYD’s opinion that extraction of the frac sand reserves reported herein is technically, legally, and economically achievable after the consideration of potentially material modifying factors. The ability of Atlas, or any mine operator, to recover all the reported frac sand reserves is dependent on numerous factors that are beyond the control of, and cannot be anticipated by, BOYD. These factors include mining and geologic conditions, the capabilities of management and employees, the securing of required approvals and permits in a timely manner, future frac sand prices, etc. Unforeseen changes in regulations could also impact performance. None of the opinions presented herein are intended to represent that BOYD intends or is qualified to render opinions that are legal or accounting in nature.
2.0 INTRODUCTION
Atlas provides high quality proppant (frac) sand products, as well as proppant supply chain logistics services to the Permian Basin oil and gas industry. The company was founded in 2017 by long-time exploration and production (E&P) operators and is headquartered in Austin, Texas. Mining and processing operations commenced on their Kermit, Texas property in June 2018, and at their Monahans, Texas property in July 2018. In 2023, Atlas added a second mining and processing facility at their Kermit property. In 2024, Atlas acquired the Kermit Mines and OnCore mining facilities of Hi-Crush, Inc.
The company’s common stock is listed on the New York Stock Exchange under the symbol AESI. Additional information regarding Atlas can be found on their website at www.atlas.energy.
2.2.Purpose and Terms of Reference
Atlas retained BOYD to independently prepare and present estimates of frac sand resources and frac sand reserves for the OnCore Plants in accordance with the disclosure requirements set forth in S-K 1300. As such, the purpose of this TRS is threefold: (1) to summarize technical and scientific information for the subject mining properties, (2) to provide the conclusions of our review of the information for the properties, and (3) to provide statements of frac sand resources and frac sand reserves for the OnCore Plants.
BOYD’s opinions and conclusions are based on our detailed review of the supporting geologic, technical, and economic information provided by Atlas, which were used in formulating the estimates of frac sand resources and frac sand reserves disclosed in this report. We independently estimated the frac sand resources and frac sand reserves from first principles using exploration information provided by Atlas or by third-party experts engaged by Atlas. We employed standard engineering and geoscience methods, or a combination of methods, that we considered to be appropriate and necessary to establish the conclusions set forth herein. As in all aspects of mining property evaluation, there are uncertainties inherent in the interpretation of engineering and geoscience data; therefore, our conclusions necessarily represent only informed professional judgment.
The ability of Atlas, or any mine operator, to recover all the estimated frac sand reserves presented in this report is dependent on numerous factors that are beyond the control of, and cannot be anticipated by, BOYD. These factors include mining and geologic
conditions, the capabilities of management and employees, the securing of required approvals and permits in a timely manner, future sand prices, etc. Unforeseen changes in regulations could also impact performance. Opinions presented in this report apply to the site conditions and features as they existed at the time of BOYD’s investigations and those reasonably foreseeable.
This report is intended for use by Atlas, subject to the terms and conditions of its professional services agreement with BOYD. We also consent to Atlas filing this TRS with the SEC pursuant to S-K 1300. Except for the purposes legislated under U.S. securities law, any other uses of or reliance on this report by any third party is at that party’s sole risk.
2.3.Expert Qualifications
BOYD is an independent consulting firm specializing in mining-related engineering and financial consulting services. Since 1943, BOYD has completed over 4,000 projects in the United States and more than 90 other countries. Our full-time staff comprises experts in: civil, environmental, geotechnical, and mining engineering; geology; mineral economics; and market analysis. Our extensive experience in frac sand resource and reserve estimation and our knowledge of the subject properties, provides BOYD an informed basis to opine on the frac sand resources and frac sand reserves available at the OnCore Plants. An overview of BOYD can be found on our website at www.jtboyd.com.
The individuals primarily responsible for the preparation of this report and the estimates of frac sand reserves presented herein are by virtue of their education, experience, and professional association considered qualified persons (QPs) as defined in S-K 1300.
Neither BOYD nor its staff employed in the preparation of this report have any beneficial interest in Atlas, and are not insiders, associates, or affiliates of Atlas. The results of our assignment were not dependent upon any prior agreements concerning the conclusions to be reached, nor were there any undisclosed understandings concerning any future business dealings between Atlas and BOYD. This report was prepared in return for fees based on agreed-upon commercial rates, and the payment for our services was not contingent upon our opinions regarding the project or approval of our work by Atlas and its representatives.
2.4.Principal Sources of Information
The information, estimates, opinions, and conclusions presented herein are informed by: (1) data, reports, and other information provided by Atlas, (2) discussions with Atlas personnel, (3) records on file with regulatory agencies, (4) data, reports, and other information from public sources, and (5) nonconfidential information in BOYD’s possession.
The following information was provided by Atlas:
•Exploration records (e.g., drill hole location maps, drilling logs, and lab testing summaries)
•Mapping data, including:
-Property control boundaries
-Infrastructure locations
-Easement and right-of-way boundaries
-Topograhpic site surveys
•Overview of processing operations and detailed flow diagrams
•Preliminary business plans
•Historical information, including:
-Production reports and reconciliation statements
-Product sales and pricing
•Files related to mining and operating permits
Work files prepared for, and information contained, in the following BOYD reports was utilized to prepare the estimates of frac sand resources and frac sand reserves disclosed herein:
Technical Report Summary: Frac Sand Resources and Reserves, OnCore Plants, West Texas; Prepared for Hi-Crush Operating, LLC (f/k/a Hi-Crush Inc.); April 2024 (BOYD Report No. 3554.018).
Any other information from sources external to BOYD and/or Atlas is referenced accordingly.
The data and workpapers used in the preparation of this report are on file in our offices.
2.4.1.Personal Inspections
Due to time constraints, BOYD did not conduct personal inspections of the OnCore properties or facilities for this assignment. However, BOYD professionals—including the QPs and co-authors of this report—reviewed the OnCore operations with senior Atlas operations and planning personnel via teleconference. During our meetings, we reviewed recent high-resolution aerial photography of the OnCore sites and discussed site geology, mining conditions and operations, and current and proposed processing operations. Additionally, the co-authors have visited many of the neighboring frac sand mining operations in the recent past.
2.4.2.Reliance on Information Provided by the Registrant
In the preparation of this report, BOYD has relied, exclusively and without independent verification, upon information furnished by Atlas with respect to:
•Property title and status
•Encumbrances, easements, and rights-of-way
•Permits, bonds, and reclamation liability
•Sustainability initiatives
•Surface tailings management
•Mine closure requirements and plans
•Monitoring/compliance requirements for protected areas/species
•Market overview and strategy
•Marketing and sales contracts
•Inflation and discount rates
Our opinions and conclusions regarding this information are provided in the relevant sections of this report.
2.4.3.Verification of Information
BOYD exercised due care in reviewing the information provided by Atlas within the scope of our expertise and experience (which is in technical and financial mining issues) and concluded the data are reasonable and reliable considering the status of the subject properties and the purpose for which this report was prepared.
We have no reason to believe that any material facts have been withheld or misstated, or that further analysis may reveal additional material information. However, the accuracy of the results and conclusions of this report are reliant on the accuracy of the information provided by Atlas. While we are not responsible for any material omissions in the information provided for use in this report, we accept responsibility for the disclosure of information contained herein which is within the scope of our expertise.
2.4.4.Other Relevant Data and Information
BOYD is not aware of any additional information that would materially impact the frac sand resource and frac sand reserve estimates reported herein.
The effective (i.e., “as of”) date of this TRS is December 31, 2024. The estimates of frac sand resources and frac sand reserves and supporting information presented in this report are effective as of December 31, 2024.
This is the second TRS for the OnCore Plants filed by Atlas. This report supersedes the previously filed TRS and any predated estimates of frac sand resources or frac reserves for the OnCore Plants. The user of this document should ensure that this is the most recent disclosure of frac sand resources and frac sand reserves for the OnCore Plants as they are no longer valid if more recent estimates are available.
The U.S. customary measurement system has been used throughout this report. Tons are short tons of 2,000 pounds-mass. Unless otherwise stated, currency is expressed in U.S. Dollars ($). Historic prices and costs are presented in nominal (unadjusted) dollars. Future dollar values are expressed on a constant (unescalated) basis as of the effective date of this report.
3.0 PROPERTY OVERVIEW
3.1.Description and Location
Atlas’s OnCore operations are associated with eleven locations spread across five counties—Glasscock, Howard, Loving, Martin, and Midland—in western Texas. Nine mobile OnCore Plants—OnCore 1, 2B, 3B, 4, 5, 6, 7, 8, and 9—are currently operating at nine individual locations. The OnCore 3 site was idled in late-2023 and the mobile plant was moved to the OnCore 3B site in May 2024. The OnCore 2 site was idled in March 2024 and the mobile plant moved to the OnCore 2B site in June 2024.
Each OnCore plant is located within the Permian Basin and operates in a relatively similar manner, mining and processing local sands to produce a damp “100 mesh” frac sand product, which is used in the hydraulic fracturing process (known as “fracking”) to produce petroleum fluids, such as oil, natural gas, and natural gas liquids.
The Midland-Odessa metropolitan area is somewhat central to all of the OnCore Plants. The western-most site—OnCore 9—is located approximately 100 miles west of Midland International Air & Space Port. The northern-most site—OnCore 2B—is located approximately 40 miles to the north-northeast; and the remaining sites located approximately 25 to 55 miles to the northeast of Midland International Air & Space Port.
The locations of currently and formerly operating OnCore plants are shown in Table 3.1, below.
| | | | | | | | |
Table 3.1: OnCore PIant Locations |
| | Geographic Coordinates |
Plant | | County | | Basin | | Lattitude | | Longitude |
|
OnCore 1 | | Howard | | Midland | | 32° 17' 33" N | | 101° 24' 06" W |
OnCore 2 | | Howard | | Midland | | 32° 18' 02" N | | 101° 24' 52" W |
OnCore 2B | | Martin | | Midland | | 32° 29' 27" N | | 102° 00' 00" W |
OnCore 3 | | Loving | | Delaware | | 31° 57' 29" N | | 103° 48' 21" W |
OnCore 3B | | Glasscock | | Midland | | 32° 00' 03" N | | 101° 37' 26" W |
OnCore 4 | | Midland | | Midland | | 32° 02' 07" N | | 101° 47' 41" W |
OnCore 5 | | Howard | | Midland | | 32° 17' 41" N | | 101° 37' 06" W |
OnCore 6 | | Glasscock | | Midland | | 31° 59' 09" N | | 101° 37' 57" W |
OnCore 7 | | Loving | | Delaware | | 31° 57' 43" N | | 103° 42' 42" W |
OnCore 8 | | Howard | | Midland | | 32° 16' 49" N | | 101° 37' 55" W |
OnCore 9 | | Loving | | Delaware | | 31° 54' 07" N | | 103° 46' 33" W |
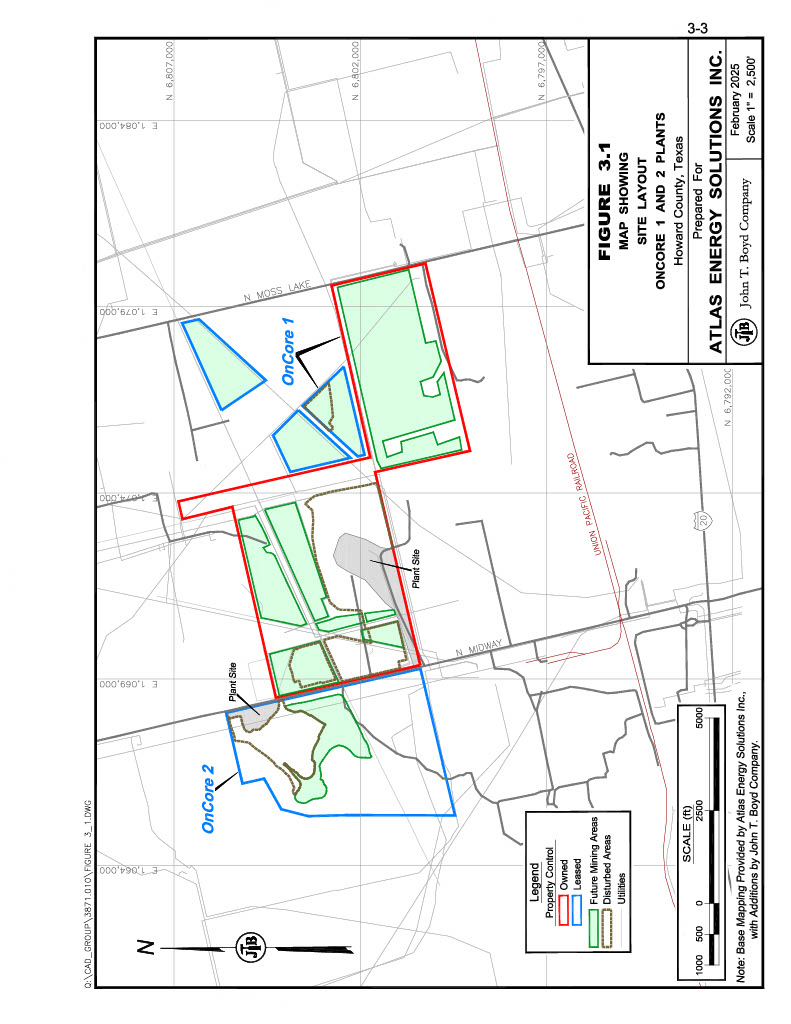
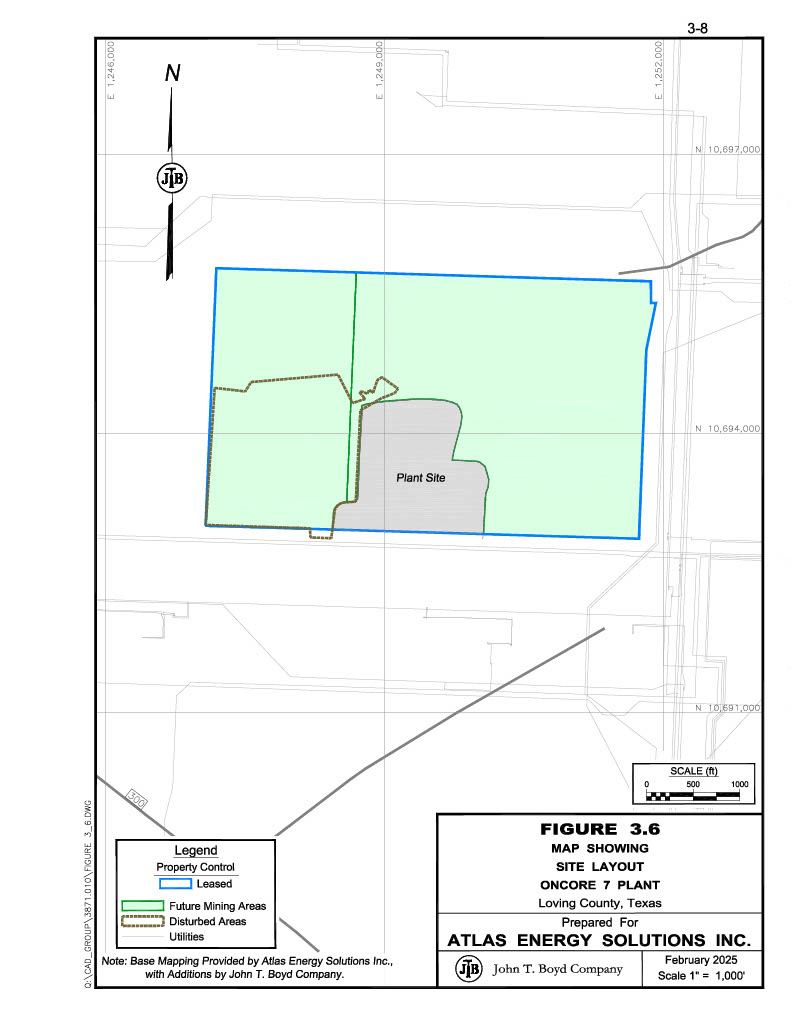
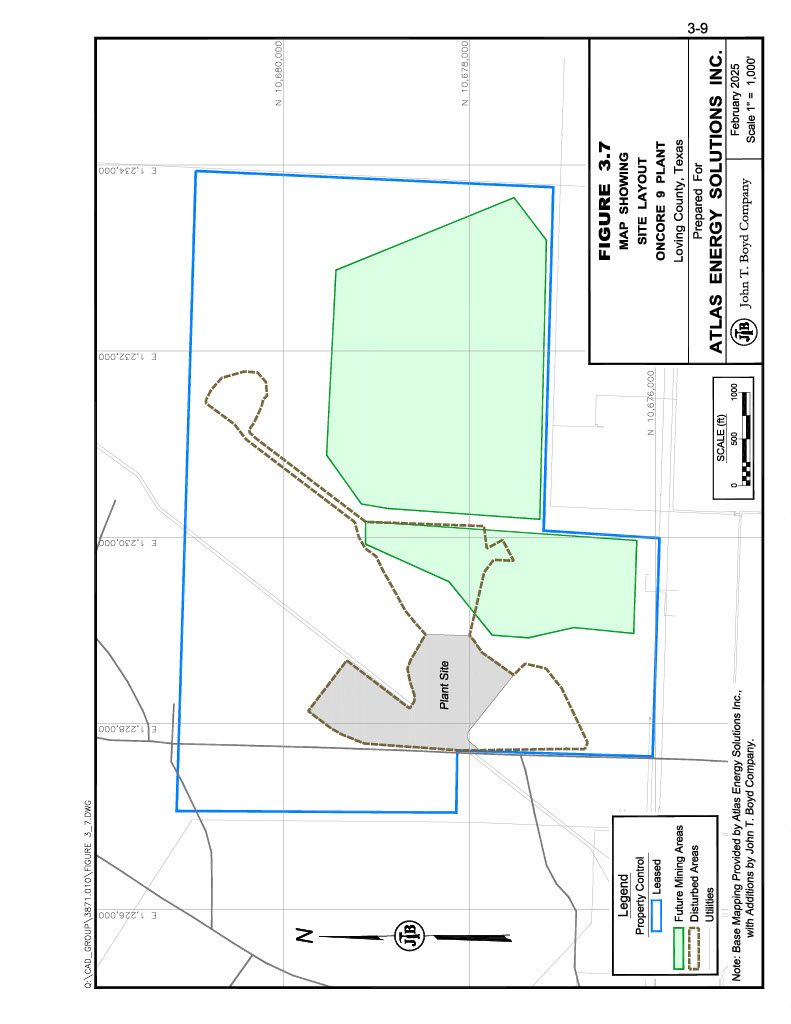
Figures 3.1 through 3.7, on the following pages, show the general layout of each OnCore site, including the locations of processing plants, loadout facilities, and current and former mining pits. Figure 1.1 (page 1-2) illustrates the general locations of the Atlas OnCore Plants.
Extensive surface mining of frac sand has been conducted in the West Texas region since the first “in-basin” frac sand mine—one of Atlas’s Kermit facilities—commenced production in August 2017, and began supplying locally sourced frac sand into the Permian Basin oil and gas industry. Since then, numerous in-basin frac sand mines have been opened across the region.
Atlas developed the OnCore mobile mining and processing concept after completing a series of regional geologic exploration efforts across areas located outside of the historic Permian Basin frac sand mining activity centers. The first OnCore site (OnCore 1) opened in late-2020, and after seeing continued demand for locally sourced damp frac sand, Atlas has now operated a total of eleven different OnCore sites since commencing production at OnCore 1. Two former operations—OnCore 2 and 3—were idled in 2023 and 2024, respectively, and four new sites—OnCore 2B, 3B, 8, and 9—began production between May and July 2024. The status of each OnCore site is provided in Table 3.2, below.
| | | | |
Table 3.2: Property Status |
|
Plant | | Status | | Start Date |
|
OnCore 1 | | Producing | | September 2020 |
OnCore 2 | | ldled | | April 2021 |
OnCore 2B | | Producing | | June 2024 |
OnCore 3 | | Reclamation | | February 2022 |
OnCore 3B | | Producing | | May 2024 |
OnCore 4 | | Producing | | July 2022 |
OnCore 5 | | Producing | | October 2023 |
OnCore 6 | | Producing | | May 2023 |
OnCore 7 | | Producing | | July 2023 |
OnCore 8 | | Producing | | May 2024 |
OnCore 9 | | Producing | | July 2024 |
The OnCore sites comprise approximately 6,579 acres of surface and sand mining rights—including 1,172.4 acres owned in fee and 5,406.6 leased acres. Table 3.3, below, provides a brief overview of the property control status of each OnCore site.
| | | | | | | | |
Table 3.3 Property Control |
|
| | Lease Terms |
Plant | | Control | | Acreage | | Start | | Length |
|
OnCore 1 | | Owned | | 852.8 | | - | | - |
| | Leased | | 132.2 | | 7/18/2022 | | 3 Years |
OnCore 2 | | Leased | | 391.6 | | 3/30/2020 | | Indef. |
OnCore 2B | | Leased | | 877.0 | | 8/28/2023 | | Indef. |
OnCore 3B | | Owned | | 319.6 | | - | | - |
OnCore 4 | | Leased | | 640.0 | | 4/11/2022 | | Indef. |
OnCore 5 | | Leased | | 1,378.8 | | 10/8/2021 | | Indef. |
OnCore 6 | | Leased | | 481.0 | | 12/15/2022 | | 4 years |
OnCore 7 | | Leased | | 297.0 | | 7/18/2022 | | 4 years |
OnCore 8 | | Leased | | 552.8 | | 2/3/2023 | | Indef. |
OnCore 9 | | Leased | | 656.2 | | 6/2/2023 | | 4 years |
Total | | | | 6,579.0 | | | | |
The OnCore sites are primarily operated under lease agreements held between Atlas and various private landowners. Some of the leases have definitive term lengths while others are subject to minimum periodic production requirements. It is generally reasonable to assume that expired leases can be renewed in the ordinary course of business; as such, we do not believe there is any undue risk associated with surface and mineral control to the estimated reserves reported herein.
Non-leased properties were formerly controlled by various Atlas customers and operated under contracts, or “work orders”, that required Atlas to supply minimum quantities of finished frac sand to the landowner at agreed upon prices. These work order-operated properties were purchased by Atlas in late-2024.
All third-party sales of frac sand produced from leased OnCore properties are subject to a royalty payable to the landowners. The blended royalty for the frac sand reserves reported herein is $1.75 per ton sold. It is BOYD’s understanding that there are no additional royalties, overriding or limited royalties, working interests, production payments, net profit interests, or other mineral interests in the OnCore properties.
Several existing frac sand mining operations are located throughout the West Texas region, however much of the current frac sand mining activity is located near Kermit, Texas. Atlas’s OnCore sites have been located away from the current frac sand mining activity center in an attempt to gain an advantage of shorter haul distances to their end use customers. The closest competitor operations to OnCore’s Delaware Basin sites are Independence Texas, LLC. Tree Dog and Z&T Ranch mines in Loving County, near the idled OnCore 3 site, the OnCore 7 site, and the newly deployed OnCore 9 site which is located approximately 4.0 miles to the southwest. OnCore’s Midland Basin operations are more widely distributed. OnCore 1 and the idled OnCore 2 have three nearby competitors—Nomad Proppant Services, LLC, and West Point Silica, LLC both operate on properties adjacent to OnCore 1 to the east and south, respectively, and Big Spring Sands, LLC operates a mine 1 mile southwest of the OnCore 1 site. Oncore 2B has two nearby competitors—Energy In Motion and Vista Minerals—located 2.5 miles to the northwest and 5 miles to the southwest, respectively. At present OnCore 3B, 4, 5, 6, and 8 have no nearby competitors.
There is no information used in this report that has been sourced from adjacent properties.
3.5.Regulation and Liabilities
The OnCore sites operate under several permits and must comply with other federal, state, and municipal law regulations that do not require a specific permit. Atlas reports that necessary permits are in place or applied for to support immediate operations. New permits or permit revisions may be necessary from time to time to facilitate future operations. Given sufficient time and planning, Atlas should be able to secure new permits, as required, to maintain its planned operations within the context of the current regulations.
To the extent known to BOYD, there are no current violations, fines, liens, or other significant factors and risks that may affect access, title, or the right or ability to perform work on the OnCore properties.
3.6.Accessibility, Local Resources, and Infrastructure
The OnCore sites all lie within rural regions of western Texas. The surrounding region has a well-established history of heavy oil and gas industry and agricultural development. The nearby Midland-Odessa metropolitan area has a population of 340,391 according to the 2020 U.S. Census. The surrounding counties have a combined population of over 200,000 people, according to 2020 population estimates by the U.S. Census.
Finished frac sand products from the OnCore Plants are sold at each site’s mine gate, where finished product is weighed and loaded into bulk trucks. General access to each site is via a well‑developed network of primary and secondary roads serviced by local municipality, county, and state governments. These roads offer direct access to each site, and processing facilities and are generally open year-round. Primary vehicular access to the western sites is via Texas state highway TX-302 or U.S. Route 285; while primary access to the eastern sites is via Interstate 20, state highways TX-137, TX-176, TX-137, or TX-349. Each of these roadways provides primary access to various portions of the region’s oil and gas fields.
Several regional airports are located throughout the area, and the Midland International Airport is just over two-hours drive from the farthest OnCore location by road.
Reliable sources of electrical power, water, supplies, and materials are readily available. Electrical power is provided to the operation by regional utility companies. Water is supplied by the public water system, surface impoundments, and water wells. Additionally, each of the OnCore sites retain recycled processing water as much as possible.
The western OnCore sites are located within Chihuahuan Basins ecoregion, while the eastern OnCore sites are located within the Arid Llano Estacado ecoregion. In general, the OnCore sites are located in an area of Texas where the southern High Plains and Trans-Pecos regions converge. The area is relatively flat lying with windblown sand hills and dunes in various locations. The surrounding areas generally consist of desert valleys covered with windblown sheet and dune sands, high plains covered with thick alluvium (the Llano Estacado or Staked Plains), or plateaus consisting of thin carbonate‑based soils (the Caprock Escarpment). The plateau areas, typically covered by a weathering-resistant caliche (a hardened natural cement of calcium carbonate that binds other materials—such as gravel, sand, clay, and silt), may abruptly stand up to 1,000 ft above the plains.
Each of the OnCore sites themselves are relatively flat, with little topographic relief other than the peaks and troughs of sand dunes. Surface elevations between the OnCore sites range from approximately 2,500 ft above mean sea-level (AMSL) on the eastern sites, to approximately 3,100 ft AMSL on the western sites, however the Caprock Escarpment abruptly rises to an elevation of approximately 3,400 ft AMSL between the eastern and western OnCore site locations.
There are not any natural surface waters present on any of the properties.
Land cover in the immediate area consists predominantly of mixed shrubbery, grasses, and other various scrub vegetation.
In and around the OnCore sites, summers are long, humid, and hot; the winters are short, cold, and dry; and the skies are mostly clear year-round. Over the course of the year, the temperature typically varies from 32°F to 97°F and is rarely below 22°F or above 105°F.
The hot season lasts from mid-May to mid-September, with an average daily high temperature above 89°F. The hottest month of the year is July, with an average high of 97°F and low of 72°F. The cool season lasts from late-November to mid‑February, with an average daily high temperature below 67°F. The coldest month of the year is January, with an average low of 33°F and a high of 61°F.
Annual precipitation in the area varies widely from year to year, but generally totals 5 to 12 inches of rain with little-to-no snow.
In general, the operating season for the OnCore mines is year-round. Adverse weather conditions seldom restrict or interfere with the mining, processing, and loading operations; however, extreme weather conditions may temporarily impact operations. Periodic flooding is possible during heavy rainfall.
4.0 GEOLOGY
Atlas’s nine operating OnCore Plants are located across five counties in West Texas, covering an area that spans approximately 140 miles between the western-most and eastern-most plant sites. The OnCore Plants are all located in relatively similar geologic settings where the High Plains and Trans-Pecos desert regions converge. Surficial geologic units are characterized by windblown Quaternary-aged sand formations, which include varying amounts of sand dunes, undivided sand and silt deposits, and sheet sand deposits. The region is bordered by the Caprock Escarpment of the Llano Estacado to the east and the basins and playas of the Chihuahuan Desert to the west and south.
The frac sand resources and frac sand reserves for each of the OnCore sites are hosted in the surficial sand deposits found across the region. The origins of these deposits are believed to be a combination of eroded bedrock material from the southern Rocky Mountains, and locally eroded sandstones. As portions of the southern Rockies were eroded via weathering, particles were carried to the Pecos River. Ancient flooding events of the Pecos River resulted in the suspended particles being deposited into flood plains. Once flood waters receded, winds took over, drying and further transporting these particles over the western Texas region.
The Caprock Escarpment of the Llano Estacado marks the eastern-most extent of the surficial sand deposits. Winds transporting particles into the area are thought to have collided with the escarpment, slowing and dropping particles out to where they have accumulated over time. Winnowing processes caused some degree of particle sorting throughout the region to occur. Due to the mechanisms and long distances of particle transport, sand grains were abraded and rounded as they reached their current locations.
4.2.1.General Stratigraphy
The surficial geologic units at each of the OnCore sites are comprised of undifferentiated Quaternary Age unconsolidated deposits that range in composition from aeolian (windblown) sheet sands and dunes to alluvial sands with silts, clays, and caliche to varying degrees. Geologic mapping in and around the subject properties indicates slight variations in surface geology; however, each OnCore site is in an area where Quaternary-age surficial sand deposits have accumulated. Table 4.1, below, shows the surficial geologic units found on each OnCore property.
| | |
Table 4.1: Surficial Geologic Units of the OnCore Properties |
|
Site | | Surfical Geologic Unit(s) |
|
OnCore 1 | | Windblown Sand Sheets, Dunes, and Dune Ridges Undivided |
OnCore 2B | | Windblown Sand and Silt; Caliche |
OnCore 3B | | Windblown Sand and Silt; Blackwater Draw Formation |
OnCore 4 | | Blackwater Draw Formation |
OnCore 5 | | Windblown Sand Sheets, Dunes, and Dune Ridges Undivided; Blackwater Draw Formation |
OnCore 6 | | Windblown Sand and Silt; Blackwater Draw Formation |
OnCore 7 | | Windblown Sand and Silt; Caliche |
OnCore 8 | | Windblown Sand Sheets, Dunes, and Dune Ridges Undivided; Blackwater Draw Formation |
OnCore 9 | | Windblown Sand and Silt; Caliche |
As shown, stratigraphic units across the OnCore sites range from generally undifferentiated, windblown sheet sands in the western sites, to Blackwater Draw Formation sand deposits in the eastern sites. A generalized stratigraphic chart of the geologic units found at the OnCore sites is presented in Figure 4.1.
| | | |
System | Series | Geologic Units |
West | East |
Quaternary | Pleistocene / Holocene | Sheet and Dune Sand | Sheet and Dune Sand |
Pleistocene | Unconsolidated Alluvium | Unconsolidated Alluvium |
Blackwater Draw Formation |
Neogene | Pliocene | Ogallala Formation | Ogallala Formation |
Figure 4.1: Generalized Stratigraphic Chart,
Surficial Deposits of the OnCore Properties
The following text discusses the strata encountered throughout the areas of the current OnCore sites, in depositional order:
Ogallala Formation
The Ogallala Formation is predominantly comprised of weakly cemented to unconsolidated fine- to medium-grained sands, which may be silty and calcareous in places. A caliche caprock is frequently exhibited, which resists weathering and forms ledges. The thickness of this formation has been recorded up to 550 ft. The Ogallala Formation is rarely encountered at any of the OnCore sites.
Blackwater Draw Formation
The Blackwater Draw Formation is a predominantly fine to medium-grained quartz sand containing silt, caliche, and calcareous nodules. Thickness is typically 25 ft or less and tends to feather out locally.
Quaternary Sheet and Dune Sands
Most of the OnCore sites are covered by Quaternary sheet and dune sands generally consisting of fine- to medium-grained quartz sand grains mixed with varying degrees of silts, calcareous sands, and caliche nodules. Surficial sand deposition in the study areas may range in thickness from less than 5 ft to over 40 ft. Overburden (i.e., overlying waste) material is generally minimal and easily removed during mining and processing operations. Interbedded alluvial deposits consisting of pebble- to cobble-sized limestone and chert nodules, or caliche are not uncommon, but are easily segregated during mining.
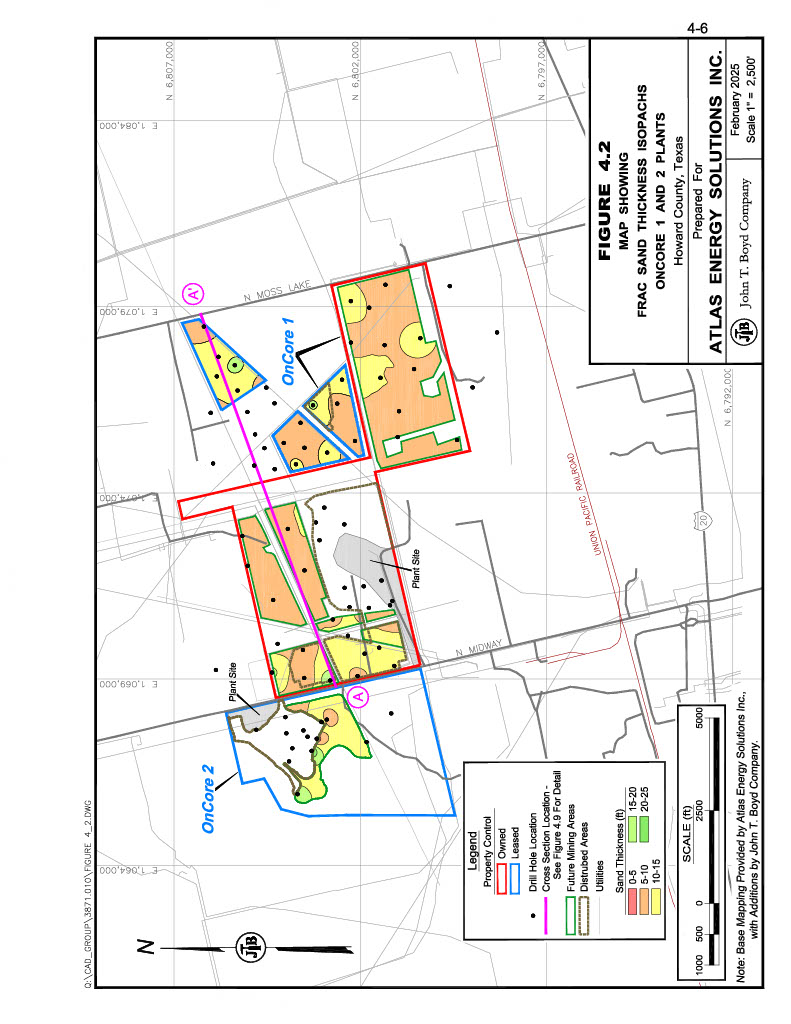
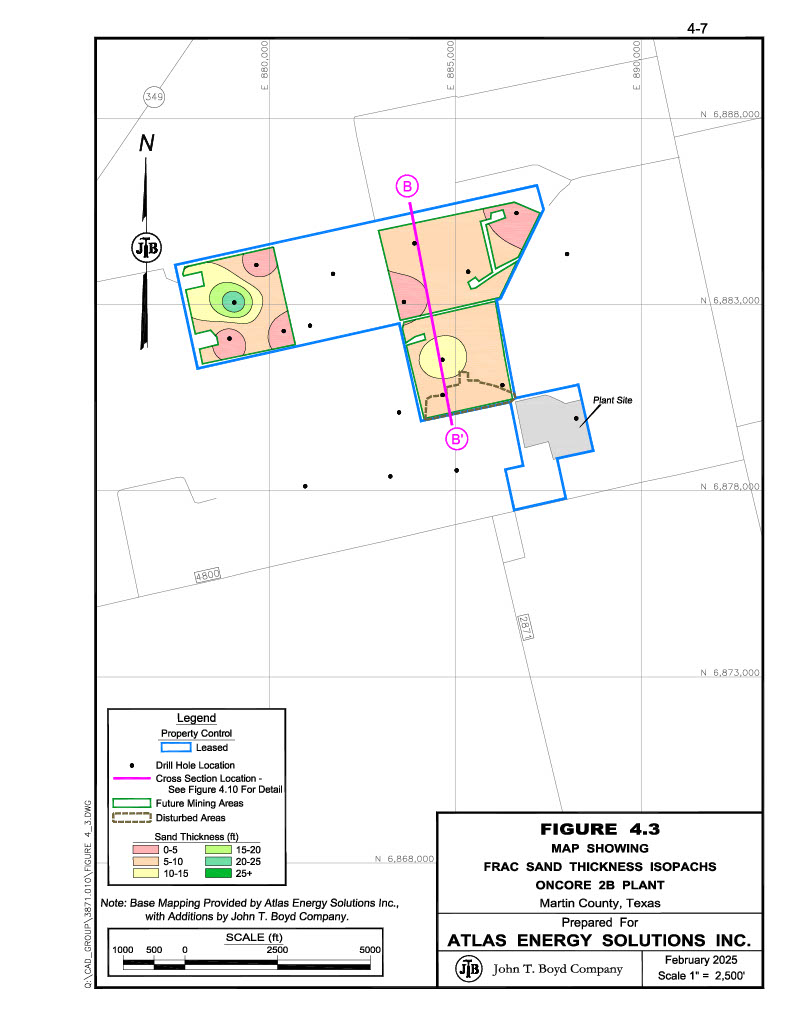
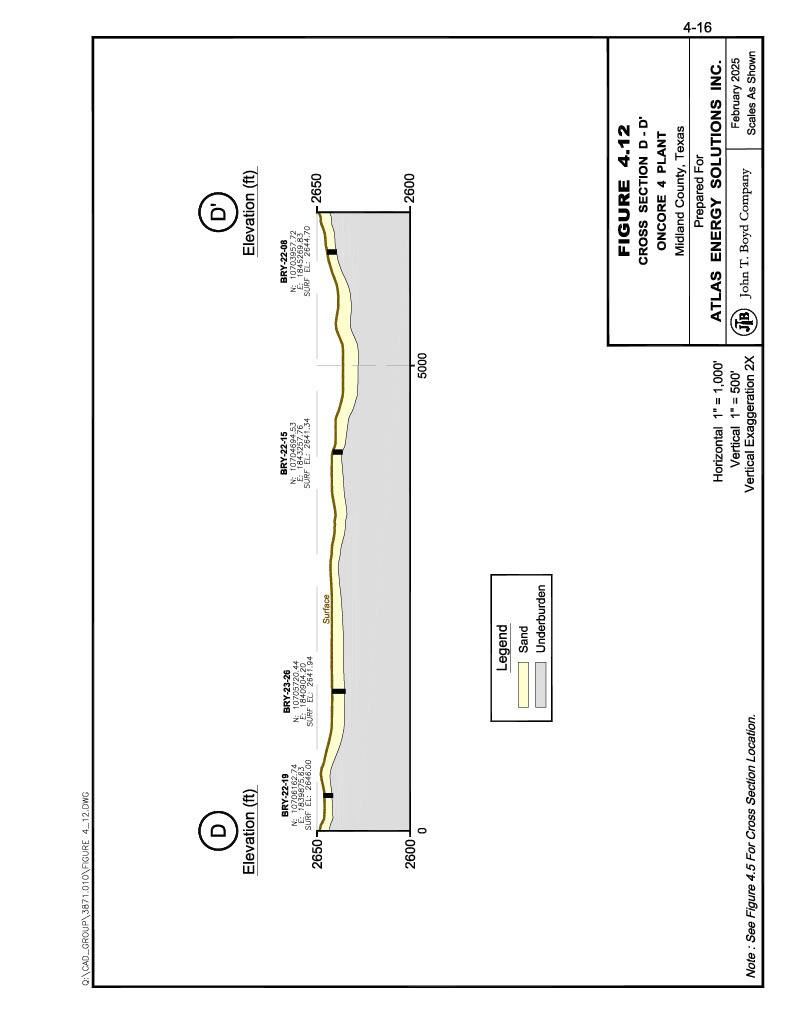
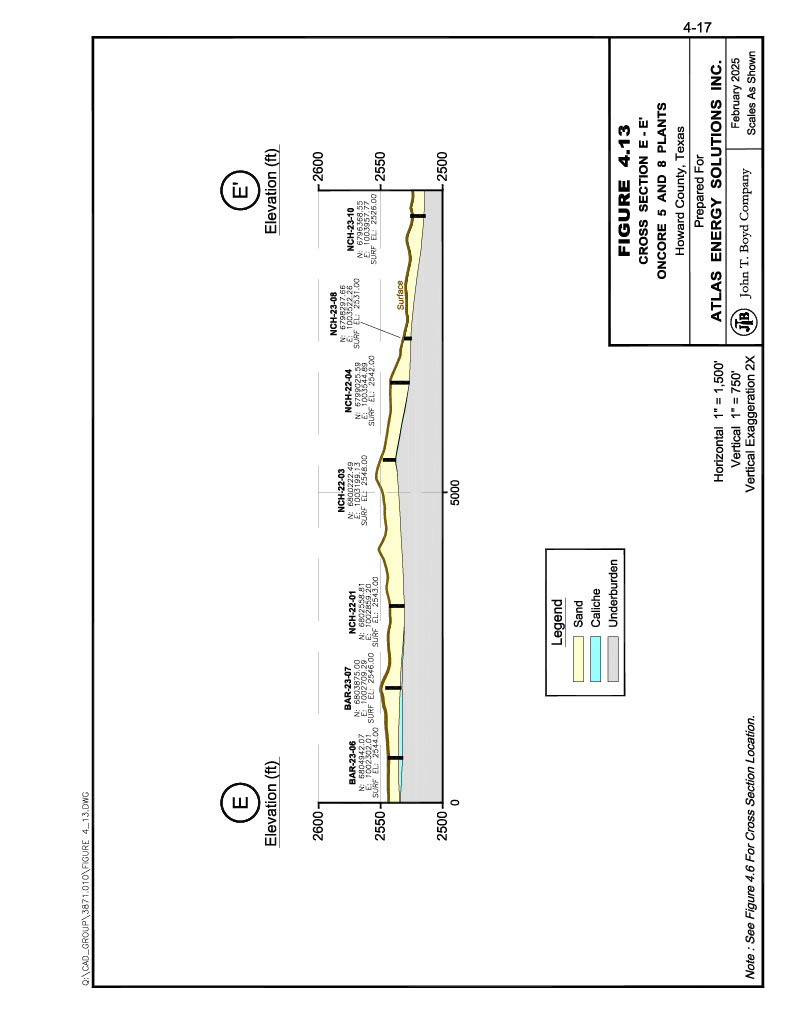
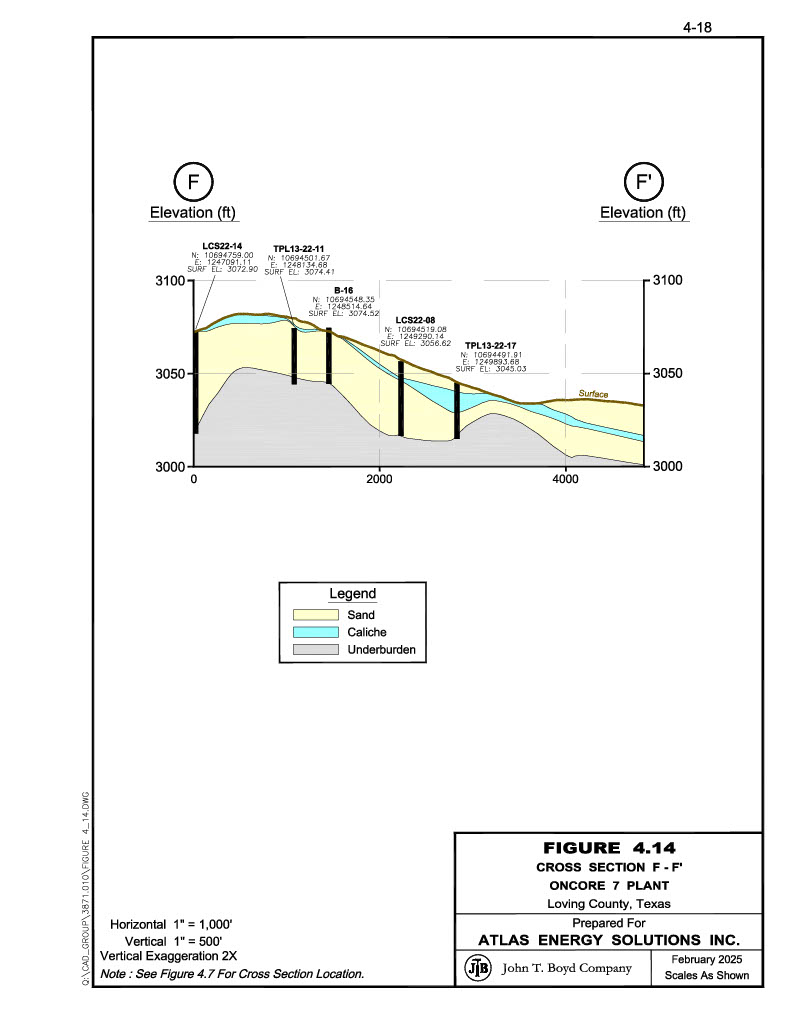
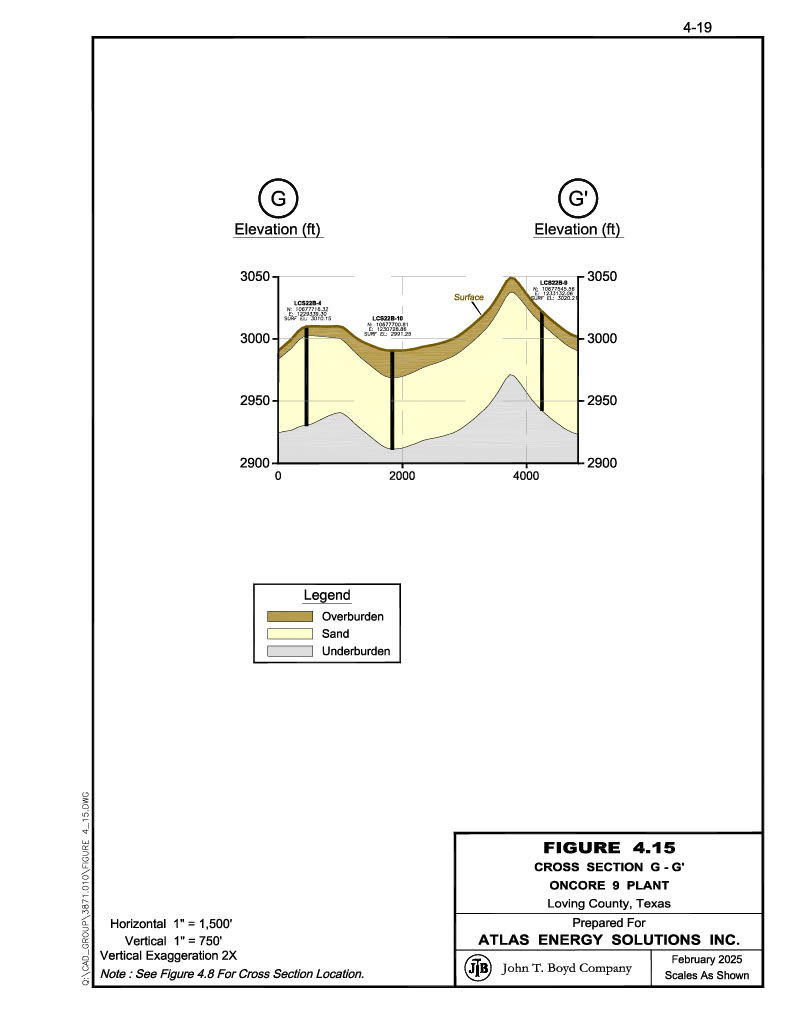
Figures 4.2 through 4.8 (pages 4-6 to 4-12) provide maps of the mineable sand thickness at each of the OnCore sites. Cross-sections through the subject sand deposits are provided in Figures 4.9 through 4.15 (pages 4-13 to 4-19).
The structural features of the Quaternary sands in and around the OnCore properties are relatively non-descript. While the subject sand deposits exhibit variable thickness and extents, they are generally unaffected by folding or faulting. Due to the lack of structural features encountered, there are no known geological features that are believed to materially affect frac sand mining operations on the properties; as such, the deposits are considered to be of low geologic complexity.
The sand mined at the OnCore sites is processed into frac sand products. Frac sand is a naturally occurring silica sand—also known as quartz sand or white sand—which generally exhibit the following characteristics required by oil and gas producers for use in developing wells:
•High-purity – frac sand grains are relatively pure (typically, >95% silicon dioxide) in composition and almost entirely free from contaminants. Typical sand deposits have numerous impurities fused to the silica grains, such as iron, carbonate, potassium, and other trace elements/minerals, which can make them more susceptible to mechanical and chemical alteration. Mineralogical purity of silica content is a characteristic of mature sand, which has been highly reworked and well sorted, so that the mechanically and chemically less-resistant minerals and fine particles have been dissolved or winnowed away.
•Homogeneous grain size – hydraulic fracturing procedures require sand in a relatively narrow range of grain sizes which are dependent on the specific geological conditions of the well and the fracking procedures used. Larger sand grains generally provide better permeability, but smaller sand grains are typically stronger. When describing frac sand, the product is frequently referred to as simply the sieve cut, e.g., 20/40 mesh sand—meaning that 90 percent of the sand is fine enough to pass through a 20-mesh sieve and is coarse enough to be retained on a 40-mesh sieve. Common frac sand sizes include 20/40 mesh, 30/50 mesh, 40/70 mesh, “100 mesh”, “200 mesh”, and finer. The size ranges for “100 mesh” and “200 mesh” vary significantly between manufacturers. As of the date of this report, finer sands such as 40/70 mesh and “100 mesh” have become more widely utilized in shale gas well fracturing.
•High sphericity and roundness – Sphericity and roundness describe the overall shape of the sand grains. Sphericity measures how close the grains approach the shape of a sphere while roundness measures the relative sharpness of corners and curvatures of the grains. Greater sphericity and roundness provide better grain strength and porosity/permeability between grains, allowing better flow of oil and gas from the fractures to the wellhead. A more spherical shape also enables the grains to be carried in the fracking fluid with minimal turbulence.
•High crush resistance – Crush resistance of frac sand is dependent upon the hardness and shape of the sand grain. Generally, a high percentage of silica in the sand increases its crush resistance. Additionally, monocrystalline grains are stronger than composite grains. Crush resistance is expressed as a K-value that indicates the highest pressure (rounded to the nearest 1,000 psi) that generates less than 10 weight percent fines (i.e., crushed sand grains). For example, a K-value of 7 means that, at 7,000 psi pressure, no more than 10 weight percent fines were generated, but more than 10 weight percent fines were generated at the next highest pressure. The higher the K-value, the more crush-resistant the sand is.
•Low acid solubility – Acid solubility is an indication of the amount of soluble cement or soluble mineral grains (i.e., non-silica contaminants) in the frac sand; low solubility requires a high silica content, as pure quartz tends to be insoluble under normal conditions.
•Low turbidity – Turbidity is a measure of the clay, silt, or other fine grains and impurities in the sand. Low turbidity is a result of mineralogical maturity and grain‑size sorting in the natural depositional environment. Generally, fine suspended matter in the mined sand is washed out during processing, so this property can be somewhat controlled for the final product.
Aeolian sand deposits, such as those found on the OnCore sites, which are predominantly comprised of silica sand grains meeting the abovementioned characteristics are well-suited to the commercial production frac sands.
5.0 EXPLORATION DATA
In developing the OnCore sites, Atlas has completed numerous geologic exploration campaigns. A total of 247 drill holes have been completed across the subject OnCore sites. The results of these exploration programs comprise geologic logs and subsurface sand samples, grain size analyses of the samples, and proppant sand testing of composited samples. Exploration summaries were provided to BOYD for our review, along with the collected and analyzed exploration data, which together comprise the primary geologic data used in the evaluation of the frac sand resources and frac sand reserves reported herein.
Maps illustrating the extents of the sand deposits, along with electronic copies of drilling and sampling logs, as well as sampling procedures and laboratory testing summaries were provided for our review. The equipment utilized, and the sampling, logging, and field work performed, are noted as being appropriate for delineating the frac sand deposits. BOYD opines that the work done by Atlas is thorough and complete for the purposes of evaluating and estimating frac sand resources and reserves on the subject sites.
Atlas notes that the OnCore sites have been developed and operated by OnCore personnel from initial greenfield prospecting stages, through current operational status. Generally, each OnCore site was the subject of at least two separate exploration campaigns—the exception being new OnCore sites located adjacent to an operating OnCore site—including a widely-spaced “reconnaissance” exploration campaign to gauge the deposits potential followed by an infill exploration campaign if the initial campaign results are favorable.
Table 5.1, below, summarizes the drilling campaigns completed on each of the OnCore sites:
| | | | | | | | | | | | |
Table 5.1: OnCore Drilling Summary |
| | Drilling | | | | Start / End | | Drillhole | | Driling |
Site | | Campaign | | Property | | Date(s) | | Drillholes | | Count | | Method(s) |
| | | | | | | | | | | | |
OnCore 1 | | 1 | | Atlas | | March 2021 | | LA-21-01 - LA-21-10 | | 10 | | Rotosonic |
| | 2 | | Atlas | | January 2022 | | LA-22-01 - LA-22-09 | | 9 | | Direct Push |
| | 3 | | Atlas | | April 2022 | | LA-22-10 - LA-22-17 | | 8 | | Direct Push |
| | 4 | | Atlas | | March 2022 | | LS-22-01 - LS-22-08 | | 8 | | Direct Push |
| | 5 | | Atlas | | June 2022 | | LS-22-09 - LS-22-14 | | 6 | | Direct Push |
| | 6 | | TPL 31 | | August 2022 | | TPL31-22-01 - TPL31-22-16 | | 16 | | Direct Push |
| | 7 | | TPL 31 | | June 2023 | | TPL31-23-17 - TPL31-23-23 | | 7 | | Direct Push |
| | | | | | | | | | 64 | | |
| | | | | | | | | | | | |
OnCore 2 | | 1 | | Ron White | | 2020 | | RW-20-01 - RW-20-03 | | 3 | | Manual Probe |
| | 2 | | Ron White | | 2021 | | RW-21-01 - RW-21-09 | | 9 | | Rotosonic |
| | 3 | | Ron White | | June 2023 | | ONC2-23-01 - ONC2-23-08 | | 8 | | Auger |
| | | | | | | | | | 20 | | |
| | | | | | | | | | | | |
OnCore 2B | | 1 | | Hightower | | May 2022 | | HTW-23-01 - HTW-23-16 | | 16 | | Direct Push |
| | 2 | | Hightower | | September 2023 | | HTW-23-17 - HTW-23-19 | | 3 | | Auger |
| | | | | | | | | | 19 | | |
| | | | | | | | | | | | |
OnCore 3B | | 1 | | Atlas | | October 2022 | | SV-22-01 - SV-22-07 | | 7 | | Direct Push |
| | | | | | | | | | | | |
OnCore 4 | | 1 | | Bryant | | March 2022 | | BRY-22-01 - BRY-22-08 | | 8 | | Direct Push |
| | 2 | | Bryant | | April 2022 | | BRY-22-09 - BYR-22-15 | | 7 | | Direct Push |
| | 3 | | Bryant | | October 2022 | | BRY-22-16 - BRY-22-20 | | 5 | | Direct Push |
| | 4 | | Bryant | | January 2023 | | BRY-23-21 - BRY-23-28 | | 8 | | Direct Push |
| | | | | | | | | | 28 | | |
| | | | | | | | | | | | |
OnCore 5 | | 1 | | Barr | | March 2021 | | BA-20-01 - BA-20-03 | | 3 | | Manual Probe |
| | 2 | | Barr | | 2021 | | BA-21-01 - BA-21-11 | | 11 | | Rotosonic |
| | 3 | | Barr | | October 2022 | | BAR-22-01 - BAR-22-03 | | 3 | | Direct Push |
| | 4 | | Barr | | July 2023 | | BAR-23-04 - BAR-23-09 | | 6 | | Direct Push |
| | 5 | | | | July 2023 | | ONC5-23-01 - ONC5-23-03 | | 3 | | Direct Push |
| | | | | | | | | | 26 | | |
| | | | | | | | | | | | |
OnCore 6 | | 1 | | Hog Mountain | | October 2022 | | HOG-22-01 - HOG-22-09 | | 9 | | Direct Push/Auger |
| | 2 | | Hog Mountain | | January 2023 | | HOG-23-10 - HOG-23-17 | | 8 | | Direct Push |
| | | | | | | | | | 17 | | |
| | | | | | | | | | | | |
OnCore 7 | | 1 | | TPL 13 | | February 202 | | TPL13-22-01 - TPL13-22-05 | | 5 | | Auger |
| | 2 | | TPL 13 | | May 2022 | | LCS-22-06 - LCS-22-09 | | 4 | | Rotosonic |
| | 3 | | TPL 13 | | June 2022 | | TPL13-22-10 - TPL13-22-21 | | 12 | | Auger |
| | 4 | | TPL 13 | | July 2022 | | LCS-22-10 - LCS-22-16 | | 7 | | Rotosonic |
| | | | | | | | | | 28 | | |
| | | | | | | | | | | | |
OnCore 8 | | 1 | | Nichols | | October 2022 | | NCH-22-01 - NCH-22-05 | | 5 | | Direct Push |
| | 2 | | Nichols | | Jauary 2023 | | NCH-23-06 - NCH-23-16 | | 11 | | Direct Push |
| | 3 | | Nichols | | November 2023 | | NCH-23-17 - NCH-23-28 | | 2 | | Manual Probe |
| | | | | | | | | | 18 | | |
| | | | | | | | | | | | |
OnCore 9 | | 1 | | TPL 31 | | October 2022 | | TPL29-22-Pit1 - TPL29-22-Pit4 | | 4 | | Auger |
| | 2 | | DBR 32 | | October 2022 | | DBR32-22-01 - DBR32-22-03 | | 3 | | Auger |
| | 3 | | TPL 31 & DBR 32 | | November 2022 | | LCS-22B-01 - LCS-22B-13 | | 13 | | Rotosonic |
| | | | | | | | | | 20 | | |
| | | | | | | | | | | | |
Total | | 34 | | | | | | | | 247 | | |
5.2.Exploration Procedures
5.2.1.Drilling and Sampling Methodologies
Atlas has completed substantial exploration drilling and sampling work across the various OnCore sites. In total, 247 drill holes were completed using the drilling methods specified in Table 5.1. Additional discussion of each drilling method, as well as provided sampling procedures, are presented below:
•Direct Push Coring: A skidsteer-mounted AMS Scientific 9520-SK drilling attachment was utilized to advance a 3-in diameter core barrel containing a 1¼ -in diameter, 4-ft long plastic core sleeve into the ground using a hydraulic hammer. Once the core barrel is fully advanced into the ground, the inner core sleeve is removed while the core barrel remains in-place. The sample sleeve is capped on both ends, labeled with drill hole name and interval depths, and the top and bottom of the obtained sample are marked on the core sleeve. A new length of plastic core sleeve is inserted, followed by adding an additional length of core barrel to the top of the drill string, and the hydraulic hammer drives the additional core barrel length into the ground. These procedures are repeated until either meeting refusal (the point at which the hammer cannot advance the drill core any deeper), or to a total depth of approximately 32 ft is reached.
Direct push coring is Atlas’s preferred method of exploration, as it provides an intact sample without compromising sample integrity as the drill hole sidewall cannot contaminate samples obtained at increasing depth. Labeled sample sleeves were taken to a secure storage facility, and later cut open for sample description and geologic logging.
•Auger Drilling: The AMS 9520-SK attachment is able to switch to utilizing an auger drill to advance through harder materials when required. This method consists of utilizing a 4-in diameter wide and 5-ft long auger flight. As depth increases, drill cuttings are lifted to the ground surface via rotation of the auger. After advancing a complete 5-ft auger length, cuttings from each run were cleaned away from the drill hole collar, quartered, and then sampled before adding another 5-ft length of auger and advancing the hole. Labeled sample sleeves were taken to a secure storage facility, and later cut open for sample description and geologic logging.
Auger drilling was only utilized when direct push methods were unable to advance through harder intervals.
•Manual Probe: A JMC PN150 manual subsoil probe advanced a steel core barrel containing a 0.8-in diameter, 3-ft long core sleeve by manually lifting and dropping a slide-hammer mounted on a vertical rod. Once the core barrel is advanced into the ground, the core sleeve is retrieved using a manual step-jack, while the core barrel remains in the ground. The sample sleeve is capped on both ends, labeled with drill hole name and interval depths, and the top and bottom of the obtained sample are marked on the core sleeve before a new sleeve is inserted into the core barrel, and an additional length of core barrel is placed on top of the drill string. These procedures are repeated until either meeting refusal, or a total depth of approximately 15-ft is reached. Labeled sample sleeves were taken to a secure storage facility, and later cut open for sample description and geologic logging.
•Rotosonic Drilling: A drilling contractor operates a track-mounted rotosonic drilling rig, which utilizes a combination of rotary core drilling and a vibratory drilling head to advance core barrels through poorly consolidated lithologies. Rotosonic drilling provides relatively undisturbed drilling cores with typically very high recoveries. After advancing 10-ft of drilling core into the ground, a 4-in diameter core is retrieved and extruded into plastic sleeves, which are labeled with the bottom depth of each drilling run. These sample bags were logged and sampled on-site, with sampling consisting of taking approximately one-quarter of the entire length of the drilled core in order to obtain a composited representative sample of the drilled interval. Obtained sample material is placed into heavy-mil sample bags, which are then labeled with drill hole name and sample top and bottom depths, and then taken to a secure storage facility.
Please refer to Figures 4.2 through 4.8 (pages 4-6 to 4-12) for the locations of drill holes completed by Atlas on the various OnCore sites.
5.2.2.Proppant Sand Testing
Samples obtained throughout the OnCore exploration campaigns were transported by Atlas personnel to secure storage facilities after completion of each drilling campaign. These facilities, owned by Atlas, are located in either Dallas or Houston, Texas. Once samples arrived and were catalogued, any samples still in capped sample sleeves were cut open to be geologically logged at the storage facilities. Once all samples were geologically logged, mineable intervals were determined by an Atlas geologist, and composite samples of the mineable sand intervals were created to be analyzed for particle size distributions. The composite samples were then transported by Atlas, to either PropTester Inc’s. (PropTester) laboratory in Cypress, Texas, or Atlas’s in-house sample trailer located at one of their Kermit mines.
The general procedure for particle size distribution analyses was as follows:
1.The sample was dried to remove moisture.
2.A 600- to 1,200-gram subsample was collected and weighed.
3.The subsample was placed in a blender for three minutes to break up the material as much as possible.
4.The blended subsample was then placed on a 200-mesh wash screen, and thoroughly washed to remove any fine materials (e.g., clays and silts).
5.The remaining larger than 200 mesh (+200 mesh) material is then dried and weighed to determine the mass of fines that were washed out (i.e., wash loss).
6.The cleaned subsample was then either placed into a sieve stack of different mesh sizes and agitated for a period of 20 minutes, or run through a high-speed photographic particle size analyzer (i.e., CAMSIZER) to determine the particle size distribution of the subsample.
Atlas also obtained various finished product and composite drill hole samples, which were delivered to PropTester for standard frac sand characteristic testing according to API RP 19C/ISO 13503-2, Measurement of Properties of Proppants Used in Hydraulic Fracturing and Gravel-packing Operations (API/ISO). Results on API/ISO testing are presented in Section 5.3.2.
5.2.3.Other Exploration Methods
To our knowledge, no other methods of exploration (such as airborne or ground geophysical surveys) were completed on the OnCore sites.
5.3.Laboratory Testing Results
The relatively uniform nature of the mineable portion of the sand deposits found on the various OnCore sites, combined with the results of laboratory testing, indicate the subject properties can produce a combination of finished “100 mesh” frac sand products—typically in the 40/140 to 40/200 mesh size range—that meet various local Permian Basin customer specifications.
5.3.1.Grain Size Distribution
Grain size distribution was analyzed according to API/ISO, Section 6. A table of the weighted average particle size distribution of the in-situ sand deposit, as derived from laboratory testing results, is shown in Table 5.2 below.
| | | | | | | | | | |
Table 5.2: Weighted Average Particle Size Distribution, by Site |
| | | | % Retained by Mesh Size |
Site | | > 40 | | 40/70 | | 70/140 | | 140/200 | | < 200 |
OnCore 1 | | 4 | | 54 | | 28 | | 2 | | 12 |
OnCore 2 | | 5 | | 43 | | 25 | | 3 | | 24 |
OnCore 2B | | 1 | | 28 | | 46 | | 7 | | 18 |
OnCore 3B | | 1 | | 47 | | 40 | | 4 | | 8 |
OnCore 4 | | 4 | | 46 | | 24 | | 6 | | 20 |
OnCore 5 | | 2 | | 33 | | 38 | | 5 | | 22 |
OnCore 6 | | 4 | | 38 | | 34 | | 6 | | 18 |
OnCore 7 | | 2 | | 55 | | 27 | | 2 | | 14 |
OnCore 8 | | 5 | | 45 | | 33 | | 3 | | 14 |
OnCore 9 | | 2 | | 34 | | 44 | | 3 | | 17 |
The preceding table highlights the relative fineness of the sand found within the subject OnCore sites, indicating most of the sand particles are concentrated between the “passing 40 mesh” and “retained by 140 mesh” size fraction. Accordingly, the OnCore sites produce a principal marketable “100 mesh” product.
As general customer specifications tend to adapt to the local sand characteristics, API/ISO testing for locally sourced frac sands has become less relevant over the past several years. However, it is still of value to be able to demonstrate that the frac sand produced at a mine meets specifications for certain well applications.
Atlas obtained various finished product loadout samples of finished product and composite drill hole samples from each OnCore site. These samples were delivered to PropTester for API/ISO frac sand analysis of frac sand characteristics. Additional turbidity testing is conducted in-house by Atlas as part of their quality control measures. The resulting proppant performance test results for each OnCore site are summarized in Table 5.3, below.
| | | | | | | | | | |
Table 5.3: Proppant Performance Test Results |
| | 100 Mesh* Sample Test Result |
| | | | | | Acid Solubility | | Turbidity | | K-Value |
Site | | Sphericity | | Roundness | | (%) | | (NTU) | | (000 psi) |
OnCore 1 | | 0.7 | | 0.6 | | 3.2 | | 354 | | 9 |
OnCore 2 | | 0.7 | | 0.6 | | 2.0 | | 423 | | 9 |
OnCore 2B | | 0.7 | | 0.7 | | 3.1 | | 29 | | 9 |
OnCore 3B | | 0.6 | | 0.6 | | 3.8 | | 28 | | 7 - 10 |
OnCore 4 | | 0.7 | | 0.6 | | 5.1 | | 724 | | 8 |
OnCore 5 | | 0.7 | | 0.6 | | 3.2 | | 432 | | 10 |
OnCore 6 | | 0.6 | | 0.6 | | 1.1 | | 764 | | 9 |
OnCore 7 | | 0.6 | | 0.6 | | 5.4 | | 364 | | 13 |
OnCore 8 | | 0.7 | | 0.7 | | 2.6 | | 14 | | 10 |
OnCore 9 | | 0.6 | | 0.6 | | 3.4 | | 310 | | 9 |
*100 mesh proppant sand material does not have an AP/ISO specification
While 100 mesh frac sands do not have API/ISO specifications, sample testing results, and Atlas’s demonstrated commercial success producing and selling frac sands from their various OnCore sites to local Permian Basin oil and gas producers suggest the sand has been shown to meet customer specifications.
For purposes of this report, BOYD did not verify historic drill hole data by conducting independent drilling in areas already explored. It is customary in preparing frac sand resource and reserve estimates to accept basic drilling and quality testing data as provided by the client, subject to the reported results being judged representative and reasonable.
BOYD’s efforts to judge the appropriateness and reasonability of the source exploration data included reviewing provided drilling logs, sampling procedures, sand quality testing results, and discussing related aspects of the OnCore deposits and processing operations with Atlas personnel.
5.5.Adequacy of Exploration and Sampling Data
BOYD’s review of the reported procedures indicate the exploration and sampling data obtained for the OnCore sites were: (1) carefully and professionally collected, prepared, and documented in conformance with general industry standards, and (2) are appropriate for use of evaluating and estimating frac sand resources and frac sand reserves. Similarly, BOYD’s review of testing data provided by Atlas suggests that the analyses completed are generally appropriate to determine frac sand characteristics and determine the subsequent quality of finished frac sand products. As such, it is BOYD’s opinion that the sampling data are also suitable for use in the estimation of frac sand resources and frac sand reserves on the various OnCore sites.
6.0 FRAC SAND RESOURCES AND RESERVES
6.1.Applicable Standards and Definitions
Unless otherwise stated, frac sand resource and frac sand reserve estimates disclosed herein are completed in accordance with the standards and definitions provided by S‑K 1300. It should be noted that BOYD considers the terms “mineral” and “frac sand” to be generally interchangeable within the relevant sections of S-K 1300.
Estimates of any mineral resources and reserves are always subject to a degree of uncertainty. The level of confidence that can be applied to a particular estimate is a function of, among other things: the amount, quality, and completeness of exploration data; the geological complexity of the deposit; and economic, legal, social, and environmental factors associated with mining the resource/reserve. By assignment, BOYD used the definitions provided in S-K 1300 to describe the degree of uncertainty associated with the estimates reported herein.
The definition of mineral (frac sand) resource provided by S-K 1300 is:
Mineral resource is a concentration or occurrence of material of economic interest in or on the Earth's crust in such form, grade or quality, and quantity that there are reasonable prospects for economic extraction. A mineral resource is a reasonable estimate of mineralization, taking into account relevant factors such as cut-off grade, likely mining dimensions, location or continuity, that, with the assumed and justifiable technical and economic conditions, is likely to, in whole or in part, become economically extractable. It is not merely an inventory of all mineralization drilled or sampled.
Estimates of frac sand resources are subdivided to reflect different levels of geological confidence into measured (highest geologic assurance), indicated, and inferred (lowest geologic assurance). Please refer to the Glossary of Abbreviations and Definitions for the meanings ascribed to these terms.
The definition of mineral (frac sand) reserve provided by S-K 1300 is:
Mineral reserve is an estimate of tonnage and grade or quality of indicated and measured mineral resources that, in the opinion of the qualified person, can be the basis of an economically viable project. More specifically, it is the economically mineable part of a measured or indicated mineral resource, which includes diluting materials and allowances for losses that may occur when the material is mined or extracted.
Estimates of frac sand reserves are subdivided to reflect geologic confidence, and potential uncertainties in the modifying factors, into proven (highest assurance) and probable. Please refer to the Glossary of Abbreviations and Definitions for the meanings ascribed to these terms.
Figure 6.1 shows the relationship between frac sand resources and frac sand reserves.
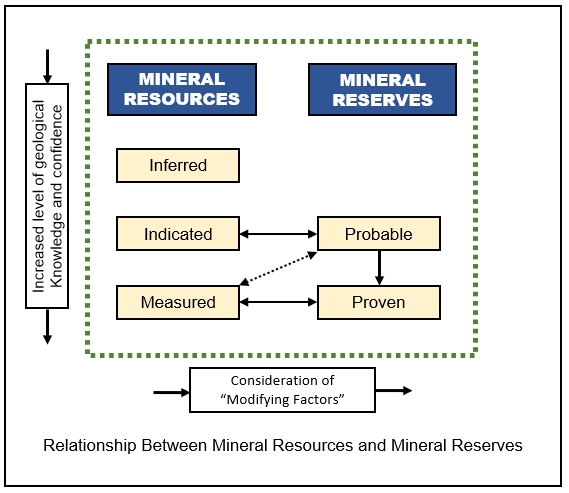
Figure 6.1: Relationship Between Frac Sand Resources and Frac Sand Reserves
In this report, the term “frac sand reserves” represent the tonnage of frac sand products that meet customer specifications and will be available for sale after processing of the
ROM sand.
BOYD independently prepared estimates of in-place frac sand for each of Atlas’s OnCore sites by performing the following tasks:
1.The top and bottom elevations of the mineable sand interval of each site was interpreted from drill hole records and sand particle size analyses. The sands mined at the various OnCore sites are generally present at the surface. As there is little-to-no overburden, the top of the mineable sand unit is considered to be the current ground surface or directly beneath a thin soil interval noted in drilling logs. The bottom of the mineable sand unit is delineated by the depth at which drilling was terminated, or an underlying caliche interval was encountered.
2.Interpreted drill hole records were compiled and validated. Strata thicknesses were aggregated, and sand particle size analyses of the sand unit were composited for each data point. The compiled drill hole data were then imported into either Carlson Software or Vulcan geologic modeling and mine planning software, both of which are geologic modeling and mine planning software suites that are widely used and accepted by the mining industry.
3.A geologic model of each site’s deposit was created using industry‑standard grid modeling methods well-suited for simple stratigraphic deposits. The geologic models delineate the top and bottom of the mineable sand horizon and the distribution of the product size fractions across each of the OnCore site deposits.
4.After reviewing the continuity and variability of each deposit, suitable resource classification criteria were developed and applied as per the discussion in Section 6.2.2.
5.Contiguous areas of remaining mineable sand within the various OnCore sites were delineated using the criteria described in Section 6.2.3, in addition to utilizing mapping of remaining mineable areas as provided by Atlas, as well as considering the following assumptions for each OnCore site:
a.Pit wall slopes of 3:1 (approximately 19 degrees).
b.Areas mined prior to December 31, 2024, were delineated from surveyed topography and/or aerial imagery and excluded from the estimates of frac sand resources.
6.In-place volumes for each of the remaining mining areas were calculated from the geologic model within the modeling software. A dry, in-place, bulk density of 100 pounds per cubic foot was used to calculate the in-place tonnage of frac sand.
7.Where warranted, adjustments are made to the estimates using production records to reconcile differences between the date of the ground survey/aerial imagery and the effective date of the estimates.
Geologic assuredness is established by the availability of both structural (thickness and elevation) and quality (size fraction) information for the deposit. Resource classification is generally based on the concentration or spacing of exploration data which can be used to demonstrate the geologic continuity of the deposit. When material variations in thickness, depth, and/or sand quality occur between drill holes, the allowable spacing distance between drill holes is reduced. The drill hole spacing criteria established by BOYD after a review of the available exploration data and geologic models and used to classify the frac sand resources of each OnCore site are provided in Table 6.1, below.
| | |
Table 6.1: Frac Sand Resource Classification Criteria |
| | |
Classification | | Nominal Maximum Spacing Requirment (ft) |
| | |
Measured | | 1,500 |
Indicated | | 2,500 |
Inferred | | 5,000 |
Extrapolation or projection of resources in any category beyond any data point does not
exceed half the point spacing distance.
The surficial sand deposits located on the OnCore sites are considered to be of low geologic complexity. We believe these criteria appropriately reflect their implied levels of geologic assurance with respect to the estimation of frac sand resources. Since sufficient drilling and sampling has been performed within the remaining mineable portions of each site, BOYD is of the opinion that there is a low degree of uncertainty associated with the estimates of frac sand resources provided herein.
6.2.3.Estimation Criteria
Development of the frac sand resource estimates for each OnCore site assume mining and processing methods and equipment that have been utilized by Atlas successfully at these types of operations for several years.
The target mining horizon at each of the OnCore sites generally manifests as a continuous, low rolling sand unit with relatively consistent depth, thickness, and quality on each site. There is little-to-no overburden, and the high-quality sand is easily distinguished from any waste units; as such, interpretation of the mineable horizon is relatively easy. The mined sand is processed to remove intervals of caliche and any out-sized material (i.e., sand which is either too coarse or silts/clays which are too fine to be sold) and produce saleable finished products. The amount of finished sand produced as a percentage of the raw sand mined is referred to as the processing yield (or plant yield), which is analogous to the “cut-off grade” of other mining operations. If the expected processing yield of the sand is too low, the costs of production will outweigh sales revenues and the deposit cannot be economically mined. The minimum economic processing yields range from approximately 30–40% based on Atlas’s historical and forecasted economics (refer to Chapters 10 through 12); however, this is well below the expected processing yields of each of the OnCore sand deposits. Other limiting criteria, such as minimum mining thicknesses or maximum stripping ratios (the ratio of waste to sand excavated) are generally not considered in the estimation of frac sand resources for the OnCore sites.
The limits of the frac sand resources are constrained to those portions of the interpreted sand deposit that:
•Are reasonably defined by available drilling and sampling data.
•Contain products that meet generally accepted specifications and can be sold at a profit (i.e., be economic).
•Honor any legal mining constraints (e.g., property boundaries, environmental setbacks, utility and infrastructure setbacks, etc.).
•Adhere to physical mining limitations.
Frac sand resources for the OnCore sites are assessed for reasonable prospects for eventual economic extraction by reporting: (1) those resources which have been subsequently converted to proppant sand reserves after the application of all material modifying factors, and/or (2) those resources which have similar characteristics (i.e., mining conditions, and expected processing yields and qualities) to those converted to frac sand reserves.
The criteria employed in developing the estimates of frac sand resources for each OnCore site are supported by historical results and align with those employed at similar operations. As such, it is BOYD’s opinion that the stated criteria are reasonable and appropriate for the estimation of frac sand resources at the OnCore sites.
6.2.4.Frac Sand Resource Estimate
There are no reportable frac sand resources excluding those converted to frac sand reserves for all of the OnCore sites. Quantities of frac sand controlled by Atlas within the defined boundaries of each OnCore site which are not reported as frac sand reserves, are not considered to have potential economic viability; as such, they are not reportable as frac sand resources.
BOYD independently estimated in-place frac sand resources for each OnCore site from the drilling, sampling, and testing data provided by Atlas. We have reviewed this information, on a representative basis, by confirming the accuracy of geologic model inputs by comparison with drilling logs and laboratory reports. We have developed stratigraphic grid models of the subject sand deposits and compared these with the provided exploration data. It is BOYD’s opinion that the geologic models are representative of the informing data and that the data are of sufficient quality to support the frac sand resources estimate provided herein. Furthermore, it is our opinion that the resource estimation methods and criteria employed are both appropriate and reasonable for these deposit types and proposed extraction methods.
Estimates of frac sand reserves for the OnCore sites were derived contemporaneously with estimates of frac sand resources. To derive an estimate of saleable product tons (frac sand reserves), a mining recovery and a processing recovery were applied to the in-place resource estimate. The mining recovery factor will determine the ROM sand tonnage that will be delivered to the processing facilities, while the processing yield accounts for the removal of out-sized (i.e., larger than 40 mesh and smaller than 140 mesh) material and losses during processing due to minor inefficiencies. Recoveries for each OnCore site were derived from sample sizing data, expected operating performance, and historical operating results, and are shown in Table 6.2 below:
| | | | | | |
Table 6.2: Mining and Processing Recoveries |
| | | | | | |
| | Recovery (%) |
Site | | Mining | | Processing | | Overall |
| | | | | | |
OnCore 1 | | 90 | | 80 | | 72 |
OnCore 2 | | 90 | | 81 | | 73 |
OnCore 2B | | 90 | | 73 | | 66 |
OnCore 3B | | 90 | | 67 | | 60 |
OnCore 4 | | 90 | | 65 | | 59 |
OnCore 5 | | 90 | | 69 | | 62 |
OnCore 6 | | 90 | | 66 | | 59 |
OnCore 7 | | 90 | | 64 | | 58 |
OnCore 8 | | 90 | | 76 | | 68 |
OnCore 9 | | 90 | | 75 | | 68 |
| | | | | | |
| | | | | | |
Average - All OnCore Plants | | 90 | | 71 | | 64 |
All of the estimated frac sand reserves are derived from either Measured frac sand resources or Indicated frac sand resources, in accordance with S-K 1300, and are therefore classified as either Proven or Probable frac sand reserves accordingly, after BOYD was satisfied that the frac sand reserve classification reflects the outcome of technical and economic studies. Figures 6.2 through 6.8, following this text, illustrate the reserve classifications of each OnCore site’s frac sand deposit.
6.3.3.Frac Sand Reserve Estimate
BOYD’s estimate of surface mineable frac sand reserves for the OnCore Plants totals nearly 59.7 million saleable product tons, as of December 31, 2024. The frac sand reserves reported in Table 6.3, below, are based on individual LOM plans which, in BOYD’s opinion, are technically achievable and economically viable after the consideration of all material modifying factors.
| | | | | | | | | | |
Table 6.3: Frac Sand Reserves (as of December 31, 2024) |
| | | | | | | | | | |
| | Mesh | | | | Product Tons (000) by Classification |
Plant | | Size | | Control | | Proven | | Probable | | Total |
| | | | | | | | | | |
OnCore 1 | | 40/140 | | Owned | | - | | 5,004 | | 5,004 |
| | | | Leased | | 2,028 | | - | | 2,028 |
| | | | Subtotal | | 2,028 | | 5,004 | | 7,032 |
OnCore 2 | | 40/140 | | Leased | | 375 | | - | | 375 |
OnCore 2B | | 40/140 | | Leased | | - | | 4,787 | | 4,787 |
OnCore 3B | | 40/140 | | Owned | | - | | 2,891 | | 2,891 |
OnCore 4 | | 40/140 | | Leased | | 1,681 | | 668 | | 2,349 |
OnCore 5 | | 40/140 | | Leased | | 3,442 | | 7,282 | | 10,724 |
OnCore 6 | | 40/140 | | Leased | | 4,322 | | - | | 4,322 |
OnCore 7 | | 40/140 | | Leased | | 3,120 | | 4,692 | | 7,812 |
OnCore 8 | | 40/140 | | Leased | | 4,660 | | - | | 4,660 |
OnCore 9 | | 40/140 | | Leased | | 13,679 | | 1,020 | | 14,699 |
Total | | | | | | 33,307 | | 26,344 | | 59,651 |
The frac sand reserves of the OnCore Plants are well-explored and defined. It is our conclusion that nearly 56% of the stated reserves can be classified in the Proven reliability category (the highest level of assurance) with the remainder classified as Probable.
Atlas’s OnCore Plants, and other frac sand mining operations in the area, have a well‑established history of mining and selling frac sand products into the local Permian Basin energy fields. BOYD has assessed that sufficient studies have been undertaken to enable the frac sand resources to be converted to frac sand reserves based on current and proposed operating methods and practices. Changes in the factors and assumptions employed in these studies may materially affect the frac sand reserve estimate.
The economic viability of the stated frac sand reserves is demonstrated by the production and financial projections and marketing information presented in Chapters 10 through 12 of this report. The forecasted sales prices used in the estimation of frac sand reserves for the OnCore Plants varies by location and year, ranging from $23.18 to $31.26 and averaging $24.83 per ton of finished frac sand over the expected life of the reserves (refer to Section 10.5 and Table 12.1 for further details).
6.3.4.Significant Risks and Uncertainties
The extent to which the frac sand reserves may be affected by any known geological, operational, environmental, permitting, legal, title, variation, socio-economic, marketing, political, or other relevant issues has been reviewed. If and as warranted. It is the opinion of BOYD that Atlas has appropriately mitigated, or has the operational acumen to mitigate, the risks associated with these factors. BOYD is not aware of any additional risks that could materially affect the development of the frac sand reserves.
Given the data available at the time this report was prepared, the estimates presented herein are considered reasonable. However, they should be accepted with the understanding that additional data and analysis available after the date of the estimate may result in a change to the current estimate. These revisions may be material.
Based on our independent estimate and operations review, we have a high degree of confidence that the estimates shown in this report accurately represent the available frac sand reserves controlled by Atlas at the OnCore Plants, as of December 31, 2024
6.3.5.Reconciliation with Previous Estimates
When comparing the OnCore Plants’ estimated frac sand reserves as of December 31, 2024, with those reported as of December 31, 2023, we note a net increase of approximately 12.5 million product tons, or 26.5%. As shown in Figure 6.9, on the following page, this increase is the direct result of: (1) the addition of the OnCore 9 Plant, (2) changes in property control and mine plans at the OnCore 1 Plant, and (3) depletion through ordinary mining operations and inventory sales.
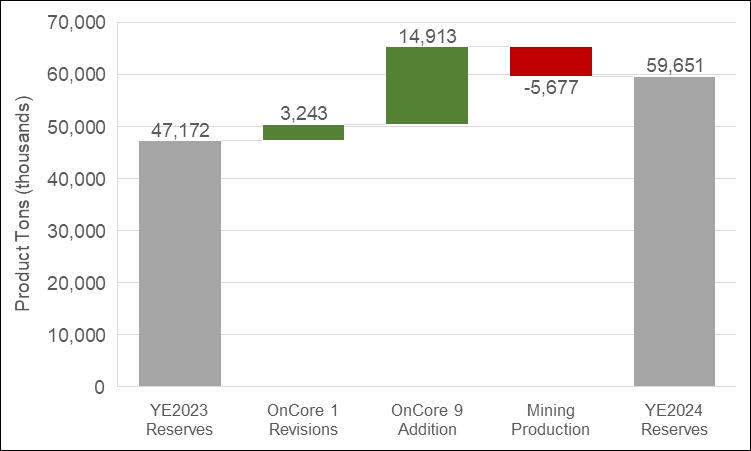
Figure 6.9: Reconciliation with Previous Frac Sand Reserves Estimate
\\jtb-7\boyd\eng_wp\3871.010 atlas - fy2024\wp\report\ch-6 - frac sand resources and reserves.docx
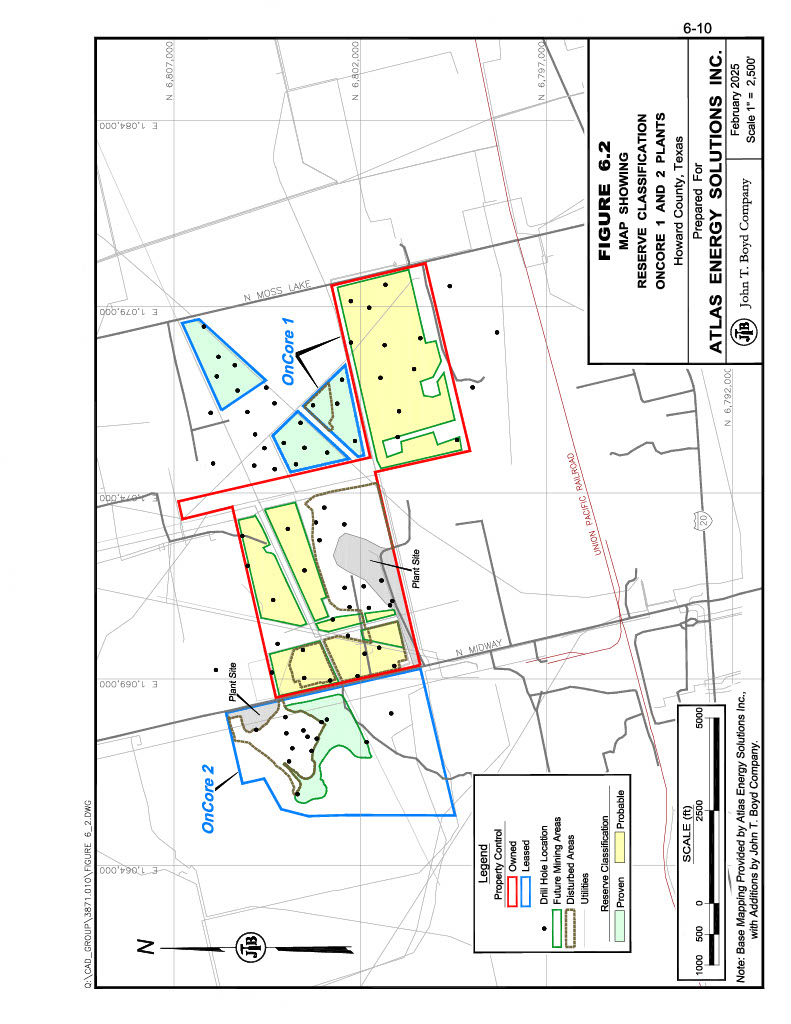
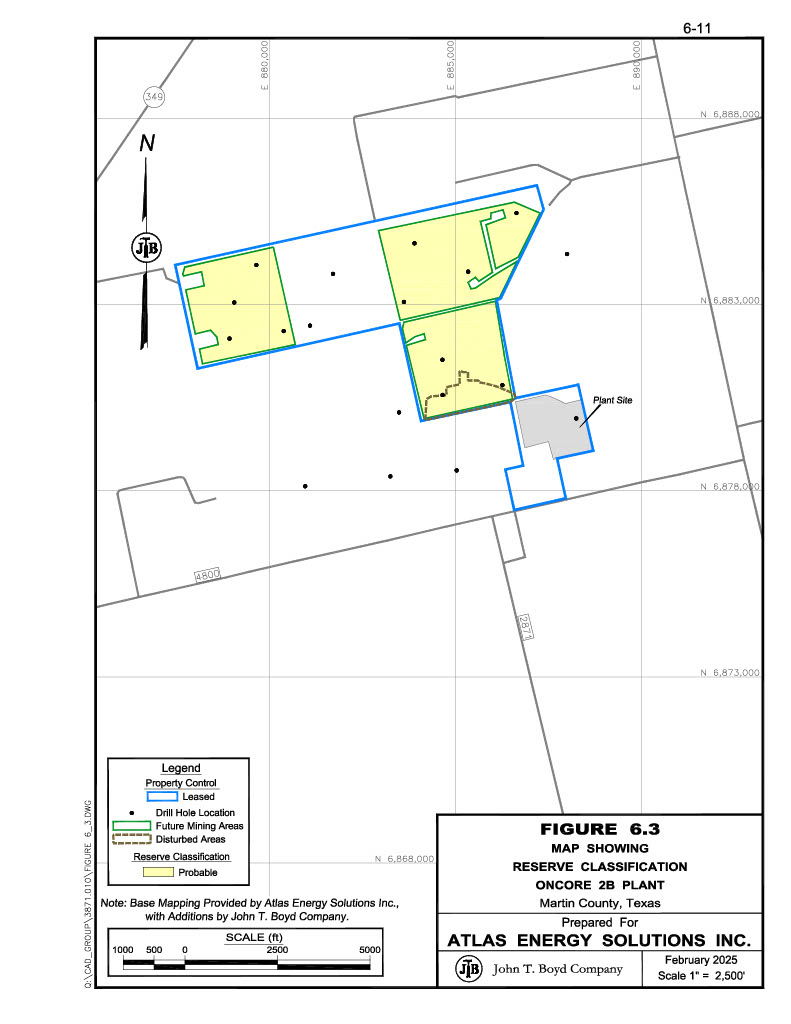
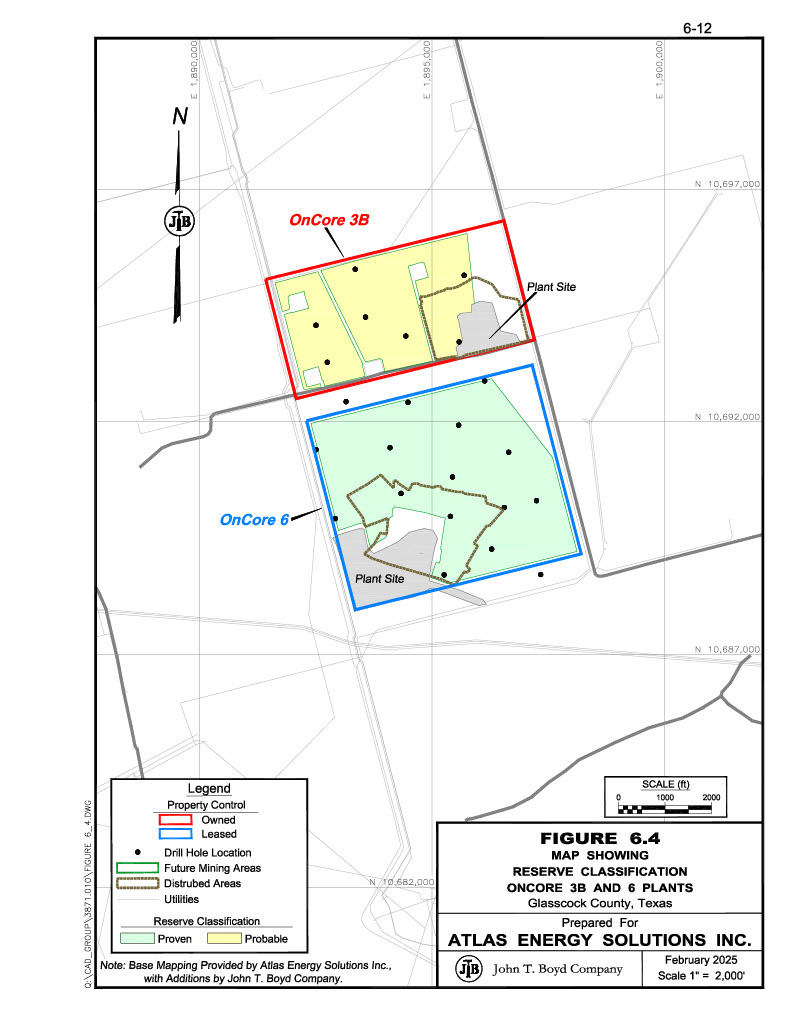
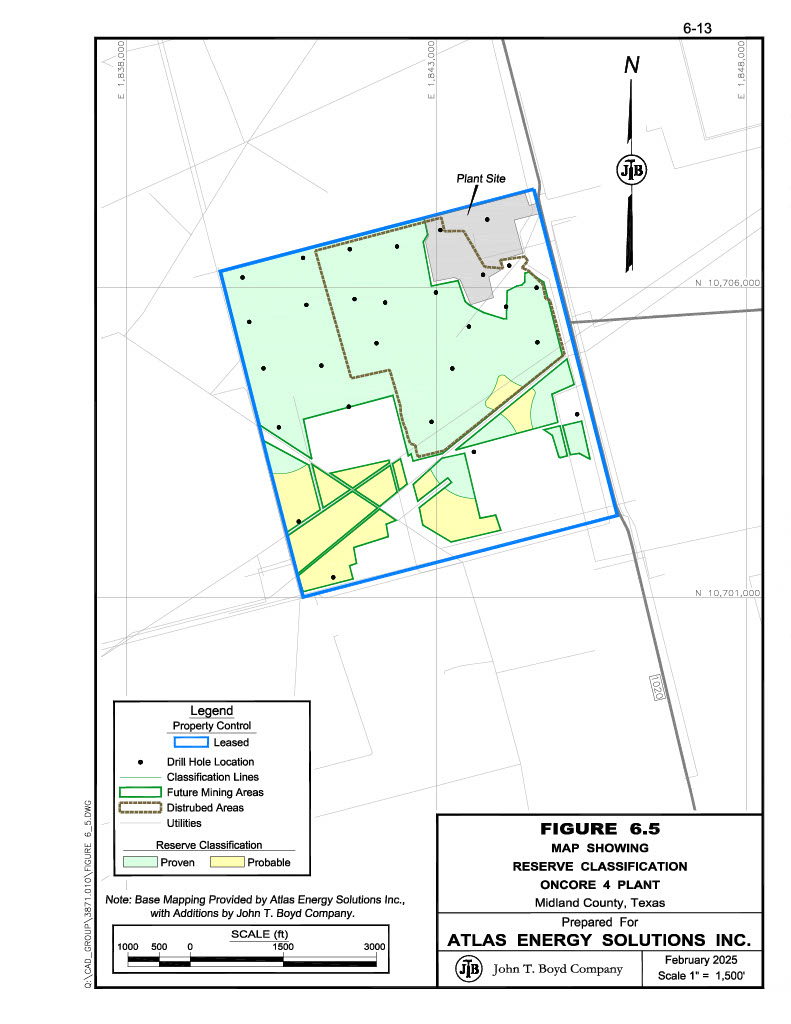
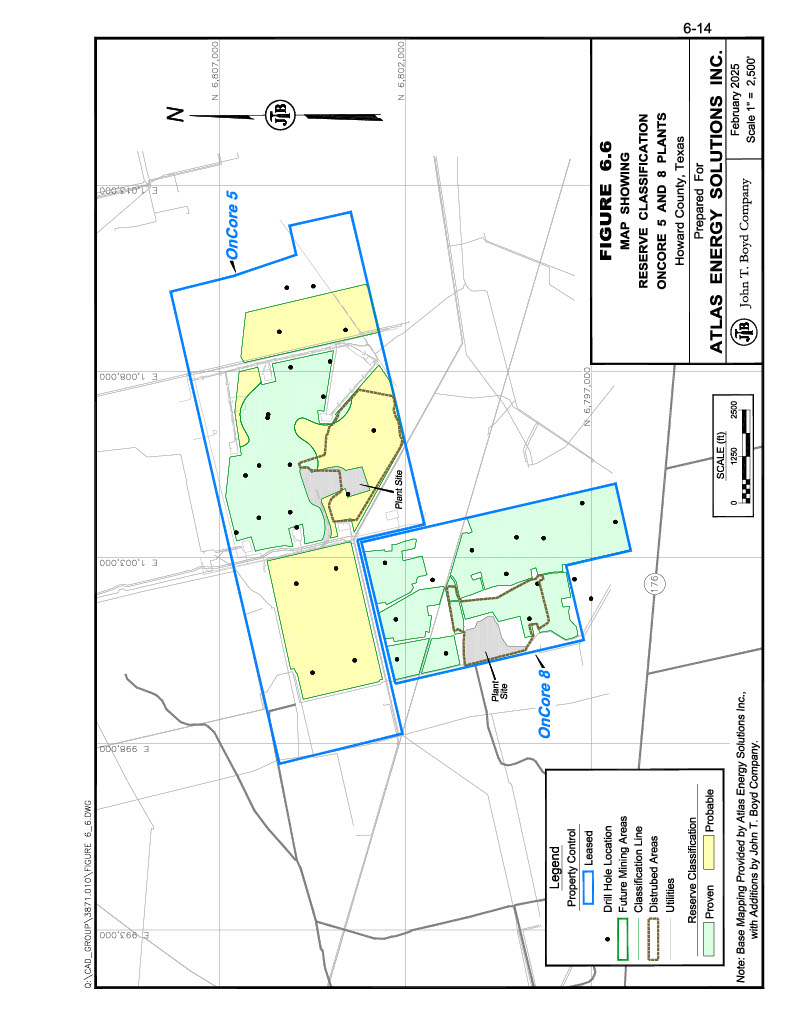
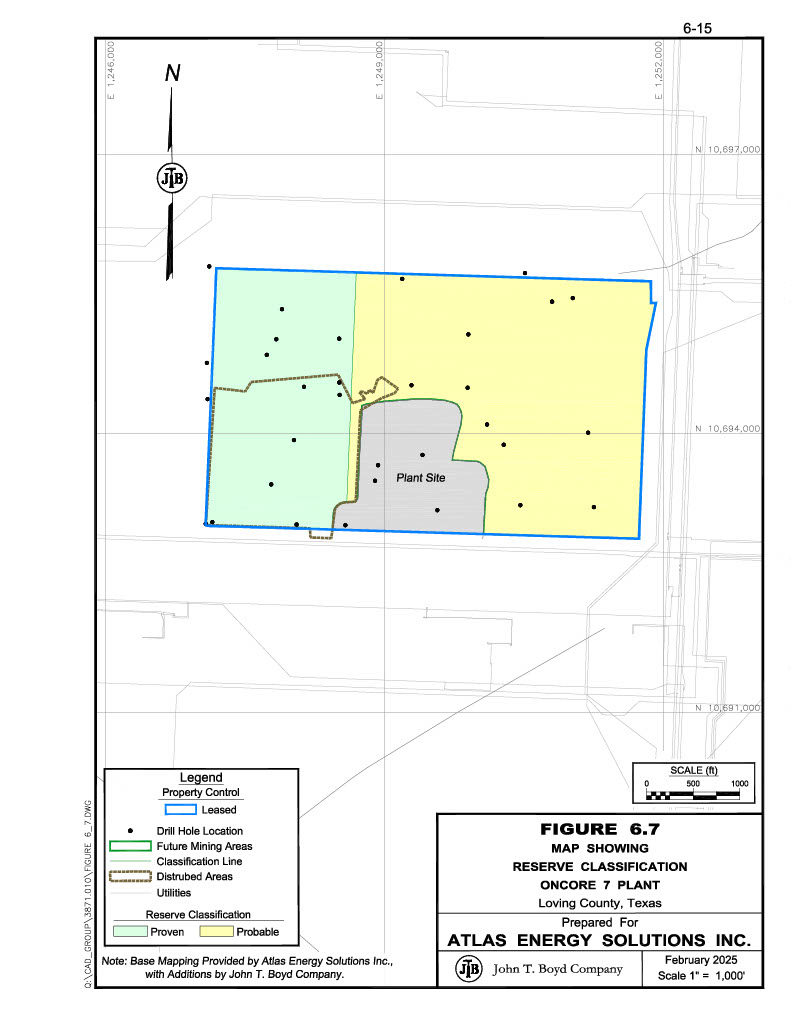
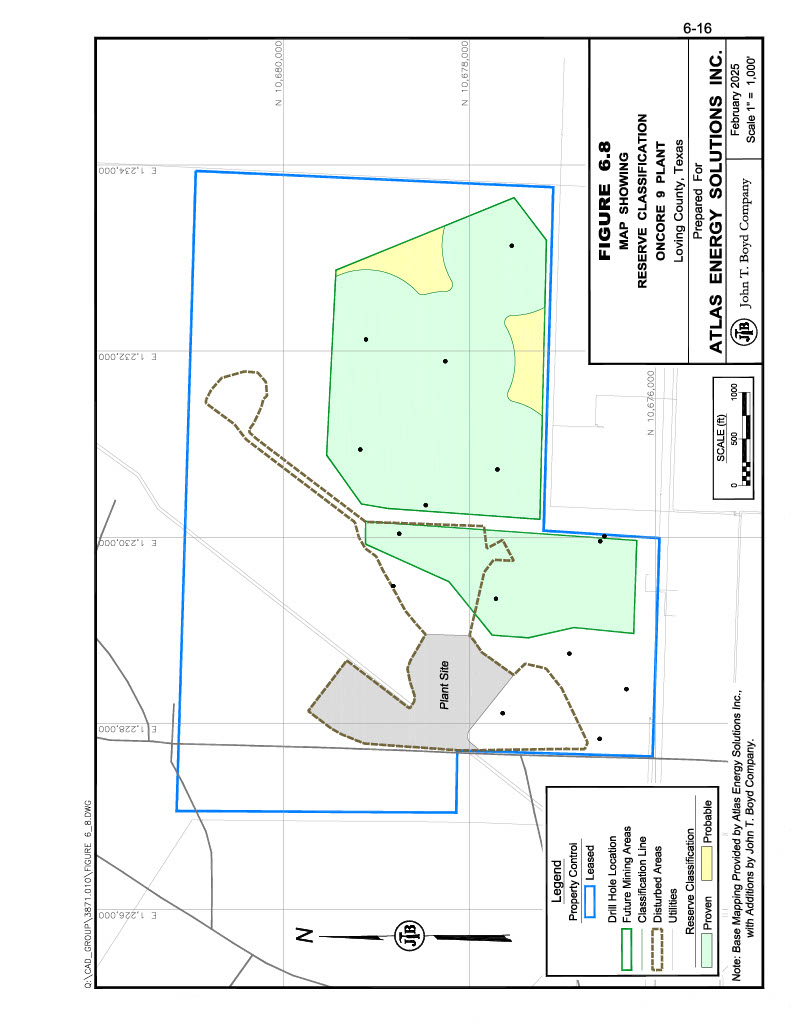
7.0 MINING OPERATIONS
The windblown sheet sands and sand dunes in and around the OnCore properties are loosely consolidated and generally overlain by very little overburden; characteristics which are amenable to the use of conventional surface mining techniques. Since most of the target sand formations are very shallow and do not extend below the water table, each is ‘dry-mined’ using medium-sized earthmoving equipment (i.e., haul trucks and excavators). Where the thickness of the sand deposits are greater than the digging depth of the excavating equipment, mining occurs in a series of benches arranged in a stair-like fashion to recover sand from the top of the formation (in elevation) down to the lowest practical elevation.
Most of the mineable areas have minimal overburden and vegetation; as such, sand excavation normally begins at the surface. Where present, overburden is stripped from the surface of the sand deposit utilizing bulldozers, loaders, excavators, and haul trucks. The overburden is placed away from the sand dunes in berms or stockpiles which will be planted (i.e., vegetated) to minimize erosion of the material after completion. Where present, interbedded waste material (e.g., caliche) is separably removed and stored elsewhere on the property or used in the construction of berms.
Drilling and blasting are not typically required for the loosely consolidated sand and waste material; however, drilling and blasting may be utilized,where warranted, to excavate hard materials (e.g., calcareous layers). Excavators and front-end loaders are used to load the mined or ROM sand material into articulated haul trucks, which transport the sand to a ROM stockpile near the processing plants.
Once the mineable interval of sand is excavated, some of the mined-out pits will be used to store reject material from the processing operations.
7.2.Mine Schedule, Equipment, and Staffing
Sand excavation at each of the OnCore operations is performed by outside earthmoving contractors. Each of the mining contractors is contractually obligated to supply their respective OnCore sand processing facilities with sufficient feed material to ensure continuous operations. Mining operations are conducted as required year-round but are generally restricted to 12 hours per day.
The primary mobile equipment involved in sand excavation, stockpiling, and hopper feeding includes:
•Articulated haul trucks,
•Water truck, motor grader, and other ancillary equipment.
Most of the mobile equipment fleets are owned and operated by the mining contractors. Regular and major repair maintenance of the fleets is also the contractors’ responsibility. If maintained in good condition, the mobile equipment fleets should be capable of achieving the production levels required by the LOM plans.
Staffing requirements for the mining operations are the responsibility of the earthmover contractors.
7.3.Engineering and Planning
The primary mine planning consideration for each operation is the safe, economical, and regular supply of raw high-quality sand feed to the processing plants. In commercial mining terms, the quantities of overburden removed, and sand mined each year at each of the OnCore Plants are considered modest. Each of the sand deposits affords easy access because of their shallow depth and large areal extent. As such, mining plans for the OnCore operations are relatively simple and very flexible; able to be modified based on demand in a relatively short time frame.
Geotechnically, the sand deposits are relatively competent, and the mining depths are so shallow that slumping, or collapsing, has not been and is not expected to be a detriment to the mining process. The pit design parameters utilized at each of the operations have been used with success at similar sand mining operations for many years.
Excessive inflow of groundwater into the mining pits is not expected. As such, dewatering before or during mining activities should be manageable with drainage ditches and sumps. Flood waters from localized flash floods are a manageable risk. Onsite water ponds can be used to hold any excessive ground or storm water.
7.4.Mining Sequence and Production
The areal extents of the remaining mining areas (as shown in Figures 6.2 to 6.8, on pages 6-9 to 6-15) and the geologic characteristics of the sand deposits afford the OnCore operations some degree of operational and planning flexibility. Generally, mining operations are expected to advance in blocks outwards from their respective processing plants to reduce haul distances and expand waste storage capacity.
As previously mentioned, the key driver of the mining operations is the adequate supply of feed material to the OnCore processing plants. Mine production requirements and expected mine life for each of the OnCore sites is shown in Table 7.1. below.
| | | | | | |
Table 7.1: Annual Production Requirements and Expected Mine Life |
| | Annual Tons (000) | | Expacted Mine Life |
Site | | ROM | | Product | | (years) |
OnCore 1 (inc. OnCore2) | | 975 | | 780 | | 10 |
OnCore 2B | | 1,111 | | 810 | | 6 |
OnCore 3B | | 896 | | 600 | | 5 |
OnCore 4 | | 737 | | 480 | | 5 |
OnCore 5 | | 1,171 | | 810 | | 14 |
OnCore 6 | | 1,002 | | 660 | | 7 |
OnCore 7 | | 1,132 | | 720 | | 11 |
OnCore 8 | | 2,359 | | 1,800 | | 3 |
OnCore 9 | | 997 | | 750 | | 21 |
In 2024, almost 7.9 million tons of raw sand were excavated at the nine active OnCore operations. This was up 39% (or 2.2 million tons) from the previous year when only seven OnCore sites were active. With the commissioning of OnCore 8 and OnCore 9
during 2024, Atlas plans to mine almost 10 million tons of raw sand in 2025, as shown in Figure 7.1, below.
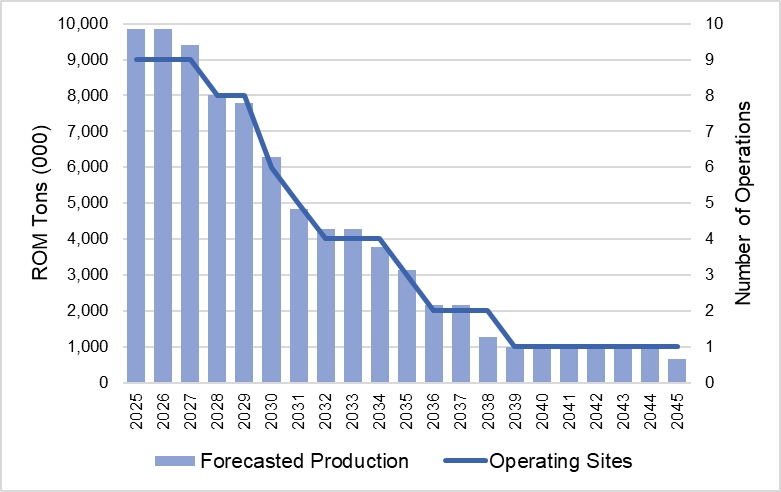
Figure 7.1: LOM Forecasted Mining Production
Future mine production, and hence the longevity of the mines, is directly related to the energy market demand for proppant sand. Actual yearly production volumes may, and are likely to, fluctuate significantly based on this demand. The presented LOM plans are based on Atlas’s controlled (via lease or service agreement) frac sand reserves. Atlas actively investigates additional sand deposits to utilize their OnCore fleet of mobile processing plants; however, there is no guarantee that additional frac resources or reserves will be available for Atlas to acquire.
It is BOYD’s opinion that the forecasted production levels for the OnCore Plants—both individually and collectively—are reasonable, logical, and consistent with typical surface sand mining practices in the region.
Surface mines face two primary types of operational risks. The first category of risk includes those daily variations in physical mining conditions, mechanical failures, and operational activities that can temporarily disrupt production activities. These conditions/circumstances can adversely affect production on any given day but are not regarded as “risk issues” relative to the long-term operation of the mine. Instead, these are considered “nuisances” that, while undesirable, are encountered on a periodic basis at many mining operations. BOYD does not regard these issues as being material to the OnCore Plants’ operations or otherwise compromising its forecasted performance.
The second type of risk is categorized as “event risk”. Items in this category are rare, but significant, occurrences that ultimately have a pronounced impact on production activities and corresponding financial outcomes. Examples of event risks are major fires or explosions, floods, or unforeseen geological anomalies that disrupt extensive areas of proposed or operating mine workings and require alterations of mining plans. Such an event can result in the cessation of production activities for an undefined but extended period (measured in months, and perhaps years) and/or result in the sterilization of frac sand reserves. This type of risk is minimal in a relatively simple surface frac sand mining operations such as those of the OnCore Plants.
8.0 PROCESSING OPERATIONS
The OnCore Plants comprise eight smaller mobile wet processing plants and one larger modular wet processing plant. The OnCore operations predominantly produce wet “100 mesh” (i.e., 40/140 to 40/200 mesh) frac sand—that is, the sand is not dried and particles larger than 40 mesh and smaller than 140-to-200 mesh are not considered finished product and are discarded as waste.
The small, built-for-purpose mobile OnCore Plants allow Atlas to move sand mining and processing operations from site to site as deposits are depleted. Indeed, Atlas moved two plants in 2024—one from the nearly exhausted OnCore 2 site to the previously unmined OnCore 2B site, and one from the recently exhausted OnCore 3 site to the previously unmined OnCore 3B site. The One newly-constructed mobile plant was deployed in 2024 to the previously unmined OnCore 9 site. The larger modular plant at OnCore 8 began production in May 2024. Table 7.1., below, provides the start-up (or commissioning) date for each of the OnCore Plants.
| | | | |
Table 8.1: OnCore Plant Commisioning Dates |
Plant | | Type | | Commisioned |
OnCore 1 | | Mobile | | September 2020 |
OnCore 2B (f/k/a OnCore 2) | | Mobile | | April 2020 |
OnCore 3B (f/k/a OnCore 3) | | Mobile | | February 2022 |
OnCore 4 | | Mobile | | July 2022 |
OnCore 5 | | Mobile | | October 2022 |
OnCore 6 | | Mobile | | May 2023 |
OnCore 7 | | Mobile | | July 2023 |
OnCore 8 | | Modular | | May 2024 |
OnCore 9 | | Mobile | | July 2024 |
The eight mobile plants were constructed by Superior Industries, Inc. (Superior). While the plants share nearly identical designs, the latter plants incorporate changes made to the early models to improve production. Each of the mobile processing plants has a nominal (or “nameplate”) capacity of 130 feed tons per hour (tph), which equates to approximately 700,000 to 900,000 tons of finished frac sand per year, depending on the expected processing yields of the sand deposits.
Designed by Superior, the OnCore 8 modular processing plant is larger capacity plant consisting of two 250-tph parallel circuits providing a nameplate capacity of 500 tph of feed sand or approximately 3 million tons of finished frac sand per year. The parallel circuit arrangement offers a degree of flexibility as one plant circuit can be idled for maintenance, while the other is operating.
Each of the OnCore Plants’ processing operations comprise two major components which are typical in the production of wet frac sand. These components include:
•Wet Plant – ROM material from the pit is delivered to the wet plant where the coarse material (e.g., gravel) and fine material (e.g., fine sand and silt) is removed from the sand.
•Storage and Loadout – Finished damp sand products are stored in stockpiles resting on a water decant system, where the sand is allowed to dry somewhat. The frac sand is then loaded into feed hoppers, conveyed to a discharge hopper, and loaded into trucks resting on weighing scales.
Each wet plant receives its raw sand feed from a ROM stockpile which is supplied by the mine. A front-end loader loads the ROM sand into a grizzly or scalping screen feed hopper. The oversized material is screened out and the remaining sand is mixed with water to be pumped to and processed through the wet plant.
The wet plants do not crush the material, but instead scrub (i.e., wash) and classify (i.e., size) the raw sand. During this process, a screen removes the plus 25 mesh top size or oversize material, and cyclones deslime and remove the minus 200 mesh material. Dewatering screens are used to remove excess moisture. The resultant minus 200 mesh material is stockpiled on a water decant system which reduces the sand’s moisture content prior to shipping to the customer.
The waste wash/process water is directed to a thickener and then to one or more settling ponds. Chemical flocculant is added as the water is discharged into the retention ponds to aid with particle settling. Water used for the wet plant processing is recycled as it is sourced from a lined retention pond. The closed-loop process water circuit provides for efficient use of water as the majority is collected and recycled in the process. Water conservation is a high priority at the operation. The wet plants typically operate 24 hours per day, 7 days per week.
Combined, the OnCore Plants have a nameplate capacity of approximately 8 million tons of wet 100 mesh frac sand per year based on operating 24 hours a day and nearly 365 days per year. Forecasted production over the expected life of the operations is provided in Figure 8.1, below.
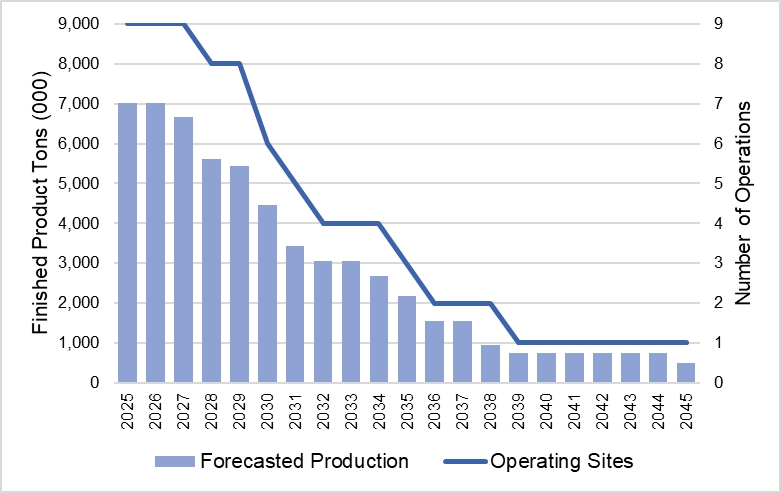
Figure 8.1: LOM Forecasted Processing Plant Production
As shown, the OnCore Plants plan to produce approximately 7 million tons wet frac sand when all nine plants are active. However, annual finished product volumes will depend on market demand and may fluctuate substantially. The presented LOM production plans are based on Atlas’s controlled (via lease or service agreement) frac sand reserves. Atlas actively investigates additional sand deposits to exploit with their OnCore fleet of mobile processing plants; however, there is no guarantee that additional frac resources or reserves will be available for Atlas to acquire.
BOYD is unaware of any reported interruptions, outages, shortages, or failures related to processing operations that have materially affected the OnCore Plants. Given the operation is well-established, we believe the risk of such events materially affecting the estimates of frac sand reserves presented herein is low.
Based on our review, it is BOYD’s opinion that the processing methods and existing equipment at the plant are sufficient for the forecasted production of finished frac sand products.
9.0 MINE INFRASTRUCTURE
All of the basic infrastructure required for the ongoing operations at the active OnCore sites is in place. Construction or installation of infrastructure at OnCore 2B, OnCore 3B, OnCore 8, and OnCore 9 was completed in 2024 during or prior to plant commisionings at each site. Figures 3.1 through 3.6 (pages 3-3 to 3-8) illustrate the general layout of the infrastructure at each of the OnCore operations.
Given the size and simplicity of the mining and processing operations at each of the OnCore sites, infrastructure requirements are relatively simple. Each site appears to have the necessary capacity/capabilities to support their respective near-term operating plans. Operational preference may lead to the upgrading of some existing facilities if warranted.
BOYD is unaware of any reported interruptions, outages, shortages, or failures related to infrastructure requirements that have materially affected the OnCore operations. Given Atlas’s operational experience and that most of the operations are well-established, we believe the risk of such events materially affecting the estimates of frac sand reserves presented herein is low.
Each of the OnCore sites is serviced by several roads maintained by the local municipality, county, and state governments. These roads are either paved or well‑maintained graded roadways. Road access is available year-round.
There is not any rail infrastructure available at any of the OnCore sites. All products are shipped via bulk trucks. Transloading would be required to use existing rail networks. Atlas plans to continue to transport their products from the OnCore Plants via road.
The OnCore facilities are serviced by three-phase electric power. Substations access 138 kV lines and step voltage down to 12.5 kV lines which deliver power to each the processing plants.
The wash process water is recycled after fines are removed via settling with a flocculent in a series of constructed ponds. As the mine progresses, silt ponds are constructed in mined-out areas. Additional makeup water is obtained from wellfields near the plants or purchased from water suppliers.
Wastewater from offices and other buildings is collected via holding tanks and disposed of on a regular basis. Potable water is provided by the public water system.
The mining and processing of frac sand at each of the OnCore operations creates a substantial volume of tailings (i.e., waste material). These tailings are typically a mixture of clay, very fine sand, and other non-silica minerals. Tailings are typically disposed of in ponds (i.e., former mining pits) where the solid materials settle to the bottom and water is recovered for reuse. As mining progresses, depleted pits will become new tailings disposal sites. Freshwater ponds are maintained on the property so water can be stored after processing through the tailings ponds.
10.0 MARKET ANALYSIS
10.1.Market Overview and Outlook
The Permian Basin’s (Permian) frac sand market is driven by unconventional horizontal drilling in the oil and gas industry. In the late 1990s, rapid advances in horizontal drilling and hydraulic fracturing (fracking) in North America ushered in large-scale commercial oil and gas production. This fracking technique has been increasingly successful and modified over time to extract oil and gas held in dense layers of shale rocks, whose low permeability had previously prevented the flow of hydrocarbons.
Hydraulic fracturing uses a mixture of water, chemicals, and proppant (natural sand or man-made sand-like substances) to fracture shale rock and release hydrocarbons such as oil, natural gas, and natural gas liquids. The proppant acts to keep the fractures open (prop) while the pressurized fluids flow back up the well piping. Wells have become more productive with the addition of horizontal drilling capabilities, longer lateral lengths, and multi-stage fracks.
North America’s shale oil industry’s growing competitiveness gained through continuous technology improvement and falling production costs have had major implications on the global energy market. Oilfield service companies, including frac sand producers, made significant efficiency gains in 2020 to survive lower commodity prices because of the COVID-19 pandemic. These gains have followed through to the present day.
Figure 10.1, on the following page, illustrates the New York Mercantile Exchange’s (NYMEX) West Texas Intermediate (WTI) Crude Oil Annual Average Futures Price at year-end 2024. We estimate breakeven pricing for unconventional oil wells in the Permian to be in the $30 to $40 per barrel range. WTI futures estimate pricing to generally be in the $63 to $70 range through 2030. This cost and pricing combination supports positive wellfield economics and thus frac sand consumption.
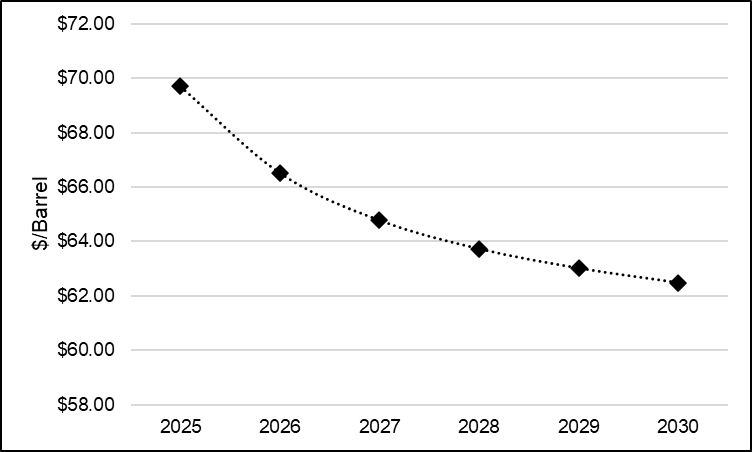
Source: Factset (provided by Atlas)
Figure 10.1: WTI Crude Oil Futures Price
Figure 10.2, on the following page, is compiled from downloaded and processed publicly available data from regulatory bodies, such as the Railroad Commission of Texas (RCC), for horizontal oil and gas well drilling permits in the U.S. This data shows a steady level of permitting activity across the U.S. over the past two years. It is important to note in this figure that most of the permits are based in the Permian region (with an average slightly above 50% of all permits).
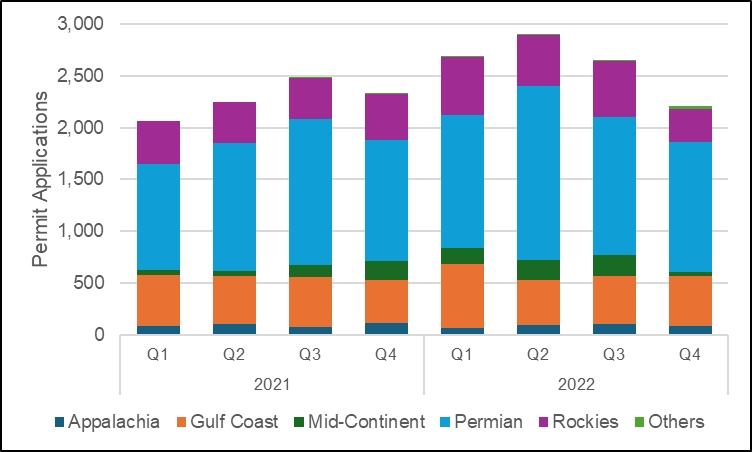
Source: Enverus (provided by Atlas)
Figure 10.2: U.S. Horizontal Drilling Permits by Region
While Permian horizontal rig counts were down approximately 8% in 2024 relative to 2023, crude oil production in millions of barrels per day (Mbbl/d) and natural gas production in billions of cubic feet per day (Bcf/d) in the region are up 6% and 13%, respectively.
As figures 10.3 and 10.4, below, illustrate Permian production is reaching multi‑year highs for both crude oil and natural gas.
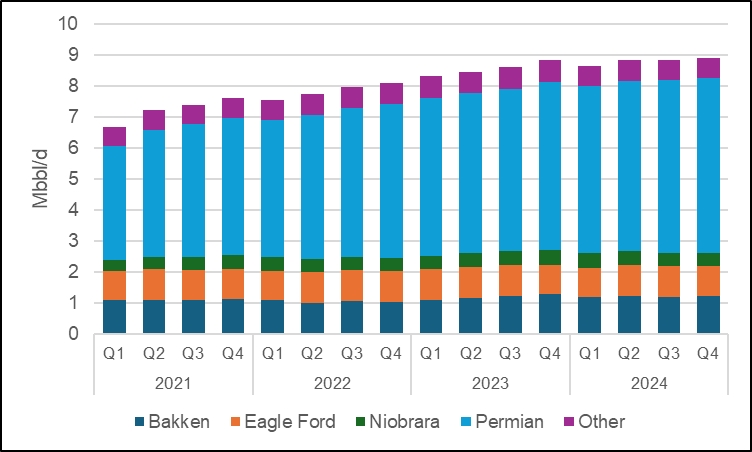
Source: EIA
Figure 10.3: U.S. Oil Production from Shale and Tight Formations
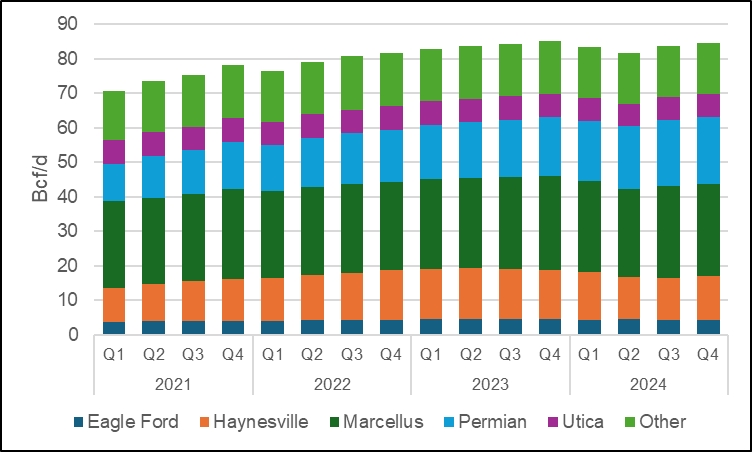
Source: EIA
Figure 10.4: U.S. Natural Gas Production from Shale and Tight Formations
The EIA reports that the inventory of drilled but uncompleted wells (DUCs) in all regions have declined 38% since the 1st quarter of 2021 (refer to Figure 10.5 for all U.S. regions, and Figure 10.6 for the Permian, below).
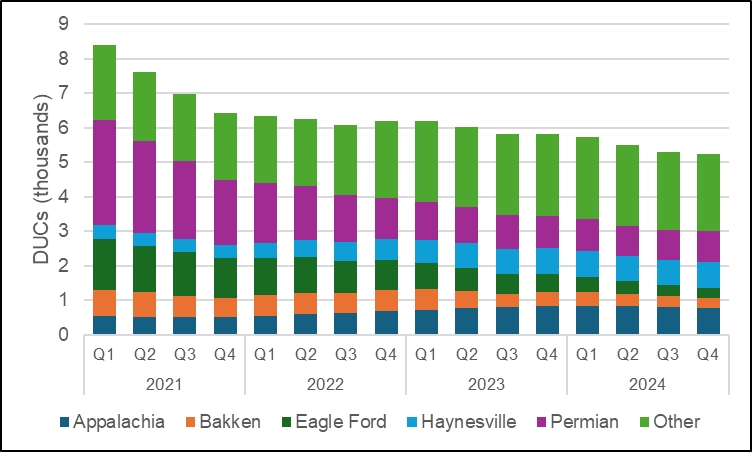
Source: EIA
Figure 10.5: U.S. Drilled but Uncompleted Wells
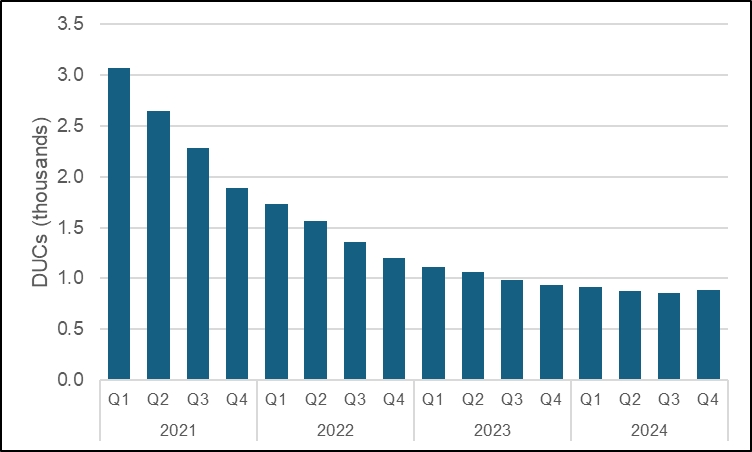
Source: EIA
Figure 10.6: Permian Drilled but Uncompleted Wells
Consequently, with increases in production and well completions, activity at frac sand mines has correspondingly increased in the Permian. According to MSHA, employee-hours have doubled from the 1st quarter of 2021 through 3rd quarter of 2024. This data is presented in Figure 10.7, below.
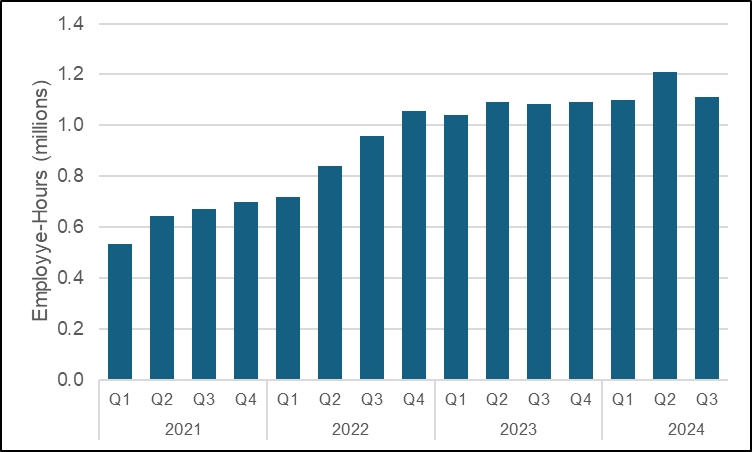
Source: MSHA
Figure 10.7: Permian In-Basin Mine Employee-Hours (Quarterly)
Industry research speculates that total in-basin mine hours, as of 3rd quarter 2024, are at the same level as the highs set in 2019. Mine hours serve as a directional indicator that dovetails with previous crude oil and natural gas production and DUC data. Current frac sand production in the Permian is estimated to be in the 65 million to 70 million tons per year range, with fairly well-balanced demand and stable pricing. BOYD anticipates frac sand pricing stabilizing substantially above the pricing used in this report. Additionally, we anticipate continued upward sand consumption in the Permian due to economic and geopolitical influences on energy demand.
Primarily, Atlas supplies a range of frac sand products to major oilfield services companies and E&P companies operating in the Permian Basin. In addition to their facilities in Kermit and Monahans, Atlas operates eight smaller, built-for-purpose mobile processing plants and one modular processing facility, collectively referred to as the OnCore Plants. The OnCore Plants exclusively produce wet “100 mesh” frac sand—a damp (i.e., undried) frac sand in the 40/140 to 40/200 mesh range.
Recent historical sales data provided by Atlas for the OnCore Plants are summarized in Table 10.1, below.
| | | | | | | | | | | | |
Table 10.1: Historical Sales Data |
| | | | | | | | | | | | |
| | Units | | 2020 | | 2021 | | 2022 | | 2023 | | 2024 |
Operating OnCore Plants | | | | 1 | | 2 | | 4 | | 7 | | 9 |
Product Sales | | 000 tons | | 137 | | 1,004 | | 2,209 | | 4,664 | | 6,003 |
Average Selling Price | | $/ton sold | | 11.50 | | 12.86 | | 17.00 | | 21.04 | | 22.84 |
Frac sand demand dropped in 2020, as compared to 2019, due to the COVID-19 pandemic. However, recovery began in the fourth quarter of 2020 and demand has remained consistent through 2024. Sales volumes and selling prices for the OnCore Plants’ frac sand have increased year-over-year for the last five years.
Atlas has structured long-term contracts with most of its customers outlining volume commitments and, in some cases, fixed pricing. Atlas also services customers on a spot basis where volume thresholds are not set, and orders are serviced on an as‑available basis at prevailing market prices. The majority of tons sold from the individual OnCore Plants are delivered to one customer only—especially, when the mobile plant operates on the customer’s land. Historically, the top-five customers by sales revenue account for approximately 90% to 100% of total sales from the OnCore Plants annually.
10.3.Market Entry Strategies
As an existing producer with a lengthy commercial history and established customer base, it is BOYD’s opinion that market entry strategies are not required for continued sale of the OnCore Plants’ frac sand products.
BOYD’s projections of sales volumes and frac sand prices for the OnCore Plants are informed by Atlas’s historical operating results, their short-term budget forecasts, and our knowledge of frac sand markets. Forecasted prices are based on sales of 100 mesh
finished frac sand products. Our frac sand sales forecast for the OnCore Plants is provided in Table 10.2, below.
| | | | |
Table 10.2: Frac Sand Sales Forecast |
| | | | |
Year(s) | | Sales (000 tons) | | ASP ($/ton) |
| | | | |
2025 | | 7,010 | | 23.18 |
2026 | | 7,010 | | 23.18 |
2027 | | 6,670 | | 23.68 |
2028 | | 5,610 | | 23.81 |
2029 | | 5,450 | | 23.87 |
2030 | | 4,457 | | 24.32 |
2031 | | 3,422 | | 24.98 |
2032 | | 3,060 | | 24.97 |
2033 | | 3,060 | | 24.97 |
2034 | | 2,667 | | 25.87 |
2035 | | 2,172 | | 26.80 |
2036 | | 1,560 | | 24.76 |
2037 | | 1,560 | | 24.76 |
2038 | | 944 | | 28.69 |
2039 | | 750 | | 31.26 |
2040-2050 | | 4,249 | | 31.26 |
Total | | 59,651 | | |
Minimum | | | | 23.18 |
Maximum | | | | 31.26 |
Average | | | | 24.83 |
As previously mentioned, some of the OnCore Plants operate under service agreements to mine, process, and deliver finished frac sand to the landowner—an E&P company. These service agreements are structured long-term contracts outlining volume commitments and, in some cases, fixed pricing. Generally, the service agreements do not preclude the sale of finished frac sand to third parties, as long as contracted volume commitments are satisfied.
11.0 CAPITAL AND OPERATING COSTS
11.1.Historical Financial Performance
All the OnCore Plants operate in a common regional market and are in the same business division within Atlas. Atlas generally accounts for the historical and projected financial performance of the OnCore Plants on a consolidated basis; however, detailed financial records are maintained for each operation.
Table 11.1 summarizes the past four years of financial data for the OnCore Plants on a consolidated basis. It should be recognized that: (1) the first OnCore plant (OnCore 1) began operation in 2020, and (2) the COVID-19 pandemic caused severe economic, market, and other disruptions which affected frac sand sales during 2020 and 2021.
| | | | | | | | | | | | |
Table 11.1: Historical Financial |
| | | | | | | | | | | | |
| | Units | | 2020 | | 2021 | | 2022 | | 2023 | | 2024 |
| | | | | | | | | | | | |
Frac Sand Sales | | 000 tons | | 137 | | 1,004 | | 2,209 | | 4,664 | | 6,003 |
| | | | | | | | | | | | |
Gross Revenues | | $ 000 | | 1,571 | | 12,906 | | 37,542 | | 98,145 | | 137,083 |
Average Selling Price | | $/ton sold | | 11.50 | | 12.86 | | 17.00 | | 21.04 | | 22.84 |
| | | | | | | | | | | | |
Cost of Goods Sold | | $ 000 | | 1,536 | | 11,340 | | 27,947 | | 47,104 | | 77,277 |
Average Cost of Goods Sold | | $/ton sold | | 11.24 | | 11.30 | | 12.65 | | 10.10 | | 12.87 |
| | | | | | | | | | | | |
Capital Expenditures | | $ 000 | | 2,417 | | 4,926 | | 31,573 | | 32,482 | | 49,138 |
The total cash cost of goods sold includes operating costs (i.e., mining, ongoing reclamation, processing, product loadout, and other related costs), in addition to selling, general, and administrative expenses.
Based on the financial data presented above:
•ASP increased from $11.50 per ton sold in 2020 to $22.84 per ton in 2024, averaging $20.49 per ton over the last five years.
•ACS has remained relatively consistent, ranging from $10.10 to $12.87 per ton sold and averaging $11.79 per ton sold, over the last five years.
•Gross profit margin has been positive every year and was 43.6% in 2024.
The production and unit cost estimates for the OnCore Plants are informed by Atlas’s historical performance and internal budget forecasts, in combination with BOYD’s familiarity with mining costs at similar operations. Operating volumes are well‑defined and understood, as are mining and processing productivities at the OnCore operations. As such, it is BOYD’s opinion that the production and financial projections are reasonable and are likely to be within ±20% accuracy level.
This section contains forward-looking information related to capital and operating cost estimates for the OnCore Plants. There are inherent known and unknown risks and uncertainties associated with all mining operations. These risks, uncertainties, and other factors are not quantifiable, but include, but are not limited to, adverse general economic conditions, operating hazards, inherent uncertainties in interpreting engineering and geologic data, fluctuations in commodity prices and prices for operational services, government regulation and political risks, as well as other risks commonly associated with the mining industry.
11.2.1.Projected Capital Expenditures
Projected capital expenditures for the OnCore Plants fall into two general categories: (1) growth or expansion outlays to increase production, and (2) sustaining or maintenance expenses to replace or repair assets to ensure continued production. The timing and amount of these capital expenditures are expected to be largely discretionary and within Atlas’s control.
Growth/expansion capital expenditures include allocations for: (1) construction of mud ponds at each operating site and other minor construction projects, and (2) purchase of sump pumps. Atlas’s capital expenditure budget for 2025 is provided in Table 11.2, below.
| | |
Table 11.2: Capital Expenditures Budget for 2025 |
Project/Site | | Budget ($ 000) |
Construction/Sitework | | 4,417 |
Equipment | | 312 |
Total | | 4,729 |
OnCore’s processing plants are already in-service and should not require any near-term major capital investment to maintain full commercial production. BOYD projected sustaining capital expenditures at a unit cost of $1.00 per ton sold, this includes maintenance of production equipment, as well as other items, for the operations. This factor is based on our professional judgment and experience with similar operations and reflects the expected life span of the OnCore processing plants and related infrastructure.
11.2.2.Projected Operating Costs
Operating cost estimates were developed based on recent actual costs and considering specific operational activity levels and cost drivers. The estimates consider current and expected labor headcount and salaries, major consumables and unit prices, power costs, and equipment and maintenance costs. The total operating cost estimate includes all site costs related to mining, processing, loading, and general and administrative expenses (including non-income taxes, fees, and royalties).
Operating costs for the OnCore operations are expected to remain relatively consistent (on an uninflated basis) with 2024 results. As such, the projected total cash cost of goods sold over the life of the mine averages $14.98 per ton sold over the life of the mine. As the operation is in a steady state, BOYD considers the future operating cost estimates to be reasonable and appropriate.
12.0 ECONOMIC ANALYSIS
The economic analysis presented in this chapter was prepared by BOYD for the purpose of confirming the commercial viability of the OnCore Plants’ reported frac sand reserves and not for the purpose of valuing any of the OnCore operations, or their assets. The economic analysis contains forward-looking information related to the projected operating and financial performance of the OnCore Plants. This projection involves inherent known and unknown risks and uncertainties, some of which may be outside of Atlas’s control. Atlas, as with all mining companies, actively evaluates, changes, and modifies business and operating plans in response to various factors that may affect operational and/or financial results. Actual results, production levels, operating expenses, sales realizations, and all other modifying factors could vary significantly from the assumptions and estimates provided in this analysis. Risk is subjective, as such, BOYD recommends that each reader should evaluate the project based on their own investment criteria.
The financial model used for the purposes of the economic analysis forecasts future free cash flow from frac sand production and sales over the life cycle of the OnCore operations using the annual forecasts of production, sales revenues, and operating and capital costs discussed earlier in this report. A DCF analysis, in which future free cash flows are discounted to present value, is used to derive an NPV for the frac sand reserves. The use of DCF-NPV analysis is a standard method within the mining industry to assess the economic value of a project after allowing for the cost of capital invested.
The financial evaluation of the OnCore Plants has been undertaken on a simplified after‑tax basis and does not reflect Atlas’s corporate tax structure. NPV is calculated using an after-tax discount rate of 10% (NPV10). Cash flows were assumed to occur in the middle of each year and are discounted to January 1, 2025. Cost estimates and other inputs to the cash flow model for the project have been prepared using constant 2024 money terms, i.e., without provision for inflation. The internal rate of return and project payback were not calculated, as there was no initial investment (sunk costs) considered in the financial model provided herein.
A suite of sensitivities was calculated to evaluate the effect of the main drivers of economic performance (including variations in sales prices, operating costs, and capital costs).
12.2.Assumptions and Limitations
Cash flow projections for the OnCore Plants have been generated from the annual forecasts of production, sales revenues, and operating and capital costs discussed earlier in this report. A summary of the key assumptions and limitations is provided below:
•Sales volumes of finished frac sand in 2025 are based on Atlas’s budget projections and are expected to remain constant thereafter. Forecasted sales volumes are at or below the capacity of the OnCore processing facilities, both individually and in aggregate.
•ROM production requirements are based on an expected processing yields at each property and will remain in line with expected sales volumes. Forecasted ROM production is at or below the capacity of the existing mining equipment and related infrastructure.
•Forecasted revenues are based on projected sales prices for 100 mesh finished frac sand sold from each OnCore Plant (i.e., FOB Mine). Additional transportation and delivery costs are assumed to be incurred by the customer or added as a pass-through to the FOB Mine price. Market specifications and forecasted sales prices for Atlas’s finished frac sand from the OnCore Plants are provided in Chapter 10.
•Projected operating costs are discussed in Chapter 11 and include all site costs related to mining, processing, loading, and general and administrative expenses (including non-income taxes, fees, and royalties). Unit operating costs are expected to remain relatively constant over the life of the operation.
•Projected capital expenditures are discussed in Chapter 11 and include costs for expansion/growth, sustaining/maintenance of operations, and post-mining reclamation costs. Unit sustaining capital expenditures are expected to remain relatively constant over the life of the operation.
•No allowance for changes in or the recapture of working capital has been made in the financial analysis as the OnCore business unit is a going concern. Exclusion of working capital from the financial analysis does not have a material impact on the NPV calculation.
•Depreciation and amortization expenses for existing assets are derived from Atlas’s depreciation schedules. Sustaining capital is depreciated over 10 years on a straight-line basis.
•Income taxes are based on a Federal Corporate Tax Rate of 21%.
•Asset recovery/salvage values were not included in the valuation.
It is BOYD’s opinion that the financial model provides a reasonable and accurate reflection of the OnCore Plants’ expected economic performance based on the assumptions and information available at the time of our review. Furthermore, it is BOYD’s opinion that the production and financial projections provided herein are reasonable and are accurate to within ±25%.
12.3.Financial Model Results
Table 12.1, below, provides a summary of the estimated remaining life of reserves financial results for the OnCore Plants.
| | | | |
Table 12.1: Financial Results |
| | | | |
| | Units | | Remaining Life of Reserves Total |
| | | | |
Expected Remaining Life | | years | | 21 |
| | | | |
Production: | | | | |
ROM Production | | 000 tons | | 83,742 |
Product Sales | | 000 tons | | 59,651 |
| | | | |
Total Revenues | | $ millions | | 1,481.0 |
Average Selling Price | | $/t sold | | 24.83 |
| | | | |
Total Cost of Goods Sold | | $ millions | | 893.8 |
Average Cost of Goods Sold | | $/t sold | | 14.98 |
| | | | |
Capital Expenditures | | $ millions | | 57.4 |
Average Capital Expenditures | | $/t sold | | 0.96 |
| | | | |
Pre-Tax: | | | | |
Cash Flow | | $ millions | | 529.8 |
NPV10 | | $ millions | | 342.5 |
| | | | |
After-tax: | | | | |
Cash Flow | | $ millions | | 436.8 |
NPV10 | | $ millions | | 280.4 |
Estimated LOM pre-tax and after-tax cash flows for frac sand production from the OnCore Plants are presented in Table 12.2, on the following page.
Table 12.2
ANNUAL PRODUCTION AND CASH FLOW FORECAST
ONCORE PLANTS
Prepared For
ATLAS ENERGY SOLUTIONS INC.
By
John T. Boyd Company
Mining and Geological Consultants
February 2025
| | | | | | | | | | | | | | | | | | | | | | |
| | | | | | | | | | | | | | 2030 | | 2035 | | 2040 | | | | |
Description | | Units | | 2025 | | 2026 | | 2027 | | 2028 | | 2029 | | to 2034 | | to 2039 | | to 2044 | | 2045 | | Total |
| | | | | | | | | | | | | | | | | | | | | | |
Production Statistics: | | | | | | | | | | | | | | | | | | | | | | |
ROM Production | | 000 tons | | 9,848 | | 9,848 | | 9,410 | | 8,021 | | 7,780 | | 23,446 | | 9,740 | | 4,985 | | 664 | | 83,742 |
Process Yield | | % | | 71.2 | | 71.2 | | 70.9 | | 69.9 | | 70.1 | | 71.1 | | 71.7 | | 75.2 | | 75.2 | | 71.2 |
Product Sales | | 000 tons | | 7,010 | | 7,010 | | 6,670 | | 5,610 | | 5,450 | | 16,666 | | 6,986 | | 3,750 | | 499 | | 59,651 |
| | | | | | | | | | | | | | | | | | | | | | |
Total Revenues | | $ 000 | | 162,461 | | 162,461 | | 157,945 | | 133,565 | | 130,103 | | 415,672 | | 186,009 | | 117,225 | | 15,599 | | 1,481,037 |
Average Selling Price | | $/ton sold | | 23.18 | | 23.18 | | 23.68 | | 23.81 | | 23.87 | | 24.94 | | 26.63 | | 31.26 | | 31.26 | | 24.83 |
| | | | | | | | | | | | | | | | | | | | | | |
Total Cash Cost of Goods Sold | | $ 000 | | 86,150 | | 86,444 | | 89,818 | | 79,844 | | 77,504 | | 241,003 | | 127,581 | | 93,113 | | 12,390 | | 893,846 |
Average Cash Cost of Goods Sold | | $/ton sold | | 12.29 | | 12.33 | | 13.47 | | 14.23 | | 14.22 | | 14.46 | | 18.26 | | 24.83 | | 24.83 | | 14.98 |
| | | | | | | | | | | | | | | | | | | | | | |
EBITDA | | $ 000 | | 76,311 | | 76,017 | | 68,126 | | 53,721 | | 52,598 | | 174,669 | | 58,428 | | 24,113 | | 3,209 | | 587,191 |
| | | | | | | | | | | | | | | | | | | | | | |
DDA | | $ 000 | | 18,645 | | 13,457 | | 9,456 | | 9,896 | | 8,615 | | 41,034 | | 28,709 | | 12,800 | | 1,722 | | 144,336 |
| | | | | | | | | | | | | | | | | | | | | | |
EBIT/Operating Income | | $ 000 | | 57,666 | | 62,560 | | 58,670 | | 43,825 | | 43,983 | | 133,634 | | 29,719 | | 11,313 | | 1,487 | | 442,855 |
| | | | | | | | | | | | | | | | | | | | | | |
Taxes | | $ 000 | | 12,110 | | 13,138 | | 12,321 | | 9,203 | | 9,236 | | 28,063 | | 6,241 | | 2,376 | | 312 | | 93,000 |
| | | | | | | | | | | | | | | | | | | | | | |
EBIAT | | $ 000 | | 45,556 | | 49,422 | | 46,349 | | 34,621 | | 34,747 | | 105,571 | | 23,478 | | 8,937 | | 1,174 | | 349,855 |
| | | | | | | | | | | | | | | | | | | | | | |
Capital Expenditures | | $ 000 | | 4,729 | | 7,010 | | 6,670 | | 5,610 | | 5,450 | | 16,666 | | 6,986 | | 3,750 | | 499 | | 57,370 |
| | | | | | | | | | | | | | | | | | | | | | |
Net Income | | $ 000 | | 40,827 | | 42,412 | | 39,679 | | 29,011 | | 29,297 | | 88,905 | | 16,492 | | 5,187 | | 675 | | 292,485 |
| | | | | | | | | | | | | | | | | | | | | | |
Pre-tax Cash Flow | | $ 000 | | 71,582 | | 69,007 | | 61,456 | | 48,111 | | 47,148 | | 158,003 | | 51,442 | | 20,363 | | 2,710 | | 529,821 |
Discounted at 10% | | $ 000 | | 68,251 | | 59,814 | | 48,427 | | 34,464 | | 30,704 | | 79,658 | | 16,935 | | 3,876 | | 384 | | 342,513 |
| | | | | | | | | | | | | | | | | | | | | | |
After-tax Cash Flow | | $ 000 | | 59,472 | | 55,869 | | 49,136 | | 38,908 | | 37,912 | | 129,939 | | 45,201 | | 17,987 | | 2,397 | | 436,821 |
| | | | | | | | | | | | | | | | | | | | | | |
Discounted at 10% | | $ 000 | | 56,705 | | 48,427 | | 38,718 | | 27,872 | | 24,689 | | 65,404 | | 14,851 | | 3,421 | | 340 | | 280,427 |
DCF-NPV on a pre-tax and after-tax basis, using discount rates of 8%, 10% (the base case), and 12%, were calculated utilizing the projected cash flows. Table 12.3 summarizes the results of the pre-tax and after-tax DCF-NPV analyses:
| | | | | | |
Table 12.3: DCF-NPV Analysis |
| | | | | | |
| | NPV ($ millions) |
| | 8% | | 10% | | 12% |
| | | | | | |
Pre-Tax | | 368.8 | | 342.5 | | 319.8 |
| | | | | | |
After-Tax | | 302.2 | | 280.4 | | 261.6 |
As shown, the pre-tax DCF-NPV ranges from approximately $319.8 million to $368.8 million. The after-tax DCF-NPV ranges from approximately $261.6 million to $302.2 million.
The economic analysis confirms that the OnCore Plants generate positive pre- and after‑tax financial results and a real NPV10 of $280.4 million. As such, it is BOYD’s opinion that the OnCore frac sand reserves have demonstrated economic viability.
12.4.Sensitivity Analysis
Table 12.4, below, shows the sensitivity of the project after-tax for a cash flow discounted at 10% (NPV10) to a variation over a range of 20% above and below the base case in: (1) average selling prices and (2) operating costs.
| | | | | | | | | | |
Table 12.4: After-Tax NPV10 Sensitivity Analysis ($ millions) |
|
| | | | | | Revenues | | | | |
| | -20% | -15% | -10% | -5% | 0% | 5% | 10% | 15% | 20% |
| -20% | 220.8 | 256.1 | 291.4 | 326.7 | 362.0 | 397.4 | 432.7 | 468.0 | 503.3 |

| -15% | 200.4 | 235.7 | 271.0 | 306.3 | 341.6 | 377.0 | 412.3 | 447.6 | 482.9 |
-10% | 179.7 | 215.3 | 250.6 | 285.9 | 321.2 | 356.5 | 391.9 | 427.2 | 462.5 |
-5% | 158.9 | 194.8 | 230.2 | 265.5 | 300.8 | 336.1 | 371.5 | 406.8 | 442.1 |
0% | 138.8 | 173.9 | 209.8 | 245.1 | 280.4 | 315.7 | 351.0 | 386.4 | 421.7 |
5% | 119.3 | 153.5 | 189.0 | 224.7 | 260.0 | 295.3 | 330.6 | 366.0 | 401.3 |
10% | 100.0 | 134.0 | 168.3 | 204.0 | 239.6 | 274.9 | 310.2 | 345.6 | 380.9 |
15% | 81.4 | 114.6 | 148.7 | 183.2 | 219.0 | 254.5 | 289.8 | 325.1 | 360.5 |
| 20% | 62.5 | 95.7 | 129.3 | 163.4 | 198.2 | 234.0 | 269.4 | 304.7 | 340.1 |
As expected, the project is most sensitive to changes in product pricing and operating costs. The project is less sensitive to capital costs. There is little to no impact varying the capital costs from 70% to 130% of the base case.
This analysis demonstrates the project value to be relatively robust, with positive NPVs reported across the range of values assessed.
13.0 PERMITTING AND COMPLIANCE
13.1.Permitting Requirements and Status
Several permits and compliance with federal, state, and municipal regulations are required for mining, processing, and related activities at each of the OnCore Plants. These activities are principally regulated by the Texas Commission on Environmental Quality (TCEQ). The predominant registration requirement is with the TCEQ’s Air New Source Review program for air pollution control. Under this program, each OnCore Plant is issued a permanent “Permit by Rule” registration for operation of the registered wet plant. A summary of the permits and registrations for the OnCore operations is provided in Table 13.1, on the following page.
BOYD reviewed the permits and registrations necessary to support continued operations at each of the OnCore Plants. Such required permits appear to be valid and in good standing. The approved permits, registrations, and certifications are adequate for the continued operation of the mining and processing facilities. New permits/registrations, revisions, and/or renewals may be necessary from time to time to facilitate future operations. Given sufficient time and planning, Atlas should be able to secure new permits/registrations, as required, to maintain its planned operations within the context of current regulations.
13.2.Environmental Studies
It is BOYD’s understanding that no standalone environmental studies have been conducted for any of the OnCore sites. As part of the state and federal permitting process, various environmental assessments have been conducted and reviewed by the relevant local, state, and federal agencies. As the necessary permits for mining and processing operations have been issued, it is BOYD’s understanding that all environmental assessments have been accepted by the relevant regulatory bodies and no material issues were found.
Table 13.1: Permit/Registration Summary
| | | | | | | | |
Site | | Program | | Permit ID | | Status | | Renewal Date |
OnCore 1 | | Aggregate Production Operation Air New Source Industrial And Hazardous Waste Petroleum Storage Tank | | Registration No. AP0003261 Registration No. 160814 Solid Waste Registration No. 98312 Registration No. 93457 | | Active Active Active Active | | 4/1/2025 N/A N/A N/A |
OnCore 2 | | Aggregate Production Operation Air New Source Industrial And Hazardous Waste | | Registration No. AP0003393 Registration No. 163015 Solid Waste Registration No. 98355 | | Active Active Active | | 12/9/2025 N/A N/A |
OnCore 2B | | Aggregate Production Operation Air New Source Stormwater Industrial And Hazardous Waste | | Registration No. AP0003965 Registration No. 177184LO01 Permit No. TXR1512RJ Solid Waste Registration No. 98920 | | Active Active Active Active | | 5/24/2025 N/A N/A N/A |
OnCore 3B | | Aggregate Production Operation Air New Source Stormwater Industrial And Hazardous Waste | | Registration No. AP0003913 Registration No. 176881LO01 Permit No. TXR1514PU Solid Waste Registration No. 98938 | | Active Active Active Active | | 2/1/2025 N/A N/A N/A |
OnCore 4 | | Aggregate Production Operation Air New Source Industrial And Hazardous Waste Petroleum Storage Tank | | Registration No. AP0003719 Registration No. 169578 Solid Waste Registration No. 98390 Registration No. 93745 | | Active Active Active Active | | 6/24/2025 N/A N/A N/A |
OnCore 5 | | Aggregate Production Operation Air New Source Industrial And Hazardous Waste | | Registration No. AP0003729 Registration No. 169979 Solid Waste Registration No. 98311 | | Active Active Active | | 8/23/2025 N/A N/A |
OnCore 6 | | Aggregate Production Operation Air New Source Industrial And Hazardous Waste Petroleum Storage Tank | | Registration No. AP0003804 Registration No. 172143 Solid Waste Registration No. 98515 Registration No. 93746 | | Active Active Active Active | | 3/13/2025 N/A N/A N/A |
OnCore 7 | | Aggregate Production Operation Air New Source Air New Source Industrial And Hazardous Waste Petroleum Storage Tank | | Registration No. AP0003833 Registration No. 173176 Permit No. 175369L001 Solid Waste Registration No. 98625 Registration No. 93566 | | Active Active Pending Active Active | | 6/12/2025 N/A N/A N/A N/A |
OnCore 8 | | Aggregate Production Operation Air New Source Stormwater Industrial And Hazardous Waste | | Registration No. AP0003912 Registration No. 175610 Permit No. TXR1510PU Solid Waste Registration No. 98913 | | Active Active Active Active | | 2/1/2025 N/A N/A N/A |
OnCore 9 | | Aggregate Production Operation Air New Source Stormwater Industrial And Hazardous Waste | | Registration No. AP0003971 Registration No. 177761LO01 Permit No. TXR1510RJ Solid Waste Registration No. 98937 | | Active Active Active Active | | 6/26/2025 N/A N/A N/A |
13.3.Waste Disposal and Water Management
The coarse refuse generated from the sand processing operations is stockpiled and used in the construction of impoundment or backfilled into previously mined pits. The fine refuse generated from the sand processing operations is disposed of by pumping it into impoundment ponds.
Waste disposal facilities are in place for current mining operations, with plans to expand the disposal facilities to meet life of reserve storage requirements.
Water control structures are in place and function as required by regulatory agencies.
The OnCore operations are regulated by TCEQ on matters involving air and water pollution and inspected periodically by the state if issues arise.
Mine safety is regulated by MSHA. They inspect the facilities a minimum of twice a year. Atlas’s safety record compares favorably with its regional peers.
Based on our review of information provided by Atlas and available public information, it is BOYD’s opinion that the OnCore Plants’ record of compliance with applicable mining, water quality, and environmental regulations is generally typical for that of the industry. BOYD is not aware of any regulatory violation or compliance issue that would materially impact the estimated frac sand reserves.
13.5.Plans, Negotiations, or Agreements
New permits and certain permit amendments/revisions require public notification. The public is made aware of pending permits by advertisement in local newspapers. Additionally, a copy of the application is retained at the local county’s public library for review. A comment period follows the last advertisement date to allow the public to submit comments to the regulatory authority.
BOYD is not aware of any other community or stakeholder concerns, impacts, negotiations, or agreements that would materially impact the frac sand reserve estimate.
13.6.Post-Mining Land Use and Reclamation
Under current regulations, the State of Texas does not require reclamation or remediation of surface mined lands by aggregate (including frac sand) operations. However, OnCore Plants’ lease and work order agreements generally require the following reclamation requirements:
•Removal of all structures and equipment.
•Refilling or grading of all mining pits to a flat bottom and sides sloped such that livestock or vehicles could easily traverse the property.
•Stabilization and landscaping (including reseeding and revegetating) of disturbed areas to prevent water and wind erosion or the discharge of exposed materials off‑site.
•Disposal of hazardous wastes.
As a matter of good mining practice, Atlas seeks to conduct progressive reclamation (per the above requirements) throughout each operation’s mining life to minimize risk and costs at closure.
13.7.Local Procurement and Hiring
BOYD is not aware of any commitments for local procurement or hiring. Atlas reports making efforts to source supplies and materials from regional vendors. The workforce is likewise located in the regional area.
Atlas’s stated core values include making positive impacts in the communities in which it operates. In addition to the payment of income taxes and other local community taxes such as property taxes and royalties, Atlas supports, financially and otherwise, local community endeavors.
14.0 INTERPRETATION AND CONCLUSIONS
BOYD’s independent technical assessment was conducted in accordance with S-K 1300 and concludes:
•Sufficient data have been obtained through site exploration and sampling programs and mining operations to support the geological interpretations of deposit thickness, grain size distribution, and frac sand quality for the portions of the sand underlying the controlled properties of the OnCore Plants. The data are of sufficient quantity and reliability to reasonably support the frac sand resource and frac sand reserve estimates presented in this report.
•BOYD is of the opinion that our data validation efforts: (1) adequately confirm the reasonableness of the geologic interpretations, resource estimation criteria, and economic assumptions; and (2) support the use of the data in frac sand resource/reserve estimation.
•The 59.7 million saleable product tons of frac sand reserves (as of December 31, 2024) identified on the property are reasonably and appropriately supported by technical studies, which consider expected geologic conditions, planned mining and processing operations, forecasted product revenues, and operating and capital cost estimates. As such, BOYD is of the opinion that there are reasonable expectations that the stated frac sand reserves for the OnCore Plants are technically, economically, and legally extractable as of December 31, 2024.
•To our knowledge, there are no other relevant data or information material to the OnCore Plants that would materially impact or change this technical report summary.
14.2.Significant Risks and Uncertainties
The ability of Atlas, or any mining company, to achieve production and financial projections is dependent on numerous factors. These factors primarily include site‑specific geological conditions, the capabilities of management and operational personnel, product sales prices and market conditions, environmental issues, securing permit renewals and bonds, and developing and operating mines in a safe and efficient manner. Unforeseen changes in legislation and new industry developments could substantially alter the performance of any mining company. It is our understanding that Atlas continuously assesses these factors and adjusts operating plans as a matter of course.
As frac sand producing operations with an established history of commercial success, there is a high degree of certainty for the OnCore Plants under the current and foreseeable operating environment. However, it should be noted that frac sand is generally marketed exclusively to the energy sector which has historically faced more volatility than many other industries.
Subject specific assessments of risk are presented in the relevant sections of this report.
Based on the status of the OnCore Plants, BOYD has no recommendations for additional work relevant to the subject frac sand reserves at this time.