UNITED STATES
SECURITIES AND EXCHANGE COMMISSION
Washington, D.C. 20549
FORM N-CSR
CERTIFIED SHAREHOLDER REPORT OF
REGISTERED MANAGEMENT INVESTMENT COMPANIES
Investment Company Act file number 811-2031
MFS SERIES TRUST V
(Exact name of registrant as specified in charter)
500 Boylston Street, Boston, Massachusetts 02116
(Address of principal executive offices) (Zip code)
Susan S. Newton
Massachusetts Financial Services Company
500 Boylston Street
Boston, Massachusetts 02116
(Name and address of agents for service)
Registrant’s telephone number, including area code: (617) 954-5000
Date of fiscal year end: September 30
Date of reporting period: March 31, 2008
| ITEM 1. | REPORTS TO STOCKHOLDERS. |

MFS® International New Discovery Fund
The report is prepared for the general information of shareholders. It is authorized for distribution to prospective investors only when preceded or accompanied by a current prospectus.
NOT FDIC INSURED Ÿ MAY LOSE VALUE Ÿ
NO BANK OR CREDIT UNION GUARANTEE Ÿ NOT A DEPOSIT Ÿ
NOT INSURED BY ANY FEDERAL GOVERNMENT AGENCY OR
NCUA/NCUSIF
3/31/08
MIO-SEM

LETTER FROM THE CEO
Dear Shareholders:
Many of our MFS® fund shareholders have been justifiably concerned, as have most investors around the world, about the state of the global economy. As we enter 2008 we see the market volatility that began in the third quarter of 2007 has intensified.
We here at MFS, and those before us who guided the firm with the same disciplined investment process, have weathered many major economic disruptions over our eight-plus decades of managing clients’ investments. We have managed money through the Great Depression, 14 recessions, as well as numerous market crises caused by wars, political upheavals, and terrorist attacks. MFS remains in business because our investors believe in the integrity of our long-term investment strategy and its proven results.
Worries over market volatility are valid, and investors cannot always expect to see the kind of returns stocks have delivered in the bull markets of past years. Yet we believe our strategy of ADR — allocating across the major asset classes, diversifying within each class, and regularly rebalancing your portfolio to maintain your desired allocation — can help you pursue the highest investment returns while minimizing the effects of market fluctuations.
MFS is a world leader in domestic and global investing. Our team approach is research driven, globally integrated, and balanced. We have 176 investment management professionals located in the Americas, Europe, and Asia who focus on the fundamentals of each security and then integrate our sophisticated quantitative approach.* This collaborative process allows us to find opportunities in any market environment.
I personally would like to thank you for your continued business. We want you to be confident that we are constantly managing our fund offerings with you in mind, while adding new products that can help you to choose what fits your unique financial goals.
Respectfully,

Robert J. Manning
Chief Executive Officer and Chief Investment Officer
MFS Investment Management®
May 15, 2008
* as of 12/31/07
The opinions expressed in this letter are subject to change, may not be relied upon for investment advice, and no forecasts can be guaranteed.
1
PORTFOLIO COMPOSITION
| | |
| Top ten holdings | | |
| Linde AG | | 1.5% |
| Christian Dior S.A. | | 1.5% |
| Symrise AG | | 1.3% |
| Synthes, Inc. | | 1.2% |
| TNT N.V. | | 1.1% |
| Konica Minolta Holdings, Inc. | | 1.1% |
| Catlin Group Ltd. | | 1.0% |
| Royal KPN N.V. | | 1.0% |
| Geberit AG | | 1.0% |
| Uni-Charm Corp. | | 0.9% |
| | |
| Equity sectors | | |
| Financial Services | | 20.0% |
| Industrial Goods & Services | | 10.3% |
| Technology | | 10.0% |
| Health Care | | 9.5% |
| Utilities & Communications | | 8.2% |
| Basic Materials | | 7.9% |
| Consumer Staples | | 7.0% |
| Special Products & Services | | 5.9% |
| Energy | | 5.7% |
| Autos & Housing | | 4.6% |
| Leisure | | 4.2% |
| Transportation | | 3.4% |
| Retailing | | 2.1% |
| |
| Country weightings | | |
| Japan | | 17.4% |
| United Kingdom | | 12.2% |
| Germany | | 10.5% |
| France | | 6.8% |
| United States | | 5.8% |
| Netherlands | | 4.8% |
| Switzerland | | 4.2% |
| Mexico | | 3.2% |
| Canada | | 3.1% |
| Other Countries | | 32.0% |
Percentages are based on net assets as of 3/31/08.
The portfolio is actively managed and current holdings may be different.
2
EXPENSE TABLE
Fund expenses borne by the shareholders during the period, October 1, 2007 through March 31, 2008
As a shareholder of the fund, you incur two types of costs: (1) transaction costs, including sales charges (loads) on certain purchase or redemption payments, and (2) ongoing costs, including management fees; distribution and service (12b-1) fees; and other fund expenses. This example is intended to help you understand your ongoing costs (in dollars) of investing in the fund and to compare these costs with the ongoing costs of investing in other mutual funds.
The example is based on an investment of $1,000 invested at the beginning of the period and held for the entire period October 1, 2007 through March 31, 2008.
The expenses include the payment of a portion of the transfer-agent-related expenses of MFS funds that invest in the fund. For further information, please see the Notes to the Financial Statements.
Actual Expenses
The first line for each share class in the following table provides information about actual account values and actual expenses. You may use the information in this line, together with the amount you invested, to estimate the expenses that you paid over the period. Simply divide your account value by $1,000 (for example, an $8,600 account value divided by $1,000 = 8.6), then multiply the result by the number in the first line under the heading entitled “Expenses Paid During Period” to estimate the expenses you paid on your account during this period.
Hypothetical Example for Comparison Purposes
The second line for each share class in the following table provides information about hypothetical account values and hypothetical expenses based on the fund’s actual expense ratio and an assumed rate of return of 5% per year before expenses, which is not the fund’s actual return. The hypothetical account values and expenses may not be used to estimate the actual ending account balance or expenses you paid for the period. You may use this information to compare the ongoing costs of investing in the fund and other funds. To do so, compare this 5% hypothetical example with the 5% hypothetical examples that appear in the shareholder reports of the other funds.
Please note that the expenses shown in the table are meant to highlight your ongoing costs only and do not reflect any transactional costs, such as sales charges (loads). Therefore, the second line for each share class in the table is useful in comparing ongoing costs only, and will not help you determine the relative total costs of owning different funds. In addition, if these transactional costs were included, your costs would have been higher.
3
Expense Table – continued
| | | | | | | | | | |
Share
Class | | | | Annualized
Expense
Ratio | | Beginning
Account Value
10/01/07 | | Ending
Account Value
3/31/08 | | Expenses
Paid During
Period (p)
10/01/07-3/31/08 |
| A | | Actual | | 1.44% | | $1,000.00 | | $896.06 | | $6.83 |
| | Hypothetical (h) | | 1.44% | | $1,000.00 | | $1,017.80 | | $7.26 |
| B | | Actual | | 2.14% | | $1,000.00 | | $892.94 | | $10.13 |
| | Hypothetical (h) | | 2.14% | | $1,000.00 | | $1,014.30 | | $10.78 |
| C | | Actual | | 2.14% | | $1,000.00 | | $893.00 | | $10.13 |
| | Hypothetical (h) | | 2.14% | | $1,000.00 | | $1,014.30 | | $10.78 |
| I | | Actual | | 1.14% | | $1,000.00 | | $897.40 | | $5.41 |
| | Hypothetical (h) | | 1.14% | | $1,000.00 | | $1,019.30 | | $5.76 |
| R | | Actual | | 1.64% | | $1,000.00 | | $895.17 | | $7.77 |
| | Hypothetical (h) | | 1.64% | | $1,000.00 | | $1,016.80 | | $8.27 |
| R1 | | Actual | | 2.23% | | $1,000.00 | | $892.39 | | $10.55 |
| | Hypothetical (h) | | 2.23% | | $1,000.00 | | $1,013.85 | | $11.23 |
| R2 | | Actual | | 1.77% | | $1,000.00 | | $894.88 | | $8.38 |
| | Hypothetical (h) | | 1.77% | | $1,000.00 | | $1,016.15 | | $8.92 |
| R3 | | Actual | | 1.72% | | $1,000.00 | | $894.61 | | $8.15 |
| | Hypothetical (h) | | 1.72% | | $1,000.00 | | $1,016.40 | | $8.67 |
| R4 | | Actual | | 1.47% | | $1,000.00 | | $895.71 | | $6.97 |
| | Hypothetical (h) | | 1.47% | | $1,000.00 | | $1,017.65 | | $7.41 |
| R5 | | Actual | | 1.19% | | $1,000.00 | | $897.20 | | $5.64 |
| | Hypothetical (h) | | 1.19% | | $1,000.00 | | $1,019.05 | | $6.01 |
| 529A | | Actual | | 1.74% | | $1,000.00 | | $894.72 | | $8.24 |
| | Hypothetical (h) | | 1.74% | | $1,000.00 | | $1,016.30 | | $8.77 |
| 529B | | Actual | | 2.39% | | $1,000.00 | | $891.56 | | $11.30 |
| | Hypothetical (h) | | 2.39% | | $1,000.00 | | $1,013.05 | | $12.03 |
| 529C | | Actual | | 2.39% | | $1,000.00 | | $891.50 | | $11.30 |
| | Hypothetical (h) | | 2.39% | | $1,000.00 | | $1,013.05 | | $12.03 |
| (h) | 5% class return per year before expenses. |
| (p) | Expenses paid is equal to each class’ annualized expense ratio, as shown above, multiplied by the average account value over the period, multiplied by the number of days in the period, divided by the number of days in the year. Expenses paid do not include any applicable sales charges (loads). If these transaction costs had been included, your costs would have been higher. |
Effective January 1, 2008 the fund’s Class R2, Class R3, Class R4, and Class R5 retirement plan administration and service fee was terminated (as described in Note 3 of the Notes to the Financial Statements). Had this fee not been in effect throughout the entire six month period, the annualized expense ratios would have been 1.64%, 1.64%, 1.39% and 1.13% for Class R2, Class R3, Class R4 and Class R5 shares respectively. The
4
Expense Table – continued
actual expenses paid during the period would have been approximately $7.80, $7.79, $6.61, and $5.38 and the hypothetical expenses paid during the period would have been approximately $8.29, $8.29, $7.03 and $5.72 for Class R2, Class R3, Class R4 and Class R5 shares, respectively.
Effective March 1, 2008 the fund’s Class R1 retirement plan administration and service fee were terminated and the Class R1 distribution fee was increased (as described in Note 3 of the Notes to the Financial Statements). Had these fee changes been in effect throughout the entire six month period, the annualized expense ratio would have been 2.14%. The actual expenses paid during the period would have been approximately $10.16 and the hypothetical expenses paid during the period would have been approximately $10.81.
Effective April 1, 2008 the fund’s Class 529A, 529B, and 529C shares program manager fee was reduced (as described in Note 3 of the Notes to Financial Statements). Had this fee change been in effect throughout the entire six month period, the annualized expense ratio would have been 1.59%, 2.24% and 2.24% for Class 529A, 529B and 529C shares, respectively. The actual expenses paid during the period would have been approximately $7.56, $10.63 and $10.63 and the hypothetical expenses paid during the period would have been approximately $8.04, $11.31 and $11.31 for Class 529A, Class 529B and Class 529C shares, respectively.
Note to Shareholders: On April 18, 2008, Class R shares and Class R2 shares were converted into Class R3 shares. After the conversion, Class R3, Class R4, and Class R5 were renamed Class R2, Class R3, and Class R4, respectively.
5
PORTFOLIO OF INVESTMENTS
3/31/08 (unaudited)
The Portfolio of Investments is a complete list of all securities owned by your fund. It is categorized by broad-based asset classes.
| | | | | |
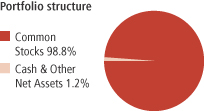
| Common Stocks - 98.8% | | | | | |
| Issuer | | Shares/Par | | Value ($) |
| | | | | |
| Aerospace - 0.7% | | | | | |
| Cobham PLC | | 3,293,176 | | $ | 13,060,406 |
| Finmeccanica S.p.A. | | 227,400 | | | 7,731,067 |
| Meggitt PLC | | 960,566 | | | 5,252,359 |
| | | | | |
| | | | | $ | 26,043,832 |
| Airlines - 1.1% | | | | | |
| Arriva PLC | | 769,750 | | $ | 10,470,937 |
| Copa Holdings S.A. | | 696,300 | | | 26,535,992 |
| Tam S.A., ADR (l) | | 305,400 | | | 5,860,625 |
| | | | | |
| | | | | $ | 42,867,554 |
| Alcoholic Beverages - 0.7% | | | | | |
| Grupo Modelo S.A. de C.V., “C” | | 4,238,400 | | $ | 18,553,326 |
| Pernod Ricard S.A. | | 60,720 | | | 6,244,766 |
| | | | | |
| | | | | $ | 24,798,092 |
| Apparel Manufacturers - 0.8% | | | | | |
| Adidas AG | | 142,396 | | $ | 9,464,253 |
| Burberry Group PLC | | 279,600 | | | 2,497,720 |
| Li & Fung Ltd. | | 4,473,000 | | | 16,736,887 |
| | | | | |
| | | | | $ | 28,698,860 |
| Automotive - 1.4% | | | | | |
| Bridgestone Corp. | | 1,284,800 | | $ | 21,940,737 |
| Continental AG | | 171,657 | | | 17,499,680 |
| Kongsberg Automotive A.S.A (l) | | 261,000 | | | 1,465,242 |
| Yamaha Motor Co. Ltd. (l) | | 758,500 | | | 14,016,392 |
| | | | | |
| | | | | $ | 54,922,051 |
| Biotechnology - 1.1% | | | | | |
| Actelion Ltd. (a)(l) | | 313,229 | | $ | 17,073,180 |
| CSL Ltd. | | 688,155 | | | 23,205,258 |
| | | | | |
| | | | | $ | 40,278,438 |
| Broadcasting - 2.3% | | | | | |
| Fuji Television Network, Inc. | | 14,127 | | $ | 20,998,333 |
| Grupo Televisa S.A., ADR | | 1,279,280 | | | 31,009,747 |
| Societe Television Francaise 1 | | 258,956 | | | 5,693,514 |
6
Portfolio of Investments (unaudited) – continued
| | | | | |
| Issuer | | Shares/Par | | Value ($) |
| | | | | |
| Common Stocks - continued | | | | |
| Broadcasting - continued | | | | | |
| WPP Group PLC | | 2,423,460 | | $ | 28,881,656 |
| | | | | |
| | | | | $ | 86,583,250 |
| Brokerage & Asset Managers - 3.2% | | | | | |
| Aberdeen Asset Management PLC | | 876,300 | | $ | 2,406,658 |
| Bolsa de Mercadorias & Futuros | | 1,357,500 | | | 12,398,322 |
| Daiwa Securities Group, Inc. (l) | | 2,741,000 | | | 23,848,432 |
| Deutsche Boerse AG | | 104,950 | | | 16,901,048 |
| IG Group Holdings PLC | | 3,252,386 | | | 21,105,396 |
| Julius Baer Holding Ltd. | | 118,501 | | | 8,731,464 |
KBC Ancora NPV | | 40,253 | | | 4,139,831 |
| Rathbone Brothers PLC | | 1,368,718 | | | 28,769,453 |
| Van Lanschot N.V. (l) | | 34,657 | | | 3,623,933 |
| | | | | |
| | | | | $ | 121,924,537 |
| Business Services - 4.6% | | | | | |
| Amadeus Fire AG | | 243,158 | | $ | 5,541,905 |
| Bunzl PLC | | 2,151,947 | | | 30,275,807 |
| Electrocomponents PLC | | 1,154,800 | | | 4,161,913 |
| Experian Group Ltd. | | 2,011,964 | | | 14,641,920 |
| Intelligence NPV | | 1,394 | | | 1,313,842 |
| Intertek Group PLC | | 1,180,948 | | | 24,166,972 |
| JFE Shoji Holdings, Inc. (l) | | 3,712,000 | | | 26,477,990 |
| Kloeckner & Co. AG | | 373,607 | | | 19,111,613 |
| LPS Brasil - Consultoria de Imoveis S.A. | | 247,761 | | | 4,412,560 |
| Satyam Computer Services Ltd., ADR | | 1,445,700 | | | 32,658,363 |
| TAKKT AG | | 314,000 | | | 5,644,906 |
| USS Co. Ltd. (l) | | 124,810 | | | 8,687,177 |
| | | | | |
| | | | | $ | 177,094,968 |
| Cable TV - 0.1% | | | | | |
| NDS Group PLC, ADR (a) | | 61,500 | | $ | 3,005,505 |
| | |
| Chemicals - 0.8% | | | | | |
| Hoganas AB (l) | | 165,700 | | $ | 3,938,698 |
| Makhteshim-Agan Industries Ltd. | | 1,399,900 | | | 10,256,436 |
| Syngenta AG | | 36,200 | | | 10,603,654 |
| Victrex PLC | | 304,105 | | | 4,528,718 |
| | | | | |
| | | | | $ | 29,327,506 |
| Computer Software - 0.4% | | | | | |
| Trend Micro, Inc. (l) | | 354,500 | | $ | 14,095,531 |
7
Portfolio of Investments (unaudited) – continued
| | | | | |
| Issuer | | Shares/Par | | Value ($) |
| | | | | |
| Common Stocks - continued | | | | |
| Computer Software - Systems - 2.1% | | | | | |
| Cap Gemini S.A. | | 132,719 | | $ | 7,555,837 |
| Detica Group PLC | | 174,500 | | | 863,332 |
| Fujitsu Ltd. | | 3,838,000 | | | 25,188,553 |
| HCL Technologies Ltd. | | 2,303,880 | | | 14,542,812 |
| Indra Sistemas S.A. (l) | | 99,200 | | | 2,855,879 |
| Obic NPV | | 55,240 | | | 9,820,770 |
| Wincor Nixdorf AG | | 264,081 | | | 21,132,381 |
| | | | | |
| | | | | $ | 81,959,564 |
| Conglomerates - 1.0% | | | | | |
| DCC PLC | | 151,000 | | $ | 3,563,046 |
| First Pacific Co. Ltd. | | 21,034,000 | | | 13,943,331 |
| Smiths Group PLC | | 177,066 | | | 3,300,462 |
| ThyssenKrupp AG | | 300,420 | | | 17,183,845 |
| | | | | |
| | | | | $ | 37,990,684 |
| Construction - 3.2% | | | | | |
| Corporacion Moctezuma S.A. de C.V. | | 1,005,500 | | $ | 2,403,830 |
| CRH PLC | | 452,000 | | | 17,179,014 |
| Geberit AG | | 252,842 | | | 37,667,337 |
| Kaufman & Broad S.A. (l) | | 60,200 | | | 2,465,683 |
| Nexity International | | 319,572 | | | 13,729,672 |
| SARE Holding S.A. de C.V., “B” | | 15,835,567 | | | 21,881,658 |
| Schindler Holding AG (l) | | 79,090 | | | 5,923,092 |
| Wienerberger AG | | 413,746 | | | 22,000,783 |
| | | | | |
| | | | | $ | 123,251,069 |
| Consumer Goods & Services - 4.8% | | | | | |
| Beiersdorf AG (l) | | 87,000 | | $ | 7,317,594 |
| Christian Dior S.A. | | 502,000 | | | 55,550,375 |
| Hengan International Group Co. Ltd. | | 3,358,000 | | | 11,520,688 |
| Henkel KGaA, IPS (l) | | 199,200 | | | 9,205,846 |
| Kao Corp. | | 784,000 | | | 22,206,848 |
| Kimberly-Clark de Mexico S.A. de C.V., “A” | | 6,092,690 | | | 27,019,482 |
| Kose Corp. | | 82,700 | | | 1,786,920 |
| Natura Cosmeticos S.A. NPV | | 752,300 | | | 7,686,828 |
| Societe BIC S.A. | | 60,379 | | | 3,722,387 |
| Uni-Charm Corp. | | 491,800 | | | 36,147,600 |
| | | | | |
| | | | | $ | 182,164,568 |
| Containers - 0.4% | | | | | |
| DS Smith PLC | | 1,043,200 | | $ | 3,237,380 |
| Mayr-Melnhof Karton AG NPV | | 50,301 | | | 5,074,774 |
8
Portfolio of Investments (unaudited) – continued
| | | | | |
| Issuer | | Shares/Par | | Value ($) |
| | | | | |
| Common Stocks - continued | | | | |
| Containers - continued | | | | | |
| Smurfit Kappa PLC | | 153,000 | | $ | 1,840,135 |
| Viscofan SA | | 164,453 | | | 3,766,279 |
| | | | | |
| | | | | $ | 13,918,568 |
| Electrical Equipment - 2.5% | | | | | |
| Halma PLC | | 1,068,936 | | $ | 4,106,815 |
| Hitachi Cable (l) | | 614,000 | | | 2,293,019 |
| Legrand S.A. | | 830,673 | | | 26,051,412 |
| LS Industrial Systems Co. Ltd. | | 323,681 | | | 20,161,602 |
| OMRON Corp. | | 541,100 | | | 11,222,477 |
| Prysmian S.p.A. | | 793,188 | | | 16,924,818 |
| Saft Groupe S.A. (l) | | 70,500 | | | 2,780,729 |
| Spectris PLC | | 738,080 | | | 10,896,321 |
| | | | | |
| | | | | $ | 94,437,193 |
| Electronics - 7.2% | | | | | |
| Advantest Corp. NPV (l) | | 90,200 | | $ | 2,384,828 |
| ARM Holdings PLC | | 5,804,290 | | | 10,128,463 |
| ASM Pacific Technology Ltd. | | 3,112,000 | | | 22,593,563 |
| Cenit AG Systemhaus | | 54,200 | | | 611,658 |
| Delta Electronics, Inc. | | 3,595,000 | | | 10,656,786 |
| Flextronics International Ltd. (a) | | 1,883,240 | | | 17,683,624 |
| Funai Electric Co. Ltd. (l) | | 279,400 | | | 9,608,884 |
| Hirose Electric Co. Ltd. (l) | | 198,600 | | | 22,362,716 |
| Hoya Corp. | | 85,400 | | | 2,023,155 |
| Konica Minolta Holdings, Inc. (l) | | 2,998,500 | | | 41,322,860 |
| Melexis N.V. (l) | | 184,500 | | | 3,054,746 |
| Nippon Electric Glass Co. Ltd. | | 2,209,000 | | | 34,608,598 |
| Realtek Semiconductor Corp. | | 2,201,725 | | | 6,566,148 |
| Richtek Technology Corp. | | 918,000 | | | 7,399,401 |
| Ricoh Co. Ltd. | | 1,766,000 | | | 29,505,245 |
| SAES Getters S.p.A. (l) | | 113,180 | | | 3,253,528 |
| SUMCO Corp. (l) | | 632,500 | | | 13,793,428 |
| Vacon Oyj (l) | | 88,900 | | | 3,928,829 |
| Venture Corp. Ltd. | | 3,031,000 | | | 23,352,389 |
| Wolfson Microelectronics PLC | | 3,590,450 | | | 8,080,840 |
| | | | | |
| | | | | $ | 272,919,689 |
| Energy - Independent - 2.9% | | | | | |
| Arch Coal, Inc. | | 400,000 | | $ | 17,400,000 |
| Galp Energia SGPS, S.A. | | 317,300 | | | 7,567,246 |
| Niko Resources Ltd. | | 133,400 | | | 10,799,387 |
| OMV AG | | 299,378 | | | 19,779,824 |
9
Portfolio of Investments (unaudited) – continued
| | | | | |
| Issuer | | Shares/Par | | Value ($) |
| | | | | |
| Common Stocks - continued | | | | |
| Energy - Independent - continued | | | | | |
| Peabody Energy Corp. | | 400,000 | | $ | 20,400,000 |
| Talisman Energy, Inc. | | 1,956,350 | | | 34,643,004 |
| | | | | |
| | | | | $ | 110,589,461 |
| Engineering - Construction - 1.5% | | | | | |
| Acciona S.A. | | 30,000 | | $ | 8,033,012 |
| Aker Kvaerner A.S.A | | 330,630 | | | 7,528,404 |
| Koninklijke BAM Groep N.V. | | 368,886 | | | 8,692,712 |
| North American Energy Partners, Inc. (a) | | 1,738,320 | | | 26,665,829 |
| Orascom Construction Industries Co. | | 72,489 | | | 5,466,628 |
| | | | | |
| | | | | $ | 56,386,585 |
| Food & Beverages - 0.8% | | | | | |
| Associated British Foods PLC | | 214,772 | | $ | 3,726,469 |
| Grupo Continental S.A. | | 2,245,300 | | | 5,393,107 |
| Ito EN Ltd. (l) | | 64,000 | | | 1,141,571 |
| Kerry Group PLC | | 657,309 | | | 20,593,654 |
| | | | | |
| | | | | $ | 30,854,801 |
| Food & Drug Stores - 0.6% | | | | | |
| Aeon Co. Ltd. | | 700,000 | | $ | 8,459,665 |
| Axfood AB (l) | | 97,500 | | | 3,470,218 |
| Lawson, Inc. (l) | | 282,200 | | | 12,478,087 |
| | | | | |
| | | | | $ | 24,407,970 |
| Furniture & Appliances - 0.0% | | | | | |
| Ekornes A.S.A. | | 104,600 | | $ | 1,899,224 |
| | |
| Gaming & Lodging - 0.6% | | | | | |
| Ladbrokes PLC | | 1,971,680 | | $ | 12,169,075 |
| William Hill PLC | | 1,435,200 | | | 10,693,581 |
| | | | | |
| | | | | $ | 22,862,656 |
| Health Maintenance Organizations - 0.2% | | | | | |
| Odontoprev S.A. | | 359,200 | | $ | 8,181,111 |
| | |
| Insurance - 4.8% | | | | | |
| Admiral Group PLC | | 1,005,550 | | $ | 16,011,462 |
| Aflac, Inc. | | 64,107 | | | 4,163,750 |
| Amlin PLC | | 3,166,846 | | | 17,065,077 |
| Aspen Insurance Holdings Ltd. | | 769,565 | | | 20,301,125 |
| Cathay Financial Holding Co. Ltd. | | 1,926,000 | | | 4,958,593 |
| Catlin Group Ltd. | | 4,475,880 | | | 39,251,661 |
10
Portfolio of Investments (unaudited) – continued
| | | | | |
| Issuer | | Shares/Par | | Value ($) |
| | | | | |
| Common Stocks - continued | | | | |
| Insurance - continued | | | | | |
| CNP Assurances S.A. | | 233,712 | | $ | 28,802,098 |
| Euler Hermes | | 8,096 | | | 867,904 |
| Hiscox Ltd. | | 4,183,716 | | | 19,848,418 |
| Old Mutual PLC | | 7,853,500 | | | 17,208,273 |
| QBE Insurance Group Ltd. | | 706,151 | | | 14,328,549 |
| | | | | |
| | | | | $ | 182,806,910 |
| Internet - 0.3% | | | | | |
| Iliad S.A. | | 75,000 | | $ | 7,461,255 |
| Universo Online S.A., IPS | | 1,021,300 | | | 4,407,357 |
| | | | | |
| | | | | $ | 11,868,612 |
| Leisure & Toys - 0.7% | | | | | |
| Sankyo Co. Ltd. (l) | | 278,800 | | $ | 16,646,767 |
| Ubisoft Entertainment S.A. | | 96,706 | | | 8,329,342 |
| | | | | |
| | | | | $ | 24,976,109 |
| Machinery & Tools - 5.6% | | | | | |
| Assa Abloy AB, “B” | | 398,000 | | $ | 7,216,758 |
| Bucyrus International, Inc., “A” | | 223,190 | | | 22,687,264 |
| Burckhardt Compression Holding AG | | 69,909 | | | 22,307,266 |
| Demag Cranes AG | | 133,560 | | | 6,096,464 |
| Fenner PLC | | 435,300 | | | 2,028,469 |
| GEA Group AG | | 720,650 | | | 24,227,428 |
| Harsco Corp. | | 464,880 | | | 25,745,054 |
| KCI Konecranes PLC (l) | | 576,992 | | | 22,220,966 |
| Mitsui Mining & Smelting Co. Ltd. | | 4,653,000 | | | 14,743,792 |
| Neopost S.A. (l) | | 205,448 | | | 23,052,272 |
| Rotork PLC | | 136,600 | | | 2,922,698 |
| Sandvik AB | | 259,800 | | | 4,514,098 |
| SKF AB (l) | | 258,200 | | | 5,192,373 |
| Timken Co. | | 1,023,910 | | | 30,430,605 |
| | | | | |
| | | | | $ | 213,385,507 |
| Major Banks - 3.3% | | | | | |
| Banco Santander Chile, ADR | | 363,170 | | $ | 18,979,264 |
| Deutsche Postbank AG | | 206,950 | | | 19,751,892 |
| Erste Bank der oesterreichischen Sparkassen AG (l) | | 311,280 | | | 20,168,226 |
| Natixis S.A. | | 1,216,140 | | | 19,559,650 |
| Raiffeisen International Bank Holding AG | | 143,786 | | | 19,596,669 |
| Sumitomo Trust & Banking Co. Ltd. | | 1,500,000 | | | 10,348,623 |
| Unibanco - Uniao de Bancos Brasileiros S.A., ADR | | 152,540 | | | 17,792,266 |
| | | | | |
| | | | | $ | 126,196,590 |
11
Portfolio of Investments (unaudited) – continued
| | | | | |
| Issuer | | Shares/Par | | Value ($) |
| | | | | |
| Common Stocks - continued | | | | |
| Medical & Health Technology & Services - 0.9% | | | | | |
| Diagnosticos da America S.A. | | 442,300 | | $ | 8,811,411 |
| Kobayashi Pharmaceutical Co. Ltd. | | 152,200 | | | 5,897,789 |
| OPG Groep NV | | 732,689 | | | 20,711,835 |
| | | | | |
| | | | | $ | 35,421,035 |
| Medical Equipment - 3.9% | | | | | |
| Cremer S.A. | | 479,300 | | $ | 3,611,474 |
| Fresenius AG, IPS | | 262,400 | | | 21,846,889 |
| Miraca Holdings, Inc. | | 589,000 | | | 15,477,585 |
| QIAGEN N.V. (l) | | 304,200 | | | 6,289,756 |
| Synthes, Inc. | | 333,020 | | | 46,561,456 |
| William Demant Holdings A/S (l) | | 312,625 | | | 24,979,297 |
| Zimmer Holdings, Inc. (a) | | 397,764 | | | 30,969,905 |
| | | | | |
| | | | | $ | 149,736,362 |
| Metals & Mining - 2.5% | | | | | |
| Cameco Corp. NPV | | 683,270 | | $ | 22,484,423 |
| First Uranium Corp. NPV | | 926,700 | | | 6,866,781 |
| Grupo Mexico S.A.B. de C.V. | | 1,625,000 | | | 10,786,013 |
| Inmet Mining Corp. | | 257,423 | | | 18,774,469 |
| Salzgitter AG | | 109,281 | | | 19,005,975 |
| SSAB Svenskt Stal AB, “A” (l) | | 126,700 | | | 3,560,696 |
| Steel Authority of India Ltd. | | 3,365,124 | | | 15,633,792 |
| | | | | |
| | | | | $ | 97,112,149 |
| Natural Gas - Distribution - 1.3% | | | | | |
| Gaz de France (l) | | 422,120 | | $ | 25,477,518 |
| Tokyo Gas Co. Ltd. (l) | | 5,579,000 | | | 22,593,809 |
| | | | | |
| | | | | $ | 48,071,327 |
| Natural Gas - Pipeline - 0.2% | | | | | |
| Enagas S.A. | | 281,900 | | $ | 8,422,655 |
| | |
| Oil Services - 2.8% | | | | | |
| Acergy S.A. (l) | | 1,227,710 | | $ | 26,448,620 |
| Expro International Group PLC | | 400,000 | | | 9,280,206 |
| Fugro N.V. (l) | | 386,584 | | | 30,014,009 |
| Petrofac Ltd. | | 177,316 | | | 1,972,525 |
| Saipem S.p.A. | | 724,772 | | | 29,296,403 |
| Schoeller-Bleckmann Oilfield Equipment | | 57,250 | | | 5,099,949 |
| Vallourec S.A. (l) | | 18,480 | | | 4,485,149 |
| | | | | |
| | | | | $ | 106,596,861 |
| Other Banks & Diversified Financials - 7.6% | | | | | |
| Aeon Credit Service Co. Ltd. | | 1,962,900 | | $ | 26,359,955 |
| Anglo Irish Bank Corp. PLC | | 2,443,182 | | | 32,584,859 |
12
Portfolio of Investments (unaudited) – continued
| | | | | |
| Issuer | | Shares/Par | | Value ($) |
| | | | | |
| Common Stocks - continued | | | | |
| Other Banks & Diversified Financials - continued | | | | | |
| Babcock & Brown Ltd. | | 379,846 | | $ | 5,153,016 |
| Banco de Oro Universal Bank | | 1,625,700 | | | 2,029,552 |
| Banco Macro S.A., ADR | | 308,200 | | | 7,812,870 |
| Banco Panamericano S.A., IPS | | 1,200,000 | | | 5,308,674 |
| Bancolombia S.A., ADR | | 168,300 | | | 5,967,918 |
| Bank of Cyprus Public Co. Ltd. | | 500,000 | | | 5,918,812 |
| Chiba Bank Ltd. (l) | | 3,238,000 | | | 22,054,434 |
| Close Brothers Group PLC | | 268,400 | | | 3,283,821 |
| Credicorp Ltd. | | 61,900 | | | 4,440,706 |
| Credito Emiliano S.p.A. (l) | | 324,000 | | | 4,293,592 |
| CSU Cardsystem S.A. | | 1,555,990 | | | 4,254,469 |
| Grupo Financiero Banorte S.A. de C.V. | | 1,592,500 | | | 6,902,254 |
| Hachijuni Bank Ltd. (l) | | 1,136,000 | | | 7,293,694 |
| Hana Financial Group, Inc. | | 642,651 | | | 26,424,813 |
| Housing Development Finance Corp. Ltd. | | 324,943 | | | 19,372,554 |
| Komercni Banka A.S. | | 99,919 | | | 23,866,177 |
| OTP Bank Ltd., GDR | | 16,101 | | | 1,315,999 |
| Redecard S.A. NPV | | 456,300 | | | 7,603,046 |
| Sapporo Hokuyo Holdings, Inc. (l) | | 228 | | | 1,593,996 |
| Shizuoka Bank Ltd. (l) | | 2,240,000 | | | 26,740,624 |
| SNS REAAL Groep N.V. | | 975,550 | | | 19,785,907 |
| Unione di Banche Italiane Scpa | | 722,106 | | | 18,495,636 |
| | | | | |
| | | | | $ | 288,857,378 |
| Pharmaceuticals - 3.4% | | | | | |
| Hisamitsu Pharmaceutical Co., Inc. | | 814,100 | | $ | 29,630,350 |
| Ipsen S.A. | | 276,663 | | | 15,702,691 |
| Merck KGaA (l) | | 150,949 | | | 18,600,205 |
| Novo Nordisk A/S, “B” (l) | | 358,515 | | | 24,510,344 |
| STADA Arzneimittel AG (l) | | 278,890 | | | 20,252,959 |
| Tanabe Seiyaku Co. Ltd. (l) | | 1,766,000 | | | 20,557,738 |
| | | | | |
| | | | | $ | 129,254,287 |
| Pollution Control - 0.0% | | | | | |
| Biffa PLC | | 147,078 | | $ | 1,017,124 |
| | |
| Precious Metals & Minerals - 0.3% | | | | | |
| Paladin Resources Ltd. NPV (l) | | 2,607,881 | | $ | 12,206,301 |
| | |
| Printing & Publishing - 0.5% | | | | | |
| Bloomsbury Publishing PLC | | 281,300 | | $ | 920,376 |
| Fimalac S.A. (l) | | 40,800 | | | 2,441,278 |
| Reed Elsevier PLC, ADR | | 712,534 | | | 9,056,813 |
| Schibsted A.S.A. (l) | | 277,950 | | | 8,293,025 |
| | | | | |
| | | | | $ | 20,711,492 |
13
Portfolio of Investments (unaudited) – continued
| | | | | |
| Issuer | | Shares/Par | | Value ($) |
| | | | | |
| Common Stocks - continued | | | | |
| Railroad & Shipping - 0.5% | | | | | |
| Jinhui Shipping & Transportation Ltd. | | 1,173,500 | | $ | 11,425,296 |
| SMRT Corp. Ltd. | | 6,830,000 | | | 9,049,855 |
| | | | | |
| | | | | $ | 20,475,151 |
| Real Estate - 1.1% | | | | | |
| Deutsche Wohnen AG (l) | | 752,450 | | $ | 21,567,351 |
| Great Eagle Holdings Ltd. | | 886,000 | | | 2,419,952 |
| Hypo Real Estate Holding AG (l) | | 420,652 | | | 10,928,388 |
| Yanlord Land Group Ltd. | | 3,723,000 | | | 5,797,878 |
| | | | | |
| | | | | $ | 40,713,569 |
| Special Products & Services - 0.3% | | | | | |
| Filtrona PLC | | 2,763,200 | | $ | 9,424,374 |
| MFS Ltd. | | 244,515 | | | 165,866 |
| | | | | |
| | | | | $ | 9,590,240 |
| Specialty Chemicals - 3.9% | | | | | |
| Akzo Nobel N.V. | | 245,000 | | $ | 19,651,878 |
| Croda International PLC | | 631,200 | | | 8,298,360 |
| Linde AG | | 396,435 | | | 55,995,072 |
| Lonza Group AG (l) | | 73,335 | | | 9,721,898 |
| Methanex Corp. NPV | | 244,430 | | | 6,417,669 |
| Symrise AG (l) | | 1,875,174 | | | 48,420,379 |
| | | | | |
| | | | | $ | 148,505,256 |
| Specialty Stores - 0.7% | | | | | |
| Bulgari S.p.A. (l) | | 792,160 | | $ | 9,152,238 |
| Inchcape PLC | | 226,500 | | | 1,805,535 |
| NEXT PLC | | 643,309 | | | 14,529,649 |
| Pendragon PLC | | 3,398,278 | | | 2,274,283 |
| | | | | |
| | | | | $ | 27,761,705 |
| Telecommunications - Wireless - 1.6% | | | | | |
| Cellcom Israel Ltd. | | 200,000 | | $ | 6,286,000 |
| MTN Group Ltd. | | 838,080 | | | 12,709,532 |
| NII Holdings, Inc. “B” (a) | | 199,100 | | | 6,327,398 |
| Philippine Long Distance Telephone Co. | | 372,010 | | | 24,859,147 |
| Tim Participacoes S.A., ADR | | 150,000 | | | 4,843,500 |
| Turkcell Iletisim Hizmetleri A.S., ADR | | 300,000 | | | 6,267,000 |
| | | | | |
| | | | | $ | 61,292,577 |
14
Portfolio of Investments (unaudited) – continued
| | | | | | |
| Issuer | | Shares/Par | | Value ($) |
| Common Stocks - continued | | | | |
| Telephone Services - 3.4% | | | | | | |
| China Netcom Group Corp. Ltd. | | | 10,227,000 | | $ | 29,436,266 |
| Elisa Oyj, “A” | | | 143,600 | | | 3,585,620 |
| Royal KPN N.V. | | | 2,294,340 | | | 38,747,605 |
| Telecom Argentina S.A., ADR (a) | | | 801,491 | | | 16,975,579 |
| Telekom Austria AG | | | 360,841 | | | 7,455,192 |
| Telenor A.S.A. | | | 1,690,940 | | | 32,362,012 |
| | | | | | |
| | | | | | $ | 128,562,274 |
| Tobacco - 0.7% | | | | | | |
| Swedish Match AB (l) | | | 1,178,380 | | $ | 25,680,111 |
| | |
| Trucking - 1.8% | | | | | | |
| Seino Holdings Co. NPV (l) | | | 966,000 | | $ | 6,293,961 |
| TNT N.V. | | | 1,115,880 | | | 41,442,193 |
| Yamato Holdings Co. Ltd. | | | 1,438,000 | | | 21,217,684 |
| | | | | | |
| | | | | | $ | 68,953,838 |
| Utilities - Electric Power - 1.7% | | | | | | |
| AES Tiete S.A., IPS | | | 230,608,000 | | $ | 7,687,592 |
| British Energy Group PLC | | | 2,203,980 | | | 28,516,743 |
| Eletropaulo Metropolitana S.A., IPS | | | 65,750,000 | | | 5,179,382 |
| Enersis S.A., ADR (l) | | | 572,800 | | | 10,127,104 |
| Equatorial Energia S.A., IEU | | | 586,600 | | | 5,601,974 |
| Hong Kong Electric Holdings | | | 1,499,000 | | | 9,551,448 |
| | | | | | |
| | | | | | $ | 66,664,243 |
| Total Common Stocks (Identified Cost, $3,498,263,940) | | | | | $ | 3,766,302,930 |
| | |
| Collateral for Securities Loaned - 6.7% | | | | | | |
| Morgan Stanley, 2.25%, dated 3/31/08, due 4/01/08, total to be received $253,811,584 (secured by various U.S. Treasury and Federal Agency obligations and Mortgage Backed securities in an individually traded account), at Cost and Net Asset Value | | | 253,795,722 | | $ | 253,795,722 |
| | |
| Money Market Funds (v) - 0.8% | | | | | | |
MFS Institutional Money Market Portfolio, 2.877%,
at Cost and Net Asset Value | | $ | 31,537,501 | | $ | 31,537,501 |
| Total Investments (Identified Cost, $3,783,597,163) (k) | | | | | $ | 4,051,636,153 |
| | |
| Other Assets, Less Liabilities - (6.3)% | | | | | | (239,282,066) |
| Net Assets - 100.0% | | | | | $ | 3,812,354,087 |
| (a) | Non-income producing security. |
| (k) | As of March 31, 2008, the fund had 23 securities that were fair valued, aggregating $470,695,087 and 11.62% of market value, in accordance with the policies adopted by the Board of Trustees. |
| (l) | All or a portion of this security is on loan. |
| (v) | Underlying fund that is available only to investment companies managed by MFS. The rate quoted is the annualized seven-day yield of the fund at period end. |
15
Portfolio of Investments (unaudited) – continued
The following abbreviations are used in this report and are defined:
| ADR | | American Depository Receipt |
| GDR | | Global Depository Receipt |
| IEU | | International Equity Unit |
| IPS | | International Preference Stock |
See Notes to Financial Statements
16
Financial Statements
STATEMENT OF ASSETS AND LIABILITIES
At 3/31/08 (unaudited)
This statement represents your fund’s balance sheet, which details the assets and liabilities comprising the total value of the fund.
| | | | |
| Assets | | | | |
| Investments, at value | | | | |
Non-affiliated issuers, at value
(identified cost, $3,752,059,662) | | $4,020,098,652 | | |
| Underlying funds, at cost and value | | 31,537,501 | | |
| Total Investments, at value including $304,199,427 of securities on loan (identified cost, $3,783,597,163) | | $4,051,636,153 | | |
| Foreign currency, at value (identified cost, $32,608,311) | | 32,703,355 | | |
| Receivable for investments sold | | 240,345,763 | | |
| Receivable for fund shares sold | | 1,211,694 | | |
| Interest and dividends receivable | | 12,710,521 | | |
| Other assets | | 53,060 | | |
| Total assets | | | | $4,338,660,546 |
| Liabilities | | | | |
| Payable to custodian | | $1,635,611 | | |
| Payable for investments purchased | | 257,900,036 | | |
| Payable for fund shares reacquired | | 10,119,725 | | |
| Collateral for securities loaned, at value (c) | | 253,795,722 | | |
| Payable to affiliates | | | | |
Management fee | | 388,169 | | |
Shareholder servicing costs | | 1,493,236 | | |
Distribution and service fees | | 140,713 | | |
Administrative services fee | | 5,168 | | |
Program manager fees | | 133 | | |
| Payable for independent trustees’ compensation | | 12,342 | | |
| Accrued expenses and other liabilities | | 815,604 | | |
| Total liabilities | | | | $526,306,459 |
| Net assets | | | | $3,812,354,087 |
| Net assets consist of: | | | | |
| Paid-in capital | | $3,384,721,521 | | |
| Unrealized appreciation (depreciation) on investments and translation of assets and liabilities in foreign currencies (net of $104,959 deferred country tax) | | 268,001,226 | | |
| Accumulated net realized gain (loss) on investments and foreign currency transactions | | 158,700,928 | | |
| Undistributed net investment income | | 930,412 | | |
| Net assets | | | | $3,812,354,087 |
| Shares of beneficial interest outstanding | | | | 168,803,295 |
17
Statement of Assets and Liabilities (unaudited) – continued
| | | | |
| Class A shares | | | | |
Net assets | | $2,231,610,260 | | |
Shares outstanding | | 98,713,282 | | |
Net asset value per share | | | | $22.61 |
Offering price per share (100 / 94.25 × net asset value per share) | | | | $23.99 |
| Class B shares | | | | |
Net assets | | $224,185,569 | | |
Shares outstanding | | 10,314,061 | | |
Net asset value and offering price per share | | | | $21.74 |
| Class C shares | | | | |
Net assets | | $347,755,076 | | |
Shares outstanding | | 16,049,894 | | |
Net asset value and offering price per share | | | | $21.67 |
| Class I shares | | | | |
Net assets | | $893,280,795 | | |
Shares outstanding | | 38,556,918 | | |
Net asset value, offering price, and redemption price per share | | | | $23.17 |
| Class R shares | | | | |
Net assets | | $29,215,999 | | |
Shares outstanding | | 1,298,678 | | |
Net asset value, offering price, and redemption price per share | | | | $22.50 |
| Class R1 shares | | | | |
Net assets | | $3,100,448 | | |
Shares outstanding | | 145,266 | | |
Net asset value, offering price, and redemption price per share | | | | $21.34 |
| Class R2 shares | | | | |
Net assets | | $2,113,139 | | |
Shares outstanding | | 98,388 | | |
Net asset value, offering price, and redemption price per share | | | | $21.48 |
| Class R3 shares | | | | |
Net assets | | $36,512,808 | | |
Shares outstanding | | 1,646,769 | | |
Net asset value, offering price, and redemption price per share | | | | $22.17 |
| Class R4 shares | | | | |
Net assets | | $22,300,430 | | |
Shares outstanding | | 988,997 | | |
Net asset value, offering price, and redemption price per share | | | | $22.55 |
18
Statement of Assets and Liabilities (unaudited) – continued
| | | | |
| Class R5 shares | | | | |
Net assets | | $17,396,527 | | |
Shares outstanding | | 768,888 | | |
Net asset value, offering price, and redemption price per share | | | | $22.63 |
| Class 529A shares | | | | |
Net assets | | $3,204,612 | | |
Shares outstanding | | 143,401 | | |
Net asset value per share | | | | $22.35 |
Offering price per share (100 / 94.25 × net asset value per share) | | | | $23.71 |
| Class 529B shares | | | | |
Net assets | | $860,781 | | |
Shares outstanding | | 40,406 | | |
Net asset value and offering price per share | | | | $21.30 |
| Class 529C shares | | | | |
Net assets | | $817,643 | | |
Shares outstanding | | 38,347 | | |
Net asset value and offering price per share | | | | $21.32 |
| (c) | Non-cash collateral is not included. |
On sales of $50,000 or more, the offering prices of Class A and Class 529A shares are reduced. A contingent deferred sales charge may be imposed on redemptions of Class A, Class B, Class C, Class 529B, and Class 529C shares.
See Notes to Financial Statements
19
Financial Statements
STATEMENT OF OPERATIONS
Six months ended 3/31/08 (unaudited)
This statement describes how much your fund earned in investment income and accrued in expenses. It also describes any gains and/or losses generated by fund operations.
| | | | | | |
| Net investment income | | | | | | |
| Income | | | | | | |
Dividends | | $35,065,766 | | | | |
Dividends from underlying funds | | 67,035 | | | | |
Interest | | 922,633 | | | | |
Foreign taxes withheld | | (1,912,828 | ) | | | |
| Total investment income | | | | | $34,142,606 | |
| Expenses | | | | | | |
Management fee | | $20,059,010 | | | | |
Distribution and service fees | | 8,083,119 | | | | |
Program manager fees | | 6,437 | | | | |
Shareholder servicing costs | | 2,986,072 | | | | |
Administrative services fee | | 254,610 | | | | |
Retirement plan administration and services fees | | 36,650 | | | | |
Independent trustees’ compensation | | 23,796 | | | | |
Custodian fee | | 705,506 | | | | |
Shareholder communications | | 210,000 | | | | |
Auditing fees | | 28,285 | | | | |
Legal fees | | 29,377 | | | | |
Miscellaneous | | 224,865 | | | | |
| Total expenses | | | | | $32,647,727 | |
Fees paid indirectly | | (6,654 | ) | | | |
Reduction of expenses by investment adviser and distributor | | (650,388 | ) | | | |
| Net expenses | | | | | $31,990,685 | |
| Net investment income | | | | | $2,151,921 | |
| Realized and unrealized gain (loss) on investments | | | | | | |
| Realized gain (loss) (identified cost basis) | | | | | | |
Investment transactions | | $274,904,037 | | | | |
Foreign currency transactions | | (934,772 | ) | | | |
Net realized gain (loss) on investments
and foreign currency transactions | | | | | $273,969,265 | |
| Change in unrealized appreciation (depreciation) | | | | | | |
Investments (net of $1,034,489 decrease in deferred
country tax) | | $(765,757,607 | ) | | | |
Translation of assets and liabilities in foreign currencies | | (119,666 | ) | | | |
Net unrealized gain (loss) on investments
and foreign currency translation | | | | | $(765,877,273 | ) |
Net realized and unrealized gain (loss) on investments
and foreign currency | | | | | $(491,908,008 | ) |
| Change in net assets from operations | | | | | $(489,756,087 | ) |
See Notes to Financial Statements
20
Financial Statements
STATEMENTS OF CHANGES IN NET ASSETS
These statements describe the increases and/or decreases in net assets resulting from operations, any distributions, and any shareholder transactions.
| | | | | | |
| | | Six months ended
3/31/08 | | | Year ended
9/30/07 | |
| Change in net assets | | (unaudited) | | | | |
| From operations | | | | | | |
| Net investment income | | $2,151,921 | | | $38,638,575 | |
Net realized gain (loss) on investments and foreign
currency transactions | | 273,969,265 | | | 891,368,819 | |
Net unrealized gain (loss) on investments and foreign
currency translation | | (765,877,273 | ) | | 215,946,398 | |
| Change in net assets from operations | | $(489,756,087 | ) | | $1,145,953,792 | |
| Distributions declared to shareholders | | | | | | |
| From net investment income | | | | | | |
Class A | | $(24,163,466 | ) | | $(22,091,946 | ) |
Class B | | (376,544 | ) | | (460,593 | ) |
Class C | | (772,620 | ) | | (918,618 | ) |
Class I | | (11,893,368 | ) | | (9,199,175 | ) |
Class R | | (214,881 | ) | | (294,678 | ) |
Class R1 | | (16,669 | ) | | (4,147 | ) |
Class R2 | | (15,660 | ) | | (9,919 | ) |
Class R3 | | (275,619 | ) | | (172,957 | ) |
Class R4 | | (214,335 | ) | | (86,964 | ) |
Class R5 | | (220,734 | ) | | (186,371 | ) |
Class 529A | | (21,867 | ) | | (16,567 | ) |
Class 529B | | (837 | ) | | (1,500 | ) |
Class 529C | | (611 | ) | | (247 | ) |
| From net realized gain on investments | | | | | | |
Class A | | (475,752,013 | ) | | (255,439,302 | ) |
Class B | | (50,310,374 | ) | | (30,402,266 | ) |
Class C | | (79,656,967 | ) | | (43,456,896 | ) |
Class I | | (172,293,681 | ) | | (76,340,811 | ) |
Class R | | (6,170,021 | ) | | (4,162,288 | ) |
Class R1 | | (668,584 | ) | | (129,106 | ) |
Class R2 | | (426,867 | ) | | (121,013 | ) |
Class R3 | | (7,439,660 | ) | | (2,570,447 | ) |
Class R4 | | (4,163,726 | ) | | (911,460 | ) |
Class R5 | | (3,542,386 | ) | | (1,620,424 | ) |
Class 529A | | (610,379 | ) | | (267,877 | ) |
Class 529B | | (181,931 | ) | | (75,974 | ) |
Class 529C | | (164,118 | ) | | (71,625 | ) |
| Total distributions declared to shareholders | | $(839,567,918 | ) | | $(449,013,171 | ) |
21
Statements of Changes in Net Assets – continued
| | | | | | |
| | | Six months ended
3/31/08 | | | Year ended
9/30/07 | |
| | | (unaudited) | | | | |
| Change in net assets from fund share transactions | | $299,873,000 | | | $(125,213,814 | ) |
| Redemption fees | | $— | | | $21,900 | |
| Total change in net assets | | $(1,029,451,005 | ) | | $571,748,707 | |
| Net assets | | | | | | |
| At beginning of period | | 4,841,805,092 | | | 4,270,056,385 | |
| At end of period (including undistributed net investment income of $930,412 and $36,965,702, respectively) | | $3,812,354,087 | | | $4,841,805,092 | |
See Notes to Financial Statements
22
Financial Statements
FINANCIAL HIGHLIGHTS
The financial highlights table is intended to help you understand the fund’s financial performance for the semiannual period and the past 5 fiscal years (or life of a particular share class, if shorter). Certain information reflects financial results for a single fund share. The total returns in the table represent the rate by which an investor would have earned (or lost) on an investment in the fund share class (assuming reinvestment of all distributions) held for the entire period.
| | | | | | | | | | | | | | | | | |
| | | Six months
ended
3/31/08 (unaudited) | | | Years ended 9/30 |
| Class A | | | 2007 | | | 2006 | | | 2005 | | | 2004 | | | 2003 |
| | | | | | | | | | | | | | | | |
Net asset value, beginning
of period | | $30.87 | | | $26.64 | | | $24.15 | | | $19.62 | | | $15.48 | | | $11.82 |
Income (loss) from
investment operations | | | | | | | | | | | | | | | | | |
Net investment income (d) | | $0.02 | | | $0.25 | | | $0.20 | | | $0.11 | | | $0.07 | | | $0.07 |
Net realized and unrealized gain (loss) on investments and foreign currency | | (2.78 | ) | | 6.84 | | | 4.07 | | | 5.54 | | | 4.18 | | | 3.59 |
| Total from investment operations | | $(2.76 | ) | | $7.09 | | | $4.27 | | | $5.65 | | | $4.25 | | | $3.66 |
Less distributions declared
to shareholders | | | | | | | | | | | | | | | | | |
From net investment income | | $(0.27 | ) | | $(0.23 | ) | | $(0.13 | ) | | $— | | | $(0.01 | ) | | $— |
From net realized gain
on investments | | (5.23 | ) | | (2.63 | ) | | (1.65 | ) | | (1.12 | ) | | (0.10 | ) | | — |
Total distributions declared
to shareholders | | $(5.50 | ) | | $(2.86 | ) | | $(1.78 | ) | | $(1.12 | ) | | $(0.11 | ) | | $— |
Redemption fees added to
paid-in capital (d) | | $— | | | $0.00 | (w) | | $0.00 | (w) | | $0.00 | (w) | | $0.00 | (w) | | $— |
| Net asset value, end of period | | $22.61 | | | $30.87 | | | $26.64 | | | $24.15 | | | $19.62 | | | $15.48 |
| Total return (%) (r)(s)(t) | | (10.39 | )(n) | | 28.17 | | | 18.69 | | | 29.77 | | | 27.55 | | | 31.08 |
| Ratios (%) (to average net assets) and Supplemental data: | | | | | | | | | | | | | | | | | |
Expenses before
expense reductions (f) | | 1.49 | (a) | | 1.51 | | | 1.55 | | | 1.61 | | | 1.63 | | | 1.81 |
Expenses after
expense reductions (f) | | 1.44 | (a) | | 1.46 | | | 1.55 | | | 1.61 | | | 1.63 | | | 1.62 |
| Net investment income | | 0.14 | (a) | | 0.88 | | | 0.77 | | | 0.49 | | | 0.38 | | | 0.51 |
| Portfolio turnover | | 35 | | | 67 | | | 68 | | | 55 | | | 61 | | | 88 |
Net assets at end of period
(000 Omitted) | | $2,231,610 | | | $2,891,693 | | | $2,635,185 | | | $1,984,799 | | | $1,033,312 | | | $371,042 |
See Notes to Financial Statements
23
Financial Highlights – continued
| | | | | | | | | | | | | | | | | | |
| | | Six months
ended
3/31/08 (unaudited) | | | Years ended 9/30 | |
| Class B | | | 2007 | | | 2006 | | | 2005 | | | 2004 | | | 2003 | |
| | | | | | | | | | | | | | | | | |
Net asset value, beginning
of period | | $29.76 | | | $25.77 | | | $23.44 | | | $19.19 | | | $15.23 | | | $11.70 | |
Income (loss) from
investment operations | | | | | | | | | | | | | | | | | | |
Net investment income (loss) (d) | | $(0.07 | ) | | $0.05 | | | $0.03 | | | $(0.04 | ) | | $(0.05 | ) | | $(0.02 | ) |
Net realized and unrealized
gain (loss) on investments and
foreign currency | | (2.68 | ) | | 6.61 | | | 3.95 | | | 5.41 | | | 4.11 | | | 3.55 | |
| Total from investment operations | | $(2.75 | ) | | $6.66 | | | $3.98 | | | $5.37 | | | $4.06 | | | $3.53 | |
Less distributions declared
to shareholders | | | | | | | | | | | | | | | | | | |
From net investment income | | $(0.04 | ) | | $(0.04 | ) | | $— | | | $— | | | $— | | | $— | |
From net realized gain
on investments | | (5.23 | ) | | (2.63 | ) | | (1.65 | ) | | (1.12 | ) | | (0.10 | ) | | — | |
Total distributions declared
to shareholders | | $(5.27 | ) | | $(2.67 | ) | | $(1.65 | ) | | $(1.12 | ) | | $(0.10 | ) | | $— | |
Redemption fees added to
paid-in capital (d) | | $— | | | $0.00 | (w) | | $0.00 | (w) | | $0.00 | (w) | | $0.00 | (w) | | $— | |
| Net asset value, end of period | | $21.74 | | | $29.76 | | | $25.77 | | | $23.44 | | | $19.19 | | | $15.23 | |
| Total return (%) (r)(s)(t) | | (10.71 | )(n) | | 27.30 | | | 17.92 | | | 28.94 | | | 26.73 | | | 30.17 | |
Ratios (%) (to average net
assets) and Supplemental data: | | | | | | | | | | | | | | | | | | |
Expenses before
expense reductions (f) | | 2.14 | (a) | | 2.16 | | | 2.20 | | | 2.26 | | | 2.28 | | | 2.46 | |
Expenses after
expense reductions (f) | | 2.14 | (a) | | 2.16 | | | 2.20 | | | 2.26 | | | 2.28 | | | 2.27 | |
| Net investment income (loss) | | (0.57 | )(a) | | 0.16 | | | 0.10 | | | (0.21 | ) | | (0.28 | ) | | (0.17 | ) |
| Portfolio turnover | | 35 | | | 67 | | | 68 | | | 55 | | | 61 | | | 88 | |
Net assets at end of period
(000 Omitted) | | $224,186 | | | $301,724 | | | $311,077 | | | $277,244 | | | $186,920 | | | $84,767 | |
See Notes to Financial Statements
24
Financial Highlights – continued
| | | | | | | | | | | | | | | | | | |
| | | Six months
ended
3/31/08 (unaudited) | | | Years ended 9/30 | |
| Class C | | | 2007 | | | 2006 | | | 2005 | | | 2004 | | | 2003 | |
| | | | | | | | | | | | | | | | | |
Net asset value, beginning
of period | | $29.69 | | | $25.74 | | | $23.41 | | | $19.17 | | | $15.22 | | | $11.69 | |
Income (loss) from
investment operations | | | | | | | | | | | | | | | | | | |
Net investment income (loss) (d) | | $(0.07 | ) | | $0.05 | | | $0.03 | | | $(0.04 | ) | | $(0.05 | ) | | $(0.02 | ) |
Net realized and unrealized
gain (loss) on investments and
foreign currency | | (2.67 | ) | | 6.59 | | | 3.95 | | | 5.40 | | | 4.10 | | | 3.55 | |
| Total from investment operations | | $(2.74 | ) | | $6.64 | | | $3.98 | | | $5.36 | | | $4.05 | | | $3.53 | |
Less distributions declared
to shareholders | | | | | | | | | | | | | | | | | | |
From net investment income | | $(0.05 | ) | | $(0.06 | ) | | $(0.00 | ) | | $— | | | $— | | | $— | |
From net realized gain
on investments | | (5.23 | ) | | (2.63 | ) | | (1.65 | ) | | (1.12 | ) | | (0.10 | ) | | — | |
Total distributions declared
to shareholders | | $(5.28 | ) | | $(2.69 | ) | | $(1.65 | ) | | $(1.12 | ) | | $(0.10 | ) | | $— | |
Redemption fees added to
paid-in capital (d) | | $— | | | $0.00 | (w) | | $0.00 | (w) | | $0.00 | (w) | | $0.00 | (w) | | $— | |
| Net asset value, end of period | | $21.67 | | | $29.69 | | | $25.74 | | | $23.41 | | | $19.17 | | | $15.22 | |
| Total return (%) (r)(s)(t) | | (10.70 | )(n) | | 27.24 | | | 17.96 | | | 28.92 | | | 26.69 | | | 30.20 | |
| Ratios (%) (to average net assets) and Supplemental data: | | | | | | | | | | | | | | | | | | |
Expenses before
expense reductions (f) | | 2.14 | (a) | | 2.16 | | | 2.20 | | | 2.26 | | | 2.28 | | | 2.46 | |
Expenses after
expense reductions (f) | | 2.14 | (a) | | 2.16 | | | 2.20 | | | 2.26 | | | 2.28 | | | 2.27 | |
| Net investment income (loss) | | (0.58 | )(a) | | 0.18 | | | 0.11 | | | (0.17 | ) | | (0.26 | ) | | (0.17 | ) |
| Portfolio turnover | | 35 | | | 67 | | | 68 | | | 55 | | | 61 | | | 88 | |
Net assets at end of period
(000 Omitted) | | $347,755 | | | $472,596 | | | $435,798 | | | $339,331 | | | $189,941 | | | $69,101 | |
See Notes to Financial Statements
25
Financial Highlights – continued
| | | | | | | | | | | | | | | | | |
| | | Six months
ended
3/31/08 (unaudited) | | | Years ended 9/30 |
| Class I | | | 2007 | | | 2006 | | | 2005 | | | 2004 | | | 2003 |
| | | | | | | | | | | | | | | | |
Net asset value, beginning
of period | | $31.55 | | | $27.18 | | | $24.59 | | | $19.89 | | | $15.65 | | | $11.91 |
Income (loss) from
investment operations | | | | | | | | | | | | | | | | | |
Net investment income (d) | | $0.06 | | | $0.35 | | | $0.29 | | | $0.19 | | | $0.14 | | | $0.12 |
Net realized and unrealized gain (loss) on investments and foreign currency | | (2.85 | ) | | 6.97 | | | 4.14 | | | 5.63 | | | 4.23 | | | 3.62 |
| Total from investment operations | | $(2.79 | ) | | $7.32 | | | $4.43 | | | $5.82 | | | $4.37 | | | $3.74 |
Less distributions declared
to shareholders | | | | | | | | | | | | | | | | | |
From net investment income | | $(0.36 | ) | | $(0.32 | ) | | $(0.19 | ) | | $— | | | $(0.03 | ) | | $— |
From net realized gain
on investments | | (5.23 | ) | | (2.63 | ) | | (1.65 | ) | | (1.12 | ) | | (0.10 | ) | | — |
Total distributions declared
to shareholders | | $(5.59 | ) | | $(2.95 | ) | | $(1.84 | ) | | $(1.12 | ) | | $(0.13 | ) | | $— |
Redemption fees added to
paid-in capital (d) | | $— | | | $0.00 | (w) | | $0.00 | (w) | | $0.00 | (w) | | $0.00 | (w) | | $— |
| Net asset value, end of period | | $23.17 | | | $31.55 | | | $27.18 | | | $24.59 | | | $19.89 | | | $15.65 |
| Total return (%) (r)(s) | | (10.26 | )(n) | | 28.54 | | | 19.09 | | | 30.24 | | | 28.05 | | | 31.40 |
| Ratios (%) (to average net assets) and Supplemental data: | | | | | | | | | | | | | | | | | |
Expenses before
expense reductions (f) | | 1.14 | (a) | | 1.16 | | | 1.20 | | | 1.26 | | | 1.29 | | | 1.46 |
Expenses after
expense reductions (f) | | 1.14 | (a) | | 1.16 | | | 1.20 | | | 1.26 | | | 1.29 | | | 1.27 |
| Net investment income | | 0.48 | (a) | | 1.19 | | | 1.11 | | | 0.87 | | | 0.75 | | | 0.89 |
| Portfolio turnover | | 35 | | | 67 | | | 68 | | | 55 | | | 61 | | | 88 |
Net assets at end of period
(000 Omitted) | | $893,281 | | | $1,040,477 | | | $791,709 | | | $515,202 | | | $232,247 | | | $69,214 |
See Notes to Financial Statements
26
Financial Highlights – continued
| | | | | | | | | | | | | | | | | | |
| | | Six months
ended
3/31/08 (unaudited) | | | Years ended 9/30 | |
| Class R | | | 2007 | | | 2006 | | | 2005 | | | 2004 | | | 2003 (i) | |
| | | | | | | | | | | | | | | | | |
Net asset value, beginning
of period | | $30.69 | | | $26.51 | | | $24.05 | | | $19.57 | | | $15.47 | | | $12.22 | |
Income (loss) from
investment operations | | | | | | | | | | | | | | | | | | |
Net investment income (loss) (d) | | $(0.01 | ) | | $0.19 | | | $0.15 | | | $0.08 | | | $0.06 | | | $0.04 | |
Net realized and unrealized
gain (loss) on investments and
foreign currency | | (2.77 | ) | | 6.81 | | | 4.07 | | | 5.52 | | | 4.16 | | | 3.21 | |
| Total from investment operations | | $(2.78 | ) | | $7.00 | | | $4.22 | | | $5.60 | | | $4.22 | | | $3.25 | |
Less distributions declared
to shareholders | | | | | | | | | | | | | | | | | | |
From net investment income | | $(0.18 | ) | | $(0.19 | ) | | $(0.11 | ) | | $— | | | $(0.02 | ) | | $— | |
From net realized gain
on investments | | (5.23 | ) | | (2.63 | ) | | (1.65 | ) | | (1.12 | ) | | (0.10 | ) | | — | |
Total distributions declared
to shareholders | | $(5.41 | ) | | $(2.82 | ) | | $(1.76 | ) | | $(1.12 | ) | | $(0.12 | ) | | $— | |
Redemption fees added to
paid-in capital (d) | | $— | | | $0.00 | (w) | | $0.00 | (w) | | $0.00 | (w) | | $0.00 | (w) | | $— | |
| Net asset value, end of period | | $22.50 | | | $30.69 | | | $26.51 | | | $24.05 | | | $19.57 | | | $15.47 | |
| Total return (%) (r)(s) | | (10.48 | )(n) | | 27.92 | | | 18.54 | | | 29.58 | | | 27.40 | | | 26.60 | (n) |
Ratios (%) (to average net
assets) and Supplemental data: | | | | | | | | | | | | | | | | | | |
Expenses before
expense reductions (f) | | 1.64 | (a) | | 1.66 | | | 1.70 | | | 1.76 | | | 1.79 | | | 1.96 | (a) |
Expenses after
expense reductions (f) | | 1.64 | (a) | | 1.66 | | | 1.70 | | | 1.76 | | | 1.79 | | | 1.77 | (a) |
| Net investment income (loss) | | (0.05 | )(a) | | 0.67 | | | 0.61 | | | 0.37 | | | 0.34 | | | 0.44 | (a) |
| Portfolio turnover | | 35 | | | 67 | | | 68 | | | 55 | | | 61 | | | 88 | |
Net assets at end of period
(000 Omitted) | | $29,216 | | | $39,655 | | | $42,498 | | | $29,525 | | | $12,683 | | | $1,596 | |
See Notes to Financial Statements
27
Financial Highlights – continued
| | | | | | | | | | | | |
| | | Six months
ended
3/31/08 (unaudited) | | | Years ended 9/30 | |
| Class R1 | | | 2007 | | | 2006 | | | 2005 (i) | |
| | | | | | | | | | | |
Net asset value, beginning
of period | | $29.42 | | | $25.58 | | | $23.43 | | | $21.18 | |
Income (loss) from
investment operations | | | | | | | | | | | | |
Net investment income (loss) (d) | | $(0.08 | ) | | $0.05 | | | $0.01 | | | $0.00 | (w) |
Net realized and unrealized
gain (loss) on investments and
foreign currency | | (2.64 | ) | | 6.50 | | | 3.93 | | | 2.25 | (g) |
| Total from investment operations | | $(2.72 | ) | | $6.55 | | | $3.94 | | | $2.25 | |
Less distributions declared
to shareholders | | | | | | | | | | | | |
From net investment income | | $(0.13 | ) | | $(0.08 | ) | | $(0.14 | ) | | $— | |
From net realized gain
on investments | | (5.23 | ) | | (2.63 | ) | | (1.65 | ) | | — | |
Total distributions declared
to shareholders | | $(5.36 | ) | | $(2.71 | ) | | $(1.79 | ) | | $— | |
Redemption fees added to
paid-in capital (d) | | $— | | | $0.00 | (w) | | $0.00 | (w) | | $0.00 | (w) |
| Net asset value, end of period | | $21.34 | | | $29.42 | | | $25.58 | | | $23.43 | |
| Total return (%) (r)(s) | | (10.76 | )(n) | | 27.10 | | | 17.83 | | | 10.62 | (n) |
Ratios (%) (to average net
assets) and Supplemental data: | | | | | | | | | | | | |
Expenses before
expense reductions (f) | | 2.23 | (a) | | 2.30 | | | 2.40 | | | 2.47 | (a) |
Expenses after
expense reductions (f) | | 2.23 | (a) | | 2.26 | | | 2.30 | | | 2.47 | (a) |
| Net investment income (loss) | | (0.63 | )(a) | | 0.17 | | | 0.05 | | | 0.01 | (a) |
| Portfolio turnover | | 35 | | | 67 | | | 68 | | | 55 | |
Net assets at end of period
(000 Omitted) | | $3,100 | | | $3,413 | | | $1,287 | | | $192 | |
See Notes to Financial Statements
28
Financial Highlights – continued
| | | | | | | | | | | | |
| | | Six months
ended
3/31/08 (unaudited) | | | Years ended 9/30 | |
| Class R2 | | | 2007 | | | 2006 | | | 2005 (i) | |
| | | | | | | | | | | |
Net asset value, beginning
of period | | $29.57 | | | $25.73 | | | $23.46 | | | $21.18 | |
Income (loss) from
investment operations | | | | | | | | | | | | |
Net investment income (loss) (d) | | $(0.02 | ) | | $0.12 | | | $0.06 | | | $0.03 | |
Net realized and unrealized
gain (loss) on investments and
foreign currency | | (2.65 | ) | | 6.57 | | | 3.98 | | | 2.25 | (g) |
| Total from investment operations | | $(2.67 | ) | | $6.69 | | | $4.04 | | | $2.28 | |
Less distributions declared
to shareholders | | | | | | | | | | | | |
From net investment income | | $(0.19 | ) | | $(0.22 | ) | | $(0.12 | ) | | $— | |
From net realized gain
on investments | | (5.23 | ) | | (2.63 | ) | | (1.65 | ) | | — | |
Total distributions declared
to shareholders | | $(5.42 | ) | | $(2.85 | ) | | $(1.77 | ) | | $— | |
Redemption fees added to
paid-in capital (d) | | $— | | | $0.00 | (w) | | $0.00 | (w) | | $0.00 | (w) |
| Net asset value, end of period | | $21.48 | | | $29.57 | | | $25.73 | | | $23.46 | |
| Total return (%) (r)(s) | | (10.51 | )(n) | | 27.56 | | | 18.25 | | | 10.76 | (n) |
Ratios (%) (to average net
assets) and Supplemental data: | | | | | | | | | | | | |
Expenses before
expense reductions (f) | | 1.77 | (a) | | 1.97 | | | 2.10 | | | 2.17 | (a) |
Expenses after
expense reductions (f) | | 1.77 | (a) | | 1.91 | | | 1.95 | | | 2.17 | (a) |
| Net investment income (loss) | | (0.13 | )(a) | | 0.43 | | | 0.26 | | | 0.33 | (a) |
| Portfolio turnover | | 35 | | | 67 | | | 68 | | | 55 | |
Net assets at end of period
(000 Omitted) | | $2,113 | | | $2,185 | | | $878 | | | $170 | |
See Notes to Financial Statements
29
Financial Highlights – continued
| | | | | | | | | | | | | | | |
| | | Six months
ended
3/31/08 (unaudited) | | | Years ended 9/30 | |
| Class R3 | | | 2007 | | | 2006 | | | 2005 | | | 2004 (i) | |
| | | | | | | | | | | | | | |
Net asset value, beginning
of period | | $30.35 | | | $26.27 | | | $23.91 | | | $19.51 | | | $16.95 | |
Income (loss) from
investment operations | | | | | | | | | | | | | | | |
Net investment income (loss) (d) | | $(0.01 | ) | | $0.16 | | | $0.14 | | | $0.10 | | | $(0.11 | ) |
Net realized and unrealized
gain (loss) on investments and
foreign currency | | (2.75 | ) | | 6.73 | | | 4.01 | | | 5.42 | | | 2.80 | |
| Total from investment operations | | $(2.76 | ) | | $6.89 | | | $4.15 | | | $5.52 | | | $2.69 | |
Less distributions declared
to shareholders | | | | | | | | | | | | | | | |
From net investment income | | $(0.19 | ) | | $(0.18 | ) | | $(0.14 | ) | | $— | | | $(0.03 | ) |
From net realized gain
on investments | | (5.23 | ) | | (2.63 | ) | | (1.65 | ) | | (1.12 | ) | | (0.10 | ) |
Total distributions declared
to shareholders | | $(5.42 | ) | | $(2.81 | ) | | $(1.79 | ) | | $(1.12 | ) | | $(0.13 | ) |
Redemption fees added to
paid-in capital (d) | | $— | | | $0.00 | (w) | | $0.00 | (w) | | $0.00 | (w) | | $0.00 | (w) |
| Net asset value, end of period | | $22.17 | | | $30.35 | | | $26.27 | | | $23.91 | | | $19.51 | |
| Total return (%) (r)(s) | | (10.54 | )(n) | | 27.75 | | | 18.36 | | | 29.25 | | | 15.99 | (n) |
Ratios (%) (to average net
assets) and Supplemental data: | | | | | | | | | | | | | | | |
Expenses before
expense reductions (f) | | 1.72 | (a) | | 1.85 | | | 1.95 | | | 2.01 | | | 2.05 | (a) |
Expenses after
expense reductions (f) | | 1.72 | (a) | | 1.81 | | | 1.85 | | | 2.01 | | | 2.05 | (a) |
| Net investment income (loss) | | (0.10 | )(a) | | 0.57 | | | 0.54 | | | 0.44 | | | (0.70 | )(a) |
| Portfolio turnover | | 35 | | | 67 | | | 68 | | | 55 | | | 61 | |
Net assets at end of period
(000 Omitted) | | $36,513 | | | $40,709 | | | $23,313 | | | $4,468 | | | $259 | |
See Notes to Financial Statements
30
Financial Highlights – continued
| | | | | | | | | | | | |
| | | Six months
ended
3/31/08 (unaudited) | | | Years ended 9/30 | |
| Class R4 | | | 2007 | | | 2006 | | | 2005 (i) | |
| | | | | | | | | | | |
Net asset value, beginning
of period | | $30.82 | | | $26.64 | | | $24.15 | | | $21.75 | |
Income (loss) from
investment operations | | | | | | | | | | | | |
Net investment income (d) | | $0.02 | | | $0.24 | | | $0.21 | | | $0.12 | |
Net realized and unrealized
gain (loss) on investments and
foreign currency | | (2.79 | ) | | 6.82 | | | 4.06 | | | 2.28 | (g) |
| Total from investment operations | | $(2.77 | ) | | $7.06 | | | $4.27 | | | $2.40 | |
Less distributions declared
to shareholders | | | | | | | | | | | | |
From net investment income | | $(0.27 | ) | | $(0.25 | ) | | $(0.13 | ) | | $— | |
From net realized gain
on investments | | (5.23 | ) | | (2.63 | ) | | (1.65 | ) | | — | |
Total distributions declared
to shareholders | | $(5.50 | ) | | $(2.88 | ) | | $(1.78 | ) | | $— | |
Redemption fees added to
paid-in capital (d) | | $— | | | $0.00(w | ) | | $0.00 | (w) | | $0.00 | (w) |
| Net asset value, end of period | | $22.55 | | | $30.82 | | | $26.64 | | | $24.15 | |
| Total return (%) (r)(s) | | (10.43 | )(n) | | 28.08 | | | 18.71 | | | 11.03 | (n) |
Ratios (%) (to average net
assets) and Supplemental data: | | | | | | | | | | | | |
Expenses before
expense reductions (f) | | 1.47 | (a) | | 1.56 | | | 1.59 | | | 1.68 | (a) |
Expenses after
expense reductions (f) | | 1.47 | (a) | | 1.56 | | | 1.59 | | | 1.68 | (a) |
| Net investment income | | 0.19 | (a) | | 0.84 | | | 0.80 | | | 1.11 | (a) |
| Portfolio turnover | | 35 | | | 67 | | | 68 | | | 55 | |
Net assets at end of period
(000 Omitted) | | $22,300 | | | $21,806 | | | $8,192 | | | $56 | |
See Notes to Financial Statements
31
Financial Highlights – continued
| | | | | | | | | | | | |
| | | Six months
ended
3/31/08 (unaudited) | | | Years ended 9/30 | |
| Class R5 | | | 2007 | | | 2006 | | | 2005 (i) | |
| | | | | | | | | | | |
Net asset value, beginning
of period | | $30.92 | | | $26.70 | | | $24.19 | | | $21.75 | |
Income (loss) from
investment operations | | | | | | | | | | | | |
Net investment income (d) | | $0.05 | | | $0.34 | | | $0.14 | | | $0.16 | |
Net realized and unrealized
gain (loss) on investments and
foreign currency | | (2.78 | ) | | 6.81 | | | 4.20 | | | 2.28 | (g) |
| Total from investment operations | | $(2.73 | ) | | $7.15 | | | $4.34 | | | $2.44 | |
Less distributions declared
to shareholders | | | | | | | | | | | | |
From net investment income | | $(0.33 | ) | | $(0.30 | ) | | $(0.18 | ) | | $— | |
From net realized gain
on investments | | (5.23 | ) | | (2.63 | ) | | (1.65 | ) | | — | |
Total distributions declared
to shareholders | | $(5.56 | ) | | $(2.93 | ) | | $(1.83 | ) | | $— | |
Redemption fees added to
paid-in capital (d) | | $— | | | $0.00 | (w) | | $0.00 | (w) | | $0.00 | (w) |
| Net asset value, end of period | | $22.63 | | | $30.92 | | | $26.70 | | | $24.19 | |
| Total return (%) (r)(s) | | (10.28 | )(n) | | 28.42 | | | 19.00 | | | 11.22 | (n) |
Ratios (%) (to average net
assets) and Supplemental data: | | | | | | | | | | | | |
Expenses before
expense reductions (f) | | 1.19 | (a) | | 1.26 | | | 1.30 | | | 1.37 | (a) |
Expenses after
expense reductions (f) | | 1.19 | (a) | | 1.26 | | | 1.30 | | | 1.37 | (a) |
| Net investment income | | 0.40 | (a) | | 1.13 | | | 0.52 | | | 1.41 | (a) |
| Portfolio turnover | | 35 | | | 67 | | | 68 | | | 55 | |
Net assets at end of period
(000 Omitted) | | $17,397 | | | $22,080 | | | $16,063 | | | $56 | |
See Notes to Financial Statements
32
Financial Highlights – continued
| | | | | | | | | | | | | | | | | |
| | | Six months
ended
3/31/08 (unaudited) | | | Years ended 9/30 |
| Class 529A | | | 2007 | | | 2006 | | | 2005 | | | 2004 | | | 2003 |
| | | | | | | | | | | | | | | | |
Net asset value, beginning
of period | | $30.54 | | | $26.40 | | | $23.97 | | | $19.52 | | | $15.43 | | | $11.81 |
Income (loss) from
investment operations | | | | | | | | | | | | | | | | | |
Net investment income (loss) (d) | | $(0.01 | ) | | $0.17 | | | $0.13 | | | $0.05 | | | $0.03 | | | $0.07 |
Net realized and unrealized
gain (loss) on investments and
foreign currency | | (2.76 | ) | | 6.76 | | | 4.04 | | | 5.52 | | | 4.16 | | | 3.55 |
| Total from investment operations | | $(2.77 | ) | | $6.93 | | | $4.17 | | | $5.57 | | | $4.19 | | | $3.62 |
Less distributions declared
to shareholders | | | | | | | | | | | | | | | | | |
From net investment income | | $(0.19 | ) | | $(0.16 | ) | | $(0.09 | ) | | $— | | | $— | | | $— |
From net realized gain
on investments | | (5.23 | ) | | (2.63 | ) | | (1.65 | ) | | (1.12 | ) | | (0.10 | ) | | — |
Total distributions declared
to shareholders | | $(5.42 | ) | | $(2.79 | ) | | $(1.74 | ) | | $(1.12 | ) | | $(0.10 | ) | | $— |
Redemption fees added to
paid-in capital (d) | | $— | | | $0.00 | (w) | | $0.00 | (w) | | $0.00 | (w) | | $0.00 | (w) | | $— |
| Net asset value, end of period | | $22.35 | | | $30.54 | | | $26.40 | | | $23.97 | | | $19.52 | | | $15.43 |
| Total return (%) (r)(s)(t) | | (10.53 | )(n) | | 27.78 | | | 18.38 | | | 29.50 | | | 27.23 | | | 30.76 |
Ratios (%) (to average net
assets) and Supplemental data: | | | | | | | | | | | | | | | | | |
Expenses before
expense reductions (f) | | 1.74 | (a) | | 1.76 | | | 1.80 | | | 1.86 | | | 1.88 | | | 2.06 |
Expenses after
expense reductions (f) | | 1.74 | (a) | | 1.76 | | | 1.80 | | | 1.86 | | | 1.88 | | | 1.87 |
| Net investment income (loss) | | (0.10 | )(a) | | 0.58 | | | 0.52 | | | 0.25 | | | 0.16 | | | 0.50 |
| Portfolio turnover | | 35 | | | 67 | | | 68 | | | 55 | | | 61 | | | 88 |
Net assets at end of period
(000 Omitted) | | $3,205 | | | $3,566 | | | $2,642 | | | $1,731 | | | $806 | | | $297 |
See Notes to Financial Statements
33
Financial Highlights – continued
| | | | | | | | | | | | | | | | | | |
| | | Six months
ended
3/31/08 | | | Years ended 9/30 | |
| Class 529B | | | 2007 | | | 2006 | | | 2005 | | | 2004 | | | 2003 | |
| | | (unaudited) | | | | | | | | | | | | | | | | |
Net asset value, beginning
of period | | $29.29 | | | $25.48 | | | $23.25 | | | $19.09 | | | $15.19 | | | $11.70 | |
Income (loss) from
investment operations | | | | | | | | | | | | | | | | | | |
Net investment loss (d) | | $(0.10 | ) | | $(0.01 | ) | | $(0.03 | ) | | $(0.09 | ) | | $(0.09 | ) | | $(0.05 | ) |
Net realized and unrealized
gain (loss) on investments and
foreign currency | | (2.64 | ) | | 6.50 | | | 3.91 | | | 5.37 | | | 4.09 | | | 3.54 | |
| Total from investment operations | | $(2.74 | ) | | $6.49 | | | $3.88 | | | $5.28 | | | $4.00 | | | $3.49 | |
Less distributions declared
to shareholders | | | | | | | | | | | | | | | | | | |
From net investment income | | $(0.02 | ) | | $(0.05 | ) | | $— | | | $— | | | $— | | | $— | |
From net realized gain
on investments | | (5.23 | ) | | (2.63 | ) | | (1.65 | ) | | (1.12 | ) | | (0.10 | ) | | — | |
Total distributions declared
to shareholders | | $(5.25 | ) | | $(2.68 | ) | | $(1.65 | ) | | $(1.12 | ) | | $(0.10 | ) | | $— | |
Redemption fees added to
paid-in capital (d) | | $— | | | $0.00 | (w) | | $0.00 | (w) | | $0.00 | (w) | | $0.00 | (w) | | $— | |
| Net asset value, end of period | | $21.30 | | | $29.29 | | | $25.48 | | | $23.25 | | | $19.09 | | | $15.19 | |
| Total return (%) (r)(s)(t) | | (10.84 | )(n) | | 26.93 | | | 17.62 | | | 28.61 | | | 26.41 | | | 29.83 | |
Ratios (%) (to average net
assets) and Supplemental data: | | | | | | | | | | | | | | | | | | |
Expenses before
expense reductions (f) | | 2.39 | (a) | | 2.41 | | | 2.45 | | | 2.50 | | | 2.53 | | | 2.71 | |
Expenses after
expense reductions (f) | | 2.39 | (a) | | 2.41 | | | 2.45 | | | 2.50 | | | 2.53 | | | 2.52 | |
| Net investment loss | | (0.78 | )(a) | | (0.04 | ) | | (0.10 | ) | | (0.44 | ) | | (0.52 | ) | | (0.39 | ) |
| Portfolio turnover | | 35 | | | 67 | | | 68 | | | 55 | | | 61 | | | 88 | |
Net assets at end of period
(000 Omitted) | | $861 | | | $1,007 | | | $727 | | | $297 | | | $172 | | | $70 | |
See Notes to Financial Statements
34
Financial Highlights – continued
| | | | | | | | | | | | | | | | | | |
| | | Six months
ended
3/31/08 | | | Years ended 9/30 | |
| Class 529C | | | 2007 | | | 2006 | | | 2005 | | | 2004 | | | 2003 | |
| | | (unaudited) | | | | | | | | | | | | | | | | |
Net asset value, beginning
of period | | $29.31 | | | $25.45 | | | $23.22 | | | $19.07 | | | $15.17 | | | $11.69 | |
Income (loss) from
investment operations | | | | | | | | | | | | | | | | | | |
Net investment loss (d) | | $(0.09 | ) | | $(0.02 | ) | | $(0.04 | ) | | $(0.08 | ) | | $(0.09 | ) | | $(0.01 | ) |
Net realized and unrealized
gain (loss) on investments and
foreign currency | | (2.65 | ) | | 6.52 | | | 3.92 | | | 5.35 | | | 4.09 | | | 3.49 | |
| Total from investment operations | | $(2.74 | ) | | $6.50 | | | $3.88 | | | $5.27 | | | $4.00 | | | $3.48 | |
Less distributions declared
to shareholders | | | | | | | | | | | | | | | | | | |
From net investment income | | $(0.02 | ) | | $(0.01 | ) | | $— | | | $— | | | $— | | | $— | |
From net realized gain
on investments | | (5.23 | ) | | (2.63 | ) | | (1.65 | ) | | (1.12 | ) | | (0.10 | ) | | — | |
Total distributions declared
to shareholders | | $(5.25 | ) | | $(2.64 | ) | | $(1.65 | ) | | $(1.12 | ) | | $(0.10 | ) | | $— | |
Redemption fees added to
paid-in capital (d) | | $— | | | $0.00 | (w) | | $0.00 | (w) | | $0.00 | (w) | | $0.00 | (w) | | $— | |
| Net asset value, end of period | | $21.32 | | | $29.31 | | | $25.45 | | | $23.22 | | | $19.07 | | | $15.17 | |
| Total return (%) (r)(s)(t) | | (10.85 | )(n) | | 26.97 | | | 17.64 | | | 28.58 | | | 26.44 | | | 29.88 | |
Ratios (%) (to average net
assets) and Supplemental data: | | | | | | | | | | | | | | | | | | |
Expenses before
expense reductions (f) | | 2.39 | (a) | | 2.41 | | | 2.45 | | | 2.50 | | | 2.53 | | | 2.71 | |
Expenses after
expense reductions (f) | | 2.39 | (a) | | 2.41 | | | 2.45 | | | 2.50 | | | 2.53 | | | 2.52 | |
| Net investment loss | | (0.76 | )(a) | | (0.06 | ) | | (0.14 | ) | | (0.39 | ) | | (0.50 | ) | | (0.09 | ) |
| Portfolio turnover | | 35 | | | 67 | | | 68 | | | 55 | | | 61 | | | 88 | |
Net assets at end of period
(000 Omitted) | | $818 | | | $895 | | | $688 | | | $504 | | | $252 | | | $102 | |
| (d) | Per share data are based on average shares outstanding. |
| (f) | Ratios do not reflect reductions from fees paid indirectly, if applicable. |
| (g) | The per share amount is not in accordance with the net realized and unrealized gain/loss for the period because of the timing of sales of fund shares and the per share amount of realized and unrealized gains and losses at such time. |
| (i) | For the period from the class’ inception, December 31, 2002 (Class R), October 31, 2003 (Class R3) and April 1, 2005 (Classes R1, R2, R4, and R5) through the stated period end. |
| (r) | Certain expenses have been reduced without which performance would have been lower. |
| (s) | From time to time the fund may receive proceeds from litigation settlements, without which performance would be lower. |
| (t) | Total returns do not include any applicable sales charges. |
| (w) | Per share amount was less than $0.01. |
See Notes to Financial Statements
35
NOTES TO FINANCIAL STATEMENTS
(unaudited)
| (1) | | Business and Organization |
MFS International New Discovery Fund (the fund) is a series of MFS Series Trust V (the trust). The trust is organized as a Massachusetts business trust and is registered under the Investment Company Act of 1940, as amended, as an open-end management investment company.
| (2) | | Significant Accounting Policies |
General – The preparation of financial statements in conformity with U.S. generally accepted accounting principles requires management to make estimates and assumptions that affect the reported amounts of assets and liabilities, and disclosure of contingent assets and liabilities at the date of the financial statements and the reported amounts of revenues and expenses during the reporting period. Actual results could differ from those estimates. The fund can invest in foreign securities, including securities of emerging market issuers. Investments in foreign securities are vulnerable to the effects of changes in the relative values of the local currency and the U.S. dollar and to the effects of changes in each country’s legal, political, and economic environment. The markets of emerging markets countries are generally more volatile than the markets of developed countries with more mature economies. All of the risks of investing in foreign securities previously described are heightened when investing in emerging markets countries.
Investment Valuations – Equity securities, including restricted equity securities, are generally valued at the last sale or official closing price as reported by an independent pricing service on the market or exchange on which they are primarily traded. For securities for which there were no sales reported that day, equity securities are generally valued at the last quoted daily bid quotation as reported by an independent pricing service on the market or exchange on which they are primarily traded. For securities held short for which there were no sales reported for the day, the position is generally valued at the last quoted daily ask quotation as reported by an independent pricing service on the market or exchange on which such securities are primarily traded. Short-term instruments with a maturity at issuance of 60 days or less may be valued at amortized cost, which approximates market value. Open-end investment companies are generally valued at net asset value per share. Securities and other assets generally valued on the basis of information from an independent pricing service may also be valued at a broker-dealer bid quotation. The values of foreign securities and other assets and liabilities expressed in foreign currencies are converted to U.S. dollars using the mean of bid and asked prices for rates reported by an independent pricing service.
The Board of Trustees has delegated primary responsibility for determining or causing to be determined the value of the fund’s investments (including any
36
Notes to Financial Statements (unaudited) – continued
fair valuation) to the adviser pursuant to valuation policies and procedures approved by the Board. If the adviser determines that reliable market quotations are not readily available, investments are valued at fair value as determined in good faith by the adviser in accordance with such procedures under the oversight of the Board of Trustees. Under the fund’s valuation policies and procedures, market quotations are not considered to be readily available for most types of debt instruments and floating rate loans and many types of derivatives. These investments are generally valued at fair value based on information from independent pricing services. In addition, investments may be valued at fair value if the adviser determines that an investment’s value has been materially affected by events occurring after the close of the exchange or market on which the investment is principally traded (such as foreign exchange or market) and prior to the determination of the fund’s net asset value, or after the halting of trading of a specific security where trading does not resume prior to the close of the exchange or market on which the security is principally traded. Forward foreign currency contracts are generally valued at the mean of bid and asked prices for the time period interpolated from rates reported by an independent pricing service for proximate time periods. The adviser may rely on independent pricing services or other information (such as the correlation with price movements of similar securities in the same or other markets; the type, cost and investment characteristics of the security; the business and financial condition of the issuer; and trading and other market data) to assist in determining whether to fair value and at what value to fair value an investment. The value of an investment for purposes of calculating the fund’s net asset value can differ depending on the source and method used to determine value. When fair valuation is used, the value of investments used to determine the fund’s net asset value may differ from quoted or published prices for the same investments.
In September 2006, FASB Statement No. 157, Fair Value Measurements (the “Statement”) was issued, and is effective for fiscal years beginning after November 15, 2007 and for all interim periods within those fiscal years. This Statement provides a single definition of fair value, a hierarchy for measuring fair value and expanded disclosures about fair value measurements. Management is evaluating the application of the Statement to the fund, and believes the impact will be limited to expanded disclosures resulting from the adoption of this Statement in the fund’s financial statements.
Repurchase Agreements – The fund may enter into repurchase agreements with institutions that the fund’s investment adviser has determined are creditworthy. Each repurchase agreement is recorded at cost. The fund requires that the securities collateral in a repurchase transaction be transferred to a custodian in a manner sufficient to enable the fund to obtain those securities in the event of a default under the repurchase agreement. The fund monitors,
37
Notes to Financial Statements (unaudited) – continued
on a daily basis, the value of the collateral to ensure that its value, including accrued interest, is greater than amounts owed to the fund under each such repurchase agreement.
Foreign Currency Translation – Purchases and sales of foreign investments, income, and expenses are converted into U.S. dollars based upon currency exchange rates prevailing on the respective dates of such transactions. Gains and losses attributable to foreign currency exchange rates on sales of securities are recorded for financial statement purposes as net realized gains and losses on investments. Gains and losses attributable to foreign exchange rate movements on income and expenses are recorded for financial statement purposes as foreign currency transaction gains and losses. That portion of both realized and unrealized gains and losses on investments that results from fluctuations in foreign currency exchange rates is not separately disclosed.
In March 2008, FASB Statement No. 161, Disclosures about Derivative Instruments and Hedging Activities (the “Standard”) was issued, and is effective for financial statements issued for fiscal years and interim periods beginning after November 15, 2008. This Standard provides enhanced disclosures about the fund’s use of and accounting for derivative instruments and the effect of derivative instruments on the fund’s results of operations and financial position. Management is evaluating the application of the Standard to the fund, and has not at this time determined the impact, if any, resulting from the adoption of this Standard on the fund’s financial statements.
Security Loans – JPMorgan Chase and Co. (“Chase”), as lending agent, may loan the securities of the fund to certain qualified institutions (the “Borrowers”) approved by the fund. The loans are collateralized at all times by cash and/or U.S. Treasury and federal agency obligations in an amount at least equal to the market value of the securities loaned. Security lending activity through Chase is further collateralized by an irrevocable standby letter of credit. Chase provides the fund with indemnification against Borrower default. The fund bears the risk of loss with respect to the investment of cash collateral. On loans collateralized by cash, the cash collateral is invested in short-term securities. A portion of the income generated upon investment of the collateral is remitted to the Borrowers, and the remainder is allocated between the fund and the lending agent. On loans collateralized by U.S. Treasury and/or federal agency obligations, a fee is received from the Borrower, and is allocated between the fund and the lending agent. Net income from securities lending is included in interest income on the Statement of Operations. The dividend and interest income earned on the securities loaned is accounted for in the same manner as other dividend and interest income.
38
Notes to Financial Statements (unaudited) – continued
At March 31, 2008, the value of securities loaned was $304,199,427. These loans were collateralized by cash of $253,795,722 and U.S. Treasury obligations of $62,235,768.
Indemnifications – Under the fund’s organizational documents, its officers and trustees may be indemnified against certain liabilities and expenses arising out of the performance of their duties to the fund. Additionally, in the normal course of business, the fund enters into agreements with service providers that may contain indemnification clauses. The fund’s maximum exposure under these agreements is unknown as this would involve future claims that may be made against the fund that have not yet occurred.
Investment Transactions and Income – Investment transactions are recorded on the trade date. Interest income is recorded on the accrual basis. All premium and discount is amortized or accreted for financial statement purposes in accordance with U.S. generally accepted accounting principles. Dividends received in cash are recorded on the ex-dividend date. Certain dividends from foreign securities will be recorded when the fund is informed of the dividend if such information is obtained subsequent to the ex-dividend date. Dividend and interest payments received in additional securities are recorded on the ex-dividend or ex-interest date in an amount equal to the value of the security on such date. The fund may receive proceeds from litigation settlements. Any proceeds received from litigation involving portfolio holdings are reflected in the Statement of Operations in realized gain/loss if the security has been disposed of by the fund or in unrealized gain/loss if the security is still held by the fund. Any other proceeds from litigation not related to portfolio holdings are reflected as other income in the Statement of Operations.
Fees Paid Indirectly – The fund’s custody fee may be reduced according to an arrangement that measures the value of cash deposited with the custodian by the fund. This amount, for the six months ended March 31, 2008, is shown as a reduction of total expenses on the Statement of Operations.
Tax Matters and Distributions – The fund intends to qualify as a regulated investment company, as defined under Subchapter M of the Internal Revenue Code, and to distribute all of its taxable income, including realized capital gains. As a result, no provision for federal income tax is required. The fund adopted the provisions of FASB Interpretation No. 48, Accounting for Uncertainty in Income Taxes (“the Interpretation”) on the first day of the fund’s fiscal year. The Interpretation prescribes a minimum threshold for financial statement recognition of the benefit of a tax position taken or expected to be taken in a tax return. There was no impact resulting from the adoption of this Interpretation on the fund’s financial statements. Each of the fund’s federal tax returns for the prior three fiscal years remains subject to examination by the Internal Revenue Service. It is the fund’s policy to record
39
Notes to Financial Statements (unaudited) – continued
interest and penalty charges on underpaid taxes associated with its tax positions as interest expense and miscellaneous expense, respectively. No such charges were recorded in the current financial statements. Foreign taxes, if any, have been accrued by the fund in the accompanying financial statements.
Distributions to shareholders are recorded on the ex-dividend date. Income and capital gain distributions are determined in accordance with income tax regulations, which may differ from U.S. generally accepted accounting principles. Certain capital accounts in the financial statements are periodically adjusted for permanent differences in order to reflect their tax character. These adjustments have no impact on net assets or net asset value per share. Temporary differences which arise from recognizing certain items of income, expense, gain or loss in different periods for financial statement and tax purposes will reverse at some time in the future. Distributions in excess of net investment income or net realized gains are temporary overdistributions for financial statement purposes resulting from differences in the recognition or classification of income or distributions for financial statement and tax purposes.
Book/tax differences primarily related to passive foreign investment companies, wash sale loss deferrals, foreign currency transactions, and treating a portion of the proceeds from redemptions as a distribution for tax purposes.
The tax character of distributions made during the current period will be determined at fiscal year end. The tax character of distributions declared to shareholders is as follows:
| | |
| | | 9/30/07 |
Ordinary income (including any
short-term capital gains) | | $93,088,775 |
| Long-term capital gain | | 355,924,396 |
| Total distributions | | $449,013,171 |
The federal tax cost and the tax basis components of distributable earnings were as follows:
| | | |
| As of 3/31/08 | | | |
| Cost of investments | | $3,793,459,052 | |
| Gross appreciation | | 528,766,392 | |
| Gross depreciation | | (270,589,291 | ) |
| Net unrealized appreciation (depreciation) | | $258,177,101 | |
| |
| As of 9/30/07 | | | |
| Undistributed ordinary income | | $191,085,201 | |
| Undistributed long-term capital gain | | 542,275,719 | |
| Other temporary differences | | (1,373,546 | ) |
| Net unrealized appreciation (depreciation) | | 1,024,969,197 | |
The aggregate cost above includes prior fiscal year end tax adjustments.
40
Notes to Financial Statements (unaudited) – continued
Multiple Classes of Shares of Beneficial Interest – The fund offers multiple classes of shares, which differ in their respective distribution and service fees. All shareholders bear the common expenses of the fund based on daily net assets of each class, without distinction between share classes. Dividends are declared separately for each class. Differences in per share dividend rates are generally due to differences in separate class expenses. Class B and Class 529B shares will convert to Class A and Class 529A shares, respectively, approximately eight years after purchase.
| (3) | | Transactions with Affiliates |
Investment Adviser – The fund has an investment advisory agreement with Massachusetts Financial Services Company (MFS) to provide overall investment management and related administrative services and facilities to the fund.
The management fee is computed daily and paid monthly at the following annual rates:
| | | |
| First $500 million of average daily net assets | | 0.975 | % |
| Average daily net assets in excess of $500 million | | 0.925 | % |
The investment adviser has agreed in writing to reduce its management fee to 0.85% of average daily net assets in excess of $5 billion. This written agreement may be rescinded only upon consent of the fund’s Board of Trustees. For the six months ended March 31, 2008, the fund’s average daily net assets did not exceed $5 billion and therefore, the management fee was not reduced.
The management fee incurred for the six months ended March 31, 2008 was equivalent to an annual effective rate of 0.93% of the fund’s average daily net assets.
The investment adviser has agreed in writing to pay a portion of the fund’s operating expenses, exclusive of management, distribution and service, program manager, and certain other fees and expenses, such that operating expenses do not exceed 0.40% annually of the fund’s average daily net assets. This written agreement will continue through January 31, 2009 unless changed or rescinded by the fund’s Board of Trustees. For the six months ended March 31, 2008, the funds actual operating expenses did not exceed the limit and therefore, the investment adviser did not pay any portion of the fund’s expenses.
Distributor – MFS Fund Distributors, Inc. (MFD), a wholly-owned subsidiary of MFS, as distributor, received $25,888 and $1,120 for the six months ended March 31, 2008, as its portion of the initial sales charge on sales of Class A and Class 529A shares of the fund, respectively.
The Board of Trustees has adopted a distribution plan for certain class shares pursuant to Rule 12b-1 of the Investment Company Act of 1940.
41
Notes to Financial Statements (unaudited) – continued
The fund’s distribution plan provides that the fund will pay MFD for services provided by MFD and financial intermediaries in connection with the distribution and servicing of certain share classes. One component of the plan is a distribution fee paid to MFD and another component of the plan is a service fee paid to MFD. MFD may subsequently pay all, or a portion, of the distribution and/or service fees to financial intermediaries.
Distribution Plan Fee Table:
| | | | | | | | | | |
| | | Distribution
Fee Rate | | Service
Fee Rate | | Total
Distribution
Plan (d) | | Annual
Effective
Rate (e) | | Distribution
and Service
Fee |
| Class A | | 0.10% | | 0.25% | | 0.35% | | 0.30% | | $4,482,786 |
| Class B | | 0.75% | | 0.25% | | 1.00% | | 1.00% | | 1,306,520 |
| Class C | | 0.75% | | 0.25% | | 1.00% | | 1.00% | | 2,048,952 |
| Class R | | 0.25% | | 0.25% | | 0.50% | | 0.50% | | $82,684 |
| Class R1 | | 0.75% | | 0.25% | | 1.00% | | 0.79% | | 13,456 |
| Class R2 | | 0.25% | | 0.25% | | 0.50% | | 0.50% | | 5,630 |
| Class R3 | | 0.25% | | 0.25% | | 0.50% | | 0.50% | | 99,612 |
| Class R4 | | — | | 0.25% | | 0.25% | | 0.25% | | 28,642 |
| Class 529A | | 0.25% | | 0.25% | | 0.50% | | 0.35% | | 5,870 |
| Class 529B | | 0.75% | | 0.25% | | 1.00% | | 1.00% | | 4,680 |
| Class 529C | | 0.75% | | 0.25% | | 1.00% | | 1.00% | | 4,287 |
| Total Distribution and Service Fees | | | | | | $8,083,119 |
| (d) | In accordance with the distribution plan for certain classes, the fund pays distribution and/or service fees up to these annual percentage rates of each class’ average daily net assets. |
| (e) | The annual effective rates represent actual fees incurred under the distribution plan for the six months ended March 31, 2008 based on each class’ average daily net assets. 0.05% of the Class A distribution fee is currently being waived under a written waiver arrangement until such time as the fund is available for sale to new investors. For the six months ended March 31, 2008 this waiver amounted to $640,406 and is reflected as a reduction of total expenses on the Statement of Operations. 0.10% of the Class 529A distribution fee is currently being paid by the fund. Payment of the remaining 0.15% of the Class 529A distribution fee is not yet in effect and will be implemented on such date as the fund’s Board of Trustees may determine. Effective March 1, 2008, the distribution fee rate for Class R1 shares increased from 0.50% to 0.75%. |
Certain Class A, Class C and Class 529C shares are subject to a contingent deferred sales charge in the event of a shareholder redemption within 12 months of purchase. Class B and Class 529B shares are subject to a contingent deferred sales charge in the event of a shareholder redemption within six years of purchase. All contingent deferred sales charges are paid to MFD and during the six months ended March 31, 2008, were as follows:
| | |
| | | Amount |
| Class A | | $593 |
| Class B | | $165,309 |
| Class C | | $9,487 |
| Class 529B | | $44 |
| Class 529C | | $— |
42
Notes to Financial Statements (unaudited) – continued
The fund has entered into and may from time to time enter into contracts with program managers and other parties which administer the tuition programs through which an investment in the fund’s 529 share classes is made. The fund has entered into an agreement with MFD pursuant to which MFD receives an annual fee of up to 0.35% of the average daily net assets attributable to each 529 share class. The fee is based on average daily net assets and is currently established at 0.25% annually of average daily net assets of the fund’s 529 share classes. Effective April 1, 2008, the fee will be 0.10%. The fee may only be increased with the approval of the Board of Trustees who oversees the fund. The services provided by MFD, or a third party with which MFD contracts, include recordkeeping and tax reporting and account services, as well as services designed to maintain the program’s compliance with the Internal Revenue Code and other regulatory requirements. Program manager fees for the six months ended March 31, 2008, were as follows:
| | |
| | | Amount |
| Class 529A | | $4,193 |
| Class 529B | | 1,171 |
| Class 529C | | 1,073 |
| Total Program Manager Fees | | $6,437 |
Shareholder Servicing Agent – MFS Service Center, Inc. (MFSC), a wholly-owned subsidiary of MFS, receives a fee from the fund for its services as shareholder servicing agent calculated as a percentage of the average daily net assets of the fund as determined periodically under the supervision of the fund’s Board of Trustees. For the six months ended March 31, 2008, the fee was $626,377, which equated to 0.0291% annually of the fund’s average daily net assets. MFSC also receives payment from the fund for out-of-pocket expenses, sub-accounting and other shareholder servicing costs which may be paid to affiliated and unaffiliated service providers. For the six months ended March 31, 2008, these out-of-pocket expenses, sub-accounting and other shareholder servicing costs amounted to $1,913,806.
Under a Special Servicing Agreement among MFS, each MFS fund which invests in other MFS funds (“MFS fund-of-funds”) and each underlying fund in which a MFS fund-of-funds invests (“underlying funds”), each underlying fund may pay a portion of each MFS fund-of-fund’s transfer agent-related expenses, including sub-accounting fees payable to financial intermediaries, to the extent such payments do not exceed the benefits realized or expected to be realized by the underlying fund from the investment in the underlying fund by the MFS fund-of-fund. For the six months ended March 31, 2008, these costs for the fund amounted to $445,889 and are reflected in the shareholder servicing costs on the Statement of Operations.
43
Notes to Financial Statements (unaudited) – continued
Administrator – MFS provides certain financial, legal, shareholder communications, compliance, and other administrative services to the fund. Under an administrative services agreement, the fund partially reimburses MFS the costs incurred to provide these services. The fund is charged a fixed amount plus a fee based on average daily net assets. The fund’s annual fixed amount is $17,500.
The administrative services fee incurred for the six months ended March 31, 2008 was equivalent to an annual effective rate of 0.0118% of the fund’s average daily net assets.
In addition to the administrative services provided by MFS to the fund as described above, MFS is responsible for providing certain retirement plan administration and services with respect to certain shares. These services include various administrative, recordkeeping, and communication/educational services with respect to the retirement plans which invest in these shares, and may be provided directly by MFS or by a third party. MFS may subsequently pay all, or a portion, of the retirement plan administration and services fee to affiliated or unaffiliated third parties. For the six months ended March 31, 2008, the fund paid MFS an annual retirement plan administration and services fee up to the following annual percentage rates of each class’ average daily net assets:
| | | | | | | | | | |
| | | Beginning
of period
through
12/31/07 | | Effective
1/01/08 | | Effective
3/01/08 | | Annual
Effective
Rate (g) | | Total
Amount |
Class R1 | | 0.35% | | 0.35% | | — | | 0.30% | | $5,084 |
Class R2 | | 0.25% | | — | | — | | 0.13% | | 1,475 |
Class R3 | | 0.15% | | — | | — | | 0.08% | | 15,941 |
Class R4 | | 0.15% | | — | | — | | 0.08% | | 8,787 |
Class R5 | | 0.10% | | — | | — | | 0.06% | | 5,363 |
| Total Retirement Plan Administration and Services Fees | | $36,650 |
| (g) | Effective January 1, 2008, the annual retirement plan administration and services fee was eliminated for Class R2, Class R3, Class R4, and Class R5 shares. Effective March 1, 2008, the annual retirement plan administration and services fee was eliminated for Class R1 shares. |
Trustees’ and Officers’ Compensation – The fund pays compensation to independent trustees in the form of a retainer, attendance fees, and additional compensation to Board and Committee chairpersons. The fund does not pay compensation directly to trustees or officers of the fund who are also officers of the investment adviser, all of whom receive remuneration for their services to the fund from MFS. Certain officers and trustees of the fund are officers or directors of MFS, MFD, and MFSC. The fund has an unfunded retirement benefit deferral plan for certain independent trustees which resulted in a net decrease in expense of $2,837. This amount is included in independent trustees’ compensation for the six months ended March 31, 2008. The liability for deferred retirement benefits payable to certain independent trustees
44
Notes to Financial Statements (unaudited) – continued
amounted to $9,646 at March 31, 2008, and is included in payable for independent trustees’ compensation.
Other – This fund and certain other MFS funds (the funds) have entered into a services agreement (the Agreement) which provides for payment of fees by the funds to Tarantino LLC in return for the provision of services of an Independent Chief Compliance Officer (ICCO) for the funds. The ICCO is an officer of the funds and the sole member of Tarantino LLC. The funds can terminate the Agreement with Tarantino LLC at any time under the terms of the Agreement. For the six months ended March 31, 2008, the fee paid by the fund to Tarantino LLC was $17,776 and is included in miscellaneous expense on the Statement of Operations. MFS has agreed to reimburse the fund for a portion of the payments made by the fund to Tarantino LLC in the amount of $9,982, which is shown as a reduction of total expenses in the Statement of Operations. Additionally, MFS has agreed to bear all expenses associated with office space, other administrative support, and supplies provided to the ICCO.
The fund may invest in a money market fund managed by MFS which seeks preservation of capital and current income. Income earned on this investment is included in dividends from underlying funds on the Statement of Operations. This money market fund does not pay a management fee to MFS.
Purchases and sales of investments, other than U.S. government securities, purchased option transactions, and short-term obligations, aggregated $1,532,053,039 and $1,956,722,719, respectively.
| (5) | | Shares of Beneficial Interest |
The fund’s Declaration of Trust permits the Trustees to issue an unlimited number of full and fractional shares of beneficial interest. Transactions in fund shares were as follows:
| | | | | | | | |
| | | Six months ended
3/31/08 | | Year ended
9/30/07 |
| | | Shares | | Amount | | Shares | | Amount |
| Shares sold | | | | | | | | |
Class A | | 8,791,258 | | $236,259,864 | | 16,344,141 | | $470,202,443 |
Class B | | 201,284 | | 4,853,226 | | 456,614 | | 12,571,100 |
Class C | | 979,369 | | 23,780,149 | | 1,286,494 | | 35,119,870 |
Class I | | 3,158,444 | | 84,813,430 | | 6,334,113 | | 185,317,025 |
Class R | | 470,853 | | 12,555,460 | | 601,097 | | 17,217,658 |
Class R1 | | 41,299 | | 1,079,587 | | 130,850 | | 3,569,322 |
Class R2 | | 30,408 | | 783,643 | | 89,138 | | 2,448,984 |
Class R3 | | 297,594 | | 7,876,426 | | 970,524 | | 27,255,114 |
Class R4 | | 297,113 | | 8,049,794 | | 792,985 | | 22,771,831 |
Class R5 | | 336,222 | | 8,421,050 | | 670,834 | | 19,513,380 |
Class 529A | | 10,117 | | 246,852 | | 18,480 | | 528,662 |
Class 529B | | 1,180 | | 30,307 | | 4,731 | | 129,935 |
Class 529C | | 3,327 | | 81,844 | | 5,721 | | 157,233 |
| | 14,618,468 | | $388,831,632 | | 27,705,722 | | $796,802,557 |
45
Notes to Financial Statements (unaudited) – continued
| | | | | | | | | | | | |
| | | Six months ended
3/31/08 | | | Year ended
9/30/07 | |
| | | Shares | | | Amount | | | Shares | | | Amount | |
| Shares issued to shareholders in reinvestment of distributions | | | | | | | | | | | | |
Class A | | 17,877,191 | | | $439,600,186 | | | 9,070,962 | | | $244,734,559 | |
Class B | | 1,892,641 | | | 44,836,661 | | | 1,031,476 | | | 26,973,094 | |
Class C | | 2,481,681 | | | 58,617,373 | | | 1,234,466 | | | 32,219,567 | |
Class I | | 6,534,132 | | | 164,529,431 | | | 2,778,595 | | | 76,439,133 | |
Class R | | 132,448 | | | 3,242,327 | | | 122,529 | | | 3,292,345 | |
Class R1 | | 29,448 | | | 685,253 | | | 5,149 | | | 133,253 | |
Class R2 | | 18,936 | | | 442,527 | | | 5,005 | | | 129,842 | |
Class R3 | | 318,691 | | | 7,690,022 | | | 102,719 | | | 2,732,308 | |
Class R4 | | 178,551 | | | 4,378,060 | | | 37,048 | | | 998,424 | |
Class R5 | | 621 | | | 15,264 | | | 270 | | | 7,295 | |
Class 529A | | 25,986 | | | 632,246 | | | 10,629 | | | 284,444 | |
Class 529B | | 7,864 | | | 182,767 | | | 3,003 | | | 77,474 | |
Class 529C | | 7,082 | | | 164,729 | | | 2,786 | | | 71,872 | |
| | 29,505,272 | | | $725,016,846 | | | 14,404,637 | | | $388,093,610 | |
| Shares reacquired | | | | | | | | | | | | |
Class A | | (21,623,165 | ) | | $(545,273,951 | ) | | (30,650,152 | ) | | $(884,151,747 | ) |
Class B | | (1,918,754 | ) | | (45,875,461 | ) | | (3,418,584 | ) | | (94,855,064 | ) |
Class C | | (3,326,793 | ) | | (78,512,470 | ) | | (3,538,099 | ) | | (98,403,931 | ) |
Class I | | (4,111,840 | ) | | (106,714,290 | ) | | (5,265,412 | ) | | (152,664,062 | ) |
Class R | | (596,797 | ) | | (16,192,319 | ) | | (1,034,329 | ) | | (29,875,533 | ) |
Class R1 | | (41,482 | ) | | (966,174 | ) | | (70,319 | ) | | (1,891,987 | ) |
Class R2 | | (24,861 | ) | | (587,730 | ) | | (54,367 | ) | | (1,470,917 | ) |
Class R3 | | (310,731 | ) | | (7,394,060 | ) | | (619,454 | ) | | (17,344,337 | ) |
Class R4 | | (194,279 | ) | | (4,951,804 | ) | | (429,918 | ) | | (12,307,026 | ) |
Class R5 | | (282,033 | ) | | (7,150,857 | ) | | (558,595 | ) | | (16,601,496 | ) |
Class 529A | | (9,460 | ) | | (233,117 | ) | | (12,414 | ) | | (355,135 | ) |
Class 529B | | (3,027 | ) | | (64,921 | ) | | (1,860 | ) | | (52,026 | ) |
Class 529C | | (2,608 | ) | | (58,324 | ) | | (4,985 | ) | | (136,720 | ) |
| | (32,445,830 | ) | | $(813,975,478 | ) | | (45,658,488 | ) | | $(1,310,109,981 | ) |
| Net change | | | | | | | | | | | | |
Class A | | 5,045,284 | | | $130,586,099 | | | (5,235,049 | ) | | $(169,214,745 | ) |
Class B | | 175,171 | | | 3,814,426 | | | (1,930,494 | ) | | (55,310,870 | ) |
Class C | | 134,257 | | | 3,885,052 | | | (1,017,139 | ) | | (31,064,494 | ) |
Class I | | 5,580,736 | | | 142,628,571 | | | 3,847,296 | | | 109,092,096 | |
Class R | | 6,504 | | | (394,532 | ) | | (310,703 | ) | | (9,365,530 | ) |
Class R1 | | 29,265 | | | 798,666 | | | 65,680 | | | 1,810,588 | |
Class R2 | | 24,483 | | | 638,440 | | | 39,776 | | | 1,107,909 | |
Class R3 | | 305,554 | | | 8,172,388 | | | 453,789 | | | 12,643,085 | |
Class R4 | | 281,385 | | | 7,476,050 | | | 400,115 | | | 11,463,229 | |
Class R5 | | 54,810 | | | 1,285,457 | | | 112,509 | | | 2,919,179 | |
Class 529A | | 26,643 | | | 645,981 | | | 16,695 | | | 457,971 | |
Class 529B | | 6,017 | | | 148,153 | | | 5,874 | | | 155,383 | |
Class 529C | | 7,801 | | | 188,249 | | | 3,522 | | | 92,385 | |
| | 11,677,910 | | | $299,873,000 | | | (3,548,129 | ) | | $(125,213,814 | ) |
46
Notes to Financial Statements (unaudited) – continued
The fund is one of several mutual funds in which the MFS funds-of-funds may invest. The MFS funds-of-funds do not invest in the underlying MFS funds for the purpose of exercising management or control. At the end of the period, the MFS International Diversification Fund, MFS Growth Allocation Fund and MFS Aggressive Growth Allocation Fund were the owners of record of approximately 7%, 3% and 3%, respectively, of the value of outstanding voting shares.
In addition, the MFS Lifetime 2020 Fund, MFS Lifetime 2030 Fund and the MFS Lifetime 2040 Fund were each the owners of record of less than 1% of the value of outstanding voting shares.
The fund and other funds managed by MFS participate in a $1 billion unsecured committed line of credit provided by a syndication of banks under a credit agreement. In addition, the fund and other funds managed by MFS have established uncommitted borrowing arrangements with certain banks. Borrowings may be made for temporary financing needs. Interest is charged to each fund, based on its borrowings, generally at a rate equal to the Federal Reserve funds rate plus 0.30%. In addition, a commitment fee, based on the average daily, unused portion of the committed line of credit, is allocated among the participating funds at the end of each calendar quarter. For the six months ended March 31, 2008, the fund’s commitment fee and interest expense were $9,836 and $0, respectively, and are included in miscellaneous expense on the Statement of Operations.
| (7) | | Transactions in Underlying Funds-Affiliated Issuers |
An affiliated issuer may be considered one in which the fund owns 5% or more of the outstanding voting securities, or a company which is under common control. For the purposes of this report, the fund assumes the following to be affiliated issuers:
| | | | | | | | | |
| Affiliate | | Beginning
Shares/Par
Amount | | Acquisitions
Shares/Par
Amount | | Dispositions
Shares/Par
Amount | | | Ending
Shares/Par
Amount |
MFS Institutional Money
Market Portfolio | | 165,785,621 | | 458,584,504 | | (592,832,624 | ) | | 31,537,501 |
| | | | |
| Affiliate | | Realized
Gain (Loss) | | Capital Gain
Distributions
from Underlying
Funds | | Dividend
Income | | | Ending
Value |
MFS Institutional Money
Market Portfolio | | $— | | $— | | $67,035 | | | $31,537,501 |
On April 18, 2008, Class R shares and Class R2 shares converted into Class R3 shares. After the conversion, Class R3, Class R4, and Class R5 were renamed Class R2, Class R3, and Class R4, respectively.
47
RESULTS OF SHAREHOLDER MEETING
(unaudited)
At a special meeting of shareholders of Class R1 shares of MFS International New Discovery Fund, which was held on February 15, 2008, the following actions were taken:
Item 1: To approve an amendment to the current Master Distribution Plan adopted to Rule 12b-1 under the Investment Company Act of 1940, as amended, with respect to Class R1 Shares of the Fund.
| | |
| | | Number of Dollars |
| For | | 2,658,481.91 |
| Against | | 0.00 |
| Abstain | | 179,947.79 |
48
BOARD REVIEW OF INVESTMENT ADVISORY AGREEMENT
A discussion regarding the Board’s most recent review and renewal of the Fund’s investment advisory agreement is available by clicking on the fund’s name under “Select a fund” on the MFS Web site (mfs.com).
PROXY VOTING POLICIES AND INFORMATION
A general description of the MFS funds’ proxy voting policies and procedures is available without charge, upon request, by calling 1-800-225-2606, by visiting the Proxy Voting section of mfs.com or by visiting the SEC’s Web site at http://www.sec.gov.
Information regarding how the fund voted proxies relating to portfolio securities during the most recent twelve-month period ended June 30 is available without charge by visiting the Proxy Voting section of mfs.com or by visiting the SEC’s Web site at http://www.sec.gov.
QUARTERLY PORTFOLIO DISCLOSURE
The fund will file a complete schedule of portfolio holdings with the Securities and Exchange Commission (the Commission) for the first and third quarters of each fiscal year on Form N-Q. The fund’s Form N-Q may be reviewed and copied at the:
Public Reference Room
Securities and Exchange Commission
100 F Street, NE, Room 1580
Washington, D.C. 20549
Information on the operation of the Public Reference Room may be obtained by calling the Commission at 1-800-SEC-0330. The fund’s Form N-Q is available on the EDGAR database on the Commission’s Internet Web site at http://www.sec.gov, and copies of this information may be obtained, upon payment of a duplicating fee, by electronic request at the following e-mail address: publicinfo@sec.gov or by writing the Public Reference Section at the above address.
A shareholder can also obtain the quarterly portfolio holdings report at mfs.com.
49


MFS Research Fund
The report is prepared for the general information of shareholders. It is authorized for distribution to prospective investors only when preceded or accompanied by a current prospectus.
NOT FDIC INSURED Ÿ MAY LOSE VALUE Ÿ
NO BANK OR CREDIT UNION GUARANTEE Ÿ NOT A DEPOSIT Ÿ
NOT INSURED BY ANY FEDERAL GOVERNMENT AGENCY OR
NCUA/NCUSIF
3/31/08
MFR-SEM

LETTER FROM THE CEO
Dear Shareholders:
Many of our MFS® fund shareholders have been justifiably concerned, as have most investors around the world, about the state of the global economy. As we enter 2008 we see the market volatility that began in the third quarter of 2007 has intensified.
We here at MFS, and those before us who guided the firm with the same disciplined investment process, have weathered many major economic disruptions over our eight-plus decades of managing clients’ investments. We have managed money through the Great Depression, 14 recessions, as well as numerous market crises caused by wars, political upheavals, and terrorist attacks. MFS remains in business because our investors believe in the integrity of our long-term investment strategy and its proven results.
Worries over market volatility are valid, and investors cannot always expect to see the kind of returns stocks have delivered in the bull markets of past years. Yet we believe our strategy of ADR — allocating across the major asset classes, diversifying within each class, and regularly rebalancing your portfolio to maintain your desired allocation — can help you pursue the highest investment returns while minimizing the effects of market fluctuations.
MFS is a world leader in domestic and global investing. Our team approach is research driven, globally integrated, and balanced. We have 176 investment management professionals located in the Americas, Europe, and Asia who focus on the fundamentals of each security and then integrate our sophisticated quantitative approach.* This collaborative process allows us to find opportunities in any market environment.
I personally would like to thank you for your continued business. We want you to be confident that we are constantly managing our fund offerings with you in mind, while adding new products that can help you to choose what fits your unique financial goals.
Respectfully,

Robert J. Manning
Chief Executive Officer and Chief Investment Officer
MFS Investment Management®
May 15, 2008
* as of 12/31/07
The opinions expressed in this letter are subject to change, may not be relied upon for investment advice, and no forecasts can be guaranteed.
1
PORTFOLIO COMPOSITION

| | |
| Top ten holdings | | |
| Exxon Mobil Corp. | | 3.0% |
| JPMorgan Chase & Co. | | 2.9% |
| MetLife, Inc. | | 2.2% |
| International Business Machines Corp. | | 2.2% |
| PepsiCo, Inc. | | 2.2% |
| Danaher Corp. | | 2.1% |
| AT&T, Inc. | | 2.1% |
| Philip Morris International, Inc. | | 2.1% |
| Intel Corp. | | 2.0% |
| Merck & Co., Inc. | | 2.0% |
| | |
| Equity sectors | | |
| Financial Services | | 17.3% |
| Technology | | 13.4% |
| Energy | | 11.6% |
| Health Care | | 10.6% |
| Consumer Staples | | 8.8% |
| Utilities & Communications | | 8.6% |
| Retailing | | 7.5% |
| Industrial Goods & Services | | 7.3% |
| Basic Materials | | 4.7% |
| Leisure | | 3.9% |
| Special Products & Services | | 3.2% |
| Transportation | | 1.3% |
| Autos & Housing | | 1.1% |
Percentages are based on net assets as of 3/31/08.
The portfolio is actively managed and current holdings may be different.
2
EXPENSE TABLE
Fund expenses borne by the shareholders during the period, October 1, 2007 through March 31, 2008
As a shareholder of the fund, you incur two types of costs: (1) transaction costs, including sales charges (loads) on certain purchase or redemption payments, and (2) ongoing costs, including management fees; distribution and service (12b-1) fees; and other fund expenses. This example is intended to help you understand your ongoing costs (in dollars) of investing in the fund and to compare these costs with the ongoing costs of investing in other mutual funds.
The example is based on an investment of $1,000 invested at the beginning of the period and held for the entire period October 1, 2007 through March 31, 2008.
The expenses include the payment of a portion of the transfer-agent-related expenses of MFS funds that invest in the fund. For further information, please see the Notes to the Financial Statements.
Actual Expenses
The first line for each share class in the following table provides information about actual account values and actual expenses. You may use the information in this line, together with the amount you invested, to estimate the expenses that you paid over the period. Simply divide your account value by $1,000 (for example, an $8,600 account value divided by $1,000 = 8.6), then multiply the result by the number in the first line under the heading entitled “Expenses Paid During Period” to estimate the expenses you paid on your account during this period.
Hypothetical Example for Comparison Purposes
The second line for each share class in the following table provides information about hypothetical account values and hypothetical expenses based on the fund’s actual expense ratio and an assumed rate of return of 5% per year before expenses, which is not the fund’s actual return. The hypothetical account values and expenses may not be used to estimate the actual ending account balance or expenses you paid for the period. You may use this information to compare the ongoing costs of investing in the fund and other funds. To do so, compare this 5% hypothetical example with the 5% hypothetical examples that appear in the shareholder reports of the other funds.
Please note that the expenses shown in the table are meant to highlight your ongoing costs only and do not reflect any transactional costs, such as sales charges (loads). Therefore, the second line for each share class in the table is useful in comparing ongoing costs only, and will not help you determine the relative total costs of owning different funds. In addition, if these transactional costs were included, your costs would have been higher.
3
Expense Table – continued
| | | | | | | | | | |
Share
Class | | | | Annualized
Expense
Ratio | | Beginning
Account Value
10/1/07 | | Ending
Account Value
3/31/08 | | Expenses
Paid During
Period (p)
10/1/07-3/31/08 |
| A | | Actual | | 0.99% | | $1,000.00 | | $904.12 | | $4.71 |
| | Hypothetical (h) | | 0.99% | | $1,000.00 | | $1,020.05 | | $5.00 |
| B | | Actual | | 1.64% | | $1,000.00 | | $901.08 | | $7.79 |
| | Hypothetical (h) | | 1.64% | | $1,000.00 | | $1,016.80 | | $8.27 |
| C | | Actual | | 1.64% | | $1,000.00 | | $901.16 | | $7.79 |
| | Hypothetical (h) | | 1.64% | | $1,000.00 | | $1,016.80 | | $8.27 |
| I | | Actual | | 0.64% | | $1,000.00 | | $905.60 | | $3.05 |
| | Hypothetical (h) | | 0.64% | | $1,000.00 | | $1,021.80 | | $3.23 |
| W | | Actual | | 0.74% | | $1,000.00 | | $905.42 | | $3.53 |
| | Hypothetical (h) | | 0.74% | | $1,000.00 | | $1,021.30 | | $3.74 |
| R | | Actual | | 1.13% | | $1,000.00 | | $903.57 | | $5.38 |
| | Hypothetical (h) | | 1.13% | | $1,000.00 | | $1,019.35 | | $5.70 |
| R1 | | Actual | | 1.73% | | $1,000.00 | | $900.71 | | $8.22 |
| | Hypothetical (h) | | 1.73% | | $1,000.00 | | $1,016.35 | | $8.72 |
| R2 | | Actual | | 1.27% | | $1,000.00 | | $902.74 | | $6.04 |
| | Hypothetical (h) | | 1.27% | | $1,000.00 | | $1,018.65 | | $6.41 |
| R3 | | Actual | | 1.22% | | $1,000.00 | | $903.15 | | $5.80 |
| | Hypothetical (h) | | 1.22% | | $1,000.00 | | $1,018.90 | | $6.16 |
| R4 | | Actual | | 0.97% | | $1,000.00 | | $903.87 | | $4.62 |
| | Hypothetical (h) | | 0.97% | | $1,000.00 | | $1,020.15 | | $4.90 |
| R5 | | Actual | | 0.69% | | $1,000.00 | | $905.21 | | $3.29 |
| | Hypothetical (h) | | 0.69% | | $1,000.00 | | $1,021.55 | | $3.49 |
| (h) | 5% class return per year before expenses. |
| (p) | Expenses paid is equal to each class’ annualized expense ratio, as shown above, multiplied by the average account value over the period, multiplied by the number of days in the period, divided by the number of days in the year. Expenses paid do not include any applicable sales charges (loads). If these transaction costs had been included, your costs would have been higher. |
| | Effective January 1, 2008, the fund’s Class R2, Class R3, Class R4, and Class R5 retirement plan administration and service fee was terminated (as described in Note 3 of the Notes to the Financial Statements). Had this fee change been in effect throughout the entire six month period, the annualized expense ratios would have been 1.15%, 1.14%, 0.89% and 0.64% for Class R2, Class R3, Class R4 and Class R5 shares respectively. The actual expenses paid during the period would have been approximately $5.49, $5.44, $4.25, and $3.06 and the hypothetical expenses paid during the period would have been approximately $5.82, $5.77, $4.51 and $3.24 for Class R2, Class R3, Class R4 and Class R5 shares, respectively. |
| | Effective March 1, 2008, the fund’s Class R1 retirement plan administration and service fee was terminated and the Class R1 distribution fee was increased (as described in Note 3 of the Notes to the Financial Statements). Had these fee changes been in effect throughout the entire six month period, the |
4
Expense Table – continued
| | annualized expense ratio would have been 1.65%. The actual expenses paid during the period would have been approximately $7.87 and the hypothetical expenses paid during the period would have been approximately $8.34. |
Note to Shareholders: On April 18, 2008, Class R shares and Class R2 shares were converted into Class R3 shares. After the conversion, Class R3, Class R4, and Class R5 were renamed Class R2, Class R3, and Class R4, respectively.
5
PORTFOLIO OF INVESTMENTS
3/31/08 (unaudited)
The Portfolio of Investments is a complete list of all securities owned by your fund. It is categorized by broad-based asset classes.
| | | | | |
| Common Stocks - 99.3% | | | | | |
| Issuer | | Shares/Par | | Value ($) |
| | | | | |
| Aerospace - 2.0% | | | | | |
| Lockheed Martin Corp. | | 243,340 | | $ | 24,163,659 |
| United Technologies Corp. | | 313,220 | | | 21,555,800 |
| | | | | |
| | | | | $ | 45,719,459 |
| Apparel Manufacturers - 1.4% | | | | | |
| Coach, Inc. (a) | | 360,380 | | $ | 10,865,457 |
| NIKE, Inc., “B” | | 306,600 | | | 20,848,800 |
| | | | | |
| | | | | $ | 31,714,257 |
| Automotive - 0.5% | | | | | |
| Bayerische Motoren Werke AG | | 220,980 | | $ | 12,203,944 |
| | |
| Biotechnology - 1.8% | | | | | |
| Genzyme Corp. (a) | | 314,800 | | $ | 23,465,192 |
| Millipore Corp. (a) | | 270,410 | | | 18,228,338 |
| | | | | |
| | | | | $ | 41,693,530 |
| Broadcasting - 1.9% | | | | | |
| News Corp., “A” | | 620,830 | | $ | 11,640,563 |
| Omnicom Group, Inc. | | 338,130 | | | 14,938,583 |
| Walt Disney Co. | | 530,190 | | | 16,637,362 |
| | | | | |
| | | | | $ | 43,216,508 |
| Brokerage & Asset Managers - 2.1% | | | | | |
| Affiliated Managers Group, Inc. (a) | | 184,430 | | $ | 16,735,178 |
| Goldman Sachs Group, Inc. | | 77,180 | | | 12,764,800 |
| Invesco Ltd. | | 753,560 | | | 18,356,722 |
| | | | | |
| | | | | $ | 47,856,700 |
| Business Services - 2.1% | | | | | |
| Satyam Computer Services Ltd., ADR | | 522,287 | | $ | 11,798,463 |
| Visa, Inc., “A” (a) | | 571,180 | | | 35,618,785 |
| | | | | |
| | | | | $ | 47,417,248 |
| Cable TV - 1.0% | | | | | |
| Comcast Corp., “Special A” | | 766,225 | | $ | 14,535,288 |
| Time Warner Cable, Inc. (a) | | 345,270 | | | 8,624,845 |
| | | | | |
| | | | | $ | 23,160,133 |
6
Portfolio of Investments (unaudited) – continued
| | | | | |
| Issuer | | Shares/Par | | Value ($) |
| | | | | |
| Common Stocks - continued | | | | | |
| Chemicals - 1.0% | | | | | |
| PPG Industries, Inc. | | 388,280 | | $ | 23,494,823 |
| | |
| Computer Software - 2.5% | | | | | |
| Oracle Corp. (a) | | 1,434,550 | | $ | 28,059,798 |
| Salesforce.com, Inc. (a) | | 323,240 | | | 18,705,899 |
| VeriSign, Inc. (a) | | 305,110 | | | 10,141,856 |
| | | | | |
| | | | | $ | 56,907,553 |
| Computer Software - Systems - 3.1% | | | | | |
| EMC Corp. (a) | | 739,680 | | $ | 10,607,011 |
| International Business Machines Corp. | | 431,990 | | | 49,739,329 |
| Network Appliance, Inc. (a) | | 507,000 | | | 10,165,350 |
| | | | | |
| | | | | $ | 70,511,690 |
| Conglomerates - 1.1% | | | | | |
| Siemens AG | | 228,800 | | $ | 24,791,333 |
| | |
| Construction - 0.6% | | | | | |
| D.R. Horton, Inc. | | 465,550 | | $ | 7,332,413 |
| Pulte Homes, Inc. | | 460,800 | | | 6,704,640 |
| | | | | |
| | | | | $ | 14,037,053 |
| Consumer Goods & Services - 1.5% | | | | | |
| Colgate-Palmolive Co. | | 95,010 | | $ | 7,402,229 |
| Estee Lauder Cos., Inc., “A” | | 294,810 | | | 13,517,039 |
| Procter & Gamble Co. | | 191,010 | | | 13,384,071 |
| | | | | |
| | | | | $ | 34,303,339 |
| Electrical Equipment - 2.7% | | | | | |
| Danaher Corp. | | 644,340 | | $ | 48,989,170 |
| Rockwell Automation, Inc. | | 237,690 | | | 13,648,160 |
| | | | | |
| | | | �� | $ | 62,637,330 |
| Electronics - 4.2% | | | | | |
| Flextronics International Ltd. (a) | | 1,697,060 | | $ | 15,935,393 |
| Intel Corp. | | 2,124,280 | | | 44,992,250 |
| Intersil Corp., “A” | | 419,330 | | | 10,764,201 |
| National Semiconductor Corp. | | 698,710 | | | 12,800,367 |
| SanDisk Corp. (a) | | 473,070 | | | 10,677,190 |
| | | | | |
| | | | | $ | 95,169,401 |
7
Portfolio of Investments (unaudited) – continued
| | | | | |
| Issuer | | Shares/Par | | Value ($) |
| | | | | |
| Common Stocks - continued | | | | | |
| Energy - Independent - 3.6% | | | | | |
| Apache Corp. | | 332,600 | | $ | 40,184,732 |
| CONSOL Energy, Inc. | | 128,960 | | | 8,922,742 |
| Valero Energy Corp. | | 223,100 | | | 10,956,441 |
| XTO Energy, Inc. | | 362,340 | | | 22,414,352 |
| | | | | |
| | | | | $ | 82,478,267 |
| Energy - Integrated - 5.4% | | | | | |
| Exxon Mobil Corp. | | 821,100 | | $ | 69,448,638 |
| Hess Corp. | | 215,150 | | | 18,971,927 |
| Marathon Oil Corp. | | 356,260 | | | 16,245,456 |
| TOTAL S.A., ADR | | 240,600 | | | 17,806,806 |
| | | | | |
| | | | | $ | 122,472,827 |
| Engineering - Construction - 0.7% | | | | | |
| Fluor Corp. | | 117,310 | | $ | 16,559,480 |
| | |
| Food & Beverages - 4.4% | | | | | |
| Dean Foods Co. (a) | | 679,710 | | $ | 13,655,374 |
| General Mills, Inc. | | 355,780 | | | 21,304,106 |
| Nestle S.A. | | 33,180 | | | 16,574,136 |
| PepsiCo, Inc. | | 682,860 | | | 49,302,492 |
| | | | | |
| | | | | $ | 100,836,108 |
| Food & Drug Stores - 1.6% | | | | | |
| CVS Caremark Corp. | | 911,120 | | $ | 36,909,471 |
| | |
| Gaming & Lodging - 1.0% | | | | | |
| International Game Technology | | 284,890 | | $ | 11,455,427 |
| Royal Caribbean Cruises Ltd. | | 312,090 | | | 10,267,761 |
| | | | | |
| | | | | $ | 21,723,188 |
| General Merchandise - 2.5% | | | | | |
| Kohl’s Corp. (a) | | 256,530 | | $ | 11,002,572 |
| Macy’s, Inc. | | 705,860 | | | 16,277,132 |
| Wal-Mart Stores, Inc. | | 582,840 | | | 30,704,011 |
| | | | | |
| | | | | $ | 57,983,715 |
| Health Maintenance Organizations - 1.6% | | | | | |
| CIGNA Corp. | | 532,250 | | $ | 21,593,383 |
| WellPoint, Inc. (a) | | 317,010 | | | 13,989,651 |
| | | | | |
| | | | | $ | 35,583,034 |
8
Portfolio of Investments (unaudited) – continued
| | | | | |
| Issuer | | Shares/Par | | Value ($) |
| | | | | |
| Common Stocks - continued | | | | | |
| Insurance - 5.5% | | | | | |
| Chubb Corp. | | 394,170 | | $ | 19,503,532 |
| Genworth Financial, Inc., “A” | | 620,350 | | | 14,044,724 |
| Hartford Financial Services Group, Inc. | | 240,700 | | | 18,237,839 |
| MetLife, Inc. | | 827,600 | | | 49,871,176 |
| Prudential Financial, Inc. | | 297,760 | | | 23,299,720 |
| | | | | |
| | | | | $ | 124,956,991 |
| Internet - 1.6% | | | | | |
| Google, Inc., “A” (a) | | 85,110 | | $ | 37,488,402 |
| | |
| Machinery & Tools - 1.9% | | | | | |
| GEA Group AG | | 365,600 | | $ | 12,291,053 |
| Ingersoll-Rand Co. Ltd., “A” | | 689,240 | | | 30,726,319 |
| | | | | |
| | | | | $ | 43,017,372 |
| Major Banks - 9.1% | | | | | |
| Bank of America Corp. | | 1,173,120 | | $ | 44,472,979 |
| Bank of New York Mellon Corp. | | 900,016 | | | 37,557,668 |
| JPMorgan Chase & Co. | | 1,560,340 | | | 67,016,603 |
| State Street Corp. | | 504,180 | | | 39,830,220 |
| Wells Fargo & Co. | | 679,120 | | | 19,762,392 |
| | | | | |
| | | | | $ | 208,639,862 |
| Medical & Health Technology & Services - 0.6% | | | | | |
| DaVita, Inc. (a) | | 306,530 | | $ | 14,639,873 |
| | |
| Medical Equipment - 2.4% | | | | | |
| Boston Scientific Corp. (a) | | 1,585,920 | | $ | 20,410,790 |
| ResMed, Inc. (a) | | 227,050 | | | 9,576,969 |
| Zimmer Holdings, Inc. (a) | | 308,780 | | | 24,041,611 |
| | | | | |
| | | | | $ | 54,029,370 |
| Metals & Mining - 2.4% | | | | | |
| BHP Billiton PLC | | 525,110 | | $ | 15,566,940 |
| Cameco Corp. | | 307,100 | | | 10,115,874 |
| Century Aluminum Co. (a) | | 155,400 | | | 10,293,696 |
| United States Steel Corp. | | 139,360 | | | 17,680,603 |
| | | | | |
| | | | | $ | 53,657,113 |
| Natural Gas - Distribution - 1.4% | | | | | |
| Questar Corp. | | 240,100 | | $ | 13,580,056 |
| Sempra Energy | | 352,430 | | | 18,777,470 |
| | | | | |
| | | | | $ | 32,357,526 |
9
Portfolio of Investments (unaudited) – continued
| | | | | |
| Issuer | | Shares/Par | | Value ($) |
| | | | | |
| Common Stocks - continued | | | | | |
| Natural Gas - Pipeline - 0.9% | | | | | |
| El Paso Corp. | | 413,200 | | $ | 6,875,648 |
| Williams Cos., Inc. | | 428,100 | | | 14,118,738 |
| | | | | |
| | | | | $ | 20,994,386 |
| Network & Telecom - 2.0% | | | | | |
| Nokia Corp., ADR | | 853,710 | | $ | 27,173,589 |
| Research in Motion Ltd. (a) | | 168,748 | | | 18,938,588 |
| | | | | |
| | | | | $ | 46,112,177 |
| Oil Services - 2.6% | | | | | |
| Exterran Holdings, Inc. (a) | | 132,970 | | $ | 8,581,884 |
| Halliburton Co. | | 611,060 | | | 24,032,990 |
| Noble Corp. | | 222,060 | | | 11,029,720 |
| Schlumberger Ltd. | | 184,300 | | | 16,034,100 |
| | | | | |
| | | | | $ | 59,678,694 |
| Other Banks & Diversified Financials - 0.6% | | | | | |
| American Express Co. | | 306,000 | | $ | 13,378,320 |
| | |
| Pharmaceuticals - 4.2% | | | | | |
| Abbott Laboratories | | 549,370 | | $ | 30,297,756 |
| Merck & Co., Inc. | | 1,179,090 | | | 44,746,466 |
| Schering-Plough Corp. | | 1,509,820 | | | 21,756,506 |
| | | | | |
| | | | | $ | 96,800,728 |
| Specialty Chemicals - 1.3% | | | | | |
| Linde AG | | 76,310 | | $ | 10,778,524 |
| Praxair, Inc. | | 226,280 | | | 19,059,564 |
| | | | | |
| | | | | $ | 29,838,088 |
| Specialty Stores - 2.0% | | | | | |
| Advance Auto Parts, Inc. | | 123,600 | | $ | 4,208,580 |
| Nordstrom, Inc. | | 537,030 | | | 17,507,178 |
| PetSmart, Inc. | | 620,190 | | | 12,676,684 |
| TJX Cos., Inc. | | 323,500 | | | 10,698,145 |
| | | | | |
| | | | | $ | 45,090,587 |
| Telecommunications - Wireless - 0.7% | | | | | |
| Rogers Communications, Inc., “B” | | 411,110 | | $ | 14,763,229 |
| | |
| Telephone Services - 2.5% | | | | | |
| AT&T, Inc. | | 1,245,230 | | $ | 47,692,309 |
| Embarq Corp. | | 216,970 | | | 8,700,497 |
| | | | | |
| | | | | $ | 56,392,806 |
10
Portfolio of Investments (unaudited) – continued
| | | | | |
| Issuer | | Shares/Par | | Value ($) |
| | | | | |
| Common Stocks - continued | | | | | |
| Tobacco - 2.9% | | | | | |
| Altria Group, Inc. | | 798,890 | | $ | 17,735,358 |
| Philip Morris International, Inc. | | 933,790 | | | 47,231,098 |
| | | | | |
| | | | | $ | 64,966,456 |
| Trucking - 1.3% | | | | | |
| FedEx Corp. | | 330,660 | | $ | 30,642,262 |
| | |
| Utilities - Electric Power - 3.1% | | | | | |
| American Electric Power Co., Inc. | | 446,450 | | $ | 18,585,714 |
| FPL Group, Inc. | | 298,970 | | | 18,757,378 |
| NRG Energy, Inc. (a) | | 389,730 | | | 15,195,573 |
| PG&E Corp. | | 496,910 | | | 18,296,226 |
| | | | | |
| | | | | $ | 70,834,891 |
| Total Common Stocks (Identified Cost, $2,321,377,721) | | | | $ | 2,267,659,524 |
| | |
| Money Market Funds (v) - 0.9% | | | | | |
MFS Institutional Money Market Portfolio, 2.86%,
at Cost and Net Asset Value | | 20,484,713 | | $ | 20,484,713 |
| Total Investments (Identified Cost, $2,341,862,434) | | | | $ | 2,288,144,237 |
| | |
| Other Assets, Less Liabilities - (0.2)% | | | | | (4,098,622) |
| Net Assets - 100.0% | | | | $ | 2,284,045,615 |
| (a) | Non-income producing security. |
| (v) | Underlying fund that is available only to investment companies managed by MFS. The rate quoted is the annualized seven-day yield of the fund at period end. |
The following abbreviations are used in this report and are defined:
| ADR | | American Depository Receipt |
See Notes to Financial Statements
11
Financial Statements
STATEMENT OF ASSETS AND LIABILITIES
At 3/31/08 (unaudited)
This statement represents your fund’s balance sheet, which details the assets and liabilities comprising the total value of the fund.
| | | | | |
| Assets | | | | | |
| Investments – | | | | | |
Non-affiliated issuers, at value
(identified cost, $2,321,377,721) | | $2,267,659,524 | | | |
| Underlying funds, at cost and value | | 20,484,713 | | | |
| Total investments, at value (identified cost, $2,341,862,434) | | | | | $2,288,144,237 |
| Receivable for investments sold | | $14,480,309 | | | |
| Receivable for fund shares sold | | 1,309,956 | | | |
| Interest and dividends receivable | | 2,885,463 | | | |
| Other assets | | 91,508 | | | |
| Total assets | | | | | $2,306,911,473 |
| Liabilities | | | | | |
| Payable for investments purchased | | $18,637,423 | | | |
| Payable for fund shares reacquired | | 2,639,802 | | | |
| Payable to affiliates | | | | | |
Management fee | | 107,357 | | | |
Shareholder servicing costs | | 889,188 | | | |
Distribution and service fees | | 75,206 | | | |
Administrative services fee | | 3,147 | | | |
| Payable for independent trustees’ compensation | | 310,439 | | | |
| Accrued expenses and other liabilities | | 203,296 | | | |
| Total liabilities | | | | | $22,865,858 |
| Net assets | | | | | $2,284,045,615 |
| Net assets consist of | | | | | |
| Paid-in capital | | $2,432,566,032 | | | |
| Unrealized appreciation (depreciation) on investments and translation of assets and liabilities in foreign currencies | | (53,694,324 | ) | | |
| Accumulated net realized gain (loss) on investments and foreign currency transactions | | (102,310,176 | ) | | |
| Undistributed net investment income | | 7,484,083 | | | |
| Net assets | | | | | $2,284,045,615 |
| Shares of beneficial interest outstanding | | | | | 94,650,958 |
12
Statement of Assets and Liabilities (unaudited) – continued
| | | | |
| Class A shares | | | | |
Net assets | | $1,144,308,981 | | |
Shares outstanding | | 47,290,091 | | |
Net asset value per share | | | | $24.20 |
Offering price per share (100 / 94.25 × net asset value per share) | | | | $25.68 |
| Class B shares | | | | |
Net assets | | $150,240,901 | | |
Shares outstanding | | 6,676,524 | | |
Net asset value and offering price per share | | | | $22.50 |
| Class C shares | | | | |
Net assets | | $125,856,491 | | |
Shares outstanding | | 5,589,560 | | |
Net asset value and offering price per share | | | | $22.52 |
| Class I shares | | | | |
Net assets | | $843,077,067 | | |
Shares outstanding | | 34,215,227 | | |
Net asset value, offering price, and redemption price per share | | | | $24.64 |
| Class W shares | | | | |
Net assets | | $178,841 | | |
Shares outstanding | | 7,397 | | |
Net asset value, offering price, and redemption price per share | | | | $24.18 |
| Class R shares | | | | |
Net assets | | $863,060 | | |
Shares outstanding | | 35,848 | | |
Net asset value, offering price, and redemption price per share | | | | $24.08 |
| Class R1 shares | | | | |
Net assets | | $4,437,713 | | |
Shares outstanding | | 199,468 | | |
Net asset value, offering price, and redemption price per share | | | | $22.25 |
| Class R2 shares | | | | |
Net assets | | $1,806,489 | | |
Shares outstanding | | 80,707 | | |
Net asset value, offering price, and redemption price per share | | | | $22.38 |
| Class R3 shares | | | | |
Net assets | | $7,873,033 | | |
Shares outstanding | | 332,165 | | |
Net asset value, offering price, and redemption price per share | | | | $23.70 |
13
Statement of Assets and Liabilities (unaudited) – continued
| | | | |
| Class R4 shares | | | | |
Net assets | | $5,341,058 | | |
Shares outstanding | | 221,409 | | |
Net asset value, offering price, and redemption price per share | | | | $24.12 |
| Class R5 shares | | | | |
Net assets | | $61,981 | | |
Shares outstanding | | 2,562 | | |
Net asset value, offering price, and redemption price per share | | | | $24.19 |
On sales of $50,000 or more, the offering price of Class A shares is reduced. A contingent deferred sales charge may be imposed on redemptions of Class A, Class B, and Class C shares.
See Notes to Financial Statements
14
Financial Statements
STATEMENT OF OPERATIONS
Six months ended 3/31/08 (unaudited)
This statement describes how much your fund earned in investment income and accrued in expenses. It also describes any gains and/or losses generated by fund operations.
| | | | | | |
| Net investment income | | | | | | |
| Income | | | | | | |
Dividends | | $19,284,188 | | | | |
Interest | | 166,428 | | | | |
Dividends from underlying funds | | 385,309 | | | | |
Foreign taxes withheld | | (99,492 | ) | | | |
| Total investment income | | | | | $19,736,433 | |
| Expenses | | | | | | |
Management fee | | $5,402,532 | | | | |
Distribution and service fees | | 3,915,813 | | | | |
Shareholder servicing costs | | 2,127,005 | | | | |
Administrative services fee | | 169,531 | | | | |
Retirement plan administration and services fees | | 12,718 | | | | |
Independent trustees’ compensation | | 20,824 | | | | |
Custodian fee | | 91,603 | | | | |
Shareholder communications | | 101,301 | | | | |
Auditing fees | | 24,964 | | | | |
Legal fees | | 12,252 | | | | |
Miscellaneous | | 101,143 | | | | |
| Total expenses | | | | | $11,979,686 | |
Fees paid indirectly | | (1,766 | ) | | | |
Reduction of expenses by investment adviser | | (5,777 | ) | | | |
| Net expenses | | | | | $11,972,143 | |
| Net investment income | | | | | $7,764,290 | |
| Realized and unrealized gain (loss) on investments | | | | | | |
| Realized gain (loss) (identified cost basis) | | | | | | |
Investment transactions | | $41,815,244 | | | | |
Written option transactions | | (799,842 | ) | | | |
Foreign currency transactions | | 32,540 | | | | |
Net realized gain (loss) on investments
and foreign currency transactions | | | | | $41,047,942 | |
| Change in unrealized appreciation (depreciation) | | | | | | |
Investments | | $(294,704,023 | ) | | | |
Translation of assets and liabilities in foreign currencies | | 11,455 | | | | |
Net unrealized gain (loss) on investments
and foreign currency translation | | | | | $(294,692,568 | ) |
Net realized and unrealized gain (loss) on investments
and foreign currency | | | | | $(253,644,626 | ) |
| Change in net assets from operations | | | | | $(245,880,336 | ) |
See Notes to Financial Statements
15
Financial Statements
STATEMENTS OF CHANGES IN NET ASSETS
These statements describe the increases and/or decreases in net assets resulting from operations, any distributions, and any shareholder transactions.
| | | | | | |
| | | Six months ended
3/31/08 (unaudited) | | | Year ended
9/30/07 | |
| Change in net assets | | | | |
| From operations | | | | | | |
| Net investment income | | $7,764,290 | | | $16,364,039 | |
| Net realized gain (loss) on investments and foreign currency transactions | | 41,047,942 | | | 404,315,799 | |
| Net unrealized gain (loss) on investments and foreign currency translation | | (294,692,568 | ) | | 65,977,370 | |
| Change in net assets from operations | | $(245,880,336 | ) | | $486,657,208 | |
| Distributions declared to shareholders | | | | | | |
| From net investment income | | | | | | |
Class A | | $(7,726,828 | ) | | $(4,063,594 | ) |
Class I | | (8,485,735 | ) | | (4,926,117 | ) |
Class W | | (1,732 | ) | | (589 | ) |
Class R | | — | | | (2,710 | ) |
Class R1 | | (20,354 | ) | | — | |
Class R2 | | (16,561 | ) | | — | |
Class R3 | | (56,748 | ) | | (5,824 | ) |
Class R4 | | (40,543 | ) | | (3,888 | ) |
Class R5 | | (581 | ) | | (320 | ) |
Class 529A | | — | | | (496 | ) |
| Total distributions declared to shareholders | | $(16,349,082 | ) | | $(9,003,538 | ) |
| Change in net assets from fund share transactions | | $(158,050,904 | ) | | $(530,527,763 | ) |
| Total change in net assets | | $(420,280,322 | ) | | $(52,874,093 | ) |
| Net assets | | | | | | |
| At beginning of period | | 2,704,325,937 | | | 2,757,200,030 | |
| At end of period (including undistributed net investment income of $7,484,083 and $16,068,875, respectively) | | $2,284,045,615 | | | $2,704,325,937 | |
See Notes to Financial Statements
16
Financial Statements
FINANCIAL HIGHLIGHTS
The financial highlights table is intended to help you understand the fund’s financial performance for the semiannual period and the past 5 fiscal years (or life of a particular share class, if shorter). Certain information reflects financial results for a single fund share. The total returns in the table represent the rate by which an investor would have earned (or lost) on an investment in the fund share class (assuming reinvestment of all distributions) held for the entire period.
| | | | | | | | | | | | | | | | | | |
| | | Six months
ended
3/31/08 (unaudited) | | | Years ended 9/30 | |
| Class A | | | 2007 | | | 2006 | | | 2005 | | | 2004 | | | 2003 | |
| | | | | | | | | | | | | | | | | |
| Net asset value, beginning of period | | $26.92 | | | $22.59 | | | $21.21 | | | $17.93 | | | $15.90 | | | $13.33 | |
Income (loss) from
investment operations | | | | | | | | | | | | | |
Net investment income (d) | | $0.07 | | | $0.15 | | | $0.08 | | | $0.06 | | | $0.07 | | | $0.11 | |
Net realized and unrealized gain (loss) on investments
and foreign currency | | (2.64 | ) | | 4.24 | | | 1.33 | | | 3.25 | | | 2.08 | | | 2.46 | |
| Total from investment operations | | $(2.57 | ) | | $4.39 | | | $1.41 | | | $3.31 | | | $2.15 | | | $2.57 | |
Less distributions declared
to shareholders | | | | | | | | | | | | | |
From net investment income | | $(0.15 | ) | | $(0.06 | ) | | $(0.03 | ) | | $(0.03 | ) | | $(0.12 | ) | | $— | |
| Net asset value, end of period | | $24.20 | | | $26.92 | | | $22.59 | | | $21.21 | | | $17.93 | | | $15.90 | |
| Total return (%) (r)(s)(t) | | (9.59 | )(n) | | 19.49 | | | 6.65 | | | 18.49 | | | 13.54 | (b)(q) | | 19.28 | (j) |
Ratios (%) (to average net assets)
and Supplemental data: | | | | | | | | | | | | | | | | |
| Expenses before expense reductions (f) | | 0.99 | (a) | | 0.97 | | | 1.02 | | | 1.06 | | | 1.02 | | | 1.06 | |
| Expenses after expense reductions (f) | | 0.99 | (a) | | 0.97 | | | 1.02 | | | 1.06 | | | 1.02 | | | 1.06 | |
| Net investment income | | 0.58 | (a) | | 0.61 | | | 0.38 | | | 0.32 | | | 0.39 | | | 0.74 | |
| Portfolio turnover | | 49 | | | 84 | | | 99 | | | 99 | | | 117 | | | 114 | |
Net assets at end of period
(000 Omitted) | | $1,144,309 | | | $1,377,199 | | | $1,491,146 | | | $1,567,980 | | | $1,405,075 | | | $1,475,897 | |
See Notes to Financial Statements
17
Financial Highlights – continued
| | | | | | | | | | | | | | | | | | |
| | | Six months
ended
3/31/08 (unaudited) | | | Years ended 9/30 | |
| Class B | | | 2007 | | | 2006 | | | 2005 | | | 2004 | | | 2003 | |
| | | | | | | | | | | | | | | | | |
| Net asset value, beginning of period | | $24.97 | | | $21.04 | | | $19.85 | | | $16.86 | | | $14.96 | | | $12.62 | |
| Income (loss) from investment operations | | | | | | | | | | | | | | | | | | |
Net investment income (loss) (d) | | $(0.01 | ) | | $(0.01 | ) | | $(0.06 | ) | | $(0.06 | ) | | $(0.04 | ) | | $0.01 | |
Net realized and unrealized
gain (loss) on investments
and foreign currency | | (2.46 | ) | | 3.94 | | | 1.25 | | | 3.05 | | | 1.95 | | | 2.33 | |
| Total from investment operations | | $(2.47 | ) | | $3.93 | | | $1.19 | | | $2.99 | | | $1.91 | | | $2.34 | |
| Less distributions declared to shareholders | | | | | | | | | | | | | | | | | | |
From net investment income | | $— | | | $— | | | $— | | | $— | | | $(0.01 | ) | | $— | |
| Net asset value, end of period | | $22.50 | | | $24.97 | | | $21.04 | | | $19.85 | | | $16.86 | | | $14.96 | |
| Total return (%) (r)(s)(t) | | (9.89 | )(n) | | 18.68 | | | 5.99 | | | 17.73 | | | 12.78 | (b)(q) | | 18.54 | (j) |
Ratios (%) (to average net assets)
and Supplemental data: | | | | | | | | | | | | | | | | |
| Expenses before expense reductions (f) | | 1.64 | (a) | | 1.62 | | | 1.68 | | | 1.71 | | | 1.67 | | | 1.70 | |
Expenses after
expense reductions (f) | | 1.64 | (a) | | 1.62 | | | 1.68 | | | 1.71 | | | 1.67 | | | 1.70 | |
| Net investment income (loss) | | (0.08 | )(a) | | (0.02 | ) | | (0.28 | ) | | (0.33 | ) | | (0.26 | ) | | 0.09 | |
| Portfolio turnover | | 49 | | | 84 | | | 99 | | | 99 | | | 117 | | | 114 | |
Net assets at end of period
(000 Omitted) | | $150,241 | | | $220,062 | | | $321,822 | | | $544,719 | | | $836,113 | | | $1,071,292 | |
See Notes to Financial Statements
18
Financial Highlights – continued
| | | | | | | | | | | | | | | | | | |
| | | Six months
ended
3/31/08 (unaudited) | | | Years ended 9/30 | |
| Class C | | | 2007 | | | 2006 | | | 2005 | | | 2004 | | | 2003 | |
| | | | | | | | | | | | | | | | | |
Net asset value, beginning
of period | | $24.99 | | | $21.05 | | | $19.86 | | | $16.87 | | | $14.96 | | | $12.63 | |
| Income (loss) from investment operations | | | | | | | | | | | | | | | | | | |
Net investment income (loss) (d) | | $(0.01 | ) | | $(0.01 | ) | | $(0.06 | ) | | $(0.06 | ) | | $(0.04 | ) | | $0.01 | |
Net realized and unrealized
gain (loss) on investments
and foreign currency | | (2.46 | ) | | 3.95 | | | 1.25 | | | 3.05 | | | 1.96 | | | 2.32 | |
| Total from investment operations | | $(2.47 | ) | | $3.94 | | | $1.19 | | | $2.99 | | | $1.92 | | | $2.33 | |
Less distributions declared
to shareholders | | | | | | | | | | | | | | | | | | |
From net investment income | | $— | | | $— | | | $— | | | $— | | | $(0.01 | ) | | $— | |
| Net asset value, end of period | | $22.52 | | | $24.99 | | | $21.05 | | | $19.86 | | | $16.87 | | | $14.96 | |
| Total return (%) (r)(s)(t) | | (9.88 | )(n) | | 18.72 | | | 5.99 | | | 17.72 | | | 12.82 | (b)(q) | | 18.45 | (j) |
Ratios (%) (to average net assets)
and Supplemental data: | | | | | | | | | | | | | | | | |
Expenses before
expense reductions (f) | | 1.64 | (a) | | 1.62 | | | 1.68 | | | 1.71 | | | 1.67 | | | 1.70 | |
Expenses after
expense reductions (f) | | 1.64 | (a) | | 1.62 | | | 1.67 | | | 1.71 | | | 1.67 | | | 1.70 | |
| Net investment income (loss) | | (0.07 | )(a) | | (0.05 | ) | | (0.28 | ) | | (0.33 | ) | | (0.26 | ) | | 0.09 | |
| Portfolio turnover | | 49 | | | 84 | | | 99 | | | 99 | | | 117 | | | 114 | |
Net assets at end of period
(000 Omitted) | | $125,856 | | | $155,741 | | | $170,718 | | | $208,725 | | | $226,376 | | | $262,391 | |
See Notes to Financial Statements
19
Financial Highlights – continued
| | | | | | | | | | | | | | | | | | |
| | | Six months
ended
3/31/08 (unaudited) | | | Years ended 9/30 | |
| Class I | | | 2007 | | | 2006 | | | 2005 | | | 2004 | | | 2003 | |
| | | | | | | | | | | | | | | | | |
| Net asset value, beginning of period | | $27.46 | | | $23.04 | | | $21.63 | | | $18.28 | | | $16.21 | | | $13.54 | |
| Income (loss) from investment operations | | | | | | | | | | | | | | | | | | |
Net investment income (d) | | $0.12 | | | $0.23 | | | $0.16 | | | $0.14 | | | $0.14 | | | $0.17 | |
Net realized and unrealized
gain (loss) on investments
and foreign currency | | (2.69 | ) | | 4.34 | | | 1.35 | | | 3.31 | | | 2.11 | | | 2.50 | |
| Total from investment operations | | $(2.57 | ) | | $4.57 | | | $1.51 | | | $3.45 | | | $2.25 | | | $2.67 | |
| Less distributions declared to shareholders | | | | | | | | | | | | | | | | | | |
From net investment income | | $(0.25 | ) | | $(0.15 | ) | | $(0.10 | ) | | $(0.10 | ) | | $(0.18 | ) | | $— | |
| Net asset value, end of period | | $24.64 | | | $27.46 | | | $23.04 | | | $21.63 | | | $18.28 | | | $16.21 | |
| Total return (%) (r)(s) | | (9.44 | )(n) | | 19.91 | | | 7.01 | | | 18.93 | | | 13.92 | (b)(q) | | 19.72 | (j) |
Ratios (%) (to average net assets)
and Supplemental data: | | | | | | | | | | | | | | | | |
| Expenses before expense reductions (f) | | 0.64 | (a) | | 0.62 | | | 0.68 | | | 0.71 | | | 0.67 | | | 0.72 | |
| Expenses after expense reductions (f) | | 0.64 | (a) | | 0.62 | | | 0.67 | | | 0.71 | | | 0.67 | | | 0.72 | |
| Net investment income | | 0.93 | (a) | | 0.92 | | | 0.73 | | | 0.67 | | | 0.78 | | | 1.08 | |
| Portfolio turnover | | 49 | | | 84 | | | 99 | | | 99 | | | 117 | | | 114 | |
Net assets at end of period
(000 Omitted) | | $843,077 | | | $932,127 | | | $760,210 | | | $619,534 | | | $421,942 | | | $186,804 | |
See Notes to Financial Statements
20
Financial Highlights – continued
| | | | | | | | | |
| | | Six months
ended
3/31/08 (unaudited) | | | Years ended 9/30 | |
| Class W | | | 2007 | | | 2006 (i) | |
| | | | | | | | |
Net asset value, beginning
of period | | $26.94 | | | $22.62 | | | $22.76 | |
Income (loss) from
investment operations | | | | | | | | | |
Net investment income (d) | | $0.11 | | | $0.20 | | | $0.06 | |
Net realized and unrealized
gain (loss) on investments
and foreign currency | | (2.63 | ) | | 4.25 | | | (0.20 | ) |
| Total from investment operations | | $(2.52 | ) | | $4.45 | | | $(0.14 | ) |
Less distributions declared
to shareholders | | | | | | | |
From net investment income | | $(0.24 | ) | | $(0.13 | ) | | $— | |
| Net asset value, end of period | | $24.18 | | | $26.94 | | | $22.62 | |
| Total return (%) (r)(s) | | (9.46 | )(n) | | 19.77 | | | (0.62 | )(n) |
Ratios (%) (to average net assets)
and Supplemental data: | | | | | | | | | |
Expenses before
expense reductions (f) | | 0.74 | (a) | | 0.72 | | | 0.77 | (a) |
Expenses after
expense reductions (f) | | 0.74 | (a) | | 0.72 | | | 0.77 | (a) |
| Net investment income | | 0.84 | (a) | | 0.79 | | | 0.66 | (a) |
| Portfolio turnover | | 49 | | | 84 | | | 99 | |
Net assets at end of period
(000 Omitted) | | $179 | | | $198 | | | $99 | |
See Notes to Financial Statements
21
Financial Highlights – continued
| | | | | | | | | | | | | | | | | | |
| | | Six months
ended 3/31/08 (unaudited) | | | Years ended 9/30 | |
| Class R | | | 2007 | | | 2006 | | | 2005 | | | 2004 | | | 2003 (i) | |
| | | | | | | | | | | | | | | | | |
| Net asset value, beginning of period | | $26.65 | | | $22.35 | | | $21.01 | | | $17.83 | | | $15.87 | | | $14.12 | |
| Income (loss) from investment operations | | | | | | | | | | | | | | | | | | |
Net investment income (d) | | $0.05 | | | $0.12 | | | $0.05 | | | $0.03 | | | $0.05 | | | $0.07 | |
Net realized and unrealized
gain (loss) on investments
and foreign currency | | (2.62 | ) | | 4.19 | | | 1.31 | | | 3.22 | | | 2.06 | | | 1.68 | |
| Total from investment operations | | $(2.57 | ) | | $4.31 | | | $1.36 | | | $3.25 | | | $2.11 | | | $1.75 | |
Less distributions declared
to shareholders | | | | | | | | | | | | | |
From net investment income | | $— | | | $(0.01 | ) | | $(0.02 | ) | | $(0.07 | ) | | $(0.15 | ) | | $— | |
| Net asset value, end of period | | $24.08 | | | $26.65 | | | $22.35 | | | $21.01 | | | $17.83 | | | $15.87 | |
| Total return (%) (r)(s) | | (9.64 | )(n) | | 19.30 | | | 6.49 | | | 18.28 | | | 13.39 | (b)(q) | | 12.39 | (j)(n) |
Ratios (%) (to average net assets)
and Supplemental data: | | | | | | | | | | | | | | | | |
| Expenses before expense reductions (f) | | 1.13 | (a) | | 1.12 | | | 1.18 | | | 1.21 | | | 1.17 | | | 1.21 | (a) |
| Expenses after expense reductions (f) | | 1.13 | (a) | | 1.12 | | | 1.17 | | | 1.21 | | | 1.17 | | | 1.21 | (a) |
| Net investment income | | 0.40 | (a) | | 0.50 | | | 0.23 | | | 0.15 | | | 0.28 | | | 0.56 | (a) |
| Portfolio turnover | | 49 | | | 84 | | | 99 | | | 99 | | | 117 | | | 114 | |
Net assets at end of period
(000 Omitted) | | $863 | | | $2,893 | | | $5,577 | | | $6,980 | | | $2,158 | | | $40 | |
See Notes to Financial Statements
22
Financial Highlights – continued
| | | | | | | | | | | | |
| | | Six months
ended
3/31/08 (unaudited) | | | Years ended 9/30 | |
| Class R1 | | | 2007 | | | 2006 | | | 2005 (i) | |
| | | | | | | | | | | |
Net asset value, beginning
of period | | $24.82 | | | $20.93 | | | $19.84 | | | $18.66 | |
Income (loss) from
investment operations | | | | | | | | | | |
Net investment loss (d) | | $(0.02 | ) | | $(0.04 | ) | | $(0.07 | ) | | $(0.05 | ) |
Net realized and unrealized
gain (loss) on investments
and foreign currency | | (2.43 | ) | | 3.93 | | | 1.24 | | | 1.23 | (g) |
| Total from investment operations | | $(2.45 | ) | | $3.89 | | | $1.17 | | | $1.18 | |
Less distributions declared
to shareholders | | | | | | | | | | |
From net investment income | | $(0.12 | ) | | $— | | | $(0.08 | ) | | $— | |
| Net asset value, end of period | | $22.25 | | | $24.82 | | | $20.93 | | | $19.84 | |
| Total return (%) (r)(s) | | (9.93 | )(n) | | 18.59 | | | 5.89 | | | 6.32 | (n) |
Ratios (%) (to average net assets)
and Supplemental data: | | | | | | | | | | | | |
Expenses before
expense reductions (f) | | 1.73 | (a) | | 1.77 | | | 1.87 | | | 1.89 | (a) |
Expenses after
expense reductions (f) | | 1.73 | (a) | | 1.72 | | | 1.77 | | | 1.89 | (a) |
| Net investment loss | | (0.15 | )(a) | | (0.19 | ) | | (0.36 | ) | | (0.59 | )(a) |
| Portfolio turnover | | 49 | | | 84 | | | 99 | | | 99 | |
Net assets at end of period
(000 Omitted) | | $4,438 | | | $3,445 | | | $1,868 | | | $776 | |
See Notes to Financial Statements
23
Financial Highlights – continued
| | | | | | | | | | | |
| | | Six months
ended
3/31/08 (unaudited) | | | Years ended 9/30 | |
| Class R2 | | | 2007 | | 2006 | | | 2005 (i) | |
| | | | | | | | | | |
Net asset value, beginning
of period | | $25.00 | | | $21.01 | | $19.86 | | | $18.66 | |
Income (loss) from
investment operations | | | | | | | | | |
Net investment income (loss) (d) | | $0.04 | | | $0.04 | | $(0.00 | )(w) | | $(0.02 | ) |
Net realized and unrealized
gain (loss) on investments
and foreign currency | | (2.45 | ) | | 3.95 | | 1.24 | | | 1.22 | (g) |
| Total from investment operations | | $(2.41 | ) | | $3.99 | | $1.24 | | | $1.20 | |
Less distributions declared
to shareholders | | | | | | | | | |
From net investment income | | $(0.21 | ) | | $— | | $(0.09 | ) | | $— | |
| Net asset value, end of period | | $22.38 | | | $25.00 | | $21.01 | | | $19.86 | |
| Total return (%) (r)(s) | | (9.73 | )(n) | | 18.99 | | 6.27 | | | 6.43 | (n) |
Ratios (%) (to average net assets)
and Supplemental data: | | | | | | | | | | | |
Expenses before
expense reductions (f) | | 1.27 | (a) | | 1.44 | | 1.57 | | | 1.61 | (a) |
Expenses after
expense reductions (f) | | 1.27 | (a) | | 1.37 | | 1.42 | | | 1.61 | (a) |
| Net investment income (loss) | | 0.33 | (a) | | 0.17 | | (0.01 | ) | | (0.19 | )(a) |
| Portfolio turnover | | 49 | | | 84 | | 99 | | | 99 | |
Net assets at end of period
(000 Omitted) | | $1,806 | | | $1,002 | | $411 | | | $53 | |
See Notes to Financial Statements
24
Financial Highlights – continued
| | | | | | | | | | | | | | | |
| | | Six months
ended
3/31/08 (unaudited) | | | Years ended 9/30 | |
| Class R3 | | | 2007 | | | 2006 | | | 2005 | | | 2004 (i) | |
| | | | | | | | | | | | | | |
Net asset value, beginning
of period | | $26.42 | | | $22.22 | | | $20.91 | | | $17.77 | | | $16.61 | |
Income (loss) from
investment operations | | | | | | | |
Net investment income (loss) (d) | | $0.05 | | | $0.06 | | | $0.02 | | | $(0.02 | ) | | $(0.01 | ) |
Net realized and unrealized
gain (loss) on investments
and foreign currency | | (2.59 | ) | | 4.18 | | | 1.31 | | | 3.22 | | | 1.35 | |
| Total from investment operations | | $(2.54 | ) | | $4.24 | | | $1.33 | | | $3.20 | | | $1.34 | |
Less distributions declared
to shareholders | | | | | | | | | | | | | |
From net investment income | | $(0.18 | ) | | $(0.04 | ) | | $(0.02 | ) | | $(0.06 | ) | | $(0.18 | ) |
| Net asset value, end of period | | $23.70 | | | $26.42 | | | $22.22 | | | $20.91 | | | $17.77 | |
| Total return (%) (r)(s) | | (9.69 | )(n) | | 19.12 | | | 6.34 | | | 18.02 | | | 8.10 | (b)(n)(q) |
Ratios (%) (to average net assets)
and Supplemental data: | | | | | | | | | | | | | |
Expenses before
expense reductions (f) | | 1.22 | (a) | | 1.31 | | | 1.42 | | | 1.46 | | | 1.42 | (a) |
Expenses after
expense reductions (f) | | 1.22 | (a) | | 1.27 | | | 1.32 | | | 1.46 | | | 1.42 | (a) |
| Net investment income (loss) | | 0.36 | (a) | | 0.24 | | | 0.09 | | | (0.09 | ) | | (0.06 | )(a) |
| Portfolio turnover | | 49 | | | 84 | | | 99 | | | 99 | | | 117 | |
Net assets at end of period
(000 Omitted) | | $7,873 | | | $6,079 | | | $2,632 | | | $1,329 | | | $155 | |
See Notes to Financial Statements
25
Financial Highlights – continued
| | | | | | | | | | | | |
| | | Six months
ended
3/31/08 (unaudited) | | | Years ended 9/30 | |
| Class R4 | | | 2007 | | | 2006 | | | 2005 (i) | |
| | | | | | | | | | | |
Net asset value, beginning
of period | | $26.88 | | | $22.55 | | | $21.21 | | | $19.87 | |
Income (loss) from
investment operations | | | | |
Net investment income (d) | | $0.08 | | | $0.11 | | | $0.08 | | | $0.03 | |
Net realized and unrealized
gain (loss) on investments
and foreign currency | | (2.64 | ) | | 4.27 | | | 1.32 | | | 1.31 | (g) |
| Total from investment operations | | $(2.56 | ) | | $4.38 | | | $1.40 | | | $1.34 | |
Less distributions declared
to shareholders | | | | | | | | | | |
From net investment income | | $(0.20 | ) | | $(0.05 | ) | | $(0.06 | ) | | $— | |
| Net asset value, end of period | | $24.12 | | | $26.88 | | | $22.55 | | | $21.21 | |
| Total return (%) (r)(s) | | (9.61 | )(n) | | 19.46 | | | 6.62 | | | 6.74 | (n) |
Ratios (%) (to average net assets)
and Supplemental data: | | | | | | | | | | | | |
Expenses before
expense reductions (f) | | 0.97 | (a) | | 1.02 | | | 1.07 | | | 1.11 | (a) |
Expenses after
expense reductions (f) | | 0.97 | (a) | | 1.02 | | | 1.07 | | | 1.11 | (a) |
| Net investment income | | 0.61 | (a) | | 0.44 | | | 0.34 | | | 0.31 | (a) |
| Portfolio turnover | | 49 | | | 84 | | | 99 | | | 99 | |
Net assets at end of period
(000 Omitted) | | $5,341 | | | $5,513 | | | $1,815 | | | $53 | |
See Notes to Financial Statements
26
Financial Highlights – continued
| | | | | | | | | | | | |
| | | Six months
ended
3/31/08 (unaudited) | | | Years ended 9/30 | |
| Class R5 | | | 2007 | | | 2006 | | | 2005 (i) | |
| | | | | | | | | | | |
Net asset value, beginning
of period | | $26.95 | | | $22.62 | | | $21.24 | | | $19.87 | |
Income (loss) from
investment operations | | | | |
Net investment income (d) | | $0.11 | | | $0.21 | | | $0.14 | | | $0.06 | |
Net realized and unrealized
gain (loss) on investments
and foreign currency | | (2.64 | ) | | 4.25 | | | 1.33 | | | 1.31 | (g) |
| Total from investment operations | | $(2.53 | ) | | $4.46 | | | $1.47 | | | $1.37 | |
Less distributions declared
to shareholders | | | | | | | | | | |
From net investment income | | $(0.23 | ) | | $(0.13 | ) | | $(0.09 | ) | | $— | |
| Net asset value, end of period | | $24.19 | | | $26.95 | | | $22.62 | | | $21.24 | |
| Total return (%) (r)(s) | | (9.48 | )(n) | | 19.77 | | | 6.95 | | | 6.89 | (n) |
Ratios (%) (to average net assets)
and Supplemental data: | | | | | | | | | | |
Expenses before
expense reductions (f) | | 0.69 | (a) | | 0.72 | | | 0.77 | | | 0.81 | (a) |
Expenses after
expense reductions (f) | | 0.69 | (a) | | 0.72 | | | 0.77 | | | 0.81 | (a) |
| Net investment income | | 0.88 | (a) | | 0.83 | | | 0.63 | | | 0.61 | (a) |
| Portfolio turnover | | 49 | | | 84 | | | 99 | | | 99 | |
Net assets at end of period
(000 Omitted) | | $62 | | | $68 | | | $57 | | | $53 | |
See Notes to Financial Statements
27
Financial Highlights – continued
Any redemption fees charged by the fund during the 2004 and 2005 fiscal years resulted in a per share impact of less than $0.01.
| (b) | The fund’s net asset value and total return calculation include a non-recurring accrual recorded as a result of an administrative proceeding regarding disclosure of brokerage allocation practices in connection with fund sales. The non-recurring accrual resulted in an increase in the net asset value of $0.02 per share based on shares outstanding on the day the proceeds were recorded. Excluding the effect of this accrual from the ending net asset value per share, Class A, Class B, Class C, Class I, Class R, and Class R3 total returns for the year ended September 30, 2004 would have been lower by 0.11%. |
| (d) | Per share data is based on average shares outstanding. |
| (f) | Ratios do not reflect reductions from fees paid indirectly, if applicable. |
| (g) | The per share amount varies from the net realized and unrealized gain/loss for the period because of the timing of sales of fund shares and the per share amount of realized and unrealized gains and losses at such time. |
| (i) | For the period from the class’ inception, December 31, 2002 (Class R), October 31, 2003 (Class R3), April 1, 2005 (Classes R1, R2, R4, and R5) and May 1, 2006 (Class W) through the stated period end. |
| (j) | The fund’s net asset value and total return calculation include proceeds received on March 26, 2003 for the partial payment of a non-recurring litigation settlement from Cendant Corporation, recorded as a realized gain on investment transactions. The proceeds resulted in an increase in the net asset value of $0.07 per share based on shares outstanding on the day the proceeds were received. Excluding the effect of this payment from the ending net asset value per share, the Class A, Class B, Class C, Class I, and Class R total return for the year ended September 30, 2003 would have been lower by approximately 0.53%, 0.55%, 0.56%, 0.52%, and 0.49%, respectively. |
| (q) | The fund’s net asset value and total return calculation include proceeds received on February 18, 2004 from a non-recurring litigation settlement from Rite Aid Corporation and on March 19, 2004 for the remaining payment of a non-recurring litigation settlement from Cendant Corporation, recorded as a realized gain on investment transactions. The proceeds resulted in an increase in the net asset value of $0.02 per share based on shares outstanding on the days the proceeds were received. Excluding the effect of these payment from the ending net asset value per share, the Class A, Class B, Class C, Class I, Class R, and Class R3 total return for the year ended September 30, 2004 would have been lower by approximately 0.10%, 0.14%, 0.12%, 0.09%, 0.16%, and 0.09%, respectively. |
| (r) | Certain expenses have been reduced without which performance would have been lower. |
| (s) | From time to time the fund may receive proceeds from litigation settlements, without which performance would be lower. |
| (t) | Total returns do not include any applicable sales charges. |
| (w) | Per share amount was less than $0.01. |
See Notes to Financial Statements
28
NOTES TO FINANCIAL STATEMENTS
(unaudited)
| (1) | | Business and Organization |
MFS Research Fund (the fund) is a series of MFS Series Trust V (the trust). The trust is organized as a Massachusetts business trust and is registered under the Investment Company Act of 1940, as amended, as an open-end management investment company.
| (2) | | Significant Accounting Policies |
General – The preparation of financial statements in conformity with U.S. generally accepted accounting principles requires management to make estimates and assumptions that affect the reported amounts of assets and liabilities, and disclosure of contingent assets and liabilities at the date of the financial statements and the reported amounts of revenues and expenses during the reporting period. Actual results could differ from those estimates. The fund can invest in foreign securities, including securities of emerging market issuers. Investments in foreign securities are vulnerable to the effects of changes in the relative values of the local currency and the U.S. dollar and to the effects of changes in each country’s legal, political, and economic environment. The markets of emerging markets countries are generally more volatile than the markets of developed countries with more mature economies. All of the risks of investing in foreign securities previously described are heightened when investing in emerging markets countries.
Investment Valuations – Equity securities, including restricted equity securities, are generally valued at the last sale or official closing price as reported by an independent pricing service on the market or exchange on which they are primarily traded. For securities for which there were no sales reported that day, equity securities are generally valued at the last quoted daily bid quotation as reported by an independent pricing service on the market or exchange on which they are primarily traded. For securities held short for which there were no sales reported for the day, the position is generally valued at the last quoted daily ask quotation as reported by an independent pricing service on the market or exchange on which such securities are primarily traded. Exchange-traded options are generally valued at the last sale or official closing price as reported by an independent pricing service on the exchange on which such options are primarily traded. Exchange-traded options for which there were no sales reported that day are generally valued at the last daily bid quotation as reported by an independent pricing service on the exchange on which such options are primarily traded. Options not traded on an exchange are generally valued at a broker-dealer bid quotation. Foreign currency options are generally valued using an external pricing model that uses market data from an independent source. Open-end investment companies are generally
29
Notes to Financial Statements (unaudited) – continued
valued at net asset value per share. Securities and other assets generally valued on the basis of information from an independent pricing service may also be valued at a broker-dealer bid quotation. The values of foreign securities and other assets and liabilities expressed in foreign currencies are converted to U.S. dollars using the mean of bid and asked prices for rates reported by an independent pricing service.
The Board of Trustees has delegated primary responsibility for determining or causing to be determined the value of the fund’s investments (including any fair valuation) to the adviser pursuant to valuation policies and procedures approved by the Board. If the adviser determines that reliable market quotations are not readily available, investments are valued at fair value as determined in good faith by the adviser in accordance with such procedures under the oversight of the Board of Trustees. Under the fund’s valuation policies and procedures, market quotations are not considered to be readily available for most types of debt instruments and floating rate loans and many types of derivatives. These investments are generally valued at fair value based on information from independent pricing services. In addition, investments may be valued at fair value if the adviser determines that an investment’s value has been materially affected by events occurring after the close of the exchange or market on which the investment is principally traded (such as foreign exchange or market) and prior to the determination of the fund’s net asset value, or after the halting of trading of a specific security where trading does not resume prior to the close of the exchange or market on which the security is principally traded. Events that occur on a frequent basis after foreign markets close (such as developments in foreign markets and significant movements in the U.S. markets) and prior to the determination of the fund’s net asset value may be deemed to have a material affect on the value of securities traded in foreign markets. Accordingly, the fund’s foreign equity securities may often be valued at fair value. The adviser may rely on independent pricing services or other information (such as the correlation with price movements of similar securities in the same or other markets; the type, cost and investment characteristics of the security; the business and financial condition of the issuer; and trading and other market data) to assist in determining whether to fair value and at what value to fair value an investment. The value of an investment for purposes of calculating the fund’s net asset value can differ depending on the source and method used to determine value. When fair valuation is used, the value of investments used to determine the fund’s net asset value may differ from quoted or published prices for the same investments.
In September 2006, FASB Statement No. 157, Fair Value Measurements (the “Statement”) was issued, and is effective for fiscal years beginning after
30
Notes to Financial Statements (unaudited) – continued
November 15, 2007 and for all interim periods within those fiscal years. This Statement provides a single definition of fair value, a hierarchy for measuring fair value and expanded disclosures about fair value measurements. Management is evaluating the application of the Statement to the fund, and believes the impact will be limited to expanded disclosures resulting from the adoption of this Statement in the fund’s financial statements.
Repurchase Agreements – The fund may enter into repurchase agreements with institutions that the fund’s investment adviser has determined are creditworthy. Each repurchase agreement is recorded at cost. The fund requires that the securities collateral in a repurchase transaction be transferred to a custodian in a manner sufficient to enable the fund to obtain those securities in the event of a default under the repurchase agreement. The fund monitors, on a daily basis, the value of the collateral to ensure that its value, including accrued interest, is greater than amounts owed to the fund under each such repurchase agreement.
Foreign Currency Translation – Purchases and sales of foreign investments, income, and expenses are converted into U.S. dollars based upon currency exchange rates prevailing on the respective dates of such transactions. Gains and losses attributable to foreign currency exchange rates on sales of securities are recorded for financial statement purposes as net realized gains and losses on investments. Gains and losses attributable to foreign exchange rate movements on income and expenses are recorded for financial statement purposes as foreign currency transaction gains and losses. That portion of both realized and unrealized gains and losses on investments that results from fluctuations in foreign currency exchange rates is not separately disclosed.
Derivative Risk – The fund may invest in derivatives for hedging or non-hedging purposes. While hedging can reduce or eliminate losses, it can also reduce or eliminate gains. When the fund uses derivatives as an investment to gain market exposure, or for hedging purposes, gains and losses from derivative instruments may be substantially greater than the derivative’s original cost. Cash that has been segregated on behalf of certain derivative contracts will be reported separately on the Statement of Assets and Liabilities as restricted cash. Derivative instruments include written options and purchased options.
Written Options – The fund may write call or put options in exchange for a premium. The premium is initially recorded as a liability, which is subsequently adjusted to the current value of the option contract. When a written option expires, the fund realizes a gain equal to the amount of the premium received. The difference between the premium and the amount paid on effecting a closing transaction is considered a realized gain or loss. When a written call option is exercised, the premium received is offset against the
31
Notes to Financial Statements (unaudited) – continued
proceeds to determine the realized gain or loss. When a written put option is exercised, the premium reduces the cost basis of the security purchased by the fund. The fund, as writer of an option, may have no control over whether the underlying securities may be sold (call) or purchased (put) and, as a result, bears the market risk of an unfavorable change in the price of the securities underlying the written option. In general, written call options may serve as a partial hedge against decreases in value in the underlying securities to the extent of the premium received.
Written Option Transactions
| | | | | | |
| | | Number of
Contracts | | | Premiums
Received | |
| Outstanding, beginning of period | | — | | | $— | |
| Options written | | 3,377 | | | 721,139 | |
| Options closed | | (3,377 | ) | | (721,139 | ) |
| Options exercised | | — | | | — | |
| Options expired | | — | | | — | |
| Outstanding, end of period | | | | | $— | |
Purchased Options – The fund may purchase call or put options for a premium. Purchasing call options may be a hedge against an anticipated increase in the dollar cost of securities to be acquired or to increase the fund’s exposure to the underlying instrument. Purchasing put options may hedge against a decline in the value of portfolio securities. The premium paid is included as an investment in the Statement of Assets and Liabilities and is subsequently adjusted to the current value of the option. Premiums paid for purchased options which have expired are treated as realized losses on investments in the Statement of Operations. Premiums paid for purchased options which are exercised or closed are added to the amount paid or offset against the proceeds on the underlying security or financial instrument to determine the realized gain or loss. The risk of loss associated with purchased options is limited to the premium paid.
In March 2008, FASB Statement No. 161, Disclosures about Derivative Instruments and Hedging Activities (the “Standard”) was issued, and is effective for financial statements issued for fiscal years and interim periods beginning after November 15, 2008. This Standard provides enhanced disclosures about the fund’s use of and accounting for derivative instruments and the effect of derivative instruments on the fund’s results of operations and financial position. Management is evaluating the application of the Standard to the fund, and has not at this time determined the impact, if any, resulting from the adoption of this Standard on the fund’s financial statements.
There were no outstanding financial instruments with off-balance-sheet risk at the end of the period.
32
Notes to Financial Statements (unaudited) – continued
Security Loans – JPMorgan Chase and Co. (“Chase”), as lending agent, may loan the securities of the fund to certain qualified institutions (the “Borrowers”) approved by the fund. The loans are collateralized at all times by cash and/or U.S. Treasury and federal agency obligations in an amount at least equal to the market value of the securities loaned. Security lending activity through Chase is further collateralized by an irrevocable standby letter of credit. Chase provides the fund with indemnification against Borrower default. The fund bears the risk of loss with respect to the investment of cash collateral. On loans collateralized by cash, the cash collateral is invested in short-term securities. A portion of the income generated upon investment of the collateral is remitted to the Borrowers, and the remainder is allocated between the fund and the lending agent. On loans collateralized by U.S. Treasury and/or federal agency obligations, a fee is received from the Borrower, and is allocated between the fund and the lending agent. Net income from securities lending is included in interest income on the Statement of Operations. The dividend and interest income earned on the securities loaned is accounted for in the same manner as other dividend and interest income. At March 31, 2008 there were no securities on loan.
Indemnifications – Under the fund’s organizational documents, its officers and trustees may be indemnified against certain liabilities and expenses arising out of the performance of their duties to the fund. Additionally, in the normal course of business, the fund enters into agreements with service providers that may contain indemnification clauses. The fund’s maximum exposure under these agreements is unknown as this would involve future claims that may be made against the fund that have not yet occurred.
Investment Transactions and Income – Investment transactions are recorded on the trade date. Interest income is recorded on the accrual basis. All premium and discount is amortized or accreted for financial statement purposes in accordance with U.S. generally accepted accounting principles. Dividends received in cash are recorded on the ex-dividend date. Certain dividends from foreign securities will be recorded when the fund is informed of the dividend if such information is obtained subsequent to the ex-dividend date. Dividend and interest payments received in additional securities are recorded on the ex-dividend or ex-interest date in an amount equal to the value of the security on such date.
The fund may receive proceeds from litigation settlements. Any proceeds received from litigation involving portfolio holdings are reflected in the Statement of Operations in realized gain/loss if the security has been disposed of by the fund or in unrealized gain/loss if the security is still held by the fund. Any other proceeds from litigation not related to portfolio holdings are reflected as other income in the Statement of Operations.
33
Notes to Financial Statements (unaudited) – continued
Fees Paid Indirectly – The fund’s custody fee may be reduced according to an arrangement that measures the value of cash deposited with the custodian by the fund. This amount, for the six months ended March 31, 2008, is shown as a reduction of total expenses on the Statement of Operations.
Tax Matters and Distributions – The fund intends to qualify as a regulated investment company, as defined under Subchapter M of the Internal Revenue Code, and to distribute all of its taxable income, including realized capital gains. As a result, no provision for federal income taxes is required. The fund adopted the provisions of FASB Interpretation No. 48, Accounting for Uncertainty in Income Taxes (“the Interpretation”) on the first day of the fund’s fiscal year. The Interpretation prescribes a minimum threshold for financial statement recognition of the benefit of a tax position taken or expected to be taken in a tax return. There was no impact resulting from the adoption of this Interpretation on the fund’s financial statements. Each of the fund’s federal tax returns for the prior three fiscal years remains subject to examination by the Internal Revenue Service. It is the fund’s policy to record interest and penalty charges on underpaid taxes associated with its tax positions as interest expense and miscellaneous expense, respectively. No such charges were recorded in the current financial statements. Foreign taxes, if any, have been accrued by the fund in the accompanying financial statements.
Distributions to shareholders are recorded on the ex-dividend date. Income and capital gain distributions are determined in accordance with income tax regulations, which may differ from U.S. generally accepted accounting principles. Certain capital accounts in the financial statements are periodically adjusted for permanent differences in order to reflect their tax character. These adjustments have no impact on net assets or net asset value per share. Temporary differences which arise from recognizing certain items of income, expense, gain or loss in different periods for financial statement and tax purposes will reverse at some time in the future. Distributions in excess of net investment income or net realized gains are temporary overdistributions for financial statement purposes resulting from differences in the recognition or classification of income or distributions for financial statement and tax purposes.
Book/tax differences primarily relate to wash sale loss deferrals.
The tax character of distributions made during the current period will be determined at fiscal year end. The tax character of distributions declared to shareholders is as follows:
| | |
| | | 9/30/07 |
Ordinary income (including any short-term capital gains) | | $9,003,538 |
34
Notes to Financial Statements (unaudited) – continued
The federal tax cost and the tax basis components of distributable earnings were as follows:
| | | |
| As of 3/31/08 | | | |
| Cost of investments | | $2,344,567,566 | |
| Gross appreciation | | 166,400,945 | |
| Gross depreciation | | (222,824,274 | ) |
| Net unrealized appreciation (depreciation) | | $(56,423,329 | ) |
| |
| As of 9/30/07 | | | |
| Undistributed ordinary income | | 16,334,860 | |
| Capital loss carryforwards | | (140,548,295 | ) |
| Other temporary differences | | (358,258 | ) |
| Net unrealized appreciation (depreciation) | | 238,280,694 | |
The aggregate cost above includes prior fiscal year end tax adjustments.
As of March 31, 2008, the fund had capital loss carryforwards available to offset future realized gains. Such losses expire as follows:
Multiple Classes of Shares of Beneficial Interest – The fund offers multiple classes of shares, which differ in their respective distribution and service fees. All shareholders bear the common expenses of the fund based on daily net assets of each class, without distinction between share classes. Dividends are declared separately for each class. Differences in per share dividend rates are generally due to differences in separate class expenses. Class B shares will convert to Class A shares approximately eight years after purchase. Class 529A, Class 529B, and Class 529C shares closed on March 31, 2007.
| (3) | | Transactions with Affiliates |
Investment Adviser – The fund has an investment advisory agreement with Massachusetts Financial Services Company (MFS) to provide overall investment management and related administrative services and facilities to the fund. The management fee is computed daily and paid monthly at an annual rate of 0.43% of the fund’s average daily net assets.
Distributor – MFS Fund Distributors, Inc. (MFD), a wholly-owned subsidiary of MFS, as distributor, received $28,335 for the six months ended March 31, 2008, as its portion of the initial sales charge on sales of Class A shares of the fund.
The Board of Trustees has adopted a distribution plan for certain class shares pursuant to Rule 12b-1 of the Investment Company Act of 1940.
The fund’s distribution plan provides that the fund will pay MFD for services provided by MFD and financial intermediaries in connection with the distribution and servicing of certain share classes. One component of the plan
35
Notes to Financial Statements (unaudited) – continued
is a distribution fee paid to MFD and another component of the plan is a service fee paid to MFD. MFD may subsequently pay all, or a portion, of the distribution and/or service fees to financial intermediaries.
Distribution Plan Fee Table:
| | | | | | | | | | |
| | | Distribution
Fee Rate | | Service
Fee Rate | | Total
Distribution
Plan (d) | | Annual
Effective
Rate (e) | | Distribution
and Service
Fee |
| Class A | | 0.10% | | 0.25% | | 0.35% | | 0.35% | | $2,229,187 |
| Class B | | 0.75% | | 0.25% | | 1.00% | | 1.00% | | 922,768 |
| Class C | | 0.75% | | 0.25% | | 1.00% | | 1.00% | | 711,045 |
| Class W | | 0.10% | | — | | 0.10% | | 0.10% | | 95 |
| Class R | | 0.25% | | 0.25% | | 0.50% | | 0.50% | | 3,504 |
| Class R1 | | 0.75% | | 0.25% | | 1.00% | | 0.79% | | 17,320 |
| Class R2 | | 0.25% | | 0.25% | | 0.50% | | 0.50% | | 4,466 |
| Class R3 | | 0.25% | | 0.25% | | 0.50% | | 0.50% | | 20,386 |
| Class R4 | | — | | 0.25% | | 0.25% | | 0.25% | | 7,042 |
| Total Distribution and Service Fees | | | | | | $3,915,813 |
| (d) | In accordance with the distribution plan for certain classes, the fund pays distribution and/or service fees up to these annual percentage rates of each class’ average daily net assets. |
| (e) | The annual effective rates represent actual fees incurred under the distribution plan for the six months ended March 31, 2008 based on each class’ average daily net assets. Assets attributable to Class A shares sold prior to March 1, 1991 are subject to a service fee of 0.15% annually. Effective March 1, 2008, the distribution fee rate for Class R1 shares increased from 0.50% to 0.75%. |
Certain Class A and Class C shares are subject to a contingent deferred sales charge in the event of a shareholder redemption within 12 months of purchase. Class B shares are subject to a contingent deferred sales charge in the event of a shareholder redemption within six years of purchase. All contingent deferred sales charges are paid to MFD and during the six months ended March 31, 2008, were as follows:
| | |
| | | Amount |
| Class A | | $400 |
| Class B | | $104,714 |
| Class C | | $3,034 |
Shareholder Servicing Agent – MFS Service Center, Inc. (MFSC), a wholly-owned subsidiary of MFS, receives a fee from the fund for its services as shareholder servicing agent calculated as a percentage of the average daily net assets of the fund as determined periodically under the supervision of the fund’s Board of Trustees. For the six months ended March 31, 2008, the fee was $609,695, which equated to 0.0486% annually of the fund’s average daily net assets. MFSC also receives payment from the fund for out-of-pocket expenses, sub-accounting and other shareholder servicing costs which may be paid to affiliated and unaffiliated service providers. For the six months ended
36
Notes to Financial Statements (unaudited) – continued
March 31, 2008, these out-of-pocket expenses, sub-accounting and other shareholder servicing costs amounted to $965,488.
Effective May 1, 2007, under a Special Servicing Agreement among MFS, each MFS fund which invests in other MFS funds (“MFS fund-of-funds”) and each underlying fund in which a MFS fund-of-funds invests (“underlying funds”), each underlying fund may pay a portion of each MFS fund-of-fund’s transfer agent-related expenses, including sub-accounting fees payable to financial intermediaries, to the extent such payments do not exceed the benefits realized or expected to be realized by the underlying fund from the investment in the underlying fund by the MFS fund-of-fund. For the six months ended March 31, 2008, these costs for the fund amounted to $551,822 and are reflected in the shareholder servicing costs on the Statement of Operations.
Administrator – MFS provides certain financial, legal, shareholder communications, compliance, and other administrative services to the fund. Under an administrative services agreement, the fund partially reimburses MFS the costs incurred to provide these services. The fund is charged a fixed amount plus a fee based on average daily net assets. The fund’s annual fixed amount is $17,500.
The administrative services fee incurred for the six months ended March 31, 2008 was equivalent to an annual effective rate of 0.0135% of the fund’s average daily net assets.
In addition to the administrative services provided by MFS to the fund as described above, MFS is responsible for providing certain retirement plan administration and services with respect to certain shares. These services include various administrative, recordkeeping, and communication/educational services with respect to the retirement plans which invest in these shares, and may be provided directly by MFS or by a third party. MFS may subsequently pay all, or a portion, of the retirement plan administration and services fee to affiliated or unaffiliated third parties. For the six months ended March 31, 2008, the fund paid MFS an annual retirement plan administration and services fee up to the following annual percentage rates of each class’ average daily net assets:
| | | | | | | | | | |
| | | Beginning
of period
through
12/31/07 | | Effective
1/01/08 | | Effective
3/01/08 | | Annual
Effective
Rate (g) | | Total
Amount |
Class R1 | | 0.35% | | 0.35% | | — | | 0.29% | | $6,330 |
Class R2 | | 0.25% | | — | | — | | 0.12% | | 1,107 |
Class R3 | | 0.15% | | — | | — | | 0.08% | | 3,119 |
Class R4 | | 0.15% | | — | | — | | 0.08% | | 2,145 |
Class R5 | | 0.10% | | — | | — | | 0.05% | | 17 |
| Total Retirement Plan Administration and Services Fees | | $12,718 |
37
Notes to Financial Statements (unaudited) – continued
| (g) | Effective January 1, 2008, the annual retirement plan administration and services fee was eliminated for Class R2, Class R3, Class R4, and Class R5 shares. Effective March 1, 2008, the annual retirement plan administration and services fee was eliminated for Class R1 shares. |
Trustees’ and Officers’ Compensation – The fund pays compensation to independent trustees in the form of a retainer, attendance fees, and additional compensation to Board and Committee chairpersons. The fund does not pay compensation directly to trustees or officers of the fund who are also officers of the investment adviser, all of whom receive remuneration for their services to the fund from MFS. Certain officers and trustees of the fund are officers or directors of MFS, MFD, and MFSC.
The fund has an unfunded, defined benefit plan for certain retired independent trustees which resulted in a pension expense of $5,274. The fund also has an unfunded retirement benefit deferral plan for certain independent trustees which resulted in a net decrease in expense of $7,830. Both amounts are included in independent trustees’ compensation for the six months ended March 31, 2008. The liability for deferred retirement benefits payable to certain independent trustees under both plans amounted to $238,688 at March 31, 2008, and is included in payable for independent trustees’ compensation.
Deferred Trustee Compensation – Under a Deferred Compensation Plan (the Plan) independent trustees previously were allowed to elect to defer receipt of all or a portion of their annual compensation. Trustees are no longer allowed to defer compensation under the Plan. Amounts previously deferred are treated as though equivalent dollar amounts had been invested in shares of certain MFS funds selected by the trustee. Deferred amounts represent an unsecured obligation of the fund until distributed in accordance with the Plan. Included in other assets and payable for independent trustees’ compensation is $67,948 of deferred trustees’ compensation.
Other – This fund and certain other MFS funds (the funds) have entered into a services agreement (the Agreement) which provides for payment of fees by the funds to Tarantino LLC in return for the provision of services of an Independent Chief Compliance Officer (ICCO) for the funds. The ICCO is an officer of the funds and the sole member of Tarantino LLC. The funds can terminate the Agreement with Tarantino LLC at any time under the terms of the Agreement. For the six months ended March 31, 2008, the fee paid by the fund to Tarantino LLC was $10,373 and is included in miscellaneous expense on the Statement of Operations. MFS has agreed to reimburse the fund for a portion of the payments made by the fund to Tarantino LLC in the amount of $5,777, which is shown as a reduction of total expenses in the Statement of Operations. Additionally, MFS has agreed to bear all expenses associated with office space, other administrative support, and supplies provided to the ICCO.
38
Notes to Financial Statements (unaudited) – continued
The fund may invest in a money market fund managed by MFS which seeks preservation of capital and current income. Income earned on this investment is included in dividends from underlying funds on the Statement of Operations. This money market fund does not pay a management fee to MFS.
Purchases and sales of investments, other than U.S. government securities, purchased option transactions, and short-term obligations, aggregated $1,234,159,542 and $1,394,013,119, respectively.
| (5) | | Shares of Beneficial Interest |
The fund’s Declaration of Trust permits the Trustees to issue an unlimited number of full and fractional shares of beneficial interest. Transactions in fund shares were as follows:
| | | | | | | | |
| | | Six months ended
3/31/08 | | Year ended
9/30/07 |
| | | Shares | | Amount | | Shares | | Amount |
| Shares sold | | | | | | | | |
Class A | | 3,610,949 | | $95,137,053 | | 6,110,886 | | $152,585,319 |
Class B | | 179,326 | | 4,305,455 | | 662,402 | | 15,329,226 |
Class C | | 87,069 | | 2,121,442 | | 221,548 | | 5,088,905 |
Class I | | 1,905,238 | | 49,821,545 | | 2,821,849 | | 70,222,720 |
Class W | | — | | — | | 2,915 | | 76,110 |
Class R | | 34,034 | | 901,922 | | 27,450 | | 666,925 |
Class R1 | | 83,160 | | 2,046,289 | | 153,027 | | 3,541,625 |
Class R2 | | 46,762 | | 1,171,528 | | 39,784 | | 948,266 |
Class R3 | | 172,106 | | 4,541,678 | | 289,102 | | 7,135,712 |
Class R4 | | 44,254 | | 1,170,480 | | 228,996 | | 5,798,879 |
Class 529A(c) | | — | | — | | 1,038 | | 24,973 |
Class 529B(c) | | — | | — | | 243 | | 5,312 |
Class 529C(c) | | — | | — | | 2,094 | | 46,229 |
| | 6,162,898 | | $161,217,392 | | 10,561,334 | | $261,470,201 |
| Shares issued to shareholders in reinvestment of distributions | | | | | | | | |
Class A | | 248,450 | | $6,700,690 | | 148,003 | | $3,541,712 |
Class I | | 304,462 | | 8,354,436 | | 202,388 | | 4,926,117 |
Class W | | 64 | | 1,732 | | 25 | | 589 |
Class R | | — | | — | | 114 | | 2,686 |
Class R1 | | 819 | | 20,354 | | — | | — |
Class R2 | | 664 | | 16,561 | | — | | — |
Class R3 | | 2,147 | | 56,748 | | 247 | | 5,821 |
Class R4 | | 1,508 | | 40,543 | | 163 | | 3,883 |
Class R5 | | 22 | | 581 | | 13 | | 320 |
Class 529A(c) | | — | | — | | 21 | | 496 |
| | 558,136 | | $15,191,645 | | 350,974 | | $8,481,624 |
39
Notes to Financial Statements (unaudited) – continued
| | | | | | | | | | | | |
| | | Six months ended
3/31/08 | | | Year ended
9/30/07 | |
| | | Shares | | | Amount | | | Shares | | | Amount | |
| Shares reacquired | | | | | | | | | | | | |
Class A | | (7,729,018 | ) | | $(201,852,839 | ) | | (21,106,268 | ) | | $(519,014,699 | ) |
Class B | | (2,314,822 | ) | | (55,812,527 | ) | | (7,147,834 | ) | | (164,908,373 | ) |
Class C | | (730,274 | ) | | (17,531,002 | ) | | (2,099,056 | ) | | (48,096,444 | ) |
Class I | | (1,939,984 | ) | | (53,093,531 | ) | | (2,070,333 | ) | | (53,634,468 | ) |
Class R | | (106,729 | ) | | (2,852,507 | ) | | (168,546 | ) | | (4,133,014 | ) |
Class R1 | | (23,319 | ) | | (557,318 | ) | | (103,476 | ) | | (2,346,514 | ) |
Class R2 | | (6,779 | ) | | (160,147 | ) | | (19,282 | ) | | (440,016 | ) |
Class R3 | | (72,132 | ) | | (1,853,318 | ) | | (177,753 | ) | | (4,331,903 | ) |
Class R4 | | (29,478 | ) | | (746,752 | ) | | (104,508 | ) | | (2,575,224 | ) |
Class 529A(c) | | — | | | — | | | (19,826 | ) | | (484,513 | ) |
Class 529B(c) | | — | | | — | | | (6,773 | ) | | (152,689 | ) |
Class 529C(c) | | — | | | — | | | (15,989 | ) | | (361,731 | ) |
| | (12,952,535 | ) | | $(334,459,941 | ) | | (33,039,644 | ) | | $(800,479,588 | ) |
| Net change | | | | | | | | | | | | |
Class A | | (3,869,619 | ) | | $(100,015,096 | ) | | (14,847,379 | ) | | $(362,887,668 | ) |
Class B | | (2,135,496 | ) | | (51,507,072 | ) | | (6,485,432 | ) | | (149,579,147 | ) |
Class C | | (643,205 | ) | | (15,409,560 | ) | | (1,877,508 | ) | | (43,007,539 | ) |
Class I | | 269,716 | | | 5,082,450 | | | 953,904 | | | 21,514,369 | |
Class W | | 64 | | | 1,732 | | | 2,939 | | | 76,699 | |
Class R | | (72,695 | ) | | (1,950,585 | ) | | (140,982 | ) | | (3,463,403 | ) |
Class R1 | | 60,660 | | | 1,509,325 | �� | | 49,551 | | | 1,195,111 | |
Class R2 | | 40,647 | | | 1,027,942 | | | 20,503 | | | 508,250 | |
Class R3 | | 102,121 | | | 2,745,108 | | | 111,596 | | | 2,809,630 | |
Class R4 | | 16,284 | | | 464,271 | | | 124,651 | | | 3,227,538 | |
Class R5 | | 22 | | | 581 | | | 13 | | | 320 | |
Class 529A (c) | | — | | | — | | | (18,767 | ) | | (459,044 | ) |
Class 529B (c) | | — | | | — | | | (6,530 | ) | | (147,377 | ) |
Class 529C (c) | | — | | | — | | | (13,895 | ) | | (315,502 | ) |
| | (6,231,501 | ) | | $(158,050,904 | ) | | (22,127,336 | ) | | $(530,527,763 | ) |
| (c) | Class 529A, Class 529B, and Class 529C shares closed on March 31, 2007. |
The fund is one of several mutual funds in which the MFS funds-of-funds may invest. The MFS funds-of-funds do not invest in the underlying MFS funds for the purpose of exercising management or control. At the end of the period, the MFS Moderate Allocation Fund, MFS Growth Allocation Fund, MFS Aggressive Growth Allocation Fund and MFS Conservative Allocation Fund were the owners of record of approximately 14%, 11%, 5% and 5%, respectively, of the value of outstanding voting shares. In addition, the MFS Lifetime Retirement Income Fund, MFS Lifetime 2010 Fund, the MFS Lifetime 2020 Fund, the Lifetime 2030 Fund and the MFS Lifetime 2040 Fund were each the owners of record of less than 1% of the value of outstanding voting shares.
The fund and other funds managed by MFS participate in a $1 billion unsecured committed line of credit provided by a syndication of banks under a credit agreement. In addition, the fund and other funds managed by MFS have established uncommitted borrowing arrangements with certain banks.
40
Notes to Financial Statements (unaudited) – continued
Borrowings may be made for temporary financing needs. Interest is charged to each fund, based on its borrowings, generally at a rate equal to the Federal Reserve funds rate plus 0.30%. In addition, a commitment fee, based on the average daily, unused portion of the committed line of credit, is allocated among the participating funds at the end of each calendar quarter. For the six months ended March 31, 2008, the fund’s commitment fee and interest expense were $5,441 and $0, respectively, and are included in miscellaneous expense on the Statement of Operations.
The fund’s investment adviser, MFS, was the subject of an administrative proceeding concerning market timing which resulted in the Securities and Exchange Commission (the “SEC”) entering an order approving a settlement with MFS and two of its former officers (the “Settlement Order”). Under the terms of the Settlement Order, MFS transferred $175 million in disgorgement and $50 million in penalty (the “Payments”) to a Fair Fund established by the SEC, from which settlement funds will be distributed to current and former shareholders of the fund and certain other affected MFS retail funds. The Payments will be distributed to shareholders in accordance with a plan developed by an independent distribution consultant (the “IDC”) in consultation with MFS and the Board of Trustees of the MFS retail funds. The plan was approved in July 2007 by the SEC. Pursuant to the distribution plan, after the distributions to eligible shareholders have been made, residual amounts, if any, may be available for distribution to the fund and certain other affected MFS retail funds. Payments made by third parties into other settlement funds to remediate harm caused by the third party’s late or excessive trading in certain MFS funds may also become part of the residual amounts. At this time, the residual amounts, if any, cannot be reasonably estimated and the fund has not accrued an estimate for any amounts to be received.
| (8) | | Transactions in Underlying Funds-Affiliated Issuers |
An affiliated issuer may be considered one in which the fund owns 5% or more of the outstanding voting securities, or a company which is under common control. For the purposes of this report, the fund assumes the following to be affiliated issuers:
| | | | | | | | | |
| Underlying Funds | | Beginning
Shares/Par
Amount | | Acquisitions
Shares/Par
Amount | | Dispositions
Shares/Par
Amount | | | Ending
Shares/Par
Amount |
MFS Institutional Money
Market Portfolio | | 8,541,771 | | 315,337,328 | | (303,394,386 | ) | | 20,484,713 |
| | | | |
| Underlying Funds | | Realized
Gain (Loss) | | Capital Gain
Distributions | | Dividend
Income | | | Ending
Value |
MFS Institutional Money
Market Portfolio | | $— | | $— | | $385,309 | | | $20,484,713 |
41
Notes to Financial Statements (unaudited) – continued
On April 18, 2008, Class R shares and Class R2 shares converted into Class R3 shares. After the conversion, Class R3, Class R4, and Class R5 were renamed Class R2, Class R3, and Class R4, respectively.
42
RESULTS OF SHAREHOLDER MEETING
(unaudited)
At a special meeting of shareholders of Class R1 shares of the MFS Research Fund, which was held on February 15, 2008, the following actions were taken:
Item 1: To approve an amendment to the current Master Distribution Plan adopted pursuant to Rule 12b-1 under the Investment Company Act of 1940, as amended, with respect to Class R1 Shares of the Fund.
| | |
| | | Number of Dollars |
For | | 2,803,886.90 |
| Against | | 0.00 |
| Abstain | | 58,180.41 |
43
BOARD REVIEW OF INVESTMENT ADVISORY AGREEMENT
A discussion regarding the Board’s most recent review and renewal of the Fund’s investment advisory agreement is available by clicking on the fund’s name under “Select a fund” on the MFS Web site (mfs.com).
PROXY VOTING POLICIES AND INFORMATION
A general description of the MFS funds’ proxy voting policies and procedures is available without charge, upon request, by calling 1-800-225-2606, by visiting the Proxy Voting section of mfs.com or by visiting the SEC’s Web site at http://www.sec.gov.
Information regarding how the fund voted proxies relating to portfolio securities during the most recent twelve-month period ended June 30 is available without charge by visiting the Proxy Voting section of mfs.com or by visiting the SEC’s Web site at http://www.sec.gov.
QUARTERLY PORTFOLIO DISCLOSURE
The fund will file a complete schedule of portfolio holdings with the Securities and Exchange Commission (the Commission) for the first and third quarters of each fiscal year on Form N-Q. The fund’s Form N-Q may be reviewed and copied at the:
Public Reference Room
Securities and Exchange Commission
100 F Street, NE, Room 1580
Washington, D.C. 20549
Information on the operation of the Public Reference Room may be obtained by calling the Commission at 1-800-SEC-0330. The fund’s Form N-Q is available on the EDGAR database on the Commission’s Internet Web site at http://www.sec.gov, and copies of this information may be obtained, upon payment of a duplicating fee, by electronic request at the following e-mail address: publicinfo@sec.gov or by writing the Public Reference Section at the above address.
A shareholder can also obtain the quarterly portfolio holdings report at mfs.com.
44


MFS® Total Return Fund
The report is prepared for the general information of shareholders. It is authorized for distribution to prospective investors only when preceded or accompanied by a current prospectus.
NOT FDIC INSURED Ÿ MAY LOSE VALUE Ÿ
NO BANK OR CREDIT UNION GUARANTEE Ÿ NOT A DEPOSIT Ÿ
NOT INSURED BY ANY FEDERAL GOVERNMENT AGENCY OR
NCUA/NCUSIF
3/31/08
MTR-SEM

LETTER FROM THE CEO
Dear Shareholders:
Many of our MFS® fund shareholders have been justifiably concerned, as have most investors around the world, about the state of the global economy. As we enter 2008 we see the market volatility that began in the third quarter of 2007 has intensified.
We here at MFS, and those before us who guided the firm with the same disciplined investment process, have weathered many major economic disruptions over our eight-plus decades of managing clients’ investments. We have managed money through the Great Depression, 14 recessions, as well as numerous market crises caused by wars, political upheavals, and terrorist attacks. MFS remains in business because our investors believe in the integrity of our long-term investment strategy and its proven results.
Worries over market volatility are valid, and investors cannot always expect to see the kind of returns stocks have delivered in the bull markets of past years. Yet we believe our strategy of ADR — allocating across the major asset classes, diversifying within each class, and regularly rebalancing your portfolio to maintain your desired allocation — can help you pursue the highest investment returns while minimizing the effects of market fluctuations.
MFS is a world leader in domestic and global investing. Our team approach is research driven, globally integrated, and balanced. We have 176 investment management professionals located in the Americas, Europe, and Asia who focus on the fundamentals of each security and then integrate our sophisticated quantitative approach.* This collaborative process allows us to find opportunities in any market environment.
I personally would like to thank you for your continued business. We want you to be confident that we are constantly managing our fund offerings with you in mind, while adding new products that can help you to choose what fits your unique financial goals.
Respectfully,

Robert J. Manning
Chief Executive Officer and Chief Investment Officer
MFS Investment Management®
May 15, 2008
* as of 12/31/07
The opinions expressed in this letter are subject to change, may not be relied upon for investment advice, and no forecasts can be guaranteed.
1
PORTFOLIO COMPOSITION
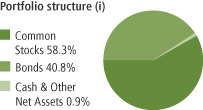
| | |
| Top ten holdings (i) | | |
| Fannie Mae, 5.5%, 30 Year | | 3.9% |
| Fannie Mae, 6.0%, 30 Year | | 2.4% |
| Exxon Mobil Corp. | | 2.1% |
| U.S. Treasury Notes, 5.125%, 2011 | | 1.8% |
| U.S. Treasury Notes, 4.75%, 2008 | | 1.7% |
| Lockheed Martin Corp. | | 1.5% |
| AT&T, Inc. | | 1.2% |
| TOTAL S.A., ADR | | 1.2% |
| Bank of America Corp. | | 1.2% |
| Allstate Corp. | | 1.2% |
| | |
| Equity sectors | | |
| Financial Services | | 13.7% |
| Energy | | 8.1% |
| Utilities & Communications | | 6.8% |
| Consumer Staples | | 5.4% |
| Industrial Goods & Services | | 5.3% |
| Health Care | | 5.0% |
| Retailing | | 3.7% |
| Technology | | 3.1% |
| Leisure | | 1.9% |
| Autos & Housing | | 1.8% |
| Basic Materials | | 1.7% |
| Special Products & Services | | 1.1% |
| Transportation | | 0.7% |
| |
| Fixed income sectors (i) | | |
| Mortgage-Backed Securities | | 16.4% |
| U.S. Treasury Securities | | 9.4% |
| High Grade Corporates | | 9.0% |
| Commercial Mortgage-Backed Securities | | 1.9% |
| U.S. Government Agencies | | 1.5% |
| Non U.S. Government Bonds | | 1.1% |
| Municipal Bonds | | 0.6% |
| Asset-Backed Securities | | 0.4% |
| Emerging Market Bonds | | 0.4% |
| High Yield Corporates | | 0.1% |
| Collateralized Debt Obligations (o) | | 0.0% |
| Residential Mortgage-Backed Securities (o) | | 0.0% |
| (i) | For purposes of this presentation, the bond component includes accrued interest amounts and may be positively or negatively impacted by the equivalent exposure from any derivative holdings, if applicable. |
Percentages are based on net assets as of 3/31/08, unless otherwise noted.
The portfolio is actively managed and current holdings may be different.
2
EXPENSE TABLE
Fund expenses borne by the shareholders during the period, October 1, 2007 through March 31, 2008
As a shareholder of the fund, you incur two types of costs: (1) transaction costs, including sales charges (loads) on certain purchase or redemption payments, and (2) ongoing costs, including management fees; distribution and service (12b-1) fees; and other fund expenses. This example is intended to help you understand your ongoing costs (in dollars) of investing in the fund and to compare these costs with the ongoing costs of investing in other mutual funds.
The example is based on an investment of $1,000 invested at the beginning of the period and held for the entire period October 1, 2007 through March 31, 2008.
Actual Expenses
The first line for each share class in the following table provides information about actual account values and actual expenses. You may use the information in this line, together with the amount you invested, to estimate the expenses that you paid over the period. Simply divide your account value by $1,000 (for example, an $8,600 account value divided by $1,000 = 8.6), then multiply the result by the number in the first line under the heading entitled “Expenses Paid During Period” to estimate the expenses you paid on your account during this period.
Hypothetical Example for Comparison Purposes
The second line for each share class in the following table provides information about hypothetical account values and hypothetical expenses based on the fund’s actual expense ratio and an assumed rate of return of 5% per year before expenses, which is not the fund’s actual return. The hypothetical account values and expenses may not be used to estimate the actual ending account balance or expenses you paid for the period. You may use this information to compare the ongoing costs of investing in the fund and other funds. To do so, compare this 5% hypothetical example with the 5% hypothetical examples that appear in the shareholder reports of the other funds.
Please note that the expenses shown in the table are meant to highlight your ongoing costs only and do not reflect any transactional costs, such as sales charges (loads). Therefore, the second line for each share class in the table is useful in comparing ongoing costs only, and will not help you determine the relative total costs of owning different funds. In addition, if these transactional costs were included, your costs would have been higher.
3
Expense Table – continued
| | | | | | | | | | |
| Class | | | | Annualized
Expense
Ratio | | Beginning
Account Value
10/01/07 | | Ending
Account Value
3/31/08 | | Expenses
Paid During
Period (p)
10/01/07-3/31/08 |
| A | | Actual | | 0.87% | | $1,000.00 | | $935.02 | | $4.21 |
| | Hypothetical (h) | | 0.87% | | $1,000.00 | | $1,020.65 | | $4.39 |
| B | | Actual | | 1.52% | | $1,000.00 | | $932.50 | | $7.34 |
| | Hypothetical (h) | | 1.52% | | $1,000.00 | | $1,017.40 | | $7.67 |
| C | | Actual | | 1.52% | | $1,000.00 | | $932.18 | | $7.34 |
| | Hypothetical (h) | | 1.52% | | $1,000.00 | | $1,017.40 | | $7.67 |
| I | | Actual | | 0.52% | | $1,000.00 | | $937.29 | | $2.52 |
| | Hypothetical (h) | | 0.52% | | $1,000.00 | | $1,022.40 | | $2.63 |
| R | | Actual | | 1.02% | | $1,000.00 | | $934.97 | | $4.93 |
| | Hypothetical (h) | | 1.02% | | $1,000.00 | | $1,019.90 | | $5.15 |
| R1 | | Actual | | 1.60% | | $1,000.00 | | $932.27 | | $7.73 |
| | Hypothetical (h) | | 1.60% | | $1,000.00 | | $1,017.00 | | $8.07 |
| R2 | | Actual | | 1.13% | | $1,000.00 | | $934.40 | | $5.46 |
| | Hypothetical (h) | | 1.13% | | $1,000.00 | | $1,019.35 | | $5.70 |
| R3 | | Actual | | 1.09% | | $1,000.00 | | $934.77 | | $5.27 |
| | Hypothetical (h) | | 1.09% | | $1,000.00 | | $1,019.55 | | $5.50 |
| R4 | | Actual | | 0.84% | | $1,000.00 | | $935.79 | | $4.07 |
| | Hypothetical (h) | | 0.84% | | $1,000.00 | | $1,020.80 | | $4.24 |
| R5 | | Actual | | 0.57% | | $1,000.00 | | $937.09 | | $2.76 |
| | Hypothetical (h) | | 0.57% | | $1,000.00 | | $1,022.15 | | $2.88 |
| 529A | | Actual | | 1.12% | | $1,000.00 | | $933.79 | | $5.41 |
| | Hypothetical (h) | | 1.12% | | $1,000.00 | | $1,019.40 | | $5.65 |
| 529B | | Actual | | 1.77% | | $1,000.00 | | $931.44 | | $8.55 |
| | Hypothetical (h) | | 1.77% | | $1,000.00 | | $1,016.15 | | $8.92 |
| 529C | | Actual | | 1.77% | | $1,000.00 | | $931.71 | | $8.55 |
| | Hypothetical (h) | | 1.77% | | $1,000.00 | | $1,016.15 | | $8.92 |
| (h) | 5% class return per year before expenses. |
| (p) | Expenses paid is equal to each class’ annualized expense ratio, as shown above, multiplied by the average account value over the period, multiplied by the number of days in the period, divided by the number of days in the year. Expenses paid do not include any applicable sales charges (loads). If these transaction costs had been included, your costs would have been higher. |
Effective January 1, 2008, the fund’s Class R2, Class R3, Class R4, and Class R5 retirement plan administration and service fee was terminated (as described in Note 3 of the Notes to the Financial Statements). Had this fee change been in effect throughout the entire six month period, the annualized expense ratios would have been 1.02%, 1.01%, 0.76% and 0.52% for Class R2, Class R3, Class R4 and
4
Expense Table – continued
Class R5 shares respectively. The actual expenses paid during the period would have been approximately $4.95, $4.90, $3.69, and $2.53 and the hypothetical expenses paid during the period would have been approximately $5.16, $5.11, $3.85 and $2.64 for Class R2, Class R3, Class R4 and Class R5 shares, respectively.
Effective March 1, 2008 the fund’s Class R1 retirement plan administration and service fee was terminated and the Class R1 distribution fee was increased (as described in Note 3 of the Notes to the Financial Statements). Had these fee changes been in effect throughout the entire six month period, the annualized expense ratio would have been 1.52%. The actual expenses paid during the period would have been approximately $7.37 and the hypothetical expenses paid during the period would have been approximately $7.69.
Effective April 1, 2008 the fund’s Class 529A, 529B, and 529C shares program manager fee was reduced (as described in Note 3 of the Notes to Financial Statements). Had this fee change been in effect throughout the entire six month period, the annualized expense ratio would have been 0.97%, 1.62% and 1.62% for Class 529A, 529B and 529C shares, respectively. The actual expenses paid during the period would have been approximately $4.71,$7.85 and $7.85 and the hypothetical expenses paid during the period would have been approximately $4.91, $8.19 and $8.19 for Class 529A, Class 529B and Class 529C shares, respectively.
Note to Shareholders: On April 18, 2008, Class R shares and Class R2 shares converted into Class R3 shares. After the conversion, Class R3, Class R4, and Class R5 were renamed Class R2, Class R3, and Class R4, respectively.
5
PORTFOLIO OF INVESTMENTS
3/31/08 (unaudited)
The Portfolio of Investments is a complete list of all securities owned by your fund. It is categorized by broad-based asset classes.
| | | | | |
| Common Stocks - 58.3% | | | | | |
| Issuer | | Shares/Par | | Value ($) |
| | | | | |
| Aerospace - 2.7% | | | | | |
| Lockheed Martin Corp. | | 1,467,190 | | $ | 145,691,958 |
| Northrop Grumman Corp. | | 387,210 | | | 30,128,810 |
| Raytheon Co. | | 86,110 | | | 5,563,567 |
| United Technologies Corp. | | 1,123,380 | | | 77,311,012 |
| | | | | |
| | | | | $ | 258,695,347 |
| Alcoholic Beverages - 0.6% | | | | | |
| Diageo PLC | | 2,205,332 | | $ | 44,430,321 |
| Heineken N.V. | | 240,700 | | | 13,976,846 |
| | | | | |
| | | | | $ | 58,407,167 |
| Apparel Manufacturers - 0.7% | | | | | |
| NIKE, Inc., “B” | | 915,460 | | $ | 62,251,280 |
| | |
| Automotive - 0.6% | | | | | |
| Harley-Davidson, Inc. | | 390,830 | | $ | 14,656,125 |
| Johnson Controls, Inc. | | 1,285,470 | | | 43,448,886 |
| | | | | |
| | | | | $ | 58,105,011 |
| Biotechnology - 0.4% | | | | | |
| Amgen, Inc. (a) | | 461,127 | | $ | 19,265,886 |
| Genzyme Corp. (a) | | 307,050 | | | 22,887,507 |
| | | | | |
| | | | | $ | 42,153,393 |
| Broadcasting - 0.9% | | | | | |
| E.W. Scripps Co., “A” | | 127,710 | | $ | 5,365,097 |
| Omnicom Group, Inc. | | 801,970 | | | 35,431,035 |
| Walt Disney Co. | | 1,093,170 | | | 34,303,675 |
| WPP Group PLC | | 669,820 | | | 7,982,600 |
| | | | | |
| | | | | $ | 83,082,407 |
| Brokerage & Asset Managers - 2.0% | | | | | |
| E*TRADE Financial Corp. (a)(l) | | 2,243,890 | | $ | 8,661,415 |
| Franklin Resources, Inc. | | 483,800 | | | 46,923,762 |
| Goldman Sachs Group, Inc. | | 340,560 | | | 56,325,218 |
| KKR Private Equity Investors LP, IEU (z) | | 474,330 | | | 5,857,976 |
| Legg Mason, Inc. | | 215,080 | | | 12,040,178 |
| Lehman Brothers Holdings, Inc. | | 723,070 | | | 27,216,355 |
| Merrill Lynch & Co., Inc. | | 829,360 | | | 33,788,126 |
| | | | | |
| | | | | $ | 190,813,030 |
6
Portfolio of Investments (unaudited) – continued
| | | | | |
| Issuer | | Shares/Par | | Value ($) |
| | | | | |
| Common Stocks - continued | | | | | |
| Business Services - 1.1% | | | | | |
| Accenture Ltd., “A” | | 799,090 | | $ | 28,103,995 |
| Automatic Data Processing, Inc. | | 488,050 | | | 20,688,440 |
| Fidelity National Information Services, Inc. | | 436,390 | | | 16,643,915 |
| Visa, Inc. (a) | | 614,800 | | | 38,338,928 |
| | | | | |
| | | | | $ | 103,775,278 |
| Cable TV - 0.3% | | | | | |
| Time Warner Cable, Inc. (a) | | 1,015,500 | | $ | 25,367,190 |
| | |
| Chemicals - 0.7% | | | | | |
| 3M Co. | | 109,620 | | $ | 8,676,423 |
| PPG Industries, Inc. | | 949,000 | | | 57,423,990 |
| | | | | |
| | | | | $ | 66,100,413 |
| Computer Software - 0.7% | | | | | |
| Oracle Corp. (a) | | 3,389,350 | | $ | 66,295,686 |
| Synopsys, Inc. (a) | | 39,080 | | | 887,507 |
| | | | | |
| | | | | $ | 67,183,193 |
| Computer Software - Systems - 1.4% | | | | | |
| Hewlett-Packard Co. | | 777,750 | | $ | 35,512,065 |
| International Business Machines Corp. | | 815,150 | | | 93,856,371 |
| | | | | |
| | | | | $ | 129,368,436 |
| Construction - 0.9% | | | | | |
| D.R. Horton, Inc. | | 844,920 | | $ | 13,307,490 |
| Masco Corp. | | 1,246,730 | | | 24,722,656 |
| Pulte Homes, Inc. | | 764,810 | | | 11,127,986 |
| Sherwin-Williams Co. | | 217,990 | | | 11,126,210 |
| Toll Brothers, Inc. (a) | | 1,110,350 | | | 26,071,018 |
| | | | | |
| | | | | $ | 86,355,360 |
| Consumer Goods & Services - 1.0% | | | | | |
| Clorox Co. | | 467,240 | | $ | 26,464,474 |
| Procter & Gamble Co. | | 974,661 | | | 68,294,496 |
| | | | | |
| | | | | $ | 94,758,970 |
| Containers - 0.0% | | | | | |
| Smurfit-Stone Container Corp. (a) | | 316,170 | | $ | 2,434,509 |
| | |
| Electrical Equipment - 1.5% | | | | | |
| General Electric Co. | | 2,044,850 | | $ | 75,679,899 |
| Rockwell Automation, Inc. | | 203,860 | | | 11,705,641 |
7
Portfolio of Investments (unaudited) – continued
| | | | | |
| Issuer | | Shares/Par | | Value ($) |
| | | | | |
| | | | | |
| Common Stocks - continued | | | | | |
| Electrical Equipment - continued | | | | | |
| W.W. Grainger, Inc. | | 470,870 | | $ | 35,969,759 |
| WESCO International, Inc. (a) | | 484,742 | | | 17,688,236 |
| | | | | |
| | | | | $ | 141,043,535 |
| Electronics - 0.9% | | | | | |
| Flextronics International Ltd. (a) | | 1,436,610 | | $ | 13,489,768 |
| Intel Corp. | | 2,871,300 | | | 60,814,134 |
| Samsung Electronics Co. Ltd., GDR | | 36,305 | | | 11,336,236 |
| | | | | |
| | | | | $ | 85,640,138 |
| Energy-Independent - 2.3% | | | | | |
| Anadarko Petroleum Corp. | | 267,680 | | $ | 16,871,870 |
| Apache Corp. | | 783,580 | | | 94,672,136 |
| Devon Energy Corp. | | 703,635 | | | 73,410,240 |
| EOG Resources, Inc. | | 156,170 | | | 18,740,400 |
| Sunoco, Inc. | | 287,950 | | | 15,108,737 |
| | | | | |
| | | | | $ | 218,803,383 |
| Energy - Integrated - 5.4% | | | | | |
| Chevron Corp. | | 197,285 | | $ | 16,840,248 |
| ConocoPhillips | | 320,900 | | | 24,455,789 |
| Exxon Mobil Corp. | | 2,309,798 | | | 195,362,715 |
| Hess Corp. | | 1,079,960 | | | 95,230,873 |
| Marathon Oil Corp. | | 1,163,360 | | | 53,049,216 |
| Royal Dutch Shell PLC, ADR | | 139,000 | | | 9,588,220 |
| TOTAL S.A., ADR | | 1,555,760 | | | 115,141,798 |
| | | | | |
| | | | | $ | 509,668,859 |
| Engineering - Construction - 0.0% | | | | | |
| North American Energy Partners, Inc. (a) | | 220,880 | | $ | 3,388,299 |
| | |
| Food & Beverages - 2.5% | | | | | |
| General Mills, Inc. | | 1,337,310 | | $ | 80,078,123 |
| Hain Celestial Group, Inc. (a) | | 31,490 | | | 928,955 |
| Kellogg Co. | | 728,220 | | | 38,275,243 |
| Nestle S.A. | | 159,653 | | | 79,750,165 |
| PepsiCo, Inc. | | 555,530 | | | 40,109,266 |
| | | | | |
| | | | | $ | 239,141,752 |
| Food & Drug Stores - 1.4% | | | | | |
| CVS Caremark Corp. | | 1,560,389 | | $ | 63,211,358 |
| Kroger Co. | | 603,850 | | | 15,337,790 |
| Safeway, Inc. | | 972,260 | | | 28,535,831 |
8
Portfolio of Investments (unaudited) – continued
| | | | | |
| Issuer | | Shares/Par | | Value ($) |
| | | | | |
| Common Stocks - continued | | | | | |
| Food & Drug Stores - continued | | | | | |
| Walgreen Co. | | 674,950 | | $ | 25,708,846 |
| | | | | |
| | | | | $ | 132,793,825 |
| Forest & Paper Products - 0.2% | | | | | |
| MeadWestvaco Corp. | | 621,350 | | $ | 16,913,147 |
| | |
| Furniture & Appliances - 0.3% | | | | | |
| Jarden Corp. (a) | | 830,045 | | $ | 18,045,178 |
| Whirlpool Corp. | | 145,540 | | | 12,629,961 |
| | | | | |
| | | | | $ | 30,675,139 |
| Gaming & Lodging - 0.7% | | | | | |
| Royal Caribbean Cruises Ltd. | | 1,663,420 | | $ | 54,726,518 |
| Wyndham Worldwide | | 550,610 | | | 11,386,615 |
| | | | | |
| | | | | $ | 66,113,133 |
| General Merchandise - 1.1% | | | | | |
| Macy’s, Inc. | | 3,547,820 | | $ | 81,812,729 |
| Stage Stores, Inc. | | 50,400 | | | 816,480 |
| Wal-Mart Stores, Inc. | | 413,820 | | | 21,800,038 |
| | | | | |
| | | | | $ | 104,429,247 |
| Health Maintenance Organizations - 0.7% | | | | | |
| UnitedHealth Group, Inc. | | 717,760 | | $ | 24,662,234 |
| WellPoint, Inc. (a) | | 865,970 | | | 38,215,256 |
| | | | | |
| | | | | $ | 62,877,490 |
| Insurance - 5.0% | | | | | |
| Allstate Corp. | | 2,262,330 | | $ | 108,727,580 |
| American International Group, Inc. | | 315,060 | | | 13,626,345 |
| Aon Corp. | | 139,600 | | | 5,611,920 |
| Aspen Insurance Holdings Ltd. | | 23,700 | | | 625,206 |
| Chubb Corp. | | 234,330 | | | 11,594,648 |
| Conseco, Inc. (a) | | 1,715,303 | | | 17,496,091 |
| Genworth Financial, Inc., “A” | | 3,769,003 | | | 85,330,228 |
| Hartford Financial Services Group, Inc. | | 572,845 | | | 43,404,466 |
| Max Capital Group Ltd. | | 698,130 | | | 18,284,025 |
| MBIA, Inc. | | 784,230 | | | 9,583,291 |
| MetLife, Inc. | | 1,740,800 | | | 104,900,608 |
| PartnerRe Ltd. | | 7,840 | | | 598,192 |
| Principal Financial Group, Inc. | | 165,630 | | | 9,228,904 |
| Prudential Financial, Inc. | | 167,110 | | | 13,076,358 |
| Travelers Cos., Inc. | | 597,807 | | | 28,605,065 |
| | | | | |
| | | | | $ | 470,692,927 |
9
Portfolio of Investments (unaudited) – continued
| | | | | |
| Issuer | | Shares/Par | | Value ($) |
| | | | | |
| Common Stocks - continued | | | | | |
| Machinery & Tools - 1.1% | | | | | |
| Eaton Corp. | | 72,340 | | $ | 5,763,328 |
| Ingersoll-Rand Co. Ltd., “A” | | 995,740 | | | 44,390,089 |
| Kennametal, Inc. | | 539,590 | | | 15,880,134 |
| Timken Co. | | 1,107,561 | | | 32,916,713 |
| | | | | |
| | | | | $ | 98,950,264 |
| Major Banks - 4.8% | | | | | |
| Bank of America Corp. | | 3,031,054 | | $ | 114,907,257 |
| Bank of New York Mellon Corp. | | 2,111,548 | | | 88,114,898 |
| JPMorgan Chase & Co. | | 2,183,671 | | | 93,788,669 |
| PNC Financial Services Group, Inc. | | 973,620 | | | 63,840,263 |
| State Street Corp. | | 602,250 | | | 47,577,750 |
| SunTrust Banks, Inc. | | 621,400 | | | 34,263,996 |
| UnionBanCal Corp. | | 192,020 | | | 9,424,342 |
| | | | | |
| | | | | $ | 451,917,175 |
| Medical & Health Technology & Services - 0.1% | | | | | |
| DaVita, Inc. (a) | | 221,860 | | $ | 10,596,034 |
| Medassets, Inc. (a) | | 37,380 | | | 553,972 |
| | | | | |
| | | | | $ | 11,150,006 |
| Medical Equipment - 0.5% | | | | | |
| Advanced Medical Optics, Inc. (a) | | 800,610 | | $ | 16,252,383 |
| Boston Scientific Corp. (a) | | 1,589,560 | | | 20,457,637 |
| Cooper Cos., Inc. | | 196,610 | | | 6,769,282 |
| | | | | |
| | | | | $ | 43,479,302 |
| Metals & Mining - 0.3% | | | | | |
| Allegheny Technologies, Inc. | | 167,270 | | $ | 11,936,387 |
| Cameco Corp. | | 163,460 | | | 5,384,372 |
| Century Aluminum Co. (a) | | 229,684 | | | 15,214,268 |
| | | | | |
| | | | | $ | 32,535,027 |
| Natural Gas - Distribution - 0.5% | | | | | |
| Sempra Energy | | 910,097 | | $ | 48,489,968 |
| | |
| Natural Gas - Pipeline - 0.6% | | | | | |
| El Paso Corp. | | 1,193,300 | | $ | 19,856,512 |
| Williams Cos., Inc. | | 1,087,950 | | | 35,880,591 |
| | | | | |
| | | | | $ | 55,737,103 |
| Network & Telecom - 0.1% | | | | | |
| Cisco Systems, Inc. (a) | | 84,220 | | $ | 2,028,860 |
10
Portfolio of Investments (unaudited) – continued
| | | | | |
| Issuer | | Shares/Par | | Value ($) |
| | | | | |
| Common Stocks - continued | | | | | |
| Network & Telecom - continued | | | | | |
| Nortel Networks Corp. (a) | | 443,447 | | $ | 2,966,660 |
| | | | | |
| | | | | $ | 4,995,520 |
| Oil Services - 0.4% | | | | | |
| Halliburton Co. | | 283,480 | | $ | 11,149,268 |
| Noble Corp. | | 495,120 | | | 24,592,610 |
| | | | | |
| | | | | $ | 35,741,878 |
| Other Banks & Diversified Financials - 1.9% | | | | | |
| American Capital Strategies Ltd. (l) | | 152,550 | | $ | 5,211,108 |
| American Express Co. | | 794,430 | | | 34,732,480 |
| Citigroup, Inc. | | 2,248,253 | | | 48,157,579 |
| New York Community Bancorp, Inc. | | 2,869,817 | | | 52,288,066 |
| UBS AG | | 573,560 | | | 16,518,528 |
| UBS AG | | 809,676 | | | 23,521,314 |
| | | | | |
| | | | | $ | 180,429,075 |
| Pharmaceuticals - 3.3% | | | | | |
| Abbott Laboratories | | 157,380 | | $ | 8,679,507 |
| GlaxoSmithKline PLC | | 431,050 | | | 9,111,641 |
| Johnson & Johnson | | 1,355,360 | | | 87,922,203 |
| Merck & Co., Inc. | | 1,899,080 | | | 72,070,086 |
| Merck KGaA (l) | | 131,550 | | | 16,209,826 |
| Pfizer, Inc. | | 554,170 | | | 11,598,778 |
| Wyeth | | 2,442,008 | | | 101,978,254 |
| | | | | |
| | | | | $ | 307,570,295 |
| Railroad & Shipping - 0.5% | | | | | |
| Burlington Northern Santa Fe Corp. | | 361,890 | | $ | 33,373,496 |
| Norfolk Southern Corp. | | 307,370 | | | 16,696,338 |
| | | | | |
| | | | | $ | 50,069,834 |
| Real Estate - 0.0% | | | | | |
| Apartment Investment & Management, REIT | | 21,500 | | $ | 769,915 |
| DiamondRock Hospitality Co., REIT | | 32,000 | | | 405,440 |
| Health Care Reit, Inc. | | 17,990 | | | 811,889 |
| Mack-Cali Realty Corp., REIT | | 43,370 | | | 1,548,743 |
| | | | | |
| | | | | $ | 3,535,987 |
| Restaurants - 0.0% | | | | | |
| Panera Bread Co., “A” (a)(l) | | 10,020 | | $ | 419,738 |
11
Portfolio of Investments (unaudited) – continued
| | | | | |
| Issuer | | Shares/Par | | Value ($) |
| | | | | |
| Common Stocks - continued | | | | | |
| Specialty Chemicals - 0.5% | | | | | |
| Air Products & Chemicals, Inc. | | 373,640 | | $ | 34,374,880 |
| Praxair, Inc. | | 92,900 | | | 7,824,967 |
| | | | | |
| | | | | $ | 42,199,847 |
| Specialty Stores - 0.5% | | | | | |
| Advance Auto Parts, Inc. | | 115,430 | | $ | 3,930,392 |
| PetSmart, Inc. | | 362,780 | | | 7,415,223 |
| Staples, Inc. | | 1,466,300 | | | 32,419,893 |
| | | | | |
| | | | | $ | 43,765,508 |
| Telecommunications - Wireless - 0.2% | | | | | |
| Vodafone Group PLC | | 5,986,983 | | $ | 17,914,679 |
| | |
| Telephone Services - 2.5% | | | | | |
| AT&T, Inc. | | 3,079,598 | | $ | 117,948,603 |
| Embarq Corp. | | 1,440,547 | | | 57,765,935 |
| Qwest Communications International, Inc. | | 8,030,260 | | | 36,377,078 |
| TELUS Corp. | | 179,200 | | | 7,536,734 |
| Verizon Communications, Inc. | | 518,012 | | | 18,881,537 |
| | | | | |
| | | | | $ | 238,509,887 |
| Tobacco - 1.3% | | | | | |
| Altria Group, Inc. | | 1,597,550 | | $ | 35,465,610 |
| Philip Morris International, Inc. (a) | | 1,808,150 | | | 91,456,227 |
| | | | | |
| | | | | $ | 126,921,837 |
| Trucking - 0.2% | | | | | |
| United Parcel Service, Inc., “B” | | 298,920 | | $ | 21,827,138 |
| | |
| Utilities - Electric Power - 3.0% | | | | | |
| American Electric Power Co., Inc. | | 730,190 | | $ | 30,397,810 |
| CMS Energy Corp. | | 379,750 | | | 5,141,815 |
| Dominion Resources, Inc. | | 544,048 | | | 22,218,920 |
| DPL, Inc. | | 947,550 | | | 24,295,182 |
| Entergy Corp. | | 140,280 | | | 15,301,742 |
| FPL Group, Inc. | | 866,600 | | | 54,370,484 |
| NRG Energy, Inc. (a) | | 718,490 | | | 28,013,925 |
| Pepco Holdings, Inc. | | 526,620 | | | 13,018,046 |
| PG&E Corp. | | 1,271,640 | | | 46,821,785 |
| PPL Corp. | | 130,670 | | | 6,000,366 |
| Public Service Enterprise Group, Inc. | | 868,060 | | | 34,887,331 |
| | | | | |
| | | | | $ | 280,467,406 |
| Total Common Stocks (Identified Cost, $5,180,679,820) | | | | $ | 5,507,659,332 |
12
Portfolio of Investments (unaudited) – continued
| | | | | | |
| Bonds – 40.4% | | | | | | |
| Issuer | | Shares/Par | | Value ($) |
| | | | | | |
| Agency - Other – 0.0% | | | | | | |
| Financing Corp., 9.65%, 2018 | | $ | 2,850,000 | | $ | 4,168,535 |
| | |
| Asset Backed & Securitized – 2.4% | | | | | | |
| Banc of America Commercial Mortgage, Inc., FRN, 5.482%, 2049 | | $ | 3,216,373 | | $ | 2,887,791 |
Bayview Financial Revolving Mortgage Loan Trust, FRN,
3.477%, 2040 (z) | | | 10,340,000 | | | 7,444,800 |
| BlackRock Capital Finance LP, 7.75%, 2024 (n) | | | 1,112,833 | | | 667,700 |
| Capital Trust Realty CDO Ltd., 5.16%, 2035 (z) | | | 2,400,000 | | | 2,259,375 |
| Chase Commercial Mortgage Securities Corp., 7.543%, 2032 | | | 484,910 | | | 488,716 |
| Countrywide Asset-Backed Certificates, FRN, 4.823%, 2031 | | | 1,799,231 | | | 1,801,125 |
| Countrywide Asset-Backed Certificates, FRN, 5.689%, 2034 | | | 6,450,000 | | | 5,843,018 |
| Countrywide Asset-Backed Certificates, FRN, 4.575%, 2035 | | | 92,038 | | | 91,603 |
| Credit Suisse Commercial Mortgage Trust, 5.509%, 2039 | | | 8,321,579 | | | 7,553,334 |
| Credit Suisse Mortgage Capital Certificate, 5.343%, 2039 | | | 5,822,867 | | | 5,208,343 |
| Falcon Franchise Loan LLC, 7.382%, 2022 (n) | | | 77,087 | | | 76,750 |
| GE Commercial Mortgage Corp., FRN, 5.338%, 2044 | | | 7,580,000 | | | 6,937,812 |
| GMAC Mortgage Corp. Loan Trust, FRN, 5.805%, 2036 | | | 7,534,000 | | | 5,769,598 |
| Greenwich Capital Commercial Funding Corp., 4.305%, 2042 | | | 5,165,031 | | | 5,095,340 |
| Greenwich Capital Commercial Funding Corp., FRN, 5.317%, 2036 | | | 3,468,895 | | | 3,459,106 |
JPMorgan Chase Commercial Mortgage Securities Corp.,
4.78%, 2042 | | | 9,444,000 | | | 8,834,306 |
JPMorgan Chase Commercial Mortgage Securities Corp.,
5.372%, 2047 | | | 11,670,000 | | | 10,479,362 |
| JPMorgan Chase Commercial Mortgage Securities Corp., FRN, 4.948%, 2037 | | | 9,800,000 | | | 9,243,969 |
| JPMorgan Chase Commercial Mortgage Securities Corp., FRN, 5.21%, 2041 | | | 2,279,327 | | | 2,295,402 |
| JPMorgan Chase Commercial Mortgage Securities Corp., FRN, 5.475%, 2043 | | | 6,980,000 | | | 6,902,287 |
| JPMorgan Chase Commercial Mortgage Securities Corp., FRN, 5.875%, 2045 | | | 7,270,000 | | | 7,388,442 |
| JPMorgan Chase Commercial Mortgage Securities Corp., FRN, 5.038%, 2046 | | | 11,782,189 | | | 11,648,097 |
| Merrill Lynch Mortgage Trust, FRN, 5.829%, 2050 | | | 5,520,000 | | | 3,682,797 |
| Merrill Lynch/Countrywide Commercial Mortgage Trust, FRN, 5.476%, 2039 | | | 6,500,000 | | | 6,008,233 |
| Morgan Stanley Capital I, Inc., 5.168%, 2042 | | | 4,603,980 | | | 4,611,626 |
| Morgan Stanley Capital I, Inc., FRN, 0.364%, 2030 (i)(n) | | | 207,635,841 | | | 1,673,711 |
| Multi-Family Capital Access One, Inc., 6.65%, 2024 | | | 1,391,971 | | | 1,396,113 |
| Residential Asset Mortgage Products, Inc., 4.109%, 2035 | | | 1,492,631 | | | 1,490,111 |
| Residential Asset Mortgage Products, Inc., FRN, 4.971%, 2034 | | | 5,243,000 | | | 5,224,281 |
| Residential Funding Mortgage Securities, Inc., FRN, 5.32%, 2024 | | | 8,242,000 | | | 4,962,646 |
13
Portfolio of Investments (unaudited) – continued
| | | | | | |
| Issuer | | Shares/Par | | Value ($) |
| | | | | | |
| Bonds - continued | | | | | | |
| Asset Backed & Securitized - continued | | | | | | |
| Spirit Master Funding LLC, 5.05%, 2023 (z) | | $ | 9,411,030 | | $ | 8,834,040 |
| Structured Asset Securities Corp., FRN, 4.67%, 2035 | | | 10,836,053 | | | 10,436,500 |
| Wachovia Bank Commercial Mortgage Trust, 4.75%, 2044 | | | 7,432,000 | | | 6,939,328 |
| Wachovia Bank Commercial Mortgage Trust, FRN, 4.847%, 2041 | | | 11,645,000 | | | 11,408,509 |
| Wachovia Bank Commercial Mortgage Trust, FRN, 5.083%, 2042 | | | 11,945,166 | | | 11,834,572 |
| Wachovia Bank Commercial Mortgage Trust, FRN, 5.118%, 2042 | | | 12,150,000 | | | 12,006,221 |
| Wachovia Bank Commercial Mortgage Trust, FRN, 5.513%, 2043 | | | 3,642,000 | | | 2,381,595 |
| Wachovia Bank Commercial Mortgage Trust, FRN, 5.958%, 2045 | | | 9,160,000 | | | 8,681,330 |
| Wachovia Bank Commercial Mortgage Trust, FRN, 5.795%, 2045 | | | 9,830,000 | | | 9,123,235 |
| | | | | | |
| | | | | | $ | 223,071,124 |
| Automotive - 0.1% | | | | | | |
| Johnson Controls, Inc., 5.5%, 2016 | | $ | 9,612,000 | | $ | 9,795,781 |
| | |
| Broadcasting - 0.2% | | | | | | |
| CBS Corp., 6.625%, 2011 | | $ | 8,518,000 | | $ | 8,688,692 |
| Hearst-Argyle Television, Inc., 7.5%, 2027 | | | 3,800,000 | | | 3,878,143 |
| News America, Inc., 8.5%, 2025 | | | 5,903,000 | | | 6,845,538 |
| | | | | | |
| | | | | | $ | 19,412,373 |
| Brokerage & Asset Managers - 0.5% | | | | | | |
| Goldman Sachs Group, Inc., 5.625%, 2017 | | $ | 11,272,000 | | $ | 10,813,511 |
| Lehman Brothers Holdings, Inc., 6.5%, 2017 | | | 11,310,000 | | | 10,740,496 |
| Merrill Lynch & Co., Inc., 6.11%, 2037 | | | 7,900,000 | | | 6,244,207 |
| Morgan Stanley, 5.75%, 2016 | | | 6,120,000 | | | 5,918,040 |
| Morgan Stanley Group, Inc., 6.75%, 2011 | | | 8,407,000 | | | 8,812,310 |
| | | | | | |
| | | | | | $ | 42,528,564 |
| Building - 0.1% | | | | | | |
| CRH America, Inc., 6.95%, 2012 | | $ | 8,021,000 | | $ | 8,405,519 |
| | |
| Business Services - 0.1% | | | | | | |
| Xerox Corp., 5.5%, 2012 | | $ | 5,100,000 | | $ | 5,142,952 |
| | |
| Cable TV - 0.2% | | | | | | |
| Cox Communications, Inc., 4.625%, 2013 | | $ | 9,350,000 | | $ | 8,980,572 |
| Time Warner Entertainment Co. LP, 8.375%, 2033 | | | 7,170,000 | | | 8,067,562 |
| | | | | | |
| | | | | | $ | 17,048,134 |
| Chemicals - 0.1% | | | | | | |
| PPG Industries, Inc., 5.75%, 2013 | | $ | 9,538,000 | | $ | 9,839,639 |
14
Portfolio of Investments (unaudited) – continued
| | | | | | |
| Issuer | | Shares/Par | | Value ($) |
| | | | | | |
| Bonds - continued | | | | | | |
| Conglomerates - 0.2% | | | | | | |
| General Electric Co., 5.25%, 2017 | | $ | 5,160,000 | | $ | 5,152,879 |
| Kennametal, Inc., 7.2%, 2012 | | | 8,542,000 | | | 9,356,762 |
| | | | | | |
| | | | | | $ | 14,509,641 |
| Consumer Goods & Services - 0.2% | | | | | | |
| Fortune Brands, Inc., 5.125%, 2011 | | $ | 9,914,000 | | $ | 9,925,471 |
| Western Union Co., 5.4%, 2011 | | | 13,050,000 | | | 13,367,741 |
| | | | | | |
| | | | | | $ | 23,293,212 |
| Defense Electronics - 0.1% | | | | | | |
| BAE Systems Holdings, Inc., 5.2%, 2015 (n) | | $ | 8,973,000 | | $ | 9,093,633 |
| | |
| Electronics - 0.1% | | | | | | |
| Tyco Electronics Ltd., 6.55%, 2017 (n) | | $ | 7,980,000 | | $ | 8,364,748 |
| | |
| Emerging Market Quasi-Sovereign - 0.1% | | | | | | |
| Ras Laffan Liquefied Natural Gas Co. Ltd., 5.832%, 2016 (n) | | $ | 6,340,000 | | $ | 6,296,444 |
| | |
| Emerging Market Sovereign - 0.1% | | | | | | |
| State of Israel, 4.625%, 2013 | | $ | 6,850,000 | | $ | 7,026,826 |
| | |
| Energy - Independent - 0.1% | | | | | | |
| Nexen, Inc., 5.875%, 2035 | | $ | 2,117,000 | | $ | 1,926,512 |
| Ocean Energy, Inc., 7.25%, 2011 | | | 8,780,000 | | | 9,689,468 |
| | | | | | |
| | | | | | $ | 11,615,980 |
| Financial Institutions - 0.5% | | | | | | |
| American Express Co., 5.5%, 2016 | | $ | 11,996,000 | | $ | 11,585,365 |
| Capital One Financial Corp., 6.15%, 2016 | | | 8,680,000 | | | 7,289,082 |
| Capmark Financial Group, Inc., 5.875%, 2012 (n) | | | 3,610,000 | | | 2,287,209 |
| CIT Group, Inc., 6.1% to 2017, FRN to 2067 | | | 1,130,000 | | | 503,426 |
| General Electric Capital Corp., 5.45%, 2013 | | | 2,383,000 | | | 2,495,926 |
| General Electric Capital Corp., 5.375%, 2016 | | | 3,979,000 | | | 4,040,448 |
| HSBC Finance Corp., 5.25%, 2011 | | | 8,925,000 | | | 8,894,209 |
| ORIX Corp., 5.48%, 2011 | | | 13,060,000 | | | 12,646,664 |
| | | | | | |
| | | | | | $ | 49,742,329 |
| Food & Beverages - 0.3% | | | | | | |
| Diageo Finance B.V., 5.5%, 2013 | | $ | 14,470,000 | | $ | 15,176,585 |
| Miller Brewing Co., 5.5%, 2013 (n) | | | 16,686,000 | | | 17,734,198 |
| | | | | | |
| | | | | | $ | 32,910,783 |
15
Portfolio of Investments (unaudited) – continued
| | | | | | |
| Issuer | | Shares/Par | | Value ($) |
| | | | | | |
| Bonds - continued | | | | | | |
| Food & Drug Stores - 0.1% | | | | | | |
| CVS Caremark Corp., 6.125%, 2016 | | $ | 6,630,000 | | $ | 6,913,399 |
| | |
| Gaming & Lodging - 0.2% | | | | | | |
| Marriott International, Inc., 6.375%, 2017 | | $ | 10,090,000 | | $ | 10,016,202 |
| Wyndham Worldwide Corp., 6%, 2016 | | | 6,562,000 | | | 5,993,127 |
| | | | | | |
| | | | | | $ | 16,009,329 |
| Insurance - 0.2% | | | | | | |
| American International Group, Inc., 6.25%, 2087 | | $ | 9,130,000 | | $ | 7,396,259 |
| ING Groep N.V., 5.775% to 2015, FRN to 2049 | | | 8,503,000 | | | 7,244,326 |
| MetLife, Inc., 6.4%, 2066 | | | 7,680,000 | | | 6,102,835 |
| | | | | | |
| | | | | | $ | 20,743,420 |
| Insurance - Property & Casualty - 0.4% | | | | | | |
| Allstate Corp., 5.55%, 2035 | | $ | 8,842,000 | | $ | 7,449,765 |
| Chubb Corp., 6.375% to 2017, FRN to 2037 | | | 12,830,000 | | | 11,950,901 |
| Fund American Cos., Inc., 5.875%, 2013 | | | 6,030,000 | | | 6,285,684 |
| ZFS Finance USA Trust IV, FRN, 5.875%, 2062 (n) | | | 2,640,000 | | | 2,496,938 |
| ZFS Finance USA Trust V, 6.5% to 2017, FRN to 2037 (n) | | | 11,610,000 | | | 10,477,282 |
| | | | | | |
| | | | | | $ | 38,660,570 |
| International Market Quasi-Sovereign - 0.2% | | | | | | |
| Hydro-Quebec, 6.3%, 2011 | | $ | 16,520,000 | | $ | 18,059,730 |
| | |
| International Market Sovereign - 0.1% | | | | | | |
| Province of Ontario, 5%, 2011 | | $ | 13,130,000 | | $ | 14,048,811 |
| | |
| Machinery & Tools - 0.1% | | | | | | |
| Atlas Copco AB, 5.6%, 2017 (n) | | $ | 9,680,000 | | $ | 9,658,704 |
| | |
| Major Banks - 0.6% | | | | | | |
| Bank of America Corp., 5.49%, 2019 | | $ | 4,135,000 | | $ | 4,007,183 |
| BNP Paribas, 7.195% to 2037, FRN to 2049 (n) | | | 3,200,000 | | | 2,834,141 |
| DBS Capital Funding Corp., 7.657% to 2011, FRN to 2049 (n) | | | 7,327,000 | | | 7,364,544 |
| MUFG Capital Finance 1 Ltd., 6.346% to 2016, FRN to 2049 | | | 9,180,000 | | | 7,480,773 |
| Natexis AMBS Co. LLC, 8.44% to 2008, FRN to 2049 (n) | | | 2,712,000 | | | 2,747,280 |
| PNC Funding Corp., 5.625%, 2017 | | | 6,510,000 | | | 6,202,565 |
| Royal Bank of Scotland Group PLC, 6.99% to 2017, FRN to 2049 (n) | | | 2,060,000 | | | 1,748,734 |
| UniCredito Italiano Capital Trust II, 9.2% to 2010, FRN to 2049 (n) | | | 11,444,000 | | | 11,275,773 |
| Unicredito Luxembourg Finance S.A., 6%, 2017 (n) | | | 8,740,000 | | | 8,658,115 |
| Wachovia Corp., 5.25%, 2014 | | | 4,613,000 | | | 4,556,417 |
| | | | | | |
| | | | | | $ | 56,875,525 |
16
Portfolio of Investments (unaudited) – continued
| | | | | | |
| Issuer | | Shares/Par | | Value ($) |
| | | | | | |
| Bonds - continued | | | | | | |
| Medical & Health Technology & Services - 0.3% | | | | | | |
| Baxter International, Inc., 5.9%, 2016 | | $ | 7,640,000 | | $ | 8,064,104 |
| Cardinal Health, Inc., 6.3%, 2016 | | | 4,803,000 | | | 4,825,320 |
| Covidien Ltd., 6%, 2017 (n) | | | 3,660,000 | | | 3,772,373 |
| HCA, Inc., 8.75%, 2010 | | | 742,000 | | | 742,000 |
| Hospira, Inc., 5.55%, 2012 | | | 3,080,000 | | | 3,183,602 |
| Hospira, Inc., 6.05%, 2017 | | | 10,978,000 | | | 10,880,592 |
| | | | | | |
| | | | | | $ | 31,467,991 |
| Metals & Mining - 0.1% | | | | | | |
| Vale Overseas Ltd., 6.25%, 2017 | | $ | 9,400,000 | | $ | 9,361,253 |
| | |
| Mortgage Backed - 16.3% | | | | | | |
| Fannie Mae, 6.33%, 2011 | | $ | 1,511,456 | | $ | 1,635,836 |
| Fannie Mae, 3.876%, 2013 | | | 1,017,420 | | | 996,384 |
| Fannie Mae, 3.886%, 2013 | | | 3,226,645 | | | 3,180,793 |
| Fannie Mae, 4.667%, 2013 | | | 685,408 | | | 697,467 |
| Fannie Mae, 4.518%, 2014 | | | 6,880,953 | | | 6,913,214 |
| Fannie Mae, 4.56%, 2014 | | | 373,441 | | | 374,907 |
| Fannie Mae, 4.63%, 2014 | | | 2,531,263 | | | 2,548,614 |
| Fannie Mae, 4.76%, 2014 | | | 202,263 | | | 205,471 |
| Fannie Mae, 4.839%, 2014 | | | 4,835,681 | | | 4,924,185 |
| Fannie Mae, 4.88%, 2014 - 2020 | | | 1,699,668 | | | 1,727,023 |
| Fannie Mae, 4.543%, 2015 | | | 674,308 | | | 670,315 |
| Fannie Mae, 4.78%, 2015 | | | 2,418,969 | | | 2,415,334 |
| Fannie Mae, 4.925%, 2015 | | | 15,821,599 | | | 16,113,027 |
| Fannie Mae, 5.19%, 2015 | | | 1,402,448 | | | 1,442,655 |
| Fannie Mae, 4.92%, 2016 | | | 2,000,000 | | | 2,013,817 |
| Fannie Mae, 4.881%, 2017 | | | 2,501,000 | | | 2,510,654 |
| Fannie Mae, 5.5%, 2017 - 2037 | | | 414,492,033 | | | 420,295,707 |
| Fannie Mae, 6%, 2017 - 2037 | | | 245,824,237 | | | 252,686,839 |
| Fannie Mae, 4.5%, 2018 - 2035 | | | 65,575,256 | | | 64,944,946 |
| Fannie Mae, 5%, 2018 - 2035 | | | 140,953,640 | | | 140,828,182 |
| Fannie Mae, 7.5%, 2030 - 2032 | | | 1,492,729 | | | 1,612,063 |
| Fannie Mae, 6.5%, 2031 - 2037 | | | 70,685,980 | | | 73,562,078 |
| Freddie Mac, 6%, 2016 - 2037 | | | 107,153,195 | | | 110,324,231 |
| Freddie Mac, 5%, 2017 - 2035 | | | 136,689,834 | | | 136,444,824 |
| Freddie Mac, 4.5%, 2019 - 2035 | | | 25,888,732 | | | 25,559,343 |
| Freddie Mac, 5.5%, 2019 - 2036 | | | 111,195,853 | | | 112,837,623 |
| Freddie Mac, TBA, 5.5%, 2037 | | | 18,972,000 | | | 19,155,801 |
| Freddie Mac, 6.5%, 2034 - 2037 | | | 28,092,525 | | | 29,206,149 |
| Ginnie Mae, 5.5%, 2032 - 2035 | | | 36,991,624 | | | 37,809,084 |
| Ginnie Mae, 6%, 2032 - 2038 | | | 31,234,070 | | | 32,297,956 |
| Ginnie Mae, 4.5%, 2033 - 2034 | | | 8,479,364 | | | 8,216,161 |
17
Portfolio of Investments (unaudited) – continued
| | | | | | |
| Issuer | | Shares/Par | | Value ($) |
| | | | | | |
| Bonds - continued | | | | | | |
| Mortgage Backed - continued | | | | | | |
| Ginnie Mae, 5%, 2033 - 2034 | | $ | 8,854,192 | | $ | 8,860,677 |
| Ginnie Mae, TBA, 5.5%, 2038 | | | 18,781,000 | | | 19,188,923 |
| | | | | | |
| | | | | | $ | 1,542,200,283 |
| Municipals - 0.6% | | | | | | |
Broward County, FL, Parks & Land Preservation Project,
5%, 2014 (c) | | $ | 4,965,000 | | $ | 5,427,589 |
| California Educational Facilities Authority Rev. (Stanford University), “T-1”, 5%, 2039 | | | 10,995,000 | | | 11,186,533 |
Gwinnett County, GA, Development Authority, COP, MBIA,
5.25%, 2014 (c) | | | 4,010,000 | | | 4,458,037 |
| Massachusetts Bay Transportation Authority, 5.25%, 2017 | | | 7,950,000 | | | 8,880,468 |
| Massachusetts Health & Educational Facilities Authority Rev. (Boston College), 5.5%, 2030 | | | 4,210,000 | | | 4,525,119 |
| Massachusetts Health & Educational Facilities Authority Rev. (Boston College), 5.5%, 2035 | | | 6,685,000 | | | 7,178,219 |
| Mesa, AZ, Utility System Rev., FSA, 4.75%, 2015 (c) | | | 4,340,000 | | | 4,751,128 |
| Metropolitan Transportation Authority, NY, “B”, FSA, 5.25%, 2026 | | | 7,145,000 | | | 7,591,991 |
| University of Texas, Permanent University Fund, “B”, 5%, 2014 (c) | | | 4,965,000 | | | 5,478,828 |
| | | | | | |
| | | | | | $ | 59,477,912 |
| Natural Gas - Pipeline - 0.3% | | | | | | |
| CenterPoint Energy, Inc., 7.875%, 2013 | | $ | 6,965,000 | | $ | 7,737,210 |
| Enterprise Products Operating LLC, 6.5%, 2019 | | | 5,070,000 | | | 5,063,206 |
| Kinder Morgan Energy Partners LP, 6.75%, 2011 | | | 8,013,000 | | | 8,394,555 |
| Kinder Morgan Energy Partners LP, 7.75%, 2032 | | | 2,520,000 | | | 2,682,968 |
| Spectra Energy Capital LLC, 8%, 2019 | | | 5,327,000 | | | 6,022,344 |
| | | | | | |
| | | | | | $ | 29,900,283 |
| Network & Telecom - 0.7% | | | | | | |
| AT&T, Inc., 6.5%, 2037 | | $ | 9,194,000 | | $ | 9,094,631 |
| BellSouth Corp., 6.55%, 2034 | | | 8,131,000 | | | 7,987,179 |
| Deutsche Telekom International Finance B.V., 5.75%, 2016 | | | 11,261,000 | | | 11,133,458 |
| Telecom Italia Capital, 5.25%, 2013 | | | 4,186,000 | | | 3,911,357 |
| Telefonica Europe B.V., 7.75%, 2010 | | | 4,400,000 | | | 4,720,052 |
| TELUS Corp., 8%, 2011 | | | 11,527,000 | | | 12,536,638 |
| Verizon New York, Inc., 6.875%, 2012 | | | 19,974,000 | | | 21,006,716 |
| | | | | | |
| | | | | | $ | 70,390,031 |
| Oil Services - 0.1% | | | | | | |
| Weatherford International Ltd., 6.35%, 2017 | | $ | 2,900,000 | | $ | 2,999,635 |
| Weatherford International Ltd., 6%, 2018 | | | 6,883,000 | | | 6,918,854 |
| | | | | | |
| | | | | | $ | 9,918,489 |
18
Portfolio of Investments (unaudited) – continued
| | | | | | |
| Issuer | | Shares/Par | | Value ($) |
| | | | | | |
| Bonds - continued | | | | | | |
| Oils - 0.1% | | | | | | |
| Valero Energy Corp., 6.875%, 2012 | | $ | 12,750,000 | | $ | 13,705,370 |
| | |
| Other Banks & Diversified Financials - 0.6% | | | | | | |
| Commonwealth Bank, 5%, 2012 (n) | | $ | 10,026,000 | | $ | 10,473,992 |
| Mizuho Capital Investment 1 Ltd., 6.686% to 2016, FRN to 2049 (n) | | | 5,268,000 | | | 4,462,096 |
| Nordea Bank AB, 5.424% to 2015, FRN to 2049 (n) | | | 5,684,000 | | | 5,333,161 |
| UBS Preferred Funding Trust V, 6.243% to 2016, FRN to 2049 | | | 12,360,000 | | | 10,337,632 |
| UFJ Finance Aruba AEC, 6.75%, 2013 | | | 9,069,000 | | | 10,088,129 |
| Woori Bank, 6.125% to 2011, FRN to 2016 (n) | | | 15,472,000 | | | 15,199,012 |
| | | | | | |
| | | | | | $ | 55,894,022 |
| Pharmaceuticals - 0.1% | | | | | | |
| Allergan, Inc., 5.75%, 2016 | | $ | 9,860,000 | | $ | 10,159,024 |
| | |
| Pollution Control - 0.1% | | | | | | |
| Waste Management, Inc., 7.375%, 2010 | | $ | 7,332,000 | | $ | 7,724,284 |
| | |
| Railroad & Shipping - 0.1% | | | | | | |
| CSX Corp., 6.75%, 2011 | | $ | 618,000 | | $ | 652,454 |
| CSX Corp., 7.9%, 2017 | | | 6,220,000 | | | 6,886,025 |
| | | | | | |
| | | | | | $ | 7,538,479 |
| Real Estate - 0.4% | | | | | | |
| Boston Properties, Inc., REIT, 5%, 2015 | | $ | 2,006,000 | | $ | 1,787,651 |
| HRPT Properties Trust, REIT, 6.25%, 2016 | | | 11,278,000 | | | 10,205,801 |
| Kimco Realty Corp., REIT, 6%, 2012 | | | 1,750,000 | | | 1,733,284 |
| ProLogis, REIT, 5.75%, 2016 | | | 11,170,000 | | | 10,255,367 |
| Simon Property Group, Inc., REIT, 5.1%, 2015 | | | 11,785,000 | | | 10,826,773 |
| Vornado Realty Trust, REIT, 4.75%, 2010 | | | 5,141,000 | | | 4,943,976 |
| | | | | | |
| | | | | | $ | 39,752,852 |
| Retailers - 0.3% | | | | | | |
| Federated Retail Holdings, Inc., 5.35%, 2012 | | $ | 2,980,000 | | $ | 2,839,323 |
| Home Depot, Inc., 5.25%, 2013 | | | 3,335,000 | | | 3,262,994 |
| Limited Brands, Inc., 5.25%, 2014 | | | 8,431,000 | | | 7,169,410 |
| Wal-Mart Stores, Inc., 5.25%, 2035 | | | 12,347,000 | | | 10,927,354 |
| | | | | | |
| | | | | | $ | 24,199,081 |
| Supermarkets - 0.1% | | | | | | |
| Kroger Co., 5%, 2013 | | $ | 3,210,000 | | $ | 3,227,835 |
| Kroger Co., 6.4%, 2017 | | | 2,010,000 | | | 2,121,302 |
| | | | | | |
| | | | | | $ | 5,349,137 |
| Supranational - 0.7% | | | | | | |
| European Investment Bank, 5.125%, 2017 | | $ | 61,653,000 | | $ | 67,221,006 |
19
Portfolio of Investments (unaudited) – continued
| | | | | | |
| Issuer | | Shares/Par | | Value ($) |
| | | | | | |
| Bonds - continued | | | | | | |
| Telecommunications - Wireless - 0.2% | | | | | | |
| Cingular Wireless LLC, 6.5%, 2011 | | $ | 3,924,000 | | $ | 4,165,353 |
| Nextel Communications, Inc., 5.95%, 2014 | | | 11,430,000 | | | 8,458,200 |
| Vodafone Group PLC, 5.625%, 2017 | | | 1,987,000 | | | 1,932,063 |
| | | | | | |
| | | | | | $ | 14,555,616 |
| U.S. Government Agencies - 1.4% | | | | | | |
| Aid-Egypt, 4.45%, 2015 | | $ | 9,559,000 | | $ | 9,920,999 |
| Fannie Mae, 6.625%, 2009 | | | 28,113,000 | | | 29,859,633 |
| Freddie Mac, 5.5%, 2017 (l) | | | 44,400,000 | | | 48,972,534 |
| Small Business Administration, 8.8%, 2011 | | | 20,546 | | | 20,844 |
| Small Business Administration, 4.35%, 2023 | | | 1,762,942 | | | 1,732,004 |
| Small Business Administration, 4.77%, 2024 | | | 4,597,596 | | | 4,617,846 |
| Small Business Administration, 4.99%, 2024 | | | 6,490,776 | | | 6,558,759 |
| Small Business Administration, 5.18%, 2024 | | | 7,389,043 | | | 7,545,701 |
| Small Business Administration, 5.52%, 2024 | | | 4,616,611 | | | 4,776,585 |
| Small Business Administration, 4.95%, 2025 | | | 5,353,904 | | | 5,253,810 |
| Small Business Administration, 5.09%, 2025 | | | 7,585,580 | | | 7,589,797 |
| Small Business Administration, 5.39%, 2025 | | | 5,716,461 | | | 5,865,943 |
| | | | | | |
| | | | | | $ | 132,714,455 |
| U.S. Treasury Obligations - 9.3% | | | | | | |
| U.S. Treasury Bonds, 6%, 2026 (l) | | $ | 11,927,000 | | $ | 14,446,579 |
| U.S. Treasury Bonds, 6.75%, 2026 (l) | | | 52,787,000 | | | 69,245,828 |
| U.S. Treasury Bonds, 5.375%, 2031 (l) | | | 77,449,000 | | | 89,574,570 |
| U.S. Treasury Bonds, 4.5%, 2036 (l) | | | 47,472,000 | | | 49,040,807 |
| U.S. Treasury Notes, 5.625%, 2008 (l) | | | 43,239,000 | | | 43,458,568 |
| U.S. Treasury Notes, 4.75%, 2008 (l) | | | 154,763,000 | | | 157,918,772 |
| U.S. Treasury Notes, 4%, 2009 (l) | | | 26,274,000 | | | 27,039,651 |
| U.S. Treasury Notes, 4.875%, 2009 (l) | | | 50,443,000 | | | 52,705,066 |
| U.S. Treasury Notes, 6.5%, 2010 (l) | | | 96,429,000 | | | 105,017,160 |
| U.S. Treasury Notes, 5.125%, 2011 (l) | | | 155,308,000 | | | 170,996,593 |
| U.S. Treasury Notes, 3.875%, 2013 (l) | | | 9,952,000 | | | 10,619,093 |
| U.S. Treasury Notes, 4.25%, 2013 (l) | | | 72,088,000 | | | 78,474,564 |
| U.S. Treasury Notes, 4.75%, 2014 (l) | | | 9,141,000 | | | 10,261,486 |
| U.S. Treasury Notes, 4.25%, 2015 (l) | | | 856,000 | | | 932,572 |
| | | | | | |
| | | | | | $ | 879,731,309 |
| Utilities - Electric Power - 1.3% | | | | | | |
| Bruce Mansfield Unit, 6.85%, 2034 | | $ | 13,870,000 | | $ | 14,519,948 |
| EDP Finance B.V., 6%, 2018 (n) | | | 11,280,000 | | | 11,522,441 |
| Enel Finance International S.A., 6.25%, 2017 (n) | | | 10,970,000 | | | 11,381,386 |
| Exelon Generation Co. LLC, 6.95%, 2011 | | | 15,019,000 | | | 15,933,807 |
| Exelon Generation Co. LLC, 6.2%, 2017 | | | 5,040,000 | | | 4,993,748 |
20
Portfolio of Investments (unaudited) – continued
| | | | | | |
| Issuer | | Shares/Par | | Value ($) |
| | | | | | |
| Bonds - continued | | | | | | |
| Utilities - Electric Power - continued | | | | | | |
| FirstEnergy Corp., 6.45%, 2011 | | $ | 13,306,000 | | $ | 13,928,162 |
| MidAmerican Energy Holdings Co., 3.5%, 2008 | | | 5,589,000 | | | 5,587,865 |
| MidAmerican Energy Holdings Co., 5.875%, 2012 | | | 2,667,000 | | | 2,818,267 |
| MidAmerican Funding LLC, 6.927%, 2029 | | | 12,485,000 | | | 13,266,549 |
| Oncor Electric Delivery Co., 7%, 2022 | | | 8,725,000 | | | 8,356,386 |
| Pacific Gas & Electric Co., 4.8%, 2014 | | | 2,350,000 | | | 2,370,360 |
| PSEG Power LLC, 6.95%, 2012 | | | 6,285,000 | | | 6,723,190 |
| PSEG Power LLC, 5.5%, 2015 | | | 5,036,000 | | | 4,995,289 |
| System Energy Resources, Inc., 5.129%, 2014 (n) | | | 3,838,627 | | | 3,835,287 |
| Waterford 3 Funding Corp., 8.09%, 2017 | | | 6,661,497 | | | 6,713,257 |
| | | | | | |
| | | | | | $ | 126,945,942 |
| Total Bonds (Identified Cost, $3,797,403,537) | | | | | $ | 3,821,442,524 |
| | |
| Money Market Funds (v) - 1.5% | | | | | | |
MFS Institutional Money Market Portfolio, 2.86%,
at Cost and Net Asset Value | | | 145,214,176 | | $ | 145,214,176 |
| | |
| Collateral for Securities Loaned - 7.2% | | | | | | |
| Morgan Stanley Repurchase Agreement, 2.25%, dated 3/31/08, due 4/01/08, total to be received $681,770,419 (secured by U.S. Treasury and Federal Agency obligations and Mortgage Backed securities in an individually traded account), at Cost and Net Asset Value | | $ | 681,727,811 | | $ | 681,727,811 |
| Total Investments (Identified Cost, $9,805,025,344) (k) | | | | | $ | 10,156,043,843 |
| | |
| Other Assets, Less Liabilities - (7.4)% | | | | | | (702,789,110) |
| Net Assets - 100.0% | | | | | $ | 9,453,254,733 |
| (a) | Non-income producing security. |
| (i) | Interest only security for which the fund receives interest on notional principal (Par amount). Par amount shown is the notional principal and does not reflect the cost of the security. |
| (k) | As of March 31, 2008, the fund held securities fair valued in accordance with the policies adopted by the Board of Trustees, aggregating $3,789,496,612 and 37.31% of market value. An independent pricing service provided an evaluated bid for 37.05% of the market value. |
| (l) | All or a portion of this security is on loan. |
| (n) | Securities exempt from registration under Rule 144A of the Securities Act of 1933. These securities may be sold in the ordinary course of business in transactions exempt from registration, normally to qualified institutional buyers. At period end, the aggregate value of these securities was $169,435,652 representing 1.79% of net assets. |
| (v) | Underlying fund that is available only to investment companies managed by MFS. The rate quoted is the annualized seven-day yield of the fund at period end. |
| (z) | Restricted securities are not registered under the Securities Act of 1933 and are subject to legal restrictions on resale. These securities generally may be resold in transactions exempt from registration or to the public if the securities are subsequently registered. Disposal of these securities may involve time-consuming negotiations and prompt sale at an acceptable price may be difficult. The fund holds the following restricted securities: |
21
Portfolio of Investments (unaudited) – continued
| | | | | | |
| Restricted Securities | | Acquisition
Date | | Cost | | Current
Market
Value |
| Bayview Financial Revolving Mortgage Loan Trust, FRN, 3.477%, 2040 | | 3/01/06 | | $10,340,000 | | $7,444,800 |
| Capital Trust Realty CDO Ltd., 5.16%, 2035 | | 4/07/06 | | 2,313,880 | | 2,259,375 |
| KKR Private Equity Investors LP, IEU | | 5/03/06-6/28/06 | | 11,652,739 | | 5,857,976 |
| Spirit Master Funding LLC, 5.05%, 2023 | | 10/04/05 | | 9,301,023 | | 8,834,040 |
| Total Restricted Securities | | | | | | $24,396,191 |
| % of Net Assets | | | | | | 0.3% |
The following abbreviations are used in this report and are defined:
| ADR | | American Depository Receipt |
| CDO | | Collateralized Debt Obligation |
| COP | | Certificate of Participation |
| FRN | | Floating Rate Note. Interest rate resets periodically and may not be the rate reported at period end. |
| GDR | | Global Depository Receipt |
| IEU | | International Equity Unit |
| REIT | | Real Estate Investment Trust |
Insurers
| FSA | | Financial Security Assurance Inc. |
| MBIA | | MBIA Insurance Corp. |
See Notes to Financial Statements
22
Financial Statements
STATEMENT OF ASSETS AND LIABILITIES
At 3/31/08 (unaudited)
This statement represents your fund’s balance sheet, which details the assets and liabilities comprising the total value of the fund.
| | | | | |
| Assets | | | | | |
| Investments - Non-affiliated issuers, at value (identified cost, $9,659,811,168) | | $10,010,829,667 | | | |
| Underlying funds, at cost and value | | 145,214,176 | | | |
| Total Investments, at value including $679,705,448 of securities on loan (identified cost, $9,805,025,344) | | | | | $10,156,043,843 |
| Foreign currency, at value (identified cost, $524,915) | | 524,947 | | | |
| Receivable for investments sold | | 37,941,870 | | | |
| Receivable for fund shares sold | | 7,559,098 | | | |
| Interest and dividends receivable | | 45,290,832 | | | |
| Other assets | | 154,368 | | | |
| Total assets | | | | | $10,247,514,958 |
| Liabilities | | | | | |
| Payable to custodian | | $3,415,858 | | | |
| Distributions payable | | 2,716,082 | | | |
| Payable for investments purchased | | 28,225,393 | | | |
| Payable for TBA purchase commitments | | 37,699,462 | | | |
| Payable for fund shares reacquired | | 35,125,734 | | | |
| Collateral for securities loaned, at value (c) | | 681,727,811 | | | |
| Payable to affiliates | | | | | |
Management fee | | 357,999 | | | |
Shareholder servicing costs | | 3,891,084 | | | |
Distribution and service fees | | 536,956 | | | |
Administrative services fee | | 12,621 | | | |
Program manager fees | | 674 | | | |
| Payable for independent trustees’ compensation | | 296,111 | | | |
| Accrued expenses and other liabilities | | 254,440 | | | |
| Total liabilities | | | | | $794,260,225 |
| Net assets | | | | | $9,453,254,733 |
| Net assets consist of | | | | | |
| Paid-in capital | | $9,203,709,321 | | | |
| Unrealized appreciation (depreciation) on investments and translation of assets and liabilities in foreign currencies | | 351,113,545 | | | |
| Accumulated distributions in excess of net realized gain on investments and foreign currency transactions | | (97,762,952 | ) | | |
| Accumulated distributions in excess of net investment income | | (3,805,181 | ) | | |
| Net assets | | | | | $9,453,254,733 |
| Shares of beneficial interest outstanding | | | | | 659,630,420 |
23
Statement of Assets and Liabilities (unaudited) – continued
| | | | |
| Class A shares | | | | |
Net assets | | $5,990,436,188 | | |
Shares outstanding | | 418,224,137 | | |
Net asset value per share | | | | $14.32 |
Offering price per share (100/94.25 × net asset value per share) | | | | $15.19 |
| Class B shares | | | | |
Net assets | | $1,448,252,270 | | |
Shares outstanding | | 101,134,923 | | |
Net asset value and offering price per share | | | | $14.32 |
| Class C shares | | | | |
Net assets | | $1,205,482,424 | | |
Shares outstanding | | 83,808,858 | | |
Net asset value and offering price per share | | | | $14.38 |
| Class I shares | | | | |
Net assets | | $248,052,318 | | |
Shares outstanding | | 17,320,666 | | |
Net asset value, offering price, and redemption price per share | | | | $14.32 |
| Class R shares | | | | |
Net assets | | $53,173,929 | | |
Shares outstanding | | 3,709,152 | | |
Net asset value, offering price, and redemption price per share | | | | $14.34 |
| Class R1 shares | | | | |
Net assets | | $22,487,060 | | |
Shares outstanding | | 1,571,475 | | |
Net asset value, offering price, and redemption price per share | | | | $14.31 |
| Class R2 shares | | | | |
Net assets | | $21,312,559 | | |
Shares outstanding | | 1,490,622 | | |
Net asset value, offering price, and redemption price per share | | | | $14.30 |
| Class R3 shares | | | | |
Net assets | | $116,076,996 | | |
Shares outstanding | | 8,084,760 | | |
Net asset value, offering price, and redemption price per share | | | | $14.36 |
| Class R4 shares | | | | |
Net assets | | $129,941,702 | | |
Shares outstanding | | 9,068,847 | | |
Net asset value, offering price, and redemption price per share | | | | $14.33 |
24
Statement of Assets and Liabilities (unaudited) – continued
| | | | |
| Class R5 shares | | | | |
Net assets | | $193,425,020 | | |
Shares outstanding | | 13,497,973 | | |
Net asset value, offering price, and redemption price per share | | | | $14.33 |
| Class 529A shares | | | | |
Net assets | | $14,049,053 | | |
Shares outstanding | | 982,853 | | |
Net asset value per share | | | | $14.29 |
Offering price per share (100/94.25 × net asset value per share) | | | | $15.16 |
| Class 529B shares | | | | |
Net assets | | $5,441,133 | | |
Shares outstanding | | 379,970 | | |
Net asset value and offering price per share | | | | $14.32 |
| Class 529C shares | | | | |
Net assets | | $5,124,081 | | |
Shares outstanding | | 356,184 | | |
Net asset value and offering price per share | | | | $14.39 |
| (c) | Non-cash collateral is not included. |
On sales of $50,000 or more, the offering prices of Class A and Class 529A shares are reduced. A contingent deferred sales charge may be imposed on redemptions of Class A, Class B, Class C, Class 529B, and Class 529C shares.
See Notes to Financial Statements
25
Financial Statements
STATEMENT OF OPERATIONS
Six months ended 3/31/08 (unaudited)
This statement describes how much your fund earned in investment income and accrued in expenses. It also describes any gains and/or losses generated by fund operations.
| | | | | | |
| Net investment income | | | | | | |
| Income | | | | | | |
Interest | | $111,433,886 | | | | |
Dividends | | 65,523,697 | | | | |
Dividends from underlying funds | | 1,995,188 | | | | |
Foreign taxes withheld | | (225,488 | ) | | | |
| Total investment income | | | | | $178,727,283 | |
| Expenses | | | | | | |
Management fee | | $17,895,738 | | | | |
Distribution and service fees | | 27,102,994 | | | | |
Program manager fees | | 31,803 | | | | |
Shareholder servicing costs | | 7,327,785 | | | | |
Administrative services fee | | 431,726 | | | | |
Retirement plan administration and services fees | | 190,344 | | | | |
Independent trustees’ compensation | | 50,901 | | | | |
Custodian fee | | 159,269 | | | | |
Shareholder communications | | 331,975 | | | | |
Auditing fees | | 30,432 | | | | |
Legal fees | | 72,489 | | | | |
Miscellaneous | | 365,701 | | | | |
| Total expenses | | | | | $53,991,157 | |
Fees paid indirectly | | (19,397 | ) | | | |
Reduction of expenses by investment adviser | | (23,685 | ) | | | |
| Net expenses | | | | | $53,948,075 | |
| Net investment income | | | | | $124,779,208 | |
| Realized and unrealized gain (loss) on investments | | | | | | |
| Realized gain (loss) (identified cost basis) | | | | | | |
Investment transactions | | $77,049,055 | | | | |
Foreign currency transactions | | (42,179 | ) | | | |
Net realized gain (loss) on investments
and foreign currency transactions | | | | | $77,006,876 | |
| Change in unrealized appreciation (depreciation) | | | | | | |
Investments | | $(892,762,301 | ) | | | |
Translation of assets and liabilities in foreign currencies | | 54,814 | | | | |
Net unrealized gain (loss) on investments
and foreign currency translation | | | | | $(892,707,487 | ) |
Net realized and unrealized gain (loss) on investments
and foreign currency | | | | | $(815,700,611 | ) |
| Change in net assets from operations | | | | | $(690,921,403 | ) |
See Notes to Financial Statements
��
26
Financial Statements
STATEMENTS OF CHANGES IN NET ASSETS
These statements describe the increases and/or decreases in net assets resulting from operations, any distributions, and any shareholder transactions.
| | | | | | |
| | | Six months
ended 3/31/08 | | | Year ended
9/30/07 | |
| | | (unaudited) | | | | |
| Change in net assets | | | | | | |
| From operations | | | | | | |
| Net investment income | | $124,779,208 | | | $278,463,697 | |
Net realized gain (loss) on investments and foreign
currency transactions | | 77,006,876 | | | 953,421,732 | |
| Net unrealized gain (loss) on investments and foreign currency translation | | (892,707,487 | ) | | 10,007,641 | |
| Change in net assets from operations | | $(690,921,403 | ) | | $1,241,893,070 | |
| Distributions declared to shareholders | | | | | | |
| From net investment income | | | | | | |
Class A | | $(88,314,711 | ) | | $(210,113,998 | ) |
Class B | | (16,568,512 | ) | | (47,172,735 | ) |
Class C | | (13,426,969 | ) | | (33,073,059 | ) |
Class I | | (3,955,165 | ) | | (8,479,409 | ) |
Class R | | (742,713 | ) | | (2,654,216 | ) |
Class R1 | | (228,483 | ) | | (199,504 | ) |
Class R2 | | (257,048 | ) | | (168,445 | ) |
Class R3 | | (1,476,084 | ) | | (1,834,749 | ) |
Class R4 | | (1,872,593 | ) | | (2,677,579 | ) |
Class R5 | | (3,030,292 | ) | | (3,786,151 | ) |
Class 529A | | (179,661 | ) | | (369,438 | ) |
Class 529B | | (52,655 | ) | | (111,487 | ) |
Class 529C | | (47,552 | ) | | (103,209 | ) |
| From net realized gain on investments | | | | | | |
Class A | | (535,843,118 | ) | | (235,284,807 | ) |
Class B | | (135,020,654 | ) | | (71,527,510 | ) |
Class C | | (108,018,631 | ) | | (47,491,836 | ) |
Class I | | (20,856,322 | ) | | (8,112,117 | ) |
Class R | | (4,933,773 | ) | | (3,387,483 | ) |
Class R1 | | (1,749,778 | ) | | (191,844 | ) |
Class R2 | | (1,347,623 | ) | | (141,467 | ) |
Class R3 | | (9,123,580 | ) | | (1,791,267 | ) |
Class R4 | | (10,864,525 | ) | | (2,058,257 | ) |
Class R5 | | (16,271,373 | ) | | (773,171 | ) |
Class 529A | | (1,163,532 | ) | | (417,189 | ) |
Class 529B | | (474,843 | ) | | (168,712 | ) |
Class 529C | | (420,572 | ) | | (155,734 | ) |
| Total distributions declared to shareholders | | $(976,240,762 | ) | | $(682,245,373 | ) |
| Change in net assets from fund share transactions | | $(2,917,323 | ) | | $(823,852,329 | ) |
| Total change in net assets | | $(1,670,079,488 | ) | | $(264,204,632 | ) |
| Net assets | | | | | | |
| At beginning of period | | 11,123,334,221 | | | 11,387,538,853 | |
| At end of period (including accumulated distributions in excess of net investment income of $3,805,181 and undistributed net investment income of $1,568,049) | | $9,453,254,733 | | | $11,123,334,221 | |
See Notes to Financial Statements
27
Financial Statements
FINANCIAL HIGHLIGHTS
The financial highlights table is intended to help you understand the fund’s financial performance for the semiannual period and the past 5 fiscal years (or life of a particular share class, if shorter). Certain information reflects financial results for a single fund share. The total returns in the table represent the rate by which an investor would have earned (or lost) on an investment in the fund share class (assuming reinvestment of all distributions) held for the entire period.
| | | | | | | | | | | | | | | | | | |
| | | Six months
ended
3/31/08 (unaudited) | | | Years ended 9/30 | |
| Class A | | | 2007 | | | 2006 | | | 2005 | | | 2004 | | | 2003 | |
| | | | | | | | | | | | | | | | | |
Net asset value, beginning
of period | | $16.86 | | | $16.06 | | | $16.11 | | | $15.43 | | | $14.13 | | | $12.78 | |
| Income (loss) from investment operations | | | | | | | | | | | | | | | | | | |
Net investment income (d) | | $0.20 | | | $0.44 | | | $0.40 | | | $0.39 | | | $0.36 | | | $0.33 | |
Net realized and unrealized gain (loss)
on investments and foreign currency | | (1.22 | ) | | 1.38 | | | 0.68 | | | 1.08 | | | 1.31 | | | 1.40 | |
| Total from investment operations | | $(1.02 | ) | | $1.82 | | | $1.08 | | | $1.47 | | | $1.67 | | | $1.73 | |
| Less distributions declared to shareholders | | | | | | | | | | | | | | | | | | |
From net investment income | | $(0.21 | ) | | $(0.48 | ) | | $(0.42 | ) | | $(0.40 | ) | | $(0.37 | ) | | $(0.38 | ) |
From net realized gain on investments | | (1.31 | ) | | (0.54 | ) | | (0.71 | ) | | (0.39 | ) | | — | | | — | |
| Total distributions declared to shareholders | | $(1.52 | ) | | $(1.02 | ) | | $(1.13 | ) | | $(0.79 | ) | | $(0.37 | ) | | $(0.38 | ) |
| Net asset value, end of period | | $14.32 | | | $16.86 | | | $16.06 | | | $16.11 | | | $15.43 | | | $14.13 | |
| Total return (%) (r)(s)(t) | | (6.50 | )(n) | | 11.65 | | | 7.16 | | | 9.72 | | | 11.89 | (b) | | 13.70 | |
Ratios (%) (to average
net assets) and Supplemental data: | | | | | | | | | | | | | | | | | | |
| Expenses before expense reductions (f) | | 0.87 | (a) | | 0.87 | | | 0.90 | | | 0.91 | | | 0.89 | | | 0.90 | |
| Expenses after expense reductions (f) | | 0.87 | (a) | | 0.87 | | | 0.90 | | | 0.91 | | | 0.89 | | | N/A | |
| Net investment income | | 2.60 | (a) | | 2.63 | | | 2.56 | | | 2.43 | | | 2.37 | | | 2.45 | |
| Portfolio turnover | | 31 | | | 45 | | | 48 | | | 50 | | | 65 | | | 71 | |
| Net assets at end of period (000 Omitted) | | $5,990,436 | | | $7,017,623 | | | $7,157,485 | | | $7,371,678 | | | $6,382,150 | | | $5,702,669 | |
See Notes to Financial Statements
28
Financial Highlights – continued
| | | | | | | | | | | | | | | | | | |
| | | Six months
ended
3/31/08 (unaudited) | | | Years ended 9/30 | |
| Class B | | | 2007 | | | 2006 | | | 2005 | | | 2004 | | | 2003 | |
| | | | | | | | | | | | | | | | | |
Net asset value, beginning
of period | | $16.85 | | | $16.06 | | | $16.10 | | | $15.42 | | | $14.12 | | | $12.78 | |
| Income (loss) from investment operations | | | | | | | | | | | | | | | | | | |
Net investment income (d) | | $0.15 | | | $0.33 | | | $0.30 | | | $0.28 | | | $0.26 | | | $0.24 | |
Net realized and unrealized gain (loss)
on investments and foreign currency | | (1.21 | ) | | 1.37 | | | 0.69 | | | 1.09 | | | 1.31 | | | 1.39 | |
| Total from investment operations | | $(1.06 | ) | | $1.70 | | | $0.99 | | | $1.37 | | | $1.57 | | | $1.63 | |
| Less distributions declared to shareholders | | | | | | | | | | | | | | | | | | |
From net investment income | | $(0.16 | ) | | $(0.37 | ) | | $(0.32 | ) | | $(0.30 | ) | | $(0.27 | ) | | $(0.29 | ) |
From net realized gain
on investments | | (1.31 | ) | | (0.54 | ) | | (0.71 | ) | | (0.39 | ) | | — | | | — | |
| Total distributions declared to shareholders | | $(1.47 | ) | | $(0.91 | ) | | $(1.03 | ) | | $(0.69 | ) | | $(0.27 | ) | | $(0.29 | ) |
Net asset value, end
of period | | $14.32 | | | $16.85 | | | $16.06 | | | $16.10 | | | $15.42 | | | $14.12 | |
| Total return (%) (r)(s)(t) | | (6.75 | )(n) | | 10.87 | | | 6.54 | | | 9.02 | | | 11.18 | (b) | | 12.90 | |
Ratios (%) (to average
net assets) and Supplemental data: | | | | | | | | | | | | | | | | | | |
| Expenses before expense reductions (f) | | 1.52 | (a) | | 1.52 | | | 1.55 | | | 1.56 | | | 1.54 | | | 1.54 | |
| Expenses after expense reductions (f) | | 1.52 | (a) | | 1.52 | | | 1.55 | | | 1.56 | | | 1.54 | | | N/A | |
| Net investment income | | 1.94 | (a) | | 1.98 | | | 1.91 | | | 1.79 | | | 1.73 | | | 1.81 | |
| Portfolio turnover | | 31 | | | 45 | | | 48 | | | 50 | | | 65 | | | 71 | |
| Net assets at end of period (000 Omitted) | | $1,448,252 | | | $1,844,219 | | | $2,245,907 | | | $2,745,051 | | | $2,762,027 | | | $2,658,781 | |
See Notes to Financial Statements
29
Financial Highlights – continued
| | | | | | | | | | | | | | | | | | |
| | | Six months
ended
3/31/08 (unaudited) | | | Years ended 9/30 | |
| Class C | | | 2007 | | | 2006 | | | 2005 | | | 2004 | | | 2003 | |
| | | | | | | | | | | | | | | | | |
Net asset value, beginning
of period | | $16.92 | | | $16.12 | | | $16.16 | | | $15.48 | | | $14.18 | | | $12.82 | |
| Income (loss) from investment operations | | | | | | | | | | | | | | | | | | |
Net investment income (d) | | $0.15 | | | $0.33 | | | $0.30 | | | $0.28 | | | $0.26 | | | $0.24 | |
Net realized and unrealized gain (loss)
on investments and foreign currency | | (1.22 | ) | | 1.38 | | | 0.69 | | | 1.09 | | | 1.31 | | | 1.41 | |
| Total from investment operations | | $(1.07 | ) | | $1.71 | | | $0.99 | | | $1.37 | | | $1.57 | | | $1.65 | |
| Less distributions declared to shareholders | | | | | | | | | | | | | | | | | | |
From net investment income | | $(0.16 | ) | | $(0.37 | ) | | $(0.32 | ) | | $(0.30 | ) | | $(0.27 | ) | | $(0.29 | ) |
From net realized gain
on investments | | (1.31 | ) | | (0.54 | ) | | (0.71 | ) | | (0.39 | ) | | — | | | — | |
| Total distributions declared to shareholders | | $(1.47 | ) | | $(0.91 | ) | | $(1.03 | ) | | $(0.69 | ) | | $(0.27 | ) | | $(0.29 | ) |
Net asset value, end
of period | | $14.38 | | | $16.92 | | | $16.12 | | | $16.16 | | | $15.48 | | | $14.18 | |
| Total return (%) (r)(s)(t) | | (6.78 | )(n) | | 10.90 | | | 6.52 | | | 8.99 | | | 11.14 | (b) | | 13.03 | |
Ratios (%) (to average
net assets) and Supplemental data: | | | | | | | | | | | | | | | | | | |
| Expenses before expense reductions (f) | | 1.52 | (a) | | 1.52 | | | 1.55 | | | 1.56 | | | 1.53 | | | 1.54 | |
| Expenses after expense reductions (f) | | 1.52 | (a) | | 1.52 | | | 1.55 | | | 1.56 | | | 1.53 | | | N/A | |
| Net investment income | | 1.95 | (a) | | 1.98 | | | 1.91 | | | 1.78 | | | 1.71 | | | 1.79 | |
| Portfolio turnover | | 31 | | | 45 | | | 48 | | | 50 | | | 65 | | | 71 | |
| Net assets at end of period (000 Omitted) | | $1,205,482 | | | $1,424,639 | | | $1,488,592 | | | $1,689,457 | | | $1,381,236 | | | $1,150,875 | |
See Notes to Financial Statements
30
Financial Highlights – continued
| | | | | | | | | | | | | | | | | | |
| | | Six months
ended
3/31/08 (unaudited) | | | Years ended 9/30 | |
| Class I | | | 2007 | | | 2006 | | | 2005 | | | 2004 | | | 2003 | |
| | | | | | | | | | | | | | | | | |
Net asset value, beginning
of period | | $16.85 | | | $16.06 | | | $16.11 | | | $15.42 | | | $14.12 | | | $12.77 | |
| Income (loss) from investment operations | | | | | | | | | | | | | | | | | | |
Net investment income (d) | | $0.23 | | | $0.50 | | | $0.45 | | | $0.44 | | | $0.43 | | | $0.37 | |
Net realized and
unrealized gain (loss)
on investments and
foreign currency | | (1.21 | ) | | 1.37 | | | 0.69 | | | 1.09 | | | 1.29 | | | 1.40 | |
| Total from investment operations | | $(0.98 | ) | | $1.87 | | | $1.14 | | | $1.53 | | | $1.72 | | | $1.77 | |
| Less distributions declared to shareholders | | | | | | | | | | | | | | | | | | |
From net investment
income | | $(0.24 | ) | | $(0.54 | ) | | $(0.48 | ) | | $(0.45 | ) | | $(0.42 | ) | | $(0.42 | ) |
From net realized gain
on investments | | (1.31 | ) | | (0.54 | ) | | (0.71 | ) | | (0.39 | ) | | — | | | — | |
Total distributions declared
to shareholders | | $(1.55 | ) | | $(1.08 | ) | | $(1.19 | ) | | $(0.84 | ) | | $(0.42 | ) | | $(0.42 | ) |
Net asset value, end
of period | | $14.32 | | | $16.85 | | | $16.06 | | | $16.11 | | | $15.42 | | | $14.12 | |
| Total return (%) (r)(s) | | (6.27 | )(n) | | 11.98 | | | 7.54 | | | 10.18 | | | 12.28 | (b) | | 14.10 | |
Ratios (%) (to average
net assets) and Supplemental data: | | | | | | | | | | | | | | | | | | |
| Expenses before expense reductions (f) | | 0.52 | (a) | | 0.52 | | | 0.55 | | | 0.56 | | | 0.55 | | | 0.55 | |
| Expenses after expense reductions (f) | | 0.52 | (a) | | 0.52 | | | 0.55 | | | 0.56 | | | 0.55 | | | N/A | |
| Net investment income | | 2.95 | (a) | | 2.98 | | | 2.91 | | | 2.78 | | | 2.78 | | | 2.79 | |
| Portfolio turnover | | 31 | | | 45 | | | 48 | | | 50 | | | 65 | | | 71 | |
| Net assets at end of period (000 Omitted) | | $248,052 | | | $269,510 | | | $242,806 | | | $211,140 | | | $181,794 | | | $378,001 | |
See Notes to Financial Statements
31
Financial Highlights – continued
| | | | | | | | | | | | | | | | | | |
| | | Six months
ended
3/31/08 (unaudited) | | | Years ended 9/30 | |
| Class R | | | 2007 | | | 2006 | | | 2005 | | | 2004 | | | 2003(i) | |
| | | | | | | | | | | | | | | | | |
Net asset value, beginning
of period | | $16.87 | | | $16.07 | | | $16.12 | | | $15.43 | | | $14.13 | | | $13.27 | |
| Income (loss) from investment operations | | | | | | | | | | | | | | | | | | |
Net investment income (d) | | $0.19 | | | $0.42 | | | $0.38 | | | $0.36 | | | $0.33 | | | $0.19 | |
Net realized and
unrealized gain (loss)
on investments and
foreign currency | | (1.21 | ) | | 1.37 | | | 0.68 | | | 1.10 | | | 1.32 | | | 0.93 | |
| Total from investment operations | | $(1.02 | ) | | $1.79 | | | $1.06 | | | $1.46 | | | $1.65 | | | $1.12 | |
Less distributions declared
to shareholders | | | | | | | | | | | | | | | | | | |
From net investment
income | | $(0.20 | ) | | $(0.45 | ) | | $(0.40 | ) | | $(0.38 | ) | | $(0.35 | ) | | $(0.26 | ) |
From net realized gain
on investments | | (1.31 | ) | | (0.54 | ) | | (0.71 | ) | | (0.39 | ) | | — | | | — | |
Total distributions declared
to shareholders | | $(1.51 | ) | | $(0.99 | ) | | $(1.11 | ) | | $(0.77 | ) | | $(0.35 | ) | | $(0.26 | ) |
Net asset value, end
of period | | $14.34 | | | $16.87 | | | $16.07 | | | $16.12 | | | $15.43 | | | $14.13 | |
| Total return (%) (r)(s) | | (6.50 | )(n) | | 11.47 | | | 7.00 | | | 9.63 | | | 11.72 | (b) | | 8.57 | (n) |
Ratios (%) (to average
net assets) and Supplemental data: | | | | | | | | | | | | | | | | | | |
| Expenses before expense reductions (f) | | 1.02 | (a) | | 1.02 | | | 1.05 | | | 1.06 | | | 1.03 | | | 1.07 | (a) |
| Expenses after expense reductions (f) | | 1.02 | (a) | | 1.02 | | | 1.05 | | | 1.06 | | | 1.03 | | | N/A | |
| Net investment income | | 2.45 | (a) | | 2.49 | | | 2.41 | | | 2.25 | | | 2.16 | | | 1.81 | (a) |
| Portfolio turnover | | 31 | | | 45 | | | 48 | | | 50 | | | 65 | | | 71 | |
| Net assets at end of period (000 Omitted) | | $53,174 | | | $73,629 | | | $101,983 | | | $98,768 | | | $45,458 | | | $16,090 | |
See Notes to Financial Statements
32
Financial Highlights – continued
| | | | | | | | | | | | |
| | | Six months
ended
3/31/08 (unaudited) | | | Years ended 9/30 | |
| Class R1 | | | 2007 | | | 2006 | | | 2005 (i) | |
| | | | | | | | | | | |
Net asset value, beginning
of period | | $16.84 | | | $16.06 | | | $16.10 | | | $15.77 | |
Income (loss) from
investment operations | | | | | | | | | | |
Net investment income (d) | | $0.15 | | | $0.30 | | | $0.28 | | | $0.12 | |
Net realized and
unrealized gain (loss)
on investments and
foreign currency | | (1.21 | ) | | 1.38 | | | 0.70 | | | 0.33 | |
Total from investment
operations | | $(1.06 | ) | | $1.68 | | | $0.98 | | | $0.45 | |
Less distributions declared
to shareholders | | | | | | | | | | |
From net investment
income | | $(0.16 | ) | | $(0.36 | ) | | $(0.31 | ) | | $(0.12 | ) |
From net realized gain
on investments | | (1.31 | ) | | (0.54 | ) | | (0.71 | ) | | — | |
Total distributions declared
to shareholders | | $(1.47 | ) | | $(0.90 | ) | | $(1.02 | ) | | $(0.12 | ) |
Net asset value, end
of period | | $14.31 | | | $16.84 | | | $16.06 | | | $16.10 | |
| Total return (%) (r)(s) | | (6.77 | )(n) | | 10.75 | | | 6.43 | | | 2.85 | (n) |
Ratios (%) (to average
net assets) and
Supplemental data: | | | | | | | | | | | | |
Expenses before expense
reductions (f) | | 1.60 | (a) | | 1.66 | | | 1.74 | | | 1.77 | (a) |
Expenses after expense
reductions (f) | | 1.60 | (a) | | 1.62 | | | 1.64 | | | 1.77 | (a) |
| Net investment income | | 1.87 | (a) | | 1.83 | | | 1.83 | | | 1.43 | (a) |
| Portfolio turnover | | 31 | | | 45 | | | 48 | | | 50 | |
Net assets at end of period
(000 Omitted) | | $22,487 | | | $16,936 | | | $5,289 | | | $1,901 | |
See Notes to Financial Statements
33
Financial Highlights – continued
| | | | | | | | | | | | |
| | | Six months
ended
3/31/08 (unaudited) | | | Years ended 9/30 | |
| Class R2 | | | 2007 | | | 2006 | | | 2005 (i) | |
| | | | | | | | | | | |
Net asset value, beginning
of period | | $16.83 | | | $16.05 | | | $16.09 | | | $15.77 | |
Income (loss) from
investment operations | | | | | | | | | | |
Net investment income (d) | | $0.18 | | | $0.35 | | | $0.34 | | | $0.15 | |
Net realized and
unrealized gain (loss)
on investments and
foreign currency | | (1.21 | ) | | 1.39 | | | 0.69 | | | 0.31 | |
Total from investment
operations | | $(1.03 | ) | | $1.74 | | | $1.03 | | | $0.46 | |
Less distributions declared
to shareholders | | | | | | | | | | |
From net investment
income | | $(0.19 | ) | | $(0.42 | ) | | $(0.36 | ) | | $(0.14 | ) |
From net realized gain
on investments | | (1.31 | ) | | (0.54 | ) | | (0.71 | ) | | — | |
Total distributions declared
to shareholders | | $(1.50 | ) | | $(0.96 | ) | | $(1.07 | ) | | $(0.14 | ) |
Net asset value, end
of period | | $14.30 | | | $16.83 | | | $16.05 | | | $16.09 | |
| Total return (%) (r)(s) | | (6.56 | )(n) | | 11.13 | | | 6.81 | | | 2.94(n | ) |
Ratios (%) (to average
net assets) and
Supplemental data: | | | | | | | | | | |
Expenses before expense
reductions (f) | | 1.13 | (a) | | 1.33 | | | 1.44 | | | 1.47 | (a) |
Expenses after expense
reductions (f) | | 1.13 | (a) | | 1.28 | | | 1.29 | | | 1.47 | (a) |
| Net investment income | | 2.34 | (a) | | 2.17 | | | 2.20 | | | 1.75 | (a) |
| Portfolio turnover | | 31 | | | 45 | | | 48 | | | 50 | |
Net assets at end of period
(000 Omitted) | | $21,313 | | | $12,478 | | | $4,078 | | | $932 | |
See Notes to Financial Statements
34
Financial Highlights – continued
| | | | | | | | | | | | | | | |
| | | Six months
ended
3/31/08 (unaudited) | | | Years ended 9/30 | |
| Class R3 | | | 2007 | | | 2006 | | | 2005 | | | 2004(i) | |
| | | | | | | | | | | | | | |
Net asset value, beginning
of period | | $16.89 | | | $16.10 | | | $16.14 | | | $15.46 | | | $14.38 | |
Income (loss) from
investment operations | | | | | | | |
Net investment income (d) | | $0.19 | | | $0.38 | | | $0.36 | | | $0.31 | | | $0.23 | |
Net realized and
unrealized gain (loss)
on investments and
foreign currency | | (1.22 | ) | | 1.38 | | | 0.69 | | | 1.10 | | | 1.13 | |
Total from investment
operations | | $(1.03 | ) | | $1.76 | | | $1.05 | | | $1.41 | | | $1.36 | |
Less distributions declared
to shareholders | | | | | | | | | | | | | |
From net investment
income | | $(0.19 | ) | | $(0.43 | ) | | $(0.38 | ) | | $(0.34 | ) | | $(0.28 | ) |
From net realized gain
on investments | | (1.31 | ) | | (0.54 | ) | | (0.71 | ) | | (0.39 | ) | | — | |
Total distributions declared
to shareholders | | $(1.50 | ) | | $(0.97 | ) | | $(1.09 | ) | | $(0.73 | ) | | $(0.28 | ) |
Net asset value, end
of period | | $14.36 | | | $16.89 | | | $16.10 | | | $16.14 | | | $15.46 | |
| Total return (%) (r)(s) | | (6.52 | )(n) | | 11.25 | | | 6.90 | | | 9.27 | | | 9.53 | (b)(n) |
Ratios (%) (to average
net assets) and
Supplemental data: | | | | | | | | | | | | | |
Expenses before expense
reductions (f) | | 1.09 | (a) | | 1.22 | | | 1.29 | | | 1.31 | | | 1.26 | (a) |
Expenses after expense
reductions (f) | | 1.09 | (a) | | 1.17 | | | 1.19 | | | 1.31 | | | 1.26 | (a) |
| Net investment income | | 2.38 | (a) | | 2.30 | | | 2.28 | | | 1.95 | | | 1.53 | (a) |
| Portfolio turnover | | 31 | | | 45 | | | 48 | | | 50 | | | 65 | |
Net assets at end of period
(000 Omitted) | | $116,077 | | | $102,667 | | | $51,797 | | | $26,576 | | | $3,894 | |
See Notes to Financial Statements
35
Financial Highlights – continued
| | | | | | | | | | | | |
| | | Six months
ended
3/31/08 (unaudited) | | | Years ended 9/30 | |
| Class R4 | | | 2007 | | | 2006 | | | 2005 (i) | |
| | | | | | | | | | | |
Net asset value, beginning
of period | | $16.86 | | | $16.07 | | | $16.11 | | | $15.78 | |
Income (loss) from
investment operations | | | | |
Net investment income (d) | | $0.20 | | | $0.42 | | | $0.39 | | | $0.17 | |
Net realized and
unrealized gain (loss)
on investments and
foreign currency | | (1.21 | ) | | 1.38 | | | 0.70 | | | 0.34 | |
Total from investment
operations | | $(1.01 | ) | | $1.80 | | | $1.09 | | | $0.51 | |
Less distributions declared
to shareholders | | | | | | | | | | |
From net investment
income | | $(0.21 | ) | | $(0.47 | ) | | $(0.42 | ) | | $(0.18 | ) |
From net realized gain
on investments | | (1.31 | ) | | (0.54 | ) | | (0.71 | ) | | — | |
Total distributions declared
to shareholders | | $(1.52 | ) | | $(1.01 | ) | | $(1.13 | ) | | $(0.18 | ) |
Net asset value, end
of period | | $14.33 | | | $16.86 | | | $16.07 | | | $16.11 | |
| Total return (%) (r)(s) | | (6.42 | )(n) | | 11.54 | | | 7.17 | | | 3.26 | (n) |
Ratios (%) (to average
net assets) and
Supplemental data: | | | | | | | | | | |
Expenses before expense
reductions (f) | | 0.84 | (a) | | 0.92 | | | 0.94 | | | 0.96 | (a) |
Expenses after expense
reductions (f) | | 0.84 | (a) | | 0.92 | | | 0.94 | | | 0.96 | (a) |
| Net investment income | | 2.63 | (a) | | 2.54 | | | 2.55 | | | 2.22 | (a) |
| Portfolio turnover | | 31 | | | 45 | | | 48 | | | 50 | |
Net assets at end of period
(000 Omitted) | | $129,942 | | | $133,204 | | | $57,485 | | | $2,134 | |
See Notes to Financial Statements
36
Financial Highlights – continued
| | | | | | | | | | | | |
| | | Six months
ended
3/31/08 (unaudited) | | | Years ended 9/30 | |
| Class R5 | | | 2007 | | | 2006 | | | 2005 (i) | |
| | | | | | | | | | | |
Net asset value, beginning
of period | | $16.86 | | | $16.06 | | | $16.11 | | | $15.78 | |
Income (loss) from
investment operations | | | | |
Net investment income (d) | | $0.22 | | | $0.50 | | | $0.45 | | | $0.21 | |
Net realized and
unrealized gain (loss)
on investments and
foreign currency | | (1.21 | ) | | 1.36 | | | 0.67 | | | 0.33 | |
Total from investment
operations | | $(0.99 | ) | | $1.86 | | | $1.12 | | | $0.54 | |
Less distributions declared
to shareholders | | | | | | | | | | |
From net investment
income | | $(0.23 | ) | | $(0.52 | ) | | $(0.46 | ) | | $(0.21 | ) |
From net realized gain
on investments | | (1.31 | ) | | (0.54 | ) | | (0.71 | ) | | — | |
Total distributions declared
to shareholders | | $(1.54 | ) | | $(1.06 | ) | | $(1.17 | ) | | $(0.21 | ) |
Net asset value, end
of period | | $14.33 | | | $16.86 | | | $16.06 | | | $16.11 | |
| Total return (%) (r)(s) | | (6.29 | )(n) | | 11.93 | | | 7.43 | | | 3.41 | (n) |
Ratios (%) (to average
net assets) and
Supplemental data: | | | | | | | | | | |
Expenses before expense
reductions (f) | | 0.57 | (a) | | 0.63 | | | 0.65 | | | 0.67 | (a) |
Expenses after expense
reductions (f) | | 0.57 | (a) | | 0.63 | | | 0.64 | | | 0.67 | (a) |
| Net investment income | | 2.90 | (a) | | 2.85 | | | 2.80 | | | 2.65 | (a) |
| Portfolio turnover | | 31 | | | 45 | | | 48 | | | 50 | |
Net assets at end of period
(000 Omitted) | | $193,425 | | | $202,523 | | | $10,122 | | | $52 | |
See Notes to Financial Statements
37
Financial Highlights – continued
| | | | | | | | | | | | | | | | | | |
| | | Six months
ended
3/31/08 (unaudited) | | | Years ended 9/30 | |
| Class 529A | | | 2007 | | | 2006 | | | 2005 | | | 2004 | | | 2003 | |
| | | | | | | | | | | | | | | | | |
Net asset value, beginning
of period | | $16.83 | | | $16.04 | | | $16.08 | | | $15.40 | | | $14.10 | | | $12.78 | |
Income (loss) from
investment operations | | | | | | | | | | | | | | | | |
Net investment income (d) | | $0.18 | | | $0.39 | | | $0.36 | | | $0.35 | | | $0.31 | | | $0.27 | |
Net realized and
unrealized gain (loss)
on investments and
foreign currency | | (1.22 | ) | | 1.38 | | | 0.69 | | | 1.08 | | | 1.32 | | | 1.39 | |
Total from investment
operations | | $(1.04 | ) | | $1.77 | | | $1.05 | | | $1.43 | | | $1.63 | | | $1.66 | |
Less distributions declared
to shareholders | | | | | | | | | | | | | | | | |
From net investment
income | | $(0.19 | ) | | $(0.44 | ) | | $(0.38 | ) | | $(0.36 | ) | | $(0.33 | ) | | $(0.34 | ) |
From net realized gain
on investments | | (1.31 | ) | | (0.54 | ) | | (0.71 | ) | | (0.39 | ) | | — | | | — | |
Total distributions declared
to shareholders | | $(1.50 | ) | | $(0.98 | ) | | $(1.09 | ) | | $(0.75 | ) | | $(0.33 | ) | | $(0.34 | ) |
Net asset value, end
of period | | $14.29 | | | $16.83 | | | $16.04 | | | $16.08 | | | $15.40 | | | $14.10 | |
| Total return (%) (r)(s)(t) | | (6.62 | )(n) | | 11.34 | | | 6.97 | | | 9.46 | | | 11.63 | (b) | | 13.19 | |
Ratios (%) (to average
net assets) and
Supplemental data: | | | | | | | | | | | | | | | | |
Expenses before expense
reductions (f) | | 1.12 | (a) | | 1.12 | | | 1.15 | | | 1.16 | | | 1.13 | | | 1.16 | |
Expenses after expense
reductions (f) | | 1.12 | (a) | | 1.12 | | | 1.14 | | | 1.16 | | | 1.13 | | | N/A | |
Net investment income
| | 2.35 | (a) | | 2.37 | | | 2.32 | | | 2.16 | | | 2.08 | | | 1.97 | |
| Portfolio turnover | | 31 | | | 45 | | | 48 | | | 50 | | | 65 | | | 71 | |
Net assets at end of period
(000 Omitted) | | $14,049 | | | $14,753 | | | $12,360 | | | $9,923 | | | $5,600 | | | $2,601 | |
See Notes to Financial Statements
38
Financial Highlights – continued
| | | | | | | | | | | | | | | | | | |
| | | Six months
ended
3/31/08 (unaudited) | | | Years ended 9/30 | |
| Class 529B | | | 2007 | | | 2006 | | | 2005 | | | 2004 | | | 2003 | |
| | | | | | | | | | | | | | | | | |
Net asset value, beginning
of period | | $16.85 | | | $16.06 | | | $16.11 | | | $15.42 | | | $14.12 | | | $12.78 | |
Income (loss) from
investment operations | | | | | | | | | | | | | | | | |
Net investment income (d) | | $0.13 | | | $0.29 | | | $0.26 | | | $0.24 | | | $0.22 | | | $0.17 | |
Net realized and
unrealized gain (loss)
on investments and
foreign currency | | (1.21 | ) | | 1.37 | | | 0.68 | | | 1.10 | | | 1.31 | | | 1.43 | |
Total from investment
operations | | $(1.08 | ) | | $1.66 | | | $0.94 | | | $1.34 | | | $1.53 | | | $1.60 | |
Less distributions declared
to shareholders | | | | | | | | | | | | | | | | |
From net investment
income | | $(0.14 | ) | | $(0.33 | ) | | $(0.28 | ) | | $(0.26 | ) | | $(0.23 | ) | | $(0.26 | ) |
From net realized gain
on investments | | (1.31 | ) | | (0.54 | ) | | (0.71 | ) | | (0.39 | ) | | — | | | — | |
Total distributions declared
to shareholders | | $(1.45 | ) | | $(0.87 | ) | | $(0.99 | ) | | $(0.65 | ) | | $(0.23 | ) | | $(0.26 | ) |
Net asset value, end
of period | | $14.32 | | | $16.85 | | | $16.06 | | | $16.11 | | | $15.42 | | | $14.12 | |
| Total return (%) (r)(s)(t) | | (6.86 | )(n) | | 10.61 | | | 6.21 | | | 8.81 | | | 10.91 | (b) | | 12.63 | |
Ratios (%) (to average
net assets) and
Supplemental data: | | | | | | | | | | | | | | | | |
Expenses before expense
reductions (f) | | 1.77 | (a) | | 1.77 | | | 1.80 | | | 1.81 | | | 1.78 | | | 1.80 | |
Expenses after expense
reductions (f) | | 1.77 | (a) | | 1.77 | | | 1.79 | | | 1.81 | | | 1.78 | | | N/A | |
| Net investment income | | 1.70 | (a) | | 1.72 | | | 1.67 | | | 1.52 | | | 1.47 | | | 1.33 | |
| Portfolio turnover | | 31 | | | 45 | | | 48 | | | 50 | | | 65 | | | 71 | |
Net assets at end of period
(000 Omitted) | | $5,441 | | | $5,809 | | | $5,069 | | | $4,477 | | | $2,676 | | | $1,064 | |
See Notes to Financial Statements
39
Financial Highlights – continued
| | | | | | | | | | | | | | | | | | |
| | | Six months
ended
3/31/08 (unaudited) | | | Years ended 9/30 | |
| Class 529C | | | 2007 | | | 2006 | | | 2005 | | | 2004 | | | 2003 | |
| | | | | | | | | | | | | | | | | |
Net asset value, beginning
of period | | $16.92 | | | $16.12 | | | $16.17 | | | $15.48 | | | $14.18 | | | $12.83 | |
Income (loss) from
investment operations | | | | | | | | | | | | | | | | |
Net investment income (d) | | $0.13 | | | $0.29 | | | $0.26 | | | $0.24 | | | $0.22 | | | $0.19 | |
Net realized and
unrealized gain (loss)
on investments and
foreign currency | | (1.21 | ) | | 1.38 | | | 0.68 | | | 1.10 | | | 1.31 | | | 1.42 | |
Total from investment
operations | | $(1.08 | ) | | $1.67 | | | $0.94 | | | $1.34 | | | $1.53 | | | $1.61 | |
Less distributions declared
to shareholders | | | | | | | | | | | | | | | | |
From net investment
income | | $(0.14 | ) | | $(0.33 | ) | | $(0.28 | ) | | $(0.26 | ) | | $(0.23 | ) | | $(0.26 | ) |
From net realized gain
on investments | | (1.31 | ) | | (0.54 | ) | | (0.71 | ) | | (0.39 | ) | | — | | | — | |
Total distributions declared
to shareholders | | $(1.45 | ) | | $(0.87 | ) | | $(0.99 | ) | | $(0.65 | ) | | $(0.23 | ) | | $(0.26 | ) |
Net asset value, end
of period | | $14.39 | | | $16.92 | | | $16.12 | | | $16.17 | | | $15.48 | | | $14.18 | |
| Total return (%) (r)(s)(t) | | (6.83 | )(n) | | 10.63 | | | 6.18 | | | 8.79 | | | 10.87 | (b) | | 12.67 | |
Ratios (%) (to average
net assets) and
Supplemental data: | | | | | | | | | | | | | | | | |
Expenses before expense
reductions (f) | | 1.77 | (a) | | 1.77 | | | 1.80 | | | 1.81 | | | 1.78 | | | 1.80 | |
Expenses after expense
reductions (f) | | 1.77 | (a) | | 1.77 | | | 1.79 | | | 1.81 | | | 1.78 | | | N/A | |
| Net investment income | | 1.70 | (a) | | 1.72 | | | 1.67 | | | 1.53 | | | 1.45 | | | 1.36 | |
| Portfolio turnover | | 31 | | | 45 | | | 48 | | | 50 | | | 65 | | | 71 | |
Net assets at end of period
(000 Omitted) | | $5,124 | | | $5,342 | | | $4,566 | | | $3,890 | | | $2,475 | | | $1,066 | |
See Notes to Financial Statements
40
Financial Highlights – continued
Any redemption fees charged by the fund during the 2004 and 2005 fiscal years resulted in a per share impact of less than $0.01.
| (b) | The fund’s net asset value and total return calculation include a non-recurring accrual recorded as a result of an administrative proceeding regarding disclosure of brokerage allocation practices in connection with fund sales. The non-recurring accrual did not have a material impact on the net asset value per share based on the shares outstanding on the day the proceeds were recorded. |
| (d) | Per share data is based on average shares outstanding. |
| (f) | Ratios do not reflect reductions from fees paid indirectly, if applicable. |
| (i) | For the period from the class’ inception, December 31, 2002 (Class R), October 31, 2003 (Class R3) and April 1, 2005 (Classes R1, R2, R4, and R5) through the stated period end. |
| (r) | Certain expenses have been reduced without which performance would have been lower. |
| (s) | From time to time the fund may receive proceeds from litigation settlements, without which performance would be lower. |
| (t) | Total returns do not include any applicable sales charges. |
See Notes to Financial Statements
41
NOTES TO FINANCIAL STATEMENTS
(unaudited)
| (1) | | Business and Organization |
MFS Total Return Fund (the fund) is a series of MFS Series Trust V (the trust). The trust is organized as a Massachusetts business trust and is registered under the Investment Company Act of 1940, as amended, as an open-end management investment company.
| (2) | | Significant Accounting Policies |
General – The preparation of financial statements in conformity with U.S. generally accepted accounting principles requires management to make estimates and assumptions that affect the reported amounts of assets and liabilities, and disclosure of contingent assets and liabilities at the date of the financial statements and the reported amounts of revenues and expenses during the reporting period. Actual results could differ from those estimates. The fund can invest in foreign securities, including securities of emerging market issuers. Investments in foreign securities are vulnerable to the effects of changes in the relative values of the local currency and the U.S. dollar and to the effects of changes in each country’s legal, political, and economic environment. The markets of emerging markets countries are generally more volatile than the markets of developed countries with more mature economies. All of the risks of investing in foreign securities previously described are heightened when investing in emerging markets countries.
Investment Valuations – Equity securities, including restricted equity securities, are generally valued at the last sale or official closing price as reported by an independent pricing service on the market or exchange on which they are primarily traded. For securities for which there were no sales reported that day, equity securities are generally valued at the last quoted daily bid quotation as reported by an independent pricing service on the market or exchange on which they are primarily traded. For securities held short for which there were no sales reported for the day, the position is generally valued at the last quoted daily ask quotation as reported by an independent pricing service on the market or exchange on which such securities are primarily traded. Debt instruments and floating rate loans (other than short-term instruments), including restricted debt instruments, are generally valued at an evaluated or composite bid as reported by an independent pricing service. Short-term instruments with a maturity at issuance of 60 days or less may be valued at amortized cost, which approximates market value. Open-end investment companies are generally valued at net asset value per share. Securities and other assets generally valued on the basis of information from an independent pricing service may also be valued at a broker-dealer bid quotation. Values obtained from pricing services can utilize both dealer-supplied valuations and electronic data processing techniques, which take
42
Notes to Financial Statements (unaudited) – continued
into account factors such as institutional-size trading in similar groups of securities, yield, quality, coupon rate, maturity, type of issue, trading characteristics, and other market data. The values of foreign securities and other assets and liabilities expressed in foreign currencies are converted to U.S. dollars using the mean of bid and asked prices for rates reported by an independent pricing service.
The Board of Trustees has delegated primary responsibility for determining or causing to be determined the value of the fund’s investments (including any fair valuation) to the adviser pursuant to valuation policies and procedures approved by the Board. If the adviser determines that reliable market quotations are not readily available, investments are valued at fair value as determined in good faith by the adviser in accordance with such procedures under the oversight of the Board of Trustees. Under the fund’s valuation policies and procedures, market quotations are not considered to be readily available for most types of debt instruments and floating rate loans and many types of derivatives. These investments are generally valued at fair value based on information from independent pricing services. In addition, investments may be valued at fair value if the adviser determines that an investment’s value has been materially affected by events occurring after the close of the exchange or market on which the investment is principally traded (such as foreign exchange or market) and prior to the determination of the fund’s net asset value, or after the halting of trading of a specific security where trading does not resume prior to the close of the exchange or market on which the security is principally traded. Events that occur on a frequent basis after foreign markets close (such as developments in foreign markets and significant movements in the U.S. markets) and prior to the determination of the fund’s net asset value may be deemed to have a material affect on the value of securities traded in foreign markets. Accordingly, the fund’s foreign equity securities may often be valued at fair value. The adviser may rely on independent pricing services or other information (such as the correlation with price movements of similar securities in the same or other markets; the type, cost and investment characteristics of the security; the business and financial condition of the issuer; and trading and other market data) to assist in determining whether to fair value and at what value to fair value an investment. The value of an investment for purposes of calculating the fund’s net asset value can differ depending on the source and method used to determine value. When fair valuation is used, the value of investments used to determine the fund’s net asset value may differ from quoted or published prices for the same investments.
In September 2006, FASB Statement No. 157, Fair Value Measurements (the “Statement”) was issued, and is effective for fiscal years beginning after
43
Notes to Financial Statements (unaudited) – continued
November 15, 2007 and for all interim periods within those fiscal years. This Statement provides a single definition of fair value, a hierarchy for measuring fair value and expanded disclosures about fair value measurements. Management is evaluating the application of the Statement to the fund, and believes the impact will be limited to expanded disclosures resulting from the adoption of this Statement in the fund’s financial statements.
Repurchase Agreements – The fund may enter into repurchase agreements with institutions that the fund’s investment adviser has determined are creditworthy. Each repurchase agreement is recorded at cost. The fund requires that the securities collateral in a repurchase transaction be transferred to a custodian in a manner sufficient to enable the fund to obtain those securities in the event of a default under the repurchase agreement. The fund monitors, on a daily basis, the value of the collateral to ensure that its value, including accrued interest, is greater than amounts owed to the fund under each such repurchase agreement.
Foreign Currency Translation – Purchases and sales of foreign investments, income, and expenses are converted into U.S. dollars based upon currency exchange rates prevailing on the respective dates of such transactions. Gains and losses attributable to foreign currency exchange rates on sales of securities are recorded for financial statement purposes as net realized gains and losses on investments. Gains and losses attributable to foreign exchange rate movements on income and expenses are recorded for financial statement purposes as foreign currency transaction gains and losses. That portion of both realized and unrealized gains and losses on investments that results from fluctuations in foreign currency exchange rates is not separately disclosed.
In March 2008, FASB Statement No. 161, Disclosures about Derivative Instruments and Hedging Activities (the “Standard”) was issued, and is effective for financial statements issued for fiscal years and interim periods beginning after November 15, 2008. This Standard provides enhanced disclosures about the fund’s use of and accounting for derivative instruments and the effect of derivative instruments on the fund’s results of operations and financial position. Management is evaluating the application of the Standard to the fund, and has not at this time determined the impact, if any, resulting from the adoption of this Standard on the fund’s financial statements.
Security Loans – JPMorgan Chase and Co. (“Chase”), as lending agent, may loan the securities of the fund to certain qualified institutions (the “Borrowers”) approved by the fund. The loans are collateralized at all times by cash and/or U.S. Treasury and federal agency obligations in an amount at least equal to the market value of the securities loaned. Security lending activity through Chase is further collateralized by an irrevocable standby letter of credit. Chase provides the fund with indemnification against Borrower default.
44
Notes to Financial Statements (unaudited) – continued
The fund bears the risk of loss with respect to the investment of cash collateral. On loans collateralized by cash, the cash collateral is invested in a money market fund or short-term securities. A portion of the income generated upon investment of the collateral is remitted to the Borrowers, and the remainder is allocated between the fund and the lending agent. On loans collateralized by U.S. Treasury and/or federal agency obligations, a fee is received from the Borrower, and is allocated between the fund and the lending agent. Net income from securities lending is included in interest income on the Statement of Operations. The dividend and interest income earned on the securities loaned is accounted for in the same manner as other dividend and interest income.
At March 31, 2008, the value of securities loaned was $679,705,448. These loans were collateralized by cash of $681,727,811 and U.S. Treasury obligations of $11,965,940.
Indemnifications – Under the fund’s organizational documents, its officers and trustees may be indemnified against certain liabilities and expenses arising out of the performance of their duties to the fund. Additionally, in the normal course of business, the fund enters into agreements with service providers that may contain indemnification clauses. The fund’s maximum exposure under these agreements is unknown as this would involve future claims that may be made against the fund that have not yet occurred.
Investment Transactions and Income – Investment transactions are recorded on the trade date. Interest income is recorded on the accrual basis. All premium and discount is amortized or accreted for financial statement purposes in accordance with U.S. generally accepted accounting principles. Dividends received in cash are recorded on the ex-dividend date. Certain dividends from foreign securities will be recorded when the fund is informed of the dividend if such information is obtained subsequent to the ex-dividend date. Dividend and interest payments received in additional securities are recorded on the ex-dividend or ex-interest date in an amount equal to the value of the security on such date.
The fund may receive proceeds from litigation settlements. Any proceeds received from litigation involving portfolio holdings are reflected in the Statement of Operations in realized gain/loss if the security has been disposed of by the fund or in unrealized gain/loss if the security is still held by the fund. Any other proceeds from litigation not related to portfolio holdings are reflected as other income in the Statement of Operations.
The fund may enter into “TBA” (to be announced) purchase commitments to purchase securities for a fixed unit price at a future date. Although the unit price has been established, the principal value has not been finalized. However, the principal amount of the commitments will not fluctuate more than 0.01%.
45
Notes to Financial Statements (unaudited) – continued
The fund holds, and maintains until settlement date, cash or high-grade debt obligations in an amount sufficient to meet the purchase price, or the fund may enter into offsetting contracts for the forward sale of other securities it owns. Income on the securities will not be earned until settlement date. TBA purchase commitments may be considered securities in themselves, and involve a risk of loss if the value of the security to be purchased declines prior to settlement date, which is in addition to the risk of decline in the value of the fund’s other assets. Unsettled TBA purchase commitments are valued at the current market value of the underlying securities.
The fund may enter into “TBA” (to be announced) sale commitments to hedge its portfolio positions or to sell mortgage-backed securities it owns under delayed delivery arrangements. Proceeds of TBA sale commitments are not received until the contractual settlement date. During the time a TBA sale commitment is outstanding, equivalent deliverable securities, or an offsetting TBA purchase commitment deliverable on or before the sale commitment date, are held as “cover” for the transaction.
Fees Paid Indirectly – The fund’s custody fee may be reduced according to an arrangement that measures the value of cash deposited with the custodian by the fund. This amount, for the six months ended March 31, 2008, is shown as a reduction of total expenses on the Statement of Operations.
Tax Matters and Distributions – The fund intends to qualify as a regulated investment company, as defined under Subchapter M of the Internal Revenue Code, and to distribute all of its taxable income, including realized capital gains. As a result, no provision for federal income tax is required. The fund adopted the provisions of FASB Interpretation No. 48, Accounting for Uncertainty in Income Taxes (“the Interpretation”) on the first day of the fund’s fiscal year. The Interpretation prescribes a minimum threshold for financial statement recognition of the benefit of a tax position taken or expected to be taken in a tax return. There was no impact resulting from the adoption of this Interpretation on the fund’s financial statements. Each of the fund’s federal tax returns for the prior three fiscal years remains subject to examination by the Internal Revenue Service. It is the fund’s policy to record interest and penalty charges on underpaid taxes associated with its tax positions as interest expense and miscellaneous expense, respectively. No such charges were recorded in the current financial statements. Foreign taxes, if any, have been accrued by the fund in the accompanying financial statements.
Distributions to shareholders are recorded on the ex-dividend date. Income and capital gain distributions are determined in accordance with income tax regulations, which may differ from U.S. generally accepted accounting principles. Certain capital accounts in the financial statements are periodically adjusted for permanent differences in order to reflect their tax character. These
46
Notes to Financial Statements (unaudited) – continued
adjustments have no impact on net assets or net asset value per share. Temporary differences which arise from recognizing certain items of income, expense, gain or loss in different periods for financial statement and tax purposes will reverse at some time in the future. Distributions in excess of net investment income or net realized gains are temporary overdistributions for financial statement purposes resulting from differences in the recognition or classification of income or distributions for financial statement and tax purposes.
Book/tax differences primarily relate to amortization and accretion of debt securities, wash sale loss deferrals, and treating a portion of the proceeds from redemptions as a distribution for tax purposes.
The tax character of distributions made during the current period will be determined at fiscal year end. The tax character of distributions declared to shareholders is as follows:
| | |
| | | 9/30/07 |
| Ordinary income (including any short-term capital gains) | | $315,535,306 |
| Long-term capital gain | | 366,710,067 |
| Total distributions | | $682,245,373 |
The federal tax cost and the tax basis components of distributable earnings were as follows:
| | | |
| As of 3/31/08 | | | |
| Cost of investments | | $9,891,751,329 | |
| Gross appreciation | | 796,327,953 | |
| Gross depreciation | | (532,035,439 | ) |
| Net unrealized appreciation (depreciation) | | $264,292,514 | |
| |
| As of 9/30/07 | | | |
| Undistributed ordinary income | | 118,109,661 | |
| Undistributed long-term capital gain | | 664,740,465 | |
| Other temporary differences | | (22,489,165 | ) |
| Net unrealized appreciation (depreciation) | | 1,156,346,616 | |
Multiple Classes of Shares of Beneficial Interest – The fund offers multiple classes of shares, which differ in their respective distribution and service fees. All shareholders bear the common expenses of the fund based on daily net assets of each class, without distinction between share classes. Dividends are declared separately for each class. Differences in per share dividend rates are generally due to differences in separate class expenses. Class B and Class 529B shares will convert to Class A and Class 529A shares, respectively, approximately eight years after purchase.
47
Notes to Financial Statements (unaudited) – continued
| (3) | | Transactions with Affiliates |
Investment Adviser – The fund has an investment advisory agreement with Massachusetts Financial Services Company (MFS) to provide overall investment management and related administrative services and facilities to the fund.
The management fee is computed daily and paid monthly at the following annual rates:
| | | |
| First $6.3 billion of average daily net assets | | 0.35 | % |
| Average daily net assets in excess of $6.3 billion | | 0.34 | % |
The management fee incurred for the six months ended March 31, 2008 was equivalent to an annual effective rate of 0.35% of the fund’s average daily net assets.
Effective December 1, 2007, if at the end of any month, the fund’s fiscal year-to-date average daily net assets exceed $11.5 billion and the total expenses for Class A exceed 0.87% of fiscal year-to-date average daily net assets, MFS has agreed in writing to reimburse Class A expenses such that Class A total expenses for the fund year-to-date are no greater than 0.87% of fiscal year-to-date average daily net assets, and to reduce the total expenses of the other share classes by the same percentage. If at the end of any month, the fund’s fiscal year-to-date average daily net assets exceed $12.5 billion and the total expenses for Class A exceed 0.85% of fiscal year-to-date average daily net assets, MFS has agreed in writing to reimburse Class A expenses such that Class A total expenses for the fund year-to-date are no greater than 0.85% of fiscal year-to-date average daily net assets, and to reduce the total expenses of the other share classes by the same percentage. This written agreement excludes certain other fees and expenses, and will continue until at least November 30, 2012.
Distributor – MFS Fund Distributors, Inc. (MFD), a wholly-owned subsidiary of MFS, as distributor, received $338,286 and $3,689 for the six months ended March 31, 2008, as its portion of the initial sales charge on sales of Class A and Class 529A shares of the fund, respectively.
The Board of Trustees has adopted a distribution plan for certain class shares pursuant to Rule 12b-1 of the Investment Company Act of 1940.
The fund’s distribution plan provides that the fund will pay MFD for services provided by MFD and financial intermediaries in connection with the distribution and servicing of certain share classes. One component of the plan is a distribution fee paid to MFD and another component of the plan is a service fee paid to MFD. MFD may subsequently pay all, or a portion, of the distribution and/or service fees to financial intermediaries.
48
Notes to Financial Statements (unaudited) – continued
Distribution Plan Fee Table:
| | | | | | | | | | |
| | | Distribution
Fee Rate | | Service
Fee Rate | | Total
Distribution
Plan (d) | | Annual
Effective
Rate (e) | | Distribution
and Service
Fee |
| Class A | | 0.10% | | 0.25% | | 0.35% | | 0.35% | | $11,435,888 |
| Class B | | 0.75% | | 0.25% | | 1.00% | | 1.00% | | 8,231,153 |
| Class C | | 0.75% | | 0.25% | | 1.00% | | 1.00% | | 6,610,036 |
| Class R | | 0.25% | | 0.25% | | 0.50% | | 0.50% | | 148,310 |
| Class R1 | | 0.75% | | 0.25% | | 1.00% | | 0.79% | | 87,444 |
| Class R2 | | 0.25% | | 0.25% | | 0.50% | | 0.50% | | 49,342 |
| Class R3 | | 0.25% | | 0.25% | | 0.50% | | 0.50% | | 290,900 |
| Class R4 | | — | | 0.25% | | 0.25% | | 0.25% | | 169,759 |
| Class 529A | | 0.25% | | 0.25% | | 0.50% | | 0.35% | | 25,310 |
| Class 529B | | 0.75% | | 0.25% | | 1.00% | | 1.00% | | 28,681 |
| Class 529C | | 0.75% | | 0.25% | | 1.00% | | 1.00% | | 26,171 |
| Total Distribution and Service Fees | | | | | | | | $27,102,994 |
| (d) | In accordance with the distribution plan for certain classes, the fund pays distribution and/or service fees up to these annual percentage rates of each class’ average daily net assets. |
| (e) | The annual effective rates represent actual fees incurred under the distribution plan for the six months ended March 31, 2008 based on each class’ average daily net assets. Assets attributable to Class A shares sold prior to October 1, 1989 are subject to a service fee of 0.15% annually. 0.10% of the Class 529A distribution fee is currently being paid by the fund. Payment of the remaining 0.15% of the Class 529A distribution fee is not yet in effect and will be implemented on such date as the fund’s Board of Trustees may determine. Effective March 1, 2008, the distribution fee rate for Class R1 shares increased from 0.50% to 0.75%. |
Certain Class A, Class C and Class 529C shares are subject to a contingent deferred sales charge in the event of a shareholder redemption within 12 months of purchase. Class B and Class 529B shares are subject to a contingent deferred sales charge in the event of a shareholder redemption within six years of purchase. All contingent deferred sales charges are paid to MFD and during the six months ended March 31, 2008, were as follows:
| | |
| | | Amount |
| Class A | | $9,921 |
| Class B | | $981,350 |
| Class C | | $47,536 |
| Class 529B | | $1,538 |
| Class 529C | | $19 |
The fund has entered into and may from time to time enter into contracts with program managers and other parties which administer the tuition programs through which an investment in the fund’s 529 share classes is made. The fund has entered into an agreement with MFD pursuant to which MFD receives an annual fee of up to 0.35% of the average daily net assets attributable to each 529 share class. The fee is based on average daily net assets and is currently established at 0.25% annually of average daily net assets of the fund’s 529
49
Notes to Financial Statements (unaudited) – continued
share classes. Effective April 1, 2008, the fee will be 0.10%. The fee may only be increased with the approval of the Board of Trustees who oversees the fund. The services provided by MFD, or a third party with which MFD contracts, include recordkeeping and tax reporting and account services, as well as services designed to maintain the program’s compliance with the Internal Revenue Code and other regulatory requirements. Program manager fees for the six months ended March 31, 2008, were as follows:
| | |
| | | Amount |
| Class 529A | | $18,079 |
| Class 529B | | 7,176 |
| Class 529C | | 6,548 |
| Total Program Manager Fees | | $31,803 |
Shareholder Servicing Agent – MFS Service Center, Inc. (MFSC), a wholly-owned subsidiary of MFS, receives a fee from the fund for its services as shareholder servicing agent calculated as a percentage of the average daily net assets of the fund as determined periodically under the supervision of the fund’s Board of Trustees. For the six months ended March 31, 2008, the fee was $2,058,131, which equated to 0.0399% annually of the fund’s average daily net assets. MFSC also receives payment from the fund for out-of-pocket expenses, sub-accounting and other shareholder servicing costs which may be paid to affiliated and unaffiliated service providers. For the six months ended March 31, 2008, these out-of-pocket expenses, sub-accounting and other shareholder servicing costs amounted to $5,269,654.
Administrator – MFS provides certain financial, legal, shareholder communications, compliance, and other administrative services to the fund. Under an administrative services agreement, the fund partially reimburses MFS the costs incurred to provide these services. The fund is charged a fixed amount plus a fee based on average daily net assets. The fund’s annual fixed amount is $17,500.
The administrative services fee incurred for the six months ended March 31, 2008 was equivalent to an annual effective rate of 0.0084% of the fund’s average daily net assets.
In addition to the administrative services provided by MFS to the fund as described above, MFS is responsible for providing certain retirement plan administration and services with respect to certain shares. These services include various administrative, recordkeeping, and communication/educational services with respect to the retirement plans which invest in these shares, and may be provided directly by MFS or by a third party. MFS may subsequently pay all, or a portion, of the retirement plan administration and services fee to affiliated or unaffiliated third parties. For the six months ended March 31, 2008, the fund paid MFS an annual retirement plan administration and
50
Notes to Financial Statements (unaudited) – continued
services fee up to the following annual percentage rates of each class’ average daily net assets:
| | | | | | | | | | |
| | | Beginning
of period
through
12/31/07 | | Effective
1/01/08 | | Effective
3/01/08 | | Annual
Effective
Rate (g) | | Total
Amount |
Class R1 | | 0.35% | | 0.35% | | — | | 0.29% | | $31,964 |
Class R2 | | 0.25% | | — | | — | | 0.11% | | 10,830 |
Class R3 | | 0.15% | | — | | — | | 0.08% | | 43,550 |
Class R4 | | 0.15% | | — | | — | | 0.08% | | 52,262 |
Class R5 | | 0.10% | | — | | — | | 0.05% | | 51,738 |
| Total Retirement Plan Administration and Services Fees | | | | | | $190,344 |
| (g) | Effective January 1, 2008, the annual retirement plan administration and services fee was eliminated for Class R2, Class R3, Class R4, and Class R5 shares. Effective March 1, 2008, the annual retirement plan administration and services fee was eliminated for Class R1 shares. |
Trustees’ and Officers’ Compensation – The fund pays compensation to independent trustees in the form of a retainer, attendance fees, and additional compensation to Board and Committee chairpersons. The fund does not pay compensation directly to trustees or officers of the fund who are also officers of the investment adviser, all of whom receive remuneration for their services to the fund from MFS. Certain officers and trustees of the fund are officers or directors of MFS, MFD, and MFSC.
The fund has an unfunded, defined benefit plan for certain retired independent trustees which resulted in a pension expense of $5,979. The fund also has an unfunded retirement benefit deferral plan for certain independent trustees which resulted in a decrease in expense of $16,694. Both amounts are included in independent trustees’ compensation for the six months ended March 31, 2008. The liability for deferred retirement benefits payable to certain independent trustees under both plans amounted to $220,861 at March 31, 2008, and is included in payable for independent trustees’ compensation.
Deferred Trustee Compensation – Under a Deferred Compensation Plan (the Plan) independent trustees previously were allowed to elect to defer receipt of all or a portion of their annual compensation. Trustees are no longer allowed to defer compensation under the Plan. Amounts previously deferred are treated as though equivalent dollar amounts had been invested in shares of certain MFS funds selected by the trustee. Deferred amounts represent an unsecured obligation of the fund until distributed in accordance with the Plan. Included in other assets and payable for independent trustees’ compensation is $67,948 of deferred trustees’ compensation.
Other – This fund and certain other MFS funds (the funds) have entered into a services agreement (the Agreement) which provides for payment of fees by the funds to Tarantino LLC in return for the provision of services of an
51
Notes to Financial Statements (unaudited) – continued
Independent Chief Compliance Officer (ICCO) for the funds. The ICCO is an officer of the funds and the sole member of Tarantino LLC. The funds can terminate the Agreement with Tarantino LLC at any time under the terms of the Agreement. For the six months ended March 31, 2008, the fee paid by the fund to Tarantino LLC was $42,280 and is included in miscellaneous expense on the Statement of Operations. MFS has agreed to reimburse the fund for a portion of the payments made by the fund to Tarantino LLC in the amount of $23,685, which is shown as a reduction of total expenses in the Statement of Operations. Additionally, MFS has agreed to bear all expenses associated with office space, other administrative support, and supplies provided to the ICCO.
The fund may invest in a money market fund managed by MFS which seeks preservation of capital and current income. Income earned on this investment is included in dividends from underlying funds on the Statement of Operations. This money market fund does not pay a management fee to MFS.
Purchases and sales of investments, other than purchased option transactions and short-term obligations, were as follows:
| | | | |
| | | Purchases | | Sales |
| U.S. government securities | | $571,822,086 | | $739,317,753 |
| Investments (non-U.S. government securities) | | $2,616,034,164 | | $3,254,008,365 |
| (5) | | Shares of Beneficial Interest |
The fund’s Declaration of Trust permits the Trustees to issue an unlimited number of full and fractional shares of beneficial interest. Transactions in fund shares were as follows:
| | | | | | | | |
| | | Six months ended
3/31/08 | | Year ended
9/30/07 |
| | | Shares | | Amount | | Shares | | Amount |
| Shares sold | | | | | | | | |
Class A | | 42,127,536 | | $664,675,532 | | 86,263,688 | | $1,433,883,288 |
Class B | | 3,014,432 | | 46,090,678 | | 8,515,279 | | 140,721,374 |
Class C | | 6,133,354 | | 95,007,349 | | 11,737,855 | | 194,910,951 |
Class I | | 3,284,372 | | 52,484,560 | | 15,269,729 | | 256,297,529 |
Class R | | 1,547,194 | | 24,367,687 | | 2,039,715 | | 33,806,288 |
Class R1 | | 774,121 | | 12,410,902 | | 1,203,427 | | 19,848,904 |
Class R2 | | 801,548 | | 12,671,285 | | 816,608 | | 13,582,257 |
Class R3 | | 2,591,346 | | 41,319,248 | | 6,117,557 | | 101,296,544 |
Class R4 | | 2,214,500 | | 34,650,705 | | 9,572,458 | | 158,183,889 |
Class R5 | | 7,790,826 | | 128,113,113 | | 15,039,684 | | 250,153,442 |
Class 529A | | 84,648 | | 1,310,438 | | 139,066 | | 2,296,785 |
Class 529B | | 28,187 | | 445,116 | | 41,020 | | 677,646 |
Class 529C | | 29,003 | | 438,773 | | 58,367 | | 968,741 |
| | 70,421,067 | | $1,113,985,386 | | 156,814,453 | | $2,606,627,638 |
52
Notes to Financial Statements (unaudited) – continued
| | | | | | | | | | | | |
| | | Six months ended
3/31/08 | | | Year ended
9/30/07 | |
| | | Shares | | | Amount | | | Shares | | | Amount | |
| Shares issued to shareholders in reinvestment of distributions | | | | | | | | | | |
Class A | | 36,767,175 | | | $564,866,849 | | | 23,902,513 | | | $389,846,161 | |
Class B | | 8,797,871 | | | 134,957,931 | | | 6,319,859 | | | 102,824,282 | |
Class C | | 5,898,641 | | | 90,880,441 | | | 3,644,503 | | | 59,563,268 | |
Class I | | 1,603,998 | | | 24,639,703 | | | 962,788 | | | 15,718,051 | |
Class R | | 177,830 | | | 2,737,822 | | | 291,619 | | | 4,754,437 | |
Class R1 | | 128,244 | | | 1,964,279 | | | 22,142 | | | 361,342 | |
Class R2 | | 103,139 | | | 1,577,800 | | | 17,585 | | | 287,032 | |
Class R3 | | 684,017 | | | 10,518,921 | | | 209,831 | | | 3,434,477 | |
Class R4 | | 824,916 | | | 12,668,550 | | | 272,680 | | | 4,463,164 | |
Class R5 | | 1,107,520 | | | 17,027,842 | | | 181,706 | | | 3,011,149 | |
Class 529A | | 87,305 | | | 1,337,133 | | | 46,591 | | | 758,634 | |
Class 529B | | 34,306 | | | 525,897 | | | 16,728 | | | 272,340 | |
Class 529C | | 30,299 | | | 466,587 | | | 15,405 | | | 251,788 | |
| | 56,245,261 | | | $864,169,755 | | | 35,903,950 | | | $585,546,125 | |
| Shares reacquired | | | | | | | | | | | | |
Class A | | (76,988,151 | ) | | $(1,202,800,609 | ) | | (139,473,185 | ) | | $(2,314,225,423 | ) |
Class B | | (20,117,326 | ) | | (311,628,933 | ) | | (45,264,715 | ) | | (749,759,119 | ) |
Class C | | (12,421,095 | ) | | (191,786,392 | ) | | (23,527,988 | ) | | (390,496,718 | ) |
Class I | | (3,557,838 | ) | | (57,129,016 | ) | | (15,361,339 | ) | | (258,740,387 | ) |
Class R | | (2,380,866 | ) | | (38,099,956 | ) | | (4,312,185 | ) | | (71,737,080 | ) |
Class R1 | | (336,404 | ) | | (5,209,907 | ) | | (549,420 | ) | | (9,045,013 | ) |
Class R2 | | (155,456 | ) | | (2,314,075 | ) | | (346,936 | ) | | (5,704,261 | ) |
Class R3 | | (1,267,534 | ) | | (19,676,143 | ) | | (3,467,622 | ) | | (57,168,431 | ) |
Class R4 | | (1,870,205 | ) | | (28,751,288 | ) | | (5,522,914 | ) | | (91,474,828 | ) |
Class R5 | | (7,409,872 | ) | | (121,959,570 | ) | | (3,842,026 | ) | | (65,201,035 | ) |
Class 529A | | (65,937 | ) | | (1,025,462 | ) | | (79,577 | ) | | (1,317,514 | ) |
Class 529B | | (27,201 | ) | | (404,449 | ) | | (28,676 | ) | | (471,626 | ) |
Class 529C | | (18,802 | ) | | (286,664 | ) | | (41,247 | ) | | (684,657 | ) |
| | (126,616,687 | ) | | $(1,981,072,464 | ) | | (241,817,830 | ) | | $(4,016,026,092 | ) |
| Net change | | | | | | | | | | | | |
Class A | | 1,906,560 | | | $26,741,772 | | | (29,306,984 | ) | | $(490,495,974 | ) |
Class B | | (8,305,023 | ) | | (130,580,324 | ) | | (30,429,577 | ) | | (506,213,463 | ) |
Class C | | (389,100 | ) | | (5,898,602 | ) | | (8,145,630 | ) | | (136,022,499 | ) |
Class I | | 1,330,532 | | | 19,995,247 | | | 871,178 | | | 13,275,193 | |
Class R | | (655,842 | ) | | (10,994,447 | ) | | (1,980,851 | ) | | (33,176,355 | ) |
Class R1 | | 565,961 | | | 9,165,274 | | | 676,149 | | | 11,165,233 | |
Class R2 | | 749,231 | | | 11,935,010 | | | 487,257 | | | 8,165,028 | |
Class R3 | | 2,007,829 | | | 32,162,026 | | | 2,859,766 | | | 47,562,590 | |
Class R4 | | 1,169,211 | | | 18,567,967 | | | 4,322,224 | | | 71,172,225 | |
Class R5 | | 1,488,474 | | | 23,181,385 | | | 11,379,364 | | | 187,963,556 | |
Class 529A | | 106,016 | | | 1,622,109 | | | 106,080 | | | 1,737,905 | |
Class 529B | | 35,292 | | | 566,564 | | | 29,072 | | | 478,360 | |
Class 529C | | 40,500 | | | 618,696 | | | 32,525 | | | 535,872 | |
| | 49,641 | | | $(2,917,323 | ) | | (49,099,427 | ) | | $(823,852,329 | ) |
53
Notes to Financial Statements (unaudited) – continued
The fund and other funds managed by MFS participate in a $1 billion unsecured committed line of credit provided by a syndication of banks under a credit agreement. In addition, the fund and other funds managed by MFS have established uncommitted borrowing arrangements with certain banks. Borrowings may be made for temporary financing needs. Interest is charged to each fund, based on its borrowings, generally at a rate equal to the Federal Reserve funds rate plus 0.30%. In addition, a commitment fee, based on the average daily, unused portion of the committed line of credit, is allocated among the participating funds at the end of each calendar quarter. For the six months ended March 31, 2008, the fund’s commitment fee and interest expense were $23,076 and $0, respectively, and are included in miscellaneous expense on the Statement of Operations.
The fund’s investment adviser, MFS, was the subject of an administrative proceeding concerning market timing which resulted in the Securities and Exchange Commission (the “SEC”) entering an order approving a settlement with MFS and two of its former officers (the “Settlement Order”). Under the terms of the Settlement Order, MFS transferred $175 million in disgorgement and $50 million in penalty (the “Payments”) to a Fair Fund established by the SEC, from which settlement funds will be distributed to current and former shareholders of the fund and certain other affected MFS retail funds. The Payments will be distributed to shareholders in accordance with a plan developed by an independent distribution consultant (the “IDC”) in consultation with MFS and the Board of Trustees of the MFS retail funds. The plan was approved in July 2007 by the SEC. Pursuant to the distribution plan, after the distributions to eligible shareholders have been made, residual amounts, if any, may be available for distribution to the fund and certain other affected MFS retail funds. Payments made by third parties into other settlement funds to remediate harm caused by the third party’s late or excessive trading in certain MFS funds may also become part of the residual amounts. At this time, the residual amounts, if any, cannot be reasonably estimated and the fund has not accrued an estimate for any amounts to be received.
54
Notes to Financial Statements (unaudited) – continued
| (8) | | Transactions in Underlying Funds-Affiliated Issuers |
An affiliated issuer may be considered one in which the fund owns 5% or more of the outstanding voting securities, or a company which is under common control. For the purposes of this report, the fund assumes the following to be affiliated issuers:
| | | | | | | | | |
| Underlying Fund: | | Beginning
Shares/Par
Amount | | Acquisitions
Shares/Par
Amount | | Dispositions
Shares/Par
Amount | | | Ending
Shares/Par
Amount |
MFS Institutional Money
Market Portfolio | | 147,711,471 | | 1,382,641,596 | | (1,385,138,891 | ) | | 145,214,176 |
| | | | |
| Underlying Fund: | | Realized
Gain (Loss) | | Capital Gain
Distributions from
Underlying Funds | | Dividend
Income | | | Ending Value |
MFS Institutional Money
Market Portfolio | | $— | | $— | | $1,995,188 | | | $145,214,176 |
On April 18, 2008, Class R shares and Class R2 shares converted into Class R3 shares. After the conversion, Class R3, Class R4, and Class R5 were renamed Class R2, Class R3, and Class R4, respectively.
55
RESULTS OF SHAREHOLDER MEETING
(unaudited)
At a special meeting of shareholders of Class R1 shares of the MFS Total Return Fund, which was held on February 15, 2008, the following actions were taken:
Item 1: To approve an amendment to the current Master Distribution Plan adopted pursuant to Rule 12b-1 under the Investment Company Act of 1940, as amended, with respect to Class R1 shares of the Fund.
| | |
| | | Number of Dollars |
For | | 11,439,874.59 |
| Against | | 71.88 |
| Abstain | | 3,369,698.11 |
56
BOARD REVIEW OF INVESTMENT ADVISORY AGREEMENT
A discussion regarding the Board’s most recent review and renewal of the Fund’s investment advisory agreement is available by clicking on the fund’s name under “Select a fund” on the MFS Web site (mfs.com).
PROXY VOTING POLICIES AND INFORMATION
A general description of the MFS funds’ proxy voting policies and procedures is available without charge, upon request, by calling 1-800-225-2606, by visiting the Proxy Voting section of mfs.com or by visiting the SEC’s Web site at http://www.sec.gov.
Information regarding how the fund voted proxies relating to portfolio securities during the most recent twelve-month period ended June 30 is available without charge by visiting the Proxy Voting section of mfs.com or by visiting the SEC’s Web site at http://www.sec.gov.
QUARTERLY PORTFOLIO DISCLOSURE
The fund will file a complete schedule of portfolio holdings with the Securities and Exchange Commission (the Commission) for the first and third quarters of each fiscal year on Form N-Q. The fund’s Form N-Q may be reviewed and copied at the:
Public Reference Room
Securities and Exchange Commission
100 F Street, NE, Room 1580
Washington, D.C. 20549
Information on the operation of the Public Reference Room may be obtained by calling the Commission at 1-800-SEC-0330. The fund’s Form N-Q is available on the EDGAR database on the Commission’s Internet Web site at http://www.sec.gov, and copies of this information may be obtained, upon payment of a duplicating fee, by electronic request at the following e-mail address: publicinfo@sec.gov or by writing the Public Reference Section at the above address.
A shareholder can also obtain the quarterly portfolio holdings report at mfs.com.
57

The Registrant has not amended any provision in its Code of Ethics (the “Code”) that relates to any element of the Code’s definition enumerated in paragraph (b) of Item 2 of this Form N-CSR.
| ITEM 3. | AUDIT COMMITTEE FINANCIAL EXPERT. |
Not applicable for semi-annual reports.
| ITEM 4. | PRINCIPAL ACCOUNTANT FEES AND SERVICES. |
Not applicable for semi-annual reports.
| ITEM 5. | AUDIT COMMITTEE OF LISTED REGISTRANTS. |
Not applicable to the Registrant.
| ITEM 6. | SCHEDULE OF INVESTMENTS |
A schedule of investments for each series of the Registrant is included as part of the report to shareholders of such series under Item 1 of this Form N-CSR.
| ITEM 7. | DISCLOSURE OF PROXY VOTING POLICIES AND PROCEDURES FOR CLOSED-END MANAGEMENT INVESTMENT COMPANIES. |
Not applicable to the Registrant.
| ITEM 8. | PORTFOLIO MANAGERS OF CLOSED-END MANAGEMENT INVESTMENT COMPANIES. |
Not applicable to the Registrant.
| ITEM 9. | PURCHASES OF EQUITY SECURITIES BY CLOSED-END MANAGEMENT INVESTMENT COMPANY AND AFFILIATED PURCHASERS. |
Not applicable to the Registrant.
| ITEM 10. | SUBMISSION OF MATTERS TO A VOTE OF SECURITY HOLDERS. |
There were no material changes to the procedures by which shareholders may send recommendations to the Board for nominees to the Registrant’s Board since the Registrant last provided disclosure as to such procedures in response to the requirements of Item 407 (c)(2)(iv) of Regulation S-K or this Item.
| ITEM 11. | CONTROLS AND PROCEDURES. |
| (a) | Based upon their evaluation of the effectiveness of the registrant’s disclosure controls and procedures (as defined in Rule 30a-3(c) under the Investment Company Act of 1940 (the “Act”)) as conducted within 90 days of the filing date of this report on Form N-CSR, the registrant’s principal financial officer and principal executive officer have concluded that those disclosure controls and procedures provide reasonable assurance that the material information required to be disclosed by the registrant on this report is recorded, processed, summarized and reported within the time periods specified in the Securities and Exchange Commission’s rules and forms. |
| (b) | There were no changes in the registrant’s internal controls over financial reporting (as defined in Rule 30a-3(d) under the Act) that occurred during the second fiscal quarter of the period covered by the report that have materially affected, or are reasonably likely to materially affect, the registrant’s internal control over financial reporting. |
| (a) | File the exhibits listed below as part of this form. Letter or number the exhibits in the sequence indicated. |
| | (1) | Any code of ethics, or amendment thereto, that is the subject of the disclosure required by Item 2, to the extent that the registrant intends to satisfy the Item 2 requirements through filing of an exhibit. |
| | (2) | A separate certification for each principal executive officer and principal financial officer of the registrant as required by Rule 30a-2 under the Act (17 CFR 270.30a-2): Attached hereto. |
| (b) | If the report is filed under Section 13(a) or 15(d) of the Exchange Act, provide the certifications required by Rule 30a-2(b) under the Act (17 CFR 270.30a-2(b)), Rule 13a-14(b) or Rule 15d-14(b) under the Exchange Act (17 CFR 240.13a-14(b) or 240.15d-14(b)) and Section 1350 of Chapter 63 of Title 18 of the United States Code (18 U.S.C. 1350) as an exhibit. A certification furnished pursuant to this paragraph will not be deemed “filed” for the purposes of Section 18 of the Exchange Act (15 U.S.C. 78r), or otherwise subject to the liability of that section. Such certification will not be deemed to be incorporated by reference into any filing under the Securities Act of 1933 or the Exchange Act, except to the extent that the registrant specifically incorporates it by reference: Attached hereto. |
Notice
A copy of the Amended and Restated Declaration of Trust, as amended, of the Registrant is on file with the Secretary of State of The Commonwealth of Massachusetts and notice is hereby given that this instrument is executed on behalf of the Registrant by an officer of the Registrant as an officer and not individually and the obligations of or arising out of this instrument are not binding upon any of the Trustees or shareholders individually, but are binding only upon the assets and property of the respective constituent series of the Registrant.
SIGNATURES
Pursuant to the requirements of the Securities Exchange Act of 1934 and the Investment Company Act of 1940, the registrant has duly caused this report to be signed on its behalf by the undersigned, thereunto duly authorized.
| | |
| (Registrant) MFS SERIES TRUST V |
| | |
| |
| By (Signature and Title)* | | ROBERT J. MANNING |
| | Robert J. Manning, President |
Date: May 15, 2008
Pursuant to the requirements of the Securities Exchange Act of 1934 and the Investment Company Act of 1940, this report has been signed below by the following persons on behalf of the registrant and in the capacities and on the dates indicated.
| | |
| By (Signature and Title)* | | ROBERT J. MANNING |
| | Robert J. Manning, President (Principal Executive��Officer) |
Date: May 15, 2008
| | |
| By (Signature and Title)* | | MARIA F. DWYER |
| | Maria F. Dwyer, Treasurer (Principal Financial Officer and Accounting Officer) |
Date: May 15, 2008
| * | Print name and title of each signing officer under his or her signature. |