UNITED STATES
SECURITIES AND EXCHANGE COMMISSION
Washington, D.C. 20549
FORM N-CSR
CERTIFIED SHAREHOLDER REPORT OF
REGISTERED MANAGEMENT INVESTMENT COMPANIES
Investment Company Act file number 811-2031
MFS SERIES TRUST V
(Exact name of registrant as specified in charter)
500 Boylston Street, Boston, Massachusetts 02116
(Address of principal executive offices) (Zip code)
Susan S. Newton
Massachusetts Financial Services Company
500 Boylston Street
Boston, Massachusetts 02116
(Name and address of agents for service)
Registrant’s telephone number, including area code: (617) 954-5000
Date of fiscal year end: September 30
Date of reporting period: March 31, 2009
| ITEM 1. | REPORTS TO STOCKHOLDERS. |

MFS® International New Discovery Fund
The report is prepared for the general information of shareholders. It is authorized for distribution to prospective investors only when preceded or accompanied by a current prospectus.
NOT FDIC INSURED Ÿ MAY LOSE VALUE Ÿ
NO BANK GUARANTEE
3/31/09
MIO-SEM

LETTER FROM THE CEO
Dear Shareholders:
The market downturns and economic setbacks of late probably rank among the worst financial declines most of us have experienced. Inevitably, people may be questioning their commitment to investing. Still, it is important to remember that downturns are an inescapable part of the business cycle. Such troughs have been seen before, and if we can use history as a guide, market recoveries typically have followed.
Recent events have clearly shown us the value of certain types of investments. In this environment, two of the hallmarks of mutual funds — transparency and liquidity — have become critically important. Unlike some other types of investments, the operations of mutual funds are relatively transparent to their shareholders. With their daily redemption feature, mutual funds also generally provide easy, convenient access to one’s money. Through these recent market upheavals, this level of liquidity enhanced the ability of mutual fund investors to respond and modify their investments as they and their advisors saw fit — a flexibility that those in less liquid investments simply did not have at their disposal.
At MFS® we take particular pride in how well mutual funds can serve investors because we invented the mutual fund in the United States. Established in 1924, Massachusetts Investors Trust was the nation’s first fund. Recent market events only reinforce what we have learned through 85 years — that mutual funds provide unique features that are important to investors in any type of market climate.
Respectfully,

Robert J. Manning
Chief Executive Officer and Chief Investment Officer
MFS Investment Management®
May 15, 2009
The opinions expressed in this letter are subject to change, may not be relied upon for investment advice, and no forecasts can be guaranteed.
Before investing, consider the fund’s investment objectives, risks, charges, and expenses. For a prospectus containing this and other information, contact your investment professional or view online. Read it carefully.
MFS Fund Distributors, Inc., 500 Boylston Street, Boston, MA 02116
1
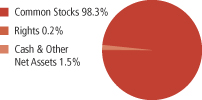
PORTFOLIO COMPOSITION
Portfolio structure
| | |
| Top ten holdings | | |
| Synthes, Inc. | | 2.2% |
| Konica Minolta Holdings, Inc. | | 1.8% |
| Intertek Group PLC | | 1.7% |
| Christian Dior S.A. | | 1.5% |
| Royal KPN N.V. | | 1.4% |
| Novo Nordisk A/S, “B” | | 1.4% |
| Bunzl PLC | | 1.3% |
| Copa Holdings S.A., “A” | | 1.3% |
| Zimmer Holdings, Inc. | | 1.3% |
| Itau Unibanco Banco Multiplo S.A., ADR | | 1.2% |
| | |
| Equity sectors | | |
| Financial Services | | 17.1% |
| Health Care | | 13.9% |
| Consumer Staples | | 11.7% |
| Technology | | 10.6% |
| Basic Materials | | 7.9% |
| Special Products & Services | | 7.2% |
| Utilities & Communications | | 6.3% |
| Leisure (a) | | 4.8% |
| Industrial Goods & Services | | 4.6% |
| Retailing | | 4.3% |
| Energy | | 4.0% |
| Transportation | | 3.6% |
| Autos & Housing | | 2.5% |
| |
| Country weightings | | |
| Japan | | 17.9% |
| United Kingdom | | 13.2% |
| Germany | | 7.0% |
| Brazil | | 6.0% |
| France | | 5.7% |
| Switzerland | | 5.6% |
| United States | | 5.2% |
| Netherlands | | 4.9% |
| Australia | | 2.9% |
| Other Countries | | 31.6% |
| (a) | This Equity Sector includes both common stocks and rights. |
Percentages are based on net assets as of 3/31/09.
The portfolio is actively managed and current holdings may be different.
2
EXPENSE TABLE
Fund expenses borne by the shareholders during the period, October 1, 2008 through March 31, 2009
As a shareholder of the fund, you incur two types of costs: (1) transaction costs, including sales charges (loads) on certain purchase or redemption payments, and (2) ongoing costs, including management fees; distribution and service (12b-1) fees; and other fund expenses. This example is intended to help you understand your ongoing costs (in dollars) of investing in the fund and to compare these costs with the ongoing costs of investing in other mutual funds.
The example is based on an investment of $1,000 invested at the beginning of the period and held for the entire period October 1, 2008 through March 31, 2009.
The actual expenses include the payment of a portion of the transfer-agent-related expenses of MFS funds that invest in the fund. For further information, please see the Notes to the Financial Statements.
Actual Expenses
The first line for each share class in the following table provides information about actual account values and actual expenses. You may use the information in this line, together with the amount you invested, to estimate the expenses that you paid over the period. Simply divide your account value by $1,000 (for example, an $8,600 account value divided by $1,000 = 8.6), then multiply the result by the number in the first line under the heading entitled “Expenses Paid During Period” to estimate the expenses you paid on your account during this period.
Hypothetical Example for Comparison Purposes
The second line for each share class in the following table provides information about hypothetical account values and hypothetical expenses based on the fund’s actual expense ratio and an assumed rate of return of 5% per year before expenses, which is not the fund’s actual return. The hypothetical account values and expenses may not be used to estimate the actual ending account balance or expenses you paid for the period. You may use this information to compare the ongoing costs of investing in the fund and other funds. To do so, compare this 5% hypothetical example with the 5% hypothetical examples that appear in the shareholder reports of the other funds.
Please note that the expenses shown in the table are meant to highlight your ongoing costs only and do not reflect any transactional costs, such as sales charges (loads). Therefore, the second line for each share class in the table is useful in comparing ongoing costs only, and will not help you determine the relative total costs of owning different funds. In addition, if these transactional costs were included, your costs would have been higher.
3
Expense Table – continued
| | | | | | | | | | |
Share
Class | | | | Annualized
Expense
Ratio | | Beginning
Account Value
10/01/08 | | Ending
Account Value
3/31/09 | | Expenses
Paid During
Period (p) 10/01/08-3/31/09 |
| A | | Actual | | 1.63% | | $1,000.00 | | $711.09 | | $6.95 |
| | Hypothetical (h) | | 1.63% | | $1,000.00 | | $1,016.80 | | $8.20 |
| B | | Actual | | 2.34% | | $1,000.00 | | $709.17 | | $9.97 |
| | Hypothetical (h) | | 2.34% | | $1,000.00 | | $1,013.26 | | $11.75 |
| C | | Actual | | 2.34% | | $1,000.00 | | $708.80 | | $9.97 |
| | Hypothetical (h) | | 2.34% | | $1,000.00 | | $1,013.26 | | $11.75 |
| I | | Actual | | 1.34% | | $1,000.00 | | $712.22 | | $5.72 |
| | Hypothetical (h) | | 1.34% | | $1,000.00 | | $1,018.25 | | $6.74 |
| R1 | | Actual | | 2.34% | | $1,000.00 | | $708.68 | | $9.97 |
| | Hypothetical (h) | | 2.34% | | $1,000.00 | | $1,013.26 | | $11.75 |
| R2 | | Actual | | 1.84% | | $1,000.00 | | $710.78 | | $7.85 |
| | Hypothetical (h) | | 1.84% | | $1,000.00 | | $1,015.76 | | $9.25 |
| R3 | | Actual | | 1.59% | | $1,000.00 | | $711.71 | | $6.79 |
| | Hypothetical (h) | | 1.59% | | $1,000.00 | | $1,017.00 | | $8.00 |
| R4 | | Actual | | 1.34% | | $1,000.00 | | $712.15 | | $5.72 |
| | Hypothetical (h) | | 1.34% | | $1,000.00 | | $1,018.25 | | $6.74 |
| 529A | | Actual | | 1.77% | | $1,000.00 | | $711.08 | | $7.55 |
| | Hypothetical (h) | | 1.77% | | $1,000.00 | | $1,016.11 | | $8.90 |
| 529B | | Actual | | 2.44% | | $1,000.00 | | $708.68 | | $10.39 |
| | Hypothetical (h) | | 2.44% | | $1,000.00 | | $1,012.76 | | $12.24 |
| 529C | | Actual | | 2.44% | | $1,000.00 | | $708.75 | | $10.39 |
| | Hypothetical (h) | | 2.44% | | $1,000.00 | | $1,012.76 | | $12.24 |
| (h) | 5% class return per year before expenses. |
| (p) | Expenses paid is equal to each class’ annualized expense ratio, as shown above, multiplied by the average account value over the period, multiplied by the number of days in the period, divided by the number of days in the year. Expenses paid do not include any applicable sales charges (loads). If these transaction costs had been included, your costs would have been higher. |
Expense Changes Impacting the Table
Changes to the fund’s fee arrangements occurred during the six month period. Had these fee changes been in effect throughout the entire six month period, the annualized expense ratios would have been 1.59% for Class A shares and 1.69% for Class 529A shares; the actual expenses paid during the period would have been approximately $6.78 for Class A shares and $7.21 for Class 529A shares; and the hypothetical expenses paid during the period would have been approximately $8.00 for Class A shares and $8.50 for Class 529A shares. For further information about the fund’s fee arrangements and changes to those fee arrangements, please see Note 3 in the Notes to Financial Statements.
4
PORTFOLIO OF INVESTMENTS
3/31/09 (unaudited)
The Portfolio of Investments is a complete list of all securities owned by your fund. It is categorized by broad-based asset classes.
| | | | | |
| Common Stocks - 98.3% | | | | | |
| Issuer | | Shares/Par | | Value ($) |
| | | | | |
| Aerospace - 0.2% | | | | | |
| Meggitt PLC | | 1,837,786 | | $ | 3,381,884 |
| | |
| Airlines - 1.7% | | | | | |
| Arriva PLC | | 548,050 | | $ | 2,913,498 |
| Copa Holdings S.A., “A” | | 656,580 | | | 18,824,148 |
| Grupo Aeroportuario del Sureste S.A. de C.V., ADR | | 81,820 | | | 2,354,779 |
| | | | | |
| | | | | $ | 24,092,425 |
| Alcoholic Beverages - 2.7% | | | | | |
| Companhia de Bebidas das Americas, ADR | | 228,503 | | $ | 10,911,017 |
| Davide Campari-Milano S.p.A. | | 483,917 | | | 3,073,215 |
| Foster’s Group Ltd. | | 1,491,365 | | | 5,247,323 |
| Grupo Modelo S.A. de C.V., “C” | | 418,000 | | | 1,255,622 |
| Heineken N.V. | | 164,070 | | | 4,664,845 |
| Lion Nathan Ltd. | | 1,032,310 | | | 5,799,959 |
| Pernod Ricard S.A. | | 150,430 | | | 8,389,178 |
| | | | | |
| | | | | $ | 39,341,159 |
| Apparel Manufacturers - 1.6% | | | | | |
| Billabong International Ltd. | | 481,333 | | $ | 2,844,907 |
| Burberry Group PLC | | 921,690 | | | 3,726,107 |
| Compagnie Financiere Richemont S.A. | | 172,627 | | | 2,696,396 |
| Li & Fung Ltd. | | 3,487,000 | | | 8,188,192 |
| Stella International Holdings Ltd. | | 6,101,500 | | | 6,447,409 |
| | | | | |
| | | | | $ | 23,903,011 |
| Automotive - 0.4% | | | | | |
| PT Astra International Tbk. | | 4,760,000 | | $ | 5,922,742 |
| | |
| Biotechnology - 0.7% | | | | | |
| Actelion Ltd. (a) | | 127,884 | | $ | 5,836,400 |
| Lonza Group AG | | 44,248 | | | 4,373,100 |
| | | | | |
| | | | | $ | 10,209,500 |
| Broadcasting - 1.6% | | | | | |
| Fuji Television Network, Inc. | | 9,570 | | $ | 10,750,734 |
| Grupo Televisa S.A., ADR | | 505,590 | | | 6,896,248 |
| WPP Group PLC | | 954,872 | | | 5,381,060 |
| | | | | |
| | | | | $ | 23,028,042 |
5
Portfolio of Investments (unaudited) – continued
| | | | | |
| Issuer | | Shares/Par | | Value ($) |
| | | | | |
| Common Stocks - continued | | | | | |
| Brokerage & Asset Managers - 3.2% | | | | | |
| Bolsa Mexicana de Valores S.A. de C.V. (a) | | 2,804,000 | | $ | 1,553,929 |
| Daiwa Securities Group, Inc. | | 2,052,000 | | | 9,082,605 |
| Deutsche Boerse AG | | 74,500 | | | 4,491,744 |
| Hong Kong Exchanges & Clearing Ltd. | | 530,500 | | | 5,010,270 |
| ICAP PLC | | 481,364 | | | 2,101,410 |
| IG Group Holdings PLC | | 3,669,255 | | | 9,226,616 |
| Julius Baer Holding Ltd. | | 126,423 | | | 3,109,764 |
| Octaviar Ltd. (a)(l) | | 244,515 | | | 0 |
| Rathbone Brothers PLC | | 707,235 | | | 7,844,220 |
| Tullett Prebon PLC | | 365,573 | | | 1,102,850 |
| Van Lanschot N.V. | | 48,159 | | | 2,439,072 |
| | | | | |
| | | | | $ | 45,962,480 |
| Business Services - 5.6% | | | | | |
| Amadeus Fire AG (h) | | 263,777 | | $ | 3,329,314 |
| Bunzl PLC | | 2,491,376 | | | 19,536,013 |
| CTS Eventim AG | | 168,850 | | | 4,912,917 |
| Electrocomponents PLC | | 1,130,717 | | | 2,032,068 |
| Infosys Technology Ltd. | | 199,890 | | | 5,216,012 |
| Intertek Group PLC | | 1,933,239 | | | 24,562,955 |
| JFE Shoji Holdings, Inc. | | 469,951 | | | 1,258,766 |
| Kloeckner & Co. AG | | 182,625 | | | 1,802,782 |
| Kroton Educacional S.A., IEU (a) | | 200,800 | | | 805,018 |
| LPS Brasil - Consultoria de Imoveis S.A. | | 454,961 | | | 1,127,719 |
| Sodexo | | 216,434 | | | 9,870,298 |
| TAKKT AG | | 357,368 | | | 3,086,194 |
| USS Co. Ltd. | | 99,820 | | | 4,391,006 |
| | | | | |
| | | | | $ | 81,931,062 |
| Chemicals - 1.7% | | | | | |
| Hoganas AB | | 78,198 | | $ | 708,781 |
| Makhteshim-Agan Industries Ltd. | | 1,188,970 | | | 4,981,867 |
| Orica Ltd. | | 412,180 | | | 4,238,952 |
| Syngenta AG | | 57,898 | | | 11,668,103 |
| Victrex PLC | | 372,623 | | | 2,716,063 |
| | | | | |
| | | | | $ | 24,313,766 |
| Computer Software - 0.1% | | | | | |
| Totvs S.A. | | 92,600 | | $ | 1,626,662 |
| | |
| Computer Software - Systems - 2.8% | | | | | |
| Acer, Inc. | | 3,933,000 | | $ | 5,941,047 |
| Advantech Co. Ltd. | | 5,621,247 | | | 7,832,700 |
6
Portfolio of Investments (unaudited) – continued
| | | | | |
| Issuer | | Shares/Par | | Value ($) |
| | | | | |
| Common Stocks - continued | | | | | |
| Computer Software - Systems - continued | | | | | |
| Capgemini | | 93,879 | | $ | 3,020,903 |
| Fujitsu Ltd. | | 1,707,000 | | | 6,421,548 |
| OBIC Co. Ltd. | | 116,070 | | | 14,547,445 |
| Wincor Nixdorf AG | | 58,964 | | | 2,672,163 |
| | | | | |
| | | | | $ | 40,435,806 |
| Conglomerates - 1.3% | | | | | |
| DCC PLC | | 163,856 | | $ | 2,481,770 |
| First Pacific Co. Ltd. | | 6,780,000 | | | 2,326,891 |
| Keppel Corp. NPV | | 3,386,000 | | | 11,278,838 |
| Smiths Group PLC | | 262,605 | | | 2,520,784 |
| | | | | |
| | | | | $ | 18,608,283 |
| Construction - 2.1% | | | | | |
| Anhui Conch Cement Co. Ltd. (a) | | 1,412,000 | | $ | 7,788,171 |
| Corporacion Moctezuma S.A. de C.V. | | 959,200 | | | 1,286,608 |
| CRH PLC | | 117,216 | | | 2,525,681 |
| Duratex S.A., IPS | | 444,100 | | | 2,871,646 |
| Geberit AG | | 64,177 | | | 5,767,642 |
| Noritz Corp. NPV | | 539,000 | | | 7,146,574 |
| Sare Holding S.A. de C.V., “B” (a) | | 10,249,167 | | | 1,287,929 |
| Wienerberger AG | | 173,764 | | | 1,369,017 |
| | | | | |
| | | | | $ | 30,043,268 |
| Consumer Goods & Services - 6.6% | | | | | |
| Avon Products, Inc. | | 229,120 | | $ | 4,405,978 |
| Beiersdorf AG | | 208,068 | | | 9,340,879 |
| Christian Dior S.A. | | 390,842 | | | 21,432,980 |
| Dabur India Ltd. | | 3,906,881 | | | 7,638,959 |
| Hengan International Group Co. Ltd. | | 2,671,000 | | | 10,734,866 |
| Henkel KGaA, IPS | | 421,506 | | | 11,469,064 |
| Kimberly-Clark de Mexico S.A. de C.V., “A” | | 2,007,060 | | | 6,499,389 |
| Kose Corp. | | 214,300 | | | 4,008,737 |
| Natura Cosmeticos S.A. | | 475,130 | | | 4,639,161 |
| Uni-Charm Corp. | | 251,500 | | | 15,323,869 |
| | | | | |
| | | | | $ | 95,493,882 |
| Containers - 0.8% | | | | | |
| Mayr-Melnhof Karton AG | | 85,690 | | $ | 6,033,930 |
| Viscofan S.A. | | 317,728 | | | 6,175,812 |
| | | | | |
| | | | | $ | 12,209,742 |
7
Portfolio of Investments (unaudited) – continued
| | | | | |
| Issuer | | Shares/Par | | Value ($) |
| | | | | |
| Common Stocks - continued | | | | | |
| Electrical Equipment - 1.5% | | | | | |
| Legrand S.A. | | 289,820 | | $ | 5,038,443 |
| LS Industrial Systems Co. Ltd. | | 329,441 | | | 12,934,175 |
| OMRON Corp. | | 78,821 | | | 935,416 |
| Prysmian S.p.A. | | 113,356 | | | 1,129,536 |
| Spectris PLC | | 377,670 | | | 2,181,147 |
| | | | | |
| | | | | $ | 22,218,717 |
| Electronics - 6.3% | | | | | |
| ARM Holdings PLC | | 2,599,570 | | $ | 3,823,243 |
| ASM Pacific Technology Ltd. | | 1,687,500 | | | 5,911,236 |
| ASML Holding N.V. | | 412,280 | | | 7,219,023 |
| ASML Holding N.V. (l) | | 162,984 | | | 2,890,816 |
| Domino Printing Sciences PLC | | 249 | | | 672 |
| Halma PLC | | 1,188,055 | | | 2,816,985 |
| Hirose Electric Co. Ltd. | | 119,100 | | | 11,536,691 |
| Hoya Corp. | | 89,300 | | | 1,767,684 |
| Konica Minolta Holdings, Inc. | | 3,073,000 | | | 26,647,152 |
| Melexis N.V. | | 237,947 | | | 1,106,477 |
| Ricoh Co. Ltd. | | 721,000 | | | 8,677,165 |
| SUMCO Corp. | | 539,500 | | | 8,064,366 |
| Venture Corp. Ltd. | | 3,219,000 | | | 10,666,860 |
| | | | | |
| | | | | $ | 91,128,370 |
| Energy - Independent - 2.6% | | | | | |
| Arch Coal, Inc. | | 246,050 | | $ | 3,289,689 |
| Galp Energia SGPS S.A. | | 357,267 | | | 4,262,491 |
| Motor Oil (Hellas) Corinth Refineries S.A. | | 118,394 | | | 1,226,926 |
| OMV AG | | 151,731 | | | 5,080,063 |
| Peabody Energy Corp. | | 78,870 | | | 1,974,905 |
| PTT Exploration & Production Public Co. Ltd. | | 1,412,300 | | | 3,872,725 |
| Santos Ltd. | | 225,551 | | | 2,626,658 |
| Talisman Energy, Inc. | | 1,496,750 | | | 15,848,360 |
| | | | | |
| | | | | $ | 38,181,817 |
| Engineering - Construction - 0.7% | | | | | |
| Aker Kvaerner A.S.A | | 836,559 | | $ | 5,421,289 |
| North American Energy Partners, Inc. (a) | | 1,534,071 | | | 4,678,917 |
| | | | | |
| | | | | $ | 10,100,206 |
| Food & Beverages - 1.4% | | | | | |
| Cranswick PLC | | 8,402 | | $ | 69,923 |
| Grupo Continental S.A. | | 2,141,490 | | | 3,460,551 |
| Kerry Group PLC | | 807,963 | | | 16,370,259 |
| | | | | |
| | | | | $ | 19,900,733 |
8
Portfolio of Investments (unaudited) – continued
| | | | | |
| Issuer | | Shares/Par | | Value ($) |
| | | | | |
| Common Stocks - continued | | | | | |
| Food & Drug Stores - 0.9% | | | | | |
| Aeon Co. Ltd. | | 689,800 | | $ | 4,511,210 |
| Lawson, Inc. | | 207,000 | | | 8,532,202 |
| | | | | |
| | | | | $ | 13,043,412 |
| Forest & Paper Products - 0.2% | | | | | |
| Suzano Papel e Celulose S.A., IPS (a) | | 770,100 | | $ | 3,485,742 |
| | |
| Gaming & Lodging - 1.5% | | | | | |
| Ladbrokes PLC | | 3,763,143 | | $ | 9,894,668 |
| Paddy Power PLC | | 204,040 | | | 3,198,833 |
| William Hill PLC | | 3,662,757 | | | 8,947,500 |
| | | | | |
| | | | | $ | 22,041,001 |
| General Merchandise - 0.4% | | | | | |
| Lotte Shopping Co. Ltd. | | 43,371 | | $ | 5,999,656 |
| | |
| Health Maintenance Organizations - 0.3% | | | | | |
| Odontoprev S.A. | | 407,800 | | $ | 4,043,281 |
| | |
| Insurance - 5.3% | | | | | |
| ACE Ltd. | | 142,840 | | $ | 5,770,736 |
| Admiral Group PLC | | 511,099 | | | 6,259,146 |
| Aflac, Inc. | | 81,759 | | | 1,582,854 |
| Amlin PLC | | 1,825,964 | | | 9,012,747 |
| Aspen Insurance Holdings Ltd. | | 581,685 | | | 13,064,645 |
| Catlin Group Ltd. | | 2,011,085 | | | 9,031,945 |
| CNP Assurances S.A. | | 144,392 | | | 9,112,362 |
| Euler Hermes (a) | | 43,789 | | | 1,445,725 |
| Hiscox Ltd. | | 2,902,443 | | | 12,868,522 |
| QBE Insurance Group Ltd. | | 648,061 | | | 8,713,844 |
| | | | | |
| | | | | $ | 76,862,526 |
| Internet - 0.6% | | | | | |
| Iliad S.A. | | 82,442 | | $ | 7,689,177 |
| Universo Online S.A., IPS | | 393,500 | | | 1,131,434 |
| | | | | |
| | | | | $ | 8,820,611 |
| Leisure & Toys - 0.9% | | | | | |
| Jumbo S.A. | | 502,515 | | $ | 3,805,556 |
| Sankyo Co. Ltd. | | 230,200 | | | 9,964,036 |
| | | | | |
| | | | | $ | 13,769,592 |
9
Portfolio of Investments (unaudited) – continued
| | | | | |
| Issuer | | Shares/Par | | Value ($) |
| | | | | |
| Common Stocks - continued | | | | | |
| Machinery & Tools - 2.2% | | | | | |
| Assa Abloy AB, “B” | | 257,389 | | $ | 2,411,241 |
| Bucyrus International, Inc. | | 334,310 | | | 5,074,826 |
| Burckhardt Compression Holding AG | | 59,768 | | | 5,565,675 |
| Fenner PLC | | 1,169,843 | | | 772,133 |
| GEA Group AG | | 330,500 | | | 3,525,991 |
| Glory Ltd. | | 345,600 | | | 6,159,684 |
| Neopost S.A. | | 86,129 | | | 6,683,342 |
| Rotork PLC | | 166,366 | | | 2,033,811 |
| | | | | |
| | | | | $ | 32,226,703 |
| Major Banks - 1.1% | | | | | |
| Banco Santander Chile, ADR (a) | | 203,130 | | $ | 6,977,516 |
| Oversea-Chinese Banking Corp. Ltd. | | 810,000 | | | 2,577,600 |
| Resona Holdings, Inc. | | 476,200 | | | 6,397,130 |
| | | | | |
| | | | | $ | 15,952,246 |
| Medical & Health Technology & Services - 1.2% | | | | | |
| Diagnosticos da America S.A. (a) | | 176,500 | | $ | 1,886,927 |
| Fresenius Medical Care AG & Co. | | 142,490 | | | 5,539,275 |
| Kobayashi Pharmaceutical Co. Ltd. | | 145,500 | | | 4,789,579 |
| SSL International PLC | | 704,448 | | | 4,538,390 |
| | | | | |
| | | | | $ | 16,754,171 |
| Medical Equipment - 7.4% | | | | | |
| Cochlear Ltd. | | 260,480 | | $ | 9,074,351 |
| Cremer S.A. | | 457,200 | | | 1,482,118 |
| Essilor International S.A. | | 253,909 | | | 9,816,696 |
| Fresenius Medical Care AG & Co. KGaA, IPS | | 215,920 | | | 9,914,272 |
| Miraca Holdings, Inc. | | 502,800 | | | 10,135,887 |
| QIAGEN N.V. (a) | | 233,493 | | | 3,735,034 |
| Sonova Holding AG | | 121,083 | | | 7,318,379 |
| Straumann Holding AG (l) | | 19,840 | | | 3,074,564 |
| Synthes, Inc. | | 284,587 | | | 31,701,337 |
| Waters Corp. (a) | | 62,687 | | | 2,316,285 |
| Zimmer Holdings, Inc. (a) | | 504,064 | | | 18,398,336 |
| | | | | |
| | | | | $ | 106,967,259 |
| Metals & Mining - 2.1% | | | | | |
| Cameco Corp. | | 296,890 | | $ | 5,074,540 |
| Grupo Mexico S.A.B. de C.V. | | 2,147,398 | | | 1,578,144 |
| Inmet Mining Corp. | | 219,543 | | | 5,436,336 |
| Nyrstar N.V. | | 1,142,775 | | | 4,478,958 |
| PT International Nickel Indonesia Tbk. | | 7,083,000 | | | 1,355,572 |
10
Portfolio of Investments (unaudited) – continued
| | | | | |
| Issuer | | Shares/Par | | Value ($) |
| | | | | |
| Common Stocks - continued | | | | | |
| Metals & Mining - continued | | | | | |
| Salzgitter AG | | 47,620 | | $ | 2,662,315 |
| Steel Authority of India Ltd. | | 2,377,941 | | | 4,566,755 |
| Usinas Siderurgicas de Minas Gerais S.A., “A”, IPS | | 396,600 | | | 5,043,518 |
| | | | | |
| | | | | $ | 30,196,138 |
| Natural Gas - Distribution - 0.5% | | | | | |
| Tokyo Gas Co. Ltd. | | 1,905,000 | | $ | 6,639,642 |
| | |
| Natural Gas - Pipeline - 0.8% | | | | | |
| Enagas S.A. | | 848,508 | | $ | 12,028,587 |
| | |
| Network & Telecom - 0.6% | | | | | |
| High Tech Computer Corp. | | 648,500 | | $ | 8,028,407 |
| | |
| Oil Services - 1.4% | | | | | |
| Acergy S.A. | | 405,658 | | $ | 2,541,323 |
| Fugro N.V. | | 137,477 | | | 4,374,514 |
| Petrofac Ltd. | | 207,119 | | | 1,589,938 |
| Petroleum Geo-Services ASA (a) | | 253,477 | | | 1,063,666 |
| Saipem S.p.A. | | 436,225 | | | 7,766,218 |
| Schoeller-Bleckmann Nooter Apparatetechnik GMBH | | 117,550 | | | 3,387,478 |
| | | | | |
| | | | | $ | 20,723,137 |
| Other Banks & Diversified Financials - 5.8% | | | | | |
| Aeon Credit Service Co. Ltd. | | 787,200 | | $ | 7,150,776 |
| Banco Compartamos S.A. | | 765,700 | | | 1,450,857 |
| Banco Panamericano S.A., IPS | | 1,143,900 | | | 1,425,098 |
| Chiba Bank Ltd. | | 2,560,451 | | | 12,771,808 |
| Credicorp Ltd. | | 42,900 | | | 2,009,436 |
| CSU Cardsystem S.A. (a) | | 1,483,390 | | | 2,206,141 |
| Grupo Financiero Banorte S.A. de C.V. | | 1,518,800 | | | 2,018,991 |
| Housing Development Finance Corp. Ltd. | | 163,586 | | | 4,593,453 |
| Itau Unibanco Banco Multiplo S.A., ADR | | 1,614,743 | | | 17,568,405 |
| Komercni Banka A.S. | | 75,563 | | | 7,531,903 |
| Redecard S.A. | | 394,500 | | | 4,770,223 |
| Shizuoka Bank Ltd. | | 981,000 | | | 8,909,077 |
| Siam Commercial Bank Public Co. Ltd. | | 713,700 | | | 1,096,762 |
| SNS REAAL Groep N.V. | | 598,257 | | | 2,109,517 |
| Unione di Banche Italiane Scpa | | 735,506 | | | 8,105,818 |
| | | | | |
| | | | | $ | 83,718,265 |
| Personal Computers & Peripherals - 0.2% | | | | | |
| Hon Hai Precision Industry Co. Ltd. | | 1,427,000 | | $ | 3,237,277 |
11
Portfolio of Investments (unaudited) – continued
| | | | | |
| Issuer | | Shares/Par | | Value ($) |
| | | | | |
| Common Stocks - continued | | | | | |
| Pharmaceuticals - 4.3% | | | | | |
| Daiichi Sankyo Co. Ltd. | | 507,700 | | $ | 8,580,665 |
| Genomma Lab Internacional S.A., “B” (a) | | 10,387,500 | | | 5,433,913 |
| Hisamitsu Pharmaceutical Co., Inc. | | 271,600 | | | 8,388,850 |
| Merck KGaA | | 95,209 | | | 8,419,486 |
| Novo Nordisk A/S, “B” | | 418,520 | | | 20,043,811 |
| Santen Pharmaceutical Co. Ltd. | | 190,400 | | | 5,309,035 |
| Tanabe Seiyaku Co. Ltd. | | 603,000 | | | 5,942,527 |
| | | | | |
| | | | | $ | 62,118,287 |
| Precious Metals & Minerals - 0.2% | | | | | |
| Paladin Resources Ltd. (a) | | 1,393,589 | | $ | 3,294,709 |
| | |
| Printing & Publishing - 0.6% | | | | | |
| Reed Elsevier PLC | | 1,165,236 | | $ | 8,376,414 |
| | |
| Real Estate - 1.7% | | | | | |
| Ascendas Real Estate Investment Trust, REIT | | 5,573,466 | | $ | 4,470,646 |
| Brasil Brokers Participacoes (a) | | 1,487,100 | | | 717,988 |
| China Overseas Land & Investment Ltd. | | 3,082,000 | | | 4,835,383 |
| City Developments Ltd. | | 1,982,400 | | | 6,647,319 |
| Deutsche Wohnen AG, REIT (a) | | 485,250 | | | 7,349,616 |
| | | | | |
| | | | | $ | 24,020,952 |
| Special Products & Services - 0.3% | | | | | |
| Filtrona PLC | | 2,588,193 | | $ | 4,799,917 |
| | |
| Specialty Chemicals - 2.9% | | | | | |
| Akzo Nobel N.V. | | 330,931 | | $ | 12,528,537 |
| Croda International PLC | | 1,305,483 | | | 9,927,813 |
| Linde AG | | 180,040 | | | 12,242,314 |
| Symrise AG | | 643,568 | | | 7,618,446 |
| | | | | |
| | | | | $ | 42,317,110 |
| Specialty Stores - 1.4% | | | | | |
| Bulgari S.p.A. (a) | | 518,751 | | $ | 2,281,294 |
| Dufry South America Ltd., BDR | | 682,180 | | | 4,337,603 |
| Esprit Holdings Ltd. | | 1,294,200 | | | 6,681,011 |
| NEXT PLC | | 144,122 | | | 2,737,945 |
| Shimamura Co. Ltd. | | 67,600 | | | 3,592,221 |
| | | | | |
| | | | | $ | 19,630,074 |
| Telecommunications - Wireless - 1.0% | | | | | |
| Cellcom Israel Ltd. | | 289,140 | | $ | 6,158,682 |
| Mobile TeleSystems OJSC, ADR | | 119,150 | | | 3,564,968 |
12
Portfolio of Investments (unaudited) – continued
| | | | | |
| Issuer | | Shares/Par | | Value ($) |
| | | | | |
| Common Stocks - continued | | | | | |
| Telecommunications - Wireless - continued | | | | | |
| NII Holdings, Inc. (a) | | 73,310 | | $ | 1,099,650 |
| Philippine Long Distance Telephone Co. | | 81,630 | | | 3,656,051 |
| | | | | |
| | | | | $ | 14,479,351 |
| Telephone Services - 2.5% | | | | | |
| BCE, Inc. | | 238,060 | | $ | 4,743,074 |
| China Unicom Ltd. | | 4,905,252 | | | 5,139,757 |
| Empresa Nacional de Telecomunicaciones S.A. | | 140,914 | | | 1,631,928 |
| Royal KPN N.V. | | 1,551,777 | | | 20,740,611 |
| Telekom Austria AG | | 275,829 | | | 4,177,717 |
| | | | | |
| | | | | $ | 36,433,087 |
| Tobacco - 1.0% | | | | | |
| Swedish Match AB | | 986,349 | | $ | 14,280,304 |
| | |
| Trucking - 1.9% | | | | | |
| DSV (l) | | 355,044 | | $ | 2,602,818 |
| TNT N.V. | | 826,309 | | | 14,140,104 |
| Yamato Holdings Co. Ltd. | | 1,226,000 | | | 11,549,196 |
| | | | | |
| | | | | $ | 28,292,118 |
| Utilities - Electric Power - 1.5% | | | | | |
| AES Tiete S.A., IPS | | 547,432 | | $ | 4,153,380 |
| Eletropaulo Metropolitana S.A., IPS | | 661,700 | | | 9,313,290 |
| Equatorial Energia S.A. | | 701,800 | | | 3,491,226 |
| International Power PLC | | 476,180 | | | 1,438,235 |
| Red Electrica de Espana | | 71,446 | | | 2,790,741 |
| | | | | |
| | | | | $ | 21,186,872 |
| Total Common Stocks (Identified Cost, $2,105,087,562) | | | | $ | 1,425,800,405 |
| | | | | | | | | |
| | | | |
| | | Strike Price | | First Exercise | | | | |
| | | | | | | | | |
| Rights - 0.2% | | | | | | | | | |
| Gaming & Lodging - 0.2% | | | | | | | | | |
William Hill PLC (1 right for 1 share)
(Identified Cost, $7,150,146) (a) | | GBP 1.05 | | 3/24/09 | | 3,662,757 | | $ | 3,363,524 |
| | | |
| Collateral for Securities Loaned - 0.4% | | | | | | | |
| Morgan Stanley, Repurchase Agreement, 0.20%, dated 3/31/09, due 4/01/09, total to be received $5,045,877 (secured by various U.S. Treasury and Federal Agency obligations and Mortgage Backed securities valued at $5,149,135 in an individually traded account), at Cost and Net Asset Value | | 5,045,849 | | $ | 5,045,849 |
13
Portfolio of Investments (unaudited) – continued
| | | | | |
| Money Market Funds (v) - 0.8% | | | | | |
| Issuer | | Shares/Par | | Value ($) |
| | | | | |
MFS Institutional Money Market Portfolio, 0.23%,
at Cost and Net Asset Value | | 12,041,475 | | $ | 12,041,475 |
| Total Investments (Identified Cost, $2,129,325,032) | | | | $ | 1,446,251,253 |
| | |
| Other Assets, Less Liabilities - 0.3% | | | | | 4,069,056 |
| Net Assets - 100.0% | | | | $ | 1,450,320,309 |
| (a) | Non-income producing security. |
| (h) | Affiliated issuers are those in which the fund’s holdings of an issuer represent 5% or more of the outstanding voting securities of the issuer. |
| (l) | All or a portion of this security is on loan. |
| (v) | Underlying fund that is available only to investment companies managed by MFS. The rate quoted is the annualized seven-day yield of the fund at period end. |
The following abbreviations are used in this report and are defined:
| ADR | | American Depository Receipt |
| BDR | | Brazilian Depository Receipt |
| IEU | | International Equity Unit |
| IPS | | International Preference Stock |
| REIT | | Real Estate Investment Trust |
Abbreviations indicate amounts shown in currencies other than the U.S. dollar. All amounts are stated in U.S. dollars unless otherwise indicated. A list of abbreviations is shown below:
See Notes to Financial Statements
14
Financial Statements
STATEMENT OF ASSETS AND LIABILITIES
At 3/31/09 (unaudited)
This statement represents your fund’s balance sheet, which details the assets and liabilities comprising the total value of the fund.
| | | | | |
| Assets | | | | | |
Investments- | | | | | |
Non-affiliated issuers, at value (identified cost, $2,114,310,944) | | $1,430,880,464 | | | |
Underlying funds, at cost and value | | 12,041,475 | | | |
Other affiliated issuers, at value (identified cost, $2,972,613) | | 3,329,314 | | | |
Total investments, at value, including $4,983,873 of securities on loan (identified cost, $2,129,325,032) | | | | | $1,446,251,253 |
Cash | | 77,886 | | | |
Foreign currency, at value (identified cost, $1,787,959) | | 1,806,610 | | | |
Receivable for investments sold | | 5,264,224 | | | |
Receivable for fund shares sold | | 1,874,269 | | | |
Interest and dividends receivable | | 8,610,929 | | | |
Other assets | | 19,044 | | | |
Total assets | | | | | $1,463,904,215 |
| Liabilities | | | | | |
Payable for investments purchased | | $1,818,740 | | | |
Payable for fund shares reacquired | | 2,730,975 | | | |
Collateral for securities loaned, at value | | 5,045,849 | | | |
Payable to affiliates | | | | | |
Investment adviser | | 40,291 | | | |
Management fee | | 74,785 | | | |
Shareholder servicing costs | | 2,240,255 | | | |
Distribution and service fees | | 23,001 | | | |
Administrative services fee | | 1,598 | | | |
Program manager fees | | 14 | | | |
Payable for independent trustees’ compensation | | 9,701 | | | |
Accrued expenses and other liabilities | | 1,598,697 | | | |
Total liabilities | | | | | $13,583,906 |
Net assets | | | | | $1,450,320,309 |
| Net assets consist of | | | | | |
Paid-in capital | | $2,791,105,171 | | | |
Unrealized appreciation (depreciation) on investments and translation of assets and liabilities in foreign currencies
(net of $637,326 deferred country tax) | | (683,804,870 | ) | | |
Accumulated net realized loss on investments and foreign currency transactions | | (659,615,505 | ) | | |
Undistributed net investment income | | 2,635,513 | | | |
Net assets | | | | | $1,450,320,309 |
Shares of beneficial interest outstanding | | | | | 128,493,631 |
15
Statement of Assets and Liabilities (unaudited) – continued
| | | | |
Class A shares | | | | |
Net assets | | $843,042,091 | | |
Shares outstanding | | 74,715,220 | | |
Net asset value per share | | | | $11.28 |
Offering price per share (100/94.25 × net asset value per share) | | | | $11.97 |
Class B shares | | | | |
Net assets | | $76,790,837 | | |
Shares outstanding | | 7,073,580 | | |
Net asset value and offering price per share | | | | $10.86 |
Class C shares | | | | |
Net assets | | $113,397,029 | | |
Shares outstanding | | 10,471,854 | | |
Net asset value and offering price per share | | | | $10.83 |
Class I shares | | | | |
Net assets | | $363,661,981 | | |
Shares outstanding | | 31,423,487 | | |
Net asset value, offering price, and redemption price per share | | | | $11.57 |
Class R1 shares | | | | |
Net assets | | $1,580,806 | | |
Shares outstanding | | 148,971 | | |
Net asset value, offering price, and redemption price per share | | | | $10.61 |
Class R2 shares | | | | |
Net assets | | $27,314,429 | | |
Shares outstanding | | 2,474,893 | | |
Net asset value, offering price, and redemption price per share | | | | $11.04 |
Class R3 shares | | | | |
Net assets | | $10,371,049 | | |
Shares outstanding | | 922,536 | | |
Net asset value, offering price, and redemption price per share | | | | $11.24 |
Class R4 shares | | | | |
Net assets | | $11,559,751 | | |
Shares outstanding | | 1,025,256 | | |
Net asset value, offering price, and redemption price per share | | | | $11.27 |
16
Statement of Assets and Liabilities (unaudited) – continued
| | | | |
Class 529A shares | | | | |
Net assets | | $1,673,001 | | |
Shares outstanding | | 150,108 | | |
Net asset value and redemption price per share | | | | $11.15 |
Offering price per share (100/94.25 × net asset value per share) | | | | $11.83 |
Class 529B shares | | | | |
Net assets | | $474,269 | | |
Shares outstanding | | 44,833 | | |
Net asset value and offering price per share | | | | $10.58 |
Class 529C shares | | | | |
Net assets | | $455,066 | | |
Shares outstanding | | 42,893 | | |
Net asset value and offering price per share | | | | $10.61 |
On sales of $50,000 or more, the offering prices of Class A and Class 529A shares are reduced. A contingent deferred sales charge may be imposed on redemptions of Class A, Class B, Class C, Class 529B, and Class 529C shares.
See Notes to Financial Statements
17
Financial Statements
STATEMENT OF OPERATIONS
Six months ended 3/31/09 (unaudited)
This statement describes how much your fund earned in investment income and accrued in expenses. It also describes any gains and/or losses generated by fund operations.
| | | | | | |
| Net investment income | | | | | | |
Income | | | | | | |
Dividends | | $18,207,643 | | | | |
Dividends from underlying funds | | 73,450 | | | | |
Interest | | 23,859 | | | | |
Foreign taxes withheld | | (867,004 | ) | | | |
Total investment income | | | | | $17,437,948 | |
Expenses | | | | | | |
Management fee | | $8,104,842 | | | | |
Distribution and service fees | | 2,870,907 | | | | |
Program manager fees | | 1,326 | | | | |
Shareholder servicing costs | | 2,386,815 | | | | |
Administrative services fee | | 180,116 | | | | |
Independent trustees’ compensation | | 25,887 | | | | |
Custodian fee | | 533,301 | | | | |
Shareholder communications | | 118,964 | | | | |
Auditing fees | | 24,404 | | | | |
Legal fees | | 35,319 | | | | |
Miscellaneous | | 166,854 | | | | |
Total expenses | | | | | $14,448,735 | |
Fees paid indirectly | | (5,876 | ) | | | |
Reduction of expenses by investment adviser and distributor | | (212,267 | ) | | | |
Net expenses | | | | | $14,230,592 | |
Net investment income | | | | | $3,207,356 | |
Realized and unrealized gain (loss) on investments
and foreign currency transactions | | | | | | |
Realized gain (loss) (identified cost basis) | | | | | | |
Investments transactions: | | | | | | |
Non-affiliated issuers | | $(646,088,351 | ) | | | |
Other affiliated issuers | | (93,120 | ) | | | |
Foreign currency transactions | | (1,177,395 | ) | | | |
Net realized gain (loss) on investments
and foreign currency transactions | | | | | $(647,358,866 | ) |
Change in unrealized appreciation (depreciation) | | | | | | |
Investments (net of $637,326 deferred country tax) | | $(100,843,641 | ) | | | |
Translation of assets and liabilities in foreign currencies | | 374,624 | | | | |
Net unrealized gain (loss) on investments
and foreign currency translation | | | | | $(100,469,017 | ) |
Net realized and unrealized gain (loss) on investments
and foreign currency | | | | | $(747,827,883 | ) |
Change in net assets from operations | | | | | $(744,620,527 | ) |
See Notes to Financial Statements
18
Financial Statements
STATEMENTS OF CHANGES IN NET ASSETS
These statements describe the increases and/or decreases in net assets resulting from operations, any distributions, and any shareholder transactions.
| | | | | | |
| Change in net assets | | Six months ended
3/31/09
(unaudited) | | | Year ended
9/30/08 | |
| From operations | | | | | | |
Net investment income | | $3,207,356 | | | $43,715,130 | |
Net realized gain (loss) on investments and foreign
currency transactions | | (647,358,866 | ) | | 269,691,596 | |
Net unrealized gain (loss) on investments and foreign
currency translation | | (100,469,017 | ) | | (1,617,214,352 | ) |
Change in net assets from operations | | $(744,620,527 | ) | | $(1,303,807,626 | ) |
| Distributions declared to shareholders | | | | | | |
From net investment income | | | | | | |
Class A | | $(20,013,619 | ) | | $(24,163,465 | ) |
Class B | | (885,154 | ) | | (376,544 | ) |
Class C | | (1,158,245 | ) | | (772,620 | ) |
Class I | | (11,935,655 | ) | | (11,893,368 | ) |
Class R (b) | | — | | | (214,881 | ) |
Class R1 | | (21,960 | ) | | (16,669 | ) |
Former Class R2 (b) | | — | | | (15,660 | ) |
Class R2 | | (606,817 | ) | | (275,619 | ) |
Class R3 | | (235,533 | ) | | (214,335 | ) |
Class R4 | | (264,200 | ) | | (220,734 | ) |
Class 529A | | (32,629 | ) | | (21,867 | ) |
Class 529B | | (6,346 | ) | | (837 | ) |
Class 529C | | (4,470 | ) | | (611 | ) |
From net realized gain on investments | | | | | | |
Class A | | (73,151,822 | ) | | (475,752,013 | ) |
Class B | | (7,286,966 | ) | | (50,310,374 | ) |
Class C | | (10,703,711 | ) | | (79,656,967 | ) |
Class I | | (35,178,675 | ) | | (172,293,681 | ) |
Class R (b) | | — | | | (6,170,021 | ) |
Class R1 | | (133,830 | ) | | (668,584 | ) |
Former Class R2 (b) | | — | | | (426,867 | ) |
Class R2 | | (2,364,337 | ) | | (7,439,660 | ) |
Class R3 | | (809,833 | ) | | (4,163,726 | ) |
Class R4 | | (778,692 | ) | | (3,542,386 | ) |
Class 529A | | (130,459 | ) | | (610,379 | ) |
Class 529B | | (40,104 | ) | | (181,931 | ) |
Class 529C | | (33,548 | ) | | (164,118 | ) |
Total distributions declared to shareholders | | $(165,776,605 | ) | | $(839,567,917 | ) |
19
Statements of Changes in Net Assets – continued
| | | | | | |
| | | Six months ended
3/31/09
(unaudited) | | | Year ended
9/30/08 | |
Change in net assets from fund share transactions | | $(247,979,415 | ) | | $(89,732,693 | ) |
Total change in net assets | | $(1,158,376,547 | ) | | $(2,233,108,236 | ) |
| Net assets | | | | | | |
At beginning of period | | 2,608,696,856 | | | 4,841,805,092 | |
At end of period (including undistributed net investment income of $2,635,513 and $34,592,785, respectively) | | $1,450,320,309 | | | $2,608,696,856 | |
| (b) | At the close of business on April 18, 2008, Class R and Class R2 shares converted into Class R3 shares. Following the conversion, Class R3 shares were renamed Class R2 shares. |
See Notes to Financial Statements
20
Financial Statements
FINANCIAL HIGHLIGHTS
The financial highlights table is intended to help you understand the fund’s financial performance for the semiannual period and the past 5 fiscal years (or life of a particular share class, if shorter). Certain information reflects financial results for a single fund share. The total returns in the table represent the rate by which an investor would have earned (or lost) on an investment in the fund share class (assuming reinvestment of all distributions) held for the entire period.
| | | | | | | | | | | | | | | | | | |
| | | Six months
ended
3/31/09 (unaudited) | | | Years ended 9/30 | |
| Class A | | | 2008 | | | 2007 | | | 2006 | | | 2005 | | | 2004 | |
| | | | | | | | | | | | | | | | | |
Net asset value, beginning
of period | | $17.39 | | | $30.87 | | | $26.64 | | | $24.15 | | | $19.62 | | | $15.48 | |
Income (loss) from
investment operations | | | | | | | | | | | | | | | | | | |
Net investment income (d) | | $0.02 | | | $0.27 | | | $0.25 | | | $0.20 | | | $0.11 | | | $0.07 | |
Net realized and unrealized
gain (loss) on investments
and foreign currency | | (4.92 | ) | | (8.25 | ) | | 6.84 | | | 4.07 | | | 5.54 | | | 4.18 | |
Total from investment
operations | | $(4.90 | ) | | $(7.98 | ) | | $7.09 | | | $4.27 | | | $5.65 | | | $4.25 | |
Less distributions declared
to shareholders | | | | | | | | | | | | | | | | | | |
From net investment income | | $(0.26 | ) | | $(0.27 | ) | | $(0.23 | ) | | $(0.13 | ) | | $— | | | $(0.01 | ) |
From net realized gain
on investments | | (0.95 | ) | | (5.23 | ) | | (2.63 | ) | | (1.65 | ) | | (1.12 | ) | | (0.10 | ) |
Total distributions declared
to shareholders | | $(1.21 | ) | | $(5.50 | ) | | $(2.86 | ) | | $(1.78 | ) | | $(1.12 | ) | | $(0.11 | ) |
Redemption fees added to
paid-in capital (d) | | $— | | | $— | | | $ 0.00 | (w) | | $ 0.00 | (w) | | $ 0.00 | (w) | | $ 0.00 | (w) |
Net asset value, end of period | | $11.28 | | | $17.39 | | | $30.87 | | | $26.64 | | | $24.15 | | | $19.62 | |
Total return (%) (r)(s)(t) | | (28.89 | )(n) | | (31.08 | ) | | 28.17 | | | 18.69 | | | 29.77 | | | 27.55 | |
Ratios (%) (to average
net assets) and
Supplemental data: | | | | | | | | | | | | | | | | | | |
Expenses before expense
reductions (f) | | 1.68 | (a) | | 1.50 | | | 1.51 | | | 1.55 | | | 1.61 | | | 1.63 | |
Expenses after expense
reductions (f) | | 1.63 | (a) | | 1.45 | | | 1.46 | | | 1.55 | | | 1.61 | | | 1.63 | |
Net investment income | | 0.40 | (a) | | 1.14 | | | 0.88 | | | 0.77 | | | 0.49 | | | 0.38 | |
Portfolio turnover | | 22 | | | 66 | | | 67 | | | 68 | | | 55 | | | 61 | |
Net assets at end of period
(000 Omitted) | | $843,042 | | | $1,472,636 | | | $2,891,693 | | | $2,635,185 | | | $1,984,799 | | | $1,033,312 | |
See Notes to Financial Statements
21
Financial Highlights – continued
| | | | | | | | | | | | | | | | | | |
| | | Six months
ended
3/31/09
(unaudited) | | | Years ended 9/30 | |
| Class B | | | 2008 | | | 2007 | | | 2006 | | | 2005 | | | 2004 | |
| | | | | | | | | | | | | | | | | |
Net asset value, beginning
of period | | $16.66 | | | $29.76 | | | $25.77 | | | $23.44 | | | $19.19 | | | $15.23 | |
Income (loss) from
investment operations | | | | | | | | | | | | | | | | | | |
Net investment income
(loss) (d) | | $(0.02 | ) | | $0.10 | | | $0.05 | | | $0.03 | | | $(0.04 | ) | | $(0.05 | ) |
Net realized and unrealized
gain (loss) on investments
and foreign currency | | (4.71 | ) | | (7.93 | ) | | 6.61 | | | 3.95 | | | 5.41 | | | 4.11 | |
Total from investment
operations | | $(4.73 | ) | | $(7.83 | ) | | $6.66 | | | $3.98 | | | $5.37 | | | $4.06 | |
Less distributions declared
to shareholders | | | | | | | | | | | | | | | | | | |
From net investment income | | $(0.12 | ) | | $(0.04 | ) | | $(0.04 | ) | | $— | | | $— | | | $— | |
From net realized gain
on investments | | (0.95 | ) | | (5.23 | ) | | (2.63 | ) | | (1.65 | ) | | (1.12 | ) | | (0.10 | ) |
Total distributions declared
to shareholders | | $(1.07 | ) | | $(5.27 | ) | | $(2.67 | ) | | $(1.65 | ) | | $(1.12 | ) | | $(0.10 | ) |
Redemption fees added to
paid-in capital (d) | | $— | | | $— | | | $0.00 | (w) | | $0.00 | (w) | | $0.00 | (w) | | $0.00 | (w) |
Net asset value, end of period | | $10.86 | | | $16.66 | | | $29.76 | | | $25.77 | | | $23.44 | | | $19.19 | |
Total return (%) (r)(s)(t) | | (29.08 | )(n) | | (31.57 | ) | | 27.30 | | | 17.92 | | | 28.94 | | | 26.73 | |
Ratios (%) (to average
net assets) and
Supplemental data: | | | | | | | | | | | | | | | | | | |
Expenses before expense
reductions (f) | | 2.34 | (a) | | 2.15 | | | 2.16 | | | 2.20 | | | 2.26 | | | 2.28 | |
Expenses after expense
reductions (f) | | 2.34 | (a) | | 2.15 | | | 2.16 | | | 2.20 | | | 2.26 | | | 2.28 | |
Net investment income (loss) | | (0.33 | )(a) | | 0.42 | | | 0.16 | | | 0.10 | | | (0.21 | ) | | (0.28 | ) |
Portfolio turnover | | 22 | | | 66 | | | 67 | | | 68 | | | 55 | | | 61 | |
Net assets at end of period
(000 Omitted) | | $76,791 | | | $143,620 | | | $301,724 | | | $311,077 | | | $277,244 | | | $186,920 | |
See Notes to Financial Statements
22
Financial Highlights – continued
| | | | | | | | | | | | | | | | | | |
| | | Six months
ended
3/31/09
(unaudited) | | | Years ended 9/30 | |
| Class C | | | 2008 | | | 2007 | | | 2006 | | | 2005 | | | 2004 | |
| | | | | | | | | | | | | | | | | |
Net asset value, beginning
of period | | $16.61 | | | $29.69 | | | $25.74 | | | $23.41 | | | $19.17 | | | $15.22 | |
Income (loss) from
investment operations | | | | | | | | | | | | | | | | | | |
Net investment income
(loss) (d) | | $(0.02 | ) | | $0.09 | | | $0.05 | | | $0.03 | | | $(0.04 | ) | | $(0.05 | ) |
Net realized and unrealized
gain (loss) on investments
and foreign currency | | (4.71 | ) | | (7.89 | ) | | 6.59 | | | 3.95 | | | 5.40 | | | 4.10 | |
Total from investment
operations | | $(4.73 | ) | | $(7.80 | ) | | $6.64 | | | $3.98 | | | $5.36 | | | $4.05 | |
Less distributions declared
to shareholders | | | | | | | | | | | | | | | | | | |
From net investment income | | $(0.10 | ) | | $(0.05 | ) | | $(0.06 | ) | | $(0.00 | )(w) | | $— | | | $— | |
From net realized gain
on investments | | (0.95 | ) | | (5.23 | ) | | (2.63 | ) | | (1.65 | ) | | (1.12 | ) | | (0.10 | ) |
Total distributions declared
to shareholders | | $(1.05 | ) | | $(5.28 | ) | | $(2.69 | ) | | $(1.65 | ) | | $(1.12 | ) | | $(0.10 | ) |
Redemption fees added to
paid-in capital (d) | | $— | | | $— | | | $0.00 | (w) | | $0.00 | (w) | | $0.00 | (w) | | $0.00 | (w) |
Net asset value, end of period | | $10.83 | | | $16.61 | | | $29.69 | | | $25.74 | | | $23.41 | | | $19.17 | |
Total return (%) (r)(s)(t) | | (29.12 | )(n) | | (31.55 | ) | | 27.24 | | | 17.96 | | | 28.92 | | | 26.69 | |
Ratios (%) (to average
net assets) and
Supplemental data: | | | | | | | | | | | | | | | | | | |
Expenses before expense
reductions (f) | | 2.34 | (a) | | 2.15 | | | 2.16 | | | 2.20 | | | 2.26 | | | 2.28 | |
Expenses after expense
reductions (f) | | 2.34 | (a) | | 2.15 | | | 2.16 | | | 2.20 | | | 2.26 | | | 2.28 | |
Net investment income (loss) | | (0.33 | )(a) | | 0.41 | | | 0.18 | | | 0.11 | | | (0.17 | ) | | (0.26 | ) |
Portfolio turnover | | 22 | | | 66 | | | 67 | | | 68 | | | 55 | | | 61 | |
Net assets at end of period
(000 Omitted) | | $113,397 | | | $220,821 | | | $472,596 | | | $435,798 | | | $339,331 | | | $189,941 | |
See Notes to Financial Statements
23
Financial Highlights – continued
| | | | | | | | | | | | | | | | | | |
| | | Six months
ended
3/31/09
(unaudited) | | | Years ended 9/30 | |
| Class I | | | 2008 | | | 2007 | | | 2006 | | | 2005 | | | 2004 | |
| | | | | | | | | | | | | | | | | |
Net asset value, beginning
of period | | $17.85 | | | $31.55 | | | $27.18 | | | $24.59 | | | $19.89 | | | $15.65 | |
Income (loss) from
investment operations | | | | | | | | | | | | | | | | | | |
Net investment income (d) | | $0.04 | | | $0.37 | | | $0.35 | | | $0.29 | | | $0.19 | | | $0.14 | |
Net realized and unrealized
gain (loss) on investments
and foreign currency | | (5.05 | ) | | (8.48 | ) | | 6.97 | | | 4.14 | | | 5.63 | | | 4.23 | |
Total from investment
operations | | $(5.01 | ) | | $(8.11 | ) | | $7.32 | | | $4.43 | | | $5.82 | | | $4.37 | |
Less distributions declared
to shareholders | | | | | | | | | | | | | | | | | | |
From net investment income | | $(0.32 | ) | | $(0.36 | ) | | $(0.32 | ) | | $(0.19 | ) | | $— | | | $(0.03 | ) |
From net realized gain
on investments | | (0.95 | ) | | (5.23 | ) | | (2.63 | ) | | (1.65 | ) | | (1.12 | ) | | (0.10 | ) |
Total distributions declared
to shareholders | | $(1.27 | ) | | $(5.59 | ) | | $(2.95 | ) | | $(1.84 | ) | | $(1.12 | ) | | $(0.13 | ) |
Redemption fees added to
paid-in capital (d) | | $— | | | $— | | | $0.00 | (w) | | $0.00 | (w) | | $0.00 | (w) | | $0.00 | (w) |
Net asset value, end of period | | $11.57 | | | $17.85 | | | $31.55 | | | $27.18 | | | $24.59 | | | $19.89 | |
Total return (%) (r)(s) | | (28.78 | )(n) | | (30.87 | ) | | 28.54 | | | 19.09 | | | 30.24 | | | 28.05 | |
Ratios (%) (to average
net assets) and
Supplemental data: | | | | | | | | | | | | | | | | | | |
Expenses before expense
reductions (f) | | 1.34 | (a) | | 1.15 | | | 1.16 | | | 1.20 | | | 1.26 | | | 1.29 | |
Expenses after expense
reductions (f) | | 1.34 | (a) | | 1.15 | | | 1.16 | | | 1.20 | | | 1.26 | | | 1.29 | |
Net investment income | | 0.64 | (a) | | 1.51 | | | 1.19 | | | 1.11 | | | 0.87 | | | 0.75 | |
Portfolio turnover | | 22 | | | 66 | | | 67 | | | 68 | | | 55 | | | 61 | |
Net assets at end of period
(000 Omitted) | | $363,662 | | | $691,978 | | | $1,040,477 | | | $791,709 | | | $515,202 | | | $232,247 | |
See Notes to Financial Statements
24
Financial Highlights – continued
| | | | | | | | | | | | | | | |
| | | Six months
ended
3/31/09 (unaudited) | | | Years ended 9/30 | |
| Class R1 | | | 2008 | | | 2007 | | | 2006 | | | 2005 (i) | |
| | | | | | | | | | | | | | |
Net asset value, beginning of period | | $16.37 | | | $29.42 | | | $25.58 | | | $23.43 | | | $21.18 | |
Income (loss) from
investment operations | | | | | | | | | | | | | | | |
Net investment income (loss) (d) | | $(0.01 | ) | | $0.10 | | | $0.05 | | | $0.01 | | | $0.00 | (w) |
Net realized and unrealized gain
(loss) on investments and
foreign currency | | (4.64 | ) | | (7.79 | ) | | 6.50 | | | 3.93 | | | 2.25 | (g) |
Total from investment operations | | $(4.65 | ) | | $(7.69 | ) | | $6.55 | | | $3.94 | | | $2.25 | |
Less distributions declared
to shareholders | | | | | | | | | | | | | | | |
From net investment income | | $(0.16 | ) | | $(0.13 | ) | | $(0.08 | ) | | $(0.14 | ) | | $— | |
From net realized gain
on investments | | (0.95 | ) | | (5.23 | ) | | (2.63 | ) | | (1.65 | ) | | — | |
Total distributions declared
to shareholders | | $(1.11 | ) | | $(5.36 | ) | | $(2.71 | ) | | $(1.79 | ) | | $— | |
Redemption fees added to
paid-in capital (d) | | $— | | | $— | | | $0.00 | (w) | | $0.00 | (w) | | $0.00 | (w) |
Net asset value, end of period | | $10.61 | | | $16.37 | | | $29.42 | | | $25.58 | | | $23.43 | |
Total return (%) (r)(s) | | (29.13 | )(n) | | (31.54 | ) | | 27.10 | | | 17.83 | | | 10.62(n | ) |
Ratios (%) (to average net assets)
and Supplemental data: | | | | | | | | | | | | | | | |
Expenses before expense reductions (f) | | 2.34 | (a) | | 2.20 | | | 2.30 | | | 2.40 | | | 2.47 | (a) |
Expenses after expense reductions (f) | | 2.34 | (a) | | 2.20 | | | 2.26 | | | 2.30 | | | 2.47 | (a) |
Net investment income (loss) | | (0.26 | )(a) | | 0.44 | | | 0.17 | | | 0.05 | | | 0.01 | (a) |
Portfolio turnover | | 22 | | | 66 | | | 67 | | | 68 | | | 55 | |
Net assets at end of period
(000 Omitted) | | $1,581 | | | $2,399 | | | $3,413 | | | $1,287 | | | $192 | |
See Notes to Financial Statements
25
Financial Highlights – continued
| | | | | | | | | | | | | | | | | | |
| | | Six months
ended
3/31/09
(unaudited) | | | Years ended 9/30 | |
| Class R2 | | | 2008 | | | 2007 | | | 2006 | | | 2005 | | | 2004 (i) | |
| | | | | | | | | | | | | | | | | |
Net asset value, beginning
of period | | $17.04 | | | $30.35 | | | $26.27 | | | $23.91 | | | $19.51 | | | $16.95 | |
Income (loss) from
investment operations | | | | | | | | | | | | | | | | | | |
Net investment income
(loss) (d) | | $0.01 | | | $0.29 | | | $0.16 | | | $0.14 | | | $0.10 | | | $(0.11 | ) |
Net realized and unrealized
gain (loss) on investments
and foreign currency | | (4.82 | ) | | (8.18 | ) | | 6.73 | | | 4.01 | | | 5.42 | | | 2.80 | |
Total from investment
operations | | $(4.81 | ) | | $(7.89 | ) | | $6.89 | | | $4.15 | | | $5.52 | | | $2.69 | |
Less distributions declared
to shareholders | | | | | | | | | | | | | | | | | | |
From net investment income | | $(0.24 | ) | | $(0.19 | ) | | $(0.18 | ) | | $(0.14 | ) | | $— | | | $(0.03 | ) |
From net realized gain
on investments | | (0.95 | ) | | (5.23 | ) | | (2.63 | ) | | (1.65 | ) | | (1.12 | ) | | (0.10 | ) |
Total distributions declared
to shareholders | | $(1.19 | ) | | $(5.42 | ) | | $(2.81 | ) | | $(1.79 | ) | | $(1.12 | ) | | $(0.13 | ) |
Redemption fees added to
paid-in capital (d) | | $— | | | $— | | | $0.00 | (w) | | $0.00 | (w) | | $0.00 | (w) | | $0.00 | (w) |
Net asset value, end of period | | $11.04 | | | $17.04 | | | $30.35 | | | $26.27 | | | $23.91 | | | $19.51 | |
Total return (%) (r)(s) | | (28.92 | )(n) | | (31.24 | ) | | 27.75 | | | 18.36 | | | 29.25 | | | 15.99 | (n) |
Ratios (%) (to average
net assets) and
Supplemental data: | | | | | | | | | | | | | | | | | | |
Expenses before expense
reductions (f) | | 1.84 | (a) | | 1.68 | | | 1.85 | | | 1.95 | | | 2.01 | | | 2.05 | (a) |
Expenses after expense
reductions (f) | | 1.84 | (a) | | 1.68 | | | 1.81 | | | 1.85 | | | 2.01 | | | 2.05 | (a) |
Net investment income (loss) | | 0.21 | (a) | | 1.27 | | | 0.57 | | | 0.54 | | | 0.44 | | | (0.70 | )(a) |
Portfolio turnover | | 22 | | | 66 | | | 67 | | | 68 | | | 55 | | | 61 | |
Net assets at end of period
(000 Omitted) | | $27,314 | | | $44,529 | | | $40,709 | | | $23,313 | | | $4,468 | | | $259 | |
See Notes to Financial Statements
26
Financial Highlights – continued
| | | | | | | | | | | | | | | |
| | | Six months
ended
3/31/09
(unaudited) | | | Years ended 9/30 | |
| Class R3 | | | 2008 | | | 2007 | | | 2006 | | | 2005 (i) | |
| | | | | | | | | | | | | | |
Net asset value, beginning of period | | $17.34 | | | $30.82 | | | $26.64 | | | $24.15 | | | $21.75 | |
Income (loss) from
investment operations | | | | | | | | | | | | | | | |
Net investment income (d) | | $0.03 | | | $0.29 | | | $0.24 | | | $0.21 | | | $0.12 | |
Net realized and unrealized gain
(loss) on investments and
foreign currency | | (4.90 | ) | | (8.27 | ) | | 6.82 | | | 4.06 | | | 2.28 | (g) |
Total from investment operations | | $(4.87 | ) | | $(7.98 | ) | | $7.06 | | | $4.27 | | | $2.40 | |
Less distributions declared
to shareholders | | | | | | | | | | | | | | | |
From net investment income | | $(0.28 | ) | | $(0.27 | ) | | $(0.25 | ) | | $(0.13 | ) | | $— | |
From net realized gain
on investments | | (0.95 | ) | | (5.23 | ) | | (2.63 | ) | | (1.65 | ) | | — | |
Total distributions declared
to shareholders | | $(1.23 | ) | | $(5.50 | ) | | $(2.88 | ) | | $(1.78 | ) | | $— | |
Redemption fees added to
paid-in capital (d) | | $— | | | $— | | | $0.00 | (w) | | $0.00 | (w) | | $0.00 | (w) |
Net asset value, end of period | | $11.24 | | | $17.34 | | | $30.82 | | | $26.64 | | | $24.15 | |
Total return (%) (r)(s) | | (28.83 | )(n) | | (31.12 | ) | | 28.08 | | | 18.71 | | | 11.03 | (n) |
Ratios (%) (to average net assets)
and Supplemental data: | | | | | | | | | | | | | | | |
Expenses before expense reductions (f) | | 1.59 | (a) | | 1.44 | | | 1.56 | | | 1.59 | | | 1.68 | (a) |
Expenses after expense reductions (f) | | 1.59 | (a) | | 1.44 | | | 1.56 | | | 1.59 | | | 1.68 | (a) |
Net investment income | | 0.50 | (a) | | 1.25 | | | 0.84 | | | 0.80 | | | 1.11 | (a) |
Portfolio turnover | | 22 | | | 66 | | | 67 | | | 68 | | | 55 | |
Net assets at end of period
(000 Omitted) | | $10,371 | | | $15,391 | | | $21,806 | | | $8,192 | | | $56 | |
See Notes to Financial Statements
27
Financial Highlights – continued
| | | | | | | | | | | | | | | |
| | | Six months
ended
3/31/09
(unaudited) | | | Years ended 9/30 | |
| Class R4 | | | 2008 | | | 2007 | | | 2006 | | | 2005 (i) | |
| | | | | | | | | | | | | | |
Net asset value, beginning of period | | $17.43 | | | $30.92 | | | $26.70 | | | $24.19 | | | $21.75 | |
Income (loss) from
investment operations | | | | | | | | | | | | | | | |
Net investment income (d) | | $0.05 | | | $0.35 | | | $0.34 | | | $0.14 | | | $0.16 | |
Net realized and unrealized gain
(loss) on investments and
foreign currency | | (4.94 | ) | | (8.28 | ) | | 6.81 | | | 4.20 | | | 2.28 | (g) |
Total from investment operations | | $(4.89 | ) | | $(7.93 | ) | | $7.15 | | | $4.34 | | | $2.44 | |
Less distributions declared
to shareholders | | | | | | | | | | | | | | | |
From net investment income | | $(0.32 | ) | | $(0.33 | ) | | $(0.30 | ) | | $(0.18 | ) | | $— | |
From net realized gain
on investments | | (0.95 | ) | | (5.23 | ) | | (2.63 | ) | | (1.65 | ) | | — | |
Total distributions declared
to shareholders | | $(1.27 | ) | | $(5.56 | ) | | $(2.93 | ) | | $(1.83 | ) | | $— | |
Redemption fees added to
paid-in capital (d) | | $— | | | $— | | | $0.00 | (w) | | $0.00 | (w) | | $0.00 | (w) |
Net asset value, end of period | | $11.27 | | | $17.43 | | | $30.92 | | | $26.70 | | | $24.19 | |
Total return (%) (r)(s) | | (28.79 | )(n) | | (30.90 | ) | | 28.42 | | | 19.00 | | | 11.22 | (n) |
Ratios (%) (to average net assets)
and Supplemental data: | | | | | | | | | | | | | | | |
Expenses before expense reductions (f) | | 1.34 | (a) | | 1.18 | | | 1.26 | | | 1.30 | | | 1.37 | (a) |
Expenses after expense reductions (f) | | 1.34 | (a) | | 1.18 | | | 1.26 | | | 1.30 | | | 1.37 | (a) |
Net investment income | | 0.84 | (a) | | 1.45 | | | 1.13 | | | 0.52 | | | 1.41 | (a) |
Portfolio turnover | | 22 | | | 66 | | | 67 | | | 68 | | | 55 | |
Net assets at end of period
(000 Omitted) | | $11,560 | | | $13,716 | | | $22,080 | | | $16,063 | | | $56 | |
See Notes to Financial Statements
28
Financial Highlights – continued
| | | | | | | | | | | | | | | | | | |
| | | Six months
ended
3/31/09
(unaudited) | | | Years ended 9/30 | |
| Class 529A | | | 2008 | | | 2007 | | | 2006 | | | 2005 | | | 2004 | |
| | | | | | | | | | | | | | | | | |
Net asset value, beginning
of period | | $17.18 | | | $30.54 | | | $26.40 | | | $23.97 | | | $19.52 | | | $15.43 | |
Income (loss) from
investment operations | | | | | | | | | | | | | | | | | | |
Net investment income (d) | | $0.02 | | | $0.23 | | | $0.17 | | | $0.13 | | | $0.05 | | | $0.03 | |
Net realized and unrealized
gain (loss) on investments
and foreign currency | | (4.86 | ) | | (8.17 | ) | | 6.76 | | | 4.04 | | | 5.52 | | | 4.16 | |
Total from investment
operations | | $(4.84 | ) | | $(7.94 | ) | | $6.93 | | | $4.17 | | | $5.57 | | | $4.19 | |
Less distributions declared
to shareholders | | | | | | | | | | | | | | | | | | |
From net investment income | | $(0.24 | ) | | $(0.19 | ) | | $(0.16 | ) | | $(0.09 | ) | | $— | | | $— | |
From net realized gain
on investments | | (0.95 | ) | | (5.23 | ) | | (2.63 | ) | | (1.65 | ) | | (1.12 | ) | | (0.10 | ) |
Total distributions declared
to shareholders | | $(1.19 | ) | | $(5.42 | ) | | $(2.79 | ) | | $(1.74 | ) | | $(1.12 | ) | | $(0.10 | ) |
Redemption fees added to
paid-in capital (d) | | $— | | | $— | | | $0.00 | (w) | | $0.00 | (w) | | $0.00 | (w) | | $0.00 | (w) |
Net asset value, end of period | | $11.15 | �� | | $17.18 | | | $30.54 | | | $26.40 | | | $23.97 | | | $19.52 | |
Total return (%) (r)(s)(t) | | (28.89 | )(n) | | (31.22 | ) | | 27.78 | | | 18.38 | | | 29.50 | | | 27.23 | |
Ratios (%) (to average
net assets) and
Supplemental data: | | | | | | | | | | | | | | | | | | |
Expenses before expense
reductions (f) | | 1.77 | (a) | | 1.68 | | | 1.76 | | | 1.80 | | | 1.86 | | | 1.88 | |
Expenses after expense
reductions (f) | | 1.77 | (a) | | 1.68 | | | 1.76 | | | 1.80 | | | 1.86 | | | 1.88 | |
Net investment income | | 0.33 | (a) | | 1.00 | | | 0.58 | | | 0.52 | | | 0.25 | | | 0.16 | |
Portfolio turnover | | 22 | | | 66 | | | 67 | | | 68 | | | 55 | | | 61 | |
Net assets at end of period
(000 Omitted) | | $1,673 | | | $2,337 | | | $3,566 | | | $2,642 | | | $1,731 | | | $806 | |
See Notes to Financial Statements
29
Financial Highlights – continued
| | | | | | | | | | | | | | | | | | |
| | | Six months
ended
3/31/09
(unaudited) | | | Years ended 9/30 | |
| Class 529B | | | 2008 | | | 2007 | | | 2006 | | | 2005 | | | 2004 | |
| | | | | | | | | | | | | | | | | |
Net asset value, beginning
of period | | $16.32 | | | $29.29 | | | $25.48 | | | $23.25 | | | $19.09 | | | $15.19 | |
Income (loss) from
investment operations | | | | | | | | | | | | | | | | | | |
Net investment income
(loss) (d) | | $(0.02 | ) | | $0.07 | | | $(0.01 | ) | | $(0.03 | ) | | $(0.09 | ) | | $(0.09 | ) |
Net realized and unrealized
gain (loss) on investments
and foreign currency | | (4.62 | ) | | (7.79 | ) | | 6.50 | | | 3.91 | | | 5.37 | | | 4.09 | |
Total from investment
operations | | $(4.64 | ) | | $(7.72 | ) | | $6.49 | | | $3.88 | | | $5.28 | | | $4.00 | |
Less distributions declared
to shareholders | | | | | | | | | | | | | | | | | | |
From net investment income | | $(0.15 | ) | | $(0.02 | ) | | $(0.05 | ) | | $— | | | $— | | | $— | |
From net realized gain
on investments | | (0.95 | ) | | (5.23 | ) | | (2.63 | ) | | (1.65 | ) | | (1.12 | ) | | (0.10 | ) |
Total distributions declared
to shareholders | | $(1.10 | ) | | $(5.25 | ) | | $(2.68 | ) | | $(1.65 | ) | | $(1.12 | ) | | $(0.10 | ) |
Redemption fees added to
paid-in capital (d) | | $— | | | $— | | | $0.00 | (w) | | $0.00 | (w) | | $0.00 | (w) | | $0.00 | (w) |
Net asset value, end of period | | $10.58 | | | $16.32 | | | $29.29 | | | $25.48 | | | $23.25 | | | $19.09 | |
Total return (%) (r)(s)(t) | | (29.13 | )(n) | | (31.69 | ) | | 26.93 | | | 17.62 | | | 28.61 | | | 26.41 | |
Ratios (%) (to average
net assets) and
Supplemental data: | | | | | | | | | | | | | | | | | | |
Expenses before expense
reductions (f) | | 2.44 | (a) | | 2.33 | | | 2.41 | | | 2.45 | | | 2.50 | | | 2.53 | |
Expenses after expense
reductions (f) | | 2.44 | (a) | | 2.33 | | | 2.41 | | | 2.45 | | | 2.50 | | | 2.53 | |
Net investment income (loss) | | (0.33 | )(a) | | 0.31 | | | (0.04 | ) | | (0.10 | ) | | (0.44 | ) | | (0.52 | ) |
Portfolio turnover | | 22 | | | 66 | | | 67 | | | 68 | | | 55 | | | 61 | |
Net assets at end of period
(000 Omitted) | | $474 | | | $652 | | | $1,007 | | | $727 | | | $297 | | | $172 | |
See Notes to Financial Statements
30
Financial Highlights – continued
| | | | | | | | | | | | | | | | | | |
| | | Six months
ended
3/31/09
(unaudited) | | | Years ended 9/30 | |
| Class 529C | | | 2008 | | | 2007 | | | 2006 | | | 2005 | | | 2004 | |
| | | | | | | | | | | | | | | | | |
Net asset value, beginning
of period | | $16.33 | | | $29.31 | | | $25.45 | | | $23.22 | | | $19.07 | | | $15.17 | |
Income (loss) from
investment operations | | | | | | | | | | | | | | | | | | |
Net investment income
(loss) (d) | | $(0.02 | ) | | $0.08 | | | $(0.02 | ) | | $(0.04 | ) | | $(0.08 | ) | | $(0.09 | ) |
Net realized and unrealized
gain (loss) on investments
and foreign currency | | (4.62 | ) | | (7.81 | ) | | 6.52 | | | 3.92 | | | 5.35 | | | 4.09 | |
Total from investment
operations | | $(4.64 | ) | | $(7.73 | ) | | $6.50 | | | $3.88 | | | $5.27 | | | $4.00 | |
Less distributions declared
to shareholders | | | | | | | | | | | | | | | | | | |
From net investment income | | $(0.13 | ) | | $(0.02 | ) | | $(0.01 | ) | | $— | | | $— | | | $— | |
From net realized gain
on investments | | (0.95 | ) | | (5.23 | ) | | (2.63 | ) | | (1.65 | ) | | (1.12 | ) | | (0.10 | ) |
Total distributions declared
to shareholders | | $(1.08 | ) | | $(5.25 | ) | | $(2.64 | ) | | $(1.65 | ) | | $(1.12 | ) | | $(0.10 | ) |
Redemption fees added to
paid-in capital (d) | | $— | | | $— | | | $0.00 | (w) | | $0.00 | (w) | | $0.00 | (w) | | $0.00 | (w) |
Net asset value, end of period | | $10.61 | | | $16.33 | | | $29.31 | | | $25.45 | | | $23.22 | | | $19.07 | |
Total return (%) (r)(s)(t) | | (29.12 | )(n) | | (31.72 | ) | | 26.97 | | | 17.64 | | | 28.58 | | | 26.44 | |
Ratios (%) (to average
net assets) and
Supplemental data: | | | | | | | | | | | | | | | | | | |
Expenses before expense
reductions (f) | | 2.44 | (a) | | 2.33 | | | 2.41 | | | 2.45 | | | 2.50 | | | 2.53 | |
Expenses after expense
reductions (f) | | 2.44 | (a) | | 2.33 | | | 2.41 | | | 2.45 | | | 2.50 | | | 2.53 | |
Net investment income (loss) | | (0.28 | )(a) | | 0.35 | | | (0.06 | ) | | (0.14 | ) | | (0.39 | ) | | (0.50 | ) |
Portfolio turnover | | 22 | | | 66 | | | 67 | | | 68 | | | 55 | | | 61 | |
Net assets at end of period
(000 Omitted) | | $455 | | | $617 | | | $895 | | | $688 | | | $504 | | | $252 | |
See Notes to Financial Statements
31
Financial Highlights – continued
| (d) | Per share data is based on average shares outstanding. |
| (f) | Ratios do not reflect reductions from fees paid indirectly, if applicable. |
| (g) | The per share amount is not in accordance with the net realized and unrealized gain/loss for the period because of the timing of sales of fund shares and the per share amount of realized and unrealized gains and losses at such time. |
| (i) | For the period from the class’ inception, October 31, 2003 (Class R2) and April 1, 2005 (Classes R1, R3, and R4) through the stated period end. |
| (r) | Certain expenses have been reduced without which performance would have been lower. |
| (s) | From time to time the fund may receive proceeds from litigation settlements, without which performance would be lower. |
| (t) | Total returns do not include any applicable sales charges. |
| (w) | Per share amount was less than $0.01. |
See Notes to Financial Statements
32
NOTES TO FINANCIAL STATEMENTS
(unaudited)
| (1) | | Business and Organization |
MFS International New Discovery Fund (the fund) is a series of MFS Series Trust V (the trust). The trust is organized as a Massachusetts business trust and is registered under the Investment Company Act of 1940, as amended, as an open-end management investment company.
| (2) | | Significant Accounting Policies |
General – The preparation of financial statements in conformity with U.S. generally accepted accounting principles requires management to make estimates and assumptions that affect the reported amounts of assets and liabilities, and disclosure of contingent assets and liabilities at the date of the financial statements and the reported amounts of revenues and expenses during the reporting period. Actual results could differ from those estimates. The fund can invest in foreign securities, including securities of emerging market issuers. Investments in foreign securities are vulnerable to the effects of changes in the relative values of the local currency and the U.S. dollar and to the effects of changes in each country’s legal, political, and economic environment. The markets of emerging markets countries are generally more volatile than the markets of developed countries with more mature economies. All of the risks of investing in foreign securities previously described are heightened when investing in emerging markets countries.
In March 2008, FASB Statement No. 161, Disclosures about Derivative Instruments and Hedging Activities (the “Standard”) was issued, and is effective for financial statements issued for fiscal years and interim periods beginning after November 15, 2008. This Standard provides enhanced disclosures about the fund’s use of and accounting for derivative instruments and the effect of derivative instruments on the fund’s results of operations and financial position. Management is evaluating the application of the Standard to the fund, and believes the impact resulting from the adoption of this Standard will be limited to expanded disclosures in the fund’s financial statements.
FASB Staff Position (FSP) 133-1 was implemented during the period. FSP 133-1 amends FAS 133 to require sellers of credit derivatives to make disclosures that will enable financial statement users to assess the potential effects of those credit derivatives on an entity’s financial position, financial performance and cash flows. There was no impact from implementing FSP 133-1 as the fund did not hold any of these credit derivatives at period end.
Investment Valuations – Equity securities, including restricted equity securities, are generally valued at the last sale or official closing price as provided by a third-party pricing service on the market or exchange on which they are primarily traded. For securities for which there were no sales reported
33
Notes to Financial Statements (unaudited) – continued
that day, equity securities are generally valued at the last quoted daily bid quotation as provided by a third-party pricing service on the market or exchange on which such securities are primarily traded. For securities held short for which there were no sales reported for that day, the position is generally valued at the last quoted daily ask quotation as provided by a third-party pricing service on the market or exchange on which such securities are primarily traded. Short-term instruments with a maturity at issuance of 60 days or less generally are valued at amortized cost, which approximates market value. Open-end investment companies are generally valued at net asset value per share. Securities and other assets generally valued on the basis of information from a third-party pricing service may also be valued at a broker/dealer bid quotation. Values obtained from pricing services can utilize both dealer-supplied valuations and electronic data processing techniques, which take into account factors such as institutional-size trading in similar groups of securities, yield, quality, coupon rate, maturity, type of issue, trading characteristics, and other market data. The values of foreign securities and other assets and liabilities expressed in foreign currencies are converted to U.S. dollars using the mean of bid and asked prices for rates provided by a third-party pricing service.
The Board of Trustees has delegated primary responsibility for determining or causing to be determined the value of the fund’s investments (including any fair valuation) to the adviser pursuant to valuation policies and procedures approved by the Board. If the adviser determines that reliable market quotations are not readily available, investments are valued at fair value as determined in good faith by the adviser in accordance with such procedures under the oversight of the Board of Trustees. Under the fund’s valuation policies and procedures, market quotations are not considered to be readily available for most types of debt instruments and floating rate loans and many types of derivatives. These investments are generally valued at fair value based on information from third-party pricing services. In addition, investments may be valued at fair value if the adviser determines that an investment’s value has been materially affected by events occurring after the close of the exchange or market on which the investment is principally traded (such as foreign exchange or market) and prior to the determination of the fund’s net asset value, or after the halting of trading of a specific security where trading does not resume prior to the close of the exchange or market on which the security is principally traded. Events that occur on a frequent basis after foreign markets close (such as developments in foreign markets and significant movements in the U.S. markets) and prior to the determination of the fund’s net asset value may be deemed to have a material affect on the value of securities traded in foreign markets. Accordingly, the fund’s foreign equity securities may often be valued at fair value. The adviser generally relies on
34
Notes to Financial Statements (unaudited) – continued
third-party pricing services or other information (such as the correlation with price movements of similar securities in the same or other markets; the type, cost and investment characteristics of the security; the business and financial condition of the issuer; and trading and other market data) to assist in determining whether to fair value and at what value to fair value an investment. The value of an investment for purposes of calculating the fund’s net asset value can differ depending on the source and method used to determine value. When fair valuation is used, the value of an investment used to determine the fund’s net asset value may differ from quoted or published prices for the same investment. There can be no assurance that the fund could obtain the fair value assigned to an investment if it were to sell the investment at the same time at which the fund determines its net asset value per share.
The fund adopted FASB Statement No. 157, Fair Value Measurements (the “Statement”). This Statement provides a single definition of fair value, a hierarchy for measuring fair value and expanded disclosures about fair value measurements.
Various inputs are used in determining the value of the fund’s assets or liabilities carried at market value. These inputs are categorized into three broad levels. Level 1 includes quoted prices in active markets for identical assets or liabilities. Level 2 includes other significant observable market-based inputs (including quoted prices for similar securities, interest rates, prepayment speed, and credit risk). Level 3 includes unobservable inputs, which may include the adviser’s own assumptions in determining the fair value of investments. Other financial instruments are derivative instruments not reflected in total investments, such as futures, forwards, swap contracts and written options. The following is a summary of the levels used as of March 31, 2009 in valuing the fund’s assets or liabilities carried at market value:
| | | | | | | | |
| | | Level 1 | | Level 2 | | Level 3 | | Total |
| Investments in Securities | | $1,047,657,887 | | $398,593,365 | | $— | | $1,446,251,253 |
| Other Financial Instruments | | $— | | $— | | $— | | $— |
Repurchase Agreements – The fund may enter into repurchase agreements with approved counterparties. Each repurchase agreement is recorded at cost. The fund requires that the securities collateral in a repurchase transaction be transferred to a custodian. The fund monitors, on a daily basis, the value of the collateral to ensure that its value, including accrued interest, is greater than amounts owed to the fund under each such repurchase agreement.
Foreign Currency Translation – Purchases and sales of foreign investments, income, and expenses are converted into U.S. dollars based upon currency exchange rates prevailing on the respective dates of such transactions or on the reporting date for foreign denominated receivables and payables. Gains and losses attributable to foreign currency exchange rates on sales of securities are recorded for financial statement purposes as net realized gains and losses on investments.
35
Notes to Financial Statements (unaudited) – continued
Gains and losses attributable to foreign exchange rate movements on receivables, payables, income and expenses are recorded for financial statement purposes as foreign currency transaction gains and losses. That portion of both realized and unrealized gains and losses on investments that results from fluctuations in foreign currency exchange rates is not separately disclosed.
Security Loans – JPMorgan Chase and Co. (“Chase”), as lending agent, may loan the securities of the fund to certain qualified institutions (the “Borrowers”) approved by the fund. The loans are collateralized by cash and/or U.S. Treasury and federal agency obligations in an amount typically at least equal to the market value of the securities loaned. The market value of the loaned securities is determined at the close of business of the fund and any additional required collateral is delivered to the fund on the next business day. Security lending activity through Chase is further collateralized by an irrevocable standby letter of credit. Chase provides the fund with indemnification against Borrower default. The fund bears the risk of loss with respect to the investment of cash collateral. On loans collateralized by cash, the cash collateral is invested in short-term securities. A portion of the income generated upon investment of the collateral is remitted to the Borrowers, and the remainder is allocated between the fund and the lending agent. On loans collateralized by U.S. Treasury and/or federal agency obligations, a fee is received from the Borrower, and is allocated between the fund and the lending agent. Income from securities lending is included in interest income on the Statement of Operations. The dividend and interest income earned on the securities loaned is accounted for in the same manner as other dividend and interest income.
Indemnifications – Under the fund’s organizational documents, its officers and trustees may be indemnified against certain liabilities and expenses arising out of the performance of their duties to the fund. Additionally, in the normal course of business, the fund enters into agreements with service providers that may contain indemnification clauses. The fund’s maximum exposure under these agreements is unknown as this would involve future claims that may be made against the fund that have not yet occurred.
Investment Transactions and Income – Investment transactions are recorded on the trade date. Interest income is recorded on the accrual basis. All premium and discount is amortized or accreted for financial statement purposes in accordance with U.S. generally accepted accounting principles. Dividends received in cash are recorded on the ex-dividend date. Certain dividends from foreign securities will be recorded when the fund is informed of the dividend if such information is obtained subsequent to the ex-dividend date. Dividend and interest payments received in additional securities are recorded on the ex-dividend or ex-interest date in an amount equal to the value of the security on such date. The fund may receive proceeds from litigation
36
Notes to Financial Statements (unaudited) – continued
settlements. Any proceeds received from litigation involving portfolio holdings are reflected in the Statement of Operations in realized gain/loss if the security has been disposed of by the fund or in unrealized gain/loss if the security is still held by the fund. Any other proceeds from litigation not related to portfolio holdings are reflected as other income in the Statement of Operations.
Fees Paid Indirectly – The fund’s custody fee may be reduced according to an arrangement that measures the value of cash deposited with the custodian by the fund. This amount, for the six months ended March 31, 2009, is shown as a reduction of total expenses on the Statement of Operations.
Tax Matters and Distributions – The fund intends to qualify as a regulated investment company, as defined under Subchapter M of the Internal Revenue Code, and to distribute all of its taxable income, including realized capital gains. As a result, no provision for federal income taxes is required. The fund’s federal tax returns for the prior three fiscal years remain subject to examination by the Internal Revenue Service. Foreign taxes, if any, have been accrued by the fund in the accompanying financial statements.
Distributions to shareholders are recorded on the ex-dividend date. Income and capital gain distributions are determined in accordance with income tax regulations, which may differ from U.S. generally accepted accounting principles. Certain capital accounts in the financial statements are periodically adjusted for permanent differences in order to reflect their tax character. These adjustments have no impact on net assets or net asset value per share. Temporary differences which arise from recognizing certain items of income, expense, gain or loss in different periods for financial statement and tax purposes will reverse at some time in the future. Distributions in excess of net investment income or net realized gains are temporary overdistributions for financial statement purposes resulting from differences in the recognition or classification of income or distributions for financial statement and tax purposes.
Book/tax differences primarily relate to passive foreign investment company adjustments, wash sale loss deferrals, foreign currency transactions, treating a portion of the proceeds from redemptions as a distribution for tax purposes, and foreign taxes.
The tax character of distributions made during the current period will be determined at fiscal year end. The tax character of distributions declared to shareholders for the last fiscal year is as follows:
| | |
| | | 9/30/08 |
Ordinary income (including any
short-term capital gains) | | $200,756,737 |
| Long-term capital gain | | 638,811,180 |
| | $839,567,917 |
37
Notes to Financial Statements (unaudited) – continued
The federal tax cost and the tax basis components of distributable earnings were as follows:
| | | |
| As of 3/31/09 | | | |
| Cost of investments | | $2,140,879,187 | |
| Gross appreciation | | 26,957,299 | |
| Gross depreciation | | (721,585,233 | ) |
| Net unrealized appreciation (depreciation) | | $(694,627,934 | ) |
| |
| As of 9/30/08 | | | |
| Undistributed ordinary income | | 35,159,345 | |
| Undistributed long-term capital gain | | 130,607,092 | |
| Other temporary differences | | (1,732,548 | ) |
| Net unrealized appreciation (depreciation) | | (594,421,619 | ) |
The aggregate cost above includes prior fiscal year end tax adjustments.
Multiple Classes of Shares of Beneficial Interest – The fund offers multiple classes of shares, which differ in their respective distribution, service, and program manager fees. The fund’s income, realized and unrealized gain (loss), and common expenses are allocated to shareholders based on the daily net assets of each class. Dividends are declared separately for each class. Differences in per share dividend rates are generally due to differences in separate class expenses. Class B and Class 529B shares will convert to Class A and Class 529A shares, respectively, approximately eight years after purchase.
| (3) | | Transactions with Affiliates |
Investment Adviser – The fund has an investment advisory agreement with Massachusetts Financial Services Company (MFS) to provide overall investment management and related administrative services and facilities to the fund.
The management fee is computed daily and paid monthly at the following annual rates:
| | | |
| First $500 million of average daily net assets | | 0.975 | % |
| Next $4.5 billion of average daily net assets | | 0.925 | % |
| Average daily net assets in excess of $5 billion | | 0.85 | % |
The management fee incurred for the six months ended March 31, 2009 was equivalent to an annual effective rate of 0.94% of the fund’s average daily net assets.
The investment adviser has agreed in writing to pay a portion of the fund’s operating expenses, exclusive of management fee, distribution and service fees, program manager fees, interest, taxes, extraordinary expenses, brokerage and transaction costs and investment-related expenses, such that operating expenses do not exceed 0.40% annually of the fund’s average daily net assets.
38
Notes to Financial Statements (unaudited) – continued
This written agreement will continue until modified by the fund’s Board of Trustees, but such agreement will continue at least until January 31, 2010. For the six months ended March 31, 2009, the fund’s actual operating expenses did not exceed the limit and therefore, the investment advisor did not pay any portion of the fund’s expenses.
Distributor – MFS Fund Distributors, Inc. (MFD), a wholly-owned subsidiary of MFS, as distributor, received $16,682 and $886 for the six months ended March 31, 2009, as its portion of the initial sales charge on sales of Class A and Class 529A shares of the fund, respectively.
The Board of Trustees has adopted a distribution plan for certain class shares pursuant to Rule 12b-1 of the Investment Company Act of 1940.
The fund’s distribution plan provides that the fund will pay MFD for services provided by MFD and financial intermediaries in connection with the distribution and servicing of certain share classes. One component of the plan is a distribution fee paid to MFD and another component of the plan is a service fee paid to MFD. MFD may subsequently pay all, or a portion, of the distribution and/or service fees to financial intermediaries.
Distribution Plan Fee Table:
| | | | | | | | | | |
| | | Distribution
Fee Rate | | Service
Fee Rate | | Total
Distribution
Plan (d) | | Annual
Effective
Rate (e) | | Distribution
and Service
Fee |
| Class A | | — | | 0.25% | | 0.25% | | 0.29% | | $1,624,718 |
| Class B | | 0.75% | | 0.25% | | 1.00% | | 1.00% | | 459,738 |
| Class C | | 0.75% | | 0.25% | | 1.00% | | 1.00% | | 680,605 |
| Class R1 | | 0.75% | | 0.25% | | 1.00% | | 1.00% | | 8,446 |
| Class R2 | | 0.25% | | 0.25% | | 0.50% | | 0.50% | | 76,198 |
| Class R3 | | — | | 0.25% | | 0.25% | | 0.25% | | 13,702 |
| Class 529A | | — | | 0.25% | | 0.25% | | 0.33% | | 2,882 |
| Class 529B | | 0.75% | | 0.25% | | 1.00% | | 1.00% | | 2,462 |
| Class 529C | | 0.75% | | 0.25% | | 1.00% | | 1.00% | | 2,156 |
| Total Distribution and Service Fees | | | | | | $2,870,907 |
| (d) | In accordance with the distribution plan for certain classes, the fund pays distribution and/or service fees up to these annual percentage rates of each class’ average daily net assets. |
| (e) | The annual effective rates represent actual fees incurred under the distribution plan for the six months ended March 31, 2009 based on each class’ average daily net assets. Effective March 1, 2009, the 0.10% Class A and 0.25% Class 529A annual distribution fees were eliminated. Prior to March 1, 2009, 0.05% of the Class A distribution fee was paid by the fund and the remaining 0.05% was waived under a written waiver agreement. For the six months ended March 31, 2009, this waiver amounted to $207,735 and is reflected as a reduction of total expenses in the Statement of Operations. Prior to March 1, 2009, 0.10% of the Class 529A distribution fee was paid by the fund and the remaining 0.15% was not in effect. |
Certain Class A shares purchased prior to September 1, 2008 are subject to a contingent deferred sales charge (CDSC) in the event of a shareholder redemption within 12 months of purchase. Certain Class A shares purchased
39
Notes to Financial Statements (unaudited) – continued
on or subsequent to September 1, 2008 are subject to a CDSC in the event of a shareholder redemption within 24 months of purchase. Class C and Class 529C shares are subject to a CDSC in the event of a shareholder redemption within 12 months of purchase. Class B and Class 529B shares are subject to a CDSC in the event of a shareholder redemption within six years of purchase. All contingent deferred sales charges are paid to MFD and during the six months ended March 31, 2009, were as follows:
| | |
| | | Amount |
| Class A | | $4 |
| Class B | | 102,336 |
| Class C | | 4,491 |
| Class 529B | | 46 |
| Class 529C | | — |
The fund has entered into and may from time to time enter into contracts with program managers and other parties which administer the tuition programs through which an investment in the fund’s 529 share classes is made. The fund has entered into an agreement with MFD pursuant to which MFD receives an annual fee of up to 0.10% of the average daily net assets attributable to each 529 share class. The services provided by MFD, or a third party with which MFD contracts, include recordkeeping and tax reporting and account services, as well as services designed to maintain the program’s compliance with the Internal Revenue Code and other regulatory requirements. Program manager fees for the six months ended March 31, 2009, were as follows:
| | |
| | | Amount |
| Class 529A | | $863 |
| Class 529B | | 247 |
| Class 529C | | 216 |
| Total Program Manager Fees | | $1,326 |
Shareholder Servicing Agent – MFS Service Center, Inc. (MFSC), a wholly-owned subsidiary of MFS, receives a fee from the fund for its services as shareholder servicing agent calculated as a percentage of the average daily net assets of the fund as determined periodically under the supervision of the fund’s Board of Trustees. For the six months ended March 31, 2009, the fee was $256,629, which equated to 0.0297% annually of the fund’s average daily net assets. MFSC also receives payment from the fund for out-of-pocket expenses, sub-accounting and other shareholder servicing costs which may be paid to affiliated and unaffiliated service providers. For the six months ended March 31, 2009, these out-of-pocket expenses, sub-accounting and other shareholder servicing costs amounted to $1,605,266.
Under a Special Servicing Agreement among MFS, each MFS fund which invests in other MFS funds (“MFS fund-of-funds”) and each underlying fund in
40
Notes to Financial Statements (unaudited) – continued
which a MFS fund-of-funds invests (“underlying funds”), each underlying fund may pay a portion of each MFS fund-of-fund’s transfer agent-related expenses, including sub-accounting fees payable to financial intermediaries, to the extent such payments do not exceed the benefits realized or expected to be realized by the underlying fund from the investment in the underlying fund by the MFS fund-of-fund. For the six months ended March 31, 2009, these costs for the fund amounted to $524,920 and are reflected in the shareholder servicing costs on the Statement of Operations.
Administrator – MFS provides certain financial, legal, shareholder communications, compliance, and other administrative services to the fund. Under an administrative services agreement, the fund partially reimburses MFS the costs incurred to provide these services. The fund is charged a fixed amount plus a fee based on average daily net assets. The fund is charged an annual fixed amount of $17,500 plus a fee based on average daily net assets.
The administrative services fee incurred for the six months ended March 31, 2009 was equivalent to an annual effective rate of 0.0209% of the fund’s average daily net assets.
Trustees’ and Officers’ Compensation – The fund pays compensation to independent trustees in the form of a retainer, attendance fees, and additional compensation to Board and Committee chairpersons. The fund does not pay compensation directly to trustees or officers of the fund who are also officers of the investment adviser, all of whom receive remuneration for their services to the fund from MFS. Certain officers and trustees of the fund are officers or directors of MFS, MFD, and MFSC.
For certain independent Trustees who served on the Board as of December 31, 2001, the fund has an unfunded retirement benefit deferral plan which resulted in a net decrease in expense of $3,388. This amount is included in independent trustees’ compensation for the six months ended March 31, 2009. The liability for deferred retirement benefits payable to certain independent trustees amounted to $2,624 at March 31, 2009, and is included in payable for independent trustees’ compensation.
Other – This fund and certain other MFS funds (the funds) have entered into services agreements (the Agreements) which provide for payment of fees by the funds to Tarantino LLC and Griffin Compliance LLC in return for the provision of services of an Independent Chief Compliance Officer (ICCO) and Assistant ICCO, respectively, for the funds. The ICCO and Assistant ICCO are officers of the funds and the sole members of Tarantino LLC and Griffin Compliance LLC, respectively. The funds can terminate the Agreements with Tarantino LLC and Griffin Compliance LLC at any time under the terms of the Agreements. For the six months ended March 31, 2009, the aggregate fees paid by the fund to Tarantino LLC and Griffin Compliance LLC were $14,238 and
41
Notes to Financial Statements (unaudited) – continued
are included in miscellaneous expense on the Statement of Operations. MFS has agreed to reimburse the fund for a portion of the payments made by the fund in the amount of $4,532, which is shown as a reduction of total expenses in the Statement of Operations. Additionally, MFS has agreed to bear all expenses associated with office space, other administrative support, and supplies provided to the ICCO and Assistant ICCO.
The fund may invest in a money market fund managed by MFS which seeks a high level of current income consistent with preservation of capital and liquidity. Income earned on this investment is included in dividends from underlying funds on the Statement of Operations. This money market fund does not pay a management fee to MFS.
Purchases and sales of investments, other than U.S. Government securities, purchased option transactions, and short-term obligations, aggregated $395,778,913 and $801,260,696, respectively.
| (5) | | Shares of Beneficial Interest |
The fund’s Declaration of Trust permits the Trustees to issue an unlimited number of full and fractional shares of beneficial interest. Transactions in fund shares were as follows:
| | | | | | | | |
| | | Six months ended
3/31/09 | | Year ended
9/30/08 |
| | | Shares | | Amount | | Shares | | Amount |
| Shares sold | | | | | | | | |
Class A | | 7,326,489 | | $90,678,974 | | 13,879,317 | | $347,954,979 |
Class B | | 147,995 | | 1,753,476 | | 293,641 | | 6,781,960 |
Class C | | 513,785 | | 6,082,145 | | 1,170,913 | | 27,792,868 |
Class I | | 3,331,714 | | 39,485,216 | | 5,618,682 | | 137,661,774 |
Class R (b) | | — | | — | | 486,485 | | 12,914,976 |
Class R1 | | 20,680 | | 232,748 | | 61,076 | | 1,478,045 |
Former Class R2 (b) | | — | | — | | 32,488 | | 829,345 |
Class R2 | | 411,081 | | 4,926,242 | | 1,965,571 | | 45,960,890 |
Class R3 | | 156,016 | | 1,896,705 | | 409,868 | | 10,501,178 |
Class R4 | | 552,249 | | 6,721,421 | | 595,038 | | 14,030,676 |
Class 529A | | 12,641 | | 152,207 | | 19,758 | | 449,485 |
Class 529B | | 3,509 | | 39,643 | | 2,202 | | 52,082 |
Class 529C | | 8,124 | | 82,884 | | 5,836 | | 134,102 |
| | 12,484,283 | | $152,051,661 | | 24,540,875 | | $606,542,360 |
42
Notes to Financial Statements (unaudited) – continued
| | | | | | | | | | | | |
| | | Six months ended
3/31/09 | | | Year ended
9/30/08 | |
| | | Shares | | | Amount | | | Shares | | | Amount | |
| Shares issued to shareholders in reinvestment of distributions | | | | | | | | | | | | |
Class A | | 6,569,906 | | | $82,780,824 | | | 17,877,207 | | | $439,600,528 | |
Class B | | 613,288 | | | 7,451,445 | | | 1,892,675 | | | 44,837,346 | |
Class C | | 755,460 | | | 9,156,175 | | | 2,481,680 | | | 58,617,374 | |
Class I | | 3,295,192 | | | 42,540,927 | | | 6,534,131 | | | 164,529,431 | |
Class R (b) | | — | | | — | | | 132,448 | | | 3,242,327 | |
Class R1 | | 13,125 | | | 155,790 | | | 29,447 | | | 685,253 | |
Former Class R2 (b) | | — | | | — | | | 18,936 | | | 442,527 | |
Class R2 | | 181,144 | | | 2,233,508 | | | 318,691 | | | 7,690,022 | |
Class R3 | | 83,267 | | | 1,044,994 | | | 178,551 | | | 4,378,061 | |
Class R4 | | 1,043 | | | 13,111 | | | 621 | | | 15,264 | |
Class 529A | | 13,099 | | | 163,088 | | | 25,986 | | | 632,246 | |
Class 529B | | 3,923 | | | 46,450 | | | 7,864 | | | 182,767 | |
Class 529C | | 3,200 | | | 38,018 | | | 7,082 | | | 164,729 | |
| | 11,532,647 | | | $145,624,330 | | | 29,505,319 | | | $725,017,875 | |
| Shares reacquired | | | | | | | | | | | | |
Class A | | (23,883,009 | ) | | $(294,661,431 | ) | | (40,722,688 | ) | | $(947,375,669 | ) |
Class B | | (2,309,021 | ) | | (27,069,745 | ) | | (3,703,888 | ) | | (83,114,987 | ) |
Class C | | (4,095,623 | ) | | (48,979,126 | ) | | (6,269,998 | ) | | (138,934,431 | ) |
Class I | | (13,977,567 | ) | | (159,126,171 | ) | | (6,354,847 | ) | | (155,851,568 | ) |
Class R (b) | | — | | | — | | | (1,911,107 | ) | | (46,969,883 | ) |
Class R1 | | (31,438 | ) | | (360,414 | ) | | (59,920 | ) | | (1,348,932 | ) |
Former Class R2 (b) | | — | | | — | | | (125,329 | ) | | (2,850,328 | ) |
Class R2 | | (731,014 | ) | | (8,734,172 | ) | | (1,011,795 | ) | | (21,817,420 | ) |
Class R3 | | (204,098 | ) | | (2,516,016 | ) | | (408,680 | ) | | (9,776,042 | ) |
Class R4 (formerly Class R5) | | (315,084 | ) | | (3,962,343 | ) | | (522,689 | ) | | (12,460,328 | ) |
Class 529A | | (11,669 | ) | | (143,464 | ) | | (26,465 | ) | | (579,134 | ) |
Class 529B | | (2,575 | ) | | (28,667 | ) | | (4,479 | ) | | (95,100 | ) |
Class 529C | | (6,230 | ) | | (73,857 | ) | | (5,665 | ) | | (119,106 | ) |
| | (45,567,328 | ) | | $(545,655,406 | ) | | (61,127,550 | ) | | $(1,421,292,928 | ) |
43
Notes to Financial Statements (unaudited) – continued
| | | | | | | | | | | | |
| | | Six months ended
3/31/09 | | | Year ended
9/30/08 | |
| | | Shares | | | Amount | | | Shares | | | Amount | |
| Net change | | | | | | | | | | | | |
Class A | | (9,986,614 | ) | | $(121,201,633 | ) | | (8,966,164 | ) | | $(159,820,162 | ) |
Class B | | (1,547,738 | ) | | (17,864,824 | ) | | (1,517,572 | ) | | (31,495,681 | ) |
Class C | | (2,826,378 | ) | | (33,740,806 | ) | | (2,617,405 | ) | | (52,524,189 | ) |
Class I | | (7,350,661 | ) | | (77,100,028 | ) | | 5,797,966 | | | 146,339,637 | |
Class R (b) | | — | | | — | | | (1,292,174 | ) | | (30,812,580 | ) |
Class R1 | | 2,367 | | | 28,124 | | | 30,603 | | | 814,366 | |
Former Class R2 (b) | | — | | | — | | | (73,905 | ) | | (1,578,456 | ) |
Class R2 | | (138,789 | ) | | (1,574,422 | ) | | 1,272,467 | | | 31,833,492 | |
Class R3 | | 35,185 | | | 425,683 | | | 179,739 | | | 5,103,197 | |
Class R4 | | 238,208 | | | 2,772,189 | | | 72,970 | | | 1,585,612 | |
Class 529A | | 14,071 | | | 171,831 | | | 19,279 | | | 502,597 | |
Class 529B | | 4,857 | | | 57,426 | | | 5,587 | | | 139,749 | |
Class 529C | | 5,094 | | | 47,045 | | | 7,253 | | | 179,725 | |
| | (21,550,398 | ) | | $(247,979,415 | ) | | (7,081,356 | ) | | $(89,732,693 | ) |
| (b) | At the close of business on April 18, 2008, Class R and Class R2 shares converted into Class R3 shares. Following the conversion, Class R3 shares were renamed Class R2 shares. |
The fund is one of several mutual funds in which the MFS funds-of-funds may invest. The MFS funds-of-funds do not invest in the underlying MFS funds for the purpose of exercising management or control. At the end of the period, the MFS International Diversification Fund, MFS Growth Allocation Fund, MFS Aggressive Growth Allocation Fund, and MFS Moderate Allocation Fund were the owners of record of approximately 8%, 2%, 2%, and 1%, respectively, of the value of outstanding voting shares of the fund. In addition, the MFS Lifetime 2020 Fund, the MFS Lifetime 2030 Fund and the MFS Lifetime 2040 Fund were each the owners of record of less than 1% of the value of outstanding voting shares of the fund.
The fund and other funds managed by MFS participate in a $1 billion unsecured committed line of credit provided by a syndication of banks under a credit agreement. In addition, the fund and other funds managed by MFS have established uncommitted borrowing arrangements with certain banks. Borrowings may be made for temporary financing needs. Interest is charged to the fund, based on its borrowings, generally at a rate equal to the Federal Reserve funds rate plus 0.30%. In addition, a commitment fee, based on the average daily, unused portion of the committed line of credit, is allocated among the participating funds at the end of each calendar quarter. For the six months ended March 31, 2009, the fund’s commitment fee and interest expense were $7,004 and $268, respectively, and are included in miscellaneous expense on the Statement of Operations.
44
Notes to Financial Statements (unaudited) – continued
| (7) | | Transactions in Underlying Funds-Affiliated Issuers |
An affiliated issuer may be considered one in which the fund owns 5% or more of the outstanding voting securities, or a company which is under common control. For the purposes of this report, the fund assumes the following to be affiliated issuers:
| | | | | | | | | | |
| Underlying Funds | | Beginning
Shares/Par
Amount | | | Acquisitions
Shares/Par
Amount | | Dispositions
Shares/Par
Amount | | | Ending
Shares/Par
Amount |
MFS Institutional Money
Market Portfolio | | 17,179,660 | | | 342,727,774 | | (347,865,959 | ) | | 12,041,475 |
| | | | |
| Underlying Funds | | Realized
Gain (Loss) | | | Capital Gain
Distributions | | Dividend
Income | | | Ending
Value |
MFS Institutional Money
Market Portfolio | | $— | | | $— | | $73,450 | | | $12,041,475 |
| | | | |
| Other Affiliated Issuers | | Beginning
Shares/Par
Amount | | | Acquisitions
Shares/Par
Amount | | Dispositions
Shares/Par
Amount | | | Ending
Shares/Par
Amount |
| Amadeus Fire AG | | 243,004 | | | 26,400 | | (5,627 | ) | | 263,777 |
| | | | |
| Other Affiliated Issuers | | Realized
Gain (Loss) | | | Capital Gain
Distributions | | Dividend
Income | | | Ending
Value |
| Amadeus Fire AG | | $(93,120 | ) | | $— | | $— | | | $3,329,314 |
45
BOARD REVIEW OF INVESTMENT ADVISORY AGREEMENT
A discussion regarding the Board’s most recent review and renewal of the fund’s Investment Advisory Agreement with MFS is available by clicking on the fund’s name under “Mutual Funds” in the “Products and Performance” section of the MFS Web site (mfs.com).
PROXY VOTING POLICIES AND INFORMATION
A general description of the MFS funds’ proxy voting policies and procedures is available without charge, upon request, by calling
1-800-225-2606, by visiting the Proxy Voting section of mfs.com or by visiting the SEC’s Web site at http://www.sec.gov.
Information regarding how the fund voted proxies relating to portfolio securities during the most recent twelve-month period ended June 30 is available without charge by visiting the Proxy Voting section of mfs.com or by visiting the SEC’s Web site at http://www.sec.gov.
QUARTERLY PORTFOLIO DISCLOSURE
The fund will file a complete schedule of portfolio holdings with the Securities and Exchange Commission (the Commission) for the first and third quarters of each fiscal year on Form N-Q. The fund’s Form N-Q may be reviewed and copied at the:
Public Reference Room
Securities and Exchange Commission
100 F Street, NE, Room 1580
Washington, D.C. 20549
Information on the operation of the Public Reference Room may be obtained by calling the Commission at 1-800-SEC-0330. The fund’s Form N-Q is available on the EDGAR database on the Commission’s Internet Web site at http://www.sec.gov, and copies of this information may be obtained, upon payment of a duplicating fee, by electronic request at the following e-mail address: publicinfo@sec.gov or by writing the Public Reference Section at the above address.
A shareholder can also obtain the quarterly portfolio holdings report at mfs.com.
46
CONTACT US
| | |
| Web site | | Mailing address |
| mfs.com | | MFS Service Center, Inc. |
| | P.O. Box 55824 |
| MFS TALK | | Boston, MA 02205-5824 |
| 1-800-637-8255 | | |
| 24 hours a day | | Overnight mail |
| | MFS Service Center, Inc. |
| Account service and literature | | c/o Boston Financial Data Services |
| | 30 Dan Road |
| Shareholders | | Canton, MA 02021-2809 |
| 1-800-225-2606 | | |
| | |
| Investment professionals | | |
| 1-800-343-2829 | | |
| | |
| Retirement plan services | | |
| 1-800-637-1255 | | |

Save paper with eDelivery. MFS® will send you prospectuses, reports, and proxies directly via e-mail so you will get information faster with less mailbox clutter. To sign up: 1. go to mfs.com. 2. log in via MFS® Access. 3. select eDelivery. If you own your MFS fund shares through a financial institution or a retirement plan, MFS® TALK, MFS Access, and eDelivery may not be available to you.


MFS® Research Fund
The report is prepared for the general information of shareholders. It is authorized for distribution to prospective investors only when preceded or accompanied by a current prospectus.
NOT FDIC INSURED Ÿ MAY LOSE VALUE Ÿ
NO BANK GUARANTEE
3/31/09
MFR-SEM

LETTER FROM THE CEO
Dear Shareholders:
The market downturns and economic setbacks of late probably rank among the worst financial declines most of us have experienced. Inevitably, people may be questioning their commitment to investing. Still, it is important to remember that downturns are an inescapable part of the business cycle. Such troughs have been seen before, and if we can use history as a guide, market recoveries typically have followed.
Recent events have clearly shown us the value of certain types of investments. In this environment, two of the hallmarks of mutual funds — transparency and liquidity — have become critically important. Unlike some other types of investments, the operations of mutual funds are relatively transparent to their shareholders. With their daily redemption feature, mutual funds also generally provide easy, convenient access to one’s money. Through these recent market upheavals, this level of liquidity enhanced the ability of mutual fund investors to respond and modify their investments as they and their advisors saw fit — a flexibility that those in less liquid investments simply did not have at their disposal.
At MFS® we take particular pride in how well mutual funds can serve investors because we invented the mutual fund in the United States. Established in 1924, Massachusetts Investors Trust was the nation’s first fund. Recent market events only reinforce what we have learned through 85 years — that mutual funds provide unique features that are important to investors in any type of market climate.
Respectfully,

Robert J. Manning
Chief Executive Officer and Chief Investment Officer
MFS Investment Management®
May 15, 2009
The opinions expressed in this letter are subject to change, may not be relied upon for investment advice, and no forecasts can be guaranteed.
Before investing, consider the fund’s investment objectives, risks, charges, and expenses. For a prospectus containing this and other information, contact your investment professional or view online. Read it carefully.
MFS Fund Distributors, Inc., 500 Boylston Street, Boston, MA 02116
1
PORTFOLIO COMPOSITION
Portfolio structure
| | |
| Top ten holdings | | |
| Chevron Corp. | | 2.6% |
| Danaher Corp. | | 2.5% |
| Exxon Mobil Corp. | | 2.5% |
| Apple, Inc. | | 2.5% |
| JPMorgan Chase & Co. | | 2.4% |
| Hewlett-Packard Co. | | 2.2% |
| PepsiCo, Inc. | | 2.1% |
| AT&T, Inc. | | 1.9% |
| Google, Inc., “A” | | 1.8% |
| Cisco Systems, Inc. | | 1.8% |
| | |
| Equity sectors | | |
| Technology | | 16.0% |
| Health Care | | 15.1% |
| Energy | | 11.8% |
| Financial Services | | 10.6% |
| Retailing (a) | | 10.5% |
| Consumer Staples | | 9.6% |
| Utilities & Communications | | 8.6% |
| Industrial Goods & Services | | 6.5% |
| Basic Materials (a) | | 2.3% |
| Autos & Housing | | 2.1% |
| Leisure | | 1.9% |
| Special Products & Services | | 1.8% |
| Transportation | | 1.4% |
| (a) | This Equity Sector includes both common stocks and securities sold short. |
Percentages are based on net assets as of 3/31/09.
The portfolio is actively managed and current holdings may be different.
2
EXPENSE TABLE
Fund expenses borne by the shareholders during the period,
October 1, 2008 through March 31, 2009
As a shareholder of the fund, you incur two types of costs: (1) transaction costs, including sales charges (loads) on certain purchase or redemption payments, and (2) ongoing costs, including management fees; distribution and service (12b-1) fees; and other fund expenses. This example is intended to help you understand your ongoing costs (in dollars) of investing in the fund and to compare these costs with the ongoing costs of investing in other mutual funds.
The example is based on an investment of $1,000 invested at the beginning of the period and held for the entire period October 1, 2008 through March 31, 2009.
The actual expenses include the payment of a portion of the transfer-agent-related expenses of MFS funds that invest in the fund. For further information, please see the Notes to the Financial Statements.
Actual Expenses
The first line for each share class in the following table provides information about actual account values and actual expenses. You may use the information in this line, together with the amount you invested, to estimate the expenses that you paid over the period. Simply divide your account value by $1,000 (for example, an $8,600 account value divided by $1,000 = 8.6), then multiply the result by the number in the first line under the heading entitled “Expenses Paid During Period” to estimate the expenses you paid on your account during this period.
Hypothetical Example for Comparison Purposes
The second line for each share class in the following table provides information about hypothetical account values and hypothetical expenses based on the fund’s actual expense ratio and an assumed rate of return of 5% per year before expenses, which is not the fund’s actual return. The hypothetical account values and expenses may not be used to estimate the actual ending account balance or expenses you paid for the period. You may use this information to compare the ongoing costs of investing in the fund and other funds. To do so, compare this 5% hypothetical example with the 5% hypothetical examples that appear in the shareholder reports of the other funds.
Please note that the expenses shown in the table are meant to highlight your ongoing costs only and do not reflect any transactional costs, such as sales charges (loads). Therefore, the second line for each share class in the table is useful in comparing ongoing costs only, and will not help you determine the relative total costs of owning different funds. In addition, if these transactional costs were included, your costs would have been higher.
3
Expense Table – continued
| | | | | | | | | | |
Share Class | | | | Annualized
Expense Ratio | | Beginning
Account Value 10/01/08 | | Ending Account Value 3/31/09 | | Expenses Paid During Period (p) 10/01/08-3/31/09 |
| A | | Actual | | 1.09% | | $1,000.00 | | $709.34 | | $4.65 |
| | Hypothetical (h) | | 1.09% | | $1,000.00 | | $1,019.50 | | $5.49 |
| B | | Actual | | 1.75% | | $1,000.00 | | $706.95 | | $7.45 |
| | Hypothetical (h) | | 1.75% | | $1,000.00 | | $1,016.21 | | $8.80 |
| C | | Actual | | 1.75% | | $1,000.00 | | $706.75 | | $7.45 |
| | Hypothetical (h) | | 1.75% | | $1,000.00 | | $1,016.21 | | $8.80 |
| I | | Actual | | 0.75% | | $1,000.00 | | $710.54 | | $3.20 |
| | Hypothetical (h) | | 0.75% | | $1,000.00 | | $1,021.19 | | $3.78 |
| W | | Actual | | 0.85% | | $1,000.00 | | $710.24 | | $3.62 |
| | Hypothetical (h) | | 0.85% | | $1,000.00 | | $1,020.69 | | $4.28 |
| R1 | | Actual | | 1.75% | | $1,000.00 | | $707.08 | | $7.45 |
| | Hypothetical (h) | | 1.75% | | $1,000.00 | | $1,016.21 | | $8.80 |
| R2 | | Actual | | 1.25% | | $1,000.00 | | $708.84 | | $5.33 |
| | Hypothetical (h) | | 1.25% | | $1,000.00 | | $1,018.70 | | $6.29 |
| R3 | | Actual | | 1.00% | | $1,000.00 | | $709.62 | | $4.26 |
| | Hypothetical (h) | | 1.00% | | $1,000.00 | | $1,019.95 | | $5.04 |
| R4 | | Actual | | 0.75% | | $1,000.00 | | $710.30 | | $3.20 |
| | Hypothetical (h) | | 0.75% | | $1,000.00 | | $1,021.19 | | $3.78 |
| (h) | 5% class return per year before expenses. |
| (p) | Expenses paid is equal to each class’ annualized expense ratio, as shown above, multiplied by the average account value over the period, multiplied by the number of days in the period, divided by the number of days in the year. Expenses paid do not include any applicable sales charges (loads). If these transaction costs had been included, your costs would have been higher. |
Expense Changes Impacting the Table
Changes to the fund’s fee arrangements occurred during the six month period. Had these fee changes been in effect throughout the entire six month period, the annualized expense ratio would have been 1.01% for Class A shares; the actual expenses paid during the period would have been approximately $4.31 for Class A shares; and the hypothetical expenses paid during the period would have been approximately $5.09 for Class A shares. For further information about the fund’s fee arrangements and changes to those fee arrangements, please see Note 3 in the Notes to Financial Statements.
4
PORTFOLIO OF INVESTMENTS
3/31/09 (unaudited)
The Portfolio of Investments is a complete list of all securities owned by your fund. It is categorized by broad-based asset classes.
| | | | | |
| Common Stocks - 98.7% | | | | | |
| Issuer | | Shares/Par | | Value ($) |
| | | | | |
| Aerospace - 1.6% | | | | | |
| Lockheed Martin Corp. | | 206,890 | | $ | 14,281,617 |
| United Technologies Corp. | | 199,590 | | | 8,578,378 |
| | | | | |
| | | | | $ | 22,859,995 |
| Apparel Manufacturers - 1.2% | | | | | |
| Li & Fung Ltd. | | 1,312,000 | | $ | 3,080,845 |
| NIKE, Inc., “B” | | 318,040 | | | 14,912,896 |
| | | | | |
| | | | | $ | 17,993,741 |
| Biotechnology - 1.5% | | | | | |
| Genzyme Corp. (a) | | 361,320 | | $ | 21,458,795 |
| | |
| Broadcasting - 0.7% | | | | | |
| Walt Disney Co. | | 591,760 | | $ | 10,746,362 |
| | |
| Brokerage & Asset Managers - 1.1% | | | | | |
| Affiliated Managers Group, Inc. (a) | | 133,650 | | $ | 5,574,541 |
| Charles Schwab Corp. | | 219,810 | | | 3,407,055 |
| Invesco Ltd. | | 547,450 | | | 7,587,657 |
| | | | | |
| | | | | $ | 16,569,253 |
| Business Services - 0.8% | | | | | |
| MasterCard, Inc., “A” | | 71,460 | | $ | 11,968,121 |
| | |
| Cable TV - 1.2% | | | | | |
| Comcast Corp., “Special A” | | 780,670 | | $ | 10,047,223 |
| DIRECTV Group, Inc. (a) | | 228,010 | | | 5,196,348 |
| Time Warner Cable, Inc. | | 106,887 | | | 2,650,798 |
| | | | | |
| | | | | $ | 17,894,369 |
| Chemicals - 0.8% | | | | | |
| 3M Co. | | 134,810 | | $ | 6,702,753 |
| Celanese Corp. | | 433,400 | | | 5,794,558 |
| | | | | |
| | | | | $ | 12,497,311 |
| Computer Software - 2.1% | | | | | |
| Adobe Systems, Inc. (a) | | 497,590 | | $ | 10,643,450 |
| MicroStrategy, Inc., “A” (a) | | 226,630 | | | 7,748,480 |
| VeriSign, Inc. (a) | | 698,520 | | | 13,181,072 |
| | | | | |
| | | | | $ | 31,573,002 |
5
Portfolio of Investments (unaudited) – continued
| | | | | |
| Issuer | | Shares/Par | | Value ($) |
| | | | | |
| Common Stocks - continued | | | | | |
| Computer Software - Systems - 4.8% | | | | | |
| Apple, Inc. (a) | | 351,320 | | $ | 36,930,758 |
| Hewlett-Packard Co. | | 1,033,110 | | | 33,121,507 |
| | | | | |
| | | | | $ | 70,052,265 |
| Conglomerates - 1.0% | | | | | |
| Siemens AG | | 248,340 | | $ | 14,190,914 |
| | |
| Construction - 2.1% | | | | | |
| Pulte Homes, Inc. | | 1,530,910 | | $ | 16,732,846 |
| Sherwin-Williams Co. | | 262,750 | | | 13,655,118 |
| | | | | |
| | | | | $ | 30,387,964 |
| Consumer Goods & Services - 1.6% | | | | | |
| Colgate-Palmolive Co. | | 178,690 | | $ | 10,539,136 |
| Mead Johnson Nutrition Co., “A” (a) | | 70,740 | | | 2,042,264 |
| Procter & Gamble Co. | | 218,500 | | | 10,289,165 |
| | | | | |
| | | | | $ | 22,870,565 |
| Electrical Equipment - 3.8% | | | | | |
| Danaher Corp. | | 691,390 | | $ | 37,487,166 |
| Rockwell Automation, Inc. | | 841,850 | | | 18,386,004 |
| | | | | |
| | | | | $ | 55,873,170 |
| Electronics - 4.2% | | | | | |
| Flextronics International Ltd. (a) | | 3,635,310 | | $ | 10,506,046 |
| Intel Corp. | | 1,591,910 | | | 23,958,245 |
| MEMC Electronic Materials, Inc. (a) | | 385,000 | | | 6,348,650 |
| National Semiconductor Corp. | | 852,330 | | | 8,753,429 |
| Samsung Electronics Co. Ltd., GDR | | 60,284 | | | 12,313,007 |
| | | | | |
| | | | | $ | 61,879,377 |
| Energy - Independent - 2.6% | | | | | |
| Anadarko Petroleum Corp. | | 222,790 | | $ | 8,664,303 |
| Apache Corp. | | 183,370 | | | 11,752,183 |
| Nexen, Inc. | | 267,480 | | | 4,535,789 |
| Noble Energy, Inc. | | 85,340 | | | 4,598,119 |
| XTO Energy, Inc. | | 283,620 | | | 8,684,444 |
| | | | | |
| | | | | $ | 38,234,838 |
| Energy - Integrated - 7.8% | | | | | |
| Chevron Corp. | | 572,570 | | $ | 38,499,607 |
| Exxon Mobil Corp. (s) | | 549,050 | | | 37,390,305 |
| Hess Corp. | | 177,280 | | | 9,608,576 |
6
Portfolio of Investments (unaudited) – continued
| | | | | |
| Issuer | | Shares/Par | | Value ($) |
| | | | | |
| Common Stocks - continued | | | | | |
| Energy - Integrated - continued | | | | | |
| Marathon Oil Corp. | | 356,760 | | $ | 9,379,220 |
| TOTAL S.A. | | 403,510 | | | 20,063,669 |
| | | | | |
| | | | | $ | 114,941,377 |
| Engineering - Construction - 0.9% | | | | | |
| Fluor Corp. | | 376,170 | | $ | 12,996,673 |
| | |
| Food & Beverages - 5.6% | | | | | |
| Coca-Cola Co. | | 513,720 | | $ | 22,577,994 |
| General Mills, Inc. | | 119,520 | | | 5,961,658 |
| Groupe Danone | | 143,916 | | | 7,009,641 |
| J.M. Smucker Co. | | 213,282 | | | 7,949,020 |
| Nestle S.A. | | 221,925 | | | 7,502,129 |
| PepsiCo, Inc. (s) | | 605,990 | | | 31,196,365 |
| | | | | |
| | | | | $ | 82,196,807 |
| Food & Drug Stores - 1.2% | | | | | |
| CVS Caremark Corp. | | 385,860 | | $ | 10,607,291 |
| Kroger Co. | | 354,450 | | | 7,521,429 |
| | | | | |
| | | | | $ | 18,128,720 |
| General Merchandise - 2.9% | | | | | |
| Kohl’s Corp. (a) | | 173,220 | | $ | 7,330,670 |
| Target Corp. | | 543,240 | | | 18,682,024 |
| Wal-Mart Stores, Inc. | | 323,770 | | | 16,868,417 |
| | | | | |
| | | | | $ | 42,881,111 |
| Health Maintenance Organizations - 1.0% | | | | | |
| WellPoint, Inc. (a) | | 406,900 | | $ | 15,449,993 |
| | |
| Insurance - 3.9% | | | | | |
| ACE Ltd. | | 239,890 | | $ | 9,691,556 |
| Aon Corp. | | 343,780 | | | 14,033,100 |
| Chubb Corp. | | 194,950 | | | 8,250,284 |
| MetLife, Inc. | | 298,290 | | | 6,792,063 |
| Travelers Cos., Inc. | | 462,180 | | | 18,782,995 |
| | | | | |
| | | | | $ | 57,549,998 |
| Internet - 1.8% | | | | | |
| Google, Inc., “A” (a) | | 78,160 | | $ | 27,204,370 |
| | |
| Machinery & Tools - 0.2% | | | | | |
| Deere & Co. | | 109,900 | | $ | 3,612,413 |
7
Portfolio of Investments (unaudited) – continued
| | | | | |
| Issuer | | Shares/Par | | Value ($) |
| | | | | |
| Common Stocks - continued | | | | | |
| Major Banks - 5.6% | | | | | |
| Bank of New York Mellon Corp. | | 588,336 | | $ | 16,620,492 |
| Goldman Sachs Group, Inc. | | 103,560 | | | 10,979,431 |
| JPMorgan Chase & Co. (s) | | 1,306,150 | | | 34,717,467 |
| State Street Corp. | | 305,960 | | | 9,417,449 |
| Wells Fargo & Co. | | 769,430 | | | 10,956,683 |
| | | | | |
| | | | | $ | 82,691,522 |
| Medical & Health Technology & Services - 2.5% | | | | | |
| DaVita, Inc. (a) | | 112,350 | | $ | 4,937,782 |
| Medco Health Solutions, Inc. (a) | | 259,780 | | | 10,739,305 |
| Patterson Cos., Inc. (a) | | 647,940 | | | 12,220,148 |
| VCA Antech, Inc. (a) | | 422,950 | | | 9,537,523 |
| | | | | |
| | | | | $ | 37,434,758 |
| Medical Equipment - 4.5% | | | | | |
| DENTSPLY International, Inc. | | 327,300 | | $ | 8,788,005 |
| Medtronic, Inc. | | 891,670 | | | 26,277,515 |
| Waters Corp. (a) | | 471,690 | | | 17,428,946 |
| Zimmer Holdings, Inc. (a) | | 385,600 | | | 14,074,400 |
| | | | | |
| | | | | $ | 66,568,866 |
| Metals & Mining - 0.9% | | | | | |
| BHP Billiton PLC | | 292,120 | | $ | 5,805,205 |
| Cameco Corp. | | 232,080 | | | 3,984,814 |
| Nucor Corp. | | 73,140 | | | 2,791,754 |
| | | | | |
| | | | | $ | 12,581,773 |
| Natural Gas - Distribution - 1.4% | | | | | |
| EQT Corp. | | 236,800 | | $ | 7,418,944 |
| Questar Corp. | | 182,480 | | | 5,370,386 |
| Sempra Energy | | 165,780 | | | 7,665,667 |
| | | | | |
| | | | | $ | 20,454,997 |
| Network & Telecom - 3.1% | | | | | |
| Cisco Systems, Inc. (a) | | 1,576,390 | | $ | 26,436,060 |
| Corning, Inc. | | 694,480 | | | 9,215,750 |
| Research in Motion Ltd. (a) | | 249,938 | | | 10,764,830 |
| | | | | |
| | | | | $ | 46,416,640 |
| Oil Services - 1.4% | | | | | |
| Noble Corp. | | 399,440 | | $ | 9,622,510 |
| Transocean, Inc. (a) | | 177,450 | | | 10,441,158 |
| | | | | |
| | | | | $ | 20,063,668 |
8
Portfolio of Investments (unaudited) – continued
| | | | | |
| Issuer | | Shares/Par | | Value ($) |
| | | | | |
| Common Stocks - continued | | | | | |
| Pharmaceuticals - 5.6% | | | | | |
| Abbott Laboratories | | 252,680 | | $ | 12,052,836 |
| Allergan, Inc. | | 159,620 | | | 7,623,451 |
| Johnson & Johnson | | 456,560 | | | 24,015,056 |
| Merck & Co., Inc. | | 433,920 | | | 11,607,360 |
| Schering-Plough Corp. | | 679,690 | | | 16,006,700 |
| Wyeth | | 268,260 | | | 11,545,910 |
| | | | | |
| | | | | $ | 82,851,313 |
| Precious Metals & Minerals - 0.3% | | | | | |
| Goldcorp, Inc. | | 116,980 | | $ | 3,897,774 |
| | |
| Specialty Chemicals - 0.5% | | | | | |
| Praxair, Inc. | | 105,430 | | $ | 7,094,385 |
| | |
| Specialty Stores - 5.5% | | | | | |
| Abercrombie & Fitch Co., “A” | | 374,340 | | $ | 8,909,292 |
| Dick’s Sporting Goods, Inc. (a) | | 497,940 | | | 7,105,604 |
| Home Depot, Inc. | | 444,350 | | | 10,468,886 |
| Nordstrom, Inc. | | 626,040 | | | 10,486,170 |
| O’Reilly Automotive, Inc. (a) | | 188,350 | | | 6,594,134 |
| PetSmart, Inc. | | 630,880 | | | 13,223,245 |
| Staples, Inc. | | 897,870 | | | 16,260,426 |
| Tiffany & Co. | | 347,520 | | | 7,492,531 |
| | | | | |
| | | | | $ | 80,540,288 |
| Telecommunications - Wireless - 0.7% | | | | | |
| Cellcom Israel Ltd. | | 181,800 | | $ | 3,872,340 |
| Rogers Communications, Inc., “B” | | 304,280 | | | 6,946,712 |
| | | | | |
| | | | | $ | 10,819,052 |
| Telephone Services - 2.5% | | | | | |
| AT&T, Inc. | | 1,130,320 | | $ | 28,484,064 |
| Verizon Communications, Inc. | | 272,710 | | | 8,235,842 |
| | | | | |
| | | | | $ | 36,719,906 |
| Tobacco - 2.4% | | | | | |
| Lorillard, Inc. | | 200,810 | | $ | 12,398,009 |
| Philip Morris International, Inc. | | 649,040 | | | 23,092,843 |
| | | | | |
| | | | | $ | 35,490,852 |
| Trucking - 1.4% | | | | | |
| FedEx Corp. | | 471,690 | | $ | 20,985,488 |
9
Portfolio of Investments (unaudited) – continued
| | | | | | | |
| Issuer | | Shares/Par | | | Value ($) | |
| | | | | | | |
| Common Stocks - continued | | | | | | | |
| Utilities - Electric Power - 4.0% | | | | | | | |
| Allegheny Energy, Inc. | | 200,180 | | | $ | 4,638,171 | |
| American Electric Power Co., Inc. | | 183,970 | | | | 4,647,082 | |
| CMS Energy Corp. | | 740,890 | | | | 8,772,138 | |
| NRG Energy, Inc. (a) | | 290,190 | | | | 5,107,344 | |
| PG&E Corp. | | 94,620 | | | | 3,616,376 | |
| PPL Corp. | | 399,400 | | | | 11,466,774 | |
| Progress Energy, Inc. | | 188,710 | | | | 6,842,625 | |
| Public Service Enterprise Group, Inc. | | 267,290 | | | | 7,877,036 | |
| Wisconsin Energy Corp. | | 131,610 | | | | 5,418,384 | |
| | | | | | | |
| | | | | | $ | 58,385,930 | |
| Total Common Stocks (Identified Cost, $1,926,300,793) | | | | | $ | 1,455,008,716 | |
| | |
| Money Market Funds (v) - 0.5% | | | | | | | |
MFS Institutional Money Market Portfolio, 0.23%,
at Cost and Net Asset Value | | 7,653,397 | | | $ | 7,653,397 | |
| Total Investments (Identified Cost, $1,933,954,190) | | | | | $ | 1,462,662,113 | |
| | |
| Securities Sold Short - (0.5)% | | | | | | | |
| Chemicals - (0.2)% | | | | | | | |
| Potash Corporation of Saskatchewan, Inc. (a) | | (44,700 | ) | | $ | (3,612,207 | ) |
| | |
| General Merchandise - (0.3)% | | | | | | | |
| BJ’s Wholesale Club, Inc. (a) | | (122,000 | ) | | $ | (3,902,780 | ) |
| Total Securities Sold Short (Proceeds Received, $7,254,396) | | | | | $ | (7,514,987 | ) |
| | |
| Other Assets, Less Liabilities - 1.3% | | | | | | 18,620,548 | |
| Net Assets - 100.0% | | | | | $ | 1,473,767,674 | |
| (a) | Non-income producing security. |
| (s) | Security or a portion of the security was pledged to cover collateral requirements for securities sold short. At March 31, 2009, the value of securities pledged amounted to $5,632,380. |
| (v) | Underlying fund that is available only to investment companies managed by MFS. The rate quoted is the annualized seven-day yield of the fund at period end. |
The following abbreviations are used in this report and are defined:
| GDR | | Global Depository Receipt |
See Notes to Financial Statements
10
Financial Statements
STATEMENT OF ASSETS AND LIABILITIES
At 3/31/09 (unaudited)
This statement represents your fund’s balance sheet, which details the assets and liabilities comprising the total value of the fund.
| | | | | |
| Assets | | | | | |
Investments- | | | | | |
Non-affiliated issuers, at value (identified cost, $1,926,300,793) | | $1,455,008,716 | | | |
Underlying funds, at cost and value | | 7,653,397 | | | |
Total investments, at value (identified cost, $1,933,954,190) | | | | | $1,462,662,113 |
Cash | | 3,705,924 | | | |
Receivable for investments sold | | 36,591,426 | | | |
Receivable for fund shares sold | | 6,231,375 | | | |
Interest and dividends receivable | | 2,300,813 | | | |
Other assets | | 70,936 | | | |
Total assets | | | | | $1,511,562,587 |
| Liabilities | | | | | |
Securities sold short, at value (proceeds received, $7,254,396) | | $7,514,987 | | | |
Payable for investments purchased | | 18,640,106 | | | |
Payable for fund shares reacquired | | 10,360,519 | | | |
Payable to affiliates | | | | | |
Management fee | | 34,807 | | | |
Shareholder servicing costs | | 879,102 | | | |
Distribution and service fees | | 19,851 | | | |
Administrative services fee | | 1,629 | | | |
Payable for independent trustees’ compensation | | 170,290 | | | |
Accrued expenses and other liabilities | | 173,622 | | | |
Total liabilities | | | | | $37,794,913 |
Net assets | | | | | $1,473,767,674 |
| Net assets consist of | | | | | |
Paid-in capital | | $2,494,837,273 | | | |
Unrealized appreciation (depreciation) on investments and translation of assets and liabilities in foreign currencies | | (471,559,487 | ) | | |
Accumulated net realized gain (loss) on investments and foreign currency transactions | | (561,552,334 | ) | | |
Undistributed net investment income | | 12,042,222 | | | |
Net assets | | | | | $1,473,767,674 |
Shares of beneficial interest outstanding | | | | | 95,207,547 |
11
Statement of Assets and Liabilities (unaudited) – continued
| | | | |
Class A shares | | | | |
Net assets | | $910,200,854 | | |
Shares outstanding | | 58,715,419 | | |
Net asset value per share | | | | $15.50 |
Offering price per share (100/94.25 × net asset value per share) | | | | $16.45 |
Class B shares | | | | |
Net assets | | $59,712,165 | | |
Shares outstanding | | 4,131,933 | | |
Net asset value and offering price per share | | | | $14.45 |
Class C shares | | | | |
Net assets | | $67,542,706 | | |
Shares outstanding | | 4,670,770 | | |
Net asset value and offering price per share | | | | $14.46 |
Class I shares | | | | |
Net assets | | $424,329,128 | | |
Shares outstanding | | 26,895,772 | | |
Net asset value, offering price, and redemption price per share | | | | $15.78 |
Class W shares | | | | |
Net assets | | $92,512 | | |
Shares outstanding | | 5,973 | | |
Net asset value, offering price, and redemption price per share | | | | $15.49 |
Class R1 shares | | | | |
Net assets | | $2,289,981 | | |
Shares outstanding | | 160,257 | | |
Net asset value, offering price, and redemption price per share | | | | $14.29 |
Class R2 shares | | | | |
Net assets | | $6,124,667 | | |
Shares outstanding | | 402,793 | | |
Net asset value, offering price, and redemption price per share | | | | $15.21 |
Class R3 shares | | | | |
Net assets | | $3,374,190 | | |
Shares outstanding | | 218,081 | | |
Net asset value, offering price, and redemption price per share | | | | $15.47 |
Class R4 shares | | | | |
Net assets | | $101,471 | | |
Shares outstanding | | 6,549 | | |
Net asset value, offering price, and redemption price per share | | | | $15.49 |
On sales of $50,000 or more, the offering price of Class A shares is reduced. A contingent deferred sales charge may be imposed on redemptions of Class A, Class B, and Class C shares.
See Notes to Financial Statements
12
Financial Statements
STATEMENT OF OPERATIONS
Six months ended 3/31/09 (unaudited)
This statement describes how much your fund earned in investment income and accrued in expenses. It also describes any gains and/or losses generated by fund operations.
| | | | | | |
| Net investment income | | | | | | |
Income | | | | | | |
Dividends | | $20,941,884 | | | | |
Interest | | 154,235 | | | | |
Dividends from underlying funds | | 75,497 | | | | |
Foreign taxes withheld | | (139,145 | ) | | | |
Total investment income | | | | | $21,032,471 | |
Expenses | | | | | | |
Management fee | | $3,649,303 | | | | |
Distribution and service fees | | 2,382,743 | | | | |
Shareholder servicing costs | | 2,246,108 | | | | |
Administrative services fee | | 177,640 | | | | |
Independent trustees’ compensation | | 32,621 | | | | |
Custodian fee | | 85,246 | | | | |
Shareholder communications | | 78,972 | | | | |
Auditing fees | | 24,551 | | | | |
Legal fees | | 24,807 | | | | |
Dividend and interest expense on securities sold short | | 6,647 | | | | |
Miscellaneous | | 67,689 | | | | |
Total expenses | | | | | $8,776,327 | |
Fees paid indirectly | | (2,932 | ) | | | |
Reduction of expenses by investment adviser | | (4,383 | ) | | | |
Net expenses | | | | | $8,769,012 | |
Net investment income | | | | | $12,263,459 | |
Realized and unrealized gain (loss) on investments
and foreign currency transactions | | | | | | |
Realized gain (loss) (identified cost basis) | | | | | | |
Investment transactions | | $(474,157,005 | ) | | | |
Written option transactions | | 32,175 | | | | |
Securities sold short | | 1,274,729 | | | | |
Foreign currency transactions | | 49,383 | | | | |
Net realized gain (loss) on investments
and foreign currency transactions | | | | | $(472,800,718 | ) |
Change in unrealized appreciation (depreciation) | | | | | | |
Investments | | $(203,874,532 | ) | | | |
Securities sold short | | (260,591 | ) | | | |
Translation of assets and liabilities in foreign currencies | | (13,642 | ) | | | |
Net unrealized gain (loss) on investments
and foreign currency translation | | | | | $(204,148,765 | ) |
Net realized and unrealized gain (loss) on investments
and foreign currency | | | | | $(676,949,483 | ) |
Change in net assets from operations | | | | | $(664,686,024 | ) |
See Notes to Financial Statements
13
Financial Statements
STATEMENTS OF CHANGES IN NET ASSETS
These statements describe the increases and/or decreases in net assets resulting from operations, any distributions, and any shareholder transactions.
| | | | | | |
| Change in net assets | | Six months ended
3/31/09
(unaudited) | | | Year ended
9/30/08 | |
| From operations | | | | | | |
Net investment income | | $12,263,459 | | | $16,759,705 | |
Net realized gain (loss) on investments and foreign
currency transactions | | (472,800,718 | ) | | 54,670,163 | |
Net unrealized gain (loss) on investments and foreign
currency translation | | (204,148,765 | ) | | (508,408,966 | ) |
Change in net assets from operations | | $(664,686,024 | ) | | $(436,979,098 | ) |
| Distributions declared to shareholders | | | | | | |
From net investment income | | | | | | |
Class A | | $(9,042,720 | ) | | $(7,726,823 | ) |
Class I | | (7,650,016 | ) | | (8,485,735 | ) |
Class W | | (1,079 | ) | | (1,732 | ) |
Class R1 | | — | | | (20,354 | ) |
Former Class R2 (b) | | — | | | (16,561 | ) |
Class R2 | | (40,371 | ) | | (56,748 | ) |
Class R3 | | (29,671 | ) | | (40,543 | ) |
Class R4 | | (544 | ) | | (581 | ) |
Total distributions declared to shareholders | | $(16,764,401 | ) | | $(16,349,077 | ) |
Change in net assets from fund share transactions | | $121,574,169 | | | $(217,353,832 | ) |
Total change in net assets | | $(559,876,256 | ) | | $(670,682,007 | ) |
| Net assets | | | | | | |
At beginning of period | | 2,033,643,930 | | | 2,704,325,937 | |
At end of period (including undistributed net investment income of $12,042,222 and $16,543,164, respectively) | | $1,473,767,674 | | | $2,033,643,930 | |
| (b) | At the close of business on April 18, 2008, Class R and Class R2 shares converted into Class R3 shares. Following the conversion, Class R3 shares were renamed Class R2 shares. |
See Notes to Financial Statements
14
Financial Statements
FINANCIAL HIGHLIGHTS
The financial highlights table is intended to help you understand the fund’s financial performance for the semiannual period and the past 5 fiscal years (or life of a particular share class, if shorter). Certain information reflects financial results for a single fund share. The total returns in the table represent the rate by which an investor would have earned (or lost) on an investment in the fund share class (assuming reinvestment of all distributions) held for the entire period.
| | | | | | | | | | | | | | | | | | |
| | | Six months
ended
3/31/09 (unaudited) | | | Years ended 9/30 | |
| Class A | | | 2008 | | | 2007 | | | 2006 | | | 2005 | | | 2004 | |
| | | | | | | | | | | | | | | | | |
Net asset value, beginning
of period | | $22.05 | | | $26.92 | | | $22.59 | | | $21.21 | | | $17.93 | | | $15.90 | |
Income (loss) from
investment operations | | | | | | | | | | | | | | | | | | |
Net investment
income (d) | | $0.11 | | | $0.16 | | | $0.15 | | | $0.08 | | | $0.06 | | | $0.07 | |
Net realized and
unrealized gain
(loss) on
investments and
foreign currency | | (6.51 | ) | | (4.88 | ) | | 4.24 | | | 1.33 | | | 3.25 | | | 2.08 | |
Total from investment
operations | | $(6.40 | ) | | $(4.72 | ) | | $4.39 | | | $1.41 | | | $3.31 | | | $2.15 | |
Less distributions
declared to
shareholders | | | | | | | | | | | | | | | | | | |
From net investment
income | | $(0.15 | ) | | $(0.15 | ) | | $(0.06 | ) | | $(0.03 | ) | | $(0.03 | ) | | $(0.12 | ) |
Net asset value, end
of period | | $15.50 | | | $22.05 | | | $26.92 | | | $22.59 | | | $21.21 | | | $17.93 | |
Total return (%) (r)(s)(t) | | (29.07 | )(n) | | (17.62 | ) | | 19.49 | | | 6.65 | | | 18.49 | | | 13.54 | (b)(q) |
Ratios (%) (to average
net assets) and
Supplemental data: | | | | | | | | | | | | | | | | | | |
Expenses before expense
reductions (f) | | 1.09 | (a) | | 1.00 | | | 0.97 | | | 1.02 | | | 1.06 | | | 1.02 | |
Expenses after expense
reductions (f) | | 1.09 | (a) | | 1.00 | | | 0.97 | | | 1.02 | | | 1.06 | | | 1.02 | |
Expenses after expense
reductions excluding
short sale dividend and
interest expense (f) | | 1.09 | (a) | | N/A | | | N/A | | | N/A | | | N/A | | | N/A | |
Net investment
income | | 1.38 | (a) | | 0.65 | | | 0.61 | | | 0.38 | | | 0.32 | | | 0.39 | |
Portfolio turnover | | 68 | | | 104 | | | 84 | | | 99 | | | 99 | | | 117 | |
Net assets at end of
period (000 Omitted) | | $910,201 | | | $1,014,501 | | | $1,377,199 | | | $1,491,146 | | | $1,567,980 | | | $1,405,075 | |
See Notes to Financial Statements
15
Financial Highlights – continued
| | | | | | | | | | | | | | | | | | |
| | | Six months
ended
3/31/09 (unaudited) | | | Years ended 9/30 | |
| Class B | | | 2008 | | | 2007 | | | 2006 | | | 2005 | | | 2004 | |
| | | | | | | | | | | | | | | | | |
Net asset value, beginning
of period | | $20.44 | | | $24.97 | | | $21.04 | | | $19.85 | | | $16.86 | | | $14.96 | |
Income (loss) from
investment operations | | | | | | | | | | | | | | | | | | |
Net investment
income (loss) (d) | | $0.05 | | | $(0.00 | )(w) | | $(0.01 | ) | | $(0.06 | ) | | $(0.06 | ) | | $(0.04 | ) |
Net realized and
unrealized gain
(loss) on
investments and
foreign currency | | (6.04 | ) | | (4.53 | ) | | 3.94 | | | 1.25 | | | 3.05 | | | 1.95 | |
Total from investment
operations | | $(5.99 | ) | | $(4.53 | ) | | $3.93 | | | $1.19 | | | $2.99 | | | $1.91 | |
Less distributions
declared to
shareholders | | | | | | | | | | | | | | | | | | |
From net investment
income | | $— | | | $— | | | $— | | | $— | | | $— | | | $(0.01 | ) |
Net asset value, end
of period | | $14.45 | | | $20.44 | | | $24.97 | | | $21.04 | | | $19.85 | | | $16.86 | |
Total return (%) (r)(s)(t) | | (29.31 | )(n) | | (18.14 | ) | | 18.68 | | | 5.99 | | | 17.73 | | | 12.78 | (b)(q) |
Ratios (%) (to average
net assets) and
Supplemental data: | | | | | | | | | | | | | | | | | | |
Expenses before expense
reductions (f) | | 1.75 | (a) | | 1.65 | | | 1.62 | | | 1.68 | | | 1.71 | | | 1.67 | |
Expenses after expense
reductions (f) | | 1.75 | (a) | | 1.65 | | | 1.62 | | | 1.68 | | | 1.71 | | | 1.67 | |
Expenses after expense
reductions excluding
short sale dividend and
interest expense (f) | | 1.75 | (a) | | N/A | | | N/A | | | N/A | | | N/A | | | N/A | |
Net investment
income (loss) | | 0.70 | (a) | | (0.01 | ) | | (0.02 | ) | | (0.28 | ) | | (0.33 | ) | | (0.26 | ) |
Portfolio turnover | | 68 | | | 104 | | | 84 | | | 99 | | | 99 | | | 117 | |
Net assets at end of
period (000 Omitted) | | $59,712 | | | $108,949 | | | $220,062 | | | $321,822 | | | $544,719 | | | $836,113 | |
See Notes to Financial Statements
16
Financial Highlights – continued
| | | | | | | | | | | | | | | | | | |
| | | Six months
ended
3/31/09 (unaudited) | | | Years ended 9/30 | |
| Class C | | | 2008 | | | 2007 | | | 2006 | | | 2005 | | | 2004 | |
| | | | | | | | | | | | | | | | | |
Net asset value, beginning
of period | | $20.46 | | | $24.99 | | | $21.05 | | | $19.86 | | | $16.87 | | | $14.96 | |
Income (loss) from
investment operations | | | | | | | | | | | | | | | | | | |
Net investment
income (loss) (d) | | $0.05 | | | $0.00 | (w) | | $(0.01 | ) | | $(0.06 | ) | | $(0.06 | ) | | $(0.04 | ) |
Net realized and
unrealized gain
(loss) on
investments and
foreign currency | | (6.05 | ) | | (4.53 | ) | | 3.95 | | | 1.25 | | | 3.05 | | | 1.96 | |
Total from investment
operations | | $(6.00 | ) | | $(4.53 | ) | | $3.94 | | | $1.19 | | | $2.99 | | | $1.92 | |
Less distributions declared to
shareholders | | | | | | | | | | | | | | | | | | |
From net investment
income | | $— | | | $— | | | $— | | | $— | | | $— | | | $(0.01 | ) |
Net asset value, end
of period | | $14.46 | | | $20.46 | | | $24.99 | | | $21.05 | | | $19.86 | | | $16.87 | |
Total return (%) (r)(s)(t) | | (29.33 | )(n) | | (18.13 | ) | | 18.72 | | | 5.99 | | | 17.72 | | | 12.82 | (b)(q) |
Ratios (%) (to average
net assets) and
Supplemental data: | | | | | | | | | | | | | | | | | | |
Expenses before expense
reductions (f) | | 1.75 | (a) | | 1.65 | | | 1.62 | | | 1.68 | | | 1.71 | | | 1.67 | |
Expenses after expense
reductions (f) | | 1.75 | (a) | | 1.65 | | | 1.62 | | | 1.67 | | | 1.71 | | | 1.67 | |
Expenses after expense
reductions excluding
short sale dividend and
interest expense (f) | | 1.75 | (a) | | N/A | | | N/A | | | N/A | | | N/A | | | N/A | |
Net investment
income (loss) | | 0.71 | (a) | | 0.00 | | | (0.05 | ) | | (0.28 | ) | | (0.33 | ) | | (0.26 | ) |
Portfolio turnover | | 68 | | | 104 | | | 84 | | | 99 | | | 99 | | | 117 | |
Net assets at end of
period (000 Omitted) | | $67,543 | | | $105,748 | | | $155,741 | | | $170,718 | | | $208,725 | | | $226,376 | |
See Notes to Financial Statements
17
Financial Highlights – continued
| | | | | | | | | | | | | | | | | | |
| | | Six months
ended
3/31/09 (unaudited) | | | Years ended 9/30 | |
| Class I | | | 2008 | | | 2007 | | | 2006 | | | 2005 | | | 2004 | |
| | | | | | | | | | | | | | | | | |
Net asset value, beginning
of period | | $22.50 | | | $27.46 | | | $23.04 | | | $21.63 | | | $18.28 | | | $16.21 | |
Income (loss) from
investment operations | | | | | | | | | | | | | | | | | | |
Net investment
income (d) | | $0.14 | | | $0.26 | | | $0.23 | | | $0.16 | | | $0.14 | | | $0.14 | |
Net realized and
unrealized gain
(loss) on
investments and
foreign currency | | (6.64 | ) | | (4.97 | ) | | 4.34 | | | 1.35 | | | 3.31 | | | 2.11 | |
Total from investment
operations | | $(6.50 | ) | | $(4.71 | ) | | $4.57 | | | $1.51 | | | $3.45 | | | $2.25 | |
Less distributions
declared to
shareholders | | | | | | | | | | | | | | | | | | |
From net investment
income | | $(0.22 | ) | | $(0.25 | ) | | $(0.15 | ) | | $(0.10 | ) | | $(0.10 | ) | | $(0.18 | ) |
Net asset value, end
of period | | $15.78 | | | $22.50 | | | $27.46 | | | $23.04 | | | $21.63 | | | $18.28 | |
Total return (%) (r)(s) | | (28.95 | )(n) | | (17.31 | ) | | 19.91 | | | 7.01 | | | 18.93 | | | 13.92 | (b)(q) |
Ratios (%) (to average
net assets) and
Supplemental data: | | | | | | | | | | | | | | | | | | |
Expenses before expense
reductions (f) | | 0.75 | (a) | | 0.65 | | | 0.62 | | | 0.68 | | | 0.71 | | | 0.67 | |
Expenses after expense
reductions (f) | | 0.75 | (a) | | 0.65 | | | 0.62 | | | 0.67 | | | 0.71 | | | 0.67 | |
Expenses after expense
reductions excluding
short sale dividend and
interest expense (f) | | 0.75 | (a) | | N/A | | | N/A | | | N/A | | | N/A | | | N/A | |
Net investment
income | | 1.75 | (a) | | 1.01 | | | 0.92 | | | 0.73 | | | 0.67 | | | 0.78 | |
Portfolio turnover | | 68 | | | 104 | | | 84 | | | 99 | | | 99 | | | 117 | |
Net assets at end of
period (000 Omitted) | | $424,329 | | | $786,709 | | | $932,127 | | | $760,210 | | | $619,534 | | | $421,942 | |
See Notes to Financial Statements
18
Financial Highlights – continued
| | | | | | | | | | | | |
| | | Six months
ended
3/31/09 (unaudited) | | | Years ended 9/30 | |
| Class W | | | 2008 | | | 2007 | | | 2006 (i) | |
| | | | | | | | | | | |
Net asset value, beginning of period | | $22.06 | | | $26.94 | | | $22.62 | | | $22.76 | |
| Income (loss) from investment operations | | | | | | | | | | | | |
Net investment income (d) | | $0.13 | | | $0.23 | | | $0.20 | | | $0.06 | |
Net realized and unrealized gain (loss)
on investments and foreign currency | | (6.51 | ) | | (4.87 | ) | | 4.25 | | | (0.20 | ) |
Total from investment operations | | $(6.38 | ) | | $(4.64 | ) | | $4.45 | | | $(0.14 | ) |
| Less distributions declared to shareholders | | | | | | | | | | | | |
From net investment income | | $(0.19 | ) | | $(0.24 | ) | | $(0.13 | ) | | $— | |
Net asset value, end of period | | $15.49 | | | $22.06 | | | $26.94 | | | $22.62 | |
Total return (%) (r)(s) | | (28.98 | )(n) | | (17.40 | ) | | 19.77 | | | (0.62 | )(n) |
Ratios (%) (to average net assets)
and Supplemental data: | | | | | | | | | | | | |
Expenses before expense reductions (f) | | 0.85 | (a) | | 0.75 | | | 0.72 | | | 0.77 | (a) |
Expenses after expense reductions (f) | | 0.85 | (a) | | 0.75 | | | 0.72 | | | 0.77 | (a) |
Expenses after expense reductions excluding
short sale dividend and interest expense (f) | | 0.85 | (a) | | N/A | | | N/A | | | N/A | |
Net investment income | | 1.65 | (a) | | 0.91 | | | 0.79 | | | 0.66 | (a) |
Portfolio turnover | | 68 | | | 104 | | | 84 | | | 99 | |
Net assets at end of period (000 Omitted) | | $93 | | | $120 | | | $198 | | | $99 | |
See Notes to Financial Statements
19
Financial Highlights – continued
| | | | | | | | | | | | | | | |
| | | Six months
ended
3/31/09 (unaudited) | | | Years ended 9/30 | |
| Class R1 | | | 2008 | | | 2007 | | | 2006 | | | 2005 (i) | |
| | | | | | | | | | | | | | |
Net asset value, beginning of period | | $20.21 | | | $24.82 | | | $20.93 | | | $19.84 | | | $18.66 | |
| Income (loss) from investment operations | | | | | | | | | | | | | | | |
Net investment income (loss) (d) | | $0.05 | | | $(0.01 | ) | | $(0.04 | ) | | $(0.07 | ) | | $(0.05 | ) |
Net realized and unrealized gain (loss)
on investments and foreign currency | | (5.97 | ) | | (4.48 | ) | | 3.93 | | | 1.24 | | | 1.23 | (g) |
Total from investment operations | | $(5.92 | ) | | $(4.49 | ) | | $3.89 | | | $1.17 | | | $1.18 | |
| Less distributions declared to shareholders | | | | | | | | | | | | | | | |
From net investment income | | $— | | | $(0.12 | ) | | $— | | | $(0.08 | ) | | $— | |
Net asset value, end of period | | $14.29 | | | $20.21 | | | $24.82 | | | $20.93 | | | $19.84 | |
Total return (%) (r)(s) | | (29.29 | )(n) | | (18.19 | ) | | 18.59 | | | 5.89 | | | 6.32 | (n) |
Ratios (%) (to average net assets)
and Supplemental data: | | | | | | | | | | | | | | | |
Expenses before expense reductions (f) | | 1.75 | (a) | | 1.69 | | | 1.77 | | | 1.87 | | | 1.89 | (a) |
Expenses after expense reductions (f) | | 1.75 | (a) | | 1.69 | | | 1.72 | | | 1.77 | | | 1.89 | (a) |
Expenses after expense reductions excluding
short sale dividend and interest expense (f) | | 1.75 | (a) | | N/A | | | N/A | | | N/A | | | N/A | |
Net investment income (loss) | | 0.70 | (a) | | (0.03 | ) | | (0.19 | ) | | (0.36 | ) | | (0.59 | )(a) |
Portfolio turnover | | 68 | | | 104 | | | 84 | | | 99 | | | 99 | |
Net assets at end of period (000 Omitted) | | $2,290 | | | $3,787 | | | $3,445 | | | $1,868 | | | $776 | |
See Notes to Financial Statements
20
Financial Highlights – continued
| | | | | | | | | | | | | | | | | | |
| | | Six months
ended
3/31/09 (unaudited) | | | Years ended 9/30 | |
| Class R2 | | | 2008 | | | 2007 | | | 2006 | | | 2005 | | | 2004 (i) | |
| | | | | | | | | | | | | | | | | |
Net asset value, beginning
of period | | $21.59 | | | $26.42 | | | $22.22 | | | $20.91 | | | $17.77 | | | $16.61 | |
Income (loss) from
investment operations | | | | | | | | | | | | | | | | | | |
Net investment
income (loss) (d) | | $0.10 | | | $0.12 | | | $0.06 | | | $0.02 | | | $(0.02 | ) | | $(0.01 | ) |
Net realized and
unrealized gain
(loss) on
investments and
foreign currency | | (6.38 | ) | | (4.77 | ) | | 4.18 | | | 1.31 | | | 3.22 | | | 1.35 | |
Total from investment
operations | | $(6.28 | ) | | $(4.65 | ) | | $4.24 | | | $1.33 | | | $3.20 | | | $1.34 | |
Less distributions
declared to
shareholders | | | | | | | | | | | | | | | | | | |
From net investment
income | | $(0.10 | ) | | $(0.18 | ) | | $(0.04 | ) | | $(0.02 | ) | | $(0.06 | ) | | $(0.18 | ) |
Net asset value, end
of period | | $15.21 | | | $21.59 | | | $26.42 | | | $22.22 | | | $20.91 | | | $17.77 | |
Total return (%) (r)(s) | | (29.12 | )(n) | | (17.73 | ) | | 19.12 | | | 6.34 | | | 18.02 | | | 8.10 | (b)(n)(q) |
Ratios (%) (to average
net assets) and
Supplemental data: | | | | | | | | | | | | | | | | | | |
Expenses before expense
reductions (f) | | 1.25 | (a) | | 1.18 | | | 1.31 | | | 1.42 | | | 1.46 | | | 1.42 | (a) |
Expenses after expense
reductions (f) | | 1.25 | (a) | | 1.18 | | | 1.27 | | | 1.32 | | | 1.46 | | | 1.42 | (a) |
Expenses after expense
reductions excluding
short sale dividend and
interest expense (f) | | 1.25 | (a) | | N/A | | | N/A | | | N/A | | | N/A | | | N/A | |
Net investment
income (loss) | | 1.21 | (a) | | 0.49 | | | 0.24 | | | 0.09 | | | (0.09 | ) | | (0.06 | )(a) |
Portfolio turnover | | 68 | | | 104 | | | 84 | | | 99 | | | 99 | | | 117 | |
Net assets at end of
period (000 Omitted) | | $6,125 | | | $9,046 | | | $6,079 | | | $2,632 | | | $1,329 | | | $155 | |
See Notes to Financial Statements
21
Financial Highlights – continued
| | | | | | | | | | | | | | | |
| | | Six months
ended
3/31/09 (unaudited) | | | Years ended 9/30 | |
| Class R3 | | | 2008 | | | 2007 | | | 2006 | | | 2005 (i) | |
| | | | | | | | | | | | | | |
Net asset value, beginning of period | | $21.99 | | | $26.88 | | | $22.55 | | | $21.21 | | | $19.87 | |
| Income (loss) from investment operations | | | | | | | | | | | | | | | |
Net investment income (d) | | $0.12 | | | $0.18 | | | $0.11 | | | $0.08 | | | $0.03 | |
Net realized and unrealized gain (loss)
on investments and foreign currency | | (6.50 | ) | | (4.87 | ) | | 4.27 | | | 1.32 | | | 1.31 | (g) |
Total from investment operations | | $(6.38 | ) | | $(4.69 | ) | | $4.38 | | | $1.40 | | | $1.34 | |
| Less distributions declared to shareholders | | | | | | | | | | | | | | | |
From net investment income | | $(0.14 | ) | | $(0.20 | ) | | $(0.05 | ) | | $(0.06 | ) | | $— | |
Net asset value, end of period | | $15.47 | | | $21.99 | | | $26.88 | | | $22.55 | | | $21.21 | |
Total return (%) (r)(s) | | (29.04 | )(n) | | (17.60 | ) | | 19.46 | | | 6.62 | | | 6.74 | (n) |
Ratios (%) (to average net assets)
and Supplemental data: | | | | | | | | | | | | | | | |
Expenses before expense reductions (f) | | 1.00 | (a) | | 0.94 | | | 1.02 | | | 1.07 | | | 1.11 | (a) |
Expenses after expense reductions (f) | | 1.00 | (a) | | 0.94 | | | 1.02 | | | 1.07 | | | 1.11 | (a) |
Expenses after expense reductions excluding
short sale dividend and interest expense (f) | | 1.00 | (a) | | N/A | | | N/A | | | N/A | | | N/A | |
Net investment income | | 1.47 | (a) | | 0.72 | | | 0.44 | | | 0.34 | | | 0.31 | (a) |
Portfolio turnover | | 68 | | | 104 | | | 84 | | | 99 | | | 99 | |
Net assets at end of period (000 Omitted) | | $3,374 | | | $4,727 | | | $5,513 | | | $1,815 | | | $53 | |
See Notes to Financial Statements
22
Financial Highlights – continued
| | | | | | | | | | | | | | | |
| | | Six months
ended
3/31/09 (unaudited) | | | Years ended 9/30 | |
| Class R4 | | | 2008 | | | 2007 | | | 2006 | | | 2005 (i) | |
| | | | | | | | | | | | | | |
Net asset value, beginning of period | | $22.09 | | | $26.95 | | | $22.62 | | | $21.24 | | | $19.87 | |
| Income (loss) from investment operations | | | | | | | | | | | | | | | |
Net investment income (d) | | $0.13 | | | $0.25 | | | $0.21 | | | $0.14 | | | $0.06 | |
Net realized and unrealized gain (loss)
on investments and foreign currency | | (6.52 | ) | | (4.88 | ) | | 4.25 | | | 1.33 | | | 1.31 | (g) |
Total from investment operations | | $(6.39 | ) | | $(4.63 | ) | | $4.46 | | | $1.47 | | | $1.37 | |
| Less distributions declared to shareholders | | | | | | | | | | | | | | | |
From net investment income | | $(0.21 | ) | | $(0.23 | ) | | $(0.13 | ) | | $(0.09 | ) | | $— | |
Net asset value, end of period | | $15.49 | | | $22.09 | | | $26.95 | | | $22.62 | | | $21.24 | |
Total return (%) (r)(s) | | (28.97 | )(n) | | (17.34 | ) | | 19.77 | | | 6.95 | | | 6.89 | (n) |
Ratios (%) (to average net assets)
and Supplemental data: | | | | | | | | | | | | | | | |
Expenses before expense reductions (f) | | 0.75 | (a) | | 0.67 | | | 0.72 | | | 0.77 | | | 0.81 | (a) |
Expenses after expense reductions (f) | | 0.75 | (a) | | 0.67 | | | 0.72 | | | 0.77 | | | 0.81 | (a) |
Expenses after expense reductions excluding
short sale dividend and interest expense (f) | | 0.75 | (a) | | N/A | | | N/A | | | N/A | | | N/A | |
Net investment income | | 1.66 | (a) | | 0.98 | | | 0.83 | | | 0.63 | | | 0.61 | (a) |
Portfolio turnover | | 68 | | | 104 | | | 84 | | | 99 | | | 99 | |
Net assets at end of period (000 Omitted) | | $101 | | | $57 | | | $68 | | | $57 | | | $53 | |
See Notes to Financial Statements
23
Financial Highlights – continued
Any redemption fees charged by the fund during the 2004 fiscal year resulted in a per share impact of less than $0.01.
| (b) | The fund’s net asset value and total return calculation include a non-recurring accrual recorded as a result of an administrative proceeding regarding disclosure of brokerage allocation practices in connection with fund sales. The non-recurring accrual resulted in an increase in the net asset value of $0.02 per share based on shares outstanding on the day the proceeds were recorded. Excluding the effect of this accrual from the ending net asset value per share, Class A, Class B, Class C, Class I, and Class R2 total returns for the year ended September 30, 2004 would have been lower by 0.11%. |
| (d) | Per share data is based on average shares outstanding. |
| (f) | Ratios do not reflect reductions from fees paid indirectly, if applicable. |
| (g) | The per share amount varies from the net realized and unrealized gain/loss for the period because of the timing of sales of fund shares and the amount of per share realized and unrealized gains and losses at such time. |
| (i) | For the period from the class’ inception, October 31, 2003 (Class R2), April 1, 2005 (Classes R1, R3, and R4) and May 1, 2006 (Class W) through the stated period end. |
| (q) | The fund’s net asset value and total return calculation include proceeds received on February 18, 2004 from a non-recurring litigation settlement from Rite Aid Corporation and on March 19, 2004 for the remaining payment of a non-recurring litigation settlement from Cendant Corporation, recorded as a realized gain on investment transactions. The proceeds resulted in an increase in the net asset value of $0.02 per share based on shares outstanding on the days the proceeds were received. Excluding the effect of these payment from the ending net asset value per share, the Class A, Class B, Class C, Class I, and Class R2 total return for the year ended September 30, 2004 would have been lower by approximately 0.10%, 0.14%, 0.12%, 0.09%, and 0.09%, respectively. |
| (r) | Certain expenses have been reduced without which performance would have been lower. |
| (s) | From time to time the fund may receive proceeds from litigation settlements, without which performance would be lower. |
| (t) | Total returns do not include any applicable sales charges. |
| (w) | Per share amount was less than $0.01. |
24
NOTES TO FINANCIAL STATEMENTS
(unaudited)
| (1) | | Business and Organization |
MFS Research Fund (the fund) is a series of MFS Series Trust V (the trust). The trust is organized as a Massachusetts business trust and is registered under the Investment Company Act of 1940, as amended, as an open-end management investment company.
| (2) | | Significant Accounting Policies |
General – The preparation of financial statements in conformity with U.S. generally accepted accounting principles requires management to make estimates and assumptions that affect the reported amounts of assets and liabilities, and disclosure of contingent assets and liabilities at the date of the financial statements and the reported amounts of revenues and expenses during the reporting period. Actual results could differ from those estimates. The fund can invest in foreign securities, including securities of emerging market issuers. Investments in foreign securities are vulnerable to the effects of changes in the relative values of the local currency and the U.S. dollar and to the effects of changes in each country’s legal, political, and economic environment. The markets of emerging markets countries are generally more volatile than the markets of developed countries with more mature economies. All of the risks of investing in foreign securities previously described are heightened when investing in emerging markets countries.
Investment Valuations – Equity securities, including restricted equity securities, are generally valued at the last sale or official closing price as provided by a third-party pricing service on the market or exchange on which they are primarily traded. For securities for which there were no sales reported that day, equity securities are generally valued at the last quoted daily bid quotation as provided by a third-party pricing service on the market or exchange on which such securities are primarily traded. For securities held short for which there were no sales reported for that day, the position is generally valued at the last quoted daily ask quotation as provided by a third-party pricing service on the market or exchange on which such securities are primarily traded. Short-term instruments with a maturity at issuance of 60 days or less generally are valued at amortized cost, which approximates market value. Exchange-traded options are generally valued at the last sale or official closing price as provided by a third-party pricing service on the exchange on which such options are primarily traded. Exchange-traded options for which there were no sales reported that day are generally valued at the last daily bid quotation as provided by a third-party pricing service on the exchange on which such options are primarily traded. Options not traded on an exchange are generally valued at a broker/dealer bid quotation. Foreign currency options are generally valued using an external pricing model that uses market data
25
Notes to Financial Statements (unaudited) – continued
from a third-party source. Open-end investment companies are generally valued at net asset value per share. Securities and other assets generally valued on the basis of information from a third-party pricing service may also be valued at a broker/dealer bid quotation. Values obtained from pricing services can utilize both dealer-supplied valuations and electronic data processing techniques, which take into account factors such as institutional-size trading in similar groups of securities, yield, quality, coupon rate, maturity, type of issue, trading characteristics, and other market data. The values of foreign securities and other assets and liabilities expressed in foreign currencies are converted to U.S. dollars using the mean of bid and asked prices for rates provided by a third-party pricing service.
The Board of Trustees has delegated primary responsibility for determining or causing to be determined the value of the fund’s investments (including any fair valuation) to the adviser pursuant to valuation policies and procedures approved by the Board. If the adviser determines that reliable market quotations are not readily available, investments are valued at fair value as determined in good faith by the adviser in accordance with such procedures under the oversight of the Board of Trustees. Under the fund’s valuation policies and procedures, market quotations are not considered to be readily available for most types of debt instruments and floating rate loans and many types of derivatives. These investments are generally valued at fair value based on information from third party pricing services. In addition, investments may be valued at fair value if the adviser determines that an investment’s value has been materially affected by events occurring after the close of the exchange or market on which the investment is principally traded (such as foreign exchange or market) and prior to the determination of the fund’s net asset value, or after the halting of trading of a specific security where trading does not resume prior to the close of the exchange or market on which the security is principally traded. Events that occur on a frequent basis after foreign markets close (such as developments in foreign markets and significant movements in the U.S. markets) and prior to the determination of the fund’s net asset value may be deemed to have a material affect on the value of securities traded in foreign markets. Accordingly, the fund’s foreign equity securities may often be valued at fair value. The adviser generally relies on third party pricing services or other information (such as the correlation with price movements of similar securities in the same or other markets; the type, cost and investment characteristics of the security; the business and financial condition of the issuer; and trading and other market data) to assist in determining whether to fair value and at what value to fair value an investment. The value of an investment for purposes of calculating the fund’s net asset value can differ depending on the source and method used to determine value. When fair valuation is used, the value of an investment used
26
Notes to Financial Statements (unaudited) – continued
to determine the fund’s net asset value may differ from quoted or published prices for the same investment. There can be no assurance that the fund could obtain the fair value assigned to an investment if it were to sell the investment at the same time at which the fund determines its net asset value per share.
The fund adopted FASB Statement No. 157, Fair Value Measurements (the “Statement”). This Statement provides a single definition of fair value, a hierarchy for measuring fair value and expanded disclosures about fair value measurements.
Various inputs are used in determining the value of the fund’s assets or liabilities carried at market value. These inputs are categorized into three broad levels. Level 1 includes quoted prices in active markets for identical assets or liabilities. Level 2 includes other significant observable market-based inputs (including quoted prices for similar securities, interest rates, prepayment speed, and credit risk). Level 3 includes unobservable inputs, which may include the adviser’s own assumptions in determining the fair value of investments. Other financial instruments are derivative instruments not reflected in total investments, such as futures, forwards, swap contracts and written options. The following is a summary of the levels used as of March 31, 2009 in valuing the fund’s assets or liabilities carried at market value:
| | | | | | | | | | |
| | | Level 1 | | | Level 2 | | Level 3 | | Total | |
| Investments in Securities | | $1,462,662,113 | | | $— | | $— | | $1,462,662,113 | |
| Short Sales | | $(7,514,987 | ) | | $— | | $— | | $(7,514,987 | ) |
| Other Financial Instruments | | $— | | | $— | | $— | | $— | |
Repurchase Agreements – The fund may enter into repurchase agreements with approved counterparties. Each repurchase agreement is recorded at cost. The fund requires that the securities collateral in a repurchase transaction be transferred to a custodian. The fund monitors, on a daily basis, the value of the collateral to ensure that its value, including accrued interest, is greater than amounts owed to the fund under each such repurchase agreement.
Foreign Currency Translation – Purchases and sales of foreign investments, income, and expenses are converted into U.S. dollars based upon currency exchange rates prevailing on the respective dates of such transactions or on the reporting date for foreign denominated receivables and payables. Gains and losses attributable to foreign currency exchange rates on sales of securities are recorded for financial statement purposes as net realized gains and losses on investments. Gains and losses attributable to foreign exchange rate movements on receivables, payables, income and expenses are recorded for financial statement purposes as foreign currency transaction gains and losses. That portion of both realized and unrealized gains and losses on investments that results from fluctuations in foreign currency exchange rates is not separately disclosed.
Derivative Risk – The fund may invest in derivatives for hedging or non-hedging purposes. While hedging can reduce or eliminate losses, it can
27
Notes to Financial Statements (unaudited) – continued
also reduce or eliminate gains. When the fund uses derivatives as an investment to gain market exposure, or for hedging purposes, gains and losses from derivative instruments may be substantially greater than the derivative’s original cost. Cash that has been segregated on behalf of certain derivative contracts will be reported separately on the Statement of Assets and Liabilities as restricted cash. On some over-the-counter derivatives, the fund attempts to reduce its exposure to counterparty credit risk by entering into an ISDA Master Agreement on a bilateral basis with each of the counterparties with whom it undertakes a significant volume of transactions. The ISDA Master Agreement gives the fund the right, upon an event of default by the applicable counterparty, to close out all transactions traded under such agreement and to net amounts owed under each transaction to one net amount payable by one party to the other. This right to close out and net payments across all transactions traded under the ISDA Master Agreement could result in a reduction of the fund’s credit risk to such counterparty equal to any amounts payable by the fund under the applicable transactions, if any. However, absent an event of default by the counterparty, the ISDA Master Agreement does not result in an offset of reported balance sheet assets and liabilities across transactions between the fund and the applicable counterparty. Derivative instruments include written options and purchased options.
In March 2008, FASB Statement No. 161, Disclosures about Derivative Instruments and Hedging Activities (the “Standard”) was issued, and is effective for financial statements issued for fiscal years and interim periods beginning after November 15, 2008. This Standard provides enhanced disclosures about the fund’s use of and accounting for derivative instruments and the effect of derivative instruments on the fund’s results of operations and financial position. Management is evaluating the application of the Standard to the fund, and believes the impact resulting from the adoption of this Standard will be limited to expanded disclosure in the fund’s financial statements.
FASB Staff Position (FSP) 133-1 was implemented during the period. FSP 133-1 amends FAS 133 to require sellers of credit derivatives to make disclosures that will enable financial statement users to assess the potential effects of those credit derivatives on an entity’s financial position, financial performance and cash flows. There was no impact from implementing FSP 133-1 as the fund did not hold any of these credit derivatives at period end.
Written Options – The fund may write call or put options in exchange for a premium. The premium is initially recorded as a liability, which is subsequently adjusted to the current value of the option contract. When a written option expires, the fund realizes a gain equal to the amount of the premium received. The difference between the premium and the amount paid on effecting a closing transaction is considered a realized gain or loss. When a
28
Notes to Financial Statements (unaudited) – continued
written call option is exercised, the premium received is offset against the proceeds to determine the realized gain or loss. When a written put option is exercised, the premium reduces the cost basis of the security purchased by the fund. The fund, as writer of an option, may have no control over whether the underlying securities may be sold (call) or purchased (put) and, as a result, bears the market risk of an unfavorable change in the price of the securities underlying the written option. In general, written call options may serve as a partial hedge against decreases in value in the underlying securities to the extent of the premium received. Collateral, in the form of cash or securities, may be required to be held in segregated accounts with the fund’s custodian in connection with these contracts.
Written Option Transactions
| | | | | | |
| | | Number of
contracts | | | Premiums
received | |
| Outstanding, beginning of period | | — | | | $— | |
| Options written | | 4,420 | | | 380,670 | |
| Options closed | | (2,210 | ) | | (216,092 | ) |
| Options exercised | | — | | | — | |
| Options expired | | (2,210 | ) | | (164,578 | ) |
| Outstanding, end of period | | — | | | $— | |
Purchased Options – The fund may purchase call or put options for a premium. Purchasing call options may be a hedge against an anticipated increase in the dollar cost of securities to be acquired or to increase the fund’s exposure to the underlying instrument. Purchasing put options may hedge against a decline in the value of portfolio securities. The premium paid is included as an investment in the Statement of Assets and Liabilities and is subsequently adjusted to the current value of the option. Premiums paid for purchased options which have expired are treated as realized losses on investments in the Statement of Operations. Premiums paid for purchased options which are exercised or closed are added to the amount paid or offset against the proceeds on the underlying security or financial instrument to determine the realized gain or loss. The risk of loss associated with purchased options is limited to the premium paid.
Short Sales – The fund may enter into short sales whereby it sells a security it does not own in anticipation of a decline in the value of that security. The fund will realize a gain if the security price decreases and a loss if the security price increases between the date of the short sale and the date on which the fund replaces the borrowed security. Losses from short sales can exceed the proceeds of the security sold; and they can also exceed the potential loss from an ordinary buy and sell transaction. The amount of any premium, dividends, or interest the fund may be required to pay in connection with a short sale will be recognized as a fund expense. During the six months ended March 31, 2009,
29
Notes to Financial Statements (unaudited) – continued
this expense amounted to $1,613. The fund segregates cash or marketable securities in an amount that, when combined with the amount of proceeds from the short sale deposited with the broker, at least equals the current market value of the security sold short.
Security Loans – JPMorgan Chase and Co. (“Chase”), as lending agent, may loan the securities of the fund to certain qualified institutions (the “Borrowers”) approved by the fund. The loans are collateralized by cash and/or U.S. Treasury and federal agency obligations in an amount typically at least equal to the market value of the securities loaned. The market value of the loaned securities is determined at the close of business of the fund and any additional required collateral is delivered to the fund on the next business day. Security lending activity through Chase is further collateralized by an irrevocable standby letter of credit. Chase provides the fund with indemnification against Borrower default. The fund bears the risk of loss with respect to the investment of cash collateral. On loans collateralized by cash, the cash collateral is invested in short-term securities. A portion of the income generated upon investment of the collateral is remitted to the Borrowers, and the remainder is allocated between the fund and the lending agent. On loans collateralized by U.S. Treasury and/or federal agency obligations, a fee is received from the Borrower, and is allocated between the fund and the lending agent. Income from securities lending is included in interest income on the Statement of Operations. The dividend and interest income earned on the securities loaned is accounted for in the same manner as other dividend and interest income. At March 31, 2009, there were no securities on loan.
Indemnifications – Under the fund’s organizational documents, its officers and trustees may be indemnified against certain liabilities and expenses arising out of the performance of their duties to the fund. Additionally, in the normal course of business, the fund enters into agreements with service providers that may contain indemnification clauses. The fund’s maximum exposure under these agreements is unknown as this would involve future claims that may be made against the fund that have not yet occurred.
Investment Transactions and Income – Investment transactions are recorded on the trade date. Interest income is recorded on the accrual basis. All premium and discount is amortized or accreted for financial statement purposes in accordance with U.S. generally accepted accounting principles. Dividends received in cash are recorded on the ex-dividend date. Certain dividends from foreign securities will be recorded when the fund is informed of the dividend if such information is obtained subsequent to the ex-dividend date. Dividend and interest payments received in additional securities are recorded on the ex-dividend or ex-interest date in an amount equal to the value of the security on such date.
30
Notes to Financial Statements (unaudited) – continued
The fund may receive proceeds from litigation settlements. Any proceeds received from litigation involving portfolio holdings are reflected in the Statement of Operations in realized gain/loss if the security has been disposed of by the fund or in unrealized gain/loss if the security is still held by the fund. Any other proceeds from litigation not related to portfolio holdings are reflected as other income in the Statement of Operations.
Fees Paid Indirectly – The fund’s custody fee may be reduced according to an arrangement that measures the value of cash deposited with the custodian by the fund. This amount, for the six months ended March 31, 2009, is shown as a reduction of total expenses on the Statement of Operations.
Tax Matters and Distributions – The fund intends to qualify as a regulated investment company, as defined under Subchapter M of the Internal Revenue Code, and to distribute all of its taxable income, including realized capital gains. As a result, no provision for federal income taxes is required. The fund’s federal tax returns for the prior three fiscal years remain subject to examination by the Internal Revenue Service. Foreign taxes, if any, have been accrued by the fund in the accompanying financial statements.
Distributions to shareholders are recorded on the ex-dividend date. Income and capital gain distributions are determined in accordance with income tax regulations, which may differ from U.S. generally accepted accounting principles. Certain capital accounts in the financial statements are periodically adjusted for permanent differences in order to reflect their tax character. These adjustments have no impact on net assets or net asset value per share. Temporary differences which arise from recognizing certain items of income, expense, gain or loss in different periods for financial statement and tax purposes will reverse at some time in the future. Distributions in excess of net investment income or net realized gains are temporary overdistributions for financial statement purposes resulting from differences in the recognition or classification of income or distributions for financial statement and tax purposes.
Book/tax differences primarily relate to wash sale loss deferrals.
The tax character of distributions made during the current period will be determined at fiscal year end. The tax character of distributions declared to shareholders for the last fiscal year is as follows:
| | |
| | | 9/30/08 |
Ordinary income (including
any short-term capital gains) | | $16,349,077 |
31
Notes to Financial Statements (unaudited) – continued
The federal tax cost and the tax basis components of distributable earnings were as follows:
| | | |
| As of 3/31/09 | | | |
| Cost of investments | | $1,938,795,313 | |
| Gross appreciation | | 24,498,018 | |
| Gross depreciation | | (500,631,218 | ) |
| Net unrealized appreciation (depreciation) | | $(476,133,200 | ) |
| |
| As of 9/30/08 | | | |
| Undistributed ordinary income | | 16,761,604 | |
| Capital loss carryforwards | | (79,526,927 | ) |
| Other temporary differences | | (7,093,258 | ) |
| Net unrealized appreciation (depreciation) | | (269,760,593 | ) |
The aggregate cost above includes prior fiscal year end tax adjustments.
As of September 30, 2008, the fund had capital loss carryforwards available to offset future realized gains. Such losses expire as follows:
Multiple Classes of Shares of Beneficial Interest – The fund offers multiple classes of shares, which differ in their respective distribution and service fees. The fund’s income, realized and unrealized gain (loss), and common expenses are allocated to shareholders based on the daily net assets of each class. Dividends are declared separately for each class. Differences in per share dividend rates are generally due to differences in separate class expenses. Class B shares will convert to Class A shares approximately eight years after purchase.
| (3) | | Transactions with Affiliates |
Investment Adviser – The fund has an investment advisory agreement with Massachusetts Financial Services Company (MFS) to provide overall investment management and related administrative services and facilities to the fund. The management fee is computed daily and paid monthly at an annual rate of 0.43% of the fund’s average daily net assets.
Distributor – MFS Fund Distributors, Inc. (MFD), a wholly-owned subsidiary of MFS, as distributor, received $15,666 for the six months ended March 31, 2009, as its portion of the initial sales charge on sales of Class A shares of the fund.
The Board of Trustees has adopted a distribution plan for certain class shares pursuant to Rule 12b-1 of the Investment Company Act of 1940.
The fund’s distribution plan provides that the fund will pay MFD for services provided by MFD and financial intermediaries in connection with the distribution and servicing of certain share classes. One component of the plan is a distribution fee paid to MFD and another component of the plan is a
32
Notes to Financial Statements (unaudited) – continued
service fee paid to MFD. MFD may subsequently pay all, or a portion, of the distribution and/or service fees to financial intermediaries.
Distribution Plan Fee Table:
| | | | | | | | | | |
| | | Distribution
Fee Rate | | Service
Fee Rate | | Total
Distribution
Plan (d) | | Annual
Effective
Rate (e) | | Distribution
and Service
Fee |
| Class A | | — | | 0.25% | | 0.25% | | 0.33% | | $1,618,827 |
| Class B | | 0.75% | | 0.25% | | 1.00% | | 1.00% | | 359,832 |
| Class C | | 0.75% | | 0.25% | | 1.00% | | 1.00% | | 370,616 |
| Class W | | 0.10% | | — | | 0.10% | | 0.10% | | 47 |
| Class R1 | | 0.75% | | 0.25% | | 1.00% | | 1.00% | | 13,019 |
| Class R2 | | 0.25% | | 0.25% | | 0.50% | | 0.50% | | 16,110 |
| Class R3 | | — | | 0.25% | | 0.25% | | 0.25% | | 4,292 |
| Total Distribution and Service Fees | | | | $2,382,743 |
| (d) | In accordance with the distribution plan for certain classes, the fund pays distribution and/or service fees up to these annual percentage rates of each class’ average daily net assets. |
| (e) | The annual effective rates represent actual fees incurred under the distribution plan for the six months ended March 31, 2009 based on each class’ average daily net assets. Effective March 1, 2009, the 0.10% Class A annual distribution fee was eliminated. |
Certain Class A shares purchased prior to September 1, 2008 are subject to a contingent deferred sales charge (CDSC) in the event of a shareholder redemption within 12 months of purchase. Certain Class A shares purchased on or subsequent to September 1, 2008 are subject to a CDSC in the event of a shareholder redemption within 24 months of purchase. Class C shares are subject to a CDSC in the event of a shareholder redemption within 12 months of purchase. Class B shares are subject to a CDSC in the event of a shareholder redemption within six years of purchase. All contingent deferred sales charges are paid to MFD and during the six months ended March 31, 2009, were as follows:
| | |
| | | Amount |
| Class A | | $3 |
| Class B | | 58,030 |
| Class C | | 1,843 |
Shareholder Servicing Agent – MFS Service Center, Inc. (MFSC), a wholly-owned subsidiary of MFS, receives a fee from the fund for its services as shareholder servicing agent calculated as a percentage of the average daily net assets of the fund as determined periodically under the supervision of the fund’s Board of Trustees. For the six months ended March 31, 2009, the fee was $818,239, which equated to 0.0963% annually of the fund’s average daily net assets. MFSC also receives payment from the fund for out-of-pocket expenses, sub-accounting and other shareholder servicing costs which may be paid to affiliated and unaffiliated service providers. For the six months ended March 31, 2009, these out-of-pocket expenses, sub-accounting and other shareholder servicing costs amounted to $780,191.
33
Notes to Financial Statements (unaudited) – continued
Under a Special Servicing Agreement among MFS, each MFS fund which invests in other MFS funds (“MFS fund-of-funds”) and each underlying fund in which a MFS fund-of-funds invests (“underlying funds”), each underlying fund may pay a portion of each MFS fund-of-fund’s transfer agent-related expenses, including sub-accounting fees payable to financial intermediaries, to the extent such payments do not exceed the benefits realized or expected to be realized by the underlying fund from the investment in the underlying fund by the MFS fund-of-fund. For the six months ended March 31, 2009, these costs for the fund amounted to $647,678 and are reflected in the shareholder servicing costs on the Statement of Operations.
Administrator – MFS provides certain financial, legal, shareholder communications, compliance, and other administrative services to the fund. Under an administrative services agreement, the fund partially reimburses MFS the costs incurred to provide these services. The fund is charged an annual fixed amount of $17,500 plus a fee based on average daily net assets.
The administrative services fee incurred for the six months ended March 31, 2009 was equivalent to an annual effective rate of 0.0209% of the fund’s average daily net assets.
Trustees’ and Officers’ Compensation – The fund pays compensation to independent trustees in the form of a retainer, attendance fees, and additional compensation to Board and Committee chairpersons. The fund does not pay compensation directly to trustees or officers of the fund who are also officers of the investment adviser, all of whom receive remuneration for their services to the fund from MFS. Certain officers and trustees of the fund are officers or directors of MFS, MFD, and MFSC.
For certain independent Trustees who retired on or before December 31, 2001, the fund has an unfunded, defined benefit plan which resulted in a pension expense of $5,189. This amount is included in independent trustees’ compensation for the six months ended March 31, 2009. For certain independent Trustees who served on the Board as of December 31, 2001, the fund also has an unfunded retirement benefit deferral plan which resulted in a net decrease in expense of $55,012. This amount is included in miscellaneous expense for the six months ended March 31, 2009. The liability for deferred retirement benefits payable to certain independent trustees under both plans amounted to $118,999 at March 31, 2009, and is included in payable for independent trustees’ compensation.
Deferred Trustee Compensation – Under a Deferred Compensation Plan (the Plan) independent trustees previously were allowed to elect to defer receipt of all or a portion of their annual compensation. Effective January 1, 2005, the trustees are no longer allowed to defer compensation under the Plan. Amounts previously deferred are treated as though equivalent dollar amounts had been
34
Notes to Financial Statements (unaudited) – continued
invested in shares of certain MFS funds selected by the trustee. Deferred amounts represent an unsecured obligation of the fund until distributed in accordance with the Plan. Included in other assets and payable for independent trustees’ compensation is $46,134 of deferred trustees’ compensation.
Other – This fund and certain other MFS funds (the funds) have entered into services agreements (the Agreements) which provide for payment of fees by the funds to Tarantino LLC and Griffin Compliance LLC in return for the provision of services of an Independent Chief Compliance Officer (ICCO) and Assistant ICCO, respectively, for the funds. The ICCO and Assistant ICCO are officers of the funds and the sole members of Tarantino LLC and Griffin Compliance LLC, respectively. The funds can terminate the Agreements with Tarantino LLC and Griffin Compliance LLC at any time under the terms of the Agreements. For the six months ended March 31, 2009, the aggregate fees paid by the fund to Tarantino LLC and Griffin Compliance LLC were $13,620 and are included in miscellaneous expense on the Statement of Operations. MFS has agreed to reimburse the fund for a portion of the payments made by the fund in the amount of $4,383, which is shown as a reduction of total expenses in the Statement of Operations. Additionally, MFS has agreed to bear all expenses associated with office space, other administrative support, and supplies provided to the ICCO and Assistant ICCO.
The fund may invest in a money market fund managed by MFS which seeks a high level of current income consistent with preservation of capital and liquidity. Income earned on this investment is included in dividends from underlying funds on the Statement of Operations. This money market fund does not pay a management fee to MFS.
Purchases and sales of investments, other than U.S. Government securities, purchased option transactions, short sales, and short-term obligations, aggregated $1,310,623,427 and $1,170,016,210, respectively.
35
Notes to Financial Statements (unaudited) – continued
| (5) | | Shares of Beneficial Interest |
The fund’s Declaration of Trust permits the Trustees to issue an unlimited number of full and fractional shares of beneficial interest. Transactions in fund shares were as follows:
| | | | | | | | | | | | |
| | | Six months ended
3/31/09 | | | Year ended
9/30/08 | |
| | | Shares | | | Amount | | | Shares | | | Amount | |
| Shares sold | | | | | | | | | | | | |
Class A | | 21,490,104 | | | $400,054,480 | | | 6,306,818 | | | $159,650,858 | |
Class B | | 184,451 | | | 2,790,802 | | | 312,088 | | | 7,338,263 | |
Class C | | 198,314 | | | 3,011,001 | | | 154,750 | | | 3,653,129 | |
Class I | | 4,245,188 | | | 65,835,007 | | | 3,851,590 | | | 94,312,405 | |
Class W | | 1,315 | | | 19,291 | | | — | | | — | |
Class R (b) | | — | | | — | | | 34,213 | | | 906,419 | |
Class R1 | | 14,261 | | | 214,470 | | | 98,589 | | | 2,396,033 | |
Former Class R2 (b) | | — | | | — | | | 47,228 | | | 1,182,320 | |
Class R2 | | 39,803 | | | 628,881 | | | 322,888 | | | 8,266,146 | |
Class R3 | | 22,610 | | | 366,087 | | | 56,506 | | | 1,472,503 | |
Class R4 | | 3,954 | | | 58,953 | | | — | | | — | |
| | 26,200,000 | | | $472,978,972 | | | 11,184,670 | | | $279,178,076 | |
| Shares issued to shareholders in reinvestment of distributions | | | | | | | | | | | | |
Class A | | 497,676 | | | $8,176,826 | | | 248,450 | | | $6,700,690 | |
Class I | | 452,171 | | | 7,551,260 | | | 304,462 | | | 8,354,436 | |
Class W | | 66 | | | 1,079 | | | 64 | | | 1,732 | |
Class R1 | | — | | | — | | | 819 | | | 20,354 | |
Former Class R2 (b) | | — | | | — | | | 664 | | | 16,561 | |
Class R2 | | 2,476 | | | 39,911 | | | 2,147 | | | 56,748 | |
Class R3 | | 1,810 | | | 29,671 | | | 1,508 | | | 40,543 | |
Class R4 | | 33 | | | 544 | | | 22 | | | 581 | |
| | 954,232 | | | $15,799,291 | | | 558,136 | | | $15,191,645 | |
| Shares reacquired | | | | | | | | | | | | |
Class A | | (9,273,040 | ) | | $(146,465,361 | ) | | (11,714,299 | ) | | $(299,487,981 | ) |
Class B | | (1,382,075 | ) | | (20,550,566 | ) | | (3,794,551 | ) | | (89,778,199 | ) |
Class C | | (697,256 | ) | | (10,378,382 | ) | | (1,217,803 | ) | | (28,608,097 | ) |
Class I | | (12,773,350 | ) | | (187,908,803 | ) | | (3,129,800 | ) | | (82,211,920 | ) |
Class W | | (865 | ) | | (13,848 | ) | | (1,940 | ) | | (45,763 | ) |
Class R (b) | | — | | | — | | | (142,756 | ) | | (3,769,030 | ) |
Class R1 | | (41,363 | ) | | (607,902 | ) | | (50,857 | ) | | (1,181,000 | ) |
Former Class R2 (b) | | — | | | — | | | (87,952 | ) | | (2,079,065 | ) |
Class R2 | | (58,515 | ) | | (919,846 | ) | | (136,050 | ) | | (3,371,242 | ) |
Class R3 | | (21,249 | ) | | (359,386 | ) | | (48,229 | ) | | (1,191,256 | ) |
| | (24,247,713 | ) | | $(367,204,094 | ) | | (20,324,237 | ) | | $(511,723,553 | ) |
36
Notes to Financial Statements (unaudited) – continued
| | | | | | | | | | | | |
| | | Six months ended
3/31/09 | | | Year ended
9/30/08 | |
| | | Shares | | | Amount | | | Shares | | | Amount | |
| Net change | | | | | | | | | | | | |
Class A | | 12,714,740 | | | $261,765,945 | | | (5,159,031 | ) | | $(133,136,433 | ) |
Class B | | (1,197,624 | ) | | (17,759,764 | ) | | (3,482,463 | ) | | (82,439,936 | ) |
Class C | | (498,942 | ) | | (7,367,381 | ) | | (1,063,053 | ) | | (24,954,968 | ) |
Class I | | (8,075,991 | ) | | (114,522,536 | ) | | 1,026,252 | | | 20,454,921 | |
Class W | | 516 | | | 6,522 | | | (1,876 | ) | | (44,031 | ) |
Class R (b) | | — | | | — | | | (108,543 | ) | | (2,862,611 | ) |
Class R1 | | (27,102 | ) | | (393,432 | ) | | 48,551 | | | 1,235,387 | |
Former Class R2 (b) | | — | | | — | | | (40,060 | ) | | (880,184 | ) |
Class R2 | | (16,236 | ) | | (251,054 | ) | | 188,985 | | | 4,951,652 | |
Class R3 | | 3,171 | | | 36,372 | | | 9,785 | | | 321,790 | |
Class R4 | | 3,987 | | | 59,497 | | | 22 | | | 581 | |
| | 2,906,519 | | | $121,574,169 | | | (8,581,431 | ) | | $(217,353,832 | ) |
| (b) | At the close of business on April 18, 2008, Class R and Class R2 shares converted into Class R3 shares. Following the conversion, Class R3 shares were renamed Class R2 shares. |
The fund is one of several mutual funds in which the MFS funds-of-funds may invest. The MFS funds-of-funds do not invest in the underlying MFS funds for the purpose of exercising management or control. At the end of the period, the MFS Moderate Allocation Fund, MFS Growth Allocation Fund, MFS Aggressive Growth Allocation Fund, and MFS Conservative Allocation Fund were the owners of record of approximately 9%, 9%, 5% and 3%, respectively, of the value of outstanding voting shares of the fund. In addition, the MFS Lifetime 2010 Fund, MFS Lifetime 2020 Fund, MFS Lifetime 2030 Fund, MFS Lifetime 2040 Fund, and the MFS Lifetime Retirement Income Fund were each the owners of record of less than 1% of the value of outstanding voting shares of the fund.
The fund and other funds managed by MFS participate in a $1 billion unsecured committed line of credit provided by a syndication of banks under a credit agreement. In addition, the fund and other funds managed by MFS have established uncommitted borrowing arrangements with certain banks. Borrowings may be made for temporary financing needs. Interest is charged to the fund, based on its borrowings, generally at a rate equal to the Federal Reserve funds rate plus 0.30%. In addition, a commitment fee, based on the average daily, unused portion of the committed line of credit, is allocated among the participating funds at the end of each calendar quarter. For the six months ended March 31, 2009, the fund’s commitment fee and interest expense were $5,777 and $294, respectively, and are included in miscellaneous expense on the Statement of Operations.
37
Notes to Financial Statements (unaudited) – continued
The fund’s investment adviser, MFS, was the subject of an administrative proceeding concerning market timing which resulted in the Securities and Exchange Commission (the “SEC”) entering an order approving a settlement with MFS and two of its former officers (the “Settlement Order”). Under the terms of the Settlement Order, MFS transferred $175 million in disgorgement and $50 million in penalty (the “Payments”) to the SEC, which established a Fair Fund from which settlement funds have been, or will be, distributed to eligible current and former shareholders of the fund and certain other affected MFS retail funds. The Payments, along with additional amounts from a third-party settlement, have been, or will be, distributed to eligible shareholders in accordance with a plan developed by an independent distribution consultant (the “IDC”) in consultation with MFS and the Board of Trustees of the MFS retail funds. The plan was approved in July 2007 by the SEC. Pursuant to the distribution plan, after the distributions to eligible shareholders have been made, residual amounts, if any, may be available for distribution to the fund and certain other affected MFS retail funds. Certain procedural conditions of the distribution plan have not been met to date and, as such, the ultimate timing and amount of any payment of the residual amount is not known at this time.
| (8) | | Transactions in Underlying Funds-Affiliated Issuers |
An affiliated issuer may be considered one in which the fund owns 5% or more of the outstanding voting securities, or a company which is under common control. For the purposes of this report, the fund assumes the following to be affiliated issuers:
| | | | | | | | | |
| Underlying Funds | | Beginning
Shares/Par
Amount | | Acquisitions
Shares/Par
Amount | | Dispositions
Shares/Par
Amount | | | Ending
Shares/Par
Amount |
MFS Institutional Money Market Portfolio | | 19,583,706 | | 369,565,898 | | (381,496,207 | ) | | 7,653,397 |
| | | | |
| Underlying Funds | | Realized
Gain (Loss) | | Capital Gain
Distributions | | Dividend
Income | | | Ending
Value |
MFS Institutional Money Market Portfolio | | $— | | $— | | $75,497 | | | $7,653,397 |
38
BOARD REVIEW OF INVESTMENT ADVISORY AGREEMENT
A discussion regarding the Board’s most recent review and renewal of the fund’s Investment Advisory Agreement with MFS is available by clicking on the fund’s name under “Mutual Funds” in the “Products and Performance” section of the MFS Web site (mfs.com).
PROXY VOTING POLICIES AND INFORMATION
A general description of the MFS funds’ proxy voting policies and procedures is available without charge, upon request, by calling 1-800-225-2606, by visiting the Proxy Voting section of mfs.com or by visiting the SEC’s Web site at http://www.sec.gov.
Information regarding how the fund voted proxies relating to portfolio securities during the most recent twelve-month period ended June 30 is available without charge by visiting the Proxy Voting section of mfs.com or by visiting the SEC’s Web site at http://www.sec.gov.
QUARTERLY PORTFOLIO DISCLOSURE
The fund will file a complete schedule of portfolio holdings with the Securities and Exchange Commission (the Commission) for the first and third quarters of each fiscal year on Form N-Q. The fund’s Form N-Q may be reviewed and copied at the:
Public Reference Room
Securities and Exchange Commission
100 F Street, NE, Room 1580
Washington, D.C. 20549
Information on the operation of the Public Reference Room may be obtained by calling the Commission at 1-800-SEC-0330. The fund’s Form N-Q is available on the EDGAR database on the Commission’s Internet Web site at http://www.sec.gov, and copies of this information may be obtained, upon payment of a duplicating fee, by electronic request at the following e-mail address: publicinfo@sec.gov or by writing the Public Reference Section at the above address.
A shareholder can also obtain the quarterly portfolio holdings report at mfs.com.
39
CONTACT US
| | |
| Web site | | Mailing address |
| mfs.com | | MFS Service Center, Inc. |
| | P.O. Box 55824 |
| MFS TALK | | Boston, MA 02205-5824 |
| 1-800-637-8255 | | |
| 24 hours a day | | Overnight mail |
| | MFS Service Center, Inc. |
| Account service and literature | | c/o Boston Financial Data Services |
| | 30 Dan Road |
| Shareholders | | Canton, MA 02021-2809 |
| 1-800-225-2606 | | |
| | |
| Investment professionals | | |
| 1-800-343-2829 | | |
| | |
| Retirement plan services | | |
| 1-800-637-1255 | | |

Save paper with eDelivery. MFS® will send you prospectuses, reports, and proxies directly via e-mail so you will get information faster with less mailbox clutter. To sign up: 1. go to mfs.com. 2. log in via MFS® Access. 3. select eDelivery. If you own your MFS fund shares through a financial institution or a retirement plan, MFS® TALK, MFS Access, and eDelivery may not be available to you.


MFS® Total Return Fund
The report is prepared for the general information of shareholders. It is authorized for distribution to prospective investors only when preceded or accompanied by a current prospectus.
NOT FDIC INSURED Ÿ MAY LOSE VALUE Ÿ
NO BANK GUARANTEE
3/31/09
MTR-SEM

LETTER FROM THE CEO
Dear Shareholders:
The market downturns and economic setbacks of late probably rank among the worst financial declines most of us have experienced. Inevitably, people may be questioning their commitment to investing. Still, it is important to remember that downturns are an inescapable part of the business cycle. Such troughs have been seen before, and if we can use history as a guide, market recoveries typically have followed.
Recent events have clearly shown us the value of certain types of investments. In this environment, two of the hallmarks of mutual funds — transparency and liquidity — have become critically important. Unlike some other types of investments, the operations of mutual funds are relatively transparent to their shareholders. With their daily redemption feature, mutual funds also generally provide easy, convenient access to one’s money. Through these recent market upheavals, this level of liquidity enhanced the ability of mutual fund investors to respond and modify their investments as they and their advisors saw fit — a flexibility that those in less liquid investments simply did not have at their disposal.
At MFS® we take particular pride in how well mutual funds can serve investors because we invented the mutual fund in the United States. Established in 1924, Massachusetts Investors Trust was the nation’s first fund. Recent market events only reinforce what we have learned through 85 years — that mutual funds provide unique features that are important to investors in any type of market climate.
Respectfully,

Robert J. Manning
Chief Executive Officer and Chief Investment Officer
MFS Investment Management®
May 15, 2009
The opinions expressed in this letter are subject to change, may not be relied upon for investment advice, and no forecasts can be guaranteed.
Before investing, consider the fund’s investment objectives, risks, charges, and expenses. For a prospectus containing this and other information, contact your investment professional or view online. Read it carefully.
MFS Fund Distributors, Inc., 500 Boylston Street, Boston, MA 02116
1
PORTFOLIO COMPOSITION
Portfolio structure (i)

| | |
| Top ten holdings (i) | | |
| Fannie Mae, 5.5%, 30 Years | | 3.7% |
| Exxon Mobil Corp. | | 2.1% |
| AT&T, Inc. | | 2.1% |
| Lockheed Martin Corp. | | 2.0% |
| Fannie Mae, 6.0%, 30 Years | | 2.0% |
| Philip Morris International, Inc. | | 1.7% |
| JPMorgan Chase & Co. | | 1.5% |
| Bank of New York Mellon Corp. | | 1.5% |
| TOTAL S.A., ADR | | 1.5% |
| Wyeth | | 1.5% |
| | |
| Equity sectors | | |
| Financial Services | | 9.7% |
| Energy | | 8.7% |
| Utilities & Communications | | 7.2% |
| Consumer Staples | | 7.0% |
| Health Care | | 6.4% |
| Industrial Goods & Services | | 5.7% |
| Technology | | 4.3% |
| Retailing | | 4.0% |
| Basic Materials | | 2.0% |
| Leisure | | 1.7% |
| Special Products & Services | | 1.4% |
| Autos & Housing | | 0.5% |
| Transportation | | 0.2% |
| |
| Fixed income sectors (i) | | |
| Mortgage-Backed Securities | | 16.6% |
| High Grade Corporates | | 10.0% |
| U.S. Treasury Securities | | 8.2% |
Commercial Mortgage-Backed Securities | | 1.9% |
| U.S. Government Agencies | | 0.7% |
Non-U.S. Government Bonds | | 0.7% |
| Asset-Backed Securities | | 0.4% |
| Emerging Markets Bonds | | 0.4% |
| Municipal Bonds | | 0.3% |
| High Yield Corporates | | 0.1% |
| Residential Mortgage-Backed Securities (o) | | 0.0% |
| Collateralized Debt Obligations (o) | | 0.0% |
| (i) | For purposes of this presentation, the bond component includes accrued interest amounts and may be positively or negatively impacted by the equivalent exposure from any derivative holdings, if applicable. |
Percentages are based on net assets as of 3/31/09, unless otherwise noted.
The portfolio is actively managed and current holdings may be different.
2
EXPENSE TABLE
Fund expenses borne by the shareholders during the period,
October 1, 2008 through March 31, 2009
As a shareholder of the fund, you incur two types of costs: (1) transaction costs, including sales charges (loads) on certain purchase or redemption payments, and (2) ongoing costs, including management fees; distribution and service (12b-1) fees; and other fund expenses. This example is intended to help you understand your ongoing costs (in dollars) of investing in the fund and to compare these costs with the ongoing costs of investing in other mutual funds.
The example is based on an investment of $1,000 invested at the beginning of the period and held for the entire period October 1, 2008 through March 31, 2009.
Actual Expenses
The first line for each share class in the following table provides information about actual account values and actual expenses. You may use the information in this line, together with the amount you invested, to estimate the expenses that you paid over the period. Simply divide your account value by $1,000 (for example, an $8,600 account value divided by $1,000 = 8.6), then multiply the result by the number in the first line under the heading entitled “Expenses Paid During Period” to estimate the expenses you paid on your account during this period.
Hypothetical Example for Comparison Purposes
The second line for each share class in the following table provides information about hypothetical account values and hypothetical expenses based on the fund’s actual expense ratio and an assumed rate of return of 5% per year before expenses, which is not the fund’s actual return. The hypothetical account values and expenses may not be used to estimate the actual ending account balance or expenses you paid for the period. You may use this information to compare the ongoing costs of investing in the fund and other funds. To do so, compare this 5% hypothetical example with the 5% hypothetical examples that appear in the shareholder reports of the other funds.
Please note that the expenses shown in the table are meant to highlight your ongoing costs only and do not reflect any transactional costs, such as sales charges (loads). Therefore, the second line for each share class in the table is useful in comparing ongoing costs only, and will not help you determine the relative total costs of owning different funds. In addition, if these transactional costs were included, your costs would have been higher.
3
Expense Table – continued
| | | | | | | | | | |
Share
Class | | | | Annualized
Expense
Ratio | | Beginning
Account Value
10/01/08 | | Ending
Account Value
3/31/09 | | Expenses
Paid During
Period (p)
10/01/08-3/31/09 |
| A | | Actual | | 0.96% | | $1,000.00 | | $819.08 | | $4.35 |
| | Hypothetical (h) | | 0.96% | | $1,000.00 | | $1,020.14 | | $4.84 |
| B | | Actual | | 1.60% | | $1,000.00 | | $816.34 | | $7.25 |
| | Hypothetical (h) | | 1.60% | | $1,000.00 | | $1,016.95 | | $8.05 |
| C | | Actual | | 1.60% | | $1,000.00 | | $816.45 | | $7.25 |
| | Hypothetical (h) | | 1.60% | | $1,000.00 | | $1,016.95 | | $8.05 |
| I | | Actual | | 0.60% | | $1,000.00 | | $820.53 | | $2.72 |
| | Hypothetical (h) | | 0.60% | | $1,000.00 | | $1,021.94 | | $3.02 |
| R1 | | Actual | | 1.61% | | $1,000.00 | | $816.27 | | $7.29 |
| | Hypothetical (h) | | 1.61% | | $1,000.00 | | $1,016.90 | | $8.10 |
| R2 | | Actual | | 1.10% | | $1,000.00 | | $818.87 | | $4.99 |
| | Hypothetical (h) | | 1.10% | | $1,000.00 | | $1,019.45 | | $5.54 |
| R3 | | Actual | | 0.86% | | $1,000.00 | | $819.65 | | $3.90 |
| | Hypothetical (h) | | 0.86% | | $1,000.00 | | $1,020.64 | | $4.33 |
| R4 | | Actual | | 0.60% | | $1,000.00 | | $820.67 | | $2.72 |
| | Hypothetical (h) | | 0.60% | | $1,000.00 | | $1,021.94 | | $3.02 |
| 529A | | Actual | | 1.05% | | $1,000.00 | | $818.32 | | $4.76 |
| | Hypothetical (h) | | 1.05% | | $1,000.00 | | $1,019.70 | | $5.29 |
| 529B | | Actual | | 1.70% | | $1,000.00 | | $816.00 | | $7.70 |
| | Hypothetical (h) | | 1.70% | | $1,000.00 | | $1,016.45 | | $8.55 |
| 529C | | Actual | | 1.70% | | $1,000.00 | | $816.07 | | $7.70 |
| | Hypothetical (h) | | 1.70% | | $1,000.00 | | $1,016.45 | | $8.55 |
| (h) | 5% class return per year before expenses. |
| (p) | Expenses paid is equal to each class’ annualized expense ratio, as shown above, multiplied by the average account value over the period, multiplied by the number of days in the period, divided by the number of days in the year. Expenses paid do not include any applicable sales charges (loads). If these transaction costs had been included, your costs would have been higher. |
4
PORTFOLIO OF INVESTMENTS
3/31/09 (unaudited)
The Portfolio of Investments is a complete list of all securities owned by your fund. It is categorized by broad-based asset classes.
| | | | | |
| Common Stocks - 58.8% | | | | | |
| Issuer | | Shares/Par | | Value ($) |
| | | | | |
| Aerospace - 4.1% | | | | | |
| Lockheed Martin Corp. | | 1,660,970 | | $ | 114,656,759 |
| Northrop Grumman Corp. | | 1,401,530 | | | 61,162,769 |
| United Technologies Corp. | | 1,299,430 | | | 55,849,501 |
| | | | | |
| | | | | $ | 231,669,029 |
| Alcoholic Beverages - 0.8% | | | | | |
| Diageo PLC | | 2,751,562 | | $ | 31,051,639 |
| Heineken N.V. | | 264,130 | | | 7,509,755 |
| Molson Coors Brewing Co. | | 203,390 | | | 6,972,209 |
| | | | | |
| | | | | $ | 45,533,603 |
| Apparel Manufacturers - 0.8% | | | | | |
| NIKE, Inc., “B” | | 914,720 | | $ | 42,891,221 |
| | |
| Automotive - 0.2% | | | | | |
| Johnson Controls, Inc. | | 1,103,480 | | $ | 13,241,760 |
| | |
| Biotechnology - 0.3% | | | | | |
| Genzyme Corp. (a) | | 270,260 | | $ | 16,050,741 |
| | |
| Broadcasting - 1.3% | | | | | |
| Omnicom Group, Inc. | | 1,448,200 | | $ | 33,887,880 |
| Walt Disney Co. | | 1,732,010 | | | 31,453,302 |
| WPP Group PLC | | 1,687,625 | | | 9,510,397 |
| | | | | |
| | | | | $ | 74,851,579 |
| Brokerage & Asset Managers - 0.6% | | | | | |
| Charles Schwab Corp. | | 502,080 | | $ | 7,782,240 |
| CME Group, Inc. | | 14,260 | | | 3,513,521 |
| Franklin Resources, Inc. | | 252,040 | | | 13,577,395 |
| Invesco Ltd. | | 593,910 | | | 8,231,593 |
| | | | | |
| | | | | $ | 33,104,749 |
| Business Services - 1.4% | | | | | |
| Accenture Ltd., “A” | | 1,279,090 | | $ | 35,162,184 |
| Automatic Data Processing, Inc. | | 391,490 | | | 13,764,788 |
| Dun & Bradstreet Corp. | | 75,370 | | | 5,803,490 |
| Visa, Inc., “A” | | 197,660 | | | 10,989,896 |
| Western Union Co. | | 979,820 | | | 12,316,337 |
| | | | | |
| | | | | $ | 78,036,695 |
5
Portfolio of Investments (unaudited) – continued
| | | | | |
| Issuer | | Shares/Par | | Value ($) |
| | | | | |
| Common Stocks - continued | | | | | |
| Cable TV - 0.1% | | | | | |
| Time Warner Cable, Inc. | | 282,807 | | $ | 7,013,614 |
| | |
| Chemicals - 1.5% | | | | | |
| 3M Co. | | 722,620 | | $ | 35,928,666 |
| PPG Industries, Inc. | | 1,356,830 | | | 50,067,027 |
| | | | | |
| | | | | $ | 85,995,693 |
| Computer Software - 1.0% | | | | | |
| Oracle Corp. | | 3,241,160 | | $ | 58,567,761 |
| | |
| Computer Software - Systems - 1.8% | | | | | |
| Hewlett-Packard Co. | | 1,430,480 | | $ | 45,861,189 |
| International Business Machines Corp. | | 613,710 | | | 59,462,362 |
| | | | | |
| | | | | $ | 105,323,551 |
| Construction - 0.3% | | | | | |
| Sherwin-Williams Co. | | 314,340 | | $ | 16,336,250 |
| | |
| Consumer Goods & Services - 1.0% | | | | | |
| Clorox Co. | | 353,410 | | $ | 18,193,547 |
| Colgate-Palmolive Co. | | 134,830 | | | 7,952,273 |
| Mead Johnson Nutrition Co., “A” (a) | | 162,130 | | | 4,680,693 |
| Procter & Gamble Co. | | 529,448 | | | 24,931,706 |
| | | | | |
| | | | | $ | 55,758,219 |
| Electrical Equipment - 1.2% | | | | | |
| Danaher Corp. | | 574,810 | | $ | 31,166,198 |
| General Electric Co. | | 394,090 | | | 3,984,250 |
| Rockwell Automation, Inc. | | 178,370 | | | 3,895,601 |
| W.W. Grainger, Inc. | | 426,760 | | | 29,950,017 |
| | | | | |
| | | | | $ | 68,996,066 |
| Electronics - 1.2% | | | | | |
| Agilent Technologies, Inc. (a) | | 801,550 | | $ | 12,319,824 |
| Intel Corp. | | 3,872,710 | | | 58,284,286 |
| | | | | |
| | | | | $ | 70,604,110 |
| Energy - Independent - 2.5% | | | | | |
| Anadarko Petroleum Corp. | | 509,930 | | $ | 19,831,178 |
| Apache Corp. | | 900,180 | | | 57,692,536 |
| Devon Energy Corp. | | 572,895 | | | 25,602,678 |
| EOG Resources, Inc. | | 251,800 | | | 13,788,568 |
| Noble Energy, Inc. | | 154,800 | | | 8,340,624 |
6
Portfolio of Investments (unaudited) – continued
| | | | | |
| Issuer | | Shares/Par | | Value ($) |
| | | | | |
| Common Stocks - continued | | | | | |
| Energy - Independent - continued | | | | | |
| Occidental Petroleum Corp. | | 226,170 | | $ | 12,586,361 |
| Ultra Petroleum Corp. (a) | | 126,470 | | | 4,539,008 |
| | | | | |
| | | | | $ | 142,380,953 |
| Energy - Integrated - 5.8% | | | | | |
| Chevron Corp. | | 936,395 | | $ | 62,963,200 |
| ConocoPhillips | | 257,250 | | | 10,073,910 |
| Exxon Mobil Corp. | | 1,764,718 | | | 120,177,296 |
| Hess Corp. | | 580,390 | | | 31,457,138 |
| Marathon Oil Corp. | | 789,570 | | | 20,757,795 |
| TOTAL S.A., ADR | | 1,756,680 | | | 86,182,721 |
| | | | | |
| | | | | $ | 331,612,060 |
| Food & Beverages - 2.9% | | | | | |
| Coca-Cola Co. | | 150,720 | | $ | 6,624,144 |
| General Mills, Inc. | | 265,530 | | | 13,244,636 |
| Groupe Danone | | 183,359 | | | 8,930,771 |
| J.M. Smucker Co. | | 355,383 | | | 13,245,124 |
| Kellogg Co. | | 429,990 | | | 15,750,534 |
| Nestle S.A. | | 1,709,150 | | | 57,777,468 |
| PepsiCo, Inc. | | 1,002,660 | | | 51,616,937 |
| | | | | |
| | | | | $ | 167,189,614 |
| Food & Drug Stores - 1.8% | | | | | |
| CVS Caremark Corp. | | 1,896,299 | | $ | 52,129,260 |
| Kroger Co. | | 1,409,360 | | | 29,906,619 |
| Walgreen Co. | | 735,200 | | | 19,085,792 |
| | | | | |
| | | | | $ | 101,121,671 |
| Gaming & Lodging - 0.1% | | | | | |
| Royal Caribbean Cruises Ltd. | | 805,360 | | $ | 6,450,934 |
| | |
| General Merchandise - 0.9% | | | | | |
| Macy’s, Inc. | | 2,911,910 | | $ | 25,915,999 |
| Target Corp. | | 269,470 | | | 9,267,073 |
| Wal-Mart Stores, Inc. | | 289,990 | | | 15,108,479 |
| | | | | |
| | | | | $ | 50,291,551 |
| Health Maintenance Organizations - 0.5% | | | | | |
| UnitedHealth Group, Inc. | | 435,700 | | $ | 9,119,201 |
| WellPoint, Inc. (a) | | 429,360 | | | 16,302,799 |
| | | | | |
| | | | | $ | 25,422,000 |
7
Portfolio of Investments (unaudited) – continued
| | | | | |
| Issuer | | Shares/Par | | Value ($) |
| | | | | |
| Common Stocks - continued | | | | | |
| Insurance - 3.0% | | | | | |
| Allstate Corp. | | 2,113,690 | | $ | 40,477,164 |
| Aon Corp. | | 262,720 | | | 10,724,230 |
| Chubb Corp. | | 301,810 | | | 12,772,599 |
| MetLife, Inc. | | 3,029,990 | | | 68,992,872 |
| Prudential Financial, Inc. | | 261,250 | | | 4,968,975 |
| Travelers Cos., Inc. | | 846,320 | | | 34,394,445 |
| | | | | |
| | | | | $ | 172,330,285 |
| Internet - 0.1% | | | | | |
| Google, Inc., “A” (a) | | 8,570 | | $ | 2,982,874 |
| | |
| Leisure & Toys - 0.2% | | | | | |
| Hasbro, Inc. | | 521,830 | | $ | 13,082,278 |
| | |
| Machinery & Tools - 0.4% | | | | | |
| Eaton Corp. | | 576,080 | | $ | 21,234,309 |
| | |
| Major Banks - 6.1% | | | | | |
| Bank of America Corp. | | 1,275,757 | | $ | 8,700,663 |
| Bank of New York Mellon Corp. | | 3,106,348 | | | 87,754,331 |
| Goldman Sachs Group, Inc. | | 694,810 | | | 73,663,756 |
| JPMorgan Chase & Co. | | 3,331,311 | | | 88,546,246 |
| PNC Financial Services Group, Inc. | | 821,080 | | | 24,049,433 |
| State Street Corp. | | 1,473,890 | | | 45,366,334 |
| Wells Fargo & Co. | | 1,464,580 | | | 20,855,619 |
| | | | | |
| | | | | $ | 348,936,382 |
| Medical Equipment - 0.8% | | | | | |
| DENTSPLY International, Inc. | | 156,820 | | $ | 4,210,617 |
| Medtronic, Inc. | | 366,360 | | | 10,796,629 |
| Waters Corp. (a) | | 493,100 | | | 18,220,045 |
| Zimmer Holdings, Inc. (a) | | 278,160 | | | 10,152,840 |
| | | | | |
| | | | | $ | 43,380,131 |
| Natural Gas - Distribution - 0.3% | | | | | |
| Sempra Energy | | 392,680 | | $ | 18,157,523 |
| | |
| Natural Gas - Pipeline - 0.1% | | | | | |
| Williams Cos., Inc. | | 681,710 | | $ | 7,757,860 |
| | |
| Network & Telecom - 0.2% | | | | | |
| Cisco Systems, Inc. (a) | | 350,980 | | $ | 5,885,935 |
| Nokia Corp., ADR | | 673,240 | | | 7,856,711 |
| | | | | |
| | | | | $ | 13,742,646 |
8
Portfolio of Investments (unaudited) – continued
| | | | | |
| Issuer | | Shares/Par | | Value ($) |
| | | | | |
| Common Stocks - continued | | | | | |
| Oil Services - 0.4% | | | | | |
| Halliburton Co. | | 306,590 | | $ | 4,742,947 |
| National Oilwell Varco, Inc. (a) | | 359,900 | | | 10,332,729 |
| Noble Corp. | | 218,690 | | | 5,268,242 |
| | | | | |
| | | | | $ | 20,343,918 |
| Pharmaceuticals - 4.8% | | | | | |
| Abbott Laboratories | | 448,460 | | $ | 21,391,542 |
| GlaxoSmithKline PLC | | 536,640 | | | 8,373,727 |
| Johnson & Johnson | | 1,205,600 | | | 63,414,560 |
| Merck & Co., Inc. | | 2,359,170 | | | 63,107,798 |
| Merck KGaA (l) | | 127,800 | | | 11,301,560 |
| Pfizer, Inc. | | 1,227,680 | | | 16,721,002 |
| Roche Holding AG | | 52,830 | | | 7,249,447 |
| Wyeth | | 1,957,128 | | | 84,234,789 |
| | | | | |
| | | | | $ | 275,794,425 |
| Railroad & Shipping - 0.0% | | | | | |
| Burlington Northern Santa Fe Corp. | | 41,920 | | $ | 2,521,488 |
| | |
| Real Estate - 0.0% | | | | | |
| Apartment Investment & Management, “A”, REIT | | 687 | | $ | 3,765 |
| | |
| Specialty Chemicals - 0.5% | | | | | |
| Air Products & Chemicals, Inc. | | 550,690 | | $ | 30,976,313 |
| | |
| Specialty Stores - 0.5% | | | | | |
| Home Depot, Inc. | | 339,450 | | $ | 7,997,442 |
| Staples, Inc. | | 1,233,750 | | | 22,343,213 |
| | | | | |
| | | | | $ | 30,340,655 |
| Telecommunications - Wireless - 0.7% | | | | | |
| Rogers Communications, Inc., “B” | | 668,020 | | $ | 15,391,800 |
| Vodafone Group PLC | | 12,498,753 | | | 22,013,783 |
| | | | | |
| | | | | $ | 37,405,583 |
| Telephone Services - 2.3% | | | | | |
| AT&T, Inc. | | 4,750,518 | | $ | 119,713,054 |
| Embarq Corp. | | 283,798 | | | 10,741,754 |
| Verizon Communications, Inc. | | 54,042 | | | 1,632,068 |
| | | | | |
| | | | | $ | 132,086,876 |
9
Portfolio of Investments (unaudited) – continued
| | | | | | |
| Issuer | | Shares/Par | | Value ($) |
| | | | | | |
| Common Stocks - continued | | | | | | |
| Tobacco - 2.3% | | | | | | |
| Altria Group, Inc. | | | 444,100 | | $ | 7,114,482 |
| Lorillard, Inc. | | | 395,800 | | | 24,436,692 |
| Philip Morris International, Inc. | | | 2,796,350 | | | 99,494,133 |
| | | | | | |
| | | | | | $ | 131,045,307 |
| Trucking - 0.2% | | | | | | |
| United Parcel Service, Inc., “B” | | | 254,100 | | $ | 12,506,802 |
| | |
| Utilities - Electric Power - 3.8% | | | | | | |
| Allegheny Energy, Inc. | | | 397,730 | | $ | 9,215,404 |
| American Electric Power Co., Inc. | | | 430,680 | | | 10,878,977 |
| CMS Energy Corp. | | | 389,140 | | | 4,607,418 |
| Dominion Resources, Inc. | | | 788,728 | | | 24,442,681 |
| Entergy Corp. | | | 178,290 | | | 12,139,766 |
| FPL Group, Inc. | | | 905,900 | | | 45,956,307 |
| Northeast Utilities | | | 153,080 | | | 3,304,997 |
| NRG Energy, Inc. (a) | | | 841,750 | | | 14,814,800 |
| PG&E Corp. | | | 517,470 | | | 19,777,703 |
| PPL Corp. | | | 975,560 | | | 28,008,328 |
| Progress Energy, Inc. | | | 280,220 | | | 10,160,777 |
| Public Service Enterprise Group, Inc. | | | 1,125,500 | | | 33,168,485 |
| | | | | | |
| | | | | | $ | 216,475,643 |
| Total Common Stocks (Identified Cost, $4,123,792,977) | | | | | $ | 3,359,548,487 |
| | |
| Bonds - 38.9% | | | | | | |
| Agency - Other - 0.1% | | | | | | |
| Financing Corp., 9.65%, 2018 | | $ | 2,850,000 | | $ | 4,292,978 |
| | |
| Asset Backed & Securitized - 2.3% | | | | | | |
| Banc of America Commercial Mortgage, Inc., 5.935%, 2051 | | $ | 13,600,000 | | $ | 9,658,452 |
| Bayview Financial Revolving Mortgage Loan Trust, FRN, 1.322%, 2040 (z) | | | 10,340,000 | | | 4,549,600 |
| BlackRock Capital Finance LP, 7.75%, 2026 (n) | | | 1,078,797 | | | 140,244 |
| Capital Trust Realty CDO Ltd., 5.16%, 2035 (z) | | | 2,400,000 | | | 840,000 |
| Chase Commercial Mortgage Securities Corp., 7.543%, 2032 | | | 42,821 | | | 42,762 |
| Citigroup/Deutsche Bank Commercial Mortgage Trust, 5.322%, 2049 | | | 6,820,000 | | | 4,537,703 |
| Countrywide Asset-Backed Certificates, FRN, 4.575%, 2035 | | | 40,169 | | | 37,628 |
| Countrywide Asset-Backed Certificates, FRN, 4.823%, 2035 | | | 972,741 | | | 914,323 |
| Countrywide Asset-Backed Certificates, FRN, 5.689%, 2046 | | | 6,450,000 | | | 2,572,636 |
| Credit Suisse Commercial Mortgage Trust, 5.509%, 2039 | | | 8,321,579 | | | 3,499,507 |
| Credit Suisse Mortgage Capital Certificate, 5.695%, 2040 | | | 9,759,829 | | | 6,375,042 |
10
Portfolio of Investments (unaudited) – continued
| | | | | | |
| Issuer | | Shares/Par | | Value ($) |
| | | | | | |
| Bonds - continued | | | | | | |
| Asset Backed & Securitized - continued | | | | | | |
| GE Commercial Mortgage Corp., FRN, 5.515%, 2044 | | $ | 7,580,000 | | $ | 3,670,895 |
| GMAC Mortgage Corp. Loan Trust, FRN, 5.805%, 2036 | | | 7,534,000 | | | 2,911,786 |
| Greenwich Capital Commercial Funding Corp., 4.305%, 2042 | | | 5,116,650 | | | 4,928,673 |
| Greenwich Capital Commercial Funding Corp., FRN, 5.317%, 2036 | | | 3,468,895 | | | 2,966,198 |
| JPMorgan Chase Commercial Mortgage Securities Corp., 4.78%, 2042 | | | 828,000 | | | 433,661 |
| JPMorgan Chase Commercial Mortgage Securities Corp., FRN, 5.819%, 2049 | | | 16,230,000 | | | 11,162,343 |
| JPMorgan Chase Commercial Mortgage Securities Corp., FRN, 4.948%, 2037 | | | 1,200,000 | | | 580,270 |
| JPMorgan Chase Commercial Mortgage Securities Corp., FRN, 5.231%, 2041 | | | 2,279,327 | | | 1,869,100 |
| JPMorgan Chase Commercial Mortgage Securities Corp., FRN, 5.475%, 2043 | | | 6,980,000 | | | 5,056,321 |
| JPMorgan Chase Commercial Mortgage Securities Corp., FRN, 5.875%, 2045 | | | 7,270,000 | | | 5,484,529 |
| Merrill Lynch Mortgage Trust, FRN, 5.829%, 2050 | | | 5,520,000 | | | 794,438 |
| Merrill Lynch/Countrywide Commercial Mortgage Trust, FRN, 5.473%, 2039 | | | 6,500,000 | | | 3,182,191 |
| Merrill Lynch/Countrywide Commercial Mortgage Trust, FRN, 5.749%, 2050 | | | 9,759,829 | | | 6,159,138 |
| Morgan Stanley Capital I, Inc., FRN, 0.501%, 2030 (i)(n) | | | 54,218,267 | | | 1,166,755 |
| Multi-Family Capital Access One, Inc., 6.65%, 2024 | | | 925,819 | | | 924,718 |
| Residential Asset Mortgage Products, Inc., FRN, 4.971%, 2034 | | | 5,243,000 | | | 3,751,530 |
| Residential Funding Mortgage Securities, Inc., 5.32%, 2035 | | | 8,242,000 | | | 2,332,263 |
| Spirit Master Funding LLC, 5.05%, 2023 (z) | | | 8,872,288 | | | 7,257,546 |
| Structured Asset Securities Corp., FRN, 4.67%, 2035 | | | 7,762,707 | | | 6,104,587 |
| Wachovia Bank Commercial Mortgage Trust, 4.75%, 2044 | | | 7,432,000 | | | 3,671,936 |
| Wachovia Bank Commercial Mortgage Trust, 5.903%, 2051 | | | 17,935,000 | | | 11,004,475 |
| Wachovia Bank Commercial Mortgage Trust, FRN, 4.847%, 2041 | | | 9,769,315 | | | 8,016,852 |
| Wachovia Bank Commercial Mortgage Trust, FRN, 5.957%, 2045 | | | 9,160,000 | | | 4,025,615 |
| Wachovia Bank Commercial Mortgage Trust, FRN, 5.795%, 2045 | | | 4,405,058 | | | 2,115,301 |
| | | | | | |
| | | | | | $ | 132,739,018 |
| Broadcasting - 0.2% | | | | | | |
| CBS Corp., 6.625%, 2011 | | $ | 4,982,000 | | $ | 4,795,713 |
| Hearst-Argyle Television, Inc., 7.5%, 2027 | | | 3,800,000 | | | 2,980,017 |
| News America, Inc., 8.5%, 2025 | | | 5,903,000 | | | 5,433,487 |
| | | | | | |
| | | | | | $ | 13,209,217 |
| Brokerage & Asset Managers - 0.0% | | | | | | |
| Lehman Brothers Holdings, Inc., 6.5%, 2017 (d) | | $ | 6,800,000 | | $ | 680 |
11
Portfolio of Investments (unaudited) – continued
| | | | | | |
| Issuer | | Shares/Par | | Value ($) |
| | | | | | |
| Bonds - continued | | | | | | |
| Building - 0.1% | | | | | | |
| CRH America, Inc., 6.95%, 2012 | | $ | 8,021,000 | | $ | 7,166,346 |
| | |
| Cable TV - 0.2% | | | | | | |
| Cox Communications, Inc., 4.625%, 2013 | | $ | 6,711,000 | | $ | 6,102,930 |
| Time Warner Entertainment Co. LP, 8.375%, 2033 | | | 7,170,000 | | | 6,782,942 |
| | | | | | |
| | | | | | $ | 12,885,872 |
| Conglomerates - 0.2% | | | | | | |
| Kennametal, Inc., 7.2%, 2012 | | $ | 8,542,000 | | $ | 8,590,348 |
| | |
| Consumer Goods & Services - 0.3% | | | | | | |
| Fortune Brands, Inc., 5.125%, 2011 | | $ | 9,636,000 | | $ | 9,457,059 |
| Western Union Co., 5.4%, 2011 | | | 10,085,000 | | | 10,283,372 |
| | | | | | |
| | | | | | $ | 19,740,431 |
| Defense Electronics - 0.2% | | | | | | |
| BAE Systems Holdings, Inc., 5.2%, 2015 (n) | | $ | 8,973,000 | | $ | 8,752,758 |
| | |
| Electronics - 0.1% | | | | | | |
| Tyco Electronics Group S.A., 6.55%, 2017 | | $ | 7,980,000 | | $ | 6,038,594 |
| | |
| Emerging Market Quasi-Sovereign - 0.2% | | | | | | |
| Petroleos Mexicanos, 8%, 2019 (n) | | $ | 4,145,000 | | $ | 4,041,375 |
| Ras Laffan Liquefied Natural Gas Co. Ltd., 5.832%, 2016 (n) | | | 6,340,000 | | | 5,984,136 |
| | | | | | |
| | | | | | $ | 10,025,511 |
| Energy - Independent - 0.3% | | | | | | |
| Anadarko Petroleum Corp., 6.45%, 2036 | | $ | 7,610,000 | | $ | 5,319,124 |
| Nexen, Inc., 5.875%, 2035 | | | 2,117,000 | | | 1,400,652 |
| Ocean Energy, Inc., 7.25%, 2011 | | | 8,780,000 | | | 9,284,069 |
| | | | | | |
| | | | | | $ | 16,003,845 |
| Energy - Integrated - 0.4% | | | | | | |
| ConocoPhillips, 6.5%, 2039 | | $ | 4,950,000 | | $ | 4,828,606 |
| Hess Corp., 8.125%, 2019 | | | 1,740,000 | | | 1,793,714 |
| Petro-Canada, 6.05%, 2018 | | | 9,475,000 | | | 8,147,676 |
| Shell International Finance, 4%, 2014 | | | 9,720,000 | | | 9,856,381 |
| | | | | | |
| | | | | | $ | 24,626,377 |
| Financial Institutions - 0.3% | | | | | | |
| General Electric Capital Corp., 5.45%, 2013 | | $ | 2,383,000 | | $ | 2,294,853 |
| HSBC Finance Corp., 5.25%, 2011 | | | 8,925,000 | | | 7,650,921 |
| ORIX Corp., 5.48%, 2011 | | | 9,030,000 | | | 6,152,852 |
| | | | | | |
| | | | | | $ | 16,098,626 |
12
Portfolio of Investments (unaudited) – continued
| | | | | | |
| Issuer | | Shares/Par | | Value ($) |
| | | | | | |
| Bonds - continued | | | | | | |
| Food & Beverages - 0.4% | | | | | | |
| Diageo Finance B.V., 5.5%, 2013 | | $ | 6,334,000 | | $ | 6,546,810 |
| Dr. Pepper Snapple Group, Inc., 6.12%, 2013 | | | 2,540,000 | | | 2,511,984 |
| Dr. Pepper Snapple Group, Inc., 6.82%, 2018 | | | 3,082,000 | | | 2,908,826 |
| General Mills, Inc., 5.65%, 2019 | | | 1,360,000 | | | 1,384,553 |
| Miller Brewing Co., 5.5%, 2013 (n) | | | 7,006,000 | | | 6,747,864 |
| | | | | | |
| | | | | | $ | 20,100,037 |
| Food & Drug Stores - 0.1% | | | | | | |
| CVS Caremark Corp., 6.125%, 2016 | | $ | 6,630,000 | | $ | 6,674,640 |
| | |
| Gaming & Lodging - 0.1% | | | | | | |
| Wyndham Worldwide Corp., 6%, 2016 | | $ | 6,562,000 | | $ | 3,343,601 |
| | |
| Insurance - 0.1% | | | | | | |
| American International Group, Inc., 8.25%, 2018 (z) | | $ | 3,490,000 | | $ | 1,493,357 |
| ING Groep N.V., 5.775% to 2015, FRN to 2049 | | | 8,503,000 | | | 2,338,325 |
| Metropolitan Life Global Funding, 5.125%, 2013 (n) | | | 3,340,000 | | | 3,050,392 |
| | | | | | |
| | | | | | $ | 6,882,074 |
| Insurance - Property & Casualty - 0.3% | | | | | | |
| Allstate Corp., 5.55%, 2035 | | $ | 7,742,000 | | $ | 5,353,028 |
| Chubb Corp., 6.375% to 2017, FRN to 2067 | | | 6,830,000 | | | 3,898,632 |
| Fund American Cos., Inc., 5.875%, 2013 | | | 6,030,000 | | | 4,629,454 |
| ZFS Finance USA Trust IV, 5.875% to 2012, FRN to 2032 (n) | | | 2,640,000 | | | 1,045,334 |
| ZFS Finance USA Trust V, 6.5% to 2017, FRN to 2037 (n) | | | 11,610,000 | | | 4,760,100 |
| | | | | | |
| | | | | | $ | 19,686,548 |
| International Market Quasi-Sovereign - 0.4% | | | | | | |
| Hydro-Quebec, 6.3%, 2011 | | $ | 16,520,000 | | $ | 17,761,181 |
| ING Bank N.V., 3.9%, 2014 (z) | | | 6,920,000 | | | 6,966,502 |
| | | | | | |
| | | | | | $ | 24,727,683 |
| International Market Sovereign - 0.2% | | | | | | |
| Province of Ontario, 5%, 2011 | | $ | 13,130,000 | | $ | 13,930,667 |
| | |
| Machinery & Tools - 0.1% | | | | | | |
| Atlas Copco AB, 5.6%, 2017 (n) | | $ | 5,970,000 | | $ | 5,393,668 |
| | |
| Major Banks - 1.1% | | | | | | |
| Bank of America Corp., 5.49%, 2019 | | $ | 4,135,000 | | $ | 2,443,578 |
| BNP Paribas, 7.195% to 2037, FRN to 2049 (n) | | | 3,200,000 | | | 1,636,544 |
| DBS Group Holdings Ltd., 7.657% to 2011, FRN to 2049 (n) | | | 4,943,000 | | | 4,195,584 |
| Goldman Sachs Group, Inc., 5.625%, 2017 | | | 6,364,000 | | | 4,957,346 |
13
Portfolio of Investments (unaudited) – continued
| | | | | | |
| Issuer | | Shares/Par | | Value ($) |
| | | | | | |
| Bonds - continued | | | | | | |
| Major Banks - continued | | | | | | |
| Goldman Sachs Group, Inc., 7.5%, 2019 | | $ | 3,238,000 | | $ | 3,230,918 |
| Merrill Lynch & Co., Inc., 6.15%, 2013 | | | 6,790,000 | | | 5,707,654 |
| Merrill Lynch & Co., Inc., 6.11%, 2037 | | | 5,900,000 | | | 2,932,371 |
| Morgan Stanley, 5.75%, 2016 | | | 6,120,000 | | | 5,571,336 |
| Morgan Stanley, 6.625%, 2018 | | | 6,920,000 | | | 6,598,268 |
| MUFG Capital Finance 1 Ltd., 6.346% to 2016, FRN to 2049 | | | 5,555,000 | | | 3,721,850 |
| Natixis S.A., 10% to 2018, FRN to 2049 (n) | | | 9,804,000 | | | 1,997,604 |
| PNC Funding Corp., 5.625%, 2017 | | | 6,510,000 | | | 5,993,991 |
Royal Bank of Scotland Group PLC, 6.99% to 2017,
FRN to 2049 (n) | | | 2,060,000 | | | 906,400 |
| UniCredito Italiano Capital Trust II, 9.2% to 2010, FRN to 2049 (n) | | | 11,444,000 | | | 3,222,035 |
| UniCredito Luxembourg Finance S.A., 6%, 2017 (n) | | | 8,740,000 | | | 4,832,418 |
| Wachovia Corp., 5.25%, 2014 | | | 4,613,000 | | | 3,830,215 |
| | | | | | |
| | | | | | $ | 61,778,112 |
| Medical & Health Technology & Services - 0.2% | | | | | | |
| Cardinal Health, Inc., 5.8%, 2016 | | $ | 4,803,000 | | $ | 4,411,613 |
| HCA, Inc., 8.75%, 2010 | | | 742,000 | | | 738,290 |
| Hospira, Inc., 5.55%, 2012 | | | 3,080,000 | | | 3,118,910 |
| Hospira, Inc., 6.05%, 2017 | | | 5,813,000 | | | 5,188,039 |
| | | | | | |
| | | | | | $ | 13,456,852 |
| Medical Equipment - 0.2% | | | | | | |
| Pfizer, Inc., 6.2%, 2019 | | $ | 4,872,000 | | $ | 5,192,178 |
| Pfizer, Inc., 7.2%, 2039 | | | 3,040,000 | | | 3,260,139 |
| | | | | | |
| | | | | | $ | 8,452,317 |
| Metals & Mining - 0.1% | | | | | | |
| ArcelorMittal, 6.125%, 2018 | | $ | 9,913,000 | | $ | 7,171,570 |
| | |
| Mortgage Backed - 16.5% | | | | | | |
| Fannie Mae, 6.33%, 2011 | | $ | 1,439,257 | | $ | 1,520,202 |
| Fannie Mae, 4.017%, 2013 | | | 997,430 | | | 1,016,915 |
| Fannie Mae, 4.02%, 2013 | | | 3,150,197 | | | 3,217,632 |
| Fannie Mae, 4.751%, 2013 | | | 671,418 | | | 700,028 |
| Fannie Mae, 4.589%, 2014 | | | 5,847,286 | | | 6,069,699 |
| Fannie Mae, 4.63%, 2014 | | | 2,484,659 | | | 2,580,709 |
| Fannie Mae, 4.777%, 2014 | | | 194,032 | | | 202,455 |
| Fannie Mae, 4.839%, 2014 | | | 4,446,052 | | | 4,665,185 |
| Fannie Mae, 4.88%, 2014 - 2020 | | | 1,634,919 | | | 1,715,108 |
| Fannie Mae, 4.564%, 2015 | | | 357,491 | | | 369,950 |
| Fannie Mae, 4.78%, 2015 | | | 2,379,114 | | | 2,487,469 |
| Fannie Mae, 4.856%, 2015 | | | 663,399 | | | 690,969 |
14
Portfolio of Investments (unaudited) – continued
| | | | | | |
| Issuer | | Shares/Par | | Value ($) |
| | | | | | |
| Bonds - continued | | | | | | |
| Mortgage Backed - continued | | | | | | |
| Fannie Mae, 4.921%, 2015 | | $ | 4,747,204 | | $ | 4,996,956 |
| Fannie Mae, 5.19%, 2015 | | | 1,380,140 | | | 1,474,009 |
| Fannie Mae, 5.09%, 2016 | | | 2,000,000 | | | 2,123,873 |
| Fannie Mae, 5.05%, 2017 | | | 2,501,000 | | | 2,649,874 |
| Fannie Mae, 5.5%, 2017 - 2035 | | | 224,995,405 | | | 234,640,811 |
| Fannie Mae, 6%, 2017 - 2037 | | | 122,561,449 | | | 128,620,826 |
| Fannie Mae, 4.5%, 2018 - 2035 | | | 40,821,091 | | | 42,137,987 |
| Fannie Mae, 5%, 2018 - 2035 | | | 74,205,502 | | | 76,981,982 |
| Fannie Mae, 7.5%, 2030 - 2032 | | | 1,295,450 | | | 1,402,528 |
| Fannie Mae, 6.5%, 2031 - 2037 | | | 44,863,131 | | | 47,570,615 |
| Freddie Mac, 6%, 2016 - 2037 | | | 80,379,112 | | | 84,348,686 |
| Freddie Mac, 5%, 2017 - 2035 | | | 99,075,239 | | | 102,743,926 |
| Freddie Mac, 4.5%, 2019 - 2035 | | | 20,383,047 | | | 21,020,808 |
| Freddie Mac, 5.5%, 2019 - 2035 | | | 70,341,011 | | | 73,300,989 |
| Freddie Mac, 6.5%, 2034 - 2037 | | | 21,044,502 | | | 22,259,329 |
| Ginnie Mae, 5.5%, 2032 - 2035 | | | 30,053,372 | | | 31,414,819 |
| Ginnie Mae, 6%, 2032 - 2038 | | | 25,737,829 | | | 26,962,475 |
| Ginnie Mae, 4.5%, 2033 - 2034 | | | 6,803,807 | | | 6,979,244 |
| Ginnie Mae, 5%, 2033 - 2034 | | | 7,392,964 | | | 7,692,020 |
| | | | | | |
| | | | | | $ | 944,558,078 |
| Municipals - 0.3% | | | | | | |
| California Educational Facilities Authority Rev. (Stanford University), “T-1”, 5%, 2039 | | $ | 3,195,000 | | $ | 3,234,746 |
| Massachusetts Bay Transportation Authority Sales Tax Rev., “A-1”, 5.25%, 2033 | | | 6,480,000 | | | 6,687,101 |
| Massachusetts Health & Educational Facilities Authority Rev. (Boston College), 5.5%, 2030 | | | 4,210,000 | | | 4,511,268 |
| | | | | | |
| | | | | | $ | 14,433,115 |
| Natural Gas - Pipeline - 0.5% | | | | | | |
| CenterPoint Energy, Inc., 7.875%, 2013 | | $ | 6,965,000 | | $ | 7,130,983 |
| Enterprise Products Operating LLC, 6.5%, 2019 | | | 5,184,000 | | | 4,763,287 |
| Kinder Morgan Energy Partners LP, 6.75%, 2011 | | | 8,013,000 | | | 8,171,241 |
| Kinder Morgan Energy Partners LP, 7.75%, 2032 | | | 2,520,000 | | | 2,359,161 |
| Spectra Energy Capital LLC, 8%, 2019 | | | 5,327,000 | | | 5,356,842 |
| | | | | | |
| | | | | | $ | 27,781,514 |
| Network & Telecom - 0.4% | | | | | | |
| AT&T, Inc., 6.55%, 2039 | | $ | 7,210,000 | | $ | 6,539,340 |
| Telecom Italia Capital, 5.25%, 2013 | | | 4,186,000 | | | 3,759,179 |
| Telefonica Europe B.V., 7.75%, 2010 | | | 3,298,000 | | | 3,443,976 |
| Verizon New York, Inc., 6.875%, 2012 | | | 11,404,000 | | | 11,680,638 |
| | | | | | |
| | | | | | $ | 25,423,133 |
15
Portfolio of Investments (unaudited) – continued
| | | | | | |
| Issuer | | Shares/Par | | Value ($) |
| | | | | | |
| Bonds - continued | | | | | | |
| Oils - 0.2% | | | | | | |
| Valero Energy Corp., 6.875%, 2012 | | $ | 12,750,000 | | $ | 12,867,963 |
| | |
| Other Banks & Diversified Financials - 0.7% | | | | | | |
| American Express Co., 5.5%, 2016 | | $ | 11,996,000 | | $ | 9,843,198 |
| Capital One Financial Corp., 6.15%, 2016 | | | 8,680,000 | | | 5,494,466 |
| Nordea Bank AB, 5.424% to 2015, FRN to 2049 (n) | | | 3,333,000 | | | 1,349,865 |
| UBS Preferred Funding Trust V, 6.243% to 2016, FRN to 2049 | | | 12,360,000 | | | 3,375,874 |
| UFJ Finance Aruba AEC, 6.75%, 2013 | | | 9,069,000 | | | 9,330,813 |
| Woori Bank, 6.125% to 2011, FRN to 2016 (n) | | | 15,472,000 | | | 10,932,206 |
| | | | | | |
| | | | | | $ | 40,326,422 |
| Pharmaceuticals - 0.4% | | | | | | |
| Allergan, Inc., 5.75%, 2016 | | $ | 9,860,000 | | $ | 9,637,775 |
| GlaxoSmithKline Capital, Inc., 4.85%, 2013 | | | 3,090,000 | | | 3,214,833 |
| Roche Holdings, Inc., 6%, 2019 (n) | | | 4,670,000 | | | 4,806,649 |
| Roche Holdings, Inc., 7%, 2039 (n) | | | 3,710,000 | | | 3,882,214 |
| | | | | | |
| | | | | | $ | 21,541,471 |
| Pollution Control - 0.1% | | | | | | |
| Waste Management, Inc., 7.375%, 2010 | | $ | 7,332,000 | | $ | 7,501,201 |
| | |
| Railroad & Shipping - 0.1% | | | | | | |
| CSX Corp., 6.75%, 2011 | | $ | 618,000 | | $ | 621,948 |
| CSX Corp., 7.9%, 2017 | | | 6,220,000 | | | 6,078,551 |
| | | | | | |
| | | | | | $ | 6,700,499 |
| Real Estate - 0.4% | | | | | | |
| Boston Properties, Inc., REIT, 5%, 2015 | | $ | 2,006,000 | | $ | 1,440,176 |
| HRPT Properties Trust, REIT, 6.25%, 2016 | | | 11,278,000 | | | 7,431,176 |
| Kimco Realty Corp., REIT, 6%, 2012 | | | 1,750,000 | | | 1,333,245 |
| ProLogis, REIT, 5.75%, 2016 | | | 11,170,000 | | | 6,138,574 |
| Vornado Realty Trust, REIT, 4.75%, 2010 | | | 5,141,000 | | | 4,785,556 |
| | | | | | |
| | | | | | $ | 21,128,727 |
| Retailers - 0.3% | | | | | | |
| Home Depot, Inc., 5.875%, 2036 | | $ | 2,896,000 | | $ | 2,050,892 |
| Limited Brands, Inc., 5.25%, 2014 | | | 6,288,000 | | | 4,412,044 |
| Wal-Mart Stores, Inc., 5.25%, 2035 | | | 12,347,000 | | | 11,096,743 |
| | | | | | |
| | | | | | $ | 17,559,679 |
| Telecommunications - Wireless - 0.2% | | | | | | |
| Cingular Wireless LLC, 6.5%, 2011 | | $ | 3,924,000 | | $ | 4,135,598 |
| Rogers Communications, Inc., 6.8%, 2018 | | | 8,529,000 | | | 8,524,548 |
| | | | | | |
| | | | | | $ | 12,660,146 |
16
Portfolio of Investments (unaudited) – continued
| | | | | | |
| Issuer | | Shares/Par | | Value ($) |
| | | | | | |
| Bonds - continued | | | | | | |
| Tobacco - 0.2% | | | | | | |
| Altria Group, Inc., 9.7%, 2018 | | $ | 3,961,000 | | $ | 4,311,549 |
| Philip Morris International, Inc., 4.875%, 2013 | | | 4,662,000 | | | 4,712,867 |
| | | | | | |
| | | | | | $ | 9,024,416 |
| U.S. Government Agencies and Equivalents - 0.7% | | | | | | |
| Aid-Egypt, 4.45%, 2015 | | $ | 9,559,000 | | $ | 10,158,540 |
| Small Business Administration, 8.8%, 2011 | | | 15,293 | | | 15,546 |
| Small Business Administration, 4.35%, 2023 | | | 1,556,384 | | | 1,614,864 |
| Small Business Administration, 4.77%, 2024 | | | 4,022,045 | | | 4,247,680 |
| Small Business Administration, 5.18%, 2024 | | | 6,443,563 | | | 6,780,449 |
| Small Business Administration, 5.52%, 2024 | | | 4,189,227 | | | 4,560,195 |
| Small Business Administration, 4.99%, 2024 | | | 5,670,917 | | | 5,992,165 |
| Small Business Administration, 4.95%, 2025 | | | 4,695,468 | | | 4,996,568 |
| | | | | | |
| | | | | | $ | 38,366,007 |
| U.S. Treasury Obligations - 8.1% | | | | | | |
| U.S. Treasury Bonds, 2.375%, 2010 | | $ | 4,813,000 | | $ | 4,930,880 |
| U.S. Treasury Bonds, 2%, 2013 | | | 11,523,000 | | | 11,760,662 |
| U.S. Treasury Bonds, 4.75%, 2017 | | | 22,360,000 | | | 26,154,224 |
| U.S. Treasury Bonds, 8.5%, 2020 | | | 2,148,000 | | | 3,207,233 |
| U.S. Treasury Bonds, 6%, 2026 | | | 18,687,000 | | | 24,620,123 |
| U.S. Treasury Bonds, 6.75%, 2026 | | | 11,593,000 | | | 16,491,043 |
| U.S. Treasury Bonds, 5.375%, 2031 | | | 18,974,000 | | | 23,922,059 |
| U.S. Treasury Bonds, 4.5%, 2036 | | | 18,917,000 | | | 21,795,940 |
| U.S. Treasury Notes, 4.875%, 2009 | | | 30,443,000 | | | 30,962,662 |
| U.S. Treasury Notes, 6.5%, 2010 | | | 4,316,000 | | | 4,537,195 |
| U.S. Treasury Notes, 1.5%, 2010 | | | 65,192,000 | | | 65,968,685 |
| U.S. Treasury Notes, 0.875%, 2011 | | | 44,324,000 | | | 44,408,659 |
| U.S. Treasury Notes, 4.125%, 2012 | | | 40,921,000 | | | 44,814,879 |
| U.S. Treasury Notes, 3.875%, 2013 | | | 9,952,000 | | | 10,902,107 |
| U.S. Treasury Notes, 3.5%, 2013 | | | 25,000,000 | | | 27,111,325 |
| U.S. Treasury Notes, 3.125%, 2013 | | | 31,742,000 | | | 33,993,714 |
| U.S. Treasury Notes, 1.5%, 2013 | | | 28,113,000 | | | 28,042,718 |
| U.S. Treasury Notes, 4.75%, 2014 | | | 2,962,000 | | | 3,420,186 |
| U.S. Treasury Notes, 4.125%, 2015 | | | 5,109,000 | | | 5,770,375 |
| U.S. Treasury Notes, 4.25%, 2015 | | | 856,000 | | | 975,305 |
| U.S. Treasury Notes, 2.625%, 2016 | | | 4,568,000 | | | 4,684,699 |
| U.S. Treasury Notes, 3.75%, 2018 | | | 23,607,000 | | | 25,733,519 |
| | | | | | |
| | | | | | $ | 464,208,192 |
| Utilities - Electric Power - 1.6% | | | | | | |
| Bruce Mansfield Unit, 6.85%, 2034 | | $ | 13,870,000 | | $ | 10,791,114 |
| Enel Finance International S.A., 6.25%, 2017 (n) | | | 8,525,000 | | | 7,724,741 |
17
Portfolio of Investments (unaudited) – continued
| | | | | | |
| Issuer | | Shares/Par | | Value ($) |
| | | | | | |
| Bonds - continued | | | | | | |
| Utilities - Electric Power - continued | | | | | | |
| Exelon Generation Co. LLC, 6.95%, 2011 | | $ | 15,019,000 | | $ | 15,335,646 |
| Exelon Generation Co. LLC, 6.2%, 2017 | | | 720,000 | | | 643,811 |
| FirstEnergy Corp., 6.45%, 2011 | | | 13,306,000 | | | 13,318,055 |
| MidAmerican Energy Holdings Co., 5.875%, 2012 | | | 2,667,000 | | | 2,768,813 |
| MidAmerican Funding LLC, 6.927%, 2029 | | | 12,485,000 | | | 11,984,077 |
| Oncor Electric Delivery Co., 7%, 2022 | | | 8,725,000 | | | 8,136,281 |
| PSEG Power LLC, 6.95%, 2012 | | | 6,285,000 | | | 6,430,724 |
| PSEG Power LLC, 5.5%, 2015 | | | 5,036,000 | | | 4,629,685 |
| System Energy Resources, Inc., 5.129%, 2014 (z) | | | 3,241,870 | | | 2,992,829 |
| Waterford 3 Funding Corp., 8.09%, 2017 | | | 6,194,467 | | | 6,103,346 |
| | | | | | |
| | | | | | $ | 90,859,122 |
| Total Bonds (Identified Cost, $2,384,400,069) | | | | | $ | 2,226,708,055 |
| | |
| Money Market Funds (v) - 1.3% | | | | | | |
MFS Institutional Money Market Portfolio, 0.23%,
at Cost and Net Asset Value | | | 76,039,536 | | $ | 76,039,536 |
| | |
| Collateral for Securities Loaned - 0.2% | | | | | | |
| Goldman Sachs Repurchase Agreement, 0.12%, dated 3/31/09, due 4/1/09, total to be received $8,573,812 (secured by U.S. Treasury and Federal Agency obligations and Mortgage Backed securities valued at $8,745,261 in an individually traded account), at Cost | | $ | 8,573,783 | | $ | 8,573,783 |
| Total Investments (Identified Cost, $6,592,806,365) | | | | | $ | 5,670,869,861 |
| | |
| Other Assets, Less Liabilities - 0.8% | | | | | | 47,975,465 |
| Net Assets - 100.0% | | | | | $ | 5,718,845,326 |
| (a) | Non-income producing security. |
| (d) | Non-income producing security – in default. |
| (i) | Interest only security for which the fund receives interest on notional principal (Par amount). Par amount shown is the notional principal and does not reflect the cost of the security. |
| (l) | All or a portion of this security is on loan. |
| (n) | Securities exempt from registration under Rule 144A of the Securities Act of 1933. These securities may be sold in the ordinary course of business in transactions exempt from registration, normally to qualified institutional buyers. At period end, the aggregate value of these securities was $86,568,886, representing 1.51% of net assets. |
| (v) | Underlying fund that is available only to investment companies managed by MFS. The rate quoted is the annualized seven-day yield of the fund at period end. |
18
Portfolio of Investments (unaudited) – continued
| (z) | Restricted securities are not registered under the Securities Act of 1933 and are subject to legal restrictions on resale. These securities generally may be resold in transactions exempt from registration or to the public if the securities are subsequently registered. Disposal of these securities may involve time-consuming negotiations and prompt sale at an acceptable price may be difficult. The fund holds the following restricted securities: |
| | | | | | |
| Restricted Securities | | Acquisition
Date | | Cost | | Current
Market
Value |
| American International Group, Inc., 8.25%, 2018 | | 8/13/08 | | $3,490,000 | | $1,493,357 |
| Bayview Financial Revolving Mortgage Loan Trust, FRN, 1.322%, 2040 | | 3/01/06 | | 10,340,000 | | 4,549,600 |
| Capital Trust Realty CDO Ltd., 5.16%, 2035 | | 4/07/06 | | 2,315,306 | | 840,000 |
| ING Bank N.V., 3.9%, 2014 | | 3/12/09 | | 6,906,730 | | 6,966,502 |
| Spirit Master Funding LLC, 5.05%, 2023 | | 10/04/05 | | 8,773,150 | | 7,257,546 |
| System Energy Resources, Inc., 5.129%, 2014 | | 4/16/04 | | 3,241,870 | | 2,992,829 |
| Total Restricted Securities | | | | | | $24,099,834 |
| % of Net Assets | | | | | | 0.4% |
The following abbreviations are used in this report and are defined:
| ADR | | American Depository Receipt |
| CDO | | Collateralized Debt Obligation |
| FRN | | Floating Rate Note. Interest rate resets periodically and may not be the rate reported at period end. |
| REIT | | Real Estate Investment Trust |
See Notes to Financial Statements
19
Financial Statements
STATEMENT OF ASSETS AND LIABILITIES
At 3/31/09 (unaudited)
This statement represents your fund’s balance sheet, which details the assets and liabilities comprising the total value of the fund.
| | | | | |
| Assets | | | | | |
Investments- | | | | | |
Non-affiliated issuers, at value
(identified cost, $6,516,766,829) | | $5,594,830,325 | | | |
Underlying funds, at cost and value | | 76,039,536 | | | |
Total investments, at value, including $8,448,979 of securities on loan (identified cost, $6,592,806,365) | | | | | $5,670,869,861 |
Receivable for investments sold | | 49,825,890 | | | |
Receivable for fund shares sold | | 5,728,777 | | | |
Interest and dividends receivable | | 28,768,015 | | | |
Other assets | | 125,463 | | | |
Total assets | | | | | $5,755,318,006 |
| Liabilities | | | | | |
Payable to custodian | | $3,660 | | | |
Distributions payable | | 1,871,101 | | | |
Payable for investments purchased | | 13,449,800 | | | |
Payable for fund shares reacquired | | 7,890,855 | | | |
Collateral for securities loaned, at value | | 8,573,783 | | | |
Payable to affiliates | | | | | |
Management fee | | 109,840 | | | |
Shareholder servicing costs | | 3,834,882 | | | |
Distribution and service fees | | 157,360 | | | |
Administrative services fee | | 6,193 | | | |
Program manager fees | | 76 | | | |
Payable for independent trustees’ compensation | | 192,892 | | | |
Accrued expenses and other liabilities | | 382,238 | | | |
Total liabilities | | | | | $36,472,680 |
Net assets | | | | | $5,718,845,326 |
| Net assets consist of | | | | | |
Paid-in capital | | $7,698,945,022 | | | |
Unrealized appreciation (depreciation) on investments and translation of assets and liabilities in foreign currencies | | (921,981,448 | ) | | |
Accumulated net realized gain (loss) on investments and foreign currency transactions | | (1,052,094,373 | ) | | |
Accumulated distributions in excess of net investment income | | (6,023,875 | ) | | |
Net assets | | | | | $5,718,845,326 |
Shares of beneficial interest outstanding | | | | | 539,081,491 |
20
Statement of Assets and Liabilities (unaudited) – continued
| | | | |
Class A shares | | | | |
Net assets | | $3,655,778,130 | | |
Shares outstanding | | 344,832,101 | | |
Net asset value per share | | | | $10.60 |
Offering price per share (100/94.25 × net asset value per share) | | | | $11.25 |
Class B shares | | | | |
Net assets | | $749,043,486 | | |
Shares outstanding | | 70,652,516 | | |
Net asset value and offering price per share | | | | $10.60 |
Class C shares | | | | |
Net assets | | $724,914,692 | | |
Shares outstanding | | 68,068,569 | | |
Net asset value and offering price per share | | | | $10.65 |
Class I shares | | | | |
Net assets | | $125,214,928 | | |
Shares outstanding | | 11,813,455 | | |
Net asset value, offering price, and redemption price per share | | | | $10.60 |
Class R1 shares | | | | |
Net assets | | $14,704,406 | | |
Shares outstanding | | 1,388,132 | | |
Net asset value, offering price, and redemption price per share | | | | $10.59 |
Class R2 shares | | | | |
Net assets | | $122,796,614 | | |
Shares outstanding | | 11,556,304 | | |
Net asset value, offering price, and redemption price per share | | | | $10.63 |
Class R3 shares | | | | |
Net assets | | $113,560,420 | | |
Shares outstanding | | 10,705,928 | | |
Net asset value, offering price, and redemption price per share | | | | $10.61 |
Class R4 shares | | | | |
Net assets | | $198,986,667 | | |
Shares outstanding | | 18,758,765 | | |
Net asset value, offering price, and redemption price per share | | | | $10.61 |
Class 529A shares | | | | |
Net assets | | $6,696,615 | | |
Shares outstanding | | 632,811 | | |
Net asset value and redemption price per share | | | | $10.58 |
Offering price per share (100/94.25 × net asset value per share) | | | | $11.23 |
21
Statement of Assets and Liabilities (unaudited) – continued
| | | | |
Class 529B shares | | | | |
Net assets | | $3,795,676 | | |
Shares outstanding | | 358,048 | | |
Net asset value and offering price per share | | | | $10.60 |
Class 529C shares | | | | |
Net assets | | $3,353,692 | | |
Shares outstanding | | 314,862 | | |
Net asset value and offering price per share | | | | $10.65 |
On sales of $50,000 or more, the offering prices of Class A and Class 529A shares are reduced. A contingent deferred sales charge may be imposed on redemptions of Class A, Class B, Class C, Class 529B, and Class 529C shares.
See Notes to Financial Statements
22
Financial Statements
STATEMENT OF OPERATIONS
Six months ended 3/31/09 (unaudited)
This statement describes how much your fund earned in investment income and accrued in expenses. It also describes any gains and/or losses generated by fund operations.
| | | | | | |
| Net investment income | | | | | | |
Income | | | | | | |
Interest | | $71,223,424 | | | | |
Dividends | | 59,920,545 | | | | |
Dividends from underlying funds | | 200,340 | | | | |
Foreign taxes withheld | | (75,651 | ) | | | |
Total investment income | | | | | $131,268,658 | |
Expenses | | | | | | |
Management fee | | $10,871,801 | | | | |
Distribution and service fees | | 15,806,558 | | | | |
Program manager fees | | 7,305 | | | | |
Shareholder servicing costs | | 6,360,498 | | | | |
Administrative services fee | | 639,503 | | | | |
Independent trustees’ compensation | | 52,458 | | | | |
Custodian fee | | 172,015 | | | | |
Shareholder communications | | 258,215 | | | | |
Auditing fees | | 32,567 | | | | |
Legal fees | | 94,226 | | | | |
Miscellaneous | | 350,480 | | | | |
Total expenses | | | | | $34,645,626 | |
Fees paid indirectly | | (6,288 | ) | | | |
Reduction of expenses by investment adviser | | (15,950 | ) | | | |
Net expenses | | | | | $34,623,388 | |
Net investment income | | | | | $96,645,270 | |
Realized and unrealized gain (loss) on investments
and foreign currency transactions | | | | | | |
Realized gain (loss) (identified cost basis) | | | | | | |
Investment transactions | | $(896,448,222 | ) | | | |
Foreign currency transactions | | (65,352 | ) | | | |
Net realized gain (loss) on investments
and foreign currency transactions | | | | | $(896,513,574 | ) |
Change in unrealized appreciation (depreciation) | | | | | | |
Investments | | $(620,790,113 | ) | | | |
Translation of assets and liabilities in foreign currencies | | 331 | | | | |
Net unrealized gain (loss) on investments
and foreign currency translation | | | | | $(620,789,782 | ) |
Net realized and unrealized gain (loss) on investments
and foreign currency | | | | | $(1,517,303,356 | ) |
Change in net assets from operations | | | | | $(1,420,658,086 | ) |
See Notes to Financial Statements
23
Financial Statements
STATEMENTS OF CHANGES IN NET ASSETS
These statements describe the increases and/or decreases in net assets resulting from operations, any distributions, and any shareholder transactions.
| | | | | | |
| | | Six months ended
3/31/09 | | | Year ended
9/30/08 | |
| Change in net assets | | (unaudited) | | | | |
| From operations | | | | | | |
Net investment income | | $96,645,270 | | | $236,088,053 | |
Net realized gain (loss) on investments and
foreign currency transactions | | (896,513,574 | ) | | 31,623,314 | |
Net unrealized gain (loss) on investments and
foreign currency translation | | (620,789,782 | ) | | (1,545,012,698 | ) |
Change in net assets from operations | | $(1,420,658,086 | ) | | $(1,277,301,331 | ) |
| Distributions declared to shareholders | | | | | | |
From net investment income | | | | | | |
Class A | | $(68,680,521 | ) | | $(168,226,819 | ) |
Class B | | (12,023,474 | ) | | (30,869,961 | ) |
Class C | | (11,094,460 | ) | | (25,701,051 | ) |
Class I | | (2,466,761 | ) | | (7,348,982 | ) |
Class R (b) | | — | | | (742,713 | ) |
Class R1 | | (224,760 | ) | | (464,398 | ) |
Former Class R2 (b) | | — | | | (257,048 | ) |
Class R2 | | (2,177,268 | ) | | (3,958,288 | ) |
Class R3 | | (1,947,687 | ) | | (3,676,156 | ) |
Class R4 | | (3,967,166 | ) | | (6,974,175 | ) |
Class 529A | | (114,986 | ) | | (371,049 | ) |
Class 529B | | (54,720 | ) | | (108,829 | ) |
Class 529C | | (47,819 | ) | | (98,078 | ) |
From net realized gain on investments | | | | | | |
Class A | | — | | | (535,843,118 | ) |
Class B | | — | | | (135,020,654 | ) |
Class C | | — | | | (108,018,631 | ) |
Class I | | — | | | (20,856,322 | ) |
Class R (b) | | — | | | (4,933,773 | ) |
Class R1 | | — | | | (1,749,778 | ) |
Former Class R2 (b) | | — | | | (1,347,623 | ) |
Class R2 | | — | | | (9,123,580 | ) |
Class R3 | | — | | | (10,864,525 | ) |
Class R4 | | — | | | (16,271,373 | ) |
Class 529A | | — | | | (1,163,532 | ) |
Class 529B | | — | | | (474,843 | ) |
Class 529C | | — | | | (420,572 | ) |
Total distributions declared to shareholders | | $(102,799,622 | ) | | $(1,094,885,871 | ) |
24
Statements of Changes in Net Assets – continued
| | | | | | |
| | | Six months ended
3/31/09 | | | Year ended
9/30/08 | |
| | | (unaudited) | | | | |
Change in net assets from fund share transactions | | $(673,149,860 | ) | | $(835,694,125 | ) |
Total change in net assets | | $(2,196,607,568 | ) | | $(3,207,881,327 | ) |
| Net assets | | | | | | |
At beginning of period | | 7,915,452,894 | | | 11,123,334,221 | |
At end of period (including accumulated distributions in excess of net investment income of $6,023,875 and undistributed net investment income of $130,477, respectively) | | $5,718,845,326 | | | $7,915,452,894 | |
| (b) | At the close of business on April 18, 2008, Class R and Class R2 shares converted into Class R3 shares. Following the conversion, Class R3 shares were renamed Class R2 shares. |
See Notes to Financial Statements
25
Financial Statements
FINANCIAL HIGHLIGHTS
The financial highlights table is intended to help you understand the fund’s financial performance for the semiannual period and the past 5 fiscal years (or life of a particular share class, if shorter). Certain information reflects financial results for a single fund share. The total returns in the table represent the rate by which an investor would have earned (or lost) on an investment in the fund share class (assuming reinvestment of all distributions) held for the entire period.
| | | | | | | | | | | | | | | | | | |
| | | Six months
ended
3/31/09 (unaudited) | | | Years ended 9/30 | |
| Class A | | | 2008 | | | 2007 | | | 2006 | | | 2005 | | | 2004 | |
| | | | | | | | | | | | | | | | |
Net asset value, beginning
of period | | $13.17 | | | $16.86 | | | $16.06 | | | $16.11 | | | $15.43 | | | $14.13 | |
Income (loss) from
investment operations | | | | | | | | | | | | | | | | | | |
Net investment income (d) | | $0.18 | | | $0.39 | | | $0.44 | | | $0.40 | | | $0.39 | | | $0.36 | |
Net realized and
unrealized gain (loss)
on investments and
foreign currency | | (2.53 | ) | | (2.36 | ) | | 1.38 | | | 0.68 | | | 1.08 | | | 1.31 | |
Total from
investment operations | | $(2.35 | ) | | $(1.97 | ) | | $1.82 | | | $1.08 | | | $1.47 | | | $1.67 | |
Less distributions declared
to shareholders | | | | | | | | | | | | | | | | | | |
From net
investment income | | $(0.22 | ) | | $(0.41 | ) | | $(0.48 | ) | | $(0.42 | ) | | $(0.40 | ) | | $(0.37 | ) |
From net realized gain
on investments | | — | | | (1.31 | ) | | (0.54 | ) | | (0.71 | ) | | (0.39 | ) | | — | |
Total distributions declared
to shareholders | | $(0.22 | ) | | $(1.72 | ) | | $(1.02 | ) | | $(1.13 | ) | | $(0.79 | ) | | $(0.37 | ) |
Net asset value, end
of period | | $10.60 | | | $13.17 | | | $16.86 | | | $16.06 | | | $16.11 | | | $15.43 | |
Total return (%) (r)(s)(t) | | (18.09 | )(n) | | (12.77 | ) | | 11.65 | | | 7.16 | | | 9.72 | | | 11.89 | (b) |
Ratios (%) (to average
net assets) and
Supplemental data: | | | | | | | | | | | | | | | | | | |
Expenses before expense
reductions (f) | | 0.96 | (a) | | 0.87 | | | 0.87 | | | 0.90 | | | 0.91 | | | 0.89 | |
Expenses after expense
reductions (f) | | 0.96 | (a) | | 0.87 | | | 0.87 | | | 0.90 | | | 0.91 | | | 0.89 | |
Net investment income | | 3.27 | (a) | | 2.62 | | | 2.63 | | | 2.56 | | | 2.43 | | | 2.37 | |
Portfolio turnover | | 36 | | | 53 | | | 45 | | | 48 | | | 50 | | | 65 | |
Net assets at end of period
(000 Omitted) | | $3,655,778 | | | $5,025,291 | | | $7,017,623 | | | $7,157,485 | | | $7,371,678 | | | $6,382,150 | |
See Notes to Financial Statements
26
Financial Highlights – continued
| | | | | | | | | | | | | | | | | | |
| | | Six months
ended
3/31/09 (unaudited) | | | Years ended 9/30 | |
| Class B | | | 2008 | | | 2007 | | | 2006 | | | 2005 | | | 2004 | |
| | | | | | | | | | | | | | | | |
Net asset value, beginning
of period | | $13.17 | | | $16.85 | | | $16.06 | | | $16.10 | | | $15.42 | | | $14.12 | |
Income (loss) from
investment operations | | | | | | | | | | | | | | | | | | |
Net investment income (d) | | $0.14 | | | $0.29 | | | $0.33 | | | $0.30 | | | $0.28 | | | $0.26 | |
Net realized and
unrealized gain (loss)
on investments and
foreign currency | | (2.53 | ) | | (2.35 | ) | | 1.37 | | | 0.69 | | | 1.09 | | | 1.31 | |
Total from
investment operations | | $(2.39 | ) | | $(2.06 | ) | | $1.70 | | | $0.99 | | | $1.37 | | | $1.57 | |
Less distributions declared
to shareholders | | | | | | | | | | | | | | | | | | |
From net
investment income | | $(0.18 | ) | | $(0.31 | ) | | $(0.37 | ) | | $(0.32 | ) | | $(0.30 | ) | | $(0.27 | ) |
From net realized gain
on investments | | — | | | (1.31 | ) | | (0.54 | ) | | (0.71 | ) | | (0.39 | ) | | — | |
Total distributions declared
to shareholders | | $(0.18 | ) | | $(1.62 | ) | | $(0.91 | ) | | $(1.03 | ) | | $(0.69 | ) | | $(0.27 | ) |
Net asset value, end
of period | | $10.60 | | | $13.17 | | | $16.85 | | | $16.06 | | | $16.10 | | | $15.42 | |
Total return (%) (r)(s)(t) | | (18.37 | )(n) | | (13.30 | ) | | 10.87 | | | 6.54 | | | 9.02 | | | 11.18 | (b) |
Ratios (%) (to average
net assets) and
Supplemental data: | | | | | | | | | | | | | | | | | | |
Expenses before expense
reductions (f) | | 1.61 | (a) | | 1.52 | | | 1.52 | | | 1.55 | | | 1.56 | | | 1.54 | |
Expenses after expense
reductions (f) | | 1.60 | (a) | | 1.52 | | | 1.52 | | | 1.55 | | | 1.56 | | | 1.54 | |
Net investment income | | 2.62 | (a) | | 1.96 | | | 1.98 | | | 1.91 | | | 1.79 | | | 1.73 | |
Portfolio turnover | | 36 | | | 53 | | | 45 | | | 48 | | | 50 | | | 65 | |
Net assets at end of period
(000 Omitted) | | $749,043 | | | $1,148,445 | | | $1,844,219 | | | $2,245,907 | | | $2,745,051 | | | $2,762,027 | |
See Notes to Financial Statements
27
Financial Highlights – continued
| | | | | | | | | | | | | | | | | | |
| | | Six months
ended
3/31/09 (unaudited) | | | Years ended 9/30 | |
| Class C | | | 2008 | | | 2007 | | | 2006 | | | 2005 | | | 2004 | |
| | | | | | | | | | | | | | | | |
Net asset value, beginning
of period | | $13.23 | | | $16.92 | | | $16.12 | | | $16.16 | | | $15.48 | | | $14.18 | |
Income (loss) from
investment operations | | | | | | | | | | | | | | | | | | |
Net investment income (d) | | $0.14 | | | $0.29 | | | $0.33 | | | $0.30 | | | $0.28 | | | $0.26 | |
Net realized and
unrealized gain (loss)
on investments and
foreign currency | | (2.54 | ) | | (2.36 | ) | | 1.38 | | | 0.69 | | | 1.09 | | | 1.31 | |
Total from
investment operations | | $(2.40 | ) | | $(2.07 | ) | | $1.71 | | | $0.99 | | | $1.37 | | | $1.57 | |
Less distributions declared
to shareholders | | | | | | | | | | | | | | | | | | |
From net
investment income | | $(0.18 | ) | | $(0.31 | ) | | $(0.37 | ) | | $(0.32 | ) | | $(0.30 | ) | | $(0.27 | ) |
From net realized gain
on investments | | — | | | (1.31 | ) | | (0.54 | ) | | (0.71 | ) | | (0.39 | ) | | — | |
Total distributions declared
to shareholders | | $(0.18 | ) | | $(1.62 | ) | | $(0.91 | ) | | $(1.03 | ) | | $(0.69 | ) | | $(0.27 | ) |
Net asset value, end
of period | | $10.65 | | | $13.23 | | | $16.92 | | | $16.12 | | | $16.16 | | | $15.48 | |
Total return (%) (r)(s)(t) | | (18.35 | )(n) | | (13.30 | ) | | 10.90 | | | 6.52 | | | 8.99 | | | 11.14 | (b) |
Ratios (%) (to average
net assets) and
Supplemental data: | | | | | | | | | | | | | | | | | | |
Expenses before expense
reductions (f) | | 1.61 | (a) | | 1.52 | | | 1.52 | | | 1.55 | | | 1.56 | | | 1.53 | |
Expenses after expense
reductions (f) | | 1.60 | (a) | | 1.52 | | | 1.52 | | | 1.55 | | | 1.56 | | | 1.53 | |
Net investment income | | 2.62 | (a) | | 1.97 | | | 1.98 | | | 1.91 | | | 1.78 | | | 1.71 | |
Portfolio turnover | | 36 | | | 53 | | | 45 | | | 48 | | | 50 | | | 65 | |
Net assets at end of period
(000 Omitted) | | $724,915 | | | $1,014,651 | | | $1,424,639 | | | $1,488,592 | | | $1,689,457 | | | $1,381,236 | |
See Notes to Financial Statements
28
Financial Highlights – continued
| | | | | | | | | | | | | | | | | | |
| | | Six months
ended
3/31/09 (unaudited) | | | Years ended 9/30 | |
| Class I | | | 2008 | | | 2007 | | | 2006 | | | 2005 | | | 2004 | |
| | | | | | | | | | | | | | | | |
Net asset value, beginning
of period | | $13.17 | | | $16.85 | | | $16.06 | | | $16.11 | | | $15.42 | | | $14.12 | |
Income (loss) from
investment operations | | | | | | | | | | | | | | | | | | |
Net investment income (d) | | $0.20 | | | $0.44 | | | $0.50 | | | $0.45 | | | $0.44 | | | $0.43 | |
Net realized and
unrealized gain (loss)
on investments and
foreign currency | | (2.52 | ) | | (2.35 | ) | | 1.37 | | | 0.69 | | | 1.09 | | | 1.29 | |
Total from
investment operations | | $(2.32 | ) | | $(1.91 | ) | | $1.87 | | | $1.14 | | | $1.53 | | | $1.72 | |
Less distributions declared
to shareholders | | | | | | | | | | | | | | | | | | |
From net
investment income | | $(0.25 | ) | | $(0.46 | ) | | $(0.54 | ) | | $(0.48 | ) | | $(0.45 | ) | | $(0.42 | ) |
From net realized gain
on investments | | — | | | (1.31 | ) | | (0.54 | ) | | (0.71 | ) | | (0.39 | ) | | — | |
Total distributions declared
to shareholders | | $(0.25 | ) | | $(1.77 | ) | | $(1.08 | ) | | $(1.19 | ) | | $(0.84 | ) | | $(0.42 | ) |
Net asset value, end
of period | | $10.60 | | | $13.17 | | | $16.85 | | | $16.06 | | | $16.11 | | | $15.42 | |
Total return (%) (r)(s) | | (17.95 | )(n) | | (12.40 | ) | | 11.98 | | | 7.54 | | | 10.18 | | | 12.28 | (b) |
Ratios (%) (to average
net assets) and
Supplemental data: | | | | | | | | | | | | | | | | | | |
Expenses before expense
reductions (f) | | 0.61 | (a) | | 0.52 | | | 0.52 | | | 0.55 | | | 0.56 | | | 0.55 | |
Expenses after expense
reductions (f) | | 0.60 | (a) | | 0.52 | | | 0.52 | | | 0.55 | | | 0.56 | | | 0.55 | |
Net investment income | | 3.62 | (a) | | 2.97 | | | 2.98 | | | 2.91 | | | 2.78 | | | 2.78 | |
Portfolio turnover | | 36 | | | 53 | | | 45 | | | 48 | | | 50 | | | 65 | |
Net assets at end of period
(000 Omitted) | | $125,215 | | | $155,134 | | | $269,510 | | | $242,806 | | | $211,140 | | | $181,794 | |
See Notes to Financial Statements
29
Financial Highlights – continued
| | | | | | | | | | | | | | | |
| | | Six months
ended
3/31/09 (unaudited) | | | Years ended 9/30 | |
| Class R1 | | | 2008 | | | 2007 | | | 2006 | | | 2005 (i) | |
| | | | | | | | | | | | | |
Net asset value, beginning of period | | $13.16 | | | $16.84 | | | $16.06 | | | $16.10 | | | $15.77 | |
Income (loss) from
investment operations | | | | | | | | | | | | | | | |
Net investment income (d) | | $0.14 | | | $0.29 | | | $0.30 | | | $0.28 | | | $0.12 | |
Net realized and unrealized gain (loss)
on investments and foreign currency | | (2.53 | ) | | (2.35 | ) | | 1.38 | | | 0.70 | | | 0.33 | |
Total from investment operations | | $(2.39 | ) | | $(2.06 | ) | | $1.68 | | | $0.98 | | | $0.45 | |
Less distributions declared
to shareholders | | | | | | | | | | | | | | | |
From net investment income | | $(0.18 | ) | | $(0.31 | ) | | $(0.36 | ) | | $(0.31 | ) | | $(0.12 | ) |
From net realized gain on investments | | — | | | (1.31 | ) | | (0.54 | ) | | (0.71 | ) | | — | |
Total distributions declared
to shareholders | | $(0.18 | ) | | $(1.62 | ) | | $(0.90 | ) | | $(1.02 | ) | | $(0.12 | ) |
Net asset value, end of period | | $10.59 | | | $13.16 | | | $16.84 | | | $16.06 | | | $16.10 | |
Total return (%) (r)(s) | | (18.37 | )(n) | | (13.32 | ) | | 10.75 | | | 6.43 | | | 2.85 | (n) |
Ratios (%) (to average net assets)
and Supplemental data: | | | | | | | | | | | | | | | |
Expenses before expense reductions (f) | | 1.61 | (a) | | 1.56 | | | 1.66 | | | 1.74 | | | 1.77 | (a) |
Expenses after expense reductions (f) | | 1.61 | (a) | | 1.56 | | | 1.62 | | | 1.64 | | | 1.77 | (a) |
Net investment income | | 2.62 | (a) | | 1.93 | | | 1.83 | | | 1.83 | | | 1.43 | (a) |
Portfolio turnover | | 36 | | | 53 | | | 45 | | | 48 | | | 50 | |
Net assets at end of period (000 Omitted) | | $14,704 | | | $19,505 | | | $16,936 | | | $5,289 | | | $1,901 | |
See Notes to Financial Statements
30
Financial Highlights – continued
| | | | | | | | | | | | | | | | | | |
| | | Six months
ended
3/31/09 (unaudited) | | | Years ended 9/30 | |
| Class R2 | | | 2008 | | | 2007 | | | 2006 | | | 2005 | | | 2004 (i) | |
| | | | | | | | | | | | | | | | |
Net asset value, beginning
of period | | $13.20 | | | $16.89 | | | $16.10 | | | $16.14 | | | $15.46 | | | $14.38 | |
Income (loss) from
investment operations | | | | | | | | | | | | | | | | | | |
Net investment income (d) | | $0.17 | | | $0.36 | | | $0.38 | | | $0.36 | | | $0.31 | | | $0.23 | |
Net realized and
unrealized gain (loss)
on investments and
foreign currency | | (2.53 | ) | | (2.36 | ) | | 1.38 | | | 0.69 | | | 1.10 | | | 1.13 | |
Total from
investment operations | | $(2.36 | ) | | $(2.00 | ) | | $1.76 | | | $1.05 | | | $1.41 | | | $1.36 | |
Less distributions declared
to shareholders | | | | | | | | | | | | | | | | | | |
From net
investment income | | $(0.21 | ) | | $(0.38 | ) | | $(0.43 | ) | | $(0.38 | ) | | $(0.34 | ) | | $(0.28 | ) |
From net realized gain
on investments | | — | | | (1.31 | ) | | (0.54 | ) | | (0.71 | ) | | (0.39 | ) | | — | |
Total distributions declared
to shareholders | | $(0.21 | ) | | $(1.69 | ) | | $(0.97 | ) | | $(1.09 | ) | | $(0.73 | ) | | $(0.28 | ) |
Net asset value, end
of period | | $10.63 | | | $13.20 | | | $16.89 | | | $16.10 | | | $16.14 | | | $15.46 | |
Total return (%) (r)(s) | | (18.11 | )(n) | | (12.90 | ) | | 11.25 | | | 6.90 | | | 9.27 | | | 9.53 | (b)(n) |
Ratios (%) (to average
net assets) and
Supplemental data: | | | | | | | | | | | | | | | | | | |
Expenses before expense
reductions (f) | | 1.11 | (a) | | 1.05 | | | 1.22 | | | 1.29 | | | 1.31 | | | 1.26 | (a) |
Expenses after expense
reductions (f) | | 1.10 | (a) | | 1.05 | | | 1.17 | | | 1.19 | | | 1.31 | | | 1.26 | (a) |
Net investment income | | 3.12 | (a) | | 2.45 | | | 2.30 | | | 2.28 | | | 1.95 | | | 1.53 | (a) |
Portfolio turnover | | 36 | | | 53 | | | 45 | | | 48 | | | 50 | | | 65 | |
Net assets at end of period
(000 Omitted) | | $122,797 | | | $166,407 | | | $102,667 | | | $51,797 | | | $26,576 | | | $3,894 | |
See Notes to Financial Statements
31
Financial Highlights – continued
| | | | | | | | | | | | | | | |
| | | Six months
ended
3/31/09 (unaudited) | | | Years ended 9/30 | |
| Class R3 | | | 2008 | | | 2007 | | | 2006 | | | 2005 (i) | |
| | | | | | | | | | | | | |
Net asset value, beginning of period | | $13.18 | | | $16.86 | | | $16.07 | | | $16.11 | | | $15.78 | |
Income (loss) from
investment operations | | | | | | | | | | | | | | | |
Net investment income (d) | | $0.18 | | | $0.40 | | | $0.42 | | | $0.39 | | | $0.17 | |
Net realized and unrealized gain (loss)
on investments and foreign currency | | (2.52 | ) | | (2.35 | ) | | 1.38 | | | 0.70 | | | 0.34 | |
Total from investment operations | | $(2.34 | ) | | $(1.95 | ) | | $1.80 | | | $1.09 | | | $0.51 | |
| Less distributions declared to shareholders | | | | | | | | | | | | | | | |
From net investment income | | $(0.23 | ) | | $(0.42 | ) | | $(0.47 | ) | | $(0.42 | ) | | $(0.18 | ) |
From net realized gain on investments | | — | | | (1.31 | ) | | (0.54 | ) | | (0.71 | ) | | — | |
Total distributions declared
to shareholders | | $(0.23 | ) | | $(1.73 | ) | | $(1.01 | ) | | $(1.13 | ) | | $(0.18 | ) |
Net asset value, end of period | | $10.61 | | | $13.18 | | | $16.86 | | | $16.07 | | | $16.11 | |
Total return (%) (r)(s) | | (18.04 | )(n) | | (12.65 | ) | | 11.54 | | | 7.17 | | | 3.26 | (n) |
Ratios (%) (to average net assets)
and Supplemental data: | | | | | | | | | | | | | | | |
Expenses before expense reductions (f) | | 0.86 | (a) | | 0.81 | | | 0.92 | | | 0.94 | | | 0.96 | (a) |
Expenses after expense reductions (f) | | 0.86 | (a) | | 0.81 | | | 0.92 | | | 0.94 | | | 0.96 | (a) |
Net investment income | | 3.32 | (a) | | 2.68 | | | 2.54 | | | 2.55 | | | 2.22 | (a) |
Portfolio turnover | | 36 | | | 53 | | | 45 | | | 48 | | | 50 | |
Net assets at end of period (000 Omitted) | | $113,560 | | | $106,360 | | | $133,204 | | | $57,485 | | | $2,134 | |
See Notes to Financial Statements
32
Financial Highlights – continued
| | | | | | | | | | | | | | | |
| | | Six months
ended
3/31/09 (unaudited) | | | Years ended 9/30 | |
| Class R4 | | | 2008 | | | 2007 | | | 2006 | | | 2005 (i) | |
| | | | | | | | | | | | | |
Net asset value, beginning of period | | $13.18 | | | $16.86 | | | $16.06 | | | $16.11 | | | $15.78 | |
Income (loss) from
investment operations | | | | | | | | | | | | | | | |
Net investment income (d) | | $0.20 | | | $0.43 | | | $0.50 | | | $0.45 | | | $0.21 | |
Net realized and unrealized gain (loss)
on investments and foreign currency | | (2.52 | ) | | (2.34 | ) | | 1.36 | | | 0.67 | | | 0.33 | |
Total from investment operations | | $(2.32 | ) | | $(1.91 | ) | | $1.86 | | | $1.12 | | | $0.54 | |
Less distributions declared
to shareholders | | | | | | | | | | | | | | | |
From net investment income | | $(0.25 | ) | | $(0.46 | ) | | $(0.52 | ) | | $(0.46 | ) | | $(0.21 | ) |
From net realized gain on investments | | — | | | (1.31 | ) | | (0.54 | ) | | (0.71 | ) | | — | |
Total distributions declared
to shareholders | | $(0.25 | ) | | $(1.77 | ) | | $(1.06 | ) | | $(1.17 | ) | | $(0.21 | ) |
Net asset value, end of period | | $10.61 | | | $13.18 | | | $16.86 | | | $16.06 | | | $16.11 | |
Total return (%) (r)(s) | | (17.93 | )(n) | | (12.42 | ) | | 11.93 | | | 7.43 | | | 3.41 | (n) |
Ratios (%) (to average net assets)
and Supplemental data: | | | | | | | | | | | | | | | |
Expenses before expense reductions (f) | | 0.61 | (a) | | 0.54 | | | 0.63 | | | 0.65 | | | 0.67 | (a) |
Expenses after expense reductions (f) | | 0.60 | (a) | | 0.54 | | | 0.63 | | | 0.64 | | | 0.67 | (a) |
Net investment income | | 3.61 | (a) | | 2.94 | | | 2.85 | | | 2.80 | | | 2.65 | (a) |
Portfolio turnover | | 36 | | | 53 | | | 45 | | | 48 | | | 50 | |
Net assets at end of period (000 Omitted) | | $198,987 | | | $257,120 | | | $202,523 | | | $10,122 | | | $52 | |
See Notes to Financial Statements
33
Financial Highlights – continued
| | | | | | | | | | | | | | | | | | |
| | | Six months
ended
3/31/09 (unaudited) | | | Years ended 9/30 | |
| Class 529A | | | 2008 | | | 2007 | | | 2006 | | | 2005 | | | 2004 | |
| | | | | | | | | | | | | | | | |
Net asset value, beginning
of period | | $13.15 | | | $16.83 | | | $16.04 | | | $16.08 | | | $15.40 | | | $14.10 | |
Income (loss) from
investment operations | | | | | | | | | | | | | | | | | | |
Net investment income (d) | | $0.18 | | | $0.36 | | | $0.39 | | | $0.36 | | | $0.35 | | | $0.31 | |
Net realized and
unrealized gain (loss)
on investments and
foreign currency | | (2.53 | ) | | (2.35 | ) | | 1.38 | | | 0.69 | | | 1.08 | | | 1.32 | |
Total from
investment operations | | $(2.35 | ) | | $(1.99 | ) | | $1.77 | | | $1.05 | | | $1.43 | | | $1.63 | |
Less distributions declared
to shareholders | | | | | | | | | | | | | | | | | | |
From net
investment income | | $(0.22 | ) | | $(0.38 | ) | | $(0.44 | ) | | $(0.38 | ) | | $(0.36 | ) | | $(0.33 | ) |
From net realized gain
on investments | | — | | | (1.31 | ) | | (0.54 | ) | | (0.71 | ) | | (0.39 | ) | | — | |
Total distributions declared
to shareholders | | $(0.22 | ) | | $(1.69 | ) | | $(0.98 | ) | | $(1.09 | ) | | $(0.75 | ) | | $(0.33 | ) |
Net asset value, end
of period | | $10.58 | | | $13.15 | | | $16.83 | | | $16.04 | | | $16.08 | | | $15.40 | |
Total return (%) (r)(s)(t) | | (18.17 | )(n) | | (12.88 | ) | | 11.34 | | | 6.97 | | | 9.46 | | | 11.63 | (b) |
Ratios (%) (to average
net assets) and
Supplemental data: | | | | | | | | | | | | | | | | | | |
Expenses before expense
reductions (f) | | 1.05 | (a) | | 1.05 | | | 1.12 | | | 1.15 | | | 1.16 | | | 1.13 | |
Expenses after expense
reductions (f) | | 1.05 | (a) | | 1.05 | | | 1.12 | | | 1.14 | | | 1.16 | | | 1.13 | |
Net investment income | | 3.19 | (a) | | 2.44 | | | 2.37 | | | 2.32 | | | 2.16 | | | 2.08 | |
Portfolio turnover | | 36 | | | 53 | | | 45 | | | 48 | | | 50 | | | 65 | |
Net assets at end of period
(000 Omitted) | | $6,697 | | | $13,149 | | | $14,753 | | | $12,360 | | | $9,923 | | | $5,600 | |
See Notes to Financial Statements
34
Financial Highlights – continued
| | | | | | | | | | | | | | | | | | |
| | | Six months
ended
3/31/09 (unaudited) | | | Years ended 9/30 | |
| Class 529B | | | 2008 | | | 2007 | | | 2006 | | | 2005 | | | 2004 | |
| | | | | | | | | | | | | | | | |
Net asset value, beginning
of period | | $13.17 | | | $16.85 | | | $16.06 | | | $16.11 | | | $15.42 | | | $14.12 | |
Income (loss) from
investment operations | | | | | | | | | | | | | | | | | | |
Net investment income (d) | | $0.14 | | | $0.27 | | | $0.29 | | | $0.26 | | | $0.24 | | | $0.22 | |
Net realized and
unrealized gain (loss)
on investments and
foreign currency | | (2.54 | ) | | (2.35 | ) | | 1.37 | | | 0.68 | | | 1.10 | | | 1.31 | |
Total from
investment operations | | $(2.40 | ) | | $(2.08 | ) | | $1.66 | | | $0.94 | | | $1.34 | | | $1.53 | |
Less distributions declared
to shareholders | | | | | | | | | | | | | | | | | | |
From net
investment income | | $(0.17 | ) | | $(0.29 | ) | | $(0.33 | ) | | $(0.28 | ) | | $(0.26 | ) | | $(0.23 | ) |
From net realized gain
on investments | | — | | | (1.31 | ) | | (0.54 | ) | | (0.71 | ) | | (0.39 | ) | | — | |
Total distributions declared
to shareholders | | $(0.17 | ) | | $(1.60 | ) | | $(0.87 | ) | | $(0.99 | ) | | $(0.65 | ) | | $(0.23 | ) |
Net asset value, end
of period | | $10.60 | | | $13.17 | | | $16.85 | | | $16.06 | | | $16.11 | | | $15.42 | |
Total return (%) (r)(s)(t) | | (18.40 | )(n) | | (13.44 | ) | | 10.61 | | | 6.21 | | | 8.81 | | | 10.91 | (b) |
Ratios (%) (to average
net assets) and
Supplemental data: | | | | | | | | | | | | | | | | | | |
Expenses before expense
reductions (f) | | 1.71 | (a) | | 1.70 | | | 1.77 | | | 1.80 | | | 1.81 | | | 1.78 | |
Expenses after expense
reductions (f) | | 1.70 | (a) | | 1.70 | | | 1.77 | | | 1.79 | | | 1.81 | | | 1.78 | |
Net investment income | | 2.52 | (a) | | 1.79 | | | 1.72 | | | 1.67 | | | 1.52 | | | 1.47 | |
Portfolio turnover | | 36 | | | 53 | | | 45 | | | 48 | | | 50 | | | 65 | |
Net assets at end of period
(000 Omitted) | | $3,796 | | | $5,018 | | | $5,809 | | | $5,069 | | | $4,477 | | | $2,676 | |
See Notes to Financial Statements
35
Financial Highlights – continued
| | | | | | | | | | | | | | | | | | |
| | | Six months
ended
3/31/09 (unaudited) | | | Years ended 9/30 | |
| Class 529C | | | 2008 | | | 2007 | | | 2006 | | | 2005 | | | 2004 | |
| | | | | | | | | | | | | | | | |
Net asset value, beginning
of period | | $13.23 | | | $16.92 | | | $16.12 | | | $16.17 | | | $15.48 | | | $14.18 | |
Income (loss) from
investment operations | | | | | | | | | | | | | | | | | | |
Net investment income (d) | | $0.14 | | | $0.27 | | | $0.29 | | | $0.26 | | | $0.24 | | | $0.22 | |
Net realized and
unrealized gain (loss)
on investments and
foreign currency | | (2.55 | ) | | (2.36 | ) | | 1.38 | | | 0.68 | | | 1.10 | | | 1.31 | |
Total from
investment operations | | $(2.41 | ) | | $(2.09 | ) | | $1.67 | | | $0.94 | | | $1.34 | | | $1.53 | |
Less distributions declared
to shareholders | | | | | | | | | | | | | | | | | | |
From net
investment income | | $(0.17 | ) | | $(0.29 | ) | | $(0.33 | ) | | $(0.28 | ) | | $(0.26 | ) | | $(0.23 | ) |
From net realized gain
on investments | | — | | | (1.31 | ) | | (0.54 | ) | | (0.71 | ) | | (0.39 | ) | | — | |
Total distributions declared
to shareholders | | $(0.17 | ) | | $(1.60 | ) | | $(0.87 | ) | | $(0.99 | ) | | $(0.65 | ) | | $(0.23 | ) |
Net asset value, end
of period | | $10.65 | | | $13.23 | | | $16.92 | | | $16.12 | | | $16.17 | | | $15.48 | |
Total return (%) (r)(s)(t) | | (18.39 | )(n) | | (13.45 | ) | | 10.63 | | | 6.18 | | | 8.79 | | | 10.87 | (b) |
Ratios (%) (to average
net assets) and
Supplemental data: | | | | | | | | | | | | | | | | | | |
Expenses before expense
reductions (f) | | 1.71 | (a) | | 1.70 | | | 1.77 | | | 1.80 | | | 1.81 | | | 1.78 | |
Expenses after expense
reductions (f) | | 1.70 | (a) | | 1.70 | | | 1.77 | | | 1.79 | | | 1.81 | | | 1.78 | |
Net investment income | | 2.52 | (a) | | 1.79 | | | 1.72 | | | 1.67 | | | 1.53 | | | 1.45 | |
Portfolio turnover | | 36 | | | 53 | | | 45 | | | 48 | | | 50 | | | 65 | |
Net assets at end of period
(000 Omitted) | | $3,354 | | | $4,372 | | | $5,342 | | | $4,566 | | | $3,890 | | | $2,475 | |
See Notes to Financial Statements
36
Financial Highlights – continued
Any redemption fees charged by the fund during the 2004 and 2005 fiscal years resulted in a per share impact of less than $0.01.
| (b) | The fund’s net asset value and total return calculation include a non-recurring accrual recorded as a result of an administrative proceeding regarding disclosure of brokerage allocation practices in connection with fund sales. The non-recurring accrual did not have a material impact on the net asset value per share based on the shares outstanding on the day the accrual was recorded. |
| (d) | Per share data is based on average shares outstanding. |
| (f) | Ratios do not reflect reductions from fees paid indirectly, if applicable. |
| (i) | For the period from the class’ inception, October 31, 2003 (Class R2) and April 1, 2005 (Classes R1, R3, and R4) through the stated period end. |
| (r) | Certain expenses have been reduced without which performance would have been lower. |
| (s) | From time to time the fund may receive proceeds from litigation settlements, without which performance would be lower. |
| (t) | Total returns do not include any applicable sales charges. |
See Notes to Financial Statements
37
NOTES TO FINANCIAL STATEMENTS
(unaudited)
| (1) | | Business and Organization |
MFS Total Return Fund (the fund) is a series of MFS Series Trust V (the trust). The trust is organized as a Massachusetts business trust and is registered under the Investment Company Act of 1940, as amended, as an open-end management investment company.
| (2) | | Significant Accounting Policies |
General – The preparation of financial statements in conformity with U.S. generally accepted accounting principles requires management to make estimates and assumptions that affect the reported amounts of assets and liabilities, and disclosure of contingent assets and liabilities at the date of the financial statements and the reported amounts of revenues and expenses during the reporting period. Actual results could differ from those estimates. The fund can invest in foreign securities, including securities of emerging market issuers. Investments in foreign securities are vulnerable to the effects of changes in the relative values of the local currency and the U.S. dollar and to the effects of changes in each country’s legal, political, and economic environment. The markets of emerging markets countries are generally more volatile than the markets of developed countries with more mature economies. All of the risks of investing in foreign securities previously described are heightened when investing in emerging markets countries.
In March 2008, FASB Statement No. 161, Disclosures about Derivative Instruments and Hedging Activities (the “Standard”) was issued, and is effective for financial statements issued for fiscal years and interim periods beginning after November 15, 2008. This Standard provides enhanced disclosures about the fund’s use of and accounting for derivative instruments and the effect of derivative instruments on the fund’s results of operations and financial position. Management is evaluating the application of the Standard to the fund, and believes the impact resulting from the adoption of this Standard will be limited to expanded disclosure in the funds’ financial statements.
FASB Staff Position (FSP) 133-1 was implemented during the period. FSP 133-1 amends FAS 133 to require sellers of credit derivatives to make disclosures that will enable financial statement users to assess the potential effects of those credit derivatives on an entity’s financial position, financial performance and cash flows. There was no impact from implementing FSP 133-1 as the fund did not hold any of these credit derivatives at period end.
Investment Valuations – Equity securities, including restricted equity securities, are generally valued at the last sale or official closing price as provided by a third-party pricing service on the market or exchange on which
38
Notes to Financial Statements (unaudited) – continued
they are primarily traded. For securities for which there were no sales reported that day, equity securities are generally valued at the last quoted daily bid quotation as provided by a third-party pricing service on the market or exchange on which such securities are primarily traded. For securities held short for which there were no sales reported for that day, the position is generally valued at the last quoted daily ask quotation as provided by a third-party pricing service on the market or exchange on which such securities are primarily traded. Debt instruments and floating rate loans (other than short-term instruments), including restricted debt instruments, are generally valued at an evaluated or composite bid as provided by a third-party pricing service. Short-term instruments with a maturity at issuance of 60 days or less generally are valued at amortized cost, which approximates market value. Open-end investment companies are generally valued at net asset value per share. Securities and other assets generally valued on the basis of information from a third-party pricing service may also be valued at a broker/dealer bid quotation. Values obtained from pricing services can utilize both dealer-supplied valuations and electronic data processing techniques, which take into account factors such as institutional-size trading in similar groups of securities, yield, quality, coupon rate, maturity, type of issue, trading characteristics, and other market data. The values of foreign securities and other assets and liabilities expressed in foreign currencies are converted to U.S. dollars using the mean of bid and asked prices for rates provided by a third-party pricing service.
The Board of Trustees has delegated primary responsibility for determining or causing to be determined the value of the fund’s investments (including any fair valuation) to the adviser pursuant to valuation policies and procedures approved by the Board. If the adviser determines that reliable market quotations are not readily available, investments are valued at fair value as determined in good faith by the adviser in accordance with such procedures under the oversight of the Board of Trustees. Under the fund’s valuation policies and procedures, market quotations are not considered to be readily available for most types of debt instruments and floating rate loans and many types of derivatives. These investments are generally valued at fair value based on information from third-party pricing services. In addition, investments may be valued at fair value if the adviser determines that an investment’s value has been materially affected by events occurring after the close of the exchange or market on which the investment is principally traded (such as foreign exchange or market) and prior to the determination of the fund’s net asset value, or after the halting of trading of a specific security where trading does not resume prior to the close of the exchange or market on which the security is principally traded. Events that occur on a frequent basis after foreign markets close (such as developments in foreign markets and significant movements in the U.S. markets) and prior to the determination of the fund’s net asset value may be deemed to have a material affect on the value of
39
Notes to Financial Statements (unaudited) – continued
securities traded in foreign markets. Accordingly, the fund’s foreign equity securities may often be valued at fair value. The adviser generally relies on third-party pricing services or other information (such as the correlation with price movements of similar securities in the same or other markets; the type, cost and investment characteristics of the security; the business and financial condition of the issuer; and trading and other market data) to assist in determining whether to fair value and at what value to fair value an investment. The value of an investment for purposes of calculating the fund’s net asset value can differ depending on the source and method used to determine value. When fair valuation is used, the value of an investment used to determine the fund’s net asset value may differ from quoted or published prices for the same investment. There can be no assurance that the fund could obtain the fair value assigned to an investment if it were to sell the investment at the same time at which the fund determines its net asset value per share.
The fund adopted FASB Statement No. 157, Fair Value Measurements (the “Statement”). This Statement provides a single definition of fair value, a hierarchy for measuring fair value and expanded disclosures about fair value measurements.
Various inputs are used in determining the value of the fund’s assets or liabilities carried at market value. These inputs are categorized into three broad levels. Level 1 includes quoted prices in active markets for identical assets or liabilities. Level 2 includes other significant observable market-based inputs (including quoted prices for similar securities, interest rates, prepayment speed, and credit risk). Level 3 includes unobservable inputs, which may include the adviser’s own assumptions in determining the fair value of investments. Other financial instruments are derivative instruments not reflected in total investments, such as futures, forwards, swap contracts and written options. The following is a summary of the levels used as of March 31, 2009 in valuing the fund’s assets or liabilities carried at market value:
| | | | | | | | |
| | | Level 1 | | Level 2 | | Level 3 | | Total |
| Investments in Securities | | $3,435,588,023 | | $2,235,281,838 | | $— | | $5,670,869,861 |
| Other Financial Instruments | | $— | | $— | | $— | | $— |
Repurchase Agreements – The fund may enter into repurchase agreements with approved counterparties. Each repurchase agreement is recorded at cost. The fund requires that the securities collateral in a repurchase transaction be transferred to a custodian. The fund monitors, on a daily basis, the value of the collateral to ensure that its value, including accrued interest, is greater than amounts owed to the fund under each such repurchase agreement.
Foreign Currency Translation – Purchases and sales of foreign investments, income, and expenses are converted into U.S. dollars based upon currency exchange rates prevailing on the respective dates of such transactions or on the
40
Notes to Financial Statements (unaudited) – continued
reporting date for foreign denominated receivables and payables. Gains and losses attributable to foreign currency exchange rates on sales of securities are recorded for financial statement purposes as net realized gains and losses on investments. Gains and losses attributable to foreign exchange rate movements on receivables, payables, income and expenses are recorded for financial statement purposes as foreign currency transaction gains and losses. That portion of both realized and unrealized gains and losses on investments that results from fluctuations in foreign currency exchange rates is not separately disclosed.
Security Loans – JPMorgan Chase and Co. (“Chase”), as lending agent, may loan the securities of the fund to certain qualified institutions (the “Borrowers”) approved by the fund. The loans are collateralized by cash and/or U.S. Treasury and federal agency obligations in an amount typically at least equal to the market value of the securities loaned. The market value of the loaned securities is determined at the close of business of the fund and any additional required collateral is delivered to the fund on the next business day. Security lending activity through Chase is further collateralized by an irrevocable standby letter of credit. Chase provides the fund with indemnification against Borrower default. The fund bears the risk of loss with respect to the investment of cash collateral. On loans collateralized by cash, the cash collateral is invested in short-term securities. A portion of the income generated upon investment of the collateral is remitted to the Borrowers, and the remainder is allocated between the fund and the lending agent. On loans collateralized by U.S. Treasury and/or federal agency obligations, a fee is received from the Borrower, and is allocated between the fund and the lending agent. Income from securities lending is included in interest income on the Statement of Operations. The dividend and interest income earned on the securities loaned is accounted for in the same manner as other dividend and interest income.
Indemnifications – Under the fund’s organizational documents, its officers and trustees may be indemnified against certain liabilities and expenses arising out of the performance of their duties to the fund. Additionally, in the normal course of business, the fund enters into agreements with service providers that may contain indemnification clauses. The fund’s maximum exposure under these agreements is unknown as this would involve future claims that may be made against the fund that have not yet occurred.
Investment Transactions and Income – Investment transactions are recorded on the trade date. Interest income is recorded on the accrual basis. All premium and discount is amortized or accreted for financial statement purposes in accordance with U.S. generally accepted accounting principles. Dividends received in cash are recorded on the ex-dividend date. Certain
41
Notes to Financial Statements (unaudited) – continued
dividends from foreign securities will be recorded when the fund is informed of the dividend if such information is obtained subsequent to the ex-dividend date. Dividend and interest payments received in additional securities are recorded on the ex-dividend or ex-interest date in an amount equal to the value of the security on such date.
The fund may receive proceeds from litigation settlements. Any proceeds received from litigation involving portfolio holdings are reflected in the Statement of Operations in realized gain/loss if the security has been disposed of by the fund or in unrealized gain/loss if the security is still held by the fund. Any other proceeds from litigation not related to portfolio holdings are reflected as other income in the Statement of Operations.
Fees Paid Indirectly – The fund’s custody fee may be reduced according to an arrangement that measures the value of cash deposited with the custodian by the fund. This amount, for the six months ended March 31, 2009, is shown as a reduction of total expenses on the Statement of Operations.
Tax Matters and Distributions – The fund intends to qualify as a regulated investment company, as defined under Subchapter M of the Internal Revenue Code, and to distribute all of its taxable income, including realized capital gains. As a result, no provision for federal income tax is required. The fund’s federal tax returns for the prior three fiscal years remain subject to examination by the Internal Revenue Service. Foreign taxes, if any, have been accrued by the fund in the accompanying financial statements.
Distributions to shareholders are recorded on the ex-dividend date. Income and capital gain distributions are determined in accordance with income tax regulations, which may differ from U.S. generally accepted accounting principles. Certain capital accounts in the financial statements are periodically adjusted for permanent differences in order to reflect their tax character. These adjustments have no impact on net assets or net asset value per share. Temporary differences which arise from recognizing certain items of income, expense, gain or loss in different periods for financial statement and tax purposes will reverse at some time in the future. Distributions in excess of net investment income or net realized gains are temporary overdistributions for financial statement purposes resulting from differences in the recognition or classification of income or distributions for financial statement and tax purposes.
Book/tax differences primarily relate to amortization and accretion of debt securities, wash sale loss deferrals, and treating a portion of the proceeds from redemptions as a distribution for tax purposes.
42
Notes to Financial Statements (unaudited) – continued
The tax character of distributions made during the current period will be determined at fiscal year end. The tax character of distributions declared to shareholders for the last fiscal year is as follows:
| | |
| | | 9/30/08 |
Ordinary income (including any
short-term capital gains) | | $358,695,276 |
| Long-term capital gain | | 736,190,595 |
| Total distributions | | $1,094,885,871 |
The federal tax cost and the tax basis components of distributable earnings were as follows:
| | | |
| As of 3/31/09 | | | |
| Cost of investments | | $6,673,712,915 | |
| Gross appreciation | | 49,709,990 | |
| Gross depreciation | | (1,052,553,044 | ) |
| Net unrealized appreciation (depreciation) | | $(1,002,843,054 | ) |
| |
| As of 9/30/08 | | | |
| Undistributed ordinary income | | 18,485,724 | |
| Post-October capital loss deferral | | (58,633,611 | ) |
| Other temporary differences | | (21,425,609 | ) |
| Net unrealized appreciation (depreciation) | | (395,068,492 | ) |
The aggregate cost above includes prior fiscal year end tax adjustments.
Multiple Classes of Shares of Beneficial Interest – The fund offers multiple classes of shares, which differ in their respective distribution, service, and program manager fees. The fund’s income, realized and unrealized gain (loss), and common expenses are allocated to shareholders based on the daily net assets of each class. Dividends are declared separately for each class. Differences in per share dividend rates are generally due to differences in separate class expenses. Class B and Class 529B shares will convert to Class A and Class 529A shares, respectively, approximately eight years after purchase.
| (3) | | Transactions with Affiliates |
Investment Adviser – The fund has an investment advisory agreement with Massachusetts Financial Services Company (MFS) to provide overall investment management and related administrative services and facilities to the fund. The management fee is computed daily and paid monthly at the following annual rates:
| | | |
| First $6.3 billion of average daily net assets | | 0.35 | % |
| Average daily net assets in excess of $6.3 billion | | 0.34 | % |
The management fee incurred for the six months ended March 31, 2009 was equivalent to an annual effective rate of 0.35% of the fund’s average daily net assets.
43
Notes to Financial Statements (unaudited) – continued
Effective December 1, 2007, if at the end of any month, the fund’s fiscal year-to-date average daily net assets exceed $11.5 billion and the total expenses for Class A exceed 0.87% of fiscal year-to-date average daily net assets, MFS has agreed in writing to reimburse Class A expenses such that Class A total expenses for the fund year-to-date are no greater than 0.87% of fiscal year-to-date average daily net assets, and to reduce the total expenses of the other share classes by the same percentage. If at the end of any month, the fund’s fiscal year-to-date average daily net assets exceed $12.5 billion and the total expenses for Class A exceed 0.85% of fiscal year-to-date average daily net assets, MFS has agreed in writing to reimburse Class A expenses such that Class A total expenses for the fund year-to-date are no greater than 0.85% of fiscal year-to-date average daily net assets, and to reduce the total expenses of the other share classes by the same percentage. This written agreement excludes interest, taxes, extraordinary expenses, brokerage and transaction costs and investment-related expenses, and will continue until at least November 30, 2012. For the six months ended March 31, 2009, the fund’s fiscal year-to-date average daily net assets did not exceed the limits and therefore, the investment adviser did not pay any portion of the fund’s expenses.
Distributor – MFS Fund Distributors, Inc. (MFD), a wholly-owned subsidiary of MFS, as distributor, received $202,530 and $2,759 for the six months ended March 31, 2009, as its portion of the initial sales charge on sales of Class A and Class 529A shares of the fund, respectively.
The Board of Trustees has adopted a distribution plan for certain class shares pursuant to Rule 12b-1 of the Investment Company Act of 1940.
The fund’s distribution plan provides that the fund will pay MFD for services provided by MFD and financial intermediaries in connection with the distribution and servicing of certain share classes. One component of the plan is a distribution fee paid to MFD and another component of the plan is a service fee paid to MFD. MFD may subsequently pay all, or a portion, of the distribution and/or service fees to financial intermediaries.
44
Notes to Financial Statements (unaudited) – continued
Distribution Plan Fee Table:
| | | | | | | | | | |
| | | Distribution
Fee Rate | | Service
Fee Rate | | Total
Distribution
Plan (d) | | Annual
Effective
Rate (e) | | Distribution
and Service
Fee |
| Class A | | 0.10% | | 0.25% | | 0.35% | | 0.35% | | $6,915,573 |
| Class B | | 0.75% | | 0.25% | | 1.00% | | 1.00% | | 4,333,937 |
| Class C | | 0.75% | | 0.25% | | 1.00% | | 1.00% | | 3,965,256 |
| Class R1 | | 0.75% | | 0.25% | | 1.00% | | 1.00% | | 79,226 |
| Class R2 | | 0.25% | | 0.25% | | 0.50% | | 0.50% | | 328,406 |
| Class R3 | | — | | 0.25% | | 0.25% | | 0.25% | | 134,183 |
| Class 529A | | 0.10% | | 0.25% | | 0.35% | | 0.35% | | 12,411 |
| Class 529B | | 0.75% | | 0.25% | | 1.00% | | 1.00% | | 20,061 |
| Class 529C | | 0.75% | | 0.25% | | 1.00% | | 1.00% | | 17,505 |
| Total Distribution and Service Fees | | | | | | | | $15,806,558 |
| (d) | In accordance with the distribution plan for certain classes, the fund pays distribution and/or service fees up to these annual percentage rates of each class’ average daily net assets. |
| (e) | The annual effective rates represent actual fees incurred under the distribution plan for the six months ended March 31, 2009 based on each class’ average daily net assets. Assets attributable to Class A shares sold prior to October 1, 1989 are subject to a service fee of 0.15% annually. Prior to March 1, 2009, 0.10% of the Class 529A distribution fee was paid by the fund and the remaining 0.15% was not in effect. Effective March 1, 2009, the distribution fee rate for Class 529A shares decreased from 0.25% to 0.10%. |
Certain Class A shares purchased prior to September 1, 2008 are subject to a contingent deferred sales charge (CDSC) in the event of a shareholder redemption within 12 months of purchase. Certain Class A shares purchased on or subsequent to September 1, 2008 are subject to a CDSC in the event of a shareholder redemption within 24 months of purchase. Class C and Class 529C shares are subject to a CDSC in the event of a shareholder redemption within 12 months of purchase. Class B and Class 529B shares are subject to a CDSC in the event of a shareholder redemption within six years of purchase. All contingent deferred sales charges are paid to MFD and during the six months ended March 31, 2009, were as follows:
| | |
| | | Amount |
| Class A | | $9,963 |
| Class B | | 814,056 |
| Class C | | 37,468 |
| Class 529B | | 1,610 |
| Class 529C | | 47 |
The fund has entered into and may from time to time enter into contracts with program managers and other parties which administer the tuition programs through which an investment in the fund’s 529 share classes is made. The fund has entered into an agreement with MFD pursuant to which MFD receives an annual fee of up to 0.10% of the average daily net assets attributable to each 529 share class. The services provided by MFD, or a third party with which
45
Notes to Financial Statements (unaudited) – continued
MFD contracts, include recordkeeping and tax reporting and account services, as well as services designed to maintain the program’s compliance with the Internal Revenue Code and other regulatory requirements. Program manager fees for the six months ended March 31, 2009, were as follows:
| | |
| | | Amount |
| Class 529A | | $3,547 |
| Class 529B | | 2,007 |
| Class 529C | | 1,751 |
| Total Program Manager Fees | | $7,305 |
Shareholder Servicing Agent – MFS Service Center, Inc. (MFSC), a wholly-owned subsidiary of MFS, receives a fee from the fund for its services as shareholder servicing agent calculated as a percentage of the average daily net assets of the fund as determined periodically under the supervision of the fund’s Board of Trustees. For the six months ended March 31, 2009, the fee was $2,130,520, which equated to 0.0685% annually of the fund’s average daily net assets. MFSC also receives payment from the fund for out-of-pocket expenses, sub-accounting and other shareholder servicing costs which may be paid to affiliated and unaffiliated service providers. For the six months ended March 31, 2009, these out-of-pocket expenses, sub-accounting and other shareholder servicing costs amounted to $4,229,978.
Administrator – MFS provides certain financial, legal, shareholder communications, compliance, and other administrative services to the fund. Under an administrative services agreement, the fund partially reimburses MFS the costs incurred to provide these services. The fund is charged an annual fixed amount of $17,500 plus a fee based on average daily net assets. The administrative services fee incurred for the six months ended March 31, 2009 was equivalent to an annual effective rate of 0.0206% of the fund’s average daily net assets.
Trustees’ and Officers’ Compensation – The fund pays compensation to independent trustees in the form of a retainer, attendance fees, and additional compensation to Board and Committee chairpersons. The fund does not pay compensation directly to trustees or officers of the fund who are also officers of the investment adviser, all of whom receive remuneration for their services to the fund from MFS. Certain officers and trustees of the fund are officers or directors of MFS, MFD, and MFSC.
For certain independent Trustees who retired on or before December 31, 2001, the fund has an unfunded, defined benefit plan which resulted in a pension expense of $5,785. For certain independent Trustees who served on the Board as of December 31, 2001, the fund also has an unfunded retirement benefit deferral plan which resulted in a net decrease in expense of $24,724. Both amounts are included in independent trustees’ compensation for the six months ended
46
Notes to Financial Statements (unaudited) – continued
March 31, 2009. The liability for deferred retirement benefits payable to certain independent trustees under both plans amounted to $136,666 at March 31, 2009, and is included in payable for independent trustees’ compensation.
Deferred Trustee Compensation – Under a Deferred Compensation Plan (the Plan) independent trustees previously were allowed to elect to defer receipt of all or a portion of their annual compensation. Trustees are no longer allowed to defer compensation under the Plan. Amounts previously deferred are treated as though equivalent dollar amounts had been invested in shares of certain MFS funds selected by the trustee. Deferred amounts represent an unsecured obligation of the fund until distributed in accordance with the Plan. Included in other assets and payable for independent trustees’ compensation is $46,132 of deferred trustees’ compensation.
Other – This fund and certain other MFS funds (the funds) have entered into services agreements (the Agreements) which provide for payment of fees by the funds to Tarantino LLC and Griffin Compliance LLC in return for the provision of services of an Independent Chief Compliance Officer (ICCO) and Assistant ICCO, respectively, for the funds. The ICCO and Assistant ICCO are officers of the funds and the sole members of Tarantino LLC and Griffin Compliance LLC, respectively. The funds can terminate the Agreements with Tarantino LLC and Griffin Compliance LLC at any time under the terms of the Agreements. For the six months ended March 31, 2009, the aggregate fees paid by the fund to Tarantino LLC and Griffin Compliance LLC were $49,636 and are included in miscellaneous expense on the Statement of Operations. MFS has agreed to reimburse the fund for a portion of the payments made by the fund in the amount of $15,950, which is shown as a reduction of total expenses in the Statement of Operations. Additionally, MFS has agreed to bear all expenses associated with office space, other administrative support, and supplies provided to the ICCO and Assistant ICCO.
The fund may invest in a money market fund managed by MFS which seeks a high level of current income consistent with preservation of capital and liquidity. Income earned on this investment is included in dividends from underlying funds on the Statement of Operations. This money market fund does not pay a management fee to MFS.
Purchases and sales of investments, other than purchased option transactions and short-term obligations, were as follows:
| | | | |
| | | Purchases | | Sales |
| U.S. Government securities | | $620,614,757 | | $1,208,814,394 |
| Investments (non-U.S. Government securities) | | $1,631,288,769 | | $1,815,641,013 |
47
Notes to Financial Statements (unaudited) – continued
| (5) | | Shares of Beneficial Interest |
The fund’s Declaration of Trust permits the Trustees to issue an unlimited number of full and fractional shares of beneficial interest. Transactions in fund shares were as follows:
| | | | | | | | |
| | | Six months ended
3/31/09 | | Year ended
9/30/08 |
| | | Shares | | Amount | | Shares | | Amount |
| Shares sold | | | | | | | | |
Class A | | 25,256,698 | | $276,999,365 | | 61,315,868 | | $936,541,049 |
Class B | | 2,161,070 | | 23,780,774 | | 4,768,937 | | 70,865,376 |
Class C | | 5,581,927 | | 61,773,565 | | 9,656,081 | | 145,125,911 |
Class I | | 1,166,362 | | 12,794,936 | | 5,345,409 | | 82,262,359 |
Class R (b) | | — | | — | | 1,621,408 | | 25,459,428 |
Class R1 | | 160,598 | | 1,779,040 | | 933,567 | | 14,673,519 |
Former Class R2 (b) | | — | | — | | 811,465 | | 12,840,225 |
Class R2 | | 1,541,126 | | 16,932,938 | | 9,366,741 | | 140,401,446 |
Class R3 | | 4,505,752 | | 48,905,825 | | 3,304,376 | | 50,105,818 |
Class R4 | | 2,776,638 | | 30,336,505 | | 16,283,300 | | 247,360,373 |
Class 529A | | 61,304 | | 671,613 | | 141,246 | | 2,110,278 |
Class 529B | | 9,473 | | 103,340 | | 39,138 | | 600,190 |
Class 529C | | 39,701 | | 439,201 | | 46,542 | | 689,028 |
| | 43,260,649 | | $474,517,102 | | 113,634,078 | | $1,729,035,000 |
| Shares issued to shareholders in reinvestment of distributions | | | | | | | | |
Class A | | 5,571,571 | | $61,048,262 | | 41,930,813 | | $638,557,613 |
Class B | | 975,018 | | 10,691,648 | | 9,722,058 | | 148,149,077 |
Class C | | 728,161 | | 8,013,291 | | 6,545,272 | | 100,146,895 |
Class I | | 223,882 | | 2,450,054 | | 1,857,455 | | 28,205,304 |
Class R (b) | | — | | — | | 181,515 | | 2,790,660 |
Class R1 | | 20,520 | | 224,564 | | 145,215 | | 2,206,260 |
Former Class R2 (b) | | — | | — | | 106,584 | | 1,604,671 |
Class R2 | | 164,878 | | 1,810,177 | | 824,703 | | 12,530,724 |
Class R3 | | 178,132 | | 1,943,461 | | 953,095 | | 14,499,167 |
Class R4 | | 267,314 | | 2,929,697 | | 1,291,232 | | 19,633,903 |
Class 529A | | 10,526 | | 114,926 | | 100,796 | | 1,529,116 |
Class 529B | | 4,997 | | 54,709 | | 38,275 | | 582,495 |
Class 529C | | 4,342 | | 47,735 | | 33,897 | | 518,125 |
| | 8,149,341 | | $89,328,524 | | 63,730,910 | | $970,954,010 |
48
Notes to Financial Statements (unaudited) – continued
| | | | | | | | | | | | |
| | | Six months ended
3/31/09 | | | Year ended
9/30/08 | |
| | | Shares | | | Amount | | | Shares | | | Amount | |
| Shares reacquired | | | | | | | | | | | | |
Class A | | (67,472,491 | ) | | $(740,317,518 | ) | | (138,087,935 | ) | | $(2,066,026,934 | ) |
Class B | | (19,671,774 | ) | | (214,722,069 | ) | | (36,742,739 | ) | | (547,330,912 | ) |
Class C | | (14,926,830 | ) | | (163,716,810 | ) | | (23,714,000 | ) | | (352,187,530 | ) |
Class I | | (1,355,639 | ) | | (14,843,874 | ) | | (11,414,148 | ) | | (166,528,677 | ) |
Class R (b) | | — | | | — | | | (6,167,917 | ) | | (93,862,169 | ) |
Class R1 | | (275,628 | ) | | (3,000,349 | ) | | (601,654 | ) | | (8,951,592 | ) |
Former Class R2 (b) | | — | | | — | | | (1,659,440 | ) | | (24,405,529 | ) |
Class R2 | | (2,753,692 | ) | | (30,395,402 | ) | | (3,664,383 | ) | | (53,574,873 | ) |
Class R3 | | (2,048,273 | ) | | (22,213,109 | ) | | (4,086,790 | ) | | (59,913,675 | ) |
Class R4 | | (3,793,347 | ) | | (41,841,785 | ) | | (10,075,871 | ) | | (159,581,601 | ) |
Class 529A | | (439,145 | ) | | (4,871,022 | ) | | (118,753 | ) | | (1,771,559 | ) |
Class 529B | | (37,403 | ) | | (411,566 | ) | | (41,110 | ) | | (599,014 | ) |
Class 529C | | (59,568 | ) | | (661,982 | ) | | (65,736 | ) | | (949,070 | ) |
| | (112,833,790 | ) | | $(1,236,995,486 | ) | | (236,440,476 | ) | | $(3,535,683,135 | ) |
| Net change | | | | | | | | | | | | |
Class A | | (36,644,222 | ) | | $(402,269,891 | ) | | (34,841,254 | ) | | $(490,928,272 | ) |
Class B | | (16,535,686 | ) | | (180,249,647 | ) | | (22,251,744 | ) | | (328,316,459 | ) |
Class C | | (8,616,742 | ) | | (93,929,954 | ) | | (7,512,647 | ) | | (106,914,724 | ) |
Class I | | 34,605 | | | 401,116 | | | (4,211,284 | ) | | (56,061,014 | ) |
Class R (b) | | — | | | — | | | (4,364,994 | ) | | (65,612,081 | ) |
Class R1 | | (94,510 | ) | | (996,745 | ) | | 477,128 | | | 7,928,187 | |
Former Class R2 (b) | | — | | | — | | | (741,391 | ) | | (9,960,633 | ) |
Class R2 | | (1,047,688 | ) | | (11,652,287 | ) | | 6,527,061 | | | 99,357,297 | |
Class R3 | | 2,635,611 | | | 28,636,177 | | | 170,681 | | | 4,691,310 | |
Class R4 | | (749,395 | ) | | (8,575,583 | ) | | 7,498,661 | | | 107,412,675 | |
Class 529A | | (367,315 | ) | | (4,084,483 | ) | | 123,289 | | | 1,867,835 | |
Class 529B | | (22,933 | ) | | (253,517 | ) | | 36,303 | | | 583,671 | |
Class 529C | | (15,525 | ) | | (175,046 | ) | | 14,703 | | | 258,083 | |
| | (61,423,800 | ) | | $(673,149,860 | ) | | (59,075,488 | ) | | $(835,694,125 | ) |
| (b) | At the close of business on April 18, 2008, Class R and Class R2 shares converted into Class R3 shares. Following the conversion, Class R3 shares were renamed Class R2 shares. |
The fund and other funds managed by MFS participate in a $1 billion unsecured committed line of credit provided by a syndication of banks under a credit agreement. In addition, the fund and other funds managed by MFS have established uncommitted borrowing arrangements with certain banks. Borrowings may be made for temporary financing needs. Interest is charged to the fund, based on its borrowings, generally at a rate equal to the Federal Reserve funds rate plus 0.30%. In addition, a commitment fee, based on the average daily, unused portion of the committed line of credit, is allocated among the participating funds at the end of each calendar quarter. For the six
49
Notes to Financial Statements (unaudited) – continued
months ended March 31, 2009, the fund’s commitment fee and interest expense were $22,008 and $1,086, respectively, and are included in miscellaneous expense on the Statement of Operations.
The fund’s investment adviser, MFS, was the subject of an administrative proceeding concerning market timing which resulted in the Securities and Exchange Commission (the “SEC”) entering an order approving a settlement with MFS and two of its former officers (the “Settlement Order”). Under the terms of the Settlement Order, MFS transferred $175 million in disgorgement and $50 million in penalty (the “Payments”) to the SEC, which established a Fair Fund from which settlement funds have been, or will be, distributed to eligible current and former shareholders of the fund and certain other affected MFS retail funds. The Payments, along with additional amounts from a third-party settlement, have been, or will be, distributed to eligible shareholders in accordance with a plan developed by an independent distribution consultant (the “IDC”) in consultation with MFS and the Board of Trustees of the MFS retail funds. The plan was approved in July 2007 by the SEC. Pursuant to the distribution plan, after the distributions to eligible shareholders have been made, residual amounts, if any, may be available for distribution to the fund and certain other affected MFS retail funds. Certain procedural conditions of the distribution plan have not been met to date and, as such, the ultimate timing and amount of any payment of the residual amount is not known at this time.
| (8) | | Transactions in Underlying Funds-Affiliated Issuers |
An affiliated issuer may be considered one in which the fund owns 5% or more of the outstanding voting securities, or a company which is under common control. For the purposes of this report, the fund assumes the following to be affiliated issuers:
| | | | | | | | | |
| Underlying Funds: | | Beginning
Shares/Par
Amount | | Acquisitions
Shares/Par
Amount | | Dispositions
Shares/Par
Amount | | | Ending
Shares/Par
Amount |
MFS Institutional Money
Market Portfolio | | 19,586,063 | | 1,151,823,136 | | (1,095,369,663 | ) | | 76,039,536 |
| | | | |
| Underlying Funds: | | Realized
Gain (Loss) | | Capital Gain
Distributions | | Dividend
Income | | | Ending
Value |
MFS Institutional Money
Market Portfolio | | $— | | $— | | $200,340 | | | $76,039,536 |
50
BOARD REVIEW OF INVESTMENT ADVISORY AGREEMENT
A discussion regarding the Board’s most recent review and renewal of the fund’s Investment Advisory Agreement with MFS is available by clicking on the fund’s name under “Mutual Funds” in the “Products and Performance” section of the MFS Web site (mfs.com).
PROXY VOTING POLICIES AND INFORMATION
A general description of the MFS funds’ proxy voting policies and procedures is available without charge, upon request, by calling
1-800-225-2606, by visiting the Proxy Voting section of mfs.com or by visiting the SEC’s Web site at http://www.sec.gov.
Information regarding how the fund voted proxies relating to portfolio securities during the most recent twelve-month period ended June 30 is available without charge by visiting the Proxy Voting section of mfs.com or by visiting the SEC’s Web site at http://www.sec.gov.
QUARTERLY PORTFOLIO DISCLOSURE
The fund will file a complete schedule of portfolio holdings with the Securities and Exchange Commission (the Commission) for the first and third quarters of each fiscal year on Form N-Q. The fund’s Form N-Q may be reviewed and copied at the:
Public Reference Room
Securities and Exchange Commission
100 F Street, NE, Room 1580
Washington, D.C. 20549
Information on the operation of the Public Reference Room may be obtained by calling the Commission at 1-800-SEC-0330. The fund’s Form N-Q is available on the EDGAR database on the Commission’s Internet Web site at http://www.sec.gov, and copies of this information may be obtained, upon payment of a duplicating fee, by electronic request at the following e-mail address: publicinfo@sec.gov or by writing the Public Reference Section at the above address.
A shareholder can also obtain the quarterly portfolio holdings report at mfs.com.
51
CONTACT US
| | |
| Web site | | Mailing address |
| mfs.com | | MFS Service Center, Inc. |
| | P.O. Box 55824 |
| MFS TALK | | Boston, MA 02205-5824 |
| 1-800-637-8255 | | |
| 24 hours a day | | Overnight mail |
| | MFS Service Center, Inc. |
| Account service and literature | | c/o Boston Financial Data Services |
| | 30 Dan Road |
| Shareholders | | Canton, MA 02021-2809 |
| 1-800-225-2606 | | |
| | |
| Investment professionals | | |
| 1-800-343-2829 | | |
| | |
| Retirement plan services | | |
| 1-800-637-1255 | | |

Save paper with eDelivery. MFS® will send you prospectuses, reports, and proxies directly via e-mail so you will get information faster with less mailbox clutter. To sign up: 1. go to mfs.com. 2. log in via MFS® Access. 3. select eDelivery. If you own your MFS fund shares through a financial institution or a retirement plan, MFS® TALK, MFS Access, and eDelivery may not be available to you.

The Registrant has not amended any provision in its Code of Ethics (the “Code”) that relates to any element of the Code’s definition enumerated in paragraph (b) of Item 2 of this Form N-CSR.
| ITEM 3. | AUDIT COMMITTEE FINANCIAL EXPERT. |
Not applicable for semi-annual reports.
| ITEM 4. | PRINCIPAL ACCOUNTANT FEES AND SERVICES. |
Not applicable for semi-annual reports.
| ITEM 5. | AUDIT COMMITTEE OF LISTED REGISTRANTS. |
Not applicable to the Registrant.
A schedule of investments for each series of the Registrant is included as part of the report to shareholders of such series under Item 1 of this Form N-CSR.
| ITEM 7. | DISCLOSURE OF PROXY VOTING POLICIES AND PROCEDURES FOR CLOSED-END MANAGEMENT INVESTMENT COMPANIES. |
Not applicable to the Registrant.
| ITEM 8. | PORTFOLIO MANAGERS OF CLOSED-END MANAGEMENT INVESTMENT COMPANIES. |
Not applicable to the Registrant.
| ITEM 9. | PURCHASES OF EQUITY SECURITIES BY CLOSED-END MANAGEMENT INVESTMENT COMPANY AND AFFILIATED PURCHASERS. |
Not applicable to the Registrant.
| ITEM 10. | SUBMISSION OF MATTERS TO A VOTE OF SECURITY HOLDERS. |
There were no material changes to the procedures by which shareholders may send recommendations to the Board for nominees to the Registrant’s Board since the Registrant last provided disclosure as to such procedures in response to the requirements of Item 407 (c)(2)(iv) of Regulation S-K or this Item.
| ITEM 11. | CONTROLS AND PROCEDURES. |
| (a) | Based upon their evaluation of the effectiveness of the registrant’s disclosure controls and procedures (as defined in Rule 30a-3(c) under the Investment Company Act of 1940 (the “Act”)) as conducted within 90 days of the filing date of this report on Form N-CSR, the registrant’s principal financial officer and principal executive officer have concluded that those disclosure controls and procedures provide reasonable assurance that the material information required to be disclosed by the registrant on this report is recorded, processed, summarized and reported within the time periods specified in the Securities and Exchange Commission’s rules and forms. |
| (b) | There were no changes in the registrant’s internal controls over financial reporting (as defined in Rule 30a-3(d) under the Act) that occurred during the second fiscal quarter of the period covered by the report that have materially affected, or are reasonably likely to materially affect, the registrant’s internal control over financial reporting. |
| (a) | File the exhibits listed below as part of this form. Letter or number the exhibits in the sequence indicated. |
| | (1) | Any code of ethics, or amendment thereto, that is the subject of the disclosure required by Item 2, to the extent that the registrant intends to satisfy the Item 2 requirements through filing of an exhibit. |
| | (2) | A separate certification for each principal executive officer and principal financial officer of the registrant as required by Rule 30a-2 under the Act (17 CFR 270.30a-2): Attached hereto. |
| (b) | If the report is filed under Section 13(a) or 15(d) of the Exchange Act, provide the certifications required by Rule 30a-2(b) under the Act (17 CFR 270.30a-2(b)), Rule 13a-14(b) or Rule 15d-14(b) under the Exchange Act (17 CFR 240.13a-14(b) or 240.15d-14(b)) and Section 1350 of Chapter 63 of Title 18 of the United States Code (18 U.S.C. 1350) as an exhibit. A certification furnished pursuant to this paragraph will not be deemed “filed” for the purposes of Section 18 of the Exchange Act (15 U.S.C. 78r), or otherwise subject to the liability of that section. Such certification will not be deemed to be incorporated by reference into any filing under the Securities Act of 1933 or the Exchange Act, except to the extent that the registrant specifically incorporates it by reference: Attached hereto. |
Notice
A copy of the Amended and Restated Declaration of Trust, as amended, of the Registrant is on file with the Secretary of State of The Commonwealth of Massachusetts and notice is hereby given that this instrument is executed on behalf of the Registrant by an officer of the Registrant as an officer and not individually and the obligations of or arising out of this instrument are not binding upon any of the Trustees or shareholders individually, but are binding only upon the assets and property of the respective constituent series of the Registrant.
SIGNATURES
Pursuant to the requirements of the Securities Exchange Act of 1934 and the Investment Company Act of 1940, the registrant has duly caused this report to be signed on its behalf by the undersigned, thereunto duly authorized.
(Registrant) MFS SERIES TRUST V
| | |
| By (Signature and Title)* | | MARIA F. DWYER |
| | Maria F. Dwyer, President |
Date: May 14, 2009
Pursuant to the requirements of the Securities Exchange Act of 1934 and the Investment Company Act of 1940, this report has been signed below by the following persons on behalf of the registrant and in the capacities and on the dates indicated.
| | |
| By (Signature and Title)* | | MARIA F. DWYER |
| | Maria F. Dwyer, President (Principal Executive Officer) |
Date: May 14, 2009
| | |
| By (Signature and Title)* | | JOHN M. CORCORAN |
| | John M. Corcoran, Treasurer (Principal Financial Officer and Accounting Officer) |
Date: May 14, 2009
| * | Print name and title of each signing officer under his or her signature. |