UNITED STATES
SECURITIES AND EXCHANGE COMMISSION
Washington, D.C. 20549
FORM N-CSR
CERTIFIED SHAREHOLDER REPORT OF
REGISTERED MANAGEMENT INVESTMENT COMPANIES
Investment Company Act file number 811-02031
MFS SERIES TRUST V
(Exact name of registrant as specified in charter)
111 Huntington Avenue, Boston, Massachusetts 02199
(Address of principal executive offices) (Zip code)
Susan S. Newton
Massachusetts Financial Services Company
111 Huntington Avenue,
Boston, Massachusetts 02199
(Name and address of agents for service)
Registrant’s telephone number, including area code: (617) 954-5000
Date of fiscal year end: September 30
Date of reporting period: March 31, 2013
| ITEM 1. | REPORTS TO STOCKHOLDERS. |
SEMIANNUAL REPORT
March 31, 2013

MFS® INTERNATIONAL NEW DISCOVERY FUND

MIO-SEM
MFS® INTERNATIONAL NEW DISCOVERY FUND
CONTENTS
The report is prepared for the general information of shareholders.
It is authorized for distribution to prospective investors only when preceded or accompanied by a current prospectus.
NOT FDIC INSURED Ÿ MAY LOSE VALUE Ÿ NO BANK GUARANTEE

LETTER FROM THE CHAIRMAN AND CEO
Dear Shareholders:
The first quarter of 2013 delivered strong returns to global equity investors, particularly those holding U.S. and Japanese stocks, while bond returns were flat overall. The U.S.
economy picked up steam, driven by the improving housing and job markets. U.S. economic data were broadly positive, with growth in manufacturing activity, durable goods orders and auto sales. However, consumer confidence wavered somewhat, a likely reflection of the impact of the payroll tax increase and uncertainty over the U.S. government’s across-the-board sequestration cuts.
The eurozone’s unemployment picture and overall economic activity steadily worsened. Cyprus, the latest debt-crisis hot spot, faces unique challenges, with its oversized banking sector’s unhealthy exposure to Greek debt. In addition, the hefty cost to
large bank depositors could weaken confidence in the region’s financial stability. China’s economic activity rebounded after a mild slowdown in 2012. The Japanese government’s aggressive effort to stimulate its long-dormant economy by devaluing the yen lifted stock prices, exports and profits for struggling Japanese firms. The outlook for further economic growth and an extension of the U.S. bull market is highly dependent on how much damage is caused by the U.S. budget cuts, global growth prospects and the ebb and flow of global tail risk events. Most factors point to a continued slow and uneven global economic recovery.
As always, managing risk in the face of uncertainty remains a top priority for investors. At MFS®, our uniquely collaborative investment process employs global research and active risk management. Our global team of investment professionals shares ideas and evaluates opportunities across continents, investment disciplines and asset classes — all with a goal of building better insights, and ultimately better results, for our clients.
We remain mindful of the many economic challenges investors face today, and believe it is more important than ever to maintain a long-term view and employ time-tested principles, such as asset allocation and diversification. We also remain confident that our unique approach can serve investors well as they work with their financial advisors to identify and pursue the most suitable opportunities.
Respectfully,

Robert J. Manning
Chairman and Chief Executive Officer
MFS Investment Management®
May 15, 2013
The opinions expressed in this letter are subject to change, may not be relied upon for investment advice, and no forecasts can be guaranteed.
1
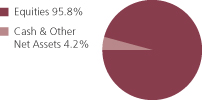
PORTFOLIO COMPOSITION
Portfolio structure
| | | | |
| Top ten holdings | | | | |
| Bunzl PLC | | | 2.6% | |
| Croda International PLC | | | 2.5% | |
| Amadeus Holdings AG | | | 1.3% | |
| Bellway PLC | | | 1.2% | |
| Aberdeen Asset Management PLC | | | 1.2% | |
| Christian Dior S.A. | | | 1.0% | |
| OBIC Co. Ltd. | | | 1.0% | |
| Hiscox Ltd. | | | 0.9% | |
| Sonova Holding AG | | | 0.9% | |
| Dignity PLC | | | 0.9% | |
| |
| Equity sectors | | | | |
| Financial Services | | | 16.2% | |
| Special Products & Services | | | 14.1% | |
| Retailing | | | 9.7% | |
| Consumer Staples | | | 8.2% | |
| Basic Materials | | | 7.8% | |
| Technology | | | 7.1% | |
| Industrial Goods & Services | | | 6.9% | |
| Health Care | | | 6.3% | |
| Leisure | | | 6.0% | |
| Autos & Housing | | | 5.0% | |
| Transportation | | | 3.6% | |
| Energy | | | 2.7% | |
| Utilities & Communications | | | 2.2% | |
| | | | |
| Issuer country weightings (x) | |
| United Kingdom | | | 25.5% | |
| Japan | | | 14.2% | |
| Brazil | | | 6.4% | |
| Germany | | | 6.2% | |
| United States | | | 4.8% | |
| France | | | 4.7% | |
| Hong Kong | | | 2.9% | |
| Denmark | | | 2.8% | |
| Mexico | | | 2.6% | |
| Other Countries | | | 29.9% | |
|
| Currency exposure weightings (y) | |
| British Pound Sterling | | | 25.5% | |
| Euro | | | 17.0% | |
| Japanese Yen | | | 14.2% | |
| United States Dollar | | | 7.1% | |
| Brazilian Real | | | 6.4% | |
| Hong Kong Dollar | | | 4.7% | |
| Danish Krone | | | 2.8% | |
| Mexican Peso | | | 2.6% | |
| Swiss Franc | | | 2.6% | |
| Other Currencies | | | 17.1% | |
2
Portfolio Composition – continued
| (x) | Represents the portfolio’s exposure to issuer countries as a percentage of a portfolio’s total net assets. |
| (y) | Represents the portfolio’s exposure to a particular currency as a percentage of a portfolio’s total net assets. |
Percentages are based on net assets as of 3/31/13.
The portfolio is actively managed and current holdings may be different.
3
EXPENSE TABLE
Fund expenses borne by the shareholders during the period, October 1, 2012 through March 31, 2013
As a shareholder of the fund, you incur two types of costs: (1) transaction costs, including sales charges (loads) on certain purchase or redemption payments, and (2) ongoing costs, including management fees; distribution and service (12b-1) fees; and other fund expenses. This example is intended to help you understand your ongoing costs (in dollars) of investing in the fund and to compare these costs with the ongoing costs of investing in other mutual funds.
The example is based on an investment of $1,000 invested at the beginning of the period and held for the entire period October 1, 2012 through March 31, 2013.
Actual Expenses
The first line for each share class in the following table provides information about actual account values and actual expenses. You may use the information in this line, together with the amount you invested, to estimate the expenses that you paid over the period. Simply divide your account value by $1,000 (for example, an $8,600 account value divided by $1,000 = 8.6), then multiply the result by the number in the first line under the heading entitled “Expenses Paid During Period” to estimate the expenses you paid on your account during this period.
Hypothetical Example for Comparison Purposes
The second line for each share class in the following table provides information about hypothetical account values and hypothetical expenses based on the fund’s actual expense ratio and an assumed rate of return of 5% per year before expenses, which is not the fund’s actual return. The hypothetical account values and expenses may not be used to estimate the actual ending account balance or expenses you paid for the period. You may use this information to compare the ongoing costs of investing in the fund and other funds. To do so, compare this 5% hypothetical example with the 5% hypothetical examples that appear in the shareholder reports of the other funds.
Please note that the expenses shown in the table are meant to highlight your ongoing costs only and do not reflect any transactional costs, such as sales charges (loads). Therefore, the second line for each share class in the table is useful in comparing ongoing costs only, and will not help you determine the relative total costs of owning different funds. In addition, if these transactional costs were included, your costs would have been higher.
4
Expense Table – continued
| | | | | | | | | | | | | | | | | | |
Share
Class | | | | Annualized
Expense
Ratio | | | Beginning
Account Value
10/01/12 | | | Ending
Account Value
3/31/13 | | | Expenses
Paid During
Period (p)
10/01/12-3/31/13 | |
| A | | Actual | | | 1.36% | | | | $1,000.00 | | | | $1,111.49 | | | | $7.16 | |
| | Hypothetical (h) | | | 1.36% | | | | $1,000.00 | | | | $1,018.15 | | | | $6.84 | |
| B | | Actual | | | 2.11% | | | | $1,000.00 | | | | $1,107.68 | | | | $11.09 | |
| | Hypothetical (h) | | | 2.11% | | | | $1,000.00 | | | | $1,014.41 | | | | $10.60 | |
| C | | Actual | | | 2.11% | | | | $1,000.00 | | | | $1,107.52 | | | | $11.09 | |
| | Hypothetical (h) | | | 2.11% | | | | $1,000.00 | | | | $1,014.41 | | | | $10.60 | |
| I | | Actual | | | 1.11% | | | | $1,000.00 | | | | $1,113.14 | | | | $5.85 | |
| | Hypothetical (h) | | | 1.11% | | | | $1,000.00 | | | | $1,019.40 | | | | $5.59 | |
| R1 | | Actual | | | 2.11% | | | | $1,000.00 | | | | $1,107.30 | | | | $11.09 | |
| | Hypothetical (h) | | | 2.11% | | | | $1,000.00 | | | | $1,014.41 | | | | $10.60 | |
| R2 | | Actual | | | 1.61% | | | | $1,000.00 | | | | $1,110.08 | | | | $8.47 | |
| | Hypothetical (h) | | | 1.61% | | | | $1,000.00 | | | | $1,016.90 | | | | $8.10 | |
| R3 | | Actual | | | 1.36% | | | | $1,000.00 | | | | $1,111.41 | | | | $7.16 | |
| | Hypothetical (h) | | | 1.36% | | | | $1,000.00 | | | | $1,018.15 | | | | $6.84 | |
| R4 | | Actual | | | 1.11% | | | | $1,000.00 | | | | $1,112.78 | | | | $5.85 | |
| | Hypothetical (h) | | | 1.11% | | | | $1,000.00 | | | | $1,019.40 | | | | $5.59 | |
| R5 | | Actual | | | 1.02% | | | | $1,000.00 | | | | $1,113.40 | | | | $5.37 | |
| | Hypothetical (h) | | | 1.02% | | | | $1,000.00 | | | | $1,019.85 | | | | $5.14 | |
| 529A | | Actual | | | 1.41% | | | | $1,000.00 | | | | $1,111.54 | | | | $7.42 | |
| | Hypothetical (h) | | | 1.41% | | | | $1,000.00 | | | | $1,017.90 | | | | $7.09 | |
| 529B | | Actual | | | 2.16% | | | | $1,000.00 | | | | $1,107.14 | | | | $11.35 | |
| | Hypothetical (h) | | | 2.16% | | | | $1,000.00 | | | | $1,014.16 | | | | $10.85 | |
| 529C | | Actual | | | 2.16% | | | | $1,000.00 | | | | $1,106.90 | | | | $11.35 | |
| | Hypothetical (h) | | | 2.16% | | | | $1,000.00 | | | | $1,014.16 | | | | $10.85 | |
| (h) | 5% class return per year before expenses. |
| (p) | Expenses paid are equal to each class’s annualized expense ratio, as shown above, multiplied by the average account value over the period, multiplied by the number of days in the period, divided by the number of days in the year. Expenses paid do not include any applicable sales charges (loads). If these transaction costs had been included, your costs would have been higher. |
5
PORTFOLIO OF INVESTMENTS
3/31/13 (unaudited)
The Portfolio of Investments is a complete list of all securities owned by your fund. It is categorized by broad-based asset classes.
| | | | | | | | |
| Common Stocks - 95.8% | | | | | | | | |
| Issuer | | Shares/Par | | | Value ($) | |
| Aerospace - 0.6% | | | | | | | | |
| Cobham PLC | | | 2,317,538 | | | $ | 8,556,945 | |
| Meggitt PLC | | | 2,096,288 | | | | 15,639,353 | |
| | | | | | | | |
| | | | | | | $ | 24,196,298 | |
| Airlines - 2.1% | | | | | | | | |
| Copa Holdings S.A., “A” | | | 115,029 | | | $ | 13,758,619 | |
| Grupo Aeroportuario del Sureste S.A. de C.V., ADR | | | 104,268 | | | | 14,250,308 | |
| Koninklijke Vopak N.V. | | | 204,499 | | | | 12,329,751 | |
| Qantas Airways Ltd. (a) | | | 7,114,176 | | | | 13,236,929 | |
| Stagecoach Group PLC | | | 6,204,930 | | | | 29,283,614 | |
| | | | | | | | |
| | | | | | | $ | 82,859,221 | |
| Alcoholic Beverages - 0.5% | | | | | | | | |
| Carlsberg Group | | | 130,695 | | | $ | 12,720,364 | |
| Davide Campari-Milano S.p.A. | | | 1,102,844 | | | | 8,582,047 | |
| | | | | | | | |
| | | | | | | $ | 21,302,411 | |
| Apparel Manufacturers - 1.8% | | | | | | | | |
| Burberry Group PLC | | | 325,167 | | | $ | 6,566,256 | |
| Cia.Hering S.A. | | | 666,900 | | | | 11,906,516 | |
| Gerry Weber International AG | | | 337,608 | | | | 14,737,302 | |
| Li & Fung Ltd. | | | 3,835,138 | | | | 5,285,962 | |
| Stella International Holdings Ltd. | | | 6,814,591 | | | | 20,452,902 | |
| Top Glove Corp. | | | 7,324,377 | | | | 12,785,400 | |
| | | | | | | | |
| | | | | | | $ | 71,734,338 | |
| Automotive - 2.6% | | | | | | | | |
| D’Ieteren S.A. | | | 130,956 | | | $ | 5,985,123 | |
| Exide Industries Ltd. | | | 7,717,651 | | | | 18,403,793 | |
| Geely Automobile Holdings Ltd. | | | 24,224,145 | | | | 11,822,691 | |
| GKN PLC | | | 2,128,630 | | | | 8,554,846 | |
| Guangzhou Automobile Group Co. Ltd., “H” | | | 15,522,750 | | | | 13,178,003 | |
| Mando Corp. | | | 46,080 | | | | 4,851,181 | |
| Motherson Sumi Systems Ltd. | | | 5,142,955 | | | | 18,393,750 | |
| Takata Corp. | | | 393,800 | | | | 7,890,217 | |
| USS Co. Ltd. | | | 104,290 | | | | 12,236,191 | |
| | | | | | | | |
| | | | | | | $ | 101,315,795 | |
6
Portfolio of Investments (unaudited) – continued
| | | | | | | | |
| Issuer | | Shares/Par | | | Value ($) | |
| Common Stocks - continued | | | | | | | | |
| Biotechnology - 0.2% | | | | | | | | |
| Abcam PLC | | | 488,668 | | | $ | 3,322,716 | |
| Lonza Group AG | | | 51,218 | | | | 3,324,583 | |
| | | | | | | | |
| | | | | | | $ | 6,647,299 | |
| Broadcasting - 1.0% | | | | | | | | |
| Havas S.A. | | | 1,952,604 | | | $ | 12,363,497 | |
| Nippon Television Holdings, Inc. | | | 548,200 | | | | 8,201,463 | |
| Proto Corp. | | | 510,400 | | | | 7,858,144 | |
| Rightmove PLC | | | 421,840 | | | | 11,415,581 | |
| | | | | | | | |
| | | | | | | $ | 39,838,685 | |
| Brokerage & Asset Managers - 5.3% | | | | | | | | |
| Aberdeen Asset Management PLC | | | 7,204,280 | | | $ | 46,982,555 | |
| Bolsa Mexicana de Valores S.A. de C.V. | | | 5,071,396 | | | | 14,566,776 | |
| CETIP S.A. Mercados Organizados | | | 1,029,057 | | | | 12,104,161 | |
| Computershare Ltd. | | | 1,218,705 | | | | 12,973,824 | |
| Daiwa Securities Group, Inc. | | | 2,143,000 | | | | 14,926,821 | |
| Hargreaves Lansdown PLC | | | 1,112,493 | | | | 14,672,474 | |
| ICAP PLC | | | 1,760,100 | | | | 7,766,410 | |
| IG Group Holdings PLC | | | 2,030,516 | | | | 16,475,326 | |
| Osaka Securities Exchange Co. Ltd. | | | 46,400 | | | | 4,202,506 | |
| Rathbone Brothers PLC | | | 841,667 | | | | 18,658,723 | |
| Schroders PLC | | | 1,027,246 | | | | 32,902,689 | |
| Yuanta Financial Holding Co. Ltd. | | | 23,028,360 | | | | 11,736,163 | |
| | | | | | | | |
| | | | | | | $ | 207,968,428 | |
| Business Services - 10.6% | | | | | | | | |
| Amadeus Fire AG | | | 257,970 | | | $ | 13,691,710 | |
| Amadeus Holdings AG | | | 1,914,569 | | | | 51,728,126 | |
| Brenntag AG | | | 149,767 | | | | 23,385,764 | |
| Brunel International N.V. | | | 131,319 | | | | 5,541,273 | |
| Bunzl PLC | | | 5,070,654 | | | | 99,774,619 | |
| Cabcharge Australia Ltd. (l) | | | 2,190,013 | | | | 10,484,095 | |
| Capgemini | | | 139,969 | | | | 6,370,131 | |
| Capita PLC | | | 1,453,217 | | | | 19,850,731 | |
| Cognizant Technology Solutions Corp., “A” (a) | | | 171,793 | | | | 13,161,062 | |
| Compass Group PLC | | | 1,280,860 | | | | 16,357,831 | |
| CTS Eventim AG | | | 123,326 | | | | 4,181,850 | |
| DKSH Holding Ltd. (a) | | | 45,234 | | | | 4,051,517 | |
| Edenred | | | 269,908 | | | | 8,833,945 | |
| Electrocomponents PLC | | | 1,285,750 | | | | 4,903,618 | |
| Intertek Group PLC | | | 511,895 | | | | 26,390,710 | |
| LPS Brasil - Consultoria de Imoveis S.A. | | | 622,000 | | | | 11,052,657 | |
| LSL Property Services PLC | | | 2,062,655 | | | | 10,554,084 | |
7
Portfolio of Investments (unaudited) – continued
| | | | | | | | |
| Issuer | | Shares/Par | | | Value ($) | |
| Common Stocks - continued | | | | | | | | |
| Business Services - continued | | | | | | | | |
| MITIE Group PLC | | | 1,635,360 | | | $ | 6,977,451 | |
| Nomura Research Institute Ltd. | | | 665,900 | | | | 17,082,336 | |
| Premier Farnell PLC | | | 1,989,493 | | | | 6,744,167 | |
| Serco Group PLC | | | 987,216 | | | | 9,405,157 | |
| Sodexo | | | 330,279 | | | | 30,782,473 | |
| Travis Perkins PLC | | | 343,457 | | | | 7,587,926 | |
| Wolseley PLC | | | 69,271 | | | | 3,444,957 | |
| | | | | | | | |
| | | | | | | $ | 412,338,190 | |
| Cable TV - 2.6% | | | | | | | | |
| Astro Malaysia Holdings Berhad | | | 19,492,659 | | | $ | 17,769,290 | |
| Dish TV India Ltd. (a) | | | 9,303,367 | | | | 11,520,969 | |
| Eutelsat Communications | | | 226,266 | | | | 7,978,460 | |
| Jupiter Telecommunications Co. Ltd. | | | 2,049 | | | | 2,686,892 | |
| Kabel Deutschland Holding AG | | | 85,187 | | | | 7,860,919 | |
| Naspers | | | 253,769 | | | | 15,745,635 | |
| SES | | | 199,700 | | | | 6,259,578 | |
| Virgin Media, Inc. | | | 185,818 | | | | 9,099,507 | |
| Ziggo N.V. | | | 655,769 | | | | 23,064,497 | |
| | | | | | | | |
| | | | | | | $ | 101,985,747 | |
| Chemicals - 0.4% | | | | | | | | |
| Nufarm Ltd. | | | 1,410,151 | | | $ | 5,797,914 | |
| Victrex PLC | | | 424,650 | | | | 10,710,890 | |
| | | | | | | | |
| | | | | | | $ | 16,508,804 | |
| Computer Software - 1.7% | | | | | | | | |
| Aveva Group PLC | | | 101,920 | | | $ | 3,506,083 | |
| Dassault Systemes S.A. | | | 77,548 | | | | 8,965,386 | |
| OBIC Business Consultants Co. Ltd. | | | 128,550 | | | | 7,179,582 | |
| OBIC Co. Ltd. | | | 166,380 | | | | 38,353,258 | |
| Totvs S.A. | | | 375,300 | | | | 7,701,599 | |
| | | | | | | | |
| | | | | | | $ | 65,705,908 | |
| Computer Software - Systems - 1.8% | | | | | | | | |
| Asustek Computer, Inc. | | | 1,673,000 | | | $ | 20,053,562 | |
| Brother Industries Ltd. | | | 467,000 | | | | 4,879,253 | |
| Konica Minolta Holdings, Inc. | | | 1,430,500 | | | | 10,450,032 | |
| Linx S.A. (a) | | | 544,200 | | | | 8,538,368 | |
| NICE Systems Ltd. (a) | | | 384,213 | | | | 14,131,233 | |
| Venture Corp. Ltd. | | | 1,975,000 | | | | 13,794,977 | |
| | | | | | | | |
| | | | | | | $ | 71,847,425 | |
8
Portfolio of Investments (unaudited) – continued
| | | | | | | | |
| Issuer | | Shares/Par | | | Value ($) | |
| Common Stocks - continued | | | | | | | | |
| Conglomerates - 0.9% | | | | | | | | |
| Alfa S.A.B de C.V. | | | 3,507,205 | | | $ | 8,590,003 | |
| DCC PLC | | | 417,836 | | | | 14,704,029 | |
| First Pacific Co. Ltd. | | | 4,322,800 | | | | 5,870,798 | |
| Smiths Group PLC | | | 297,887 | | | | 5,689,488 | |
| | | | | | | | |
| | | | | | | $ | 34,854,318 | |
| Construction - 2.3% | | | | | | | | |
| Bellway PLC | | | 2,392,407 | | | $ | 47,147,794 | |
| China Shanshui Cement Group Ltd. | | | 6,599,891 | | | | 3,808,402 | |
| Corporacion GEO S.A.B. de C.V. (a) | | | 3,883,066 | | | | 2,346,111 | |
| Geberit AG | | | 82,915 | | | | 20,418,583 | |
| PDG Realty S.A. | | | 3,634,900 | | | | 5,656,384 | |
| Semen Indonesia Persero Tbk PT | | | 4,574,720 | | | | 8,332,652 | |
| Urbi Desarrollos Urbanos S.A.B. de C.V. (a) | | | 4,150,309 | | | | 1,071,787 | |
| | | | | | | | |
| | | | | | | $ | 88,781,713 | |
| Consumer Products - 3.8% | | | | | | | | |
| Beiersdorf AG | | | 237,063 | | | $ | 21,894,025 | |
| Christian Dior S.A. | | | 234,351 | | | | 38,876,685 | |
| Dabur India Ltd. | | | 6,487,750 | | | | 16,367,272 | |
| Henkel KGaA, IPS | | | 234,897 | | | | 22,612,455 | |
| Kimberly-Clark de Mexico S.A. de C.V., “A” | | | 3,459,224 | | | | 12,110,374 | |
| Milbon Co. Ltd. | | | 180,730 | | | | 6,447,789 | |
| PZ Cussons | | | 482,226 | | | | 2,955,785 | |
| Shiseido Co. Ltd. | | | 199,700 | | | | 2,813,781 | |
| Uni-Charm Corp. | | | 420,500 | | | | 24,869,240 | |
| | | | | | | | |
| | | | | | | $ | 148,947,406 | |
| Consumer Services - 2.2% | | | | | | | | |
| Abril Educacao S.A., IEU | | | 375,190 | | | $ | 8,728,021 | |
| Anhanguera Educacional Participacoes S.A. | | | 565,000 | | | | 9,118,711 | |
| Dignity PLC | | | 1,660,426 | | | | 35,825,660 | |
| Estacio Participacoes S.A. | | | 511,840 | | | | 10,973,870 | |
| Kakaku.com, Inc. | | | 129,800 | | | | 3,191,939 | |
| Kroton Educacional S.A. | | | 1,034,310 | | | | 13,218,525 | |
| Rakuten | | | 392,200 | | | | 3,985,298 | |
| | | | | | | | |
| | | | | | | $ | 85,042,024 | |
| Containers - 1.0% | | | | | | | | |
| Klabin S.A., IPS | | | 1,115,600 | | | $ | 7,621,958 | |
| Mayr-Melnhof Karton AG | | | 113,296 | | | | 12,408,324 | |
| Viscofan S.A. | | | 325,526 | | | | 17,070,656 | |
| | | | | | | | |
| | | | | | | $ | 37,100,938 | |
9
Portfolio of Investments (unaudited) – continued
| | | | | | | | |
| Issuer | | Shares/Par | | | Value ($) | |
| Common Stocks - continued | | | | | | | | |
| Electrical Equipment - 1.9% | | | | | | | | |
| Domino Printing Sciences PLC | | | 1,071,206 | | | $ | 10,400,643 | |
| IMI PLC | | | 604,236 | | | | 11,889,476 | |
| Kaba Holding AG | | | 3,798 | | | | 1,478,779 | |
| Keyence Corp. | | | 14,000 | | | | 4,255,893 | |
| Legrand S.A. | | | 234,412 | | | | 10,223,563 | |
| OMRON Corp. | | | 92,921 | | | | 2,288,986 | |
| Pfeiffer Vacuum Technology AG | | | 62,066 | | | | 6,846,881 | |
| Sensata Technologies Holding B.V. (a) | | | 89,768 | | | | 2,950,674 | |
| Spectris PLC | | | 654,081 | | | | 24,408,789 | |
| | | | | | | | |
| | | | | | | $ | 74,743,684 | |
| Electronics - 2.6% | | | | | | | | |
| Advantech Co. Ltd. | | | 3,496,787 | | | $ | 14,362,327 | |
| ASM International N.V. | | | 302,129 | | | | 10,033,770 | |
| Chroma Ate, Inc. | | | 6,314,000 | | | | 15,094,324 | |
| Halma PLC | | | 1,229,543 | | | | 9,677,425 | |
| Hirose Electric Co. Ltd. | | | 71,508 | | | | 9,650,315 | |
| Infineon Technologies AG | | | 1,142,832 | | | | 9,025,084 | |
| Seoul Semiconductor Co. Ltd. | | | 467,465 | | | | 12,156,151 | |
| Siliconware Precision Industries Co. | | | 14,384,000 | | | | 16,397,519 | |
| Stanley Electric Co. Ltd. | | | 213,431 | | | | 3,755,098 | |
| | | | | | | | |
| | | | | | | $ | 100,152,013 | |
| Energy - Independent - 1.1% | | | | | | | | |
| Athabasca Oil Corp. (a) | | | 340,004 | | | $ | 3,036,884 | |
| Cairn Energy PLC (a) | | | 2,719,715 | | | | 11,302,306 | |
| Canadian Oil Sands Ltd. | | | 607,950 | | | | 12,509,063 | |
| Gran Tierra Energy, Inc. (a) | | | 1,973,070 | | | | 11,496,812 | |
| Japan Petroleum Exploration Co. Ltd. | | | 160,800 | | | | 6,377,023 | |
| | | | | | | | |
| | | | | | | $ | 44,722,088 | |
| Engineering - Construction - 1.1% | | | | | | | | |
| JGC Corp. | | | 874,000 | | | $ | 22,077,363 | |
| Outotec Oyj (l) | | | 380,668 | | | | 5,578,029 | |
| Promotora y Operadora de Infraestructura S.A.B. de C.V. (a) | | | 1,493,860 | | | | 12,110,772 | |
| Toshiba Plant Kensetsu Co. Ltd. | | | 262,000 | | | | 3,188,065 | |
| | | | | | | | |
| | | | | | | $ | 42,954,229 | |
| Food & Beverages - 3.5% | | | | | | | | |
| Arca Continental S.A.B de C.V. | | | 1,170,018 | | | $ | 8,793,663 | |
| Associated British Foods PLC | | | 309,664 | | | | 8,944,564 | |
| Booker Group PLC | | | 7,957,910 | | | | 14,691,348 | |
| Britvic PLC | | | 1,771,399 | | | | 11,961,256 | |
| Chr. Hansen Holding A/S | | | 381,205 | | | | 14,146,017 | |
10
Portfolio of Investments (unaudited) – continued
| | | | | | | | |
| Issuer | | Shares/Par | | | Value ($) | |
| Common Stocks - continued | | | | | | | | |
| Food & Beverages - continued | | | | | | | | |
| Coca-Cola Hellenic Bottling Co. S.A. | | | 311,598 | | | $ | 8,348,897 | |
| D.E Master Blenders 1753 N.V. (a) | | | 247,051 | | | | 3,816,470 | |
| Kerry Group PLC | | | 293,303 | | | | 17,479,036 | |
| M. Dias Branco S.A. Industria e Comercio de Alimentos | | | 458,500 | | | | 18,233,543 | |
| Shenguan Holdings Group Ltd. | | | 28,421,505 | | | | 14,754,053 | |
| Tate & Lyle PLC | | | 350,372 | | | | 4,525,167 | |
| Want Want China Holdings Ltd. | | | 6,009,146 | | | | 9,211,258 | |
| | | | | | | | |
| | | | | | | $ | 134,905,272 | |
| Food & Drug Stores - 3.6% | | | | | | | | |
| Alimentation Couche-Tard, Inc. | | | 226,727 | | | $ | 12,266,472 | |
| Brazil Pharma S.A. | | | 1,446,000 | | | | 10,086,462 | |
| Cosmos Pharmaceutical Corp. | | | 96,900 | | | | 12,593,502 | |
| CP All PLC | | | 10,183,730 | | | | 16,080,489 | |
| Dairy Farm International Holdings Ltd. | | | 680,109 | | | | 8,229,319 | |
| E-Mart Co. Ltd. | | | 37,052 | | | | 7,334,719 | |
| FamilyMart Co. Ltd. | | | 116,700 | | | | 5,390,157 | |
| Lawson, Inc. | | | 272,600 | | | | 20,984,816 | |
| O’Key Group S.A., GDR | | | 1,918,350 | | | | 21,869,190 | |
| Raia Drogasil S.A. | | | 557,200 | | | | 5,929,153 | |
| Sundrug Co. Ltd. | | | 251,400 | | | | 11,144,564 | |
| Wumart Stores, Inc. | | | 4,828,514 | | | | 8,732,525 | |
| | | | | | | | |
| | | | | | | $ | 140,641,368 | |
| Furniture & Appliances - 0.1% | | | | | | | | |
| SEB S.A. | | | 34,866 | | | $ | 2,411,022 | |
| | |
| Gaming & Lodging - 1.0% | | | | | | | | |
| Ladbrokes PLC | | | 1,385,818 | | | $ | 4,754,627 | |
| Minor International Public Co. Ltd. | | | 5,437,159 | | | | 4,529,419 | |
| Paddy Power PLC | | | 143,196 | | | | 12,890,799 | |
| Shangri-La Asia Ltd. | | | 3,740,895 | | | | 7,344,824 | |
| William Hill PLC | | | 1,616,668 | | | | 9,086,393 | |
| | | | | | | | |
| | | | | | | $ | 38,606,062 | |
| General Merchandise - 1.4% | | | | | | | | |
| BIM Birlesik Magazalar A.S. | | | 90,815 | | | $ | 4,441,629 | |
| Clicks Group Ltd. | | | 835,682 | | | | 5,248,979 | |
| David Jones Ltd. | | | 1,241,256 | | | | 3,875,532 | |
| Dollarama, Inc. | | | 425,987 | | | | 27,303,854 | |
| Lojas Renner S.A. | | | 132,100 | | | | 4,912,678 | |
| Mitra Adiperkasa Tbk. | | | 3,224,192 | | | | 3,019,310 | |
| Seria Co. Ltd. | | | 304,800 | | | | 7,579,546 | |
| | | | | | | | |
| | | | | | | $ | 56,381,528 | |
11
Portfolio of Investments (unaudited) – continued
| | | | | | | | |
| Issuer | | Shares/Par | | | Value ($) | |
| Common Stocks - continued | | | | | | | | |
| Health Maintenance Organizations - 0.2% | | | | | | | | |
| Odontoprev S.A. | | | 1,584,900 | | | $ | 7,211,031 | |
| | |
| Insurance - 3.4% | | | | | | | | |
| Admiral Group PLC | | | 315,127 | | | $ | 6,377,877 | |
| Amlin PLC | | | 2,265,989 | | | | 14,581,344 | |
| Brasil Insurance Paticipaco e Administracao S.A. | | | 1,168,200 | | | | 12,950,183 | |
| Catlin Group Ltd. | | | 1,450,800 | | | | 11,485,016 | |
| Hiscox Ltd. (a) | | | 4,383,448 | | | | 36,632,359 | |
| Insurance Australia Group Ltd. | | | 2,318,075 | | | | 13,815,334 | |
| Jardine Lloyd Thompson Group PLC | | | 1,312,667 | | | | 16,973,463 | |
| Samsung Fire & Marine Insurance Co. Ltd. (a) | | | 37,191 | | | | 7,295,306 | |
| Sony Financial Holdings, Inc. | | | 366,800 | | | | 5,491,484 | |
| Storebrand A.S.A. (a) | | | 1,529,645 | | | | 5,975,123 | |
| | | | | | | | |
| | | | | | | $ | 131,577,489 | |
| Internet - 0.1% | | | | | | | | |
| 51job, Inc., ADR (a) | | | 49,079 | | | $ | 2,915,783 | |
| | |
| Leisure & Toys - 0.1% | | | | | | | | |
| Shimano, Inc. | | | 51,800 | | | $ | 4,372,584 | |
| | |
| Machinery & Tools - 3.0% | | | | | | | | |
| Aalberts Industries N.V. | | | 214,989 | | | $ | 4,808,121 | |
| Burckhardt Compression Holding AG | | | 26,387 | | | | 9,877,747 | |
| ElringKlinger AG | | | 240,204 | | | | 7,279,740 | |
| Faiveley S.A. | | | 31,382 | | | | 1,986,241 | |
| Finning International, Inc. | | | 323,583 | | | | 8,047,446 | |
| GEA Group AG | | | 745,431 | | | | 24,569,576 | |
| GLORY Ltd. | | | 85,400 | | | | 2,048,403 | |
| Neopost S.A. | | | 149,062 | | | | 8,930,943 | |
| Rotork PLC | | | 189,304 | | | | 8,353,005 | |
| Sinotruk (Hong Kong) Ltd. | | | 9,898,878 | | | | 5,342,681 | |
| Spirax-Sarco Engineering PLC | | | 266,398 | | | | 10,876,395 | |
| T.K. Corp. (a) | | | 749,514 | | | | 16,152,302 | |
| Thermax Ltd. | | | 656,296 | | | | 6,813,824 | |
| | | | | | | | |
| | | | | | | $ | 115,086,424 | |
| Medical & Health Technology & Services - 1.5% | | | | | | | | |
| Diagnosticos da America S.A. | | | 1,088,200 | | | $ | 6,230,573 | |
| Fleury S.A. | | | 581,200 | | | | 5,443,770 | |
| Hogy Medical Co. Ltd. | | | 45,900 | | | | 2,500,181 | |
| Kobayashi Pharmaceutical Co. Ltd. | | | 360,200 | | | | 17,382,767 | |
12
Portfolio of Investments (unaudited) – continued
| | | | | | | | |
| Issuer | | Shares/Par | | | Value ($) | |
| Common Stocks - continued | | | | | | | | |
| Medical & Health Technology & Services - continued | | | | | | | | |
| Miraca Holdings, Inc. | | | 550,200 | | | $ | 26,785,591 | |
| | | | | | | | |
| | | | | | | $ | 58,342,882 | |
| Medical Equipment - 2.4% | | | | | | | | |
| Fisher & Paykel Healthcare Corp. Ltd. | | | 9,796,600 | | | $ | 21,482,064 | |
| Nakanishi, Inc. | | | 83,700 | | | | 10,238,097 | |
| Nihon Kohden Corp. | | | 234,100 | | | | 8,152,984 | |
| Smith & Nephew PLC | | | 751,197 | | | | 8,674,686 | |
| Sonova Holding AG | | | 304,500 | | | | 36,546,417 | |
| Sysmex Corp. | | | 81,500 | | | | 5,010,459 | |
| William Demant Holdings A/S (a) | | | 19,310 | | | | 1,618,091 | |
| | | | | | | | |
| | | | | | | $ | 91,722,798 | |
| Metals & Mining - 1.1% | | | | | | | | |
| Iluka Resources Ltd. (l) | | | 2,627,033 | | | $ | 25,680,538 | |
| MOIL Ltd. | | | 1,489,646 | | | | 6,133,086 | |
| Usinas Siderurgicas de Minas Gerais S.A., “A”, IPS (a) | | | 1,973,000 | | | | 10,516,819 | |
| | | | | | | | |
| | | | | | | $ | 42,330,443 | |
| Network & Telecom - 0.9% | | | | | | | | |
| VTech Holdings Ltd. | | | 2,790,444 | | | $ | 34,021,476 | |
| | |
| Oil Services - 1.6% | | | | | | | | |
| AMEC PLC | | | 1,157,545 | | | $ | 18,573,260 | |
| Fugro N.V. | | | 156,796 | | | | 8,679,721 | |
| Global Ports Investments PLC, GDR | | | 334,708 | | | | 4,970,414 | |
| John Wood Group PLC | | | 848,627 | | | | 11,173,050 | |
| Petroleum Geo-Services ASA | | | 212,954 | | | | 3,295,244 | |
| Schoeller-Bleckmann Nooter Apparatetechnik GMBH | | | 76,590 | | | | 7,670,478 | |
| Technip | | | 85,010 | | | | 8,716,448 | |
| | | | | | | | |
| | | | | | | $ | 63,078,615 | |
| Other Banks & Diversified Financials - 4.7% | | | | | | | | |
| Aeon Credit Service Co. Ltd. | | | 655,400 | | | $ | 18,608,405 | |
| Canadian Western Bank | | | 302,011 | | | | 8,413,100 | |
| Chiba Bank Ltd. | | | 1,898,451 | | | | 13,606,439 | |
| Credicorp Ltd. | | | 178,004 | | | | 29,557,564 | |
| Federal Bank Ltd. | | | 2,013,395 | | | | 17,826,993 | |
| Julius Baer Group Ltd. | | | 158,923 | | | | 6,181,083 | |
| Jyske Bank (a) | | | 773,121 | | | | 26,323,086 | |
| Public Bank Berhad | | | 2,272,377 | | | | 11,958,719 | |
| Shizuoka Bank Ltd. | | | 920,000 | | | | 10,354,640 | |
| Sydbank A/S (a) | | | 1,105,069 | | | | 22,632,123 | |
13
Portfolio of Investments (unaudited) – continued
| | | | | | | | |
| Issuer | | Shares/Par | | | Value ($) | |
| Common Stocks - continued | | | | | | | | |
| Other Banks & Diversified Financials - continued | | | | | | | | |
| TISCO Financial Group Public Co. Ltd. | | | 1,675,382 | | | $ | 3,174,589 | |
| Wing Hang Bank | | | 1,236,160 | | | | 13,160,302 | |
| | | | | | | | |
| | | | | | | $ | 181,797,043 | |
| Pharmaceuticals - 2.0% | | | | | | | | |
| Genomma Lab Internacional S.A., “B” (a) | | | 4,554,491 | | | $ | 11,173,556 | |
| Hisamitsu Pharmaceutical Co., Inc. | | | 87,100 | | | | 4,753,599 | |
| Santen Pharmaceutical Co. Ltd. | | | 512,300 | | | | 24,206,148 | |
| Tsumura & Co. | | | 174,000 | | | | 6,420,153 | |
| Virbac SA | | | 134,256 | | | | 30,929,288 | |
| | | | | | | | |
| | | | | | | $ | 77,482,744 | |
| Pollution Control - 0.3% | | | | | | | | |
| Daiseki Co. Ltd. | | | 616,200 | | | $ | 10,357,237 | |
| | |
| Printing & Publishing - 0.1% | | | | | | | | |
| De La Rue PLC | | | 264,979 | | | $ | 3,929,593 | |
| | |
| Railroad & Shipping - 0.1% | | | | | | | | |
| Precious Shipping Public Co. Ltd. | | | 8,486,318 | | | $ | 5,273,164 | |
| | |
| Real Estate - 2.8% | | | | | | | | |
| Ascendas India Trust, REIT | | | 24,039,000 | | | $ | 16,010,112 | |
| Asian Property Development Public Co. Ltd. | | | 7,954,824 | | | | 2,512,193 | |
| Brasil Brokers Participacoes S.A. | | | 2,811,400 | | | | 10,055,347 | |
| Deutsche Wohnen AG | | | 1,218,278 | | | | 22,146,789 | |
| GSW Immobilien AG | | | 224,298 | | | | 8,873,796 | |
| Macquarie Mexico Real Estate S.A. de C.V., REIT (a) | | | 4,207,265 | | | | 9,395,792 | |
| Midland Holdings Ltd. | | | 33,339,351 | | | | 14,779,611 | |
| Multiplan Empreendimentos | | | 450,546 | | | | 12,768,842 | |
| Supalai PLC | | | 11,062,141 | | | | 7,742,366 | |
| TAG Immobilien AG | | | 364,930 | | | | 4,177,815 | |
| | | | | | | | |
| | | | | | | $ | 108,462,663 | |
| Restaurants - 1.2% | | | | | | | | |
| Ajisen (China) Holdings Ltd. | | | 11,874,037 | | | $ | 9,432,140 | |
| Arcos Dorados Holdings, Inc. | | | 622,279 | | | | 8,214,083 | |
| Domino’s Pizza UK & IRL PLC | | | 1,841,807 | | | | 16,861,162 | |
| Whitbread PLC | | | 320,233 | | | | 12,495,322 | |
| | | | | | | | |
| | | | | | | $ | 47,002,707 | |
| Special Products & Services - 0.4% | | | | | | | | |
| Filtrona PLC | | | 1,548,359 | | | $ | 17,127,319 | |
14
Portfolio of Investments (unaudited) – continued
| | | | | | | | |
| Issuer | | Shares/Par | | | Value ($) | |
| Common Stocks - continued | | | | | | | | |
| Specialty Chemicals - 5.3% | | | | | | | | |
| Air Water, Inc. | | | 337,000 | | | $ | 4,837,800 | |
| Chugoku Marine Paints Ltd. | | | 686,000 | | | | 3,627,394 | |
| Croda International PLC | | | 2,295,838 | | | | 95,687,097 | |
| Elementis PLC | | | 3,232,820 | | | | 12,805,864 | |
| Fuchs Petrolub AG, IPS | | | 218,168 | | | | 18,342,165 | |
| Japan Pure Chemical Co. Ltd. | | | 374 | | | | 877,617 | |
| Kansai Paint Co. Ltd. | | | 930,000 | | | | 10,328,945 | |
| Mexichem S.A.B de C.V. | | | 1,278,910 | | | | 6,880,606 | |
| Sika AG | | | 7,307 | | | | 17,755,471 | |
| SK KAKEN Co. Ltd. | | | 52,000 | | | | 2,722,022 | |
| Symrise AG | | | 785,955 | | | | 31,144,748 | |
| Tikkurila Oyj | | | 129,611 | | | | 2,725,046 | |
| | | | | | | | |
| | | | | | | $ | 207,734,775 | |
| Specialty Stores - 2.9% | | | | | | | | |
| ABC-Mart, Inc. | | | 325,000 | | | $ | 12,371,257 | |
| Cj O Shopping Co. Ltd. | | | 37,984 | | | | 10,215,879 | |
| Delticom AG | | | 38,633 | | | | 1,774,819 | |
| Esprit Holdings Ltd. | | | 3,136,999 | | | | 3,784,201 | |
| Hyundai Home Shopping Network Corp. | | | 50,309 | | | | 6,269,669 | |
| JB Hi-Fi Ltd. (l) | | | 472,392 | | | | 7,283,244 | |
| M.Video OJSC | | | 708,910 | | | | 5,630,676 | |
| MonotaRO Co. Ltd. | | | 332,300 | | | | 16,018,709 | |
| NEXT PLC | | | 465,480 | | | | 30,879,559 | |
| Nitori Co. Ltd. | | | 78,450 | | | | 5,997,452 | |
| Point, Inc. | | | 50,150 | | | | 2,470,758 | |
| Shimamura Co. Ltd. | | | 47,400 | | | | 5,596,602 | |
| Yamada Denki Co. Ltd. | | | 78,550 | | | | 3,582,207 | |
| | | | | | | | |
| | | | | | | $ | 111,875,032 | |
| Telecommunications - Wireless - 0.4% | | | | | | | | |
| TIM Participacoes S.A., ADR | | | 644,970 | | | $ | 14,111,944 | |
| | |
| Telephone Services - 1.0% | | | | | | | | |
| Bezeq - The Israel Telecommunication Corp. Ltd. | | | 4,489,125 | | | $ | 6,215,239 | |
| Empresa Nacional de Telecomunicaciones S.A. | | | 248,968 | | | | 5,267,797 | |
| PT XL Axiata Tbk | | | 37,931,387 | | | | 20,492,903 | |
| TDC A.S. | | | 805,600 | | | | 6,190,902 | |
| | | | | | | | |
| | | | | | | $ | 38,166,841 | |
| Tobacco - 0.4% | | | | | | | | |
| Swedish Match AB | | | 516,460 | | | $ | 16,013,466 | |
15
Portfolio of Investments (unaudited) – continued
| | | | | | | | |
| Issuer | | Shares/Par | | | Value ($) | |
| Common Stocks - continued | | | | | | | | |
| Trucking - 1.4% | | | | | | | | |
| DSV A.S. | | | 1,005,624 | | | $ | 24,296,074 | |
| Kintetsu World Express, Inc. | | | 192,900 | | | | 7,035,586 | |
| Yamato Holdings Co. Ltd. | | | 1,159,300 | | | | 21,418,369 | |
| | | | | | | | |
| | | | | | | $ | 52,750,029 | |
| Utilities - Electric Power - 0.6% | | | | | | | | |
| Energias do Brasil S.A. | | | 2,112,200 | | | $ | 13,251,792 | |
| Tractebel Energia S.A. | | | 595,500 | | | | 10,181,675 | |
| | | | | | | | |
| | | | | | | $ | 23,433,467 | |
| Utilities - Water - 0.2% | | | | | | | | |
| Aguas Andinas S.A., “A” | | | 10,864,894 | | | $ | 8,514,266 | |
| Total Common Stocks (Identified Cost, $2,929,488,314) | | | $ | 3,729,184,029 | |
| | |
| Collateral for Securities Loaned - 0.5% | | | | | | | | |
| Morgan Stanley, Repurchase Agreement, 0.19%, dated 3/28/13, due 4/1/13, total to be received $20,594,182 (secured by U.S. Treasury and Federal Agency obligations valued at $21,005,629 in an individually traded account), at Cost and Value | | $ | 20,593,747 | | | $ | 20,593,747 | |
| | |
| Money Market Funds - 4.1% | | | | | | | | |
MFS Institutional Money Market Portfolio, 0.14%,
at Cost and Net Asset Value (v) | | | 157,132,620 | | | $ | 157,132,620 | |
| Total Investments (Identified Cost, $3,107,214,681) | | | | | | $ | 3,906,910,396 | |
| | |
| Other Assets, Less Liabilities - (0.4)% | | | | | | | (16,425,020 | ) |
| Net Assets - 100.0% | | | | | | $ | 3,890,485,376 | |
| (a) | Non-income producing security. |
| (l) | A portion of this security is on loan. |
| (v) | Underlying affiliated fund that is available only to investment companies managed by MFS. The rate quoted for the MFS Institutional Money Market Portfolio is the annualized seven-day yield of the fund at period end. |
The following abbreviations are used in this report and are defined:
| ADR | | American Depositary Receipt |
| GDR | | Global Depositary Receipt |
| IEU | | International Equity Unit |
| IPS | | International Preference Stock |
| PLC | | Public Limited Company |
| REIT | | Real Estate Investment Trust |
See Notes to Financial Statements
16
Financial Statements
STATEMENT OF ASSETS AND LIABILITIES
At 3/31/13 (unaudited)
This statement represents your fund’s balance sheet, which details the assets and liabilities comprising the total value of the fund.
| | | | |
| Assets | | | | |
Investments- | | | | |
Non-affiliated issuers, at value (identified cost, $2,950,082,061) | | | $3,749,777,776 | |
Underlying affiliated funds, at cost and value | | | 157,132,620 | |
Total investments, at value, including $19,037,422 of securities on loan
(identified cost, $3,107,214,681) | | | $3,906,910,396 | |
Foreign currency, at value (identified cost, $671,505) | | | 667,760 | |
Receivables for | | | | |
Investments sold | | | 1,964 | |
Fund shares sold | | | 16,660,238 | |
Interest and dividends | | | 9,570,962 | |
Other assets | | | 18,741 | |
Total assets | | | $3,933,830,061 | |
| Liabilities | | | | |
Payable to custodian | | | $342,660 | |
Payables for | | | | |
Investments purchased | | | 10,163,430 | |
Fund shares reacquired | | | 4,367,199 | |
Collateral for securities loaned, at value | | | 20,593,747 | |
Payable to affiliates | | | | |
Investment adviser | | | 524,460 | |
Shareholder servicing costs | | | 1,716,719 | |
Distribution and service fees | | | 89,922 | |
Program manager fees | | | 52 | |
Payable for independent Trustees’ compensation | | | 10,427 | |
Deferred country tax expense payable | | | 5,175,618 | |
Accrued expenses and other liabilities | | | 360,451 | |
Total liabilities | | | $43,344,685 | |
Net assets | | | $3,890,485,376 | |
| Net assets consist of | | | | |
Paid-in capital | | | $3,355,526,357 | |
Unrealized appreciation (depreciation) on investments and translation of assets and liabilities in foreign currencies (net of $5,175,618 deferred country tax) | | | 798,471,288 | |
Accumulated net realized gain (loss) on investments and foreign currency | | | (265,419,965 | ) |
Undistributed net investment income | | | 1,907,696 | |
Net assets | | | $3,890,485,376 | |
Shares of beneficial interest outstanding | | | 151,174,977 | |
17
Statement of Assets and Liabilities (unaudited) – continued
| | | | | | | | | | | | |
| | | Net assets | | | Shares
outstanding | | | Net asset value
per share (a) | |
Class A | | | $1,454,947,604 | | | | 57,001,337 | | | | $25.52 | |
Class B | | | 39,026,151 | | | | 1,581,755 | | | | 24.67 | |
Class C | | | 169,962,263 | | | | 6,955,671 | | | | 24.44 | |
Class I | | | 1,132,892,474 | | | | 43,206,514 | | | | 26.22 | |
Class R1 | | | 6,506,179 | | | | 272,767 | | | | 23.85 | |
Class R2 | | | 63,667,355 | | | | 2,556,192 | | | | 24.91 | |
Class R3 | | | 129,154,966 | | | | 5,094,324 | | | | 25.35 | |
Class R4 | | | 365,767,648 | | | | 14,336,450 | | | | 25.51 | |
Class R5 | | | 520,851,053 | | | | 19,857,903 | | | | 26.23 | |
Class 529A | | | 5,266,617 | | | | 209,300 | | | | 25.16 | |
Class 529B | | | 691,843 | | | | 29,029 | | | | 23.83 | |
Class 529C | | | 1,751,223 | | | | 73,735 | | | | 23.75 | |
| (a) | Maximum offering price per share was equal to the net asset value per share for all share classes, except for Classes A and 529A, for which the maximum offering prices per share were $27.08 [100 / 94.25 x $25.52] and $26.69 [100 / 94.25 x $25.16], respectively. On sales of $50,000 or more, the maximum offering prices of Class A and Class 529A shares are reduced. A contingent deferred sales charge may be imposed on redemptions of Class A, Class B, Class C, Class 529B, and Class 529C shares. Redemption price per share was equal to the net asset value per share for Classes I, R1, R2, R3, R4, R5, and 529A. |
See Notes to Financial Statements
18
Financial Statements
STATEMENT OF OPERATIONS
Six months ended 3/31/13 (unaudited)
This statement describes how much your fund earned in investment income and accrued in expenses. It also describes any gains and/or losses generated by fund operations.
| | | | |
| Net investment income | | | | |
Income | | | | |
Dividends | | | $25,291,108 | |
Interest | | | 271,140 | |
Dividends from underlying affiliated funds | | | 576,315 | |
Foreign taxes withheld | | | (1,015,639 | ) |
Total investment income | | | $25,122,924 | |
Expenses | | | | |
Management fee | | | $16,597,513 | |
Distribution and service fees | | | 2,987,074 | |
Program manager fees | | | 3,593 | |
Shareholder servicing costs | | | 1,866,718 | |
Administrative services fee | | | 232,435 | |
Independent Trustees’ compensation | | | 26,685 | |
Custodian fee | | | 543,433 | |
Shareholder communications | | | 86,705 | |
Audit and tax fees | | | 29,607 | |
Legal fees | | | 19,489 | |
Miscellaneous | | | 189,384 | |
Total expenses | | | $22,582,636 | |
Fees paid indirectly | | | (140 | ) |
Reduction of expenses by investment adviser and distributor | | | (5,436 | ) |
Net expenses | | | $22,577,060 | |
Net investment income | | | $2,545,864 | |
| Realized and unrealized gain (loss) on investments and foreign currency | |
Realized gain (loss) (identified cost basis) | | | | |
Investments (net of $1,237,408 country tax) | | | $112,374,539 | |
Foreign currency | | | (385,328 | ) |
Net realized gain (loss) on investments and foreign currency | | | $111,989,211 | |
Change in unrealized appreciation (depreciation) | | | | |
Investments (net of $2,227,089 increase in deferred country tax) | | | $267,872,754 | |
Translation of assets and liabilities in foreign currencies | | | (15,784 | ) |
Net unrealized gain (loss) on investments and foreign currency translation | | | $267,856,970 | |
Net realized and unrealized gain (loss) on investments and foreign currency | | | $379,846,181 | |
Change in net assets from operations | | | $382,392,045 | |
See Notes to Financial Statements
19
Financial Statements
STATEMENTS OF CHANGES IN NET ASSETS
These statements describe the increases and/or decreases in net assets resulting from operations, any distributions, and any shareholder transactions.
| | | | | | | | |
| Change in net assets | | Six months ended
3/31/13
(unaudited) | | | Year ended
9/30/12 | |
| From operations | | | | | | | | |
Net investment income | | | $2,545,864 | | | | $36,821,969 | |
Net realized gain (loss) on investments and foreign currency | | | 111,989,211 | | | | 20,843,334 | |
Net unrealized gain (loss) on investments and foreign currency translation | | | 267,856,970 | | | | 563,995,366 | |
Change in net assets from operations | | | $382,392,045 | | | | $621,660,669 | |
| Distributions declared to shareholders | | | | | | | | |
From net investment income | | | $(40,380,082 | ) | | | $(31,029,975 | ) |
Change in net assets from fund share transactions | | | $198,937,878 | | | | $264,394,944 | |
Total change in net assets | | | $540,949,841 | | | | $855,025,638 | |
| Net assets | | | | | | | | |
At beginning of period | | | 3,349,535,535 | | | | 2,494,509,897 | |
At end of period (including undistributed net investment income of $1,907,696 and $39,741,914, respectively) | | | $3,890,485,376 | | | | $3,349,535,535 | |
See Notes to Financial Statements
20
Financial Statements
FINANCIAL HIGHLIGHTS
The financial highlights table is intended to help you understand the fund’s financial performance for the semiannual period and the past 5 fiscal years (or life of a particular share class, if shorter). Certain information reflects financial results for a single fund share. The total returns in the table represent the rate by which an investor would have earned (or lost) on an investment in the fund share class (assuming reinvestment of all distributions) held for the entire period.
| | | | | | | | | | | | | | | | | | | | | | | | |
| | | Six months
ended
3/31/13 (unaudited) | | | Years ended 9/30 | |
| Class A | | | 2012 | | | 2011 | | | 2010 | | | 2009 | | | 2008 | |
| | | | | | | | | | | | | | | | | |
Net asset value, beginning of
period | | | $23.23 | | | | $18.94 | | | | $20.24 | | | | $17.43 | | | | $17.39 | | | | $30.87 | |
| Income (loss) from investment operations | | | | | | | | | | | | | | | | | |
Net investment income (d) | | | $0.01 | | | | $0.25 | | | | $0.24 | | | | $0.21 | | | | $0.20 | | | | $0.27 | |
Net realized and unrealized
gain (loss) on investments
and foreign currency | | | 2.54 | | | | 4.28 | | | | (1.34 | ) | | | 2.80 | | | | 1.05 | | | | (8.25 | ) |
Total from investment operations | | | $2.55 | | | | $4.53 | | | | $(1.10 | ) | | | $3.01 | | | | $1.25 | | | | $(7.98 | ) |
| Less distributions declared to shareholders | | | | | | | | | | | | | | | | | |
From net investment income | | | $(0.26 | ) | | | $(0.24 | ) | | | $(0.20 | ) | | | $(0.20 | ) | | | $(0.26 | ) | | | $(0.27 | ) |
From net realized gain on
investments | | | — | | | | — | | | | — | | | | — | | | | (0.95 | ) | | | (5.23 | ) |
Total distributions declared to
shareholders | | | $(0.26 | ) | | | $(0.24 | ) | | | $(0.20 | ) | | | $(0.20 | ) | | | $(1.21 | ) | | | $(5.50 | ) |
Net asset value, end of period (x) | | | $25.52 | | | | $23.23 | | | | $18.94 | | | | $20.24 | | | | $17.43 | | | | $17.39 | |
Total return (%) (r)(s)(t)(x) | | | 11.06 | (n) | | | 24.13 | | | | (5.53 | ) | | | 17.43 | | | | 9.88 | | | | (31.08 | ) |
Ratios (%) (to average net assets)
and Supplemental data: | | | | | | | | | | | | | | | | | | | | | |
Expenses before expense
reductions (f) | | | 1.36 | (a) | | | 1.41 | | | | 1.43 | | | | 1.44 | | | | 1.54 | | | | 1.50 | |
Expenses after expense
reductions (f) | | | 1.36 | (a) | | | 1.41 | | | | 1.42 | | | | 1.44 | | | | 1.52 | | | | 1.45 | |
Net investment income | | | 0.05 | (a) | | | 1.19 | | | | 1.12 | | | | 1.14 | | | | 1.48 | | | | 1.14 | |
Portfolio turnover | | | 9 | (n) | | | 21 | | | | 44 | | | | 34 | | | | 42 | | | | 66 | |
Net assets at end of period
(000 omitted) | | | $1,454,948 | | | | $1,309,494 | | | | $1,199,483 | | | | $1,359,614 | | | | $1,253,375 | | | | $1,472,636 | |
See Notes to Financial Statements
21
Financial Highlights – continued
| | | | | | | | | | | | | | | | | | | | | | | | |
| | | Six months
ended
3/31/13 (unaudited) | | | Years ended 9/30 | |
| Class B | | | 2012 | | | 2011 | | | 2010 | | | 2009 | | | 2008 | |
| | | | | | | | | | | | | | | | | |
Net asset value, beginning of
period | | | $22.34 | | | | $18.15 | | | | $19.38 | | | | $16.70 | | | | $16.66 | | | | $29.76 | |
| Income (loss) from investment operations | | | | | | | | | | | | | | | | | |
Net investment income (loss) (d) | | | $(0.09 | ) | | | $0.07 | | | | $0.07 | | | | $0.06 | | | | $0.09 | | | | $0.10 | |
Net realized and unrealized
gain (loss) on investments
and foreign currency | | | 2.46 | | | | 4.14 | | | | (1.27 | ) | | | 2.70 | | | | 1.02 | | | | (7.93 | ) |
Total from investment operations | | | $2.37 | | | | $4.21 | | | | $(1.20 | ) | | | $2.76 | | | | $1.11 | | | | $(7.83 | ) |
| Less distributions declared to shareholders | | | | | | | | | | | | | | | | | |
From net investment income | | | $(0.04 | ) | | | $(0.02 | ) | | | $(0.03 | ) | | | $(0.08 | ) | | | $(0.12 | ) | | | $(0.04 | ) |
From net realized gain on
investments | | | — | | | | — | | | | — | | | | — | | | | (0.95 | ) | | | (5.23 | ) |
Total distributions declared to
shareholders | | | $(0.04 | ) | | | $(0.02 | ) | | | $(0.03 | ) | | | $(0.08 | ) | | | $(1.07 | ) | | | $(5.27 | ) |
Net asset value, end of period (x) | | | $24.67 | | | | $22.34 | | | | $18.15 | | | | $19.38 | | | | $16.70 | | | | $16.66 | |
Total return (%) (r)(s)(t)(x) | | | 10.63 | (n) | | | 23.21 | | | | (6.21 | ) | | | 16.59 | | | | 9.05 | | | | (31.57 | ) |
Ratios (%) (to average net assets)
and Supplemental data: | | | | | | | | | | | | | | | | | |
Expenses before expense
reductions (f) | | | 2.11 | (a) | | | 2.16 | | | | 2.17 | | | | 2.19 | | | | 2.26 | | | | 2.15 | |
Expenses after expense
reductions (f) | | | 2.11 | (a) | | | 2.16 | | | | 2.17 | | | | 2.19 | | | | 2.26 | | | | 2.15 | |
Net investment income (loss) | | | (0.74 | )(a) | | | 0.36 | | | | 0.32 | | | | 0.33 | | | | 0.70 | | | | 0.42 | |
Portfolio turnover | | | 9 | (n) | | | 21 | | | | 44 | | | | 34 | | | | 42 | | | | 66 | |
Net assets at end of period
(000 omitted) | | | $39,026 | | | | $45,496 | | | | $57,379 | | | | $85,229 | | | | $101,608 | | | | $143,620 | |
See Notes to Financial Statements
22
Financial Highlights – continued
| | | | | | | | | | | | | | | | | | | | | | | | |
| | | Six months
ended
3/31/13 (unaudited) | | | Years ended 9/30 | |
| Class C | | | 2012 | | | 2011 | | | 2010 | | | 2009 | | | 2008 | |
| | | | | | | | | | | | | | | | | |
Net asset value, beginning of
period | | | $22.17 | | | | $18.06 | | | | $19.31 | | | | $16.66 | | | | $16.61 | | | | $29.69 | |
| Income (loss) from investment operations | | | | | | | | | | | | | | | | | |
Net investment income (loss) (d) | | | $(0.08 | ) | | | $0.09 | | | | $0.08 | | | | $0.07 | | | | $0.09 | | | | $0.09 | |
Net realized and unrealized
gain (loss) on investments
and foreign currency | | | 2.45 | | | | 4.08 | | | | (1.27 | ) | | | 2.68 | | | | 1.01 | | | | (7.89 | ) |
Total from investment operations | | | $2.37 | | | | $4.17 | | | | $(1.19 | ) | | | $2.75 | | | | $1.10 | | | | $(7.80 | ) |
| Less distributions declared to shareholders | | | | | | | | | | | | | | | | | |
From net investment income | | | $(0.10 | ) | | | $(0.06 | ) | | | $(0.06 | ) | | | $(0.10 | ) | | | $(0.10 | ) | | | $(0.05 | ) |
From net realized gain on
investments | | | — | | | | — | | | | — | | | | — | | | | (0.95 | ) | | | (5.23 | ) |
Total distributions declared to
shareholders | | | $(0.10 | ) | | | $(0.06 | ) | | | $(0.06 | ) | | | $(0.10 | ) | | | $(1.05 | ) | | | $(5.28 | ) |
Net asset value, end of period (x) | | | $24.44 | | | | $22.17 | | | | $18.06 | | | | $19.31 | | | | $16.66 | | | | $16.61 | |
Total return (%) (r)(s)(t)(x) | | | 10.71 | (n) | | | 23.17 | | | | (6.20 | ) | | | 16.57 | | | | 9.04 | | | | (31.55 | ) |
Ratios (%) (to average net assets)
and Supplemental data: | | | | | | | | | | | | | | | | | |
Expenses before expense
reductions (f) | | | 2.11 | (a) | | | 2.16 | | | | 2.18 | | | | 2.19 | | | | 2.26 | | | | 2.15 | |
Expenses after expense
reductions (f) | | | 2.11 | (a) | | | 2.16 | | | | 2.17 | | | | 2.19 | | | | 2.26 | | | | 2.15 | |
Net investment income | | | (0.70 | )(a) | | | 0.45 | | | | 0.37 | | | | 0.38 | | | | 0.71 | | | | 0.41 | |
Portfolio turnover | | | 9 | (n) | | | 21 | | | | 44 | | | | 34 | | | | 42 | | | | 66 | |
Net assets at end of period
(000 omitted) | | | $169,962 | | | | $152,757 | | | | $142,778 | | | | $170,747 | | | | $166,342 | | | | $220,821 | |
See Notes to Financial Statements
23
Financial Highlights – continued
| | | | | | | | | | | | | | | | | | | | | | | | |
| | | Six months
ended
3/31/13 (unaudited) | | | Years ended 9/30 | |
| Class I | | | 2012 | | | 2011 | | | 2010 | | | 2009 | | | 2008 | |
| | | | | | | | | | | | | | | | | |
Net asset value, beginning of
period | | | $23.88 | | | | $19.48 | | | | $20.80 | | | | $17.90 | | | | $17.85 | | | | $31.55 | |
| Income (loss) from investment operations | | | | | | | | | | | | | | | | | |
Net investment income (d) | | | $0.04 | | | | $0.33 | | | | $0.32 | | | | $0.27 | | | | $0.23 | | | | $0.37 | |
Net realized and unrealized
gain (loss) on investments
and foreign currency | | | 2.62 | | | | 4.37 | | | | (1.39 | ) | | | 2.87 | | | | 1.09 | | | | (8.48 | ) |
Total from investment operations | | | $2.66 | | | | $4.70 | | | | $(1.07 | ) | | | $3.14 | | | | $1.32 | | | | $(8.11 | ) |
| Less distributions declared to shareholders | | | | | | | | | | | | | | | | | |
From net investment income | | | $(0.32 | ) | | | $(0.30 | ) | | | $(0.25 | ) | | | $(0.24 | ) | | | $(0.32 | ) | | | $(0.36 | ) |
From net realized gain on
investments | | | — | | | | — | | | | — | | | | — | | | | (0.95 | ) | | | (5.23 | ) |
Total distributions declared to
shareholders | | | $(0.32 | ) | | | $(0.30 | ) | | | $(0.25 | ) | | | $(0.24 | ) | | | $(1.27 | ) | | | $(5.59 | ) |
Net asset value, end of period (x) | | | $26.22 | | | | $23.88 | | | | $19.48 | | | | $20.80 | | | | $17.90 | | | | $17.85 | |
Total return (%) (r)(s)(x) | | | 11.23 | (n) | | | 24.40 | | | | (5.27 | ) | | | 17.72 | | | | 10.19 | | | | (30.87 | ) |
Ratios (%) (to average net assets)
and Supplemental data: | | | | | | | | | | | | | | | | | |
Expenses before expense
reductions (f) | | | 1.11 | (a) | | | 1.16 | | | | 1.18 | | | | 1.19 | | | | 1.26 | | | | 1.15 | |
Expenses after expense
reductions (f) | | | 1.11 | (a) | | | 1.16 | | | | 1.18 | | | | 1.19 | | | | 1.26 | | | | 1.15 | |
Net investment income | | | 0.29 | (a) | | | 1.52 | | | | 1.42 | | | | 1.42 | | | | 1.66 | | | | 1.51 | |
Portfolio turnover | | | 9 | (n) | | | 21 | | | | 44 | | | | 34 | | | | 42 | | | | 66 | |
Net assets at end of period
(000 omitted) | | | $1,132,892 | | | | $968,523 | | | | $845,262 | | | | $774,647 | | | | $584,559 | | | | $691,978 | |
See Notes to Financial Statements
24
Financial Highlights – continued
| | | | | | | | | | | | | | | | | | | | | | | | |
| | | Six months
ended
3/31/13 (unaudited) | | | Years ended 9/30 | |
| Class R1 | | | 2012 | | | 2011 | | | 2010 | | | 2009 | | | 2008 | |
| | | | | | | | | | | | | | | | | |
Net asset value, beginning of
period | | | $21.64 | | | | $17.65 | | | | $18.89 | | | | $16.33 | | | | $16.37 | | | | $29.42 | |
| Income (loss) from investment operations | | | | | | | | | | | | | | | | | |
Net investment income (loss) (d) | | | $(0.06 | ) | | | $0.09 | | | | $0.07 | | | | $0.07 | | | | $0.10 | | | | $0.10 | |
Net realized and unrealized
gain (loss) on investments
and foreign currency | | | 2.36 | | | | 3.99 | | | | (1.24 | ) | | | 2.61 | | | | 0.97 | | | | (7.79 | ) |
Total from investment operations | | | $2.30 | | | | $4.08 | | | | $(1.17 | ) | | | $2.68 | | | | $1.07 | | | | $(7.69 | ) |
| Less distributions declared to shareholders | | | | | | | | | | | | | | | | | |
From net investment income | | | $(0.09 | ) | | | $(0.09 | ) | | | $(0.07 | ) | | | $(0.12 | ) | | | $(0.16 | ) | | | $(0.13 | ) |
From net realized gain on
investments | | | — | | | | — | | | | — | | | | — | | | | (0.95 | ) | | | (5.23 | ) |
Total distributions declared to
shareholders | | | $(0.09 | ) | | | $(0.09 | ) | | | $(0.07 | ) | | | $(0.12 | ) | | | $(1.11 | ) | | | $(5.36 | ) |
Net asset value, end of period (x) | | | $23.85 | | | | $21.64 | | | | $17.65 | | | | $18.89 | | | | $16.33 | | | | $16.37 | |
Total return (%) (r)(s)(x) | | | 10.68 | (n) | | | 23.20 | | | | (6.21 | ) | | | 16.51 | | | | 9.07 | | | | (31.54 | ) |
Ratios (%) (to average net assets)
and Supplemental data: | | | | | | | | | | | | | | | | | |
Expenses before expense
reductions (f) | | | 2.11 | (a) | | | 2.16 | | | | 2.18 | | | | 2.19 | | | | 2.25 | | | | 2.20 | |
Expenses after expense
reductions (f) | | | 2.11 | (a) | | | 2.16 | | | | 2.18 | | | | 2.19 | | | | 2.25 | | | | 2.20 | |
Net investment income | | | (0.51 | )(a) | | | 0.46 | | | | 0.35 | | | | 0.41 | | | | 0.80 | | | | 0.44 | |
Portfolio turnover | | | 9 | (n) | | | 21 | | | | 44 | | | | 34 | | | | 42 | | | | 66 | |
Net assets at end of period
(000 omitted) | | | $6,506 | | | | $2,869 | | | | $2,560 | | | | $2,881 | | | | $2,476 | | | | $2,399 | |
See Notes to Financial Statements
25
Financial Highlights – continued
| | | | | | | | | | | | | | | | | | | | | | | | |
| | | Six months
ended
3/31/13 (unaudited) | | | Years ended 9/30 | |
| Class R2 | | | 2012 | | | 2011 | | | 2010 | | | 2009 | | | 2008 | |
| | | | | | | | | | | | | | | | | |
Net asset value, beginning of
period | | | $22.66 | | | | $18.47 | | | | $19.75 | | | | $17.02 | | | | $17.04 | | | | $30.35 | |
| Income (loss) from investment operations | | | | | | | | | | | | | | | | | |
Net investment income (loss) (d) | | | $(0.02 | ) | | | $0.20 | | | | $0.19 | | | | $0.16 | | | | $0.17 | | | | $0.29 | |
Net realized and unrealized
gain (loss) on investments
and foreign currency | | | 2.49 | | | | 4.17 | | | | (1.31 | ) | | | 2.74 | | | | 1.00 | | | | (8.18 | ) |
Total from investment operations | | | $2.47 | | | | $4.37 | | | | $(1.12 | ) | | | $2.90 | | | | $1.17 | | | | $(7.89 | ) |
| Less distributions declared to shareholders | | | | | | | | | | | | | | | | | |
From net investment income | | | $(0.22 | ) | | | $(0.18 | ) | | | $(0.16 | ) | | | $(0.17 | ) | | | $(0.24 | ) | | | $(0.19 | ) |
From net realized gain on
investments | | | — | | | | — | | | | — | | | | — | | | | (0.95 | ) | | | (5.23 | ) |
Total distributions declared to
shareholders | | | $(0.22 | ) | | | $(0.18 | ) | | | $(0.16 | ) | | | $(0.17 | ) | | | $(1.19 | ) | | | $(5.42 | ) |
Net asset value, end of period (x) | | | $24.91 | | | | $22.66 | | | | $18.47 | | | | $19.75 | | | | $17.02 | | | | $17.04 | |
Total return (%) (r)(s)(x) | | | 10.96 | (n) | | | 23.82 | | | | (5.76 | ) | | | 17.17 | | | | 9.58 | | | | (31.24 | ) |
Ratios (%) (to average net assets)
and Supplemental data: | | | | | | | | | | | | | | | | | |
Expenses before expense
reductions (f) | | | 1.61 | (a) | | | 1.66 | | | | 1.68 | | | | 1.69 | | | | 1.75 | | | | 1.68 | |
Expenses after expense
reductions (f) | | | 1.61 | (a) | | | 1.66 | | | | 1.67 | | | | 1.69 | | | | 1.75 | | | | 1.68 | |
Net investment income | | | (0.19 | )(a) | | | 0.99 | | | | 0.91 | | | | 0.89 | | | | 1.27 | | | | 1.27 | |
Portfolio turnover | | | 9 | (n) | | | 21 | | | | 44 | | | | 34 | | | | 42 | | | | 66 | |
Net assets at end of period
(000 omitted) | | | $63,667 | | | | $48,637 | | | | $40,259 | | | | $42,679 | | | | $39,097 | | | | $44,529 | |
See Notes to Financial Statements
26
Financial Highlights – continued
| | | | | | | | | | | | | | | | | | | | | | | | |
| | | Six months
ended
3/31/13 (unaudited) | | | Years ended 9/30 | |
| Class R3 | | | 2012 | | | 2011 | | | 2010 | | | 2009 | | | 2008 | |
| | | | | | | | | | | | | | | | | |
Net asset value, beginning of
period | | | $23.09 | | | | $18.85 | | | | $20.16 | | | | $17.36 | | | | $17.34 | | | | $30.82 | |
| Income (loss) from investment operations | | | | | | | | | | | | | | | | | |
Net investment income (d) | | | $0.01 | | | | $0.27 | | | | $0.32 | | | | $0.21 | | | | $0.21 | | | | $0.29 | |
Net realized and unrealized
gain (loss) on investments
and foreign currency | | | 2.52 | | | | 4.23 | | | | (1.42 | ) | | | 2.80 | | | | 1.04 | | | | (8.27 | ) |
Total from investment operations | | | $2.53 | | | | $4.50 | | | | $(1.10 | ) | | | $3.01 | | | | $1.25 | | | | $(7.98 | ) |
| Less distributions declared to shareholders | | | | | | | | | | | | | | | | | |
From net investment income | | | $(0.27 | ) | | | $(0.26 | ) | | | $(0.21 | ) | | | $(0.21 | ) | | | $(0.28 | ) | | | $(0.27 | ) |
From net realized gain on
investments | | | — | | | | — | | | | — | | | | — | | | | (0.95 | ) | | | (5.23 | ) |
Total distributions declared to
shareholders | | | $(0.27 | ) | | | $(0.26 | ) | | | $(0.21 | ) | | | $(0.21 | ) | | | $(1.23 | ) | | | $(5.50 | ) |
Net asset value, end of period (x) | | | $25.35 | | | | $23.09 | | | | $18.85 | | | | $20.16 | | | | $17.36 | | | | $17.34 | |
Total return (%) (r)(s)(x) | | | 11.05 | (n) | | | 24.15 | | | | (5.55 | ) | | | 17.48 | | | | 9.92 | | | | (31.12 | ) |
Ratios (%) (to average net assets)
and Supplemental data: | | | | | | | | | | | | | | | | | |
Expenses before expense
reductions (f) | | | 1.36 | (a) | | | 1.41 | | | | 1.44 | | | | 1.44 | | | | 1.50 | | | | 1.44 | |
Expenses after expense
reductions (f) | | | 1.36 | (a) | | | 1.41 | | | | 1.44 | | | | 1.44 | | | | 1.50 | | | | 1.44 | |
Net investment income | | | 0.08 | (a) | | | 1.29 | | | | 1.46 | | | | 1.18 | | | | 1.55 | | | | 1.25 | |
Portfolio turnover | | | 9 | (n) | | | 21 | | | | 44 | | | | 34 | | | | 42 | | | | 66 | |
Net assets at end of period
(000 omitted) | | | $129,155 | | | | $93,526 | | | | $57,720 | | | | $21,895 | | | | $15,821 | | | | $15,391 | |
See Notes to Financial Statements
27
Financial Highlights – continued
| | | | | | | | | | | | | | | | | | | | | | | | |
| | | Six months
ended
3/31/13 (unaudited) | | | Years ended 9/30 | |
| Class R4 | | | 2012 | | | 2011 | | | 2010 | | | 2009 | | | 2008 | |
| | | | | | | | | | | | | | | | | |
Net asset value, beginning of
period | | | $23.25 | | | | $18.97 | | | | $20.26 | | | | $17.44 | | | | $17.43 | | | | $30.92 | |
| Income (loss) from investment operations | | | | | | | | | | | | | | | | | |
Net investment income (d) | | | $0.04 | | | | $0.34 | | | | $0.35 | | | | $0.29 | | | | $0.27 | | | | $0.35 | |
Net realized and unrealized
gain (loss) on investments
and foreign currency | | | 2.54 | | | | 4.24 | | | | (1.39 | ) | | | 2.77 | | | | 1.01 | | | | (8.28 | ) |
Total from investment operations | | | $2.58 | | | | $4.58 | | | | $(1.04 | ) | | | $3.06 | | | | $1.28 | | | | $(7.93 | ) |
| Less distributions declared to shareholders | | | | | | | | | | | | | | | | | |
From net investment income | | | $(0.32 | ) | | | $(0.30 | ) | | | $(0.25 | ) | | | $(0.24 | ) | | | $(0.32 | ) | | | $(0.33 | ) |
From net realized gain on
investments | | | — | | | | — | | | | — | | | | — | | | | (0.95 | ) | | | (5.23 | ) |
Total distributions declared to
shareholders | | | $(0.32 | ) | | | $(0.30 | ) | | | $(0.25 | ) | | | $(0.24 | ) | | | $(1.27 | ) | | | $(5.56 | ) |
Net asset value, end of period (x) | | | $25.51 | | | | $23.25 | | | | $18.97 | | | | $20.26 | | | | $17.44 | | | | $17.43 | |
Total return (%) (r)(s)(x) | | | 11.19 | (n) | | | 24.42 | | | | (5.26 | ) | | | 17.73 | | | | 10.20 | | | | (30.90 | ) |
Ratios (%) (to average net assets)
and Supplemental data: | | | | | | | | | | | | | | | | | |
Expenses before expense
reductions (f) | | | 1.11 | (a) | | | 1.16 | | | | 1.19 | | | | 1.20 | | | | 1.24 | | | | 1.18 | |
Expenses after expense
reductions (f) | | | 1.11 | (a) | | | 1.16 | | | | 1.19 | | | | 1.20 | | | | 1.24 | | | | 1.18 | |
Net investment income | | | 0.31 | (a) | | | 1.60 | | | | 1.61 | | | | 1.56 | | | | 1.96 | | | | 1.45 | |
Portfolio turnover | | | 9 | (n) | | | 21 | | | | 44 | | | | 34 | | | | 42 | | | | 66 | |
Net assets at end of period
(000 omitted) | | | $365,768 | | | | $282,570 | | | | $143,620 | | | | $50,050 | | | | $21,166 | | | | $13,716 | |
See Notes to Financial Statements
28
Financial Highlights – continued
| | | | | | | | |
| Class R5 | | Six months
ended
3/31/13 (unaudited) | | | Period ended
9/30/12 (i)
| |
Net asset value, beginning of period | | | $23.88 | | | | $21.12 | |
| Income (loss) from investment operations | | | | | | | | |
Net investment income (d) | | | $0.05 | | | | $0.12 | |
Net realized and unrealized gain (loss) on investments and
foreign currency | | | 2.62 | | | | 2.64 | (g) |
Total from investment operations | | | $2.67 | | | | $2.76 | |
| Less distributions declared to shareholders | | | | | | | | |
From net investment income | | | $(0.32 | ) | | | $— | |
Net asset value, end of period (x) | | | $26.23 | | | | $23.88 | |
Total return (%) (r)(s)(x) | | | 11.30 | (n) | | | 13.07 | (n) |
Ratios (%) (to average net assets)
and Supplemental data: | | | | | | | | |
Expenses before expense reductions (f) | | | 1.02 | (a) | | | 1.05 | (a) |
Expenses after expense reductions (f) | | | 1.02 | (a) | | | 1.05 | (a) |
Net investment income | | | 0.40 | (a) | | | 1.61 | (a) |
Portfolio turnover | | | 9 | (n) | | | 21 | |
Net assets at end of period (000 omitted) | | | $520,851 | | | | $438,906 | |
See Notes to Financial Statements
29
Financial Highlights – continued
| | | | | | | | | | | | | | | | | | | | | | | | |
| | | Six months
ended
3/31/13 (unaudited) | | | Years ended 9/30 | |
| Class 529A | | | 2012 | | | 2011 | | | 2010 | | | 2009 | | | 2008 | |
| | | | | | | | | | | | | | | | | |
Net asset value, beginning of
period | | | $22.90 | | | | $18.68 | | | | $19.97 | | | | $17.21 | | | | $17.18 | | | | $30.54 | |
| Income (loss) from investment operations | | | | | | | | | | | | | | | | | |
Net investment income (d) | | | $(0.00 | )(w) | | | $0.25 | | | | $0.23 | | | | $0.20 | | | | $0.19 | | | | $0.23 | |
Net realized and unrealized
gain (loss) on investments
and foreign currency | | | 2.51 | | | | 4.20 | | | | (1.33 | ) | | | 2.75 | | | | 1.03 | | | | (8.17 | ) |
Total from investment operations | | | $2.51 | | | | $4.45 | | | | $(1.10 | ) | | | $2.95 | | | | $1.22 | | | | $(7.94 | ) |
| Less distributions declared to shareholders | | | | | | | | | | | | | | | | | |
From net investment income | | | $(0.25 | ) | | | $(0.23 | ) | | | $(0.19 | ) | | | $(0.19 | ) | | | $(0.24 | ) | | | $(0.19 | ) |
From net realized gain on
investments | | | — | | | | — | | | | — | | | | — | | | | (0.95 | ) | | | (5.23 | ) |
Total distributions declared to
shareholders | | | $(0.25 | ) | | | $(0.23 | ) | | | $(0.19 | ) | | | $(0.19 | ) | | | $(1.19 | ) | | | $(5.42 | ) |
Net asset value, end of period (x) | | | $25.16 | | | | $22.90 | | | | $18.68 | | | | $19.97 | | | | $17.21 | | | | $17.18 | |
Total return (%) (r)(s)(t)(x) | | | 11.07 | (n) | | | 24.03 | | | | (5.60 | ) | | | 17.29 | | | | 9.75 | | | | (31.22 | ) |
Ratios (%) (to average net assets)
and Supplemental data: | | | | | | | | | | | | | | | | | |
Expenses before expense
reductions (f) | | | 1.46 | (a) | | | 1.51 | | | | 1.53 | | | | 1.54 | | | | 1.63 | | | | 1.68 | |
Expenses after expense
reductions (f) | | | 1.41 | (a) | | | 1.46 | | | | 1.51 | | | | 1.54 | | | | 1.63 | | | | 1.68 | |
Net investment income (loss) | | | (0.01 | )(a) | | | 1.18 | | | | 1.08 | | | | 1.11 | | | | 1.45 | | | | 1.00 | |
Portfolio turnover | | | 9 | (n) | | | 21 | | | | 44 | | | | 34 | | | | 42 | | | | 66 | |
Net assets at end of period
(000 omitted) | | | $5,267 | | | | $4,637 | | | | $3,788 | | | | $3,607 | | | | $2,648 | | | | $2,337 | |
See Notes to Financial Statements
30
Financial Highlights – continued
| | | | | | | | | | | | | | | | | | | | | | | | |
| | | Six months
ended
3/31/13 (unaudited) | | | Years ended 9/30 | |
| Class 529B | | | 2012 | | | 2011 | | | 2010 | | | 2009 | | | 2008 | |
| | | | | | | | | | | | | | | | | |
Net asset value, beginning of
period | | | $21.62 | | | | $17.60 | | | | $18.84 | | | | $16.27 | | | | $16.32 | | | | $29.29 | |
| Income (loss) from investment operations | | | | | | | | | | | | | | | | | |
Net investment income (loss) (d) | | | $(0.09 | ) | | | $0.07 | | | | $0.05 | | | | $0.05 | | | | $0.09 | | | | $0.07 | |
Net realized and unrealized
gain (loss) on investments
and foreign currency | | | 2.38 | | | | 4.00 | | | | (1.23 | ) | | | 2.61 | | | | 0.96 | | | | (7.79 | ) |
Total from investment operations | | | $2.29 | | | | $4.07 | | | | $(1.18 | ) | | | $2.66 | | | | $1.05 | | | | $(7.72 | ) |
| Less distributions declared to shareholders | | | | | | | | | | | | | | | | | |
From net investment income | | | $(0.08 | ) | | | $(0.05 | ) | | | $(0.06 | ) | | | $(0.09 | ) | | | $(0.15 | ) | | | $(0.02 | ) |
From net realized gain on
investments | | | — | | | | — | | | | — | | | | — | | | | (0.95 | ) | | | (5.23 | ) |
Total distributions declared to
shareholders | | | $(0.08 | ) | | | $(0.05 | ) | | | $(0.06 | ) | | | $(0.09 | ) | | | $(1.10 | ) | | | $(5.25 | ) |
Net asset value, end of period (x) | | | $23.83 | | | | $21.62 | | | | $17.60 | | | | $18.84 | | | | $16.27 | | | | $16.32 | |
Total return (%) (r)(s)(t)(x) | | | 10.62 | (n) | | | 23.16 | | | | (6.31 | ) | | | 16.44 | | | | 8.98 | | | | (31.69 | ) |
Ratios (%) (to average net assets)
and Supplemental data: | | | | | | | | | | | | | | | | | |
Expenses before expense
reductions (f) | | | 2.21 | (a) | | | 2.26 | | | | 2.27 | | | | 2.29 | | | | 2.35 | | | | 2.33 | |
Expenses after expense
reductions (f) | | | 2.16 | (a) | | | 2.21 | | | | 2.26 | | | | 2.29 | | | | 2.35 | | | | 2.33 | |
Net investment income (loss) | | | (0.76 | )(a) | | | 0.35 | | | | 0.25 | | | | 0.28 | | | | 0.73 | | | | 0.31 | |
Portfolio turnover | | | 9 | (n) | | | 21 | | | | 44 | | | | 34 | | | | 42 | | | | 66 | |
Net assets at end of period
(000 omitted) | | | $692 | | | | $627 | | | | $634 | | | | $834 | | | | $758 | | | | $652 | |
See Notes to Financial Statements
31
Financial Highlights – continued
| | | | | | | | | | | | | | | | | | | | | | | | |
| | | Six months
ended
3/31/13 (unaudited) | | | Years ended 9/30 | |
| Class 529C | | | 2012 | | | 2011 | | | 2010 | | | 2009 | | | 2008 | |
| | | | | | | | | | | | | | | | | |
Net asset value, beginning of
period | | | $21.59 | | | | $17.63 | | | | $18.88 | | | | $16.32 | | | | $16.33 | | | | $29.31 | |
| Income (loss) from investment operations | | | | | | | | | | | | | | | | | |
Net investment income (loss) (d) | | | $(0.08 | ) | | | $0.10 | | | | $0.08 | | | | $0.06 | | | | $0.10 | | | | $0.08 | |
Net realized and unrealized
gain (loss) on investments
and foreign currency | | | 2.37 | | | | 3.96 | | | | (1.26 | ) | | | 2.61 | | | | 0.97 | | | | (7.81 | ) |
Total from investment operations | | | $2.29 | | | | $4.06 | | | | $(1.18 | ) | | | $2.67 | | | | $1.07 | | | | $(7.73 | ) |
| Less distributions declared to shareholders | | | | | | | | | | | | | | | | | |
From net investment income | | | $(0.13 | ) | | | $(0.10 | ) | | | $(0.07 | ) | | | $(0.11 | ) | | | $(0.13 | ) | | | $(0.02 | ) |
From net realized gain on
investments | | | — | | | | — | | | | — | | | | — | | | | (0.95 | ) | | | (5.23 | ) |
Total distributions declared to
shareholders | | | $(0.13 | ) | | | $(0.10 | ) | | | $(0.07 | ) | | | $(0.11 | ) | | | $(1.08 | ) | | | $(5.25 | ) |
Net asset value, end of period (x) | | | $23.75 | | | | $21.59 | | | | $17.63 | | | | $18.88 | | | | $16.32 | | | | $16.33 | |
Total return (%) (r)(s)(t)(x) | | | 10.64 | (n) | | | 23.12 | | | | (6.29 | ) | | | 16.45 | | | | 9.02 | | | | (31.72 | ) |
Ratios (%) (to average net assets)
and Supplemental data: | | | | | | | | | | | | | | | | | |
Expenses before expense
reductions (f) | | | 2.21 | (a) | | | 2.26 | | | | 2.28 | �� | | | 2.29 | | | | 2.34 | | | | 2.33 | |
Expenses after expense
reductions (f) | | | 2.16 | (a) | | | 2.21 | | | | 2.26 | | | | 2.29 | | | | 2.34 | | | | 2.33 | |
Net investment income (loss) | | | (0.75 | )(a) | | | 0.51 | | | | 0.40 | | | | 0.33 | | | | 0.80 | | | | 0.35 | |
Portfolio turnover | | | 9 | (n) | | | 21 | | | | 44 | | | | 34 | | | | 42 | | | | 66 | |
Net assets at end of period
(000 omitted) | | | $1,751 | | | | $1,494 | | | | $1,026 | | | | $770 | | | | $717 | | | | $617 | |
| (d) | Per share data is based on average shares outstanding. |
| (f) | Ratios do not reflect reductions from fees paid indirectly, if applicable. |
| (g) | The per share amount varies from the net realized and unrealized gain/loss for the period because of the timing of sales of fund shares and the per share amount of realized and unrealized gains and losses at such time. |
| (i) | For the period from the class’ inception June 1, 2012 through the stated period end. |
| (l) | Recognition of net investment income by the fund may be affected by the timing of the declaration of dividends by companies in which the fund invests and the actual annual net investment income ratio may differ. |
| (r) | Certain expenses have been reduced without which performance would have been lower. |
| (s) | From time to time the fund may receive proceeds from litigation settlements, without which performance would be lower. |
| (t) | Total returns do not include any applicable sales charges. |
| (w) | Per share amount was less than $0.01. |
| (x) | The net asset values per share and total returns have been calculated on net assets which include adjustments made in accordance with U.S. generally accepted accounting principles required at period end for financial reporting purposes. |
See Notes to Financial Statements
32
NOTES TO FINANCIAL STATEMENTS
(unaudited)
(1) Business and Organization
MFS International New Discovery Fund (the fund) is a series of MFS Series Trust V (the trust). The trust is organized as a Massachusetts business trust and is registered under the Investment Company Act of 1940, as amended, as an open-end management investment company.
(2) Significant Accounting Policies
General – The preparation of financial statements in conformity with U.S. generally accepted accounting principles requires management to make estimates and assumptions that affect the reported amounts of assets and liabilities, and disclosure of contingent assets and liabilities at the date of the financial statements and the reported amounts of revenues and expenses during the reporting period. Actual results could differ from those estimates. In the preparation of these financial statements, management has evaluated subsequent events occurring after the date of the fund’s Statement of Assets and Liabilities through the date that the financial statements were issued. The fund invests in foreign securities, including securities of emerging market issuers. Investments in foreign securities are vulnerable to the effects of changes in the relative values of the local currency and the U.S. dollar and to the effects of changes in each country’s legal, political, and economic environment. The markets of emerging markets countries are generally more volatile than the markets of developed countries with more mature economies. All of the risks of investing in foreign securities previously described are heightened when investing in emerging markets countries.
In January 2013, the Financial Accounting Standards Board issued Accounting Standards Update 2013-01 (“ASU 2013-01”) entitled Balance Sheet (Topic 210) – Clarifying the Scope of Disclosures about Offsetting Assets and Liabilities which is intended to clarify the scope of Accounting Standards Update 2011-11 (“ASU 2011-11”), Balance Sheet (Topic 210) – Disclosures about Offsetting Assets and Liabilities. Consistent with the effective date for ASU 2011-11, ASU 2013-01 is effective for annual reporting periods beginning on or after January 1, 2013, and interim periods within those annual periods. ASU 2013-01 limits the scope of ASU 2011-11’s disclosure requirements on offsetting to financial assets and financial liabilities related to derivatives, repurchase and reverse repurchase agreements, and securities lending and securities borrowing transactions. Although still evaluating the potential impact of these two ASUs to the fund, management expects that the impact of the fund’s adoption will be limited to additional financial statement disclosures.
Investment Valuations – Equity securities, including restricted equity securities, are generally valued at the last sale or official closing price as provided by a third-party pricing service on the market or exchange on which they are primarily traded. Equity securities, for which there were no sales reported that day, are generally valued at the last quoted daily bid quotation as provided by a third-party pricing service on the market or exchange on which such securities are primarily traded. Short-term instruments with a maturity at issuance of 60 days or less generally are valued at amortized cost, which approximates market value. Open-end investment companies are generally valued at net asset value per share. Securities and other assets generally valued on the basis of information from a third-party pricing service may also be valued
33
Notes to Financial Statements (unaudited) – continued
at a broker/dealer bid quotation. Values obtained from third-party pricing services can utilize both transaction data and market information such as yield, quality, coupon rate, maturity, type of issue, trading characteristics, and other market data. The values of foreign securities and other assets and liabilities expressed in foreign currencies are converted to U.S. dollars using the mean of bid and asked prices for rates provided by a third-party pricing service.
The Board of Trustees has delegated primary responsibility for determining or causing to be determined the value of the fund’s investments (including any fair valuation) to the adviser pursuant to valuation policies and procedures approved by the Board. If the adviser determines that reliable market quotations are not readily available, investments are valued at fair value as determined in good faith by the adviser in accordance with such procedures under the oversight of the Board of Trustees. Under the fund’s valuation policies and procedures, market quotations are not considered to be readily available for most types of debt instruments and floating rate loans and many types of derivatives. These investments are generally valued at fair value based on information from third-party pricing services. In addition, investments may be valued at fair value if the adviser determines that an investment’s value has been materially affected by events occurring after the close of the exchange or market on which the investment is principally traded (such as foreign exchange or market) and prior to the determination of the fund’s net asset value, or after the halting of trading of a specific security where trading does not resume prior to the close of the exchange or market on which the security is principally traded. Events that occur on a frequent basis after foreign markets close (such as developments in foreign markets and significant movements in the U.S. markets) and prior to the determination of the fund’s net asset value may be deemed to have a material effect on the value of securities traded in foreign markets. Accordingly, the fund’s foreign equity securities may often be valued at fair value. The adviser generally relies on third-party pricing services or other information (such as the correlation with price movements of similar securities in the same or other markets; the type, cost and investment characteristics of the security; the business and financial condition of the issuer; and trading and other market data) to assist in determining whether to fair value and at what value to fair value an investment. The value of an investment for purposes of calculating the fund’s net asset value can differ depending on the source and method used to determine value. When fair valuation is used, the value of an investment used to determine the fund’s net asset value may differ from quoted or published prices for the same investment. There can be no assurance that the fund could obtain the fair value assigned to an investment if it were to sell the investment at the same time at which the fund determines its net asset value per share.
Various inputs are used in determining the value of the fund’s assets or liabilities. These inputs are categorized into three broad levels. In certain cases, the inputs used to measure fair value may fall into different levels of the fair value hierarchy. In such cases, an investment’s level within the fair value hierarchy is based on the lowest level of input that is significant to the fair value measurement. The fund’s assessment of the significance of a particular input to the fair value measurement in its entirety requires judgment, and considers factors specific to the investment. Level 1 includes unadjusted quoted prices in active markets for identical assets or liabilities. Level 2 includes other significant observable market-based inputs (including quoted prices for similar
34
Notes to Financial Statements (unaudited) – continued
securities, interest rates, prepayment speed, and credit risk). Level 3 includes unobservable inputs, which may include the adviser’s own assumptions in determining the fair value of investments. The following is a summary of the levels used as of March 31, 2013 in valuing the fund’s assets or liabilities:
| | | | | | | | | | | | | | | | |
| Investments at Value | | Level 1 | | | Level 2 | | | Level 3 | | | Total | |
| Equity Securities: | | | | | | | | | | | | | | | | |
United Kingdom | | | $993,752,813 | | | | $— | | | | $— | | | | $993,752,813 | |
Japan | | | 550,991,937 | | | | 2,722,022 | | | | — | | | | 553,713,959 | |
Brazil | | | 248,504,580 | | | | — | | | | — | | | | 248,504,580 | |
Germany | | | 242,545,437 | | | | — | | | | — | | | | 242,545,437 | |
France | | | 183,627,661 | | | | — | | | | — | | | | 183,627,661 | |
Hong Kong | | | 67,989,659 | | | | 44,939,735 | | | | — | | | | 112,929,394 | |
Denmark | | | 107,926,657 | | | | — | | | | — | | | | 107,926,657 | |
Mexico | | | 101,289,749 | | | | — | | | | — | | | | 101,289,749 | |
Switzerland | | | 99,634,180 | | | | — | | | | — | | | | 99,634,180 | |
Other Countries | | | 837,649,991 | | | | 247,609,610 | | | | — | | | | 1,085,259,601 | |
| Short Term Securities | | | — | | | | 20,593,747 | | | | — | | | | 20,593,747 | |
| Mutual Funds | | | 157,132,620 | | | | — | | | | — | | | | 157,132,620 | |
| Total Investments | | | $3,591,045,283 | | | | $315,865,113 | | | | $— | | | | $3,906,910,396 | |
For further information regarding security characteristics, see the Portfolio of Investments.
Of the level 2 investments presented above, equity investments amounting to $54,438,369 would have been considered level 1 investments at the beginning of the period. Of the level 1 investments presented above, equity investments amounting to $370,309,835 would have been considered level 2 investments at the beginning of the period. The primary reason for changes in the classifications between levels 1 and 2 occurs when foreign equity securities are fair valued using other observable market-based inputs in place of the closing exchange price due to events occurring after the close of the exchange or market on which the investment is principally traded. The fund’s foreign equity securities may often be valued at fair value. The fund’s policy is to recognize transfers between the levels as of the end of the period.
Repurchase Agreements – The fund entered into repurchase agreements with approved counterparties. Each repurchase agreement is recorded at cost. The fund requires that the securities collateral in a repurchase transaction be transferred to a custodian. The fund monitors, on a daily basis, the value of the collateral to ensure that its value, including accrued interest, is greater than amounts owed to the fund under each such repurchase agreement.
Foreign Currency Translation – Purchases and sales of foreign investments, income, and expenses are converted into U.S. dollars based upon currency exchange rates prevailing on the respective dates of such transactions or on the reporting date for foreign denominated receivables and payables. Gains and losses attributable to foreign currency exchange rates on sales of securities are recorded for financial statement purposes as net realized gains and losses on investments. Gains and losses attributable to foreign exchange rate movements on receivables, payables, income and expenses are recorded for financial statement purposes as foreign currency transaction gains and
35
Notes to Financial Statements (unaudited) – continued
losses. That portion of both realized and unrealized gains and losses on investments that results from fluctuations in foreign currency exchange rates is not separately disclosed.
Security Loans – JPMorgan Chase and Co. (“Chase”), as lending agent, loans the securities of the fund to certain qualified institutions (the “Borrowers”) approved by the fund. The loans are collateralized by cash and/or U.S. Treasury and federal agency obligations in an amount typically at least equal to the market value of the securities loaned. The market value of the loaned securities is determined at the close of business of the fund and any additional required collateral is delivered to the fund on the next business day. Chase provides the fund with indemnification against Borrower default. The fund bears the risk of loss with respect to the investment of cash collateral. On loans collateralized by cash, the cash collateral is invested in short-term securities. Collateral for securities loaned is held at carrying value, which approximates fair value. If the collateral for securities loaned was carried at fair value, its fair value would be considered level 2 under the fair value hierarchy. A portion of the income generated upon investment of the collateral is remitted to the Borrowers, and the remainder is allocated between the fund and the lending agent. On loans collateralized by U.S. Treasury and/or federal agency obligations, a fee is received from the Borrower, and is allocated between the fund and the lending agent. Income from securities lending is included in “Interest” income on the Statement of Operations. The dividend and interest income earned on the securities loaned is accounted for in the same manner as other dividend and interest income.
Indemnifications – Under the fund’s organizational documents, its officers and Trustees may be indemnified against certain liabilities and expenses arising out of the performance of their duties to the fund. Additionally, in the normal course of business, the fund enters into agreements with service providers that may contain indemnification clauses. The fund’s maximum exposure under these agreements is unknown as this would involve future claims that may be made against the fund that have not yet occurred.
Investment Transactions and Income – Investment transactions are recorded on the trade date. Interest income is recorded on the accrual basis. Dividends received in cash are recorded on the ex-dividend date. Certain dividends from foreign securities will be recorded when the fund is informed of the dividend if such information is obtained subsequent to the ex-dividend date. Dividend and interest payments received in additional securities are recorded on the ex-dividend or ex-interest date in an amount equal to the value of the security on such date.
The fund may receive proceeds from litigation settlements. Any proceeds received from litigation involving portfolio holdings are reflected in the Statement of Operations in realized gain/loss if the security has been disposed of by the fund or in unrealized gain/loss if the security is still held by the fund. Any other proceeds from litigation not related to portfolio holdings are reflected as other income in the Statement of Operations.
Fees Paid Indirectly – The fund’s custody fee may be reduced according to an arrangement that measures the value of cash deposited with the custodian by the fund. This amount, for the six months ended March 31, 2013, is shown as a reduction of total expenses in the Statement of Operations.
36
Notes to Financial Statements (unaudited) – continued
Tax Matters and Distributions – The fund intends to qualify as a regulated investment company, as defined under Subchapter M of the Internal Revenue Code, and to distribute all of its taxable income, including realized capital gains. As a result, no provision for federal income tax is required. The fund’s federal tax returns, when filed, will remain subject to examination by the Internal Revenue Service for a three year period. Foreign taxes have been accrued by the fund in the accompanying financial statements.
Distributions to shareholders are recorded on the ex-dividend date. Income and capital gain distributions are determined in accordance with income tax regulations, which may differ from U.S. generally accepted accounting principles. Certain capital accounts in the financial statements are periodically adjusted for permanent differences in order to reflect their tax character. These adjustments have no impact on net assets or net asset value per share. Temporary differences which arise from recognizing certain items of income, expense, gain or loss in different periods for financial statement and tax purposes will reverse at some time in the future. Distributions in excess of net investment income or net realized gains are temporary overdistributions for financial statement purposes resulting from differences in the recognition or classification of income or distributions for financial statement and tax purposes.
Book/tax differences primarily relate to passive foreign investment company adjustments and wash sale loss deferrals.
The tax character of distributions declared to shareholders for the last fiscal year is as follows:
| | | | |
| | | 9/30/12 | |
Ordinary income (including any
short-term capital gains) | | | $31,029,975 | |
The federal tax cost and the tax basis components of distributable earnings were as follows:
| | | | |
| Cost of investments | | | $3,118,606,305 | |
| Gross appreciation | | | 936,507,803 | |
| Gross depreciation | | | (148,203,712 | ) |
| Net unrealized appreciation (depreciation) | | | $788,304,091 | |
| |
| As of 9/30/12 | | | |
| Undistributed ordinary income | | | 40,377,288 | |
| Capital loss carryforwards | | | (360,829,109 | ) |
| Post-October capital loss deferral | | | (2,462,524 | ) |
| Other temporary differences | | | (3,357,642 | ) |
| Net unrealized appreciation (depreciation) | | | 519,219,043 | |
The aggregate cost above includes prior fiscal year end tax adjustments, if applicable.
Under the Regulated Investment Company Modernization Act of 2010 (the “Act”), net capital losses recognized after September 30, 2011 may be carried forward indefinitely, and their character is retained as short-term and/or long-term losses (“post-enactment losses”). Previously, net capital losses were carried forward for eight years and treated
37
Notes to Financial Statements (unaudited) – continued
as short-term losses (“pre-enactment losses”). As a transition rule, the Act requires that post-enactment net capital losses be used before pre-enactment net capital losses.
As of September 30, 2012, the fund had capital loss carryforwards available to offset future realized gains. Such losses expire as follows:
Multiple Classes of Shares of Beneficial Interest – The fund offers multiple classes of shares, which differ in their respective distribution, service, and program manager fees. The fund’s income, realized and unrealized gain (loss), and common expenses are allocated to shareholders based on the daily net assets of each class. Dividends are declared separately for each class. Differences in per share dividend rates are generally due to differences in separate class expenses. Class B and Class 529B shares will convert to Class A and Class 529A shares, respectively, approximately eight years after purchase. The fund’s distributions declared to shareholders as reported in the Statements of Changes in Net Assets are presented by class as follows:
| | | | | | | | | | | | | | | | |
| | | From net investment
income | |
| | | Six months
ended
3/31/13 | | | Year
ended
9/30/12 | | | Year
ended
9/30/12 | | | Year
ended
9/30/11 | |
| Class A | | | $14,369,907 | | | | $14,564,840 | | | | $14,564,840 | | | | $13,756,193 | |
| Class B | | | 77,374 | | | | 56,068 | | | | 56,068 | | | | 125,350 | |
| Class C | | | 649,081 | | | | 475,347 | | | | 475,347 | | | | 518,358 | |
| Class I | | | 13,545,285 | | | | 12,334,934 | | | | 12,334,934 | | | | 9,665,922 | |
| Class R1 | | | 12,110 | | | | 12,764 | | | | 12,764 | | | | 11,420 | |
| Class R2 | | | 483,056 | | | | 365,562 | | | | 365,562 | | | | 358,424 | |
| Class R3 | | | 1,139,762 | | | | 846,208 | | | | 846,208 | | | | 257,202 | |
| Class R4 | | | 4,118,307 | | | | 2,321,577 | | | | 2,321,577 | | | | 866,373 | |
| Class R5 | | | 5,921,317 | | | | — | | | | — | | | | — | |
| Class 529A | | | 52,230 | | | | 45,152 | | | | 45,152 | | | | 35,239 | |
| Class 529B | | | 2,327 | | | | 1,719 | | | | 1,719 | | | | 2,458 | |
| Class 529C | | | 9,326 | | | | 5,804 | | | | 5,804 | | | | 3,332 | |
| Total | | | $40,380,082 | | | | $31,029,975 | | | | $31,029,975 | | | | $25,600,271 | |
(3) Transactions with Affiliates
Investment Adviser – The fund has an investment advisory agreement with MFS to provide overall investment management and related administrative services and facilities to the fund.
The management fee is computed daily and paid monthly at the following annual rates:
| | | | |
| First $500 million of average daily net assets | | | 0.975 | % |
| Next $4.5 billion of average daily net assets | | | 0.925 | % |
| Average daily net assets in excess of $5 billion | | | 0.850 | % |
The management fee incurred for the six months ended March 31, 2013 was equivalent to an annual effective rate of 0.93% of the fund’s average daily net assets.
38
Notes to Financial Statements (unaudited) – continued
Distributor – MFS Fund Distributors, Inc. (MFD), a wholly-owned subsidiary of MFS, as distributor, received $311,882 and $1,228 for the six months ended March 31, 2013, as its portion of the initial sales charge on sales of Class A and Class 529A shares of the fund, respectively.
The Board of Trustees has adopted a distribution plan for certain class shares pursuant to Rule 12b-1 of the Investment Company Act of 1940.
The fund’s distribution plan provides that the fund will pay MFD for services provided by MFD and financial intermediaries in connection with the distribution and servicing of certain share classes. One component of the plan is a distribution fee paid to MFD and another component of the plan is a service fee paid to MFD. MFD may subsequently pay all, or a portion, of the distribution and/or service fees to financial intermediaries.
Distribution Plan Fee Table:
| | | | | | | | | | | | | | | | | | | | |
| | | Distribution Fee Rate (d) | | | Service
Fee Rate (d) | | | Total Distribution Plan (d) | | | Annual Effective Rate (e) | | | Distribution and Service Fee | |
| Class A | | | — | | | | 0.25% | | | | 0.25% | | | | 0.25% | | | | $1,687,109 | |
| Class B | | | 0.75% | | | | 0.25% | | | | 1.00% | | | | 1.00% | | | | 211,723 | |
| Class C | | | 0.75% | | | | 0.25% | | | | 1.00% | | | | 1.00% | | | | 787,254 | |
| Class R1 | | | 0.75% | | | | 0.25% | | | | 1.00% | | | | 1.00% | | | | 15,655 | |
| Class R2 | | | 0.25% | | | | 0.25% | | | | 0.50% | | | | 0.50% | | | | 135,390 | |
| Class R3 | | | — | | | | 0.25% | | | | 0.25% | | | | 0.25% | | | | 132,400 | |
| Class 529A | | | — | | | | 0.25% | | | | 0.25% | | | | 0.25% | | | | 6,136 | |
| Class 529B | | | 0.75% | | | | 0.25% | | | | 1.00% | | | | 1.00% | | | | 3,285 | |
| Class 529C | | | 0.75% | | | | 0.25% | | | | 1.00% | | | | 1.00% | | | | 8,122 | |
| Total Distribution and Service Fees | | | | $2,987,074 | |
| (d) | In accordance with the distribution plan for certain classes, the fund pays distribution and/or service fees equal to these annual percentage rates of each class’s average daily net assets. The distribution and service fee rates disclosed by class represent the current rates in effect at the end of the reporting period. |
| (e) | The annual effective rates represent actual fees incurred under the distribution plan for the six months ended March 31, 2013 based on each class’s average daily net assets. |
Certain Class A shares are subject to a contingent deferred sales charge (CDSC) in the event of a shareholder redemption within 18 months of purchase for shares purchased on or after August 1, 2012, and within 24 months of purchase for shares purchased prior to August 1, 2012. Class C and Class 529C shares are subject to a CDSC in the event of a shareholder redemption within 12 months of purchase. Class B and Class 529B shares are subject to a CDSC in the event of a shareholder redemption within six years of purchase. All contingent deferred sales charges are paid to MFD and during the six months ended March 31, 2013, were as follows:
| | | | |
| | | Amount | |
| Class A | | | $11,756 | |
| Class B | | | 15,940 | |
| Class C | | | 2,988 | |
| Class 529B | | | 64 | |
| Class 529C | | | 15 | |
39
Notes to Financial Statements (unaudited) – continued
The fund has entered into and may from time to time enter into contracts with program managers and other parties which administer the tuition programs through which an investment in the fund’s 529 share classes is made. The fund has entered into an agreement with MFD pursuant to which MFD receives an annual fee of up to 0.10% of the average daily net assets attributable to each 529 share class. MFD has agreed to waive a portion of this fee in an amount equal to 0.05% of the average daily net assets for each 529 share class. This waiver agreement will continue until modified by the fund’s Board of Trustees but such agreement will expire on January 31, 2014, unless MFD elects to extend waiver. For the six months ended March 31, 2013, this waiver amounted to $1,797 and is reflected as a reduction of total expenses in the Statement of Operations. The program manager fee incurred for the six months ended March 31, 2013 was equivalent to an annual effective rate of 0.05% of the average daily net assets attributable to each 529 share class. The services provided by MFD, or a third party with which MFD contracts, include recordkeeping and tax reporting and account services, as well as services designed to maintain the program’s compliance with the Internal Revenue Code and other regulatory requirements. Program manager fees and waivers for the six months ended March 31, 2013, were as follows:
| | | | | | | | |
| | | Fee | | | Waiver | |
| Class 529A | | | $2,454 | | | | $1,228 | |
| Class 529B | | | 328 | | | | 164 | |
| Class 529C | | | 811 | | | | 405 | |
| Total Program Manager Fees and Waivers | | | $3,593 | | | | $1,797 | |
Shareholder Servicing Agent – MFS Service Center, Inc. (MFSC), a wholly-owned subsidiary of MFS, receives a fee from the fund for its services as shareholder servicing agent calculated as a percentage of the average daily net assets of the fund as determined periodically under the supervision of the fund’s Board of Trustees. For the six months ended March 31, 2013, the fee was $224,331, which equated to 0.0126% annually of the fund’s average daily net assets. MFSC also receives payment from the fund for out-of-pocket expenses, sub-accounting and other shareholder servicing costs which may be paid to affiliated and unaffiliated service providers. Class R5 shares do not incur sub-accounting fees. For the six months ended March 31, 2013, these out-of-pocket expenses, sub-accounting and other shareholder servicing costs amounted to $1,642,387.
Administrator – MFS provides certain financial, legal, shareholder communications, compliance, and other administrative services to the fund. Under an administrative services agreement, the fund partially reimburses MFS the costs incurred to provide these services. The fund is charged an annual fixed amount of $17,500 plus a fee based on average daily net assets. The administrative services fee incurred for the six months ended March 31, 2013 was equivalent to an annual effective rate of 0.0131% of the fund’s average daily net assets.
Trustees’ and Officers’ Compensation – The fund pays compensation to independent Trustees in the form of a retainer, attendance fees, and additional compensation to Board and Committee chairpersons. The fund does not pay compensation directly to Trustees or officers of the fund who are also officers of the
40
Notes to Financial Statements (unaudited) – continued
investment adviser, all of whom receive remuneration for their services to the fund from MFS. Certain officers and Trustees of the fund are officers or directors of MFS, MFD, and MFSC.
Prior to December 31, 2001, the fund had an unfunded defined benefit plan (“DB plan”) for independent Trustees. As of December 31, 2001, the Board took action to terminate the DB plan with respect to then-current and any future independent Trustees, such that the DB plan covers only certain of those former independent Trustees who retired on or before December 31, 2001. Effective January 1, 2002, accrued benefits under the DB plan for then-current independent Trustees who continued were credited to an unfunded retirement deferral plan (the “Retirement Deferral plan”), which was established for and exists solely with respect to these credited amounts, and is not available for other deferrals by these or other independent Trustees. Although the Retirement Deferral plan is unfunded, amounts deferred under the plan are periodically adjusted for investment experience as if they had been invested in shares of the fund. The Retirement Deferral plan resulted in an expense of $457 and is included in independent Trustees’ compensation for the six months ended March 31, 2013. The liability for deferred retirement benefits payable to certain independent Trustees under the Retirement Deferral plan amounted to $3,437 at March 31, 2013, and is included in “Payable for independent Trustees’ compensation” in the Statement of Assets and Liabilities.
Other – This fund and certain other funds managed by MFS (the funds) have entered into services agreements (the Agreements) which provide for payment of fees by the funds to Tarantino LLC and Griffin Compliance LLC in return for the provision of services of an Independent Chief Compliance Officer (ICCO) and Assistant ICCO, respectively, for the funds. The ICCO and Assistant ICCO are officers of the funds and the sole members of Tarantino LLC and Griffin Compliance LLC, respectively. The funds can terminate the Agreements with Tarantino LLC and Griffin Compliance LLC at any time under the terms of the Agreements. For the six months ended March 31, 2013, the aggregate fees paid by the fund to Tarantino LLC and Griffin Compliance LLC were $12,672 and are included in “Miscellaneous” expense in the Statement of Operations MFS has agreed to reimburse the fund for a portion of the payments made by the fund in the amount of $3,639, which is shown as a reduction of total expenses in the Statement of Operations. Additionally, MFS has agreed to bear all expenses associated with office space, other administrative support, and supplies provided to the ICCO and Assistant ICCO.
The fund invests in the MFS Institutional Money Market Portfolio which is managed by MFS and seeks current income consistent with preservation of capital and liquidity. Income earned on this investment is included in “Dividends from underlying affiliated funds” in the Statement of Operations. This money market fund does not pay a management fee to MFS.
(4) Portfolio Securities
Purchases and sales of investments, other than in-kind transactions and short-term obligations, aggregated $524,994,778 and $309,563,354, respectively.
41
Notes to Financial Statements (unaudited) – continued
(5) Shares of Beneficial Interest
The fund’s Declaration of Trust permits the Trustees to issue an unlimited number of full and fractional shares of beneficial interest. Transactions in fund shares were as follows:
| | | | | | | | | | | | | | | | |
| | | Six months ended
3/31/13 | | | Year ended
9/30/12 (i) | |
| | | Shares | | | Amount | | | Shares | | | Amount | |
| Shares sold | | | | | | | | | | | | | | | | |
Class A | | | 7,508,459 | | | | $182,076,268 | | | | 11,277,815 | | | | $238,208,964 | |
Class B | | | 64,723 | | | | 1,515,252 | | | | 221,010 | | | | 4,496,903 | |
Class C | | | 635,470 | | | | 14,842,468 | | | | 577,409 | | | | 11,802,793 | |
Class I | | | 11,905,893 | | | | 296,963,347 | | | | 24,182,655 | | | | 522,917,346 | |
Class R1 | | | 184,108 | | | | 4,313,511 | | | | 35,760 | | | | 702,146 | |
Class R2 | | | 764,015 | | | | 18,138,432 | | | | 935,515 | | | | 19,588,939 | |
Class R3 | | | 1,520,334 | | | | 36,909,891 | | | | 1,903,770 | | | | 39,610,402 | |
Class R4 | | | 3,982,008 | | | | 96,335,557 | | | | 6,645,737 | | | | 139,620,241 | |
Class R5 | | | 1,698,172 | | | | 42,462,955 | | | | 18,819,851 | | | | 398,844,368 | |
Class 529A | | | 11,401 | | | | 271,177 | | | | 27,450 | | | | 565,587 | |
Class 529B | | | 1,388 | | | | 31,462 | | | | 3,286 | | | | 63,473 | |
Class 529C | | | 8,405 | | | | 185,959 | | | | 23,801 | | | | 468,503 | |
| | | 28,284,376 | | | | $694,046,279 | | | | 64,654,059 | | | | $1,376,889,665 | |
| | | |
Shares issued to shareholders in
reinvestment of distributions | | | | | | | | | | | | | |
Class A | | | 556,157 | | | | $13,158,677 | | | | 670,311 | | | | $13,071,095 | |
Class B | | | 3,150 | | | | 72,188 | | | | 2,705 | | | | 51,016 | |
Class C | | | 23,895 | | | | 542,407 | | | | 20,345 | | | | 380,859 | |
Class I | | | 437,697 | | | | 10,631,660 | | | | 513,610 | | | | 10,272,178 | |
Class R1 | | | 546 | | | | 12,110 | | | | 699 | | | | 12,764 | |
Class R2 | | | 18,516 | | | | 427,897 | | | | 16,360 | | | | 311,812 | |
Class R3 | | | 48,501 | | | | 1,139,762 | | | | 43,687 | | | | 846,208 | |
Class R4 | | | 141,109 | | | | 3,334,395 | | | | 89,045 | | | | 1,733,700 | |
Class R5 | | | 243,776 | | | | 5,921,317 | | | | — | | | | — | |
Class 529A | | | 2,239 | | | | 52,230 | | | | 2,348 | | | | 45,152 | |
Class 529B | | | 105 | | | | 2,327 | | | | 94 | | | | 1,719 | |
Class 529C | | | 423 | | | | 9,326 | | | | 318 | | | | 5,804 | |
| | | 1,476,114 | | | | $35,304,296 | | | | 1,359,522 | | | | $26,732,307 | |
42
Notes to Financial Statements (unaudited) – continued
| | | | | | | | | | | | | | | | |
| | | Six months ended
3/31/13 | | | Year ended
9/30/12 (i) | |
| | | Shares | | | Amount | | | Shares | | | Amount | |
| Shares reacquired | | | | | | | | | | | | | | | | |
Class A | | | (7,433,623 | ) | | | $(178,684,568 | ) | | | (18,900,215 | ) | | | $(398,739,420 | ) |
Class B | | | (523,058 | ) | | | (12,235,339 | ) | | | (1,348,228 | ) | | | (27,243,465 | ) |
Class C | | | (592,931 | ) | | | (13,587,965 | ) | | | (1,614,534 | ) | | | (32,448,088 | ) |
Class I | | | (9,691,550 | ) | | | (245,076,215 | ) | | | (27,542,559 | ) | | | (582,587,694 | ) |
Class R1 | | | (44,457 | ) | | | (995,997 | ) | | | (48,887 | ) | | | (975,623 | ) |
Class R2 | | | (372,604 | ) | | | (8,792,979 | ) | | | (985,041 | ) | | | (20,302,691 | ) |
Class R3 | | | (525,700 | ) | | | (12,624,863 | ) | | | (957,958 | ) | | | (20,274,219 | ) |
Class R4 | | | (1,942,168 | ) | | | (46,804,481 | ) | | | (2,151,754 | ) | | | (45,686,138 | ) |
Class R5 | | | (460,634 | ) | | | (11,315,254 | ) | | | (443,262 | ) | | | (9,871,876 | ) |
Class 529A | | | (6,806 | ) | | | (164,709 | ) | | | (30,129 | ) | | | (630,232 | ) |
Class 529B | | | (1,465 | ) | | | (33,853 | ) | | | (10,403 | ) | | | (207,847 | ) |
Class 529C | | | (4,278 | ) | | | (96,474 | ) | | | (13,138 | ) | | | (259,735 | ) |
| | | (21,599,274 | ) | | | $(530,412,697 | ) | | | (54,046,108 | ) | | | $(1,139,227,028 | ) |
| | | | |
| Net change | | | | | | | | | | | | | | | | |
Class A | | | 630,993 | | | | $16,550,377 | | | | (6,952,089 | ) | | | $(147,459,361 | ) |
Class B | | | (455,185 | ) | | | (10,647,899 | ) | | | (1,124,513 | ) | | | (22,695,546 | ) |
Class C | | | 66,434 | | | | 1,796,910 | | | | (1,016,780 | ) | | | (20,264,436 | ) |
Class I | | | 2,652,040 | | | | 62,518,792 | | | | (2,846,294 | ) | | | (49,398,170 | ) |
Class R1 | | | 140,197 | | | | 3,329,624 | | | | (12,428 | ) | | | (260,713 | ) |
Class R2 | | | 409,927 | | | | 9,773,350 | | | | (33,166 | ) | | | (401,940 | ) |
Class R3 | | | 1,043,135 | | | | 25,424,790 | | | | 989,499 | | | | 20,182,391 | |
Class R4 | | | 2,180,949 | | | | 52,865,471 | | | | 4,583,028 | | | | 95,667,803 | |
Class R5 | | | 1,481,314 | | | | 37,069,018 | | | | 18,376,589 | | | | 388,972,492 | |
Class 529A | | | 6,834 | | | | 158,698 | | | | (331 | ) | | | (19,493 | ) |
Class 529B | | | 28 | | | | (64 | ) | | | (7,023 | ) | | | (142,655 | ) |
Class 529C | | | 4,550 | | | | 98,811 | | | | 10,981 | | | | 214,572 | |
| | | 8,161,216 | | | | $198,937,878 | | | | 11,967,473 | | | | $264,394,944 | |
| (i) | For Class R5, the period is from inception, June 1, 2012, through the stated period end. |
The fund is one of several mutual funds in which the MFS funds-of-funds may invest. The MFS funds-of-funds do not invest in the underlying MFS funds for the purpose of exercising management or control. At the end of the period, the MFS International Dividersification Fund, the MFS Growth Allocation Fund, MFS Moderate Allocation Fund, and the MFS Aggressive Growth Allocation Fund were the owners of record of approximately 9%, 2%, 1%, and 1%, respectively, of the value of outstanding voting shares of the fund. In addition, the MFS Lifetime 2020 Fund, the MFS Lifetime 2025 Fund, the MFS Lifetime 2030 Fund, the MFS Lifetime 2035 Fund, the MFS Lifetime 2040 Fund, the MFS Lifetime 2045 Fund, and the MFS Lifetime 2050 Fund were each the owners of record of less than 1% of the value of outstanding voting shares of the fund.
43
Notes to Financial Statements (unaudited) – continued
(6) Line of Credit
The fund and certain other funds managed by MFS participate in a $1.1 billion unsecured committed line of credit, subject to a $1 billion sublimit, provided by a syndication of banks under a credit agreement. Borrowings may be made for temporary financing needs. Interest is charged to each fund, based on its borrowings, generally at a rate equal to the higher of the Federal Reserve funds rate or one month LIBOR plus an agreed upon spread. A commitment fee, based on the average daily, unused portion of the committed line of credit, is allocated among the participating funds at the end of each calendar quarter. In addition, the fund and other funds managed by MFS have established unsecured uncommitted borrowing arrangements with certain banks for temporary financing needs. Interest is charged to each fund, based on its borrowings, at a rate equal to the Federal Reserve funds rate plus an agreed upon spread. For the six months ended March 31, 2013, the fund’s commitment fee and interest expense were $9,868 and $0, respectively, and are included in “Miscellaneous” expense in the Statement of Operations.
(7) Transactions in Underlying Affiliated Funds-Affiliated Issuers
An affiliated issuer may be considered one in which the fund owns 5% or more of the outstanding voting securities, or a company which is under common control. For the purposes of this report, the fund assumes the following to be an affiliated issuer:
| | | | | | | | | | | | | | | | |
| Underlying Affiliated Fund | | Beginning
Shares/Par
Amount | | | Acquisitions
Shares/Par
Amount | | | Dispositions
Shares/Par
Amount | | | Ending Shares/Par
Amount | |
MFS Institutional Money
Market Portfolio | | | 79,812,607 | | | | 307,744,326 | | | | (230,424,313 | ) | | | 157,132,620 | |
| | | | |
| Underlying Affiliated Fund | | Realized
Gain (Loss) | | | Capital Gain
Distributions | | | Dividend
Income | | | Ending Value | |
MFS Institutional Money
Market Portfolio | | | $— | | | | $— | | | | $576,315 | | | | $157,132,620 | |
(8) Redemption In-Kind
On February 1, 2013, the fund recorded redemption proceeds for a distribution in-kind of portfolio securities that were valued at $128,556,503. The redeeming shareholder generally receives a pro rata share of the securities held by the fund. The distribution of such securities generated a realized gain of $50,914,886 for the fund.
44
BOARD REVIEW OF INVESTMENT ADVISORY AGREEMENT
A discussion regarding the Board’s most recent review and renewal of the fund’s Investment Advisory Agreement with MFS is available by clicking on the fund’s name under “Mutual Funds” in the “Products” section of the MFS Web site (mfs.com).
PROXY VOTING POLICIES AND INFORMATION
A general description of the MFS funds’ proxy voting policies and procedures is available without charge, upon request, by calling 1-800-225-2606, by visiting the Proxy Voting section of mfs.com or by visiting the SEC’s Web site at http://www.sec.gov.
Information regarding how the fund voted proxies relating to portfolio securities during the most recent twelve-month period ended June 30 is available without charge by visiting the Proxy Voting section of mfs.com or by visiting the SEC’s Web site at http://www.sec.gov.
QUARTERLY PORTFOLIO DISCLOSURE
The fund will file a complete schedule of portfolio holdings with the Securities and Exchange Commission (the Commission) for the first and third quarters of each fiscal year on Form N-Q. A shareholder can obtain the quarterly portfolio holdings report at mfs.com. The fund’s Form N-Q is also available on the EDGAR database on the Commission’s Internet Web site at http://www.sec.gov, and may be reviewed and copied at the:
Public Reference Room
Securities and Exchange Commission
100 F Street, NE, Room 1580
Washington, D.C. 20549
Information on the operation of the Public Reference Room may be obtained by calling the Commission at 1-800-SEC-0330. Copies of the fund’s Form N-Q also may be obtained, upon payment of a duplicating fee, by electronic request at the following e-mail address: publicinfo@sec.gov, or by writing the Public Reference Section at the above address.
FURTHER INFORMATION
From time to time, MFS may post important information about the fund or the MFS funds on the MFS web site (mfs.com). This information is available by visiting the “News & Commentary” section of mfs.com or by clicking on the fund’s name under “Mutual Funds” in the “Products” section of mfs.com.
PROVISION OF FINANCIAL REPORTS AND SUMMARY PROSPECTUSES
The fund produces financial reports every six months and updates its summary prospectus and prospectus annually. To avoid sending duplicate copies of materials to households, only one copy of the fund’s annual and semiannual report and summary prospectus may be mailed to shareholders having the same last name and residential address on the fund’s records. However, any shareholder may contact MFSC (please see back cover for address and telephone number) to request that copies of these reports and summary prospectuses be sent personally to that shareholder.
45
Save paper with eDelivery.

| MFS® will send you prospectuses, |
reports, and proxies directly via e-mail so you will get information faster with less mailbox clutter.
To sign up:
1. Go to mfs.com.
2. Log in via MFS® Access.
3. Select eDelivery.
If you own your MFS fund shares through a financial institution or a retirement plan, MFS® TALK, MFS® Access, or eDelivery may not be available to you.
CONTACT
WEB SITE
mfs.com
MFS TALK
1-800-637-8255
24 hours a day
ACCOUNT SERVICE AND LITERATURE
Shareholders
1-800-225-2606
Financial advisors
1-800-343-2829
Retirement plan services
1-800-637-1255
MAILING ADDRESS
MFS Service Center, Inc.
P.O. Box 55824
Boston, MA 02205-5824
OVERNIGHT MAIL
MFS Service Center, Inc.
c/o Boston Financial Data Services
30 Dan Road
Canton, MA 02021-2809
SEMIANNUAL REPORT
March 31, 2013

MFS® RESEARCH FUND

MFR-SEM
MFS® RESEARCH FUND
CONTENTS
The report is prepared for the general information of shareholders.
It is authorized for distribution to prospective investors only when preceded or accompanied by a current prospectus.
NOT FDIC INSURED Ÿ MAY LOSE VALUE Ÿ NO BANK GUARANTEE

LETTER FROM THE CHAIRMAN AND CEO
Dear Shareholders:
The first quarter of 2013 delivered strong returns to global equity investors, particularly those holding U.S. and Japanese stocks, while bond returns were flat overall. The U.S.
economy picked up steam, driven by the improving housing and job markets. U.S. economic data were broadly positive, with growth in manufacturing activity, durable goods orders and auto sales. However, consumer confidence wavered somewhat, a likely reflection of the impact of the payroll tax increase and uncertainty over the U.S. government’s across-the-board sequestration cuts.
The eurozone’s unemployment picture and overall economic activity steadily worsened. Cyprus, the latest debt-crisis hot spot, faces unique challenges, with its oversized banking sector’s unhealthy exposure to Greek debt. In addition, the hefty cost to
large bank depositors could weaken confidence in the region’s financial stability. China’s economic activity rebounded after a mild slowdown in 2012. The Japanese government’s aggressive effort to stimulate its long-dormant economy by devaluing the yen lifted stock prices, exports and profits for struggling Japanese firms. The outlook for further economic growth and an extension of the U.S. bull market is highly dependent on how much damage is caused by the U.S. budget cuts, global growth prospects and the ebb and flow of global tail risk events. Most factors point to a continued slow and uneven global economic recovery.
As always, managing risk in the face of uncertainty remains a top priority for investors. At MFS®, our uniquely collaborative investment process employs global research and active risk management. Our global team of investment professionals shares ideas and evaluates opportunities across continents, investment disciplines and asset classes — all with a goal of building better insights, and ultimately better results, for our clients.
We remain mindful of the many economic challenges investors face today, and believe it is more important than ever to maintain a long-term view and employ time-tested principles, such as asset allocation and diversification. We also remain confident that our unique approach can serve investors well as they work with their financial advisors to identify and pursue the most suitable opportunities.
Respectfully,

Robert J. Manning
Chairman and Chief Executive Officer
MFS Investment Management®
May 15, 2013
The opinions expressed in this letter are subject to change, may not be relied upon for investment advice, and no forecasts can be guaranteed.
1
PORTFOLIO COMPOSITION
Portfolio structure (i)

| | | | |
| Top ten holdings (i) | | | | |
| Exxon Mobil Corp. | | | 4.1% | |
| Apple, Inc. | | | 2.9% | |
| Danaher Corp. | | | 2.3% | |
| Johnson & Johnson | | | 2.0% | |
| Google, Inc., “A” | | | 2.0% | |
| JPMorgan Chase & Co. | | | 2.0% | |
| Pfizer, Inc. | | | 2.0% | |
| Visa, Inc., “A” | | | 1.9% | |
| Philip Morris International, Inc. | | | 1.7% | |
| Target Corp. | | | 1.7% | |
| | | | |
| Global equity sectors (i) | | | | |
| Technology | | | 16.6% | |
| Financial Services | | | 16.3% | |
| Capital Goods | | | 14.5% | |
| Energy | | | 14.5% | |
| Health Care | | | 12.7% | |
| Consumer Cyclicals | | | 11.6% | |
| Consumer Staples | | | 8.4% | |
| Telecommunications/Cable television | | | 4.5% | |
| (i) | For purposes of this presentation, the components include the market value of securities and reflect the impact of the equivalent exposure of derivative positions. These amounts may be negative from time to time. Equivalent exposure is a calculated amount that translates the derivative position into a reasonable approximation of the amount of the underlying asset that the portfolio would have to hold at a given point in time to have the same price sensitivity that results from the portfolio’s ownership of the derivative contract. When dealing with derivatives, equivalent exposure is a more representative measure of the potential impact of a position on portfolio performance than market value. |
Percentages are based on net assets as of 3/31/13.
The portfolio is actively managed and current holdings may be different.
2
EXPENSE TABLE
Fund expenses borne by the shareholders during the period,
October 1, 2012 through March 31, 2013
As a shareholder of the fund, you incur two types of costs: (1) transaction costs, including sales charges (loads) on certain purchase or redemption payments, and (2) ongoing costs, including management fees; distribution and service (12b-1) fees; and other fund expenses. This example is intended to help you understand your ongoing costs (in dollars) of investing in the fund and to compare these costs with the ongoing costs of investing in other mutual funds.
The example is based on an investment of $1,000 invested at the beginning of the period and held for the entire period October 1, 2012 through March 31, 2013.
The expenses include the payment of a portion of the transfer-agent-related expenses of MFS funds that invest in the fund. For further information, please see the Notes to the Financial Statements.
Actual Expenses
The first line for each share class in the following table provides information about actual account values and actual expenses. You may use the information in this line, together with the amount you invested, to estimate the expenses that you paid over the period. Simply divide your account value by $1,000 (for example, an $8,600 account value divided by $1,000 = 8.6), then multiply the result by the number in the first line under the heading entitled “Expenses Paid During Period” to estimate the expenses you paid on your account during this period.
Hypothetical Example for Comparison Purposes
The second line for each share class in the following table provides information about hypothetical account values and hypothetical expenses based on the fund’s actual expense ratio and an assumed rate of return of 5% per year before expenses, which is not the fund’s actual return. The hypothetical account values and expenses may not be used to estimate the actual ending account balance or expenses you paid for the period. You may use this information to compare the ongoing costs of investing in the fund and other funds. To do so, compare this 5% hypothetical example with the 5% hypothetical examples that appear in the shareholder reports of the other funds.
Please note that the expenses shown in the table are meant to highlight your ongoing costs only and do not reflect any transactional costs, such as sales charges (loads). Therefore, the second line for each share class in the table is useful in comparing ongoing costs only, and will not help you determine the relative total costs of owning different funds. In addition, if these transactional costs were included, your costs would have been higher.
3
Expense Table – continued
| | | | | | | | | | | | | | | | | | |
Share
Class | | | | Annualized
Expense
Ratio | | | Beginning
Account Value
10/01/12 | | | Ending Account Value
3/31/13 | | | Expenses Paid During Period (p)
10/01/12-3/31/13 | |
| A | | Actual | | | 0.85% | | | | $1,000.00 | | | | $1,105.47 | | | | $4.46 | |
| | Hypothetical (h) | | | 0.85% | | | | $1,000.00 | | | | $1,020.69 | | | | $4.28 | |
| B | | Actual | | | 1.60% | | | | $1,000.00 | | | | $1,101.12 | | | | $8.38 | |
| | Hypothetical (h) | | | 1.60% | | | | $1,000.00 | | | | $1,016.95 | | | | $8.05 | |
| C | | Actual | | | 1.60% | | | | $1,000.00 | | | | $1,101.54 | | | | $8.38 | |
| | Hypothetical (h) | | | 1.60% | | | | $1,000.00 | | | | $1,016.95 | | | | $8.05 | |
| I | | Actual | | | 0.60% | | | | $1,000.00 | | | | $1,106.79 | | | | $3.15 | |
| | Hypothetical (h) | | | 0.60% | | | | $1,000.00 | | | | $1,021.94 | | | | $3.02 | |
| R1 | | Actual | | | 1.60% | | | | $1,000.00 | | | | $1,101.17 | | | | $8.38 | |
| | Hypothetical (h) | | | 1.60% | | | | $1,000.00 | | | | $1,016.95 | | | | $8.05 | |
| R2 | | Actual | | | 1.10% | | | | $1,000.00 | | | | $1,103.69 | | | | $5.77 | |
| | Hypothetical (h) | | | 1.10% | | | | $1,000.00 | | | | $1,019.45 | | | | $5.54 | |
| R3 | | Actual | | | 0.85% | | | | $1,000.00 | | | | $1,105.41 | | | | $4.46 | |
| | Hypothetical (h) | | | 0.85% | | | | $1,000.00 | | | | $1,020.69 | | | | $4.28 | |
| R4 | | Actual | | | 0.60% | | | | $1,000.00 | | | | $1,107.11 | | | | $3.15 | |
| | Hypothetical (h) | | | 0.60% | | | | $1,000.00 | | | | $1,021.94 | | | | $3.02 | |
| R5 | | Actual | | | 0.55% | | | | $1,000.00 | | | | $1,106.94 | | | | $2.89 | |
| | Hypothetical (h) | | | 0.55% | | | | $1,000.00 | | | | $1,022.19 | | | | $2.77 | |
| (h) | 5% class return per year before expenses. |
| (p) | Expenses paid are equal to each class’s annualized expense ratio, as shown above, multiplied by the average account value over the period, multiplied by the number of days in the period, divided by the number of days in the year. Expenses paid do not include any applicable sales charges (loads). If these transaction costs had been included, your costs would have been higher. |
4
PORTFOLIO OF INVESTMENTS
3/31/13 (unaudited)
The Portfolio of Investments is a complete list of all securities owned by your fund. It is categorized by broad-based asset classes.
| | | | | | | | |
| Common Stocks - 98.6% | | | | | | | | |
| Issuer | | Shares/Par | | | Value ($) | |
| Aerospace - 3.1% | | | | | | | | |
| Honeywell International, Inc. | | | 509,640 | | | $ | 38,401,374 | |
| Precision Castparts Corp. | | | 185,810 | | | | 35,233,292 | |
| United Technologies Corp. | | | 322,450 | | | | 30,126,504 | |
| | | | | | | | |
| | | | | | | $ | 103,761,170 | |
| Alcoholic Beverages - 0.5% | | | | | | | | |
| Diageo PLC | | | 552,461 | | | $ | 17,418,312 | |
| | |
| Apparel Manufacturers - 1.7% | | | | | | | | |
| Guess?, Inc. | | | 523,450 | | | $ | 12,997,264 | |
| Li & Fung Ltd. | | | 5,990,000 | | | | 8,256,003 | |
| NIKE, Inc., “B” | | | 318,130 | | | | 18,772,851 | |
| VF Corp. | | | 110,050 | | | | 18,460,888 | |
| | | | | | | | |
| | | | | | | $ | 58,487,006 | |
| Automotive - 1.2% | | | | | | | | |
| Delphi Automotive PLC | | | 570,280 | | | $ | 25,320,432 | |
| General Motors Co. (a) | | | 583,390 | | | | 16,229,910 | |
| | | | | | | | |
| | | | | | | $ | 41,550,342 | |
| Biotechnology - 1.6% | | | | | | | | |
| Celgene Corp. (a) | | | 211,380 | | | $ | 24,501,056 | |
| Gilead Sciences, Inc. (a) | | | 431,100 | | | | 21,093,723 | |
| ViroPharma, Inc. (a) | | | 365,850 | | | | 9,204,786 | |
| | | | | | | | |
| | | | | | | $ | 54,799,565 | |
| Broadcasting - 2.5% | | | | | | | | |
| News Corp., “A” | | | 1,779,660 | | | $ | 54,315,223 | |
| Walt Disney Co. | | | 520,820 | | | | 29,582,576 | |
| | | | | | | | |
| | | | | | | $ | 83,897,799 | |
| Brokerage & Asset Managers - 1.6% | | | | | | | | |
| BlackRock, Inc. | | | 98,793 | | | $ | 25,377,946 | |
| Franklin Resources, Inc. | | | 187,690 | | | | 28,305,529 | |
| | | | | | | | |
| | | | | | | $ | 53,683,475 | |
| Business Services - 1.9% | | | | | | | | |
| Accenture PLC, “A” | | | 387,450 | | | $ | 29,434,577 | |
| Fidelity National Information Services, Inc. | | | 464,310 | | | | 18,395,962 | |
5
Portfolio of Investments (unaudited) – continued
| | | | | | | | |
| Issuer | | Shares/Par | | | Value ($) | |
| Common Stocks - continued | | | | | | | | |
| Business Services - continued | | | | | | | | |
| FleetCor Technologies, Inc. (a) | | | 190,880 | | | $ | 14,634,770 | |
| | | | | | | | |
| | | | | | | $ | 62,465,309 | |
| Cable TV - 1.6% | | | | | | | | |
| Comcast Corp., “Special A” | | | 866,020 | | | $ | 34,311,712 | |
| Time Warner Cable, Inc. | | | 212,280 | | | | 20,391,617 | |
| | | | | | | | |
| | | | | | | $ | 54,703,329 | |
| Chemicals - 0.8% | | | | | | | | |
| 3M Co. | | | 57,980 | | | $ | 6,163,854 | |
| Celanese Corp. | | | 494,870 | | | | 21,799,023 | |
| | | | | | | | |
| | | | | | | $ | 27,962,877 | |
| Computer Software - 3.9% | | | | | | | | |
| Check Point Software Technologies Ltd. (a) | | | 210,100 | | | $ | 9,872,599 | |
| Citrix Systems, Inc. (a) | | | 307,470 | | | | 22,187,035 | |
| Oracle Corp. | | | 1,499,770 | | | | 48,502,562 | |
| Salesforce.com, Inc. (a) | | | 156,730 | | | | 28,028,026 | |
| Symantec Corp. (a) | | | 500,800 | | | | 12,359,744 | |
| TIBCO Software, Inc. (a) | | | 410,260 | | | | 8,295,457 | |
| | | | | | | | |
| | | | | | | $ | 129,245,423 | |
| Computer Software - Systems - 5.2% | | | | | | | | |
| Apple, Inc. (s) | | | 219,260 | | | $ | 97,051,054 | |
| Dell, Inc. | | | 230,640 | | | | 3,305,071 | |
| EMC Corp. (a) | | | 1,331,570 | | | | 31,811,207 | |
| Hewlett-Packard Co. | | | 1,771,690 | | | | 42,237,090 | |
| | | | | | | | |
| | | | | | | $ | 174,404,422 | |
| Construction - 0.9% | | | | | | | | |
| Stanley Black & Decker, Inc. | | | 389,660 | | | $ | 31,550,770 | |
| | |
| Consumer Products - 2.0% | | | | | | | | |
| Colgate-Palmolive Co. | | | 236,380 | | | $ | 27,899,931 | |
| International Flavors & Fragrances, Inc. | | | 282,090 | | | | 21,627,840 | |
| Procter & Gamble Co. | | | 217,500 | | | | 16,760,550 | |
| | | | | | | | |
| | | | | | | $ | 66,288,321 | |
| Consumer Services - 0.5% | | | | | | | | |
| Priceline.com, Inc. (a) | | | 24,420 | | | $ | 16,799,251 | |
| | |
| Containers - 0.4% | | | | | | | | |
| Packaging Corp. of America | | | 283,450 | | | $ | 12,718,402 | |
6
Portfolio of Investments (unaudited) – continued
| | | | | | | | |
| Issuer | | Shares/Par | | | Value ($) | |
| Common Stocks - continued | | | | | | | | |
| Electrical Equipment - 3.0% | | | | | | | | |
| Danaher Corp. (s) | | | 1,258,750 | | | $ | 78,231,312 | |
| W.W. Grainger, Inc. | | | 92,460 | | | | 20,801,651 | |
| | | | | | | | |
| | | | | | | $ | 99,032,963 | |
| Electronics - 2.4% | | | | | | | | |
| Altera Corp. | | | 655,430 | | | $ | 23,248,102 | |
| JDS Uniphase Corp. (a) | | | 950,710 | | | | 12,710,993 | |
| Mellanox Technologies Ltd. (a) | | | 191,660 | | | | 10,639,047 | |
| Microchip Technology, Inc. | | | 676,630 | | | | 24,872,919 | |
| NXP Semiconductors N.V. (a) | | | 312,550 | | | | 9,457,763 | |
| | | | | | | | |
| | | | | | | $ | 80,928,824 | |
| Energy - Independent - 4.2% | | | | | | | | |
| Anadarko Petroleum Corp. | | | 220,830 | | | $ | 19,311,583 | |
| Cabot Oil & Gas Corp. | | | 406,490 | | | | 27,482,789 | |
| EOG Resources, Inc. | | | 140,260 | | | | 17,963,098 | |
| EQT Corp. | | | 171,410 | | | | 11,613,027 | |
| Noble Energy, Inc. | | | 172,000 | | | | 19,893,520 | |
| Occidental Petroleum Corp. | | | 232,840 | | | | 18,247,671 | |
| Pioneer Natural Resources Co. | | | 206,410 | | | | 25,646,443 | |
| | | | | | | | |
| | | | | | | $ | 140,158,131 | |
| Energy - Integrated - 4.1% | | | | | | | | |
| Exxon Mobil Corp. (s) | | | 1,506,550 | | | $ | 135,755,220 | |
| | |
| Engineering - Construction - 0.7% | | | | | | | | |
| Fluor Corp. | | | 337,920 | | | $ | 22,414,234 | |
| | |
| Food & Beverages - 3.6% | | | | | | | | |
| Coca-Cola Co. | | | 1,137,730 | | | $ | 46,009,801 | |
| General Mills, Inc. | | | 434,270 | | | | 21,413,854 | |
| Groupe Danone | | | 271,188 | | | | 18,871,153 | |
| Mondelez International, Inc. | | | 1,114,030 | | | | 34,100,458 | |
| | | | | | | | |
| | | | | | | $ | 120,395,266 | |
| Food & Drug Stores - 0.9% | | | | | | | | |
| CVS Caremark Corp. | | | 383,020 | | | $ | 21,062,270 | |
| Walgreen Co. | | | 203,980 | | | | 9,725,766 | |
| | | | | | | | |
| | | | | | | $ | 30,788,036 | |
| Gaming & Lodging - 0.4% | | | | | | | | |
| Sands China Ltd. | | | 1,173,600 | | | $ | 6,084,785 | |
| Wynn Resorts Ltd. | | | 51,790 | | | | 6,482,036 | |
| | | | | | | | |
| | | | | | | $ | 12,566,821 | |
7
Portfolio of Investments (unaudited) – continued
| | | | | | | | |
| Issuer | | Shares/Par | | | Value ($) | |
| Common Stocks - continued | | | | | | | | |
| General Merchandise - 2.2% | | | | | | | | |
| Hudson’s Bay Co. | | | 437,890 | | | $ | 6,815,542 | |
| Kohl’s Corp. | | | 250,250 | | | | 11,544,033 | |
| Target Corp. | | | 816,420 | | | | 55,883,949 | |
| | | | | | | | |
| | | | | | | $ | 74,243,524 | |
| Health Maintenance Organizations - 0.8% | | | | | | | | |
| UnitedHealth Group, Inc. | | | 446,350 | | | $ | 25,535,684 | |
| | |
| Insurance - 2.7% | | | | | | | | |
| ACE Ltd. | | | 385,830 | | | $ | 34,327,295 | |
| American International Group, Inc. (a) | | | 611,230 | | | | 23,727,949 | |
| MetLife, Inc. | | | 860,840 | | | | 32,729,137 | |
| | | | | | | | |
| | | | | | | $ | 90,784,381 | |
| Internet - 3.2% | | | | | | | | |
| eBay, Inc. (a) | | | 549,580 | | | $ | 29,798,228 | |
| Google, Inc., “A” (a) | | | 85,260 | | | | 67,698,998 | |
| Rackspace Hosting, Inc. (a) | | | 172,560 | | | | 8,710,829 | |
| | | | | | | | |
| | | | | | | $ | 106,208,055 | |
| Machinery & Tools - 2.3% | | | | | | | | |
| Eaton Corp. PLC | | | 353,750 | | | $ | 21,667,188 | |
| Joy Global, Inc. | | | 383,040 | | | | 22,798,541 | |
| Roper Industries, Inc. | | | 242,310 | | | | 30,848,486 | |
| | | | | | | | |
| | | | | | | $ | 75,314,215 | |
| Major Banks - 6.3% | | | | | | | | |
| Goldman Sachs Group, Inc. | | | 143,350 | | | $ | 21,093,953 | |
| JPMorgan Chase & Co. | | | 1,409,720 | | | | 66,905,311 | |
| Morgan Stanley | | | 852,540 | | | | 18,738,829 | |
| PNC Financial Services Group, Inc. | | | 353,950 | | | | 23,537,675 | |
| State Street Corp. | | | 450,820 | | | | 26,638,954 | |
| Wells Fargo & Co. | | | 1,490,420 | | | | 55,130,636 | |
| | | | | | | | |
| | | | | | | $ | 212,045,358 | |
| Medical & Health Technology & Services - 1.7% | | | | | | | | |
| AmerisourceBergen Corp. | | | 312,530 | | | $ | 16,079,668 | |
| Cerner Corp. (a) | | | 127,240 | | | | 12,055,990 | |
| Express Scripts Holding Co. (a) | | | 476,780 | | | | 27,486,367 | |
| | | | | | | | |
| | | | | | | $ | 55,622,025 | |
| Medical Equipment - 2.6% | | | | | | | | |
| Covidien PLC | | | 408,080 | | | $ | 27,684,147 | |
| St. Jude Medical, Inc. | | | 354,980 | | | | 14,355,391 | |
8
Portfolio of Investments (unaudited) – continued
| | | | | | | | |
| Issuer | | Shares/Par | | | Value ($) | |
| Common Stocks - continued | | | | | | | | |
| Medical Equipment - continued | | | | | | | | |
| Stryker Corp. | | | 303,310 | | | $ | 19,787,944 | |
| Thermo Fisher Scientific, Inc. | | | 344,160 | | | | 26,324,798 | |
| | | | | | | | |
| | | | | | | $ | 88,152,280 | |
| Natural Gas - Distribution - 0.5% | | | | | | | | |
| Spectra Energy Corp. | | | 503,220 | | | $ | 15,474,015 | |
| | |
| Natural Gas - Pipeline - 0.4% | | | | | | | | |
| Kinder Morgan, Inc. | | | 387,528 | | | $ | 14,989,583 | |
| | |
| Network & Telecom - 0.1% | | | | | | | | |
| Fortinet, Inc. (a) | | | 70,080 | | | $ | 1,659,494 | |
| | |
| Oil Services - 2.1% | | | | | | | | |
| Cameron International Corp. (a) | | | 390,710 | | | $ | 25,474,292 | |
| Dresser-Rand Group, Inc. (a) | | | 320,290 | | | | 19,749,081 | |
| Ensco PLC, “A” | | | 151,840 | | | | 9,110,400 | |
| Schlumberger Ltd. | | | 219,180 | | | | 16,414,390 | |
| | | | | | | | |
| | | | | | | $ | 70,748,163 | |
| Other Banks & Diversified Financials - 5.7% | | | | | | | | |
| American Express Co. | | | 530,290 | | | $ | 35,773,363 | |
| Citigroup, Inc. | | | 1,251,010 | | | | 55,344,682 | |
| Discover Financial Services | | | 417,400 | | | | 18,716,216 | |
| SunTrust Banks, Inc. | | | 587,500 | | | | 16,925,875 | |
| Visa, Inc., “A” | | | 376,750 | | | | 63,987,220 | |
| | | | | | | | |
| | | | | | | $ | 190,747,356 | |
| Pharmaceuticals - 6.0% | | | | | | | | |
| Eli Lilly & Co. | | | 419,790 | | | $ | 23,839,874 | |
| Johnson & Johnson | | | 830,910 | | | | 67,744,092 | |
| Perrigo Co. | | | 109,450 | | | | 12,994,999 | |
| Pfizer, Inc. | | | 2,313,860 | | | | 66,778,000 | |
| Valeant Pharmaceuticals International, Inc. (a) | | | 150,290 | | | | 11,274,756 | |
| Zoetis, Inc. (a) | | | 529,160 | | | | 17,673,944 | |
| | | | | | | | |
| | | | | | | $ | 200,305,665 | |
| Railroad & Shipping - 0.9% | | | | | | | | |
| Union Pacific Corp. | | | 209,020 | | | $ | 29,766,538 | |
| | |
| Restaurants - 1.4% | | | | | | | | |
| McDonald’s Corp. | | | 334,670 | | | $ | 33,363,252 | |
| Starbucks Corp. | | | 255,900 | | | | 14,576,064 | |
| | | | | | | | |
| | | | | | | $ | 47,939,316 | |
9
Portfolio of Investments (unaudited) – continued
| | | | | | | | |
| Issuer | | Shares/Par | | | Value ($) | |
| Common Stocks - continued | | | | | | | | |
| Specialty Chemicals - 0.4% | | | | | | | | |
| Airgas, Inc. | | | 122,690 | | | $ | 12,165,940 | |
| | |
| Specialty Stores - 2.0% | | | | | | | | |
| Amazon.com, Inc. (a) | | | 66,050 | | | $ | 17,601,664 | |
| AutoZone, Inc. (a) | | | 45,220 | | | | 17,941,939 | |
| Bed Bath & Beyond, Inc. (a) | | | 283,770 | | | | 18,280,463 | |
| Tiffany & Co. | | | 204,640 | | | | 14,230,666 | |
| | | | | | | | |
| | | | | | | $ | 68,054,732 | |
| Telecommunications - Wireless - 0.8% | | | | | | | | |
| American Tower Corp., REIT | | | 218,430 | | | $ | 16,801,636 | |
| SBA Communications Corp. (a) | | | 117,310 | | | | 8,448,666 | |
| | | | | | | | |
| | | | | | | $ | 25,250,302 | |
| Telephone Services - 2.1% | | | | | | | | |
| AT&T, Inc. | | | 791,590 | | | $ | 29,043,437 | |
| Verizon Communications, Inc. | | | 809,580 | | | | 39,790,857 | |
| | | | | | | | |
| | | | | | | $ | 68,834,294 | |
| Tobacco - 2.3% | | | | | | | | |
| Lorillard, Inc. | | | 487,970 | | | $ | 19,689,590 | |
| Philip Morris International, Inc. | | | 608,760 | | | | 56,438,140 | |
| | | | | | | | |
| | | | | | | $ | 76,127,730 | |
| Trucking - 0.8% | | | | | | | | |
| Expeditors International of Washington, Inc. | | | 787,630 | | | $ | 28,126,267 | |
| | |
| Utilities - Electric Power - 2.6% | | | | | | | | |
| AES Corp. | | | 814,020 | | | $ | 10,232,231 | |
| American Electric Power Co., Inc. | | | 333,520 | | | | 16,219,078 | |
| CMS Energy Corp. | | | 888,510 | | | | 24,824,969 | |
| Duke Energy Corp. | | | 169,560 | | | | 12,308,360 | |
| Edison International | | | 478,140 | | | | 24,060,005 | |
| | | | | | | | |
| | | | | | | $ | 87,644,643 | |
| Total Common Stocks (Identified Cost, $2,754,307,887) | | | $ | 3,297,514,828 | |
| | |
| Convertible Preferred Stocks - 0.4% | | | | | | | | |
| Utilities - Electric Power - 0.4% | | | | | | | | |
PPL Corp. 9.5% (Identified Cost, $12,863,017) | | | 239,930 | | | $ | 13,148,164 | |
10
Portfolio of Investments (unaudited) – continued
| | | | | | | | | | | | | | | | |
| Warrants - 0.0% | | | | | | | | | | | | | | | | |
| Issuer | | Strike Price | | | First Exercise | | | Shares/Par | | | Value ($) | |
| Natural Gas - Pipeline - 0.0% | | | | | | | | | | | | | |
| Kinder Morgan, Inc. (1 share for 1 warrant) (Identified Cost, $0) (a) | | $ | 40 | | | | 2/15/12 | | | | 201,996 | | | $ | 1,038,259 | |
| | |
| Money Market Funds - 0.9% | | | | | | | | | |
MFS Institutional Money Market Portfolio, 0.14%,
at Cost and Net Asset Value (v) | | | | | | | | 31,356,852 | | | $ | 31,356,852 | |
| Total Investments (Identified Cost, $2,798,527,756) | | | | | | | $ | 3,343,058,103 | |
| | | |
| Issuer/Expiration Date/Strike Price | | | | | | Number
of
Contracts | | | | |
| Call Options Written - 0.0% | | | | | | | | | | | | | |
Oracle Corp. - April 2013 @ $34
(Premiums Received, $26,614) | | | | | | | | $(930) | | | $ | (8,370 | ) |
| | | |
| Other Assets, Less Liabilities - 0.1% | | | | | | | | | | | | 2,235,848 | |
| Net Assets - 100.0% | | | | | | | | | | | | | | $ | 3,345,285,581 | |
| (a) | Non-income producing security. |
| (s) | Security or a portion of the security was pledged to cover collateral requirements for certain derivative transactions. |
| (v) | Underlying affiliated fund that is available only to investment companies managed by MFS. The rate quoted for the MFS Institutional Money Market Portfolio is the annualized seven-day yield of the fund at period end. |
At March 31, 2013, the fund had cash collateral of $79,613 and other liquid securities with an aggregate value of $1,289,674 to cover any commitments for certain derivative contracts. Cash collateral is comprised of “Deposits with brokers” in the Statement of Assets and Liabilities.
The following abbreviations are used in this report and are defined:
| PLC | | Public Limited Company |
| REIT | | Real Estate Investment Trust |
See Notes to Financial Statements
11
Financial Statements
STATEMENT OF ASSETS AND LIABILITIES
At 3/31/13 (unaudited)
This statement represents your fund’s balance sheet, which details the assets and liabilities comprising the total value of the fund.
| | | | |
| Assets | | | | |
Investments- | | | | |
Non-affiliated issuers, at value (identified cost, $2,767,170,904) | | | $3,311,701,251 | |
Underlying affiliated funds, at cost and value | | | 31,356,852 | |
Total investments, at value (identified cost, $2,798,527,756) | | | $3,343,058,103 | |
Cash | | | 100,710 | |
Foreign currency, at value (identified cost, $23) | | | 23 | |
Deposits with brokers | | | 79,613 | |
Receivables for | | | | |
Fund shares sold | | | 5,392,150 | |
Interest and dividends | | | 3,487,241 | |
Other assets | | | 62,673 | |
Total assets | | | $3,352,180,513 | |
| Liabilities | | | | |
Payables for | | | | |
Fund shares reacquired | | | $5,156,511 | |
Written options outstanding, at value (premiums received, $26,614) | | | 8,370 | |
Payable to affiliates | | | | |
Investment adviser | | | 202,755 | |
Shareholder servicing costs | | | 1,254,069 | |
Distribution and service fees | | | 82,027 | |
Payable for independent Trustees’ compensation | | | 157,198 | |
Accrued expenses and other liabilities | | | 34,002 | |
Total liabilities | | | $6,894,932 | |
Net assets | | | $3,345,285,581 | |
| Net assets consist of | | | | |
Paid-in capital | | | $2,868,217,281 | |
Unrealized appreciation (depreciation) on investments and translation of assets and liabilities in foreign currencies | | | 544,548,875 | |
Accumulated net realized gain (loss) on investments and foreign currency | | | (85,999,541 | ) |
Undistributed net investment income | | | 18,518,966 | |
Net assets | | | $3,345,285,581 | |
Shares of beneficial interest outstanding | | | 106,225,671 | |
12
Statement of Assets and Liabilities (unaudited) – continued
| | | | | | | | | | | | |
| | | Net assets | | | Shares
outstanding | | | Net asset value
per share (a) | |
Class A | | | $1,763,477,205 | | | | 55,929,448 | | | | $31.53 | |
Class B | | | 32,229,346 | | | | 1,096,067 | | | | 29.40 | |
Class C | | | 93,123,576 | | | | 3,176,552 | | | | 29.32 | |
Class I | | | 375,009,847 | | | | 11,670,690 | | | | 32.13 | |
Class R1 | | | 3,303,666 | | | | 114,028 | | | | 28.97 | |
Class R2 | | | 23,342,400 | | | | 758,009 | | | | 30.79 | |
Class R3 | | | 48,429,383 | | | | 1,543,451 | | | | 31.38 | |
Class R4 | | | 30,065,531 | | | | 953,990 | | | | 31.52 | |
Class R5 | | | 976,304,627 | | | | 30,983,436 | | | | 31.51 | |
| (a) | Maximum offering price per share was equal to the net asset value per share for all share classes, except for Class A, for which the maximum offering price per share was $33.45 [100 / 94.25 x $31.53]. On sales of $50,000 or more, the maximum offering price of Class A shares is reduced. A contingent deferred sales charge may be imposed on redemptions of Class A, Class B, and Class C shares. Redemption price per share was equal to the net asset value per share for Classes I, R1, R2, R3, R4, and R5. |
See Notes to Financial Statements
13
Financial Statements
STATEMENT OF OPERATIONS
Six months ended 3/31/13 (unaudited)
This statement describes how much your fund earned in investment income and accrued in expenses. It also describes any gains and/or losses generated by fund operations.
| | | | |
| Net investment income | | | | |
Income | | | | |
Dividends | | | $30,002,568 | |
Interest | | | 81,556 | |
Dividends from underlying affiliated funds | | | 30,904 | |
Foreign taxes withheld | | | (9,229 | ) |
Total investment income | | | $30,105,799 | |
Expenses | | | | |
Management fee | | | $6,426,549 | |
Distribution and service fees | | | 2,736,026 | |
Shareholder servicing costs | | | 1,765,757 | |
Administrative services fee | | | 196,303 | |
Independent Trustees’ compensation | | | 34,365 | |
Custodian fee | | | 81,913 | |
Shareholder communications | | | 41,468 | |
Audit and tax fees | | | 24,245 | |
Legal fees | | | 16,370 | |
Interest expense on securities sold short | | | 6,421 | |
Miscellaneous | | | 145,831 | |
Total expenses | | | $11,475,248 | |
Fees paid indirectly | | | (24 | ) |
Reduction of expenses by investment adviser | | | (3,024 | ) |
Net expenses | | | $11,472,200 | |
Net investment income | | | $18,633,599 | |
| Realized and unrealized gain (loss) on investments and foreign currency | |
Realized gain (loss) (identified cost basis) | | | | |
Investments | | | $125,601,916 | |
Written options | | | 49,232 | |
Securities sold short | | | (1,855,839 | ) |
Foreign currency | | | (51,969 | ) |
Net realized gain (loss) on investments and foreign currency | | | $123,743,340 | |
Change in unrealized appreciation (depreciation) | | | | |
Investments | | | $169,774,869 | |
Written options | | | 18,244 | |
Securities sold short | | | 1,131,043 | |
Translation of assets and liabilities in foreign currencies | | | 298 | |
Net unrealized gain (loss) on investments and foreign currency translation | | | $170,924,454 | |
Net realized and unrealized gain (loss) on investments and foreign currency | | | $294,667,794 | |
Change in net assets from operations | | | $313,301,393 | |
See Notes to Financial Statements
14
Financial Statements
STATEMENTS OF CHANGES IN NET ASSETS
These statements describe the increases and/or decreases in net assets resulting from operations, any distributions, and any shareholder transactions.
| | | | | | | | |
| Change in net assets | | Six months ended
3/31/13
(unaudited) | | | Year ended
9/30/12 | |
| From operations | | | | | | | | |
Net investment income | | | $18,633,599 | | | | $24,150,260 | |
Net realized gain (loss) on investments and foreign currency | | | 123,743,340 | | | | 113,179,797 | |
Net unrealized gain (loss) on investments and foreign currency translation | | | 170,924,454 | | | | 453,798,998 | |
Change in net assets from operations | | | $313,301,393 | | | | $591,129,055 | |
| Distributions declared to shareholders | | | | | | | | |
From net investment income | | | $(24,130,435 | ) | | | $(18,435,299 | ) |
Change in net assets from fund share transactions | | | $256,787,269 | | | | $271,041,801 | |
Total change in net assets | | | $545,958,227 | | | | $843,735,557 | |
| Net assets | | | | | | | | |
At beginning of period | | | 2,799,327,354 | | | | 1,955,591,797 | |
At end of period (including undistributed net investment income of $18,518,966 and $24,015,802, respectively) | | | $3,345,285,581 | | | | $2,799,327,354 | |
See Notes to Financial Statements
15
Financial Statements
FINANCIAL HIGHLIGHTS
The financial highlights table is intended to help you understand the fund’s financial performance for the semiannual period and the past 5 fiscal years. Certain information reflects financial results for a single fund share. The total returns in the table represent the rate by which an investor would have earned (or lost) on an investment in the fund share class (assuming reinvestment of all distributions) held for the entire period.
| | | | | | | | | | | | | | | | | | | | | | | | |
| | | Six months
ended
3/31/13 (unaudited) | | | Years ended 9/30 | |
| Class A | | | 2012 | | | 2011 | | | 2010 | | | 2009 | | | 2008 | |
| | | | | | | | | | | | | | | | | |
Net asset value, beginning of
period | | | $28.74 | | | | $22.31 | | | | $22.43 | | | | $20.86 | | | | $22.05 | | | | $26.92 | |
| Income (loss) from investment operations | | | | | |
Net investment income (d) | | | $0.17 | | | | $0.25 | | | | $0.20 | | | | $0.17 | | | | $0.18 | | | | $0.16 | |
Net realized and unrealized
gain (loss) on investments
and foreign currency | | | 2.84 | | | | 6.38 | | | | (0.15 | ) | | | 1.60 | | | | (1.22 | ) | | | (4.88 | ) |
Total from investment
operations | | | $3.01 | | | | $6.63 | | | | $0.05 | | | | $1.77 | | | | $(1.04 | ) | | | $(4.72 | ) |
| Less distributions declared to shareholders | | | | | |
From net investment income | | | $(0.22 | ) | | | $(0.20 | ) | | | $(0.17 | ) | | | $(0.20 | ) | | | $(0.15 | ) | | | $(0.15 | ) |
Net asset value, end of
period (x) | | | $31.53 | | | | $28.74 | | | | $22.31 | | | | $22.43 | | | | $20.86 | | | | $22.05 | |
Total return (%) (r)(s)(t)(x) | | | 10.55 | (n) | | | 29.92 | | | | 0.16 | | | | 8.54 | | | | (4.54 | ) | | | (17.62 | ) |
Ratios (%) (to average net assets)
and Supplemental data: | | | | | |
Expenses before expense
reductions (f) | | | 0.85 | (a) | | | 0.90 | | | | 0.90 | | | | 0.92 | | | | 1.04 | | | | 1.00 | |
Expenses after expense
reductions (f) | | | 0.85 | (a) | | | 0.90 | | | | 0.90 | | | | 0.92 | | | | 1.04 | | | | 1.00 | |
Net investment income | | | 1.17 | (a) | | | 0.97 | | | | 0.82 | | | | 0.77 | | | | 1.04 | | | | 0.65 | |
Portfolio turnover | | | 29 | (n) | | | 61 | | | | 69 | | | | 73 | | | | 125 | | | | 104 | |
Net assets at end of period
(000 omitted) | | | $1,763,477 | | | | $1,541,284 | | | | $1,204,531 | | | | $1,279,176 | | | | $1,203,507 | | | | $1,014,501 | |
| Supplemental Ratios (%): | | | | | | | | | |
Ratio of expenses to average
net assets after expense
reductions excluding short
sale dividend and interest
expense (f) | | | 0.85 | (a) | | | 0.88 | | | | 0.89 | | | | 0.92 | | | | 1.04 | | | | N/A | |
See Notes to Financial Statements
16
Financial Highlights – continued
| | | | | | | | | | | | | | | | | | | | | | | | |
| | | Six months
ended
3/31/13 (unaudited) | | | Years ended 9/30 | |
| Class B | | | 2012 | | | 2011 | | | 2010 | | | 2009 | | | 2008 | |
| | | | | | | | | | | | | | | | | |
Net asset value, beginning of
period | | | $26.70 | | | | $20.70 | | | | $20.83 | | | | $19.37 | | | | $20.44 | | | | $24.97 | |
| Income (loss) from investment operations | | | | | |
Net investment income (d) | | | $0.06 | | | | $0.05 | | | | $0.02 | | | | $0.00 | (w) | | | $0.06 | | | | $(0.00 | )(w) |
Net realized and unrealized
gain (loss) on investments
and foreign currency | | | 2.64 | | | | 5.95 | | | | (0.15 | ) | | | 1.50 | | | | (1.13 | ) | | | (4.53 | ) |
Total from investment
operations | | | $2.70 | | | | $6.00 | | | | $(0.13 | ) | | | $1.50 | | | | $(1.07 | ) | | | $(4.53 | ) |
| Less distributions declared to shareholders | | | | | |
From net investment income | | | $— | | | | $— | | | | $— | | | | $(0.04 | ) | | | $— | | | | $— | |
Net asset value, end of
period (x) | | | $29.40 | | | | $26.70 | | | | $20.70 | | | | $20.83 | | | | $19.37 | | | | $20.44 | |
Total return (%) (r)(s)(t)(x) | | | 10.11 | (n) | | | 28.99 | | | | (0.62 | ) | | | 7.77 | | | | (5.23 | ) | | | (18.14 | ) |
Ratios (%) (to average net assets)
and Supplemental data: | | | | | |
Expenses before expense
reductions (f) | | | 1.60 | (a) | | | 1.65 | | | | 1.65 | | | | 1.67 | | | | 1.75 | | | | 1.65 | |
Expenses after expense
reductions (f) | | | 1.60 | (a) | | | 1.65 | | | | 1.65 | | | | 1.67 | | | | 1.75 | | | | 1.65 | |
Net investment income (loss) | | | 0.43 | (a) | | | 0.22 | | | | 0.07 | | | | 0.02 | | | | 0.36 | | | | (0.01 | ) |
Portfolio turnover | | | 29 | (n) | | | 61 | | | | 69 | | | | 73 | | | | 125 | | | | 104 | |
Net assets at end of period
(000 omitted) | | | $32,229 | | | | $33,019 | | | | $34,609 | | | | $49,123 | | | | $66,795 | | | | $108,949 | |
| Supplemental Ratios (%): | | | | | | | | | |
Ratio of expenses to average
net assets after expense
reductions excluding short
sale dividend and interest
expense (f) | | | 1.60 | (a) | | | 1.63 | | | | 1.64 | | | | 1.67 | | | | 1.75 | | | | N/A | |
See Notes to Financial Statements
17
Financial Highlights – continued
| | | | | | | | | | | | | | | | | | | | | | | | |
| | | Six months
ended
3/31/13 (unaudited) | | | Years ended 9/30 | |
| Class C | | | 2012 | | | 2011 | | | 2010 | | | 2009 | | | 2008 | |
| | | | | | | | | | | | | | | | | |
Net asset value, beginning of
period | | | $26.64 | | | | $20.68 | | | | $20.80 | | | | $19.39 | | | | $20.46 | | | | $24.99 | |
| Income (loss) from investment operations | | | | | |
Net investment income (d) | | | $0.06 | | | | $0.05 | | | | $0.02 | | | | $0.00 | (w) | | | $0.05 | | | | $0.00 | (w) |
Net realized and unrealized
gain (loss) on investments
and foreign currency | | | 2.64 | | | | 5.93 | | | | (0.14 | ) | | | 1.49 | | | | (1.12 | ) | | | (4.53 | ) |
Total from investment
operations | | | $2.70 | | | | $5.98 | | | | $(0.12 | ) | | | $1.49 | | | | $(1.07 | ) | | | $(4.53 | ) |
| Less distributions declared to shareholders | | | | | |
From net investment income | | | $(0.02 | ) | | | $(0.02 | ) | | | $(0.00 | )(w) | | | $(0.08 | ) | | | $— | | | | $— | |
Net asset value, end of
period (x) | | | $29.32 | | | | $26.64 | | | | $20.68 | | | | $20.80 | | | | $19.39 | | | | $20.46 | |
Total return (%) (r)(s)(t)(x) | | | 10.15 | (n) | | | 28.94 | | | | (0.56 | ) | | | 7.69 | | | | (5.23 | ) | | | (18.13 | ) |
Ratios (%) (to average net assets)
and Supplemental data: | | | | | |
Expenses before expense
reductions (f) | | | 1.60 | (a) | | | 1.65 | | | | 1.65 | | | | 1.67 | | | | 1.75 | | | | 1.65 | |
Expenses after expense
reductions (f) | | | 1.60 | (a) | | | 1.65 | | | | 1.65 | | | | 1.67 | | | | 1.75 | | | | 1.65 | |
Net investment income | | | 0.42 | (a) | | | 0.22 | | | | 0.07 | | | | 0.02 | | | | 0.33 | | | | 0.00 | |
Portfolio turnover | | | 29 | (n) | | | 61 | | | | 69 | | | | 73 | | | | 125 | | | | 104 | |
Net assets at end of period
(000 omitted) | | | $93,124 | | | | $85,428 | | | | $72,558 | | | | $81,879 | | | | $85,919 | | | | $105,748 | |
| Supplemental Ratios (%): | | | | | | | | | |
Ratio of expenses to average
net assets after expense
reductions excluding short
sale dividend and interest
expense (f) | | | 1.60 | (a) | | | 1.63 | | | | 1.64 | | | | 1.67 | | | | 1.75 | | | | N/A | |
See Notes to Financial Statements
18
Financial Highlights – continued
| | | | | | | | | | | | | | | | | | | | | | | | |
| | | Six months
ended
3/31/13 (unaudited) | | | Years ended 9/30 | |
| Class I | | | 2012 | | | 2011 | | | 2010 | | | 2009 | | | 2008 | |
| | | | | | | | | | | | | | | | | |
Net asset value, beginning of
period | | | $29.31 | | | | $22.75 | | | | $22.86 | | | | $21.26 | | | | $22.50 | | | | $27.46 | |
| Income (loss) from investment operations | | | | | |
Net investment income (d) | | | $0.21 | | | | $0.33 | | | | $0.27 | | | | $0.23 | | | | $0.25 | | | | $0.26 | |
Net realized and unrealized
gain (loss) on investments
and foreign currency | | | 2.89 | | | | 6.50 | | | | (0.15 | ) | | | 1.62 | | | | (1.27 | ) | | | (4.97 | ) |
Total from investment
operations | | | $3.10 | | | | $6.83 | | | | $0.12 | | | | $1.85 | | | | $(1.02 | ) | | | $(4.71 | ) |
| Less distributions declared to shareholders | | | | | |
From net investment income | | | $(0.28 | ) | | | $(0.27 | ) | | | $(0.23 | ) | | | $(0.25 | ) | | | $(0.22 | ) | | | $(0.25 | ) |
Net asset value, end of
period (x) | | | $32.13 | | | | $29.31 | | | | $22.75 | | | | $22.86 | | | | $21.26 | | | | $22.50 | |
Total return (%) (r)(s)(x) | | | 10.68 | (n) | | | 30.27 | | | | 0.42 | | | | 8.78 | | | | (4.27 | ) | | | (17.31 | ) |
Ratios (%) (to average net assets)
and Supplemental data: | | | | | |
Expenses before expense
reductions (f) | | | 0.60 | (a) | | | 0.65 | | | | 0.65 | | | | 0.67 | | | | 0.75 | | | | 0.65 | |
Expenses after expense
reductions (f) | | | 0.60 | (a) | | | 0.65 | | | | 0.65 | | | | 0.67 | | | | 0.75 | | | | 0.65 | |
Net investment income | | | 1.39 | (a) | | | 1.26 | | | | 1.07 | | | | 1.02 | | | | 1.43 | | | | 1.01 | |
Portfolio turnover | | | 29 | (n) | | | 61 | | | | 69 | | | | 73 | | | | 125 | | | | 104 | |
Net assets at end of period
(000 omitted) | | | $375,010 | | | | $237,389 | | | | $608,723 | | | | $554,786 | | | | $535,678 | | | | $786,709 | |
| Supplemental Ratios (%): | | | | | | | | | |
Ratio of expenses to average
net assets after expense
reductions excluding short
sale dividend and interest
expense (f) | | | 0.60 | (a) | | | 0.63 | | | | 0.64 | | | | 0.67 | | | | 0.75 | | | | N/A | |
See Notes to Financial Statements
19
Financial Highlights – continued
| | | | | | | | | | | | | | | | | | | | | | | | |
| | | Six months
ended
3/31/13 (unaudited) | | | Years ended 9/30 | |
| Class R1 | | | 2012 | | | 2011 | | | 2010 | | | 2009 | | | 2008 | |
| | | | | | | | | | | | | | | | | |
Net asset value, beginning of
period | | | $26.32 | | | | $20.42 | | | | $20.54 | | | | $19.16 | | | | $20.21 | | | | $24.82 | |
| Income (loss) from investment operations | | | | | |
Net investment income (loss) (d) | | | $0.06 | | | | $0.05 | | | | $0.02 | | | | $(0.00 | )(w) | | | $0.05 | | | | $(0.01 | ) |
Net realized and unrealized
gain (loss) on investments
and foreign currency | | | 2.60 | | | | 5.87 | | | | (0.14 | ) | | | 1.47 | | | | (1.10 | ) | | | (4.48 | ) |
Total from investment
operations | | | $2.66 | | | | $5.92 | | | | $(0.12 | ) | | | $1.47 | | | | $(1.05 | ) | | | $(4.49 | ) |
| Less distributions declared to shareholders | | | | | |
From net investment income | | | $(0.01 | ) | | | $(0.02 | ) | | | $— | | | | $(0.09 | ) | | | $— | | | | $(0.12 | ) |
Net asset value, end of
period (x) | | | $28.97 | | | | $26.32 | | | | $20.42 | | | | $20.54 | | | | $19.16 | | | | $20.21 | |
Total return (%) (r)(s)(x) | | | 10.12 | (n) | | | 28.99 | | | | (0.58 | ) | | | 7.68 | | | | (5.20 | ) | | | (18.19 | ) |
Ratios (%) (to average net assets)
and Supplemental data: | | | | | |
Expenses before expense
reductions (f) | | | 1.60 | (a) | | | 1.65 | | | | 1.65 | | | | 1.67 | | | | 1.75 | | | | 1.69 | |
Expenses after expense
reductions (f) | | | 1.60 | (a) | | | 1.65 | | | | 1.65 | | | | 1.67 | | | | 1.75 | | | | 1.69 | |
Net investment income (loss) | | | 0.42 | (a) | | | 0.22 | | | | 0.07 | | | | 0.02 | | | | 0.34 | | | | (0.03 | ) |
Portfolio turnover | | | 29 | (n) | | | 61 | | | | 69 | | | | 73 | | | | 125 | | | | 104 | |
Net assets at end of period
(000 omitted) | | | $3,304 | | | | $2,688 | | | | $2,434 | | | | $2,863 | | | | $2,945 | | | | $3,787 | |
| Supplemental Ratios (%): | | | | | | | | | |
Ratio of expenses to average
net assets after expense
reductions excluding short
sale dividend and interest
expense (f) | | | 1.60 | (a) | | | 1.63 | | | | 1.64 | | | | 1.67 | | | | 1.75 | | | | N/A | |
See Notes to Financial Statements
20
Financial Highlights – continued
| | | | | | | | | | | | | | | | | | | | | | | | |
| | | Six months
ended
3/31/13 (unaudited) | | | Years ended 9/30 | |
| Class R2 | | | 2012 | | | 2011 | | | 2010 | | | 2009 | | | 2008 | |
| | | | | | | | | | | | | | | | | |
Net asset value, beginning of
period | | | $28.07 | | | | $21.80 | | | | $21.95 | | | | $20.43 | | | | $21.59 | | | | $26.42 | |
| Income (loss) from investment operations | | | | | |
Net investment income (d) | | | $0.13 | | | | $0.18 | | | | $0.14 | | | | $0.11 | | | | $0.14 | | | | $0.12 | |
Net realized and unrealized
gain (loss) on investments
and foreign currency | | | 2.76 | | | | 6.25 | | | | (0.16 | ) | | | 1.58 | | | | (1.20 | ) | | | (4.77 | ) |
Total from investment
operations | | | $2.89 | | | | $6.43 | | | | $(0.02 | ) | | | $1.69 | | | | $(1.06 | ) | | | $(4.65 | ) |
| Less distributions declared to shareholders | | | | | |
From net investment income | | | $(0.17 | ) | | | $(0.16 | ) | | | $(0.13 | ) | | | $(0.17 | ) | | | $(0.10 | ) | | | $(0.18 | ) |
Net asset value, end of
period (x) | | | $30.79 | | | | $28.07 | | | | $21.80 | | | | $21.95 | | | | $20.43 | | | | $21.59 | |
Total return (%) (r)(s)(x) | | | 10.37 | (n) | | | 29.66 | | | | (0.13 | ) | | | 8.32 | | | | (4.79 | ) | | | (17.73 | ) |
Ratios (%) (to average net assets)
and Supplemental data: | | | | | |
Expenses before expense
reductions (f) | | | 1.10 | (a) | | | 1.15 | | | | 1.15 | | | | 1.17 | | | | 1.25 | | | | 1.18 | |
Expenses after expense
reductions (f) | | | 1.10 | (a) | | | 1.15 | | | | 1.15 | | | | 1.17 | | | | 1.25 | | | | 1.18 | |
Net investment income | | | 0.91 | (a) | | | 0.71 | | | | 0.57 | | | | 0.52 | | | | 0.81 | | | | 0.49 | |
Portfolio turnover | | | 29 | (n) | | | 61 | | | | 69 | | | | 73 | | | | 125 | | | | 104 | |
Net assets at end of period
(000 omitted) | | | $23,342 | | | | $17,583 | | | | $11,711 | | | | $9,733 | | | | $8,304 | | | | $9,046 | |
| Supplemental Ratios (%): | | | | | | | | | |
Ratio of expenses to average
net assets after expense
reductions excluding short
sale dividend and interest
expense (f) | | | 1.10 | (a) | | | 1.13 | | | | 1.14 | | | | 1.17 | | | | 1.25 | | | | N/A | |
See Notes to Financial Statements
21
Financial Highlights – continued
| | | | | | | | | | | | | | | | | | | | | | | | |
| | | Six months
ended
3/31/13 (unaudited) | | | Years ended 9/30 | |
| Class R3 | | | 2012 | | | 2011 | | | 2010 | | | 2009 | | | 2008 | |
| | | | | | | | | | | | | | | | | |
Net asset value, beginning of
period | | | $28.64 | | | | $22.24 | | | | $22.37 | | | | $20.82 | | | | $21.99 | | | | $26.88 | |
| Income (loss) from investment operations | | | | | |
Net investment income (d) | | | $0.17 | | | | $0.26 | | | | $0.21 | | | | $0.17 | | | | $0.18 | | | | $0.18 | |
Net realized and unrealized
gain (loss) on investments
and foreign currency | | | 2.83 | | | | 6.35 | | | | (0.15 | ) | | | 1.59 | | | | (1.21 | ) | | | (4.87 | ) |
Total from investment
operations | | | $3.00 | | | | $6.61 | | | | $0.06 | | | | $1.76 | | | | $(1.03 | ) | | | $(4.69 | ) |
| Less distributions declared to shareholders | | | | | |
From net investment income | | | $(0.26 | ) | | | $(0.21 | ) | | | $(0.19 | ) | | | $(0.21 | ) | | | $(0.14 | ) | | | $(0.20 | ) |
Net asset value, end of
period (x) | | | $31.38 | | | | $28.64 | | | | $22.24 | | | | $22.37 | | | | $20.82 | | | | $21.99 | |
Total return (%) (r)(s)(x) | | | 10.54 | (n) | | | 29.93 | | | | 0.19 | | | | 8.52 | | | | (4.50 | ) | | | (17.60 | ) |
Ratios (%) (to average net assets)
and Supplemental data: | | | | | |
Expenses before expense
reductions (f) | | | 0.85 | (a) | | | 0.90 | | | | 0.90 | | | | 0.93 | | | | 1.00 | | | | 0.94 | |
Expenses after expense
reductions (f) | | | 0.85 | (a) | | | 0.90 | | | | 0.90 | | | | 0.92 | | | | 1.00 | | | | 0.94 | |
Net investment income | | | 1.15 | (a) | | | 0.96 | | | | 0.84 | | | | 0.77 | | | | 1.04 | | | | 0.72 | |
Portfolio turnover | | | 29 | (n) | | | 61 | | | | 69 | | | | 73 | | | | 125 | | | | 104 | |
Net assets at end of period
(000 omitted) | | | $48,429 | | | | $35,774 | | | | $8,582 | | | | $8,954 | | | | $5,195 | | | | $4,727 | |
| Supplemental Ratios (%): | | | | | | | | | |
Ratio of expenses to average
net assets after expense
reductions excluding short
sale dividend and interest
expense (f) | | | 0.85 | (a) | | | 0.89 | | | | 0.89 | | | | 0.92 | | | | 1.00 | | | | N/A | |
See Notes to Financial Statements
22
Financial Highlights – continued
| | | | | | | | | | | | | | | | | | | | | | | | |
| | | Six months
ended
3/31/13 (unaudited) | | | Years ended 9/30 | |
| Class R4 | | | 2012 | | | 2011 | | | 2010 | | | 2009 | | | 2008 | |
| | | | | | | | | | | | | | | | | |
Net asset value, beginning of
period | | | $28.75 | | | | $22.32 | | | | $22.45 | | | | $20.88 | | | | $22.09 | | | | $26.95 | |
| Income (loss) from investment operations | | | | | |
Net investment income (d) | | | $0.21 | | | | $0.32 | | | | $0.26 | | | | $0.22 | | | | $0.18 | | | | $0.25 | |
Net realized and unrealized
gain (loss) on investments
and foreign currency | | | 2.84 | | | | 6.38 | | | | (0.16 | ) | | | 1.60 | | | | (1.18 | ) | | | (4.88 | ) |
Total from investment
operations | | | $3.05 | | | | $6.70 | | | | $0.10 | | | | $1.82 | | | | $(1.00 | ) | | | $(4.63 | ) |
| Less distributions declared to shareholders | | | | | |
From net investment income | | | $(0.28 | ) | | | $(0.27 | ) | | | $(0.23 | ) | | | $(0.25 | ) | | | $(0.21 | ) | | | $(0.23 | ) |
Net asset value, end of
period (x) | | | $31.52 | | | | $28.75 | | | | $22.32 | | | | $22.45 | | | | $20.88 | | | | $22.09 | |
Total return (%) (r)(s)(x) | | | 10.71 | (n) | | | 30.27 | | | | 0.34 | | | | 8.80 | | | | (4.25 | ) | | | (17.34 | ) |
Ratios (%) (to average net assets)
and Supplemental data: | | | | | |
Expenses before expense
reductions (f) | | | 0.60 | (a) | | | 0.65 | | | | 0.64 | | | | 0.67 | | | | 0.74 | | | | 0.67 | |
Expenses after expense
reductions (f) | | | 0.60 | (a) | | | 0.65 | | | | 0.64 | | | | 0.67 | | | | 0.74 | | | | 0.67 | |
Net investment income | | | 1.41 | (a) | | | 1.21 | | | | 1.02 | | | | 1.01 | | | | 0.99 | | | | 0.98 | |
Portfolio turnover | | | 29 | (n) | | | 61 | | | | 69 | | | | 73 | | | | 125 | | | | 104 | |
Net assets at end of period
(000 omitted) | | | $30,066 | | | | $20,829 | | | | $12,225 | | | | $739 | | | | $348 | | | | $57 | |
| Supplemental Ratios (%): | | | | | | | | | |
Ratio of expenses to average
net assets after expense
reductions excluding short
sale dividend and interest
expense (f) | | | 0.60 | (a) | | | 0.63 | | | | 0.64 | | | | 0.67 | | | | 0.74 | | | | N/A | |
See Notes to Financial Statements
23
Financial Highlights – continued
| | | | | | | | | | | | | | | | | | | | | | | | |
| | | Six months
ended
3/31/13 (unaudited) | | | Years ended 9/30 | |
| Class R5 (y) | | | 2012 | | | 2011 | | | 2010 | | | 2009 | | | 2008 | |
| | | | | | | | | | | | | | | | | |
Net asset value, beginning of
period | | | $28.75 | | | | $22.30 | | | | $22.42 | | | | $20.86 | | | | $22.06 | | | | $26.94 | |
| Income (loss) from investment operations | | | | | |
Net investment income (d) | | | $0.21 | | | | $0.31 | | | | $0.24 | | | | $0.20 | | | | $0.22 | | | | $0.23 | |
Net realized and unrealized
gain (loss) on investments
and foreign currency | | | 2.84 | | | | 6.38 | | | | (0.15 | ) | | | 1.60 | | | | (1.23 | ) | | | (4.87 | ) |
Total from investment
operations | | | $3.05 | | | | $6.69 | | | | $0.09 | | | | $1.80 | | | | $(1.01 | ) | | | $(4.64 | ) |
| Less distributions declared to shareholders | | | | | |
From net investment income | | | $(0.29 | ) | | | $(0.24 | ) | | | $(0.21 | ) | | | $(0.24 | ) | | | $(0.19 | ) | | | $(0.24 | ) |
Net asset value, end of
period (x) | | | $31.51 | | | | $28.75 | | | | $22.30 | | | | $22.42 | | | | $20.86 | | | | $22.06 | |
Total return (%) (r)(s)(x) | | | 10.69 | (n) | | | 30.25 | | | | 0.31 | | | | 8.69 | | | | (4.35 | ) | | | (17.40 | ) |
Ratios (%) (to average net assets)
and Supplemental data: | | | | | |
Expenses before expense
reductions (f) | | | 0.55 | (a) | | | 0.60 | | | | 0.75 | | | | 0.77 | | | | 0.85 | | | | 0.75 | |
Expenses after expense
reductions (f) | | | 0.55 | (a) | | | 0.60 | | | | 0.75 | | | | 0.77 | | | | 0.85 | | | | 0.75 | |
Net investment income | | | 1.47 | (a) | | | 1.13 | | | | 0.96 | | | | 0.93 | | | | 1.27 | | | | 0.91 | |
Portfolio turnover | | | 29 | (n) | | | 61 | | | | 69 | | | | 73 | | | | 125 | | | | 104 | |
Net assets at end of period
(000 omitted) | | | $976,305 | | | | $825,334 | | | | $219 | | | | $197 | | | | $125 | | | | $120 | |
| Supplemental Ratios (%): | | | | | | | | | |
Ratio of expenses to average
net assets after expense
reductions excluding short
sale dividend and interest
expense (f) | | | 0.55 | (a) | | | 0.58 | | | | 0.74 | | | | 0.77 | | | | 0.85 | | | | N/A | |
See Notes to Financial Statements
24
Financial Highlights – continued
| (d) | Per share data is based on average shares outstanding. |
| (f) | Ratios do not reflect reductions from fees paid indirectly, if applicable. |
| (r) | Certain expenses have been reduced without which performance would have been lower. |
| (s) | From time to time the fund may receive proceeds from litigation settlements, without which performance would be lower. |
| (t) | Total returns do not include any applicable sales charges. |
| (w) | Per share amount was less than $0.01. |
| (x) | The net asset values per share and total returns have been calculated on net assets which include adjustments made in accordance with U.S. generally accepted accounting principles required at period end for financial reporting purposes. |
| (y) | As further discussed in Note 5 in the Notes to Financial Statements, on May 10, 2012, sales of Class W shares (including exchanges) were suspended. On May 11, 2012, certain Class W shares were automatically converted to Class I shares. Shareholders of certain Class W shares became shareholders of Class I and received Class I shares with a total net asset value equal to their Class W shares at the time of the conversion. On May 30, 2012, remaining Class W shares, which represented MFS seed money, were redesignated as Class R5. Class R5 shares are generally available only to certain eligible retirement plans and to funds distributed by MFD. Class R5 shares do not pay a 12b-1 distribution fee or sub-accounting costs. On June 1, 2012, Class R5 shares were offered for sale to the public. For further information about the fund’s fee arrangements, please see Note 3 in the Notes to Financial Statements. |
See Notes to Financial Statements
25
NOTES TO FINANCIAL STATEMENTS
(unaudited)
(1) Business and Organization
MFS Research Fund (the fund) is a series of MFS Series Trust V (the trust). The trust is organized as a Massachusetts business trust and is registered under the Investment Company Act of 1940, as amended, as an open-end management investment company.
(2) Significant Accounting Policies
General – The preparation of financial statements in conformity with U.S. generally accepted accounting principles requires management to make estimates and assumptions that affect the reported amounts of assets and liabilities, and disclosure of contingent assets and liabilities at the date of the financial statements and the reported amounts of revenues and expenses during the reporting period. Actual results could differ from those estimates. In the preparation of these financial statements, management has evaluated subsequent events occurring after the date of the fund’s Statement of Assets and Liabilities through the date that the financial statements were issued.
In January 2013, the Financial Accounting Standards Board issued Accounting Standards Update 2013-01 (“ASU 2013-01”) entitled Balance Sheet (Topic 210) – Clarifying the Scope of Disclosures about Offsetting Assets and Liabilities which is intended to clarify the scope of Accounting Standards Update 2011-11 (“ASU 2011-11”), Balance Sheet (Topic 210) – Disclosures about Offsetting Assets and Liabilities. Consistent with the effective date for ASU 2011-11, ASU 2013-01 is effective for annual reporting periods beginning on or after January 1, 2013, and interim periods within those annual periods. ASU 2013-01 limits the scope of ASU 2011-11’s disclosure requirements on offsetting to financial assets and financial liabilities related to derivatives, repurchase and reverse repurchase agreements, and securities lending and securities borrowing transactions. Although still evaluating the potential impact of these two ASUs to the fund, management expects that the impact of the fund’s adoption will be limited to additional financial statement disclosures.
Investment Valuations – Equity securities, including restricted equity securities, are generally valued at the last sale or official closing price as provided by a third-party pricing service on the market or exchange on which they are primarily traded. Equity securities, for which there were no sales reported that day, are generally valued at the last quoted daily bid quotation as provided by a third-party pricing service on the market or exchange on which such securities are primarily traded. Equity securities held short, for which there were no sales reported for that day, are generally valued at the last quoted daily ask quotation as provided by a third-party pricing service on the market or exchange on which such securities are primarily traded. Short-term instruments with a maturity at issuance of 60 days or less generally are valued at amortized cost, which approximates market value. Exchange-traded options are generally valued at the last sale or official closing price as provided by a third-party pricing service on the exchange on which such options are primarily traded. Exchange-traded options for which there were no sales reported that day are generally valued at the last daily bid quotation as provided by a third-party pricing service on the exchange on which such options are primarily traded. Options not traded on an
26
Notes to Financial Statements (unaudited) – continued
exchange are generally valued at a broker/dealer bid quotation. Foreign currency options are generally valued at valuations provided by a third-party pricing service. Open-end investment companies are generally valued at net asset value per share. Securities and other assets generally valued on the basis of information from a third-party pricing service may also be valued at a broker/dealer bid quotation. Values obtained from third-party pricing services can utilize both transaction data and market information such as yield, quality, coupon rate, maturity, type of issue, trading characteristics, and other market data. The values of foreign securities and other assets and liabilities expressed in foreign currencies are converted to U.S. dollars using the mean of bid and asked prices for rates provided by a third-party pricing service.
The Board of Trustees has delegated primary responsibility for determining or causing to be determined the value of the fund’s investments (including any fair valuation) to the adviser pursuant to valuation policies and procedures approved by the Board. If the adviser determines that reliable market quotations are not readily available, investments are valued at fair value as determined in good faith by the adviser in accordance with such procedures under the oversight of the Board of Trustees. Under the fund’s valuation policies and procedures, market quotations are not considered to be readily available for most types of debt instruments and floating rate loans and many types of derivatives. These investments are generally valued at fair value based on information from third-party pricing services. In addition, investments may be valued at fair value if the adviser determines that an investment’s value has been materially affected by events occurring after the close of the exchange or market on which the investment is principally traded (such as foreign exchange or market) and prior to the determination of the fund’s net asset value, or after the halting of trading of a specific security where trading does not resume prior to the close of the exchange or market on which the security is principally traded. Events that occur on a frequent basis after foreign markets close (such as developments in foreign markets and significant movements in the U.S. markets) and prior to the determination of the fund’s net asset value may be deemed to have a material effect on the value of securities traded in foreign markets. Accordingly, the fund’s foreign equity securities may often be valued at fair value. The adviser generally relies on third-party pricing services or other information (such as the correlation with price movements of similar securities in the same or other markets; the type, cost and investment characteristics of the security; the business and financial condition of the issuer; and trading and other market data) to assist in determining whether to fair value and at what value to fair value an investment. The value of an investment for purposes of calculating the fund’s net asset value can differ depending on the source and method used to determine value. When fair valuation is used, the value of an investment used to determine the fund’s net asset value may differ from quoted or published prices for the same investment. There can be no assurance that the fund could obtain the fair value assigned to an investment if it were to sell the investment at the same time at which the fund determines its net asset value per share.
Various inputs are used in determining the value of the fund’s assets or liabilities. These inputs are categorized into three broad levels. In certain cases, the inputs used to measure fair value may fall into different levels of the fair value hierarchy. In such cases, an investment’s level within the fair value hierarchy is based on the lowest level of input that is significant to the fair value measurement. The fund’s assessment of the
27
Notes to Financial Statements (unaudited) – continued
significance of a particular input to the fair value measurement in its entirety requires judgment, and considers factors specific to the investment. Level 1 includes unadjusted quoted prices in active markets for identical assets or liabilities. Level 2 includes other significant observable market-based inputs (including quoted prices for similar securities, interest rates, prepayment speed, and credit risk). Level 3 includes unobservable inputs, which may include the adviser’s own assumptions in determining the fair value of investments. Other financial instruments are derivative instruments not reflected in total investments, such as written options. The following is a summary of the levels used as of March 31, 2013 in valuing the fund’s assets or liabilities:
| | | | | | | | | | | | | | | | |
| Investments at Value | | Level 1 | | | Level 2 | | | Level 3 | | | Total | |
| Equity Securities: | | | $3,311,701,251 | | | | $— | | | | $— | | | | $3,311,701,251 | |
| Mutual Funds | | | 31,356,852 | | | | — | | | | — | | | | 31,356,852 | |
| Total Investments | | | $3,343,058,103 | | | | $— | | | | $— | | | | $3,343,058,103 | |
| | | | |
| Other Financial Instruments | | | | | | | | | | | | |
| Written Options | | | $(8,370 | ) | | | $— | | | | $— | | | | $(8,370 | ) |
For further information regarding security characteristics, see the Portfolio of Investments.
Of the level 1 investments presented above, equity investments amounting to $6,084,785 would have been considered level 2 investments at the beginning of the period. The primary reason for changes in the classifications between levels 1 and 2 occurs when foreign equity securities are fair valued using other observable market-based inputs in place of the closing exchange price due to events occurring after the close of the exchange or market on which the investment is principally traded. The fund’s foreign equity securities may often be valued at fair value. The fund’s policy is to recognize transfers between the levels as of the end of the period.
Foreign Currency Translation – Purchases and sales of foreign investments, income, and expenses are converted into U.S. dollars based upon currency exchange rates prevailing on the respective dates of such transactions or on the reporting date for foreign denominated receivables and payables. Gains and losses attributable to foreign currency exchange rates on sales of securities are recorded for financial statement purposes as net realized gains and losses on investments. Gains and losses attributable to foreign exchange rate movements on receivables, payables, income and expenses are recorded for financial statement purposes as foreign currency transaction gains and losses. That portion of both realized and unrealized gains and losses on investments that results from fluctuations in foreign currency exchange rates is not separately disclosed.
Derivatives – The fund uses derivatives for different purposes, primarily to increase or decrease exposure to a particular market or segment of the market, or security, to increase or decrease interest rate or currency exposure, or as alternatives to direct investments. Derivatives are used for hedging or non-hedging purposes. While hedging can reduce or eliminate losses, it can also reduce or eliminate gains. When the fund uses derivatives as an investment to increase market exposure, or for hedging purposes, gains and losses from derivative instruments may be substantially greater than the derivative’s original cost.
28
Notes to Financial Statements (unaudited) – continued
The derivative instruments used by the fund were written options and purchased options. The fund’s period end derivatives, as presented in the Portfolio of Investments, generally are indicative of the volume of its derivative activity during the period.
The following table presents, by major type of derivative contract, the fair value, on a gross basis, of the asset and liability components of derivatives held by the fund at March 31, 2013 as reported in the Statement of Assets and Liabilities:
| | | | | | | | | | |
| | | | | Fair Value | |
| Risk | | Derivative Contracts | | Asset Derivatives | | | Liability Derivatives | |
| Equity | | Written Equity Options | | | $— | | | | $(8,370) | |
The following table presents, by major type of derivative contract, the realized gain (loss) on derivatives held by the fund for the six months ended March 31, 2013 as reported in the Statement of Operations:
| | | | | | | | |
| Risk | | Investments
(Purchased
Options) | | | Written
Options | |
| Equity | | | $(186,815 | ) | | | $49,232 | |
The following table presents, by major type of derivative contract, the change in unrealized appreciation (depreciation) on derivatives held by the fund for the six months ended March 31, 2013 as reported in the Statement of Operations:
| | | | |
| Risk | | Written
Options | |
| Equity | | | $18,244 | |
Derivative counterparty credit risk is managed through formal evaluation of the creditworthiness of all potential counterparties. On certain over-the-counter derivatives, the fund attempts to reduce its exposure to counterparty credit risk whenever possible by entering into an International Swaps and Derivatives Association (ISDA) Master Agreement on a bilateral basis with each of the counterparties with whom it undertakes a significant volume of transactions. The ISDA Master Agreement gives each party to the agreement the right to terminate all transactions traded under such agreement if there is a certain deterioration in the credit quality of the other party. The ISDA Master Agreement gives the fund the right, upon an event of default by the applicable counterparty or a termination of the agreement, to close out all transactions traded under such agreement and to net amounts owed under each transaction to one net amount payable by one party to the other. This right to close out and net payments across all transactions traded under the ISDA Master Agreement could result in a reduction of the fund’s credit risk to such counterparty equal to any amounts payable by the fund under the applicable transactions, if any. However, absent an event of default by the counterparty or a termination of the agreement, the ISDA Master Agreement does not result in an offset of reported amounts of assets and liabilities in the Statement of Assets and Liabilities across transactions between the fund and the applicable counterparty.
Collateral requirements differ by type of derivative. Collateral or margin requirements are set by the broker or exchange clearing house for exchange traded derivatives (i.e., futures contracts and exchange-traded options) while collateral terms are contract
29
Notes to Financial Statements (unaudited) – continued
specific for over-the-counter traded derivatives (i.e., forward foreign currency exchange contracts, swap agreements and over-the-counter options). For derivatives traded under an ISDA Master Agreement, the collateral requirements are netted across all transactions traded under such agreement and one amount is posted from one party to the other to collateralize such obligations. Cash collateral that has been segregated to cover obligations of the fund under derivative contracts, if any, will be reported separately in the Statement of Assets and Liabilities as “Deposits with brokers”. Securities collateral pledged for the same purpose, if any, is noted in the Portfolio of Investments.
Written Options – In exchange for a premium, the fund wrote call options on securities that it anticipated the price would decline. At the time the option was written, the fund believed the premium received exceeded the potential loss that could result from adverse price changes in the options’ underlying securities. In a written option, the fund as the option writer grants the buyer the right to purchase from, or sell to, the fund a specified number of shares or units of a particular security, currency or index at a specified price within a specified period of time.
The premium received is initially recorded as a liability in the Statement of Assets and Liabilities. The option is subsequently marked-to-market daily with the difference between the premium received and the market value of the written option being recorded as unrealized appreciation or depreciation. When a written option expires, the fund realizes a gain equal to the amount of the premium received. The difference between the premium received and the amount paid on effecting a closing transaction is considered a realized gain or loss. When a written call option is exercised, the premium received is offset against the proceeds to determine the realized gain or loss.
At the initiation of the written option contract, for exchange traded options, the fund is required to deposit securities or cash as collateral with the custodian for the benefit of the broker. For over-the-counter options, the fund may post collateral subject to the terms of an ISDA Master Agreement as generally described above if the market value of the options contract moves against it. The fund, as writer of an option, may have no control over whether the underlying securities may be sold (call) or purchased (put) and, as a result, bears the market risk of an unfavorable change in the price of the securities underlying the written option. Losses from writing options can exceed the premium received and can exceed the potential loss from an ordinary buy and sell transaction. Although the fund’s market risk may be significant, the maximum counterparty credit risk to the fund is equal to the market value of any collateral posted to the broker. For over-the-counter options, this risk is mitigated in cases where there is an ISDA Master Agreement between the fund and the counterparty providing for netting as described above.
30
Notes to Financial Statements (unaudited) – continued
The following table represents the written option activity in the fund during the six months ended March 31, 2013:
| | | | | | | | |
| | | Number of
Contracts | | | Premiums
Received | |
| Outstanding, beginning of period | | | — | | | | $— | |
| Options written | | | 2,115 | | | | 75,846 | |
| Options expired | | | (1,185 | ) | | | (49,232 | ) |
| Outstanding, end of period | | | 930 | | | | $26,614 | |
Purchased Options – The fund purchased call options for a premium. Purchased call options entitle the holder to buy a specified number of shares or units of a particular security, currency or index at a specified price at a specified date or within a specified period of time. Purchasing call options may hedge against an anticipated increase in the dollar cost of securities or currency to be acquired or increase the fund’s exposure to an underlying instrument.
The premium paid is initially recorded as an investment in the Statement of Assets and Liabilities. That investment is subsequently marked-to-market daily with the difference between the premium paid and the market value of the purchased option being recorded as unrealized appreciation or depreciation. Premiums paid for purchased call options which have expired are treated as realized losses on investments in the Statement of Operations. Upon the exercise or closing of a purchased call option, the premium paid is added to the cost of the security or financial instrument purchased.
Whether or not the option is exercised, the fund’s maximum risk of loss from purchasing an option is the amount of premium paid. All option contracts involve credit risk if the counterparty to the option contract fails to perform. For over-the-counter options, this risk is mitigated in cases where there is an ISDA Master Agreement between the fund and the counterparty providing for netting as described above and for posting of collateral by the counterparty to the fund to cover the fund’s exposure to the counterparty under such ISDA Master Agreement.
Short Sales – The fund entered into short sales whereby it sells a security it does not own in anticipation of a decline in the value of that security. The fund will realize a gain if the security price decreases and a loss if the security price increases between the date of the short sale and the date on which the fund replaces the borrowed security. Losses from short sales can exceed the proceeds of the security sold; and they can also exceed the potential loss from an ordinary buy and sell transaction. The amount of any premium, dividends, or interest the fund may be required to pay in connection with a short sale will be recognized as a fund expense. During the six months ended March 31, 2013, this expense amounted to $6,421. The fund segregates cash or marketable securities in an amount that, when combined with the amount of proceeds from the short sale deposited with the broker, at least equals the current market value of the security sold short. At March 31, 2013, the fund had no short sales outstanding.
Security Loans – JPMorgan Chase and Co. (“Chase”), as lending agent, loans the securities of the fund to certain qualified institutions (the “Borrowers”) approved by the fund. The loans are collateralized by cash and/or U.S. Treasury and federal agency obligations in an amount typically at least equal to the market value of the securities
31
Notes to Financial Statements (unaudited) – continued
loaned. The market value of the loaned securities is determined at the close of business of the fund and any additional required collateral is delivered to the fund on the next business day. Chase provides the fund with indemnification against Borrower default. The fund bears the risk of loss with respect to the investment of cash collateral. On loans collateralized by cash, the cash collateral is invested in short-term securities. A portion of the income generated upon investment of the collateral is remitted to the Borrowers, and the remainder is allocated between the fund and the lending agent. On loans collateralized by U.S. Treasury and/or federal agency obligations, a fee is received from the Borrower, and is allocated between the fund and the lending agent. Income from securities lending is included in “Interest” income in the Statement of Operations. The dividend and interest income earned on the securities loaned is accounted for in the same manner as other dividend and interest income. At March 31, 2013, there were no securities on loan or collateral outstanding.
Indemnifications – Under the fund’s organizational documents, its officers and Trustees may be indemnified against certain liabilities and expenses arising out of the performance of their duties to the fund. Additionally, in the normal course of business, the fund enters into agreements with service providers that may contain indemnification clauses. The fund’s maximum exposure under these agreements is unknown as this would involve future claims that may be made against the fund that have not yet occurred.
Investment Transactions and Income – Investment transactions are recorded on the trade date. Interest income is recorded on the accrual basis. Dividends received in cash are recorded on the ex-dividend date. Certain dividends from foreign securities will be recorded when the fund is informed of the dividend if such information is obtained subsequent to the ex-dividend date. Dividend and interest payments received in additional securities are recorded on the ex-dividend or ex-interest date in an amount equal to the value of the security on such date.
The fund may receive proceeds from litigation settlements. Any proceeds received from litigation involving portfolio holdings are reflected in the Statement of Operations in realized gain/loss if the security has been disposed of by the fund or in unrealized gain/loss if the security is still held by the fund. Any other proceeds from litigation not related to portfolio holdings are reflected as other income in the Statement of Operations.
Fees Paid Indirectly – The fund’s custody fee may be reduced according to an arrangement that measures the value of cash deposited with the custodian by the fund. This amount, for the six months ended March 31, 2013, is shown as a reduction of total expenses in the Statement of Operations.
Tax Matters and Distributions – The fund intends to qualify as a regulated investment company, as defined under Subchapter M of the Internal Revenue Code, and to distribute all of its taxable income, including realized capital gains. As a result, no provision for federal income tax is required. The fund’s federal tax returns, when filed, will remain subject to examination by the Internal Revenue Service for a three year period. Foreign taxes have been accrued by the fund in the accompanying financial statements.
32
Notes to Financial Statements (unaudited) – continued
Distributions to shareholders are recorded on the ex-dividend date. Income and capital gain distributions are determined in accordance with income tax regulations, which may differ from U.S. generally accepted accounting principles. Certain capital accounts in the financial statements are periodically adjusted for permanent differences in order to reflect their tax character. These adjustments have no impact on net assets or net asset value per share. Temporary differences which arise from recognizing certain items of income, expense, gain or loss in different periods for financial statement and tax purposes will reverse at some time in the future. Distributions in excess of net investment income or net realized gains are temporary overdistributions for financial statement purposes resulting from differences in the recognition or classification of income or distributions for financial statement and tax purposes.
Book/tax differences primarily relate wash sale loss deferrals.
The tax character of distributions made during the current period will be determined at fiscal year end. The tax character of distributions declared to shareholders for the last fiscal year is as follows:
| | | | |
| | | 9/30/12 | |
Ordinary income (including any
short-term capital gains) | | | $18,435,299 | |
The federal tax cost and the tax basis components of distributable earnings were as follows:
| | | | |
| As of 3/31/13 | | | |
| Cost of investments | | | $2,799,183,534 | |
| Gross appreciation | | | 574,945,296 | |
| Gross depreciation | | | (31,070,727 | ) |
| Net unrealized appreciation (depreciation) | | | $543,874,569 | |
| |
| As of 9/30/12 | | | |
| Undistributed ordinary income | | | 24,128,679 | |
| Capital loss carryforwards | | | (208,867,893 | ) |
| Other temporary differences | | | (1,463,144 | ) |
| Net unrealized appreciation (depreciation) | | | 374,099,700 | |
The aggregate cost above includes prior fiscal year end tax adjustments, if applicable.
Under the Regulated Investment Company Modernization Act of 2010 (the “Act”), net capital losses recognized for fund fiscal years beginning after September 30, 2011 may be carried forward indefinitely, and their character is retained as short-term and/or long-term losses (“post-enactment losses”). Previously, net capital losses were carried forward for eight years and treated as short-term losses (“pre-enactment losses”). As a transition rule, the Act requires that all post-enactment net capital losses be used before pre-enactment net capital losses.
As of September 30, 2012, the fund had capital loss carryforwards available to offset future realized gains. Such losses are characterized as follows:
33
Notes to Financial Statements (unaudited) – continued
Multiple Classes of Shares of Beneficial Interest – The fund offers multiple classes of shares, which differ in their respective distribution and service fees. The fund’s income, realized and unrealized gain (loss), and common expenses are allocated to shareholders based on the daily net assets of each class. Dividends are declared separately for each class. Differences in per share dividend rates are generally due to differences in separate class expenses. Class B shares will convert to Class A shares approximately eight years after purchase. The fund’s distributions declared to shareholders as reported in the Statement of Changes in Net Assets are presented by class as follows:
| | | | | | | | |
| | | From net investment
income | |
| | | Six months
ended
3/31/13 | | | Year
ended
9/30/12 | |
| Class A | | | $12,248,800 | | | | $10,793,641 | |
| Class C | | | 71,423 | | | | 73,115 | |
| Class I | | | 2,556,786 | | | | 7,226,809 | |
| Class R1 | | | 1,148 | | | | 1,976 | |
| Class R2 | | | 117,394 | | | | 87,582 | |
| Class R3 | | | 332,823 | | | | 80,256 | |
| Class R4 | | | 211,113 | | | | 169,471 | |
| Class R5 | | | 8,590,948 | | | | 2,449 | |
| Total | | | $24,130,435 | | | | $18,435,299 | |
On May 30, 2012, Class W shares were redesignated Class R5. See Note 5 for additional information.
(3) Transactions with Affiliates
Investment Adviser – The fund has an investment advisory agreement with MFS to provide overall investment management and related administrative services and facilities to the fund. The management fee is computed daily and paid monthly at an annual rate of 0.43% of the fund’s average daily net assets.
Distributor – MFS Fund Distributors, Inc. (MFD), a wholly-owned subsidiary of MFS, as distributor, received $87,633 for the six months ended March 31, 2013, as its portion of the initial sales charge on sales of Class A shares of the fund.
The Board of Trustees has adopted a distribution plan for certain class shares pursuant to Rule 12b-1 of the Investment Company Act of 1940.
The fund’s distribution plan provides that the fund will pay MFD for services provided by MFD and financial intermediaries in connection with the distribution and servicing of certain share classes. One component of the plan is a distribution fee paid to MFD and another component of the plan is a service fee paid to MFD. MFD may subsequently pay all, or a portion, of the distribution and/or service fees to financial intermediaries.
34
Notes to Financial Statements (unaudited) – continued
Distribution Plan Fee Table:
| | | | | | | | | | | | | | | | | | | | |
| | | Distribution
Fee Rate (d) | | | Service Fee Rate (d) | | | Total
Distribution
Plan (d) | | | Annual
Effective
Rate (e) | | | Distribution and Service Fee | |
| Class A | | | — | | | | 0.25% | | | | 0.25% | | | | 0.25% | | | | $2,034,751 | |
| Class B | | | 0.75% | | | | 0.25% | | | | 1.00% | | | | 1.00% | | | | 159,553 | |
| Class C | | | 0.75% | | | | 0.25% | | | | 1.00% | | | | 1.00% | | | | 428,873 | |
| Class R1 | | | 0.75% | | | | 0.25% | | | | 1.00% | | | | 1.00% | | | | 13,492 | |
| Class R2 | | | 0.25% | | | | 0.25% | | | | 0.50% | | | | 0.50% | | | | 49,804 | |
| Class R3 | | | — | | | | 0.25% | | | | 0.25% | | | | 0.25% | | | | 49,553 | |
| Total Distribution and Service Fees | | | | $2,736,026 | |
| (d) | In accordance with the distribution plan for certain classes, the fund pays distribution and/or service fees equal to these annual percentage rates of each class’s average daily net assets. The distribution and service fee rates disclosed by class represent the current rates in effect at the end of the reporting period. |
| (e) | The annual effective rates represent actual fees incurred under the distribution plan for the six months ended March 31, 2013 based on each class’s average daily net assets. |
Certain Class A shares are subject to a contingent deferred sales charge (CDSC) in the event of a shareholder redemption within 18 months of purchase for shares purchased on or after August 1, 2012, and within 24 months of purchase for shares purchased prior to August 1, 2012. Class C shares are subject to a CDSC in the event of a shareholder redemption within 12 months of purchase. Class B shares are subject to a CDSC in the event of a shareholder redemption within six years of purchase. All contingent deferred sales charges are paid to MFD and during the six months ended March 31, 2013, were as follows:
| | | | |
| | | Amount | |
| Class A | | | $238 | |
| Class B | | | 20,383 | |
| Class C | | | 1,572 | |
Shareholder Servicing Agent – MFS Service Center, Inc. (MFSC), a wholly-owned subsidiary of MFS, receives a fee from the fund for its services as shareholder servicing agent calculated as a percentage of the average daily net assets of the fund as determined periodically under the supervision of the fund’s Board of Trustees. For the six months ended March 31, 2013, the fee was $401,213, which equated to 0.0268% annually of the fund’s average daily net assets. MFSC also receives payment from the fund for out-of-pocket expenses, sub-accounting and other shareholder servicing costs which may be paid to affiliated and unaffiliated service providers. Class R5 shares do not incur sub-accounting fees. For the six months ended March 31, 2013, these out-of-pocket expenses, sub-accounting and other shareholder servicing costs amounted to $900,653.
Under a Special Servicing Agreement among MFS, each MFS fund which invests in other MFS funds (“MFS fund-of-funds”) and certain underlying funds in which a MFS fund-of-funds invests (“underlying funds”), each underlying fund may pay a portion of each MFS fund-of-fund’s transfer agent-related expenses, including sub-accounting fees payable to financial intermediaries, to the extent such payments do not exceed the benefits realized or expected to be realized by the underlying fund from the investment
35
Notes to Financial Statements (unaudited) – continued
in the underlying fund by the MFS fund-of-fund. For the six months ended March 31, 2013, these costs for the fund amounted to $463,891 and are reflected in the “Shareholder servicing costs” in the Statement of Operations.
Administrator – MFS provides certain financial, legal, shareholder communications, compliance, and other administrative services to the fund. Under an administrative services agreement, the fund partially reimburses MFS the costs incurred to provide these services. The fund is charged an annual fixed amount of $17,500 plus a fee based on average daily net assets. The administrative services fee incurred for the six months ended March 31, 2013 was equivalent to an annual effective rate of 0.0131% of the fund’s average daily net assets.
Trustees’ and Officers’ Compensation – The fund pays compensation to independent Trustees in the form of a retainer, attendance fees, and additional compensation to Board and Committee chairpersons. The fund does not pay compensation directly to Trustees or officers of the fund who are also officers of the investment adviser, all of whom receive remuneration for their services to the fund from MFS. Certain officers and Trustees of the fund are officers or directors of MFS, MFD, and MFSC.
Prior to December 31, 2001, the fund had an unfunded defined benefit plan (“DB plan”) for independent Trustees. As of December 31, 2001, the Board took action to terminate the DB plan with respect to then-current and any future independent Trustees, such that the DB plan covers only certain of those former independent Trustees who retired on or before December 31, 2001. Effective January 1, 2002, accrued benefits under the DB plan for then-current independent Trustees who continued were credited to an unfunded retirement deferral plan (the “Retirement Deferral plan”), which was established for and exists solely with respect to these credited amounts, and is not available for other deferrals by these or other independent Trustees. Although the Retirement Deferral plan is unfunded, amounts deferred under the plan are periodically adjusted for investment experience as if they had been invested in shares of the fund. The DB plan resulted in a pension expense of $1,445 and the Retirement Deferral plan resulted in an expense of $7,631. Both amounts are included in independent Trustees’ compensation for the six months ended March 31, 2013. The liability for deferred retirement benefits payable to certain independent Trustees under both plans amounted to $103,893 at March 31, 2013, and is included in “Payable for independent Trustees’ compensation” in the Statement of Assets and Liabilities.
Deferred Trustee Compensation – Under a Deferred Compensation Plan (the “Plan”), independent Trustees previously were allowed to elect to defer receipt of all or a portion of their annual compensation. Effective January 1, 2005, the Board elected to no longer allow Trustees to defer receipt of future compensation under the Plan. Amounts deferred under the Plan are invested in shares of certain MFS Funds selected by the independent Trustees as notional investments. Deferred amounts represent an unsecured obligation of the fund until distributed in accordance with the Plan. Included in “Other assets” and “Payable for independent Trustees’ compensation” in the Statement of Assets and Liabilities is $46,713 of deferred Trustees’ compensation. There is no current year expense associated with the Plan.
36
Notes to Financial Statements (unaudited) – continued
Other – This fund and certain other funds managed by MFS (the funds) have entered into services agreements (the Agreements) which provide for payment of fees by the funds to Tarantino LLC and Griffin Compliance LLC in return for the provision of services of an Independent Chief Compliance Officer (ICCO) and Assistant ICCO, respectively, for the funds. The ICCO and Assistant ICCO are officers of the funds and the sole members of Tarantino LLC and Griffin Compliance LLC, respectively. The funds can terminate the Agreements with Tarantino LLC and Griffin Compliance LLC at any time under the terms of the Agreements. For the six months ended March 31, 2013, the aggregate fees paid by the fund to Tarantino LLC and Griffin Compliance LLC were $10,600 and are included in “Miscellaneous” expense in the Statement of Operations. MFS has agreed to reimburse the fund for a portion of the payments made by the fund in the amount of $3,024, which is shown as a reduction of total expenses in the Statement of Operations. Additionally, MFS has agreed to bear all expenses associated with office space, other administrative support, and supplies provided to the ICCO and Assistant ICCO.
The fund invests in the MFS Institutional Money Market Portfolio which is managed by MFS and seeks current income consistent with preservation of capital and liquidity. Income earned on this investment is included in “Dividends from underlying affiliated funds” in the Statement of Operations. This money market fund does not pay a management fee to MFS.
(4) Portfolio Securities
Purchases and sales of investments, other than purchased option transactions and short-term obligations, aggregated $1,099,912,256 and $851,642,513 respectively.
(5) Shares of Beneficial Interest
The fund’s Declaration of Trust permits the Trustees to issue an unlimited number of full and fractional shares of beneficial interest. Transactions in fund shares were as follows:
| | | | | | | | | | | | | | | | |
| | | Six months ended
3/31/13 | | | Year ended
9/30/12 | |
| | | Shares | | | Amount | | | Shares | | | Amount | |
| Shares sold | | | | | | | | | | | | | | | | |
Class A | | | 6,486,872 | | | | $188,870,045 | | | | 7,556,456 | | | | $202,867,617 | |
Class B | | | 66,937 | | | | 1,836,716 | | | | 140,589 | | | | 3,428,343 | |
Class C | | | 232,634 | | | | 6,451,788 | | | | 172,364 | | | | 4,284,738 | |
Class I | | | 4,276,186 | | | | 130,784,837 | | | | 10,001,045 | | | | 278,834,685 | |
Class R1 | | | 20,604 | | | | 581,743 | | | | 12,128 | | | | 294,968 | |
Class R2 | | | 222,104 | | | | 6,347,383 | | | | 248,424 | | | | 6,443,769 | |
Class R3 | | | 461,798 | | | | 13,645,231 | | | | 934,660 | | | | 25,476,945 | |
Class R4 | | | 309,612 | | | | 9,305,852 | | | | 301,986 | | | | 7,701,093 | |
Class R5 | | | 2,511,745 | | | | 73,254,341 | | | | 29,524,424 | | | | 772,578,096 | |
| | | 14,588,492 | | | | $431,077,936 | | | | 48,892,076 | | | | $1,301,910,254 | |
37
Notes to Financial Statements (unaudited) – continued
| | | | | | | | | | | | | | | | |
| | | Six months ended
3/31/13 | | | Year ended
9/30/12 | |
| | | Shares | | | Amount | | | Shares | | | Amount | |
Shares issued to shareholders in
reinvestment of distributions | | | | | | | | | | | | | | | | |
Class A | | | 380,240 | | | | $10,969,682 | | | | 401,574 | | | | $9,569,512 | |
Class C | | | 2,277 | | | | 61,264 | | | | 2,613 | | | | 58,053 | |
Class I | | | 86,162 | | | | 2,531,434 | | | | 297,079 | | | | 7,204,156 | |
Class R1 | | | 43 | | | | 1,148 | | | | 90 | | | | 1,976 | |
Class R2 | | | 3,698 | | | | 104,278 | | | | 3,386 | | | | 78,975 | |
Class R3 | | | 11,574 | | | | 332,296 | | | | 3,362 | | | | 79,818 | |
Class R4 | | | 7,325 | | | | 211,112 | | | | 7,123 | | | | 169,471 | |
Class R5 | | | 298,193 | | | | 8,590,948 | | | | 102 | | | | 2,420 | |
| | | 789,512 | | | | $22,802,162 | | | | 715,329 | | | | $17,164,381 | |
| | | | |
| Shares reacquired | | | | | | | | | | | | | | | | |
Class A | | | (4,562,017 | ) | | | $(133,638,105 | ) | | | (8,328,026 | ) | | | $(218,561,415 | ) |
Class B | | | (207,522 | ) | | | (5,695,826 | ) | | | (575,616 | ) | | | (14,052,701 | ) |
Class C | | | (264,832 | ) | | | (7,181,080 | ) | | | (477,497 | ) | | | (11,654,619 | ) |
Class I | | | (790,378 | ) | | | (23,967,183 | ) | | | (28,960,622 | ) | | | (771,340,034 | ) |
Class R1 | | | (8,750 | ) | | | (233,071 | ) | | | (29,258 | ) | | | (705,171 | ) |
Class R2 | | | (94,285 | ) | | | (2,682,014 | ) | | | (162,415 | ) | | | (4,191,771 | ) |
Class R3 | | | (179,091 | ) | | | (5,241,606 | ) | | | (74,806 | ) | | | (1,991,387 | ) |
Class R4 | | | (87,301 | ) | | | (2,609,156 | ) | | | (132,387 | ) | | | (3,590,636 | ) |
Class R5 | | | (536,298 | ) | | | (15,844,788 | ) | | | (824,554 | ) | | | (21,945,100 | ) |
| | | (6,730,474 | ) | | | $(197,092,829 | ) | | | (39,565,181 | ) | | | $(1,048,032,834 | ) |
| | | | |
| Net change | | | | | | | | | | | | | | | | |
Class A | | | 2,305,095 | | | | $66,201,622 | | | | (369,996 | ) | | | $(6,124,286 | ) |
Class B | | | (140,585 | ) | | | (3,859,110 | ) | | | (435,027 | ) | | | (10,624,358 | ) |
Class C | | | (29,921 | ) | | | (668,028 | ) | | | (302,520 | ) | | | (7,311,828 | ) |
Class I | | | 3,571,970 | | | | 109,349,088 | | | | (18,662,498 | ) | | | (485,301,193 | ) |
Class R1 | | | 11,897 | | | | 349,820 | | | | (17,040 | ) | | | (408,227 | ) |
Class R2 | | | 131,517 | | | | 3,769,647 | | | | 89,395 | | | | 2,330,973 | |
Class R3 | | | 294,281 | | | | 8,735,921 | | | | 863,216 | | | | 23,565,376 | |
Class R4 | | | 229,636 | | | | 6,907,808 | | | | 176,722 | | | | 4,279,928 | |
Class R5 | | | 2,273,640 | | | | 66,000,501 | | | | 28,699,972 | | | | 750,635,416 | |
| | | 8,647,530 | | | | $256,787,269 | | | | 10,042,224 | | | | $271,041,801 | |
The fund is one of several mutual funds in which the MFS funds-of-funds may invest. The MFS funds-of-funds do not invest in the underlying MFS funds for the purpose of exercising management or control. At the end of the period, the MFS Moderate Allocation Fund, the MFS Growth Allocation Fund, the MFS Conservative Allocation Fund, and the MFS Aggressive Growth Allocation Fund were the owners of record of approximately 11%, 9%, 4% and 3%, respectively, of the value of outstanding voting shares of the fund. In addition, the MFS Lifetime 2010 Fund, the MFS Lifetime 2015 Fund, the MFS Lifetime 2020 Fund, the MFS Lifetime 2025 Fund, the MFS Lifetime 2030 Fund, the MFS Lifetime 2035 Fund, the MFS Lifetime 2040 Fund, the MFS
38
Notes to Financial Statements (unaudited) – continued
Lifetime 2045 Fund, the MFS Lifetime 2050 Fund, the MFS Lifetime 2055 Fund, and the MFS Lifetime Retirement Income Fund were each the owners of record of less than 1% of the value of outstanding voting shares of the fund.
Redesignation of Class W to Class R5 – On May 10, 2012, sales of Class W shares (including exchanges) were suspended. On May 11, 2012, certain Class W shares were automatically converted to Class I shares. Shareholders of certain Class W shares became shareholders of Class I and received Class I shares with a total net asset value equal to theirClass W shares at the time of the conversion. On May 30, 2012, remaining Class W shares, which represented MFS seed money, were redesignated as Class R5. Class R5 shares are generally available only to certain eligible retirement plans and to funds distributed by MFD. Class R5 shares do not pay a 12b-1 distribution fee or sub-accounting costs. On June 1, 2012, Class R5 shares were offered for sale to the public.
(6) Line of Credit
The fund and certain other funds managed by MFS participate in a $1.1 billion unsecured committed line of credit, subject to a $1 billion sublimit, provided by a syndication of banks under a credit agreement. Borrowings may be made for temporary financing needs. Interest is charged to each fund, based on its borrowings, generally at a rate equal to the higher of the Federal Reserve funds rate or one month LIBOR plus an agreed upon spread. A commitment fee, based on the average daily, unused portion of the committed line of credit, is allocated among the participating funds at the end of each calendar quarter. In addition, the fund and other funds managed by MFS have established unsecured uncommitted borrowing arrangements with certain banks for temporary financing needs. Interest is charged to each fund, based on its borrowings, at a rate equal to the Federal Reserve funds rate plus an agreed upon spread. For the six months ended March 31, 2013, the fund’s commitment fee and interest expense were $8,175 and $0, respectively, and are included in “Miscellaneous” expense in the Statement of Operations.
(7) Transactions in Underlying Affiliated Funds-Affiliated Issuers
An affiliated issuer may be considered one in which the fund owns 5% or more of the outstanding voting securities, or a company which is under common control. For the purposes of this report, the fund assumes the following to be an affiliated issuer:
| | | | | | | | | | | | | | | | |
| Underlying Affiliated Fund | | Beginning
Shares/Par
Amount | | | Acquisitions Shares/Par Amount | | | Dispositions Shares/Par Amount | | | Ending Shares/Par Amount | |
MFS Institutional Money
Market Portfolio | | | 53,816,932 | | | | 265,655,686 | | | | (288,115,766 | ) | | | 31,356,852 | |
| | | | |
| Underlying Affiliated Fund | | Realized Gain (Loss) | | | Capital Gain Distributions | | | Dividend
Income | | | Ending Value | |
MFS Institutional Money
Market Portfolio | | | $— | | | | $— | | | | $30,904 | | | | $31,356,852 | |
39
BOARD REVIEW OF INVESTMENT ADVISORY AGREEMENT
A discussion regarding the Board’s most recent review and renewal of the fund’s Investment Advisory Agreement with MFS is available by clicking on the fund’s name under “Mutual Funds” in the “Products” section of the MFS Web site (mfs.com).
PROXY VOTING POLICIES AND INFORMATION
A general description of the MFS funds’ proxy voting policies and procedures is available without charge, upon request, by calling 1-800-225-2606, by visiting the Proxy Voting section of mfs.com or by visiting the SEC’s Web site at http://www.sec.gov.
Information regarding how the fund voted proxies relating to portfolio securities during the most recent twelve-month period ended June 30 is available without charge by visiting the Proxy Voting section of mfs.com or by visiting the SEC’s Web site at http://www.sec.gov.
QUARTERLY PORTFOLIO DISCLOSURE
The fund will file a complete schedule of portfolio holdings with the Securities and Exchange Commission (the Commission) for the first and third quarters of each fiscal year on Form N-Q. A shareholder can obtain the quarterly portfolio holdings report at mfs.com. The fund’s Form N-Q is also available on the EDGAR database on the Commission’s Internet Web site at http://www.sec.gov, and may be reviewed and copied at the:
Public Reference Room
Securities and Exchange Commission
100 F Street, NE, Room 1580
Washington, D.C. 20549
Information on the operation of the Public Reference Room may be obtained by calling the Commission at 1-800-SEC-0330. Copies of the fund’s Form N-Q also may be obtained, upon payment of a duplicating fee, by electronic request at the following e-mail address: publicinfo@sec.gov, or by writing the Public Reference Section at the above address.
FURTHER INFORMATION
From time to time, MFS may post important information about the fund or the MFS funds on the MFS web site (mfs.com). This information is available by visiting the “News & Commentary” section of mfs.com or by clicking on the fund’s name under “Mutual Funds” in the “Products” section of mfs.com.
PROVISION OF FINANCIAL REPORTS AND SUMMARY PROSPECTUSES
The fund produces financial reports every six months and updates its summary prospectus and prospectus annually. To avoid sending duplicate copies of materials to households, only one copy of the fund’s annual and semiannual report and summary prospectus may be mailed to shareholders having the same last name and residential address on the fund’s records. However, any shareholder may contact MFSC (please see back cover for address and telephone number) to request that copies of these reports and summary prospectuses be sent personally to that shareholder.
40
Save paper with eDelivery.

| MFS® will send you prospectuses, |
reports, and proxies directly via e-mail so you will get information faster with less mailbox clutter.
To sign up:
1. Go to mfs.com.
2. Log in via MFS® Access.
3. Select eDelivery.
If you own your MFS fund shares through a financial institution or a retirement plan, MFS® TALK, MFS® Access, or eDelivery may not be available to you.
CONTACT
WEB SITE
mfs.com
MFS TALK
1-800-637-8255
24 hours a day
ACCOUNT SERVICE AND LITERATURE
Shareholders
1-800-225-2606
Financial advisors
1-800-343-2829
Retirement plan services
1-800-637-1255
MAILING ADDRESS
MFS Service Center, Inc.
P.O. Box 55824
Boston, MA 02205-5824
OVERNIGHT MAIL
MFS Service Center, Inc.
c/o Boston Financial Data Services
30 Dan Road
Canton, MA 02021-2809
SEMIANNUAL REPORT
March 31, 2013

MFS® TOTAL RETURN FUND

MTR-SEM
MFS® TOTAL RETURN FUND
CONTENTS
The report is prepared for the general information of shareholders.
It is authorized for distribution to prospective investors only when preceded or accompanied by a current prospectus.
NOT FDIC INSURED Ÿ MAY LOSE VALUE Ÿ NO BANK GUARANTEE

LETTER FROM THE CHAIRMAN AND CEO
Dear Shareholders:
The first quarter of 2013 delivered strong returns to global equity investors, particularly those holding U.S. and Japanese stocks, while bond returns were flat overall. The U.S.
economy picked up steam, driven by the improving housing and job markets. U.S. economic data were broadly positive, with growth in manufacturing activity, durable goods orders and auto sales. However, consumer confidence wavered somewhat, a likely reflection of the impact of the payroll tax increase and uncertainty over the U.S. government’s across-the-board sequestration cuts.
The eurozone’s unemployment picture and overall economic activity steadily worsened. Cyprus, the latest debt-crisis hot spot, faces unique challenges, with its oversized banking sector’s unhealthy exposure to Greek debt. In addition, the hefty cost to
large bank depositors could weaken confidence in the region’s financial stability. China’s economic activity rebounded after a mild slowdown in 2012. The Japanese government’s aggressive effort to stimulate its long-dormant economy by devaluing the yen lifted stock prices, exports and profits for struggling Japanese firms. The outlook for further economic growth and an extension of the U.S. bull market is highly dependent on how much damage is caused by the U.S. budget cuts, global growth prospects and the ebb and flow of global tail risk events. Most factors point to a continued slow and uneven global economic recovery.
As always, managing risk in the face of uncertainty remains a top priority for investors. At MFS®, our uniquely collaborative investment process employs global research and active risk management. Our global team of investment professionals shares ideas and evaluates opportunities across continents, investment disciplines and asset classes — all with a goal of building better insights, and ultimately better results, for our clients.
We remain mindful of the many economic challenges investors face today, and believe it is more important than ever to maintain a long-term view and employ time-tested principles, such as asset allocation and diversification. We also remain confident that our unique approach can serve investors well as they work with their financial advisors to identify and pursue the most suitable opportunities.
Respectfully,

Robert J. Manning
Chairman and Chief Executive Officer
MFS Investment Management®
May 15, 2013
The opinions expressed in this letter are subject to change, may not be relied upon for investment advice, and no forecasts can be guaranteed.
1
PORTFOLIO COMPOSITION
Portfolio structure (i)

| | | | |
| Top ten holdings (i) | | | | |
| U.S. Treasury Notes, 0.875%, 2016 | | | 3.7% | |
| U.S. Treasury Notes, 2.125%, 2015 | | | 2.4% | |
| U.S. Treasury Bonds, 4.5%, 2039 | | | 2.2% | |
| JPMorgan Chase & Co. | | | 2.2% | |
| Philip Morris International, Inc. | | | 2.1% | |
| Johnson & Johnson | | | 1.8% | |
| Pfizer, Inc. | | | 1.8% | |
| Exxon Mobil Corp. | | | 1.5% | |
| Fannie Mae, 5.5%, 30 Years | | | 1.4% | |
| Lockheed Martin Corp. | | | 1.3% | |
|
Composition including fixed income credit
quality (a)(i) | |
| AAA | | | 1.1% | |
| AA | | | 1.2% | |
| A | | | 4.3% | |
| BBB | | | 5.6% | |
| BB | | | 0.3% | |
| CCC | | | 0.1% | |
| CC | | | 0.1% | |
| C | | | 0.1% | |
| U.S. Government | | | 13.3% | |
| Federal Agencies | | | 11.9% | |
| Not Rated | | | 0.1% | |
| Non-Fixed Income | | | 60.8% | |
| Cash & Other | | | 1.1% | |
| | | | |
| Equity sectors | | | | |
| Financial Services | | | 13.4% | |
| Health Care | | | 7.6% | |
| Consumer Staples | | | 7.4% | |
| Industrial Goods & Services | | | 7.1% | |
| Energy | | | 5.6% | |
| Leisure | | | 4.4% | |
| Utilities & Communications | | | 3.4% | |
| Retailing | | | 2.8% | |
| Basic Materials | | | 2.7% | |
| Technology | | | 2.5% | |
| Autos & Housing | | | 1.7% | |
| Special Products & Services | | | 1.2% | |
| Transportation | | | 1.0% | |
| |
| Fixed income sectors (i) | | | | |
| U.S. Treasury Securities | | | 13.3% | |
| Mortgage-Backed Securities | | | 11.4% | |
| High Grade Corporates | | | 8.9% | |
| Commercial Mortgage-Backed Securities | | | 1.5% | |
| Emerging Markets Bonds | | | 1.2% | |
| Non-U.S. Government Bonds | | | 0.8% | |
| U.S. Government Agencies | | | 0.5% | |
| Asset-Backed Securities | | | 0.2% | |
| High Yield Corporates | | | 0.2% | |
| Collateralized Debt Obligations | | | 0.1% | |
| Residential Mortgage-Backed Securities (o) | | | 0.0% | |
2
Portfolio Composition – continued
| (a) | For all securities other than those specifically described below, ratings are assigned to underlying securities utilizing ratings from Moody’s, Fitch, and Standard & Poor’s rating agencies and applying the following hierarchy: If all three agencies provide a rating, the middle rating (after dropping the highest and lowest ratings) is assigned; if two of the three agencies rate a security, the lower of the two is assigned. Ratings are shown in the S&P and Fitch scale (e.g., AAA). Securities rated BBB or higher are considered investment grade. All ratings are subject to change. U.S. Government includes securities issued by the U.S. Department of the Treasury. Federal Agencies includes rated and unrated U.S. Agency fixed-income securities, U.S. Agency mortgage-backed securities, and collateralized mortgage obligations of U.S. Agency mortgage-backed securities. Not Rated includes fixed income securities, including fixed income futures contracts, which have not been rated by any rating agency. Non-Fixed Income includes equity securities (including convertible bonds and equity derivatives) and commodities. Cash & Other includes cash, other assets less liabilities, offsets to derivative positions, and short-term securities. The fund may not hold all of these instruments. The fund is not rated by these agencies. |
| (i) | For purposes of this presentation, the components include the market value of securities, and reflect the impact of the equivalent exposure of derivative positions, if any. These amounts may be negative from time to time. The bond component will include any accrued interest amounts. Equivalent exposure is a calculated amount that translates the derivative position into a reasonable approximation of the amount of the underlying asset that the portfolio would have to hold at a given point in time to have the same price sensitivity that results from the portfolio’s ownership of the derivative contract. When dealing with derivatives, equivalent exposure is a more representative measure of the potential impact of a position on portfolio performance than market value. Where the fund holds convertible bonds, these are treated as part of the equity portion of the portfolio. |
Percentages are based on net assets as of 3/31/13.
The portfolio is actively managed and current holdings may be different.
3
EXPENSE TABLE
Fund expenses borne by the shareholders during the period,
October 1, 2012 through March 31, 2013
As a shareholder of the fund, you incur two types of costs: (1) transaction costs, including sales charges (loads) on certain purchase or redemption payments, and (2) ongoing costs, including management fees; distribution and service (12b-1) fees; and other fund expenses. This example is intended to help you understand your ongoing costs (in dollars) of investing in the fund and to compare these costs with the ongoing costs of investing in other mutual funds.
The example is based on an investment of $1,000 invested at the beginning of the period and held for the entire period October 1, 2012 through March 31, 2013.
Actual Expenses
The first line for each share class in the following table provides information about actual account values and actual expenses. You may use the information in this line, together with the amount you invested, to estimate the expenses that you paid over the period. Simply divide your account value by $1,000 (for example, an $8,600 account value divided by $1,000 = 8.6), then multiply the result by the number in the first line under the heading entitled “Expenses Paid During Period” to estimate the expenses you paid on your account during this period.
Hypothetical Example for Comparison Purposes
The second line for each share class in the following table provides information about hypothetical account values and hypothetical expenses based on the fund’s actual expense ratio and an assumed rate of return of 5% per year before expenses, which is not the fund’s actual return. The hypothetical account values and expenses may not be used to estimate the actual ending account balance or expenses you paid for the period. You may use this information to compare the ongoing costs of investing in the fund and other funds. To do so, compare this 5% hypothetical example with the 5% hypothetical examples that appear in the shareholder reports of the other funds.
Please note that the expenses shown in the table are meant to highlight your ongoing costs only and do not reflect any transactional costs, such as sales charges (loads). Therefore, the second line for each share class in the table is useful in comparing ongoing costs only, and will not help you determine the relative total costs of owning different funds. In addition, if these transactional costs were included, your costs would have been higher.
4
Expense Table – continued
| | | | | | | | | | | | | | | | | | |
Share
Class | | | | Annualized
Expense
Ratio | | | Beginning
Account Value
10/01/12 | | | Ending Account Value
3/31/13 | | | Expenses Paid During Period (p) 10/01/12-3/31/13 | |
| A | | Actual | | | 0.76% | | | | $1,000.00 | | | | $1,081.66 | | | | $3.94 | |
| | Hypothetical (h) | | | 0.76% | | | | $1,000.00 | | | | $1,021.14 | | | | $3.83 | |
| B | | Actual | | | 1.51% | | | | $1,000.00 | | | | $1,077.50 | | | | $7.82 | |
| | Hypothetical (h) | | | 1.51% | | | | $1,000.00 | | | | $1,017.40 | | | | $7.59 | |
| C | | Actual | | | 1.51% | | | | $1,000.00 | | | | $1,077.22 | | | | $7.82 | |
| | Hypothetical (h) | | | 1.51% | | | | $1,000.00 | | | | $1,017.40 | | | | $7.59 | |
| I | | Actual | | | 0.51% | | | | $1,000.00 | | | | $1,083.00 | | | | $2.65 | |
| | Hypothetical (h) | | | 0.51% | | | | $1,000.00 | | | | $1,022.39 | | | | $2.57 | |
| R1 | | Actual | | | 1.51% | | | | $1,000.00 | | | | $1,076.99 | | | | $7.82 | |
| | Hypothetical (h) | | | 1.51% | | | | $1,000.00 | | | | $1,017.40 | | | | $7.59 | |
| R2 | | Actual | | | 1.01% | | | | $1,000.00 | | | | $1,080.10 | | | | $5.24 | |
| | Hypothetical (h) | | | 1.01% | | | | $1,000.00 | | | | $1,019.90 | | | | $5.09 | |
| R3 | | Actual | | | 0.76% | | | | $1,000.00 | | | | $1,081.60 | | | | $3.94 | |
| | Hypothetical (h) | | | 0.76% | | | | $1,000.00 | | | | $1,021.14 | | | | $3.83 | |
| R4 | | Actual | | | 0.51% | | | | $1,000.00 | | | | $1,083.61 | | | | $2.65 | |
| | Hypothetical (h) | | | 0.51% | | | | $1,000.00 | | | | $1,022.39 | | | | $2.57 | |
| R5 | | Actual | | | 0.43% | | | | $1,000.00 | | | | $1,083.44 | | | | $2.23 | |
| | Hypothetical (h) | | | 0.43% | | | | $1,000.00 | | | | $1,022.79 | | | | $2.17 | |
| 529A | | Actual | | | 0.81% | | | | $1,000.00 | | | | $1,081.56 | | | | $4.20 | |
| | Hypothetical (h) | | | 0.81% | | | | $1,000.00 | | | | $1,020.89 | | | | $4.08 | |
| 529B | | Actual | | | 1.56% | | | | $1,000.00 | | | | $1,077.17 | | | | $8.08 | |
| | Hypothetical (h) | | | 1.56% | | | | $1,000.00 | | | | $1,017.15 | | | | $7.85 | |
| 529C | | Actual | | | 1.56% | | | | $1,000.00 | | | | $1,077.71 | | | | $8.08 | |
| | Hypothetical (h) | | | 1.56% | | | | $1,000.00 | | | | $1,017.15 | | | | $7.85 | |
| (h) | 5% class return per year before expenses. |
| (p) | Expenses paid are equal to each class’s annualized expense ratio, as shown above, multiplied by the average account value over the period, multiplied by the number of days in the period, divided by the number of days in the year. Expenses paid do not include any applicable sales charges (loads). If these transaction costs had been included, your costs would have been higher. |
5
PORTFOLIO OF INVESTMENTS
3/31/13 (unaudited)
The Portfolio of Investments is a complete list of all securities owned by your fund. It is categorized by broad-based asset classes.
| | | | | | | | |
| Common Stocks - 60.6% | | | | | | | | |
| Issuer | | Shares/Par | | | Value ($) | |
| Aerospace - 4.3% | | | | | | | | |
| General Dynamics Corp. | | | 132,400 | | | $ | 9,335,513 | |
| Honeywell International, Inc. | | | 881,020 | | | | 66,384,857 | |
| Lockheed Martin Corp. | | | 826,450 | | | | 79,768,954 | |
| Northrop Grumman Corp. | | | 244,170 | | | | 17,128,526 | |
| Precision Castparts Corp. | | | 47,460 | | | | 8,999,365 | |
| United Technologies Corp. | | | 826,720 | | | | 77,240,450 | |
| | | | | | | | |
| | | | | | | $ | 258,857,665 | |
| Alcoholic Beverages - 0.9% | | | | | | | | |
| Diageo PLC | | | 1,610,517 | | | $ | 50,777,317 | |
| Diageo PLC, ADR | | | 19,290 | | | | 2,427,454 | |
| | | | | | | | |
| | | | | | | $ | 53,204,771 | |
| Automotive - 1.2% | | | | | | | | |
| Delphi Automotive PLC | | | 628,550 | | | $ | 27,907,620 | |
| General Motors Co. (a) | | | 254,800 | | | | 7,088,536 | |
| Johnson Controls, Inc. | | | 1,035,170 | | | | 36,303,412 | |
| | | | | | | | |
| | | | | | | $ | 71,299,568 | |
| Broadcasting - 2.3% | | | | | | | | |
| Omnicom Group, Inc. | | | 629,470 | | | $ | 37,075,783 | |
| Time Warner, Inc. | | | 267,050 | | | | 15,387,421 | |
| Viacom, Inc., “B” | | | 408,570 | | | | 25,155,655 | |
| Walt Disney Co. | | | 1,053,620 | | | | 59,845,616 | |
| | | | | | | | |
| | | | | | | $ | 137,464,475 | |
| Brokerage & Asset Managers - 1.2% | | | | | | | | |
| BlackRock, Inc. | | | 156,649 | | | $ | 40,239,995 | |
| Franklin Resources, Inc. | | | 223,370 | | | | 33,686,430 | |
| | | | | | | | |
| | | | | | | $ | 73,926,425 | |
| Business Services - 1.2% | | | | | | | | |
| Accenture PLC, “A” | | | 693,390 | | | $ | 52,676,838 | |
| Dun & Bradstreet Corp. | | | 95,410 | | | | 7,981,047 | |
| Fidelity National Information Services, Inc. | | | 69,270 | | | | 2,744,477 | |
| Fiserv, Inc. (a) | | | 104,530 | | | | 9,180,870 | |
| | | | | | | | |
| | | | | | | $ | 72,583,232 | |
6
Portfolio of Investments (unaudited) – continued
| | | | | | | | |
| Issuer | | Shares/Par | | | Value ($) | |
| Common Stocks - continued | | | | | | | | |
| Cable TV - 0.9% | | | | | | | | |
| Comcast Corp., “Special A” | | | 1,201,380 | | | $ | 47,598,676 | |
| Time Warner Cable, Inc. | | | 99,610 | | | | 9,568,537 | |
| | | | | | | | |
| | | | | | | $ | 57,167,213 | |
| Chemicals - 2.2% | | | | | | | | |
| 3M Co. | | | 588,020 | | | $ | 62,512,406 | |
| Celanese Corp. | | | 238,570 | | | | 10,509,009 | |
| E.I. du Pont de Nemours & Co. | | | 161,090 | | | | 7,919,184 | |
| PPG Industries, Inc. | | | 378,400 | | | | 50,682,896 | |
| | | | | | | | |
| | | | | | | $ | 131,623,495 | |
| Computer Software - 0.9% | | | | | | | | |
| Check Point Software Technologies Ltd. (a) | | | 152,590 | | | $ | 7,170,204 | |
| Oracle Corp. | | | 1,412,700 | | | | 45,686,718 | |
| | | | | | | | |
| | | | | | | $ | 52,856,922 | |
| Computer Software - Systems - 1.3% | | | | | | | | |
| Hewlett-Packard Co. | | | 1,193,870 | | | $ | 28,461,861 | |
| International Business Machines Corp. | | | 240,470 | | | | 51,292,251 | |
| | | | | | | | |
| | | | | | | $ | 79,754,112 | |
| Construction - 0.4% | | | | | | | | |
| Stanley Black & Decker, Inc. | | | 326,011 | | | $ | 26,397,111 | |
| | |
| Consumer Products - 0.6% | | | | | | | | |
| Procter & Gamble Co. | | | 353,408 | | | $ | 27,233,620 | |
| Reckitt Benckiser Group PLC | | | 152,534 | | | | 10,934,802 | |
| | | | | | | | |
| | | | | | | $ | 38,168,422 | |
| Electrical Equipment - 1.9% | | | | | | | | |
| Danaher Corp. | | | 1,140,000 | | | $ | 70,851,000 | |
| Pentair Ltd. | | | 170,510 | | | | 8,994,403 | |
| Tyco International Ltd. | | | 992,570 | | | | 31,762,240 | |
| | | | | | | | |
| | | | | | | $ | 111,607,643 | |
| Electronics - 0.3% | | | | | | | | |
| Intel Corp. | | | 541,300 | | | $ | 11,827,405 | |
| Microchip Technology, Inc. | | | 236,670 | | | | 8,699,989 | |
| | | | | | | | |
| | | | | | | $ | 20,527,394 | |
| Energy - Independent - 2.7% | | | | | | | | |
| Anadarko Petroleum Corp. | | | 309,270 | | | $ | 27,045,662 | |
| Apache Corp. | | | 400,630 | | | | 30,912,611 | |
| Canadian Natural Resources Ltd. | | | 292,350 | | | | 9,393,206 | |
7
Portfolio of Investments (unaudited) – continued
| | | | | | | | |
| Issuer | | Shares/Par | | | Value ($) | |
| Common Stocks - continued | | | | | | | | |
| Energy - Independent - continued | | | | | | | | |
| EOG Resources, Inc. | | | 90,620 | | | $ | 11,605,703 | |
| EQT Corp. | | | 181,950 | | | | 12,327,113 | |
| Noble Energy, Inc. | | | 249,180 | | | | 28,820,159 | |
| Occidental Petroleum Corp. | | | 569,330 | | | | 44,618,392 | |
| | | | | | | | |
| | | | | | | $ | 164,722,846 | |
| Energy - Integrated - 2.5% | | | | | | | | |
| Chevron Corp. | | | 524,395 | | | $ | 62,308,614 | |
| Exxon Mobil Corp. | | | 986,658 | | | | 88,907,752 | |
| | | | | | | | |
| | | | | | | $ | 151,216,366 | |
| Engineering - Construction - 0.2% | | | | | | | | |
| Fluor Corp. | | | 175,460 | | | $ | 11,638,262 | |
| | |
| Food & Beverages - 3.2% | | | | | | | | |
| Coca-Cola Co. | | | 337,020 | | | $ | 13,629,089 | |
| Coca-Cola Enterprises, Inc. | | | 137,430 | | | | 5,073,916 | |
| Dr Pepper Snapple Group, Inc. | | | 193,520 | | | | 9,085,764 | |
| General Mills, Inc. | | | 969,330 | | | | 47,797,662 | |
| Groupe Danone | | | 423,054 | | | | 29,439,049 | |
| J.M. Smucker Co. | | | 50,940 | | | | 5,051,210 | |
| Kellogg Co. | | | 104,140 | | | | 6,709,740 | |
| Kraft Foods Group, Inc. | | | 67,246 | | | | 3,465,186 | |
| Mondelez International, Inc. | | | 366,550 | | | | 11,220,096 | |
| Nestle S.A. | | | 719,579 | | | | 52,053,844 | |
| PepsiCo, Inc. | | | 102,390 | | | | 8,100,073 | |
| | | | | | | | |
| | | | | | | $ | 191,625,629 | |
| Food & Drug Stores - 1.2% | | | | | | | | |
| CVS Caremark Corp. | | | 929,599 | | | $ | 51,118,649 | |
| Kroger Co. | | | 356,910 | | | | 11,827,997 | |
| Walgreen Co. | | | 220,360 | | | | 10,506,765 | |
| | | | | | | | |
| | | | | | | $ | 73,453,411 | |
| General Merchandise - 1.2% | | | | | | | | |
| Kohl’s Corp. | | | 410,810 | | | $ | 18,950,665 | |
| Target Corp. | | | 804,250 | | | | 55,050,913 | |
| | | | | | | | |
| | | | | | | $ | 74,001,578 | |
| Insurance - 4.0% | | | | | | | | |
| ACE Ltd. | | | 612,290 | | | $ | 54,475,441 | |
| Aon PLC | | | 476,920 | | | | 29,330,580 | |
| Chubb Corp. | | | 149,810 | | | | 13,112,869 | |
| MetLife, Inc. | | | 1,268,640 | | | | 48,233,693 | |
8
Portfolio of Investments (unaudited) – continued
| | | | | | | | |
| Issuer | | Shares/Par | | | Value ($) | |
| Common Stocks - continued | | | | | | | | |
| Insurance - continued | | | | | | | | |
| Prudential Financial, Inc. | | | 767,400 | | | $ | 45,268,926 | |
| Travelers Cos., Inc. | | | 577,153 | | | | 48,590,511 | |
| | | | | | | | |
| | | | | | | $ | 239,012,020 | |
| Leisure & Toys - 0.4% | | | | | | | | |
| Hasbro, Inc. | | | 540,500 | | | $ | 23,749,570 | |
| | |
| Machinery & Tools - 0.7% | | | | | | | | |
| Eaton Corp. PLC | | | 504,333 | | | $ | 30,890,396 | |
| Illinois Tool Works, Inc. | | | 152,290 | | | | 9,280,553 | |
| | | | | | | | |
| | | | | | | $ | 40,170,949 | |
| Major Banks - 7.0% | | | | | | | | |
| Bank of America Corp. | | | 1,805,560 | | | $ | 21,991,721 | |
| Bank of New York Mellon Corp. | | | 2,177,958 | | | | 60,961,044 | |
| Goldman Sachs Group, Inc. | | | 452,842 | | | | 66,635,700 | |
| JPMorgan Chase & Co. | | | 2,766,051 | | | | 131,276,780 | |
| Morgan Stanley | | | 581,250 | | | | 12,775,875 | |
| PNC Financial Services Group, Inc. | | | 330,509 | | | | 21,978,849 | |
| State Street Corp. | | | 702,760 | | | | 41,526,088 | |
| Wells Fargo & Co. | | | 1,829,360 | | | | 67,668,026 | |
| | | | | | | | |
| | | | | | | $ | 424,814,083 | |
| Medical & Health Technology & Services - 0.5% | | | | | | | | |
| AmerisourceBergen Corp. | | | 233,990 | | | $ | 12,038,786 | |
| Express Scripts Holding Co. (a) | | | 224,530 | | | | 12,944,155 | |
| Quest Diagnostics, Inc. | | | 138,530 | | | | 7,820,019 | |
| | | | | | | | |
| | | | | | | $ | 32,802,960 | |
| Medical Equipment - 2.6% | | | | | | | | |
| Abbott Laboratories | | | 797,330 | | | $ | 28,161,696 | |
| Becton, Dickinson & Co. | | | 104,110 | | | | 9,953,957 | |
| Covidien PLC | | | 406,150 | | | | 27,553,216 | |
| Medtronic, Inc. | | | 422,530 | | | | 19,842,009 | |
| St. Jude Medical, Inc. | | | 738,110 | | | | 29,849,168 | |
| Thermo Fisher Scientific, Inc. | | | 557,380 | | | | 42,633,996 | |
| | | | | | | | |
| | | | | | | $ | 157,994,042 | |
| Natural Gas - Pipeline - 0.3% | | | | | | | | |
| Williams Cos., Inc. | | | 538,450 | | | $ | 20,170,337 | |
| | |
| Oil Services - 0.4% | | | | | | | | |
| Noble Corp. | | | 342,440 | | | $ | 13,064,086 | |
| Schlumberger Ltd. | | | 116,210 | | | | 8,702,967 | |
| | | | | | | | |
| | | | | | | $ | 21,767,053 | |
9
Portfolio of Investments (unaudited) – continued
| | | | | | | | |
| Issuer | | Shares/Par | | | Value ($) | |
| Common Stocks - continued | | | | | | | | |
| Other Banks & Diversified Financials - 1.2% | | | | | | | | |
| American Express Co. | | | 147,410 | | | $ | 9,944,279 | |
| MasterCard, Inc., “A” | | | 13,356 | | | | 7,227,332 | |
| SunTrust Banks, Inc. | | | 258,200 | | | | 7,438,742 | |
| Visa, Inc., “A” | | | 142,910 | | | | 24,271,834 | |
| Western Union Co. | | | 929,911 | | | | 13,985,861 | |
| Zions Bancorporation | | | 375,490 | | | | 9,383,495 | |
| | | | | | | | |
| | | | | | | $ | 72,251,543 | |
| Pharmaceuticals - 4.5% | | | | | | | | |
| AbbVie, Inc. | | | 495,190 | | | $ | 20,193,848 | |
| Bayer AG | | | 106,208 | | | | 10,956,690 | |
| Johnson & Johnson | | | 1,327,770 | | | | 108,253,088 | |
| Merck & Co., Inc. | | | 352,340 | | | | 15,583,998 | |
| Pfizer, Inc. | | | 3,719,235 | | | | 107,337,122 | |
| Roche Holding AG | | | 44,180 | | | | 10,288,493 | |
| Zoetis, Inc. (a) | | | 46,810 | | | | 1,563,454 | |
| | | | | | | | |
| | | | | | | $ | 274,176,693 | |
| Printing & Publishing - 0.4% | | | | | | | | |
| McGraw-Hill Cos., Inc. | | | 149,410 | | | $ | 7,781,273 | |
| Moody’s Corp. | | | 250,250 | | | | 13,343,330 | |
| | | | | | | | |
| | | | | | | $ | 21,124,603 | |
| Railroad & Shipping - 0.3% | | | | | | | | |
| Canadian National Railway Co. | | | 84,480 | | | $ | 8,473,344 | |
| Union Pacific Corp. | | | 59,170 | | | | 8,426,400 | |
| | | | | | | | |
| | | | | | | $ | 16,899,744 | |
| Restaurants - 0.4% | | | | | | | | |
| McDonald’s Corp. | | | 219,810 | | | $ | 21,912,859 | |
| | |
| Specialty Chemicals - 0.5% | | | | | | | | |
| Air Products & Chemicals, Inc. | | | 378,790 | | | $ | 33,000,185 | |
| | |
| Specialty Stores - 0.4% | | | | | | | | |
| Advance Auto Parts, Inc. | | | 126,959 | | | $ | 10,493,161 | |
| Staples, Inc. | | | 838,500 | | | | 11,261,055 | |
| | | | | | | | |
| | | | | | | $ | 21,754,216 | |
| Telecommunications - Wireless - 0.5% | | | | | | | | |
| Vodafone Group PLC | | | 9,695,425 | | | $ | 27,489,372 | |
| Vodafone Group PLC, ADR | | | 57,810 | | | | 1,642,382 | |
| | | | | | | | |
| | | | | | | $ | 29,131,754 | |
10
Portfolio of Investments (unaudited) – continued
| | | | | | | | |
| Issuer | | Shares/Par | | | Value ($) | |
| Common Stocks - continued | | | | | | | | |
| Telephone Services - 1.6% | | | | | | | | |
| AT&T, Inc. | | | 1,520,728 | | | $ | 55,795,510 | |
| CenturyLink, Inc. | | | 198,703 | | | | 6,980,436 | |
| Verizon Communications, Inc. | | | 637,180 | | | | 31,317,397 | |
| | | | | | | | |
| | | | | | | $ | 94,093,343 | |
| Tobacco - 2.7% | | | | | | | | |
| Altria Group, Inc. | | | 260,680 | | | $ | 8,964,785 | |
| Lorillard, Inc. | | | 712,980 | | | | 28,768,743 | |
| Philip Morris International, Inc. | | | 1,379,890 | | | | 127,929,602 | |
| | | | | | | | |
| | | | | | | $ | 165,663,130 | |
| Trucking - 0.7% | | | | | | | | |
| United Parcel Service, Inc., “B” | | | 514,840 | | | $ | 44,224,756 | |
| | |
| Utilities - Electric Power - 0.9% | | | | | | | | |
| Duke Energy Corp. | | | 131,450 | | | $ | 9,541,956 | |
| NRG Energy, Inc. | | | 332,260 | | | | 8,801,567 | |
| PG&E Corp. | | | 112,440 | | | | 5,006,953 | |
| PPL Corp. | | | 607,200 | | | | 19,011,432 | |
| Public Service Enterprise Group, Inc. | | | 430,570 | | | | 14,785,774 | |
| | | | | | | | |
| | | | | | | $ | 57,147,682 | |
| Total Common Stocks (Identified Cost, $2,695,822,083) | | | $ | 3,663,958,062 | |
| | |
| Bonds - 37.8% | | | | | | | | |
| Agency - Other - 0.1% | | | | | | | | |
| Financing Corp., 9.65%, 2018 | | $ | 2,850,000 | | | $ | 4,142,871 | |
| | |
| Asset-Backed & Securitized - 1.8% | | | | | | | | |
| Bayview Financial Revolving Mortgage Loan Trust, FRN, 1.803%, 2040 (z) | | $ | 6,644,747 | | | $ | 3,539,073 | |
| BlackRock Capital Finance LP, 7.75%, 2026 (n) | | | 882,763 | | | | 112,552 | |
| Capital Trust Realty Ltd., CDO, 5.16%, 2035 (n) | | | 2,654,735 | | | | 2,662,964 | |
| Citigroup/Deutsche Bank Commercial Mortgage Trust, 5.322%, 2049 | | | 7,105,112 | | | | 8,076,253 | |
| Credit Suisse Mortgage Capital Certificate, FRN, 5.695%, 2040 | | | 9,759,829 | | | | 11,261,964 | |
| GMAC Mortgage Corp. Loan Trust, FRN, 5.805%, 2036 | | | 3,597,600 | | | | 3,437,970 | |
| Goldman Sachs Mortgage Securities Corp., FRN, 5.981%, 2045 | | | 5,229,879 | | | | 5,984,394 | |
| JPMorgan Chase Commercial Mortgage Securities Corp., 4.78%, 2042 | | | 828,000 | | | | 885,618 | |
| JPMorgan Chase Commercial Mortgage Securities Corp., “A3”, FRN, 5.929%, 2051 | | | 12,669,291 | | | | 13,326,409 | |
| JPMorgan Chase Commercial Mortgage Securities Corp., “A4”, FRN, 5.807%, 2049 | | | 8,257,080 | | | | 9,481,952 | |
11
Portfolio of Investments (unaudited) – continued
| | | | | | | | |
| Issuer | | Shares/Par | | | Value ($) | |
| Bonds - continued | | | | | | | | |
| Asset-Backed & Securitized - continued | | | | | | | | |
| JPMorgan Chase Commercial Mortgage Securities Corp., FRN, 4.948%, 2037 | | $ | 1,200,000 | | | $ | 1,292,005 | |
| JPMorgan Chase Commercial Mortgage Securities Corp., FRN, 5.214%, 2041 | | | 2,279,327 | | | | 2,361,118 | |
| Merrill Lynch Mortgage Trust, “A3”, FRN, 5.85%, 2050 | | | 1,948,101 | | | | 2,054,004 | |
| Merrill Lynch/Countrywide Commercial Mortgage Trust, FRN, 5.81%, 2050 | | | 11,723,839 | | | | 13,392,798 | |
| Morgan Stanley Capital I, Inc., FRN, 0.578%, 2030 (i)(n) | | | 26,234,692 | | | | 523,041 | |
| Residential Asset Mortgage Products, Inc., FRN, 4.971%, 2034 | | | 436,641 | | | | 436,550 | |
| Residential Funding Mortgage Securities, Inc., FRN, 5.32%, 2035 | | | 8,015,386 | | | | 4,708,526 | |
| Spirit Master Funding LLC, 5.05%, 2023 (z) | | | 6,363,752 | | | | 6,457,299 | |
| Wachovia Bank Commercial Mortgage Trust, “A4”, FRN, 5.926%, 2051 | | | 9,392,500 | | | | 10,767,393 | |
| Wachovia Bank Commercial Mortgage Trust, FRN, 5.731%, 2049 | | | 4,967,192 | | | | 5,700,052 | |
| | | | | | | | |
| | | | | | | $ | 106,461,935 | |
| Automotive - 0.2% | | | | | | | | |
| Hyundai Capital America, 2.125%, 2017 (n) | | $ | 384,000 | | | $ | 387,128 | |
| Toyota Motor Credit Corp., 3.2%, 2015 | | | 3,480,000 | | | | 3,674,306 | |
| Toyota Motor Credit Corp., 3.4%, 2021 | | | 4,890,000 | | | | 5,239,117 | |
| Volkswagen International Finance N.V., 2.375%, 2017 (n) | | | 4,856,000 | | | | 5,034,079 | |
| | | | | | | | |
| | | | | | | $ | 14,334,630 | |
| Broadcasting - 0.2% | | | | | | | | |
| Hearst-Argyle Television, Inc., 7.5%, 2027 | | $ | 3,800,000 | | | $ | 3,059,000 | |
| News America, Inc., 8.5%, 2025 | | | 5,903,000 | | | | 8,098,591 | |
| | | | | | | | |
| | | | | | | $ | 11,157,591 | |
| Cable TV - 0.4% | | | | | | | | |
| Comcast Corp., 2.85%, 2023 | | $ | 6,030,000 | | | $ | 6,009,926 | |
| Cox Communications, Inc., 4.625%, 2013 | | | 6,711,000 | | | | 6,756,829 | |
| DIRECTV Holdings LLC, 4.6%, 2021 | | | 3,220,000 | | | | 3,505,736 | |
| Time Warner Entertainment Co. LP, 8.375%, 2033 | | | 7,170,000 | | | | 9,911,521 | |
| | | | | | | | |
| | | | | | | $ | 26,184,012 | |
| Conglomerates - 0.2% | | | | | | | | |
| ABB Finance (USA), Inc., 2.875%, 2022 | | $ | 1,772,000 | | | $ | 1,798,415 | |
| General Electric Co., 2.7%, 2022 | | | 5,120,000 | | | | 5,120,415 | |
| United Technologies Corp., 3.1%, 2022 | | | 2,450,000 | | | | 2,567,798 | |
| | | | | | | | |
| | | | | | | $ | 9,486,628 | |
| Consumer Services - 0.0% | | | | | | | | |
| eBay, Inc., 1.35%, 2017 | | $ | 1,644,000 | | | $ | 1,662,178 | |
12
Portfolio of Investments (unaudited) – continued
| | | | | | | | |
| Issuer | | Shares/Par | | | Value ($) | |
| Bonds - continued | | | | | | | | |
| Defense Electronics - 0.1% | | | | | | | | |
| BAE Systems Holdings, Inc., 5.2%, 2015 (n) | | $ | 3,942,000 | | | $ | 4,280,200 | |
| | |
| Emerging Market Quasi-Sovereign - 0.4% | | | | | | | | |
| CNOOC Finance (2012) Ltd., 3.875%, 2022 (n) | | $ | 5,880,000 | | | $ | 6,195,727 | |
| Corporacion Nacional del Cobre de Chile, 3.75%, 2020 (n) | | | 1,789,000 | | | | 1,873,330 | |
| Gaz Capital S.A., 3.85%, 2020 (n) | | | 1,632,000 | | | | 1,632,000 | |
| Petrobras International Finance Co., 5.375%, 2021 | | | 2,152,000 | | | | 2,321,993 | |
| Petrobras International Finance Co., 6.75%, 2041 | | | 1,511,000 | | | | 1,707,873 | |
| Petroleos Mexicanos, 8%, 2019 | | | 4,145,000 | | | | 5,305,600 | |
| Qtel International Finance Ltd., 6.5%, 2014 (n) | | | 1,395,000 | | | | 1,482,746 | |
| Ras Laffan Liquefied Natural Gas Co. Ltd., 5.832%, 2016 (n) | | | 3,687,978 | | | | 3,970,108 | |
| | | | | | | | |
| | | | | | | $ | 24,489,377 | |
| Emerging Market Sovereign - 0.4% | | | | | | | | |
| Republic of Peru, 7.35%, 2025 | | $ | 551,000 | | | $ | 777,737 | |
| Russian Federation, 3.625%, 2015 (z) | | | 12,000,000 | | | | 12,528,000 | |
| United Mexican States, 4.75%, 2044 | | | 7,817,000 | | | | 8,110,138 | |
| | | | | | | | |
| | | | | | | $ | 21,415,875 | |
| Energy - Independent - 0.1% | | | | | | | | |
| Apache Corp., 3.25%, 2022 | | $ | 2,382,000 | | | $ | 2,470,825 | |
| Apache Corp., 4.75%, 2043 | | | 1,827,000 | | | | 1,868,013 | |
| EOG Resources, Inc., 2.625%, 2023 | | | 1,718,000 | | | | 1,696,599 | |
| Hess Corp., 8.125%, 2019 | | | 1,740,000 | | | | 2,247,254 | |
| | | | | | | | |
| | | | | | | $ | 8,282,691 | |
| Energy - Integrated - 0.6% | | | | | | | | |
| BP Capital Markets PLC, 4.5%, 2020 | | $ | 1,661,000 | | | $ | 1,897,847 | |
| BP Capital Markets PLC, 4.742%, 2021 | | | 4,892,000 | | | | 5,670,004 | |
| Husky Energy, Inc., 5.9%, 2014 | | | 4,370,000 | | | | 4,631,986 | |
| Husky Energy, Inc., 7.25%, 2019 | | | 4,453,000 | | | | 5,735,869 | |
| Petro-Canada, 6.05%, 2018 | | | 9,475,000 | | | | 11,416,731 | |
| Total Capital International S.A., 1.55%, 2017 | | | 7,071,000 | | | | 7,186,102 | |
| | | | | | | | |
| | | | | | | $ | 36,538,539 | |
| Financial Institutions - 0.1% | | | | | | | | |
| General Electric Capital Corp., 3.1%, 2023 | | $ | 3,339,000 | | | $ | 3,305,820 | |
| | |
| Food & Beverages - 0.2% | | | | | | | | |
| Anheuser-Busch InBev S.A., 8%, 2039 | | $ | 5,850,000 | | | $ | 9,248,177 | |
| Conagra Foods, Inc., 3.2%, 2023 | | | 2,934,000 | | | | 2,924,359 | |
| Kraft Foods Group, Inc., 3.5%, 2022 | | | 2,361,000 | | | | 2,468,711 | |
| | | | | | | | |
| | | | | | | $ | 14,641,247 | |
13
Portfolio of Investments (unaudited) – continued
| | | | | | | | |
| Issuer | | Shares/Par | | | Value ($) | |
| Bonds - continued | | | | | | | | |
| Insurance - 0.1% | | | | | | | | |
| Metropolitan Life Global Funding I, 5.125%, 2013 (n) | | $ | 3,340,000 | | | $ | 3,343,143 | |
| Metropolitan Life Global Funding I, 5.125%, 2014 (n) | | | 1,320,000 | | | | 1,391,353 | |
| | | | | | | | |
| | | | | | | $ | 4,734,496 | |
| Insurance - Health - 0.1% | | | | | | | | |
| WellPoint, Inc., 3.3%, 2023 | | $ | 3,410,000 | | | $ | 3,455,489 | |
| | |
| Insurance - Property & Casualty - 0.4% | | | | | | | | |
| ACE Ltd., 2.7%, 2023 | | $ | 5,960,000 | | | $ | 5,929,544 | |
| Chubb Corp., 6.375% to 2017, FRN to 2067 | | | 8,200,000 | | | | 9,009,750 | |
| Marsh & McLennan Cos., Inc., 4.8%, 2021 | | | 5,360,000 | | | | 6,118,510 | |
| ZFS Finance USA Trust V, 6.5% to 2017, FRN to 2067 (n) | | | 2,925,000 | | | | 3,129,750 | |
| | | | | | | | |
| | | | | | | $ | 24,187,554 | |
| International Market Quasi-Sovereign - 0.5% | | | | | | | | |
| Achmea Hypotheekbank N.V., 3.2%, 2014 (n) | | $ | 394,000 | | | $ | 410,469 | |
| ING Bank N.V., 3.9%, 2014 (n) | | | 6,920,000 | | | | 7,153,349 | |
| KFW International Finance, Inc., 4.875%, 2019 | | | 7,250,000 | | | | 8,755,825 | |
| Societe Financement de l’ Economie Francaise, 3.375%, 2014 (n) | | | 4,053,000 | | | | 4,184,868 | |
| Temasek Financial I Ltd., 2.375%, 2023 (n) | | | 10,140,000 | | | | 9,764,891 | |
| | | | | | | | |
| | | | | | | $ | 30,269,402 | |
| International Market Sovereign - 0.1% | | | | | | | | |
| Republic of Iceland, 4.875%, 2016 (n) | | $ | 5,610,000 | | | $ | 5,981,663 | |
| | |
| Internet - 0.1% | | | | | | | | |
| Baidu, Inc., 3.5%, 2022 | | $ | 6,460,000 | | | $ | 6,534,361 | |
| | |
| Local Authorities - 0.1% | | | | | | | | |
| New Jersey Turnpike Authority Rev. (Build America Bonds), “F”, 7.414%, 2040 | | $ | 5,815,000 | | �� | $ | 8,480,887 | |
| | |
| Machinery & Tools - 0.1% | | | | | | | | |
| Atlas Copco AB, 5.6%, 2017 (n) | | $ | 5,970,000 | | | $ | 6,875,088 | |
| | |
| Major Banks - 1.7% | | | | | | | | |
| ABN AMRO Bank N.V., FRN, 2.072%, 2014 (n) | | $ | 5,900,000 | | | $ | 5,969,974 | |
| Banco Santander U.S. Debt S.A.U., 3.781%, 2015 (n) | | | 2,600,000 | | | | 2,652,073 | |
| Bank of America Corp., 7.375%, 2014 | | | 2,825,000 | | | | 3,023,259 | |
| Bank of America Corp., 5.49%, 2019 | | | 4,135,000 | | | | 4,628,806 | |
| Bank of America Corp., 7.625%, 2019 | | | 3,980,000 | | | | 5,055,706 | |
| BNP Paribas, 7.195% to 2037, FRN to 2049 (n) | | | 3,200,000 | | | | 3,296,000 | |
| Commonwealth Bank of Australia, 5%, 2019 (n) | | | 3,930,000 | | | | 4,594,913 | |
14
Portfolio of Investments (unaudited) – continued
| | | | | | | | |
| Issuer | | Shares/Par | | | Value ($) | |
| Bonds - continued | | | | | | | | |
| Major Banks - continued | | | | | | | | |
| Credit Suisse New York, 5.5%, 2014 | | $ | 5,410,000 | | | $ | 5,691,558 | |
| Goldman Sachs Group, Inc., 5.625%, 2017 | | | 6,364,000 | | | | 7,125,058 | |
| HSBC Holdings PLC, 5.1%, 2021 | | | 3,688,000 | | | | 4,261,377 | |
| ING Bank N.V., 3.75%, 2017 (n) | | | 4,761,000 | | | | 5,073,464 | |
| JPMorgan Chase & Co., 6.3%, 2019 | | | 6,750,000 | | | | 8,244,524 | |
| JPMorgan Chase & Co., 3.25%, 2022 | | | 1,884,000 | | | | 1,881,091 | |
| Merrill Lynch & Co., Inc., 6.15%, 2013 | | | 6,790,000 | | | | 6,813,819 | |
| Morgan Stanley, 6.625%, 2018 | | | 11,740,000 | | | | 14,034,019 | |
| PNC Funding Corp., 5.625%, 2017 | | | 6,510,000 | | | | 7,435,969 | |
| Royal Bank of Scotland PLC, 2.55%, 2015 | | | 1,405,000 | | | | 1,444,044 | |
| Wachovia Corp., 5.25%, 2014 | | | 4,613,000 | | | | 4,880,619 | |
| Wells Fargo & Co., 2.1%, 2017 | | | 6,600,000 | | | | 6,805,966 | |
| | | | | | | | |
| | | | | | | $ | 102,912,239 | |
| Medical & Health Technology & Services - 0.3% | | | | | | | | |
| CareFusion Corp., 6.375%, 2019 | | $ | 6,240,000 | | | $ | 7,543,205 | |
| Express Scripts Holding Co., 2.65%, 2017 | | | 7,200,000 | | | | 7,541,698 | |
| | | | | | | | |
| | | | | | | $ | 15,084,903 | |
| Metals & Mining - 0.2% | | | | | | | | |
| Freeport-McMoRan Copper & Gold, Inc., 3.875%, 2023 (n) | | $ | 5,930,000 | | | $ | 5,947,155 | |
| Rio Tinto Finance (USA) PLC, 3.5%, 2022 | | | 5,540,000 | | | | 5,699,618 | |
| Vale Overseas Ltd., 4.625%, 2020 | | | 1,631,000 | | | | 1,727,443 | |
| Vale Overseas Ltd., 6.875%, 2039 | | | 1,269,000 | | | | 1,447,046 | |
| | | | | | | | |
| | | | | | | $ | 14,821,262 | |
| Mortgage-Backed - 11.4% | | | | | | | | |
| Fannie Mae, 4.006%, 2013 | | $ | 1,627,797 | | | $ | 1,627,666 | |
| Fannie Mae, 4.629%, 2014 | | | 2,916,845 | | | | 2,991,047 | |
| Fannie Mae, 4.825%, 2014 | | | 3,840,164 | | | | 3,967,775 | |
| Fannie Mae, 4.854%, 2014 | | | 116,316 | | | | 117,088 | |
| Fannie Mae, 4.386%, 2015 | | | 613,703 | | | | 654,876 | |
| Fannie Mae, 4.58%, 2015 | | | 291,575 | | | | 301,037 | |
| Fannie Mae, 4.78%, 2015 | | | 2,198,008 | | | | 2,347,610 | |
| Fannie Mae, 4.907%, 2015 | | | 2,103,821 | | | | 2,255,271 | |
| Fannie Mae, 5.19%, 2015 | | | 1,277,673 | | | | 1,380,202 | |
| Fannie Mae, 5.09%, 2016 | | | 1,993,333 | | | | 2,197,353 | |
| Fannie Mae, 5.284%, 2016 | | | 1,166,223 | | | | 1,297,250 | |
| Fannie Mae, 5.343%, 2016 | | | 2,013,474 | | | | 2,265,003 | |
| Fannie Mae, 5.35%, 2016 | | | 639,247 | | | | 708,490 | |
| Fannie Mae, 5.05%, 2017 | | | 2,392,726 | | | | 2,645,192 | |
| Fannie Mae, 5.5%, 2017 - 2040 | | | 86,747,578 | | | | 95,186,044 | |
| Fannie Mae, 6%, 2017 - 2037 | | | 42,648,496 | | | | 47,571,178 | |
| Fannie Mae, 2.578%, 2018 | | | 4,000,000 | | | | 4,227,692 | |
15
Portfolio of Investments (unaudited) – continued
| | | | | | | | |
| Issuer | | Shares/Par | | | Value ($) | |
| Bonds - continued | | | | | | | | |
| Mortgage-Backed - continued | | | | | | | | |
| Fannie Mae, 3.546%, 2018 | | $ | 784,942 | | | $ | 868,177 | |
| Fannie Mae, 3.649%, 2018 | | | 1,167,359 | | | | 1,294,130 | |
| Fannie Mae, 3.84%, 2018 | | | 1,427,261 | | | | 1,590,571 | |
| Fannie Mae, 4.5%, 2018 - 2041 | | | 28,245,548 | | | | 30,668,043 | |
| Fannie Mae, 5%, 2018 - 2041 | | | 45,691,487 | | | | 49,803,875 | |
| Fannie Mae, 4.293%, 2019 | | | 765,236 | | | | 881,685 | |
| Fannie Mae, 4.88%, 2020 | | | 525,251 | | | | 585,227 | |
| Fannie Mae, 3%, 2027 | | | 1,320,530 | | | | 1,390,600 | |
| Fannie Mae, 7.5%, 2030 - 2032 | | | 513,690 | | | | 602,900 | |
| Fannie Mae, 6.5%, 2031 - 2037 | | | 14,373,528 | | | | 16,305,334 | |
| Fannie Mae, 4%, 2040 - 2041 | | | 4,204,894 | | | | 4,505,369 | |
| Fannie Mae, 3.5%, 2041 - 2042 | | | 12,404,426 | | | | 13,164,861 | |
| Fannie Mae, TBA, 2.5%, 2028 | | | 10,240,000 | | | | 10,609,932 | |
| Fannie Mae, TBA, 3%, 2028 - 2043 | | | 11,550,000 | | | | 11,984,863 | |
| Fannie Mae, TBA, 4%, 2028 | | | 4,420,000 | | | | 4,728,537 | |
| Fannie Mae, TBA, 3.5%, 2031 - 2043 | | | 43,821,000 | | | | 46,182,285 | |
| Fannie Mae, TBA, 4.5%, 2043 | | | 13,920,000 | | | | 15,000,301 | |
| Freddie Mac, 6%, 2016 - 2037 | | | 23,021,514 | | | | 25,461,355 | |
| Freddie Mac, 3.882%, 2017 | | | 2,574,445 | | | | 2,862,420 | |
| Freddie Mac, 5%, 2017 - 2039 | | | 29,131,106 | | | | 31,599,943 | |
| Freddie Mac, 2.412%, 2018 | | | 1,963,000 | | | | 2,068,929 | |
| Freddie Mac, 3.154%, 2018 | | | 712,000 | | | | 773,700 | |
| Freddie Mac, 4.5%, 2019 - 2039 | | | 15,060,411 | | | | 16,068,254 | |
| Freddie Mac, 5.085%, 2019 | | | 6,789,000 | | | | 7,961,229 | |
| Freddie Mac, 5.5%, 2019 - 2035 | | | 19,449,254 | | | | 21,244,470 | |
| Freddie Mac, 3.808%, 2020 | | | 5,739,000 | | | | 6,444,742 | |
| Freddie Mac, 6.5%, 2034 - 2037 | | | 7,857,067 | | | | 8,925,448 | |
| Freddie Mac, 4%, 2040 - 2041 | | | 24,122,282 | | | | 25,640,226 | |
| Freddie Mac, 3.5%, 2042 | | | 11,017,010 | | | | 11,658,243 | |
| Freddie Mac, TBA, 2.5%, 2028 | | | 7,559,000 | | | | 7,809,392 | |
| Freddie Mac, TBA, 3%, 2043 | | | 13,142,000 | | | | 13,458,229 | |
| Freddie Mac, TBA, 3.5%, 2043 | | | 2,940,000 | | | | 3,086,426 | |
| Ginnie Mae, 5.5%, 2032 - 2035 | | | 9,814,334 | | | | 10,823,494 | |
| Ginnie Mae, 6%, 2032 - 2038 | | | 10,090,886 | | | | 11,466,718 | |
| Ginnie Mae, 4.5%, 2033 - 2041 | | | 28,560,280 | | | | 31,468,805 | |
| Ginnie Mae, 5%, 2033 - 2041 | | | 19,006,305 | | | | 20,932,883 | |
| Ginnie Mae, 3.5%, 2041 - 2042 | | | 9,543,995 | | | | 10,264,279 | |
| Ginnie Mae, 4%, 2041 | | | 14,043,200 | | | | 15,234,348 | |
| Ginnie Mae, TBA, 3%, 2043 | | | 18,530,000 | | | | 19,340,116 | |
| | | | | | | | |
| | | | | | | $ | 686,501,113 | |
16
Portfolio of Investments (unaudited) – continued
| | | | | | | | |
| Issuer | | Shares/Par | | | Value ($) | |
| Bonds - continued | | | | | | | | |
| Natural Gas - Pipeline - 0.3% | | | | | | | | |
| Energy Transfer Partners LP, 3.6%, 2023 | | $ | 3,288,000 | | | $ | 3,271,951 | |
| Enterprise Products Operating LLC, 6.5%, 2019 | | | 5,184,000 | | | | 6,436,314 | |
| Kinder Morgan Energy Partners LP, 7.75%, 2032 | | | 2,520,000 | | | | 3,369,726 | |
| Spectra Energy Capital LLC, 8%, 2019 | | | 5,327,000 | | | | 7,026,441 | |
| | | | | | | | |
| | | | | | | $ | 20,104,432 | |
| Network & Telecom - 0.2% | | | | | | | | |
| AT&T, Inc., 5.55%, 2041 | | $ | 8,008,000 | | | $ | 8,826,906 | |
| Telecom Italia Capital, 5.25%, 2013 | | | 4,186,000 | | | | 4,273,249 | |
| | | | | | | | |
| | | | | | | $ | 13,100,155 | |
| Oil Services - 0.0% | | | | | | | | |
| Transocean, Inc., 3.8%, 2022 | | $ | 2,855,000 | | | $ | 2,812,509 | |
| | |
| Other Banks & Diversified Financials - 0.8% | | | | | | | | |
| American Express Co., 5.5%, 2016 | | $ | 6,317,000 | | | $ | 7,203,900 | |
| Banco Bradesco S.A., 6.75%, 2019 (n) | | | 3,383,000 | | | | 3,839,705 | |
| Banco de Credito del Peru, 5.375%, 2020 | | | 4,872,000 | | | | 5,310,480 | |
| BBVA Bancomer S.A. de C.V., 6.75%, 2022 (n) | | | 4,730,000 | | | | 5,404,025 | |
| Capital One Financial Corp., 6.15%, 2016 | | | 8,680,000 | | | | 9,978,354 | |
| Citigroup, Inc., 3.375%, 2023 | | | 2,008,000 | | | | 2,024,132 | |
| Groupe BPCE S.A., 12.5% to 2019, FRN to 2049 (n) | | | 5,168,000 | | | | 6,371,131 | |
| Svenska Handelsbanken AB, 4.875%, 2014 (n) | | | 5,000,000 | | | | 5,251,845 | |
| Swedbank AB, 2.125%, 2017 (n) | | | 1,317,000 | | | | 1,332,815 | |
| | | | | | | | |
| | | | | | | $ | 46,716,387 | |
| Pharmaceuticals - 0.5% | | | | | | | | |
| AbbVie, Inc., 1.2%, 2015 (n) | | $ | 10,860,000 | | | $ | 10,944,371 | |
| Hospira, Inc., 6.05%, 2017 | | | 5,813,000 | | | | 6,614,839 | |
| Roche Holdings, Inc., 6%, 2019 (n) | | | 6,175,000 | | | | 7,679,835 | |
| Teva Pharmaceutical Finance IV LLC, 3.65%, 2021 | | | 7,330,000 | | | | 7,800,586 | |
| | | | | | | | |
| | | | | | | $ | 33,039,631 | |
| Real Estate - 0.4% | | | | | | | | |
| Boston Properties, Inc., REIT, 5%, 2015 | | $ | 2,006,000 | | | $ | 2,182,243 | |
| ERP Operating LP, REIT, 5.375%, 2016 | | | 1,460,000 | | | | 1,653,939 | |
| ERP Operating LP, REIT, 4.625%, 2021 | | | 5,212,000 | | | | 5,844,539 | |
| HCP, Inc., REIT, 5.375%, 2021 | | | 4,146,000 | | | | 4,816,006 | |
| WEA Finance LLC, REIT, 6.75%, 2019 (n) | | | 2,086,000 | | | | 2,579,731 | |
| WEA Finance LLC, REIT, 4.625%, 2021 (n) | | | 5,810,000 | | | | 6,480,515 | |
| | | | | | | | |
| | | | | | | $ | 23,556,973 | |
17
Portfolio of Investments (unaudited) – continued
| | | | | | | | |
| Issuer | | Shares/Par | | | Value ($) | |
| Bonds - continued | | | | | | | | |
| Retailers - 0.4% | | | | | | | | |
| Home Depot, Inc., 5.95%, 2041 | | $ | 1,578,000 | | | $ | 2,005,556 | |
| Limited Brands, Inc., 5.25%, 2014 | | | 2,262,000 | | | | 2,386,410 | |
| Target Corp., 4%, 2042 | | | 5,822,000 | | | | 5,664,946 | |
| Wal-Mart Stores, Inc., 5.25%, 2035 | | | 12,347,000 | | | | 14,495,267 | |
| | | | | | | | |
| | | | | | | $ | 24,552,179 | |
| Supranational - 0.1% | | | | | | | | |
| Asian Development Bank, 2.75%, 2014 | | $ | 5,390,000 | | | $ | 5,539,896 | |
| Asian Development Bank, 1.125%, 2017 | | | 3,322,000 | | | | 3,379,032 | |
| | | | | | | | |
| | | | | | | $ | 8,918,928 | |
| Telecommunications - Wireless - 0.4% | | | | | | | | |
| American Tower Trust I, 3.07%, 2023 (n) | | $ | 5,960,000 | | | $ | 5,997,614 | |
| Crown Castle Towers LLC, 6.113%, 2020 (n) | | | 3,852,000 | | | | 4,712,525 | |
| Crown Castle Towers LLC, 4.883%, 2020 (n) | | | 2,040,000 | | | | 2,348,085 | |
| Rogers Communications, Inc., 6.8%, 2018 | | | 8,529,000 | | | | 10,728,365 | |
| | | | | | | | |
| | | | | | | $ | 23,786,589 | |
| Tobacco - 0.2% | | | | | | | | |
| Altria Group, Inc., 2.85%, 2022 | | $ | 6,040,000 | | | $ | 5,937,882 | |
| B.A.T. International Finance PLC, 3.25%, 2022 (n) | | | 5,833,000 | | | | 6,063,666 | |
| | | | | | | | |
| | | | | | | $ | 12,001,548 | |
| Transportation - Services - 0.1% | | | | | | | | |
| ERAC USA Finance Co., 7%, 2037 (n) | | $ | 6,381,000 | | | $ | 8,141,218 | |
| | |
| U.S. Government Agencies and Equivalents - 0.4% | | | | | | | | |
| Aid-Egypt, 4.45%, 2015 | | $ | 9,559,000 | | | $ | 10,490,563 | |
| Small Business Administration, 4.35%, 2023 | | | 814,254 | | | | 885,530 | |
| Small Business Administration, 4.77%, 2024 | | | 2,227,424 | | | | 2,433,036 | |
| Small Business Administration, 5.18%, 2024 | | | 3,721,417 | | | | 4,146,701 | |
| Small Business Administration, 5.52%, 2024 | | | 2,116,618 | | | | 2,394,609 | |
| Small Business Administration, 4.99%, 2024 | | | 3,195,527 | | | | 3,557,393 | |
| Small Business Administration, 4.95%, 2025 | | | 2,454,115 | | | | 2,703,572 | |
| | | | | | | | |
| | | | | | | $ | 26,611,404 | |
| U.S. Treasury Obligations - 13.3% | | | | | | | | |
| U.S. Treasury Bonds, 8.5%, 2020 | | $ | 2,148,000 | | | $ | 3,195,653 | |
| U.S. Treasury Bonds, 6%, 2026 | | | 1,524,000 | | | | 2,169,320 | |
| U.S. Treasury Bonds, 6.75%, 2026 | | | 926,000 | | | | 1,406,507 | |
| U.S. Treasury Bonds, 5.25%, 2029 | | | 5,294,000 | | | | 7,181,639 | |
| U.S. Treasury Bonds, 5.375%, 2031 | | | 4,690,000 | | | | 6,524,231 | |
| U.S. Treasury Bonds, 4.5%, 2036 | | | 1,557,000 | | | | 1,977,633 | |
| U.S. Treasury Bonds, 5%, 2037 | | | 2,452,000 | | | | 3,338,935 | |
18
Portfolio of Investments (unaudited) – continued
| | | | | | | | |
| Issuer | | Shares/Par | | | Value ($) | |
| Bonds - continued | | | | | | | | |
| U.S. Treasury Obligations - continued | | | | | | | | |
| U.S. Treasury Bonds, 4.5%, 2039 | | $ | 103,566,000 | | | $ | 132,240,836 | |
| U.S. Treasury Notes, 3.125%, 2013 | | | 13,432,000 | | | | 13,631,385 | |
| U.S. Treasury Notes, 2.75%, 2013 | | | 24,524,000 | | | | 24,894,729 | |
| U.S. Treasury Notes, 2%, 2013 | | | 11,523,000 | | | | 11,664,341 | |
| U.S. Treasury Notes, 1.5%, 2013 | | | 16,019,000 | | | | 16,180,439 | |
| U.S. Treasury Notes, 1.875%, 2014 | | | 11,334,000 | | | | 11,510,652 | |
| U.S. Treasury Notes, 1.875%, 2014 | | | 28,430,000 | | | | 28,948,620 | |
| U.S. Treasury Notes, 4.75%, 2014 | | | 2,962,000 | | | | 3,113,225 | |
| U.S. Treasury Notes, 0.5%, 2014 | | | 21,032,000 | | | | 21,116,612 | |
| U.S. Treasury Notes, 2.125%, 2015 | | | 139,369,000 | | | | 144,911,148 | |
| U.S. Treasury Notes, 4.25%, 2015 | | | 856,000 | | | | 936,050 | |
| U.S. Treasury Notes, 2.625%, 2016 | | | 4,568,000 | | | | 4,867,775 | |
| U.S. Treasury Notes, 0.875%, 2016 | | | 221,451,000 | | | | 224,444,132 | |
| U.S. Treasury Notes, 4.75%, 2017 | | | 2,870,000 | | | | 3,381,219 | |
| U.S. Treasury Notes, 3.75%, 2018 | | | 4,535,000 | | | | 5,249,263 | |
| U.S. Treasury Notes, 3.125%, 2019 | | | 52,370,000 | | | | 58,998,052 | |
| U.S. Treasury Notes, 3.5%, 2020 | | | 55,133,000 | | | | 63,661,414 | |
| U.S. Treasury Notes, 3.125%, 2021 | | | 5,239,000 | | | | 5,899,198 | |
| | | | | | | | |
| | | | | | | $ | 801,443,008 | |
| Utilities-Electric Power - 0.8% | | | | | | | | |
| Bruce Mansfield Unit, 6.85%, 2034 | | $ | 5,721,111 | | | $ | 6,201,113 | |
| MidAmerican Funding LLC, 6.927%, 2029 | | | 12,485,000 | | | | 16,544,922 | |
| Oncor Electric Delivery Co., 7%, 2022 | | | 4,555,000 | | | | 5,926,365 | |
| Progress Energy, Inc., 3.15%, 2022 | | | 6,169,000 | | | | 6,285,909 | |
| PSEG Power LLC, 5.32%, 2016 | | | 5,099,000 | | | | 5,759,927 | |
| System Energy Resources, Inc., 5.129%, 2014 (z) | | | 841,760 | | | | 849,955 | |
| Waterford 3 Funding Corp., 8.09%, 2017 | | | 3,563,716 | | | | 3,667,777 | |
| | | | | | | | |
| | | | | | | $ | 45,235,968 | |
| Total Bonds (Identified Cost, $2,153,468,005) | | | | | | $ | 2,286,242,980 | |
| | |
| Convertible Preferred Stocks - 0.2% | | | | | | | | |
| Aerospace - 0.0% | | | | | | | | |
| United Technologies Corp., 7.5% | | | 41,830 | | | $ | 2,503,525 | |
| | |
| Automotive - 0.1% | | | | | | | | |
| General Motors Co., 4.75% | | | 193,780 | | | $ | 8,320,913 | |
| | |
| Utilities-Electric Power - 0.1% | | | | | | | | |
| PPL Corp., 9.5% | | | 58,230 | | | $ | 3,191,004 | |
| Total Convertible Preferred Stocks (Identified Cost, $14,702,269) | | | $ | 14,015,442 | |
19
Portfolio of Investments (unaudited) – continued
| | | | | | | | |
| Money Market Funds - 3.4% | | | | | | | | |
| Issuer | | Shares/Par | | | Value ($) | |
MFS Institutional Money Market Portfolio, 0.14%,
at Cost and Net Asset Value (v) | | | 202,318,680 | | | $ | 202,318,680 | |
| Total Investments (Identified Cost, $5,066,311,037) | | | | | | $ | 6,166,535,164 | |
| | |
| Other Assets, Less Liabilities - (2.0)% | | | | | | | (123,835,264 | ) |
| Net Assets - 100.0% | | | | | | $ | 6,042,699,900 | |
| (a) | Non-income producing security. |
| (i) | Interest only security for which the fund receives interest on notional principal (Par amount). Par amount shown is the notional principal and does not reflect the cost of the security. |
| (n) | Securities exempt from registration under Rule 144A of the Securities Act of 1933. These securities may be sold in the ordinary course of business in transactions exempt from registration, normally to qualified institutional buyers. At period end, the aggregate value of these securities was $175,510,687, representing 2.9% of net assets. |
| (v) | Underlying affiliated fund that is available only to investment companies managed by MFS. The rate quoted for the MFS Institutional Money Market Portfolio is the annualized seven-day yield of the fund at period end. |
| (z) | Restricted securities are not registered under the Securities Act of 1933 and are subject to legal restrictions on resale. These securities generally may be resold in transactions exempt from registration or to the public if the securities are subsequently registered. Disposal of these securities may involve time-consuming negotiations and prompt sale at an acceptable price may be difficult. The fund holds the following restricted securities: |
| | | | | | | | | | |
| Restricted Securities | | Acquisition Date | | Cost | | | Value | |
| Bayview Financial Revolving Mortgage Loan Trust, FRN, 1.803%, 2040 | | 3/01/06 | | | $6,644,747 | | | | $3,539,073 | |
| Russian Federation, 3.625%, 2015 | | 4/22/10 | | | 11,972,407 | | | | 12,528,000 | |
| Spirit Master Funding LLC, 5.05%, 2023 | | 10/04/05 | | | 6,307,586 | | | | 6,457,299 | |
| System Energy Resources, Inc., 5.129%, 2014 | | 4/16/04 | | | 841,760 | | | | 849,955 | |
| Total Restricted Securities | | | | $23,374,327 | |
| % of Net assets | | | | 0.4% | |
The following abbreviations are used in this report and are defined:
| ADR | | American Depositary Receipt |
| CDO | | Collateralized Debt Obligation |
| FRN | | Floating Rate Note. Interest rate resets periodically and may not be the rate reported at period end. |
| PLC | | Public Limited Company |
| REIT | | Real Estate Investment Trust |
See Notes to Financial Statements
20
Financial Statements
STATEMENT OF ASSETS AND LIABILITIES
At 3/31/13 (unaudited)
This statement represents your fund’s balance sheet, which details the assets and liabilities comprising the total value of the fund.
| | | | |
| Assets | | | | |
Investments- | | | | |
Non-affiliated issuers, at value (identified cost, $4,863,992,357) | | | $5,964,216,484 | |
Underlying affiliated funds, at cost and value | | | 202,318,680 | |
Total investments, at value (identified cost, $5,066,311,037) | | | $6,166,535,164 | |
Cash | | | 1,801,618 | |
Receivables for | | | | |
Investments sold | | | 23,193,332 | |
Fund shares sold | | | 5,247,489 | |
Interest and dividends | | | 21,244,356 | |
Other assets | | | 76,417 | |
Total assets | | | $6,218,098,376 | |
| Liabilities | | | | |
Payables for | | | | |
Distributions | | | $1,070,469 | |
Investments purchased | | | 60,346,469 | |
TBA purchase commitments | | | 95,610,458 | |
Fund shares reacquired | | | 13,880,656 | |
Payable to affiliates | | | | |
Investment adviser | | | 296,619 | |
Shareholder servicing costs | | | 3,495,287 | |
Distribution and service fees | | | 325,117 | |
Program manager fees | | | 163 | |
Payable for independent Trustees’ compensation | | | 157,295 | |
Accrued expenses and other liabilities | | | 215,943 | |
Total liabilities | | | $175,398,476 | |
Net assets | | | $6,042,699,900 | |
| Net assets consist of | | | | |
Paid-in capital | | | $5,379,462,657 | |
Unrealized appreciation (depreciation) on investments and translation of assets and liabilities in foreign currencies | | | 1,100,207,855 | |
Accumulated net realized gain (loss) on investments and foreign currency | | | (425,049,524 | ) |
Accumulated distributions in excess of net investment income | | | (11,921,088 | ) |
Net assets | | | $6,042,699,900 | |
Shares of beneficial interest outstanding | | | 372,190,843 | |
21
Statement of Assets and Liabilities (unaudited) – continued
| | | | | | | | | | | | |
| | | Net assets | | | Shares
outstanding | | | Net asset value
per share (a) | |
Class A | | | $4,260,967,157 | | | | 262,653,748 | | | | $16.22 | |
Class B | | | 305,895,987 | | | | 18,844,260 | | | | 16.23 | |
Class C | | | 796,460,062 | | | | 48,850,067 | | | | 16.30 | |
Class I | | | 138,970,207 | | | | 8,567,644 | | | | 16.22 | |
Class R1 | | | 16,882,267 | | | | 1,041,833 | | | | 16.20 | |
Class R2 | | | 155,993,281 | | | | 9,591,741 | | | | 16.26 | |
Class R3 | | | 187,389,627 | | | | 11,544,564 | | | | 16.23 | |
Class R4 | | | 154,635,588 | | | | 9,524,834 | | | | 16.23 | |
Class R5 | | | 1,579,542 | | | | 97,403 | | | | 16.22 | |
Class 529A | | | 14,590,237 | | | | 901,268 | | | | 16.19 | |
Class 529B | | | 2,629,403 | | | | 162,001 | | | | 16.23 | |
Class 529C | | | 6,706,542 | | | | 411,480 | | | | 16.30 | |
| (a) | Maximum offering price per share was equal to the net asset value per share for all share classes, except for Classes A and 529A, for which the maximum offering prices per share were $17.21 [100 / 94.25 x $16.22] and $17.18 [100 / 94.25 x $16.19], respectively. On sales of $50,000 or more, the maximum offering prices of Class A and Class 529A shares are reduced. A contingent deferred sales charge may be imposed on redemptions of Class A, Class B, Class C, Class 529B, and Class 529C shares. Redemption price per share was equal to the net asset value per share for Classes I, R1, R2, R3, R4, R5, and 529A. |
See Notes to Financial Statements
22
Financial Statements
STATEMENT OF OPERATIONS
Six months ended 3/31/13 (unaudited)
This statement describes how much your fund earned in investment income and accrued in expenses. It also describes any gains and/or losses generated by fund operations.
| | | | |
| Net investment income | | | | |
Income | | | | |
Dividends | | | $47,344,662 | |
Interest | | | 38,600,049 | |
Dividends from underlying affiliated funds | | | 113,794 | |
Foreign taxes withheld | | | (64,071 | ) |
| Total investment income | | | $85,994,434 | |
Expenses | | | | |
Management fee | | | $10,242,008 | |
Distribution and service fees | | | 11,348,455 | |
Program manager fees | | | 11,266 | |
Shareholder servicing costs | | | 3,939,226 | |
Administrative services fee | | | 260,115 | |
Independent Trustees’ compensation | | | 60,774 | |
Custodian fee | | | 120,222 | |
Shareholder communications | | | 129,533 | |
Audit and tax fees | | | 36,805 | |
Legal fees | | | 40,706 | |
Miscellaneous | | | 183,002 | |
Total expenses | | | $26,372,112 | |
Fees paid indirectly | | | (100 | ) |
Reduction of expenses by investment adviser and distributor | | | (11,426 | ) |
Net expenses | | | $26,360,586 | |
Net investment income | | | $59,633,848 | |
| Realized and unrealized gain (loss) on investments and foreign currency | |
Realized gain (loss) (identified cost basis) | | | | |
Investments | | | $172,632,130 | |
Foreign currency | | | (5,386 | ) |
Net realized gain (loss) on investments and foreign currency | | | $172,626,744 | |
Change in unrealized appreciation (depreciation) | | | | |
Investments | | | $225,562,570 | |
Translation of assets and liabilities in foreign currencies | | | (15,076 | ) |
Net unrealized gain (loss) on investments and foreign currency translation | | | $225,547,494 | |
Net realized and unrealized gain (loss) on investments and foreign currency | | | $398,174,238 | |
Change in net assets from operations | | | $457,808,086 | |
See Notes to Financial Statements
23
Financial Statements
STATEMENTS OF CHANGES IN NET ASSETS
These statements describe the increases and/or decreases in net assets resulting from operations, any distributions, and any shareholder transactions.
| | | | | | | | |
| Change in net assets | | Six months ended
3/31/13
(unaudited) | | | Year ended
9/30/12 | |
| From operations | | | | | | | | |
Net investment income | | | $59,633,848 | | | | $129,195,378 | |
Net realized gain (loss) on investments and foreign currency | | | 172,626,744 | | | | 314,507,909 | |
Net unrealized gain (loss) on investments and foreign currency translation | | | 225,547,494 | | | | 530,710,794 | |
Change in net assets from operations | | | $457,808,086 | | | | $974,414,081 | |
| Distributions declared to shareholders | | | | | | | | |
From net investment income | | | $(71,464,129 | ) | | | $(141,501,529 | ) |
Change in net assets from fund share transactions | | | $(238,668,644 | ) | | | $(682,886,162 | ) |
Total change in net assets | | | $147,675,313 | | | | $150,026,390 | |
| Net assets | | | | | | | | |
At beginning of period | | | 5,895,024,587 | | | | 5,744,998,197 | |
At end of period (including accumulated distributions in excess of net investment income of $11,921,088 and $90,807, respectively) | | | $6,042,699,900 | | | | $5,895,024,587 | |
See Notes to Financial Statements
24
Financial Statements
FINANCIAL HIGHLIGHTS
The financial highlights table is intended to help you understand the fund’s financial performance for the semiannual period and the past 5 fiscal years (or life of a particular share class, if shorter). Certain information reflects financial results for a single fund share. The total returns in the table represent the rate by which an investor would have earned (or lost) on an investment in the fund share class (assuming reinvestment of all distributions) held for the entire period.
| | | | | | | | | | | | | | | | | | | | | | | | |
| | | Six months
ended
3/31/13
(unaudited) | | | Years ended 9/30 | |
| Class A | | | 2012 | | | 2011 | | | 2010 | | | 2009 | | | 2008 | |
| | | | | | | | | | | | | | | | | |
Net asset value, beginning of
period | | | $15.19 | | | | $13.18 | | | | $13.46 | | | | $12.84 | | | | $13.17 | | | | $16.86 | |
| Income (loss) from investment operations | | | | | | | | | | | | | |
Net investment income (d) | | | $0.17 | | | | $0.34 | | | | $0.32 | | | | $0.31 | | | | $0.34 | | | | $0.39 | |
Net realized and unrealized
gain (loss) on investments
and foreign currency | | | 1.06 | | | | 2.04 | | | | (0.28 | ) | | | 0.63 | | | | (0.31 | ) | | | (2.36 | ) |
Total from investment
operations | | | $1.23 | | | | $2.38 | | | | $0.04 | | | | $0.94 | | | | $0.03 | | | | $(1.97 | ) |
| Less distributions declared to shareholders | | | | | | | | | | | | | |
From net investment income | | | $(0.20 | ) | | | $(0.37 | ) | | | $(0.32 | ) | | | $(0.32 | ) | | | $(0.36 | ) | | | $(0.41 | ) |
From net realized gain on
investments | | | — | | | | — | | | | — | | | | — | | | | — | | | | (1.31 | ) |
Total distributions declared to
shareholders | | | $(0.20 | ) | | | $(0.37 | ) | | | $(0.32 | ) | | | $(0.32 | ) | | | $(0.36 | ) | | | $(1.72 | ) |
Net asset value, end of
period (x) | | | $16.22 | | | | $15.19 | | | | $13.18 | | | | $13.46 | | | | $12.84 | | | | $13.17 | |
Total return (%) (r)(s)(t)(x) | | | 8.17 | (n) | | | 18.21 | | | | 0.14 | | | | 7.45 | | | | 0.61 | | | | (12.77 | ) |
Ratios (%) (to average net assets)
and Supplemental data: | | | | | | | | | |
Expenses before expense
reductions (f) | | | 0.76 | (a) | | | 0.77 | | | | 0.79 | | | | 0.88 | | | | 0.92 | | | | 0.87 | |
Expenses after expense
reductions (f) | | | 0.76 | (a) | | | 0.77 | | | | 0.79 | | | | 0.88 | | | | 0.92 | | | | 0.87 | |
Net investment income | | | 2.17 | (a) | | | 2.33 | | | | 2.28 | | | | 2.36 | | | | 2.94 | | | | 2.62 | |
Portfolio turnover | | | 16 | (n) | | | 23 | | | | 24 | | | | 32 | | | | 56 | | | | 53 | |
Net assets at end of period
(000 omitted) | | | $4,260,967 | | | | $4,152,753 | | | | $3,898,883 | | | | $4,357,041 | | | | $4,373,436 | | | | $5,025,291 | |
See Notes to Financial Statements
25
Financial Highlights – continued
| | | | | | | | | | | | | | | | | | | | | | | | |
| | | Six months
ended
3/31/13 (unaudited) | | | Years ended 9/30 | |
| Class B | | | 2012 | | | 2011 | | | 2010 | | | 2009 | | | 2008 | |
| | | | | | | | | | | | | | | | | |
Net asset value, beginning of
period | | | $15.20 | | | | $13.19 | | | | $13.47 | | | | $12.84 | | | | $13.17 | | | | $16.85 | |
| Income (loss) from investment operations | | | | | | | | | | | | | |
Net investment income (d) | | | $0.11 | | | | $0.23 | | | | $0.22 | | | | $0.23 | | | | $0.26 | | | | $0.29 | |
Net realized and unrealized
gain (loss) on investments
and foreign currency | | | 1.06 | | | | 2.04 | | | | (0.29 | ) | | | 0.64 | | | | (0.31 | ) | | | (2.35 | ) |
Total from investment
operations | | | $1.17 | | | | $2.27 | | | | $(0.07 | ) | | | $0.87 | | | | $(0.05 | ) | | | $(2.06 | ) |
| Less distributions declared to shareholders | | | | | | | | | | | | | |
From net investment income | | | $(0.14 | ) | | | $(0.26 | ) | | | $(0.21 | ) | | | $(0.24 | ) | | | $(0.28 | ) | | | $(0.31 | ) |
From net realized gain on
investments | | | — | | | | — | | | | — | | | | — | | | | — | | | | (1.31 | ) |
Total distributions declared to
shareholders | | | $(0.14 | ) | | | $(0.26 | ) | | | $(0.21 | ) | | | $(0.24 | ) | | | $(0.28 | ) | | | $(1.62 | ) |
Net asset value, end of
period (x) | | | $16.23 | | | | $15.20 | | | | $13.19 | | | | $13.47 | | | | $12.84 | | | | $13.17 | |
Total return (%) (r)(s)(t)(x) | | | 7.75 | (n) | | | 17.30 | | | | (0.60 | ) | | | 6.81 | | | | (0.05 | ) | | | (13.30 | ) |
Ratios (%) (to average net assets)
and Supplemental data: | | | | | | | | | |
Expenses before expense
reductions (f) | | | 1.51 | (a) | | | 1.52 | | | | 1.52 | | | | 1.53 | | | | 1.57 | | | | 1.52 | |
Expenses after expense
reductions (f) | | | 1.51 | (a) | | | 1.52 | | | | 1.52 | | | | 1.53 | | | | 1.57 | | | | 1.52 | |
Net investment income | | | 1.43 | (a) | | | 1.59 | | | | 1.55 | | | | 1.72 | | | | 2.32 | | | | 1.96 | |
Portfolio turnover | | | 16 | (n) | | | 23 | | | | 24 | | | | 32 | | | | 56 | | | | 53 | |
Net assets at end of period
(000 omitted) | | | $305,896 | | | | $338,115 | | | | $394,233 | | | | $574,454 | | | | $775,219 | | | | $1,148,445 | |
See Notes to Financial Statements
26
Financial Highlights – continued
| | | | | | | | | | | | | | | | | | | | | | | | |
| | | Six months
ended
3/31/13 (unaudited)
| | | Years ended 9/30 | |
| Class C | | | 2012 | | | 2011 | | | 2010 | | | 2009 | | | 2008 | |
| | | | | | | | | | | | | | | | | |
Net asset value, beginning of
period | | | $15.27 | | | | $13.25 | | | | $13.53 | | | | $12.90 | | | | $13.23 | | | | $16.92 | |
| Income (loss) from investment operations | | | | | | | | | | | | | |
Net investment income (d) | | | $0.11 | | | | $0.23 | | | | $0.22 | | | | $0.23 | | | | $0.26 | | | | $0.29 | |
Net realized and unrealized
gain (loss) on investments
and foreign currency | | | 1.06 | | | | 2.05 | | | | (0.29 | ) | | | 0.64 | | | | (0.31 | ) | | | (2.36 | ) |
Total from investment
operations | | | $1.17 | | | | $2.28 | | | | $(0.07 | ) | | | $0.87 | | | | $(0.05 | ) | | | $(2.07 | ) |
| Less distributions declared to shareholders | | | | | | | | | | | | | |
From net investment income | | | $(0.14 | ) | | | $(0.26 | ) | | | $(0.21 | ) | | | $(0.24 | ) | | | $(0.28 | ) | | | $(0.31 | ) |
From net realized gain on
investments | | | — | | | | — | | | | — | | | | — | | | | — | | | | (1.31 | ) |
Total distributions declared to
shareholders | | | $(0.14 | ) | | | $(0.26 | ) | | | $(0.21 | ) | | | $(0.24 | ) | | | $(0.28 | ) | | | $(1.62 | ) |
Net asset value, end of
period (x) | | | $16.30 | | | | $15.27 | | | | $13.25 | | | | $13.53 | | | | $12.90 | | | | $13.23 | |
Total return (%) (r)(s)(t)(x) | | | 7.72 | (n) | | | 17.31 | | | | (0.59 | ) | | | 6.79 | | | | (0.04 | ) | | | (13.30 | ) |
Ratios (%) (to average net assets)
and Supplemental data: | | | | | | | | | |
Expenses before expense
reductions (f) | | | 1.51 | (a) | | | 1.52 | | | | 1.52 | | | | 1.53 | | | | 1.57 | | | | 1.52 | |
Expenses after expense
reductions (f) | | | 1.51 | (a) | | | 1.52 | | | | 1.52 | | | | 1.53 | | | | 1.57 | | | | 1.52 | |
Net investment income | | | 1.42 | (a) | | | 1.58 | | | | 1.56 | | | | 1.71 | | | | 2.29 | | | | 1.97 | |
Portfolio turnover | | | 16 | (n) | | | 23 | | | | 24 | | | | 32 | | | | 56 | | | | 53 | |
Net assets at end of period
(000 omitted) | | | $796,460 | | | | $769,540 | | | | $734,645 | | | | $840,204 | | | | $861,667 | | | | $1,014,651 | |
See Notes to Financial Statements
27
Financial Highlights – continued
| | | | | | | | | | | | | | | | | | | | | | | | |
| | | Six months
ended
3/31/13 (unaudited) | | | Years ended 9/30 | |
| Class I | | | 2012 | | | 2011 | | | 2010 | | | 2009 | | | 2008 | |
| | | | | | | | | | | | | | | | | |
Net asset value, beginning of
period | | | $15.19 | | | | $13.18 | | | | $13.46 | | | | $12.84 | | | | $13.17 | | | | $16.85 | |
| Income (loss) from investment operations | | | | | | | | | | | | | |
Net investment income (d) | | | $0.19 | | | | $0.37 | | | | $0.36 | | | | $0.36 | | | | $0.38 | | | | $0.44 | |
Net realized and unrealized
gain (loss) on investments
and foreign currency | | | 1.06 | | | | 2.05 | | | | (0.28 | ) | | | 0.63 | | | | (0.31 | ) | | | (2.35 | ) |
Total from investment
operations | | | $1.25 | | | | $2.42 | | | | $0.08 | | | | $0.99 | | | | $0.07 | | | | $(1.91 | ) |
| Less distributions declared to shareholders | | | | | | | | | | | | | |
From net investment income | | | $(0.22 | ) | | | $(0.41 | ) | | | $(0.36 | ) | | | $(0.37 | ) | | | $(0.40 | ) | | | $(0.46 | ) |
From net realized gain on
investments | | | — | | | | — | | | | — | | | | — | | | | — | | | | (1.31 | ) |
Total distributions declared to
shareholders | | | $(0.22 | ) | | | $(0.41 | ) | | | $(0.36 | ) | | | $(0.37 | ) | | | $(0.40 | ) | | | $(1.77 | ) |
Net asset value, end of
period (x) | | | $16.22 | | | | $15.19 | | | | $13.18 | | | | $13.46 | | | | $12.84 | | | | $13.17 | |
Total return (%) (r)(s)(x) | | | 8.30 | (n) | | | 18.50 | | | | 0.42 | | | | 7.83 | | | | 0.96 | | | | (12.40 | ) |
Ratios (%) (to average net assets)
and Supplemental data: | | | | | | | | | |
Expenses before expense
reductions (f) | | | 0.51 | (a) | | | 0.52 | | | | 0.52 | | | | 0.53 | | | | 0.57 | | | | 0.52 | |
Expenses after expense
reductions (f) | | | 0.51 | (a) | | | 0.52 | | | | 0.52 | | | | 0.53 | | | | 0.57 | | | | 0.52 | |
Net investment income | | | 2.42 | (a) | | | 2.59 | | | | 2.57 | | | | 2.72 | | | | 3.30 | | | | 2.97 | |
Portfolio turnover | | | 16 | (n) | | | 23 | | | | 24 | | | | 32 | | | | 56 | | | | 53 | |
Net assets at end of period
(000 omitted) | | | $138,970 | | | | $121,687 | | | | $109,575 | | | | $98,214 | | | | $104,557 | | | | $155,134 | |
See Notes to Financial Statements
28
Financial Highlights – continued
| | | | | | | | | | | | | | | | | | | | | | | | |
| | | Six months
ended
3/31/13 (unaudited) | | | Years ended 9/30 | |
| Class R1 | | | 2012 | | | 2011 | | | 2010 | | | 2009 | | | 2008 | |
| | | | | | | | | | | | | | | | | |
Net asset value, beginning of
period | | | $15.18 | | | | $13.17 | | | | $13.45 | | | | $12.83 | | | | $13.16 | | | | $16.84 | |
| Income (loss) from investment operations | | | | | | | | | | | | | |
Net investment income (d) | | | $0.11 | | | | $0.23 | | | | $0.22 | | | | $0.23 | | | | $0.26 | | | | $0.29 | |
Net realized and unrealized
gain (loss) on investments
and foreign currency | | | 1.05 | | | | 2.04 | | | | (0.29 | ) | | | 0.63 | | | | (0.30 | ) | | | (2.35 | ) |
Total from investment
operations | | | $1.16 | | | | $2.27 | | | | $(0.07 | ) | | | $0.86 | | | | $(0.04 | ) | | | $(2.06 | ) |
| Less distributions declared to shareholders | | | | | | | | | | | | | |
From net investment income | | | $(0.14 | ) | | | $(0.26 | ) | | | $(0.21 | ) | | | $(0.24 | ) | | | $(0.29 | ) | | | $(0.31 | ) |
From net realized gain on
investments | | | — | | | | — | | | | — | | | | — | | | | — | | | | (1.31 | ) |
Total distributions declared to
shareholders | | | $(0.14 | ) | | | $(0.26 | ) | | | $(0.21 | ) | | | $(0.24 | ) | | | $(0.29 | ) | | | $(1.62 | ) |
Net asset value, end of
period (x) | | | $16.20 | | | | $15.18 | | | | $13.17 | | | | $13.45 | | | | $12.83 | | | | $13.16 | |
Total return (%) (r)(s)(x) | | | 7.70 | (n) | | | 17.36 | | | | (0.58 | ) | | | 6.76 | | | | (0.04 | ) | | | (13.32 | ) |
Ratios (%) (to average net assets)
and Supplemental data: | | | | | | | | | |
Expenses before expense
reductions (f) | | | 1.51 | (a) | | | 1.52 | | | | 1.52 | | | | 1.53 | | | | 1.57 | | | | 1.56 | |
Expenses after expense
reductions (f) | | | 1.51 | (a) | | | 1.52 | | | | 1.52 | | | | 1.53 | | | | 1.57 | | | | 1.56 | |
Net investment income | | | 1.43 | (a) | | | 1.58 | | | | 1.56 | | | | 1.71 | | | | 2.29 | | | | 1.93 | |
Portfolio turnover | | | 16 | (n) | | | 23 | | | | 24 | | | | 32 | | | | 56 | | | | 53 | |
Net assets at end of period
(000 omitted) | | | $16,882 | | | | $17,900 | | | | $15,441 | | | | $17,670 | | | | $16,811 | | | | $19,505 | |
See Notes to Financial Statements
29
Financial Highlights – continued
| | | | | | | | | | | | | | | | | | | | | | | | |
| | | Six months
ended
3/31/13 (unaudited) | | | Years ended 9/30 | |
| Class R2 | | | 2012 | | | 2011 | | | 2010 | | | 2009 | | | 2008 | |
| | | | | | | | | | | | | | | | | |
Net asset value, beginning of
period | | | $15.23 | | | | $13.22 | | | | $13.50 | | | | $12.87 | | | | $13.20 | | | | $16.89 | |
| Income (loss) from investment operations | | | | | | | | | | | | | |
Net investment income (d) | | | $0.15 | | | | $0.30 | | | | $0.29 | | | | $0.29 | | | | $0.32 | | | | $0.36 | |
Net realized and unrealized
gain (loss) on investments
and foreign currency | | | 1.06 | | | | 2.04 | | | | (0.28 | ) | | | 0.64 | | | | (0.31 | ) | | | (2.36 | ) |
Total from investment
operations | | | $1.21 | | | | $2.34 | | | | $0.01 | | | | $0.93 | | | | $0.01 | | | | $(2.00 | ) |
| Less distributions declared to shareholders | | | | | | | | | | | | | |
From net investment income | | | $(0.18 | ) | | | $(0.33 | ) | | | $(0.29 | ) | | | $(0.30 | ) | | | $(0.34 | ) | | | $(0.38 | ) |
From net realized gain on
investments | | | — | | | | — | | | | — | | | | — | | | | — | | | | (1.31 | ) |
Total distributions declared to
shareholders | | | $(0.18 | ) | | | $(0.33 | ) | | | $(0.29 | ) | | | $(0.30 | ) | | | $(0.34 | ) | | | $(1.69 | ) |
Net asset value, end of
period (x) | | | $16.26 | | | | $15.23 | | | | $13.22 | | | | $13.50 | | | | $12.87 | | | | $13.20 | |
Total return (%) (r)(s)(x) | | | 8.01 | (n) | | | 17.86 | | | | (0.08 | ) | | | 7.35 | | | | 0.46 | | | | (12.90 | ) |
Ratios (%) (to average net assets)
and Supplemental data: | | | | | | | | | |
Expenses before expense
reductions (f) | | | 1.01 | (a) | | | 1.02 | | | | 1.02 | | | | 1.03 | | | | 1.07 | | | | 1.05 | |
Expenses after expense
reductions (f) | | | 1.01 | (a) | | | 1.02 | | | | 1.02 | | | | 1.03 | | | | 1.07 | | | | 1.05 | |
Net investment income | | | 1.92 | (a) | | | 2.08 | | | | 2.06 | | | | 2.21 | | | | 2.79 | | | | 2.45 | |
Portfolio turnover | | | 16 | (n) | | | 23 | | | | 24 | | | | 32 | | | | 56 | | | | 53 | |
Net assets at end of period
(000 omitted) | | | $155,993 | | | | $154,925 | | | | $151,437 | | | | $166,794 | | | | $152,115 | | | | $166,407 | |
See Notes to Financial Statements
30
Financial Highlights – continued
| | | | | | | | | | | | | | | | | | | | | | | | |
| | | Six months
ended
3/31/13 (unaudited) | | | Years ended 9/30 | |
| Class R3 | | | 2012 | | | 2011 | | | 2010 | | | 2009 | | | 2008 | |
| | | | | | | | | | | | | | | | | |
Net asset value, beginning of
period | | | $15.20 | | | | $13.19 | | | | $13.47 | | | | $12.85 | | | | $13.18 | | | | $16.86 | |
| Income (loss) from investment operations | | | | | | | | | | | | | |
Net investment income (d) | | | $0.17 | | | | $0.34 | | | | $0.33 | | | | $0.32 | | | | $0.34 | | | | $0.40 | |
Net realized and unrealized
gain (loss) on investments
and foreign currency | | | 1.06 | | | | 2.04 | | | | (0.29 | ) | | | 0.64 | | | | (0.30 | ) | | | (2.35 | ) |
Total from investment
operations | | | $1.23 | | | | $2.38 | | | | $0.04 | | | | $0.96 | | | | $0.04 | | | | $(1.95 | ) |
| Less distributions declared to shareholders | | | | | | | | | | | | | |
From net investment income | | | $(0.20 | ) | | | $(0.37 | ) | | | $(0.32 | ) | | | $(0.34 | ) | | | $(0.37 | ) | | | $(0.42 | ) |
From net realized gain on
investments | | | — | | | | — | | | | — | | | | — | | | | — | | | | (1.31 | ) |
Total distributions declared to
shareholders | | | $(0.20 | ) | | | $(0.37 | ) | | | $(0.32 | ) | | | $(0.34 | ) | | | $(0.37 | ) | | | $(1.73 | ) |
Net asset value, end of
period (x) | | | $16.23 | | | | $15.20 | | | | $13.19 | | | | $13.47 | | | | $12.85 | | | | $13.18 | |
Total return (%) (r)(s)(x) | | | 8.16 | (n) | | | 18.20 | | | | 0.17 | | | | 7.55 | | | | 0.71 | | | | (12.65 | ) |
Ratios (%) (to average net assets)
and Supplemental data: | | | | | | | | | |
Expenses before expense
reductions (f) | | | 0.76 | (a) | | | 0.77 | | | | 0.77 | | | | 0.78 | | | | 0.82 | | | | 0.81 | |
Expenses after expense
reductions (f) | | | 0.76 | (a) | | | 0.77 | | | | 0.77 | | | | 0.78 | | | | 0.82 | | | | 0.81 | |
Net investment income | | | 2.18 | (a) | | | 2.32 | | | | 2.31 | | | | 2.46 | | | | 3.00 | | | | 2.68 | |
Portfolio turnover | | | 16 | (n) | | | 23 | | | | 24 | | | | 32 | | | | 56 | | | | 53 | |
Net assets at end of period
(000 omitted) | | | $187,390 | | | | $192,389 | | | | $153,259 | | | | $160,057 | | | | $142,968 | | | | $106,360 | |
See Notes to Financial Statements
31
Financial Highlights – continued
| | | | | | | | | | | | | | | | | | | | | | | | |
| | | Six months
ended
3/31/13 (unaudited) | | | Years ended 9/30 | |
| Class R4 | | | 2012 | | | 2011 | | | 2010 | | | 2009 | | | 2008 | |
| | | | | | | | | | | | | | | | | |
Net asset value, beginning of
period | | | $15.21 | | | | $13.19 | | | | $13.47 | | | | $12.85 | | | | $13.18 | | | | $16.86 | |
| Income (loss) from investment operations | | | | | | | | | | | | | |
Net investment income (d) | | | $0.19 | | | | $0.38 | | | | $0.36 | | | | $0.36 | | | | $0.38 | | | | $0.43 | |
Net realized and unrealized
gain (loss) on investments
and foreign currency | | | 1.05 | | | | 2.04 | | | | (0.28 | ) | | | 0.63 | | | | (0.31 | ) | | | (2.34 | ) |
Total from investment
operations | | | $1.24 | | | | $2.42 | | | | $0.08 | | | | $0.99 | | | | $0.07 | | | | $(1.91 | ) |
| Less distributions declared to shareholders | | | | | | | | | | | | | |
From net investment income | | | $(0.22 | ) | | | $(0.40 | ) | | | $(0.36 | ) | | | $(0.37 | ) | | | $(0.40 | ) | | | $(0.46 | ) |
From net realized gain on
investments | | | — | | | | — | | | | — | | | | — | | | | — | | | | (1.31 | ) |
Total distributions declared to
shareholders | | | $(0.22 | ) | | | $(0.40 | ) | | | $(0.36 | ) | | | $(0.37 | ) | | | $(0.40 | ) | | | $(1.77 | ) |
Net asset value, end of
period (x) | | | $16.23 | | | | $15.21 | | | | $13.19 | | | | $13.47 | | | | $12.85 | | | | $13.18 | |
Total return (%) (r)(s)(x) | | | 8.22 | (n) | | | 18.49 | | | | 0.42 | | | | 7.82 | | | | 0.96 | | | | (12.42 | ) |
Ratios (%) (to average net assets)
and Supplemental data: | | | | | | | | | |
Expenses before expense
reductions (f) | | | 0.51 | (a) | | | 0.52 | | | | 0.52 | | | | 0.53 | | | | 0.57 | | | | 0.54 | |
Expenses after expense
reductions (f) | | | 0.51 | (a) | | | 0.52 | | | | 0.52 | | | | 0.53 | | | | 0.57 | | | | 0.54 | |
Net investment income | | | 2.41 | (a) | | | 2.64 | | | | 2.56 | | | | 2.71 | | | | 3.27 | | | | 2.94 | |
Portfolio turnover | | | 16 | (n) | | | 23 | | | | 24 | | | | 32 | | | | 56 | | | | 53 | |
Net assets at end of period
(000 omitted) | | | $154,636 | | | | $125,421 | | | | $268,667 | | | | $291,138 | | | | $264,796 | | | | $257,120 | |
See Notes to Financial Statements
32
Financial Highlights – continued
| | | | | | | | |
| Class R5 | | Six months
ended
3/31/13
(unaudited) | | | Year ended
9/30/2012 (i) | |
| | | | | |
Net asset value, beginning of period | | | $15.19 | | | | $14.30 | |
| Income (loss) from investment operations | | | | | | | | |
Net investment income (d) | | | $0.20 | | | | $0.11 | |
Net realized and unrealized gain (loss) on investments and foreign
currency | �� | | 1.06 | | | | 0.91 | (g) |
Total from investment operations | | | $1.26 | | | | $1.02 | |
| Less distributions declared to shareholders | | | | | | | | |
From net investment income | | | $(0.23 | ) | | | $(0.13 | ) |
Net asset value, end of period (x) | | | $16.22 | | | | $15.19 | |
Total return (%) (r)(s)(x) | | | 8.34 | (n) | | | 7.17 | (n) |
Ratios (%) (to average net assets)
and Supplemental data: | | | | | | | | |
Expenses before expense reductions (f) | | | 0.43 | (a) | | | 0.44 | (a) |
Expenses after expense reductions (f) | | | 0.43 | (a) | | | 0.44 | (a) |
Net investment income | | | 2.51 | (a) | | | 2.29 | (a)(l) |
Portfolio turnover | | | 16 | (n) | | | 23 | |
Net assets at end of period (000 omitted) | | | $1,580 | | | | $107 | |
See Notes to Financial Statements
33
Financial Highlights – continued
| | | | | | | | | | | | | | | | | | | | | | | | |
| | | Six months
ended
3/31/13 | | | Years ended 9/30 | |
| Class 529A | | | 2012 | | | 2011 | | | 2010 | | | 2009 | | | 2008 | |
| | | (unaudited) | | | | | | | | | | | | | | | | |
Net asset value, beginning of
period | | | $15.16 | | | | $13.16 | | | | $13.44 | | | | $12.82 | | | | $13.15 | | | | $16.83 | |
| Income (loss) from investment operations | | | | | | | | | | | | | |
Net investment income (d) | | | $0.16 | | | | $0.33 | | | | $0.31 | | | | $0.30 | | | | $0.33 | | | | $0.36 | |
Net realized and unrealized
gain (loss) on investments
and foreign currency | | | 1.07 | | | | 2.03 | | | | (0.28 | ) | | | 0.63 | | | | (0.31 | ) | | | (2.35 | ) |
Total from investment
operations | | | $1.23 | | | | $2.36 | | | | $0.03 | | | | $0.93 | | | | $0.02 | | | | $(1.99 | ) |
| Less distributions declared to shareholders | | | | | | | | | | | | | |
From net investment income | | | $(0.20 | ) | | | $(0.36 | ) | | | $(0.31 | ) | | | $(0.31 | ) | | | $(0.35 | ) | | | $(0.38 | ) |
From net realized gain on
investments | | | — | | | | — | | | | — | | | | — | | | | — | | | | (1.31 | ) |
Total distributions declared to
shareholders | | | $(0.20 | ) | | | $(0.36 | ) | | | $(0.31 | ) | | | $(0.31 | ) | | | $(0.35 | ) | | | $(1.69 | ) |
Net asset value, end of
period (x) | | | $16.19 | | | | $15.16 | | | | $13.16 | | | | $13.44 | | | | $12.82 | | | | $13.15 | |
Total return (%) (r)(s)(t)(x) | | | 8.16 | (n) | | | 18.11 | | | | 0.06 | | | | 7.36 | | | | 0.50 | | | | (12.88 | ) |
Ratios (%) (to average net assets)
and Supplemental data: | | | | | | | | | |
Expenses before expense
reductions (f) | | | 0.86 | (a) | | | 0.87 | | | | 0.89 | | | | 0.98 | | | | 1.02 | | | | 1.05 | |
Expenses after expense
reductions (f) | | | 0.81 | (a) | | | 0.82 | | | | 0.88 | | | | 0.98 | | | | 1.02 | | | | 1.05 | |
Net investment income | | | 2.12 | (a) | | | 2.27 | | | | 2.20 | | | | 2.26 | | | | 2.84 | | | | 2.44 | |
Portfolio turnover | | | 16 | (n) | | | 23 | | | | 24 | | | | 32 | | | | 56 | | | | 53 | |
Net assets at end of period
(000 omitted) | | | $14,590 | | | | $13,064 | | | | $9,758 | | | | $8,965 | | | | $8,228 | | | | $13,149 | |
See Notes to Financial Statements
34
Financial Highlights – continued
| | | | | | | | | | | | | | | | | | | | | | | | |
| | | Six months
ended
3/31/13 | | | Years ended 9/30 | |
| Class 529B | | | 2012 | | | 2011 | | | 2010 | | | 2009 | | | 2008 | |
| | | (unaudited) | | | | | | | | | | | | | | | | |
Net asset value, beginning of
period | | | $15.20 | | | | $13.19 | | | | $13.46 | | | | $12.84 | | | | $13.17 | | | | $16.85 | |
| Income (loss) from investment operations | | | | | | | | | | | | | |
Net investment income (d) | | | $0.11 | | | | $0.22 | | | | $0.21 | | | | $0.21 | | | | $0.25 | | | | $0.27 | |
Net realized and unrealized
gain (loss) on investments
and foreign currency | | | 1.06 | | | | 2.04 | | | | (0.28 | ) | | | 0.64 | | | | (0.31 | ) | | | (2.35 | ) |
Total from investment
operations | | | $1.17 | | | | $2.26 | | | | $(0.07 | ) | | | $0.85 | | | | $(0.06 | ) | | | $(2.08 | ) |
| Less distributions declared to shareholders | | | | | | | | | | | | | |
From net investment income | | | $(0.14 | ) | | | $(0.25 | ) | | | $(0.20 | ) | | | $(0.23 | ) | | | $(0.27 | ) | | | $(0.29 | ) |
From net realized gain on
investments | | | — | | | | — | | | | — | | | | — | | | | — | | | | (1.31 | ) |
Total distributions declared to
shareholders | | | $(0.14 | ) | | | $(0.25 | ) | | | $(0.20 | ) | | | $(0.23 | ) | | | $(0.27 | ) | | | $(1.60 | ) |
Net asset value, end of
period (x) | | | $16.23 | | | | $15.20 | | | | $13.19 | | | | $13.46 | | | | $12.84 | | | | $13.17 | |
Total return (%) (r)(s)(t)(x) | | | 7.72 | (n) | | | 17.24 | | | | (0.60 | ) | | | 6.65 | | | | (0.14 | ) | | | (13.44 | ) |
Ratios (%) (to average net assets)
and Supplemental data: | | | | | | | | | |
Expenses before expense
reductions (f) | | | 1.61 | (a) | | | 1.62 | | | | 1.62 | | | | 1.63 | | | | 1.67 | | | | 1.70 | |
Expenses after expense
reductions (f) | | | 1.56 | (a) | | | 1.57 | | | | 1.61 | | | | 1.63 | | | | 1.67 | | | | 1.70 | |
Net investment income | | | 1.38 | (a) | | | 1.54 | | | | 1.47 | | | | 1.61 | | | | 2.19 | | | | 1.79 | |
Portfolio turnover | | | 16 | (n) | | | 23 | | | | 24 | | | | 32 | | | | 56 | | | | 53 | |
Net assets at end of period
(000 omitted) | | | $2,629 | | | | $3,095 | | | | $4,007 | | | | $4,828 | | | | $4,609 | | | | $5,018 | |
See Notes to Financial Statements
35
Financial Highlights – continued
| | | | | | | | | | | | | | | | | | | | | | | | |
| | | Six months
ended
3/31/13 | | | Years ended 9/30 | |
| Class 529C | | | 2012 | | | 2011 | | | 2010 | | | 2009 | | | 2008 | |
| | | (unaudited) | | | | | | | | | | | | | | | | |
Net asset value, beginning of
period | | | $15.27 | | | | $13.25 | | | | $13.53 | | | | $12.90 | | | | $13.23 | | | | $16.92 | |
| Income (loss) from investment operations | | | | | | | | | | | | | |
Net investment income (d) | | | $0.11 | | | | $0.22 | | | | $0.21 | | | | $0.21 | | | | $0.25 | | | | $0.27 | |
Net realized and unrealized
gain (loss) on investments
and foreign currency | | | 1.06 | | | | 2.05 | | | | (0.29 | ) | | | 0.65 | | | | (0.31 | ) | | | (2.36 | ) |
Total from investment
operations | | | $1.17 | | | | $2.27 | | | | $(0.08 | ) | | | $0.86 | | | | $(0.06 | ) | | | $(2.09 | ) |
| Less distributions declared to shareholders | | | | | | | | | | | | | |
From net investment income | | | $(0.14 | ) | | | $(0.25 | ) | | | $(0.20 | ) | | | $(0.23 | ) | | | $(0.27 | ) | | | $(0.29 | ) |
From net realized gain on
investments | | | — | | | | — | | | | — | | | | — | | | | — | | | | (1.31 | ) |
Total distributions declared to
shareholders | | | $(0.14 | ) | | | $(0.25 | ) | | | $(0.20 | ) | | | $(0.23 | ) | | | $(0.27 | ) | | | $(1.60 | ) |
Net asset value, end of
period (x) | | | $16.30 | | | | $15.27 | | | | $13.25 | | | | $13.53 | | | | $12.90 | | | | $13.23 | |
Total return (%) (r)(s)(t)(x) | | | 7.70 | (n) | | | 17.26 | | | | (0.66 | ) | | | 6.69 | | | | (0.14 | ) | | | (13.45 | ) |
Ratios (%) (to average net assets)
and Supplemental data: | | | | | | | | | |
Expenses before expense
reductions (f) | | | 1.61 | (a) | | | 1.62 | | | | 1.62 | | | | 1.63 | | | | 1.67 | | | | 1.70 | |
Expenses after expense
reductions (f) | | | 1.56 | (a) | | | 1.57 | | | | 1.61 | | | | 1.63 | | | | 1.67 | | | | 1.70 | |
Net investment income | | | 1.37 | (a) | | | 1.53 | | | | 1.47 | | | | 1.60 | | | | 2.18 | | | | 1.79 | |
Portfolio turnover | | | 16 | (n) | | | 23 | | | | 24 | | | | 32 | | | | 56 | | | | 53 | |
Net assets at end of period
(000 omitted) | | | $6,707 | | | | $6,028 | | | | $5,091 | | | | $4,973 | | | | $4,100 | | | | $4,372 | |
See Notes to Financial Statements
36
Financial Highlights – continued
| (d) | Per share data is based on average shares outstanding. |
| (f) | Ratios do not reflect reductions from fees paid indirectly, if applicable. |
| (g) | The per share amount varies from the net realized and unrealized gain/loss for the period because of the timing of sales of fund shares and the per share amount of realized and unrealized gains and losses at such time. |
| (i) | For the period from the class inception, June 1, 2012, through the stated period end. |
| (l) | Recognition of net investment income by the fund may be affected by the timing of the declaration of dividends by companies in which the fund invests and the actual annual net investment income ratio may differ. |
| (r) | Certain expenses have been reduced without which performance would have been lower. |
| (s) | From time to time the fund may receive proceeds from litigation settlements, without which performance would be lower. |
| (t) | Total returns do not include any applicable sales charges. |
| (x) | The net asset values per share and total returns have been calculated on net assets which include adjustments made in accordance with U.S. generally accepted accounting principles required at period end for financial reporting purposes. |
See Notes to Financial Statements
37
NOTES TO FINANCIAL STATEMENTS
(unaudited)
(1) Business and Organization
MFS Total Return Fund (the fund) is a series of MFS Series Trust V (the trust). The trust is organized as a Massachusetts business trust and is registered under the Investment Company Act of 1940, as amended, as an open-end management investment company.
(2) Significant Accounting Policies
General – The preparation of financial statements in conformity with U.S. generally accepted accounting principles requires management to make estimates and assumptions that affect the reported amounts of assets and liabilities, and disclosure of contingent assets and liabilities at the date of the financial statements and the reported amounts of revenues and expenses during the reporting period. Actual results could differ from those estimates. In the preparation of these financial statements, management has evaluated subsequent events occurring after the date of the fund’s Statement of Assets and Liabilities through the date that the financial statements were issued. The fund invests a significant portion of its assets in asset-backed and/or mortgage-backed securities. The value of these securities may depend, in part, on the issuer’s or borrower’s credit quality or ability to pay principal and interest when due and may fall if an issuer or borrower defaults on its obligation to pay principal or interest or if the instrument’s credit rating is downgraded by a credit rating agency. U.S. Government securities not supported as to the payment of principal or interest by the U.S. Treasury, such as those issued by Fannie Mae, Freddie Mac, and the Federal Home Loan Banks, are subject to greater credit risk than are U.S. Government securities supported by the U.S. Treasury, such as those issued by Ginnie Mae.
In January 2013, the Financial Accounting Standards Board issued Accounting Standards Update 2013-01 (“ASU 2013-01”) entitled Balance Sheet (Topic 210) – Clarifying the Scope of Disclosures about Offsetting Assets and Liabilities which is intended to clarify the scope of Accounting Standards Update 2011-11 (“ASU 2011-11”), Balance Sheet (Topic 210) – Disclosures about Offsetting Assets and Liabilities. Consistent with the effective date for ASU 2011-11, ASU 2013-01 is effective for annual reporting periods beginning on or after January 1, 2013, and interim periods within those annual periods. ASU 2013-01 limits the scope of ASU 2011-11’s disclosure requirements on offsetting to financial assets and financial liabilities related to derivatives, repurchase and reverse repurchase agreements, and securities lending and securities borrowing transactions. Although still evaluating the potential impact of these two ASUs to the fund, management expects that the impact of the fund’s adoption will be limited to additional financial statement disclosures.
Investment Valuations – Equity securities, including restricted equity securities, are generally valued at the last sale or official closing price as provided by a third-party pricing service on the market or exchange on which they are primarily traded. Equity securities, for which there were no sales reported that day, are generally valued at the last quoted daily bid quotation as provided by a third-party pricing service on the market or exchange on which such securities are primarily traded. Debt instruments and floating rate loans (other than short-term instruments), including restricted debt instruments, are generally valued at an evaluated or composite bid as provided by a
38
Notes to Financial Statements (unaudited) – continued
third-party pricing service. Short-term instruments with a maturity at issuance of 60 days or less generally are valued at amortized cost, which approximates market value. Open-end investment companies are generally valued at net asset value per share. Securities and other assets generally valued on the basis of information from a third-party pricing service may also be valued at a broker/dealer bid quotation. Values obtained from third-party pricing services can utilize both transaction data and market information such as yield, quality, coupon rate, maturity, type of issue, trading characteristics, and other market data. The values of foreign securities and other assets and liabilities expressed in foreign currencies are converted to U.S. dollars using the mean of bid and asked prices for rates provided by a third-party pricing service.
The Board of Trustees has delegated primary responsibility for determining or causing to be determined the value of the fund’s investments (including any fair valuation) to the adviser pursuant to valuation policies and procedures approved by the Board. If the adviser determines that reliable market quotations are not readily available, investments are valued at fair value as determined in good faith by the adviser in accordance with such procedures under the oversight of the Board of Trustees. Under the fund’s valuation policies and procedures, market quotations are not considered to be readily available for most types of debt instruments and floating rate loans and many types of derivatives. These investments are generally valued at fair value based on information from third-party pricing services. In addition, investments may be valued at fair value if the adviser determines that an investment’s value has been materially affected by events occurring after the close of the exchange or market on which the investment is principally traded (such as foreign exchange or market) and prior to the determination of the fund’s net asset value, or after the halting of trading of a specific security where trading does not resume prior to the close of the exchange or market on which the security is principally traded. Events that occur on a frequent basis after foreign markets close (such as developments in foreign markets and significant movements in the U.S. markets) and prior to the determination of the fund’s net asset value may be deemed to have a material effect on the value of securities traded in foreign markets. Accordingly, the fund’s foreign equity securities may often be valued at fair value. The adviser generally relies on third-party pricing services or other information (such as the correlation with price movements of similar securities in the same or other markets; the type, cost and investment characteristics of the security; the business and financial condition of the issuer; and trading and other market data) to assist in determining whether to fair value and at what value to fair value an investment. The value of an investment for purposes of calculating the fund’s net asset value can differ depending on the source and method used to determine value. When fair valuation is used, the value of an investment used to determine the fund’s net asset value may differ from quoted or published prices for the same investment. There can be no assurance that the fund could obtain the fair value assigned to an investment if it were to sell the investment at the same time at which the fund determines its net asset value per share.
Various inputs are used in determining the value of the fund’s assets or liabilities. These inputs are categorized into three broad levels. In certain cases, the inputs used to measure fair value may fall into different levels of the fair value hierarchy. In such cases, an investment’s level within the fair value hierarchy is based on the lowest level of input that is significant to the fair value measurement. The fund’s assessment of the significance of a particular input to the fair value measurement in its entirety requires
39
Notes to Financial Statements (unaudited) – continued
judgment, and considers factors specific to the investment. Level 1 includes unadjusted quoted prices in active markets for identical assets or liabilities. Level 2 includes other significant observable market-based inputs (including quoted prices for similar securities, interest rates, prepayment speed, and credit risk). Level 3 includes unobservable inputs, which may include the adviser’s own assumptions in determining the fair value of investments. The following is a summary of the levels used as of March 31, 2013 in valuing the fund’s assets or liabilities:
| | | | | | | | | | | | | | | | |
| Investments at Value | | Level 1 | | | Level 2 | | | Level 3 | | | Total | |
| Equity Securities | | | $3,677,973,504 | | | | $— | | | | $— | | | | $3,677,973,504 | |
| U.S. Treasury Bonds & U.S. Government Agency & Equivalents | | | — | | | | 832,197,283 | | | | — | | | | 832,197,283 | |
| Non-U.S. Sovereign Debt | | | — | | | | 91,075,244 | | | | — | | | | 91,075,244 | |
| U.S. Corporate Bonds | | | — | | | | 393,503,006 | | | | — | | | | 393,503,006 | |
| Residential Mortgage-Backed Securities | | | — | | | | 695,196,705 | | | | — | | | | 695,196,705 | |
| Commercial Mortgage-Backed Securities | | | — | | | | 91,564,299 | | | | — | | | | 91,564,299 | |
| Asset-Backed Securities (including CDOs) | | | — | | | | 6,202,037 | | | | — | | | | 6,202,037 | |
| Foreign Bonds | | | — | | | | 176,504,406 | | | | — | | | | 176,504,406 | |
| Mutual Funds | | | 202,318,680 | | | | — | | | | — | | | | 202,318,680 | |
| Total Investments | | | $3,880,292,184 | | | | $2,286,242,980 | | | | $— | | | | $6,166,535,164 | |
For further information regarding security characteristics, see the Portfolio of Investments.
Foreign Currency Translation – Purchases and sales of foreign investments, income, and expenses are converted into U.S. dollars based upon currency exchange rates prevailing on the respective dates of such transactions or on the reporting date for foreign denominated receivables and payables. Gains and losses attributable to foreign currency exchange rates on sales of securities are recorded for financial statement purposes as net realized gains and losses on investments. Gains and losses attributable to foreign exchange rate movements on receivables, payables, income and expenses are recorded for financial statement purposes as foreign currency transaction gains and losses. That portion of both realized and unrealized gains and losses on investments that results from fluctuations in foreign currency exchange rates is not separately disclosed.
Security Loans – JPMorgan Chase and Co. (“Chase”), as lending agent, loans the securities of the fund to certain qualified institutions (the “Borrowers”) approved by the fund. The loans are collateralized by cash and/or U.S. Treasury and federal agency obligations in an amount typically at least equal to the market value of the securities loaned. The market value of the loaned securities is determined at the close of business of the fund and any additional required collateral is delivered to the fund on the next business day. Chase provides the fund with indemnification against Borrower default. The fund bears the risk of loss with respect to the investment of cash collateral. On loans collateralized by cash, the cash collateral is invested in short-term securities. A portion of the income generated upon investment of the collateral is remitted to the Borrowers, and the remainder is allocated between the fund and the lending agent. On
40
Notes to Financial Statements (unaudited) – continued
loans collateralized by U.S. Treasury and/or federal agency obligations, a fee is received from the Borrower, and is allocated between the fund and the lending agent. Income from securities lending is included in “Interest” income on the Statement of Operations. The dividend and interest income earned on the securities loaned is accounted for in the same manner as other dividend and interest income.
Indemnifications – Under the fund’s organizational documents, its officers and Trustees may be indemnified against certain liabilities and expenses arising out of the performance of their duties to the fund. Additionally, in the normal course of business, the fund enters into agreements with service providers that may contain indemnification clauses. The fund’s maximum exposure under these agreements is unknown as this would involve future claims that may be made against the fund that have not yet occurred.
Investment Transactions and Income – Investment transactions are recorded on the trade date. Interest income is recorded on the accrual basis. All premium and discount is amortized or accreted for financial statement purposes in accordance with U.S. generally accepted accounting principles. Some securities may be purchased on a “when-issued” or “forward delivery” basis, which means that the securities will be delivered to the fund at a future date, usually beyond customary settlement time. Dividends received in cash are recorded on the ex-dividend date. Certain dividends from foreign securities will be recorded when the fund is informed of the dividend if such information is obtained subsequent to the ex-dividend date. Dividend and interest payments received in additional securities are recorded on the ex-dividend or ex-interest date in an amount equal to the value of the security on such date.
The fund may receive proceeds from litigation settlements. Any proceeds received from litigation involving portfolio holdings are reflected in the Statement of Operations in realized gain/loss if the security has been disposed of by the fund or in unrealized gain/loss if the security is still held by the fund. Any other proceeds from litigation not related to portfolio holdings are reflected as other income in the Statement of Operations.
The fund purchased or sold debt securities on a when-issued or delayed delivery basis, or in a “To Be Announced” (TBA) or “forward commitment” transaction with delivery or payment to occur at a later date beyond the normal settlement period. TBA securities resulting from these transactions are included in the Portfolio of Investments. At the time a fund enters into a commitment to purchase or sell a security, the transaction is recorded and the value of the security acquired is reflected in the fund’s net asset value. The price of such security and the date that the security will be delivered and paid for are fixed at the time the transaction is negotiated. The value of the security may vary with market fluctuations. TBA purchase commitments are held at carrying amount, which approximates fair value and are categorized as level 2 within the fair value hierarchy disclosure. No interest accrues to the fund until payment takes place. At the time that a fund enters into this type of transaction, the fund is required to have sufficient cash and/or liquid securities to cover its commitments. Losses may arise due to changes in the value of the underlying securities or if the counterparty does not perform under the contract’s terms, or if the issuer does not issue the securities due to political, economic or other factors. Additionally, losses may arise due to declines in the value of the securities prior to settlement date.
41
Notes to Financial Statements (unaudited) – continued
Fees Paid Indirectly – The fund’s custody fee may be reduced according to an arrangement that measures the value of cash deposited with the custodian by the fund. This amount, for the six months ended March 31, 2013, is shown as a reduction of total expenses in the Statement of Operations.
Tax Matters and Distributions – The fund intends to qualify as a regulated investment company, as defined under Subchapter M of the Internal Revenue Code, and to distribute all of its taxable income, including realized capital gains. As a result, no provision for federal income tax is required. The fund’s federal tax returns, when filed, will remain subject to examination by the Internal Revenue Service for a three year period. Foreign taxes have been accrued by the fund in the accompanying financial statements.
Distributions to shareholders are recorded on the ex-dividend date. Income and capital gain distributions are determined in accordance with income tax regulations, which may differ from U.S. generally accepted accounting principles. Certain capital accounts in the financial statements are periodically adjusted for permanent differences in order to reflect their tax character. These adjustments have no impact on net assets or net asset value per share. Temporary differences which arise from recognizing certain items of income, expense, gain or loss in different periods for financial statement and tax purposes will reverse at some time in the future. Distributions in excess of net investment income or net realized gains are temporary overdistributions for financial statement purposes resulting from differences in the recognition or classification of income or distributions for financial statement and tax purposes.
Book/tax differences primarily relate to amortization and accretion of debt securities and wash sale loss deferrals.
The tax character of distributions made during the current period will be determined at fiscal year end. The tax character of distributions declared to shareholders for the last fiscal year is as follows:
| | | | |
| | | 9/30/12 | |
Ordinary income (including any
short-term capital gains) | | | $141,501,529 | |
The federal tax cost and the tax basis components of distributable earnings were as follows:
| | | | |
| As of 3/31/13 | | | |
| Cost of investments | | | $5,188,763,134 | |
| Gross appreciation | | | 1,025,955,581 | |
| Gross depreciation | | | (48,183,551 | ) |
| Net unrealized appreciation (depreciation) | | | $977,772,030 | |
| |
| As of 9/30/12 | | | |
| Undistributed ordinary income | | | 10,577,984 | |
| Capital loss carryforwards | | | (475,820,313 | ) |
| Other temporary differences | | | (10,820,923 | ) |
| Net unrealized appreciation (depreciation) | | | 752,956,538 | |
The aggregate cost above includes prior fiscal year end tax adjustments, if applicable.
42
Notes to Financial Statements (unaudited) – continued
Under the Regulated Investment Company Modernization Act of 2010 (the “Act”), net capital losses recognized for fund fiscal years beginning after September 30, 2011 may be carried forward indefinitely, and their character is retained as short-term and/or long-term losses (“post-enactment losses”). Previously, net capital losses were carried forward for eight years and treated as short-term losses (“pre-enactment losses”). As a transition rule, the Act requires that all post-enactment net capital losses be used before pre-enactment net capital losses.
As of September 30, 2012, the fund had capital loss carryforwards available to offset future realized gains. Such losses expire as follows:
Multiple Classes of Shares of Beneficial Interest – The fund offers multiple classes of shares, which differ in their respective distribution, service, and program manager fees. The fund’s income, realized and unrealized gain (loss), and common expenses are allocated to shareholders based on the daily net assets of each class. Dividends are declared separately for each class. Differences in per share dividend rates are generally due to differences in separate class expenses. Class B and Class 529B shares will convert to Class A and Class 529A shares, respectively, approximately eight years after purchase. The fund’s distributions declared to shareholders as reported in the Statements of Changes in Net Assets are presented by class as follows:
| | | | | | | | |
| | | From net investment
income | |
| | | Six months
ended
3/31/13 | | | Year
ended
9/30/12 (i) | |
| Class A | | | $53,249,211 | | | | $104,008,922 | |
| Class B | | | 2,872,462 | | | | 6,613,089 | |
| Class C | | | 6,972,101 | | | | 13,629,421 | |
| Class I | | | 1,807,015 | | | | 3,124,280 | |
| Class R1 | | | 153,136 | | | | 306,928 | |
| Class R2 | | | 1,758,019 | | | | 3,602,635 | |
| Class R3 | | | 2,424,036 | | | | 4,588,957 | |
| Class R4 | | | 1,968,857 | | | | 5,172,503 | |
| Class R5 | | | 7,366 | | | | 924 | |
| Class 529A | | | 171,222 | | | | 292,028 | |
| Class 529B | | | 24,260 | | | | 62,365 | |
| Class 529C | | | 56,444 | | | | 99,477 | |
| Total | | | $71,464,129 | | | | $141,501,529 | |
| (i) | For Class R5, the period is from inception, June 1, 2012, through the stated period end. |
(3) Transactions with Affiliates
Investment Adviser – The fund has an investment advisory agreement with MFS to provide overall investment management and related administrative services and facilities to the fund.
43
Notes to Financial Statements (unaudited) – continued
The management fee is computed daily and paid monthly at the following annual rates:
| | | | |
| First $6.3 billion of average daily net assets | | | 0.35 | % |
| Average daily net assets in excess of $6.3 billion | | | 0.34 | % |
The management fee incurred for the six months ended March 31, 2013 was equivalent to an annual effective rate of 0.35% of the fund’s average daily net assets.
Prior to December 1, 2012, MFS agreed to the following expense reimbursement arrangement. If at the end of any month, the fund’s fiscal year-to-date average daily net assets exceeded $11.5 billion and the total expenses for Class A exceeded 0.87% of fiscal year-to-date average daily net assets, MFS agreed in writing to reimburse Class A expenses such that Class A total expenses for the fund year-to-date were no greater than 0.87% of fiscal year-to-date average daily net assets, and to reduce the total expenses of the other share classes by the same percentage. If at the end of any month, the fund’s fiscal year-to-date average daily net assets exceeded $12.5 billion and the total expenses for Class A exceeded 0.85% of fiscal year-to-date average daily net assets, MFS agreed in writing to reimburse Class A expenses such that Class A total expenses for the fund year-to-date were no greater than 0.85% of fiscal year-to-date average daily net assets, and to reduce the total expenses of the other share classes by the same percentage. This written agreement excluded interest, taxes, extraordinary expenses, brokerage and transaction costs, and investment-related expenses, and the agreement terminated on November 30, 2012. For the period from October 1, 2012 through November 30, 2012, the fund’s fiscal year-to-date average daily net assets did not exceed the limits and therefore, the investment adviser did not pay any portion of the fund’s expenses.
Distributor – MFS Fund Distributors, Inc. (MFD), a wholly-owned subsidiary of MFS, as distributor, received $398,440 and $4,722 for the six months ended March 31, 2013, as its portion of the initial sales charge on sales of Class A and Class 529A shares of the fund, respectively.
The Board of Trustees has adopted a distribution plan for certain class shares pursuant to Rule 12b-1 of the Investment Company Act of 1940.
The fund’s distribution plan provides that the fund will pay MFD for services provided by MFD and financial intermediaries in connection with the distribution and servicing of certain share classes. One component of the plan is a distribution fee paid to MFD and another component of the plan is a service fee paid to MFD. MFD may subsequently pay all, or a portion, of the distribution and/or service fees to financial intermediaries.
44
Notes to Financial Statements (unaudited) – continued
Distribution Plan Fee Table:
| | | | | | | | | | | | | | | | | | | | |
| | | Distribution
Fee Rate (d) | | | Service
Fee Rate (d) | | | Total
Distribution
Plan (d) | | | Annual
Effective
Rate (e) | | | Distribution
and Service
Fee | |
| Class A | | | — | | | | 0.25% | | | | 0.25% | | | | 0.25% | | | | $5,152,859 | |
| Class B | | | 0.75% | | | | 0.25% | | | | 1.00% | | | | 1.00% | | | | 1,601,721 | |
| Class C | | | 0.75% | | | | 0.25% | | | | 1.00% | | | | 1.00% | | | | 3,832,684 | |
| Class R1 | | | 0.75% | | | | 0.25% | | | | 1.00% | | | | 1.00% | | | | 84,625 | |
| Class R2 | | | 0.25% | | | | 0.25% | | | | 0.50% | | | | 0.50% | | | | 378,534 | |
| Class R3 | | | — | | | | 0.25% | | | | 0.25% | | | | 0.25% | | | | 235,629 | |
| Class 529A | | | — | | | | 0.25% | | | | 0.25% | | | | 0.25% | | | | 16,770 | |
| Class 529B | | | 0.75% | | | | 0.25% | | | | 1.00% | | | | 1.00% | | | | 14,165 | |
| Class 529C | | | 0.75% | | | | 0.25% | | | | 1.00% | | | | 1.00% | | | | 31,468 | |
| Total Distribution and Service Fees | | | | $11,348,455 | |
| (d) | In accordance with the distribution plan for certain classes, the fund pays distribution and/or service fees equal to these annual percentage rates of each class’s average daily net assets. The distribution and service fee rates disclosed by class represent the current rates in effect at the end of the reporting period. |
| (e) | The annual effective rates represent actual fees incurred under the distribution plan for the six months ended March 31, 2013 based on each class’s average daily net assets. |
Certain Class A shares are subject to a contingent deferred sales charge (CDSC) in the event of a shareholder redemption within 18 months of purchase for shares purchased on or after August 1, 2012, and within 24 months of purchase for shares purchased prior to August 1, 2012. Class C and Class 529C shares are subject to a CDSC in the event of a shareholder redemption within 12 months of purchase. Class B and Class 529B shares are subject to a CDSC in the event of a shareholder redemption within six years of purchase. All contingent deferred sales charges are paid to MFD and during the six months ended March 31, 2013, were as follows:
| | | | |
| | | Amount | |
| Class A | | | $1,346 | |
| Class B | | | 143,070 | |
| Class C | | | 13,678 | |
| Class 529B | | | 252 | |
| Class 529C | | | 41 | |
The fund has entered into and may from time to time enter into contracts with program managers and other parties which administer the tuition programs through which an investment in the fund’s 529 share classes is made. The fund has entered into an agreement with MFD pursuant to which MFD receives an annual fee of up to 0.10% of the average daily net assets attributable to each 529 share class. MFD has agreed to waive a portion of this fee in an amount equal to 0.05% of the average daily net assets for each 529 share class. This waiver agreement will continue until modified by the fund’s Board of Trustees but such agreement will continue at least until January 31, 2014, after which MFD may eliminate this waiver without a vote of the fund’s Board of Trustees. For the six months ended March 31, 2013, this waiver amounted to $5,632 and is reflected as a reduction of total expenses in the Statement of Operations. The program manager fee incurred for the six months ended March 31,
45
Notes to Financial Statements (unaudited) – continued
2013 was equivalent to an annual effective rate of 0.05% of the average daily net assets attributable to each 529 share class. The services provided by MFD, or a third party with which MFD contracts, include recordkeeping and tax reporting and account services, as well as services designed to maintain the program’s compliance with the Internal Revenue Code and other regulatory requirements. Program manager fees and waivers for the six months ended March 31, 2013, were as follows:
| | | | | | | | |
| | | Fee | | | Waiver | |
| Class 529A | | | $6,708 | | | | $3,354 | |
| Class 529B | | | 1,415 | | | | 707 | |
Class 529C | | | 3,143 | | | | 1,571 | |
| Total Program Manager Fees and Waivers | | | $11,266 | | | | $5,632 | |
Shareholder Servicing Agent – MFS Service Center, Inc. (MFSC), a wholly-owned subsidiary of MFS, receives a fee from the fund for its services as shareholder servicing agent calculated as a percentage of the average daily net assets of the fund as determined periodically under the supervision of the fund’s Board of Trustees. For the six months ended March 31, 2013, the fee was $920,158, which equated to 0.0314% annually of the fund’s average daily net assets. MFSC also receives payment from the fund for out-of-pocket expenses, sub-accounting and other shareholder servicing costs which may be paid to affiliated and unaffiliated service providers. Class R5 shares do not incur sub-accounting fees. For the six months ended March 31, 2013, these out-of-pocket expenses, sub-accounting and other shareholder servicing costs amounted to $3,019,068.
Administrator – MFS provides certain financial, legal, shareholder communications, compliance, and other administrative services to the fund. Under an administrative services agreement, the fund partially reimburses MFS the costs incurred to provide these services. The fund is charged an annual fixed amount of $17,500 plus a fee based on average daily net assets. The administrative services fee incurred for the six months ended March 31, 2013 was equivalent to an annual effective rate of 0.0089% of the fund’s average daily net assets.
Trustees’ and Officers’ Compensation – The fund pays compensation to independent Trustees in the form of a retainer, attendance fees, and additional compensation to Board and Committee chairpersons. The fund does not pay compensation directly to Trustees or officers of the fund who are also officers of the investment adviser, all of whom receive remuneration for their services to the fund from MFS. Certain officers and Trustees of the fund are officers or directors of MFS, MFD, and MFSC.
Prior to December 31, 2001, the fund had an unfunded defined benefit plan (“DB plan”) for independent Trustees. As of December 31, 2001, the Board took action to terminate the DB plan with respect to then-current and any future independent Trustees, such that the DB plan covers only certain of those former independent Trustees who retired on or before December 31, 2001. Effective January 1, 2002, accrued benefits under the DB plan for then-current independent Trustees who continued were credited to an unfunded retirement deferral plan (the “Retirement Deferral plan”), which was established for and exists solely with respect to these credited amounts, and is not available for other deferrals by these or other
46
Notes to Financial Statements (unaudited) – continued
independent Trustees. Although the Retirement Deferral plan is unfunded, amounts deferred under the plan are periodically adjusted for investment experience as if they had been invested in shares of the fund. The DB plan resulted in a pension expense of $1,876 and the Retirement Deferral plan resulted in an expense of $4,406. Both amounts are included in independent Trustees’ compensation for the six months ended March 31, 2013. The liability for deferred retirement benefits payable to certain independent Trustees under both plans amounted to $95,386 at March 31, 2013, and is included in “Payable for independent Trustees’ compensation” in the Statement of Assets and Liabilities.
Deferred Trustee Compensation – Under a Deferred Compensation Plan (the “Plan”), independent Trustees previously were allowed to elect to defer receipt of all or a portion of their annual compensation. Effective January 1, 2005, the Board elected to no longer allow Trustees to defer receipt of future compensation under the Plan. Amounts deferred under the Plan are invested in shares of certain MFS Funds selected by the independent Trustees as notional investments. Deferred amounts represent an unsecured obligation of the fund until distributed in accordance with the Plan. Included in “Other assets” and “Payable for independent Trustees’ compensation” in the Statement of Assets and Liabilities is $46,713 of deferred Trustees’ compensation. There is no current year expense associated with the Plan.
Other – This fund and certain other funds managed by MFS (the funds) have entered into services agreements (the Agreements) which provide for payment of fees by the funds to Tarantino LLC and Griffin Compliance LLC in return for the provision of services of an Independent Chief Compliance Officer (ICCO) and Assistant ICCO, respectively, for the funds. The ICCO and Assistant ICCO are officers of the funds and the sole members of Tarantino LLC and Griffin Compliance LLC, respectively. The funds can terminate the Agreements with Tarantino LLC and Griffin Compliance LLC at any time under the terms of the Agreements. For the six months ended March 31, 2013, the aggregate fees paid by the fund to Tarantino LLC and Griffin Compliance LLC were $21,566 and are included in “Miscellaneous” expense in the Statement of Operations. MFS has agreed to reimburse the fund for a portion of the payments made by the fund in the amount of $5,794, which is shown as a reduction of total expenses in the Statement of Operations. Additionally, MFS has agreed to bear all expenses associated with office space, other administrative support, and supplies provided to the ICCO and Assistant ICCO.
The fund invests in the MFS Institutional Money Market Portfolio which is managed by MFS and seeks current income consistent with preservation of capital and liquidity. Income earned on this investment is included in “Dividends from underlying affiliated funds” in the Statement of Operations. This money market fund does not pay a management fee to MFS.
On May 31, 2012, MFS purchased 6,993 shares of Class R5 for an aggregate amount of $100,000.
47
Notes to Financial Statements (unaudited) – continued
(4) Portfolio Securities
Purchases and sales of investments, other than short-term obligations, were as follows:
| | | | | | | | |
| | | Purchases | | | Sales | |
| U.S. Government securities | | | $517,752,920 | | | | $505,482,995 | |
| Investments (non-U.S. Government securities) | | | $415,119,586 | | | | $683,737,613 | |
(5) Shares of Beneficial Interest
The fund’s Declaration of Trust permits the Trustees to issue an unlimited number of full and fractional shares of beneficial interest. Transactions in fund shares were as follows:
| | | | | | | | | | | | | | | | |
| | | Six months ended
3/31/13 | | | Year ended
9/30/12 (i) | |
| | | Shares | | | Amount | | | Shares | | | Amount | |
| Shares sold | | | | | | | | | | | | | | | | |
Class A | | | 11,529,184 | | | | $179,284,226 | | | | 25,488,736 | | | | $369,916,614 | |
Class B | | | 750,092 | | | | 11,644,823 | | | | 2,091,735 | | | | 30,290,673 | |
Class C | | | 2,479,922 | | | | 38,756,910 | | | | 4,667,416 | | | | 68,045,787 | |
Class I | | | 1,247,794 | | | | 19,428,105 | | | | 2,460,682 | | | | 36,073,366 | |
Class R1 | | | 82,117 | | | | 1,275,917 | | | | 191,551 | | | | 2,775,941 | |
Class R2 | | | 857,992 | | | | 13,345,361 | | | | 2,056,849 | | | | 29,904,091 | |
Class R3 | | | 1,039,725 | | | | 16,154,341 | | | | 3,346,654 | | | | 48,266,307 | |
Class R4 | | | 1,954,059 | | | | 30,208,068 | | | | 2,334,603 | | | | 33,863,591 | |
Class R5 | | | 91,059 | | | | 1,435,866 | | | | 6,993 | | | | 100,000 | |
Class 529A | | | 96,114 | | | | 1,493,969 | | | | 211,036 | | | | 3,047,914 | |
Class 529B | | | 8,010 | | | | 124,600 | | | | 13,964 | | | | 203,047 | |
Class 529C | | | 40,792 | | | | 630,693 | | | | 74,535 | | | | 1,079,248 | |
| | | 20,176,860 | | | | $313,782,879 | | | | 42,944,754 | | | | $623,566,579 | |
| | | |
Shares issued to shareholders in
reinvestment of distributions | | | | | | | | | | | | | |
Class A | | | 3,127,294 | | | | $48,432,157 | | | | 6,412,590 | | | | $93,177,116 | |
Class B | | | 170,181 | | | | 2,633,522 | | | | 408,630 | | | | 5,924,742 | |
Class C | | | 332,213 | | | | 5,168,609 | | | | 673,218 | | | | 9,819,198 | |
Class I | | | 90,713 | | | | 1,407,591 | | | | 161,420 | | | | 2,343,898 | |
Class R1 | | | 9,907 | | | | 153,136 | | | | 21,158 | | | | 306,920 | |
Class R2 | | | 101,054 | | | | 1,568,716 | | | | 219,199 | | | | 3,191,107 | |
Class R3 | | | 156,419 | | | | 2,423,550 | | | | 315,307 | | | | 4,588,831 | |
Class R4 | | | 116,043 | | | | 1,801,424 | | | | 314,069 | | | | 4,537,612 | |
Class R5 | | | 462 | | | | 7,366 | | | | 62 | | | | 924 | |
Class 529A | | | 11,060 | | | | 171,089 | | | | 20,107 | | | | 291,955 | |
Class 529B | | | 1,569 | | | | 24,260 | | | | 4,310 | | | | 62,365 | |
Class 529C | | | 3,628 | | | | 56,434 | | | | 6,822 | | | | 99,477 | |
| | | 4,120,543 | | | | $63,847,854 | | | | 8,556,892 | | | | $124,344,145 | |
48
Notes to Financial Statements (unaudited) – continued
| | | | | | | | | | | | | | | | |
| | | Six months ended
3/31/13 | | | Year ended
9/30/12 (i) | |
| | | Shares | | | Amount | | | Shares | | | Amount | |
| Shares reacquired | | | | | | | | | | | | | | | | |
Class A | | | (25,315,375 | ) | | | $(391,482,116 | ) | | | (54,296,938 | ) | | | $(784,852,589 | ) |
Class B | | | (4,316,402 | ) | | | (67,297,476 | ) | | | (10,147,219 | ) | | | (146,830,880 | ) |
Class C | | | (4,358,704 | ) | | | (67,670,344 | ) | | | (10,390,591 | ) | | | (150,858,415 | ) |
Class I | | | (780,859 | ) | | | (12,094,589 | ) | | | (2,923,606 | ) | | | (41,541,457 | ) |
Class R1 | | | (229,618 | ) | | | (3,530,116 | ) | | | (205,526 | ) | | | (2,962,496 | ) |
Class R2 | | | (1,538,501 | ) | | | (23,780,552 | ) | | | (3,562,686 | ) | | | (51,712,763 | ) |
Class R3 | | | (2,306,748 | ) | | | (35,862,354 | ) | | | (2,624,171 | ) | | | (38,159,548 | ) |
Class R4 | | | (793,692 | ) | | | (12,295,881 | ) | | | (14,766,924 | ) | | | (209,530,428 | ) |
Class R5 | | | (1,173 | ) | | | (18,555 | ) | | | — | | | | — | |
Class 529A | | | (67,570 | ) | | | (1,037,974 | ) | | | (111,065 | ) | | | (1,598,587 | ) |
Class 529B | | | (51,190 | ) | | | (797,053 | ) | | | (118,532 | ) | | | (1,721,335 | ) |
Class 529C | | | (27,832 | ) | | | (432,367 | ) | | | (70,801 | ) | | | (1,028,388 | ) |
| | | (39,787,664 | ) | | | $(616,299,377 | ) | | | (99,218,059 | ) | | | $(1,430,796,886 | ) |
| | | | |
| Net change | | | | | | | | | | | | | | | | |
Class A | | | (10,658,897 | ) | | | $(163,765,733 | ) | | | (22,395,612 | ) | | | $(321,758,859 | ) |
Class B | | | (3,396,129 | ) | | | (53,019,131 | ) | | | (7,646,854 | ) | | | (110,615,465 | ) |
Class C | | | (1,546,569 | ) | | | (23,744,825 | ) | | | (5,049,957 | ) | | | (72,993,430 | ) |
Class I | | | 557,648 | | | | 8,741,107 | | | | (301,504 | ) | | | (3,124,193 | ) |
Class R1 | | | (137,594 | ) | | | (2,101,063 | ) | | | 7,183 | | | | 120,365 | |
Class R2 | | | (579,455 | ) | | | (8,866,475 | ) | | | (1,286,638 | ) | | | (18,617,565 | ) |
Class R3 | | | (1,110,604 | ) | | | (17,284,463 | ) | | | 1,037,790 | | | | 14,695,590 | |
Class R4 | | | 1,276,410 | | | | 19,713,611 | | | | (12,118,252 | ) | | | (171,129,225 | ) |
Class R5 | | | 90,348 | | | | 1,424,677 | | | | 7,055 | | | | 100,924 | |
Class 529A | | | 39,604 | | | | 627,084 | | | | 120,078 | | | | 1,741,282 | |
Class 529B | | | (41,611 | ) | | | (648,193 | ) | | | (100,258 | ) | | | (1,455,923 | ) |
Class 529C | | | 16,588 | | | | 254,760 | | | | 10,556 | | | | 150,337 | |
| | | (15,490,261 | ) | | | $(238,668,644 | ) | | | (47,716,413 | ) | | | $(682,886,162 | ) |
| (i) | For Class R5, the period is from inception, June 1, 2012, through the stated period end. |
(6) Line of Credit
The fund and certain other funds managed by MFS participate in a $1.1 billion unsecured committed line of credit, subject to a $1 billion sublimit, provided by a syndication of banks under a credit agreement. Borrowings may be made for temporary financing needs. Interest is charged to each fund, based on its borrowings, generally at a rate equal to the higher of the Federal Reserve funds rate or one month LIBOR plus an agreed upon spread. A commitment fee, based on the average daily, unused portion of the committed line of credit, is allocated among the participating funds at the end of each calendar quarter. In addition, the fund and other funds managed by MFS have established unsecured uncommitted borrowing arrangements with certain banks for temporary financing needs. Interest is charged to each fund, based on its borrowings, at a rate equal to the Federal Reserve funds rate plus an agreed upon spread. For the six months ended March 31, 2013, the fund’s
49
Notes to Financial Statements (unaudited) – continued
commitment fee and interest expense were $18,031 and $0, respectively, and are included in “Miscellaneous” expense in the Statement of Operations.
(7) Transactions in Underlying Affiliated Funds-Affiliated Issuers
An affiliated issuer may be considered one in which the fund owns 5% or more of the outstanding voting securities, or a company which is under common control. For the purposes of this report, the fund assumes the following to be an affiliated issuer:
| | | | | | | | | | | | | | | | |
| Underlying Affiliated Fund | | Beginning
Shares/Par
Amount | | | Acquisitions
Shares/Par
Amount | | | Dispositions
Shares/Par
Amount | | | Ending
Shares/Par
Amount | |
MFS Institutional Money
Market Portfolio | | | 119,222,920 | | | | 404,067,193 | | | | (320,971,433 | ) | | | 202,318,680 | |
| | | | |
| Underlying Affiliated Fund | | Realized
Gain (Loss) | | | Capital Gain
Distributions | | | Dividend
Income | | | Ending
Value | |
MFS Institutional Money
Market Portfolio | | | $— | | | | $— | | | | $113,794 | | | | $202,318,680 | |
50
BOARD REVIEW OF INVESTMENT ADVISORY AGREEMENT
A discussion regarding the Board’s most recent review and renewal of the fund’s Investment Advisory Agreement with MFS is available by clicking on the fund’s name under “Mutual Funds” in the “Products” section of the MFS Web site (mfs.com).
PROXY VOTING POLICIES AND INFORMATION
A general description of the MFS funds’ proxy voting policies and procedures is available without charge, upon request, by calling 1-800-225-2606, by visiting the Proxy Voting section of mfs.com or by visiting the SEC’s Web site at http://www.sec.gov.
Information regarding how the fund voted proxies relating to portfolio securities during the most recent twelve-month period ended June 30 is available without charge by visiting the Proxy Voting section of mfs.com or by visiting the SEC’s Web site at http://www.sec.gov.
QUARTERLY PORTFOLIO DISCLOSURE
The fund will file a complete schedule of portfolio holdings with the Securities and Exchange Commission (the Commission) for the first and third quarters of each fiscal year on Form N-Q. A shareholder can obtain the quarterly portfolio holdings report at mfs.com. The fund’s Form N-Q is also available on the EDGAR database on the Commission’s Internet Web site at http://www.sec.gov, and may be reviewed and copied at the:
Public Reference Room
Securities and Exchange Commission
100 F Street, NE, Room 1580
Washington, D.C. 20549
Information on the operation of the Public Reference Room may be obtained by calling the Commission at 1-800-SEC-0330. Copies of the fund’s Form N-Q also may be obtained, upon payment of a duplicating fee, by electronic request at the following e-mail address: publicinfo@sec.gov, or by writing the Public Reference Section at the above address.
FURTHER INFORMATION
From time to time, MFS may post important information about the fund or the MFS funds on the MFS web site (mfs.com). This information is available by visiting the “News & Commentary” section of mfs.com or by clicking on the fund’s name under “Mutual Funds” in the “Products” section of mfs.com.
PROVISION OF FINANCIAL REPORTS AND SUMMARY PROSPECTUSES
The fund produces financial reports every six months and updates its summary prospectus and prospectus annually. To avoid sending duplicate copies of materials to households, only one copy of the fund’s annual and semiannual report and summary prospectus may be mailed to shareholders having the same last name and residential address on the fund’s records. However, any shareholder may contact MFSC (please see back cover for address and telephone number) to request that copies of these reports and summary prospectuses be sent personally to that shareholder.
51
Save paper with eDelivery.

| MFS® will send you prospectuses, |
reports, and proxies directly via e-mail so you will get information faster with less mailbox clutter.
To sign up:
1. Go to mfs.com.
2. Log in via MFS® Access.
3. Select eDelivery.
If you own your MFS fund shares through a financial institution or a retirement plan, MFS® TALK, MFS® Access, or eDelivery may not be available to you.
CONTACT
WEB SITE
mfs.com
MFS TALK
1-800-637-8255
24 hours a day
ACCOUNT SERVICE AND LITERATURE
Shareholders
1-800-225-2606
Financial advisors
1-800-343-2829
Retirement plan services
1-800-637-1255
MAILING ADDRESS
MFS Service Center, Inc.
P.O. Box 55824
Boston, MA 02205-5824
OVERNIGHT MAIL
MFS Service Center, Inc.
c/o Boston Financial Data Services
30 Dan Road
Canton, MA 02021-2809
During the period covered by this report, the Registrant has not amended any provision in its Code of Ethics (the “Code”) that relates to an element of the Code’s definitions enumerated in paragraph (b) of Item 2 of this Form N-CSR. During the period covered by this report, the Registrant did not grant a waiver, including an implicit waiver, from any provision of the Code.
| ITEM 3. | AUDIT COMMITTEE FINANCIAL EXPERT. |
Not applicable for semi-annual reports.
| ITEM 4. | PRINCIPAL ACCOUNTANT FEES AND SERVICES. |
Not applicable for semi-annual reports.
| ITEM 5. | AUDIT COMMITTEE OF LISTED REGISTRANTS. |
Not applicable to the Registrant.
A schedule of investments for each series of the Registrant is included as part of the report to shareholders of such series under Item 1 of this Form N-CSR.
| ITEM 7. | DISCLOSURE OF PROXY VOTING POLICIES AND PROCEDURES FOR CLOSED-END MANAGEMENT INVESTMENT COMPANIES. |
Not applicable to the Registrant.
| ITEM 8. | PORTFOLIO MANAGERS OF CLOSED-END MANAGEMENT INVESTMENT COMPANIES. |
Not applicable to the Registrant.
| ITEM 9. | PURCHASES OF EQUITY SECURITIES BY CLOSED-END MANAGEMENT INVESTMENT COMPANY AND AFFILIATED PURCHASERS. |
Not applicable to the Registrant.
| ITEM 10. | SUBMISSION OF MATTERS TO A VOTE OF SECURITY HOLDERS. |
There were no material changes to the procedures by which shareholders may send recommendations to the Board for nominees to the Registrant’s Board since the Registrant last provided disclosure as to such procedures in response to the requirements of Item 407 (c)(2)(iv) of Regulation S-K or this Item.
| ITEM 11. | CONTROLS AND PROCEDURES. |
| (a) | Based upon their evaluation of the effectiveness of the registrant’s disclosure controls and procedures (as defined in Rule 30a-3(c) under the Investment Company Act of 1940 (the “Act”)) as conducted within 90 days of the filing date of this report on Form N-CSR, the registrant’s principal financial officer and principal executive officer have concluded that those disclosure controls and procedures provide reasonable assurance that the material information required to be disclosed by the registrant on this report is recorded, processed, summarized and reported within the time periods specified in the Securities and Exchange Commission’s rules and forms. |
| (b) | There were no changes in the registrant’s internal controls over financial reporting (as defined in Rule 30a-3(d) under the Act) that occurred during the second fiscal quarter of the period covered by the report that have materially affected, or are reasonably likely to materially affect, the registrant’s internal control over financial reporting. |
| (a) | File the exhibits listed below as part of this form. Letter or number the exhibits in the sequence indicated. |
| | (1) | Any code of ethics, or amendment thereto, that is the subject of the disclosure required by Item 2, to the extent that the registrant intends to satisfy the Item 2 requirements through filing of an exhibit. |
| | (2) | A separate certification for each principal executive officer and principal financial officer of the registrant as required by Rule 30a-2(a) under the Act (17 CFR 270.30a-2): Attached hereto. |
| (b) | If the report is filed under Section 13(a) or 15(d) of the Exchange Act, provide the certifications required by Rule 30a-2(b) under the Act (17 CFR 270.30a-2(b)), Rule 13a-14(b) or Rule 15d-14(b) under the Exchange Act (17 CFR 240.13a-14(b) or 240.15d-14(b)) and Section 1350 of Chapter 63 of Title 18 of the United States Code (18 U.S.C. 1350) as an exhibit. A certification furnished pursuant to this paragraph will not be deemed “filed” for the purposes of Section 18 of the Exchange Act (15 U.S.C. 78r), or otherwise subject to the liability of that section. Such certification will not be deemed to be incorporated by reference into any filing under the Securities Act of 1933 or the Exchange Act, except to the extent that the registrant specifically incorporates it by reference: Attached hereto. |
Notice
A copy of the Amended and Restated Declaration of Trust, as amended, of the Registrant is on file with the Secretary of State of The Commonwealth of Massachusetts and notice is hereby given that this instrument is executed on behalf of the Registrant by an officer of the Registrant as an officer and not individually and the obligations of or arising out of this instrument are not binding upon any of the Trustees or shareholders individually, but are binding only upon the assets and property of the respective constituent series of the Registrant.
SIGNATURES
Pursuant to the requirements of the Securities Exchange Act of 1934 and the Investment Company Act of 1940, the registrant has duly caused this report to be signed on its behalf by the undersigned, thereunto duly authorized.
(Registrant) MFS SERIES TRUST V
| | |
| By (Signature and Title)* | | JOHN M. CORCORAN |
| | John M. Corcoran, President |
Date: May 15, 2013
Pursuant to the requirements of the Securities Exchange Act of 1934 and the Investment Company Act of 1940, this report has been signed below by the following persons on behalf of the registrant and in the capacities and on the dates indicated.
| | |
| By (Signature and Title)* | | JOHN M. CORCORAN |
| | John M. Corcoran, President (Principal Executive Officer) |
Date: May 15, 2013
| | |
| By (Signature and Title)* | | DAVID L. DILORENZO |
| | David L. DiLorenzo, Treasurer |
| | (Principal Financial Officer and Accounting Officer) |
Date: May 15, 2013
| * | Print name and title of each signing officer under his or her signature. |