UNITED STATES
SECURITIES AND EXCHANGE COMMISSION
Washington, D.C. 20549
FORM N-CSR
CERTIFIED SHAREHOLDER REPORT OF
REGISTERED MANAGEMENT INVESTMENT COMPANIES
Investment Company Act file number 811-02031
MFS SERIES TRUST V
(Exact name of registrant as specified in charter)
111 Huntington Avenue, Boston, Massachusetts 02199
(Address of principal executive offices) (Zip code)
Kristin V. Collins
Massachusetts Financial Services Company
111 Huntington Avenue, Boston, Massachusetts 02199
(Name and address of agents for service)
Registrant’s telephone number, including area code: (617) 954-5000
Date of fiscal year end: September 30
Date of reporting period: March 31, 2016
| ITEM 1. | REPORTS TO STOCKHOLDERS. |
SEMIANNUAL REPORT
March 31, 2016

MFS® INTERNATIONAL NEW DISCOVERY FUND

MIO-SEM
MFS® INTERNATIONAL NEW DISCOVERY FUND
CONTENTS
The report is prepared for the general information of shareholders.
It is authorized for distribution to prospective investors only when preceded or accompanied by a current prospectus.
NOT FDIC INSURED • MAY LOSE VALUE • NO BANK GUARANTEE

LETTER FROM THE CHAIRMAN
Dear Shareholders:
Markets remained volatile in the first quarter of 2016, but after a tough start to the year stocks largely recouped their losses, with most major indices closing out the
quarter roughly where they were at the beginning of the year. After falling to multiyear lows in February, oil prices stabilized as oil-producing nations began taking steps to cap crude production. U.S. economic growth remained positive but unspectacular amid continued improvement in labor markets and upbeat service-sector activity. Headwinds from abroad forced the U.S. Federal Reserve to table its plans to tighten monetary policy, while the Bank of Japan and the European Central Bank continued to ease policy aggressively, perpetuating a lower-for-longer global interest rate environment.
China’s economy — while suffering growing pains linked to its shift from an export-led to a consumer-driven economic model — appeared to stabilize as the first quarter drew to a close. Europe awaits a crucial referendum scheduled for June 23 in which British voters will decide whether the United Kingdom should remain in the European Union.
As markets have become more focused on short-term trends in recent years, we believe it’s important for investors to lengthen their investment time horizon. At MFS®, we don’t trade on headlines or trends; we invest for the long term.
We believe that this approach, coupled with the professional guidance of a financial advisor, will help you reach your investment goals.
Respectfully,

Robert J. Manning
Chairman
MFS Investment Management
May 16, 2016
The opinions expressed in this letter are subject to change and may not be relied upon for investment advice. No forecasts can be guaranteed.
1
PORTFOLIO COMPOSITION
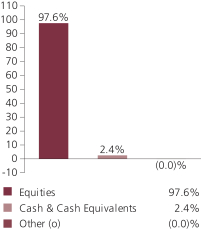
Portfolio structure
| | | | |
| Top ten holdings | | | | |
| Bunzl PLC | | | 3.5% | |
| OBIC Co. Ltd. | | | 1.9% | |
| Amadeus IT Holding S.A. | | | 1.6% | |
| Dollarama, Inc. | | | 1.5% | |
| Domino’s Pizza UK & IRL PLC | | | 1.3% | |
| Croda International PLC | | | 1.3% | |
| Symrise AG | | | 1.3% | |
| Dignity PLC | | | 1.2% | |
| NEXT PLC | | | 1.1% | |
| Compass Group PLC | | | 1.1% | |
| | | | |
| Equity sectors | | | | |
| Special Products & Services | | | 16.3% | |
| Financial Services | | | 14.9% | |
| Retailing | | | 11.6% | |
| Technology | | | 9.2% | |
| Basic Materials | | | 9.1% | |
| Consumer Staples | | | 7.9% | |
| Health Care | | | 5.9% | |
| Leisure | | | 5.8% | |
| Autos & Housing | | | 5.2% | |
| Industrial Goods & Services | | | 5.2% | |
| Utilities & Communications | | | 2.7% | |
| Transportation | | | 2.5% | |
| Energy | | | 1.3% | |
| |
| Issuer country weightings (x) | | | | |
| United Kingdom | | | 26.3% | |
| Japan | | | 18.0% | |
| Germany | | | 7.0% | |
| France | | | 4.9% | |
| United States | | | 3.8% | |
| Hong Kong | | | 3.7% | |
| Canada | | | 3.1% | |
| Denmark | | | 2.6% | |
| Switzerland | | | 2.5% | |
| Other Countries | | | 28.1% | |
2
Portfolio Composition – continued
| | | | |
| Currency exposure weightings (y) | |
| British Pound Sterling | | | 27.2% | |
| Japanese Yen | | | 18.0% | |
| Euro | | | 17.0% | |
| United States Dollar | | | 5.2% | |
| Hong Kong Dollar | | | 4.4% | |
| Canadian Dollar | | | 3.1% | |
| Danish Krone | | | 2.6% | |
| Swiss Franc | | | 2.5% | |
| Australian Dollar | | | 2.5% | |
| Other Currencies | | | 17.5% | |
| (x) | Represents the portfolio’s exposure to issuer countries as a percentage of a portfolio’s net assets. For purposes of this presentation, United States includes Cash & Cash Equivalents and Other. |
| (y) | Represents the portfolio’s exposure to a particular currency as a percentage of a portfolio’s net assets. For purposes of this presentation, United States Dollar includes Cash & Cash Equivalents and Other. |
From time to time Other may be negative due to equivalent exposure from currency derivatives and/or offsets to derivative positions.
Cash & Cash Equivalents includes any cash, investments in money market funds, short-term securities, and other assets less liabilities. Please see the Statement of Assets and Liabilities for additional information related to the fund’s cash position and other assets and liabilities.
Other includes currency derivatives and/or any offsets to derivative positions.
Percentages are based on net assets as of 3/31/16.
The portfolio is actively managed and current holdings may be different.
3
EXPENSE TABLE
Fund expenses borne by the shareholders during the period, October 1, 2015 through March 31, 2016
As a shareholder of the fund, you incur two types of costs: (1) transaction costs, including sales charges (loads) on certain purchase or redemption payments, and (2) ongoing costs, including management fees; distribution and service (12b-1) fees; and other fund expenses. This example is intended to help you understand your ongoing costs (in dollars) of investing in the fund and to compare these costs with the ongoing costs of investing in other mutual funds.
The example is based on an investment of $1,000 invested at the beginning of the period and held for the entire period October 1, 2015 through March 31, 2016.
Actual Expenses
The first line for each share class in the following table provides information about actual account values and actual expenses. You may use the information in this line, together with the amount you invested, to estimate the expenses that you paid over the period. Simply divide your account value by $1,000 (for example, an $8,600 account value divided by $1,000 = 8.6), then multiply the result by the number in the first line under the heading entitled “Expenses Paid During Period” to estimate the expenses you paid on your account during this period.
Hypothetical Example for Comparison Purposes
The second line for each share class in the following table provides information about hypothetical account values and hypothetical expenses based on the fund���s actual expense ratio and an assumed rate of return of 5% per year before expenses, which is not the fund’s actual return. The hypothetical account values and expenses may not be used to estimate the actual ending account balance or expenses you paid for the period. You may use this information to compare the ongoing costs of investing in the fund and other funds. To do so, compare this 5% hypothetical example with the 5% hypothetical examples that appear in the shareholder reports of the other funds.
Please note that the expenses shown in the table are meant to highlight your ongoing costs only and do not reflect any transactional costs, such as sales charges (loads). Therefore, the second line for each share class in the table is useful in comparing ongoing costs only, and will not help you determine the relative total costs of owning different funds. In addition, if these transactional costs were included, your costs would have been higher.
4
Expense Table – continued
| | | | | | | | | | | | | | | | | | |
Share
Class | | | | Annualized
Expense Ratio | | | Beginning
Account Value
10/01/15 | | | Ending Account Value
3/31/16 | | | Expenses
Paid During Period (p)
10/01/15-3/31/16 | |
| A | | Actual | | | 1.33% | | | | $1,000.00 | | | | $1,049.71 | | | | $6.82 | |
| | Hypothetical (h) | | | 1.33% | | | | $1,000.00 | | | | $1,018.35 | | | | $6.71 | |
| B | | Actual | | | 2.08% | | | | $1,000.00 | | | | $1,045.79 | | | | $10.64 | |
| | Hypothetical (h) | | | 2.08% | | | | $1,000.00 | | | | $1,014.60 | | | | $10.48 | |
| C | | Actual | | | 2.08% | | | | $1,000.00 | | | | $1,045.80 | | | | $10.64 | |
| | Hypothetical (h) | | | 2.08% | | | | $1,000.00 | | | | $1,014.60 | | | | $10.48 | |
| I | | Actual | | | 1.08% | | | | $1,000.00 | | | | $1,051.42 | | | | $5.54 | |
| | Hypothetical (h) | | | 1.08% | | | | $1,000.00 | | | | $1,019.60 | | | | $5.45 | |
| R1 | | Actual | | | 2.08% | | | | $1,000.00 | | | | $1,045.93 | | | | $10.64 | |
| | Hypothetical (h) | | | 2.08% | | | | $1,000.00 | | | | $1,014.60 | | | | $10.48 | |
| R2 | | Actual | | | 1.58% | | | | $1,000.00 | | | | $1,048.82 | | | | $8.09 | |
| | Hypothetical (h) | | | 1.58% | | | | $1,000.00 | | | | $1,017.10 | | | | $7.97 | |
| R3 | | Actual | | | 1.33% | | | | $1,000.00 | | | | $1,049.87 | | | | $6.82 | |
| | Hypothetical (h) | | | 1.33% | | | | $1,000.00 | | | | $1,018.35 | | | | $6.71 | |
| R4 | | Actual | | | 1.08% | | | | $1,000.00 | | | | $1,051.38 | | | | $5.54 | |
| | Hypothetical (h) | | | 1.08% | | | | $1,000.00 | | | | $1,019.60 | | | | $5.45 | |
| R5 | | Actual | | | 0.95% | | | | $1,000.00 | | | | $1,051.94 | | | | $4.87 | |
| | Hypothetical (h) | | | 0.95% | | | | $1,000.00 | | | | $1,020.25 | | | | $4.80 | |
| 529A | | Actual | | | 1.34% | | | | $1,000.00 | | | | $1,049.98 | | | | $6.87 | |
| | Hypothetical (h) | | | 1.34% | | | | $1,000.00 | | | | $1,018.30 | | | | $6.76 | |
| 529B | | Actual | | | 1.64% | | | | $1,000.00 | | | | $1,048.29 | | | | $8.40 | |
| | Hypothetical (h) | | | 1.64% | | | | $1,000.00 | | | | $1,016.80 | | | | $8.27 | |
| 529C | | Actual | | | 2.13% | | | | $1,000.00 | | | | $1,046.24 | | | | $10.90 | |
| | Hypothetical (h) | | | 2.13% | | | | $1,000.00 | | | | $1,014.35 | | | | $10.73 | |
| (h) | 5% class return per year before expenses. |
| (p) | “Expenses Paid During Period” are equal to each class’s annualized expense ratio, as shown above, multiplied by the average account value over the period, multiplied by 183/366 (to reflect the one-half year period). Expenses paid do not include any applicable sales charges (loads). If these transaction costs had been included, your costs would have been higher. |
Notes to Expense Table
Each class with a Rule 12b-1 service fee is subject to a rebate of a portion of such fee. Such rebates are included in the expense ratios above. For Class 529A shares, Class 529B shares, and Class 529C shares, this rebate reduced the expense ratios above by 0.05%, 0.02%, and 0.01%, respectively. See Note 3 in the Notes to Financial Statements for additional information.
5
PORTFOLIO OF INVESTMENTS
3/31/16 (unaudited)
The Portfolio of Investments is a complete list of all securities owned by your fund. It is categorized by broad-based asset classes.
| | | | | | | | |
| Common Stocks - 96.4% | | | | | | | | |
| Issuer | | Shares/Par | | | Value ($) | |
| Aerospace - 1.0% | | | | | | | | |
| Cobham PLC | | | 2,610,209 | | | $ | 8,138,889 | |
| Meggitt PLC | | | 2,361,020 | | | | 13,787,867 | |
| MTU Aero Engines AG | | | 155,880 | | | | 14,951,010 | |
| Saab AB, “B” | | | 199,440 | | | | 6,839,417 | |
| Singapore Technologies Engineering Ltd. | | | 552,000 | | | | 1,322,818 | |
| | | | | | | | |
| | | | $ | 45,040,001 | |
| Airlines - 1.0% | | | | | | | | |
| Copa Holdings S.A., “A” (l) | | | 226,597 | | | $ | 15,351,947 | |
| Koninklijke Vopak N.V. | | | 114,209 | | | | 5,687,630 | |
| Stagecoach Group PLC | | | 6,988,526 | | | | 25,313,996 | |
| | | | | | | | |
| | | | $ | 46,353,573 | |
| Alcoholic Beverages - 0.6% | | | | | | | | |
| Carlsberg Group | | | 147,199 | | | $ | 14,026,445 | |
| Davide Campari-Milano S.p.A. | | | 1,242,119 | | | | 12,416,782 | |
| | | | | | | | |
| | | | $ | 26,443,227 | |
| Apparel Manufacturers - 1.9% | | | | | | | | |
| Burberry Group PLC | | | 506,753 | | | $ | 9,934,797 | |
| Christian Dior S.A. | | | 206,742 | | | | 37,499,123 | |
| Gerry Weber International AG (l) | | | 290,814 | | | | 4,080,210 | |
| Global Brands Group Holding Ltd. (a) | | | 79,513,138 | | | | 9,635,036 | |
| Samsonite International S.A. | | | 2,866,200 | | | | 9,606,528 | |
| Stella International Holdings Ltd. | | | 7,507,591 | | | | 17,652,737 | |
| | | | | | | | |
| | | | $ | 88,408,431 | |
| Automotive - 2.4% | | | | | | | | |
| ElringKlinger AG | | | 270,538 | | | $ | 7,414,451 | |
| Ford Otomotiv Sanayi S.A. | | | 290,456 | | | | 3,828,354 | |
| GKN PLC | | | 2,397,446 | | | | 9,944,342 | |
| Koito Manufacturing Co. Ltd. | | | 715,000 | | | | 32,400,373 | |
| NGK Spark Plug Co. Ltd | | | 539,700 | | | | 10,329,324 | |
| Shimano, Inc. | | | 35,100 | | | | 5,501,479 | |
| Stanley Electric Co. Ltd. | | | 922,131 | | | | 20,852,311 | |
| Tofas Turk Otomobil Fabriikasi A.S. | | | 595,860 | | | | 4,834,041 | |
| USS Co. Ltd. | | | 1,161,900 | | | | 18,562,319 | |
| | | | | | | | |
| | | | $ | 113,666,994 | |
6
Portfolio of Investments (unaudited) – continued
| | | | | | | | |
| Issuer | | Shares/Par | | | Value ($) | |
| Common Stocks - continued | | | | | | | | |
| Biotechnology - 0.3% | | | | | | | | |
| Abcam PLC | | | 550,379 | | | $ | 4,663,843 | |
| Lonza Group AG | | | 57,685 | | | | 9,760,646 | |
| | | | | | | | |
| | | | $ | 14,424,489 | |
| Broadcasting - 0.7% | | | | | | | | |
| Havas S.A. | | | 2,199,204 | | | $ | 17,634,935 | |
| Nippon Television Holdings, Inc. | | | 610,800 | | | | 10,078,241 | |
| Proto Corp. (l) | | | 568,700 | | | | 6,998,529 | |
| | | | | | | | |
| | | | $ | 34,711,705 | |
| Brokerage & Asset Managers - 3.7% | | | | | | | | |
| Aberdeen Asset Management PLC | | | 1,839,894 | | | $ | 7,330,427 | |
| Bolsa Mexicana de Valores S.A. de C.V. | | | 3,351,981 | | | | 5,738,886 | |
| CETIP S.A. Mercados Organizados | | | 654,500 | | | | 7,308,324 | |
| Computershare Ltd. | | | 2,298,690 | | | | 17,232,954 | |
| Daiwa Securities Group, Inc. | | | 2,388,000 | | | | 14,689,346 | |
| Hargreaves Lansdown PLC | | | 628,406 | | | | 12,130,246 | |
| IG Group Holdings PLC | | | 1,886,974 | | | | 21,681,331 | |
| Osaka Securities Exchange Co. Ltd. | | | 175,700 | | | | 2,691,428 | |
| Rathbone Brothers PLC | | | 875,165 | | | | 26,546,904 | |
| Schroders PLC | | | 1,156,966 | | | | 44,583,207 | |
| Yuanta Financial Holding Co. Ltd. | | | 40,449,227 | | | | 14,453,334 | |
| | | | | | | | |
| | | | $ | 174,386,387 | |
| Business Services - 13.3% | | | | | | | | |
| Amadeus Fire AG | | | 183,730 | | | $ | 13,902,913 | |
| Amadeus IT Holding S.A. | | | 1,729,808 | | | | 74,187,054 | |
| Ashtead Group PLC | | | 521,672 | | | | 6,473,532 | |
| Babcock International Group PLC | | | 1,263,922 | | | | 17,236,349 | |
| Brenntag AG | | | 506,043 | | | | 28,906,481 | |
| Bunzl PLC | | | 5,784,905 | | | | 168,082,364 | |
| Capgemini | | | 116,201 | | | | 10,919,150 | |
| Cerved Information Solutions S.p.A. | | | 3,634,415 | | | | 29,900,393 | |
| Cognizant Technology Solutions Corp., “A” (a) | | | 402,726 | | | | 25,250,920 | |
| Compass Group PLC | | | 2,903,853 | | | | 51,215,690 | |
| CTS Eventim AG | | | 270,894 | | | | 9,625,115 | |
| DKSH Holding Ltd. | | | 50,944 | | | | 3,483,509 | |
| Edenred | | | 303,993 | | | | 5,904,746 | |
| Electrocomponents PLC | | | 1,448,122 | | | | 5,020,795 | |
| Elior Participations SCA | | | 912,524 | | | | 20,009,217 | |
| Exova Group PLC | | | 3,324,060 | | | | 7,626,754 | |
| Intertek Group PLC | | | 749,438 | | | | 34,088,964 | |
| LSL Property Services PLC | | | 638,016 | | | | 2,634,508 | |
| Meitec Corp. | | | 138,300 | | | | 4,835,492 | |
7
Portfolio of Investments (unaudited) – continued
| | | | | | | | |
| Issuer | | Shares/Par | | | Value ($) | |
| Common Stocks - continued | | | | | | | | |
| Business Services - continued | | | | | | | | |
| MITIE Group PLC | | | 2,284,803 | | | $ | 8,433,579 | |
| Nomura Research Institute Ltd. | | | 815,980 | | | | 27,478,468 | |
| Premier Farnell PLC | | | 2,240,743 | | | | 3,628,596 | |
| Sodexo | | | 371,989 | | | | 40,102,141 | |
| Travis Perkins PLC | | | 386,837 | | | | 10,150,714 | |
| Zoopla Property Group PLC | | | 5,707,524 | | | | 20,493,578 | |
| | | | | | | | |
| | | | $ | 629,591,022 | |
| Cable TV - 0.7% | | | | | | | | |
| Astro Malaysia Holdings Berhad | | | 1,812,926 | | | $ | 1,389,376 | |
| Eutelsat Communications | | | 534,604 | | | | 17,270,372 | |
| SES S.A. | | | 520,234 | | | | 15,234,457 | |
| | | | | | | | |
| | | | $ | 33,894,205 | |
| Chemicals - 0.7% | | | | | | | | |
| Orica Ltd. | | | 1,853,723 | | | $ | 21,840,329 | |
| Victrex PLC | | | 478,278 | | | | 11,320,553 | |
| | | | | | | | |
| | | | $ | 33,160,882 | |
| Computer Software - 2.3% | | | | | | | | |
| OBIC Business Consultants Co. Ltd. | | | 341,400 | | | $ | 14,515,074 | |
| OBIC Co. Ltd. | | | 1,718,500 | | | | 90,853,214 | |
| Totvs S.A. | | | 625,528 | | | | 4,731,929 | |
| | | | | | | | |
| | | | $ | 110,100,217 | |
| Computer Software - Systems - 2.1% | | | | | | | | |
| Brother Industries Ltd. | | | 1,293,000 | | | $ | 14,866,427 | |
| EPAM Systems, Inc. (a) | | | 378,448 | | | | 28,258,712 | |
| Globant S.A. (a) | | | 268,532 | | | | 8,286,898 | |
| Konica Minolta, Inc. | | | 1,102,000 | | | | 9,360,807 | |
| Linx S.A. | | | 494,000 | | | | 6,586,392 | |
| NEC Corp. | | | 1,628,000 | | | | 4,093,687 | |
| Temenos Group AG | | | 247,278 | | | | 13,526,933 | |
| Venture Corp. Ltd. | | | 2,177,000 | | | | 13,502,779 | |
| | | | | | | | |
| | | | $ | 98,482,635 | |
| Conglomerates - 1.3% | | | | | | | | |
| DCC PLC | | | 470,603 | | | $ | 41,568,068 | |
| First Pacific Co. Ltd. | | | 20,751,150 | | | | 15,488,428 | |
| Smiths Group PLC | | | 335,505 | | | | 5,184,911 | |
| | | | | | | | |
| | | | $ | 62,241,407 | |
| Construction - 2.6% | | | | | | | | |
| Bellway PLC | | | 1,231,437 | | | $ | 46,391,725 | |
| DuluxGroup Ltd. | | | 2,762,757 | | | | 13,299,729 | |
8
Portfolio of Investments (unaudited) – continued
| | | | | | | | |
| Issuer | | Shares/Par | | | Value ($) | |
| Common Stocks - continued | | | | | | | | |
| Construction - continued | | | | | | | | |
| Elementia S.A. de C.V. (a) | | | 4,814,700 | | | $ | 5,802,002 | |
| Geberit AG | | | 68,221 | | | | 25,491,972 | |
| Semen Indonesia Persero Tbk PT | | | 4,281,720 | | | | 3,285,558 | |
| SIG PLC | | | 1,435,446 | | | | 3,010,023 | |
| Techtronic Industries Co. Ltd. | | | 6,587,500 | | | | 26,027,816 | |
| | | | | | | | |
| | | | $ | 123,308,825 | |
| Consumer Products - 3.2% | | | | | | | | |
| Beiersdorf AG | | | 267,000 | | | $ | 24,105,023 | |
| Dabur India Ltd. | | | 5,065,506 | | | | 19,115,406 | |
| Hengan International Group Co. Ltd. | | | 458,000 | | | | 3,973,445 | |
| Kobayashi Pharmaceutical Co. Ltd. | | | 376,400 | | | | 33,043,067 | |
| LG Household & Healthcare Ltd. | | | 32,322 | | | | 26,708,893 | |
| Milbon Co. Ltd. | | | 241,596 | | | | 9,767,309 | |
| Mitsubishi Pencil Co. Ltd. | | | 52,000 | | | | 2,231,641 | |
| PZ Cussons | | | 404,893 | | | | 1,756,795 | |
| Societe BIC S.A. | | | 49,516 | | | | 7,448,711 | |
| Uni-Charm Corp. | | | 1,169,800 | | | | 25,455,064 | |
| | | | | | | | |
| | | | $ | 153,605,354 | |
| Consumer Services - 1.8% | | | | | | | | |
| Asante, Inc. | | | 129,700 | | | $ | 1,821,989 | |
| Dignity PLC | | | 1,558,827 | | | | 55,501,469 | |
| Estacio Participacoes S.A. | | | 1,367,674 | | | | 4,495,962 | |
| GAEC Anima Educacao S.A. (a) | | | 1,025,922 | | | | 2,838,965 | |
| Kakaku.com, Inc. | | | 289,200 | | | | 5,370,545 | |
| Kroton Educacional S.A. | | | 1,585,616 | | | | 5,062,470 | |
| Localiza Rent a Car S.A. | | | 701,513 | | | | 5,798,386 | |
| Park24 Co Ltd. | | | 71,600 | | | | 2,003,998 | |
| Rakuten | | | 119,300 | | | | 1,150,652 | |
| | | | | | | | |
| | | | $ | 84,044,436 | |
| Containers - 1.3% | | | | | | | | |
| Fuji Seal International, Inc. | | | 894,500 | | | $ | 31,712,248 | |
| Mayr-Melnhof Karton AG | | | 127,604 | | | | 15,318,662 | |
| Viscofan S.A. | | | 262,132 | | | | 15,704,442 | |
| | | | | | | | |
| | | | $ | 62,735,352 | |
| Electrical Equipment - 1.5% | | | | | | | | |
| Bajaj Electricals Ltd. | | | 2,216,380 | | | $ | 6,359,050 | |
| IMI PLC | | | 595,477 | | | | 8,146,293 | |
| Keyence Corp. | | | 8,200 | | | | 4,472,860 | |
| Legrand S.A. | | | 238,002 | | | | 13,336,652 | |
| OMRON Corp. | | | 103,621 | | | | 3,084,369 | |
9
Portfolio of Investments (unaudited) – continued
| | | | | | | | |
| Issuer | | Shares/Par | | | Value ($) | |
| Common Stocks - continued | | | | | | | | |
| Electrical Equipment - continued | | | | | | | | |
| Pfeiffer Vacuum Technology AG | | | 69,906 | | | $ | 7,840,853 | |
| Spectris PLC | | | 954,531 | | | | 25,280,228 | |
| Voltronic Power Technology Corp. | | | 215,000 | | | | 3,386,931 | |
| | | | | | | | |
| | | | $ | 71,907,236 | |
| Electronics - 3.2% | | | | | | | | |
| Advantech Co. Ltd. | | | 1,570,893 | | | $ | 11,543,506 | |
| ASM International N.V. | | | 448,916 | | | | 20,108,488 | |
| ASM Pacific Technology Ltd. | | | 1,341,500 | | | | 10,531,606 | |
| Chroma Ate, Inc. | | | 13,613,000 | | | | 29,269,811 | |
| Halma PLC | | | 1,384,817 | | | | 18,129,219 | |
| Hirose Electric Co. Ltd. | | | 83,693 | | | | 9,228,576 | |
| Infineon Technologies AG | | | 1,431,553 | | | | 20,370,196 | |
| Iriso Electronics Co. Ltd. (l) | | | 153,080 | | | | 7,589,732 | |
| JEOL Ltd. | | | 1,008,000 | | | | 5,105,158 | |
| Seoul Semiconductor Co. Ltd. | | | 575,866 | | | | 7,528,154 | |
| Siliconware Precision Industries Co. | | | 6,734,000 | | | | 10,880,189 | |
| | | | | | | | |
| | | | $ | 150,284,635 | |
| Energy - Independent - 0.7% | | | | | | | | |
| Cairn Energy PLC (a) | | | 1,317,047 | | | $ | 3,783,217 | |
| Gran Tierra Energy, Inc. (a) | | | 6,256,480 | | | | 15,608,081 | |
| TORC Oil & Gas Ltd. (l) | | | 1,238,841 | | | | 7,363,890 | |
| Ultrapar Participacoes S.A. | | | 430,900 | | | | 8,363,581 | |
| | | | | | | | |
| | | | $ | 35,118,769 | |
| Engineering - Construction - 0.5% | | | | | | | | |
| JGC Corp. | | | 467,000 | | | $ | 6,991,825 | |
| Promotora y Operadora de Infraestructura S.A.B. de C.V. | | | 550,082 | | | | 7,313,986 | |
| Stantec, Inc. (l) | | | 283,605 | | | | 7,206,133 | |
| Toshiba Plant Kensetsu Co. Ltd. | | | 291,000 | | | | 3,565,587 | |
| | | | | | | | |
| | | | $ | 25,077,531 | |
| Food & Beverages - 3.1% | | | | | | | | |
| BRF S.A. | | | 588,300 | | | $ | 8,395,053 | |
| Britvic PLC | | | 833,189 | | | | 8,502,324 | |
| Chr. Hansen Holding A.S. | | | 118,977 | | | | 7,986,911 | |
| Coca-Cola East Japan Co. Ltd. | | | 202,800 | | | | 3,366,035 | |
| Coca-Cola HBC AG | | | 320,235 | | | | 6,807,075 | |
| Coca-Cola West Co. Ltd. | | | 372,400 | | | | 9,218,592 | |
| Grupo Lala S.A.B. de C.V. | | | 2,165,774 | | | | 5,901,705 | |
| Kerry Group PLC | | | 229,702 | | | | 21,401,622 | |
| P/f Bakkafrost | | | 811,217 | | | | 31,420,480 | |
| S Foods, Inc. (l) | | | 205,100 | | | | 4,435,678 | |
10
Portfolio of Investments (unaudited) – continued
| | | | | | | | |
| Issuer | | Shares/Par | | | Value ($) | |
| Common Stocks - continued | | | | | | | | |
| Food & Beverages - continued | | | | | | | | |
| Shenguan Holdings Group Ltd. | | | 13,965,505 | | | $ | 1,440,235 | |
| Super Group Ltd. | | | 35,664,200 | | | | 26,195,465 | |
| Tate & Lyle PLC | | | 488,682 | | | | 4,056,806 | |
| Tingyi (Cayman Islands) Holdings Corp. | | | 2,460,000 | | | | 2,749,418 | |
| Want Want China Holdings Ltd. | | | 8,824,146 | | | | 6,540,744 | |
| | | | | | | | |
| | | | $ | 148,418,143 | |
| Food & Drug Stores - 4.0% | | | | | | | | |
| Alimentation Couche-Tard, Inc. | | | 606,508 | | | $ | 26,992,235 | |
| Booker Group PLC | | | 19,314,967 | | | | 47,797,951 | |
| Clicks Group Ltd. | | | 2,988,664 | | | | 19,672,398 | |
| Cosmos Pharmaceutical Corp. (l) | | | 108,000 | | | | 17,954,418 | |
| Dairy Farm International Holdings Ltd. | | | 3,311,709 | | | | 20,002,722 | |
| FamilyMart Co. Ltd. | | | 130,000 | | | | 6,757,297 | |
| Lawson, Inc. | | | 303,700 | | | | 25,419,645 | |
| Sundrug Co. Ltd. | | | 280,100 | | | | 20,955,547 | |
| Welcia Holdings Co. Ltd. | | | 43,700 | | | | 2,516,114 | |
| | | | | | | | |
| | | | $ | 188,068,327 | |
| Forest & Paper Products - 0.1% | | | | | | | | |
| Fibria Celulose S.A. | | | 551,939 | | | $ | 4,657,247 | |
| | |
| Furniture & Appliances - 0.2% | | | | | | | | |
| Coway Co. Ltd. | | | 52,042 | | | $ | 4,391,442 | |
| SEB S.A. | | | 39,266 | | | | 4,073,100 | |
| Zojirushi Corp. (l) | | | 156,800 | | | | 2,496,651 | |
| | | | | | | | |
| | | | $ | 10,961,193 | |
| Gaming & Lodging - 1.4% | | | | | | | | |
| Minor International PLC | | | 10,437,384 | | | $ | 10,977,351 | |
| Paddy Power Betfair PLC | | | 303,922 | | | | 42,363,098 | |
| Shangri-La Asia Ltd. | | | 9,386,495 | | | | 10,708,616 | |
| | | | | | | | |
| | | | $ | 64,049,065 | |
| General Merchandise - 2.8% | | | | | | | | |
| B&M European Value Retail S.A. | | | 4,578,116 | | | $ | 17,450,897 | |
| Dollarama, Inc. | | | 1,012,475 | | | | 71,245,498 | |
| Poundland Group PLC | | | 1,324,210 | | | | 2,966,959 | |
| PriceSmart, Inc. | | | 61,628 | | | | 5,212,496 | |
| Seria Co. Ltd. | | | 366,700 | | | | 22,123,533 | |
| Woolworths Holdings Ltd. | | | 2,330,246 | | | | 14,153,122 | |
| | | | | | | | |
| | | | $ | 133,152,505 | |
11
Portfolio of Investments (unaudited) – continued
| | | | | | | | |
| Issuer | | Shares/Par | | | Value ($) | |
| Common Stocks - continued | | | | | | | | |
| Health Maintenance Organizations - 0.3% | | | | | | | | |
| Odontoprev S.A. | | | 2,273,555 | | | $ | 7,208,301 | |
| Qualicorp S.A. | | | 1,261,465 | | | | 5,216,855 | |
| | | | | | | | |
| | | | $ | 12,425,156 | |
| Insurance - 3.1% | | | | | | | | |
| Admiral Group PLC | | | 354,924 | | | $ | 10,108,533 | |
| AUB Group Ltd. (h) | | | 3,502,813 | | | | 22,017,666 | |
| Brasil Insurance Paticipaco e Administracao S.A. | | | 74,450 | | | | 471,052 | |
| Hiscox Ltd. | | | 3,529,166 | | | | 49,116,329 | |
| Jardine Lloyd Thompson Group PLC | | | 1,478,438 | | | | 17,932,168 | |
| Samsung Fire & Marine Insurance Co. Ltd. | | | 93,041 | | | | 24,000,608 | |
| Sony Financial Holdings, Inc. | | | 876,900 | | | | 11,204,249 | |
| Storebrand A.S.A. (a) | | | 1,722,818 | | | | 6,731,205 | |
| XL Group PLC | | | 212,422 | | | | 7,817,130 | |
| | | | | | | | |
| | | | $ | 149,398,940 | |
| Internet - 1.4% | | | | | | | | |
| 51job, Inc., ADR (a) | | | 600,240 | | | $ | 18,619,445 | |
| Rightmove PLC | | | 812,274 | | | | 49,126,726 | |
| | | | | | | | |
| | | | $ | 67,746,171 | |
| Machinery & Tools - 1.9% | | | | | | | | |
| Aalberts Industries N.V. | | | 242,140 | | | $ | 8,400,943 | |
| Burckhardt Compression Holding AG | | | 23,730 | | | | 8,137,869 | |
| Daikin Industries Ltd. | | | 65,500 | | | | 4,895,695 | |
| GEA Group AG | | | 743,872 | | | | 36,397,433 | |
| GLORY Ltd. | | | 50,600 | | | | 1,719,712 | |
| Neopost S.A. | | | 167,887 | | | | 3,528,483 | |
| Rotork PLC | | | 1,912,024 | | | | 5,019,952 | |
| Spirax-Sarco Engineering PLC | | | 278,609 | | | | 14,565,539 | |
| T.K. Corp. | | | 876,165 | | | | 8,810,683 | |
| | | | | | | | |
| | | | $ | 91,476,309 | |
| Medical & Health Technology & Services - 0.8% | | | | | | | | |
| Hogy Medical Co. Ltd. | | | 51,200 | | | $ | 2,747,772 | |
| Miraca Holdings, Inc. | | | 596,000 | | | | 24,492,425 | |
| Sonic Healthcare Ltd. | | | 677,119 | | | | 9,585,406 | |
| | | | | | | | |
| | | | $ | 36,825,603 | |
| Medical Equipment - 2.9% | | | | | | | | |
| Ansell Ltd. | | | 1,584,372 | | | $ | 20,998,710 | |
| Fisher & Paykel Healthcare Corp. Ltd. | | | 5,117,291 | | | | 34,663,298 | |
| Nakanishi, Inc. | | | 466,000 | | | | 14,802,523 | |
| Nihon Kohden Corp. | | | 521,600 | | | | 12,967,585 | |
12
Portfolio of Investments (unaudited) – continued
| | | | | | | | |
| Issuer | | Shares/Par | | | Value ($) | |
| Common Stocks - continued | | | | | | | | |
| Medical Equipment - continued | | | | | | | | |
| Smith & Nephew PLC | | | 846,063 | | | $ | 13,950,013 | |
| Sonova Holding AG | | | 158,220 | | | | 20,206,350 | |
| Terumo Corp. | | | 366,600 | | | | 13,143,463 | |
| William Demant Holdings A/S (a) | | | 60,376 | | | | 6,071,252 | |
| | | | | | | | |
| | | | $ | 136,803,194 | |
| Metals & Mining - 0.6% | | | | | | | | |
| Iluka Resources Ltd. | | | 2,739,397 | | | $ | 13,775,244 | |
| MOIL Ltd. | | | 4,200,697 | | | | 13,809,381 | |
| | | | | | | | |
| | | | $ | 27,584,625 | |
| Natural Gas - Distribution - 0.7% | | | | | | | | |
| China Resources Gas Group Ltd. | | | 12,444,000 | | | $ | 35,532,057 | |
| | |
| Network & Telecom - 0.3% | | | | | | | | |
| VTech Holdings Ltd. | | | 1,051,665 | | | $ | 12,486,010 | |
| | |
| Oil Services - 0.6% | | | | | | | | |
| Aker Solutions ASA | | | 2,283,400 | | | $ | 7,340,259 | |
| John Wood Group PLC | | | 779,082 | | | | 6,881,582 | |
| Technip | | | 227,633 | | | | 12,617,039 | |
| | | | | | | | |
| | | | $ | 26,838,880 | |
| Other Banks & Diversified Financials - 5.5% | | | | | | | | |
| Aeon Financial Service Co. Ltd. | | | 730,200 | | | $ | 17,232,318 | |
| AEON Thana Sinsap Public Co. Ltd. | | | 2,918,500 | | | | 7,922,591 | |
| Bancolombia S.A., ADR | | | 161,462 | | | | 5,518,771 | |
| Bank of Yokohama Ltd. | | | 1,030,000 | | | | 4,557,750 | |
| Chiba Bank Ltd. | | | 2,538,451 | | | | 12,653,348 | |
| Credicorp Ltd. | | | 170,973 | | | | 22,399,173 | |
| E.Sun Financial Holding Co. Ltd. | | | 47,516,006 | | | | 26,574,947 | |
| Federal Bank Ltd. | | | 19,401,680 | | | | 13,608,789 | |
| Grupo Financiero Inbursa S.A. de C.V. | | | 2,282,103 | | | | 4,555,713 | |
| Julius Baer Group Ltd. | | | 175,283 | | | | 7,528,665 | |
| Jyske Bank | | | 619,812 | | | | 27,978,381 | |
| Public Bank Berhad | | | 4,774,677 | | | | 22,983,067 | |
| Security Bank Corp. | | | 7,686,560 | | | | 29,213,769 | |
| Shizuoka Bank Ltd. | | | 1,025,000 | | | | 7,395,264 | |
| Shriram Transport Finance Co. Ltd. | | | 1,513,036 | | | | 21,777,346 | |
| Sydbank A/S | | | 776,307 | | | | 22,251,328 | |
| Unione di Banche Italiane S.c.p.A. | | | 2,002,715 | | | | 7,410,948 | |
| | | | | | | | |
| | | | $ | 261,562,168 | |
13
Portfolio of Investments (unaudited) – continued
| | | | | | | | |
| Issuer | | Shares/Par | | | Value ($) | |
| Common Stocks - continued | | | | | | | | |
| Pharmaceuticals - 1.6% | | | | | | | | |
| Genomma Lab Internacional S.A., “B” (a) | | | 8,794,195 | | | $ | 6,800,337 | |
| Hisamitsu Pharmaceutical Co., Inc. | | | 72,600 | | | | 3,244,729 | |
| KYORIN Holdings Ltd. | | | 377,000 | | | | 7,181,909 | |
| Santen Pharmaceutical Co. Ltd. | | | 1,885,700 | | | | 28,366,343 | |
| Taiko Pharmaceutical Co. Ltd. | | | 120,900 | | | | 1,550,124 | |
| Tsumura & Co. | | | 133,000 | | | | 3,193,087 | |
| Virbac SA | | | 157,760 | | | | 27,420,931 | |
| | | | | | | | |
| | | | $ | 77,757,460 | |
| Pollution Control - 0.3% | | | | | | | | |
| Daiseki Co. Ltd. | | | 792,300 | | | $ | 12,967,405 | |
| | |
| Precious Metals & Minerals - 0.4% | | | | | | | | |
| Agnico-Eagle Mines Ltd. | | | 516,614 | | | $ | 18,691,582 | |
| | |
| Railroad & Shipping - 0.1% | | | | | | | | |
| Pacific Basin Shipping Ltd. | | | 18,706,752 | | | $ | 2,749,096 | |
| Precious Shipping Public Co. Ltd. (a) | | | 14,024,727 | | | | 2,391,938 | |
| | | | | | | | |
| | | | $ | 5,141,034 | |
| Real Estate - 2.5% | | | | | | | | |
| Ascendas India Trust, REIT | | | 33,778,000 | | | $ | 21,928,071 | |
| City Developments Ltd. | | | 1,712,800 | | | | 10,382,146 | |
| Concentradora Fibra Hotelera Mexicana S.A. de C.V., REIT | | | 8,968,989 | | | | 8,186,591 | |
| Deutsche Wohnen AG | | | 790,386 | | | | 24,580,061 | |
| Fibro Uno Administracion S.A. de C.V. | | | 3,822,733 | | | | 8,885,780 | |
| Foxtons Group PLC | | | 2,427,902 | | | | 5,675,213 | |
| LEG Immobilien AG | | | 239,557 | | | | 22,584,239 | |
| Midland Holdings Ltd. (a)(h) | | | 45,603,000 | | | | 14,226,412 | |
| Prologis Peroperty Mexico S.A. de C.V., REIT | | | 474,014 | | | | 752,841 | |
| TAG Immobilien AG (l) | | | 237,520 | | | | 3,213,558 | |
| | | | | | | | |
| | | | $ | 120,414,912 | |
| Restaurants - 3.0% | | | | | | | | |
| Ajisen (China) Holdings Ltd. | | | 13,082,037 | | | $ | 4,856,848 | |
| Alsea S.A.B. de C.V. | | | 1,858,343 | | | | 6,974,238 | |
| Cafe De Coral Holdings Ltd. | | | 6,552,000 | | | | 19,046,143 | |
| Domino’s Pizza UK & IRL PLC | | | 4,290,182 | | | | 62,110,680 | |
| Heian Ceremony Service Co. | | | 20,244 | | | | 113,141 | |
| Jollibee Foods Corp. | | | 1,783,540 | | | | 8,792,781 | |
| Whitbread PLC | | | 675,294 | | | | 38,407,683 | |
| | | | | | | | |
| | | | $ | 140,301,514 | |
14
Portfolio of Investments (unaudited) – continued
| | | | | | | | |
| Issuer | | Shares/Par | | | Value ($) | |
| Common Stocks - continued | | | | | | | | |
| Specialty Chemicals - 5.4% | | | | | | | | |
| Air Water, Inc. | | | 376,000 | | | $ | 5,565,916 | |
| Croda International PLC | | | 1,404,956 | | | | 61,323,009 | |
| Elementis PLC | | | 3,641,079 | | | | 12,519,422 | |
| Filtrona PLC | | | 716,257 | | | | 8,512,692 | |
| IMCD Group NV | | | 218,300 | | | | 8,165,025 | |
| Japan Pure Chemical Co. Ltd. | | | 41,700 | | | | 754,376 | |
| Kansai Paint Co. Ltd. | | | 1,037,000 | | | | 16,659,079 | |
| Marine Harvest A.S.A. | | | 1,335,910 | | | | 20,584,254 | |
| PTT Global Chemical PLC | | | 14,006,100 | | | | 24,086,670 | |
| Sika AG | | | 8,112 | | | | 32,108,858 | |
| SK KAKEN Co. Ltd. | | | 58,000 | | | | 4,808,210 | |
| Symrise AG | | | 885,210 | | | | 59,429,545 | |
| Tikkurila Oyj | | | 145,978 | | | | 2,651,089 | |
| | | | | | | | |
| | | | $ | 257,168,145 | |
| Specialty Stores - 2.9% | | | | | | | | |
| ABC-Mart, Inc. | | | 362,200 | | | $ | 23,203,714 | |
| Cj O Shopping Co. Ltd. | | | 66,126 | | | | 11,448,888 | |
| Esprit Holdings Ltd. (a) | | | 6,542,399 | | | | 6,106,076 | |
| Just Eat PLC (a) | | | 2,515,089 | | | | 13,629,195 | |
| MonotaRO Co. Ltd. (l) | | | 196,800 | | | | 5,849,180 | |
| NEXT PLC | | | 660,865 | | | | 51,255,036 | |
| Nitori Co. Ltd. | | | 174,900 | | | | 16,022,204 | |
| Shimamura Co. Ltd. | | | 52,800 | | | | 6,591,497 | |
| XXL ASA | | | 436,190 | | | | 5,324,083 | |
| | | | | | | | |
| | | | $ | 139,429,873 | |
| Telecommunications - Wireless - 0.4% | | | | | | | | |
| Cellnex Telecom S.A.U. | | | 897,040 | | | $ | 14,341,422 | |
| Infrastrutture Wireless Italiane S.p.A. (a)(n) | | | 1,387,784 | | | | 6,957,776 | |
| | | | | | | | |
| | | | $ | 21,299,198 | |
| Telephone Services - 0.6% | | | | | | | | |
| Bezeq - The Israel Telecommunication Corp. Ltd. | | | 6,073,425 | | | $ | 13,703,102 | |
| PT XL Axiata Tbk (a) | | | 9,609,807 | | | | 2,898,886 | |
| TDC A.S. | | | 2,666,167 | | | | 13,048,889 | |
| | | | | | | | |
| | | | $ | 29,650,877 | |
| Tobacco - 0.4% | | | | | | | | |
| Swedish Match AB | | | 581,683 | | | $ | 19,747,093 | |
| | |
| Trucking - 1.4% | | | | | | | | |
| DSV A.S. | | | 763,335 | | | $ | 31,775,998 | |
| Kintetsu World Express, Inc. | | | 277,200 | | | | 3,684,670 | |
15
Portfolio of Investments (unaudited) – continued
| | | | | | | | |
| Issuer | | Shares/Par | | | Value ($) | |
| Common Stocks - continued | | | | | | | | |
| Trucking - continued | | | | | | | | |
| Yamato Holdings Co. Ltd. | | | 1,480,100 | | | $ | 29,550,710 | |
| | | | | | | | |
| | | | $ | 65,011,378 | |
| Utilities - Electric Power - 0.9% | | | | | | | | |
| CESC Ltd. | | | 2,530,578 | | | $ | 18,063,411 | |
| Glow Energy PLC | | | 9,987,700 | | | | 26,119,056 | |
| | | | | | | | |
| | | | $ | 44,182,467 | |
| Total Common Stocks (Identified Cost, $3,765,328,899) | | | | | | $ | 4,576,735,844 | |
| | |
| Preferred Stocks - 1.2% | | | | | | | | |
| Consumer Products - 0.6% | | | | | | | | |
| Henkel AG & Co. KGaA | | | 264,562 | | | $ | 29,171,269 | |
| | |
| Specialty Chemicals - 0.6% | | | | | | | | |
| Fuchs Petrolub SE | | | 604,462 | | | $ | 27,007,146 | |
| Total Preferred Stocks (Identified Cost, $30,807,967) | | | $ | 56,178,415 | |
| | | | | | | | | | | | | | | | |
| | | | |
| | | Strike Price | | | First Exercise | | | | | | | |
| Warrants - 0.0% | | | | | | | | | |
| Gaming & Lodging - 0.0% | | | | | | | | | | | | | | | | |
| Minor International PLC (1 share for 1 warrant) (a) | | | THB 40 | | | | 10/16/17 | | | | 975,262 | | | $ | 130,848 | |
| | | | |
| Railroad & Shipping - 0.0% | | | | | | | | �� | | | | | | | | |
| Precious Shipping Public Co. Ltd. (1 share for 1 warrant) (a) | | | THB 18 | | | | 6/30/17 | | | | 467,490 | | | $ | 30,298 | |
| Total Warrants (Identified Cost, $0) | | | | | | | $ | 161,146 | |
| | |
| Collateral for Securities Loaned - 0.9% | | | | | | | | | |
JPMorgan Prime Money Market Fund, 0.44%,
at Cost and Net Asset Value (j) | | | | 40,223,975 | | | $ | 40,223,975 | |
| | |
| Money Market Funds - 1.8% | | | | | | | | | |
MFS Institutional Money Market Portfolio, 0.35%,
at Cost and Net Asset Value (v) | | | | 86,670,840 | | | $ | 86,670,840 | |
| Total Investments (Identified Cost, $3,923,031,681) | | | | | | | $ | 4,759,970,220 | |
| | |
| Other Assets, Less Liabilities - (0.3)% | | | | | | | | (14,115,212 | ) |
| Net Assets - 100.0% | | | | | | | | | | | | | | $ | 4,745,855,008 | |
| (a) | Non-income producing security. |
| (h) | Affiliated issuers are those in which the fund’s holdings of an issuer represent 5% or more of the outstanding voting securities of the issuer. |
16
Portfolio of Investments (unaudited) – continued
| (j) | The rate quoted is the annualized seven-day yield of the fund at period end. |
| (l) | A portion of this security is on loan. |
| (n) | Securities exempt from registration under Rule 144A of the Securities Act of 1933. These securities may be sold in the ordinary course of business in transactions exempt from registration, normally to qualified institutional buyers. At period end, the aggregate value of these securities was $6,957,776, representing 0.1% of net assets. |
| (v) | Underlying affiliated fund that is available only to investment companies managed by MFS. The rate quoted for the MFS Institutional Money Market Portfolio is the annualized seven-day yield of the fund at period end. |
The following abbreviations are used in this report and are defined:
| ADR | | American Depositary Receipt |
| PLC | | Public Limited Company |
| REIT | | Real Estate Investment Trust |
Abbreviations indicate amounts shown in currencies other than the U.S. dollar. All amounts are stated in U.S. dollars unless otherwise indicated. A list of abbreviations is shown below:
See Notes to Financial Statements
17
Financial Statements
STATEMENT OF ASSETS AND LIABILITIES
At 3/31/16 (unaudited)
This statement represents your fund’s balance sheet, which details the assets and liabilities comprising the total value of the fund.
| | | | |
| Assets | | | | |
Investments | | | | |
Non-affiliated issuers, at value (identified cost, $3,785,963,824) | | | $4,637,055,302 | |
Underlying affiliated funds, at cost and value | | | 86,670,840 | |
Other affiliated issuers, at value (identified cost, $50,397,017) | | | 36,244,078 | |
Total investments, at value, including $38,376,174 of securities on loan (identified cost, $3,923,031,681) | | | $4,759,970,220 | |
Cash | | | 163,723 | |
Foreign currency, at value (identified cost, $1,771,294) | | | 1,771,294 | |
Receivables for | | | | |
Investments sold | | | 22,389,406 | |
Fund shares sold | | | 6,045,466 | |
Interest and dividends | | | 15,172,657 | |
Other assets | | | 19,892 | |
Total assets | | | $4,805,532,658 | |
| Liabilities | | | | |
Payables for | | | | |
Investments purchased | | | $4,407,703 | |
Fund shares reacquired | | | 9,007,161 | |
Collateral for securities loaned, at value | | | 40,223,975 | |
Payable to affiliates | | | | |
Investment adviser | | | 233,478 | |
Shareholder servicing costs | | | 1,805,882 | |
Distribution and service fees | | | 29,661 | |
Program manager fees | | | 25 | |
Payable for independent Trustees’ compensation | | | 7,869 | |
Deferred country tax expense payable | | | 3,368,887 | |
Accrued expenses and other liabilities | | | 593,009 | |
Total liabilities | | | $59,677,650 | |
Net assets | | | $4,745,855,008 | |
| Net assets consist of | | | | |
Paid-in capital | | | $3,906,287,339 | |
Unrealized appreciation (depreciation) on investments and translation of assets and liabilities in foreign currencies (net of $3,340,388 deferred country tax) | | | 833,565,463 | |
Accumulated net realized gain (loss) on investments and foreign currency | | | (5,166,655 | ) |
Undistributed net investment income | | | 11,168,861 | |
Net assets | | | $4,745,855,008 | |
Shares of beneficial interest outstanding | | | 168,650,649 | |
18
Statement of Assets and Liabilities (unaudited) – continued
| | | | | | | | | | | | |
| | | Net assets | | | Shares
outstanding | | | Net asset value
per share (a) | |
Class A | | | $1,407,508,271 | | | | 50,661,172 | | | | $27.78 | |
Class B | | | 18,617,095 | | | | 689,652 | | | | 26.99 | |
Class C | | | 167,589,080 | | | | 6,314,020 | | | | 26.54 | |
Class I | | | 1,677,555,674 | | | | 58,740,480 | | | | 28.56 | |
Class R1 | | | 3,157,534 | | | | 121,617 | | | | 25.96 | |
Class R2 | | | 58,931,054 | | | | 2,176,473 | | | | 27.08 | |
Class R3 | | | 148,449,356 | | | | 5,385,204 | | | | 27.57 | |
Class R4 | | | 309,056,154 | | | | 11,130,665 | | | | 27.77 | |
Class R5 | | | 946,336,841 | | | | 33,110,003 | | | | 28.58 | |
Class 529A | | | 6,354,371 | | | | 232,197 | | | | 27.37 | |
Class 529B | | | 331,641 | | | | 12,731 | | | | 26.05 | |
Class 529C | | | 1,967,937 | | | | 76,435 | | | | 25.75 | |
| (a) | Maximum offering price per share was equal to the net asset value per share for all share classes, except for Classes A and 529A, for which the maximum offering prices per share were $29.47 [100 / 94.25 x $27.78] and $29.04 [100 / 94.25 x $27.37], respectively. On sales of $50,000 or more, the maximum offering prices of Class A and Class 529A shares are reduced. A contingent deferred sales charge may be imposed on redemptions of Class A, Class B, Class C, Class 529B, and Class 529C shares. Redemption price per share was equal to the net asset value per share for Classes I, R1, R2, R3, R4, R5, and 529A. |
See Notes to Financial Statements
19
Financial Statements
STATEMENT OF OPERATIONS
Six months ended 3/31/16 (unaudited)
This statement describes how much your fund earned in investment income and accrued in expenses. It also describes any gains and/or losses generated by fund operations.
| | | | |
| Net investment income | |
Income | | | | |
Dividends | | | $41,125,633 | |
Interest | | | 318,091 | |
Dividends from other affiliated issuers | | | 660,748 | |
Dividends from underlying affiliated funds | | | 88,032 | |
Foreign taxes withheld | | | (2,211,498 | ) |
Total investment income | | | $39,981,006 | |
Expenses | | | | |
Management fee | | | $22,319,045 | |
Distribution and service fees | | | 3,052,770 | |
Shareholder servicing costs | | | 2,789,346 | |
Program manager fees | | | 4,213 | |
Administrative services fee | | | 319,118 | |
Independent Trustees’ compensation | | | 25,589 | |
Custodian fee | | | 664,467 | |
Shareholder communications | | | 162,332 | |
Audit and tax fees | | | 52,292 | |
Legal fees | | | 22,580 | |
Miscellaneous | | | 149,800 | |
Total expenses | | | $29,561,552 | |
Fees paid indirectly | | | (121 | ) |
Reduction of expenses by investment adviser and distributor | | | (1,120,763 | ) |
Net expenses | | | $28,440,668 | |
Net investment income | | | $11,540,338 | |
| Realized and unrealized gain (loss) on investments and foreign currency | |
Realized gain (loss) (identified cost basis) | | | | |
Investments (net of $631,779 country tax) | | | $63,321,452 | |
Foreign currency | | | (776,426 | ) |
Net realized gain (loss) on investments and foreign currency | | | $62,545,026 | |
Change in unrealized appreciation (depreciation) | | | | |
Investments (net of $28,747 decrease in deferred country tax) | | | $154,361,226 | |
Translation of assets and liabilities in foreign currencies | | | 152,494 | |
Net unrealized gain (loss) on investments and foreign currency translation | | | $154,513,720 | |
Net realized and unrealized gain (loss) on investments and foreign currency | | | $217,058,746 | |
Change in net assets from operations | | | $228,599,084 | |
See Notes to Financial Statements
20
Financial Statements
STATEMENTS OF CHANGES IN NET ASSETS
These statements describe the increases and/or decreases in net assets resulting from operations, any distributions, and any shareholder transactions.
| | | | | | | | |
| Change in net assets | | Six months ended 3/31/16
(unaudited) | | | Year ended
9/30/15 | |
| From operations | | | | | | | | |
Net investment income | | | $11,540,338 | | | | $51,910,272 | |
Net realized gain (loss) on investments and foreign currency | | | 62,545,026 | | | | 138,033,313 | |
Net unrealized gain (loss) on investments and foreign currency translation | | | 154,513,720 | | | | (301,115,954 | ) |
Change in net assets from operations | | | $228,599,084 | | | | $(111,172,369 | ) |
| Distributions declared to shareholders | | | | | | | | |
From net investment income | | | $(50,927,230 | ) | | | $(61,557,406 | ) |
Change in net assets from fund share transactions | | | $(229,846,284 | ) | | | $(85,999,791 | ) |
Total change in net assets | | | $(52,174,430 | ) | | | $(258,729,566 | ) |
| Net assets | | | | | | | | |
At beginning of period | | | 4,798,029,438 | | | | 5,056,759,004 | |
At end of period (including undistributed net investment income of $11,168,861 and $50,555,753, respectively) | | | $4,745,855,008 | | | | $4,798,029,438 | |
See Notes to Financial Statements
21
Financial Statements
FINANCIAL HIGHLIGHTS
The financial highlights table is intended to help you understand the fund’s financial performance for the semiannual period and the past 5 fiscal years (or life of a particular share class, if shorter). Certain information reflects financial results for a single fund share. The total returns in the table represent the rate by which an investor would have earned (or lost) on an investment in the fund share class (assuming reinvestment of all distributions) held for the entire period.
| | | | | | | | | | | | | | | | | | | | | | | | |
| | | Six months
ended
3/31/16 (unaudited) | | | Years ended 9/30 | |
| Class A | | | 2015 | | | 2014 | | | 2013 | | | 2012 | | | 2011 | |
| | | | | | | | | | | | | | | | | |
Net asset value, beginning of
period | | | $26.70 | | | | $27.64 | | | | $27.41 | | | | $23.23 | | | | $18.94 | | | | $20.24 | |
| Income (loss) from investment operations | | | | | | | | | | | | | | | | | |
Net investment income (d) | | | $0.05 | | | | $0.25 | | | | $0.27 | | | | $0.27 | | | | $0.25 | | | | $0.24 | |
Net realized and unrealized
gain (loss) on investments
and foreign currency | | | 1.27 | | | | (0.88 | ) | | | 0.26 | | | | 4.17 | | | | 4.28 | | | | (1.34 | ) |
Total from investment
operations | | | $1.32 | | | | $(0.63 | ) | | | $0.53 | | | | $4.44 | | | | $4.53 | | | | $(1.10 | ) |
| Less distributions declared to shareholders | | | | | | | | | | | | | | | | | |
From net investment income | | | $(0.24 | ) | | | $(0.31 | ) | | | $(0.30 | ) | | | $(0.26 | ) | | | $(0.24 | ) | | | $(0.20 | ) |
Net asset value, end of period (x) | | | $27.78 | | | | $26.70 | | | | $27.64 | | | | $27.41 | | | | $23.23 | | | | $18.94 | |
Total return (%) (r)(s)(t)(x) | | | 4.97 | (n) | | | (2.30 | ) | | | 1.93 | | | | 19.29 | | | | 24.13 | | | | (5.53 | ) |
Ratios (%) (to average net assets)
and Supplemental data: | | | | | | | | | | | | | | | | | |
Expenses before expense
reductions (f) | | | 1.38 | (a) | | | 1.37 | | | | 1.36 | | | | 1.39 | | | | 1.41 | | | | 1.43 | |
Expenses after expense
reductions (f) | | | 1.33 | (a) | | | 1.32 | | | | 1.34 | | | | 1.39 | | | | 1.41 | | | | 1.42 | |
Net investment income | | | 0.34 | (a)(l) | | | 0.88 | | | | 0.96 | | | | 1.07 | | | | 1.19 | | | | 1.12 | |
Portfolio turnover | | | 6 | (n) | | | 15 | | | | 14 | | | | 15 | | | | 21 | | | | 44 | |
Net assets at end of period
(000 omitted) | | | $1,407,508 | | | | $1,405,724 | | | | $1,555,607 | | | | $1,581,384 | | | | $1,309,494 | | | | $1,199,483 | |
See Notes to Financial Statements
22
Financial Highlights – continued
| | | | | | | | | | | | | | | | | | | | | | | | |
| | | Six months
ended
3/31/16 (unaudited) | | | Years ended 9/30 | |
| Class B | | | 2015 | | | 2014 | | | 2013 | | | 2012 | | | 2011 | |
| | | | | | | | | | | | | | | | | |
Net asset value, beginning of
period | | | $25.83 | | | | $26.68 | | | | $26.40 | | | | $22.34 | | | | $18.15 | | | | $19.38 | |
| Income (loss) from investment operations | | | | | | | | | | | | | | | | | |
Net investment income (loss) (d) | | | $(0.06 | ) | | | $0.03 | | | | $0.03 | | | | $0.04 | | | | $0.07 | | | | $0.07 | |
Net realized and unrealized
gain (loss) on investments
and foreign currency | | | 1.24 | | | | (0.85 | ) | | | 0.28 | | | | 4.06 | | | | 4.14 | | | | (1.27 | ) |
Total from investment
operations | | | $1.18 | | | | $(0.82 | ) | | | $0.31 | | | | $4.10 | | | | $4.21 | | | | $(1.20 | ) |
| Less distributions declared to shareholders | | | | | | | | | | | | | | | | | |
From net investment income | | | $(0.02 | ) | | | $(0.03 | ) | | | $(0.03 | ) | | | $(0.04 | ) | | | $(0.02 | ) | | | $(0.03 | ) |
Net asset value, end of period (x) | | | $26.99 | | | | $25.83 | | | | $26.68 | | | | $26.40 | | | | $22.34 | | | | $18.15 | |
Total return (%) (r)(s)(t)(x) | | | 4.58 | (n) | | | (3.06 | ) | | | 1.18 | | | | 18.39 | | | | 23.21 | | | | (6.21 | ) |
Ratios (%) (to average net assets)
and Supplemental data: | | | | | | | | | | | | | | | | | |
Expenses before expense
reductions (f) | | | 2.13 | (a) | | | 2.12 | | | | 2.11 | | | | 2.14 | | | | 2.16 | | | | 2.17 | |
Expenses after expense
reductions (f) | | | 2.08 | (a) | | | 2.07 | | | | 2.10 | | | | 2.13 | | | | 2.16 | | | | 2.17 | |
Net investment income (loss) | | | (0.42 | )(a)(l) | | | 0.11 | | | | 0.12 | | | | 0.19 | | | | 0.36 | | | | 0.32 | |
Portfolio turnover | | | 6 | (n) | | | 15 | | | | 14 | | | | 15 | | | | 21 | | | | 44 | |
Net assets at end of period
(000 omitted) | | | $18,617 | | | | $18,975 | | | | $23,690 | | | | $33,509 | | | | $45,496 | | | | $57,379 | |
See Notes to Financial Statements
23
Financial Highlights – continued
| | | | | | | | | | | | | | | | | | | | | | | | |
| | | Six months
ended
3/31/16 (unaudited) | | | Years ended 9/30 | |
| Class C | | | 2015 | | | 2014 | | | 2013 | | | 2012 | | | 2011 | |
| | | | | | | | | | | | | | | | | |
Net asset value, beginning of
period | | | $25.42 | | | | $26.32 | | | | $26.14 | | | | $22.17 | | | | $18.06 | | | | $19.31 | |
| Income (loss) from investment operations | | | | | | | | | | | | | | | | | |
Net investment income (loss) (d) | | | $(0.05 | ) | | | $0.03 | | | | $0.06 | | | | $0.08 | | | | $0.09 | | | | $0.08 | |
Net realized and unrealized
gain (loss) on investments
and foreign currency | | | 1.21 | | | | (0.83 | ) | | | 0.25 | | | | 3.99 | | | | 4.08 | | | | (1.27 | ) |
Total from investment
operations | | | $1.16 | | | | $(0.80 | ) | | | $0.31 | | | | $4.07 | | | | $4.17 | | | | $(1.19 | ) |
| Less distributions declared to shareholders | | | | | | | | | | | | | | | | | |
From net investment income | | | $(0.04 | ) | | | $(0.10 | ) | | | $(0.13 | ) | | | $(0.10 | ) | | | $(0.06 | ) | | | $(0.06 | ) |
Net asset value, end of period (x) | | | $26.54 | | | | $25.42 | | | | $26.32 | | | | $26.14 | | | | $22.17 | | | | $18.06 | |
Total return (%) (r)(s)(t)(x) | | | 4.58 | (n) | | | (3.04 | ) | | | 1.17 | | | | 18.41 | | | | 23.17 | | | | (6.20 | ) |
Ratios (%) (to average net assets)
and Supplemental data: | | | | | | | | | | | | | | | | | |
Expenses before expense
reductions (f) | | | 2.13 | (a) | | | 2.12 | | | | 2.11 | | | | 2.14 | | | | 2.16 | | | | 2.18 | |
Expenses after expense
reductions (f) | | | 2.08 | (a) | | | 2.07 | | | | 2.10 | | | | 2.14 | | | | 2.16 | | | | 2.17 | |
Net investment income (loss) | | | (0.41 | )(a)(l) | | | 0.12 | | | | 0.21 | | | | 0.32 | | | | 0.45 | | | | 0.37 | |
Portfolio turnover | | | 6 | (n) | | | 15 | | | | 14 | | | | 15 | | | | 21 | | | | 44 | |
Net assets at end of period
(000 omitted) | | | $167,589 | | | | $166,327 | | | | $184,614 | | | | $184,560 | | | | $152,757 | | | | $142,778 | |
See Notes to Financial Statements
24
Financial Highlights – continued
| | | | | | | | | | | | | | | | | | | | | | | | |
| | | Six months
ended
3/31/16 (unaudited) | | | Years ended 9/30 | |
| Class I | | | 2015 | | | 2014 | | | 2013 | | | 2012 | | | 2011 | |
| | | | | | | | | | | | | | | | | |
Net asset value, beginning of
period | | | $27.48 | | | | $28.45 | | | | $28.20 | | | | $23.88 | | | | $19.48 | | | | $20.80 | |
| Income (loss) from investment operations | | | | | | | | | | | | | | | | | |
Net investment income (d) | | | $0.08 | | | | $0.33 | | | | $0.36 | | | | $0.35 | | | | $0.33 | | | | $0.32 | |
Net realized and unrealized
gain (loss) on investments
and foreign currency | | | 1.32 | | | | (0.92 | ) | | | 0.26 | | | | 4.29 | | | | 4.37 | | | | (1.39 | ) |
Total from investment
operations | | | $1.40 | | | | $(0.59 | ) | | | $0.62 | | | | $4.64 | | | | $4.70 | | | | $(1.07 | ) |
| Less distributions declared to shareholders | | | | | | | | | | | | | | | | | |
From net investment income | | | $(0.32 | ) | | | $(0.38 | ) | | | $(0.37 | ) | | | $(0.32 | ) | | | $(0.30 | ) | | | $(0.25 | ) |
Net asset value, end of period (x) | | | $28.56 | | | | $27.48 | | | | $28.45 | | | | $28.20 | | | | $23.88 | | | | $19.48 | |
Total return (%) (r)(s)(x) | | | 5.10 | (n) | | | (2.07 | ) | | | 2.19 | | | | 19.63 | | | | 24.40 | | | | (5.27 | ) |
Ratios (%) (to average net assets)
and Supplemental data: | | | | | | | | | | | | | | | | | |
Expenses before expense
reductions (f) | | | 1.13 | (a) | | | 1.12 | | | | 1.11 | | | | 1.14 | | | | 1.16 | | | | 1.18 | |
Expenses after expense
reductions (f) | | | 1.08 | (a) | | | 1.07 | | | | 1.10 | | | | 1.14 | | | | 1.16 | | | | 1.18 | |
Net investment income | | | 0.57 | (a)(l) | | | 1.13 | | | | 1.24 | | | | 1.34 | | | | 1.52 | | | | 1.42 | |
Portfolio turnover | | | 6 | (n) | | | 15 | | | | 14 | | | | 15 | | | | 21 | | | | 44 | |
Net assets at end of period
(000 omitted) | | | $1,677,556 | | | | $1,779,171 | | | | $1,871,618 | | | | $1,530,692 | | | | $968,523 | | | | $845,262 | |
See Notes to Financial Statements
25
Financial Highlights – continued
| | | | | | | | | | | | | | | | | | | | | | | | |
| | | Six months
ended
3/31/16 (unaudited) | | | Years ended 9/30 | |
| Class R1 | | | 2015 | | | 2014 | | | 2013 | | | 2012 | | | 2011 | |
| | | | | | | | | | | | | | | | | |
Net asset value, beginning of
period | | | $24.82 | | | | $25.61 | | | | $25.52 | | | | $21.64 | | | | $17.65 | | | | $18.89 | |
| Income (loss) from investment operations | | | | | | | | | | | | | | | | | |
Net investment income (loss) (d) | | | $(0.05 | ) | | | $0.02 | | | | $0.04 | | | | $0.17 | | | | $0.09 | | | | $0.07 | |
Net realized and unrealized
gain (loss) on investments
and foreign currency | | | 1.19 | | | | (0.81 | ) | | | 0.26 | | | | 3.80 | | | | 3.99 | | | | (1.24 | ) |
Total from investment
operations | | | $1.14 | | | | $(0.79 | ) | | | $0.30 | | | | $3.97 | | | | $4.08 | | | | $(1.17 | ) |
| Less distributions declared to shareholders | | | | | | | | | | | | | | | | | |
From net investment income | | | $— | | | | $— | | | | $(0.21 | ) | | | $(0.09 | ) | | | $(0.09 | ) | | | $(0.07 | ) |
Net asset value, end of period (x) | | | $25.96 | | | | $24.82 | | | | $25.61 | | | | $25.52 | | | | $21.64 | | | | $17.65 | |
Total return (%) (r)(s)(x) | | | 4.59 | (n) | | | (3.08 | ) | | | 1.17 | | | | 18.43 | | | | 23.20 | | | | (6.21 | ) |
Ratios (%) (to average net assets)
and Supplemental data: | | | | | | | | | | | | | | | | | |
Expenses before expense
reductions (f) | | | 2.13 | (a) | | | 2.12 | | | | 2.11 | | | | 2.15 | | | | 2.16 | | | | 2.18 | |
Expenses after expense
reductions (f) | | | 2.08 | (a) | | | 2.07 | | | | 2.10 | | | | 2.15 | | | | 2.16 | | | | 2.18 | |
Net investment income (loss) | | | (0.40 | )(a)(l) | | | 0.06 | | | | 0.17 | | | | 0.70 | | | | 0.46 | | | | 0.35 | |
Portfolio turnover | | | 6 | (n) | | | 15 | | | | 14 | | | | 15 | | | | 21 | | | | 44 | |
Net assets at end of period
(000 omitted) | | | $3,158 | | | | $3,260 | | | | $7,403 | | | | $8,642 | | | | $2,869 | | | | $2,560 | |
See Notes to Financial Statements
26
Financial Highlights – continued
| | | | | | | | | | | | | | | | | | | | | | | | |
| | | Six months
ended
3/31/16 (unaudited) | | | Years ended 9/30 | |
| Class R2 | | | 2015 | | | 2014 | | | 2013 | | | 2012 | | | 2011 | |
| | | | | | | | | | | | | | | | | |
Net asset value, beginning of
period | | | $25.98 | | | | $26.90 | | | | $26.72 | | | | $22.66 | | | | $18.47 | | | | $19.75 | |
| Income (loss) from investment operations | | | | | | | | | | | | | | | | | |
Net investment income (d) | | | $0.01 | | | | $0.16 | | | | $0.19 | | | | $0.22 | | | | $0.20 | | | | $0.19 | |
Net realized and unrealized
gain (loss) on investments
and foreign currency | | | 1.26 | | | | (0.85 | ) | | | 0.25 | | | | 4.06 | | | | 4.17 | | | | (1.31 | ) |
Total from investment
operations | | | $1.27 | | | | $(0.69 | ) | | | $0.44 | | | | $4.28 | | | | $4.37 | | | | $(1.12 | ) |
| Less distributions declared to shareholders | | | | | | | | | | | | | | | | | |
From net investment income | | | $(0.17 | ) | | | $(0.23 | ) | | | $(0.26 | ) | | | $(0.22 | ) | | | $(0.18 | ) | | | $(0.16 | ) |
Net asset value, end of period (x) | | | $27.08 | | | | $25.98 | | | | $26.90 | | | | $26.72 | | | | $22.66 | | | | $18.47 | |
Total return (%) (r)(s)(x) | | | 4.88 | (n) | | | (2.57 | ) | | | 1.65 | | | | 19.03 | | | | 23.82 | | | | (5.76 | ) |
Ratios (%) (to average net assets)
and Supplemental data: | | | | | | | | | | | | | | | | | |
Expenses before expense
reductions (f) | | | 1.63 | (a) | | | 1.62 | | | | 1.61 | | | | 1.64 | | | | 1.66 | | | | 1.68 | |
Expenses after expense
reductions (f) | | | 1.58 | (a) | | | 1.57 | | | | 1.60 | | | | 1.64 | | | | 1.66 | | | | 1.67 | |
Net investment income | | | 0.08 | (a)(l) | | | 0.60 | | | | 0.70 | | | | 0.89 | | | | 0.99 | | | | 0.91 | |
Portfolio turnover | | | 6 | (n) | | | 15 | | | | 14 | | | | 15 | | | | 21 | | | | 44 | |
Net assets at end of period
(000 omitted) | | | $58,931 | | | | $60,527 | | | | $75,355 | | | | $76,634 | | | | $48,637 | | | | $40,259 | |
See Notes to Financial Statements
27
Financial Highlights – continued
| | | | | | | | | | | | | | | | | | | | | | | | |
| | | Six months
ended
3/31/16 (unaudited) | | | Years ended 9/30 | |
| Class R3 | | | 2015 | | | 2014 | | | 2013 | | | 2012 | | | 2011 | |
| | | | | | | | | | | | | | | | | |
Net asset value, beginning of
period | | | $26.50 | | | | $27.45 | | | | $27.23 | | | | $23.09 | | | | $18.85 | | | | $20.16 | |
| Income (loss) from investment operations | | | | | | | | | | | | | | | | | |
Net investment income (d) | | | $0.05 | | | | $0.24 | | | | $0.27 | | | | $0.29 | | | | $0.27 | | | | $0.32 | |
Net realized and unrealized
gain (loss) on investments
and foreign currency | | | 1.27 | | | | (0.88 | ) | | | 0.26 | | | | 4.12 | | | | 4.23 | | | | (1.42 | ) |
Total from investment
operations | | | $1.32 | | | | $(0.64 | ) | | | $0.53 | | | | $4.41 | | | | $4.50 | | | | $(1.10 | ) |
| Less distributions declared to shareholders | | | | | | | | | | | | | | | | | |
From net investment income | | | $(0.25 | ) | | | $(0.31 | ) | | | $(0.31 | ) | | | $(0.27 | ) | | | $(0.26 | ) | | | $(0.21 | ) |
Net asset value, end of period (x) | | | $27.57 | | | | $26.50 | | | | $27.45 | | | | $27.23 | | | | $23.09 | | | | $18.85 | |
Total return (%) (r)(s)(x) | | | 4.99 | (n) | | | (2.33 | ) | | | 1.94 | | | | 19.29 | | | | 24.15 | | | | (5.55 | ) |
Ratios (%) (to average net assets)
and Supplemental data: | | | | | | | | | | | | | | | | | |
Expenses before expense
reductions (f) | | | 1.38 | (a) | | | 1.37 | | | | 1.36 | | | | 1.39 | | | | 1.41 | | | | 1.44 | |
Expenses after expense
reductions (f) | | | 1.33 | (a) | | | 1.32 | | | | 1.34 | | | | 1.39 | | | | 1.41 | | | | 1.44 | |
Net investment income | | | 0.34 | (a)(l) | | | 0.88 | | | | 0.96 | | | | 1.15 | | | | 1.29 | | | | 1.46 | |
Portfolio turnover | | | 6 | (n) | | | 15 | | | | 14 | | | | 15 | | | | 21 | | | | 44 | |
Net assets at end of period
(000 omitted) | | | $148,449 | | | | $145,450 | | | | $155,509 | | | | $144,977 | | | | $93,526 | | | | $57,720 | |
See Notes to Financial Statements
28
Financial Highlights – continued
| | | | | | | | | | | | | | | | | | | | | | | | |
| | | Six months
ended
3/31/16 (unaudited) | | | Years ended 9/30 | |
| Class R4 | | | 2015 | | | 2014 | | | 2013 | | | 2012 | | | 2011 | |
| | | | | | | | | | | | | | | | | |
Net asset value, beginning of
period | | | $26.72 | | | | $27.67 | | | | $27.43 | | | | $23.25 | | | | $18.97 | | | | $20.26 | |
| Income (loss) from investment operations | | | | | | | | | | | | | | | | | |
Net investment income (d) | | | $0.08 | | | | $0.32 | | | | $0.33 | | | | $0.34 | | | | $0.34 | | | | $0.35 | |
Net realized and unrealized
gain (loss) on investments
and foreign currency | | | 1.29 | | | | (0.89 | ) | | | 0.27 | | | | 4.16 | | | | 4.24 | | | | (1.39 | ) |
Total from investment
operations | | | $1.37 | | | | $(0.57 | ) | | | $0.60 | | | | $4.50 | | | | $4.58 | | | | $(1.04 | ) |
| Less distributions declared to shareholders | | | | | | | | | | | | | | | | | |
From net investment income | | | $(0.32 | ) | | | $(0.38 | ) | | | $(0.36 | ) | | | $(0.32 | ) | | | $(0.30 | ) | | | $(0.25 | ) |
Net asset value, end of period (x) | | | $27.77 | | | | $26.72 | | | | $27.67 | | | | $27.43 | | | | $23.25 | | | | $18.97 | |
Total return (%) (r)(s)(x) | | | 5.14 | (n) | | | (2.07 | ) | | | 2.19 | | | | 19.56 | | | | 24.42 | | | | (5.26 | ) |
Ratios (%) (to average net assets)
and Supplemental data: | | | | | | | | | | | | | | | | | |
Expenses before expense
reductions (f) | | | 1.13 | (a) | | | 1.12 | | | | 1.11 | | | | 1.14 | | | | 1.16 | | | | 1.19 | |
Expenses after expense
reductions (f) | | | 1.08 | (a) | | | 1.07 | | | | 1.10 | | | | 1.14 | | | | 1.16 | | | | 1.19 | |
Net investment income | | | 0.57 | (a)(l) | | | 1.15 | | | | 1.15 | | | | 1.36 | | | | 1.60 | | | | 1.61 | |
Portfolio turnover | | | 6 | (n) | | | 15 | | | | 14 | | | | 15 | | | | 21 | | | | 44 | |
Net assets at end of period
(000 omitted) | | | $309,056 | | | | $337,705 | | | | $350,430 | | | | $416,387 | | | | $282,570 | | | | $143,620 | |
See Notes to Financial Statements
29
Financial Highlights – continued
| | | | | | | | | | | | | | | | | | | | |
| | | Six months
ended
3/31/16 (unaudited) | | | Years ended 9/30 | |
| Class R5 | | | 2015 | | | 2014 | | | 2013 | | | 2012 (i) | |
| | | | | | | | | | | | | | |
Net asset value, beginning of period | | | $27.51 | | | | $28.48 | | | | $28.22 | | | | $23.88 | | | | $21.12 | |
| Income (loss) from investment operations | | | | | | | | | | | | | |
Net investment income (d) | | | $0.10 | | | | $0.37 | | | | $0.40 | | | | $0.38 | | | | $0.12 | |
Net realized and unrealized gain
(loss) on investments and foreign
currency | | | 1.32 | | | | (0.93 | ) | | | 0.25 | | | | 4.28 | | | | 2.64 | (g) |
Total from investment operations | | | $1.42 | | | | $(0.56 | ) | | | $0.65 | | | | $4.66 | | | | $2.76 | |
| Less distributions declared to shareholders | | | | | | | | | | | | | |
From net investment income | | | $(0.35 | ) | | | $(0.41 | ) | | | $(0.39 | ) | | | $(0.32 | ) | | | $— | |
Net asset value, end of period (x) | | | $28.58 | | | | $27.51 | | | | $28.48 | | | | $28.22 | | | | $23.88 | |
Total return (%) (r)(s)(x) | | | 5.19 | (n) | | | (1.96 | ) | | | 2.31 | | | | 19.74 | | | | 13.07 | (n) |
Ratios (%) (to average net assets)
and Supplemental data: | | | | | | | | | | | | | |
Expenses before expense reductions (f) | | | 1.00 | (a) | | | 1.00 | | | | 1.00 | | | | 1.02 | | | | 1.05 | (a) |
Expenses after expense reductions (f) | | | 0.95 | (a) | | | 0.95 | | | | 0.99 | | | | 1.02 | | | | 1.05 | (a) |
Net investment income | | | 0.73 | (a)(I) | | | 1.27 | | | | 1.36 | | | | 1.48 | | | | 1.61 | (a) |
Portfolio turnover | | | 6 | (n) | | | 15 | | | | 14 | | | | 15 | | | | 21 | |
Net assets at end of period
(000 omitted) | | | $946,337 | | | | $872,671 | | | | $823,847 | | | | $652,771 | | | | $438,906 | |
See Notes to Financial Statements
30
Financial Highlights – continued
| | | | | | | | | | | | | | | | | | | | | | | | |
| | | Six months
ended
3/31/16 (unaudited) | | | Years ended 9/30 | |
| Class 529A | | | 2015 | | | 2014 | | | 2013 | | | 2012 | | | 2011 | |
| | | | | | | | | | | | | | | | | |
Net asset value, beginning of
period | | | $26.31 | | | | $27.25 | | | | $27.03 | | | | $22.90 | | | | $18.68 | | | | $19.97 | |
| Income (loss) from investment operations | | | | | | | | | | | | | | | | | |
Net investment income (d) | | | $0.05 | | | | $0.24 | | | | $0.28 | | | | $0.26 | | | | $0.25 | | | | $0.23 | |
Net realized and unrealized
gain (loss) on investments
and foreign currency | | | 1.26 | | | | (0.87 | ) | | | 0.24 | | | | 4.12 | | | | 4.20 | | | | (1.33 | ) |
Total from investment
operations | | | $1.31 | | | | $(0.63 | ) | | | $0.52 | | | | $4.38 | | | | $4.45 | | | | $(1.10 | ) |
| Less distributions declared to shareholders | | | | | | | | | | | | | | | | | |
From net investment income | | | $(0.25 | ) | | | $(0.31 | ) | | | $(0.30 | ) | | | $(0.25 | ) | | | $(0.23 | ) | | | $(0.19 | ) |
Net asset value, end of period (x) | | | $27.37 | | | | $26.31 | | | | $27.25 | | | | $27.03 | | | | $22.90 | | | | $18.68 | |
Total return (%) (r)(s)(t)(x) | | | 5.00 | (n) | | | (2.31 | ) | | | 1.92 | | | | 19.32 | | | | 24.03 | | | | (5.60 | ) |
Ratios (%) (to average net assets)
and Supplemental data: | | | | | | | | | | | | | | | | | |
Expenses before expense
reductions (f) | | | 1.48 | (a) | | | 1.47 | | | | 1.46 | | | | 1.49 | | | | 1.51 | | | | 1.53 | |
Expenses after expense
reductions (f) | | | 1.34 | (a) | | | 1.33 | | | | 1.34 | | | | 1.40 | | | | 1.46 | | | | 1.51 | |
Net investment income | | | 0.35 | (a)(l) | | | 0.88 | | | | 0.98 | | | | 1.06 | | | | 1.18 | | | | 1.08 | |
Portfolio turnover | | | 6 | (n) | | | 15 | | | | 14 | | | | 15 | | | | 21 | | | | 44 | |
Net assets at end of period
(000 omitted) | | | $6,354 | | | | $5,911 | | | | $6,174 | | | | $5,740 | | | | $4,637 | | | | $3,788 | |
See Notes to Financial Statements
31
Financial Highlights – continued
| | | | | | | | | | | | | | | | | | | | | | | | |
| | | Six months
ended
3/31/16 (unaudited) | | | Years ended 9/30 | |
| Class 529B | | | 2015 | | | 2014 | | | 2013 | | | 2012 | | | 2011 | |
| | | | | | | | | | | | | | | | | |
Net asset value, beginning of
period | | | $24.85 | | | | $25.67 | | | | $25.50 | | | | $21.62 | | | | $17.60 | | | | $18.84 | |
| Income (loss) from investment operations | | | | | | | | | | | | | | | | | |
Net investment income (d) | | | $0.00 | (w) | | | $0.01 | | | | $0.02 | | | | $0.06 | | | | $0.07 | | | | $0.05 | |
Net realized and unrealized
gain (loss) on investments
and foreign currency | | | 1.20 | | | | (0.80 | ) | | | 0.26 | | | | 3.90 | | | | 4.00 | | | | (1.23 | ) |
Total from investment
operations | | | $1.20 | | | | $(0.79 | ) | | | $0.28 | | | | $3.96 | | | | $4.07 | | | | $(1.18 | ) |
| Less distributions declared to shareholders | | | | | | | | | | | | | | | | | |
From net investment income | | | $— | | | | $(0.03 | ) | | | $(0.11 | ) | | | $(0.08 | ) | | | $(0.05 | ) | | | $(0.06 | ) |
Net asset value, end of period (x) | | | $26.05 | | | | $24.85 | | | | $25.67 | | | | $25.50 | | | | $21.62 | | | | $17.60 | |
Total return (%) (r)(s)(t)(x) | | | 4.83 | (n) | | | (3.06 | ) | | | 1.11 | | | | 18.37 | | | | 23.16 | | | | (6.31 | ) |
Ratios (%) (to average net assets)
and Supplemental data: | | | | | | | | | | | | | | | | | |
Expenses before expense
reductions (f) | | | 1.75 | (a) | | | 2.22 | | | | 2.20 | | | | 2.24 | | | | 2.26 | | | | 2.27 | |
Expenses after expense
reductions (f) | | | 1.64 | (a) | | | 2.11 | | | | 2.13 | | | | 2.17 | | | | 2.21 | | | | 2.26 | |
Net investment income | | | 0.04 | (a)(l) | | | 0.04 | | | | 0.06 | | | | 0.27 | | | | 0.35 | | | | 0.25 | |
Portfolio turnover | | | 6 | (n) | | | 15 | | | | 14 | | | | 15 | | | | 21 | | | | 44 | |
Net assets at end of period
(000 omitted) | | | $332 | | | | $344 | | | | $499 | | | | $748 | | | | $627 | | | | $634 | |
See Notes to Financial Statements
32
Financial Highlights – continued
| | | | | | | | | | | | | | | | | | | | | | | | |
| | | Six months
ended
3/31/16 (unaudited) | | | Years ended 9/30 | |
| Class 529C | | | 2015 | | | 2014 | | | 2013 | | | 2012 | | | 2011 | |
| | | | | | | | | | | | | | | | | |
Net asset value, beginning of
period | | | $24.66 | | | | $25.56 | | | | $25.41 | | | | $21.59 | | | | $17.63 | | | | $18.88 | |
| Income (loss) from investment operations | | | | | | | | | | | | | | | | | |
Net investment income (loss) (d) | | | $(0.06 | ) | | | $0.02 | | | | $0.04 | | | | $0.06 | | | | $0.10 | | | | $0.08 | |
Net realized and unrealized
gain (loss) on investments
and foreign currency | | | 1.20 | | | | (0.80 | ) | | | 0.24 | | | | 3.89 | | | | 3.96 | | | | (1.26 | ) |
Total from investment
operations | | | $1.14 | | | | $(0.78 | ) | | | $0.28 | | | | $3.95 | | | | $4.06 | | | | $(1.18 | ) |
| Less distributions declared to shareholders | | | | | | | | | | | | | | | | | |
From net investment income | | | $(0.05 | ) | | | $(0.12 | ) | | | $(0.13 | ) | | | $(0.13 | ) | | | $(0.10 | ) | | | $(0.07 | ) |
Net asset value, end of period (x) | | | $25.75 | | | | $24.66 | | | | $25.56 | | | | $25.41 | | | | $21.59 | | | | $17.63 | |
Total return (%) (r)(s)(t)(x) | | | 4.62 | (n) | | | (3.08 | ) | | | 1.09 | | | | 18.38 | | | | 23.12 | | | | (6.29 | ) |
Ratios (%) (to average net assets)
and Supplemental data: | | | | | | | | | | | | | | | | | |
Expenses before expense
reductions (f) | | | 2.23 | (a) | | | 2.22 | | | | 2.21 | | | | 2.24 | | | | 2.26 | | | | 2.28 | |
Expenses after expense
reductions (f) | | | 2.13 | (a) | | | 2.12 | | | | 2.14 | | | | 2.19 | | | | 2.21 | | | | 2.26 | |
Net investment income (loss) | | | (0.45 | )(a)(l) | | | 0.09 | | | | 0.15 | | | | 0.27 | | | | 0.51 | | | | 0.40 | |
Portfolio turnover | | | 6 | (n) | | | 15 | | | | 14 | | | | 15 | | | | 21 | | | | 44 | |
Net assets at end of period
(000 omitted) | | | $1,968 | | | | $1,965 | | | | $2,015 | | | | $1,913 | | | | $1,494 | | | | $1,026 | |
| (d) | Per share data is based on average shares outstanding. |
| (f) | Ratios do not reflect reductions from fees paid indirectly, if applicable. |
| (g) | The per share amount varies from the net realized and unrealized gain/loss for the period because of the timing of sales of fund shares and the per share amount of realized and unrealized gains and losses at such time. |
| (i) | For the period from the class inception, June 1, 2012, through the stated period end. |
| (l) | Recognition of net investment income by the fund may be affected by the timing of the declaration of dividends by companies in which the fund invests and the actual annual net investment income ratio may differ. |
| (r) | Certain expenses have been reduced without which performance would have been lower. |
| (s) | From time to time the fund may receive proceeds from litigation settlements, without which performance would be lower. |
| (t) | Total returns do not include any applicable sales charges. |
| (x) | The net asset values and total returns have been calculated on net assets which include adjustments made in accordance with U.S. generally accepted accounting principles required at period end for financial reporting purposes. |
See Notes to Financial Statements
33
NOTES TO FINANCIAL STATEMENTS
(unaudited)
(1) Business and Organization
MFS International New Discovery Fund (the fund) is a diversified series of MFS Series Trust V (the trust). The trust is organized as a Massachusetts business trust and is registered under the Investment Company Act of 1940, as amended, as an open-end management investment company.
The fund is an investment company and accordingly follows the investment company accounting and reporting guidance of the Financial Accounting Standards Board (FASB) Accounting Standards Codification Topic 946 Financial Services – Investment Companies.
The fund has entered into contractual arrangements with an investment adviser, administrator, distributor, shareholder servicing agent, 529 program manager (if applicable), and custodian who each provide services to the fund. Unless expressly stated otherwise, shareholders are not parties to, or intended beneficiaries of these contractual arrangements, and these contractual arrangements are not intended to create any shareholder right to enforce them against the service providers or to seek any remedy under them against the service providers, either directly or on behalf of the fund.
Under the Trust’s By-Laws and Declaration of Trust, any claims asserted against or on behalf of the MFS Funds, including claims against Trustees and Officers, must be brought in states and federal courts located within the Commonwealth of Massachusetts.
(2) Significant Accounting Policies
General – The preparation of financial statements in conformity with U.S. generally accepted accounting principles requires management to make estimates and assumptions that affect the reported amounts of assets and liabilities, and disclosure of contingent assets and liabilities at the date of the financial statements and the reported amounts of increases and decreases in net assets from operations during the reporting period. Actual results could differ from those estimates. In the preparation of these financial statements, management has evaluated subsequent events occurring after the date of the fund’s Statement of Assets and Liabilities through the date that the financial statements were issued. The fund invests in foreign securities, including securities of emerging market issuers. Investments in foreign securities are vulnerable to the effects of changes in the relative values of the local currency and the U.S. dollar and to the effects of changes in each country’s legal, political, and economic environment. The markets of emerging markets countries are generally more volatile than the markets of developed countries with more mature economies. All of the risks of investing in foreign securities previously described are heightened when investing in emerging markets countries.
In January 2016, FASB issued Accounting Standards Update 2016-01, Financial Instruments – Overall (Subtopic 825-10) – Recognition and Measurement of Financial Assets and Financial Liabilities (“ASU 2016-01”) which would first be effective for annual reporting periods beginning after December 15, 2017, and interim periods therein. ASU 2016-01, which changes the accounting for equity investments and for
34
Notes to Financial Statements (unaudited) – continued
certain financial liabilities, also modifies the presentation and disclosure requirements for financial instruments. Investment companies are specifically exempted from ASU 2016-01’s equity investment accounting provisions and will continue to follow the industry specific guidance for investment accounting under ASC 946. Although still evaluating the potential impacts of ASU 2016-01 to the fund, management expects that the impact of the fund’s adoption will be limited to additional financial statement disclosures.
Balance Sheet Offsetting – The fund’s accounting policy with respect to balance sheet offsetting is that, absent an event of default by the counterparty or a termination of the agreement, the International Swaps and Derivatives Association (ISDA) Master Agreement does not result in an offset of reported amounts of financial assets and financial liabilities in the Statement of Assets and Liabilities across transactions between the fund and the applicable counterparty. The fund’s right to setoff may be restricted or prohibited by the bankruptcy or insolvency laws of the particular jurisdiction to which a specific master netting agreement counterparty is subject. Balance sheet offsetting disclosures, to the extent applicable to the fund, have been included in the fund’s Significant Accounting Policies note under the captions for each of the fund’s in-scope financial instruments and transactions.
Investment Valuations – Equity securities, including restricted equity securities, are generally valued at the last sale or official closing price on their primary market or exchange as provided by a third-party pricing service. Equity securities, for which there were no sales reported that day, are generally valued at the last quoted daily bid quotation on their primary market or exchange as provided by a third-party pricing service. Short-term instruments with a maturity at issuance of 60 days or less may be valued at amortized cost, which approximates market value. Open-end investment companies are generally valued at net asset value per share. Securities and other assets generally valued on the basis of information from a third-party pricing service may also be valued at a broker/dealer bid quotation. Values obtained from third-party pricing services can utilize both transaction data and market information such as yield, quality, coupon rate, maturity, type of issue, trading characteristics, and other market data. The values of foreign securities and other assets and liabilities expressed in foreign currencies are converted to U.S. dollars using the mean of bid and asked prices for rates provided by a third-party pricing service.
The Board of Trustees has delegated primary responsibility for determining or causing to be determined the value of the fund’s investments (including any fair valuation) to the adviser pursuant to valuation policies and procedures approved by the Board. If the adviser determines that reliable market quotations are not readily available, investments are valued at fair value as determined in good faith by the adviser in accordance with such procedures under the oversight of the Board of Trustees. Under the fund’s valuation policies and procedures, market quotations are not considered to be readily available for most types of debt instruments and floating rate loans and many types of derivatives. These investments are generally valued at fair value based on information from third-party pricing services. In addition, investments may be valued at fair value if the adviser determines that an investment’s value has been materially affected by events occurring after the close of the exchange or market on which the investment is principally traded (such as foreign exchange or market) and prior to the determination
35
Notes to Financial Statements (unaudited) – continued
of the fund’s net asset value, or after the halting of trading of a specific security where trading does not resume prior to the close of the exchange or market on which the security is principally traded. Events that occur on a frequent basis after foreign markets close (such as developments in foreign markets and significant movements in the U.S. markets) and prior to the determination of the fund’s net asset value may be deemed to have a material effect on the value of securities traded in foreign markets. Accordingly, the fund’s foreign equity securities may often be valued at fair value. The adviser generally relies on third-party pricing services or other information (such as the correlation with price movements of similar securities in the same or other markets; the type, cost and investment characteristics of the security; the business and financial condition of the issuer; and trading and other market data) to assist in determining whether to fair value and at what value to fair value an investment. The value of an investment for purposes of calculating the fund’s net asset value can differ depending on the source and method used to determine value. When fair valuation is used, the value of an investment used to determine the fund’s net asset value may differ from quoted or published prices for the same investment. There can be no assurance that the fund could obtain the fair value assigned to an investment if it were to sell the investment at the same time at which the fund determines its net asset value per share.
Various inputs are used in determining the value of the fund’s assets or liabilities. These inputs are categorized into three broad levels. In certain cases, the inputs used to measure fair value may fall into different levels of the fair value hierarchy. In such cases, an investment’s level within the fair value hierarchy is based on the lowest level of input that is significant to the fair value measurement. The fund’s assessment of the significance of a particular input to the fair value measurement in its entirety requires judgment, and considers factors specific to the investment. Level 1 includes unadjusted quoted prices in active markets for identical assets or liabilities. Level 2 includes other significant observable market-based inputs (including quoted prices for similar securities, interest rates, prepayment speed, and credit risk). Level 3 includes unobservable inputs, which may include the adviser’s own assumptions in determining the fair value of investments. The following is a summary of the levels used as of March 31, 2016 in valuing the fund’s assets or liabilities:
| | | | | | | | | | | | | | | | |
| Investments at Value | | Level 1 | | | Level 2 | | | Level 3 | | | Total | |
| Equity Securities: | | | | | | | | | | | | | | | | |
United Kingdom | | | $1,246,929,554 | | | | $— | | | | $— | | | | $1,246,929,554 | |
Japan | | | 848,505,301 | | | | 4,557,750 | | | | — | | | | 853,063,051 | |
Germany | | | 333,579,503 | | | | — | | | | — | | | | 333,579,503 | |
France | | | 232,999,058 | | | | — | | | | — | | | | 232,999,058 | |
Hong Kong | | | 174,267,226 | | | | — | | | | — | | | | 174,267,226 | |
Canada | | | 147,107,417 | | | | — | | | | — | | | | 147,107,417 | |
Denmark | | | 123,139,205 | | | | — | | | | — | | | | 123,139,205 | |
Switzerland | | | 120,244,802 | | | | — | | | | — | | | | 120,244,802 | |
Australia | | | 118,750,039 | | | | — | | | | — | | | | 118,750,039 | |
Other Countries | | | 1,222,475,295 | | | | 60,520,255 | | | | — | | | | 1,282,995,550 | |
| Mutual Funds | | | 126,894,815 | | | | — | | | | — | | | | 126,894,815 | |
| Total Investments | | | $4,694,892,215 | | | | $65,078,005 | | | | $— | | | | $4,759,970,220 | |
36
Notes to Financial Statements (unaudited) – continued
For further information regarding security characteristics, see the Portfolio of Investments.
Of the level 1 investments presented above, equity investments amounting to $1,344,727,663 would have been considered level 2 investments at the beginning of the period. The primary reason for changes in the classifications between levels 1 and 2 occurs when foreign equity securities are fair valued using other observable market-based inputs in place of the closing exchange price due to events occurring after the close of the exchange or market on which the investment is principally traded. The fund’s foreign equity securities may often be valued at fair value. The fund’s policy is to recognize transfers between the levels as of the end of the period.
Foreign Currency Translation – Purchases and sales of foreign investments, income, and expenses are converted into U.S. dollars based upon currency exchange rates prevailing on the respective dates of such transactions or on the reporting date for foreign denominated receivables and payables. Gains and losses attributable to foreign currency exchange rates on sales of securities are recorded for financial statement purposes as net realized gains and losses on investments. Gains and losses attributable to foreign exchange rate movements on receivables, payables, income and expenses are recorded for financial statement purposes as foreign currency transaction gains and losses. That portion of both realized and unrealized gains and losses on investments that results from fluctuations in foreign currency exchange rates is not separately disclosed.
Security Loans – Under its Securities Lending Agency Agreement with the fund, JPMorgan Chase and Co. (“Chase”), as lending agent, loans the securities of the fund to certain qualified institutions (the “Borrowers”) approved by the fund. Security loans can be terminated at the discretion of either the lending agent or the fund and the related securities must be returned within the earlier of the standard trade settlement period for such securities or within three business days. The loans are collateralized by cash and/or U.S. Treasury and federal agency obligations in an amount typically at least equal to the market value of the securities loaned. On loans collateralized by cash, the cash collateral is invested in a money market fund. The market value of the loaned securities is determined at the close of business of the fund and any additional required collateral is delivered to the fund on the next business day. Chase provides the fund with indemnification against Borrower default. In the event of Borrower default, Chase will, for the benefit of the fund, either purchase securities identical to those loaned or, when such purchase is commercially impracticable, pay the fund the market value of the loaned securities. In return, Chase assumes the fund’s rights to the related collateral. If the collateral value is less than the cost to purchase identical securities, Chase is responsible for the shortfall, but only to the extent that such shortfall is not due to a decline in collateral value resulting from collateral reinvestment for which the fund bears the risk of loss. At period end, the fund had investment securities on loan, all of which were classified as equity securities in the fund’s Portfolio of Investments, with a fair value of $38,376,174. The fair value of the fund’s investment securities on loan and a related liability of $40,223,975 for cash collateral received on securities loaned are both presented gross in the Statement of Assets and Liabilities. The collateral received on securities loaned exceeded the value of securities on loan at period end. The liability for cash collateral for securities loaned is carried at fair value,
37
Notes to Financial Statements (unaudited) – continued
which is categorized as level 2 within the fair value hierarchy. A portion of the income generated upon investment of the collateral is remitted to the Borrowers, and the remainder is allocated between the fund and the lending agent. On loans collateralized by U.S. Treasury and/or federal agency obligations, a fee is received from the Borrower, and is allocated between the fund and the lending agent. Income from securities lending is included in “Interest” income in the Statement of Operations. The dividend and interest income earned on the securities loaned is accounted for in the same manner as other dividend and interest income.
Indemnifications – Under the fund’s organizational documents, its officers and Trustees may be indemnified against certain liabilities and expenses arising out of the performance of their duties to the fund. Additionally, in the normal course of business, the fund enters into agreements with service providers that may contain indemnification clauses. The fund’s maximum exposure under these agreements is unknown as this would involve future claims that may be made against the fund that have not yet occurred.
Investment Transactions and Income – Investment transactions are recorded on the trade date. Interest income is recorded on the accrual basis. Dividends received in cash are recorded on the ex-dividend date. Certain dividends from foreign securities will be recorded when the fund is informed of the dividend if such information is obtained subsequent to the ex-dividend date. Dividend and interest payments received in additional securities are recorded on the ex-dividend or ex-interest date in an amount equal to the value of the security on such date.
The fund may receive proceeds from litigation settlements. Any proceeds received from litigation involving portfolio holdings are reflected in the Statement of Operations in realized gain/loss if the security has been disposed of by the fund or in unrealized gain/loss if the security is still held by the fund. Any other proceeds from litigation not related to portfolio holdings are reflected as other income in the Statement of Operations.
Fees Paid Indirectly – The fund’s custody fee may be reduced by a credit earned under an arrangement that measures the value of U.S. dollars deposited with the custodian by the fund. The amount of the credit, for the six months ended March 31, 2016, is shown as a reduction of total expenses in the Statement of Operations.
Tax Matters and Distributions – The fund intends to qualify as a regulated investment company, as defined under Subchapter M of the Internal Revenue Code, and to distribute all of its taxable income, including realized capital gains. As a result, no provision for federal income tax is required. The fund’s federal tax returns, when filed, will remain subject to examination by the Internal Revenue Service for a three year period. Management has analyzed the fund’s tax positions taken on federal and state tax returns for all open tax years and does not believe that there are any uncertain tax positions that require recognition of a tax liability. Foreign taxes, if any, have been accrued by the fund in the accompanying financial statements in accordance with the applicable foreign tax law. Foreign income taxes may be withheld by certain countries in which the fund invests. Additionally, capital gains realized by the fund on securities issued in or by certain foreign countries may be subject to capital gains tax imposed by those countries.
38
Notes to Financial Statements (unaudited) – continued
Distributions to shareholders are recorded on the ex-dividend date. Income and capital gain distributions are determined in accordance with income tax regulations, which may differ from U.S. generally accepted accounting principles. Certain capital accounts in the financial statements are periodically adjusted for permanent differences in order to reflect their tax character. These adjustments have no impact on net assets or net asset value per share. Temporary differences which arise from recognizing certain items of income, expense, gain or loss in different periods for financial statement and tax purposes will reverse at some time in the future. Distributions in excess of net investment income or net realized gains are temporary overdistributions for financial statement purposes resulting from differences in the recognition or classification of income or distributions for financial statement and tax purposes.
Book/tax differences primarily relate to passive foreign investment companies and wash sale loss deferrals.
The tax character of distributions made during the current period will be determined at fiscal year end. The tax character of distributions declared to shareholders for the last fiscal year is as follows:
| | | | |
| | | 9/30/15 | |
Ordinary income (including any
short-term capital gains) | | | $61,557,406 | |
The federal tax cost and the tax basis components of distributable earnings were as follows:
| | | | |
| As of 3/31/16 | | | |
| Cost of investments | | | $3,951,255,583 | |
| Gross appreciation | | | 1,270,029,084 | |
| Gross depreciation | | | (461,314,447 | ) |
| Net unrealized appreciation (depreciation) | | | $808,714,637 | |
| |
| As of 9/30/15 | | | |
| Undistributed ordinary income | | | 50,926,261 | |
| Capital loss carryforwards | | | (25,298,362 | ) |
| Post-October capital loss deferral | | | (14,189,417 | ) |
| Other temporary differences | | | (3,924,825 | ) |
| Net unrealized appreciation (depreciation) | | | 654,382,158 | |
The aggregate cost above includes prior fiscal year end tax adjustments, if applicable.
Under the Regulated Investment Company Modernization Act of 2010 (the “Act”), net capital losses recognized for fund fiscal years beginning after September 30, 2011 may be carried forward indefinitely, and their character is retained as short-term and/or long-term losses (“post-enactment losses”). Previously, net capital losses were carried forward for eight years and treated as short-term losses (“pre-enactment losses”). As a transition rule, the Act requires that all post-enactment net capital losses be used before pre-enactment net capital losses.
39
Notes to Financial Statements (unaudited) – continued
As of September 30, 2015, the fund had capital loss carryforwards available to offset future realized gains. Such pre-enactment losses expire as follows:
Multiple Classes of Shares of Beneficial Interest – The fund offers multiple classes of shares, which differ in their respective distribution, service, and program manager fees. The fund’s income, realized and unrealized gain (loss), and common expenses are allocated to shareholders based on the daily net assets of each class. Dividends are declared separately for each class. Differences in per share dividend rates are generally due to differences in separate class expenses. Class B and Class 529B shares will convert to Class A and Class 529A shares, respectively, approximately eight years after purchase. The fund’s distributions declared to shareholders as reported in the Statements of Changes in Net Assets are presented by class as follows:
| | | | | | | | |
| | | From net investment
income | |
| | | Six months
ended
3/31/16 | | | Year
ended
9/30/15 | |
| Class A | | | $12,649,875 | | | | $16,965,167 | |
| Class B | | | 16,424 | | | | 27,944 | |
| Class C | | | 285,680 | | | | 706,071 | |
| Class I | | | 20,669,811 | | | | 24,422,472 | |
| Class R2 | | | 378,775 | | | | 627,682 | |
| Class R3 | | | 1,396,765 | | | | 1,804,986 | |
| Class R4 | | | 3,997,456 | | | | 4,763,774 | |
| Class R5 | | | 11,471,066 | | | | 12,160,108 | |
| Class 529A | | | 57,447 | | | | 69,455 | |
| Class 529B | | | — | | | | 657 | |
| Class 529C | | | 3,931 | | | | 9,090 | |
| Total | | | $50,927,230 | | | | $61,557,406 | |
(3) Transactions with Affiliates
Investment Adviser – The fund has an investment advisory agreement with MFS to provide overall investment management and related administrative services and facilities to the fund. The management fee is computed daily and paid monthly at the following annual rates:
| | | | |
| First $500 million of average daily net assets | | | 0.975 | % |
| Next $4.5 billion of average daily net assets | | | 0.925 | % |
| Average daily net assets in excess of $5 billion | | | 0.850 | % |
The investment adviser has agreed in writing to reduce its management fee to 0.90% of average daily net assets in excess of $1 billion up to $3 billion, 0.85% of average daily net assets in excess of $3 billion up to $5 billion, 0.80% of average daily net
assets in excess of $5 billion up to $10 billion, and 0.75% of average daily net assets in excess of $10 billion. This written agreement will continue until modified by the fund’s Board of Trustees, but such agreement will continue at least until January 31, 2017. For the six months ended March 31, 2016, this management fee reduction amounted to $923,241, which is included in the reduction of total expenses in the Statement of
40
Notes to Financial Statements (unaudited) – continued
Operations. MFS has also agreed in writing to reduce its management fee by a specified amount if certain MFS mutual fund assets exceed thresholds agreed to by MFS and the fund’s Board of Trustees. For the six months ended March 31, 2016, this management fee reduction amounted to $183,991, which is included in the reduction of total expenses in the Statement of Operations. The management fee incurred for the six months ended March 31, 2016 was equivalent to an annual effective rate of 0.88% of the fund’s average daily net assets.
Distributor – MFS Fund Distributors, Inc. (MFD), a wholly-owned subsidiary of MFS, as distributor, received $234,490 and $1,341 for the six months ended March 31, 2016, as its portion of the initial sales charge on sales of Class A and Class 529A shares of the fund, respectively. The Board of Trustees has adopted a distribution plan for certain share classes pursuant to Rule 12b-1 of the Investment Company Act of 1940.
The fund’s distribution plan provides that the fund will pay MFD for services provided by MFD and financial intermediaries in connection with the distribution and servicing of certain share classes. One component of the plan is a distribution fee paid to MFD and another component of the plan is a service fee paid to MFD. MFD may subsequently pay all, or a portion, of the distribution and/or service fees to financial intermediaries.
Distribution Plan Fee Table:
| | | | | | | | | | | | | | | | | | | | |
| | | Distribution
Fee Rate (d) | | | Service
Fee Rate (d) | | | Total
Distribution
Plan (d) | | | Annual
Effective
Rate (e) | | | Distribution
and Service
Fee | |
| Class A | | | — | | | | 0.25% | | | | 0.25% | | | | 0.25% | | | | $1,755,858 | |
| Class B | | | 0.75% | | | | 0.25% | | | | 1.00% | | | | 1.00% | | | | 94,585 | |
| Class C | | | 0.75% | | | | 0.25% | | | | 1.00% | | | | 1.00% | | | | 835,505 | |
| Class R1 | | | 0.75% | | | | 0.25% | | | | 1.00% | | | | 1.00% | | | | 15,516 | |
| Class R2 | | | 0.25% | | | | 0.25% | | | | 0.50% | | | | 0.50% | | | | 148,636 | |
| Class R3 | | | — | | | | 0.25% | | | | 0.25% | | | | 0.25% | | | | 184,356 | |
| Class 529A | | | — | | | | 0.25% | | | | 0.25% | | | | 0.20% | | | | 7,669 | |
| Class 529B | | | 0.75% | | | | 0.25% | | | | 1.00% | | | | 0.50% | | | | 856 | |
| Class 529C | | | 0.75% | | | | 0.25% | | | | 1.00% | | | | 0.99% | | | | 9,789 | |
| Total Distribution and Service Fees | | | | $3,052,770 | |
| (d) | In accordance with the distribution plan for certain classes, the fund pays distribution and/or service fees equal to these annual percentage rates of each class’s average daily net assets. The distribution and service fee rates disclosed by class represent the current rates in effect at the end of the reporting period. Any rate changes, if applicable, are detailed below. |
| (e) | The annual effective rates represent actual fees incurred under the distribution plan for the six months ended March 31, 2016 based on each class’s average daily net assets. MFD has voluntarily agreed to rebate a portion of each class’s 0.25% service fee attributable to accounts for which MFD retains the 0.25% service fee except for accounts attributable to MFS or its affiliates’ seed money. For the six months ended March 31, 2016, this rebate amounted to $9,643, $29, $197, $1,433, $29, and $94 for Class A, Class B, Class C, Class 529A, Class 529B, and Class 529C, respectively, and is included in the reduction of total expenses in the Statement of Operations. For the period December 1, 2015 through March 31, 2016, the 0.75% distribution fee was not imposed for Class 529B shares. This waiver can be discontinued at any time. |
Certain Class A shares are subject to a contingent deferred sales charge (CDSC) in the event of a shareholder redemption within 18 months of purchase. Class C and Class 529C shares are subject to a CDSC in the event of a shareholder redemption
41
Notes to Financial Statements (unaudited) – continued
within 12 months of purchase. Class B and Class 529B shares are subject to a CDSC in the event of a shareholder redemption within six years of purchase. All contingent deferred sales charges are paid to MFD and during the six months ended March 31, 2016, were as follows:
| | | | |
| Class A | | | $2,700 | |
| Class B | | | 8,638 | |
| Class C | | | 3,951 | |
| Class 529B | | | — | |
| Class 529C | | | 16 | |
The fund has entered into and may from time to time enter into contracts with program managers and other parties which administer the tuition programs through which an investment in the fund’s 529 share classes is made. The fund has entered into an agreement with MFD pursuant to which MFD receives an annual fee of up to 0.10% of the average daily net assets attributable to each 529 share class. MFD has agreed to waive a portion of this fee in an amount equal to 0.05% of the average daily net assets for each 529 share class. This waiver agreement will expire on January 31, 2017, unless MFD elects to extend the waiver. For the six months ended March 31, 2016, this waiver amounted to $2,106 and is included in the reduction of total expenses in the Statement of Operations. The program manager fee incurred for the six months ended March 31, 2016 was equivalent to an annual effective rate of 0.05% of the average daily net assets attributable to each 529 share class. The services provided by MFD, or a third party with which MFD contracts, include recordkeeping and tax reporting and account services, as well as services designed to maintain the program’s compliance with the Internal Revenue Code and other regulatory requirements. Program manager fees and waivers for the six months ended March 31, 2016, were as follows:
| | | | | | | | |
| | | Fee | | | Waiver | |
| Class 529A | | | $3,068 | | | | $1,533 | |
| Class 529B | | | 166 | | | | 83 | |
| Class 529C | | | 979 | | | | 490 | |
| Total Program Manager Fees and Waivers | | | $4,213 | | | | $2,106 | |
Shareholder Servicing Agent – MFS Service Center, Inc. (MFSC), a wholly-owned subsidiary of MFS, receives a fee from the fund for its services as shareholder servicing agent calculated as a percentage of the average daily net assets of the fund as determined periodically under the supervision of the fund’s Board of Trustees. For the six months ended March 31, 2016, the fee was $131,478, which equated to 0.0055% annually of the fund’s average daily net assets. MFSC also receives payment from the fund for out-of-pocket expenses, sub-accounting and other shareholder servicing costs which may be paid to affiliated and unaffiliated service providers. Class R5 shares do not incur sub-accounting fees. For the six months ended March 31, 2016, these out-of-pocket expenses, sub-accounting and other shareholder servicing costs amounted to $2,657,868.
Administrator – MFS provides certain financial, legal, shareholder communications, compliance, and other administrative services to the fund. Under an administrative services agreement, the fund reimburses MFS the costs incurred to provide these
42
Notes to Financial Statements (unaudited) – continued
services. The fund is charged an annual fixed amount of $17,500 plus a fee based on average daily net assets. The administrative services fee incurred for the six months ended March 31, 2016 was equivalent to an annual effective rate of 0.0133% of the fund’s average daily net assets.
Trustees’ and Officers’ Compensation – The fund pays compensation to independent Trustees in the form of a retainer, attendance fees, and additional compensation to Board and Committee chairpersons. The fund does not pay compensation directly to Trustees or officers of the fund who are also officers of the investment adviser, all of whom receive remuneration for their services to the fund from MFS. Certain officers and Trustees of the fund are officers or directors of MFS, MFD, and MFSC.
Prior to December 31, 2001, the fund had an unfunded defined benefit plan (“DB plan”) for independent Trustees. As of December 31, 2001, the Board took action to terminate the DB plan with respect to then-current and any future independent Trustees, such that the DB plan covers only certain of those former independent Trustees who retired on or before December 31, 2001. Effective January 1, 2002, accrued benefits under the DB plan for then-current independent Trustees who continued were credited to an unfunded retirement deferral plan (the “Retirement Deferral plan”), which was established for and exists solely with respect to these credited amounts, and is not available for other deferrals by these or other independent Trustees. Although the Retirement Deferral plan is unfunded, amounts deferred under the plan are periodically adjusted for investment experience as if they had been invested in shares of the fund. The Retirement Deferral plan resulted in a net decrease in expense of $62 and is included in “Independent Trustees’ compensation” in the Statement of Operations for the six months ended March 31, 2016. The liability for deferred retirement benefits payable to certain independent Trustees under the Retirement Deferral plan amounted to $1,911 at March 31, 2016, and is included in “Payable for independent Trustees’ compensation” in the Statement of Assets and Liabilities.
Other – This fund and certain other funds managed by MFS (the funds) have entered into a service agreement (the ISO Agreement) which provides for payment of fees solely by the funds to Tarantino LLC in return for the provision of services of an Independent Senior Officer (ISO) for the funds. Frank L. Tarantino serves as the ISO and is an officer of the funds and the sole member of Tarantino LLC. The funds can terminate the ISO Agreement with Tarantino LLC at any time under the terms of the ISO Agreement. For the six months ended March 31, 2016, the fee paid by the fund under this agreement was $6,244 and is included in “Miscellaneous” expense in the Statement of Operations. MFS has agreed to bear all expenses associated with office space, other administrative support, and supplies provided to the ISO.
The fund invests in the MFS Institutional Money Market Portfolio which is managed by MFS and seeks current income consistent with preservation of capital and liquidity. Income earned on this investment is included in “Dividends from underlying affiliated funds” in the Statement of Operations. This money market fund does not pay a management fee to MFS.
The fund is permitted to engage in purchase and sale transactions (“cross-trades”) with funds and accounts for which MFS serves as investment adviser or sub-adviser pursuant
43
Notes to Financial Statements (unaudited) – continued
to a policy adopted by the Board of Trustees. This policy has been designed to ensure that cross-trades conducted by the fund comply with Rule 17a-7 under the Investment Company Act of 1940. Under this policy, cross-trades are effected at current market prices with no remuneration paid in connection with the transaction. During the six months ended March 31, 2016, the fund engaged in purchase and sale transactions pursuant to this policy, which amounted to $36,631,394 and $6,842,450 respectively. The sales transactions resulted in net realized gains of $1,597,359.
(4) Portfolio Securities
For the six months ended March 31, 2016, purchases and sales of investments and short-term obligations, aggregated $302,483,210 and $536,154,294, respectively.
(5) Shares of Beneficial Interest
The fund’s Declaration of Trust permits the Trustees to issue an unlimited number of full and fractional shares of beneficial interest. Transactions in fund shares were as follows:
| | | | | | | | | | | | | | | | |
| | | Six months ended
3/31/16 | | | Year ended
9/30/15 | |
| | | Shares | | | Amount | | | Shares | | | Amount | |
| Shares sold | | | | | | | | | | | | | | | | |
Class A | | | 3,900,052 | | | | $105,282,737 | | | | 9,526,220 | | | | $267,054,485 | |
Class B | | | 37,478 | | | | 992,179 | | | | 69,896 | | | | 1,917,751 | |
Class C | | | 241,468 | | | | 6,275,071 | | | | 637,354 | | | | 17,103,232 | |
Class I | | | 7,042,223 | | | | 196,894,691 | | | | 16,724,971 | | | | 481,167,702 | |
Class R1 | | | 14,260 | | | | 359,447 | | | | 45,198 | | | | 1,177,494 | |
Class R2 | | | 176,456 | | | | 4,650,348 | | | | 630,803 | | | | 17,160,889 | |
Class R3 | | | 826,704 | | | | 22,480,355 | | | | 1,628,728 | | | | 45,155,247 | |
Class R4 | | | 1,822,522 | | | | 49,370,350 | | | | 3,593,756 | | | | 100,674,926 | |
Class R5 | | | 2,601,558 | | | | 72,538,196 | | | | 5,228,368 | | | | 150,199,662 | |
Class 529A | | | 13,346 | | | | 359,804 | | | | 26,140 | | | | 723,568 | |
Class 529B | | | 359 | | | | 9,118 | | | | 2,014 | | | | 53,616 | |
Class 529C | | | 3,426 | | | | 85,639 | | | | 8,082 | | | | 207,683 | |
| | | 16,679,852 | | | | $459,297,935 | | | | 38,121,530 | | | | $1,082,596,255 | |
| | | |
Shares issued to shareholders in
reinvestment of distributions | | | | | | | | | | | | | |
Class A | | | 432,759 | | | | $11,896,538 | | | | 591,364 | | | | $15,966,827 | |
Class B | | | 600 | | | | 16,057 | | | | 1,028 | | | | 27,022 | |
Class C | | | 9,699 | | | | 255,383 | | | | 23,827 | | | | 616,176 | |
Class I | | | 582,138 | | | | 16,439,574 | | | | 688,231 | | | | 19,084,653 | |
Class R2 | | | 13,224 | | | | 354,527 | | | | 22,038 | | | | 580,256 | |
Class R3 | | | 51,201 | | | | 1,396,765 | | | | 67,350 | | | | 1,804,986 | |
Class R4 | | | 135,818 | | | | 3,729,566 | | | | 165,817 | | | | 4,472,095 | |
Class R5 | | | 378,352 | | | | 10,688,458 | | | | 419,437 | | | | 11,635,178 | |
Class 529A | | | 2,121 | | | | 57,447 | | | | 2,610 | | | | 69,455 | |
Class 529B | | | — | | | | — | | | | 26 | | | | 657 | |
Class 529C | | | 155 | | | | 3,931 | | | | 362 | | | | 9,090 | |
| | | 1,606,067 | | | | $44,838,246 | | | | 1,982,090 | | | | $54,266,395 | |
44
Notes to Financial Statements (unaudited) – continued
| | | | | | | | | | | | | | | | |
| | | Six months ended
3/31/16 | | | Year ended
9/30/15 | |
| | | Shares | | | Amount | | | Shares | | | Amount | |
| Shares reacquired | | | | | | | | | | | | | |
Class A | | | (6,322,116 | ) | | | $(171,050,707 | ) | | | (13,740,162 | ) | | | $(384,267,450 | ) |
Class B | | | (82,986 | ) | | | (2,165,569 | ) | | | (224,368 | ) | | | (6,067,688 | ) |
Class C | | | (480,368 | ) | | | (12,353,962 | ) | | | (1,131,060 | ) | | | (30,080,627 | ) |
Class I | | | (13,638,246 | ) | | | (373,824,570 | ) | | | (18,452,198 | ) | | | (525,840,817 | ) |
Class R1 | | | (23,974 | ) | | | (603,624 | ) | | | (202,930 | ) | | | (5,097,345 | ) |
Class R2 | | | (342,600 | ) | | | (8,995,240 | ) | | | (1,124,310 | ) | | | (30,447,951 | ) |
Class R3 | | | (981,971 | ) | | | (26,169,901 | ) | | | (1,872,868 | ) | | | (51,716,498 | ) |
Class R4 | | | (3,465,305 | ) | | | (94,186,501 | ) | | | (3,784,885 | ) | | | (105,990,473 | ) |
Class R5 | | | (1,587,268 | ) | | | (44,209,080 | ) | | | (2,855,745 | ) | | | (82,116,096 | ) |
Class 529A | | | (7,924 | ) | | | (213,339 | ) | | | (30,661 | ) | | | (841,645 | ) |
Class 529B | | | (1,484 | ) | | | (38,269 | ) | | | (7,614 | ) | | | (201,265 | ) |
Class 529C | | | (6,808 | ) | | | (171,703 | ) | | | (7,585 | ) | | | (194,586 | ) |
| | | (26,941,050 | ) | | | $(733,982,465 | ) | | | (43,434,386 | ) | | | $(1,222,862,441 | ) |
| | | | |
| Net change | | | | | | | | | | | | | | | | |
Class A | | | (1,989,305 | ) | | | $(53,871,432 | ) | | | (3,622,578 | ) | | | $(101,246,138 | ) |
Class B | | | (44,908 | ) | | | (1,157,333 | ) | | | (153,444 | ) | | | (4,122,915 | ) |
Class C | | | (229,201 | ) | | | (5,823,508 | ) | | | (469,879 | ) | | | (12,361,219 | ) |
Class I | | | (6,013,885 | ) | | | (160,490,305 | ) | | | (1,038,996 | ) | | | (25,588,462 | ) |
Class R1 | | | (9,714 | ) | | | (244,177 | ) | | | (157,732 | ) | | | (3,919,851 | ) |
Class R2 | | | (152,920 | ) | | | (3,990,365 | ) | | | (471,469 | ) | | | (12,706,806 | ) |
Class R3 | | | (104,066 | ) | | | (2,292,781 | ) | | | (176,790 | ) | | | (4,756,265 | ) |
Class R4 | | | (1,506,965 | ) | | | (41,086,585 | ) | | | (25,312 | ) | | | (843,452 | ) |
Class R5 | | | 1,392,642 | | | | 39,017,574 | | | | 2,792,060 | | | | 79,718,744 | |
Class 529A | | | 7,543 | | | | 203,912 | | | | (1,911 | ) | | | (48,622 | ) |
Class 529B | | | (1,125 | ) | | | (29,151 | ) | | | (5,574 | ) | | | (146,992 | ) |
Class 529C | | | (3,227 | ) | | | (82,133 | ) | | | 859 | | | | 22,187 | |
| | | (8,655,131 | ) | | | $(229,846,284 | ) | | | (3,330,766 | ) | | | $(85,999,791 | ) |
The fund is one of several mutual funds in which certain MFS funds may invest. The MFS funds do not invest in the underlying funds for the purpose of exercising management or control. At the end of the period, the MFS International Diversification Fund, the MFS Growth Allocation Fund, the MFS Aggressive Growth Allocation Fund, and the MFS Moderate Allocation Fund, were the owners of record of approximately 10%, 2%, 1%, and 1%, respectively, of the value of outstanding voting shares of the fund. In addition, the MFS Lifetime 2020 Fund, the MFS Lifetime 2025 Fund, and the MFS Lifetime 2030 Fund, the MFS Lifetime 2035 Fund, the MFS Lifetime 2040 Fund, the MFS Lifetime 2045 Fund, the MFS Lifetime 2050 Fund, and the MFS Lifetime 2055 Fund were each the owners of record of less than 1% of the value of outstanding voting shares of the fund.
(6) Line of Credit
The fund and certain other funds managed by MFS participate in a $1.25 billion unsecured committed line of credit, subject to a $1 billion sublimit, provided by a
45
Notes to Financial Statements (unaudited) – continued
syndication of banks under a credit agreement. Borrowings may be made for temporary financing needs. Interest is charged to each fund, based on its borrowings, generally at a rate equal to the higher of the Overnight Federal Reserve funds rate or daily one month LIBOR plus an agreed upon spread. A commitment fee, based on the average daily, unused portion of the committed line of credit, is allocated among the participating funds at the end of each calendar quarter. In addition, the fund and other funds managed by MFS have established unsecured uncommitted borrowing arrangements with certain banks for temporary financing needs. Interest is charged to each fund, based on its borrowings, at a rate equal to the Overnight Federal Reserve funds rate plus an agreed upon spread. For the six months ended March 31, 2016, the fund’s commitment fee and interest expense were $8,564 and $0, respectively, and are included in “Miscellaneous” expense in the Statement of Operations.
(7) Transactions in Underlying Affiliated Funds-Affiliated Issuers
An affiliated issuer may be considered one in which the fund owns 5% or more of the outstanding voting securities, or a company which is under common control. For the purposes of this report, the fund assumes the following to be affiliated issuers:
| | | | | | | | | | | | | | | | |
| Underlying Affiliated Fund | | Beginning
Shares/Par
Amount | | | Acquisitions
Shares/Par
Amount | | | Dispositions
Shares/Par
Amount | | | Ending
Shares/Par
Amount | |
MFS Institutional Money
Market Portfolio | | | 152,475,413 | | | | 265,433,828 | | | | (331,238,401 | ) | | | 86,670,840 | |
| | | | |
| Underlying Affiliated Fund | | Realized
Gain (Loss) | | | Capital Gain
Distributions | | | Dividend
Income | | | Ending
Value | |
MFS Institutional Money
Market Portfolio | | | $— | | | | $— | | | | $88,032 | | | | $86,670,840 | |
| | | | |
| Other Affiliated Issuers | | Beginning
Shares/Par
Amount | | | Acquisitions
Shares/Par
Amount | | | Dispositions
Shares/Par
Amount | | | Ending
Shares/Par
Amount | |
| AUB Group Ltd. | | | 3,393,873 | | | | 108,940 | | | | — | | | | 3,502,813 | |
| Midland Holdings Ltd. | | | 44,623,000 | | | | 980,000 | | | | — | | | | 45,603,000 | |
| | | | |
| Other Affiliated Issuers | | Realized
Gain (Loss) | | | Capital Gain
Distributions | | | Dividend
Income | | | Ending
Value | |
| AUB Group Ltd. | | | $— | | | | $— | | | | $660,478 | | | | $22,017,666 | |
| Midland Holdings Ltd. | | | — | | | | — | | | | — | | | | 14,226,412 | |
| | | | | | | | | | | | | | | | |
| Total | | | $— | | | | $— | | | | $660,478 | | | | $36,244,078 | |
| | | | | | | | | | | | | | | | |
46
PROXY VOTING POLICIES AND INFORMATION
MFS votes proxies on behalf of the fund pursuant to proxy voting policies and procedures that are available without charge, upon request, by calling 1-800-225-2606, by visiting the Proxy Voting section of mfs.com or by visiting the SEC’s Web site at http://www.sec.gov.
Information regarding how the fund voted proxies relating to portfolio securities during the most recent twelve-month period ended June 30 is available without charge by visiting the Proxy Voting section of mfs.com or by visiting the SEC’s Web site at http://www.sec.gov.
QUARTERLY PORTFOLIO DISCLOSURE
The fund will file a complete schedule of portfolio holdings with the Securities and Exchange Commission (the Commission) for the first and third quarters of each fiscal year on Form N-Q. A shareholder can obtain the quarterly portfolio holdings report at mfs.com. The fund’s Form N-Q is also available on the EDGAR database on the Commission’s Internet Web site at http://www.sec.gov, and may be reviewed and copied at the:
Public Reference Room
Securities and Exchange Commission
100 F Street, NE, Room 1580
Washington, D.C. 20549
Information on the operation of the Public Reference Room may be obtained by calling the Commission at 1-800-SEC-0330. Copies of the fund’s Form N-Q also may be obtained, upon payment of a duplicating fee, by electronic request at the following e-mail address: publicinfo@sec.gov or by writing the Public Reference Section at the above address.
FURTHER INFORMATION
From time to time, MFS may post important information about the fund or the MFS funds on the MFS web site (mfs.com). This information is available by visiting the “Market Commentary” and “Announcements” sub sections in the “Market Outlooks” section of mfs.com or by clicking on the fund’s name under “Mutual Funds” in the “Products” section of mfs.com.
PROVISION OF FINANCIAL REPORTS AND SUMMARY PROSPECTUSES
The fund produces financial reports every six months and updates its summary prospectus and prospectus annually. To avoid sending duplicate copies of materials to households, only one copy of the fund’s annual and semiannual report and summary prospectus may be mailed to shareholders having the same last name and residential address on the fund’s records. However, any shareholder may contact MFSC (please see back cover for address and telephone number) to request that copies of these reports and summary prospectuses be sent personally to that shareholder.
47
Save paper with eDelivery.

| MFS® will send you prospectuses, |
reports, and proxies directly via e-mail so you will get information faster with less mailbox clutter.
To sign up:
1. Go to mfs.com.
2. Log in via MFS® Access.
3. Select eDelivery.
If you own your MFS fund shares through a financial institution or a retirement plan, MFS® TALK, MFS® Access, or eDelivery may not be available to you.
CONTACT
WEB SITE
mfs.com
MFS TALK
1-800-637-8255
24 hours a day
ACCOUNT SERVICE AND LITERATURE
Shareholders
1-800-225-2606
Financial advisors
1-800-343-2829
Retirement plan services
1-800-637-1255
MAILING ADDRESS
MFS Service Center, Inc.
P.O. Box 55824
Boston, MA 02205-5824
OVERNIGHT MAIL
MFS Service Center, Inc.
c/o Boston Financial Data Services
30 Dan Road
Canton, MA 02021-2809
SEMIANNUAL REPORT
March 31, 2016

MFS® RESEARCH FUND

MFR-SEM
MFS® RESEARCH FUND
CONTENTS
The report is prepared for the general information of shareholders.
It is authorized for distribution to prospective investors only when preceded or accompanied by a current prospectus.
NOT FDIC INSURED • MAY LOSE VALUE • NO BANK GUARANTEE

LETTER FROM THE CHAIRMAN
Dear Shareholders:
Markets remained volatile in the first quarter of 2016, but after a tough start to the year stocks largely recouped their losses, with most major indices closing out the
quarter roughly where they were at the beginning of the year. After falling to multiyear lows in February, oil prices stabilized as oil-producing nations began taking steps to cap crude production. U.S. economic growth remained positive but unspectacular amid continued improvement in labor markets and upbeat service-sector activity. Headwinds from abroad forced the U.S. Federal Reserve to table its plans to tighten monetary policy, while the Bank of Japan and the European Central Bank continued to ease policy aggressively, perpetuating a lower-for-longer global interest rate environment.
China’s economy — while suffering growing pains linked to its shift from an export-led to a consumer-driven economic model — appeared to stabilize as the first quarter drew to a close. Europe awaits a crucial referendum scheduled for June 23 in which British voters will decide whether the United Kingdom should remain in the European Union.
As markets have become more focused on short-term trends in recent years, we believe it’s important for investors to lengthen their investment time horizon. At MFS®, we don’t trade on headlines or trends; we invest for the long term.
We believe that this approach, coupled with the professional guidance of a financial advisor, will help you reach your investment goals.
Respectfully,

Robert J. Manning
Chairman
MFS Investment Management
May 16, 2016
The opinions expressed in this letter are subject to change and may not be relied upon for investment advice. No forecasts can be guaranteed.
1
PORTFOLIO COMPOSITION
Portfolio structure
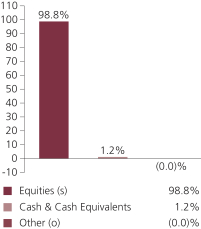
| | | | |
| Top ten holdings | | | | |
| Apple, Inc. | | | 2.8% | |
| Danaher Corp. | | | 2.5% | |
| Visa, Inc., “A” | | | 2.3% | |
| Alphabet, Inc., “A” | | | 2.3% | |
| Wells Fargo & Co. | | | 2.1% | |
| JPMorgan Chase & Co. | | | 1.9% | |
| Facebook, Inc., “A” | | | 1.7% | |
| Amazon.com, Inc. | | | 1.5% | |
| Medtronic PLC | | | 1.5% | |
| Cisco Systems, Inc. | | | 1.4% | |
| | | | |
| Global equity sectors | | | | |
| Technology | | | 19.3% | |
| Financial Services | | | 15.6% | |
| Consumer Cyclicals | | | 14.1% | |
| Health Care | | | 13.7% | |
| Capital Goods | | | 13.5% | |
| Energy | | | 9.9% | |
| Consumer Staples | | | 8.4% | |
| Telecommunications/Cable Television (s) | | | 4.3% | |
| (s) | Includes securities sold short. |
From time to time Other may be negative due to equivalent exposure from currency derivatives and/or offsets to derivative positions.
Cash & Cash Equivalents includes any cash, investments in money market funds, short-term securities, and other assets less liabilities. Please see the Statement of Assets and Liabilities for additional information related to the fund’s cash position and other assets and liabilities.
Other includes currency derivatives and/or any offsets to derivative positions.
Percentages are based on net assets as of 3/31/16.
The portfolio is actively managed and current holdings may be different.
2
EXPENSE TABLE
Fund expenses borne by the shareholders during the period, October 1, 2015 through March 31, 2016
As a shareholder of the fund, you incur two types of costs: (1) transaction costs, including sales charges (loads) on certain purchase or redemption payments, and (2) ongoing costs, including management fees; distribution and service (12b-1) fees; and other fund expenses. This example is intended to help you understand your ongoing costs (in dollars) of investing in the fund and to compare these costs with the ongoing costs of investing in other mutual funds.
The example is based on an investment of $1,000 invested at the beginning of the period and held for the entire period October 1, 2015 through March 31, 2016.
Actual Expenses
The first line for each share class in the following table provides information about actual account values and actual expenses. You may use the information in this line, together with the amount you invested, to estimate the expenses that you paid over the period. Simply divide your account value by $1,000 (for example, an $8,600 account value divided by $1,000 = 8.6), then multiply the result by the number in the first line under the heading entitled “Expenses Paid During Period” to estimate the expenses you paid on your account during this period.
Hypothetical Example for Comparison Purposes
The second line for each share class in the following table provides information about hypothetical account values and hypothetical expenses based on the fund’s actual expense ratio and an assumed rate of return of 5% per year before expenses, which is not the fund’s actual return. The hypothetical account values and expenses may not be used to estimate the actual ending account balance or expenses you paid for the period. You may use this information to compare the ongoing costs of investing in the fund and other funds. To do so, compare this 5% hypothetical example with the 5% hypothetical examples that appear in the shareholder reports of the other funds.
Please note that the expenses shown in the table are meant to highlight your ongoing costs only and do not reflect any transactional costs, such as sales charges (loads). Therefore, the second line for each share class in the table is useful in comparing ongoing costs only, and will not help you determine the relative total costs of owning different funds. In addition, if these transactional costs were included, your costs would have been higher.
3
Expense Table – continued
| | | | | | | | | | | | | | | | | | |
Share
Class | | | | Annualized
Expense
Ratio | | | Beginning
Account Value
10/01/15 | | | Ending
Account Value
3/31/16 | | | Expenses
Paid During
Period (p)
10/01/15-3/31/16 | |
| A | | Actual | | | 0.82% | | | | $1,000.00 | | | | $1,064.20 | | | | $4.23 | |
| | Hypothetical (h) | | | 0.82% | | | | $1,000.00 | | | | $1,020.90 | | | | $4.14 | |
| B | | Actual | | | 1.57% | | | | $1,000.00 | | | | $1,059.99 | | | | $8.09 | |
| | Hypothetical (h) | | | 1.57% | | | | $1,000.00 | | | | $1,017.15 | | | | $7.92 | |
| C | | Actual | | | 1.57% | | | | $1,000.00 | | | | $1,059.95 | | | | $8.09 | |
| | Hypothetical (h) | | | 1.57% | | | | $1,000.00 | | | | $1,017.15 | | | | $7.92 | |
| I | | Actual | | | 0.57% | | | | $1,000.00 | | | | $1,065.57 | | | | $2.94 | |
| | Hypothetical (h) | | | 0.57% | | | | $1,000.00 | | | | $1,022.15 | | | | $2.88 | |
| R1 | | Actual | | | 1.57% | | | | $1,000.00 | | | | $1,060.01 | | | | $8.09 | |
| | Hypothetical (h) | | | 1.57% | | | | $1,000.00 | | | | $1,017.15 | | | | $7.92 | |
| R2 | | Actual | | | 1.07% | | | | $1,000.00 | | | | $1,063.09 | | | | $5.52 | |
| | Hypothetical (h) | | | 1.07% | | | | $1,000.00 | | | | $1,019.65 | | | | $5.40 | |
| R3 | | Actual | | | 0.82% | | | | $1,000.00 | | | | $1,064.37 | | | | $4.23 | |
| | Hypothetical (h) | | | 0.82% | | | | $1,000.00 | | | | $1,020.90 | | | | $4.14 | |
| R4 | | Actual | | | 0.57% | | | | $1,000.00 | | | | $1,065.57 | | | | $2.94 | |
| | Hypothetical (h) | | | 0.57% | | | | $1,000.00 | | | | $1,022.15 | | | | $2.88 | |
| R5 | | Actual | | | 0.49% | | | | $1,000.00 | | | | $1,066.02 | | | | $2.53 | |
| | Hypothetical (h) | | | 0.49% | | | | $1,000.00 | | | | $1,022.55 | | | | $2.48 | |
| (h) | 5% class return per year before expenses. |
| (p) | “Expenses Paid During Period” are equal to each class’s annualized expense ratio, as shown above, multiplied by the average account value over the period, multiplied by 183/366 (to reflect the one-half year period). Expenses paid do not include any applicable sales charges (loads). If these transaction costs had been included, your costs would have been higher. |
Notes to Expense Table
Expense ratios include 0.01% of investment related expenses from short sales (See Note 2 of the Notes to Financial Statements).
4
PORTFOLIO OF INVESTMENTS
3/31/16 (unaudited)
The Portfolio of Investments is a complete list of all securities owned by your fund. It is categorized by broad-based asset classes.
| | | | | | | | |
| Common Stocks - 98.6% | | | | | | | | |
| Issuer | | Shares/Par | | | Value ($) | |
| Aerospace - 3.8% | | | | | | | | |
| Honeywell International, Inc. | | | 462,806 | | | $ | 51,857,412 | |
| Northrop Grumman Corp. | | | 222,343 | | | | 44,001,680 | |
| Orbital ATK, Inc. | | | 253,465 | | | | 22,036,247 | |
| Rockwell Collins, Inc. | | | 228,712 | | | | 21,089,534 | |
| United Technologies Corp. | | | 420,458 | | | | 42,087,846 | |
| | | | | | | | |
| | | | $ | 181,072,719 | |
| Alcoholic Beverages - 0.8% | | | | | | | | |
| Constellation Brands, Inc., “A” | | | 268,898 | | | $ | 40,627,799 | |
| | |
| Apparel Manufacturers - 2.0% | | | | | | | | |
| Hanesbrands, Inc. | | | 884,736 | | | $ | 25,073,418 | |
| NIKE, Inc., “B” | | | 743,834 | | | | 45,723,476 | |
| PVH Corp. | | | 266,908 | | | | 26,439,906 | |
| | | | | | | | |
| | | | $ | 97,236,800 | |
| Automotive - 0.3% | | | | | | | | |
| Harley-Davidson, Inc. | | | 324,686 | | | $ | 16,666,132 | |
| | |
| Biotechnology - 1.9% | | | | | | | | |
| Alexion Pharmaceuticals, Inc. (a) | | | 272,036 | | | $ | 37,872,852 | |
| Celgene Corp. (a) | | | 527,266 | | | | 52,774,054 | |
| | | | | | | | |
| | | | $ | 90,646,906 | |
| Broadcasting - 2.1% | | | | | | | | |
| Nielsen Holdings PLC | | | 510,452 | | | $ | 26,880,402 | |
| Time Warner, Inc. | | | 541,980 | | | | 39,320,649 | |
| Twenty-First Century Fox, Inc. | | | 1,330,479 | | | | 37,093,755 | |
| | | | | | | | |
| | | | $ | 103,294,806 | |
| Brokerage & Asset Managers - 2.3% | | | | | | | | |
| BlackRock, Inc. | | | 186,924 | | | $ | 63,660,707 | |
| NASDAQ, Inc. | | | 732,084 | | | | 48,595,736 | |
| | | | | | | | |
| | | | $ | 112,256,443 | |
| Business Services - 4.1% | | | | | | | | |
| Accenture PLC, “A” | | | 337,501 | | | $ | 38,947,615 | |
| Cognizant Technology Solutions Corp., “A” (a) | | | 532,137 | | | | 33,364,990 | |
| Equifax, Inc. | | | 198,324 | | | | 22,666,450 | |
| Fidelity National Information Services, Inc. | | | 504,204 | | | | 31,921,155 | |
5
Portfolio of Investments (unaudited) – continued
| | | | | | | | |
| Issuer | | Shares/Par | | | Value ($) | |
| Common Stocks - continued | | | | | | | | |
| Business Services - continued | | | | | | | | |
| Fiserv, Inc. (a) | | | 232,546 | | | $ | 23,854,569 | |
| Gartner, Inc. (a) | | | 240,837 | | | | 21,518,786 | |
| Global Payments, Inc. | | | 367,372 | | | | 23,989,392 | |
| | | | | | | | |
| | | | $ | 196,262,957 | |
| Cable TV - 1.9% | | | | | | | | |
| Charter Communications, Inc., “A” (a)(l) | | | 190,260 | | | $ | 38,514,332 | |
| Comcast Corp., “A” | | | 309,927 | | | | 18,930,341 | |
| Time Warner Cable, Inc. | | | 174,675 | | | | 35,741,998 | |
| | | | | | | | |
| | | | $ | 93,186,671 | |
| Chemicals - 1.8% | | | | | | | | |
| E.I. du Pont de Nemours & Co. | | | 437,373 | | | $ | 27,694,458 | |
| Monsanto Co. | | | 308,241 | | | | 27,045,065 | |
| PPG Industries, Inc. | | | 272,839 | | | | 30,418,820 | |
| | | | | | | | |
| | | | $ | 85,158,343 | |
| Computer Software - 3.0% | | | | | | | | |
| Adobe Systems, Inc. (a) | | | 409,031 | | | $ | 38,367,108 | |
| Microsoft Corp. | | | 382,723 | | | | 21,137,791 | |
| Qlik Technologies, Inc. (a) | | | 605,501 | | | | 17,511,089 | |
| Sabre Corp. | | | 741,325 | | | | 21,439,119 | |
| Salesforce.com, Inc. (a) | | | 654,562 | | | | 48,326,312 | |
| | | | | | | | |
| | | | $ | 146,781,419 | |
| Computer Software - Systems - 3.9% | | | | | | | | |
| Apple, Inc. (s) | | | 1,257,247 | | | $ | 137,027,350 | |
| Constellation Software, Inc. | | | 30,945 | | | | 12,670,831 | |
| Hewlett Packard Enterprise | | | 2,297,026 | | | | 40,726,271 | |
| | | | | | | | |
| | | | $ | 190,424,452 | |
| Construction - 0.8% | | | | | | | | |
| Sherwin-Williams Co. | | | 132,522 | | | $ | 37,725,038 | |
| | |
| Consumer Products - 1.7% | | | | | | | | |
| Estee Lauder Cos., Inc., “A” | | | 254,605 | | | $ | 24,011,798 | |
| Kimberly-Clark Corp. | | | 255,283 | | | | 34,338,116 | |
| Newell Rubbermaid, Inc. (l) | | | 569,162 | | | | 25,208,185 | |
| | | | | | | | |
| | | | $ | 83,558,099 | |
| Consumer Services - 0.6% | | | | | | | | |
| Priceline Group, Inc. (a) | | | 24,190 | | | $ | 31,179,942 | |
6
Portfolio of Investments (unaudited) – continued
| | | | | | | | |
| Issuer | | Shares/Par | | | Value ($) | |
| Common Stocks - continued | | | | | | | | |
| Containers - 0.5% | | | | | | | | |
| Berry Plastics Group, Inc. (a) | | | 290,000 | | | $ | 10,483,500 | |
| Crown Holdings, Inc. (a) | | | 297,859 | | | | 14,770,828 | |
| | | | | | | | |
| | | | $ | 25,254,328 | |
| Electrical Equipment - 3.4% | | | | | | | | |
| Danaher Corp. (s) | | | 1,255,330 | | | $ | 119,080,604 | |
| Tyco International PLC | | | 638,134 | | | | 23,425,899 | |
| W.W. Grainger, Inc. (l) | | | 99,744 | | | | 23,283,242 | |
| | | | | | | | |
| | | | $ | 165,789,745 | |
| Electronics - 1.2% | | | | | | | | |
| Analog Devices, Inc. | | | 231,162 | | | $ | 13,682,479 | |
| Broadcom Corp. | | | 275,286 | | | | 42,531,687 | |
| | | | | | | | |
| | | | $ | 56,214,166 | |
| Energy - Independent - 3.7% | | | | | | | | |
| EOG Resources, Inc. | | | 799,892 | | | $ | 58,056,161 | |
| EQT Corp. | | | 252,202 | | | | 16,963,107 | |
| Memorial Resource Development Corp. (a) | | | 2,029,187 | | | | 20,657,124 | |
| Noble Energy, Inc. | | | 596,146 | | | | 18,724,946 | |
| Pioneer Natural Resources Co. | | | 168,746 | | | | 23,749,312 | |
| Valero Energy Corp. | | | 606,745 | | | | 38,916,624 | |
| | | | | | | | |
| | | | $ | 177,067,274 | |
| Energy - Integrated - 1.2% | | | | | | | | |
| Exxon Mobil Corp. (s) | | | 699,598 | | | $ | 58,479,397 | |
| | |
| Food & Beverages - 3.8% | | | | | | | | |
| Archer Daniels Midland Co. | | | 394,910 | | | $ | 14,339,182 | |
| Blue Buffalo Pet Products, Inc. (a) | | | 538,624 | | | | 13,821,092 | |
| Coca-Cola Co. | | | 1,327,881 | | | | 61,600,400 | |
| J.M. Smucker Co. | | | 188,430 | | | | 24,465,751 | |
| Mead Johnson Nutrition Co., “A” | | | 322,026 | | | | 27,362,549 | |
| Mondelez International, Inc. | | | 980,604 | | | | 39,341,832 | |
| | | | | | | | |
| | | | $ | 180,930,806 | |
| Food & Drug Stores - 1.2% | | | | | | | | |
| CVS Health Corp. | | | 552,838 | | | $ | 57,345,885 | |
| | |
| General Merchandise - 2.5% | | | | | | | | |
| Costco Wholesale Corp. | | | 295,038 | | | $ | 46,492,088 | |
| Dollar Tree, Inc. (a) | | | 428,844 | | | | 35,362,476 | |
| Target Corp. | | | 467,315 | | | | 38,450,678 | |
| | | | | | | | |
| | | | $ | 120,305,242 | |
7
Portfolio of Investments (unaudited) – continued
| | | | | | | | |
| Issuer | | Shares/Par | | | Value ($) | |
| Common Stocks - continued | | | | | | | | |
| Health Maintenance Organizations - 1.5% | | | | | | | | |
| Cigna Corp. | | | 116,909 | | | $ | 16,044,591 | |
| UnitedHealth Group, Inc. | | | 419,423 | | | | 54,063,625 | |
| | | | | | | | |
| | | | $ | 70,108,216 | |
| Insurance - 2.3% | | | | | | | | |
| American International Group, Inc. | | | 866,896 | | | $ | 46,855,729 | |
| Chubb Ltd. | | | 530,824 | | | | 63,247,680 | |
| | | | | | | | |
| | | | $ | 110,103,409 | |
| Internet - 5.7% | | | | | | | | |
| Alibaba Group Holding Ltd., ADR (a) | | | 222,116 | | | $ | 17,553,827 | |
| Alphabet, Inc., “A” (a) | | | 146,840 | | | | 112,024,236 | |
| Alphabet, Inc., “C” (a) | | | 65,755 | | | | 48,984,187 | |
| Facebook, Inc., “A” (a) | | | 697,225 | | | | 79,553,372 | |
| LinkedIn Corp., “A” (a) | | | 128,441 | | | | 14,687,228 | |
| | | | | | | | |
| | | | $ | 272,802,850 | |
| Machinery & Tools - 1.0% | | | | | | | | |
| Roper Technologies, Inc. | | | 277,243 | | | $ | 50,671,703 | |
| | |
| Major Banks - 5.8% | | | | | | | | |
| Goldman Sachs Group, Inc. | | | 296,636 | | | $ | 46,565,919 | |
| JPMorgan Chase & Co. | | | 1,569,942 | | | | 92,971,965 | |
| PNC Financial Services Group, Inc. | | | 455,150 | | | | 38,492,036 | |
| Wells Fargo & Co. | | | 2,114,864 | | | | 102,274,823 | |
| | | | | | | | |
| | | | $ | 280,304,743 | |
| Medical & Health Technology & Services - 1.1% | | | | | | | | |
| McKesson Corp. | | | 171,713 | | | $ | 27,001,869 | |
| VCA, Inc. (a) | | | 472,143 | | | | 27,237,930 | |
| | | | | | | | |
| | | | $ | 54,239,799 | |
| Medical Equipment - 4.4% | | | | | | | | |
| Cooper Cos., Inc. | | | 177,717 | | | $ | 27,363,086 | |
| Medtronic PLC | | | 934,873 | | | | 70,115,475 | |
| PerkinElmer, Inc. | | | 421,998 | | | | 20,872,021 | |
| Steris PLC | | | 174,720 | | | | 12,413,856 | |
| Stryker Corp. | | | 518,607 | | | | 55,641,345 | |
| VWR Corp. (a) | | | 990,359 | | | | 26,799,115 | |
| | | | | | | | |
| | | | $ | 213,204,898 | |
| Natural Gas - Distribution - 0.7% | | | | | | | | |
| Sempra Energy | | | 312,445 | | | $ | 32,509,902 | |
8
Portfolio of Investments (unaudited) – continued
| | | | | | | | |
| Issuer | | Shares/Par | | | Value ($) | |
| Common Stocks - continued | | | | | | | | |
| Natural Gas - Pipeline - 0.5% | | | | | | | | |
| Enterprise Products Partners LP | | | 920,780 | | | $ | 22,669,604 | |
| | |
| Network & Telecom - 1.4% | | | | | | | | |
| Cisco Systems, Inc. | | | 2,306,602 | | | $ | 65,668,959 | |
|
| Oil Services - 1.1% | |
| Halliburton Co. | | | 872,350 | | | $ | 31,160,342 | |
| Schlumberger Ltd. | | | 269,570 | | | | 19,880,788 | |
| | | | | | | | |
| | | | $ | 51,041,130 | |
| Other Banks & Diversified Financials - 4.0% | | | | | | | | |
| Discover Financial Services | | | 549,758 | | | $ | 27,993,677 | |
| PrivateBancorp, Inc. | | | 617,481 | | | | 23,834,767 | |
| Visa, Inc., “A” | | | 1,478,047 | | | | 113,041,035 | |
| Wintrust Financial Corp. | | | 602,933 | | | | 26,734,049 | |
| | | | | | | | |
| | | | $ | 191,603,528 | |
| Pharmaceuticals - 4.8% | | | | | | | | |
| Allergan PLC (a) | | | 192,421 | | | $ | 51,574,601 | |
| Bristol-Myers Squibb Co. | | | 354,608 | | | | 22,652,359 | |
| Eli Lilly & Co. | | | 830,489 | | | | 59,803,513 | |
| Endo International PLC (a) | | | 427,521 | | | | 12,034,716 | |
| Merck & Co., Inc. | | | 1,190,845 | | | | 63,007,609 | |
| Zoetis, Inc. | | | 484,917 | | | | 21,496,371 | |
| | | | | | | | |
| | | | $ | 230,569,169 | |
| Railroad & Shipping - 1.3% | | | | | | | | |
| Canadian Pacific Railway Ltd. | | | 113,527 | | | $ | 15,063,898 | |
| Union Pacific Corp. | | | 597,054 | | | | 47,495,646 | |
| | | | | | | | |
| | | | $ | 62,559,544 | |
| Real Estate - 1.2% | | | | | | | | |
| Ventas, Inc., REIT | | | 916,729 | | | $ | 57,717,258 | |
| | |
| Restaurants - 1.3% | | | | | | | | |
| Aramark | | | 946,849 | | | $ | 31,359,639 | |
| YUM! Brands, Inc. | | | 405,443 | | | | 33,185,510 | |
| | | | | | | | |
| | | | $ | 64,545,149 | |
| Specialty Chemicals - 0.5% | | | | | | | | |
| Albemarle Corp. | | | 352,150 | | | $ | 22,512,950 | |
| | |
| Specialty Stores - 4.3% | | | | | | | | |
| Amazon.com, Inc. (a) | | | 123,135 | | | $ | 73,097,861 | |
| AutoZone, Inc. (a) | | | 40,967 | | | | 32,637,999 | |
9
Portfolio of Investments (unaudited) – continued
| | | | | | | | |
| Issuer | | Shares/Par | | | Value ($) | |
| Common Stocks - continued | | | | | | | | |
| Specialty Stores - continued | | | | | | | | |
| Gap, Inc. | | | 657,654 | | | $ | 19,335,028 | |
| Lululemon Athletica, Inc. (a) | | | 316,243 | | | | 21,412,814 | |
| Ross Stores, Inc. | | | 569,968 | | | | 33,001,147 | |
| Urban Outfitters, Inc. (a) | | | 778,014 | | | | 25,744,483 | |
| | | | | | | | |
| | | | $ | 205,229,332 | |
| Telecommunications - Wireless - 1.1% | | | | | | | | |
| American Tower Corp., REIT | | | 501,644 | | | $ | 51,353,296 | |
| | |
| Telephone Services - 1.3% | | | | | | | | |
| Verizon Communications, Inc. | | | 1,145,992 | | | $ | 61,975,247 | |
| | |
| Tobacco - 2.0% | | | | | | | | |
| Philip Morris International, Inc. | | | 589,152 | | | $ | 57,801,703 | |
| Reynolds American, Inc. | | | 781,450 | | | | 39,314,749 | |
| | | | | | | | |
| | | | $ | 97,116,452 | |
| Utilities - Electric Power - 2.8% | | | | | | | | |
| American Electric Power Co., Inc. | | | 386,864 | | | $ | 25,687,770 | |
| CMS Energy Corp. | | | 985,711 | | | | 41,833,575 | |
| NextEra Energy, Inc. | | | 366,382 | | | | 43,357,646 | |
| Xcel Energy, Inc. | | | 562,229 | | | | 23,512,417 | |
| | | | | | | | |
| | | | $ | 134,391,408 | |
| Total Common Stocks (Identified Cost, $3,796,407,476) | | | $ | 4,750,363,915 | |
| | | | | | | | | | | | | | | | |
|
| Convertible Preferred Stocks - 0.3% | |
| Telephone Services - 0.3% | |
Frontier Communications Corp., 11.125%
(Identified Cost, $16,064,235) | | | | 158,895 | | | $ | 16,588,638 | |
| | | |
| | | Strike Price | | | First Exercise | | | | |
| Warrants - 0.0% | | | | | | | | | | | | | | | | |
| Medical & Health Technology & Services - 0.0% | |
| HealthSouth Corp. (1 share for 1 warrant) (Identified Cost, $0) (a) | | $ | 41.40 | | | | 1/04/16 | | | | 41,141 | | | $ | 84,339 | |
| |
| Money Market Funds - 0.5% | | | | | |
MFS Institutional Money Market Portfolio, 0.35%,
at Cost and Net Asset Value (v) | | | | 22,862,120 | | | $ | 22,862,120 | |
|
| Collateral for Securities Loaned - 1.7% | |
JPMorgan Prime Money Market Fund, 0.44%,
at Cost and Net Asset Value (j) | | | | 81,085,090 | | | $ | 81,085,090 | |
| Total Investments (Identified Cost, $3,916,418,921) | | | $ | 4,870,984,102 | |
10
Portfolio of Investments (unaudited) – continued
| | | | | | | | |
| Securities Sold Short - (0.2)% | | | | | | | | |
| Issuer | | Shares/Par | | | Value ($) | |
| Telecommunications - Wireless - (0.2)% | | | | | | | | |
Crown Castle International Corp., REIT
(Proceeds Received, $7,242,422) | | | (88,179 | ) | | $ | (7,627,484 | ) |
| | |
| Other Assets, Less Liabilities - (0.9)% | | | | | | | (47,497,611 | ) |
| Net Assets - 100.0% | | | | | | $ | 4,815,859,007 | |
| (a) | Non-income producing security. |
| (j) | The rate quoted is the annualized seven-day yield of the fund at period end. |
| (l) | A portion of this security is on loan. |
| (s) | Security or a portion of the security was pledged to cover collateral requirements for securities sold short. |
| (v) | Underlying affiliated fund that is available only to investment companies managed by MFS. The rate quoted for the MFS Institutional Money Market Portfolio is the annualized seven-day yield of the fund at period end. |
At March 31, 2016, the fund had cash collateral of $22,866 and other liquid securities with an aggregate value of $15,240,524 to cover any commitments for securities sold short. Cash collateral is comprised of “Deposits with brokers” in the Statement of Assets and Liabilities.
The following abbreviations are used in this report and are defined:
| ADR | | American Depositary Receipt |
| PLC | | Public Limited Company |
| REIT | | Real Estate Investment Trust |
See Notes to Financial Statements
11
Financial Statements
STATEMENT OF ASSETS AND LIABILITIES
At 3/31/16 (unaudited)
This statement represents your fund’s balance sheet, which details the assets and liabilities comprising the total value of the fund.
| | | | |
| Assets | | | | |
Investments | | | | |
Non-affiliated issuers, at value (identified cost, $3,893,556,801) | | | $4,848,121,982 | |
Underlying affiliated funds, at cost and value | | | 22,862,120 | |
Total investments, at value, including $79,101,646 of securities on loan (identified cost, $3,916,418,921) | | | $4,870,984,102 | |
Cash | | | 6,357 | |
Deposits with brokers | | | 22,866 | |
Receivables for | | | | |
Investments sold | | | 56,426,262 | |
Fund shares sold | | | 10,029,703 | |
Dividends | | | 5,077,613 | |
Other assets | | | 43,084 | |
Total assets | | | $4,942,589,987 | |
| Liabilities | | | | |
Payables for | | | | |
Securities sold short, at value (proceeds received, $7,242,422) | | | $7,627,484 | |
Investments purchased | | | 29,019,457 | |
Fund shares reacquired | | | 7,654,695 | |
Collateral for securities loaned, at value | | | 81,085,090 | |
Payable to affiliates | | | | |
Investment adviser | | | 116,741 | |
Shareholder servicing costs | | | 1,017,953 | |
Distribution and service fees | | | 27,288 | |
Payable for independent Trustees’ compensation | | | 109,390 | |
Accrued expenses and other liabilities | | | 72,882 | |
Total liabilities | | | $126,730,980 | |
Net assets | | | $4,815,859,007 | |
| Net assets consist of | | | | |
Paid-in capital | | | $3,854,424,746 | |
Unrealized appreciation (depreciation) on investments and translation of assets and liabilities in foreign currencies | | | 954,179,805 | |
Accumulated distributions in excess of net realized gain on investments and foreign currency | | | (2,204,937 | ) |
Undistributed net investment income | | | 9,459,393 | |
Net assets | | | $4,815,859,007 | |
Shares of beneficial interest outstanding | | | 133,061,870 | |
12
Statement of Assets and Liabilities (unaudited) – continued
| | | | | | | | | | | | |
| | | Net assets | | | Shares
outstanding | | | Net asset value
per share (a) | |
Class A | | | $2,239,729,159 | | | | 61,923,296 | | | | $36.17 | |
Class B | | | 24,865,020 | | | | 745,913 | | | | 33.34 | |
Class C | | | 131,899,038 | | | | 3,980,680 | | | | 33.13 | |
Class I | | | 864,277,882 | | | | 23,366,596 | | | | 36.99 | |
Class R1 | | | 4,225,727 | | | | 129,327 | | | | 32.67 | |
Class R2 | | | 27,725,850 | | | | 787,964 | | | | 35.19 | |
Class R3 | | | 53,824,080 | | | | 1,496,118 | | | | 35.98 | |
Class R4 | | | 53,348,309 | | | | 1,475,362 | | | | 36.16 | |
Class R5 | | | 1,415,963,942 | | | | 39,156,614 | | | | 36.16 | |
| (a) | Maximum offering price per share was equal to the net asset value per share for all share classes, except for Class A, for which the maximum offering price per share was $38.38 [100 / 94.25 x $36.17]. On sales of $50,000 or more, the maximum offering price of Class A shares is reduced. A contingent deferred sales charge may be imposed on redemptions of Class A, Class B, and Class C shares. Redemption price per share was equal to the net asset value per share for Classes I, R1, R2, R3, R4, and R5. |
See Notes to Financial Statements
13
Financial Statements
STATEMENT OF OPERATIONS
Six months ended 3/31/16 (unaudited)
This statement describes how much your fund earned in investment income and accrued in expenses. It also describes any gains and/or losses generated by fund operations.
| | | | |
| Net investment income | |
Income | | | | |
Dividends | | | $39,376,882 | |
Interest | | | 218,294 | |
Dividends from underlying affiliated funds | | | 49,021 | |
Foreign taxes withheld | | | (66,415 | ) |
Total investment income | | | $39,577,782 | |
Expenses | | | | |
Management fee | | | $10,054,477 | |
Distribution and service fees | | | 3,699,786 | |
Shareholder servicing costs | | | 1,831,629 | |
Administrative services fee | | | 319,118 | |
Independent Trustees’ compensation | | | 25,815 | |
Custodian fee | | | 84,806 | |
Shareholder communications | | | 60,962 | |
Audit and tax fees | | | 27,145 | |
Legal fees | | | 20,897 | |
Dividend and interest expense on securities sold short | | | 191,446 | |
Miscellaneous | | | 148,302 | |
Total expenses | | | $16,464,383 | |
Fees paid indirectly | | | (70 | ) |
Reduction of expenses by investment adviser and distributor | | | (43,717 | ) |
Net expenses | | | $16,420,596 | |
Net investment income | | | $23,157,186 | |
| Realized and unrealized gain (loss) on investments and foreign currency | |
Realized gain (loss) (identified cost basis) | | | | |
Investments | | | $1,120,615 | |
Foreign currency | | | 7,429 | |
Net realized gain (loss) on investments and foreign currency | | | $1,128,044 | |
Change in unrealized appreciation (depreciation) | | | | |
Investments | | | $265,575,127 | |
Securities sold short | | | (672,806 | ) |
Translation of assets and liabilities in foreign currencies | | | (314 | ) |
Net unrealized gain (loss) on investments and foreign currency translation | | | $264,902,007 | |
Net realized and unrealized gain (loss) on investments and foreign currency | | | $266,030,051 | |
Change in net assets from operations | | | $289,187,237 | |
See Notes to Financial Statements
14
Financial Statements
STATEMENTS OF CHANGES IN NET ASSETS
These statements describe the increases and/or decreases in net assets resulting from operations, any distributions, and any shareholder transactions.
| | | | | | | | |
| Change in net assets | | Six months ended
3/31/16 (unaudited) | | | Year ended
9/30/15 | |
| From operations | | | | | | | | |
Net investment income | | | $23,157,186 | | | | $38,807,497 | |
Net realized gain (loss) on investments and foreign currency | | | 1,128,044 | | | | 324,146,619 | |
Net unrealized gain (loss) on investments and foreign currency translation | | | 264,902,007 | | | | (393,288,159 | ) |
Change in net assets from operations | | | $289,187,237 | | | | $(30,334,043 | ) |
| Distributions declared to shareholders | | | | | | | | |
From net investment income | | | $(41,097,332 | ) | | | $(34,715,497 | ) |
From net realized gain on investments | | | (276,133,861 | ) | | | (219,198,792 | ) |
Total distributions declared to shareholders | | | $(317,231,193 | ) | | | $(253,914,289 | ) |
Change in net assets from fund share transactions | | | $427,265,797 | | | | $195,204,607 | |
Total change in net assets | | | $399,221,841 | | | | $(89,043,725 | ) |
| Net assets | | | | | | | | |
At beginning of period | | | 4,416,637,166 | | | | 4,505,680,891 | |
At end of period (including undistributed net investment income of $9,459,393 and $27,399,539, respectively) | | | $4,815,859,007 | | | | $4,416,637,166 | |
See Notes to Financial Statements
15
Financial Statements
FINANCIAL HIGHLIGHTS
The financial highlights table is intended to help you understand the fund’s financial performance for the semiannual period and the past 5 fiscal years. Certain information reflects financial results for a single fund share. The total returns in the table represent the rate by which an investor would have earned (or lost) on an investment in the fund share class (assuming reinvestment of all distributions) held for the entire period.
| | | | | | | | | | | | | | | | | | | | | | | | |
| | | Six months
ended
3/31/16 (unaudited) | | | Years ended 9/30 | |
| Class A | | | 2015 | | | 2014 | | | 2013 | | | 2012 | | | 2011 | |
| | | | | | | | | | | | | | | | | |
Net asset value, beginning of
period | | | $36.37 | | | | $38.78 | | | | $34.33 | | | | $28.74 | | | | $22.31 | | | | $22.43 | |
| Income (loss) from investment operations | |
Net investment income (d) | | | $0.16 | | | | $0.28 | | | | $0.24 | | | | $0.30 | | | | $0.25 | | | | $0.20 | |
Net realized and unrealized
gain (loss) on investments
and foreign currency | | | 2.15 | | | | (0.53 | ) | | | 5.24 | | | | 5.51 | | | | 6.38 | | | | (0.15 | ) |
Total from investment operations | | | $2.31 | | | | $(0.25 | ) | | | $5.48 | | | | $5.81 | | | | $6.63 | | | | $0.05 | |
| Less distributions declared to shareholders | |
From net investment income | | | $(0.29 | ) | | | $(0.26 | ) | | | $(0.35 | ) | | | $(0.22 | ) | | | $(0.20 | ) | | | $(0.17 | ) |
From net realized gain on
investments | | | (2.22 | ) | | | (1.90 | ) | | | (0.68 | ) | | | — | | | | — | | | | — | |
Total distributions declared to
shareholders | | | $(2.51 | ) | | | $(2.16 | ) | | | $(1.03 | ) | | | $(0.22 | ) | | | $(0.20 | ) | | | $(0.17 | ) |
Net asset value, end of period (x) | | | $36.17 | | | | $36.37 | | | | $38.78 | | | | $34.33 | | | | $28.74 | | | | $22.31 | |
Total return (%) (r)(s)(t)(x) | | | 6.42 | (n) | | | (0.93 | ) | | | 16.27 | | | | 20.36 | | | | 29.92 | | | | 0.16 | |
Ratios (%) (to average net assets)
and Supplemental data: | |
Expenses before expense
reductions (f) | | | 0.82 | (a) | | | 0.82 | | | | 0.81 | | | | 0.88 | | | | 0.90 | | | | 0.90 | |
Expenses after expense
reductions (f) | | | 0.82 | (a) | | | 0.82 | | | | 0.80 | | | | 0.87 | | | | 0.90 | | | | 0.90 | |
Net investment income | | | 0.87 | (a) | | | 0.71 | | | | 0.65 | | | | 0.95 | | | | 0.97 | | | | 0.82 | |
Portfolio turnover | | | 21 | (n) | | | 44 | | | | 39 | | | | 46 | | | | 61 | | | | 69 | |
Net assets at end of period
(000 omitted) | | | $2,239,729 | | | | $2,061,339 | | | | $2,131,106 | | | | $1,915,947 | | | | $1,541,284 | | | | $1,204,531 | |
| Supplemental Ratios (%): | |
Ratio of expenses to average
net assets after expense
reductions excluding short
sale dividend and interest
expense (f) | | | 0.81 | (a) | | | 0.81 | | | | 0.80 | | | | 0.87 | | | | 0.88 | | | | 0.89 | |
See Notes to Financial Statements
16
Financial Highlights – continued
| | | | | | | | | | | | | | | | | | | | | | | | |
| | | Six months
ended
3/31/16 (unaudited) | | | Years ended 9/30 | |
| Class B | | | 2015 | | | 2014 | | | 2013 | | | 2012 | | | 2011 | |
| | | | | | | | | | | | | | | | | |
Net asset value, beginning of
period | | | $33.56 | | | | $35.95 | | | | $31.89 | | | | $26.70 | | | | $20.70 | | | | $20.83 | |
| Income (loss) from investment operations | |
Net investment income (loss) (d) | | | $0.02 | | | | $(0.01 | ) | | | $(0.03 | ) | | | $0.06 | | | | $0.05 | | | | $0.02 | |
Net realized and unrealized
gain (loss) on investments
and foreign currency | | | 1.99 | | | | (0.48 | ) | | | 4.87 | | | | 5.13 | | | | 5.95 | | | | (0.15 | ) |
Total from investment operations | | | $2.01 | | | | $(0.49 | ) | | | $4.84 | | | | $5.19 | | | | $6.00 | | | | $(0.13 | ) |
| Less distributions declared to shareholders | |
From net investment income | | | $(0.01 | ) | | | $— | | | | $(0.10 | ) | | | $— | | | | $— | | | | $— | |
From net realized gain on
investments | | | (2.22 | ) | | | (1.90 | ) | | | (0.68 | ) | | | — | | | | — | | | | — | |
Total distributions declared to
shareholders | | | $(2.23 | ) | | | $(1.90 | ) | | | $(0.78 | ) | | | $— | | | | $— | | | | $— | |
Net asset value, end of period (x) | | | $33.34 | | | | $33.56 | | | | $35.95 | | | | $31.89 | | | | $26.70 | | | | $20.70 | |
Total return (%) (r)(s)(t)(x) | | | 6.03 | (n) | | | (1.66 | ) | | | 15.41 | | | | 19.44 | | | | 28.99 | | | | (0.62 | ) |
Ratios (%) (to average net assets)
and Supplemental data: | |
Expenses before expense
reductions (f) | | | 1.57 | (a) | | | 1.57 | | | | 1.56 | | | | 1.62 | | | | 1.65 | | | | 1.65 | |
Expenses after expense
reductions (f) | | | 1.57 | (a) | | | 1.57 | | | | 1.55 | | | | 1.62 | | | | 1.65 | | | | 1.65 | |
Net investment income (loss) | | | 0.12 | (a) | | | (0.04 | ) | | | (0.09 | ) | | | 0.22 | | | | 0.22 | | | | 0.07 | |
Portfolio turnover | | | 21 | (n) | | | 44 | | | | 39 | | | | 46 | | | | 61 | | | | 69 | |
Net assets at end of period
(000 omitted) | | | $24,865 | | | | $25,338 | | | | $29,834 | | | | $31,773 | | | | $33,019 | | | | $34,609 | |
| Supplemental Ratios (%): | |
Ratio of expenses to average
net assets after expense
reductions excluding short
sale dividend and interest
expense (f) | | | 1.56 | (a) | | | 1.56 | | | | 1.55 | | | | 1.62 | | | | 1.63 | | | | 1.64 | |
See Notes to Financial Statements
17
Financial Highlights – continued
| | | | | | | | | | | | | | | | | | | | | | | | |
| | | Six months
ended
3/31/16 (unaudited) | | | Years ended 9/30 | |
| Class C | | | 2015 | | | 2014 | | | 2013 | | | 2012 | | | 2011 | |
| | | | | | | | | | | | | | | | | |
Net asset value, beginning of
period | | | $33.39 | | | | $35.79 | | | | $31.80 | | | | $26.64 | | | | $20.68 | | | | $20.80 | |
| Income (loss) from investment operations | |
Net investment income (loss) (d) | | | $0.02 | | | | $(0.01 | ) | | | $(0.03 | ) | | | $0.06 | | | | $0.05 | | | | $0.02 | |
Net realized and unrealized
gain (loss) on investments
and foreign currency | | | 1.96 | | | | (0.48 | ) | | | 4.85 | | | | 5.12 | | | | 5.93 | | | | (0.14 | ) |
Total from investment operations | | | $1.98 | | | | $(0.49 | ) | | | $4.82 | | | | $5.18 | | | | $5.98 | | | | $(0.12 | ) |
| Less distributions declared to shareholders | |
From net investment income | | | $(0.02 | ) | | | $(0.01 | ) | | | $(0.15 | ) | | | $(0.02 | ) | | | $(0.02 | ) | | | $(0.00 | )(w) |
From net realized gain on
investments | | | (2.22 | ) | | | (1.90 | ) | | | (0.68 | ) | | | — | | | | — | | | | — | |
Total distributions declared to
shareholders | | | $(2.24 | ) | | | $(1.91 | ) | | | $(0.83 | ) | | | $(0.02 | ) | | | $(0.02 | ) | | | $(0.00 | )(w) |
Net asset value, end of period (x) | | | $33.13 | | | | $33.39 | | | | $35.79 | | | | $31.80 | | | | $26.64 | | | | $20.68 | |
Total return (%) (r)(s)(t)(x) | | | 5.99 | (n) | | | (1.67 | ) | | | 15.40 | | | | 19.47 | | | | 28.94 | | | | (0.56 | ) |
Ratios (%) (to average net assets)
and Supplemental data: | |
Expenses before expense
reductions (f) | | | 1.57 | (a) | | | 1.57 | | | | 1.56 | | | | 1.63 | | | | 1.65 | | | | 1.65 | |
Expenses after expense
reductions (f) | | | 1.57 | (a) | | | 1.57 | | | | 1.55 | | | | 1.63 | | | | 1.65 | | | | 1.65 | |
Net investment income (loss) | | | 0.12 | (a) | | | (0.04 | ) | | | (0.10 | ) | | | 0.20 | | | | 0.22 | | | | 0.07 | |
Portfolio turnover | | | 21 | (n) | | | 44 | | | | 39 | | | | 46 | | | | 61 | | | | 69 | |
Net assets at end of period
(000 omitted) | | | $131,899 | | | | $129,249 | | | | $129,359 | | | | $107,173 | | | | $85,428 | | | | $72,558 | |
| Supplemental Ratios (%): | |
Ratio of expenses to average
net assets after expense
reductions excluding short
sale dividend and interest
expense (f) | | | 1.56 | (a) | | | 1.57 | | | | 1.55 | | | | 1.62 | | | | 1.63 | | | | 1.64 | |
See Notes to Financial Statements
18
Financial Highlights – continued
| | | | | | | | | | | | | | | | | | | | | | | | |
| | | Six months
ended
3/31/16 (unaudited) | | | Years ended 9/30 | |
| Class I | | | 2015 | | | 2014 | | | 2013 | | | 2012 | | | 2011 | |
| | | | | | | | | | | | | | | | | |
Net asset value, beginning of
period | | | $37.18 | | | | $39.59 | | | | $35.03 | | | | $29.31 | | | | $22.75 | | | | $22.86 | |
| Income (loss) from investment operations | |
Net investment income (d) | | | $0.21 | | | | $0.38 | | | | $0.34 | | | | $0.37 | | | | $0.33 | | | | $0.27 | |
Net realized and unrealized
gain (loss) on investments
and foreign currency | | | 2.20 | | | | (0.54 | ) | | | 5.34 | | | | 5.63 | | | | 6.50 | | | | (0.15 | ) |
Total from investment operations | | | $2.41 | | | | $(0.16 | ) | | | $5.68 | | | | $6.00 | | | | $6.83 | | | | $0.12 | |
| Less distributions declared to shareholders | |
From net investment income | | | $(0.38 | ) | | | $(0.35 | ) | | | $(0.44 | ) | | | $(0.28 | ) | | | $(0.27 | ) | | | $(0.23 | ) |
From net realized gain on
investments | | | (2.22 | ) | | | (1.90 | ) | | | (0.68 | ) | | | — | | | | — | | | | — | |
Total distributions declared to
shareholders | | | $(2.60 | ) | | | $(2.25 | ) | | | $(1.12 | ) | | | $(0.28 | ) | | | $(0.27 | ) | | | $(0.23 | ) |
Net asset value, end of period (x) | | | $36.99 | | | | $37.18 | | | | $39.59 | | | | $35.03 | | | | $29.31 | | | | $22.75 | |
Total return (%) (r)(s)(x) | | | 6.56 | (n) | | | (0.68 | ) | | | 16.54 | | | | 20.67 | | | | 30.27 | | | | 0.42 | |
Ratios (%) (to average net assets)
and Supplemental data: | |
Expenses before expense
reductions (f) | | | 0.57 | (a) | | | 0.57 | | | | 0.56 | | | | 0.64 | | | | 0.65 | | | | 0.65 | |
Expenses after expense
reductions (f) | | | 0.57 | (a) | | | 0.57 | | | | 0.56 | | | | 0.64 | | | | 0.65 | | | | 0.65 | |
Net investment income | | | 1.13 | (a) | | | 0.96 | | | | 0.90 | | | | 1.15 | | | | 1.26 | | | | 1.07 | |
Portfolio turnover | | | 21 | (n) | | | 44 | | | | 39 | | | | 46 | | | | 61 | | | | 69 | |
Net assets at end of period
(000 omitted) | | | $864,278 | | | | $723,107 | | | | $705,200 | | | | $559,067 | | | | $237,389 | | | | $608,723 | |
| Supplemental Ratios (%): | |
Ratio of expenses to average
net assets after expense
reductions excluding short
sale dividend and interest
expense (f) | | | 0.56 | (a) | | | 0.57 | | | | 0.56 | | | | 0.63 | | | | 0.63 | | | | 0.64 | |
See Notes to Financial Statements
19
Financial Highlights – continued
| | | | | | | | | | | | | | | | | | | | | | | | |
| | | Six months
ended
3/31/16 (unaudited) | | | Years ended 9/30 | |
| Class R1 | | | 2015 | | | 2014 | | | 2013 | | | 2012 | | | 2011 | |
| | | | | | | | | | | | | | | | | |
Net asset value, beginning of
period | | | $32.95 | | | | $35.35 | | | | $31.42 | | | | $26.32 | | | | $20.42 | | | | $20.54 | |
| Income (loss) from investment operations | |
Net investment income (loss) (d) | | | $0.02 | | | | $(0.01 | ) | | | $(0.03 | ) | | | $0.05 | | | | $0.05 | | | | $0.02 | |
Net realized and unrealized
gain (loss) on investments
and foreign currency | | | 1.94 | | | | (0.47 | ) | | | 4.79 | | | | 5.06 | | | | 5.87 | | | | (0.14 | ) |
Total from investment operations | | | $1.96 | | | | $(0.48 | ) | | | $4.76 | | | | $5.11 | | | | $5.92 | | | | $(0.12 | ) |
| Less distributions declared to shareholders | |
From net investment income | | | $(0.02 | ) | | | $(0.02 | ) | | | $(0.15 | ) | | | $(0.01 | ) | | | $(0.02 | ) | | | $— | |
From net realized gain on
investments | | | (2.22 | ) | | | (1.90 | ) | | | (0.68 | ) | | | — | | | | — | | | | — | |
Total distributions declared to
shareholders | | | $(2.24 | ) | | | $(1.92 | ) | | | $(0.83 | ) | | | $(0.01 | ) | | | $(0.02 | ) | | | $— | |
Net asset value, end of period (x) | | | $32.67 | | | | $32.95 | | | | $35.35 | | | | $31.42 | | | | $26.32 | | | | $20.42 | |
Total return (%) (r)(s)(x) | | | 6.00 | (n) | | | (1.66 | ) | | | 15.41 | | | | 19.43 | | | | 28.99 | | | | (0.58 | ) |
Ratios (%) (to average net assets)
and Supplemental data: | |
Expenses before expense
reductions (f) | | | 1.57 | (a) | | | 1.57 | | | | 1.56 | | | | 1.63 | | | | 1.65 | | | | 1.65 | |
Expenses after expense
reductions (f) | | | 1.57 | (a) | | | 1.57 | | | | 1.56 | | | | 1.63 | | | | 1.65 | | | | 1.65 | |
Net investment income (loss) | | | 0.12 | (a) | | | (0.04 | ) | | | (0.10 | ) | | | 0.19 | | | | 0.22 | | | | 0.07 | |
Portfolio turnover | | | 21 | (n) | | | 44 | | | | 39 | | | | 46 | | | | 61 | | | | 69 | |
Net assets at end of period
(000 omitted) | | | $4,226 | | | | $3,980 | | | | $4,422 | | | | $3,671 | | | | $2,688 | | | | $2,434 | |
| Supplemental Ratios (%): | |
Ratio of expenses to average
net assets after expense
reductions excluding short
sale dividend and interest
expense (f) | | | 1.57 | (a) | | | 1.57 | | | | 1.56 | | | | 1.62 | | | | 1.63 | | | | 1.64 | |
See Notes to Financial Statements
20
Financial Highlights – continued
| | | | | | | | | | | | | | | | | | | | | | | | |
| | | Six months
ended
3/31/16 (unaudited) | | | Years ended 9/30 | |
| Class R2 | | | 2015 | | | 2014 | | | 2013 | | | 2012 | | | 2011 | |
| | | | | | | | | | | | | | | | | |
Net asset value, beginning of
period | | | $35.37 | | | | $37.76 | | | | $33.48 | | | | $28.07 | | | | $21.80 | | | | $21.95 | |
| Income (loss) from investment operations | |
Net investment income (d) | | | $0.11 | | | | $0.17 | | | | $0.15 | | | | $0.21 | | | | $0.18 | | | | $0.14 | |
Net realized and unrealized
gain (loss) on investments
and foreign currency | | | 2.10 | | | | (0.51 | ) | | | 5.10 | | | | 5.37 | | | | 6.25 | | | | (0.16 | ) |
Total from investment operations | | | $2.21 | | | | $(0.34 | ) | | | $5.25 | | | | $5.58 | | | | $6.43 | | | | $(0.02 | ) |
| Less distributions declared to shareholders | |
From net investment income | | | $(0.17 | ) | | | $(0.15 | ) | | | $(0.29 | ) | | | $(0.17 | ) | | | $(0.16 | ) | | | $(0.13 | ) |
From net realized gain on
investments | | | (2.22 | ) | | | (1.90 | ) | | | (0.68 | ) | | | — | | | | — | | | | — | |
Total distributions declared to
shareholders | | | $(2.39 | ) | | | $(2.05 | ) | | | $(0.97 | ) | | | $(0.17 | ) | | | $(0.16 | ) | | | $(0.13 | ) |
Net asset value, end of period (x) | | | $35.19 | | | | $35.37 | | | | $37.76 | | | | $33.48 | | | | $28.07 | | | | $21.80 | |
Total return (%) (r)(s)(x) | | | 6.31 | (n) | | | (1.19 | ) | | | 15.99 | | | | 20.01 | | | | 29.66 | | | | (0.13 | ) |
Ratios (%) (to average net assets)
and Supplemental data: | |
Expenses before expense
reductions (f) | | | 1.07 | (a) | | | 1.07 | | | | 1.06 | | | | 1.13 | | | | 1.15 | | | | 1.15 | |
Expenses after expense
reductions (f) | | | 1.07 | (a) | | | 1.07 | | | | 1.06 | | | | 1.13 | | | | 1.15 | | | | 1.15 | |
Net investment income | | | 0.62 | (a) | | | 0.46 | | | | 0.40 | | | | 0.67 | | | | 0.71 | | | | 0.57 | |
Portfolio turnover | | | 21 | (n) | | | 44 | | | | 39 | | | | 46 | | | | 61 | | | | 69 | |
Net assets at end of period
(000 omitted) | | | $27,726 | | | | $27,224 | | | | $37,003 | | | | $33,970 | | | | $17,583 | | | | $11,711 | |
| Supplemental Ratios (%): | |
Ratio of expenses to average
net assets after expense
reductions excluding short
sale dividend and interest
expense (f) | | | 1.07 | (a) | | | 1.07 | | | | 1.06 | | | | 1.13 | | | | 1.13 | | | | 1.14 | |
See Notes to Financial Statements
21
Financial Highlights – continued
| | | | | | | | | | | | | | | | | | | | | | | | |
| | | Six months
ended
3/31/16 (unaudited) | | | Years ended 9/30 | |
| Class R3 | | | 2015 | | | 2014 | | | 2013 | | | 2012 | | | 2011 | |
| | | | | | | | | | | | | | | | | |
Net asset value, beginning of
period | | | $36.17 | | | | $38.57 | | | | $34.16 | | | | $28.64 | | | | $22.24 | | | | $22.37 | |
| Income (loss) from investment operations | |
Net investment income (d) | | | $0.16 | | | | $0.27 | | | | $0.24 | | | | $0.29 | | | | $0.26 | | | | $0.21 | |
Net realized and unrealized
gain (loss) on investments
and foreign currency | | | 2.14 | | | | (0.52 | ) | | | 5.21 | | | | 5.49 | | | | 6.35 | | | | (0.15 | ) |
Total from investment operations | | | $2.30 | | | | $(0.25 | ) | | | $5.45 | | | | $5.78 | | | | $6.61 | | | | $0.06 | |
| Less distributions declared to shareholders | |
From net investment income | | | $(0.27 | ) | | | $(0.25 | ) | | | $(0.36 | ) | | | $(0.26 | ) | | | $(0.21 | ) | | | $(0.19 | ) |
From net realized gain on
investments | | | (2.22 | ) | | | (1.90 | ) | | | (0.68 | ) | | | — | | | | — | | | | — | |
Total distributions declared to
shareholders | | | $(2.49 | ) | | | $(2.15 | ) | | | $(1.04 | ) | | | $(0.26 | ) | | | $(0.21 | ) | | | $(0.19 | ) |
Net asset value, end of period (x) | | | $35.98 | | | | $36.17 | | | | $38.57 | | | | $34.16 | | | | $28.64 | | | | $22.24 | |
Total return (%) (r)(s)(x) | | | 6.44 | (n) | | | (0.92 | ) | | | 16.26 | | | | 20.33 | | | | 29.93 | | | | 0.19 | |
Ratios (%) (to average net assets)
and Supplemental data: | |
Expenses before expense
reductions (f) | | | 0.82 | (a) | | | 0.82 | | | | 0.81 | | | | 0.88 | | | | 0.90 | | | | 0.90 | |
Expenses after expense
reductions (f) | | | 0.82 | (a) | | | 0.82 | | | | 0.81 | | | | 0.88 | | | | 0.90 | | | | 0.90 | |
Net investment income | | | 0.87 | (a) | | | 0.70 | | | | 0.65 | | | | 0.92 | | | | 0.96 | | | | 0.84 | |
Portfolio turnover | | | 21 | (n) | | | 44 | | | | 39 | | | | 46 | | | | 61 | | | | 69 | |
Net assets at end of period
(000 omitted) | | | $53,824 | | | | $51,952 | | | | $58,407 | | | | $61,690 | | | | $35,774 | | | | $8,582 | |
| Supplemental Ratios (%): | |
Ratio of expenses to average
net assets after expense
reductions excluding short
sale dividend and interest
expense (f) | | | 0.81 | (a) | | | 0.82 | | | | 0.81 | | | | 0.88 | | | | 0.89 | | | | 0.89 | |
See Notes to Financial Statements
22
Financial Highlights – continued
| | | | | | | | | | | | | | | | | | | | | | | | |
| | | Six months
ended
3/31/16 (unaudited) | | | Years ended 9/30 | |
| Class R4 | | | 2015 | | | 2014 | | | 2013 | | | 2012 | | | 2011 | |
| | | | | | | | | | | | | | | | | |
Net asset value, beginning of
period | | | $36.40 | | | | $38.81 | | | | $34.35 | | | | $28.75 | | | | $22.32 | | | | $22.45 | |
| Income (loss) from investment operations | |
Net investment income (d) | | | $0.20 | | | | $0.37 | | | | $0.34 | | | | $0.37 | | | | $0.32 | | | | $0.26 | |
Net realized and unrealized
gain (loss) on investments
and foreign currency | | | 2.16 | | | | (0.52 | ) | | | 5.23 | | | | 5.51 | | | | 6.38 | | | | (0.16 | ) |
Total from investment operations | | | $2.36 | | | | $(0.15 | ) | | | $5.57 | | | | $5.88 | | | | $6.70 | | | | $0.10 | |
| Less distributions declared to shareholders | |
From net investment income | | | $(0.38 | ) | | | $(0.36 | ) | | | $(0.43 | ) | | | $(0.28 | ) | | | $(0.27 | ) | | | $(0.23 | ) |
From net realized gain on
investments | | | (2.22 | ) | | | (1.90 | ) | | | (0.68 | ) | | | — | | | | — | | | | — | |
Total distributions declared to
shareholders | | | $(2.60 | ) | | | $(2.26 | ) | | | $(1.11 | ) | | | $(0.28 | ) | | | $(0.27 | ) | | | $(0.23 | ) |
Net asset value, end of period (x) | | | $36.16 | | | | $36.40 | | | | $38.81 | | | | $34.35 | | | | $28.75 | | | | $22.32 | |
Total return (%) (r)(s)(x) | | | 6.56 | (n) | | | (0.68 | ) | | | 16.56 | | | | 20.65 | | | | 30.27 | | | | 0.34 | |
Ratios (%) (to average net assets)
and Supplemental data: | |
Expenses before expense
reductions (f) | | | 0.57 | (a) | | | 0.57 | | | | 0.55 | | | | 0.63 | | | | 0.65 | | | | 0.64 | |
Expenses after expense
reductions (f) | | | 0.57 | (a) | | | 0.57 | | | | 0.55 | | | | 0.63 | | | | 0.65 | | | | 0.64 | |
Net investment income | | | 1.12 | (a) | | | 0.96 | | | | 0.90 | | | | 1.19 | | | | 1.21 | | | | 1.02 | |
Portfolio turnover | | | 21 | (n) | | | 44 | | | | 39 | | | | 46 | | | | 61 | | | | 69 | |
Net assets at end of period
(000 omitted) | | | $53,348 | | | | $46,669 | | | | $46,235 | | | | $27,088 | | | | $20,829 | | | | $12,225 | |
| Supplemental Ratios (%): | |
Ratio of expenses to average
net assets after expense
reductions excluding short
sale dividend and interest
expense (f) | | | 0.56 | (a) | | | 0.57 | | | | 0.55 | | | | 0.62 | | | | 0.63 | | | | 0.64 | |
See Notes to Financial Statements
23
Financial Highlights – continued
| | | | | | | | | | | | | | | | | | | | | | | | |
| | | Six months
ended
3/31/16 (unaudited) | | | Years ended 9/30 | |
| Class R5 (y) | | | 2015 | | | 2014 | | | 2013 | | | 2012 | | | 2011 | |
| | | | | | | | | | | | | | | | | |
Net asset value, beginning of
period | | | $36.42 | | | | $38.82 | | | | $34.37 | | | | $28.75 | | | | $22.30 | | | | $22.42 | |
| Income (loss) from investment operations | |
Net investment income (d) | | | $0.22 | | | | $0.41 | | | | $0.36 | | | | $0.40 | | | | $0.31 | | | | $0.24 | |
Net realized and unrealized
gain (loss) on investments
and foreign currency | | | 2.16 | | | | (0.53 | ) | | | 5.23 | | | | 5.51 | | | | 6.38 | | | | (0.15 | ) |
Total from investment operations | | | $2.38 | | | | $(0.12 | ) | | | $5.59 | | | | $5.91 | | | | $6.69 | | | | $0.09 | |
| Less distributions declared to shareholders | |
From net investment income | | | $(0.42 | ) | | | $(0.38 | ) | | | $(0.46 | ) | | | $(0.29 | ) | | | $(0.24 | ) | | | $(0.21 | ) |
From net realized gain on
investments | | | (2.22 | ) | | | (1.90 | ) | | | (0.68 | ) | | | — | | | | — | | | | — | |
Total distributions declared to
shareholders | | | $(2.64 | ) | | | $(2.28 | ) | | | $(1.14 | ) | | | $(0.29 | ) | | | $(0.24 | ) | | | $(0.21 | ) |
Net asset value, end of period (x) | | | $36.16 | | | | $36.42 | | | | $38.82 | | | | $34.37 | | | | $28.75 | | | | $22.30 | |
Total return (%) (r)(s)(x) | | | 6.60 | (n) | | | (0.59 | ) | | | 16.62 | | | | 20.74 | | | | 30.25 | | | | 0.31 | |
Ratios (%) (to average net assets)
and Supplemental data: | |
Expenses before expense
reductions (f) | | | 0.49 | (a) | | | 0.48 | | | | 0.49 | | | | 0.54 | | | | 0.60 | | | | 0.75 | |
Expenses after expense
reductions (f) | | | 0.49 | (a) | | | 0.48 | | | | 0.49 | | | | 0.54 | | | | 0.60 | | | | 0.75 | |
Net investment income | | | 1.21 | (a) | | | 1.05 | | | | 0.97 | | | | 1.28 | | | | 1.13 | | | | 0.96 | |
Portfolio turnover | | | 21 | (n) | | | 44 | | | | 39 | | | | 46 | | | | 61 | | | | 69 | |
Net assets at end of period
(000 omitted) | | | $1,415,964 | | | | $1,347,779 | | | | $1,364,115 | | | | $1,120,028 | | | | $825,334 | | | | $219 | |
| Supplemental Ratios (%): | |
Ratio of expenses to average
net assets after expense
reductions excluding short
sale dividend and interest
expense (f) | | | 0.48 | (a) | | | 0.48 | | | | 0.48 | | | | 0.54 | | | | 0.58 | | | | 0.74 | |
See Notes to Financial Statements
24
Financial Highlights – continued
| (d) | Per share data is based on average shares outstanding. |
| (f) | Ratios do not reflect reductions from fees paid indirectly, if applicable. |
| (r) | Certain expenses have been reduced without which performance would have been lower. |
| (s) | From time to time the fund may receive proceeds from litigation settlements, without which performance would be lower. |
| (t) | Total returns do not include any applicable sales charges. |
| (w) | Per share amount was less than $0.01. |
| (x) | The net asset values and total returns have been calculated on net assets which include adjustments made in accordance with U.S. generally accepted accounting principles required at period end for financial reporting purposes. |
| (y) | On May 10, 2012, sales of Class W shares (including exchanges) were suspended. On May 11, 2012, certain Class W shares were automatically converted to Class I shares. Shareholders of certain Class W shares became shareholders of Class I and received Class I shares with a total net asset value equal to their Class W shares at the time of the conversion. On May 30, 2012, remaining Class W shares, which represented MFS seed money, were redesignated Class R5. Class R5 shares do not pay a 12b-1 distribution fee or sub-accounting costs. On June 1, 2012, Class R5 shares were offered for sale to the public. |
See Notes to Financial Statements
25
NOTES TO FINANCIAL STATEMENTS
(unaudited)
(1) Business and Organization
MFS Research Fund (the fund) is a diversified series of MFS Series Trust V (the trust). The trust is organized as a Massachusetts business trust and is registered under the Investment Company Act of 1940, as amended, as an open-end management investment company.
The fund is an investment company and accordingly follows the investment company accounting and reporting guidance of the Financial Accounting Standards Board (FASB) Accounting Standards Codification Topic 946 Financial Services – Investment Companies.
The fund has entered into contractual arrangements with an investment adviser, administrator, distributor, shareholder servicing agent, 529 program manager (if applicable), and custodian who each provide services to the fund. Unless expressly stated otherwise, shareholders are not parties to, or intended beneficiaries of these contractual arrangements, and these contractual arrangements are not intended to create any shareholder right to enforce them against the service providers or to seek any remedy under them against the service providers, either directly or on behalf of the fund.
Under the Trust’s By-Laws and Declaration of Trust, any claims asserted against or on behalf of the MFS Funds, including claims against Trustees and Officers, must be brought in states and federal courts located within the Commonwealth of Massachusetts.
(2) Significant Accounting Policies
General – The preparation of financial statements in conformity with U.S. generally accepted accounting principles requires management to make estimates and assumptions that affect the reported amounts of assets and liabilities, and disclosure of contingent assets and liabilities at the date of the financial statements and the reported amounts of increases and decreases in net assets from operations during the reporting period. Actual results could differ from those estimates. In the preparation of these financial statements, management has evaluated subsequent events occurring after the date of the fund’s Statement of Assets and Liabilities through the date that the financial statements were issued.
In January 2016, FASB issued Accounting Standards Update 2016-01, Financial Instruments – Overall (Subtopic 825-10) – Recognition and Measurement of Financial Assets and Financial Liabilities (“ASU 2016-01”) which would first be effective for annual reporting periods beginning after December 15, 2017, and interim periods therein. ASU 2016-01, which changes the accounting for equity investments and for certain financial liabilities, also modifies the presentation and disclosure requirements for financial instruments. Investment companies are specifically exempted from ASU 2016-01’s equity investment accounting provisions and will continue to follow the industry specific guidance for investment accounting under ASC 946. Although still evaluating the potential impacts of ASU 2016-01 to the fund, management expects that the impact of the fund’s adoption will be limited to additional financial statement disclosures.
26
Notes to Financial Statements (unaudited) – continued
Balance Sheet Offsetting – The fund’s accounting policy with respect to balance sheet offsetting is that, absent an event of default by the counterparty or a termination of the agreement, the International Swaps and Derivatives Association (ISDA) Master Agreement does not result in an offset of reported amounts of financial assets and financial liabilities in the Statement of Assets and Liabilities across transactions between the fund and the applicable counterparty. The fund’s right to setoff may be restricted or prohibited by the bankruptcy or insolvency laws of the particular jurisdiction to which a specific master netting agreement counterparty is subject. Balance sheet offsetting disclosures, to the extent applicable to the fund, have been included in the fund’s Significant Accounting Policies note under the captions for each of the fund’s in-scope financial instruments and transactions.
Investment Valuations – Equity securities, including restricted equity securities, are generally valued at the last sale or official closing price on their primary market or exchange as provided by a third-party pricing service. Equity securities, for which there were no sales reported that day, are generally valued at the last quoted daily bid quotation on their primary market or exchange as provided by a third-party pricing service. Equity securities held short, for which there were no sales reported for that day, are generally valued at the last quoted daily ask quotation on their primary market or exchange as provided by a third-party pricing service. Short-term instruments with a maturity at issuance of 60 days or less may be valued at amortized cost, which approximates market value. Open-end investment companies are generally valued at net asset value per share. Securities and other assets generally valued on the basis of information from a third-party pricing service may also be valued at a broker/dealer bid quotation. Values obtained from third-party pricing services can utilize both transaction data and market information such as yield, quality, coupon rate, maturity, type of issue, trading characteristics, and other market data. The values of foreign securities and other assets and liabilities expressed in foreign currencies are converted to U.S. dollars using the mean of bid and asked prices for rates provided by a third-party pricing service.
The Board of Trustees has delegated primary responsibility for determining or causing to be determined the value of the fund’s investments (including any fair valuation) to the adviser pursuant to valuation policies and procedures approved by the Board. If the adviser determines that reliable market quotations are not readily available, investments are valued at fair value as determined in good faith by the adviser in accordance with such procedures under the oversight of the Board of Trustees. Under the fund’s valuation policies and procedures, market quotations are not considered to be readily available for most types of debt instruments and floating rate loans and many types of derivatives. These investments are generally valued at fair value based on information from third-party pricing services. In addition, investments may be valued at fair value if the adviser determines that an investment’s value has been materially affected by events occurring after the close of the exchange or market on which the investment is principally traded (such as foreign exchange or market) and prior to the determination of the fund’s net asset value, or after the halting of trading of a specific security where trading does not resume prior to the close of the exchange or market on which the security is principally traded. Events that occur on a frequent basis after foreign markets close (such as developments in foreign markets and significant movements in the U.S.
27
Notes to Financial Statements (unaudited) – continued
markets) and prior to the determination of the fund’s net asset value may be deemed to have a material effect on the value of securities traded in foreign markets. Accordingly, the fund’s foreign equity securities may often be valued at fair value. The adviser generally relies on third-party pricing services or other information (such as the correlation with price movements of similar securities in the same or other markets; the type, cost and investment characteristics of the security; the business and financial condition of the issuer; and trading and other market data) to assist in determining whether to fair value and at what value to fair value an investment. The value of an investment for purposes of calculating the fund’s net asset value can differ depending on the source and method used to determine value. When fair valuation is used, the value of an investment used to determine the fund’s net asset value may differ from quoted or published prices for the same investment. There can be no assurance that the fund could obtain the fair value assigned to an investment if it were to sell the investment at the same time at which the fund determines its net asset value per share.
Various inputs are used in determining the value of the fund’s assets or liabilities. These inputs are categorized into three broad levels. In certain cases, the inputs used to measure fair value may fall into different levels of the fair value hierarchy. In such cases, an investment’s level within the fair value hierarchy is based on the lowest level of input that is significant to the fair value measurement. The fund’s assessment of the significance of a particular input to the fair value measurement in its entirety requires judgment, and considers factors specific to the investment. Level 1 includes unadjusted quoted prices in active markets for identical assets or liabilities. Level 2 includes other significant observable market-based inputs (including quoted prices for similar securities, interest rates, prepayment speed, and credit risk). Level 3 includes unobservable inputs, which may include the adviser’s own assumptions in determining the fair value of investments. The following is a summary of the levels used as of March 31, 2016 in valuing the fund’s assets or liabilities:
| | | | | | | | | | | | | | | | |
| Investments at Value | | Level 1 | | | Level 2 | | | Level 3 | | | Total | |
| Equity Securities | | | $4,767,036,892 | | | | $— | | | | $— | | | | $4,767,036,892 | |
| Mutual Funds | | | 103,947,210 | | | | — | | | | — | | | | 103,947,210 | |
| Total Investments | | | $4,870,984,102 | | | | $— | | | | $— | | | | $4,870,984,102 | |
| Short Sales | | | $(7,627,484 | ) | | | $— | | | | $— | | | | $(7,627,484 | ) |
For further information regarding security characteristics, see the Portfolio of Investments.
Foreign Currency Translation – Purchases and sales of foreign investments, income, and expenses are converted into U.S. dollars based upon currency exchange rates prevailing on the respective dates of such transactions or on the reporting date for foreign denominated receivables and payables. Gains and losses attributable to foreign currency exchange rates on sales of securities are recorded for financial statement purposes as net realized gains and losses on investments. Gains and losses attributable to foreign exchange rate movements on receivables, payables, income and expenses are recorded for financial statement purposes as foreign currency transaction gains and losses. That portion of both realized and unrealized gains and losses on investments that results from fluctuations in foreign currency exchange rates is not separately disclosed.
28
Notes to Financial Statements (unaudited) – continued
Short Sales – The fund entered into short sales whereby it sells a security it does not own in anticipation of a decline in the value of that security. The fund will realize a gain if the security price decreases and a loss if the security price increases between the date of the short sale and the date on which the fund replaces the borrowed security. Losses from short sales can exceed the proceeds of the security sold; and they can also exceed the potential loss from an ordinary buy and sell transaction. The amount of any premium, dividends, or interest the fund may be required to pay in connection with a short sale will be recognized as a fund expense. During the six months ended March 31, 2016, this expense amounted to $191,446. The fund segregates cash or marketable securities in an amount that, when combined with the amount of proceeds from the short sale deposited with the broker, at least equals the current market value of the security sold short.
Security Loans – Under its Securities Lending Agency Agreement with the fund, JPMorgan Chase and Co. (“Chase”), as lending agent, loans the securities of the fund to certain qualified institutions (the “Borrowers”) approved by the fund. Security loans can be terminated at the discretion of either the lending agent or the fund and the related securities must be returned within the earlier of the standard trade settlement period for such securities or within three business days. The loans are collateralized by cash and/or U.S. Treasury and federal agency obligations in an amount typically at least equal to the market value of the securities loaned. On loans collateralized by cash, the cash collateral is invested in a money market fund. The market value of the loaned securities is determined at the close of business of the fund and any additional required collateral is delivered to the fund on the next business day. Chase provides the fund with indemnification against Borrower default. In the event of Borrower default, Chase will, for the benefit of the fund, either purchase securities identical to those loaned or, when such purchase is commercially impracticable, pay the fund the market value of the loaned securities. In return, Chase assumes the fund’s rights to the related collateral. If the collateral value is less than the cost to purchase identical securities, Chase is responsible for the shortfall, but only to the extent that such shortfall is not due to a decline in collateral value resulting from collateral reinvestment for which the fund bears the risk of loss. At period end, the fund had investment securities on loan, all of which were classified as equity securities in the fund’s Portfolio of Investments, with a fair value of $79,101,646. The fair value of the fund’s investment securities on loan and a related liability of $81,085,090 for cash collateral received on securities loaned are both presented gross in the Statement of Assets and Liabilities. The collateral received on securities loaned exceeded the value of securities on loan at period end. The liability for cash collateral for securities loaned is carried at fair value, which is categorized as level 2 within the fair value hierarchy. A portion of the income generated upon investment of the collateral is remitted to the Borrowers, and the remainder is allocated between the fund and the lending agent. On loans collateralized by U.S. Treasury and/or federal agency obligations, a fee is received from the Borrower, and is allocated between the fund and the lending agent. Income from securities lending is included in “Interest” income in the Statement of Operations. The dividend and interest income earned on the securities loaned is accounted for in the same manner as other dividend and interest income.
29
Notes to Financial Statements (unaudited) – continued
Indemnifications – Under the fund’s organizational documents, its officers and Trustees may be indemnified against certain liabilities and expenses arising out of the performance of their duties to the fund. Additionally, in the normal course of business, the fund enters into agreements with service providers that may contain indemnification clauses. The fund’s maximum exposure under these agreements is unknown as this would involve future claims that may be made against the fund that have not yet occurred.
Investment Transactions and Income – Investment transactions are recorded on the trade date. Interest income is recorded on the accrual basis. Some securities may be purchased on a “when-issued” or “forward delivery” basis, which means that the securities will be delivered to the fund at a future date, usually beyond customary settlement time. Dividends received in cash are recorded on the ex-dividend date. Certain dividends from foreign securities will be recorded when the fund is informed of the dividend if such information is obtained subsequent to the ex-dividend date. Dividend and interest payments received in additional securities are recorded on the ex-dividend or ex-interest date in an amount equal to the value of the security on such date.
The fund may receive proceeds from litigation settlements. Any proceeds received from litigation involving portfolio holdings are reflected in the Statement of Operations in realized gain/loss if the security has been disposed of by the fund or in unrealized gain/loss if the security is still held by the fund. Any other proceeds from litigation not related to portfolio holdings are reflected as other income in the Statement of Operations.
The fund purchased or sold debt securities on a when-issued or delayed delivery basis, or in a “To Be Announced” (TBA) or “forward commitment” transaction with delivery or payment to occur at a later date beyond the normal settlement period. At the time a fund enters into a commitment to purchase or sell a security, the transaction is recorded and the value of the security acquired is reflected in the fund’s net asset value. The price of such security and the date that the security will be delivered and paid for are fixed at the time the transaction is negotiated. The value of the security may vary with market fluctuations. No interest accrues to the fund until payment takes place. At the time that a fund enters into this type of transaction, the fund is required to have sufficient cash and/or liquid securities to cover its commitments. Losses may arise due to changes in the value of the underlying securities or if the counterparty does not perform under the contract’s terms, or if the issuer does not issue the securities due to political, economic or other factors. Additionally, losses may arise due to declines in the value of the securities prior to settlement date.
To mitigate this risk of loss on TBA securities and other types of forward settling mortgage-backed securities, the fund whenever possible enters into a Master Securities Forward Transaction Agreement (“MSFTA”) on a bilateral basis with each of the counterparties with whom it undertakes a significant volume of transactions. The MSFTA gives each party to the agreement the right to terminate all transactions traded under such agreement if there is a certain deterioration in the credit quality of the other party. Upon an event of default or a termination of the MSFTA, the non-defaulting party has the right to close out all transactions traded under such agreement and to net amounts owed under each transaction to one net amount
30
Notes to Financial Statements (unaudited) – continued
payable by one party to the other. This right to close out and net payments across all transactions traded under the MSFTA could result in a reduction of the fund’s credit risk to such counterparty equal to any amounts payable by the fund under the applicable transactions, if any.
For mortgage-backed securities traded under a MSFTA, the collateral and margining requirements are contract specific. Collateral amounts across all transactions traded under such agreement are netted and one amount is posted from one party to the other to collateralize such obligations. Cash that has been pledged to cover the fund’s collateral or margin obligations under a MSFTA, if any, will be reported separately on the Statement of Assets and Liabilities as restricted cash. Securities pledged as collateral or margin for the same purpose, if any, are noted in the Portfolio of Investments.
Fees Paid Indirectly – The fund’s custody fee may be reduced by a credit earned under an arrangement that measures the value of U.S. dollars deposited with the custodian by the fund. The amount of the credit, for the six months ended March 31, 2016, is shown as a reduction of total expenses in the Statement of Operations.
Tax Matters and Distributions – The fund intends to qualify as a regulated investment company, as defined under Subchapter M of the Internal Revenue Code, and to distribute all of its taxable income, including realized capital gains. As a result, no provision for federal income tax is required. The fund’s federal tax returns, when filed, will remain subject to examination by the Internal Revenue Service for a three year period. Management has analyzed the fund’s tax positions taken on federal and state tax returns for all open tax years and does not believe that there are any uncertain tax positions that require recognition of a tax liability. Foreign taxes, if any, have been accrued by the fund in the accompanying financial statements in accordance with the applicable foreign tax law. Foreign income taxes may be withheld by certain countries in which the fund invests. Additionally, capital gains realized by the fund on securities issued in or by certain foreign countries may be subject to capital gains tax imposed by those countries.
Distributions to shareholders are recorded on the ex-dividend date. Income and capital gain distributions are determined in accordance with income tax regulations, which may differ from U.S. generally accepted accounting principles. Certain capital accounts in the financial statements are periodically adjusted for permanent differences in order to reflect their tax character. These adjustments have no impact on net assets or net asset value per share. Temporary differences which arise from recognizing certain items of income, expense, gain or loss in different periods for financial statement and tax purposes will reverse at some time in the future. Distributions in excess of net investment income or net realized gains are temporary overdistributions for financial statement purposes resulting from differences in the recognition or classification of income or distributions for financial statement and tax purposes.
Book/tax differences primarily relate to wash sale loss deferrals and treating a portion of the proceeds from redemptions as a distribution for tax purposes.
31
Notes to Financial Statements (unaudited) – continued
The tax character of distributions made during the current period will be determined at fiscal year end. The tax character of distributions declared to shareholders for the last fiscal year is as follows:
| | | | |
| | | 9/30/15 | |
Ordinary income (including any
short-term capital gains) | | | $65,201,123 | |
| Long-term capital gains | | | 188,713,166 | |
| Total distributions | | | $253,914,289 | |
The federal tax cost and the tax basis components of distributable earnings were as follows:
| | | | |
| As of 3/31/16 | | | |
| Cost of investments | | | $3,918,414,523 | |
| Gross appreciation | | | 1,075,993,461 | |
| Gross depreciation | | | (123,423,882 | ) |
| Net unrealized appreciation (depreciation) | | | $952,569,579 | |
| |
| As of 9/30/15 | | | |
| Undistributed ordinary income | | | 42,353,599 | |
| Undistributed long-term capital gain | | | 260,153,749 | |
| Other temporary differences | | | (23,583 | ) |
| Net unrealized appreciation (depreciation) | | | 686,994,452 | |
The aggregate cost above includes prior fiscal year end tax adjustments, if applicable.
Multiple Classes of Shares of Beneficial Interest – The fund offers multiple classes of shares, which differ in their respective distribution and service fees. The fund’s income, realized and unrealized gain (loss), and common expenses are allocated to shareholders based on the daily net assets of each class. Dividends are declared separately for each class. Differences in per share dividend rates are generally due to differences in separate class expenses. Class B shares will convert to Class A shares approximately eight years after purchase. The fund’s distributions declared to shareholders as reported in the Statements of Changes in Net Assets are presented by class as follows:
| | | | | | | | | | | | | | | | |
| | | From net investment
income | | | From net realized gain on
investments | |
| | | Six months
ended
3/31/16 | | | Year
ended
9/30/15 | | | Six months
ended
3/31/16 | | | Year
ended
9/30/15 | |
| Class A | | | $17,319,821 | | | | $14,038,385 | | | | $132,940,458 | | | | $103,136,672 | |
| Class B | | | 4,358 | | | | — | | | | 1,665,861 | | | | 1,551,839 | |
| Class C | | | 91,405 | | | | 40,600 | | | | 8,522,919 | | | | 6,956,132 | |
| Class I | | | 7,476,844 | | | | 6,426,546 | | | | 43,745,780 | | | | 34,500,958 | |
| Class R1 | | | 2,456 | | | | 2,624 | | | | 271,290 | | | | 241,733 | |
| Class R2 | | | 128,652 | | | | 137,750 | | | | 1,695,624 | | | | 1,753,197 | |
| Class R3 | | | 385,508 | | | | 404,851 | | | | 3,139,237 | | | | 3,022,819 | |
| Class R4 | | | 495,216 | | | | 454,137 | | | | 2,903,613 | | | | 2,416,964 | |
| Class R5 | | | 15,193,072 | | | | 13,210,604 | | | | 81,249,079 | | | | 65,618,478 | |
| Total | | | $41,097,332 | | | | $34,715,497 | | | | $276,133,861 | | | | $219,198,792 | |
32
Notes to Financial Statements (unaudited) – continued
(3) Transactions with Affiliates
Investment Adviser – The fund has an investment advisory agreement with MFS to provide overall investment management and related administrative services and facilities to the fund. The management fee is computed daily and paid monthly at an annual rate of 0.43% of the fund’s average daily net assets.
The investment adviser has agreed in writing to reduce its management fee to 0.40% of average daily net assets in excess of $5 billion. This written agreement will continue until modified by the fund’s Board of Trustees, but such agreement will continue at least until January 31, 2017. For the six months ended March 31, 2016, the fund’s average daily net assets did not exceed $5 billion and therefore, the management fee was not reduced in accordance with this agreement.
Distributor – MFS Fund Distributors, Inc. (MFD), a wholly-owned subsidiary of MFS, as distributor, received $72,478 for the six months ended March 31, 2016, as its portion of the initial sales charge on sales of Class A shares of the fund.
The Board of Trustees has adopted a distribution plan for certain share classes pursuant to Rule 12b-1 of the Investment Company Act of 1940.
The fund’s distribution plan provides that the fund will pay MFD for services provided by MFD and financial intermediaries in connection with the distribution and servicing of certain share classes. One component of the plan is a distribution fee paid to MFD and another component of the plan is a service fee paid to MFD. MFD may subsequently pay all, or a portion, of the distribution and/or service fees to financial intermediaries.
Distribution Plan Fee Table:
| | | | | | | | | | | | | | | | | | | | |
| | | Distribution
Fee Rate (d) | | | Service
Fee Rate (d) | | | Total
Distribution
Plan (d) | | | Annual
Effective
Rate (e) | | | Distribution
and Service
Fee | |
| Class A | | | — | | | | 0.25% | | | | 0.25% | | | | 0.25% | | | | $2,758,188 | |
| Class B | | | 0.75% | | | | 0.25% | | | | 1.00% | | | | 1.00% | | | | 127,167 | |
| Class C | | | 0.75% | | | | 0.25% | | | | 1.00% | | | | 1.00% | | | | 658,020 | |
| Class R1 | | | 0.75% | | | | 0.25% | | | | 1.00% | | | | 1.00% | | | | 20,542 | |
| Class R2 | | | 0.25% | | | | 0.25% | | | | 0.50% | | | | 0.50% | | | | 69,790 | |
| Class R3 | | | — | | | | 0.25% | | | | 0.25% | | | | 0.25% | | | | 66,079 | |
| Total Distribution and Service Fees | | | | $3,699,786 | |
| (d) | In accordance with the distribution plan for certain classes, the fund pays distribution and/or service fees equal to these annual percentage rates of each class’s average daily net assets. The distribution and service fee rates disclosed by class represent the current rates in effect at the end of the reporting period. Any rate changes, if applicable, are detailed below. |
| (e) | The annual effective rates represent actual fees incurred under the distribution plan for the six months ended March 31, 2016 based on each class’s average daily net assets. MFD has voluntarily agreed to rebate a portion of each class’s 0.25% service fee attributable to accounts for which MFD retains the 0.25% service fee except for accounts attributable to MFS or its affiliates’ seed money. For the six months ended March 31, 2016, this rebate amounted to $41,782, $581, and $1,354 for Class A, Class B, and Class C, respectively, and is included in the reduction of total expenses in the Statement of Operations. |
Certain Class A shares are subject to a contingent deferred sales charge (CDSC) in the event of a shareholder redemption within 18 months of purchase. Class C shares are subject to a CDSC in the event of a shareholder redemption within 12 months of
33
Notes to Financial Statements (unaudited) – continued
purchase. Class B shares are subject to a CDSC in the event of a shareholder redemption within six years of purchase. All contingent deferred sales charges are paid to MFD and during the six months ended March 31, 2016, were as follows:
| | | | |
| | | Amount | |
| Class A | | | $377 | |
| Class B | | | 12,712 | |
| Class C | | | 5,143 | |
Shareholder Servicing Agent – MFS Service Center, Inc. (MFSC), a wholly-owned subsidiary of MFS, receives a fee from the fund for its services as shareholder servicing agent calculated as a percentage of the average daily net assets of the fund as determined periodically under the supervision of the fund’s Board of Trustees. For the six months ended March 31, 2016, the fee was $228,717, which equated to 0.0098% annually of the fund’s average daily net assets. MFSC also receives payment from the fund for out-of-pocket expenses, sub-accounting and other shareholder servicing costs which may be paid to affiliated and unaffiliated service providers. Class R5 shares do not incur sub-accounting fees. For the six months ended March 31, 2016, these out-of-pocket expenses, sub-accounting and other shareholder servicing costs amounted to $1,602,912.
Administrator – MFS provides certain financial, legal, shareholder communications, compliance, and other administrative services to the fund. Under an administrative services agreement, the fund reimburses MFS the costs incurred to provide these services. The fund is charged an annual fixed amount of $17,500 plus a fee based on average daily net assets. The administrative services fee incurred for the six months ended March 31, 2016 was equivalent to an annual effective rate of 0.0137% of the fund’s average daily net assets.
Trustees’ and Officers’ Compensation – The fund pays compensation to independent Trustees in the form of a retainer, attendance fees, and additional compensation to Board and Committee chairpersons. The fund does not pay compensation directly to Trustees or officers of the fund who are also officers of the investment adviser, all of whom receive remuneration for their services to the fund from MFS. Certain officers and Trustees of the fund are officers or directors of MFS, MFD, and MFSC.
Prior to December 31, 2001, the fund had an unfunded defined benefit plan (“DB plan”) for independent Trustees. As of December 31, 2001, the Board took action to terminate the DB plan with respect to then-current and any future independent Trustees, such that the DB plan covers only certain of those former independent Trustees who retired on or before December 31, 2001. Effective January 1, 2002, accrued benefits under the DB plan for then-current independent Trustees who continued were credited to an unfunded retirement deferral plan (the “Retirement Deferral plan”), which was established for and exists solely with respect to these credited amounts, and is not available for other deferrals by these or other independent Trustees. Although the Retirement Deferral plan is unfunded, amounts deferred under the plan are periodically adjusted for investment experience as if they had been invested in shares of the fund. The DB plan resulted in a pension expense of $2,421 and the Retirement Deferral plan resulted in a decrease in expense of $1,814.
34
Notes to Financial Statements (unaudited) – continued
Both amounts are included in “Independent Trustees’ compensation” in the Statement of Operations for the six months ended March 31, 2016. The liability for deferred retirement benefits payable to certain independent Trustees under both plans amounted to $79,434 at March 31, 2016, and is included in “Payable for independent Trustees’ compensation” in the Statement of Assets and Liabilities.
Deferred Trustee Compensation – Under a Deferred Compensation Plan (the “Plan”), independent Trustees previously were allowed to elect to defer receipt of all or a portion of their annual compensation. Effective January 1, 2005, the Board elected to no longer allow Trustees to defer receipt of future compensation under the Plan. Amounts deferred under the Plan are invested in shares of certain MFS Funds selected by the independent Trustees as notional investments. Deferred amounts represent an unsecured obligation of the fund until distributed in accordance with the Plan. Included in “Other assets” and “Payable for independent Trustees’ compensation” in the Statement of Assets and Liabilities is $24,249 of deferred Trustees’ compensation. There is no current year expense associated with the Plan.
Other – This fund and certain other funds managed by MFS (the funds) have entered into a service agreement (the ISO Agreement) which provides for payment of fees solely by the funds to Tarantino LLC in return for the provision of services of an Independent Senior Officer (ISO) for the funds. Frank L. Tarantino serves as the ISO and is an officer of the funds and the sole member of Tarantino LLC. The funds can terminate the ISO Agreement with Tarantino LLC at any time under the terms of the ISO Agreement. For the six months ended March 31, 2016, the fee paid by the fund under this agreement was $5,929 and is included in “Miscellaneous” expense in the Statement of Operations. MFS has agreed to bear all expenses associated with office space, other administrative support, and supplies provided to the ISO.
The fund invests in the MFS Institutional Money Market Portfolio which is managed by MFS and seeks current income consistent with preservation of capital and liquidity. Income earned on this investment is included in “Dividends from underlying affiliated funds” in the Statement of Operations. This money market fund does not pay a management fee to MFS.
On March 16, 2016, MFS purchased 1,867 shares of Class I for an aggregate amount of $67,776.
The fund is permitted to engage in purchase and sale transactions (“cross-trades”) with funds and accounts for which MFS serves as investment adviser or sub-adviser pursuant to a policy adopted by the Board of Trustees. This policy has been designed to ensure that cross-trades conducted by the fund comply with Rule 17a-7 under the Investment Company Act of 1940. Under this policy, cross-trades are effected at current market prices with no remuneration paid in connection with the transaction. During the six months ended March 31, 2016, the fund engaged in purchase and sale transactions pursuant to this policy, which amounted to $422,711 and $11,088,564, respectively. The sales transactions resulted in net realized gains (losses) of $3,870,881.
(4) Portfolio Securities
For the six months ended March 31, 2016, purchases and sales of investments, other than short-term obligations, aggregated $1,118,495,700 and $990,841,529, respectively.
35
Notes to Financial Statements (unaudited) – continued
(5) Shares of Beneficial Interest
The fund’s Declaration of Trust permits the Trustees to issue an unlimited number of full and fractional shares of beneficial interest. Transactions in fund shares were as follows:
| | | | | | | | | | | | | | | | |
| | | Six months ended
3/31/16 | | | Year ended
9/30/15 | |
| | | Shares | | | Amount | | | Shares | | | Amount | |
| Shares sold | | | | | | | | | | | | | | | | |
Class A | | | 7,743,678 | | | | $286,575,144 | | | | 6,768,405 | | | | $262,791,598 | |
Class B | | | 49,300 | | | | 1,671,122 | | | | 101,866 | | | | 3,667,174 | |
Class C | | | 197,769 | | | | 6,604,216 | | | | 504,769 | | | | 18,054,185 | |
Class I | | | 6,666,564 | | | | 240,049,308 | | | | 6,188,537 | | | | 243,733,761 | |
Class R1 | | | 6,537 | | | | 212,946 | | | | 15,488 | | | | 543,909 | |
Class R2 | | | 67,876 | | | | 2,393,178 | | | | 96,370 | | | | 3,639,994 | |
Class R3 | | | 124,900 | | | | 4,461,444 | | | | 321,738 | | | | 12,544,061 | |
Class R4 | | | 200,078 | | | | 7,143,188 | | | | 392,096 | | | | 15,252,850 | |
Class R5 | | | 749,240 | | | | 26,528,903 | | | | 2,046,467 | | | | 78,021,783 | |
| | | 15,805,942 | | | | $575,639,449 | | | | 16,435,736 | | | | $638,249,315 | |
| | | | |
| Shares issued to shareholders in reinvestment of distributions | | | | | | | | | | | | | | | | |
Class A | | | 3,993,026 | | | | $143,269,784 | | | | 2,897,856 | | | | $110,871,995 | |
Class B | | | 49,184 | | | | 1,629,949 | | | | 42,330 | | | | 1,503,144 | |
Class C | | | 232,096 | | | | 7,645,258 | | | | 172,606 | | | | 6,098,154 | |
Class I | | | 1,379,460 | | | | 50,584,795 | | | | 1,035,069 | | | | 40,409,106 | |
Class R1 | | | 8,426 | | | | 273,746 | | | | 7,008 | | | | 244,357 | |
Class R2 | | | 45,909 | | | | 1,603,594 | | | | 45,614 | | | | 1,700,950 | |
Class R3 | | | 98,160 | | | | 3,503,334 | | | | 89,765 | | | | 3,416,436 | |
Class R4 | | | 94,807 | | | | 3,398,829 | | | | 75,120 | | | | 2,871,101 | |
Class R5 | | | 2,665,317 | | | | 95,524,969 | | | | 2,062,508 | | | | 78,829,082 | |
| | | 8,566,385 | | | | $307,434,258 | | | | 6,427,876 | | | | $245,944,325 | |
| | | | |
| Shares reacquired | | | | | | | | | | | | | | | | |
Class A | | | (6,490,736 | ) | | | $(230,210,895 | ) | | | (7,946,899 | ) | | | $(309,239,112 | ) |
Class B | | | (107,609 | ) | | | (3,569,745 | ) | | | (219,002 | ) | | | (7,878,360 | ) |
Class C | | | (320,452 | ) | | | (10,605,493 | ) | | | (420,801 | ) | | | (15,060,689 | ) |
Class I | | | (4,128,413 | ) | | | (150,940,246 | ) | | | (5,586,127 | ) | | | (220,445,191 | ) |
Class R1 | | | (6,422 | ) | | | (205,612 | ) | | | (26,804 | ) | | | (947,784 | ) |
Class R2 | | | (95,408 | ) | | | (3,327,928 | ) | | | (352,366 | ) | | | (13,335,026 | ) |
Class R3 | | | (163,166 | ) | | | (5,863,506 | ) | | | (489,406 | ) | | | (19,068,710 | ) |
Class R4 | | | (101,581 | ) | | | (3,616,522 | ) | | | (376,401 | ) | | | (14,680,693 | ) |
Class R5 | | | (1,261,398 | ) | | | (47,467,963 | ) | | | (2,241,323 | ) | | | (88,333,468 | ) |
| | | (12,675,185 | ) | | | $(455,807,910 | ) | | | (17,659,129 | ) | | | $(688,989,033 | ) |
36
Notes to Financial Statements (unaudited) – continued
| | | | | | | | | | | | | | | | |
| | | Six months ended
3/31/16 | | | Year ended
9/30/15 | |
| | | Shares | | | Amount | | | Shares | | | Amount | |
| Net change | | | | | | | | | | | | | | | | |
Class A | | | 5,245,968 | | | | $199,634,033 | | | | 1,719,362 | | | | $64,424,481 | |
Class B | | | (9,125 | ) | | | (268,674 | ) | | | (74,806 | ) | | | (2,708,042 | ) |
Class C | | | 109,413 | | | | 3,643,981 | | | | 256,574 | | | | 9,091,650 | |
Class I | | | 3,917,611 | | | | 139,693,857 | | | | 1,637,479 | | | | 63,697,676 | |
Class R1 | | | 8,541 | | | | 281,080 | | | | (4,308 | ) | | | (159,518 | ) |
Class R2 | | | 18,377 | | | | 668,844 | | | | (210,382 | ) | | | (7,994,082 | ) |
Class R3 | | | 59,894 | | | | 2,101,272 | | | | (77,903 | ) | | | (3,108,213 | ) |
Class R4 | | | 193,304 | | | | 6,925,495 | | | | 90,815 | | | | 3,443,258 | |
Class R5 | | | 2,153,159 | | | | 74,585,909 | | | | 1,867,652 | | | | 68,517,397 | |
| | | 11,697,142 | | | | $427,265,797 | | | | 5,204,483 | | | | $195,204,607 | |
The fund is one of several mutual funds in which certain MFS funds may invest. The MFS funds do not invest in the underlying funds for the purpose of exercising management or control. At the end of the period, the MFS Moderate Allocation Fund, the MFS Growth Allocation Fund, the MFS Conservative Allocation Fund, and the MFS Aggressive Growth Allocation Fund were the owners of record of approximately 10%, 9%, 4%, and 3% respectively, of the value of outstanding voting shares of the fund. In addition, the MFS Lifetime Income Fund, the MFS Lifetime 2015 Fund, the MFS Lifetime 2020 Fund, the MFS Lifetime 2025 Fund, the MFS Lifetime 2030 Fund, the MFS Lifetime 2035 Fund, the MFS Lifetime 2040 Fund, the MFS Lifetime 2045 Fund, the MFS Lifetime 2050 Fund, and the MFS Lifetime 2055 Fund were each the owners of record of less than 1% of the value of outstanding voting shares of the fund.
(6) Line of Credit
The fund and certain other funds managed by MFS participate in a $1.25 billion unsecured committed line of credit, subject to a $1 billion sublimit, provided by a syndication of banks under a credit agreement. Borrowings may be made for temporary financing needs. Interest is charged to each fund, based on its borrowings, generally at a rate equal to the higher of the Overnight Federal Reserve funds rate or daily one month LIBOR plus an agreed upon spread. A commitment fee, based on the average daily, unused portion of the committed line of credit, is allocated among the participating funds at the end of each calendar quarter. In addition, the fund and other funds managed by MFS have established unsecured uncommitted borrowing arrangements with certain banks for temporary financing needs. Interest is charged to each fund, based on its borrowings, at a rate equal to the Overnight Federal Reserve funds rate plus an agreed upon spread. For the six months ended March 31, 2016, the fund’s commitment fee and interest expense were $7,953 and $0, respectively, and are included in “Miscellaneous” expense in the Statement of Operations.
37
Notes to Financial Statements (unaudited) – continued
(7) Transactions in Underlying Affiliated Funds-Affiliated Issuers
An affiliated issuer may be considered one in which the fund owns 5% or more of the outstanding voting securities, or a company which is under common control. For the purposes of this report, the fund assumes the following to be an affiliated issuer:
| | | | | | | | | | | | | | | | |
| Underlying Affiliated Fund | | Beginning
Shares/Par
Amount | | | Acquisitions
Shares/Par
Amount | | | Dispositions
Shares/Par
Amount | | | Ending
Shares/Par
Amount | |
MFS Institutional Money
Market Portfolio | | | 43,464,374 | | | | 306,821,959 | | | | (327,424,213 | ) | | | 22,862,120 | |
| | | | |
| Underlying Affiliated Fund | | Realized
Gain (Loss) | | | Capital Gain
Distributions | | | Dividend
Income | | | Ending
Value | |
MFS Institutional Money
Market Portfolio | | | $— | | | | $— | | | | $49,021 | | | | $22,862,120 | |
38
PROXY VOTING POLICIES AND INFORMATION
MFS votes proxies on behalf of the fund pursuant to proxy voting policies and procedures that are available without charge, upon request, by calling 1-800-225-2606, by visiting the Proxy Voting section of mfs.com or by visiting the SEC’s Web site at http://www.sec.gov.
Information regarding how the fund voted proxies relating to portfolio securities during the most recent twelve-month period ended June 30 is available without charge by visiting the Proxy Voting section of mfs.com or by visiting the SEC’s Web site at http://www.sec.gov.
QUARTERLY PORTFOLIO DISCLOSURE
The fund will file a complete schedule of portfolio holdings with the Securities and Exchange Commission (the Commission) for the first and third quarters of each fiscal year on Form N-Q. A shareholder can obtain the quarterly portfolio holdings report at mfs.com. The fund’s Form N-Q is also available on the EDGAR database on the Commission’s Internet Web site at http://www.sec.gov, and may be reviewed and copied at the:
Public Reference Room
Securities and Exchange Commission
100 F Street, NE, Room 1580
Washington, D.C. 20549
Information on the operation of the Public Reference Room may be obtained by calling the Commission at 1-800-SEC-0330. Copies of the fund’s Form N-Q also may be obtained, upon payment of a duplicating fee, by electronic request at the following e-mail address: publicinfo@sec.gov or by writing the Public Reference Section at the above address.
FURTHER INFORMATION
From time to time, MFS may post important information about the fund or the MFS funds on the MFS web site (mfs.com). This information is available by visiting the “Market Commentary” and “Announcements” sub sections in the “Market Outlooks” section of mfs.com or by clicking on the fund’s name under “Mutual Funds” in the “Products” section of mfs.com.
PROVISION OF FINANCIAL REPORTS AND SUMMARY PROSPECTUSES
The fund produces financial reports every six months and updates its summary prospectus and prospectus annually. To avoid sending duplicate copies of materials to households, only one copy of the fund’s annual and semiannual report and summary prospectus may be mailed to shareholders having the same last name and residential address on the fund’s records. However, any shareholder may contact MFSC (please see back cover for address and telephone number) to request that copies of these reports and summary prospectuses be sent personally to that shareholder.
39
Save paper with eDelivery.

| MFS® will send you prospectuses, |
reports, and proxies directly via e-mail so you will get information faster with less mailbox clutter.
To sign up:
1. Go to mfs.com.
2. Log in via MFS® Access.
3. Select eDelivery.
If you own your MFS fund shares through a financial institution or a retirement plan, MFS® TALK, MFS® Access, or eDelivery may not be available to you.
CONTACT
WEB SITE
mfs.com
MFS TALK
1-800-637-8255
24 hours a day
ACCOUNT SERVICE AND LITERATURE
Shareholders
1-800-225-2606
Financial advisors
1-800-343-2829
Retirement plan services
1-800-637-1255
MAILING ADDRESS
MFS Service Center, Inc.
P.O. Box 55824
Boston, MA 02205-5824
OVERNIGHT MAIL
MFS Service Center, Inc.
c/o Boston Financial Data Services
30 Dan Road
Canton, MA 02021-2809
SEMIANNUAL REPORT
March 31, 2016

MFS® TOTAL RETURN FUND

MTR-SEM
MFS® TOTAL RETURN FUND
CONTENTS
The report is prepared for the general information of shareholders.
It is authorized for distribution to prospective investors only when preceded or accompanied by a current prospectus.
NOT FDIC INSURED • MAY LOSE VALUE • NO BANK GUARANTEE

LETTER FROM THE CHAIRMAN
Dear Shareholders:
Markets remained volatile in the first quarter of 2016, but after a tough start to the year stocks largely recouped their losses, with most major indices closing out the
quarter roughly where they were at the beginning of the year. After falling to multiyear lows in February, oil prices stabilized as oil-producing nations began taking steps to cap crude production. U.S. economic growth remained positive but unspectacular amid continued improvement in labor markets and upbeat service-sector activity. Headwinds from abroad forced the U.S. Federal Reserve to table its plans to tighten monetary policy, while the Bank of Japan and the European Central Bank continued to ease policy aggressively, perpetuating a lower-for-longer global interest rate environment.
China’s economy — while suffering growing pains linked to its shift from an export-led to a consumer-driven economic model — appeared to stabilize as the first quarter drew to a close. Europe awaits a crucial referendum scheduled for June 23 in which British voters will decide whether the United Kingdom should remain in the European Union.
As markets have become more focused on short-term trends in recent years, we believe it’s important for investors to lengthen their investment time horizon. At MFS®, we don’t trade on headlines or trends; we invest for the long term.
We believe that this approach, coupled with the professional guidance of a financial advisor, will help you reach your investment goals.
Respectfully,

Robert J. Manning
Chairman
MFS Investment Management
May 16, 2016
The opinions expressed in this letter are subject to change and may not be relied upon for investment advice. No forecasts can be guaranteed.
1
PORTFOLIO COMPOSITION
Portfolio structure (i)
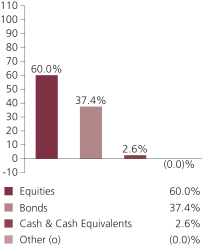
| | | | |
| Top ten holdings (i) | | | | |
| U.S. Treasury Notes, 0.875%, 12/31/2016 | | | 2.5% | |
| U.S. Treasury Bonds, 2.875%, 5/15/2043 | | | 2.4% | |
| JPMorgan Chase & Co. | | | 2.3% | |
| U.S. Treasury Notes, 1%, 6/30/2019 | | | 2.0% | |
| Philip Morris International, Inc. | | | 1.7% | |
| U.S. Treasury Notes, 3.125%, 5/15/2021 | | | 1.6% | |
| Wells Fargo & Co. | | | 1.5% | |
| Freddie Mac, 4%, 30 Years | | | 1.4% | |
| Fannie Mae, 4%, 30 Years | | | 1.3% | |
| Johnson & Johnson | | | 1.2% | |
| | | | |
| Composition including fixed income credit quality (a)(i) | |
| AAA | | | 1.9% | |
| AA | | | 1.0% | |
| A | | | 4.2% | |
| BBB | | | 7.2% | |
| BB | | | 0.1% | |
| B (o) | | | 0.0% | |
| CCC (o) | | | 0.0% | |
| C | | | 0.1% | |
| U.S. Government | | | 12.2% | |
| Federal Agencies | | | 10.7% | |
| Not Rated (o) | | | 0.0% | |
| Non-Fixed Income | | | 60.0% | |
| Cash & Cash Equivalents | | | 2.6% | |
| Other (o) | | | (0.0)% | |
|
| Equity sectors | |
| Financial Services | | | 13.6% | |
| Health Care | | | 7.9% | |
| Consumer Staples | | | 6.2% | |
| Industrial Goods & Services | | | 5.9% | |
| Technology | | | 4.3% | |
| Utilities & Communications | | | 4.0% | |
| Energy | | | 3.7% | |
| Leisure | | | 3.4% | |
| Retailing | | | 3.3% | |
| Basic Materials | | | 3.1% | |
| Autos & Housing | | | 2.2% | |
| Special Products & Services | | | 1.5% | |
| Transportation | | | 0.9% | |
2
Portfolio Composition – continued
| | | | |
| Fixed income sectors (i) | |
| U.S. Treasury Securities | | | 12.2% | |
| Investment Grade Corporates | | | 11.2% | |
| Mortgage-Backed Securities | | | 10.5% | |
| Commercial Mortgage-Backed Securities | | | 1.5% | |
| Emerging Markets Bonds | | | 0.7% | |
| Collateralized Debt Obligations | | | 0.4% | |
| Non-U.S. Government Bonds | | | 0.3% | |
| Asset-Backed Securities | | | 0.2% | |
| High Yield Corporates | | | 0.2% | |
| U.S. Government Agencies | | | 0.2% | |
| Residential Mortgage-Backed Securities (o) | | | 0.0% | |
| (a) | For all securities other than those specifically described below, ratings are assigned to underlying securities utilizing ratings from Moody’s, Fitch, and Standard & Poor’s rating agencies and applying the following hierarchy: If all three agencies provide a rating, the middle rating (after dropping the highest and lowest ratings) is assigned; if two of the three agencies rate a security, the lower of the two is assigned. Ratings are shown in the S&P and Fitch scale (e.g., AAA). Securities rated BBB or higher are considered investment grade. All ratings are subject to change. U.S. Government includes securities issued by the U.S. Department of the Treasury. Federal Agencies includes rated and unrated U.S. Agency fixed-income securities, U.S. Agency mortgage-backed securities, and collateralized mortgage obligations of U.S. Agency mortgage-backed securities. Not Rated includes fixed income securities, including fixed income futures contracts, which have not been rated by any rating agency. Non-Fixed Income includes equity securities (including convertible bonds and equity derivatives) and commodities. The fund may not hold all of these instruments. The fund is not rated by these agencies. |
| (i) | For purposes of this presentation, the components include the value of securities, and reflect the impact of the equivalent exposure of derivative positions, if any. These amounts may be negative from time to time. Equivalent exposure is a calculated amount that translates the derivative position into a reasonable approximation of the amount of the underlying asset that the portfolio would have to hold at a given point in time to have the same price sensitivity that results from the portfolio’s ownership of the derivative contract. When dealing with derivatives, equivalent exposure is a more representative measure of the potential impact of a position on portfolio performance than value. The bond component will include any accrued interest amounts. |
From time to time Other may be negative due to equivalent exposure from currency derivatives and/or offsets to derivative positions.
Where the fund holds convertible bonds, these are treated as part of the equity portion of the portfolio.
Cash & Cash Equivalents includes any cash, investments in money market funds, short-term securities, and other assets less liabilities. Please see the Statement of Assets and Liabilities for additional information related to the fund’s cash position and other assets and liabilities.
Other includes currency derivatives and/or any offsets to derivative positions.
Percentages are based on net assets as of 3/31/16.
The portfolio is actively managed and current holdings may be different.
3
EXPENSE TABLE
Fund expenses borne by the shareholders during the period, October 1, 2015 through March 31, 2016
As a shareholder of the fund, you incur two types of costs: (1) transaction costs, including sales charges (loads) on certain purchase or redemption payments, and (2) ongoing costs, including management fees; distribution and service (12b-1) fees; and other fund expenses. This example is intended to help you understand your ongoing costs (in dollars) of investing in the fund and to compare these costs with the ongoing costs of investing in other mutual funds.
The example is based on an investment of $1,000 invested at the beginning of the period and held for the entire period October 1, 2015 through March 31, 2016.
Actual Expenses
The first line for each share class in the following table provides information about actual account values and actual expenses. You may use the information in this line, together with the amount you invested, to estimate the expenses that you paid over the period. Simply divide your account value by $1,000 (for example, an $8,600 account value divided by $1,000 = 8.6), then multiply the result by the number in the first line under the heading entitled “Expenses Paid During Period” to estimate the expenses you paid on your account during this period.
Hypothetical Example for Comparison Purposes
The second line for each share class in the following table provides information about hypothetical account values and hypothetical expenses based on the fund’s actual expense ratio and an assumed rate of return of 5% per year before expenses, which is not the fund’s actual return. The hypothetical account values and expenses may not be used to estimate the actual ending account balance or expenses you paid for the period. You may use this information to compare the ongoing costs of investing in the fund and other funds. To do so, compare this 5% hypothetical example with the 5% hypothetical examples that appear in the shareholder reports of the other funds.
Please note that the expenses shown in the table are meant to highlight your ongoing costs only and do not reflect any transactional costs, such as sales charges (loads). Therefore, the second line for each share class in the table is useful in comparing ongoing costs only, and will not help you determine the relative total costs of owning different funds. In addition, if these transactional costs were included, your costs would have been higher.
4
Expense Table – continued
| | | | | | | | | | | | | | | | | | |
Share
Class | | | | Annualized
Expense
Ratio | | | Beginning
Account Value
10/01/15 | | | Ending
Account Value
3/31/16 | | | Expenses
Paid During
Period (p)
10/01/15-3/31/16 | |
| A | | Actual | | | 0.74% | | | | $1,000.00 | | | | $1,053.11 | | | | $3.80 | |
| | Hypothetical (h) | | | 0.74% | | | | $1,000.00 | | | | $1,021.30 | | | | $3.74 | |
| B | | Actual | | | 1.49% | | | | $1,000.00 | | | | $1,049.05 | | | | $7.63 | |
| | Hypothetical (h) | | | 1.49% | | | | $1,000.00 | | | | $1,017.55 | | | | $7.52 | |
| C | | Actual | | | 1.49% | | | | $1,000.00 | | | | $1,048.87 | | | | $7.63 | |
| | Hypothetical (h) | | | 1.49% | | | | $1,000.00 | | | | $1,017.55 | | | | $7.52 | |
| I | | Actual | | | 0.49% | | | | $1,000.00 | | | | $1,053.80 | | | | $2.52 | |
| | Hypothetical (h) | | | 0.49% | | | | $1,000.00 | | | | $1,022.55 | | | | $2.48 | |
| R1 | | Actual | | | 1.49% | | | | $1,000.00 | | | | $1,049.21 | | | | $7.63 | |
| | Hypothetical (h) | | | 1.49% | | | | $1,000.00 | | | | $1,017.55 | | | | $7.52 | |
| R2 | | Actual | | | 0.99% | | | | $1,000.00 | | | | $1,051.62 | | | | $5.08 | |
| | Hypothetical (h) | | | 0.99% | | | | $1,000.00 | | | | $1,020.05 | | | | $5.00 | |
| R3 | | Actual | | | 0.74% | | | | $1,000.00 | | | | $1,053.04 | | | | $3.80 | |
| | Hypothetical (h) | | | 0.74% | | | | $1,000.00 | | | | $1,021.30 | | | | $3.74 | |
| R4 | | Actual | | | 0.49% | | | | $1,000.00 | | | | $1,053.73 | | | | $2.52 | |
| | Hypothetical (h) | | | 0.49% | | | | $1,000.00 | | | | $1,022.55 | | | | $2.48 | |
| R5 | | Actual | | | 0.41% | | | | $1,000.00 | | | | $1,054.85 | | | | $2.11 | |
| | Hypothetical (h) | | | 0.41% | | | | $1,000.00 | | | | $1,022.95 | | | | $2.07 | |
| 529A | | Actual | | | 0.78% | | | | $1,000.00 | | | | $1,052.43 | | | | $4.00 | |
| | Hypothetical (h) | | | 0.78% | | | | $1,000.00 | | | | $1,021.10 | | | | $3.94 | |
| 529B | | Actual | | | 1.54% | | | | $1,000.00 | | | | $1,048.78 | | | | $7.89 | |
| | Hypothetical (h) | | | 1.54% | | | | $1,000.00 | | | | $1,017.30 | | | | $7.77 | |
| 529C | | Actual | | | 1.54% | | | | $1,000.00 | | | | $1,048.62 | | | | $7.89 | |
| | Hypothetical (h) | | | 1.54% | | | | $1,000.00 | | | | $1,017.30 | | | | $7.77 | |
| (h) | 5% class return per year before expenses. |
| (p) | “Expenses Paid During Period” are equal to each class’s annualized expense ratio, as shown above, multiplied by the average account value over the period, multiplied by 183/366 (to reflect the one-half year period). Expenses paid do not include any applicable sales charges (loads). If these transaction costs had been included, your costs would have been higher. |
Notes to Expense Table
Each class with a Rule 12b-1 service fee is subject to a rebate of a portion of such fee. Such rebates are included in the expense ratios above. For Class 529A shares, this rebate reduced the expense ratio above by 0.01%. See Note 3 in the Notes to Financial Statements for additional information.
5
PORTFOLIO OF INVESTMENTS
3/31/16 (unaudited)
The Portfolio of Investments is a complete list of all securities owned by your fund. It is categorized by broad-based asset classes.
| | | | | | | | |
| Common Stocks - 59.1% | | | | | | | | |
| Issuer | | Shares/Par | | | Value ($) | |
| Aerospace - 2.8% | | | | | | | | |
| Honeywell International, Inc. | | | 535,746 | | | $ | 60,030,339 | |
| Lockheed Martin Corp. | | | 173,758 | | | | 38,487,397 | |
| Northrop Grumman Corp. | | | 228,780 | | | | 45,275,562 | |
| Orbital ATK, Inc. | | | 34,750 | | | | 3,021,165 | |
| United Technologies Corp. | | | 533,445 | | | | 53,397,845 | |
| | | | | | | | |
| | | | $ | 200,212,308 | |
| Airlines - 0.1% | | | | | | | | |
| Delta Air Lines, Inc. | | | 144,760 | | | $ | 7,046,917 | |
| | |
| Alcoholic Beverages - 0.4% | | | | | | | | |
| Diageo PLC | | | 955,174 | | | $ | 25,811,708 | |
| | |
| Automotive - 1.6% | | | | | | | | |
| Delphi Automotive PLC | | | 257,056 | | | $ | 19,284,341 | |
| General Motors Co. | | | 298,132 | | | | 9,370,289 | |
| Harley-Davidson, Inc. | | | 136,906 | | | | 7,027,385 | |
| Hyundai Motor Co. | | | 74,722 | | | | 9,964,240 | |
| Johnson Controls, Inc. | | | 621,827 | | | | 24,232,598 | |
| Kia Motors Corp. | | | 369,295 | | | | 15,597,192 | |
| LKQ Corp. (a) | | | 301,856 | | | | 9,638,262 | |
| Magna International, Inc. | | | 396,269 | | | | 17,034,609 | |
| | | | | | | | |
| | | | $ | 112,148,916 | |
| Biotechnology - 0.2% | | | | | | | | |
| Celgene Corp. (a) | | | 57,090 | | | $ | 5,714,138 | |
| Gilead Sciences, Inc. | | | 98,596 | | | | 9,057,029 | |
| | | | | | | | |
| | | | $ | 14,771,167 | |
| Broadcasting - 1.2% | | | | | | | | |
| Omnicom Group, Inc. | | | 382,202 | | | $ | 31,810,672 | |
| Time Warner, Inc. | | | 433,745 | | | | 31,468,200 | |
| Twenty-First Century Fox, Inc. | | | 320,339 | | | | 8,931,051 | |
| Viacom, Inc., “B” | | | 130,269 | | | | 5,377,504 | |
| Walt Disney Co. | | | 102,803 | | | | 10,209,366 | |
| | | | | | | | |
| | | | $ | 87,796,793 | |
| Brokerage & Asset Managers - 0.9% | | | | | | | | |
| BlackRock, Inc. | | | 72,166 | | | $ | 24,577,575 | |
| Blackstone Group LP | | | 195,715 | | | | 5,489,806 | |
6
Portfolio of Investments (unaudited) – continued
| | | | | | | | |
| Issuer | | Shares/Par | | | Value ($) | |
| Common Stocks - continued | | | | | | | | |
| Brokerage & Asset Managers - continued | | | | | | | | |
| Franklin Resources, Inc. | | | 559,081 | | | $ | 21,832,113 | |
| NASDAQ, Inc. | | | 222,999 | | | | 14,802,674 | |
| | | | | | | | |
| | | | $ | 66,702,168 | |
| Business Services - 1.5% | | | | | | | | |
| Accenture PLC, “A” | | | 561,536 | | | $ | 64,801,254 | |
| Equifax, Inc. | | | 27,563 | | | | 3,150,175 | |
| Fidelity National Information Services, Inc. | | | 186,983 | | | | 11,837,894 | |
| Fiserv, Inc. (a) | | | 67,007 | | | | 6,873,578 | |
| Global Payments, Inc. | | | 288,509 | | | | 18,839,638 | |
| | | | | | | | |
| | | | $ | 105,502,539 | |
| Cable TV - 1.5% | | | | | | | | |
| Comcast Corp., “A” | | | 1,192,851 | | | $ | 72,859,339 | |
| Time Warner Cable, Inc. | | | 169,154 | | | | 34,612,291 | |
| | | | | | | | |
| | | | $ | 107,471,630 | |
| Chemicals - 2.4% | | | | | | | | |
| 3M Co. | | | 316,574 | | | $ | 52,750,726 | |
| Celanese Corp. | | | 145,164 | | | | 9,508,242 | |
| E.I. du Pont de Nemours & Co. | | | 279,071 | | | | 17,670,776 | |
| LyondellBasell Industries N.V., “A” | | | 300,616 | | | | 25,726,717 | |
| Monsanto Co. | | | 57,146 | | | | 5,013,990 | |
| PPG Industries, Inc. | | | 521,311 | | | | 58,120,963 | |
| | | | | | | | |
| | | | $ | 168,791,414 | |
| Computer Software - 1.0% | | | | | | | | |
| CA, Inc. | | | 280,226 | | | $ | 8,628,159 | |
| Microsoft Corp. | | | 487,413 | | | | 26,919,820 | |
| Oracle Corp. | | | 604,966 | | | | 24,749,159 | |
| Sabre Corp. | | | 427,572 | | | | 12,365,382 | |
| | | | | | | | |
| | | | $ | 72,662,520 | |
| Computer Software - Systems - 0.9% | | | | | | | | |
| Apple, Inc. | | | 124,089 | | | $ | 13,524,460 | |
| Hewlett Packard Enterprise | | | 376,480 | | | | 6,674,990 | |
| International Business Machines Corp. | | | 226,225 | | | | 34,261,776 | |
| Seagate Technology PLC | | | 172,007 | | | | 5,925,641 | |
| | | | | | | | |
| | | | $ | 60,386,867 | |
| Construction - 0.6% | | | | | | | | |
| Bellway PLC | | | 74,835 | | | $ | 2,819,247 | |
| Owens Corning | | | 477,967 | | | | 22,598,280 | |
| Stanley Black & Decker, Inc. | | | 131,937 | | | | 13,881,092 | |
| | | | | | | | |
| | | | $ | 39,298,619 | |
7
Portfolio of Investments (unaudited) – continued
| | | | | | | | |
| Issuer | | Shares/Par | | | Value ($) | |
| Common Stocks - continued | | | | | | | | |
| Consumer Products - 0.5% | | | | | | | | |
| Kimberly-Clark Corp. | | | 89,164 | | | $ | 11,993,450 | |
| Newell Rubbermaid, Inc. (l) | | | 106,425 | | | | 4,713,563 | |
| Procter & Gamble Co. | | | 83,954 | | | | 6,910,254 | |
| Reckitt Benckiser Group PLC | | | 92,817 | | | | 8,971,656 | |
| | | | | | | | |
| | | | $ | 32,588,923 | |
| Containers - 0.1% | | | | | | | | |
| Crown Holdings, Inc. (a) | | | 143,665 | | | $ | 7,124,347 | |
| | |
| Electrical Equipment - 1.5% | | | | | | | | |
| Danaher Corp. | | | 661,973 | | | $ | 62,794,759 | |
| Pentair PLC | | | 222,202 | | | | 12,056,681 | �� |
| Tyco International PLC | | | 773,961 | | | | 28,412,108 | |
| | | | | | | | |
| | | | $ | 103,263,548 | |
| Electronics - 1.1% | | | | | | | | |
| Analog Devices, Inc. | | | 78,077 | | | $ | 4,621,378 | |
| Intel Corp. | | | 267,391 | | | | 8,650,099 | |
| Maxim Integrated Products, Inc. | | | 208,164 | | | | 7,656,272 | |
| Microchip Technology, Inc. | | | 144,018 | | | | 6,941,668 | |
| Taiwan Semiconductor Manufacturing Co. Ltd., ADR | | | 833,730 | | | | 21,843,726 | |
| Texas Instruments, Inc. | | | 517,958 | | | | 29,741,148 | |
| | | | | | | | |
| | | | $ | 79,454,291 | |
| Energy - Independent - 1.9% | | | | | | | | |
| Anadarko Petroleum Corp. | | | 234,170 | | | $ | 10,905,297 | |
| California Resources Corp. | | | 9,617 | | | | 9,906 | |
| Canadian Natural Resources Ltd. | | | 177,900 | | | | 4,803,300 | |
| EOG Resources, Inc. | | | 304,411 | | | | 22,094,150 | |
| EQT Corp. | | | 140,901 | | | | 9,477,001 | |
| Hess Corp. | | | 203,255 | | | | 10,701,376 | |
| Marathon Petroleum Corp. | | | 257,480 | | | | 9,573,106 | |
| Noble Energy, Inc. | | | 303,253 | | | | 9,525,177 | |
| Occidental Petroleum Corp. | | | 289,894 | | | | 19,837,446 | |
| Valero Energy Corp. | | | 534,127 | | | | 34,258,906 | |
| | | | | | | | |
| | | | $ | 131,185,665 | |
| Energy - Integrated - 1.4% | | | | | | | | |
| BP PLC | | | 2,967,432 | | | $ | 14,923,302 | |
| Chevron Corp. | | | 389,192 | | | | 37,128,917 | |
| Exxon Mobil Corp. | | | 519,557 | | | | 43,429,770 | |
| | | | | | | | |
| | | | $ | 95,481,989 | |
8
Portfolio of Investments (unaudited) – continued
| | | | | | | | |
| Issuer | | Shares/Par | | | Value ($) | |
| Common Stocks - continued | | | | | | | | |
| Food & Beverages - 2.4% | | | | | | | | |
| Archer Daniels Midland Co. | | | 846,988 | | | $ | 30,754,134 | |
| Coca-Cola Co. | | | 205,085 | | | | 9,513,893 | |
| Danone S.A. | | | 262,997 | | | | 18,707,010 | |
| Dean Foods Co. | | | 148,310 | | | | 2,568,729 | |
| General Mills, Inc. | | | 634,183 | | | | 40,175,493 | |
| J.M. Smucker Co. | | | 22,928 | | | | 2,976,972 | |
| Kellogg Co. | | | 154,188 | | | | 11,803,091 | |
| McCormick & Co., Inc. | | | 66,999 | | | | 6,665,061 | |
| Mondelez International, Inc. | | | 223,050 | | | | 8,948,766 | |
| Nestle S.A. | | | 472,571 | | | | 35,311,972 | |
| | | | | | | | |
| | | | $ | 167,425,121 | |
| Food & Drug Stores - 1.3% | | | | | | | | |
| CVS Health Corp. | | | 720,640 | | | $ | 74,751,987 | |
| Kroger Co. | | | 258,410 | | | | 9,884,183 | |
| Lawson, Inc. | | | 64,800 | | | | 5,423,751 | |
| | | | | | | | |
| | | | $ | 90,059,921 | |
| Gaming & Lodging - 0.1% | | | | | | | | |
| Hilton Worldwide Holdings, Inc. | | | 221,510 | | | $ | 4,988,405 | |
| | |
| General Merchandise - 1.0% | | | | | | | | |
| Kohl’s Corp. | | | 189,810 | | | $ | 8,847,044 | |
| Target Corp. | | | 745,727 | | | | 61,358,418 | |
| | | | | | | | |
| | | | $ | 70,205,462 | |
| Health Maintenance Organizations - 0.2% | | | | | | | | |
| Cigna Corp. | | | 97,968 | | | $ | 13,445,128 | |
| | |
| Insurance - 3.9% | | | | | | | | |
| Aon PLC | | | 336,507 | | | $ | 35,148,156 | |
| Chubb Ltd. | | | 445,289 | | | | 53,056,184 | |
| MetLife, Inc. | | | 1,418,059 | | | | 62,309,512 | |
| Prudential Financial, Inc. | | | 487,716 | | | | 35,222,850 | |
| Suncorp Group Ltd. | | | 983,004 | | | | 8,974,443 | |
| Travelers Cos., Inc. | | | 381,058 | | | | 44,473,279 | |
| Validus Holdings Ltd. | | | 441,680 | | | | 20,842,879 | |
| Zurich Insurance Group AG | | | 73,329 | | | | 17,029,136 | |
| | | | | | | | |
| | | | $ | 277,056,439 | |
| Internet - 0.5% | | | | | | | | |
| Alphabet, Inc., “A” (a) | | | 12,352 | | | $ | 9,423,341 | |
| Facebook, Inc., “A” (a) | | | 231,173 | | | | 26,376,839 | |
| | | | | | | | |
| | | | $ | 35,800,180 | |
9
Portfolio of Investments (unaudited) – continued
| | | | | | | | |
| Issuer | | Shares/Par | | | Value ($) | |
| Common Stocks - continued | | | | | | | | |
| Leisure & Toys - 0.3% | | | | | | | | |
| Activision Blizzard, Inc. | | | 378,554 | | | $ | 12,810,267 | |
| Electronic Arts, Inc. (a) | | | 45,989 | | | | 3,040,333 | |
| Take-Two Interactive Software, Inc. (a) | | | 196,590 | | | | 7,405,545 | |
| | | | | | | | |
| | | | $ | 23,256,145 | |
| Machinery & Tools - 1.5% | | | | | | | | |
| Allison Transmission Holdings, Inc. | | | 629,115 | | | $ | 16,973,523 | |
| Caterpillar, Inc. | | | 114,868 | | | | 8,791,997 | |
| Cummins, Inc. | | | 128,895 | | | | 14,170,716 | |
| Deere & Co. | | | 158,614 | | | | 12,211,692 | |
| Eaton Corp. PLC | | | 376,799 | | | | 23,572,545 | |
| Illinois Tool Works, Inc. | | | 274,523 | | | | 28,122,136 | |
| Ingersoll-Rand Co. Ltd., “A” | | | 65,865 | | | | 4,084,289 | |
| | | | | | | | |
| | | | $ | 107,926,898 | |
| Major Banks - 6.2% | | | | | | | | |
| Bank of America Corp. | | | 1,098,698 | | | $ | 14,854,397 | |
| Bank of New York Mellon Corp. | | | 960,254 | | | | 35,366,155 | |
| BNP Paribas | | | 100,370 | | | | 5,051,553 | |
| BOC Hong Kong Holdings Ltd. | | | 1,373,000 | | | | 4,097,398 | |
| Goldman Sachs Group, Inc. | | | 270,276 | | | | 42,427,926 | |
| HSBC Holdings PLC | | | 1,188,566 | | | | 7,407,011 | |
| JPMorgan Chase & Co. | | | 2,687,192 | | | | 159,135,510 | |
| Morgan Stanley | | | 353,699 | | | | 8,846,012 | |
| PNC Financial Services Group, Inc. | | | 210,601 | | | | 17,810,527 | |
| State Street Corp. | | | 394,685 | | | | 23,096,966 | |
| Sumitomo Mitsui Financial Group, Inc. | | | 369,500 | | | | 11,202,044 | |
| Wells Fargo & Co. | | | 2,187,903 | | | | 105,806,989 | |
| | | | | | | | |
| | | | $ | 435,102,488 | |
| Medical & Health Technology & Services - 0.4% | | | | | | | | |
| Community Health Systems, Inc. (a) | | | 373,473 | | | $ | 6,912,985 | |
| Express Scripts Holding Co. (a) | | | 133,792 | | | | 9,190,172 | |
| McKesson Corp. | | | 67,511 | | | | 10,616,105 | |
| | | | | | | | |
| | | | $ | 26,719,262 | |
| Medical Equipment - 2.5% | | | | | | | | |
| Abbott Laboratories | | | 848,444 | | | $ | 35,490,413 | |
| Cooper Cos., Inc. | | | 91,597 | | | | 14,103,190 | |
| Medtronic PLC | | | 650,766 | | | | 48,807,450 | |
| St. Jude Medical, Inc. | | | 362,270 | | | | 19,924,850 | |
| Thermo Fisher Scientific, Inc. | | | 319,852 | | | | 45,287,845 | |
| Zimmer Biomet Holdings, Inc. | | | 124,646 | | | | 13,291,003 | |
| | | | | | | | |
| | | | $ | 176,904,751 | |
10
Portfolio of Investments (unaudited) – continued
| | | | | | | | |
| Issuer | | Shares/Par | | | Value ($) | |
| Common Stocks - continued | | | | | | | | |
| Metals & Mining - 0.2% | | | | | | | | |
| BHP Billiton PLC | | | 611,266 | | | $ | 6,872,442 | |
| Rio Tinto PLC | | | 282,950 | | | | 7,946,896 | |
| | | | | | | | |
| | | | $ | 14,819,338 | |
| Natural Gas - Distribution - 0.1% | | | | | | | | |
| Engie | | | 593,345 | | | $ | 9,209,281 | |
| | |
| Natural Gas - Pipeline - 0.2% | | | | | | | | |
| Enterprise Products Partners LP | | | 177,806 | | | $ | 4,377,584 | |
| Williams Partners LP | | | 364,710 | | | | 7,458,320 | |
| | | | | | | | |
| | | | $ | 11,835,904 | |
| Network & Telecom - 0.8% | | | | | | | | |
| Cisco Systems, Inc. | | | 1,428,352 | | | $ | 40,665,181 | |
| Motorola Solutions, Inc. | | | 195,180 | | | | 14,775,126 | |
| | | | | | | | |
| | | | $ | 55,440,307 | |
| Oil Services - 0.5% | | | | | | | | |
| Baker Hughes, Inc. | | | 21,395 | | | $ | 937,743 | |
| National Oilwell Varco, Inc. | | | 212,572 | | | | 6,610,989 | |
| Noble Corp. PLC | | | 370,717 | | | | 3,836,921 | |
| Schlumberger Ltd. | | | 283,706 | | | | 20,923,318 | |
| | | | | | | | |
| | | | $ | 32,308,971 | |
| Other Banks & Diversified Financials - 2.0% | | | | | | | | |
| American Express Co. | | | 383,123 | | | $ | 23,523,752 | |
| BB&T Corp. | | | 525,117 | | | | 17,470,643 | |
| Citigroup, Inc. | | | 395,156 | | | | 16,497,763 | |
| Discover Financial Services | | | 289,665 | | | | 14,749,742 | |
| SunTrust Banks, Inc. | | | 157,112 | | | | 5,668,601 | |
| U.S. Bancorp | | | 621,585 | | | | 25,230,135 | |
| UBS Group AG | | | 812,825 | | | | 13,094,128 | |
| Visa, Inc., “A” | | | 272,444 | | | | 20,836,517 | |
| | | | | | | | |
| | | | $ | 137,071,281 | |
| Pharmaceuticals - 4.5% | | | | | | | | |
| Allergan PLC (a) | | | 58,503 | | | $ | 15,680,559 | |
| Bayer AG | | | 64,629 | | | | 7,596,820 | |
| Bristol-Myers Squibb Co. | | | 446,091 | | | | 28,496,293 | |
| Eli Lilly & Co. | | | 601,901 | | | | 43,342,891 | |
| Endo International PLC (a) | | | 227,724 | | | | 6,410,431 | |
| Johnson & Johnson | | | 777,724 | | | | 84,149,737 | |
| Merck & Co., Inc. | | | 1,400,481 | | | | 74,099,450 | |
| Novartis AG | | | 48,519 | | | | 3,517,003 | |
11
Portfolio of Investments (unaudited) – continued
| | | | | | | | |
| Issuer | | Shares/Par | | | Value ($) | |
| Common Stocks - continued | | | | | | | | |
| Pharmaceuticals - continued | | | | | | | | |
| Pfizer, Inc. | | | 1,420,709 | | | $ | 42,109,815 | |
| Roche Holding AG | | | 13,920 | | | | 3,426,617 | |
| Teva Pharmaceutical Industries Ltd., ADR | | | 114,920 | | | | 6,149,369 | |
| | | | | | | | |
| | | | $ | 314,978,985 | |
| Printing & Publishing - 0.0% | | | | | | | | |
| McGraw-Hill Cos., Inc. | | | 27,944 | | | $ | 2,765,897 | |
| Time, Inc. | | | 15,019 | | | | 231,893 | |
| | | | | | | | |
| | | | $ | 2,997,790 | |
| Railroad & Shipping - 0.4% | | | | | | | | |
| Canadian National Railway Co. | | | 125,827 | | | $ | 7,859,154 | |
| Union Pacific Corp. | | | 247,427 | | | | 19,682,818 | |
| | | | | | | | |
| | | | $ | 27,541,972 | |
| Real Estate - 0.6% | | | | | | | | |
| Hospitality Properties Trust, REIT | | | 228,696 | | | $ | 6,074,166 | |
| Medical Properties Trust, Inc., REIT | | | 680,453 | | | | 8,832,280 | |
| Mid-America Apartment Communities, Inc., REIT | | | 157,778 | | | | 16,126,489 | |
| Starwood Property Trust, Inc., REIT | | | 303,369 | | | | 5,742,775 | |
| Store Capital Corp., REIT | | | 178,490 | | | | 4,619,321 | |
| | | | | | | | |
| | | | $ | 41,395,031 | |
| Restaurants - 0.2% | | | | | | | | |
| Aramark | | | 307,672 | | | $ | 10,190,097 | |
| YUM! Brands, Inc. | | | 65,063 | | | | 5,325,407 | |
| | | | | | | | |
| | | | $ | 15,515,504 | |
| Specialty Chemicals - 0.4% | | | | | | | | |
| Axalta Coating Systems Ltd. (a) | | | 399,006 | | | $ | 11,650,975 | |
| Marine Harvest A.S.A. | | | 631,751 | | | | 9,734,281 | |
| Praxair, Inc. | | | 51,916 | | | | 5,941,786 | |
| | | | | | | | |
| | | | $ | 27,327,042 | |
| Specialty Stores - 1.0% | | | | | | | | |
| Abercrombie & Fitch Co., “A” | | | 238,480 | | | $ | 7,521,659 | |
| Advance Auto Parts, Inc. | | | 29,212 | | | | 4,683,852 | |
| Amazon.com, Inc. (a) | | | 60,109 | | | | 35,683,107 | |
| American Eagle Outfitters, Inc. | | | 1,374,050 | | | | 22,905,414 | |
| Bed Bath & Beyond, Inc. (a) | | | 49,793 | | | | 2,471,725 | |
| | | | | | | | |
| | | | $ | 73,265,757 | |
| Telecommunications - Wireless - 0.0% | | | | | | | | |
| Vodafone Group PLC | | | 1,058,762 | | | $ | 3,363,671 | |
12
Portfolio of Investments (unaudited) – continued
| | | | | | | | |
| Issuer | | Shares/Par | | | Value ($) | |
| Common Stocks - continued | | | | | | | | |
| Telephone Services - 1.6% | | | | | | | | |
| AT&T, Inc. | | | 205,077 | | | $ | 8,032,866 | |
| Frontier Communications Corp. | | | 1,326,116 | | | | 7,412,988 | |
| TDC A.S. | | | 1,117,268 | | | | 5,468,190 | |
| Telefonica Brasil S.A., ADR | | | 776,613 | | | | 9,699,896 | |
| Verizon Communications, Inc. | | | 1,536,161 | | | | 83,075,587 | |
| | | | | | | | |
| | | | $ | 113,689,527 | |
| Tobacco - 2.6% | | | | | | | | |
| Altria Group, Inc. | | | 748,353 | | | $ | 46,891,799 | |
| Japan Tobacco, Inc. | | | 187,800 | | | | 7,826,043 | |
| Philip Morris International, Inc. | | | 1,201,245 | | | | 117,854,147 | |
| Reynolds American, Inc. | | | 154,133 | | | | 7,754,431 | |
| | | | | | | | |
| | | | $ | 180,326,420 | |
| Trucking - 0.4% | | | | | | | | |
| United Parcel Service, Inc., “B” | | | 298,375 | | | $ | 31,469,611 | |
| | |
| Utilities - Electric Power - 1.7% | | | | | | | | |
| American Electric Power Co., Inc. | | | 411,418 | | | $ | 27,318,155 | |
| Duke Energy Corp. | | | 226,583 | | | | 18,280,716 | |
| Exelon Corp. | | | 843,140 | | | | 30,235,000 | |
| PPL Corp. | | | 751,514 | | | | 28,610,138 | |
| Public Service Enterprise Group, Inc. | | | 199,831 | | | | 9,420,033 | |
| Xcel Energy, Inc. | | | 80,511 | | | | 3,366,970 | |
| | | | | | | | |
| | | | | | | $ | 117,231,012 | |
| Total Common Stocks (Identified Cost, $3,124,092,831) | | | $ | 4,156,379,933 | |
| | |
| Bonds - 37.2% | | | | | | | | |
| Agency - Other - 0.1% | | | | | | | | |
| Financing Corp., 9.65%, 11/02/2018 | | $ | 2,850,000 | | | $ | 3,479,910 | |
| | |
| Asset-Backed & Securitized - 2.1% | | | | | | | | |
| Atrium CDO Corp., FRN, 1.718%, 11/16/2022 (z) | | $ | 3,217,630 | | | $ | 3,196,118 | |
| Bayview Financial Revolving Mortgage Loan Trust, FRN, 2.035%, 12/28/2040 (z) | | | 5,264,459 | | | | 3,804,930 | |
| BlackRock Capital Finance LP, 7.75%, 9/25/2026 (z) | | | 305,538 | | | | 65,691 | |
| Cent LP, 2013-17A, “A1”, CLO, FRN, 1.916%, 1/30/2025 (n) | | | 5,792,000 | | | | 5,727,135 | |
| Citigroup/Deutsche Bank Commercial Mortgage Trust, 5.322%, 12/11/2049 | | | 5,466,764 | | | | 5,573,384 | |
| Commercial Mortgage Trust, 2015-DC1, “A5”, 3.35%, 2/10/2048 | | | 7,000,000 | | | | 7,281,033 | |
| Commercial Mortgage Trust, 2015-LC21, “A4”, 3.708%, 7/10/2048 | | | 9,641,397 | | | | 10,297,496 | |
13
Portfolio of Investments (unaudited) – continued
| | | | | | | | |
| Issuer | | Shares/Par | | | Value ($) | |
| Bonds - continued | | | | | | | | |
| Asset-Backed & Securitized - continued | | | | | | | | |
| Commercial Mortgage Trust, 2015-PC1, “A5”, 3.902%, 7/10/2050 | | $ | 11,000,000 | | | $ | 11,899,898 | |
| Credit Suisse Mortgage Capital Certificate, 5.695%, 9/15/2040 | | | 8,671,649 | | | | 8,945,264 | |
| CSAIL Commercial Mortgage Trust, 2015-C2, “A4”, 3.504%, 6/15/2057 | | | 5,534,308 | | | | 5,814,303 | |
| Dryden Senior Loan Fund, 2013-26A, “A”, CLO, FRN, 1.722%, 7/15/2025 (n) | | | 7,443,000 | | | | 7,313,455 | |
| Ford Credit Auto Owner Trust, 2014-1, “A”, 2.26%, 11/15/2025 (n) | | | 3,369,000 | | | | 3,413,167 | |
| Ford Credit Auto Owner Trust, 2014-2, “A”, 2.31%, 4/15/2026 (n) | | | 3,092,000 | | | | 3,119,946 | |
| Fortress Credit BSL Ltd., 2013-1A, “A”, FRN, 1.8%, 1/19/2025 (n) | | | 5,676,137 | | | | 5,592,283 | |
| GMAC Mortgage Corp. Loan Trust, 5.805%, 10/25/2036 | | | 1,837,485 | | | | 1,745,205 | |
| GS Mortgage Securities Trust, 2015-GC30, “A4”, 3.382%, 5/10/2050 | | | 10,734,280 | | | | 11,169,234 | |
| ING Investment Management Ltd., 2013-2A, “A1”, CLO, FRN, 1.769%, 4/25/2025 (n) | | | 6,757,000 | | | | 6,630,475 | |
| JPMorgan Chase Commercial Mortgage Securities Corp., “A3”, FRN, 5.935%, 2/15/2051 | | | 293,326 | | | | 292,953 | |
| JPMorgan Chase Commercial Mortgage Securities Corp., “A4”, FRN, 5.743%, 6/15/2049 | | | 13,257,080 | | | | 13,561,211 | |
| Merrill Lynch Mortgage Trust, “A3”, FRN, 5.837%, 6/12/2050 | | | 194,370 | | | | 194,194 | |
| Morgan Stanley Capital I, Inc., FRN, 0.758%, 11/15/2030 (i)(n) | | | 10,835,418 | | | | 153,256 | |
| Residential Funding Mortgage Securities, Inc., 5.32%, 12/25/2035 | | | 4,130,333 | | | | 3,346,867 | |
| Wachovia Bank Commercial Mortgage Trust, “A4”, FRN, 5.946%, 2/15/2051 | | | 8,802,401 | | | | 9,069,899 | |
| Wachovia Bank Commercial Mortgage Trust, FRN, 5.703%, 6/15/2049 | | | 13,568,423 | | | | 13,881,831 | |
| Wells Fargo Commercial Mortgage Trust, 2015-NXS1, “A5”, 3.148%, 5/15/2048 | | | 6,507,931 | | | | 6,677,764 | |
| | | | | | | | |
| | | | | | | $ | 148,766,992 | |
| Automotive - 0.2% | | | | | | | | |
| General Motors Financial Co., Inc., 5.25%, 3/01/2026 | | $ | 3,195,000 | | | $ | 3,341,734 | |
| Nissan Motor Acceptance Corp., 2.35%, 3/04/2019 (n) | | | 2,097,000 | | | | 2,131,206 | |
| Toyota Motor Credit Corp., 3.4%, 9/15/2021 | | | 4,890,000 | | | | 5,251,596 | |
| Volkswagen International Finance N.V., 2.375%, 3/22/2017 (n) | | | 4,856,000 | | | | 4,876,784 | |
| | | | | | | | |
| | | | | | | $ | 15,601,320 | |
| Biotechnology - 0.1% | | | | | | | | |
| Life Technologies Corp., 6%, 3/01/2020 | | $ | 3,000,000 | | | $ | 3,361,659 | |
| Life Technologies Corp., 5%, 1/15/2021 | | | 3,000,000 | | | | 3,274,065 | |
| | | | | | | | |
| | | | | | | $ | 6,635,724 | |
14
Portfolio of Investments (unaudited) – continued
| | | | | | | | |
| Issuer | | Shares/Par | | | Value ($) | |
| Bonds - continued | | | | | | | | |
| Broadcasting - 0.3% | | | | | | | | |
| 21st Century Fox America, Inc., 8.5%, 2/23/2025 | | $ | 5,903,000 | | | $ | 7,900,439 | |
| Grupo Televisa S.A.B., 5%, 5/13/2045 | | | 1,839,000 | | | | 1,691,209 | |
| The Walt Disney Co., 3%, 2/13/2026 | | | 9,850,000 | | | | 10,414,523 | |
| | | | | | | | |
| | | | | | | $ | 20,006,171 | |
| Brokerage & Asset Managers - 0.1% | | | | | | | | |
| Intercontinental Exchange, Inc., 2.75%, 12/01/2020 | | $ | 2,359,000 | | | $ | 2,408,676 | |
| Intercontinental Exchange, Inc., 4%, 10/15/2023 | | | 7,055,000 | | | | 7,365,300 | |
| | | | | | | | |
| | | | | | | $ | 9,773,976 | |
| Cable TV - 0.2% | | | | | | | | |
| CCO Safari II LLC, 4.908%, 7/23/2025 (n) | | $ | 5,325,000 | | | $ | 5,616,895 | |
| Time Warner Entertainment Co. LP, 8.375%, 7/15/2033 | | | 7,170,000 | | | | 9,108,531 | |
| | | | | | | | |
| | | | | | | $ | 14,725,426 | |
| Computer Software - Systems - 0.2% | | | | | | | | |
| Apple, Inc., 2.85%, 2/23/2023 | | $ | 9,582,000 | | | $ | 9,932,308 | |
| Apple, Inc., 3.85%, 5/04/2043 | | | 2,060,000 | | | | 2,002,983 | |
| | | | | | | | |
| | | | | | | $ | 11,935,291 | |
| Conglomerates - 0.1% | | | | | | | | |
| General Electric Capital Corp., 3.1%, 1/09/2023 | | $ | 956,000 | | | $ | 1,012,326 | |
| General Electric Capital Corp., FRN, 1.237%, 1/09/2020 | | | 4,530,000 | | | | 4,531,771 | |
| | | | | | | | |
| | | | | | | $ | 5,544,097 | |
| Consumer Products - 0.2% | | | | | | | | |
| Newell Rubbermaid, Inc., 3.85%, 4/01/2023 | | $ | 7,747,000 | | | $ | 8,034,499 | |
| Reckitt Benckiser Treasury Services PLC, 3.625%, 9/21/2023 (n) | | | 6,003,000 | | | | 6,304,086 | |
| | | | | | | | |
| | | | | | | $ | 14,338,585 | |
| Consumer Services - 0.1% | | | | | | | | |
| Visa, Inc., 3.15%, 12/14/2025 | | $ | 9,366,000 | | | $ | 9,776,933 | |
| | |
| Emerging Market Quasi-Sovereign - 0.3% | | | | | | | | |
| CNOOC Finance (2012) Ltd., 3.875%, 5/02/2022 (n) | | $ | 5,880,000 | | | $ | 6,131,611 | |
| Petroleos Mexicanos, 3.125%, 1/23/2019 | | | 2,358,000 | | | | 2,336,778 | |
| Petroleos Mexicanos, 8%, 5/03/2019 | | | 4,145,000 | | | | 4,617,323 | |
| Ras Laffan Liquefied Natural Gas Co. Ltd., 5.832%, 9/30/2016 (n) | | | 680,916 | | | | 695,059 | |
| State Grid Overseas Investment (2014) Ltd., 2.75%, 5/07/2019 (z) | | | 5,329,000 | | | | 5,468,220 | |
| | | | | | | | |
| | | | | | | $ | 19,248,991 | |
| Emerging Market Sovereign - 0.1% | | | | | | | | |
| Republic of Peru, 7.35%, 7/21/2025 | | $ | 551,000 | | | $ | 724,565 | |
| United Mexican States, 4.75%, 3/08/2044 | | | 7,817,000 | | | | 7,797,458 | |
| | | | | | | | |
| | | | | | | $ | 8,522,023 | |
15
Portfolio of Investments (unaudited) – continued
| | | | | | | | |
| Issuer | | Shares/Par | | | Value ($) | |
| Bonds - continued | | | | | | | | |
| Energy - Independent - 0.1% | | | | | | | | |
| Anadarko Petroleum Corp., 6.375%, 9/15/2017 | | $ | 3,836,000 | | | $ | 4,020,032 | |
| Hess Corp., 8.125%, 2/15/2019 | | | 1,740,000 | | | | 1,911,731 | |
| | | | | | | | |
| | | | | | | $ | 5,931,763 | |
| Energy - Integrated - 0.6% | | | | | | | | |
| BP Capital Markets PLC, 4.5%, 10/01/2020 | | $ | 1,661,000 | | | $ | 1,816,290 | |
| BP Capital Markets PLC, 4.742%, 3/11/2021 | | | 4,892,000 | | | | 5,427,997 | |
| Chevron Corp., 0.788%, 11/15/2017 | | | 11,906,000 | | | | 11,849,863 | |
| Husky Energy, Inc., 7.25%, 12/15/2019 | | | 4,453,000 | | | | 4,921,928 | |
| Petro-Canada, 6.05%, 5/15/2018 | | | 9,475,000 | | | | 10,021,044 | |
| Total Capital International S.A., 1.55%, 6/28/2017 | | | 3,893,000 | | | | 3,908,331 | |
| Total Capital International S.A., 3.75%, 4/10/2024 | | | 6,370,000 | | | | 6,702,387 | |
| | | | | | | | |
| | | | | | | $ | 44,647,840 | |
| Financial Institutions - 0.0% | | | | | | | | |
| GE Capital International Funding Co., 3.373%, 11/15/2025 (n) | | $ | 2,488,000 | | | $ | 2,654,932 | |
| | |
| Food & Beverages - 0.6% | | | | | | | | |
| Anheuser-Busch InBev Finance, Inc., 3.65%, 2/01/2026 | | $ | 11,910,000 | | | $ | 12,524,711 | |
| Anheuser-Busch InBev S.A., 8%, 11/15/2039 | | | 5,850,000 | | | | 8,648,991 | |
| Diageo Capital PLC, 2.625%, 4/29/2023 | | | 6,190,000 | | | | 6,283,605 | |
| J.M. Smucker Co., 3.5%, 3/15/2025 | | | 4,232,000 | | | | 4,411,551 | |
| Kraft Foods Group, Inc., 3.5%, 6/06/2022 | | | 2,361,000 | | | | 2,481,753 | |
| Wm. Wrigley Jr. Co., 2.4%, 10/21/2018 (n) | | | 1,411,000 | | | | 1,425,090 | |
| Wm. Wrigley Jr. Co., 3.375%, 10/21/2020 (n) | | | 4,239,000 | | | | 4,414,270 | |
| | | | | | | | |
| | | | | | | $ | 40,189,971 | |
| Food & Drug Stores - 0.3% | | | | | | | | |
| CVS Health Corp., 3.875%, 7/20/2025 | | $ | 9,168,000 | | | $ | 9,893,418 | |
| Walgreens Boots Alliance, Inc., 3.3%, 11/18/2021 | | | 5,935,000 | | | | 6,111,418 | |
| Walgreens Boots Alliance, Inc., 4.5%, 11/18/2034 | | | 2,991,000 | | | | 2,904,644 | |
| | | | | | | | |
| | | | | | | $ | 18,909,480 | |
| Forest & Paper Products - 0.1% | | | | | | | | |
| Georgia-Pacific LLC, 3.734%, 7/15/2023 (n) | | $ | 7,000,000 | | | $ | 7,286,559 | |
| | |
| Insurance - 0.3% | | | | | | | | |
| American International Group, Inc., 4.875%, 6/01/2022 | | $ | 10,460,000 | | | $ | 11,502,224 | |
| American International Group, Inc., 3.75%, 7/10/2025 | | | 8,000,000 | | | | 7,990,464 | |
| | | | | | | | |
| | | | | | | $ | 19,492,688 | |
16
Portfolio of Investments (unaudited) – continued
| | | | | | | | |
| Issuer | | Shares/Par | | | Value ($) | |
| Bonds - continued | | | | | | | | |
| Insurance - Health - 0.2% | | | | | | | | |
| Anthem, Inc., 3.3%, 1/15/2023 | | $ | 3,410,000 | | | $ | 3,447,507 | |
| UnitedHealth Group, Inc., 3.75%, 7/15/2025 | | | 9,796,000 | | | | 10,555,023 | |
| | | | | | | | |
| | | | | | | $ | 14,002,530 | |
| Insurance - Property & Casualty - 0.2% | | | | | | | | |
| Berkshire Hathaway, Inc., 3.125%, 3/15/2026 | | $ | 3,183,000 | | | $ | 3,263,676 | |
| Liberty Mutual Group, Inc., 4.25%, 6/15/2023 (n) | | | 3,278,000 | | | | 3,378,461 | |
| Marsh & McLennan Cos., Inc., 4.8%, 7/15/2021 | | | 5,360,000 | | | | 5,914,873 | |
| ZFS Finance USA Trust V, 6.5% to 5/09/2017, FRN to 5/09/2067 (n) | | | 2,925,000 | | | | 2,873,813 | |
| | | | | | | | |
| | | | | | | $ | 15,430,823 | |
| International Market Quasi-Sovereign - 0.3% | | | | | | | | |
| KFW International Finance, Inc., 4.875%, 6/17/2019 | | $ | 7,250,000 | | | $ | 8,073,520 | |
| Temasek Financial I Ltd., 2.375%, 1/23/2023 (n) | | | 10,140,000 | | | | 10,234,626 | |
| | | | | | | | |
| | | | | | | $ | 18,308,146 | |
| International Market Sovereign - 0.0% | | | | | | | | |
| Republic of Iceland, 4.875%, 6/16/2016 (n) | | $ | 1,807,000 | | | $ | 1,815,524 | |
| | |
| Internet - 0.1% | | | | | | | | |
| Baidu, Inc., 3.5%, 11/28/2022 | | $ | 6,460,000 | | | $ | 6,594,853 | |
| | |
| Local Authorities - 0.1% | | | | | | | | |
| New Jersey Turnpike Authority Rev. (Build America Bonds), “F”, 7.414%, 1/01/2040 | | $ | 5,815,000 | | | $ | 8,706,102 | |
| | |
| Machinery & Tools - 0.1% | | | | | | | | |
| Atlas Copco AB, 5.6%, 5/22/2017 (n) | | $ | 5,970,000 | | | $ | 6,197,093 | |
| | |
| Major Banks - 1.7% | | | | | | | | |
| Bank of America Corp., 5.49%, 3/15/2019 | | $ | 4,135,000 | | | $ | 4,506,497 | |
| Bank of America Corp., 7.625%, 6/01/2019 | | | 3,980,000 | | | | 4,631,828 | |
| Bank of America Corp., 4.1%, 7/24/2023 | | | 7,970,000 | | | | 8,383,978 | |
| Bank of America Corp., 4.125%, 1/22/2024 | | | 10,657,000 | | | | 11,288,811 | |
| BNP Paribas, 7.195% to 6/25/2037, FRN to 6/29/2049 (n) | | | 3,200,000 | | | | 3,456,000 | |
| Commonwealth Bank of Australia, 5%, 10/15/2019 (n) | | | 3,930,000 | | | | 4,315,278 | |
| Credit Suisse Group AG, 6.5%, 8/08/2023 (n) | | | 2,567,000 | | | | 2,759,525 | |
| Goldman Sachs Group, Inc., 5.625%, 1/15/2017 | | | 7,504,000 | | | | 7,741,592 | |
| ING Bank N.V., 3.75%, 3/07/2017 (n) | | | 4,761,000 | | | | 4,866,885 | |
| ING Bank N.V., 5.8%, 9/25/2023 (n) | | | 6,238,000 | | | | 6,797,474 | |
| JPMorgan Chase & Co., 6.3%, 4/23/2019 | | | 6,750,000 | | | | 7,633,906 | |
| JPMorgan Chase & Co., 3.2%, 1/25/2023 | | | 7,972,000 | | | | 8,177,757 | |
| Mitsubishi UFJ Financial Group, Inc., 3.85%, 3/01/2026 | | | 6,387,000 | | | | 6,643,502 | |
| Morgan Stanley, 3.875%, 4/29/2024 | | | 6,520,000 | | | | 6,838,782 | |
17
Portfolio of Investments (unaudited) – continued
| | | | | | | | |
| Issuer | | Shares/Par | | | Value ($) | |
| Bonds - continued | | | | | | | | |
| Major Banks - continued | | | | | | | | |
| Morgan Stanley, 6.625%, 4/01/2018 | | $ | 11,740,000 | | | $ | 12,826,361 | |
| Morgan Stanley, 4%, 7/23/2025 | | | 2,939,000 | | | | 3,073,121 | |
| PNC Funding Corp., 5.625%, 2/01/2017 | | | 6,510,000 | | | | 6,733,280 | |
| Wells Fargo & Co., 2.1%, 5/08/2017 | | | 6,600,000 | | | | 6,675,266 | |
| Wells Fargo & Co., 5.9% to 6/15/2024, FRN to 12/29/2049 | | | 3,543,000 | | | | 3,590,611 | |
| | | | | | | | |
| | | | $ | 120,940,454 | |
| Medical & Health Technology & Services - 0.4% | | | | | | | | |
| Becton, Dickinson and Co., 6.375%, 8/01/2019 | | $ | 6,240,000 | | | $ | 7,110,892 | |
| Becton, Dickinson and Co., 2.675%, 12/15/2019 | | | 4,190,000 | | | | 4,292,638 | |
| Express Scripts Holding Co., 2.65%, 2/15/2017 | | | 7,200,000 | | | | 7,294,032 | |
| Laboratory Corp. of America Holdings, 3.2%, 2/01/2022 | | | 5,980,000 | | | | 6,062,243 | |
| | | | | | | | |
| | | | $ | 24,759,805 | |
| Medical Equipment - 0.2% | | | | | | | | |
| Medtronic, Inc., 4.375%, 3/15/2035 | | $ | 7,267,000 | | | $ | 7,867,450 | |
| Zimmer Holdings, Inc., 3.55%, 4/01/2025 | | | 9,149,000 | | | | 9,244,113 | |
| | | | | | | | |
| | | | $ | 17,111,563 | |
| Metals & Mining - 0.1% | | | | | | | | |
| Freeport-McMoRan Copper & Gold, Inc., 3.875%, 3/15/2023 | | $ | 5,930,000 | | | $ | 4,017,575 | |
| | |
| Midstream - 0.5% | | | | | | | | |
| APT Pipelines Ltd., 4.2%, 3/23/2025 (n) | | $ | 9,121,000 | | | $ | 8,897,061 | |
| Energy Transfer Partners LP, 3.6%, 2/01/2023 | | | 3,288,000 | | | | 2,852,376 | |
| Energy Transfer Partners LP, 4.9%, 2/01/2024 | | | 2,630,000 | | | | 2,392,603 | |
| Enterprise Products Operating LP, 6.5%, 1/31/2019 | | | 5,184,000 | | | | 5,679,492 | |
| Kinder Morgan Energy Partners LP, 4.15%, 2/01/2024 | | | 5,700,000 | | | | 5,365,855 | |
| Kinder Morgan Energy Partners LP, 7.75%, 3/15/2032 | | | 2,520,000 | | | | 2,634,768 | |
| Kinder Morgan Energy Partners LP, 5.4%, 9/01/2044 | | | 1,888,000 | | | | 1,653,054 | |
| Spectra Energy Capital LLC, 8%, 10/01/2019 | | | 5,327,000 | | | | 5,856,669 | |
| | | | | | | | |
| | | | | | | $ | 35,331,878 | |
| Mortgage-Backed - 10.5% | | | | | | | | |
| Fannie Mae, 3.99%, 7/01/2021 | | $ | 645,907 | | | $ | 709,831 | |
| Fannie Mae, 2.62%, 5/01/2023 | | | 664,270 | | | | 689,960 | |
| Fannie Mae, 3%, 10/01/2030 | | | 10,835,279 | | | | 11,324,266 | |
| Fannie Mae, 4%, 9/01/2040 - 7/01/2043 | | | 19,038,958 | | | | 20,386,750 | |
| Fannie Mae, 3.5%, 7/01/2043 | | | 9,789,377 | | | | 10,282,967 | |
| Fannie Mae, 5.75%, 7/01/2016 | | | 1,207,080 | | | | 1,206,926 | |
| Fannie Mae, 5.05%, 1/01/2017 | | | 2,271,913 | | | | 2,299,490 | |
| Fannie Mae, 6%, 1/01/2017 - 7/01/2037 | | | 15,296,435 | | | | 17,496,072 | |
| Fannie Mae, 5.5%, 11/01/2017 - 4/01/2040 | | | 30,325,041 | | | | 34,122,598 | |
| Fannie Mae, 3.8%, 2/01/2018 | | | 747,262 | | | | 775,231 | |
18
Portfolio of Investments (unaudited) – continued
| | | | | | | | |
| Issuer | | Shares/Par | | | Value ($) | |
| Bonds - continued | | | | | | | | |
| Mortgage-Backed - continued | | | | | | | | |
| Fannie Mae, 3.91%, 2/01/2018 | | $ | 1,111,221 | | | $ | 1,153,857 | |
| Fannie Mae, 5%, 2/01/2018 - 3/01/2042 | | | 19,907,630 | | | | 22,013,112 | |
| Fannie Mae, 4.5%, 6/01/2018 - 4/01/2044 | | | 40,951,527 | | | | 44,639,877 | |
| Fannie Mae, 3.86%, 7/01/2018 | | | 1,022,332 | | | | 1,075,626 | |
| Fannie Mae, 2.578%, 9/25/2018 | | | 3,909,616 | | | | 3,996,664 | |
| Fannie Mae, 4.6%, 9/01/2019 | | | 734,885 | | | | 803,183 | |
| Fannie Mae, 4.449%, 1/01/2021 | | | 1,027,432 | | | | 1,131,810 | |
| Fannie Mae, 2.67%, 3/01/2022 | | | 928,704 | | | | 966,778 | |
| Fannie Mae, 2.73%, 4/01/2023 | | | 664,602 | | | | 694,731 | |
| Fannie Mae, 2.41%, 5/01/2023 | | | 1,007,892 | | | | 1,033,980 | |
| Fannie Mae, 2.55%, 5/01/2023 | | | 949,500 | | | | 982,180 | |
| Fannie Mae, 2.59%, 5/01/2023 | | | 994,328 | | | | 1,030,958 | |
| Fannie Mae, 3%, 3/01/2027 - 12/01/2030 | | | 14,557,713 | | | | 15,236,011 | |
| Fannie Mae, 2.5%, 2/01/2028 - 5/01/2030 | | | 5,182,354 | | | | 5,360,406 | |
| Fannie Mae, 6.5%, 6/01/2031 - 7/01/2037 | | | 5,946,288 | | | | 6,923,109 | |
| Fannie Mae, 4%, 12/01/2040 - 2/01/2045 | | | 68,590,745 | | | | 73,425,161 | |
| Fannie Mae, 3.5%, 11/01/2041 - 8/01/2043 | | | 16,002,876 | | | | 16,850,064 | |
| Fannie Mae, 3.5%, 4/01/2043 - 9/01/2043 | | | 34,542,463 | | | | 36,282,712 | |
| Freddie Mac, 4%, 4/01/2044 - 9/01/2044 | | | 21,528,287 | | | | 22,994,208 | |
| Freddie Mac, 6%, 4/01/2016 - 6/01/2037 | | | 8,885,381 | | | | 10,055,477 | |
| Freddie Mac, 5%, 12/01/2017 - 7/01/2039 | | | 10,505,044 | | | | 11,521,926 | |
| Freddie Mac, 3.154%, 2/25/2018 | | | 672,613 | | | | 692,566 | |
| Freddie Mac, 2.412%, 8/25/2018 | | | 1,961,798 | | | | 2,008,153 | |
| Freddie Mac, 4.5%, 1/01/2019 - 2/01/2041 | | | 8,332,777 | | | | 8,974,849 | |
| Freddie Mac, 5.5%, 1/01/2019 - 10/01/2035 | | | 8,242,921 | | | | 9,205,013 | |
| Freddie Mac, 5.085%, 3/25/2019 | | | 6,789,000 | | | | 7,434,035 | |
| Freddie Mac, 2.456%, 8/25/2019 | | | 1,100,000 | | | | 1,137,013 | |
| Freddie Mac, 1.869%, 11/25/2019 | | | 2,200,000 | | | | 2,233,567 | |
| Freddie Mac, 2.313%, 3/25/2020 | | | 624,000 | | | | 642,902 | |
| Freddie Mac, 3.808%, 8/25/2020 | | | 5,900,000 | | | | 6,435,835 | |
| Freddie Mac, 3.034%, 10/25/2020 | | | 1,781,000 | | | | 1,886,490 | |
| Freddie Mac, 2.791%, 1/25/2022 | | | 3,221,000 | | | | 3,394,134 | |
| Freddie Mac, 2.716%, 6/25/2022 | | | 2,443,294 | | | | 2,566,412 | |
| Freddie Mac, 2.682%, 10/25/2022 | | | 1,960,000 | | | | 2,048,140 | |
| Freddie Mac, 2.51%, 11/25/2022 | | | 3,050,000 | | | | 3,153,510 | |
| Freddie Mac, 3.111%, 2/25/2023 | | | 4,920,000 | | | | 5,264,170 | |
| Freddie Mac, 3.32%, 2/25/2023 | | | 1,059,000 | | | | 1,147,229 | |
| Freddie Mac, 3.25%, 4/25/2023 | | | 5,681,000 | | | | 6,130,904 | |
| Freddie Mac, 3.458%, 8/25/2023 | | | 5,373,000 | | | | 5,870,370 | |
| Freddie Mac, 3.171%, 10/25/2024 | | | 3,005,000 | | | | 3,212,942 | |
| Freddie Mac, 2.67%, 12/25/2024 | | | 3,612,000 | | | | 3,719,540 | |
| Freddie Mac, 3%, 11/01/2030 - 7/01/2043 | | | 42,663,812 | | | | 44,115,864 | |
| Freddie Mac, 6.5%, 5/01/2034 - 7/01/2037 | | | 3,684,041 | | | | 4,260,707 | |
19
Portfolio of Investments (unaudited) – continued
| | | | | | | | |
| Issuer | | Shares/Par | | | Value ($) | |
| Bonds - continued | | | | | | | | |
| Mortgage-Backed - continued | | | | | | | | |
| Freddie Mac, 4%, 11/01/2040 - 11/01/2043 | | $ | 20,909,644 | | | $ | 22,361,836 | |
| Freddie Mac, 3.5%, 2/01/2042 - 12/01/2045 | | | 66,735,998 | | | | 70,027,670 | |
| Freddie Mac, TBA, 4%, 4/01/2046 | | | 46,983,000 | | | | 50,143,340 | |
| Ginnie Mae, 4%, 2/20/2042 | | | 3,176,870 | | | | 3,417,597 | |
| Ginnie Mae, 3%, 2/15/2043 - 6/20/2043 | | | 10,178,386 | | | | 10,568,873 | |
| Ginnie Mae, 6%, 9/15/2032 - 1/15/2038 | | | 5,255,111 | | | | 6,103,282 | |
| Ginnie Mae, 5.5%, 12/15/2032 - 4/20/2035 | | | 4,871,898 | | | | 5,531,169 | |
| Ginnie Mae, 4.5%, 7/15/2033 - 6/20/2041 | | | 12,586,677 | | | | 13,775,739 | |
| Ginnie Mae, 5%, 7/20/2033 - 10/15/2034 | | | 1,593,222 | | | | 1,780,430 | |
| Ginnie Mae, 4%, 1/20/2041 - 4/20/2041 | | | 11,024,415 | | | | 11,881,217 | |
| Ginnie Mae, 3.5%, 12/15/2041 - 12/20/2045 | | | 33,294,826 | | | | 35,263,659 | |
| Ginnie Mae, 3%, 7/20/2043 | | | 4,124,627 | | | | 4,281,222 | |
| | | | | | | | |
| | | | | | | $ | 738,136,300 | |
| Network & Telecom - 0.4% | | | | | | | | |
| AT&T, Inc., 3%, 6/30/2022 | | $ | 6,074,000 | | | $ | 6,162,316 | |
| AT&T, Inc., 3.4%, 5/15/2025 | | | 6,074,000 | | | | 6,088,231 | |
| Verizon Communications, Inc., 6.4%, 9/15/2033 | | | 7,225,000 | | | | 8,886,743 | |
| Verizon Communications, Inc., 6.55%, 9/15/2043 | | | 5,466,000 | | | | 7,199,963 | |
| | | | | | | | |
| | | | | | | $ | 28,337,253 | |
| Oils - 0.1% | | | | | | | | |
| Marathon Petroleum Corp., 3.625%, 9/15/2024 | | $ | 7,085,000 | | | $ | 6,478,687 | |
| Valero Energy Corp., 4.9%, 3/15/2045 | | | 4,000,000 | | | | 3,571,536 | |
| | | | | | | | |
| | | | | | | $ | 10,050,223 | |
| Other Banks & Diversified Financials - 0.9% | | | | | | | | |
| American Express Co., 5.5%, 9/12/2016 | | $ | 6,317,000 | | | $ | 6,425,716 | |
| Banco de Credito del Peru, 5.375%, 9/16/2020 | | | 4,872,000 | | | | 5,310,480 | |
| Bank of Tokyo-Mitsubishi UFJ Ltd., 4.1%, 9/09/2023 (n) | | | 4,960,000 | | | | 5,364,409 | |
| BBVA Bancomer S.A. de C.V., 6.75%, 9/30/2022 (n) | | | 4,730,000 | | | | 5,249,827 | |
| Capital One Financial Corp., 6.15%, 9/01/2016 | | | 8,680,000 | | | | 8,856,195 | |
| Citigroup, Inc., 2.5%, 9/26/2018 | | | 10,880,000 | | | | 11,046,399 | |
| Discover Bank, 4.2%, 8/08/2023 | | | 4,000,000 | | | | 4,181,096 | |
| Groupe BPCE S.A., 12.5% to 9/30/2019, FRN to 8/29/2049 (n) | | | 5,168,000 | | | | 6,386,769 | |
| SunTrust Banks, Inc., 2.35%, 11/01/2018 | | | 2,541,000 | | | | 2,558,617 | |
| Swedbank AB, 2.125%, 9/29/2017 (n) | | | 1,317,000 | | | | 1,328,142 | |
| UBS Group Funding (Jersey) Ltd., 4.125%, 4/15/2026 (z) | | | 7,103,000 | | | | 7,097,502 | |
| | | | | | | | |
| | | | | | | $ | 63,805,152 | |
| Pharmaceuticals - 0.8% | | | | | | | | |
| AbbVie, Inc., 3.6%, 5/14/2025 | | $ | 4,236,000 | | | $ | 4,446,601 | |
| Actavis Funding SCS, 3%, 3/12/2020 | | | 1,375,000 | | | | 1,413,786 | |
| Actavis Funding SCS, 4.85%, 6/15/2044 | | | 3,997,000 | | | | 4,256,557 | |
20
Portfolio of Investments (unaudited) – continued
| | | | | | | | |
| Issuer | | Shares/Par | | | Value ($) | |
| Bonds - continued | | | | | | | | |
| Pharmaceuticals - continued | | | | | | | | |
| Bayer U.S. Finance LLC, 3%, 10/08/2021 (n) | | $ | 9,000,000 | | | $ | 9,414,450 | |
| Celgene Corp., 2.875%, 8/15/2020 | | | 3,798,000 | | | | 3,911,777 | |
| Forest Laboratories, Inc., 4.875%, 2/15/2021 (n) | | | 6,838,000 | | | | 7,539,428 | |
| Gilead Sciences, Inc., 3.7%, 4/01/2024 | | | 1,862,000 | | | | 1,997,807 | |
| Gilead Sciences, Inc., 3.5%, 2/01/2025 | | | 14,207,000 | | | | 14,984,194 | |
| Roche Holdings, Inc., 6%, 3/01/2019 (n) | | | 1,495,000 | | | | 1,698,102 | |
| Teva Pharmaceutical Finance IV LLC, 3.65%, 11/10/2021 | | | 3,299,000 | | | | 3,438,191 | |
| | | | | | | | |
| | | | | | | $ | 53,100,893 | |
| Real Estate - Apartment - 0.0% | | | | | | | | |
| ERP Operating LP, REIT, 4.625%, 12/15/2021 | | $ | 3,113,000 | | | $ | 3,463,844 | |
| | |
| Real Estate - Healthcare - 0.1% | | | | | | | | |
| HCP, Inc., REIT, 5.375%, 2/01/2021 | | $ | 4,146,000 | | | $ | 4,527,859 | |
| | |
| Real Estate - Retail - 0.1% | | | | | | | | |
| Simon Property Group, Inc., REIT, 4.375%, 3/01/2021 | | $ | 4,500,000 | | | $ | 4,954,140 | |
| | |
| Retailers - 0.4% | | | | | | | | |
| Dollar General Corp., 4.15%, 11/01/2025 | | $ | 5,000,000 | | | $ | 5,253,230 | |
| Gap, Inc., 5.95%, 4/12/2021 | | | 3,740,000 | | | | 4,052,069 | |
| Home Depot, Inc., 5.95%, 4/01/2041 | | | 1,578,000 | | | | 2,087,020 | |
| Wal-Mart Stores, Inc., 5.25%, 9/01/2035 | | | 12,347,000 | | | | 15,293,587 | |
| | | | | | | | |
| | | | | | | $ | 26,685,906 | |
| Supermarkets - 0.1% | | | | | | | | |
| The Kroger Co., 4%, 2/01/2024 | | $ | 8,000,000 | | | $ | 8,658,088 | |
| | |
| Supranational - 0.0% | | | | | | | | |
| Asian Development Bank, 1.125%, 3/15/2017 | | $ | 3,322,000 | | | $ | 3,332,096 | |
| | |
| Telecommunications - Wireless - 0.3% | | | | | | | | |
| American Tower Trust I, REIT, 3.07%, 3/15/2023 (n) | | $ | 5,960,000 | | | $ | 5,960,103 | |
| Crown Castle Towers LLC, 6.113%, 1/15/2020 (n) | | | 3,852,000 | | | | 4,250,051 | |
| Crown Castle Towers LLC, 4.883%, 8/15/2020 (n) | | | 2,040,000 | | | | 2,184,924 | |
| Rogers Communications, Inc., 6.8%, 8/15/2018 | | | 8,529,000 | | | | 9,496,223 | |
| SBA Tower Trust, 2.898%, 10/15/2044 (n) | | | 2,389,000 | | | | 2,400,304 | |
| | | | | | | | |
| | | | | | | $ | 24,291,605 | |
| Tobacco - 0.4% | | | | | | | | |
| Altria Group, Inc., 2.85%, 8/09/2022 | | $ | 3,375,000 | | | $ | 3,486,216 | |
| B.A.T. International Finance PLC, 3.25%, 6/07/2022 (n) | | | 2,950,000 | | | | 3,123,776 | |
| Imperial Tobacco Finance PLC, 2.95%, 7/21/2020 (z) | | | 6,137,000 | | | | 6,308,897 | |
21
Portfolio of Investments (unaudited) – continued
| | | | | | | | |
| Issuer | | Shares/Par | | | Value ($) | |
| Bonds - continued | | | | | | | | |
| Tobacco - continued | | | | | | | | |
| Reynolds American, Inc., 4.45%, 6/12/2025 | | $ | 13,773,000 | | | $ | 15,153,633 | |
| | | | | | | | |
| | | | $ | 28,072,522 | |
| Transportation - Services - 0.1% | | | | | | | | |
| ERAC USA Finance LLC, 7%, 10/15/2037 (n) | | $ | 6,381,000 | | | $ | 8,138,838 | |
| | |
| U.S. Government Agencies and Equivalents - 0.1% | | | | | | | | |
| Small Business Administration, 4.35%, 7/01/2023 | | $ | 294,965 | | | $ | 312,414 | |
| Small Business Administration, 4.77%, 4/01/2024 | | | 792,449 | | | | 848,636 | |
| Small Business Administration, 5.18%, 5/01/2024 | | | 1,515,006 | | | | 1,651,722 | |
| Small Business Administration, 5.52%, 6/01/2024 | | | 676,939 | | | | 743,623 | |
| Small Business Administration, 4.99%, 9/01/2024 | | | 1,182,800 | | | | 1,285,182 | |
| Small Business Administration, 4.95%, 3/01/2025 | | | 993,402 | | | | 1,077,721 | |
| | | | | | | | |
| | | | | | | $ | 5,919,298 | |
| U.S. Treasury Obligations - 12.2% | | | | | | | | |
| U.S. Treasury Bonds, 8.5%, 2/15/2020 | | $ | 2,148,000 | | | $ | 2,756,488 | |
| U.S. Treasury Bonds, 6%, 2/15/2026 | | | 1,524,000 | | | | 2,108,360 | |
| U.S. Treasury Bonds, 6.75%, 8/15/2026 | | | 926,000 | | | | 1,359,700 | |
| U.S. Treasury Bonds, 5.25%, 2/15/2029 | | | 5,294,000 | | | | 7,268,498 | |
| U.S. Treasury Bonds, 5.375%, 2/15/2031 | | | 4,690,000 | | | | 6,724,836 | |
| U.S. Treasury Bonds, 4.5%, 2/15/2036 | | | 26,962,000 | | | | 36,993,751 | |
| U.S. Treasury Bonds, 5%, 5/15/2037 | | | 2,452,000 | | | | 3,587,296 | |
| U.S. Treasury Bonds, 4.5%, 8/15/2039 | | | 4,987,000 | | | | 6,828,879 | |
| U.S. Treasury Bonds, 2.875%, 5/15/2043 | | | 155,466,500 | | | | 163,816,761 | |
| U.S. Treasury Notes, 0.875%, 12/31/2016 | | | 176,031,000 | | | | 176,409,115 | |
| U.S. Treasury Notes, 0.75%, 6/30/2017 | | | 19,439,000 | | | | 19,457,234 | |
| U.S. Treasury Notes, 4.75%, 8/15/2017 | | | 2,870,000 | | | | 3,027,626 | |
| U.S. Treasury Notes, 3.75%, 11/15/2018 | | | 4,535,000 | | | | 4,882,744 | |
| U.S. Treasury Notes, 3.125%, 5/15/2019 | | | 52,370,000 | | | | 55,976,565 | |
| U.S. Treasury Notes, 1%, 6/30/2019 | | | 138,622,000 | | | | 138,995,586 | |
| U.S. Treasury Notes, 3.5%, 5/15/2020 | | | 55,133,000 | | | | 60,394,342 | |
| U.S. Treasury Notes, 3.125%, 5/15/2021 | | | 99,605,000 | | | | 108,767,863 | |
| U.S. Treasury Notes, 2.5%, 8/15/2023 | | | 51,706,000 | | | | 55,101,223 | |
| | | | | | | | |
| | | | | | | $ | 854,456,867 | |
| Utilities - Electric Power - 0.7% | | | | | | | | |
| Berkshire Hathaway Energy Co., 3.75%, 11/15/2023 | | $ | 3,550,000 | | | $ | 3,788,251 | |
| Dominion Resources, Inc., 3.625%, 12/01/2024 | | | 6,000,000 | | | | 6,087,702 | |
| MidAmerican Funding LLC, 6.927%, 3/01/2029 | | | 2,785,000 | | | | 3,700,989 | |
| Oncor Electric Delivery Co., 7%, 9/01/2022 | | | 4,555,000 | | | | 5,639,058 | |
| Pacific Gas & Electric Co., 4.6%, 6/15/2043 | | | 4,920,000 | | | | 5,354,406 | |
| PPL Capital Funding, Inc., 5%, 3/15/2044 | | | 1,773,000 | | | | 1,900,440 | |
| PPL Corp., 3.4%, 6/01/2023 | | | 4,920,000 | | | | 5,019,163 | |
| Progress Energy, Inc., 3.15%, 4/01/2022 | | | 6,169,000 | | | | 6,251,936 | |
22
Portfolio of Investments (unaudited) – continued
| | | | | | | | |
| Issuer | | Shares/Par | | | Value ($) | |
| Bonds - continued | | | | | | | | |
| Utilities - Electric Power - continued | | | | | | | | |
| Southern Co., 2.15%, 9/01/2019 | | $ | 7,000,000 | | | $ | 7,032,354 | |
| Waterford 3 Funding Corp., 8.09%, 1/02/2017 | | | 2,403,358 | | | | 2,400,860 | |
| | | | | | | | |
| | | | | | | $ | 47,175,159 | |
| Total Bonds (Identified Cost, $2,515,670,313) | | | $ | 2,613,791,061 | |
| | |
| Preferred Stocks - 0.1% | | | | | | | | |
| Telephone Services - 0.1% | | | | | | | | |
| Telecom Italia S.p.A. (Identified Cost, $4,341,722) | | | 6,259,102 | | | $ | 5,484,119 | |
| | |
| Convertible Preferred Stocks - 0.8% | | | | | | | | |
| Food & Beverages - 0.4% | | | | | | | | |
| Tyson Foods, Inc., 4.75% | | | 414,550 | | | $ | 30,875,684 | |
| | |
| Pharmaceuticals - 0.1% | | | | | | | | |
| Allergan PLC, 5.5% | | | 8,365 | | | $ | 7,688,606 | |
| | |
| Telephone Services - 0.1% | | | | | | | | |
| Frontier Communications Corp., 11.125% | | | 41,668 | | | $ | 4,350,139 | |
| | |
| Utilities - Electric Power - 0.2% | | | | | | | | |
| Exelon Corp., 6.5% | | | 298,266 | | | $ | 14,683,635 | |
Total Convertible Preferred Stocks
(Identified Cost, $48,749,554) | | | $ | 57,598,064 | |
| | |
| Money Market Funds - 2.6% | | | | | | | | |
MFS Institutional Money Market Portfolio, 0.36%,
at Cost and Net Asset Value (v) | | | 186,373,455 | | | $ | 186,373,455 | |
| | | | | | | | | | | | | | |
| | | | |
| | | Strike Price | | | First Exercise | | | | | | |
| Warrants - 0.0% | | | | | | | | | | | | | | |
| Medical & Health Technology & Services - 0.0% | | | | | |
HealthSouth Corp. (1 share for
1 warrant) (a) (Identified Cost, $0) | | $ | 41.40 | | | 1/04/16 | | | 11,915 | | | $ | 24,426 | |
| | | | | | | | |
| | |
| Collateral for Securities Loaned - 0.1% | | | | | | | | |
JPMorgan Prime Money Market Fund, 0.44%,
at Cost and Net Asset Value (j) | | | 4,357,581 | | | $ | 4,357,581 | |
| Total Investments (Identified Cost, $5,883,585,456) | | | | | | $ | 7,024,008,639 | |
| |
| Other Assets, Less Liabilities - 0.1% | | | | 5,332,482 | |
| Net Assets - 100.0% | | | | | | $ | 7,029,341,121 | |
23
Portfolio of Investments (unaudited) – continued
| (a) | Non-income producing security. |
| (i) | Interest only security for which the fund receives interest on notional principal (Par amount). Par amount shown is the notional principal and does not reflect the cost of the security. |
| (j) | The rate quoted is the annualized seven-day yield of the fund at period end. |
| (l) | A portion of this security is on loan. |
| (n) | Securities exempt from registration under Rule 144A of the Securities Act of 1933. These securities may be sold in the ordinary course of business in transactions exempt from registration, normally to qualified institutional buyers. At period end, the aggregate value of these securities was $192,117,072, representing 2.7% of net assets. |
| (v) | Underlying affiliated fund that is available only to investment companies managed by MFS. The rate quoted for the MFS Institutional Money Market Portfolio is the annualized seven-day yield of the fund at period end. |
| (z) | Restricted securities are not registered under the Securities Act of 1933 and are subject to legal restrictions on resale. These securities generally may be resold in transactions exempt from registration or to the public if the securities are subsequently registered. Disposal of these securities may involve time-consuming negotiations and prompt sale at an acceptable price may be difficult. The fund holds the following restricted securities: |
| | | | | | | | | | |
| Restricted Securities | | Acquisition
Date | | Cost | | | Value | |
| Atrium CDO Corp., FRN, 1.718%, 11/16/2022 | | 2/03/16-2/04/16 | | | $3,206,544 | | | | $3,196,118 | |
| Bayview Financial Revolving Mortgage Loan Trust, FRN, 2.035%, 12/28/2040 | | 3/01/06 | | | 5,264,459 | | | | 3,804,930 | |
BlackRock Capital Finance LP,
7.75%, 9/25/2026 | | 10/10/96 | | | 298,170 | | | | 65,691 | |
Imperial Tobacco Finance PLC,
2.95%, 7/21/2020 | | 7/15/15 | | | 6,079,159 | | | | 6,308,897 | |
State Grid Overseas Investment (2014) Ltd.,
2.75%, 5/07/2019 | | 4/28/14 | | | 5,297,672 | | | | 5,468,220 | |
UBS Group Funding (Jersey) Ltd.,
4.125%, 4/15/2026 | | 3/29/16 | | | 7,087,302 | | | | 7,097,502 | |
| Total Restricted Securities | | | | $25,941,358 | |
| % of Net assets | | | | 0.4% | |
The following abbreviations are used in this report and are defined:
| ADR | | American Depositary Receipt |
| CDO | | Collateralized Debt Obligation |
| CLO | | Collateralized Loan Obligation |
| FRN | | Floating Rate Note. Interest rate resets periodically and the current rate may not be the rate reported at period end. |
| PLC | | Public Limited Company |
| REIT | | Real Estate Investment Trust |
See Notes to Financial Statements
24
Financial Statements
STATEMENT OF ASSETS AND LIABILITIES
At 3/31/16 (unaudited)
This statement represents your fund’s balance sheet, which details the assets and liabilities comprising the total value of the fund.
| | | | |
| Assets | | | | |
Investments | | | | |
Non-affiliated issuers, at value (identified cost, $5,697,212,001) | | | $6,837,635,184 | |
Underlying affiliated funds, at cost and value | | | 186,373,455 | |
Total investments, at value, including $4,241,698 of securities on loan (identified cost, $5,883,585,456) | | | $7,024,008,639 | |
Cash | | | 506,170 | |
Receivables for | | | | |
Investments sold | | | 61,711,827 | |
TBA sale commitments | | | 4,730,822 | |
Fund shares sold | | | 11,494,352 | |
Interest and dividends | | | 24,758,120 | |
Other assets | | | 51,079 | |
Total assets | | | $7,127,261,009 | |
| Liabilities | | | | |
Payables for | | | | |
Distributions | | | $948,038 | |
Investments purchased | | | 27,332,324 | |
TBA purchase commitments | | | 54,660,420 | |
Fund shares reacquired | | | 7,865,607 | |
Collateral for securities loaned, at value | | | 4,357,581 | |
Payable to affiliates | | | | |
Investment adviser | | | 137,549 | |
Shareholder servicing costs | | | 2,269,742 | |
Distribution and service fees | | | 103,640 | |
Program manager fees | | | 83 | |
Payable for independent Trustees’ compensation | | | 95,668 | |
Accrued expenses and other liabilities | | | 149,236 | |
Total liabilities | | | $97,919,888 | |
Net assets | | | $7,029,341,121 | |
| Net assets consist of | | | | |
Paid-in capital | | | $5,917,075,887 | |
Unrealized appreciation (depreciation) on investments and translation of assets and liabilities in foreign currencies | | | 1,140,475,340 | |
Accumulated net realized gain (loss) on investments and foreign currency | | | (25,769,448 | ) |
Accumulated distributions in excess of net investment income | | | (2,440,658 | ) |
Net assets | | | $7,029,341,121 | |
Shares of beneficial interest outstanding | | | 401,119,204 | |
25
Statement of Assets and Liabilities (unaudited) – continued
| | | | | | | | | | | | |
| | | Net assets | | | Shares
outstanding | | | Net asset value
per share (a) | |
Class A | | | $4,633,600,570 | | | | 264,671,150 | | | | $17.51 | |
Class B | | | 206,301,413 | | | | 11,770,429 | | | | 17.53 | |
Class C | | | 1,026,016,625 | | | | 58,274,500 | | | | 17.61 | |
Class I | | | 231,933,499 | | | | 13,250,133 | | | | 17.50 | |
Class R1 | | | 14,556,708 | | | | 832,432 | | | | 17.49 | |
Class R2 | | | 181,311,712 | | | | 10,326,838 | | | | 17.56 | |
Class R3 | | | 309,281,635 | | | | 17,654,627 | | | | 17.52 | |
Class R4 | | | 265,417,343 | | | | 15,147,432 | | | | 17.52 | |
Class R5 | | | 130,677,112 | | | | 7,464,086 | | | | 17.51 | |
Class 529A | | | 19,684,172 | | | | 1,127,108 | | | | 17.46 | |
Class 529B | | | 1,619,940 | | | | 92,432 | | | | 17.53 | |
Class 529C | | | 8,940,392 | | | | 508,037 | | | | 17.60 | |
| (a) | Maximum offering price per share was equal to the net asset value per share for all share classes, except for Classes A and 529A, for which the maximum offering prices per share were $18.58 [100 / 94.25 x $17.51] and $18.53 [100 / 94.25 x $17.46], respectively. On sales of $50,000 or more, the maximum offering prices of Class A and Class 529A shares are reduced. A contingent deferred sales charge may be imposed on redemptions of Class A, Class B, Class C, Class 529B, and Class 529C shares. Redemption price per share was equal to the net asset value per share for Classes I, R1, R2, R3, R4, R5, and 529A. |
See Notes to Financial Statements
26
Financial Statements
STATEMENT OF OPERATIONS
Six months ended 3/31/16 (unaudited)
This statement describes how much your fund earned in investment income and accrued in expenses. It also describes any gains and/or losses generated by fund operations.
| | | | |
| Net investment income | |
Income | | | | |
Dividends | | | $53,166,746 | |
Interest | | | 40,968,862 | |
Dividends from underlying affiliated funds | | | 180,737 | |
Foreign taxes withheld | | | (376,759 | ) |
Total investment income | | | $93,939,586 | |
Expenses | | | | |
Management fee | | | $11,933,606 | |
Distribution and service fees | | | 12,601,695 | |
Shareholder servicing costs | | | 3,951,084 | |
Program manager fees | | | 14,510 | |
Administrative services fee | | | 319,118 | |
Independent Trustees’ compensation | | | 51,093 | |
Custodian fee | | | 142,619 | |
Shareholder communications | | | 136,554 | |
Audit and tax fees | | | 40,452 | |
Legal fees | | | 30,859 | |
Miscellaneous | | | 178,487 | |
Total expenses | | | $29,400,077 | |
Fees paid indirectly | | | (525 | ) |
Reduction of expenses by investment adviser and distributor | | | (126,541 | ) |
Net expenses | | | $29,273,011 | |
Net investment income | | | $64,666,575 | |
| Realized and unrealized gain (loss) on investments and foreign currency | |
Realized gain (loss) (identified cost basis) | | | | |
Investments | | | $47,912,460 | |
Foreign currency | | | (28,325 | ) |
Net realized gain (loss) on investments and foreign currency | | | $47,884,135 | |
Change in unrealized appreciation (depreciation) | | | | |
Investments | | | $236,100,620 | |
Translation of assets and liabilities in foreign currencies | | | 136,359 | |
Net unrealized gain (loss) on investments and foreign currency translation | | | $236,236,979 | |
Net realized and unrealized gain (loss) on investments and foreign currency | | | $284,121,114 | |
Change in net assets from operations | | | $348,787,689 | |
See Notes to Financial Statements
27
Financial Statements
STATEMENTS OF CHANGES IN NET ASSETS
These statements describe the increases and/or decreases in net assets resulting from operations, any distributions, and any shareholder transactions.
| | | | | | | | |
| Change in net assets | | Six months ended
3/31/16
(unaudited) | | | Year ended
9/30/15 | |
| From operations | | | | | | | | |
Net investment income | | | $64,666,575 | | | | $155,522,254 | |
Net realized gain (loss) on investments and foreign currency | | | 47,884,135 | | | | 224,577,571 | |
Net unrealized gain (loss) on investments and foreign currency translation | | | 236,236,979 | | | | (383,746,630 | ) |
Change in net assets from operations | | | $348,787,689 | | | | $(3,646,805 | ) |
| Distributions declared to shareholders | | | | | | | | |
From net investment income | | | $(98,108,332 | ) | | | $(135,077,976 | ) |
From net realized gain on investments | | | (198,221,380 | ) | | | (162,130,845 | ) |
Total distributions declared to shareholders | | | $(296,329,712 | ) | | | $(297,208,821 | ) |
Change in net assets from fund share transactions | | | $278,212,911 | | | | $221,960,513 | |
Total change in net assets | | | $330,670,888 | | | | $(78,895,113 | ) |
| Net assets | | | | | | | | |
At beginning of period | | | 6,698,670,233 | | | | 6,777,565,346 | |
At end of period (including accumulated distributions in excess of net investment income of $2,440,658 and undistributed net investment income of $31,001,099, respectively) | | | $7,029,341,121 | | | | $6,698,670,233 | |
See Notes to Financial Statements
28
Financial Statements
FINANCIAL HIGHLIGHTS
The financial highlights table is intended to help you understand the fund’s financial performance for the semiannual period and the past 5 fiscal years (or life of a particular share class, if shorter). Certain information reflects financial results for a single fund share. The total returns in the table represent the rate by which an investor would have earned (or lost) on an investment in the fund share class (assuming reinvestment of all distributions) held for the entire period.
| | | | | | | | | | | | | | | | | | | | | | | | |
| | | Six months
ended
3/31/16 (unaudited) | | | Years ended 9/30 | |
| Class A | | | 2015 | | | 2014 | | | 2013 | | | 2012 | | | 2011 | |
| | | | | | | | | | | | | | | | | |
Net asset value, beginning of
period | | | $17.38 | | | | $18.16 | | | | $16.77 | | | | $15.19 | | | | $13.18 | | | | $13.46 | |
| Income (loss) from investment operations | |
Net investment income (d) | | | $0.18 | | | | $0.43 | | | | $0.38 | | | | $0.34 | | | | $0.34 | | | | $0.32 | |
Net realized and unrealized
gain (loss) on investments
and foreign currency | | | 0.72 | | | | (0.40 | ) | | | 1.53 | | | | 1.60 | | | | 2.04 | | | | (0.28 | ) |
Total from investment operations | | | $0.90 | | | | $0.03 | | | | $1.91 | | | | $1.94 | | | | $2.38 | | | | $0.04 | |
| Less distributions declared to shareholders | |
From net investment income | | | $(0.26 | ) | | | $(0.38 | ) | | | $(0.38 | ) | | | $(0.36 | ) | | | $(0.37 | ) | | | $(0.32 | ) |
From net realized gain on
investments | | | (0.51 | ) | | | (0.43 | ) | | | (0.14 | ) | | | — | | | | — | | | | — | |
Total distributions declared to
shareholders | | | $(0.77 | ) | | | $(0.81 | ) | | | $(0.52 | ) | | | $(0.36 | ) | | | $(0.37 | ) | | | $(0.32 | ) |
Net asset value, end of period (x) | | | $17.51 | | | | $17.38 | | | | $18.16 | | | | $16.77 | | | | $15.19 | | | | $13.18 | |
Total return (%) (r)(s)(t)(x) | | | 5.31 | (n) | | | 0.01 | | | | 11.55 | | | | 12.93 | | | | 18.21 | | | | 0.14 | |
Ratios (%) (to average net assets)
and Supplemental data: | |
Expenses before expense
reductions (f) | | | 0.74 | (a) | | | 0.74 | | | | 0.73 | | | | 0.75 | | | | 0.77 | | | | 0.79 | |
Expenses after expense
reductions (f) | | | 0.74 | (a) | | | 0.74 | | | | 0.73 | | | | 0.75 | | | | 0.77 | | | | 0.79 | |
Net investment income | | | 2.01 | (a) | | | 2.35 | | | | 2.13 | | | | 2.11 | | | | 2.33 | | | | 2.28 | |
Portfolio turnover | | | 19 | (n) | | | 45 | | | | 35 | | | | 53 | | | | 23 | | | | 24 | |
Net assets at end of period
(000 omitted) | | | $4,633,601 | | | | $4,492,707 | | | | $4,621,662 | | | | $4,399,349 | | | | $4,152,753 | | | | $3,898,883 | |
See Notes to Financial Statements
29
Financial Highlights – continued
| | | | | | | | | | | | | | | | | | | | | | | | |
| | | Six months
ended
3/31/16 (unaudited) | | | Years ended 9/30 | |
| Class B | | | 2015 | | | 2014 | | | 2013 | | | 2012 | | | 2011 | |
| | | | | | | | | | | | | | | | | |
Net asset value, beginning of
period | | | $17.40 | | | | $18.18 | | | | $16.78 | | | | $15.20 | | | | $13.19 | | | | $13.47 | |
| Income (loss) from investment operations | |
Net investment income (d) | | | $0.11 | | | | $0.29 | | | | $0.24 | | | | $0.22 | | | | $0.23 | | | | $0.22 | |
Net realized and unrealized
gain (loss) on investments
and foreign currency | | | 0.72 | | | | (0.41 | ) | | | 1.55 | | | | 1.60 | | | | 2.04 | | | | (0.29 | ) |
Total from investment operations | | | $0.83 | | | | $(0.12 | ) | | | $1.79 | | | | $1.82 | | | | $2.27 | | | | $(0.07 | ) |
| Less distributions declared to shareholders | |
From net investment income | | | $(0.19 | ) | | | $(0.23 | ) | | | $(0.25 | ) | | | $(0.24 | ) | | | $(0.26 | ) | | | $(0.21 | ) |
From net realized gain on
investments | | | (0.51 | ) | | | (0.43 | ) | | | (0.14 | ) | | | — | | | | — | | | | — | |
Total distributions declared to
shareholders | | | $(0.70 | ) | | | $(0.66 | ) | | | $(0.39 | ) | | | $(0.24 | ) | | | $(0.26 | ) | | | $(0.21 | ) |
Net asset value, end of period (x) | | | $17.53 | | | | $17.40 | | | | $18.18 | | | | $16.78 | | | | $15.20 | | | | $13.19 | |
Total return (%) (r)(s)(t)(x) | | | 4.91 | (n) | | | (0.75 | ) | | | 10.75 | | | | 12.05 | | | | 17.30 | | | | (0.60 | ) |
Ratios (%) (to average net assets)
and Supplemental data: | |
Expenses before expense
reductions (f) | | | 1.49 | (a) | | | 1.49 | | | | 1.48 | | | | 1.50 | | | | 1.52 | | | | 1.52 | |
Expenses after expense
reductions (f) | | | 1.49 | (a) | | | 1.49 | | | | 1.48 | | | | 1.50 | | | | 1.52 | | | | 1.52 | |
Net investment income | | | 1.26 | (a) | | | 1.56 | | | | 1.38 | | | | 1.36 | | | | 1.59 | | | | 1.55 | |
Portfolio turnover | | | 19 | (n) | | | 45 | | | | 35 | | | | 53 | | | | 23 | | | | 24 | |
Net assets at end of period
(000 omitted) | | | $206,301 | | | | $208,889 | | | | $248,181 | | | | $272,887 | | | | $338,115 | | | | $394,233 | |
See Notes to Financial Statements
30
Financial Highlights – continued
| | | | | | | | | | | | | | | | | | | | | | | | |
| | | Six months
ended
3/31/16 (unaudited) | | | Years ended 9/30 | |
| Class C | | | 2015 | | | 2014 | | | 2013 | | | 2012 | | | 2011 | |
| | | | | | | | | | | | | | | | | |
Net asset value, beginning of
period | | | $17.48 | | | | $18.25 | | | | $16.86 | | | | $15.27 | | | | $13.25 | | | | $13.53 | |
| Income (loss) from investment operations | |
Net investment income (d) | | | $0.11 | | | | $0.29 | | | | $0.25 | | | | $0.22 | | | | $0.23 | | | | $0.22 | |
Net realized and unrealized
gain (loss) on investments
and foreign currency | | | 0.72 | | | | (0.39 | ) | | | 1.53 | | | | 1.61 | | | | 2.05 | | | | (0.29 | ) |
Total from investment operations | | | $0.83 | | | | $(0.10 | ) | | | $1.78 | | | | $1.83 | | | | $2.28 | | | | $(0.07 | ) |
| Less distributions declared to shareholders | |
From net investment income | | | $(0.19 | ) | | | $(0.24 | ) | | | $(0.25 | ) | | | $(0.24 | ) | | | $(0.26 | ) | | | $(0.21 | ) |
From net realized gain on
investments | | | (0.51 | ) | | | (0.43 | ) | | | (0.14 | ) | | | — | | | | — | | | | — | |
Total distributions declared to
shareholders | | | $(0.70 | ) | | | $(0.67 | ) | | | $(0.39 | ) | | | $(0.24 | ) | | | $(0.26 | ) | | | $(0.21 | ) |
Net asset value, end of period (x) | | | $17.61 | | | | $17.48 | | | | $18.25 | | | | $16.86 | | | | $15.27 | | | | $13.25 | |
Total return (%) (r)(s)(t)(x) | | | 4.89 | (n) | | | (0.68 | ) | | | 10.65 | | | | 12.08 | | | | 17.31 | | | | (0.59 | ) |
Ratios (%) (to average net assets)
and Supplemental data: | |
Expenses before expense
reductions (f) | | | 1.49 | (a) | | | 1.49 | | | | 1.48 | | | | 1.50 | | | | 1.52 | | | | 1.52 | |
Expenses after expense
reductions (f) | | | 1.49 | (a) | | | 1.49 | | | | 1.48 | | | | 1.50 | | | | 1.52 | | | | 1.52 | |
Net investment income | | | 1.26 | (a) | | | 1.60 | | | | 1.38 | | | | 1.35 | | | | 1.58 | | | | 1.56 | |
Portfolio turnover | | | 19 | (n) | | | 45 | | | | 35 | | | | 53 | | | | 23 | | | | 24 | |
Net assets at end of period
(000 omitted) | | | $1,026,017 | | | | $965,137 | | | | $930,405 | | | | $836,471 | | | | $769,540 | | | | $734,645 | |
See Notes to Financial Statements
31
Financial Highlights – continued
| | | | | | | | | | | | | | | | | | | | | | | | |
| | | Six months
ended
3/31/16 (unaudited) | | | Years ended 9/30 | |
| Class I | | | 2015 | | | 2014 | | | 2013 | | | 2012 | | | 2011 | |
| | | | | | | | | | | | | | | | | |
Net asset value, beginning of
period | | | $17.38 | | | | $18.15 | | | | $16.77 | | | | $15.19 | | | | $13.18 | | | | $13.46 | |
| Income (loss) from investment operations | |
Net investment income (d) | | | $0.20 | | | | $0.47 | | | | $0.42 | | | | $0.38 | | | | $0.37 | | | | $0.36 | |
Net realized and unrealized
gain (loss) on investments
and foreign currency | | | 0.71 | | | | (0.39 | ) | | | 1.53 | | | | 1.60 | | | | 2.05 | | | | (0.28 | ) |
Total from investment operations | | | $0.91 | | | | $0.08 | | | | $1.95 | | | | $1.98 | | | | $2.42 | | | | $0.08 | |
| Less distributions declared to shareholders | |
From net investment income | | | $(0.28 | ) | | | $(0.42 | ) | | | $(0.43 | ) | | | $(0.40 | ) | | | $(0.41 | ) | | | $(0.36 | ) |
From net realized gain on
investments | | | (0.51 | ) | | | (0.43 | ) | | | (0.14 | ) | | | — | | | | — | | | | — | |
Total distributions declared to
shareholders | | | $(0.79 | ) | | | $(0.85 | ) | | | $(0.57 | ) | | | $(0.40 | ) | | | $(0.41 | ) | | | $(0.36 | ) |
Net asset value, end of period (x) | | | $17.50 | | | | $17.38 | | | | $18.15 | | | | $16.77 | | | | $15.19 | | | | $13.18 | |
Total return (%) (r)(s)(x) | | | 5.38 | (n) | | | 0.31 | | | | 11.76 | | | | 13.21 | | | | 18.50 | | | | 0.42 | |
Ratios (%) (to average net assets)
and Supplemental data: | |
Expenses before expense
reductions (f) | | | 0.49 | (a) | | | 0.49 | | | | 0.48 | | | | 0.50 | | | | 0.52 | | | | 0.52 | |
Expenses after expense
reductions (f) | | | 0.49 | (a) | | | 0.49 | | | | 0.48 | | | | 0.50 | | | | 0.52 | | | | 0.52 | |
Net investment income | | | 2.26 | (a) | | | 2.56 | | | | 2.37 | | | | 2.35 | | | | 2.59 | | | | 2.57 | |
Portfolio turnover | | | 19 | (n) | | | 45 | | | | 35 | | | | 53 | | | | 23 | | | | 24 | |
Net assets at end of period
(000 omitted) | | | $231,933 | | | | $213,734 | | | | $226,527 | | | | $160,246 | | | | $121,687 | | | | $109,575 | |
See Notes to Financial Statements
32
Financial Highlights – continued
| | | | | | | | | | | | | | | | | | | | | | | | |
| | | Six months
ended
3/31/16 (unaudited) | | | Years ended 9/30 | |
| Class R1 | | | 2015 | | | 2014 | | | 2013 | | | 2012 | | | 2011 | |
| | | | | | | | | | | | | | | | | |
Net asset value, beginning of
period | | | $17.36 | | | | $18.14 | | | | $16.75 | | | | $15.18 | | | | $13.17 | | | | $13.45 | |
| Income (loss) from investment operations | |
Net investment income (d) | | | $0.11 | | | | $0.28 | | | | $0.25 | | | | $0.22 | | | | $0.23 | | | | $0.22 | |
Net realized and unrealized
gain (loss) on investments
and foreign currency | | | 0.72 | | | | (0.39 | ) | | | 1.53 | | | | 1.59 | | | | 2.04 | | | | (0.29 | ) |
Total from investment operations | | | $0.83 | | | | $(0.11 | ) | | | $1.78 | | | | $1.81 | | | | $2.27 | | | | $(0.07 | ) |
| Less distributions declared to shareholders | |
From net investment income | | | $(0.19 | ) | | | $(0.24 | ) | | | $(0.25 | ) | | | $(0.24 | ) | | | $(0.26 | ) | | | $(0.21 | ) |
From net realized gain on
investments | | | (0.51 | ) | | | (0.43 | ) | | | (0.14 | ) | | | — | | | | — | | | | — | |
Total distributions declared to
shareholders | | | $(0.70 | ) | | | $(0.67 | ) | | | $(0.39 | ) | | | $(0.24 | ) | | | $(0.26 | ) | | | $(0.21 | ) |
Net asset value, end of period (x) | | | $17.49 | | | | $17.36 | | | | $18.14 | | | | $16.75 | | | | $15.18 | | | | $13.17 | |
Total return (%) (r)(s)(x) | | | 4.92 | (n) | | | (0.75 | ) | | | 10.72 | | | | 12.02 | | | | 17.36 | | | | (0.58 | ) |
Ratios (%) (to average net assets)
and Supplemental data: | |
Expenses before expense
reductions (f) | | | 1.49 | (a) | | | 1.49 | | | | 1.48 | | | | 1.50 | | | | 1.52 | | | | 1.52 | |
Expenses after expense
reductions (f) | | | 1.49 | (a) | | | 1.49 | | | | 1.48 | | | | 1.50 | | | | 1.52 | | | | 1.52 | |
Net investment income | | | 1.26 | (a) | | | 1.56 | | | | 1.38 | | | | 1.36 | | | | 1.58 | | | | 1.56 | |
Portfolio turnover | | | 19 | (n) | | | 45 | | | | 35 | | | | 53 | | | | 23 | | | | 24 | |
Net assets at end of period
(000 omitted) | | | $14,557 | | | | $13,964 | | | | $16,905 | | | | $16,134 | | | | $17,900 | | | | $15,441 | |
See Notes to Financial Statements
33
Financial Highlights – continued
| | | | | | | | | | | | | | | | | | | | | | | | |
| | | Six months
ended
3/31/16 (unaudited) | | | Years ended 9/30 | |
| Class R2 | | | 2015 | | | 2014 | | | 2013 | | | 2012 | | | 2011 | |
| | | | | | | | | | | | | | | | | |
Net asset value, beginning of
period | | | $17.43 | | | | $18.21 | | | | $16.81 | | | | $15.23 | | | | $13.22 | | | | $13.50 | |
| Income (loss) from investment operations | |
Net investment income (d) | | | $0.15 | | | | $0.39 | | | | $0.33 | | | | $0.30 | | | | $0.30 | | | | $0.29 | |
Net realized and unrealized
gain (loss) on investments
and foreign currency | | | 0.73 | | | | (0.41 | ) | | | 1.55 | | | | 1.60 | | | | 2.04 | | | | (0.28 | ) |
Total from investment operations | | | $0.88 | | | | $(0.02 | ) | | | $1.88 | | | | $1.90 | | | | $2.34 | | | | $0.01 | |
| Less distributions declared to shareholders | |
From net investment income | | | $(0.24 | ) | | | $(0.33 | ) | | | $(0.34 | ) | | | $(0.32 | ) | | | $(0.33 | ) | | | $(0.29 | ) |
From net realized gain on
investments | | | (0.51 | ) | | | (0.43 | ) | | | (0.14 | ) | | | — | | | | — | | | | — | |
Total distributions declared to
shareholders | | | $(0.75 | ) | | | $(0.76 | ) | | | $(0.48 | ) | | | $(0.32 | ) | | | $(0.33 | ) | | | $(0.29 | ) |
Net asset value, end of period (x) | | | $17.56 | | | | $17.43 | | | | $18.21 | | | | $16.81 | | | | $15.23 | | | | $13.22 | |
Total return (%) (r)(s)(x) | | | 5.16 | (n) | | | (0.24 | ) | | | 11.29 | | | | 12.61 | | | | 17.86 | | | | (0.08 | ) |
Ratios (%) (to average net assets)
and Supplemental data: | |
Expenses before expense
reductions (f) | | | 0.99 | (a) | | | 0.99 | | | | 0.98 | | | | 1.00 | | | | 1.02 | | | | 1.02 | |
Expenses after expense
reductions (f) | | | 0.99 | (a) | | | 0.99 | | | | 0.98 | | | | 1.00 | | | | 1.02 | | | | 1.02 | |
Net investment income | | | 1.76 | (a) | | | 2.11 | | | | 1.87 | | | | 1.85 | | | | 2.08 | | | | 2.06 | |
Portfolio turnover | | | 19 | (n) | | | 45 | | | | 35 | | | | 53 | | | | 23 | | | | 24 | |
Net assets at end of period
(000 omitted) | | | $181,312 | | | | $168,609 | | | | $166,275 | | | | $162,091 | | | | $154,925 | | | | $151,437 | |
See Notes to Financial Statements
34
Financial Highlights – continued
| | | | | | | | | | | | | | | | | | | | | | | | |
| | | Six months
ended
3/31/16 (unaudited) | | | Years ended 9/30 | |
| Class R3 | | | 2015 | | | 2014 | | | 2013 | | | 2012 | | | 2011 | |
| | | | | | | | | | | | | | | | | |
Net asset value, beginning of
period | | | $17.39 | | | | $18.17 | | | | $16.78 | | | | $15.20 | | | | $13.19 | | | | $13.47 | |
| Income (loss) from investment operations | |
Net investment income (d) | | | $0.18 | | | | $0.43 | | | | $0.38 | | | | $0.34 | | | | $0.34 | | | | $0.33 | |
Net realized and unrealized
gain (loss) on investments
and foreign currency | | | 0.72 | | | | (0.41 | ) | | | 1.53 | | | | 1.60 | | | | 2.04 | | | | (0.29 | ) |
Total from investment operations | | | $0.90 | | | | $0.02 | | | | $1.91 | | | | $1.94 | | | | $2.38 | | | | $0.04 | |
| Less distributions declared to shareholders | |
From net investment income | | | $(0.26 | ) | | | $(0.37 | ) | | | $(0.38 | ) | | | $(0.36 | ) | | | $(0.37 | ) | | | $(0.32 | ) |
From net realized gain on
investments | | | (0.51 | ) | | | (0.43 | ) | | | (0.14 | ) | | | — | | | | — | | | | — | |
Total distributions declared to
shareholders | | | $(0.77 | ) | | | $(0.80 | ) | | | $(0.52 | ) | | | $(0.36 | ) | | | $(0.37 | ) | | | $(0.32 | ) |
Net asset value, end of period (x) | | | $17.52 | | | | $17.39 | | | | $18.17 | | | | $16.78 | | | | $15.20 | | | | $13.19 | |
Total return (%) (r)(s)(x) | | | 5.30 | (n) | | | 0.00 | | | | 11.54 | | | | 12.92 | | | | 18.20 | | | | 0.17 | |
Ratios (%) (to average net assets)
and Supplemental data: | |
Expenses before expense
reductions (f) | | | 0.74 | (a) | | | 0.74 | | | | 0.73 | | | | 0.75 | | | | 0.77 | | | | 0.77 | |
Expenses after expense
reductions (f) | | | 0.74 | (a) | | | 0.74 | | | | 0.73 | | | | 0.75 | | | | 0.77 | | | | 0.77 | |
Net investment income | | | 2.02 | (a) | | | 2.35 | | | | 2.13 | | | | 2.11 | | | | 2.32 | | | | 2.31 | |
Portfolio turnover | | | 19 | (n) | | | 45 | | | | 35 | | | | 53 | | | | 23 | | | | 24 | |
Net assets at end of period
(000 omitted) | | | $309,282 | | | | $251,635 | | | | $256,487 | | | | $178,646 | | | | $192,389 | | | | $153,259 | |
See Notes to Financial Statements
35
Financial Highlights – continued
| | | | | | | | | | | | | | | | | | | | | | | | |
| | | Six months
ended
3/31/16 (unaudited) | | | Years ended 9/30 | |
| Class R4 | | | 2015 | | | 2014 | | | 2013 | | | 2012 | | | 2011 | |
| | | | | | | | | | | | | | | | | |
Net asset value, beginning of
period | | | $17.40 | | | | $18.17 | | | | $16.78 | | | | $15.21 | | | | $13.19 | | | | $13.47 | |
| Income (loss) from investment operations | |
Net investment income (d) | | | $0.20 | | | | $0.48 | | | | $0.42 | | | | $0.38 | | | | $0.38 | | | | $0.36 | |
Net realized and unrealized
gain (loss) on investments
and foreign currency | | | 0.71 | | | | (0.40 | ) | | | 1.54 | | | | 1.59 | | | | 2.04 | | | | (0.28 | ) |
Total from investment operations | | | $0.91 | | | | $0.08 | | | | $1.96 | | | | $1.97 | | | | $2.42 | | | | $0.08 | |
| Less distributions declared to shareholders | |
From net investment income | | | $(0.28 | ) | | | $(0.42 | ) | | | $(0.43 | ) | | | $(0.40 | ) | | | $(0.40 | ) | | | $(0.36 | ) |
From net realized gain on
investments | | | (0.51 | ) | | | (0.43 | ) | | | (0.14 | ) | | | — | | | | — | | | | — | |
Total distributions declared to
shareholders | | | $(0.79 | ) | | | $(0.85 | ) | | | $(0.57 | ) | | | $(0.40 | ) | | | $(0.40 | ) | | | $(0.36 | ) |
Net asset value, end of period (x) | | | $17.52 | | | | $17.40 | | | | $18.17 | | | | $16.78 | | | | $15.21 | | | | $13.19 | |
Total return (%) (r)(s)(x) | | | 5.37 | (n) | | | 0.31 | | | | 11.82 | | | | 13.13 | | | | 18.49 | | | | 0.42 | |
Ratios (%) (to average net assets)
and Supplemental data: | |
Expenses before expense
reductions (f) | | | 0.49 | (a) | | | 0.49 | | | | 0.48 | | | | 0.50 | | | | 0.52 | | | | 0.52 | |
Expenses after expense
reductions (f) | | | 0.49 | (a) | | | 0.49 | | | | 0.48 | | | | 0.50 | | | | 0.52 | | | | 0.52 | |
Net investment income | | | 2.25 | (a) | | | 2.62 | | | | 2.38 | | | | 2.34 | | | | 2.64 | | | | 2.56 | |
Portfolio turnover | | | 19 | (n) | | | 45 | | | | 35 | | | | 53 | | | | 23 | | | | 24 | |
Net assets at end of period
(000 omitted) | | | $265,417 | | | | $287,976 | | | | $249,619 | | | | $182,332 | | | | $125,421 | | | | $268,667 | |
See Notes to Financial Statements
36
Financial Highlights – continued
| | | | | | | | | | | | | | | | | | | | |
| | | Six months
ended
3/31/16 (unaudited) | | | Years ended 9/30 | |
| Class R5 | | | 2015 | | | 2014 | | | 2013 | | | 2012 (i) | |
| | | | | | | | | | | | | | |
Net asset value, beginning of period | | | $17.38 | | | | $18.16 | | | | $16.77 | | | | $15.19 | | | | $14.30 | |
| Income (loss) from investment operations | |
Net investment income (d) | | | $0.20 | | | | $0.55 | | | | $0.44 | | | | $0.40 | | | | $0.11 | |
Net realized and unrealized gain (loss) on investments and foreign currency | | | 0.73 | | | | (0.47 | ) | | | 1.53 | | | | 1.59 | | | | 0.91 | (g) |
Total from investment operations | | | $0.93 | | | | $0.08 | | | | $1.97 | | | | $1.99 | | | | $1.02 | |
| Less distributions declared to shareholders | |
From net investment income | | | $(0.29 | ) | | | $(0.43 | ) | | | $(0.44 | ) | | | $(0.41 | ) | | | $(0.13 | ) |
From net realized gain on investments | | | (0.51 | ) | | | (0.43 | ) | | | (0.14 | ) | | | — | | | | — | |
Total distributions declared to shareholders | | | $(0.80 | ) | | | $(0.86 | ) | | | $(0.58 | ) | | | $(0.41 | ) | | | $(0.13 | ) |
Net asset value, end of period (x) | | | $17.51 | | | | $17.38 | | | | $18.16 | | | | $16.77 | | | | $15.19 | |
Total return (%) (r)(s)(x) | | | 5.49 | (n) | | | 0.34 | | | | 11.91 | | | | 13.30 | | | | 7.17 | (n) |
Ratios (%) (to average net assets)
and Supplemental data: | |
Expenses before expense reductions (f) | | | 0.41 | (a) | | | 0.41 | | | | 0.41 | | | | 0.41 | | | | 0.44 | (a) |
Expenses after expense reductions (f) | | | 0.41 | (a) | | | 0.41 | | | | 0.41 | | | | 0.41 | | | | 0.44 | (a) |
Net investment income | | | 2.36 | (a) | | | 3.02 | | | | 2.46 | | | | 2.42 | | | | 2.29 | (a)(l) |
Portfolio turnover | | | 19 | (n) | | | 45 | | | | 35 | | | | 53 | | | | 23 | |
Net assets at end of period (000 omitted) | | | $130,677 | | | | $67,900 | | | | $33,689 | | | | $10,800 | | | | $107 | |
See Notes to Financial Statements
37
Financial Highlights – continued
| | | | | | | | | | | | | | | | | | | | | | | | |
| | | Six months
ended
3/31/16 (unaudited) | | | Years ended 9/30 | |
| Class 529A | | | 2015 | | | 2014 | | | 2013 | | | 2012 | | | 2011 | |
| | | | | | | | | | | | | | | | | |
Net asset value, beginning of
period | | | $17.34 | | | | $18.12 | | | | $16.73 | | | | $15.16 | | | | $13.16 | | | | $13.44 | |
| Income (loss) from investment operations | |
Net investment income (d) | | | $0.17 | | | | $0.42 | | | | $0.37 | | | | $0.33 | | | | $0.33 | | | | $0.31 | |
Net realized and unrealized
gain (loss) on investments
and foreign currency | | | 0.72 | | | | (0.40 | ) | | | 1.54 | | | | 1.59 | | | | 2.03 | | | | (0.28 | ) |
Total from investment operations | | | $0.89 | | | | $0.02 | | | | $1.91 | | | | $1.92 | | | | $2.36 | | | | $0.03 | |
| Less distributions declared to shareholders | |
From net investment income | | | $(0.26 | ) | | | $(0.37 | ) | | | $(0.38 | ) | | | $(0.35 | ) | | | $(0.36 | ) | | | $(0.31 | ) |
From net realized gain on
investments | | | (0.51 | ) | | | (0.43 | ) | | | (0.14 | ) | | | — | | | | — | | | | — | |
Total distributions declared to
shareholders | | | $(0.77 | ) | | | $(0.80 | ) | | | $(0.52 | ) | | | $(0.35 | ) | | | $(0.36 | ) | | | $(0.31 | ) |
Net asset value, end of period (x) | | | $17.46 | | | | $17.34 | | | | $18.12 | | | | $16.73 | | | | $15.16 | | | | $13.16 | |
Total return (%) (r)(s)(t)(x) | | | 5.24 | (n) | | | (0.03 | ) | | | 11.53 | | | | 12.84 | | | | 18.11 | | | | 0.06 | |
Ratios (%) (to average net assets)
and Supplemental data: | |
Expenses before expense
reductions (f) | | | 0.84 | (a) | | | 0.84 | | | | 0.83 | | | | 0.85 | | | | 0.87 | | | | 0.89 | |
Expenses after expense
reductions (f) | | | 0.78 | (a) | | | 0.78 | | | | 0.77 | | | | 0.80 | | | | 0.82 | | | | 0.88 | |
Net investment income | | | 1.97 | (a) | | | 2.31 | | | | 2.09 | | | | 2.05 | | | | 2.27 | | | | 2.20 | |
Portfolio turnover | | | 19 | (n) | | | 45 | | | | 35 | | | | 53 | | | | 23 | | | | 24 | |
Net assets at end of period
(000 omitted) | | | $19,684 | | | | $18,177 | | | | $17,789 | | | | $15,581 | | | | $13,064 | | | | $9,758 | |
See Notes to Financial Statements
38
Financial Highlights – continued
| | | | | | | | | | | | | | | | | | | | | | | | |
| | | Six months
ended
3/31/16 (unaudited) | | | Years ended 9/30 | |
| Class 529B | | | 2015 | | | 2014 | | | 2013 | | | 2012 | | | 2011 | |
| | | | | | | | | | | | | | | | | |
Net asset value, beginning of
period | | | $17.40 | | | | $18.17 | | | | $16.78 | | | | $15.20 | | | | $13.19 | | | | $13.46 | |
| Income (loss) from investment operations | |
Net investment income (d) | | | $0.11 | | | | $0.27 | | | | $0.24 | | | | $0.21 | | | | $0.22 | | | | $0.21 | |
Net realized and unrealized
gain (loss) on investments
and foreign currency | | | 0.72 | | | | (0.38 | ) | | | 1.53 | | | | 1.60 | | | | 2.04 | | | | (0.28 | ) |
Total from investment operations | | | $0.83 | | | | $(0.11 | ) | | | $1.77 | | | | $1.81 | | | | $2.26 | | | | $(0.07 | ) |
| Less distributions declared to shareholders | |
From net investment income | | | $(0.19 | ) | | | $(0.23 | ) | | | $(0.24 | ) | | | $(0.23 | ) | | | $(0.25 | ) | | | $(0.20 | ) |
From net realized gain on
investments | | | (0.51 | ) | | | (0.43 | ) | | | (0.14 | ) | | | — | | | | — | | | | — | |
Total distributions declared to
shareholders | | | $(0.70 | ) | | | $(0.66 | ) | | | $(0.38 | ) | | | $(0.23 | ) | | | $(0.25 | ) | | | $(0.20 | ) |
Net asset value, end of period (x) | | | $17.53 | | | | $17.40 | | | | $18.17 | | | | $16.78 | | | | $15.20 | | | | $13.19 | |
Total return (%) (r)(s)(t)(x) | | | 4.88 | (n) | | | (0.75 | ) | | | 10.63 | | | | 11.99 | | | | 17.24 | | | | (0.60 | ) |
Ratios (%) (to average net assets)
and Supplemental data: | |
Expenses before expense
reductions (f) | | | 1.59 | (a) | | | 1.59 | | | | 1.58 | | | | 1.60 | | | | 1.62 | | | | 1.62 | |
Expenses after expense
reductions (f) | | | 1.54 | (a) | | | 1.54 | | | | 1.53 | | | | 1.55 | | | | 1.57 | | | | 1.61 | |
Net investment income | | | 1.21 | (a) | | | 1.50 | | | | 1.33 | | | | 1.31 | | | | 1.54 | | | | 1.47 | |
Portfolio turnover | | | 19 | (n) | | | 45 | | | | 35 | | | | 53 | | | | 23 | | | | 24 | |
Net assets at end of period
(000 omitted) | | | $1,620 | | | | $1,721 | | | | $2,110 | | | | $2,369 | | | | $3,095 | | | | $4,007 | |
See Notes to Financial Statements
39
Financial Highlights – continued
| | | | | | | | | | | | | | | | | | | | | | | | |
| | | Six months
ended
3/31/16 (unaudited) | | | Years ended 9/30 | |
| Class 529C | | | 2015 | | | 2014 | | | 2013 | | | 2012 | | | 2011 | |
| | | | | | | | | | | | | | | | | |
Net asset value, beginning of
period | | | $17.47 | | | | $18.25 | | | | $16.85 | | | | $15.27 | | | | $13.25 | | | | $13.53 | |
| Income (loss) from investment operations | |
Net investment income (d) | | | $0.11 | | | | $0.28 | | | | $0.24 | | | | $0.21 | | | | $0.22 | | | | $0.21 | |
Net realized and unrealized
gain (loss) on investments
and foreign currency | | | 0.72 | | | | (0.40 | ) | | | 1.54 | | | | 1.60 | | | | 2.05 | | | | (0.29 | ) |
Total from investment operations | | | $0.83 | | | | $(0.12 | ) | | | $1.78 | | | | $1.81 | | | | $2.27 | | | | $(0.08 | ) |
| Less distributions declared to shareholders | |
From net investment income | | | $(0.19 | ) | | | $(0.23 | ) | | | $(0.24 | ) | | | $(0.23 | ) | | | $(0.25 | ) | | | $(0.20 | ) |
From net realized gain on
investments | | | (0.51 | ) | | | (0.43 | ) | | | (0.14 | ) | | | — | | | | — | | | | — | |
Total distributions declared to
shareholders | | | $(0.70 | ) | | | $(0.66 | ) | | | $(0.38 | ) | | | $(0.23 | ) | | | $(0.25 | ) | | | $(0.20 | ) |
Net asset value, end of period (x) | | | $17.60 | | | | $17.47 | | | | $18.25 | | | | $16.85 | | | | $15.27 | | | | $13.25 | |
Total return (%) (r)(s)(t)(x) | | | 4.86 | (n) | | | (0.79 | ) | | | 10.66 | | | | 11.97 | | | | 17.26 | | | | (0.66 | ) |
Ratios (%) (to average net assets)
and Supplemental data: | |
Expenses before expense
reductions (f) | | | 1.59 | (a) | | | 1.59 | | | | 1.58 | | | | 1.60 | | | | 1.62 | | | | 1.62 | |
Expenses after expense
reductions (f) | | | 1.54 | (a) | | | 1.54 | | | | 1.53 | | | | 1.55 | | | | 1.57 | | | | 1.61 | |
Net investment income | | | 1.21 | (a) | | | 1.55 | | | | 1.33 | | | | 1.30 | | | | 1.53 | | | | 1.47 | |
Portfolio turnover | | | 19 | (n) | | | 45 | | | | 35 | | | | 53 | | | | 23 | | | | 24 | |
Net assets at end of period
(000 omitted) | | | $8,940 | | | | $8,222 | | | | $7,915 | | | | $6,989 | | | | $6,028 | | | | $5,091 | |
See Notes to Financial Statements
40
Financial Highlights – continued
| (d) | Per share data is based on average shares outstanding. |
| (f) | Ratios do not reflect reductions from fees paid indirectly, if applicable. |
| (g) | The per share amount varies from the net realized and unrealized gain/loss for the period because of the timing of sales of fund shares and the per share amount of realized and unrealized gains and losses at such time. |
| (i) | For the period from the class inception, June 1, 2012, through the stated period end. |
| (l) | Recognition of net investment income by the fund may be affected by the timing of the declaration of dividends by companies in which the fund invests and the actual annual net investment income ratio may differ. |
| (r) | Certain expenses have been reduced without which performance would have been lower. |
| (s) | From time to time the fund may receive proceeds from litigation settlements, without which performance would be lower. |
| (t) | Total returns do not include any applicable sales charges. |
| (x) | The net asset values and total returns have been calculated on net assets which include adjustments made in accordance with U.S. generally accepted accounting principles required at period end for financial reporting purposes. |
See Notes to Financial Statements
41
NOTES TO FINANCIAL STATEMENTS
(unaudited)
(1) Business and Organization
MFS Total Return Fund (the fund) is a diversified series of MFS Series Trust V (the trust). The trust is organized as a Massachusetts business trust and is registered under the Investment Company Act of 1940, as amended, as an open-end management investment company.
The fund is an investment company and accordingly follows the investment company accounting and reporting guidance of the Financial Accounting Standards Board (FASB) Accounting Standards Codification Topic 946 Financial Services – Investment Companies.
The fund has entered into contractual arrangements with an investment adviser, administrator, distributor, shareholder servicing agent, 529 program manager (if applicable), and custodian who each provide services to the fund. Unless expressly stated otherwise, shareholders are not parties to, or intended beneficiaries of these contractual arrangements, and these contractual arrangements are not intended to create any shareholder right to enforce them against the service providers or to seek any remedy under them against the service providers, either directly or on behalf of the fund.
Under the Trust’s By-Laws and Declaration of Trust, any claims asserted against or on behalf of the MFS Funds, including claims against Trustees and Officers, must be brought in states and federal courts located within the Commonwealth of Massachusetts.
(2) Significant Accounting Policies
General – The preparation of financial statements in conformity with U.S. generally accepted accounting principles requires management to make estimates and assumptions that affect the reported amounts of assets and liabilities, and disclosure of contingent assets and liabilities at the date of the financial statements and the reported amounts of increases and decreases in net assets from operations during the reporting period. Actual results could differ from those estimates. In the preparation of these financial statements, management has evaluated subsequent events occurring after the date of the fund’s Statement of Assets and Liabilities through the date that the financial statements were issued.
In January 2016, FASB issued Accounting Standards Update 2016-01, Financial Instruments – Overall (Subtopic 825-10) – Recognition and Measurement of Financial Assets and Financial Liabilities (“ASU 2016-01”) which would first be effective for annual reporting periods beginning after December 15, 2017, and interim periods therein. ASU 2016-01, which changes the accounting for equity investments and for certain financial liabilities, also modifies the presentation and disclosure requirements for financial instruments. Investment companies are specifically exempted from ASU 2016-01’s equity investment accounting provisions and will continue to follow the industry specific guidance for investment accounting under ASC 946. Although still evaluating the potential impacts of ASU 2016-01 to the fund, management expects that the impact of the fund’s adoption will be limited to additional financial statement disclosures.
42
Notes to Financial Statements (unaudited) – continued
Balance Sheet Offsetting – The fund’s accounting policy with respect to balance sheet offsetting is that, absent an event of default by the counterparty or a termination of the agreement, the International Swaps and Derivatives Association (ISDA) Master Agreement does not result in an offset of reported amounts of financial assets and financial liabilities in the Statement of Assets and Liabilities across transactions between the fund and the applicable counterparty. The fund’s right to setoff may be restricted or prohibited by the bankruptcy or insolvency laws of the particular jurisdiction to which a specific master netting agreement counterparty is subject. Balance sheet offsetting disclosures, to the extent applicable to the fund, have been included in the fund’s Significant Accounting Policies note under the captions for each of the fund’s in-scope financial instruments and transactions.
Investment Valuations – Equity securities, including restricted equity securities, are generally valued at the last sale or official closing price on their primary market or exchange as provided by a third-party pricing service. Equity securities, for which there were no sales reported that day, are generally valued at the last quoted daily bid quotation on their primary market or exchange as provided by a third-party pricing service. Debt instruments and floating rate loans, including restricted debt instruments, are generally valued at an evaluated or composite bid as provided by a third-party pricing service. Short-term instruments with a maturity at issuance of 60 days or less may be valued at amortized cost, which approximates market value. Open-end investment companies are generally valued at net asset value per share. Securities and other assets generally valued on the basis of information from a third-party pricing service may also be valued at a broker/dealer bid quotation. Values obtained from third-party pricing services can utilize both transaction data and market information such as yield, quality, coupon rate, maturity, type of issue, trading characteristics, and other market data. The values of foreign securities and other assets and liabilities expressed in foreign currencies are converted to U.S. dollars using the mean of bid and asked prices for rates provided by a third-party pricing service.
The Board of Trustees has delegated primary responsibility for determining or causing to be determined the value of the fund’s investments (including any fair valuation) to the adviser pursuant to valuation policies and procedures approved by the Board. If the adviser determines that reliable market quotations are not readily available, investments are valued at fair value as determined in good faith by the adviser in accordance with such procedures under the oversight of the Board of Trustees. Under the fund’s valuation policies and procedures, market quotations are not considered to be readily available for most types of debt instruments and floating rate loans and many types of derivatives. These investments are generally valued at fair value based on information from third-party pricing services. In addition, investments may be valued at fair value if the adviser determines that an investment’s value has been materially affected by events occurring after the close of the exchange or market on which the investment is principally traded (such as foreign exchange or market) and prior to the determination of the fund’s net asset value, or after the halting of trading of a specific security where trading does not resume prior to the close of the exchange or market on which the security is principally traded. Events that occur on a frequent basis after foreign markets close (such as developments in foreign markets and significant movements in the U.S. markets) and prior to the determination of the fund’s net asset value may be deemed
43
Notes to Financial Statements (unaudited) – continued
to have a material effect on the value of securities traded in foreign markets. Accordingly, the fund’s foreign equity securities may often be valued at fair value. The adviser generally relies on third-party pricing services or other information (such as the correlation with price movements of similar securities in the same or other markets; the type, cost and investment characteristics of the security; the business and financial condition of the issuer; and trading and other market data) to assist in determining whether to fair value and at what value to fair value an investment. The value of an investment for purposes of calculating the fund’s net asset value can differ depending on the source and method used to determine value. When fair valuation is used, the value of an investment used to determine the fund’s net asset value may differ from quoted or published prices for the same investment. There can be no assurance that the fund could obtain the fair value assigned to an investment if it were to sell the investment at the same time at which the fund determines its net asset value per share.
Various inputs are used in determining the value of the fund’s assets or liabilities. These inputs are categorized into three broad levels. In certain cases, the inputs used to measure fair value may fall into different levels of the fair value hierarchy. In such cases, an investment’s level within the fair value hierarchy is based on the lowest level of input that is significant to the fair value measurement. The fund’s assessment of the significance of a particular input to the fair value measurement in its entirety requires judgment, and considers factors specific to the investment. Level 1 includes unadjusted quoted prices in active markets for identical assets or liabilities. Level 2 includes other significant observable market-based inputs (including quoted prices for similar securities, interest rates, prepayment speed, and credit risk). Level 3 includes unobservable inputs, which may include the adviser’s own assumptions in determining the fair value of investments. The following is a summary of the levels used as of March 31, 2016 in valuing the fund’s assets or liabilities:
| | | | | | | | | | | | | | | | |
| Investments at Value | | Level 1 | | | Level 2 | | | Level 3 | | | Total | |
| Equity Securities | | | $4,219,486,542 | | | | $— | | | | $— | | | | $4,219,486,542 | |
| U.S. Treasury Bonds & U.S. Government Agency & Equivalents | | | — | | | | 863,856,075 | | | | — | | | | 863,856,075 | |
| Non-U.S. Sovereign Debt | | | — | | | | 51,226,779 | | | | — | | | | 51,226,779 | |
| U.S. Corporate Bonds | | | — | | | | 644,264,661 | | | | — | | | | 644,264,661 | |
| Residential Mortgage-Backed Securities | | | — | | | | 743,294,056 | | | | — | | | | 743,294,056 | |
| Commercial Mortgage-Backed Securities | | | — | | | | 104,811,719 | | | | — | | | | 104,811,719 | |
| Asset-Backed Securities (including CDOs) | | | — | | | | 38,797,509 | | | | — | | | | 38,797,509 | |
| Foreign Bonds | | | — | | | | 167,540,262 | | | | — | | | | 167,540,262 | |
| Mutual Funds | | | 190,731,036 | | | | — | | | | — | | | | 190,731,036 | |
| Total Investments | | | $4,410,217,578 | | | | $2,613,791,061 | | | | $— | | | | $7,024,008,639 | |
For further information regarding security characteristics, see the Portfolio of Investments.
Of the level 1 investments presented above, equity investments amounting to $57,661,360 would have been considered level 2 investments at the beginning of the period. The primary reason for changes in the classifications between levels 1 and 2 occurs when foreign equity securities are fair valued using other observable market-based inputs in place of the closing exchange price due to events occurring after the
44
Notes to Financial Statements (unaudited) – continued
close of the exchange or market on which the investment is principally traded. The fund’s foreign equity securities may often be valued at fair value. The fund’s policy is to recognize transfers between the levels as of the end of the period.
Foreign Currency Translation – Purchases and sales of foreign investments, income, and expenses are converted into U.S. dollars based upon currency exchange rates prevailing on the respective dates of such transactions or on the reporting date for foreign denominated receivables and payables. Gains and losses attributable to foreign currency exchange rates on sales of securities are recorded for financial statement purposes as net realized gains and losses on investments. Gains and losses attributable to foreign exchange rate movements on receivables, payables, income and expenses are recorded for financial statement purposes as foreign currency transaction gains and losses. That portion of both realized and unrealized gains and losses on investments that results from fluctuations in foreign currency exchange rates is not separately disclosed.
Security Loans – Under its Securities Lending Agency Agreement with the fund, JPMorgan Chase and Co. (“Chase”), as lending agent, loans the securities of the fund to certain qualified institutions (the “Borrowers”) approved by the fund. Security loans can be terminated at the discretion of either the lending agent or the fund and the related securities must be returned within the earlier of the standard trade settlement period for such securities or within three business days. The loans are collateralized by cash and/or U.S. Treasury and federal agency obligations in an amount typically at least equal to the market value of the securities loaned. On loans collateralized by cash, the cash collateral is invested in a money market fund. The market value of the loaned securities is determined at the close of business of the fund and any additional required collateral is delivered to the fund on the next business day. Chase provides the fund with indemnification against Borrower default. In the event of Borrower default, Chase will, for the benefit of the fund, either purchase securities identical to those loaned or, when such purchase is commercially impracticable, pay the fund the market value of the loaned securities. In return, Chase assumes the fund’s rights to the related collateral. If the collateral value is less than the cost to purchase identical securities, Chase is responsible for the shortfall, but only to the extent that such shortfall is not due to a decline in collateral value resulting from collateral reinvestment for which the fund bears the risk of loss. At period end, the fund had investment securities on loan, all of which were classified as equity securities in the fund’s Portfolio of Investments, with a fair value of $4,241,698. The fair value of the fund’s investment securities on loan and a related liability of $4,357,581 for cash collateral received on securities loaned are both presented gross in the Statement of Assets and Liabilities. The collateral received on securities loaned exceeded the value of securities on loan at period end. The liability for cash collateral for securities loaned is carried at fair value, which is categorized as level 2 within the fair value hierarchy. A portion of the income generated upon investment of the collateral is remitted to the Borrowers, and the remainder is allocated between the fund and the lending agent. On loans collateralized by U.S. Treasury and/or federal agency obligations, a fee is received from the Borrower, and is allocated between the fund and the lending agent. Income from securities
45
Notes to Financial Statements (unaudited) – continued
lending is included in “Interest” income in the Statement of Operations. The dividend and interest income earned on the securities loaned is accounted for in the same manner as other dividend and interest income.
Dollar Roll Transactions – The fund enters into dollar roll transactions, with respect to mortgage-backed securities issued by Ginnie Mae, Fannie Mae, and Freddie Mac, in which the fund sells mortgage-backed securities to financial institutions and simultaneously agrees to purchase similar (same issuer, type and coupon) securities at a later date at an agreed-upon price. During the period between the sale and repurchase in a dollar roll transaction the fund will not be entitled to receive interest and principal payments on the securities sold but is compensated by interest earned on the proceeds of the initial sale and by a lower purchase price on the securities to be repurchased which enhances the fund’s total return. The fund accounts for dollar roll transactions as purchases and sales and realizes gains and losses on these transactions.
Indemnifications – Under the fund’s organizational documents, its officers and Trustees may be indemnified against certain liabilities and expenses arising out of the performance of their duties to the fund. Additionally, in the normal course of business, the fund enters into agreements with service providers that may contain indemnification clauses. The fund’s maximum exposure under these agreements is unknown as this would involve future claims that may be made against the fund that have not yet occurred.
Investment Transactions and Income – Investment transactions are recorded on the trade date. Interest income is recorded on the accrual basis. All premium and discount is amortized or accreted for financial statement purposes in accordance with U.S. generally accepted accounting principles. Some securities may be purchased on a “when-issued” or “forward delivery” basis, which means that the securities will be delivered to the fund at a future date, usually beyond customary settlement time. Dividends received in cash are recorded on the ex-dividend date. Certain dividends from foreign securities will be recorded when the fund is informed of the dividend if such information is obtained subsequent to the ex-dividend date. Dividend and interest payments received in additional securities are recorded on the ex-dividend or ex-interest date in an amount equal to the value of the security on such date.
The fund may receive proceeds from litigation settlements. Any proceeds received from litigation involving portfolio holdings are reflected in the Statement of Operations in realized gain/loss if the security has been disposed of by the fund or in unrealized gain/loss if the security is still held by the fund. Any other proceeds from litigation not related to portfolio holdings are reflected as other income in the Statement of Operations.
The fund invests a significant portion of its assets in asset-backed and/or mortgage-backed securities. The value of these securities may depend, in part, on the issuer’s or borrower’s credit quality or ability to pay principal and interest when due and that value may fall if an issuer or borrower defaults on its obligation to pay principal or interest or if the instrument’s credit rating is downgraded by a credit rating agency. U.S. Government securities not supported as to the payment of principal or interest by the U.S. Treasury, such as those issued by Fannie Mae, Freddie Mac, and the Federal
46
Notes to Financial Statements (unaudited) – continued
Home Loan Banks, are subject to greater credit risk than are U.S. Government securities supported by the U.S. Treasury, such as those issued by Ginnie Mae.
The fund purchased or sold debt securities on a when-issued or delayed delivery basis, or in a “To Be Announced” (TBA) or “forward commitment” transaction with delivery or payment to occur at a later date beyond the normal settlement period. At the time a fund enters into a commitment to purchase or sell a security, the transaction is recorded and the value of the security acquired is reflected in the fund’s net asset value. The price of such security and the date that the security will be delivered and paid for are fixed at the time the transaction is negotiated. The value of the security may vary with market fluctuations. TBA securities resulting from these transactions are included in the Portfolio of Investments. TBA purchase and sale commitments are held at carrying amount, which approximates fair value and are categorized as level 2 within the fair value hierarchy. No interest accrues to the fund until payment takes place. At the time that a fund enters into this type of transaction, the fund is required to have sufficient cash and/or liquid securities to cover its commitments. Losses may arise due to changes in the value of the underlying securities or if the counterparty does not perform under the contract’s terms, or if the issuer does not issue the securities due to political, economic or other factors. Additionally, losses may arise due to declines in the value of the securities prior to settlement date.
To mitigate this risk of loss on TBA securities and other types of forward settling mortgage-backed securities, the fund whenever possible enters into a Master Securities Forward Transaction Agreement (“MSFTA”) on a bilateral basis with each of the counterparties with whom it undertakes a significant volume of transactions. The MSFTA gives each party to the agreement the right to terminate all transactions traded under such agreement if there is a certain deterioration in the credit quality of the other party. Upon an event of default or a termination of the MSFTA, the non-defaulting party has the right to close out all transactions traded under such agreement and to net amounts owed under each transaction to one net amount payable by one party to the other. This right to close out and net payments across all transactions traded under the MSFTA could result in a reduction of the fund’s credit risk to such counterparty equal to any amounts payable by the fund under the applicable transactions, if any.
For mortgage-backed securities traded under a MSFTA, the collateral and margining requirements are contract specific. Collateral amounts across all transactions traded under such agreement are netted and one amount is posted from one party to the other to collateralize such obligations. Cash that has been pledged to cover the fund’s collateral or margin obligations under a MSFTA, if any, will be reported separately on the Statement of Assets and Liabilities as restricted cash. Securities pledged as collateral or margin for the same purpose, if any, are noted in the Portfolio of Investments.
Fees Paid Indirectly – The fund’s custody fee may be reduced by a credit earned under an arrangement that measures the value of U.S. dollars deposited with the custodian by the fund. The amount of the credit, for the six months ended March 31, 2016, is shown as a reduction of total expenses in the Statement of Operations.
Tax Matters and Distributions – The fund intends to qualify as a regulated investment company, as defined under Subchapter M of the Internal Revenue Code,
47
Notes to Financial Statements (unaudited) – continued
and to distribute all of its taxable income, including realized capital gains. As a result, no provision for federal income tax is required. The fund’s federal tax returns, when filed, will remain subject to examination by the Internal Revenue Service for a three year period. Management has analyzed the fund’s tax positions taken on federal and state tax returns for all open tax years and does not believe that there are any uncertain tax positions that require recognition of a tax liability. Foreign taxes, if any, have been accrued by the fund in the accompanying financial statements in accordance with the applicable foreign tax law. Foreign income taxes may be withheld by certain countries in which the fund invests. Additionally, capital gains realized by the fund on securities issued in or by certain foreign countries may be subject to capital gains tax imposed by those countries.
Distributions to shareholders are recorded on the ex-dividend date. Income and capital gain distributions are determined in accordance with income tax regulations, which may differ from U.S. generally accepted accounting principles. Certain capital accounts in the financial statements are periodically adjusted for permanent differences in order to reflect their tax character. These adjustments have no impact on net assets or net asset value per share. Temporary differences which arise from recognizing certain items of income, expense, gain or loss in different periods for financial statement and tax purposes will reverse at some time in the future. Distributions in excess of net investment income or net realized gains are temporary overdistributions for financial statement purposes resulting from differences in the recognition or classification of income or distributions for financial statement and tax purposes.
Book/tax differences primarily relate to amortization and accretion of debt securities, wash sale loss deferrals, and treating a portion of the proceeds from redemptions as a distribution for tax purposes.
The tax character of distributions made during the current period will be determined at fiscal year end. The tax character of distributions declared to shareholders for the last fiscal year is as follows:
| | | | |
| | | 9/30/15 | |
Ordinary income (including any short-term capital gains) | | | $156,126,358 | |
| Long-term capital gains | | | 141,082,463 | |
| Total distributions | | | $297,208,821 | |
48
Notes to Financial Statements (unaudited) – continued
The federal tax cost and the tax basis components of distributable earnings were as follows:
| | | | |
| As of 3/31/16 | | | |
| Cost of investments | | | $5,929,728,115 | |
| Gross appreciation | | | 1,218,961,873 | |
| Gross depreciation | | | (124,681,349 | ) |
| Net unrealized appreciation (depreciation) | | | $1,094,280,524 | |
| |
| As of 9/30/15 | | | |
| Undistributed ordinary income | | | 41,916,766 | |
| Undistributed long-term capital gain | | | 192,764,862 | |
| Post-October capital loss deferral | | | (4,251,183 | ) |
| Other temporary differences | | | (10,999,869 | ) |
| Net unrealized appreciation (depreciation) | | | 840,376,681 | |
The aggregate cost above includes prior fiscal year end tax adjustments, if applicable.
Multiple Classes of Shares of Beneficial Interest – The fund offers multiple classes of shares, which differ in their respective distribution, service, and program manager fees. The fund’s income, realized and unrealized gain (loss), and common expenses are allocated to shareholders based on the daily net assets of each class. Dividends are declared separately for each class. Differences in per share dividend rates are generally due to differences in separate class expenses. Class B and Class 529B shares will convert to Class A and Class 529A shares, respectively, approximately eight years after purchase. The fund’s distributions declared to shareholders as reported in the Statements of Changes in Net Assets are presented by class as follows:
| | | | | | | | | | | | | | | | |
| | | From net investment
income | | | From net realized gain on
investments | |
| | | Six months
ended
3/31/16 | | | Year
ended
9/30/15 | | | Six months
ended
3/31/16 | | | Year
ended
9/30/15 | |
| Class A | | | $67,489,194 | | | | $97,137,378 | | | | $130,685,487 | | | | $110,460,121 | |
| Class B | | | 2,305,439 | | | | 3,031,569 | | | | 6,045,708 | | | | 5,797,113 | |
| Class C | | | 11,057,970 | | | | 12,746,701 | | | | 28,711,893 | | | | 22,402,438 | |
| Class I | | | 3,683,079 | | | | 5,610,293 | | | | 6,725,454 | | | | 5,570,003 | |
| Class R1 | | | 162,253 | | | | 204,367 | | | | 423,930 | | | | 376,935 | |
| Class R2 | | | 2,376,548 | | | | 3,069,748 | | | | 4,966,622 | | | | 3,906,425 | |
| Class R3 | | | 4,420,798 | | | | 5,413,770 | | | | 8,687,690 | | | | 6,131,712 | |
| Class R4 | | | 4,361,500 | | | | 6,404,145 | | | | 7,859,888 | | | | 5,965,346 | |
| Class R5 | | | 1,861,571 | | | | 950,275 | | | | 3,275,627 | | | | 846,784 | |
| Class 529A | | | 280,750 | | | | 378,571 | | | | 549,127 | | | | 430,300 | |
| Class 529B | | | 18,073 | | | | 24,663 | | | | 48,728 | | | | 50,294 | |
| Class 529C | | | 91,157 | | | | 106,496 | | | | 241,226 | | | | 193,374 | |
| Total | | | $98,108,332 | | | | $135,077,976 | | | | $198,221,380 | | | | $162,130,845 | |
49
Notes to Financial Statements (unaudited) – continued
(3) Transactions with Affiliates
Investment Adviser – The fund has an investment advisory agreement with MFS to provide overall investment management and related administrative services and facilities to the fund. The management fee is computed daily and paid monthly at the following annual rates:
| | | | |
| First $6.3 billion of average daily net assets | | | 0.35 | % |
| Average daily net assets in excess of $6.3 billion | | | 0.34 | % |
The management fee incurred for the six months ended March 31, 2016 was equivalent to an annual effective rate of 0.35% of the fund’s average daily net assets.
Distributor – MFS Fund Distributors, Inc. (MFD), a wholly-owned subsidiary of MFS, as distributor, received $836,807 and $4,687 for the six months ended March 31, 2016, as its portion of the initial sales charge on sales of Class A and Class 529A shares of the fund, respectively.
The Board of Trustees has adopted a distribution plan for certain share classes pursuant to Rule 12b-1 of the Investment Company Act of 1940.
The fund’s distribution plan provides that the fund will pay MFD for services provided by MFD and financial intermediaries in connection with the distribution and servicing of certain share classes. One component of the plan is a distribution fee paid to MFD and another component of the plan is a service fee paid to MFD. MFD may subsequently pay all, or a portion, of the distribution and/or service fees to financial intermediaries.
Distribution Plan Fee Table:
| | | | | | | | | | | | | | | | | | | | |
| | | Distribution
Fee Rate (d) | | | Service
Fee Rate (d) | | | Total
Distribution
Plan (d) | | | Annual
Effective
Rate (e) | | | Distribution
and Service
Fee | |
| Class A | | | — | | | | 0.25% | | | | 0.25% | | | | 0.25% | | | | $5,649,551 | |
| Class B | | | 0.75% | | | | 0.25% | | | | 1.00% | | | | 1.00% | | | | 1,039,160 | |
| Class C | | | 0.75% | | | | 0.25% | | | | 1.00% | | | | 1.00% | | | | 4,965,105 | |
| Class R1 | | | 0.75% | | | | 0.25% | | | | 1.00% | | | | 1.00% | | | | 71,572 | |
| Class R2 | | | 0.25% | | | | 0.25% | | | | 0.50% | | | | 0.50% | | | | 435,694 | |
| Class R3 | | | — | | | | 0.25% | | | | 0.25% | | | | 0.25% | | | | 366,419 | |
| Class 529A | | | — | | | | 0.25% | | | | 0.25% | | | | 0.24% | | | | 23,619 | |
| Class 529B | | | 0.75% | | | | 0.25% | | | | 1.00% | | | | 1.00% | | | | 8,362 | |
| Class 529C | | | 0.75% | | | | 0.25% | | | | 1.00% | | | | 1.00% | | | | 42,213 | |
| Total Distribution and Service Fees | | | | $12,601,695 | |
| (d) | In accordance with the distribution plan for certain classes, the fund pays distribution and/or service fees equal to these annual percentage rates of each class’s average daily net assets. The distribution and service fee rates disclosed by class represent the current rates in effect at the end of the reporting period. Any rate changes, if applicable, are detailed below. |
| (e) | The annual effective rates represent actual fees incurred under the distribution plan for the six months ended March 31, 2016 based on each class’s average daily net assets. MFD has voluntarily agreed to rebate a portion of each class’s 0.25% service fee attributable to accounts for which MFD retains the 0.25% service fee except for accounts attributable to MFS or its affiliates’ seed money. For the six months ended March 31, 2016, this rebate amounted to $114,683, $855, $2,296, $1,344, $8, and $99 for Class A, Class B, Class C, Class 529A, Class 529B, and Class 529C, respectively, and is included in the reduction of total expenses in the Statement of Operations. |
50
Notes to Financial Statements (unaudited) – continued
Certain Class A shares are subject to a contingent deferred sales charge (CDSC) in the event of a shareholder redemption within 18 months of purchase. Class C and Class 529C shares are subject to a CDSC in the event of a shareholder redemption within 12 months of purchase. Class B and Class 529B shares are subject to a CDSC in the event of a shareholder redemption within six years of purchase. All contingent deferred sales charges are paid to MFD and during the six months ended March 31, 2016, were as follows:
| | | | |
| | | Amount | |
| Class A | | | $4,253 | |
| Class B | | | 107,332 | |
| Class C | | | 37,386 | |
| Class 529B | | | 541 | |
| Class 529C | | | 35 | |
The fund has entered into and may from time to time enter into contracts with program managers and other parties which administer the tuition programs through which an investment in the fund’s 529 share classes is made. The fund has entered into an agreement with MFD pursuant to which MFD receives an annual fee of up to 0.10% of the average daily net assets attributable to each 529 share class. MFD has agreed to waive a portion of this fee in an amount equal to 0.05% of the average daily net assets for each 529 share class. This waiver agreement will expire on January 31, 2017, unless MFD elects to extend the waiver. For the six months ended March 31, 2016, this waiver amounted to $7,256 and is included in the reduction of total expenses in the Statement of Operations. The program manager fee incurred for the six months ended March 31, 2016 was equivalent to an annual effective rate of 0.05% of the average daily net assets attributable to each 529 share class. The services provided by MFD, or a third party with which MFD contracts, include recordkeeping and tax reporting and account services, as well as services designed to maintain the program’s compliance with the Internal Revenue Code and other regulatory requirements. Program manager fees and waivers for the six months ended March 31, 2016, were as follows:
| | | | | | | | |
| | | Fee | | | Waiver | |
| Class 529A | | | $9,447 | | | | $4,724 | |
| Class 529B | | | 837 | | | | 419 | |
| Class 529C | | | 4,226 | | | | 2,113 | |
| Total Program Manager Fees and Waivers | | | $14,510 | | | | $7,256 | |
Shareholder Servicing Agent – MFS Service Center, Inc. (MFSC), a wholly-owned subsidiary of MFS, receives a fee from the fund for its services as shareholder servicing agent calculated as a percentage of the average daily net assets of the fund as determined periodically under the supervision of the fund’s Board of Trustees. For the six months ended March 31, 2016, the fee was $604,034, which equated to 0.0177% annually of the fund’s average daily net assets. MFSC also receives payment from the fund for out-of-pocket expenses, sub-accounting and other shareholder servicing costs which may be paid to affiliated and unaffiliated service providers. Class R5 shares do
51
Notes to Financial Statements (unaudited) – continued
not incur sub-accounting fees. For the six months ended March 31, 2016, these out-of-pocket expenses, sub-accounting and other shareholder servicing costs amounted to $3,347,050.
Administrator – MFS provides certain financial, legal, shareholder communications, compliance, and other administrative services to the fund. Under an administrative services agreement, the fund reimburses MFS the costs incurred to provide these services. The fund is charged an annual fixed amount of $17,500 plus a fee based on average daily net assets. The administrative services fee incurred for the six months ended March 31, 2016 was equivalent to an annual effective rate of 0.0094% of the fund’s average daily net assets.
Trustees’ and Officers’ Compensation – The fund pays compensation to independent Trustees in the form of a retainer, attendance fees, and additional compensation to Board and Committee chairpersons. The fund does not pay compensation directly to Trustees or officers of the fund who are also officers of the investment adviser, all of whom receive remuneration for their services to the fund from MFS. Certain officers and Trustees of the fund are officers or directors of MFS, MFD, and MFSC.
Prior to December 31, 2001, the fund had an unfunded defined benefit plan (“DB plan”) for independent Trustees. As of December 31, 2001, the Board took action to terminate the DB plan with respect to then-current and any future independent Trustees, such that the DB plan covers only certain of those former independent Trustees who retired on or before December 31, 2001. Effective January 1, 2002, accrued benefits under the DB plan for then-current independent Trustees who continued were credited to an unfunded retirement deferral plan (the “Retirement Deferral plan”), which was established for and exists solely with respect to these credited amounts, and is not available for other deferrals by these or other independent Trustees. Although the Retirement Deferral plan is unfunded, amounts deferred under the plan are periodically adjusted for investment experience as if they had been invested in shares of the fund. The DB plan resulted in a pension expense of $2,903 and the Retirement Deferral plan resulted in a net decrease in expense of $1,567. Both amounts are included in “Independent Trustees’ compensation” in the Statement of Operations for the six months ended March 31, 2016. The liability for deferred retirement benefits payable to certain independent Trustees under both plans amounted to $60,150 at March 31, 2016, and is included in “Payable for independent Trustees’ compensation” in the Statement of Assets and Liabilities.
Deferred Trustee Compensation – Under a Deferred Compensation Plan (the “Plan”), independent Trustees previously were allowed to elect to defer receipt of all or a portion of their annual compensation. Effective January 1, 2005, the Board elected to no longer allow Trustees to defer receipt of future compensation under the Plan. Amounts deferred under the Plan are invested in shares of certain MFS Funds selected by the independent Trustees as notional investments. Deferred amounts represent an unsecured obligation of the fund until distributed in accordance with the Plan. Included in “Other assets” and “Payable for independent Trustees’ compensation” in the Statement of Assets and Liabilities is $24,249 of deferred Trustees’ compensation. There is no current year expense associated with the Plan.
52
Notes to Financial Statements (unaudited) – continued
Other – This fund and certain other funds managed by MFS (the funds) have entered into a service agreement (the ISO Agreement) which provides for payment of fees solely by the funds to Tarantino LLC in return for the provision of services of an Independent Senior Officer (ISO) for the funds. Frank L. Tarantino serves as the ISO and is an officer of the funds and the sole member of Tarantino LLC. The funds can terminate the ISO Agreement with Tarantino LLC at any time under the terms of the ISO Agreement. For the six months ended March 31, 2016, the fee paid by the fund under this agreement was $8,657 and is included in “Miscellaneous” expense in the Statement of Operations. MFS has agreed to bear all expenses associated with office space, other administrative support, and supplies provided to the ISO.
The fund invests in the MFS Institutional Money Market Portfolio which is managed by MFS and seeks current income consistent with preservation of capital and liquidity. Income earned on this investment is included in “Dividends from underlying affiliated funds” in the Statement of Operations. This money market fund does not pay a management fee to MFS.
On September 9, 2015, MFS redeemed 7,826 shares of Class R5 for an aggregate amount of $137,268. On March 16, 2016, MFS redeemed 4,678 shares of Class I for an aggregate amount of $80,972.
The fund is permitted to engage in purchase and sale transactions (“cross-trades”) with funds and accounts for which MFS serves as investment adviser or sub-adviser pursuant to a policy adopted by the Board of Trustees. This policy has been designed to ensure that cross-trades conducted by the fund comply with Rule 17a-7 under the Investment Company Act of 1940. Under this policy, cross-trades are effected at current market prices with no remuneration paid in connection with the transaction. During the six months ended March 31, 2016, the fund engaged in purchase and sale transactions pursuant to this policy, which amounted to $390,429 and $126,410, respectively. The sales transactions resulted in net realized gains (losses) of $75,204.
(4) Portfolio Securities
For the six months ended March 31, 2016, purchases and sales of investments, other than short-term obligations, were as follows:
| | | | | | | | |
| | | Purchases | | | Sales | |
| U.S. Government securities | | | $565,325,854 | | | | $719,285,003 | |
| Investments (non-U.S. Government securities) | | | $590,873,643 | | | | $678,065,120 | |
53
Notes to Financial Statements (unaudited) – continued
(5) Shares of Beneficial Interest
The fund’s Declaration of Trust permits the Trustees to issue an unlimited number of full and fractional shares of beneficial interest. Transactions in fund shares were as follows:
| | | | | | | | | | | | | | | | |
| | | Six months ended
3/31/16 | | | Year ended
9/30/15 | |
| | | Shares | | | Amount | | | Shares | | | Amount | |
| Shares sold | | | | | | | | | | | | | | | | |
Class A | | | 17,823,388 | | | | $308,102,729 | | | | 28,618,204 | | | | $522,265,156 | |
Class B | | | 840,685 | | | | 14,622,521 | | | | 1,424,548 | | | | 26,001,894 | |
Class C | | | 5,772,948 | | | | 100,898,399 | | | | 10,069,153 | | | | 184,668,016 | |
Class I | | | 3,116,356 | | | | 54,085,435 | | | | 4,166,257 | | | | 76,010,620 | |
Class R1 | | | 93,701 | | | | 1,647,879 | | | | 120,565 | | | | 2,199,292 | �� |
Class R2 | | | 1,777,714 | | | | 30,865,575 | | | | 2,299,960 | | | | 41,989,239 | |
Class R3 | | | 4,458,755 | | | | 79,344,474 | | | | 4,052,616 | | | | 73,530,176 | |
Class R4 | | | 1,427,866 | | | | 24,686,520 | | | | 5,512,281 | | | | 100,835,440 | |
Class R5 | | | 3,821,262 | | | | 67,257,477 | | | | 2,244,330 | | | | 39,739,949 | |
Class 529A | | | 91,957 | | | | 1,597,080 | | | | 151,497 | | | | 2,761,681 | |
Class 529B | | | 3,696 | | | | 64,400 | | | | 8,915 | | | | 162,896 | |
Class 529C | | | 61,235 | | | | 1,048,163 | | | | 90,340 | | | | 1,656,386 | |
| | | 39,289,563 | | | | $684,220,652 | | | | 58,758,666 | | | | $1,071,820,745 | |
|
Shares issued to shareholders in
reinvestment of distributions | |
Class A | | | 10,821,989 | | | | $186,916,850 | | | | 10,674,691 | | | | $195,029,386 | |
Class B | | | 433,247 | | | | 7,486,015 | | | | 432,631 | | | | 7,918,544 | |
Class C | | | 1,849,227 | | | | 32,084,487 | | | | 1,519,963 | | | | 27,932,118 | |
Class I | | | 509,633 | | | | 8,804,179 | | | | 532,348 | | | | 9,724,876 | |
Class R1 | | | 33,984 | | | | 585,787 | | | | 31,824 | | | | 581,203 | |
Class R2 | | | 378,101 | | | | 6,547,958 | | | | 340,904 | | | | 6,243,967 | |
Class R3 | | | 758,424 | | | | 13,108,488 | | | | 631,539 | | | | 11,544,461 | |
Class R4 | | | 650,543 | | | | 11,251,348 | | | | 569,923 | | | | 10,415,019 | |
Class R5 | | | 163,910 | | | | 2,829,545 | | | | 95,066 | | | | 1,735,952 | |
Class 529A | | | 48,115 | | | | 829,013 | | | | 44,053 | | | | 803,000 | |
Class 529B | | | 3,867 | | | | 66,793 | | | | 4,004 | | | | 73,262 | |
Class 529C | | | 19,128 | | | | 331,821 | | | | 16,320 | | | | 299,797 | |
| | | 15,670,168 | | | | $270,842,284 | | | | 14,893,266 | | | | $272,301,585 | |
54
Notes to Financial Statements (unaudited) – continued
| | | | | | | | | | | | | | | | |
| | | Six months ended
3/31/16 | | | Year ended
9/30/15 | |
| | | Shares | | | Amount | | | Shares | | | Amount | |
| Shares reacquired | | | | | | | | | | | | | | | | |
Class A | | | (22,458,851 | ) | | | $(392,440,054 | ) | | | (35,334,159 | ) | | | $(644,900,371 | ) |
Class B | | | (1,508,878 | ) | | | (26,187,878 | ) | | | (3,506,712 | ) | | | (64,138,053 | ) |
Class C | | | (4,574,044 | ) | | | (79,577,505 | ) | | | (7,333,681 | ) | | | (134,398,395 | ) |
Class I | | | (2,674,476 | ) | | | (45,069,435 | ) | | | (4,877,482 | ) | | | (87,839,472 | ) |
Class R1 | | | (99,524 | ) | | | (1,716,828 | ) | | | (280,143 | ) | | | (5,103,068 | ) |
Class R2 | | | (1,503,132 | ) | | | (26,200,353 | ) | | | (2,099,770 | ) | | | (38,345,664 | ) |
Class R3 | | | (2,031,470 | ) | | | (35,479,934 | ) | | | (4,332,523 | ) | | | (78,600,565 | ) |
Class R4 | | | (3,485,924 | ) | | | (60,767,158 | ) | | | (3,263,526 | ) | | | (59,404,550 | ) |
Class R5 | | | (427,630 | ) | | | (7,368,253 | ) | | | (288,417 | ) | | | (5,246,790 | ) |
Class 529A | | | (61,217 | ) | | | (1,056,160 | ) | | | (129,184 | ) | | | (2,354,604 | ) |
Class 529B | | | (14,024 | ) | | | (243,596 | ) | | | (30,133 | ) | | | (551,226 | ) |
Class 529C | | | (43,025 | ) | | | (742,871 | ) | | | (69,719 | ) | | | (1,279,059 | ) |
| | | (38,882,195 | ) | | | $(676,850,025 | ) | | | (61,545,449 | ) | | | $(1,122,161,817 | ) |
| | | | |
| Net change | | | | | | | | | | | | | | | | |
Class A | | | 6,186,526 | | | | $102,579,525 | | | | 3,958,736 | | | | $72,394,171 | |
Class B | | | (234,946 | ) | | | (4,079,342 | ) | | | (1,649,533 | ) | | | (30,217,615 | ) |
Class C | | | 3,048,131 | | | | 53,405,381 | | | | 4,255,435 | | | | 78,201,739 | |
Class I | | | 951,513 | | | | 17,820,179 | | | | (178,877 | ) | | | (2,103,976 | ) |
Class R1 | | | 28,161 | | | | 516,838 | | | | (127,754 | ) | | | (2,322,573 | ) |
Class R2 | | | 652,683 | | | | 11,213,180 | | | | 541,094 | | | | 9,887,542 | |
Class R3 | | | 3,185,709 | | | | 56,973,028 | | | | 351,632 | | | | 6,474,072 | |
Class R4 | | | (1,407,515 | ) | | | (24,829,290 | ) | | | 2,818,678 | | | | 51,845,909 | |
Class R5 | | | 3,557,542 | | | | 62,718,769 | | | | 2,050,979 | | | | 36,229,111 | |
Class 529A | | | 78,855 | | | | 1,369,933 | | | | 66,366 | | | | 1,210,077 | |
Class 529B | | | (6,461 | ) | | | (112,403 | ) | | | (17,214 | ) | | | (315,068 | ) |
Class 529C | | | 37,338 | | | | 637,113 | | | | 36,941 | | | | 677,124 | |
| | | 16,077,536 | | | | $278,212,911 | | | | 12,106,483 | | | | $221,960,513 | |
(6) Line of Credit
The fund and certain other funds managed by MFS participate in a $1.25 billion unsecured committed line of credit, subject to a $1 billion sublimit, provided by a syndication of banks under a credit agreement. Borrowings may be made for temporary financing needs. Interest is charged to each fund, based on its borrowings, generally at a rate equal to the higher of the Overnight Federal Reserve funds rate or daily one month LIBOR plus an agreed upon spread. A commitment fee, based on the average daily, unused portion of the committed line of credit, is allocated among the participating funds at the end of each calendar quarter. In addition, the fund and other funds managed by MFS have established unsecured uncommitted borrowing arrangements with certain banks for temporary financing needs. Interest is charged to each fund, based on its borrowings, at a rate equal to the Overnight Federal Reserve funds rate plus an agreed upon spread. For the six months ended March 31, 2016, the fund’s commitment fee and interest expense were $11,708 and $0, respectively, and are included in “Miscellaneous” expense in the Statement of Operations.
55
Notes to Financial Statements (unaudited) – continued
(7) Transactions in Underlying Affiliated Funds-Affiliated Issuers
An affiliated issuer may be considered one in which the fund owns 5% or more of the outstanding voting securities, or a company which is under common control. For the purposes of this report, the fund assumes the following to be an affiliated issuer:
| | | | | | | | | | | | | | | | |
| Underlying Affiliated Fund | | Beginning
Shares/Par
Amount | | | Acquisitions
Shares/Par
Amount | | | Dispositions
Shares/Par
Amount | | | Ending
Shares/Par
Amount | |
MFS Institutional Money
Market Portfolio | | | 201,003,794 | | | | 534,342,676 | | | | (548,973,015 | ) | | | 186,373,455 | |
| | | | |
| Underlying Affiliated Fund | | Realized
Gain (Loss) | | | Capital Gain
Distributions | | | Dividend
Income | | | Ending
Value | |
MFS Institutional Money
Market Portfolio | | | $— | | | | $— | | | | $180,737 | | | | $186,373,455 | |
56
PROXY VOTING POLICIES AND INFORMATION
MFS votes proxies on behalf of the fund pursuant to proxy voting policies and procedures that are available without charge, upon request, by calling 1-800-225-2606, by visiting the Proxy Voting section of mfs.com or by visiting the SEC’s Web site at http://www.sec.gov.
Information regarding how the fund voted proxies relating to portfolio securities during the most recent twelve-month period ended June 30 is available without charge by visiting the Proxy Voting section of mfs.com or by visiting the SEC’s Web site at http://www.sec.gov.
QUARTERLY PORTFOLIO DISCLOSURE
The fund will file a complete schedule of portfolio holdings with the Securities and Exchange Commission (the Commission) for the first and third quarters of each fiscal year on Form N-Q. A shareholder can obtain the quarterly portfolio holdings report at mfs.com. The fund’s Form N-Q is also available on the EDGAR database on the Commission’s Internet Web site at http://www.sec.gov, and may be reviewed and copied at the:
Public Reference Room
Securities and Exchange Commission
100 F Street, NE, Room 1580
Washington, D.C. 20549
Information on the operation of the Public Reference Room may be obtained by calling the Commission at 1-800-SEC-0330. Copies of the fund’s Form N-Q also may be obtained, upon payment of a duplicating fee, by electronic request at the following e-mail address: publicinfo@sec.gov or by writing the Public Reference Section at the above address.
FURTHER INFORMATION
From time to time, MFS may post important information about the fund or the MFS funds on the MFS web site (mfs.com). This information is available by visiting the “Market Commentary” and “Announcements” sub sections in the “Market Outlooks” section of mfs.com or by clicking on the fund’s name under “Mutual Funds” in the “Products” section of mfs.com.
PROVISION OF FINANCIAL REPORTS AND SUMMARY PROSPECTUSES
The fund produces financial reports every six months and updates its summary prospectus and prospectus annually. To avoid sending duplicate copies of materials to households, only one copy of the fund’s annual and semiannual report and summary prospectus may be mailed to shareholders having the same last name and residential address on the fund’s records. However, any shareholder may contact MFSC (please see back cover for address and telephone number) to request that copies of these reports and summary prospectuses be sent personally to that shareholder.
57
Save paper with eDelivery.

| MFS® will send you prospectuses, |
reports, and proxies directly via e-mail so you will get information faster with less mailbox clutter.
To sign up:
1. Go to mfs.com.
2. Log in via MFS® Access.
3. Select eDelivery.
If you own your MFS fund shares through a financial institution or a retirement plan, MFS® TALK, MFS® Access, or eDelivery may not be available to you.
CONTACT
WEB SITE
mfs.com
MFS TALK
1-800-637-8255
24 hours a day
ACCOUNT SERVICE AND LITERATURE
Shareholders
1-800-225-2606
Financial advisors
1-800-343-2829
Retirement plan services
1-800-637-1255
MAILING ADDRESS
MFS Service Center, Inc.
P.O. Box 55824
Boston, MA 02205-5824
OVERNIGHT MAIL
MFS Service Center, Inc.
c/o Boston Financial Data Services
30 Dan Road
Canton, MA 02021-2809
During the period covered by this report, the Registrant has not amended any provision in its Code of Ethics (the “Code”) that relates to an element of the Code’s definitions enumerated in paragraph (b) of Item 2 of this Form N-CSR. During the period covered by this report, the Registrant did not grant a waiver, including an implicit waiver, from any provision of the Code.
| ITEM 3. | AUDIT COMMITTEE FINANCIAL EXPERT. |
Not applicable for semi-annual reports.
| ITEM 4. | PRINCIPAL ACCOUNTANT FEES AND SERVICES. |
Not applicable for semi-annual reports.
| ITEM 5. | AUDIT COMMITTEE OF LISTED REGISTRANTS. |
Not applicable to the Registrant.
A schedule of investments for each series of the Registrant is included as part of the report to shareholders of such series under Item 1 of this Form N-CSR.
| ITEM 7. | DISCLOSURE OF PROXY VOTING POLICIES AND PROCEDURES FOR CLOSED-END MANAGEMENT INVESTMENT COMPANIES. |
Not applicable to the Registrant.
| ITEM 8. | PORTFOLIO MANAGERS OF CLOSED-END MANAGEMENT INVESTMENT COMPANIES. |
Not applicable to the Registrant.
| ITEM 9. | PURCHASES OF EQUITY SECURITIES BY CLOSED-END MANAGEMENT INVESTMENT COMPANY AND AFFILIATED PURCHASERS. |
Not applicable to the Registrant.
| ITEM 10. | SUBMISSION OF MATTERS TO A VOTE OF SECURITY HOLDERS. |
There were no material changes to the procedures by which shareholders may send recommendations to the Board for nominees to the Registrant’s Board since the Registrant last provided disclosure as to such procedures in response to the requirements of Item 407 (c)(2)(iv) of Regulation S-K or this Item.
| ITEM 11. | CONTROLS AND PROCEDURES. |
| (a) | Based upon their evaluation of the effectiveness of the registrant’s disclosure controls and procedures (as defined in Rule 30a-3(c) under the Investment Company Act of 1940 (the “Act”)) as conducted within 90 days of the filing date of this report on Form N-CSR, the registrant’s principal financial officer and principal executive officer have concluded that those disclosure controls and procedures provide reasonable assurance that the material information required to be disclosed by the registrant on this report is recorded, processed, summarized and reported within the time periods specified in the Securities and Exchange Commission’s rules and forms. |
| (b) | There were no changes in the registrant’s internal controls over financial reporting (as defined in Rule 30a-3(d) under the Act) that occurred during the second fiscal quarter of the period covered by the report that have materially affected, or are reasonably likely to materially affect, the registrant’s internal control over financial reporting. |
| (a) | File the exhibits listed below as part of this form. Letter or number the exhibits in the sequence indicated. |
| | (1) | Any code of ethics, or amendment thereto, that is the subject of the disclosure required by Item 2, to the extent that the registrant intends to satisfy the Item 2 requirements through filing of an exhibit. |
| | (2) | A separate certification for each principal executive officer and principal financial officer of the registrant as required by Rule 30a-2(a) under the Act (17 CFR 270.30a-2): Attached hereto. |
| (b) | If the report is filed under Section 13(a) or 15(d) of the Exchange Act, provide the certifications required by Rule 30a-2(b) under the Act (17 CFR 270.30a-2(b)), Rule 13a-14(b) or Rule 15d-14(b) under the Exchange Act (17 CFR 240.13a-14(b) or 240.15d-14(b)) and Section 1350 of Chapter 63 of Title 18 of the United States Code (18 U.S.C. 1350) as an exhibit. A certification furnished pursuant to this paragraph will not be deemed “filed” for the purposes of Section 18 of the Exchange Act (15 U.S.C. 78r), or otherwise subject to the liability of that section. Such certification will not be deemed to be incorporated by reference into any filing under the Securities Act of 1933 or the Exchange Act, except to the extent that the registrant specifically incorporates it by reference: Attached hereto. |
Notice
A copy of the Amended and Restated Declaration of Trust, as amended, of the Registrant is on file with the Secretary of State of The Commonwealth of Massachusetts and notice is hereby given that this instrument is executed on behalf of the Registrant by an officer of the Registrant as an officer and not individually and the obligations of or arising out of this instrument are not binding upon any of the Trustees or shareholders individually, but are binding only upon the assets and property of the respective constituent series of the Registrant.
SIGNATURES
Pursuant to the requirements of the Securities Exchange Act of 1934 and the Investment Company Act of 1940, the registrant has duly caused this report to be signed on its behalf by the undersigned, thereunto duly authorized.
(Registrant) MFS SERIES TRUST V
| | |
| By (Signature and Title)* | | ROBIN A. STELMACH |
| | Robin A. Stelmach, President |
Date: May 16, 2016
Pursuant to the requirements of the Securities Exchange Act of 1934 and the Investment Company Act of 1940, this report has been signed below by the following persons on behalf of the registrant and in the capacities and on the dates indicated.
| | |
| By (Signature and Title)* | | ROBIN A. STELMACH |
| | Robin A. Stelmach, President (Principal Executive Officer) |
Date: May 16, 2016
| | |
| By (Signature and Title)* | | DAVID L. DILORENZO |
| | David L. DiLorenzo, Treasurer (Principal Financial Officer and Accounting Officer) |
Date: May 16, 2016
| * | Print name and title of each signing officer under his or her signature. |