UNITED STATES
SECURITIES AND EXCHANGE COMMISSION
Washington, D.C. 20549
FORMN-CSR
CERTIFIED SHAREHOLDER REPORT OF
REGISTERED MANAGEMENT INVESTMENT COMPANIES
Investment Company Act file number811-02031
MFS SERIES TRUST V
(Exact name of registrant as specified in charter)
111 Huntington Avenue, Boston, Massachusetts 02199
(Address of principal executive offices) (Zip code)
Christopher R. Bohane
Massachusetts Financial Services Company
111 Huntington Avenue
Boston, Massachusetts 02199
(Name and address of agents for service)
Registrant’s telephone number, including area code: (617)954-5000
Date of fiscal year end: September 30
Date of reporting period: September 30, 2019
| ITEM 1. | REPORTS TO STOCKHOLDERS. |
Annual Report
September 30, 2019

MFS® International New Discovery Fund

Beginning on January 1, 2021, as permitted by regulations adopted by the U.S. Securities and Exchange Commission, paper copies of the fund’s annual and semiannual shareholder reports will no longer be sent by mail, unless you specifically request paper copies of the reports. Instead, the complete reports will be made available on the fund’s Web site (funds.mfs.com), and you will be notified by mail each time a report is posted and provided with a Web site link to access the report.
If you are already signed up to receive shareholder reports by email, you will not be affected by this change and you need not take any action. You may sign up to receive shareholder reports and other communications from the fund by email by contacting your financial intermediary (such as a broker-dealer or bank) or, if you hold your shares directly with the fund, by calling 1-800-225-2606 or by logging on to MFS Access at mfs.com.
Beginning on January 1, 2019, you may elect to receive all future reports in paper free of charge. Contact your financial intermediary to request that you continue to receive paper copies of your shareholder reports. If you invest directly with the fund, you can call 1-800-225-2606 or send an email request to orderliterature@mfs.com to let the fund know that you wish to continue receiving paper copies of your shareholder reports. Your election to receive reports in paper will apply to all funds held in your account if you invest through your financial intermediary or all funds held with the MFS fund complex if you invest directly.
MIO-ANN
MFS® International New Discovery Fund
CONTENTS
The report is prepared for the general information of shareholders.
It is authorized for distribution to prospective investors only when preceded or accompanied by a current prospectus.
NOT FDIC INSURED• MAY LOSE VALUE• NO BANK GUARANTEE

LETTER FROM THE EXECUTIVE CHAIR
Dear Shareholders:
Slowing global growth, low inflation, and increasing trade friction between the United States and China have been hallmarks of the past 12 months. After experiencing an
uptick in market volatility in late 2018, markets steadied during the first half of 2019, thanks in large measure to the adoption of a dovish policy stance on the part of global central banks, focused on supporting economic growth. The U.S. and China have raised tariffs on each other, heightening tensions and uncertainty. While British Prime Minister Boris Johnson has negotiated a reworked withdrawal agreement with the European Union, Parliament has not yet approved the deal, leading the EU to grant the United Kingdom a Brexit delay until no later than January 31, 2020. The combination of Brexit uncertainty and the deteriorating outlook for global trade has hampered business confidence and investment in the U.K. and Europe.
Markets expect that the longest economic expansion in U.S. history will continue for the time being, albeit at a slower pace. In an effort to prolong the expansion, the U.S. Federal Reserve lowered interest rates for the first time in more than a decade in July and again in September and October. Similarly, the European Central Bank loosened policy in September. While markets have grown more risk averse, the accommodative monetary environment has helped push global interest rates towardrecord-low levels and has been somewhat supportive of risk assets despite the unsettled economic and geopolitical backdrop.
Since launching the first U.S.open-end mutual fund in 1924, MFS® has been committed to a single purpose: to create value by allocating capital responsibly for clients. Through our powerful global investment platform, we combine collective expertise, thoughtful risk management, and long-term discipline to uncover what we believe are the best investment opportunities in the market.
Respectfully,

Robert J. Manning
Executive Chair
MFS Investment Management
November 15, 2019
The opinions expressed in this letter are subject to change and may not be relied upon for investment advice. No forecasts can be guaranteed.
1
PORTFOLIO COMPOSITION
Portfolio structure

| | | | |
| Top ten holdings | | | | |
| OBIC Co. Ltd. | | | 2.8% | |
| Amadeus IT Group S.A. | | | 1.7% | |
| Croda International PLC | | | 1.6% | |
| Symrise AG | | | 1.4% | |
| CTS Eventim AG | | | 1.1% | |
| LEG Immobilien AG | | | 1.1% | |
| Sika AG | | | 1.1% | |
| Dollarama, Inc. | | | 1.1% | |
| Compass Group PLC | | | 1.0% | |
| China Resources Beer Holdings Co. Ltd. | | | 0.9% | |
| |
| GICS equity sectors (g) | | | | |
| Industrials | | | 17.4% | |
| Consumer Discretionary | | | 15.7% | |
| Information Technology | | | 11.5% | |
| Consumer Staples | | | 11.3% | |
| Financials | | | 10.3% | |
| Materials | | | 9.4% | |
| Health Care | | | 6.3% | |
| Communication Services | | | 5.4% | |
| Real Estate | | | 4.2% | |
| Energy | | | 1.3% | |
| Utilities | | | 1.1% | |
| | | | |
| Issuer country weightings (x) | | | | |
| Japan | | | 20.4% | |
| United Kingdom | | | 16.6% | |
| Germany | | | 8.2% | |
| United States | | | 6.4% | |
| Australia | | | 4.1% | |
| India | | | 3.5% | |
| Hong Kong | | | 3.1% | |
| Spain | | | 3.0% | |
| Switzerland | | | 3.0% | |
| Other Countries | | | 31.7% | |
|
| Currency exposure weightings (y) | |
| Japanese Yen | | | 20.4% | |
| Euro | | | 20.1% | |
| British Pound Sterling | | | 17.2% | |
| United States Dollar | | | 7.5% | |
| Hong Kong Dollar | | | 4.5% | |
| Australian Dollar | | | 4.1% | |
| Indian Rupee | | | 3.2% | |
| Swiss Franc | | | 3.0% | |
| Brazilian Real | | | 2.9% | |
| Other Currencies | | | 17.1% | |
2
Portfolio Composition – continued
| (g) | The Global Industry Classification Standard (GICS®) was developed by and/or is the exclusive property of MSCI, Inc. and S&P Global Market Intelligence Inc. (“S&P Global Market Intelligence”). GICS is a service mark of MSCI and S&P Global Market Intelligence and has been licensed for use by MFS. |
| (x) | Represents the portfolio’s exposure to issuer countries as a percentage of a portfolio’s net assets. For purposes of this presentation, United States includes Cash & Cash Equivalents. |
| (y) | Represents the portfolio’s exposure to a particular currency as a percentage of a portfolio’s net assets. For purposes of this presentation, United States Dollar includes Cash & Cash Equivalents. |
Cash & Cash Equivalents includes any cash, investments in money market funds, short-term securities, and other assets less liabilities. Please see the Statement of Assets and Liabilities for additional information related to the fund’s cash position and other assets and liabilities.
Percentages are based on net assets as of September 30, 2019.
The portfolio is actively managed and current holdings may be different.
3
MANAGEMENT REVIEW
Summary of Results
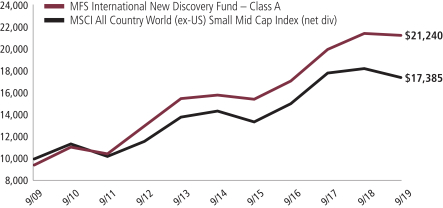
For the twelve months ended September 30, 2019, Class A shares of the MFS International New Discovery Fund (fund) provided a total return of –0.85%, at net asset value. This compares with a return of –4.54% for the fund’s benchmark, the MSCI All Country World(ex-US) Small Mid Cap Index (net div).
Market Environment
Changes in market sentiment, largely driven by uncertainty over the outcome of trade negotiations between the United States and China, contributed to periodic bouts of volatility during the reporting period. The global economy decelerated, led by weakness in China and Europe.
The deteriorating global growth backdrop, along with declining inflationary pressures, prompted the US Federal Reserve to adopt a more dovish posture beginning in early 2019, resulting in the first interest rate cut in over a decade at the end of July, followed by an additional cut in September. The Fed’s actions led to a sharp decline in long-term interest rates during the period’s second half, inverting portions of the US Treasury yield curve. Markets anticipate at least one more rate reduction before the end of 2019.
Globally, central banks have tilted more dovish as well, with the European Central Bank unveiling a package of easing measures including cutting overnight rates deeper into negative territory, restarting its bond-buying program and lengthening the term of cheap loans to banks to three years from two. The central banks of India and Australia are among those that have cut rates several times in recent months, while China has been more circumspect in increasing liquidity as it continues to attempt to deleverage its economy.
Emerging markets experienced considerable volatility through the end of 2018 as tighter global financial conditions exposed structural weakness in some countries. Those conditions improved in 2019 as the Fed became more dovish, but diminished hopes for a trade deal between the US and China weighed on sentiment. Idiosyncratic factors negatively impacted some emerging economies, such as Argentina and Turkey.
From a geopolitical perspective, uncertainty over Brexit remains high. While British Prime Minister Boris Johnson has negotiated a reworked withdrawal agreement with the European Union, Parliament has not yet approved the deal, leading the EU to grant the United Kingdom a Brexit delay until no later than January 31, 2020. The combination of Brexit uncertainty and the deteriorating outlook for global trade has hampered business confidence and investment in the UK and Europe.
Contributors to Performance
Stock selection in theconsumer discretionarysector was a key contributor to the fund’s performance relative to the MSCI All Country World(ex-US) Small Mid Cap Index. Within this sector, overweight positions in bakery chain Greggs PLC (United Kingdom) and food delivery website operator Takeaway.com Holding (Netherlands) bolstered relative returns. The share price of Greggs PLC advanced during the period as the company reported solid sales results, driven by strong demand for its newly launched
4
Management Review – continued
vegan sausage roll. Greggs’ management also reported favorable forward-looking guidance, citing materially higher profits for 2019, which further benefited the stock price. Additionally, holding shares of food catering company Compass Group PLC (United Kingdom) helped relative performance.
Stock selection in thecommunication servicessector also supported relative results. Within this sector, overweight positions in telecommunications services provider Cellnex Telecom S.A. (Spain) and ticketing and live entertainment company CTS Eventim AG (Germany) buoyed relative performance.
Stock selection in thehealth caresector further benefited relative returns. However, there were no individual securities within this sector that were among the fund’s top relative contributors during the reporting period.
Stocks in other sectors that boosted relative performance included the fund’s overweight position in system services provider OBIC (Japan). The share price of OBIC appreciated during the period as the company delivered strong operating profits that were ahead of consensus estimates. OBIC’s revenues were fueled by strong performance in both its cloud computing and system integration and office automation segments. In addition, holding shares of brewing company China Resources Beer Holdings (b) (China), real estate owner and developer Ascendas India Trust (b) (Singapore) and investment management and consulting firm E.Sun Financial Holding (b) (Taiwan) aided relative returns.
The fund’s cash and/or cash equivalents position during the period was also a contributor to relative performance. Under normal market conditions, the fund strives to be fully invested and generally holds cash to buy new holdings and to provide liquidity. In a period when equity markets fell, as measured by the fund’s benchmark, holding cash benefited performance versus the benchmark, which has no cash position.
Detractors from Performance
During the reporting period, the fund’s underweight position in the strong-performingreal estatesector detracted from relative performance. However, there were no individual securities within this sector that were among the fund’s top relative detractors during the reporting period.
Elsewhere, the fund’s positions in tourism and travel IT solutions provider Amadeus IT Group S.A. (b) (Spain), parcel delivery services company Yamato Holdings (b) (Japan) and semiconductor products manufacturer Silicon Motion Technology (b) (Taiwan) negatively impacted relative results. The share price of Amadeus IT Group S.A. depreciated during the period as a result of lower-than-expected revenue and market share losses, notably in Western Europe. Additionally, investor concerns over an uncertain macro environment and low industry bookings growth appeared to have further weighed on the stock price. The share price of Yamato Holdings fell as the company lowered its operating profit guidance due to a disruption in new order intake in its moving business, owing to higher personnel and subcontracting expenses. Later in the period, the company reported weak financial results, driven by an increase in labor and repair costs, which also pressured the stock price. The fund’s overweight positions in power transmission manufacturer LS Industrial Systems (Korea), packaging systems manufacturer Fuji Seal International (Japan), oil and gas company Aker Solutions
5
Management Review – continued
(Norway), retail store operator Dairy Farm International Holdings (Hong Kong) and multinational lubricants and related specialty products manufacturer Fuchs Petrolub SE (Germany) detracted from relative performance. Not holding shares of cloud-basede-commerce platform operator Shopify (Canada) and global financial markets infrastructure business London Stock Exchange Group also held back relative returns.
Respectfully,
Portfolio Manager(s)
David Antonelli, Peter Fruzzetti, Jose Luis Garcia, and Robert Lau
| (b) | Security is not a benchmark constituent. |
Note to Shareholders: Effective April 15, 2021, David Antonelli will no longer be a Portfolio Manager of the Fund.
The views expressed in this report are those of the portfolio manager(s) only through the end of the period of the report as stated on the cover and do not necessarily reflect the views of MFS or any other person in the MFS organization. These views are subject to change at any time based on market or other conditions, and MFS disclaims any responsibility to update such views. These views may not be relied upon as investment advice or an indication of trading intent on behalf of any MFS portfolio. References to specific securities are not recommendations of such securities, and may not be representative of any MFS portfolio’s current or future investments.
6
PERFORMANCE SUMMARYTHROUGH 9/30/19
The following chart illustrates a representative class of the fund’s historical performance in comparison to its benchmark(s). Performance results include the deduction of the maximum applicable sales charge and reflect the percentage change in net asset value, including reinvestment of dividends and capital gains distributions. The performance of other share classes will be greater than or less than that of the class depicted below. Benchmarks are unmanaged and may not be invested in directly. Benchmark returns do not reflect sales charges, commissions or expenses. (See Notes to Performance Summary.)
Performance data shown represents past performance and is no guarantee of future results. Investment return and principal value fluctuate so your shares, when sold, may be worth more or less than the original cost; current performance may be lower or higher than quoted. The performance shown does not reflect the deduction of taxes, if any, that a shareholder would pay on fund distributions or the redemption of fund shares.
Growth of a Hypothetical $10,000 Investment
7
Performance Summary – continued
Total Returns through 9/30/19
Average annual without sales charge
| | | | | | | | | | | | | | |
| | | Share Class | | Class Inception Date | | 1-yr | | 5-yr | | 10-yr | | Life (t) | | |
| | | A | | 10/09/97 | | (0.85)% | | 6.11% | | 8.46% | | N/A | | |
| | | B | | 10/02/00 | | (1.57)% | | 5.32% | | 7.66% | | N/A | | |
| | | C | | 10/02/00 | | (1.60)% | | 5.32% | | 7.66% | | N/A | | |
| | | I | | 10/09/97 | | (0.62)% | | 6.38% | | 8.73% | | N/A | | |
| | | R1 | | 4/01/05 | | (1.61)% | | 5.31% | | 7.65% | | N/A | | |
| | | R2 | | 10/31/03 | | (1.10)% | | 5.84% | | 8.19% | | N/A | | |
| | | R3 | | 4/01/05 | | (0.88)% | | 6.11% | | 8.46% | | N/A | | |
| | | R4 | | 4/01/05 | | (0.61)% | | 6.37% | | 8.73% | | N/A | | |
| | | R6 | | 6/01/12 | | (0.47)% | | 6.51% | | N/A | | 9.14% | | |
| | | 529A | | 7/31/02 | | (0.88)% | | 6.11% | | 8.43% | | N/A | | |
| | | 529B | | 7/31/02 | | (1.55)% | | 5.68% | | 7.81% | | N/A | | |
| | | 529C | | 7/31/02 | | (1.66)% | | 5.28% | | 7.60% | | N/A | | |
| | | | | |
| Comparative benchmark(s) | | | | | | | | | | |
| | | MSCI All Country World(ex-US) Small Mid Cap Index
(net div) (f) | | (4.54)% | | 3.90% | | 5.69% | | N/A | | |
| | | | | |
| Average annual with sales charge | | | | | | | | | | |
| | | A
With Initial Sales Charge (5.75%) | | (6.55)% | | 4.86% | | 7.82% | | N/A | | |
| | | B
With CDSC (Declining over six years from 4% to 0%) (v) | | (5.28)% | | 5.00% | | 7.66% | | N/A | | |
| | | C
With CDSC (1% for 12 months) (v) | | (2.53)% | | 5.32% | | 7.66% | | N/A | | |
| | | 529A
With Initial Sales Charge (5.75%) | | (6.58)% | | 4.86% | | 7.79% | | N/A | | |
| | | 529B
With CDSC (Declining over six years from 4% to 0%) (v) | | (5.23)% | | 5.36% | | 7.81% | | N/A | | |
| | | 529C
With CDSC (1% for 12 months) (v) | | (2.58)% | | 5.28% | | 7.60% | | N/A | | |
CDSC – Contingent Deferred Sales Charge.
Class I, R1, R2, R3, R4, and R6 shares do not have a sales charge.
| (f) | Source: FactSet Research Systems Inc. |
| (t) | For the period from the class inception date through the stated period end (for those share classes with less than 10 years of performance history). No comparative benchmark performance information is provided for “life” periods. (See Notes to Performance Summary.) |
| (v) | Assuming redemption at the end of the applicable period. |
8
Performance Summary – continued
Benchmark Definition(s)
MSCI All Country World (ex-US) Small Mid Cap Index (net div) – a free float weighted index that is designed to measure equity market performance of small and mid cap companies across global developed and emerging market countries, excluding the United States.
It is not possible to invest directly in an index.
Notes to Performance Summary
Class 529 shares are only available in conjunction with qualified tuition programs, such as the MFS 529 Savings Plan. There also is an additional fee, which is detailed in the program description, on qualified tuition programs. If this fee was reflected, the performance for Class 529 shares would have been lower. This annual fee is waived for Oregon residents and for those accounts with assets of $25,000 or more.
Average annual total return represents the average annual change in value for each share class for the periods presented. Life returns are presented where the share class has less than 10 years of performance history and represent the average annual total return from the class inception date to the stated period end date. As the fund’s share classes may have different inception dates, the life returns may represent different time periods and may not be comparable. As a result, no comparative benchmark performance information is provided for life periods.
Performance results reflect any applicable expense subsidies and waivers in effect during the periods shown. Without such subsidies and waivers the fund’s performance results would be less favorable. Please see the prospectus and financial statements for complete details.
Performance results do not include adjustments made for financial reporting purposes in accordance with U.S. generally accepted accounting principles and may differ from amounts reported in the financial highlights.
From time to time the fund may receive proceeds from litigation settlements, without which performance would be lower.
9
EXPENSE TABLE
Fund expenses borne by the shareholders during the period, April 1, 2019 through September 30, 2019
As a shareholder of the fund, you incur two types of costs: (1) transaction costs, including sales charges (loads) on certain purchase or redemption payments, and (2) ongoing costs, including management fees; distribution and service(12b-1) fees; and other fund expenses. This example is intended to help you understand your ongoing costs (in dollars) of investing in the fund and to compare these costs with the ongoing costs of investing in other mutual funds.
The example is based on an investment of $1,000 invested at the beginning of the period and held for the entire period April 1, 2019 through September 30, 2019.
Actual Expenses
The first line for each share class in the following table provides information about actual account values and actual expenses. You may use the information in this line, together with the amount you invested, to estimate the expenses that you paid over the period. Simply divide your account value by $1,000 (for example, an $8,600 account value divided by $1,000 = 8.6), then multiply the result by the number in the first line under the heading entitled “Expenses Paid During Period” to estimate the expenses you paid on your account during this period.
Hypothetical Example for Comparison Purposes
The second line for each share class in the following table provides information about hypothetical account values and hypothetical expenses based on the fund’s actual expense ratio and an assumed rate of return of 5% per year before expenses, which is not the fund’s actual return. The hypothetical account values and expenses may not be used to estimate the actual ending account balance or expenses you paid for the period. You may use this information to compare the ongoing costs of investing in the fund and other funds. To do so, compare this 5% hypothetical example with the 5% hypothetical examples that appear in the shareholder reports of the other funds.
Please note that the expenses shown in the table are meant to highlight your ongoing costs only and do not reflect any transactional costs, such as sales charges (loads). Therefore, the second line for each share class in the table is useful in comparing ongoing costs only, and will not help you determine the relative total costs of owning different funds. In addition, if these transactional costs were included, your costs would have been higher.
10
Expense Table – continued
| | | | | | | | | | | | | | | | | | |
Share
Class | | | | Annualized
Expense
Ratio | | | Beginning
Account Value
4/01/19 | | | Ending
Account Value
9/30/19 | | | Expenses
Paid During
Period (p)
4/01/19-9/30/19 | |
| A | | Actual | | | 1.27% | | | | $1,000.00 | | | | $1,013.38 | | | | $6.41 | |
| | Hypothetical (h) | | | 1.27% | | | | $1,000.00 | | | | $1,018.70 | | | | $6.43 | |
| B | | Actual | | | 2.02% | | | | $1,000.00 | | | | $1,009.64 | | | | $10.18 | |
| | Hypothetical (h) | | | 2.02% | | | | $1,000.00 | | | | $1,014.94 | | | | $10.20 | |
| C | | Actual | | | 2.02% | | | | $1,000.00 | | | | $1,009.51 | | | | $10.18 | |
| | Hypothetical (h) | | | 2.02% | | | | $1,000.00 | | | | $1,014.94 | | | | $10.20 | |
| I | | Actual | | | 1.02% | | | | $1,000.00 | | | | $1,014.50 | | | | $5.15 | |
| | Hypothetical (h) | | | 1.02% | | | | $1,000.00 | | | | $1,019.95 | | | | $5.16 | |
| R1 | | Actual | | | 2.02% | | | | $1,000.00 | | | | $1,009.42 | | | | $10.18 | |
| | Hypothetical (h) | | | 2.02% | | | | $1,000.00 | | | | $1,014.94 | | | | $10.20 | |
| R2 | | Actual | | | 1.52% | | | | $1,000.00 | | | | $1,011.84 | | | | $7.67 | |
| | Hypothetical (h) | | | 1.52% | | | | $1,000.00 | | | | $1,017.45 | | | | $7.69 | |
| R3 | | Actual | | | 1.27% | | | | $1,000.00 | | | | $1,013.20 | | | | $6.41 | |
| | Hypothetical (h) | | | 1.27% | | | | $1,000.00 | | | | $1,018.70 | | | | $6.43 | |
| R4 | | Actual | | | 1.02% | | | | $1,000.00 | | | | $1,014.34 | | | | $5.15 | |
| | Hypothetical (h) | | | 1.02% | | | | $1,000.00 | | | | $1,019.95 | | | | $5.16 | |
| R6 | | Actual | | | 0.91% | | | | $1,000.00 | | | | $1,015.09 | | | | $4.60 | |
| | Hypothetical (h) | | | 0.91% | | | | $1,000.00 | | | | $1,020.51 | | | | $4.61 | |
| 529A | | Actual | | | 1.27% | | | | $1,000.00 | | | | $1,012.99 | | | | $6.41 | |
| | Hypothetical (h) | | | 1.27% | | | | $1,000.00 | | | | $1,018.70 | | | | $6.43 | |
| 529B | | Actual | | | 1.82% | | | | $1,000.00 | | | | $1,010.40 | | | | $9.17 | |
| | Hypothetical (h) | | | 1.82% | | | | $1,000.00 | | | | $1,015.94 | | | | $9.20 | |
| 529C | | Actual | | | 2.06% | | | | $1,000.00 | | | | $1,009.17 | | | | $10.38 | |
| | Hypothetical (h) | | | 2.06% | | | | $1,000.00 | | | | $1,014.74 | | | | $10.40 | |
| (h) | 5% class return per year before expenses. |
| (p) | “Expenses Paid During Period” are equal to each class’s annualized expense ratio, as shown above, multiplied by the average account value over the period, multiplied by 183/365 (to reflect theone-half year period). Expenses paid do not include any applicable sales charges (loads). If these transaction costs had been included, your costs would have been higher. |
Notes to Expense Table
For the period from April 1, 2019 through May 31, 2019, the distribution fee for Class 529B was not imposed. Had the distribution fee been imposed throughout the entire six month period, the annualized expense ratio, the actual expenses paid during the period, and the hypothetical expenses paid during the period would have been approximately 2.07%, $10.43, and $10.45 for Class 529B. See Note 3 in the Notes to Financial Statements for additional information.
11
Expense Table – continued
Each class with a Rule12b-1 service fee is subject to a rebate of a portion of such fee. Such rebates are included in the expense ratios above. For Class 529A shares this rebate reduced the expense ratios above by 0.04%. See Note 3 in the Notes to Financial Statements for additional information.
12
PORTFOLIO OF INVESTMENTS
9/30/19
The Portfolio of Investments is a complete list of all securities owned by your fund. It is categorized
by broad-based asset classes.
| | | | | | | | |
| Common Stocks - 92.8% | | | | | | | | |
| | |
| Issuer | | Shares/Par | | | Value ($) | |
| Aerospace - 1.8% | | | | | | | | |
| Cobham PLC (a) | | | 5,481,438 | | | $ | 10,571,222 | |
| Embraer S.A., ADR | | | 302,583 | | | | 5,219,557 | |
| LISI Group | | | 633,663 | | | | 17,542,789 | |
| Meggitt PLC | | | 1,647,534 | | | | 12,863,356 | |
| MTU Aero Engines AG | | | 155,880 | | | | 41,421,962 | |
| Saab AB, “B” | | | 249,300 | | | | 7,156,829 | |
| Singapore Technologies Engineering Ltd. | | | 12,378,800 | | | | 34,391,775 | |
| | | | | | | | |
| | | | | | | $ | 129,167,490 | |
| Airlines - 1.0% | | | | | | | | |
| Aena S.A. | | | 65,330 | | | $ | 11,962,681 | |
| Enav S.p.A. | | | 4,352,531 | | | | 24,574,133 | |
| Grupo Aeroportuario del Pacifico S.A.B. de C.V. | | | 455,859 | | | | 4,386,724 | |
| Grupo Aeroportuario del Sureste S.A.B. de C.V., ADR | | | 49,704 | | | | 7,579,860 | |
| Ryanair Holdings PLC, ADR (a) | | | 229,457 | | | | 15,231,356 | |
| Stagecoach Group PLC | | | 2,617,086 | | | | 4,302,249 | |
| | | | | | | | |
| | | | | | | $ | 68,037,003 | |
| Alcoholic Beverages - 1.7% | | | | | | | | |
| Carlsberg Group | | | 147,199 | | | $ | 21,757,675 | |
| China Resources Beer Holdings Co. Ltd. | | | 12,158,000 | | | | 64,691,040 | |
| Compania Cervecerias Unidas S.A., ADR | | | 524,105 | | | | 11,629,890 | |
| Davide Campari-Milano S.p.A. | | | 2,119,141 | | | | 19,147,892 | |
| | | | | | | | |
| | | | | | | $ | 117,226,497 | |
| Apparel Manufacturers - 0.9% | | | | | | | | |
| Burberry Group PLC | | | 638,505 | | | $ | 17,067,505 | |
| Coats Group PLC | | | 13,218,548 | | | | 12,084,005 | |
| Pacific Textiles Holdings Ltd. | | | 38,809,000 | | | | 26,140,674 | |
| Stella International Holdings Ltd. | | | 5,141,591 | | | | 8,003,293 | |
| | | | | | | | |
| | | | | | | $ | 63,295,477 | |
| Automotive - 3.0% | | | | | | | | |
| ARB Corp. | | | 903,937 | | | $ | 11,665,816 | |
| Autoliv, Inc., SDR | | | 80,720 | | | | 6,289,306 | |
| Cie Plastic Omnium S.A. | | | 518,046 | | | | 14,206,449 | |
| Daikyonishikawa Corp. | | | 332,421 | | | | 2,458,823 | |
| Hella KGaA Hueck & Co. | | | 528,956 | | | | 23,649,490 | |
| Hero MotoCorp Ltd. | | | 446,205 | | | | 17,029,680 | |
| Koito Manufacturing Co. Ltd. | | | 645,800 | | | | 31,839,825 | |
13
Portfolio of Investments – continued
| | | | | | | | |
| | |
| Issuer | | Shares/Par | | | Value ($) | |
| Common Stocks - continued | | | | | | | | |
| Automotive - continued | | | | | | | | |
| Mahindra & Mahindra Ltd. | | | 1,458,920 | | | $ | 11,263,745 | |
| NGK Spark Plug Co. Ltd | | | 837,800 | | | | 16,078,706 | |
| Shimano, Inc. | | | 35,100 | | | | 5,309,109 | |
| Stanley Electric Co. Ltd. | | | 871,131 | | | | 23,216,918 | |
| USS Co. Ltd. | | | 2,280,200 | | | | 44,473,000 | |
| | | | | | | | |
| | | | | | | $ | 207,480,867 | |
| Biotechnology - 0.3% | | | | | | | | |
| Abcam PLC | | | 550,379 | | | $ | 7,748,426 | |
| Lonza Group AG | | | 29,817 | | | | 10,079,912 | |
| | | | | | | | |
| | | | | | | $ | 17,828,338 | |
| Broadcasting - 0.3% | | | | | | | | |
| Nippon Television Holdings, Inc. | | | 610,800 | | | $ | 7,868,238 | |
| Proto Corp. | | | 1,137,400 | | | | 12,328,627 | |
| | | | | | | | |
| | | | | | | $ | 20,196,865 | |
| Brokerage & Asset Managers - 2.7% | | | | | | | | |
| ASX Ltd. | | | 272,411 | | | $ | 14,929,121 | |
| Daiwa Securities Group, Inc. | | | 2,388,000 | | | | 10,695,988 | |
| Euronext N.V. | | | 136,239 | | | | 11,144,452 | |
| Hargreaves Lansdown PLC | | | 855,872 | | | | 21,878,094 | |
| IG Group Holdings PLC | | | 1,379,925 | | | | 10,224,234 | |
| Japan Exchange Group, Inc. | | | 145,300 | | | | 2,299,133 | |
| Rathbone Brothers PLC | | | 944,140 | | | | 25,771,254 | |
| Schroders PLC | | | 1,228,191 | | | | 46,436,257 | |
| TMX Group Ltd. | | | 493,260 | | | | 42,570,365 | |
| | | | | | | | |
| | | | | | | $ | 185,948,898 | |
| Business Services - 7.5% | | | | | | | | |
| Aeon Delight Co. Ltd. | | | 295,700 | | | $ | 9,270,964 | |
| Amadeus Fire AG | | | 183,730 | | | | 20,306,010 | |
| AS ONE Corp. | | | 163,600 | | | | 13,541,919 | |
| Ashtead Group PLC | | | 521,672 | | | | 14,521,789 | |
| Auto Trader Group PLC | | | 5,377,355 | | | | 33,719,806 | |
| Babcock International Group PLC | | | 1,548,854 | | | | 10,626,515 | |
| Bapcor Ltd. | | | 1,942,581 | | | | 9,650,027 | |
| Brenntag AG | | | 445,101 | | | | 21,540,120 | |
| Bunzl PLC | | | 1,143,030 | | | | 29,865,015 | |
| Cerved Information Solutions S.p.A. | | | 5,092,614 | | | | 44,405,557 | |
| Compass Group PLC | | | 2,792,166 | | | | 71,854,942 | |
| DKSH Holding Ltd. | | | 50,944 | | | | 2,542,989 | |
| Doshisha Co. Ltd. | | | 141,800 | | | | 2,246,079 | |
| Edenred | | | 202,894 | | | | 9,736,984 | |
14
Portfolio of Investments – continued
| | | | | | | | |
| | |
| Issuer | | Shares/Par | | | Value ($) | |
| Common Stocks - continued | | | | | | | | |
| Business Services - continued | | | | | | | | |
| Electrocomponents PLC | | | 2,616,212 | | | $ | 20,709,522 | |
| Elior Group | | | 766,815 | | | | 10,188,280 | |
| Intertek Group PLC | | | 700,519 | | | | 47,183,280 | |
| IPH Ltd. | | | 6,860,020 | | | | 40,396,777 | |
| Meitec Corp. | | | 371,900 | | | | 18,287,440 | |
| Midland IC&I Ltd. (a) | | | 21,556,500 | | | | 330,043 | |
| Nomura Research Institute Ltd. | | | 2,692,500 | | | | 53,760,798 | |
| SAN-AI OIL Co. Ltd. | | | 479,300 | | | | 4,747,822 | |
| Sodexo | | | 218,000 | | | | 24,473,737 | |
| Sohgo Security Services Co. Ltd. | | | 204,800 | | | | 10,773,192 | |
| | | | | | | | |
| | | | | | | $ | 524,679,607 | |
| Cable TV - 0.2% | | | | | | | | |
| NOS, SGPS S.A. | | | 2,937,264 | | | $ | 16,039,369 | |
| | |
| Chemicals - 0.2% | | | | | | | | |
| Orica Ltd. | | | 1,096,864 | | | $ | 16,687,000 | |
| | |
| Computer Software - 3.7% | | | | | | | | |
| Fuji Soft, Inc. | | | 129,900 | | | $ | 5,515,736 | |
| OBIC Business Consultants Co. Ltd. | | | 365,800 | | | | 14,904,483 | |
| OBIC Co. Ltd. | | | 1,687,700 | | | | 193,142,713 | |
| Oracle Corp. | | | 99,800 | | | | 8,700,430 | |
| SCSK Corp. | | | 267,000 | | | | 12,586,381 | |
| Wisetech Global Ltd. | | | 1,128,543 | | | | 26,454,190 | |
| | | | | | | | |
| | | | | | | $ | 261,303,933 | |
| Computer Software - Systems - 3.3% | | | | | | | | |
| Amadeus IT Group S.A. | | | 1,659,120 | | | $ | 118,845,276 | |
| Comture Corp. | | | 667,200 | | | | 12,628,965 | |
| EMIS Group PLC | | | 543,548 | | | | 6,790,125 | |
| Globant S.A. (a) | | | 48,985 | | | | 4,486,046 | |
| Linx S.A. | | | 2,347,200 | | | | 18,269,401 | |
| NS Solutions Corp. | | | 723,500 | | | | 23,729,048 | |
| Temenos AG | | | 104,582 | | | | 17,499,318 | |
| Venture Corp. Ltd. | | | 2,727,700 | | | | 30,214,584 | |
| | | | | | | | |
| | | | | | | $ | 232,462,763 | |
| Conglomerates - 0.9% | | | | | | | | |
| Ansell Ltd. | | | 1,332,982 | | | $ | 24,697,909 | |
| DCC PLC | | | 409,413 | | | | 35,720,820 | |
| | | | | | | | |
| | | | | | | $ | 60,418,729 | |
15
Portfolio of Investments – continued
| | | | | | | | |
| | |
| Issuer | | Shares/Par | | | Value ($) | |
| Common Stocks - continued | | | | | | | | |
| Construction - 2.4% | | | | | | | | |
| Bellway PLC | | | 438,705 | | | $ | 18,048,649 | |
| CEMEX Latam Holdings S.A. (a) | | | 1,901,177 | | | | 2,368,276 | |
| Cyrela Brazil Realty S.A. Empreendimentos e Participacoes | | | 1,487,700 | | | | 8,611,219 | |
| Forterra PLC | | | 1,273,052 | | | | 4,453,225 | |
| Geberit AG | | | 36,594 | | | | 17,474,776 | |
| Ibstock PLC | | | 3,340,097 | | | | 9,700,300 | |
| PT Indocement Tunggal Prakarsa Tbk | | | 20,153,800 | | | | 26,667,746 | |
| Reliance Worldwide Corp. (l) | | | 9,939,050 | | | | 27,034,697 | |
| Rinnai Corp. | | | 89,900 | | | | 6,074,537 | |
| Somfy S.A. | | | 64,885 | | | | 5,869,877 | |
| Techtronic Industries Co. Ltd. | | | 4,956,000 | | | | 34,780,946 | |
| Toto Ltd. | | | 145,700 | | | | 5,491,772 | |
| | | | | | | | |
| | | | | | | $ | 166,576,020 | |
| Consumer Products - 2.5% | | | | | | | | |
| Beiersdorf AG | | | 195,187 | | | $ | 23,018,908 | |
| Dabur India Ltd. | | | 3,441,839 | | | | 21,736,831 | |
| Essity AB | | | 1,162,842 | | | | 33,937,709 | |
| Kobayashi Pharmaceutical Co. Ltd. | | | 273,600 | | | | 20,913,223 | |
| Lion Corp. | | | 1,082,500 | | | | 21,334,636 | |
| Milbon Co. Ltd. | | | 220,292 | | | | 10,900,300 | |
| Mitsubishi Pencil Co. Ltd. | | | 231,500 | | | | 3,690,008 | |
| PZ Cussons | | | 404,893 | | | | 1,008,118 | |
| Uni-Charm Corp. | | | 1,169,800 | | | | 37,077,619 | |
| | | | | | | | |
| | | | | | | $ | 173,617,352 | |
| Consumer Services - 2.1% | | | | | | | | |
| 51job, Inc., ADR (a) | | | 436,169 | | | $ | 32,276,506 | |
| Anima Holdings S.A. | | | 2,733,658 | | | | 13,599,372 | |
| Asante, Inc. | | | 170,200 | | | | 3,102,559 | |
| Heian Ceremony Service Co. | | | 363,967 | | | | 2,843,771 | |
| Kakaku.com, Inc. | | | 289,200 | | | | 7,149,636 | |
| Kroton Educacional S.A. | | | 2,301,416 | | | | 6,192,573 | |
| Localiza Rent a Car S.A. | | | 1,287,984 | | | | 14,092,048 | |
| MakeMyTrip Ltd. (a) | | | 1,069,505 | | | | 24,267,068 | |
| Moneysupermarket.com Group PLC | | | 6,696,787 | | | | 31,157,585 | |
| Park24 Co. Ltd. | | | 358,200 | | | | 8,308,584 | |
| Rakuten | | | 119,300 | | | | 1,175,071 | |
| Webjet Ltd. (l) | | | 805,386 | | | | 5,930,624 | |
| | | | | | | | |
| | | | | | | $ | 150,095,397 | |
| Containers - 1.4% | | | | | | | | |
| Fuji Seal International, Inc. | | | 1,662,300 | | | $ | 41,955,299 | |
| Gerresheimer AG | | | 213,917 | | | | 15,341,851 | |
16
Portfolio of Investments – continued
| | | | | | | | |
| | |
| Issuer | | Shares/Par | | | Value ($) | |
| Common Stocks - continued | | | | | | | | |
| Containers - continued | | | | | | | | |
| Lock & Lock Co. Ltd. | | | 506,486 | | | $ | 5,245,452 | |
| Mayr-Melnhof Karton AG | | | 148,502 | | | | 17,869,317 | |
| Viscofan S.A. | | | 359,298 | | | | 16,839,525 | |
| | | | | | | | |
| | | | | | | $ | 97,251,444 | |
| Electrical Equipment - 2.6% | | | | | | | | |
| Advantech Co. Ltd. | | | 2,011,748 | | | $ | 17,752,522 | |
| Bharat Heavy Electricals Ltd. | | | 14,453,222 | | | | 9,870,859 | |
| Cembre S.p.A. | | | 542,886 | | | | 12,633,192 | |
| IMI PLC | | | 973,218 | | | | 11,489,947 | |
| Legrand S.A. | | | 586,196 | | | | 41,836,764 | |
| LS Industrial Systems Co. Ltd. | | | 663,084 | | | | 26,763,843 | |
| OMRON Corp. | | | 208,121 | | | | 11,485,123 | |
| Spectris PLC | | | 339,818 | | | | 10,211,599 | |
| Voltronic Power Technology Corp. | | | 1,816,612 | | | | 37,474,631 | |
| | | | | | | | |
| | | | | | | $ | 179,518,480 | |
| Electronics - 2.4% | | | | | | | | |
| Amano Corp. | | | 246,720 | | | $ | 7,557,033 | |
| ASM International N.V. | | | 295,075 | | | | 27,170,204 | |
| ASM Pacific Technology Ltd. | | | 1,578,700 | | | | 19,393,909 | |
| Halma PLC | | | 1,141,329 | | | | 27,659,457 | |
| Hirose Electric Co. Ltd. | | | 87,800 | | | | 10,831,917 | |
| Infineon Technologies AG | | | 554,339 | | | | 9,976,580 | |
| Iriso Electronics Co. Ltd. | | | 218,500 | | | | 10,549,211 | |
| JEOL Ltd. | | | 504,000 | | | | 12,052,234 | |
| Kardex AG | | | 86,904 | | | | 11,998,769 | |
| Silicon Motion Technology Corp., ADR | | | 629,098 | | | | 22,238,614 | |
| Tripod Technology Corp. | | | 2,467,000 | | | | 8,866,235 | |
| Zuken, Inc. | | | 2,300 | | | | 39,565 | |
| | | | | | | | |
| | | | | | | $ | 168,333,728 | |
| Energy - Independent - 0.3% | | | | | | | | |
| Caltex Australia Ltd. | | | 455,134 | | | $ | 8,116,966 | |
| Gran Tierra Energy, Inc. (a) | | | 2,492,939 | | | | 3,085,949 | |
| Seven Generations Energy Ltd. (a) | | | 713,338 | | | | 4,533,574 | |
| TORC Oil & Gas Ltd. (l) | | | 771,099 | | | | 2,229,165 | |
| | | | | | | | |
| | | | | | | $ | 17,965,654 | |
| Energy - Integrated - 0.2% | | | | | | | | |
| Cairn Energy PLC (a) | | | 2,679,393 | | | $ | 6,322,045 | |
| Galp Energia SGPS S.A. | | | 438,166 | | | | 6,602,530 | |
| | | | | | | | |
| | | | | | | $ | 12,924,575 | |
17
Portfolio of Investments – continued
| | | | | | | | |
| | |
| Issuer | | Shares/Par | | | Value ($) | |
| Common Stocks - continued | | | | | | | | |
| Engineering - Construction - 0.1% | | | | | | | | |
| JGC Corp. | | | 257,000 | | | $ | 3,388,797 | |
| Toshiba Plant Kensetsu Co. Ltd. | | | 291,000 | | | | 4,870,736 | |
| | | | | | | | |
| | | | | | | $ | 8,259,533 | |
| Entertainment - 1.7% | | | | | | | | |
| CTS Eventim AG | | | 1,404,103 | | | $ | 79,121,786 | |
| Merlin Entertainments PLC (a) | | | 3,404,264 | | | | 18,936,164 | |
| PVR Ltd. | | | 911,419 | | | | 23,704,754 | |
| | | | | | | | |
| | | | | | | $ | 121,762,704 | |
| Food & Beverages - 4.8% | | | | | | | | |
| Arca Continental S.A.B. de C.V. | | | 1,893,799 | | | $ | 10,236,725 | |
| ARIAKE JAPAN Co. Ltd. | | | 143,600 | | | | 11,182,539 | |
| AVI Ltd. | | | 4,871,301 | | | | 26,461,666 | |
| BRF S.A. (a) | | | 759,900 | | | | 6,986,409 | |
| Britvic PLC | | | 728,348 | | | | 8,807,638 | |
| Coca-Cola HBC AG | | | 320,235 | | | | 10,461,803 | |
| Ezaki Glico Co. Ltd. | | | 454,000 | | | | 18,866,014 | |
| Greencore Group PLC | | | 1,315,340 | | | | 3,655,044 | |
| Grupo Lala S.A.B. de C.V. (l) | | | 5,125,977 | | | | 5,878,223 | |
| Kerry Group PLC | | | 229,702 | | | | 26,864,024 | |
| Kikkoman Corp. | | | 264,600 | | | | 12,702,960 | |
| Morinaga & Co. Ltd. | | | 442,000 | | | | 21,461,272 | |
| Mowi A.S.A. | | | 488,346 | | | | 11,267,066 | |
| Orion Corp./Republic of Korea | | | 403,852 | | | | 33,222,453 | |
| P/f Bakkafrost | | | 811,217 | | | | 47,883,083 | |
| Ridley Corp. NPV | | | 11,316,502 | | | | 7,599,882 | |
| S Foods, Inc. | | | 557,300 | | | | 15,434,160 | |
| Shenguan Holdings Group Ltd. | | | 13,203,505 | | | | 496,961 | |
| Tata Global Beverages Ltd. | | | 6,500,523 | | | | 25,316,421 | |
| Tate & Lyle PLC | | | 488,682 | | | | 4,422,322 | |
| Tingyi (Cayman Islands) Holdings Corp. | | | 19,414,000 | | | | 27,425,571 | |
| | | | | | | | |
| | | | | | | $ | 336,632,236 | |
| Food & Drug Stores - 1.1% | | | | | | | | |
| Cosmos Pharmaceutical Corp. | | | 56,200 | | | $ | 10,993,110 | |
| Dairy Farm International Holdings Ltd. | | | 5,301,209 | | | | 33,397,617 | |
| Japan Meat Co. Ltd. | | | 253,700 | | | | 5,302,551 | |
| Matsumotokiyoshi Holdings Co. Ltd. | | | 90,800 | | | | 3,340,001 | |
| San-A Co. Ltd. | | | 87,700 | | | | 3,879,883 | |
| Spencer’s Retail Ltd. (a) | | | 723,473 | | | | 750,844 | |
| Sundrug Co. Ltd. | | | 560,200 | | | | 17,615,537 | |
| | | | | | | | |
| | | | | | | $ | 75,279,543 | |
18
Portfolio of Investments – continued
| | | | | | | | |
| | |
| Issuer | | Shares/Par | | | Value ($) | |
| Common Stocks - continued | | | | | | | | |
| Forest & Paper Products - 0.2% | | | | | | | | |
| Suzano S.A. | | | 1,375,800 | | | $ | 11,142,293 | |
| | |
| Furniture & Appliances - 0.5% | | | | | | | | |
| SEB S.A. | | | 179,882 | | | $ | 27,311,490 | |
| Zojirushi Corp. (l) | | | 751,300 | | | | 9,969,502 | |
| | | | | | | | |
| | | | | | | $ | 37,280,992 | |
| Gaming & Lodging - 1.5% | | | | | | | | |
| Dalata Hotel Group PLC | | | 2,408,975 | | | $ | 12,865,745 | |
| Flutter Entertainment PLC | | | 495,580 | | | | 46,370,802 | |
| Genting Berhad | | | 13,067,100 | | | | 17,937,517 | |
| Shangri-La Asia Ltd. | | | 22,020,000 | | | | 22,514,236 | |
| Tabcorp Holdings Ltd. | | | 2,451,737 | | | | 8,025,779 | |
| | | | | | | | |
| | | | | | | $ | 107,714,079 | |
| General Merchandise - 1.9% | | | | | | | | |
| B&M European Value Retail S.A. | | | 3,400,790 | | | $ | 15,864,388 | |
| Dollarama, Inc. | | | 2,072,885 | | | | 74,209,862 | |
| Lojas Renner S.A. | | | 1,412,510 | | | | 17,157,699 | |
| Magazine Luiza S.A. | | | 942,400 | | | | 8,401,183 | |
| Seria Co. Ltd. | | | 609,100 | | | | 14,847,619 | |
| | | | | | | | |
| | | | | | | $ | 130,480,751 | |
| Health Maintenance Organizations - 0.2% | | | | | | | | |
| Notre Dame Intermedica Participacoes S.A. | | | 924,208 | | | $ | 12,067,121 | |
| | |
| Insurance - 2.2% | | | | | | | | |
| Admiral Group PLC | | | 354,924 | | | $ | 9,242,884 | |
| AUB Group Ltd. | | | 2,784,190 | | | | 21,948,927 | |
| Hiscox Ltd. | | | 2,884,362 | | | | 58,871,355 | |
| Samsung Fire & Marine Insurance Co. Ltd. | | | 168,976 | | | | 31,447,976 | |
| Sony Financial Holdings, Inc. | | | 876,900 | | | | 19,099,437 | |
| Steadfast Group Ltd. | | | 5,674,742 | | | | 13,597,092 | |
| | | | | | | | |
| | | | | | | $ | 154,207,671 | |
| Internet - 1.5% | | | | | | | | |
| PChome Online, Inc. (a) | | | 4,918,504 | | | $ | 20,530,428 | |
| Rightmove PLC | | | 8,150,419 | | | | 55,177,538 | |
| Scout24 AG | | | 516,319 | | | | 29,432,447 | |
| | | | | | | | |
| | | | | | | $ | 105,140,413 | |
| Leisure & Toys - 0.1% | | | | | | | | |
| Thule Group AB | | | 569,392 | | | $ | 10,781,606 | |
19
Portfolio of Investments – continued
| | | | | | | | |
| | |
| Issuer | | Shares/Par | | | Value ($) | |
| Common Stocks - continued | | | | | | | | |
| Machinery & Tools - 4.3% | | | | | | | | |
| Aalberts N.V. | | | 567,882 | | | $ | 22,505,494 | |
| Doosan Bobcat, Inc. | | | 1,102,777 | | | | 32,702,916 | |
| Fujitsu General Ltd. | | | 524,400 | | | | 8,766,865 | |
| GEA Group AG | | | 1,757,939 | | | | 47,460,945 | |
| Haitian International Holdings Ltd. | | | 16,517,000 | | | | 33,714,399 | |
| MISUMI Group, Inc. | | | 225,900 | | | | 5,366,524 | |
| MonotaRO Co. Ltd. | | | 581,000 | | | | 15,312,267 | |
| Nabtesco Corp. | | | 482,500 | | | | 15,083,687 | |
| Nissei ASB Machine Co. Ltd. (l) | | | 233,300 | | | | 7,377,679 | |
| NOHMI BOSAI Ltd. | | | 294,400 | | | | 5,656,932 | |
| Obara Group, Inc. | | | 128,500 | | | | 4,369,508 | |
| PT United Tractors Tbk | | | 21,209,700 | | | | 30,742,485 | |
| Rotork PLC | | | 1,912,024 | | | | 7,323,144 | |
| Shima Seiki Manufacturing Ltd. | | | 191,900 | | | | 4,434,772 | |
| Spirax-Sarco Engineering PLC | | | 250,662 | | | | 24,178,404 | |
| T.K. Corp. | | | 828,332 | | | | 7,270,586 | |
| THK Co. Ltd. | | | 230,800 | | | | 6,118,995 | |
| VAT Group AG | | | 83,494 | | | | 10,528,250 | |
| Weir Group PLC | | | 645,392 | | | | 11,311,937 | |
| | | | | | | | |
| | | | | | | $ | 300,225,789 | |
| Major Banks - 0.1% | | | | | | | | |
| Bank of Ireland | | | 1,062,471 | | | $ | 4,215,266 | |
| | |
| Medical & Health Technology & Services - 0.8% | | | | | | | | |
| Fleury S.A. | | | 1,273,961 | | | $ | 8,100,711 | |
| Hogy Medical Co. Ltd. | | | 79,600 | | | | 2,285,403 | |
| Instituto Hermes Pardini S.A. | | | 760,100 | | | | 4,372,228 | |
| Miraca Holdings, Inc. | | | 99,000 | | | | 2,267,094 | |
| Ramsay Health Care Ltd. | | | 357,306 | | | | 15,644,288 | |
| Selcuk Ecza Deposu Ticaret ve Sanayi A.S. | | | 1,645,416 | | | | 1,474,377 | |
| Sonic Healthcare Ltd. | | | 1,262,430 | | | | 23,958,745 | |
| | | | | | | | |
| | | | | | | $ | 58,102,846 | |
| Medical Equipment - 2.6% | | | | | | | | |
| Demant A/S (a) | | | 301,880 | | | $ | 7,732,151 | |
| EIKEN CHEMICAL Co. Ltd. | | | 584,200 | | | | 8,872,712 | |
| Nakanishi, Inc. | | | 1,674,900 | | | | 26,466,264 | |
| Nihon Kohden Corp. | | | 521,600 | | | | 15,316,347 | |
| Sagami Rubber Industries Co. Ltd. (l) | | | 264,700 | | | | 3,738,237 | |
| Shimadzu Corp. | | | 624,700 | | | | 15,877,503 | |
| Smith & Nephew PLC | | | 1,994,014 | | | | 48,029,583 | |
| Sonova Holding AG | | | 134,496 | | | | 31,264,037 | |
20
Portfolio of Investments – continued
| | | | | | | | |
| | |
| Issuer | | Shares/Par | | | Value ($) | |
| Common Stocks - continued | | | | | | | | |
| Medical Equipment - continued | | | | | | | | |
| Terumo Corp. | | | 733,200 | | | $ | 23,598,021 | |
| | | | | | | | |
| | | | | | | $ | 180,894,855 | |
| Metals & Mining - 0.3% | | | | | | | | |
| Iluka Resources Ltd. | | | 2,098,560 | | | $ | 11,377,902 | |
| MOIL Ltd. | | | 6,090,545 | | | | 11,769,406 | |
| | | | | | | | |
| | | | | | | $ | 23,147,308 | |
| Natural Gas - Distribution - 0.4% | | | | | | | | |
| Italgas S.p.A. | | | 4,294,940 | | | $ | 27,722,480 | |
| | |
| Network & Telecom - 0.5% | | | | | | | | |
| VTech Holdings Ltd. | | | 3,825,465 | | | $ | 33,463,638 | |
| | |
| Oil Services - 0.3% | | | | | | | | |
| Aker Solutions ASA (a) | | | 3,679,848 | | | $ | 9,942,201 | |
| TechnipFMC PLC | | | 502,950 | | | | 12,065,669 | |
| | | | | | | | |
| | | | | | | $ | 22,007,870 | |
| Other Banks & Diversified Financials - 4.7% | | | | | | | | |
| Aeon Financial Service Co. Ltd. | | | 1,311,900 | | | $ | 19,849,919 | |
| AEON Thana Sinsap Public Co. Ltd. | | | 2,759,200 | | | | 18,764,545 | |
| Banco Macro S.A., ADR | | | 28,241 | | | | 734,831 | |
| Bancolombia S.A., ADR | | | 188,347 | | | | 9,313,759 | |
| Chiba Bank Ltd. | | | 2,538,451 | | | | 13,134,313 | |
| Credicorp Ltd. | | | 133,547 | | | | 27,836,537 | |
| E.Sun Financial Holding Co. Ltd. | | | 54,363,860 | | | | 45,898,068 | |
| Federal Bank Ltd. | | | 26,502,621 | | | | 33,806,653 | |
| FinecoBank, S.p.A. | | | 2,502,438 | | | | 26,489,793 | |
| Grupo Financiero Inbursa S.A. de C.V. | | | 5,288,278 | | | | 6,726,248 | |
| Julius Baer Group Ltd. | | | 435,158 | | | | 19,280,283 | |
| Jyske Bank (a) | | | 678,847 | | | | 21,931,378 | |
| Komercni Banka A.S. | | | 406,450 | | | | 13,741,023 | |
| Metropolitan Bank & Trust Co. | | | 24,094,175 | | | | 31,797,059 | |
| Shizuoka Bank Ltd. | | | 1,025,000 | | | | 7,678,939 | |
| Shriram Transport Finance Co. Ltd. | | | 1,931,725 | | | | 29,193,065 | |
| Sydbank A.S. | | | 325,271 | | | | 5,736,208 | |
| | | | | | | | |
| | | | | | | $ | 331,912,621 | |
| Pharmaceuticals - 1.7% | | | | | | | | |
| Genomma Lab Internacional S.A., “B” (a)(l) | | | 9,753,419 | | | $ | 9,351,104 | |
| Kalbe Farma Tbk PT | | | 333,929,300 | | | | 39,403,422 | |
| Santen Pharmaceutical Co. Ltd. | | | 2,042,300 | | | | 35,630,904 | |
| Virbac S.A. (a) | | | 109,089 | | | | 24,969,326 | |
21
Portfolio of Investments – continued
| | | | | | | | |
| | |
| Issuer | | Shares/Par | | | Value ($) | |
| Common Stocks - continued | | | | | | | | |
| Pharmaceuticals - continued | | | | | | | | |
| Yunnan Baiyao Group Co. Ltd. | | | 646,117 | | | $ | 6,883,503 | |
| | | | | | | | |
| | | | | | | $ | 116,238,259 | |
| Pollution Control - 0.4% | | | | | | | | |
| Daiseki Co. Ltd. | | | 965,500 | | | $ | 24,816,724 | |
| | |
| Precious Metals & Minerals - 0.5% | | | | | | | | |
| Agnico-Eagle Mines Ltd. | | | 598,138 | | | $ | 32,054,797 | |
| | |
| Printing & Publishing - 0.1% | | | | | | | | |
| China Literature Ltd. (a) | | | 1,547,400 | | | $ | 5,231,529 | |
| | |
| Railroad & Shipping - 0.4% | | | | | | | | |
| DFDS A/S (a) | | | 201,472 | | | $ | 7,311,869 | |
| Sankyu, Inc. | | | 312,100 | | | | 16,287,590 | |
| Senko Group Holdings Co. Ltd. | | | 657,300 | | | | 5,138,663 | |
| | | | | | | | |
| | | | | | | $ | 28,738,122 | |
| Real Estate - 4.2% | | | | | | | | |
| Ascendas India Trust, REIT | | | 23,540,300 | | | $ | 26,569,380 | |
| City Developments Ltd. | | | 4,876,000 | | | | 34,755,743 | |
| Concentradora Fibra Danhos S.A. de C.V., REIT | | | 6,724,842 | | | | 9,361,073 | |
| Deutsche Wohnen SE | | | 547,327 | | | | 19,978,763 | |
| Embassy Office Parks REIT | | | 2,472,000 | | | | 14,006,260 | |
| Hibernia PLC, REIT | | | 4,778,191 | | | | 7,655,744 | |
| LEG Immobilien AG | | | 683,969 | | | | 78,276,660 | |
| Midland Holdings Ltd. (a)(h) | | | 43,113,000 | | | | 5,372,769 | |
| Multiplan Empreendimentos Imobiliarios S.A. | | | 3,219,285 | | | | 22,353,186 | |
| Prologis Peroperty Mexico S.A. de C.V., REIT | | | 4,441,245 | | | | 9,236,277 | |
| Shaftesbury PLC, REIT | | | 1,314,662 | | | | 14,685,381 | |
| TAG Immobilien AG | | | 710,764 | | | | 16,222,160 | |
| Unite Group PLC, REIT | | | 2,721,299 | | | | 36,538,026 | |
| | | | | | | | |
| | | | | | | $ | 295,011,422 | |
| Restaurants - 1.3% | | | | | | | | |
| Cafe de Coral Holdings Ltd. | | | 11,822,000 | | | $ | 31,528,105 | |
| Greggs PLC | | | 1,552,203 | | | | 39,887,883 | |
| Whitbread PLC | | | 312,265 | | | | 16,486,616 | |
| | | | | | | | |
| | | | | | | $ | 87,902,604 | |
| Specialty Chemicals - 6.5% | | | | | | | | |
| Air Water, Inc. | | | 376,000 | | | $ | 6,761,323 | |
| Croda International PLC | | | 1,886,807 | | | | 112,748,280 | |
| Elementis PLC | | | 956,822 | | | | 1,739,985 | |
22
Portfolio of Investments – continued
| | | | | | | | |
| | |
| Issuer | | Shares/Par | | | Value ($) | |
| Common Stocks - continued | | | | | | | | |
| Specialty Chemicals - continued | | | | | | | | |
| Essentra PLC | | | 5,724,110 | | | $ | 29,954,065 | |
| IMCD Group N.V. | | | 218,300 | | | | 16,143,963 | |
| Japan Pure Chemical Co. Ltd. | | | 41,700 | | | | 967,526 | |
| Kansai Paint Co. Ltd. | | | 1,037,000 | | | | 24,237,973 | |
| Nihon Parkerizing Co. Ltd. | | | 1,049,600 | | | | 11,477,423 | |
| NOF Corp. | | | 83,600 | | | | 2,770,955 | |
| Orbia Advance Corp S.A.B. de C.V. | | | 5,840,795 | | | | 11,398,045 | |
| PT Astra Agro Lestari Tbk | | | 15,352,000 | | | | 11,653,244 | |
| PTT Global Chemical PLC | | | 6,126,700 | | | | 10,767,047 | |
| Sika AG | | | 517,126 | | | | 75,647,909 | |
| SK KAKEN Co. Ltd. | | | 19,900 | | | | 8,033,619 | |
| Symrise AG | | | 1,029,979 | | | | 100,093,298 | |
| T. Hasegawa Co. Ltd. | | | 1,154,600 | | | | 21,425,908 | |
| Taisei Lamick Co. Ltd. | | | 219,800 | | | | 5,783,408 | |
| Takasago International Corp. | | | 161,300 | | | | 3,922,410 | |
| Tikkurila Oyj | | | 145,978 | | | | 2,154,332 | |
| | | | | | | | |
| | | | | | | $ | 457,680,713 | |
| Specialty Stores - 2.5% | | | | | | | | |
| ABC-Mart, Inc. | | | 281,500 | | | $ | 17,885,827 | |
| Dufry AG | | | 115,908 | | | | 9,694,905 | |
| Esprit Holdings Ltd. (a) | | | 6,185,199 | | | | 1,171,796 | |
| Howden Joinery Group | | | 3,101,903 | | | | 21,373,346 | |
| Just Eat PLC (a) | | | 5,707,242 | | | | 46,889,860 | |
| Nitori Co. Ltd. | | | 56,600 | | | | 8,276,032 | |
| Ryohin Keikaku Co. Ltd. | | | 999,000 | | | | 18,747,299 | |
| Shimamura Co. Ltd. | | | 52,800 | | | | 4,197,745 | |
| Takeaway.com Holding B.V. (a)(l) | | | 604,862 | | | | 48,258,515 | |
| | | | | | | | |
| | | | | | | $ | 176,495,325 | |
| Telecommunications - Wireless - 1.1% | | | | | | | | |
| Cellnex Telecom S.A. | | | 1,483,493 | | | $ | 61,281,768 | |
| Infrastrutture Wireless Italiane S.p.A. (n) | | | 1,387,784 | | | | 14,400,096 | |
| | | | | | | | |
| | | | | | | $ | 75,681,864 | |
| Telephone Services - 0.5% | | | | | | | | |
| Bezeq - The Israel Telecommunication Corp. Ltd. (a) | | | 6,073,425 | | | $ | 4,021,869 | |
| Hellenic Telecommunications Organization S.A. | | | 2,120,009 | | | | 29,207,296 | |
| | | | | | | | |
| | | | | | | $ | 33,229,165 | |
| Tobacco - 0.4% | | | | | | | | |
| Swedish Match AB | | | 651,525 | | | $ | 26,943,771 | |
23
Portfolio of Investments – continued
| | | | | | | | |
| | |
| Issuer | | Shares/Par | | | Value ($) | |
| Common Stocks - continued | | | | | | | | |
| Trucking - 1.3% | | | | | | | | |
| DSV A.S. | | | 184,416 | | | $ | 17,547,916 | |
| Freightways Ltd. | | | 1,136,246 | | | | 5,773,625 | |
| Hamakyorex Co. Ltd. | | | 114,900 | | | | 3,708,769 | |
| Kintetsu World Express, Inc. | | | 277,200 | | | | 3,920,774 | |
| Mainfreight Ltd. | | | 262,213 | | | | 6,551,491 | |
| Seino Holdings Co. Ltd. | | | 1,666,600 | | | | 20,839,244 | |
| SG Holdings Co. Ltd. | | | 700,500 | | | | 17,135,931 | |
| Transcom Co. Ltd. | | | 77,900 | | | | 4,521,928 | |
| Yamato Holdings Co. Ltd. | | | 951,800 | | | | 14,392,851 | |
| | | | | | | | |
| | | | | | | $ | 94,392,529 | |
| Utilities - Electric Power - 0.5% | | | | | | | | |
| CESC Ltd. | | | 2,391,765 | | | $ | 25,178,587 | |
| Equatorial Energia S.A. | | | 321,600 | | | | 7,762,612 | |
| | | | | | | | |
| | | | | | | $ | 32,941,199 | |
| Utilities - Water - 0.2% | | | | | | | | |
| Aguas Andinas S.A., “A” | | | 16,299,206 | | | $ | 8,914,659 | |
| Companhia de Saneamento Basico do Estado de Sao Paulo | | | 485,700 | | | | 5,798,077 | |
| | | | | | | | |
| | | | | | | $ | 14,712,736 | |
| Total Common Stocks (Identified Cost, $4,960,594,499) | | | $ | 6,481,567,860 | |
| | |
| Preferred Stocks - 1.1% | | | | | | | | |
| Consumer Products - 0.2% | | | | | | | | |
| Henkel AG & Co. KGaA | | | 173,051 | | | $ | 17,126,418 | |
| | |
| Food & Drug Stores - 0.2% | | | | | | | | |
| Cia Brasileira de Distribuicao | | | 654,700 | | | $ | 12,574,173 | |
| | |
| General Merchandise - 0.1% | | | | | | | | |
| Lojas Americanas S.A. | | | 2,313,400 | | | $ | 11,113,362 | |
| | |
| Metals & Mining - 0.1% | | | | | | | | |
| Gerdau S.A. | | | 1,786,200 | | | $ | 5,657,443 | |
| | |
| Specialty Chemicals - 0.5% | | | | | | | | |
| Fuchs Petrolub SE | | | 854,382 | | | $ | 32,090,311 | |
| Total Preferred Stocks (Identified Cost, $65,321,956) | | | | | | $ | 78,561,707 | |
| | |
| Investment Companies (h) - 5.9% | | | | | | | | |
| Money Market Funds - 5.9% | | | | | | | | |
MFS Institutional Money Market Portfolio, 2.09% (v)
(Identified Cost, $408,906,448) | | | 408,940,385 | | | $ | 408,940,385 | |
24
Portfolio of Investments – continued
| | | | | | | | |
| Collateral for Securities Loaned - 0.2% | | | | | | | | |
| | |
| Issuer | | Shares/Par | | | Value ($) | |
JPMorgan U.S. Government Money Market Fund, 1.85% (j)
(Identified Cost, $16,049,030) | | | 16,049,030 | | | $ | 16,049,030 | |
| | |
| Other Assets, Less Liabilities - 0.0% | | | | | | | 1,477,155 | |
| Net Assets - 100.0% | | | | | | $ | 6,986,596,137 | |
| (a) | Non-income producing security. |
| (h) | An affiliated issuer, which may be considered one in which the fund owns 5% or more of the outstanding voting securities, or a company which is under common control. At period end, the aggregate values of the fund’s investments in affiliated issuers and in unaffiliated issuers were $414,313,154 and $6,570,805,828, respectively. |
| (j) | The rate quoted is the annualizedseven-day yield of the fund at period end. |
| (l) | A portion of this security is on loan. See Note 2 for additional information. |
| (n) | Securities exempt from registration under Rule 144A of the Securities Act of 1933. These securities may be sold in the ordinary course of business in transactions exempt from registration, normally to qualified institutional buyers. At period end, the aggregate value of these securities was $14,400,096, representing 0.2% of net assets. |
| (v) | Affiliated issuer that is available only to investment companies managed by MFS. The rate quoted for the MFS Institutional Money Market Portfolio is the annualizedseven-day yield of the fund at period end. |
The following abbreviations are used in this report and are defined:
| ADR | | American Depositary Receipt |
| REIT | | Real Estate Investment Trust |
| SDR | | Swedish Depository Receipt |
See Notes to Financial Statements
25
Financial Statements
STATEMENT OF ASSETS AND LIABILITIES
At 9/30/19
This statement represents your fund’s balance sheet, which details the assets and liabilities
comprising the total value of the fund.
| | | | |
| Assets | | | | |
Investments in unaffiliated issuers, at value, including $25,069,378 of securities on loan (identified cost, $5,022,846,692) | | | $6,570,805,828 | |
Investments in affiliated issuers, at value (identified cost, $428,025,241) | | | 414,313,154 | |
Cash | | | 220,204 | |
Receivables for | | | | |
Investments sold | | | 1,164,575 | |
Fund shares sold | | | 15,032,138 | |
Interest and dividends | | | 25,625,595 | |
Other assets | | | 2,588 | |
Total assets | | | $7,027,164,082 | |
| |
| Liabilities | | | | |
Payables for | | | | |
Investments purchased | | | $2,899,403 | |
Fund shares reacquired | | | 15,042,600 | |
Collateral for securities loaned, at value (c) | | | 16,049,030 | |
Payable to affiliates | | | | |
Investment adviser | | | 654,789 | |
Administrative services fee | | | 6,315 | |
Shareholder servicing costs | | | 1,991,878 | |
Distribution and service fees | | | 38,604 | |
Program manager fees | | | 53 | |
Payable for independent Trustees’ compensation | | | 731 | |
Deferred country tax expense payable | | | 3,096,480 | |
Accrued expenses and other liabilities | | | 788,062 | |
Total liabilities | | | $40,567,945 | |
Net assets | | | $6,986,596,137 | |
| |
| Net assets consist of | | | | |
Paid-in capital | | | $5,323,002,374 | |
Total distributable earnings (loss) | | | 1,663,593,763 | |
Net assets | | | $6,986,596,137 | |
Shares of beneficial interest outstanding | | | 209,534,924 | |
| (c) | Non-cash collateral is not included. |
26
Statement of Assets and Liabilities – continued
| | | | | | | | | | | | |
| | | |
| | | Net assets | | | Shares
outstanding | | | Net asset value
per share (a) | |
| Class A | | | $1,015,816,906 | | | | 31,201,444 | | | | $32.56 | |
| Class B | | | 9,834,311 | | | | 313,041 | | | | 31.42 | |
| Class C | | | 60,915,616 | | | | 1,977,660 | | | | 30.80 | |
| Class I | | | 2,049,196,902 | | | | 61,001,259 | | | | 33.59 | |
| Class R1 | | | 2,320,295 | | | | 77,311 | | | | 30.01 | |
| Class R2 | | | 43,493,263 | | | | 1,375,029 | | | | 31.63 | |
| Class R3 | | | 132,788,881 | | | | 4,116,895 | | | | 32.25 | |
| Class R4 | | | 276,549,643 | | | | 8,498,129 | | | | 32.54 | |
| Class R6 | | | 3,385,990,509 | | | | 100,667,487 | | | | 33.64 | |
| Class 529A | | | 8,131,392 | | | | 254,310 | | | | 31.97 | |
| Class 529B | | | 208,602 | | | | 6,927 | | | | 30.11 | |
| Class 529C | | | 1,349,817 | | | | 45,432 | | | | 29.71 | |
| (a) | Maximum offering price per share was equal to the net asset value per share for all share classes, except for Classes A and 529A, for which the maximum offering prices per share were $34.55 [100 / 94.25 x $32.56] and $33.92 [100 / 94.25 x $31.97], respectively. On sales of $50,000 or more, the maximum offering prices of Class A and Class 529A shares are reduced. A contingent deferred sales charge may be imposed on redemptions of Class A, Class B, Class C, Class 529B, and Class 529C shares. Redemption price per share was equal to the net asset value per share for Classes I, R1, R2, R3, R4, R6, and 529A. |
See Notes to Financial Statements
27
Financial Statements
STATEMENT OF OPERATIONS
Year ended 9/30/19
This statement describes how much your fund earned in investment income and accrued in
expenses. It also describes any gains and/or losses generated by fund operations.
| | | | |
| Net investment income (loss) | | | | |
Income | | | | |
Dividends | | | $146,588,963 | |
Dividends from affiliated issuers | | | 8,766,700 | |
Income on securities loaned | | | 267,243 | |
Other | | | 2,184 | |
Foreign taxes withheld | | | (10,415,892 | ) |
Total investment income | | | $145,209,198 | |
Expenses | | | | |
Management fee | | | $56,763,454 | |
Distribution and service fees | | | 4,039,116 | |
Shareholder servicing costs | | | 4,601,413 | |
Program manager fees | | | 4,910 | |
Administrative services fee | | | 579,866 | |
Independent Trustees’ compensation | | | 97,148 | |
Custodian fee | | | 1,650,373 | |
Shareholder communications | | | 357,599 | |
Audit and tax fees | | | 79,390 | |
Legal fees | | | 64,262 | |
Miscellaneous | | | 352,997 | |
Total expenses | | | $68,590,528 | |
Fees paid indirectly | | | (13,908 | ) |
Reduction of expenses by investment adviser and distributor | | | (651,923 | ) |
Net expenses | | | $67,924,697 | |
Net investment income (loss) | | | $77,284,501 | |
| |
| Realized and unrealized gain (loss) | | | | |
Realized gain (loss) (identified cost basis) | | | | |
Unaffiliated issuers (net of $133,087 country tax) | | | $120,609,331 | |
Affiliated issuers | | | (4,036 | ) |
Foreign currency | | | (489,646 | ) |
Net realized gain (loss) | | | $120,115,649 | |
Change in unrealized appreciation or depreciation | | | | |
Unaffiliated issuers (net of $476,597 increase in deferred country tax) | | | $(226,592,173 | ) |
Affiliated issuers | | | (6,053,746 | ) |
Translation of assets and liabilities in foreign currencies | | | (219,703 | ) |
Net unrealized gain (loss) | | | $(232,865,622 | ) |
Net realized and unrealized gain (loss) | | | $(112,749,973 | ) |
Change in net assets from operations | | | $(35,465,472 | ) |
See Notes to Financial Statements
28
Financial Statements
STATEMENTS OF CHANGES IN NET ASSETS
These statements describe the increases and/or decreases in net assets resulting from operations, any distributions, and any shareholder transactions.
| | | | | | | | |
| | | Year ended | |
| | | 9/30/19 | | | 9/30/18 | |
| Change in net assets | | | | | | |
| | |
| From operations | | | | | | | | |
Net investment income (loss) | | | $77,284,501 | | | | $54,100,165 | |
Net realized gain (loss) | | | 120,115,649 | | | | 367,639,427 | |
Net unrealized gain (loss) | | | (232,865,622 | ) | | | 33,402,824 | |
Change in net assets from operations | | | $(35,465,472 | ) | | | $455,142,416 | |
Total distributions to shareholders | | | $(368,030,292 | ) | | | $(163,806,613 | ) |
Change in net assets from fund share transactions | | | $852,699,261 | | | | $275,242,271 | |
Total change in net assets | | | $449,203,497 | | | | $566,578,074 | |
| | |
| Net assets | | | | | | | | |
At beginning of period | | | 6,537,392,640 | | | | 5,970,814,566 | |
At end of period | | | $6,986,596,137 | | | | $6,537,392,640 | |
See Notes to Financial Statements
29
Financial Statements
FINANCIAL HIGHLIGHTS
The financial highlights table is intended to help you understand the fund’s financial performance for the past 5 years. Certain information reflects financial results for a single fund share. The total returns in the table represent the rate that an investor would have earned (or lost) on an investment in the fund share class (assuming reinvestment of all distributions) held for the entire period.
| | | | | | | | | | | | | | | | | | | | |
| Class A | | Year ended | |
| | | | | |
| | | 9/30/19 | | | 9/30/18 | | | 9/30/17 | | | 9/30/16 | | | 9/30/15 | |
Net asset value, beginning of period | | | $35.00 | | | | $33.42 | | | | $29.34 | | | | $26.70 | | | | $27.64 | |
| | |
| Income (loss) from investment operations | | | | | | | | | |
Net investment income (loss) (d) | | | $0.29 | | | | $0.22 | | | | $0.20 | (c) | | | $0.26 | | | | $0.25 | |
Net realized and unrealized gain (loss) | | | (0.82 | ) | | | 2.22 | | | | 4.54 | | | | 2.62 | | | | (0.88 | ) |
Total from investment operations | | | $(0.53 | ) | | | $2.44 | | | | $4.74 | | | | $2.88 | | | | $(0.63 | ) |
| | |
| Less distributions declared to shareholders | | | | | | | | | |
From net investment income | | | $(0.20 | ) | | | $(0.28 | ) | | | $(0.36 | ) | | | $(0.24 | ) | | | $(0.31 | ) |
From net realized gain | | | (1.71 | ) | | | (0.58 | ) | | | (0.30 | ) | | | — | | | | — | |
Total distributions declared to shareholders | | | $(1.91 | ) | | | $(0.86 | ) | | | $(0.66 | ) | | | $(0.24 | ) | | | $(0.31 | ) |
Net asset value, end of period (x) | | | $32.56 | | | | $35.00 | | | | $33.42 | | | | $29.34 | | | | $26.70 | |
Total return (%) (r)(s)(t)(x) | | | (0.85 | ) | | | 7.40 | | | | 16.69 | (c) | | | 10.87 | | | | (2.30 | ) |
| | |
Ratios (%) (to average net assets)
and Supplemental data: | | | | | | | | | |
Expenses before expense reductions (f) | | | 1.29 | | | | 1.30 | | | | 1.33 | (c) | | | 1.37 | | | | 1.37 | |
Expenses after expense reductions (f) | | | 1.28 | | | | 1.29 | | | | 1.30 | (c) | | | 1.33 | | | | 1.32 | |
Net investment income (loss) | | | 0.90 | | | | 0.62 | | | | 0.68 | (c) | | | 0.92 | | | | 0.88 | |
Portfolio turnover | | | 14 | | | | 21 | | | | 17 | | | | 13 | | | | 15 | |
Net assets at end of period (000 omitted) | | | $1,015,817 | | | | $1,163,703 | | | | $1,224,654 | | | | $1,359,996 | | | | $1,405,724 | |
See Notes to Financial Statements
30
Financial Highlights – continued
| | | | | | | | | | | | | | | | | | | | |
| Class B | | Year ended | |
| | | | | |
| | | 9/30/19 | | | 9/30/18 | | | 9/30/17 | | | 9/30/16 | | | 9/30/15 | |
Net asset value, beginning of period | | | $33.86 | | | | $32.36 | | | | $28.40 | | | | $25.83 | | | | $26.68 | |
| | |
| Income (loss) from investment operations | | | | | | | | | |
Net investment income (loss) (d) | | | $0.04 | | | | $(0.05 | ) | | | $(0.02 | )(c) | | | $0.04 | | | | $0.03 | |
Net realized and unrealized gain (loss) | | | (0.77 | ) | | | 2.16 | | | | 4.41 | | | | 2.55 | | | | (0.85 | ) |
Total from investment operations | | | $(0.73 | ) | | | $2.11 | | | | $4.39 | | | | $2.59 | | | | $(0.82 | ) |
| | |
| Less distributions declared to shareholders | | | | | | | | | |
From net investment income | | | $— | | | | $(0.03 | ) | | | $(0.13 | ) | | | $(0.02 | ) | | | $(0.03 | ) |
From net realized gain | | | (1.71 | ) | | | (0.58 | ) | | | (0.30 | ) | | | — | | | | — | |
Total distributions declared to shareholders | | | $(1.71 | ) | | | $(0.61 | ) | | | $(0.43 | ) | | | $(0.02 | ) | | | $(0.03 | ) |
Net asset value, end of period (x) | | | $31.42 | | | | $33.86 | | | | $32.36 | | | | $28.40 | | | | $25.83 | |
Total return (%) (r)(s)(t)(x) | | | (1.57 | ) | | | 6.59 | | | | 15.81 | (c) | | | 10.04 | | | | (3.06 | ) |
| | |
Ratios (%) (to average net assets)
and Supplemental data: | | | | | | | | | |
Expenses before expense reductions (f) | | | 2.04 | | | | 2.05 | | | | 2.07 | (c) | | | 2.12 | | | | 2.12 | |
Expenses after expense reductions (f) | | | 2.03 | | | | 2.03 | | | | 2.05 | (c) | | | 2.08 | | | | 2.07 | |
Net investment income (loss) | | | 0.12 | | | | (0.14 | ) | | | (0.06 | )(c) | | | 0.16 | | | | 0.11 | |
Portfolio turnover | | | 14 | | | | 21 | | | | 17 | | | | 13 | | | | 15 | |
Net assets at end of period (000 omitted) | | | $9,834 | | | | $13,212 | | | | $15,120 | | | | $17,469 | | | | $18,975 | |
| |
| Class C | | Year ended | |
| | | | | |
| | | 9/30/19 | | | 9/30/18 | | | 9/30/17 | | | 9/30/16 | | | 9/30/15 | |
Net asset value, beginning of period | | | $33.24 | | | | $31.78 | | | | $27.93 | | | | $25.42 | | | | $26.32 | |
| | |
| Income (loss) from investment operations | | | | | | | | | |
Net investment income (loss) (d) | | | $0.03 | | | | $(0.08 | ) | | | $(0.01 | )(c) | | | $0.05 | | | | $0.03 | |
Net realized and unrealized gain (loss) | | | (0.76 | ) | | | 2.15 | | | | 4.32 | | | | 2.50 | | | | (0.83 | ) |
Total from investment operations | | | $(0.73 | ) | | | $2.07 | | | | $4.31 | | | | $2.55 | | | | $(0.80 | ) |
| | |
| Less distributions declared to shareholders | | | | | | | | | |
From net investment income | | | $— | | | | $(0.03 | ) | | | $(0.16 | ) | | | $(0.04 | ) | | | $(0.10 | ) |
From net realized gain | | | (1.71 | ) | | | (0.58 | ) | | | (0.30 | ) | | | — | | | | — | |
Total distributions declared to shareholders | | | $(1.71 | ) | | | $(0.61 | ) | | | $(0.46 | ) | | | $(0.04 | ) | | | $(0.10 | ) |
Net asset value, end of period (x) | | | $30.80 | | | | $33.24 | | | | $31.78 | | | | $27.93 | | | | $25.42 | |
Total return (%) (r)(s)(t)(x) | | | (1.60 | ) | | | 6.58 | | | | 15.81 | (c) | | | 10.06 | | | | (3.04 | ) |
| | |
Ratios (%) (to average net assets)
and Supplemental data: | | | | | | | | | |
Expenses before expense reductions (f) | | | 2.04 | | | | 2.04 | | | | 2.07 | (c) | | | 2.12 | | | | 2.12 | |
Expenses after expense reductions (f) | | | 2.03 | | | | 2.03 | | | | 2.05 | (c) | | | 2.08 | | | | 2.07 | |
Net investment income (loss) | | | 0.10 | | | | (0.25 | ) | | | (0.04 | )(c) | | | 0.17 | | | | 0.12 | |
Portfolio turnover | | | 14 | | | | 21 | | | | 17 | | | | 13 | | | | 15 | |
Net assets at end of period (000 omitted) | | | $60,916 | | | | $84,044 | | | | $152,036 | | | | $166,306 | | | | $166,327 | |
See Notes to Financial Statements
31
Financial Highlights – continued
| | | | | | | | | | | | | | | | | | | | |
| Class I | | Year ended | |
| | | | | |
| | | 9/30/19 | | | 9/30/18 | | | 9/30/17 | | | 9/30/16 | | | 9/30/15 | |
Net asset value, beginning of period | | | $36.06 | | | | $34.41 | | | | $30.20 | | | | $27.48 | | | | $28.45 | |
| | |
| Income (loss) from investment operations | | | | | | | | | |
Net investment income (loss) (d) | | | $0.39 | | | | $0.32 | | | | $0.32 | (c) | | | $0.33 | | | | $0.33 | |
Net realized and unrealized gain (loss) | | | (0.86 | ) | | | 2.27 | | | | 4.63 | | | | 2.71 | | | | (0.92 | ) |
Total from investment operations | | | $(0.47 | ) | | | $2.59 | | | | $4.95 | | | | $3.04 | | | | $(0.59 | ) |
| | | |
| Less distributions declared to shareholders | | | | | | | | | | | | | |
From net investment income | | | $(0.29 | ) | | | $(0.36 | ) | | | $(0.44 | ) | | | $(0.32 | ) | | | $(0.38 | ) |
From net realized gain | | | (1.71 | ) | | | (0.58 | ) | | | (0.30 | ) | | | — | | | | — | |
Total distributions declared to shareholders | | | $(2.00 | ) | | | $(0.94 | ) | | | $(0.74 | ) | | | $(0.32 | ) | | | $(0.38 | ) |
Net asset value, end of period (x) | | | $33.59 | | | | $36.06 | | | | $34.41 | | | | $30.20 | | | | $27.48 | |
Total return (%) (r)(s)(t)(x) | | | (0.62 | ) | | | 7.65 | | | | 16.98 | (c) | | | 11.14 | | | | (2.07 | ) |
| | | |
Ratios (%) (to average net assets)
and Supplemental data: | | | | | | | | | | | | | |
Expenses before expense reductions (f) | | | 1.04 | | | | 1.05 | | | | 1.07 | (c) | | | 1.12 | | | | 1.12 | |
Expenses after expense reductions (f) | | | 1.03 | | | | 1.04 | | | | 1.05 | (c) | | | 1.08 | | | | 1.07 | |
Net investment income (loss) | | | 1.18 | | | | 0.87 | | | | 1.03 | (c) | | | 1.15 | | | | 1.13 | |
Portfolio turnover | | | 14 | | | | 21 | | | | 17 | | | | 13 | | | | 15 | |
Net assets at end of period (000 omitted) | | | $2,049,197 | | | | $2,094,665 | | | | $1,876,295 | | | | $1,670,850 | | | | $1,779,171 | |
| |
| Class R1 | | Year ended | |
| | | | | |
| | | 9/30/19 | | | 9/30/18 | | | 9/30/17 | | | 9/30/16 | | | 9/30/15 | |
Net asset value, beginning of period | | | $32.44 | | | | $31.03 | | | | $27.32 | | | | $24.82 | | | | $25.61 | |
| | | |
| Income (loss) from investment operations | | | | | | | | | | | | | |
Net investment income (loss) (d) | | | $0.04 | | | | $(0.07 | ) | | | $(0.01 | )(c) | | | $0.05 | | | | $0.02 | |
Net realized and unrealized gain (loss) | | | (0.76 | ) | | | 2.09 | | | | 4.21 | | | | 2.45 | | | | (0.81 | ) |
Total from investment operations | | | $(0.72 | ) | | | $2.02 | | | | $4.20 | | | | $2.50 | | | | $(0.79 | ) |
| | | |
| Less distributions declared to shareholders | | | | | | | | | | | | | |
From net investment income | | | $— | | | | $(0.03 | ) | | | $(0.19 | ) | | | $— | | | | $— | |
From net realized gain | | | (1.71 | ) | | | (0.58 | ) | | | (0.30 | ) | | | — | | | | — | |
Total distributions declared to shareholders | | | $(1.71 | ) | | | $(0.61 | ) | | | $(0.49 | ) | | | $— | | | | $— | |
Net asset value, end of period (x) | | | $30.01 | | | | $32.44 | | | | $31.03 | | | | $27.32 | | | | $24.82 | |
Total return (%) (r)(s)(t)(x) | | | (1.61 | ) | | | 6.59 | | | | 15.79 | (c) | | | 10.07 | | | | (3.08 | ) |
| | | |
Ratios (%) (to average net assets)
and Supplemental data: | | | | | | | | | | | | | |
Expenses before expense reductions (f) | | | 2.04 | | | | 2.05 | | | | 2.07 | (c) | | | 2.12 | | | | 2.12 | |
Expenses after expense reductions (f) | | | 2.03 | | | | 2.04 | | | | 2.05 | (c) | | | 2.08 | | | | 2.07 | |
Net investment income (loss) | | | 0.14 | | | | (0.21 | ) | | | (0.02 | )(c) | | | 0.19 | | | | 0.06 | |
Portfolio turnover | | | 14 | | | | 21 | | | | 17 | | | | 13 | | | | 15 | |
Net assets at end of period (000 omitted) | | | $2,320 | | | | $2,471 | | | | $3,928 | | | | $3,265 | | | | $3,260 | |
See Notes to Financial Statements
32
Financial Highlights – continued
| | | | | | | | | | | | | | | | | | | | |
| Class R2 | | Year ended | |
| | | | | |
| | | 9/30/19 | | | 9/30/18 | | | 9/30/17 | | | 9/30/16 | | | 9/30/15 | |
Net asset value, beginning of period | | | $34.02 | | | | $32.51 | | | | $28.56 | | | | $25.98 | | | | $26.90 | |
| | | |
| Income (loss) from investment operations | | | | | | | | | | | | | |
Net investment income (loss) (d) | | | $0.22 | | | | $0.12 | | | | $0.13 | (c) | | | $0.18 | | | | $0.16 | |
Net realized and unrealized gain (loss) | | | (0.81 | ) | | | 2.17 | | | | 4.41 | | | | 2.57 | | | | (0.85 | ) |
Total from investment operations | | | $(0.59 | ) | | | $2.29 | | | | $4.54 | | | | $2.75 | | | | $(0.69 | ) |
| | | |
| Less distributions declared to shareholders | | | | | | | | | | | | | |
From net investment income | | | $(0.09 | ) | | | $(0.20 | ) | | | $(0.29 | ) | | | $(0.17 | ) | | | $(0.23 | ) |
From net realized gain | | | (1.71 | ) | | | (0.58 | ) | | | (0.30 | ) | | | — | | | | — | |
Total distributions declared to shareholders | | | $(1.80 | ) | | | $(0.78 | ) | | | $(0.59 | ) | | | $(0.17 | ) | | | $(0.23 | ) |
Net asset value, end of period (x) | | | $31.63 | | | | $34.02 | | | | $32.51 | | | | $28.56 | | | | $25.98 | |
Total return (%) (r)(s)(t)(x) | | | (1.10 | ) | | | 7.13 | | | | 16.37 | (c) | | | 10.61 | | | | (2.57 | ) |
| | | |
Ratios (%) (to average net assets)
and Supplemental data: | | | | | | | | | | | | | |
Expenses before expense reductions (f) | | | 1.54 | | | | 1.55 | | | | 1.57 | (c) | | | 1.62 | | | | 1.62 | |
Expenses after expense reductions (f) | | | 1.53 | | | | 1.54 | | | | 1.55 | (c) | | | 1.58 | | | | 1.57 | |
Net investment income (loss) | | | 0.71 | | | | 0.35 | | | | 0.46 | (c) | | | 0.66 | | | | 0.60 | |
Portfolio turnover | | | 14 | | | | 21 | | | | 17 | | | | 13 | | | | 15 | |
Net assets at end of period (000 omitted) | | | $43,493 | | | | $48,630 | | | | $52,892 | | | | $54,065 | | | | $60,527 | |
| |
| Class R3 | | Year ended | |
| | | | | |
| | | 9/30/19 | | | 9/30/18 | | | 9/30/17 | | | 9/30/16 | | | 9/30/15 | |
Net asset value, beginning of period | | | $34.69 | | | | $33.14 | | | | $29.11 | | | | $26.50 | | | | $27.45 | |
| | | |
| Income (loss) from investment operations | | | | | | | | | | | | | |
Net investment income (loss) (d) | | | $0.29 | | | | $0.20 | | | | $0.22 | (c) | | | $0.25 | | | | $0.24 | |
Net realized and unrealized gain (loss) | | | (0.83 | ) | | | 2.21 | | | | 4.48 | | | | 2.61 | | | | (0.88 | ) |
Total from investment operations | | | $(0.54 | ) | | | $2.41 | | | | $4.70 | | | | $2.86 | | | | $(0.64 | ) |
| | | |
| Less distributions declared to shareholders | | | | | | | | | | | | | |
From net investment income | | | $(0.19 | ) | | | $(0.28 | ) | | | $(0.37 | ) | | | $(0.25 | ) | | | $(0.31 | ) |
From net realized gain | | | (1.71 | ) | | | (0.58 | ) | | | (0.30 | ) | | | — | | | | — | |
Total distributions declared to shareholders | | | $(1.90 | ) | | | $(0.86 | ) | | | $(0.67 | ) | | | $(0.25 | ) | | | $(0.31 | ) |
Net asset value, end of period (x) | | | $32.25 | | | | $34.69 | | | | $33.14 | | | | $29.11 | | | | $26.50 | |
Total return (%) (r)(s)(t)(x) | | | (0.88 | ) | | | 7.39 | | | | 16.70 | (c) | | | 10.85 | | | | (2.33 | ) |
| | | |
Ratios (%) (to average net assets)
and Supplemental data: | | | | | | | | | | | | | |
Expenses before expense reductions (f) | | | 1.29 | | | | 1.30 | | | | 1.32 | (c) | | | 1.37 | | | | 1.37 | |
Expenses after expense reductions (f) | | | 1.28 | | | | 1.29 | | | | 1.30 | (c) | | | 1.33 | | | | 1.32 | |
Net investment income (loss) | | | 0.92 | | | | 0.58 | | | | 0.73 | (c) | | | 0.92 | | | | 0.88 | |
Portfolio turnover | | | 14 | | | | 21 | | | | 17 | | | | 13 | | | | 15 | |
Net assets at end of period (000 omitted) | | | $132,789 | | | | $146,726 | | | | $174,621 | | | | $157,360 | | | | $145,450 | |
See Notes to Financial Statements
33
Financial Highlights – continued
| | | | | | | | | | | | | | | | | | | | |
| Class R4 | | Year ended | |
| | | | | |
| | | 9/30/19 | | | 9/30/18 | | | 9/30/17 | | | 9/30/16 | | | 9/30/15 | |
Net asset value, beginning of period | | | $35.00 | | | | $33.43 | | | | $29.36 | | | | $26.72 | | | | $27.67 | |
| | | |
| Income (loss) from investment operations | | | | | | | | | | | | | |
Net investment income (loss) (d) | | | $0.36 | | | | $0.31 | | | | $0.29 | (c) | | | $0.32 | | | | $0.32 | |
Net realized and unrealized gain (loss) | | | (0.82 | ) | | | 2.21 | | | | 4.52 | | | | 2.64 | | | | (0.89 | ) |
Total from investment operations | | | $(0.46 | ) | | | $2.52 | | | | $4.81 | | | | $2.96 | | | | $(0.57 | ) |
| | | |
| Less distributions declared to shareholders | | | | | | | | | | | | | |
From net investment income | | | $(0.29 | ) | | | $(0.37 | ) | | | $(0.44 | ) | | | $(0.32 | ) | | | $(0.38 | ) |
From net realized gain | | | (1.71 | ) | | | (0.58 | ) | | | (0.30 | ) | | | — | | | | — | |
Total distributions declared to shareholders | | | $(2.00 | ) | | | $(0.95 | ) | | | $(0.74 | ) | | | $(0.32 | ) | | | $(0.38 | ) |
Net asset value, end of period (x) | | | $32.54 | | | | $35.00 | | | | $33.43 | | | | $29.36 | | | | $26.72 | |
Total return (%) (r)(s)(t)(x) | | | (0.61 | ) | | | 7.65 | | | | 16.98 | (c) | | | 11.16 | | | | (2.07 | ) |
| | | |
Ratios (%) (to average net assets)
and Supplemental data: | | | | | | | | | | | | | |
Expenses before expense reductions (f) | | | 1.04 | | | | 1.05 | | | | 1.07 | (c) | | | 1.12 | | | | 1.12 | |
Expenses after expense reductions (f) | | | 1.03 | | | | 1.04 | | | | 1.05 | (c) | | | 1.08 | | | | 1.07 | |
Net investment income (loss) | | | 1.14 | | | | 0.87 | | | | 0.96 | (c) | | | 1.15 | | | | 1.15 | |
Portfolio turnover | | | 14 | | | | 21 | | | | 17 | | | | 13 | | | | 15 | |
Net assets at end of period (000 omitted) | | | $276,550 | | | | $318,571 | | | | $330,370 | | | | $312,467 | | | | $337,705 | |
| |
| Class R6 | | Year ended | |
| | | | | |
| | | 9/30/19 | | | 9/30/18 | | | 9/30/17 | | | 9/30/16 | | | 9/30/15 | |
Net asset value, beginning of period | | | $36.11 | | | | $34.45 | | | | $30.24 | | | | $27.51 | | | | $28.48 | |
| | | |
| Income (loss) from investment operations | | | | | | | | | | | | | |
Net investment income (loss) (d) | | | $0.44 | | | | $0.37 | | | | $0.35 | (c) | | | $0.38 | | | | $0.37 | |
Net realized and unrealized gain (loss) | | | (0.87 | ) | | | 2.27 | | | | 4.64 | | | | 2.70 | | | | (0.93 | ) |
Total from investment operations | | | $(0.43 | ) | | | $2.64 | | | | $4.99 | | | | $3.08 | | | | $(0.56 | ) |
| | | |
| Less distributions declared to shareholders | | | | | | | | | | | | | |
From net investment income | | | $(0.33 | ) | | | $(0.40 | ) | | | $(0.48 | ) | | | $(0.35 | ) | | | $(0.41 | ) |
From net realized gain | | | (1.71 | ) | | | (0.58 | ) | | | (0.30 | ) | | | — | | | | — | |
Total distributions declared to shareholders | | | $(2.04 | ) | | | $(0.98 | ) | | | $(0.78 | ) | | | $(0.35 | ) | | | $(0.41 | ) |
Net asset value, end of period (x) | | | $33.64 | | | | $36.11 | | | | $34.45 | | | | $30.24 | | | | $27.51 | |
Total return (%) (r)(s)(t)(x) | | | (0.47 | ) | | | 7.79 | | | | 17.10 | (c) | | | 11.30 | | | | (1.96 | ) |
| | | | |
Ratios (%) (to average net assets)
and Supplemental data: | | | | | | | | | | | | | | | | | |
Expenses before expense reductions (f) | | | 0.92 | | | | 0.93 | | | | 0.96 | (c) | | | 1.00 | | | | 1.00 | |
Expenses after expense reductions (f) | | | 0.91 | | | | 0.92 | | | | 0.94 | (c) | | | 0.95 | | | | 0.95 | |
Net investment income (loss) | | | 1.34 | | | | 1.02 | | | | 1.13 | (c) | | | 1.32 | | | | 1.27 | |
Portfolio turnover | | | 14 | | | | 21 | | | | 17 | | | | 13 | | | | 15 | |
Net assets at end of period (000 omitted) | | | $3,385,991 | | | | $2,654,886 | | | | $2,131,042 | | | | $1,027,737 | | | | $872,671 | |
See Notes to Financial Statements
34
Financial Highlights – continued
| | | | | | | | | | | | | | | | | | | | |
| Class 529A | | Year ended | |
| | | | | |
| | | 9/30/19 | | | 9/30/18 | | | 9/30/17 | | | 9/30/16 | | | 9/30/15 | |
Net asset value, beginning of period | | | $34.42 | | | | $32.89 | | | | $28.90 | | | | $26.31 | | | | $27.25 | |
| | | |
| Income (loss) from investment operations | | | | | | | | | | | | | |
Net investment income (loss) (d) | | | $0.29 | | | | $0.22 | | | | $0.22 | (c) | | | $0.25 | | | | $0.24 | |
Net realized and unrealized gain (loss) | | | (0.83 | ) | | | 2.18 | | | | 4.44 | | | | 2.59 | | | | (0.87 | ) |
Total from investment operations | | | $(0.54 | ) | | | $2.40 | | | | $4.66 | | | | $2.84 | | | | $(0.63 | ) |
| | | |
| Less distributions declared to shareholders | | | | | | | | | | | | | |
From net investment income | | | $(0.20 | ) | | | $(0.29 | ) | | | $(0.37 | ) | | | $(0.25 | ) | | | $(0.31 | ) |
From net realized gain | | | (1.71 | ) | | | (0.58 | ) | | | (0.30 | ) | | | — | | | | — | |
Total distributions declared to shareholders | | | $(1.91 | ) | | | $(0.87 | ) | | | $(0.67 | ) | | | $(0.25 | ) | | | $(0.31 | ) |
Net asset value, end of period (x) | | | $31.97 | | | | $34.42 | | | | $32.89 | | | | $28.90 | | | | $26.31 | |
Total return (%) (r)(s)(t)(x) | | | (0.88 | ) | | | 7.41 | | | | 16.67 | (c) | | | 10.87 | | | | (2.31 | ) |
| | | |
Ratios (%) (to average net assets)
and Supplemental data: | | | | | | | | | | | | | |
Expenses before expense reductions (f) | | | 1.34 | | | | 1.36 | | | | 1.42 | (c) | | | 1.47 | | | | 1.47 | |
Expenses after expense reductions (f) | | | 1.29 | | | | 1.29 | | | | 1.30 | (c) | | | 1.33 | | | | 1.33 | |
Net investment income (loss) | | | 0.91 | | | | 0.64 | | | | 0.74 | (c) | | | 0.93 | | | | 0.88 | |
Portfolio turnover | | | 14 | | | | 21 | | | | 17 | | | | 13 | | | | 15 | |
Net assets at end of period (000 omitted) | | | $8,131 | | | | $8,529 | | | | $7,540 | | | | $6,193 | | | | $5,911 | |
| |
| Class 529B | | Year ended | |
| | | | | |
| | | 9/30/19 | | | 9/30/18 | | | 9/30/17 | | | 9/30/16 | | | 9/30/15 | |
Net asset value, beginning of period | | | $32.70 | | | | $31.15 | | | | $27.51 | | | | $24.85 | | | | $25.67 | |
| | | |
| Income (loss) from investment operations | | | | | | | | | | | | | |
Net investment income (loss) (d) | | | $0.05 | | | | $0.20 | | | | $0.08 | (c) | | | $0.20 | | | | $0.01 | |
Net realized and unrealized gain (loss) | | | (0.77 | ) | | | 2.08 | | | | 4.22 | | | | 2.46 | | | | (0.80 | ) |
Total from investment operations | | | $(0.72 | ) | | | $2.28 | | | | $4.30 | | | | $2.66 | | | | $(0.79 | ) |
| | | |
| Less distributions declared to shareholders | | | | | | | | | | | | | |
From net investment income | | | $(0.16 | ) | | | $(0.15 | ) | | | $(0.36 | ) | | | $— | | | | $(0.03 | ) |
From net realized gain | | | (1.71 | ) | | | (0.58 | ) | | | (0.30 | ) | | | — | | | | — | |
Total distributions declared to shareholders | | | $(1.87 | ) | | | $(0.73 | ) | | | $(0.66 | ) | | | $— | | | | $(0.03 | ) |
Net asset value, end of period (x) | | | $30.11 | | | | $32.70 | | | | $31.15 | | | | $27.51 | | | | $24.85 | |
Total return (%) (r)(s)(t)(x) | | | (1.55 | ) | | | 7.43 | | | | 16.19 | (c) | | | 10.70 | | | | (3.06 | ) |
| | | |
Ratios (%) (to average net assets)
and Supplemental data: | | | | | | | | | | | | | |
Expenses before expense reductions (f) | | | 1.97 | | | | 1.31 | | | | 1.79 | (c) | | | 1.61 | | | | 2.22 | |
Expenses after expense reductions (f) | | | 1.95 | | | | 1.27 | | | | 1.71 | (c) | | | 1.50 | | | | 2.11 | |
Net investment income (loss) | | | 0.17 | | | | 0.62 | | | | 0.30 | (c) | | | 0.76 | | | | 0.04 | |
Portfolio turnover | | | 14 | | | | 21 | | | | 17 | | | | 13 | | | | 15 | |
Net assets at end of period (000 omitted) | | | $209 | | | | $269 | | | | $297 | | | | $330 | | | | $344 | |
See Notes to Financial Statements
35
Financial Highlights – continued
| | | | | | | | | | | | | | | | | | | | |
| Class 529C | | Year ended | |
| | | | | |
| | | 9/30/19 | | | 9/30/18 | | | 9/30/17 | | | 9/30/16 | | | 9/30/15 | |
Net asset value, beginning of period | | | $32.15 | | | | $30.78 | | | | $27.08 | | | | $24.66 | | | | $25.56 | |
| | | | |
| Income (loss) from investment operations | | | | | | | | | | | | | | | | | |
Net investment income (loss) (d) | | | $0.03 | | | | $(0.06 | ) | | | $(0.02 | )(c) | | | $0.04 | | | | $0.02 | |
Net realized and unrealized gain (loss) | | | (0.76 | ) | | | 2.06 | | | | 4.18 | | | | 2.43 | | | | (0.80 | ) |
Total from investment operations | | | $(0.73 | ) | | | $2.00 | | | | $4.16 | | | | $2.47 | | | | $(0.78 | ) |
| | | | |
| Less distributions declared to shareholders | | | | | | | | | | | | | | | | | |
From net investment income | | | $— | | | | $(0.05 | ) | | | $(0.16 | ) | | | $(0.05 | ) | | | $(0.12 | ) |
From net realized gain | | | (1.71 | ) | | | (0.58 | ) | | | (0.30 | ) | | | — | | | | — | |
Total distributions declared to shareholders | | | $(1.71 | ) | | | $(0.63 | ) | | | $(0.46 | ) | | | $(0.05 | ) | | | $(0.12 | ) |
Net asset value, end of period (x) | | | $29.71 | | | | $32.15 | | | | $30.78 | | | | $27.08 | | | | $24.66 | |
Total return (%) (r)(s)(t)(x) | | | (1.66 | ) | | | 6.56 | | | | 15.75 | (c) | | | 10.03 | | | | (3.08 | ) |
| | | | |
Ratios (%) (to average net assets)
and Supplemental data: | | | | | | | | | | | | | | | | | |
Expenses before expense reductions (f) | | | 2.09 | | | | 2.11 | | | | 2.17 | (c) | | | 2.22 | | | | 2.22 | |
Expenses after expense reductions (f) | | | 2.08 | | | | 2.08 | | | | 2.10 | (c) | | �� | 2.12 | | | | 2.12 | |
Net investment income (loss) | | | 0.09 | | | | (0.20 | ) | | | (0.08 | )(c) | | | 0.14 | | | | 0.09 | |
Portfolio turnover | | | 14 | | | | 21 | | | | 17 | | | | 13 | | | | 15 | |
Net assets at end of period (000 omitted) | | | $1,350 | | | | $1,686 | | | | $2,020 | | | | $1,909 | | | | $1,965 | |
| (c) | Amount reflects aone-time reimbursement of expenses by the custodian (or former custodian) without which net investment income and performance would be lower and expenses would be higher. |
| (d) | Per share data is based on average shares outstanding. |
| (f) | Ratios do not reflect reductions from fees paid indirectly, if applicable. |
| (r) | Certain expenses have been reduced without which performance would have been lower. |
| (s) | From time to time the fund may receive proceeds from litigation settlements, without which performance would be lower. |
| (t) | Total returns do not include any applicable sales charges. |
| (x) | The net asset values and total returns have been calculated on net assets which include adjustments made in accordance with U.S. generally accepted accounting principles required at period end for financial reporting purposes. |
See Notes to Financial Statements
36
NOTES TO FINANCIAL STATEMENTS
(1) Business and Organization
MFS International New Discovery Fund (the fund) is a diversified series of MFS Series Trust V (the trust). The trust is organized as a Massachusetts business trust and is registered under the Investment Company Act of 1940, as amended, as anopen-end management investment company.
The fund is an investment company and accordingly follows the investment company accounting and reporting guidance of the Financial Accounting Standards Board (FASB) Accounting Standards Codification Topic 946 Financial Services – Investment Companies.
(2) Significant Accounting Policies
General– The preparation of financial statements in conformity with U.S. generally accepted accounting principles requires management to make estimates and assumptions that affect the reported amounts of assets and liabilities, and disclosure of contingent assets and liabilities at the date of the financial statements and the reported amounts of increases and decreases in net assets from operations during the reporting period. Actual results could differ from those estimates. In the preparation of these financial statements, management has evaluated subsequent events occurring after the date of the fund’s Statement of Assets and Liabilities through the date that the financial statements were issued. The fund invests in foreign securities, including securities of emerging market issuers. Investments in foreign securities are vulnerable to the effects of changes in the relative values of the local currency and the U.S. dollar and to the effects of changes in each country’s market, economic, industrial, political, regulatory, geopolitical, and other conditions. Investments in emerging markets can involve additional and greater risks than the risks associated with investments in developed foreign markets. Emerging markets can have less developed markets, greater custody and operational risk, less developed legal, regulatory, and accounting systems, and greater political, social, and economic instability than developed markets.
Balance Sheet Offsetting– The fund’s accounting policy with respect to balance sheet offsetting is that, absent an event of default by the counterparty or a termination of the agreement, the International Swaps and Derivatives Association (ISDA) Master Agreement, or similar agreement, does not result in an offset of reported amounts of financial assets and financial liabilities in the Statement of Assets and Liabilities across transactions between the fund and the applicable counterparty. The fund’s right to setoff may be restricted or prohibited by the bankruptcy or insolvency laws of the particular jurisdiction to which a specific master netting agreement counterparty is subject. Balance sheet offsetting disclosures, to the extent applicable to the fund, have been included in the fund’s Significant Accounting Policies note under the captions for each of the fund’sin-scope financial instruments and transactions.
Investment Valuations– Equity securities, including restricted equity securities, are generally valued at the last sale or official closing price on their primary market or exchange as provided by a third-party pricing service. Equity securities, for which there were no sales reported that day, are generally valued at the last quoted daily bid quotation on their primary market or exchange as provided by a third-party pricing service. Short-term instruments with a maturity at issuance of 60 days or less may be
37
Notes to Financial Statements – continued
valued at amortized cost, which approximates market value.Open-end investment companies are generally valued at net asset value per share. Securities and other assets generally valued on the basis of information from a third-party pricing service may also be valued at a broker/dealer bid quotation. In determining values, third-party pricing services can utilize both transaction data and market information such as yield, quality, coupon rate, maturity, type of issue, trading characteristics, and other market data. The values of foreign securities and other assets and liabilities expressed in foreign currencies are converted to U.S. dollars using the mean of bid and asked prices for rates provided by a third-party pricing service.
The Board of Trustees has delegated primary responsibility for determining or causing to be determined the value of the fund’s investments (including any fair valuation) to the adviser pursuant to valuation policies and procedures approved by the Board. If the adviser determines that reliable market quotations are not readily available, investments are valued at fair value as determined in good faith by the adviser in accordance with such procedures under the oversight of the Board of Trustees. Under the fund’s valuation policies and procedures, market quotations are not considered to be readily available for most types of debt instruments and floating rate loans and many types of derivatives. These investments are generally valued at fair value based on information from third-party pricing services. In addition, investments may be valued at fair value if the adviser determines that an investment’s value has been materially affected by events occurring after the close of the exchange or market on which the investment is principally traded (such as foreign exchange or market) and prior to the determination of the fund’s net asset value, or after the halt of trading of a specific security where trading does not resume prior to the close of the exchange or market on which the security is principally traded. Events that occur after foreign markets close (such as developments in foreign markets and significant movements in the U.S. markets) and prior to the determination of the fund’s net asset value may be deemed to have a material effect on the value of securities traded in foreign markets. Accordingly, the fund’s foreign equity securities may often be valued at fair value. The adviser generally relies on third-party pricing services or other information (such as the correlation with price movements of similar securities in the same or other markets; the type, cost and investment characteristics of the security; the business and financial condition of the issuer; and trading and other market data) to assist in determining whether to fair value and at what value to fair value an investment. The value of an investment for purposes of calculating the fund’s net asset value can differ depending on the source and method used to determine value. When fair valuation is used, the value of an investment used to determine the fund’s net asset value may differ from quoted or published prices for the same investment. There can be no assurance that the fund could obtain the fair value assigned to an investment if it were to sell the investment at the same time at which the fund determines its net asset value per share.
Various inputs are used in determining the value of the fund’s assets or liabilities. These inputs are categorized into three broad levels. In certain cases, the inputs used to measure fair value may fall into different levels of the fair value hierarchy. In such cases, an investment’s level within the fair value hierarchy is based on the lowest level of input that is significant to the fair value measurement. The fund’s assessment of the significance of a particular input to the fair value measurement in its entirety requires judgment, and considers factors specific to the investment. Level 1 includes unadjusted
38
Notes to Financial Statements – continued
quoted prices in active markets for identical assets or liabilities. Level 2 includes other significant observable market-based inputs (including quoted prices for similar securities, interest rates, prepayment speed, and credit risk). Level 3 includes unobservable inputs, which may include the adviser’s own assumptions in determining the fair value of investments. The following is a summary of the levels used as of September 30, 2019 in valuing the fund’s assets or liabilities:
| | | | | | | | | | | | | | | | |
| | | | |
| Financial Instruments | | Level 1 | | | Level 2 | | | Level 3 | | | Total | |
| Equity Securities: | | | | | | | | | | | | | | | | |
Japan | | | $292,916,346 | | | | $1,135,427,012 | | | | $— | | | | $1,428,343,358 | |
United Kingdom | | | 1,156,574,989 | | | | — | | | | — | | | | 1,156,574,989 | |
Germany | | | 575,057,708 | | | | — | | | | — | | | | 575,057,708 | |
Australia | | | 152,572,507 | | | | 135,143,237 | | | | — | | | | 287,715,744 | |
India | | | 214,387,938 | | | | 33,506,236 | | | | — | | | | 247,894,174 | |
Hong Kong | | | 41,730,953 | | | | 174,366,073 | | | | — | | | | 216,097,026 | |
Spain | | | 208,929,249 | | | | — | | | | — | | | | 208,929,249 | |
Switzerland | | | 206,011,148 | | | | — | | | | — | | | | 206,011,148 | |
Brazil | | | 199,470,667 | | | | — | | | | — | | | | 199,470,667 | |
Other Countries | | | 1,621,225,380 | | | | 412,810,124 | | | | — | | | | 2,034,035,504 | |
| Mutual Funds | | | 424,989,415 | | | | — | | | | — | | | | 424,989,415 | |
| Total | | | $5,093,866,300 | | | | $1,891,252,682 | | | | $— | | | | $6,985,118,982 | |
For further information regarding security characteristics, see the Portfolio of Investments.
Foreign Currency Translation– Purchases and sales of foreign investments, income, and expenses are converted into U.S. dollars based upon currency exchange rates prevailing on the respective dates of such transactions or on the reporting date for foreign denominated receivables and payables. Gains and losses attributable to foreign currency exchange rates on sales of securities are recorded for financial statement purposes as net realized gains and losses on investments. Gains and losses attributable to foreign exchange rate movements on receivables, payables, income and expenses are recorded for financial statement purposes as foreign currency transaction gains and losses. That portion of both realized and unrealized gains and losses on investments that results from fluctuations in foreign currency exchange rates is not separately disclosed.
Security Loans– Under its Securities Lending Agency Agreement with the fund, JPMorgan Chase and Co., as lending agent, loans the securities of the fund to certain qualified institutions (the “Borrowers”) approved by the fund. Security loans can be terminated at the discretion of either the lending agent or the fund and the related securities must be returned within the earlier of the standard trade settlement period for such securities or within three business days. The loans are collateralized by cash and/or U.S. Treasury and federal agency obligations in an amount typically at least equal to the market value of the securities loaned. On loans collateralized by cash, the cash collateral is invested in a money market fund. The market value of the loaned securities is determined at the close of business of the fund and any additional required collateral is delivered to the fund on the next business day. The lending agent provides the fund with indemnification against Borrower default. In the event of Borrower
39
Notes to Financial Statements – continued
default, the lending agent will, for the benefit of the fund, either purchase securities identical to those loaned or, when such purchase is commercially impracticable, pay the fund the market value of the loaned securities. In return, the lending agent assumes the fund’s rights to the related collateral. If the collateral value is less than the cost to purchase identical securities, the lending agent is responsible for the shortfall, but only to the extent that such shortfall is not due to a decline in collateral value resulting from collateral reinvestment for which the fund bears the risk of loss. At period end, the fund had investment securities on loan, all of which were classified as equity securities in the fund’s Portfolio of Investments, with a fair value of $25,069,378. The fair value of the fund’s investment securities on loan and a related liability of $16,049,030 for cash collateral received on securities loaned are both presented gross in the Statement of Assets and Liabilities. Additionally, these loans were collateralized by U.S. Treasury Obligations of $10,546,984 held by the lending agent. The collateral on securities loaned exceeded the value of securities on loan at period end. The liability for cash collateral for securities loaned is carried at fair value, which is categorized as level 2 within the fair value hierarchy. A portion of the income generated upon investment of the collateral is remitted to the Borrowers, and the remainder is allocated between the fund and the lending agent. On loans collateralized by U.S. Treasury and/or federal agency obligations, a fee is received from the Borrower, and is allocated between the fund and the lending agent. Income from securities lending is separately reported in the Statement of Operations. The dividend and interest income earned on the securities loaned is accounted for in the same manner as other dividend and interest income.
Indemnifications– Under the fund’s organizational documents, its officers and Trustees may be indemnified against certain liabilities and expenses arising out of the performance of their duties to the fund. Additionally, in the normal course of business, the fund enters into agreements with service providers that may contain indemnification clauses. The fund’s maximum exposure under these agreements is unknown as this would involve future claims that may be made against the fund that have not yet occurred.
Investment Transactions and Income– Investment transactions are recorded on the trade date. Interest income is recorded on the accrual basis. Dividends received in cash are recorded on theex-dividend date. Certain dividends from foreign securities will be recorded when the fund is informed of the dividend if such information is obtained subsequent to theex-dividend date. Dividend payments received in additional securities are recorded on theex-dividend date in an amount equal to the value of the security on such date.
The fund may receive proceeds from litigation settlements. Any proceeds received from litigation involving portfolio holdings are reflected in the Statement of Operations in realized gain/loss if the security has been disposed of by the fund or in unrealized gain/loss if the security is still held by the fund. Any other proceeds from litigation not related to portfolio holdings are reflected as other income in the Statement of Operations.
Fees Paid Indirectly– The fund’s custody fee may be reduced by a credit earned under an arrangement that measures the value of U.S. dollars deposited with the custodian by the fund. The amount of the credit, for the year ended September 30, 2019, is shown as a reduction of total expenses in the Statement of Operations.
40
Notes to Financial Statements – continued
Tax Matters and Distributions– The fund intends to qualify as a regulated investment company, as defined under Subchapter M of the Internal Revenue Code, and to distribute all of its taxable income, including realized capital gains. As a result, no provision for federal income tax is required. The fund’s federal tax returns, when filed, will remain subject to examination by the Internal Revenue Service for a three year period. Management has analyzed the fund’s tax positions taken on federal and state tax returns for all open tax years and does not believe that there are any uncertain tax positions that require recognition of a tax liability. Foreign taxes, if any, have been accrued by the fund in the accompanying financial statements in accordance with the applicable foreign tax law. Foreign income taxes may be withheld by certain countries in which the fund invests. Additionally, capital gains realized by the fund on securities issued in or by certain foreign countries may be subject to capital gains tax imposed by those countries.
Distributions to shareholders are recorded on theex-dividend date. Income and capital gain distributions are determined in accordance with income tax regulations, which may differ from U.S. generally accepted accounting principles. Certain capital accounts in the financial statements are periodically adjusted for permanent differences in order to reflect their tax character. These adjustments have no impact on net assets or net asset value per share. Temporary differences which arise from recognizing certain items of income, expense, gain or loss in different periods for financial statement and tax purposes will reverse at some time in the future.
Book/tax differences primarily relate to passive foreign investment companies, wash sale loss deferrals, treating a portion of the proceeds from redemptions as a distribution for tax purposes, and foreign taxes.
The tax character of distributions declared to shareholders for the last two fiscal years is as follows:
| | | | | | | | |
| | |
| | | Year ended
9/30/19 | | | Year ended
9/30/18 | |
| Ordinary income (including any short-term capital gains) | | | $64,579,660 | | | | $81,770,974 | |
| Long-term capital gains | | | 303,450,632 | | | | 82,035,639 | |
| | |
| Total distributions | | | $368,030,292 | | | | $163,806,613 | |
The federal tax cost and the tax basis components of distributable earnings were as follows:
| | | | |
| |
| As of 9/30/19 | | | |
| |
| Cost of investments | | | $5,512,321,601 | |
| Gross appreciation | | | 1,917,191,553 | |
| |
| Gross depreciation | | | (444,394,172 | ) |
| Net unrealized appreciation (depreciation) | | | $1,472,797,381 | |
| |
| Undistributed ordinary income | | | 86,898,235 | |
| Undistributed long-term capital gain | | | 106,050,323 | |
| Other temporary differences | | | (2,152,176 | ) |
41
Notes to Financial Statements – continued
Multiple Classes of Shares of Beneficial Interest– The fund offers multiple classes of shares, which differ in their respective distribution, service, and program manager fees. The fund’s income, realized and unrealized gain (loss), and common expenses are allocated to shareholders based on the daily net assets of each class. Dividends are declared separately for each class. Differences in per share dividend rates are generally due to differences in separate class expenses. Class B and Class 529B shares will convert to Class A and Class 529A shares, respectively, approximately eight years after purchase. Class C and Class 529C shares will convert to Class A and Class 529A shares, respectively, approximately ten years after purchase. The fund’s distributions declared to shareholders as reported in the Statements of Changes in Net Assets are presented by class as follows:
| | | | | | | | |
| | |
| | | Year
ended
9/30/19 | | | Year
ended
9/30/18 | |
| Class A | | | $62,150,447 | | | | $29,805,589 | |
| Class B | | | 650,897 | | | | 278,995 | |
| Class C | | | 4,078,231 | | | | 2,805,949 | |
| Class I | | | 115,003,468 | | | | 52,258,841 | |
| Class R1 | | | 132,056 | | | | 65,039 | |
| Class R2 | | | 2,247,366 | | | | 1,237,348 | |
| Class R3 | | | 8,026,352 | | | | 4,433,730 | |
| Class R4 | | | 17,885,611 | | | | 9,356,644 | |
| Class R6 | | | 157,283,589 | | | | 63,312,919 | |
| Class 529A | | | 469,327 | | | | 203,688 | |
| Class 529B | | | 15,379 | | | | 6,920 | |
| Class 529C | | | 87,569 | | | | 40,951 | |
| Total | | | $368,030,292 | | | | $163,806,613 | |
(3) Transactions with Affiliates
Investment Adviser– The fund has an investment advisory agreement with MFS to provide overall investment management and related administrative services and facilities to the fund. The management fee is computed daily and paid monthly at the following annual rates based on the fund’s average daily net assets:
| | | | |
| Up to $500 million | | | 0.975 | % |
| In excess of $500 million and up to $1 billion | | | 0.925 | % |
| In excess of $1 billion and up to $3 billion | | | 0.90 | % |
| In excess of $3 billion and up to $5 billion | | | 0.85 | % |
| In excess of $5 billion and up to $10 billion | | | 0.80 | % |
| In excess of $10 billion | | | 0.75 | % |
MFS has agreed in writing to reduce its management fee by a specified amount if certain MFS mutual fund assets exceed thresholds agreed to by MFS and the fund’s Board of Trustees. For the year ended September 30, 2019, this management fee reduction amounted to $631,110, which is included in the reduction of total expenses in the Statement of Operations. The management fee incurred for the year ended September 30, 2019 was equivalent to an annual effective rate of 0.86% of the fund’s average daily net assets.
42
Notes to Financial Statements – continued
Distributor– MFS Fund Distributors, Inc. (MFD), a wholly-owned subsidiary of MFS, as distributor, received $120,714 and $3,048 for the year ended September 30, 2019, as its portion of the initial sales charge on sales of Class A and Class 529A shares of the fund, respectively.
The Board of Trustees has adopted a distribution plan for certain share classes pursuant to Rule12b-1 of the Investment Company Act of 1940.
The fund’s distribution plan provides that the fund will pay MFD for services provided by MFD and financial intermediaries in connection with the distribution and servicing of certain share classes. One component of the plan is a distribution fee paid to MFD and another component of the plan is a service fee paid to MFD. MFD may subsequently pay all, or a portion, of the distribution and/or service fees to financial intermediaries.
Distribution Plan Fee Table:
| | | | | | | | | | | | | | | | | | | | |
| | | | | |
| | | Distribution
Fee Rate (d) | | | Service
Fee Rate (d) | | | Total
Distribution
Plan (d) | | | Annual
Effective
Rate (e) | | | Distribution
and Service
Fee | |
| Class A | | | — | | | | 0.25% | | | | 0.25% | | | | 0.25% | | | | $2,620,464 | |
| Class B | | | 0.75% | | | | 0.25% | | | | 1.00% | | | | 1.00% | | | | 112,416 | |
| Class C | | | 0.75% | | | | 0.25% | | | | 1.00% | | | | 1.00% | | | | 688,463 | |
| Class R1 | | | 0.75% | | | | 0.25% | | | | 1.00% | | | | 1.00% | | | | 22,645 | |
| Class R2 | | | 0.25% | | | | 0.25% | | | | 0.50% | | | | 0.50% | | | | 215,659 | |
| Class R3 | | | — | | | | 0.25% | | | | 0.25% | | | | 0.25% | | | | 342,135 | |
| Class 529A | | | — | | | | 0.25% | | | | 0.25% | | | | 0.21% | | | | 20,196 | |
| Class 529B | | | 0.75% | | | | 0.25% | | | | 1.00% | | | | 0.87% | | | | 2,012 | |
| Class 529C | | | 0.75% | | | | 0.25% | | | | 1.00% | | | | 1.00% | | | | 15,126 | |
| Total Distribution and Service Fees | | | | | | | | | | | | $4,039,116 | |
| (d) | In accordance with the distribution plan for certain classes, the fund pays distribution and/or service fees equal to these annual percentage rates of each class’s average daily net assets. The distribution and service fee rates disclosed by class represent the current rates in effect at the end of the reporting period. Any rate changes, if applicable, are detailed below. |
| (e) | The annual effective rates represent actual fees incurred under the distribution plan for the year ended September 30, 2019 based on each class’s average daily net assets. MFD has voluntarily agreed to rebate a portion of each class’s 0.25% service fee attributable to accounts for which MFD retains the 0.25% service fee except for accounts attributable to MFS or its affiliates’ seed money. For the year ended September 30, 2019, this rebate amounted to $16,631, $315, $316, $1, $17, $78, $3,386, $23, and $46 for Class A, Class B, Class C, Class R1, Class R2, Class R3, Class 529A, Class 529B, and Class 529C, respectively, and is included in the reduction of total expenses in the Statement of Operations. For the period April 1, 2019 through May 31, 2019, the 0.75% distribution fee was not imposed for Class 529B shares due to the sales charge limitations contained in Financial Industry Regulatory Authority (“FINRA”) Rule 2341. Effective June 1, 2019, the distribution fee of 0.75% was reinstated. |
Certain Class A shares are subject to a contingent deferred sales charge (CDSC) in the event of a shareholder redemption within 18 months of purchase. Class B and Class 529B shares are subject to a CDSC in the event of a shareholder redemption within six years of purchase. Class C and Class 529C shares are subject to a CDSC in
43
Notes to Financial Statements – continued
the event of a shareholder redemption within 12 months of purchase. All contingent deferred sales charges are paid to MFD and during the year ended September 30, 2019, were as follows:
| | | | |
| |
| | | Amount | |
| Class A | | | $13,113 | |
| Class B | | | 7,164 | |
| Class C | | | 6,250 | |
| Class 529B | | | — | |
| Class 529C | | | 6 | |
The fund has entered into and may from time to time enter into contracts with program managers and other parties which administer the tuition programs through which an investment in the fund’s 529 share classes is made. The fund has entered into an agreement with MFD pursuant to which MFD receives an annual fee of up to 0.05% of the average daily net assets attributable to each 529 share class. The services provided by MFD, or a third party with which MFD contracts, include recordkeeping and tax reporting and account services, as well as services designed to maintain the program’s compliance with the Internal Revenue Code and other regulatory requirements. Program manager fees for the year ended September 30, 2019, were as follows:
| | | | |
| |
| | | Fee | |
| Class 529A | | | $4,039 | |
| Class 529B | | | 114 | |
| Class 529C | | | 757 | |
| Total Program Manager Fees | | | $4,910 | |
Shareholder Servicing Agent– MFS Service Center, Inc. (MFSC), a wholly-owned subsidiary of MFS, receives a fee from the fund for its services as shareholder servicing agent calculated as a percentage of the average daily net assets of the fund as determined periodically under the supervision of the fund’s Board of Trustees. For the year ended September 30, 2019, the fee was $206,147, which equated to 0.0032% annually of the fund’s average daily net assets. MFSC also receives payment from the fund forout-of-pocket expenses,sub-accounting and other shareholder servicing costs which may be paid to affiliated and unaffiliated service providers. Class R6 shares do not incursub-accounting fees. For the year ended September 30, 2019, theseout-of-pocket expenses,sub-accounting and other shareholder servicing costs amounted to $4,395,266.
Administrator– MFS provides certain financial, legal, shareholder communications, compliance, and other administrative services to the fund. Under an administrative services agreement, the fund reimburses MFS the costs incurred to provide these services. The fund is charged an annual fixed amount of $17,500 plus a fee based on average daily net assets. The administrative services fee incurred for the year ended September 30, 2019 was equivalent to an annual effective rate of 0.0089% of the fund’s average daily net assets.
Trustees’ and Officers’ Compensation– The fund pays compensation to independent Trustees in the form of a retainer, attendance fees, and additional compensation to Board and Committee chairpersons. The fund does not pay
44
Notes to Financial Statements – continued
compensation directly to Trustees or officers of the fund who are also officers of the investment adviser, all of whom receive remuneration from MFS for their services to the fund. Certain officers and Trustees of the fund are officers or directors of MFS, MFD, and MFSC.
Prior to December 31, 2001, the fund had an unfunded defined benefit plan (“DB plan”) for independent Trustees. As of December 31, 2001, the Board took action to terminate the DB plan with respect to then-current and any future independent Trustees. Effective January 1, 2002, accrued benefits under the DB plan forthen-current independent Trustees who continued were credited to an unfunded retirement deferral plan (the “Retirement Deferral plan”), which was established for and exists solely with respect to these credited amounts, and is not available for other deferrals by these or other independent Trustees. Although the Retirement Deferral plan is unfunded, amounts deferred under the plan are periodically adjusted for investment experience as if they had been invested in shares of the fund. The Retirement Deferral plan, which terminated on December 31, 2018, resulted in a net decrease in expense of $245 and is included in “Independent Trustees’ compensation” in the Statement of Operations for the year ended September 30, 2019.
Other– This fund and certain other funds managed by MFS (the funds) had entered into a service agreement (the ISO Agreement) which provided for payment of fees solely by the funds to Tarantino LLC in return for the provision of services of an Independent Senior Officer (ISO) for the funds. Frank L. Tarantino served as the ISO and was an officer of the funds and the sole member of Tarantino LLC. Effective June 30, 2019, Mr. Tarantino retired from his position as ISO for the funds, and the ISO Agreement was terminated. For the year ended September 30, 2019, the fee paid by the fund under this agreement was $10,979 and is included in “Miscellaneous” expense in the Statement of Operations. MFS had agreed to bear all expenses associated with office space, other administrative support, and supplies provided to the ISO.
The fund invests in the MFS Institutional Money Market Portfolio which is managed by MFS and seeks current income consistent with preservation of capital and liquidity. This money market fund does not pay a management fee to MFS.
The fund is permitted to engage in purchase and sale transactions with funds and accounts for which MFS serves as investment adviser orsub-adviser (“cross-trades”) pursuant to a policy adopted by the Board of Trustees. This policy has been designed to ensure that cross-trades conducted by the fund comply with Rule17a-7 under the Investment Company Act of 1940. During the year ended September 30, 2019, the fund engaged in purchase and sale transactions pursuant to this policy, which amounted to $1,441,252 and $978,832, respectively. The sales transactions resulted in net realized gains (losses) of $(6,358).
(4) Portfolio Securities
For the year ended September 30, 2019, purchases and sales of investments, other than short-term obligations, aggregated $1,349,367,740 and $883,236,013, respectively.
45
Notes to Financial Statements – continued
(5) Shares of Beneficial Interest
The fund’s Declaration of Trust permits the Trustees to issue an unlimited number of full and fractional shares of beneficial interest. Transactions in fund shares were as follows:
| | | | | | | | | | | | | | | | |
| | | Year ended
9/30/19 | | | Year ended
9/30/18 | |
| | | | |
| | | Shares | | | Amount | | | Shares | | | Amount | |
| Shares sold | | | | | | | | | | | | | | | | |
Class A | | | 4,800,291 | | | | $152,094,394 | | | | 6,555,105 | | | | $230,678,813 | |
Class B | | | 41,626 | | | | 1,260,250 | | | | 43,169 | | | | 1,470,168 | |
Class C | | | 210,535 | | | | 6,294,886 | | | | 473,025 | | | | 15,845,578 | |
Class I | | | 25,396,305 | | | | 834,838,227 | | | | 16,558,175 | | | | 597,541,984 | |
Class R1 | | | 31,603 | | | | 940,198 | | | | 33,310 | | | | 1,087,975 | |
Class R2 | | | 524,828 | | | | 16,205,806 | | | | 422,585 | | | | 14,490,548 | |
Class R3 | | | 898,563 | | | | 28,414,764 | | | | 1,002,503 | | | | 34,839,942 | |
Class R4 | | | 2,046,856 | | | | 63,717,424 | | | | 2,908,698 | | | | 102,106,126 | |
Class R6 | | | 30,497,869 | | | | 1,006,616,218 | | | | 20,953,786 | | | | 757,098,221 | |
Class 529A | | | 35,818 | | | | 1,124,989 | | | | 41,156 | | | | 1,423,100 | |
Class 529B | | | 581 | | | | 17,339 | | | | 1,057 | | | | 34,620 | |
Class 529C | | | 5,969 | | | | 174,459 | | | | 9,620 | | | | 311,044 | |
| | | 64,490,844 | | | | $2,111,698,954 | | | | 49,002,189 | | | | $1,756,928,119 | |
| | | | |
| Shares issued to shareholders in reinvestment of distributions | | | | | | | | | | | | | | | | |
Class A | | | 1,939,000 | | | | $56,366,740 | | | | 829,311 | | | | $27,964,358 | |
Class B | | | 22,816 | | | | 643,863 | | | | 8,344 | | | | 273,848 | |
Class C | | | 133,835 | | | | 3,703,205 | | | | 84,593 | | | | 2,724,748 | |
Class I | | | 3,258,598 | | | | 97,562,421 | | | | 1,264,484 | | | | 43,839,647 | |
Class R1 | | | 4,897 | | | | 132,037 | | | | 2,069 | | | | 65,039 | |
Class R2 | | | 70,768 | | | | 2,002,751 | | | | 35,779 | | | | 1,174,978 | |
Class R3 | | | 278,693 | | | | 8,026,352 | | | | 132,666 | | | | 4,433,688 | |
Class R4 | | | 586,124 | | | | 16,997,589 | | | | 260,003 | | | | 8,749,106 | |
Class R6 | | | 4,999,594 | | | | 149,737,848 | | | | 1,737,606 | | | | 60,277,572 | |
Class 529A | | | 16,439 | | | | 469,327 | | | | 6,142 | | | | 203,688 | |
Class 529B | | | 569 | | | | 15,379 | | | | 220 | | | | 6,920 | |
Class 529C | | | 3,280 | | | | 87,569 | | | | 1,314 | | | | 40,951 | |
| | | 11,314,613 | | | | $335,745,081 | | | | 4,362,531 | | | | $149,754,543 | |
| | | | |
| Shares reacquired | | | | | | | | | | | | | | | | |
Class A | | | (8,788,160 | ) | | | $(279,390,465 | ) | | | (10,779,950 | ) | | | $(376,937,771 | ) |
Class B | | | (141,535 | ) | | | (4,339,305 | ) | | | (128,593 | ) | | | (4,377,889 | ) |
Class C | | | (895,003 | ) | | | (27,027,561 | ) | | | (2,813,801 | ) | | | (94,671,170 | ) |
Class I | | | (25,740,731 | ) | | | (844,901,220 | ) | | | (14,267,477 | ) | | | (513,141,694 | ) |
Class R1 | | | (35,360 | ) | | | (1,022,229 | ) | | | (85,798 | ) | | | (2,769,756 | ) |
Class R2 | | | (649,983 | ) | | | (20,242,311 | ) | | | (655,695 | ) | | | (22,336,872 | ) |
Class R3 | | | (1,290,262 | ) | | | (40,756,378 | ) | | | (2,174,857 | ) | | | (75,774,692 | ) |
Class R4 | | | (3,236,361 | ) | | | (102,745,711 | ) | | | (3,950,700 | ) | | | (139,030,483 | ) |
Class R6 | | | (8,345,483 | ) | | | (272,338,063 | ) | | | (11,030,833 | ) | | | (400,541,400 | ) |
Class 529A | | | (45,742 | ) | | | (1,440,979 | ) | | | (28,714 | ) | | | (991,042 | ) |
Class 529B | | | (2,446 | ) | | | (71,714 | ) | | | (2,592 | ) | | | (85,121 | ) |
Class 529C | | | (16,255 | ) | | | (468,838 | ) | | | (24,112 | ) | | | (782,501 | ) |
| | | (49,187,321 | ) | | | $(1,594,744,774 | ) | | | (45,943,122 | ) | | | $(1,631,440,391 | ) |
46
Notes to Financial Statements – continued
| | | | | | | | | | | | | | | | |
| | | Year ended
9/30/19 | | | Year ended
9/30/18 | |
| | | | |
| | | Shares | | | Amount | | | Shares | | | Amount | |
| Net change | | | | | | | | | | | | | | | | |
Class A | | | (2,048,869 | ) | | | $(70,929,331 | ) | | | (3,395,534 | ) | | | $(118,294,600 | ) |
Class B | | | (77,093 | ) | | | (2,435,192 | ) | | | (77,080 | ) | | | (2,633,873 | ) |
Class C | | | (550,633 | ) | | | (17,029,470 | ) | | | (2,256,183 | ) | | | (76,100,844 | ) |
Class I | | | 2,914,172 | | | | 87,499,428 | | | | 3,555,182 | | | | 128,239,937 | |
Class R1 | | | 1,140 | | | | 50,006 | | | | (50,419 | ) | | | (1,616,742 | ) |
Class R2 | | | (54,387 | ) | | | (2,033,754 | ) | | | (197,331 | ) | | | (6,671,346 | ) |
Class R3 | | | (113,006 | ) | | | (4,315,262 | ) | | | (1,039,688 | ) | | | (36,501,062 | ) |
Class R4 | | | (603,381 | ) | | | (22,030,698 | ) | | | (781,999 | ) | | | (28,175,251 | ) |
Class R6 | | | 27,151,980 | | | | 884,016,003 | | | | 11,660,559 | | | | 416,834,393 | |
Class 529A | | | 6,515 | | | | 153,337 | | | | 18,584 | | | | 635,746 | |
Class 529B | | | (1,296 | ) | | | (38,996 | ) | | | (1,315 | ) | | | (43,581 | ) |
Class 529C | | | (7,006 | ) | | | (206,810 | ) | | | (13,178 | ) | | | (430,506 | ) |
| | | 26,618,136 | | | | $852,699,261 | | | | 7,421,598 | | | | $275,242,271 | |
Class T shares were not publicly available for sale during the period. Please see the fund’s prospectus for details.
Effective June 1, 2019, purchases of the fund’s Class B and Class 529B shares are closed to new and existing investors subject to certain exceptions. Please see the fund’s prospectus for details.
Effective at the close of business on November 29, 2019, the fund will be closed to new investors with certain exceptions. Please see the fund’s prospectus for details.
The fund is one of several mutual funds in which certain MFS funds may invest. The MFS funds do not invest in the underlying funds for the purpose of exercising management or control. At the end of the period, the MFS International Diversification Fund, the MFS Growth Allocation Fund, and the MFS Aggressive Growth Allocation Fund were the owners of record of approximately 27%, 1%, and 1%, respectively, of the value of outstanding voting shares of the fund. In addition, the MFS Moderate Allocation Fund, the MFS Lifetime 2025 Fund, the MFS Lifetime 2030 Fund, the MFS Lifetime 2035 Fund, the MFS Lifetime 2040 Fund, the MFS Lifetime 2045 Fund, the MFS Lifetime 2050 Fund, the MFS Lifetime 2055 Fund, and the MFS Lifetime 2060 Fund were each the owners of record of less than 1% of the value of outstanding voting shares of the fund.
(6) Line of Credit
The fund and certain other funds managed by MFS participate in a $1.25 billion unsecured committed line of credit, subject to a $1 billion sublimit, provided by a syndicate of banks under a credit agreement. Borrowings may be made for temporary financing needs. Interest is charged to each fund, based on its borrowings, generally at a rate equal to the highest of one month LIBOR, the Federal Funds Effective Rate and the Overnight Bank Funding Rate, plus an agreed upon spread. A commitment fee, based on the average daily, unused portion of the committed line of credit, is allocated among the participating funds. In addition, the fund and other funds managed by MFS have established unsecured uncommitted borrowing arrangements with certain banks
47
Notes to Financial Statements – continued
for temporary financing needs. Interest is charged to each fund, based on its borrowings, at rates equal to customary reference rates plus an agreed upon spread. For the year ended September 30, 2019, the fund’s commitment fee and interest expense were $38,042 and $0, respectively, and are included in “Miscellaneous” expense in the Statement of Operations.
(7) Investments in Affiliated Issuers
An affiliated issuer may be considered one in which the fund owns 5% or more of the outstanding voting securities, or a company which is under common control. For the purposes of this report, the following were affiliated issuers:
| | | | | | | | | | | | | | | | | | | | | | | | |
| | | | | | |
| Affiliated Issuers | | Beginning
Value | | | Purchases | | | Sales
Proceeds | | | Realized
Gain
(Loss) | | | Change in
Unrealized
Appreciation or
Depreciation | | | Ending
Value | |
| MFS Institutional Money Market Portfolio | | | $311,703,579 | | | | $955,769,792 | | | | $858,557,600 | | | | $(4,036 | ) | | | $28,650 | | | | $408,940,385 | |
| Midland Holdings Ltd. | | | 11,455,165 | | | | — | | | | — | | | | — | | | | (6,082,396 | ) | | | 5,372,769 | |
| | | $323,158,744 | | | | $955,769,792 | | | | $858,557,600 | | | | $(4,036 | ) | | | $(6,053,746 | ) | | | $414,313,154 | |
| | | | | | |
| Affiliated Issuers | | | | | | | | | | | | | | Dividend
Income | | | Capital Gain
Distributions | |
| MFS Institutional Money Market Portfolio | | | | | | | | | | | | $8,766,700 | | | | $— | |
| Midland Holdings Ltd. | | | | | | | | | | | | | | | | | | | — | | | | — | |
| | | | | | | | | | | | | | | | | | | $8,766,700 | | | | $— | |
48
REPORT OF INDEPENDENT REGISTERED PUBLIC ACCOUNTING FIRM
To the Shareholders of MFS International New Discovery Fund and the Board of Trustees of MFS Series Trust V
Opinion on the Financial Statements
We have audited the accompanying statement of assets and liabilities of MFS International New Discovery Fund (the “Fund”) (one of the funds constituting MFS Series Trust V (the “Trust”)), including the portfolio of investments, as of September 30, 2019,and the related statement of operations for the year then ended, the statements of changes in net assets for each of the two years in the period then ended, the financial highlights for each of the five years in the period then ended and the related notes (collectively referred to as the “financial statements”). In our opinion, the financial statements present fairly, in all material respects, the financial position of the Fund (one of the funds constituting MFS Series Trust V) at September 30, 2019, the results of its operations for the year then ended, the changes in its net assets for each of the two years in the period then ended and its financial highlights for each of the five years in the period then ended, in conformity with U.S. generally accepted accounting principles.
Basis for Opinion
These financial statements are the responsibility of the Trust’s management. Our responsibility is to express an opinion on the Fund’s financial statements based on our audits. We are a public accounting firm registered with the Public Company Accounting Oversight Board (United States) (“PCAOB”) and are required to be independent with respect to the Trust in accordance with the U.S. federal securities laws and the applicable rules and regulations of the Securities and Exchange Commission and the PCAOB.
We conducted our audits in accordance with the standards of the PCAOB. Those standards require that we plan and perform the audit to obtain reasonable assurance about whether the financial statements are free of material misstatement, whether due to error or fraud. The Trust is not required to have, nor were we engaged to perform, an audit of the Trust’s internal control over financial reporting. As part of our audits we are required to obtain an understanding of internal control over financial reporting but not for the purpose of expressing an opinion on the effectiveness of the Trust’s internal control over financial reporting. Accordingly, we express no such opinion.
Our audits included performing procedures to assess the risks of material misstatement of the financial statements, whether due to error or fraud, and performing procedures that respond to those risks. Such procedures included examining, on a test basis, evidence regarding the amounts and disclosures in the financial statements. Our procedures included confirmation of securities owned as of September 30, 2019,by correspondence with the custodian andothers or by other appropriate auditing procedures where replies from others were not received. Our audits also included
49
Report of Independent Registered Public Accounting Firm – continued
evaluating the accounting principles used and significant estimates made by
management, as well as evaluating the overall presentation of the financial statements. We believe that our audits provide a reasonable basis for our opinion.

We have served as the auditor of one or more MFS investment companies since 1993.
Boston, Massachusetts
November 15, 2019
50
TRUSTEES AND OFFICERS — IDENTIFICATION AND BACKGROUND
The Trustees and Officers of the Trust, as of November 1, 2019, are listed below, together with their principal occupations during the past five years. (Their titles may have varied during that period.) The address of each Trustee and Officer is 111 Huntington Avenue, Boston, Massachusetts 02199-7618.
| | | | | | | | | | |
Name, Age | | Position(s)
Held with Fund | | Trustee/Officer Since (h) | | Number of
MFS Funds
overseen
by the
Trustee | | Principal
Occupations During the Past Five Years | | Other Directorships
During the Past
Five Years (j) |
| INTERESTED TRUSTEES |
Robert J. Manning (k)
(age 56) | | Trustee | | February 2004 | | 133 | | Massachusetts Financial Services Company, Executive Chairman (since January 2017); Director; Chairman of the Board; Chief Executive Officer (until 2015);Co-Chief Executive Officer (2015-2016) | | N/A |
| | | | | |
Robin A. Stelmach (k) (age 58) | | Trustee | | January 2014 | | 133 | | Massachusetts Financial Services Company, Vice Chair (since January 2017); Chief Operating Officer and Executive Vice President (until January 2017) | | N/A |
| INDEPENDENT TRUSTEES |
John P. Kavanaugh (age 64) | | Trustee and Chair of Trustees | | January 2009 | | 133 | | Private investor | | N/A |
| | | | | |
Steven E. Buller (age 68) | | Trustee | | February 2014 | | 133 | | Financial Accounting Standards Advisory Council, Chairman (2014-2015); Public Company Accounting Oversight Board, Standing Advisory Group, Member (until 2014); BlackRock, Inc. (investment management), Managing Director (until 2014), BlackRock Finco UK (investment management), Director (until 2014) | | N/A |
51
Trustees and Officers – continued
| | | | | | | | | | |
Name, Age | | Position(s)
Held with Fund | | Trustee/Officer Since (h) | | Number of
MFS Funds
overseen
by the
Trustee | | Principal
Occupations During the Past Five Years | | Other Directorships
During the Past
Five Years (j) |
John A. Caroselli (age 65) | | Trustee | | March 2017 | | 133 | | JC Global Advisors, LLC (management consulting), President (since 2015); First Capital Corporation (commercial finance), Executive Vice President (until 2015) | | N/A |
| | | | | |
Maureen R. Goldfarb (age 64) | | Trustee | | January 2009 | | 133 | | Private investor | | N/A |
| | | | | |
Michael Hegarty
(age 74) | | Trustee | | December 2004 | | 133 | | Private investor | | Rouse Properties Inc., Director (until 2016); Capmark Financial Group Inc., Director (until 2015) |
| | | | | |
Peter D. Jones
(age 64) | | Trustee | | January 2019 | | 133 | | Franklin Templeton Distributors, Inc. (investment management), President (until 2015); Franklin Templeton Institutional, LLC (investment management), Chairman (until 2015) | | N/A |
| | | | | |
James W. Kilman, Jr.
(age 58) | | Trustee | | January 2019 | | 133 | | Burford Capital Limited (finance and investment management), Chief Financial Officer (since 2019); KielStrand Capital LLC (family office and merchant bank), Chief Executive Officer (since 2016); Morgan Stanley & Co. (financial services), Vice Chairman of Investment Banking,Co-Head of Diversified Financials Coverage – Financial Institutions Investment Banking Group (until 2016) | | Alpha-En Corporation, Director (since 2016) |
52
Trustees and Officers – continued
| | | | | | | | | | |
Name, Age | | Position(s)
Held with Fund | | Trustee/Officer Since (h) | | Number of
MFS Funds
overseen
by the
Trustee | | Principal
Occupations During the Past Five Years | | Other Directorships
During the Past
Five Years (j) |
Clarence Otis, Jr. (age 63) | | Trustee | | March 2017 | | 133 | | Darden Restaurants, Inc., Chief Executive Officer (until 2014) | | VF Corporation, Director; Verizon Communications, Inc., Director; The Travelers Companies, Director; Federal Reserve Bank of Atlanta, Director (until 2015) |
| | | | | |
Maryanne L. Roepke (age 63) | | Trustee | | May 2014 | | 133 | | American Century Investments (investment management), Senior Vice President and Chief Compliance Officer (until 2014) | | N/A |
| | | | | |
Laurie J. Thomsen
(age 62) | | Trustee | | March 2005 | | 133 | | Private investor | | The Travelers Companies, Director; Dycom Industries, Inc., Director (since 2015) |
| | | | | | | | |
Name, Age | | Position(s) Held
with Fund | | Trustee/Officer
Since (h) | | Number of
MFS Funds
for which
the Person
is an Officer | | Principal
Occupations During
the Past Five Years |
| OFFICERS | | | | | | | | |
Christopher R. Bohane (k)
(age 45) | | Assistant Secretary and Assistant Clerk | | July 2005 | | 133 | | Massachusetts Financial Services Company, Vice President and Assistant General Counsel |
| | | | |
Kino Clark (k) (age 51) | | Assistant Treasurer | | January 2012 | | 133 | | Massachusetts Financial Services Company, Vice President |
53
Trustees and Officers – continued
| | | | | | | | |
Name, Age | | Position(s) Held
with Fund | | Trustee/Officer
Since (h) | | Number of
MFS Funds
for which
the Person
is an Officer | | Principal
Occupations During
the Past Five Years |
John W. Clark, Jr. (k) (age 52) | | Assistant Treasurer | | April 2017 | | 133 | | Massachusetts Financial Services Company, Vice President (since March 2017); Deutsche Bank (financial services), Department Head – Treasurer’s Office (until February 2017) |
| | | | |
Thomas H. Connors (k) (age 60) | | Assistant Secretary and Assistant Clerk | | September 2012 | | 133 | | Massachusetts Financial Services Company, Vice President and Senior Counsel |
| | | | |
David L. DiLorenzo (k)
(age 51) | | President | | July 2005 | | 133 | | Massachusetts Financial Services Company, Senior Vice President |
| | | | |
Heidi W. Hardin (k) (age 52) | | Secretary and Clerk | | April 2017 | | 133 | | Massachusetts Financial Services Company, Executive Vice President and General Counsel (since March 2017); Harris Associates (investment management), General Counsel (from September 2015 to January 2017); Janus Capital Management LLC (investment management), Senior Vice President and General Counsel (until September 2015) |
| | | | |
Brian E. Langenfeld (k) (age 46) | | Assistant Secretary and Assistant Clerk | | June 2006 | | 133 | | Massachusetts Financial Services Company, Vice President and Senior Counsel |
| | | | |
Amanda S. Mooradian (k) (age 40) | | Assistant Secretary and Assistant Clerk | | September 2018 | | 133 | | Massachusetts Financial Services Company, Assistant Vice President and Counsel |
54
Trustees and Officers – continued
| | | | | | | | |
Name, Age | | Position(s) Held
with Fund | | Trustee/Officer
Since (h) | | Number of
MFS Funds
for which
the Person
is an Officer | | Principal
Occupations During
the Past Five Years |
Susan A. Pereira (k)
(age 48) | | Assistant Secretary and Assistant Clerk | | July 2005 | | 133 | | Massachusetts Financial Services Company, Vice President and Assistant General Counsel |
| | | | |
Kasey L. Phillips (k) (age 48) | | Assistant Treasurer | | September 2012 | | 133 | | Massachusetts Financial Services Company, Vice President |
| | | | |
Matthew A. Stowe (k) (age 44) | | Assistant Secretary and Assistant Clerk | | October 2014 | | 133 | | Massachusetts Financial Services Company, Vice President and Assistant General Counsel |
| | | | |
Martin J. Wolin (k) (age 52) | | Chief Compliance Officer | | July 2015 | | 133 | | Massachusetts Financial Services Company, Senior Vice President and Chief Compliance Officer (since July 2015); Mercer (financial service provider), Chief Risk and Compliance Officer, North America and Latin America (until June 2015) |
| | | | |
James O. Yost (k)
(age 59) | | Treasurer | | September 1990 | | 133 | | Massachusetts Financial Services Company, Senior Vice President |
| (h) | Date first appointed to serve as Trustee/officer of an MFS Fund. Each Trustee has served continuously since appointment unless indicated otherwise. For the period from December 15, 2004 until February 22, 2005, Mr. Manning served as Advisory Trustee. From January 2012 through December 2016, Messrs. DiLorenzo and Yost served as Treasurer and Deputy Treasurer of the Funds, respectively. |
| (j) | Directorships or trusteeships of companies required to report to the Securities and Exchange Commission (i.e., “public companies”). |
| (k) | “Interested person” of the Trust within the meaning of the Investment Company Act of 1940 (referred to as the 1940 Act), which is the principal federal law governing investment companies like the fund, as a result of a position with MFS. The address of MFS is 111 Huntington Avenue, Boston, Massachusetts 02199-7618. |
Each Trustee (other than Messrs. Jones and Kilman) has been elected by shareholders and each Trustee and Officer holds office until his or her successor is chosen and qualified or until his or her earlier death, resignation, retirement or removal. Messrs. Jones and Kilman became Trustees of the Funds on January 1, 2019. The Trust does
55
Trustees and Officers – continued
not hold annual meetings for the purpose of electing Trustees, and Trustees are not elected for fixed terms. Under the terms of the Board’s retirement policy, an Independent Trustee shall retire at the end of the calendar year in which he or she reaches the earlier of 75 years of age or 15 years of service on the Board (or, in the case of any Independent Trustee who joined the Board prior to 2015, 20 years of service on the Board).
Messrs. Buller, Hegarty, Kilman and Otis and Ms. Roepke are members of the Trust’s Audit Committee.
Each of the Interested Trustees and certain Officers hold comparable officer positions with certain affiliates of MFS.
The Statement of Additional Information for a Fund includes further information about the Trustees and is available without charge upon request by calling1-800-225-2606.
| | |
| Investment Adviser | | Custodian |
Massachusetts Financial Services Company
111 Huntington Avenue Boston, MA 02199-7618 | | JPMorgan Chase Bank, NA 4 Metrotech Center New York, NY 11245 |
| Distributor | | Independent Registered Public Accounting Firm |
MFS Fund Distributors, Inc.
111 Huntington Avenue Boston, MA 02199-7618 | | Ernst & Young LLP 200 Clarendon Street Boston, MA 02116 |
| Portfolio Manager(s) | | |
David Antonelli Peter Fruzzetti Jose Luis Garcia Robert Lau | | |
56
BOARD REVIEW OF INVESTMENT ADVISORY AGREEMENT
The Investment Company Act of 1940 requires that both the full Board of Trustees and a majority of thenon-interested (“independent”) Trustees, voting separately, annually approve the continuation of the Fund’s investment advisory agreement with MFS. The Trustees consider matters bearing on the Fund and its advisory arrangements at their meetings throughout the year, including a review of performance data at each regular meeting. In addition, the independent Trustees met several times over the course of three months beginning in May and ending in July, 2019 (“contract review meetings”) for the specific purpose of considering whether to approve the continuation of the investment advisory agreement for the Fund and the other investment companies that the Board oversees (the “MFS Funds”). The independent Trustees were assisted in their evaluation of the Fund’s investment advisory agreement by independent legal counsel, from whom they received separate legal advice and with whom they met separately from MFS during various contract review meetings. The independent Trustees were also assisted in this process by the MFS Funds’ Independent Senior Officer, a senior officer appointed by and reporting to the independent Trustees.
In connection with their deliberations regarding the continuation of the investment advisory agreement, the Trustees, including the independent Trustees, considered such information and factors as they believed, in light of the legal advice furnished to them and their own business judgment, to be relevant. The investment advisory agreement for the Fund was considered separately, although the Trustees also took into account the common interests of all MFS Funds in their review. As described below, the Trustees considered the nature, quality, and extent of the various investment advisory, administrative, and shareholder services performed by MFS under the existing investment advisory agreement and other arrangements with the Fund.
In connection with their contract review meetings, the Trustees received and relied upon materials that included, among other items: (i) information provided by Broadridge Financial Solutions, Inc. (“Broadridge”), an independent third party, on the investment performance of the Fund for various time periods ended December 31, 2018 and the investment performance of a group of funds with substantially similar investment classifications/objectives (the “Broadridge performance universe”), (ii) information provided by Broadridge on the Fund’s advisory fees and other expenses and the advisory fees and other expenses of comparable funds identified by Broadridge as well as all other funds in the same investment classification/category (the “Broadridge expense group and universe”), (iii) information provided by MFS on the advisory fees of portfolios of other clients of MFS, including institutional separate accounts and other clients, (iv) information as to whether and to what extent applicable expense waivers, reimbursements or fee “breakpoints” are observed for the Fund, (v) information regarding MFS’ financial results and financial condition, including MFS’ and certain of its affiliates’ estimated profitability from services performed for the Fund and the MFS Funds as a whole, and compared to MFS’ institutional business, (vi) MFS’ views regarding the outlook for the mutual fund industry and the strategic business plans of MFS, (vii) descriptions of various functions performed by MFS for the Funds, such as compliance monitoring and portfolio trading practices, and (viii) information regarding the overall organization of MFS, including
57
Board Review of Investment Advisory Agreement – continued
information about MFS’ senior management and other personnel providing investment advisory, administrative and other services to the Fund and the other MFS Funds. The comparative performance, fee and expense information prepared and provided by Broadridge was not independently verified and the independent Trustees did not independently verify any information provided to them by MFS.
The Trustees’ conclusion as to the continuation of the investment advisory agreement was based on a comprehensive consideration of all information provided to the Trustees and not the result of any single factor. Some of the factors that figured particularly in the Trustees’ deliberations are described below, although individual Trustees may have evaluated the information presented differently from one another, giving different weights to various factors. It is also important to recognize that the fee arrangements for the Fund and other MFS Funds are the result of years of review and discussion between the independent Trustees and MFS, that certain aspects of such arrangements may receive greater scrutiny in some years than in others, and that the Trustees’ conclusions may be based, in part, on their consideration of these same arrangements during the course of the year and in prior years.
Based on information provided by Broadridge and MFS, the Trustees reviewed the Fund’s total return investment performance as well as the Broadridge performance universe over various time periods. The Trustees placed particular emphasis on the total return performance of the Fund’s Class A shares in comparison to the performance of funds in its Broadridge performance universe over the five-year period ended December 31, 2018, which the Trustees believed was a long enough period to reflect differing market conditions. The total return performance of the Fund’s Class A shares was in the 2nd quintile relative to the other funds in the universe for this five-year period (the 1st quintile being the best performers and the 5th quintile being the worst performers). The total return performance of the Fund’s Class A shares was in the 1st quintile for each of theone- and three-year periods ended December 31, 2018 relative to the Broadridge performance universe. Because of the passage of time, these performance results may differ from the performance results for more recent periods, including those shown elsewhere in this report.
In addition to considering the performance information provided in connection with the contract review meetings, the Trustees noted that, in light of the Fund’s substandard relative performance at the time of their contract review meetings in 2018, they had met at each of their regular meetings since then with MFS’ senior investment management personnel to discuss the Fund’s performance and MFS’ efforts to improve the Fund’s performance. The Trustees further noted that the Fund’sfive-year performance as compared to its Broadridge performance universe improved for the period ended December 31, 2018, as compared to the prior year. Taking this information into account, the Trustees concluded, within the context of their overall conclusions regarding the investment advisory agreement, that they were satisfied with MFS’ responses and efforts relating to investment performance.
In assessing the reasonableness of the Fund’s advisory fee, the Trustees considered, among other information, the Fund’s advisory fee and the total expense ratio of the Fund’s Class A shares as a percentage of average daily net assets and the advisory fee and total expense ratios of the Broadridge expense group based on information
58
Board Review of Investment Advisory Agreement – continued
provided by Broadridge. The Trustees considered that, according to the data provided by Broadridge (which takes into account any fee reductions or expense limitations that were in effect during the Fund’s last fiscal year), the Fund’s effective advisory fee rate was approximately at the Broadridge expense group median and the Fund’s total expense ratio was lower than the Broadridge expense group median.
The Trustees also considered the advisory fees charged by MFS to any institutional separate accounts advised by MFS (“separate accounts”) and unaffiliated investment companies for which MFS serves as subadviser (“subadvised funds”) that have comparable investment strategies to the Fund, if any. In comparing these fees, the Trustees considered information provided by MFS as to the generally broader scope of services provided by MFS to the Fund, as well as the more extensive regulatory burdens imposed on MFS in managing the Fund, in comparison to separate accounts and subadvised funds. The Trustees also considered the higher demands placed on MFS’ investment personnel and trading infrastructure as a result of the daily cashin-flows andout-flows of the Fund in comparison to separate accounts.
The Trustees also considered whether the Fund may benefit from any economies of scale in the management of the Fund in the event of growth in assets of the Fund and/or growth in assets of the MFS Funds as a whole. They noted that the Fund’s advisory fee rate schedule is subject to contractual breakpoints that reduce the Fund’s advisory fee rate on average daily net assets over $500 million, $1 billion, $3 billion, $5 billion and $10 billion. The Trustees also noted that MFS has agreed in writing to waive a portion of the management fees of certain MFS Funds, including the Fund, if the total combined assets of certain funds within the MFS Funds’ complex increase above agreed upon thresholds (the “group fee waiver”), enabling the Fund’s shareholders to share in the benefits from any economies of scale at the complex level. The group fee waiver is reviewed and renewed annually between the Board and MFS. The Trustees concluded that the breakpoints and the group fee waiver were sufficient to allow the Fund to benefit from economies of scale as its assets and overall complex assets grow.
The Trustees also considered information prepared by MFS relating to MFS’ costs and profits with respect to the Fund, the MFS Funds considered as a group, and other investment companies and accounts advised by MFS, as well as MFS’ methodologies used to determine and allocate its costs to the MFS Funds, the Fund and other accounts and products for purposes of estimating profitability.
After reviewing these and other factors described herein, the Trustees concluded, within the context of their overall conclusions regarding the investment advisory agreement, that the advisory fees charged to the Fund represent reasonable compensation in light of the services being provided by MFS to the Fund.
In addition, the Trustees considered MFS’ resources and related efforts to continue to retain, attract and motivate capable personnel to serve the Fund. The Trustees also considered current and developing conditions in the financial services industry, including the presence of large and well-capitalized companies which are spending, and appear to be prepared to continue to spend, substantial sums to engage personnel and to provide services to competing investment companies. In this regard, the Trustees also considered the financial resources of MFS and its ultimate parent, Sun Life
59
Board Review of Investment Advisory Agreement – continued
Financial Inc. The Trustees also considered the advantages and possible disadvantages to the Fund of having an adviser that also serves other investment companies as well as other accounts.
The Trustees also considered the nature, quality, cost, and extent of administrative, transfer agency, and distribution services provided to the Fund by MFS and its affiliates under agreements and plans other than the investment advisory agreement, including any12b-1 fees the Fund pays to MFS Fund Distributors, Inc., an affiliate of MFS. The Trustees also considered the nature, extent and quality of certain other services MFS performs or arranges for on the Fund’s behalf, which may include securities lending programs, directed expense payment programs, class action recovery programs, and MFS’ interaction with third-party service providers, principally custodians andsub-custodians. The Trustees concluded that the variousnon-advisory services provided by MFS and its affiliates on behalf of the Fund were satisfactory.
The Trustees consideredso-called“fall-out benefits” to MFS such as reputational value derived from serving as investment manager to the MFS Funds. The Trustees also considered that, effective January 3, 2018, MFS had discontinued its historic practice of obtaining investment research from portfolio brokerage commissions paid by certain MFS Funds and would thereafter directly pay for or voluntarily reimburse a Fund, if applicable, for the costs of external research acquired through the use of the Fund’s portfolio brokerage commissions.
Based on their evaluation of factors that they deemed to be material, including those factors described above, the Board of Trustees, including the independent Trustees, concluded that the Fund’s investment advisory agreement with MFS should be continued for an additionalone-year period, commencing August 1, 2019.
60
PROXY VOTING POLICIES AND INFORMATION
MFS votes proxies on behalf of the fund pursuant to proxy voting policies and procedures that are available without charge, upon request, by calling1-800-225-2606, by visitingmfs.com/proxyvoting,or by visiting the SEC’s Web site athttp://www.sec.gov.
Information regarding how the fund voted proxies relating to portfolio securities during the most recent twelve-month period ended June 30 is available by August 31 of each year without charge by visitingmfs.com/proxyvoting,or by visiting the SEC’s Web site athttp://www.sec.gov.
QUARTERLY PORTFOLIO DISCLOSURE
The fund files a complete schedule of portfolio holdings with the SEC for the first and third quarters of each fiscal year on Form N-Q or as an exhibit to its reports onForm N-PORT (for first and third fiscal quarters ending March 31, 2019 or after). The fund’s Form N-Q or Form N-PORT reports are available on the SEC’s website athttp://www.sec.gov.A shareholder can obtain the portfolio holdings report for the first and third quarters of the fund’s fiscal year atmfs.com/openendfunds by choosing the fund’s name and then selecting the “Resources” tab and clicking on “Prospectus and Reports”.
FURTHER INFORMATION
From time to time, MFS may post important information about the fund or the MFS funds on the MFS web site (mfs.com). This information is available athttps://www.mfs.com/en-us/what-we-do/announcements.htmlor atmfs.com/openendfundsby choosing the fund’s name.
INFORMATION ABOUT FUND CONTRACTS AND LEGAL CLAIMS
The fund has entered into contractual arrangements with an investment adviser, administrator, distributor, shareholder servicing agent, 529 program manager (if applicable), and custodian who each provide services to the fund. Unless expressly stated otherwise, shareholders are not parties to, or intended beneficiaries of these contractual arrangements, and these contractual arrangements are not intended to create any shareholder right to enforce them against the service providers or to seek any remedy under them against the service providers, either directly or on behalf of the fund.
Under the Trust’s By-Laws and Declaration of Trust, any claims asserted against or on behalf of the MFS Funds, including claims against Trustees and Officers, must be brought in state and federal courts located within the Commonwealth of Massachusetts.
FEDERAL TAX INFORMATION (unaudited)
The fund will notify shareholders of amounts for use in preparing 2019 income tax forms in January 2020. The following information is provided pursuant to provisions of the Internal Revenue Code.
The fund designates the maximum amount allowable as qualified dividend income eligible to be taxed at the same rate as long-term capital gain.
The fund designates $344,541,000 as capital gain dividends paid during the fiscal year.
Income derived from foreign sources was $146,341,203. The fund intends to pass through foreign tax credits of $9,586,691 for the fiscal year.
61
rev. 3/16
| | | | |
| | | |
FACTS | | WHAT DOES MFS DO WITH YOUR PERSONAL INFORMATION? | |  |
| | |
| Why? | | Financial companies choose how they share your personal information. Federal law gives consumers the right to limit some but not all sharing. Federal law also requires us to tell you how we collect, share, and protect your personal information. Please read this notice carefully to understand what we do. |
| | |
| What? | | The types of personal information we collect and share depend on the product or service you have with us. This information can include: • Social Security number and account balances • Account transactions and transaction history • Checking account information and wire transfer instructions When you areno longer our customer, we continue to share your information as described in this notice. |
| | |
| How? | | All financial companies need to share customers’ personal information to run their everyday business. In the section below, we list the reasons financial companies can share their customers’ personal information; the reasons MFS chooses to share; and whether you can limit this sharing. |
| | | | |
Reasons we can share your
personal information | | Does MFS
share? | | Can you limit
this sharing? |
For our everyday business purposes – such as to process your transactions, maintain your account(s), respond to court orders and legal investigations, or report to credit bureaus | | Yes | | No |
For our marketing purposes – to offer our products and services to you | | No | | We don’t share |
For joint marketing with other financial companies | | No | | We don’t share |
For our affiliates’ everyday business purposes – information about your transactions and experiences | | No | | We don’t share |
For our affiliates’ everyday business purposes – information about your creditworthiness | | No | | We don’t share |
| For nonaffiliates to market to you | | No | | We don’t share |
| | |
| | |
| Questions? | | Call800-225-2606 or go tomfs.com. |
62
| | |
| Who we are |
| Who is providing this notice? | | MFS Funds, MFS Investment Management, MFS Institutional Advisors, Inc., and MFS Heritage Trust Company. |
| | |
| What we do |
| How does MFS protect my personal information? | | To protect your personal information from unauthorized access and use, we use security measures that comply with federal law. These measures include procedural, electronic, and physical safeguards for the protection of the personal information we collect about you. |
| How does MFS collect my personal information? | | We collect your personal information, for example, when you • open an account or provide account information • direct us to buy securities or direct us to sell your securities • make a wire transfer We also collect your personal information from others, such as credit bureaus, affiliates, or other companies. |
| Why can’t I limit all sharing? | | Federal law gives you the right to limit only • sharing for affiliates’ everyday business purposes – information about your creditworthiness • affiliates from using your information to market to you • sharing for nonaffiliates to market to you State laws and individual companies may give you additional rights to limit sharing. |
| | |
| Definitions |
| Affiliates | | Companies related by common ownership or control. They can be financial and nonfinancial companies. • MFS does not share personal information with affiliates, except for everyday business purposes as described on page one of this notice. |
| Nonaffiliates | | Companies not related by common ownership or control. They can be financial and nonfinancial companies. • MFS does not share with nonaffiliates so they can market to you. |
| Joint marketing | | A formal agreement between nonaffiliated financial companies that together market financial products or services to you. • MFS doesn’t jointly market. |
| | |
| Other important information |
| If you own an MFS product or receive an MFS service in the name of a third party such as a bank or broker-dealer, their privacy policy may apply to you instead of ours. |
63
Save paper with eDelivery.

| MFS® will send you prospectuses, |
reports, and proxies directly viae-mail so you will get information faster with less mailbox clutter.
To sign up:
1. Go to mfs.com.
2. Log in via MFS® Access.
3. Select eDelivery.
If you own your MFS fund shares through a financial institution or a retirement plan, MFS® TALK, MFS® Access, or eDelivery may not be available to you.
CONTACT
WEB SITE
mfs.com
MFS TALK
1-800-637-8255
24 hours a day
ACCOUNT SERVICE AND LITERATURE
Shareholders
1-800-225-2606
Financial advisors
1-800-343-2829
Retirement plan services
1-800-637-1255
MAILING ADDRESS
MFS Service Center, Inc.
P.O. Box 219341
Kansas City, MO 64121-9341
OVERNIGHT MAIL
MFS Service Center, Inc.
Suite 219341
430 W 7th Street
Kansas City, MO 64105-1407
Annual Report
September 30, 2019

MFS® Research Fund

Beginning on January 1, 2021, as permitted by regulations adopted by the U.S. Securities and Exchange Commission, paper copies of the fund’s annual and semiannual shareholder reports will no longer be sent by mail, unless you specifically request paper copies of the reports. Instead, the complete reports will be made available on the fund’s Web site (funds.mfs.com), and you will be notified by mail each time a report is posted and provided with a Web site link to access the report.
If you are already signed up to receive shareholder reports by email, you will not be affected by this change and you need not take any action. You may sign up to receive shareholder reports and other communications from the fund by email by contacting your financial intermediary (such as a broker-dealer or bank) or, if you hold your shares directly with the fund, by calling 1-800-225-2606 or by logging on to MFS Access at mfs.com.
Beginning on January 1, 2019, you may elect to receive all future reports in paper free of charge. Contact your financial intermediary to request that you continue to receive paper copies of your shareholder reports. If you invest directly with the fund, you can call 1-800-225-2606 or send an email request to orderliterature@mfs.com to let the fund know that you wish to continue receiving paper copies of your shareholder reports. Your election to receive reports in paper will apply to all funds held in your account if you invest through your financial intermediary or all funds held with the MFS fund complex if you invest directly.
MFR-ANN
MFS® Research Fund
CONTENTS
The report is prepared for the general information of shareholders.
It is authorized for distribution to prospective investors only when preceded or accompanied by a current prospectus.
NOT FDIC INSURED• MAY LOSE VALUE• NO BANK GUARANTEE

LETTER FROM THE EXECUTIVE CHAIR
Dear Shareholders:
Slowing global growth, low inflation, and increasing trade friction between the United States and China have been hallmarks of the past 12 months. After experiencing an
uptick in market volatility in late 2018, markets steadied during the first half of 2019, thanks in large measure to the adoption of a dovish policy stance on the part of global central banks, focused on supporting economic growth. The U.S. and China have raised tariffs on each other, heightening tensions and uncertainty. While British Prime Minister Boris Johnson has negotiated a reworked withdrawal agreement with the European Union, Parliament has not yet approved the deal, leading the EU to grant the United Kingdom a Brexit delay until no later than January 31, 2020. The combination of Brexit uncertainty and the deteriorating outlook for global trade has hampered business confidence and investment in the U.K. and Europe.
Markets expect that the longest economic expansion in U.S. history will continue for the time being, albeit at a slower pace. In an effort to prolong the expansion, the U.S. Federal Reserve lowered interest rates for the first time in more than a decade in July and again in September and October. Similarly, the European Central Bank loosened policy in September. While markets have grown more risk averse, the accommodative monetary environment has helped push global interest rates towardrecord-low levels and has been somewhat supportive of risk assets despite the unsettled economic and geopolitical backdrop.
Since launching the first U.S.open-end mutual fund in 1924, MFS® has been committed to a single purpose: to create value by allocating capital responsibly for clients. Through our powerful global investment platform, we combine collective expertise, thoughtful risk management, and long-term discipline to uncover what we believe are the best investment opportunities in the market.
Respectfully,

Robert J. Manning
Executive Chair
MFS Investment Management
November 15, 2019
The opinions expressed in this letter are subject to change and may not be relied upon for investment advice. No forecasts can be guaranteed.
1
PORTFOLIO COMPOSITION
Portfolio structure

| | | | |
| Top ten holdings | | | | |
| Microsoft Corp. | | | 4.7% | |
| Amazon.com, Inc. | | | 3.6% | |
| Alphabet, Inc., “A” | | | 3.5% | |
| Mastercard, Inc., “A” | | | 2.6% | |
| Facebook, Inc., “A” | | | 2.2% | |
| Citigroup, Inc. | | | 1.7% | |
| Aon PLC | | | 1.5% | |
| Pfizer, Inc. | | | 1.5% | |
| Cisco Systems, Inc. | | | 1.5% | |
| Medtronic PLC | | | 1.5% | |
| | | | |
| Global equity sectors (k) | | | | |
| Technology | | | 24.1% | |
| Financial Services | | | 16.6% | |
| Consumer Cyclicals | | | 14.0% | |
| Health Care (s) | | | 13.8% | |
| Capital Goods | | | 12.4% | |
| Energy | | | 7.8% | |
| Consumer Staples | | | 6.0% | |
| Telecommunications/Cable Television (s) | | | 4.3% | |
| (k) | The sectors set forth above and the associated portfolio composition are based on MFS’ own custom sector classification methodology. |
| (s) | Includes securities sold short. |
Cash & Cash Equivalents includes any cash, investments in money market funds, short-term securities, and other assets less liabilities. Please see the Statement of Assets and Liabilities for additional information related to the fund’s cash position and other assets and liabilities.
Percentages are based on net assets as of September 30, 2019.
The portfolio is actively managed and current holdings may be different.
2
MANAGEMENT REVIEW
Summary of Results
For the twelve months ended September 30, 2019, Class A shares of the MFS Research Fund (fund) provided a total return of 6.41%, at net asset value. This compares with a return of 4.25% for the fund’s benchmark, the Standard & Poor’s 500 Stock Index (S&P 500 Index).
Market Environment
Changes in market sentiment, largely driven by uncertainty over the outcome of trade negotiations between the United States and China, contributed to periodic bouts of volatility during the reporting period. The global economy decelerated, led by weakness in China and Europe.
The deteriorating global growth backdrop, along with declining inflationary pressures, prompted the US Federal Reserve to adopt a more dovish posture beginning in early 2019, resulting in the first interest rate cut in over a decade at the end of July, followed by an additional cut in September. The Fed’s actions led to a sharp decline in long-term interest rates during the period’s second half, inverting portions of the US Treasury yield curve. Markets anticipate at least one more rate reduction before the end of 2019.
Globally, central banks have tilted more dovish as well, with the European Central Bank unveiling a package of easing measures including cutting overnight rates deeper into negative territory, restarting its bond-buying program and lengthening the term of cheap loans to banks to three years from two. The central banks of India and Australia are among those that have cut rates several times in recent months, while China has been more circumspect in increasing liquidity as it continues to attempt to deleverage its economy.
Emerging markets experienced considerable volatility through the end of 2018 as tighter global financial conditions exposed structural weakness in some countries. Those conditions improved in 2019 as the Fed became more dovish, but diminished hopes for a trade deal between the US and China weighed on sentiment. Idiosyncratic factors negatively impacted some emerging economies, such as Argentina and Turkey.
From a geopolitical perspective, uncertainty over Brexit remains high. While British Prime Minister Boris Johnson has negotiated a reworked withdrawal agreement with the European Union, Parliament has not yet approved the deal, leading the EU to grant the United Kingdom a Brexit delay until no later than January 31, 2020. The combination of Brexit uncertainty and the deteriorating outlook for global trade has hampered business confidence and investment in the UK and Europe.
Contributors to Performance
Stock selection in thefinancial servicessector contributed to performance relative to the S&P 500 Index. Within this sector, holdings of real estate investment trust STORE Capital (b) and global alternative asset manager Blackstone Group (b) aided relative returns. The share price of STORE Capital advanced on the back of lower selling, general and administrative expenses and lower interest costs, coupled withbetter-than-expected funds from operations. The company also posted a record
3
Management Review – continued
acquisition year, which bolstered its revenue outlook for the upcoming year. Additionally, overweight positions in debit and credit transaction processing company Mastercard and risk management and human capital consulting services provider Aon further supported relative results.
Stock selection in both thecapital goodsandtelecommunications/cable televisionsectors also helped relative performance. However, there were no individual stocks within thecapital goodssector that were among the fund’s largest relative contributors during the period. Within thetelecommunications/cable televisionsector, an overweight position in broadcast and communication tower management firm American Tower and holdings of cable and telecommunications company Altice USA (b) helped relative returns. The share price of American Tower appreciated as the company reported solid results with strong growth in its domestic and international leasing activity, as major carriers added capacity to their networks and began to pursue 5G upgrades. As a result, the company also increased its 2019 organic revenue growth outlook, which further supported the stock price.
Security selection in theconsumer cyclicals sectorfurther contributed to relative performance, led by an overweight position in coffee and tea company Starbucks. The share price of Starbucks appreciated due to strong global same-store sales trends, better margins and slightly lower tax related expenses. Management also raised itsfull-year outlook, which further supported the stock price.
Elsewhere, not owning shares of integrated oil and gas company Exxon Mobil and health insurance and Medicare/Medicaid provider UnitedHealth Group and an overweight position in animal health products manufacturer Zoetis also bolstered relative performance.
Detractors from Performance
Stock selection in thetechnology sector detracted from relative performance, led by an overweight position in information technology company DXC Technology (h). The share price of DXC Technology declined, owing to execution challenges in its Digital business, paired with an uncertain macroeconomic environment and foreign exchange headwinds.
Elsewhere, not owning shares of household products maker Procter & Gamble hurt relative returns. The share price of Procter & Gamble advanced steadily throughout the reporting period, owing to strong organic sales growth and favorable volumes and price mix. Overweight positions in energy exploration and production company EOG Resources (h), video game maker Electronic Arts, global health services provider Cigna and diagnostics and life science research services provider PerkinElmer also weakened relative returns. The share price of EOG Resources depreciated due to a decline in oil prices during the period. EOG Resource’s management also announced an increase to its capital expenditure budget and cut oil and gas production guidance figures below market estimates, which further pressured its stock price. Additionally, holdings of integrated oil company BP (b) (United Kingdom), animal health services firm Elanco Animal Health (b) and petroleum services provider Core Laboratories (b) (Netherlands) also weighed on relative returns.
4
Management Review – continued
The fund’s cash and/or cash equivalents position during the period was also a detractor from relative performance. Under normal market conditions, the fund strives to be fully invested and generally holds cash to buy new holdings and to provide liquidity. In a period when equity markets rose, as measured by the fund’s benchmark, holding cash hurt performance versus the benchmark, which has no cash position.
Respectfully,
Portfolio Manager(s)
Joseph MacDougall
| (b) | Security is not a benchmark constituent. |
| (h) | Security was not held in the portfolio at period end. |
The views expressed in this report are those of the portfolio manager(s) only through the end of the period of the report as stated on the cover and do not necessarily reflect the views of MFS or any other person in the MFS organization. These views are subject to change at any time based on market or other conditions, and MFS disclaims any responsibility to update such views. These views may not be relied upon as investment advice or an indication of trading intent on behalf of any MFS portfolio. References to specific securities are not recommendations of such securities, and may not be representative of any MFS portfolio’s current or future investments.
5
PERFORMANCE SUMMARYTHROUGH 9/30/19
The following chart illustrates a representative class of the fund’s historical performance in comparison to its benchmark(s). Performance results include the deduction of the maximum applicable sales charge and reflect the percentage change in net asset value, including reinvestment of dividends and capital gains distributions. The performance of other share classes will be greater than or less than that of the class depicted below. Benchmarks are unmanaged and may not be invested in directly. Benchmark returns do not reflect sales charges, commissions or expenses. (See Notes to Performance Summary.)
Performance data shown represents past performance and is no guarantee of future results. Investment return and principal value fluctuate so your shares, when sold, may be worth more or less than the original cost; current performance may be lower or higher than quoted. The performance shown does not reflect the deduction of taxes, if any, that a shareholder would pay on fund distributions or the redemption of fund shares.
Growth of a Hypothetical $10,000 Investment
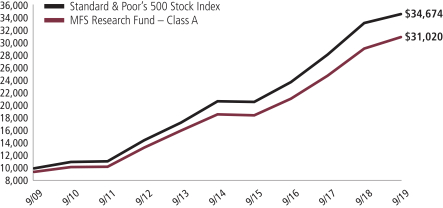
6
Performance Summary – continued
Total Returns through 9/30/19
Average annual without sales charge
| | | | | | | | | | | | |
| | | Share Class | | Class Inception Date | | 1-yr | | 5-yr | | 10-yr | | |
| | | A | | 10/13/71 | | 6.41% | | 10.73% | | 12.65% | | |
| | | B | | 9/07/93 | | 5.63% | | 9.91% | | 11.81% | | |
| | | C | | 1/03/94 | | 5.62% | | 9.90% | | 11.81% | | |
| | | I | | 1/02/97 | | 6.68% | | 11.01% | | 12.93% | | |
| | | R1 | | 4/01/05 | | 5.62% | | 9.90% | | 11.80% | | |
| | | R2 | | 10/31/03 | | 6.15% | | 10.46% | | 12.37% | | |
| | | R3 | | 4/01/05 | | 6.41% | | 10.73% | | 12.65% | | |
| | | R4 | | 4/01/05 | | 6.67% | | 11.02% | | 12.93% | | |
| | | R6 | | 5/01/06 | | 6.75% | | 11.10% | | 12.97% | | |
| | | | |
| Comparative benchmark(s) | | | | | | | | |
| | | Standard & Poor’s 500 Stock Index (f) | | 4.25% | | 10.84% | | 13.24% | | |
| | | | |
| Average annual with sales charge | | | | | | | | |
| | | A
With Initial Sales Charge (5.75%) | | 0.29% | | 9.43% | | 11.99% | | |
| | | B
With CDSC (Declining over six years from 4% to 0%) (v) | | 1.88% | | 9.64% | | 11.81% | | |
| | | C
With CDSC (1% for 12 months) (v) | | 4.68% | | 9.90% | | 11.81% | | |
CDSC – Contingent Deferred Sales Charge.
Class I, R1, R2, R3, R4, and R6 shares do not have a sales charge.
On May 30, 2012, Class W shares were redesignated Class R5 shares. Total returns for Class R5 shares prior to May 30, 2012 reflect the performance history of Class W shares which had different fees and expenses than Class R5 shares. Effective August 26, 2016, Class R5 shares were renamed Class R6 shares.
| (f) | Source: FactSet Research Systems Inc. |
| (v) | Assuming redemption at the end of the applicable period. |
Benchmark Definition(s)
Standard & Poor’s 500 Stock Index – a market capitalization-weighted index of 500 widely held equity securities, designed to measure broad U.S. equity performance.
It is not possible to invest directly in an index.
Notes to Performance Summary
Average annual total return represents the average annual change in value for each share class for the periods presented.
Performance results reflect any applicable expense subsidies and waivers in effect during the periods shown. Without such subsidies and waivers the fund’s performance results would be less favorable. Please see the prospectus and financial statements for complete details.
7
Performance Summary – continued
Performance results do not include adjustments made for financial reporting purposes in accordance with U.S. generally accepted accounting principles and may differ from amounts reported in the financial highlights.
From time to time the fund may receive proceeds from litigation settlements, without which performance would be lower.
8
EXPENSE TABLE
Fund expenses borne by the shareholders during the period, April 1, 2019 through September 30, 2019
As a shareholder of the fund, you incur two types of costs: (1) transaction costs, including sales charges (loads) on certain purchase or redemption payments, and (2) ongoing costs, including management fees; distribution and service(12b-1) fees; and other fund expenses. This example is intended to help you understand your ongoing costs (in dollars) of investing in the fund and to compare these costs with the ongoing costs of investing in other mutual funds.
The example is based on an investment of $1,000 invested at the beginning of the period and held for the entire period April 1, 2019 through September 30, 2019.
Actual Expenses
The first line for each share class in the following table provides information about actual account values and actual expenses. You may use the information in this line, together with the amount you invested, to estimate the expenses that you paid over the period. Simply divide your account value by $1,000 (for example, an $8,600 account value divided by $1,000 = 8.6), then multiply the result by the number in the first line under the heading entitled “Expenses Paid During Period” to estimate the expenses you paid on your account during this period.
Hypothetical Example for Comparison Purposes
The second line for each share class in the following table provides information about hypothetical account values and hypothetical expenses based on the fund’s actual expense ratio and an assumed rate of return of 5% per year before expenses, which is not the fund’s actual return. The hypothetical account values and expenses may not be used to estimate the actual ending account balance or expenses you paid for the period. You may use this information to compare the ongoing costs of investing in the fund and other funds. To do so, compare this 5% hypothetical example with the 5% hypothetical examples that appear in the shareholder reports of the other funds.
Please note that the expenses shown in the table are meant to highlight your ongoing costs only and do not reflect any transactional costs, such as sales charges (loads). Therefore, the second line for each share class in the table is useful in comparing ongoing costs only, and will not help you determine the relative total costs of owning different funds. In addition, if these transactional costs were included, your costs would have been higher.
9
Expense Table – continued
| | | | | | | | | | | | | | | | | | |
Share
Class | | | | Annualized
Expense
Ratio | | | Beginning
Account Value
4/01/19 | | | Ending
Account Value
9/30/19 | | | Expenses
Paid During
Period (p)
4/01/19-9/30/19 | |
| A | | Actual | | | 0.77% | | | | $1,000.00 | | | | $1,078.55 | | | | $4.01 | |
| | Hypothetical (h) | | | 0.77% | | | | $1,000.00 | | | | $1,021.21 | | | | $3.90 | |
| B | | Actual | | | 1.53% | | | | $1,000.00 | | | | $1,074.72 | | | | $7.96 | |
| | Hypothetical (h) | | | 1.53% | | | | $1,000.00 | | | | $1,017.40 | | | | $7.74 | |
| C | | Actual | | | 1.53% | | | | $1,000.00 | | | | $1,074.48 | | | | $7.96 | |
| | Hypothetical (h) | | | 1.53% | | | | $1,000.00 | | | | $1,017.40 | | | | $7.74 | |
| I | | Actual | | | 0.53% | | | | $1,000.00 | | | | $1,080.05 | | | | $2.76 | |
| | Hypothetical (h) | | | 0.53% | | | | $1,000.00 | | | | $1,022.41 | | | | $2.69 | |
| R1 | | Actual | | | 1.53% | | | | $1,000.00 | | | | $1,074.66 | | | | $7.96 | |
| | Hypothetical (h) | | | 1.53% | | | | $1,000.00 | | | | $1,017.40 | | | | $7.74 | |
| R2 | | Actual | | | 1.03% | | | | $1,000.00 | | | | $1,077.45 | | | | $5.36 | |
| | Hypothetical (h) | | | 1.03% | | | | $1,000.00 | | | | $1,019.90 | | | | $5.22 | |
| R3 | | Actual | | | 0.78% | | | | $1,000.00 | | | | $1,078.73 | | | | $4.06 | |
| | Hypothetical (h) | | | 0.78% | | | | $1,000.00 | | | | $1,021.16 | | | | $3.95 | |
| R4 | | Actual | | | 0.53% | | | | $1,000.00 | | | | $1,080.04 | | | | $2.76 | |
| | Hypothetical (h) | | | 0.53% | | | | $1,000.00 | | | | $1,022.41 | | | | $2.69 | |
| R6 | | Actual | | | 0.48% | | | | $1,000.00 | | | | $1,080.21 | | | | $2.50 | |
| | Hypothetical (h) | | | 0.48% | | | | $1,000.00 | | | | $1,022.66 | | | | $2.43 | |
| (h) | 5% class return per year before expenses. |
| (p) | “Expenses Paid During Period” are equal to each class’s annualized expense ratio, as shown above, multiplied by the average account value over the period, multiplied by 183/365 (to reflect theone-half year period). Expenses paid do not include any applicable sales charges (loads). If these transaction costs had been included, your costs would have been higher. |
Notes to Expense Table
Expense ratios include 0.02% of investment related expenses from short sales (See Note 2 of the Notes to Financial Statements).
Each class with a Rule12b-1 service fee is subject to a rebate of a portion of such fee. Such rebates are included in the expense ratios above. For Class A and Class B shares, this rebate reduced the expense ratios above by 0.01%. See Note 3 in the Notes to Financial Statements for additional information.
10
PORTFOLIO OF INVESTMENTS
9/30/19
The Portfolio of Investments is a complete list of all securities owned by your fund. It is categorized by broad-based asset classes.
| | | | | | | | |
| Common Stocks - 99.4% | | | | | | | | |
| | |
| Issuer | | Shares/Par | | | Value ($) | |
| Aerospace - 4.5% | | | | | | | | |
| Boeing Co. | | | 59,855 | | | $ | 22,773,032 | |
| Honeywell International, Inc. | | | 453,476 | | | | 76,728,139 | |
| Huntington Ingalls Industries, Inc. | | | 124,849 | | | | 26,441,770 | |
| L3Harris Technologies, Inc. | | | 157,894 | | | | 32,943,004 | |
| Northrop Grumman Corp. | | | 131,675 | | | | 49,350,473 | |
| United Technologies Corp. | | | 419,430 | | | | 57,260,584 | |
| | | | | | | | |
| | | | | | | $ | 265,497,002 | |
| Alcoholic Beverages - 0.6% | | | | | | | | |
| Constellation Brands, Inc., “A” | | | 168,361 | | | $ | 34,897,868 | |
| | |
| Apparel Manufacturers - 1.7% | | | | | | | | |
| NIKE, Inc., “B” | | | 832,651 | | | $ | 78,202,582 | |
| Skechers USA, Inc., “A” (a) | | | 631,936 | | | | 23,602,810 | |
| | | | | | | | |
| | | | | | | $ | 101,805,392 | |
| Automotive - 0.3% | | | | | | | | |
| IAA, Inc. (a) | | | 388,779 | | | $ | 16,223,748 | |
| | |
| Biotechnology - 0.4% | | | | | | | | |
| Bio-Techne Corp. | | | 134,151 | | | $ | 26,249,326 | |
| | |
| Brokerage & Asset Managers - 3.0% | | | | | | | | |
| Blackstone Group, Inc. | | | 631,008 | | | $ | 30,818,431 | |
| Charles Schwab Corp. | | | 756,548 | | | | 31,646,403 | |
| CME Group, Inc. | | | 256,139 | | | | 54,132,416 | |
| TD Ameritrade Holding Corp. | | | 1,258,371 | | | | 58,765,926 | |
| | | | | | | | |
| �� | | | | | | $ | 175,363,176 | |
| Business Services - 5.0% | | | | | | | | |
| Accenture PLC, “A” | | | 283,739 | | | $ | 54,577,196 | |
| Cognizant Technology Solutions Corp., “A” | | | 581,649 | | | | 35,053,077 | |
| Fidelity National Information Services, Inc. | | | 484,809 | | | | 64,363,243 | |
| Fiserv, Inc. (a) | | | 744,930 | | | | 77,167,299 | |
| Global Payments, Inc. | | | 401,314 | | | | 63,808,926 | |
| | | | | | | | |
| | | | | | | $ | 294,969,741 | |
| Cable TV - 2.5% | | | | | | | | |
| Altice USA, Inc., “A” (a) | | | 2,674,583 | | | $ | 76,707,041 | |
| Comcast Corp., “A” | | | 1,627,493 | | | | 73,367,384 | |
| | | | | | | | |
| | | | | | | $ | 150,074,425 | |
11
Portfolio of Investments – continued
| | | | | | | | |
| | |
| Issuer | | Shares/Par | | | Value ($) | |
| Common Stocks - continued | | | | | | | | |
| Chemicals - 0.5% | | | | | | | | |
| FMC Corp. | | | 345,332 | | | $ | 30,278,710 | |
| | |
| Computer Software - 8.1% | | | | | | | | |
| Adobe Systems, Inc. (a) | | | 306,023 | | | $ | 84,538,854 | |
| Cadence Design Systems, Inc. (a) | | | 513,906 | | | | 33,958,908 | |
| Microsoft Corp. | | | 1,985,219 | | | | 276,004,998 | |
| Salesforce.com, Inc. (a) | | | 549,687 | | | | 81,595,538 | |
| | | | | | | | |
| | | | | | | $ | 476,098,298 | |
| Computer Software - Systems - 2.0% | | | | | | | | |
| Apple, Inc. | | | 294,878 | | | $ | 66,043,826 | |
| Constellation Software, Inc. | | | 38,917 | | | | 38,867,063 | |
| Square, Inc., “A” (a) | | | 240,965 | | | | 14,927,782 | |
| | | | | | | | |
| | | | | | | $ | 119,838,671 | |
| Construction - 2.4% | | | | | | | | |
| Masco Corp. | | | 876,463 | | | $ | 36,530,978 | |
| Sherwin-Williams Co. | | | 73,458 | | | | 40,392,351 | |
| Toll Brothers, Inc. | | | 770,963 | | | | 31,648,031 | |
| Vulcan Materials Co. | | | 229,792 | | | | 34,753,742 | |
| | | | | | | | |
| | | | | | | $ | 143,325,102 | |
| Consumer Products - 1.7% | | | | | | | | |
| Colgate-Palmolive Co. | | | 553,061 | | | $ | 40,655,514 | |
| Energizer Holdings, Inc. | | | 300,852 | | | | 13,111,130 | |
| Kimberly-Clark Corp. | | | 321,885 | | | | 45,723,765 | |
| | | | | | | | |
| | | | | | | $ | 99,490,409 | |
| Consumer Services - 0.8% | | | | | | | | |
| Booking Holdings, Inc. (a) | | | 23,912 | | | $ | 46,929,930 | |
| | |
| Electrical Equipment - 1.3% | | | | | | | | |
| HD Supply Holdings, Inc. (a) | | | 635,542 | | | $ | 24,897,358 | |
| Sensata Technologies Holding PLC (a) | | | 519,899 | | | | 26,026,144 | |
| TE Connectivity Ltd. | | | 297,214 | | | | 27,694,400 | |
| | | | | | | | |
| | | | | | | $ | 78,617,902 | |
| Electronics - 1.8% | | | | | | | | |
| Analog Devices, Inc. | | | 523,637 | | | $ | 58,505,962 | |
| NXP Semiconductors N.V. | | | 431,987 | | | | 47,138,421 | |
| | | | | | | | |
| | | | | | | $ | 105,644,383 | |
| Energy - Independent - 2.1% | | | | | | | | |
| ConocoPhillips | | | 741,463 | | | $ | 42,248,562 | |
| Diamondback Energy, Inc. | | | 240,906 | | | | 21,659,858 | |
12
Portfolio of Investments – continued
| | | | | | | | |
| | |
| Issuer | | Shares/Par | | | Value ($) | |
| Common Stocks - continued | | | | | | | | |
| Energy - Independent - continued | | | | | | | | |
| Pioneer Natural Resources Co. | | | 228,952 | | | $ | 28,795,293 | |
| Valero Energy Corp. | | | 356,558 | | | | 30,393,004 | |
| | | | | | | | |
| | | | | | | $ | 123,096,717 | |
| Energy - Integrated - 1.3% | | | | | | | | |
| BP PLC, ADR | | | 1,963,623 | | | $ | 74,598,038 | |
| | |
| Food & Beverages - 2.9% | | | | | | | | |
| J.M. Smucker Co. | | | 186,920 | | | $ | 20,564,938 | |
| Mondelez International, Inc. | | | 1,176,852 | | | | 65,103,453 | |
| PepsiCo, Inc. | | | 608,324 | | | | 83,401,220 | |
| | | | | | | | |
| | | | | | | $ | 169,069,611 | |
| Gaming & Lodging - 0.9% | | | | | | | | |
| Marriott International, Inc., “A” | | | 433,361 | | | $ | 53,897,108 | |
| | |
| General Merchandise - 1.4% | | | | | | | | |
| Dollar General Corp. | | | 504,760 | | | $ | 80,226,554 | |
| | |
| Health Maintenance Organizations - 1.4% | | | | | | | | |
| Cigna Corp. | | | 310,272 | | | $ | 47,096,187 | |
| Humana, Inc. | | | 133,729 | | | | 34,190,493 | |
| | | | | | | | |
| | | | | | | $ | 81,286,680 | |
| Insurance - 2.7% | | | | | | | | |
| Aon PLC | | | 459,763 | | | $ | 88,996,324 | |
| Chubb Ltd. | | | 440,043 | | | | 71,040,542 | |
| | | | | | | | |
| | | | | | | $ | 160,036,866 | |
| Internet - 5.7% | | | | | | | | |
| Alphabet, Inc., “A” (a)(s) | | | 170,695 | | | $ | 208,442,492 | |
| Facebook, Inc., “A” (a)(s) | | | 716,386 | | | | 127,574,019 | |
| | | | | | | | |
| | | | | | | $ | 336,016,511 | |
| Leisure & Toys - 1.0% | | | | | | | | |
| Electronic Arts, Inc. (a) | | | 604,594 | | | $ | 59,141,385 | |
| | |
| Machinery & Tools - 1.3% | | | | | | | | |
| Flowserve Corp. | | | 478,568 | | | $ | 22,353,911 | |
| Roper Technologies, Inc. | | | 148,236 | | | | 52,860,958 | |
| | | | | | | | |
| | | | | | | $ | 75,214,869 | |
| Major Banks - 2.5% | | | | | | | | |
| Goldman Sachs Group, Inc. | | | 378,806 | | | $ | 78,499,967 | |
| PNC Financial Services Group, Inc. | | | 260,266 | | | | 36,478,883 | |
13
Portfolio of Investments – continued
| | | | | | | | |
| | |
| Issuer | | Shares/Par | | | Value ($) | |
| Common Stocks - continued | | | | | | | | |
| Major Banks - continued | | | | | | | | |
| State Street Corp. | | | 532,170 | | | $ | 31,499,142 | |
| | | | | | | | |
| | | | | | | $ | 146,477,992 | |
| Medical & Health Technology & Services - 1.2% | | | | | | | | |
| ICON PLC (a) | | | 277,735 | | | $ | 40,921,475 | |
| McKesson Corp. | | | 209,542 | | | | 28,636,010 | |
| | | | | | | | |
| | | | | | | $ | 69,557,485 | |
| Medical Equipment - 7.1% | | | | | | | | |
| Becton, Dickinson and Co. | | | 232,200 | | | $ | 58,737,312 | |
| Boston Scientific Corp. (a) | | | 1,229,040 | | | | 50,009,638 | |
| Danaher Corp. | | | 432,485 | | | | 62,463,809 | |
| Masimo Corp. (a) | | | 204,002 | | | | 30,353,458 | |
| Medtronic PLC | | | 810,221 | | | | 88,006,205 | |
| PerkinElmer, Inc. | | | 664,291 | | | | 56,577,664 | |
| STERIS PLC | | | 209,860 | | | | 30,322,671 | |
| West Pharmaceutical Services, Inc. | | | 287,494 | | | | 40,772,399 | |
| | | | | | | | |
| | | | | | | $ | 417,243,156 | |
| Natural Gas - Distribution - 0.5% | | | | | | | | |
| Sempra Energy | | | 199,717 | | | $ | 29,480,226 | |
| | |
| Natural Gas - Pipeline - 0.6% | | | | | | | | |
| Enterprise Products Partners LP | | | 1,304,635 | | | $ | 37,286,468 | |
| | |
| Network & Telecom - 1.5% | | | | | | | | |
| Cisco Systems, Inc. | | | 1,794,586 | | | $ | 88,670,494 | |
| | |
| Oil Services - 0.2% | | | | | | | | |
| Core Laboratories N.V. | | | 218,292 | | | $ | 10,176,773 | |
| | |
| Other Banks & Diversified Financials - 6.7% | | | | | | | | |
| BB&T Corp. | | | 1,371,046 | | | $ | 73,172,725 | |
| Citigroup, Inc. (s) | | | 1,440,126 | | | | 99,483,904 | |
| Mastercard, Inc., “A” | | | 572,674 | | | | 155,521,078 | |
| U.S. Bancorp | | | 1,178,182 | | | | 65,200,592 | |
| | | | | | | | |
| | | | | | | $ | 393,378,299 | |
| Pharmaceuticals - 3.9% | | | | | | | | |
| Elanco Animal Health, Inc. (a) | | | 1,021,933 | | | $ | 27,173,198 | |
| Eli Lilly & Co. | | | 418,857 | | | | 46,840,778 | |
| Pfizer, Inc. | | | 2,469,602 | | | | 88,732,800 | |
| Zoetis, Inc. | | | 557,976 | | | | 69,518,230 | |
| | | | | | | | |
| | | | | | | $ | 232,265,006 | |
14
Portfolio of Investments – continued
| | | | | | | | |
| | |
| Issuer | | Shares/Par | | | Value ($) | |
| Common Stocks - continued | | | | | | | | |
| Railroad & Shipping - 1.4% | | | | | | | | |
| Canadian Pacific Railway Ltd. | | | 184,635 | | | $ | 41,073,902 | |
| Kansas City Southern Co. | | | 306,558 | | | | 40,775,280 | |
| | | | | | | | |
| | | | | | | $ | 81,849,182 | |
| Real Estate - 1.7% | | | | | | | | |
| Public Storage, Inc., REIT | | | 203,415 | | | $ | 49,891,597 | |
| STORE Capital Corp., REIT | | | 1,372,038 | | | | 51,327,942 | |
| | | | | | | | |
| | | | | | | $ | 101,219,539 | |
| Restaurants - 1.7% | | | | | | | | |
| Chipotle Mexican Grill, Inc., “A” (a) | | | 27,557 | | | $ | 23,160,832 | |
| Starbucks Corp. | | | 896,835 | | | | 79,298,150 | |
| | | | | | | | |
| | | | | | | $ | 102,458,982 | |
| Specialty Chemicals - 0.7% | | | | | | | | |
| DuPont de Nemours, Inc. | | | 562,200 | | | $ | 40,090,482 | |
| | |
| Specialty Stores - 6.4% | | | | | | | | |
| Amazon.com, Inc. (a) | | | 123,283 | | | $ | 214,008,192 | |
| Chewy, Inc., “A” (a) | | | 394,160 | | | | 9,688,453 | |
| Ross Stores, Inc. | | | 694,073 | | | | 76,243,919 | |
| Target Corp. | | | 745,599 | | | | 79,711,989 | |
| | | | | | | | |
| | | | | | | $ | 379,652,553 | |
| Telecommunications - Wireless - 1.4% | | | | | | | | |
| American Tower Corp., REIT | | | 383,028 | | | $ | 84,698,982 | |
| | |
| Telephone Services - 0.6% | | | | | | | | |
| Verizon Communications, Inc. | | | 622,529 | | | $ | 37,575,850 | |
| | |
| Tobacco - 0.8% | | | | | | | | |
| Philip Morris International, Inc. | | | 655,948 | | | $ | 49,806,132 | |
| | |
| Utilities - Electric Power - 3.2% | | | | | | | | |
| American Electric Power Co., Inc. | | | 377,034 | | | $ | 35,324,316 | |
| CMS Energy Corp. | | | 476,272 | | | | 30,457,594 | |
| Duke Energy Corp. | | | 415,315 | | | | 39,812,096 | |
| FirstEnergy Corp. | | | 855,981 | | | | 41,283,964 | |
| NextEra Energy, Inc. | | | 170,181 | | | | 39,650,471 | |
| | | | | | | | |
| | | | | | | $ | 186,528,441 | |
| Total Common Stocks (Identified Cost, $4,040,117,365) | | | $ | 5,866,304,464 | |
15
Portfolio of Investments – continued
| | | | | | | | |
| Investment Companies (h) - 1.5% | | | | | | | | |
| | |
| Issuer | | Shares/Par | | | Value ($) | |
| Money Market Funds - 1.5% | | | | | | | | |
| MFS Institutional Money Market Portfolio, 2.09% (v) (Identified Cost, $89,760,471) | | | 89,761,455 | | | $ | 89,761,455 | |
| | |
| Securities Sold Short - (0.4)% | | | | | | | | |
| Medical & Health Technology & Services - (0.1)% | | | | | | | | |
| Healthcare Services Group, Inc. | | | (403,047 | ) | | $ | (9,790,012 | ) |
| | |
| Telecommunications - Wireless - (0.3)% | | | | | | | | |
| Crown Castle International Corp., REIT | | | (116,649 | ) | | $ | (16,215,377 | ) |
Total Securities Sold Short
(Proceeds Received, $22,654,623) | | | $ | (26,005,389 | ) |
| | |
| Other Assets, Less Liabilities - (0.5)% | | | | | | | (31,729,951 | ) |
| Net Assets - 100.0% | | | | | | $ | 5,898,330,579 | |
| (a) | Non-income producing security. |
| (h) | An affiliated issuer, which may be considered one in which the fund owns 5% or more of the outstanding voting securities, or a company which is under common control. At period end, the aggregate values of the fund’s investments in affiliated issuers and in unaffiliated issuers were $89,761,455 and $5,866,304,464, respectively. |
| (s) | Security or a portion of the security was pledged to cover collateral requirements for securities sold short. |
| (v) | Affiliated issuer that is available only to investment companies managed by MFS. The rate quoted for the MFS Institutional Money Market Portfolio is the annualizedseven-day yield of the fund at period end. |
The following abbreviations are used in this report and are defined:
| ADR | | American Depositary Receipt |
| REIT | | Real Estate Investment Trust |
At September 30, 2019, the fund had cash collateral of $269,045 and other liquid securities with an aggregate value of $46,791,815 to cover any collateral or margin obligations for securities sold short. Restricted cash and/or deposits with brokers in the Statement of Assets and Liabilities are comprised of cash collateral.
See Notes to Financial Statements
16
Financial Statements
STATEMENT OF ASSETS AND LIABILITIES
At 9/30/19
This statement represents your fund’s balance sheet, which details the assets and liabilities comprising the total value of the fund.
| | | | |
| Assets | | | | |
Investments in unaffiliated issuers, at value (identified cost, $4,040,117,365) | | | $5,866,304,464 | |
Investments in affiliated issuers, at value (identified cost, $89,760,471) | | | 89,761,455 | |
Cash | | | 648,536 | |
Deposits with brokers for | | | | |
Securities sold short | | | 269,045 | |
Receivables for | | | | |
Fund shares sold | | | 5,834,259 | |
Dividends | | | 5,039,425 | |
Other assets | | | 2,334 | |
Total assets | | | $5,967,859,518 | |
| |
| Liabilities | | | | |
Payables for | | | | |
Securities sold short, at value (proceeds received, $22,654,623) | | | $26,005,389 | |
Investments purchased | | | 36,918,329 | |
Fund shares reacquired | | | 4,303,205 | |
Payable to affiliates | | | | |
Investment adviser | | | 274,201 | |
Administrative services fee | | | 6,315 | |
Shareholder servicing costs | | | 1,595,174 | |
Distribution and service fees | | | 15,567 | |
Payable for independent Trustees’ compensation | | | 9,944 | |
Accrued expenses and other liabilities | | | 400,815 | |
Total liabilities | | | $69,528,939 | |
Net assets | | | $5,898,330,579 | |
| |
| Net assets consist of | | | | |
Paid-in capital | | | $3,886,419,932 | |
Total distributable earnings (loss) | | | 2,011,910,647 | |
Net assets | | | $5,898,330,579 | |
Shares of beneficial interest outstanding | | | 131,150,633 | |
17
Statement of Assets and Liabilities – continued
| | | | | | | | | | | | |
| | | |
| | | Net assets | | | Shares
outstanding | | | Net asset value
per share (a) | |
Class A | | | $1,452,740,452 | | | | 32,649,356 | | | | $44.50 | |
Class B | | | 17,764,697 | | | | 445,908 | | | | 39.84 | |
Class C | | | 71,371,370 | | | | 1,805,349 | | | | 39.53 | |
Class I | | | 2,835,695,916 | | | | 61,993,186 | | | | 45.74 | |
Class R1 | | | 4,186,662 | | | | 108,121 | | | | 38.72 | |
Class R2 | | | 21,738,167 | | | | 507,311 | | | | 42.85 | |
Class R3 | | | 44,940,701 | | | | 1,018,606 | | | | 44.12 | |
Class R4 | | | 16,868,908 | | | | 378,835 | | | | 44.53 | |
Class R6 | | | 1,433,023,706 | | | | 32,243,961 | | | | 44.44 | |
| (a) | Maximum offering price per share was equal to the net asset value per share for all share classes, except for Class A, for which the maximum offering price per share was $47.21 [100 / 94.25 x $44.50]. On sales of $50,000 or more, the maximum offering price of Class A shares is reduced. A contingent deferred sales charge may be imposed on redemptions of Class A, Class B, and Class C shares. Redemption price per share was equal to the net asset value per share for Classes I, R1, R2, R3, R4, and R6. |
See Notes to Financial Statements
18
Financial Statements
STATEMENT OF OPERATIONS
Year ended 9/30/19
This statement describes how much your fund earned in investment income and accrued in expenses. It also describes any gains and/or losses generated by fund operations.
| | | | |
| Net investment income (loss) | | | | |
Income | | | | |
Dividends | | | $91,854,486 | |
Dividends from affiliated issuers | | | 954,803 | |
Income on securities loaned | | | 561,202 | |
Other | | | 306,269 | |
Foreign taxes withheld | | | (327,989 | ) |
Total investment income | | | $93,348,771 | |
Expenses | | | | |
Management fee | | | $23,799,087 | |
Distribution and service fees | | | 4,572,517 | |
Shareholder servicing costs | | | 3,292,661 | |
Administrative services fee | | | 579,866 | |
Independent Trustees’ compensation | | | 45,953 | |
Custodian fee | | | 223,744 | |
Shareholder communications | | | 145,642 | |
Audit and tax fees | | | 57,033 | |
Legal fees | | | 54,650 | |
Dividend and interest expense on securities sold short | | | 1,103,936 | |
Interest expense and fees | | | 38,060 | |
Miscellaneous | | | 291,819 | |
Total expenses | | | $34,204,968 | |
Fees paid indirectly | | | (1,975 | ) |
Reduction of expenses by distributor | | | (151,905 | ) |
Net expenses | | | $34,051,088 | |
Net investment income (loss) | | | $59,297,683 | |
| |
| Realized and unrealized gain (loss) | | | | |
Realized gain (loss) (identified cost basis) | | | | |
Unaffiliated issuers | | | $166,309,748 | |
Affiliated issuers | | | 6,045 | |
Foreign currency | | | (1,090 | ) |
Net realized gain (loss) | | | $166,314,703 | |
Change in unrealized appreciation or depreciation | | | | |
Unaffiliated issuers | | | $128,400,666 | |
Affiliated issuers | | | 984 | |
Securities sold short | | | (30,937 | ) |
Translation of assets and liabilities in foreign currencies | | | (177 | ) |
Net unrealized gain (loss) | | | $128,370,536 | |
Net realized and unrealized gain (loss) | | | $294,685,239 | |
Change in net assets from operations | | | $353,982,922 | |
See Notes to Financial Statements
19
Financial Statements
STATEMENTS OF CHANGES IN NET ASSETS
These statements describe the increases and/or decreases in net assets resulting from operations, any distributions, and any shareholder transactions.
| | | | | | | | |
| | | Year ended | |
| | | 9/30/19 | | | 9/30/18 | |
| Change in net assets | | | | | | |
| | |
| From operations | | | | | | | | |
Net investment income (loss) | | | $59,297,683 | | | | $53,782,908 | |
Net realized gain (loss) | | | 166,314,703 | | | | 649,862,215 | |
Net unrealized gain (loss) | | | 128,370,536 | | | | 216,524,483 | |
Change in net assets from operations | | | $353,982,922 | | | | $920,169,606 | |
Total distributions to shareholders | | | $(571,518,557 | ) | | | $(457,221,994 | ) |
Change in net assets from fund share transactions | | | $275,632,415 | | | | $(6,420,157 | ) |
Total change in net assets | | | $58,096,780 | | | | $456,527,455 | |
| | |
| Net assets | | | | | | | | |
At beginning of period | | | 5,840,233,799 | | | | 5,383,706,344 | |
At end of period | | | $5,898,330,579 | | | | $5,840,233,799 | |
See Notes to Financial Statements
20
Financial Statements
FINANCIAL HIGHLIGHTS
The financial highlights table is intended to help you understand the fund’s financial performance for the past 5 years. Certain information reflects financial results for a single fund share. The total returns in the table represent the rate that an investor would have earned (or lost) on an investment in the fund share class (assuming reinvestment of all distributions) held for the entire period.
| | | | | | | | | | | | | | | | | | | | |
| Class A | | Year ended | |
| | | | | |
| | | 9/30/19 | | | 9/30/18 | | | 9/30/17 | | | 9/30/16 | | | 9/30/15 | |
Net asset value, beginning of period | | | $46.73 | | | | $43.26 | | | | $38.88 | | | | $36.37 | | | | $38.78 | |
| | |
| Income (loss) from investment operations | | | | | | | | | |
Net investment income (loss) (d) | | | $0.37 | | | | $0.35 | | | | $0.33 | (c) | | | $0.46 | | | | $0.28 | |
Net realized and unrealized gain (loss) | | | 1.90 | | | | 6.83 | | | | 6.15 | | | | 4.56 | | | | (0.53 | ) |
Total from investment operations | | | $2.27 | | | | $7.18 | | | | $6.48 | | | | $5.02 | | | | $(0.25 | ) |
| | |
| Less distributions declared to shareholders | | | | | | | | | |
From net investment income | | | $(0.28 | ) | | | $(0.46 | ) | | | $(0.38 | ) | | | $(0.29 | ) | | | $(0.26 | ) |
From net realized gain | | | (4.22 | ) | | | (3.25 | ) | | | (1.72 | ) | | | (2.22 | ) | | | (1.90 | ) |
Total distributions declared to shareholders | | | $(4.50 | ) | | | $(3.71 | ) | | | $(2.10 | ) | | | $(2.51 | ) | | | $(2.16 | ) |
Net asset value, end of period (x) | | | $44.50 | | | | $46.73 | | | | $43.26 | | | | $38.88 | | | | $36.37 | |
Total return (%) (r)(s)(t)(x) | | | 6.46 | | | | 17.51 | | | | 17.46 | (c) | | | 14.39 | | | | (0.93 | ) |
| | |
Ratios (%) (to average net assets)
and Supplemental data: | | | | | | | | | |
Expenses before expense reductions (f) | | | 0.80 | | | | 0.82 | | | | 0.82 | (c) | | | 0.83 | | | | 0.82 | |
Expenses after expense reductions (f) | | | 0.79 | | | | 0.81 | | | | 0.82 | (c) | | | 0.82 | | | | 0.82 | |
Net investment income (loss) | | | 0.89 | | | | 0.81 | | | | 0.82 | (c) | | | 1.25 | | | | 0.71 | |
Portfolio turnover | | | 32 | | | | 33 | | | | 38 | | | | 47 | | | | 44 | |
Net assets at end of period (000 omitted) | | | $1,452,740 | | | | $1,456,897 | | | | $2,643,928 | | | | $2,331,409 | | | | $2,061,339 | |
| | |
| Supplemental Ratios (%): | | | | | | | | | |
Ratio of expenses to average net assets after
expense reductions excluding short sale
expenses and interest expense and fees (f) | | | 0.77 | | | | 0.80 | | | | 0.81 | (c) | | | 0.82 | | | | 0.81 | |
See Notes to Financial Statements
21
Financial Highlights – continued
| | | | | | | | | | | | | | | | | | | | |
| Class B | | Year ended | |
| | | | | |
| | | 9/30/19 | | | 9/30/18 | | | 9/30/17 | | | 9/30/16 | | | 9/30/15 | |
Net asset value, beginning of period | | | $42.40 | | | | $39.55 | | | | $35.70 | | | | $33.56 | | | | $35.95 | |
| | |
| Income (loss) from investment operations | | | | | | | | | |
Net investment income (loss) (d) | | | $0.05 | | | | $0.03 | | | | $0.03 | (c) | | | $0.16 | | | | $(0.01 | ) |
Net realized and unrealized gain (loss) | | | 1.66 | | | | 6.21 | | | | 5.64 | | | | 4.21 | | | | (0.48 | ) |
Total from investment operations | | | $1.71 | | | | $6.24 | | | | $5.67 | | | | $4.37 | | | | $(0.49 | ) |
| | |
| Less distributions declared to shareholders | | | | | | | | | |
From net investment income | | | $(0.05 | ) | | | $(0.14 | ) | | | $(0.10 | ) | | | $(0.01 | ) | | | $— | |
From net realized gain | | | (4.22 | ) | | | (3.25 | ) | | | (1.72 | ) | | | (2.22 | ) | | | (1.90 | ) |
Total distributions declared to shareholders | | | $(4.27 | ) | | | $(3.39 | ) | | | $(1.82 | ) | | | $(2.23 | ) | | | $(1.90 | ) |
Net asset value, end of period (x) | | | $39.84 | | | | $42.40 | | | | $39.55 | | | | $35.70 | | | | $33.56 | |
Total return (%) (r)(s)(t)(x) | | | 5.63 | | | | 16.65 | | | | 16.59 | (c) | | | 13.54 | | | | (1.66 | ) |
| | |
Ratios (%) (to average net assets)
and Supplemental data: | | | | | | | | | |
Expenses before expense reductions (f) | | | 1.55 | | | | 1.57 | | | | 1.57 | (c) | | | 1.58 | | | | 1.57 | |
Expenses after expense reductions (f) | | | 1.54 | | | | 1.56 | | | | 1.57 | (c) | | | 1.57 | | | | 1.57 | |
Net investment income (loss) | | | 0.14 | | | | 0.06 | | | | 0.07 | (c) | | | 0.47 | | | | (0.04 | ) |
Portfolio turnover | | | 32 | | | | 33 | | | | 38 | | | | 47 | | | | 44 | |
Net assets at end of period (000 omitted) | | | $17,765 | | | | $21,445 | | | | $22,131 | | | | $24,104 | | | | $25,338 | |
| | |
| Supplemental Ratios (%): | | | | | | | | | |
Ratio of expenses to average net assets after
expense reductions excluding short sale
expenses and interest expense and fees (f) | | | 1.52 | | | | 1.55 | | | | 1.56 | (c) | | | 1.57 | | | | 1.56 | |
See Notes to Financial Statements
22
Financial Highlights – continued
| | | | | | | | | | | | | | | | | | | | |
| Class C | | Year ended | |
| | | | | |
| | | 9/30/19 | | | 9/30/18 | | | 9/30/17 | | | 9/30/16 | | | 9/30/15 | |
Net asset value, beginning of period | | | $42.05 | | | | $39.27 | | | | $35.48 | | | | $33.39 | | | | $35.79 | |
| | |
| Income (loss) from investment operations | | | | | | | | | |
Net investment income (loss) (d) | | | $0.05 | | | | $0.01 | | | | $0.03 | (c) | | | $0.16 | | | | $(0.01 | ) |
Net realized and unrealized gain (loss) | | | 1.65 | | | | 6.17 | | | | 5.60 | | | | 4.17 | | | | (0.48 | ) |
Total from investment operations | | | $1.70 | | | | $6.18 | | | | $5.63 | | | | $4.33 | | | | $(0.49 | ) |
| | |
| Less distributions declared to shareholders | | | | | | | | | |
From net investment income | | | $— | | | | $(0.15 | ) | | | $(0.12 | ) | | | $(0.02 | ) | | | $(0.01 | ) |
From net realized gain | | | (4.22 | ) | | | (3.25 | ) | | | (1.72 | ) | | | (2.22 | ) | | | (1.90 | ) |
Total distributions declared to shareholders | | | $(4.22 | ) | | | $(3.40 | ) | | | $(1.84 | ) | | | $(2.24 | ) | | | $(1.91 | ) |
Net asset value, end of period (x) | | | $39.53 | | | | $42.05 | | | | $39.27 | | | | $35.48 | | | | $33.39 | |
Total return (%) (r)(s)(t)(x) | | | 5.64 | | | | 16.62 | | | | 16.61 | (c) | | | 13.51 | | | | (1.67 | ) |
| | |
Ratios (%) (to average net assets)
and Supplemental data: | | | | | | | | | |
Expenses before expense reductions (f) | | | 1.55 | | | | 1.57 | | | | 1.57 | (c) | | | 1.58 | | | | 1.57 | |
Expenses after expense reductions (f) | | | 1.55 | | | | 1.56 | | | | 1.57 | (c) | | | 1.58 | | | | 1.57 | |
Net investment income (loss) | | | 0.13 | | | | 0.03 | | | | 0.07 | (c) | | | 0.49 | | | | (0.04 | ) |
Portfolio turnover | | | 32 | | | | 33 | | | | 38 | | | | 47 | | | | 44 | |
Net assets at end of period (000 omitted) | | | $71,371 | | | | $78,122 | | | | $133,255 | | | | $134,406 | | | | $129,249 | |
| | |
| Supplemental Ratios (%): | | | | | | | | | |
Ratio of expenses to average net assets after
expense reductions excluding short sale
expenses and interest expense and fees (f) | | | 1.53 | | | | 1.55 | | | | 1.56 | (c) | | | 1.57 | | | | 1.57 | |
See Notes to Financial Statements
23
Financial Highlights – continued
| | | | | | | | | | | | | | | | | | | | |
| Class I | | Year ended | |
| | | | | |
| | | 9/30/19 | | | 9/30/18 | | | 9/30/17 | | | 9/30/16 | | | 9/30/15 | |
Net asset value, beginning of period | | | $48.03 | | | | $44.35 | | | | $39.81 | | | | $37.18 | | | | $39.59 | |
| | |
| Income (loss) from investment operations | | | | | | | | | |
Net investment income (loss) (d) | | | $0.49 | | | | $0.50 | | | | $0.44 | (c) | | | $0.57 | | | | $0.38 | |
Net realized and unrealized gain (loss) | | | 1.93 | | | | 6.99 | | | | 6.29 | | | | 4.66 | | | | (0.54 | ) |
Total from investment operations | | | $2.42 | | | | $7.49 | | | | $6.73 | | | | $5.23 | | | | $(0.16 | ) |
| | |
| Less distributions declared to shareholders | | | | | | | | | |
From net investment income | | | $(0.49 | ) | | | $(0.56 | ) | | | $(0.47 | ) | | | $(0.38 | ) | | | $(0.35 | ) |
From net realized gain | | | (4.22 | ) | | | (3.25 | ) | | | (1.72 | ) | | | (2.22 | ) | | | (1.90 | ) |
Total distributions declared to shareholders | | | $(4.71 | ) | | | $(3.81 | ) | | | $(2.19 | ) | | | $(2.60 | ) | | | $(2.25 | ) |
Net asset value, end of period (x) | | | $45.74 | | | | $48.03 | | | | $44.35 | | | | $39.81 | | | | $37.18 | |
Total return (%) (r)(s)(t)(x) | | | 6.68 | | | | 17.83 | | | | 17.74 | (c) | | | 14.68 | | | | (0.68 | ) |
| | |
Ratios (%) (to average net assets)
and Supplemental data: | | | | | | | | | |
Expenses before expense reductions (f) | | | 0.55 | | | | 0.57 | | | | 0.57 | (c) | | | 0.58 | | | | 0.57 | |
Expenses after expense reductions (f) | | | N/A | | | | N/A | | | | 0.57 | (c) | | | 0.58 | | | | 0.57 | |
Net investment income (loss) | | | 1.13 | | | | 1.09 | | | | 1.07 | (c) | | | 1.52 | | | | 0.96 | |
Portfolio turnover | | | 32 | | | | 33 | | | | 38 | | | | 47 | | | | 44 | |
Net assets at end of period (000 omitted) | | | $2,835,696 | | | | $2,752,743 | | | | $1,065,739 | | | | $927,500 | | | | $723,107 | |
| | |
| Supplemental Ratios (%): | | | | | | | | | |
Ratio of expenses to average net assets after
expense reductions excluding short sale
expenses and interest expense and fees (f) | | | 0.53 | | | | 0.56 | | | | 0.56 | (c) | | | 0.57 | | | | 0.57 | |
See Notes to Financial Statements
24
Financial Highlights – continued
| | | | | | | | | | | | | | | | | | | | |
| Class R1 | | Year ended | |
| | | | | |
| | | 9/30/19 | | | 9/30/18 | | | 9/30/17 | | | 9/30/16 | | | 9/30/15 | |
Net asset value, beginning of period | | | $41.37 | | | | $38.69 | | | | $34.99 | | | | $32.95 | | | | $35.35 | |
| | |
| Income (loss) from investment operations | | | | | | | | | |
Net investment income (loss) (d) | | | $0.04 | | | | $0.03 | | | | $0.02 | (c) | | | $0.17 | | | | $(0.01 | ) |
Net realized and unrealized gain (loss) | | | 1.60 | | | | 6.06 | | | | 5.52 | | | | 4.11 | | | | (0.47 | ) |
Total from investment operations | | | $1.64 | | | | $6.09 | | | | $5.54 | | | | $4.28 | | | | $(0.48 | ) |
| | |
| Less distributions declared to shareholders | | | | | | | | | |
From net investment income | | | $(0.07 | ) | | | $(0.16 | ) | | | $(0.12 | ) | | | $(0.02 | ) | | | $(0.02 | ) |
From net realized gain | | | (4.22 | ) | | | (3.25 | ) | | | (1.72 | ) | | | (2.22 | ) | | | (1.90 | ) |
Total distributions declared to shareholders | | | $(4.29 | ) | | | $(3.41 | ) | | | $(1.84 | ) | | | $(2.24 | ) | | | $(1.92 | ) |
Net asset value, end of period (x) | | | $38.72 | | | | $41.37 | | | | $38.69 | | | | $34.99 | | | | $32.95 | |
Total return (%) (r)(s)(t)(x) | | | 5.62 | | | | 16.64 | | | | 16.59 | (c) | | | 13.53 | | | | (1.66 | ) |
| | |
Ratios (%) (to average net assets)
and Supplemental data: | | | | | | | | | |
Expenses before expense reductions (f) | | | 1.55 | | | | 1.57 | | | | 1.57 | (c) | | | 1.58 | | | | 1.57 | |
Expenses after expense reductions (f) | | | N/A | | | | N/A | | | | 1.57 | (c) | | | 1.58 | | | | 1.57 | |
Net investment income (loss) | | | 0.12 | | | | 0.07 | | | | 0.07 | (c) | | | 0.50 | | | | (0.04 | ) |
Portfolio turnover | | | 32 | | | | 33 | | | | 38 | | | | 47 | | | | 44 | |
Net assets at end of period (000 omitted) | | | $4,187 | | | | $4,947 | | | | $4,189 | | | | $4,500 | | | | $3,980 | |
| | |
| Supplemental Ratios (%): | | | | | | | | | |
Ratio of expenses to average net assets after
expense reductions excluding short sale
expenses and interest expense and fees (f) | | | 1.53 | | | | 1.56 | | | | 1.56 | (c) | | | 1.57 | | | | 1.57 | |
See Notes to Financial Statements
25
Financial Highlights – continued
| | | | | | | | | | | | | | | | | | | | |
| Class R2 | | Year ended | |
| | | | | |
| | | 9/30/19 | | | 9/30/18 | | | 9/30/17 | | | 9/30/16 | | | 9/30/15 | |
Net asset value, beginning of period | | | $45.23 | | | | $41.97 | | | | $37.77 | | | | $35.37 | | | | $37.76 | |
| | |
| Income (loss) from investment operations | | | | | | | | | |
Net investment income (loss) (d) | | | $0.25 | | | | $0.24 | | | | $0.22 | (c) | | | $0.35 | | | | $0.17 | |
Net realized and unrealized gain (loss) | | | 1.82 | | | | 6.60 | | | | 5.98 | | | | 4.44 | | | | (0.51 | ) |
Total from investment operations | | | $2.07 | | | | $6.84 | | | | $6.20 | | | | $4.79 | | | | $(0.34 | ) |
| | |
| Less distributions declared to shareholders | | | | | | | | | |
From net investment income | | | $(0.23 | ) | | | $(0.33 | ) | | | $(0.28 | ) | | | $(0.17 | ) | | | $(0.15 | ) |
From net realized gain | | | (4.22 | ) | | | (3.25 | ) | | | (1.72 | ) | | | (2.22 | ) | | | (1.90 | ) |
Total distributions declared to shareholders | | | $(4.45 | ) | | | $(3.58 | ) | | | $(2.00 | ) | | | $(2.39 | ) | | | $(2.05 | ) |
Net asset value, end of period (x) | | | $42.85 | | | | $45.23 | | | | $41.97 | | | | $37.77 | | | | $35.37 | |
Total return (%) (r)(s)(t)(x) | | | 6.18 | | | | 17.21 | | | | 17.19 | (c) | | | 14.10 | | | | (1.19 | ) |
| | |
Ratios (%) (to average net assets)
and Supplemental data: | | | | | | | | | |
Expenses before expense reductions (f) | | | 1.05 | | | | 1.07 | | | | 1.07 | (c) | | | 1.08 | | | | 1.07 | |
Expenses after expense reductions (f) | | | N/A | | | | N/A | | | | 1.07 | (c) | | | 1.08 | | | | 1.07 | |
Net investment income (loss) | | | 0.63 | | | | 0.56 | | | | 0.57 | (c) | | | 0.97 | | | | 0.46 | |
Portfolio turnover | | | 32 | | | | 33 | | | | 38 | | | | 47 | | | | 44 | |
Net assets at end of period (000 omitted) | | | $21,738 | | | | $21,137 | | | | $26,054 | | | | $27,545 | | | | $27,224 | |
| | |
| Supplemental Ratios (%): | | | | | | | | | |
Ratio of expenses to average net assets after
expense reductions excluding short sale
expenses and interest expense and fees (f) | | | 1.03 | | | | 1.06 | | | | 1.06 | (c) | | | 1.07 | | | | 1.07 | |
See Notes to Financial Statements
26
Financial Highlights – continued
| | | | | | | | | | | | | | | | | | | | |
| Class R3 | | Year ended | |
| | | | | |
| | | 9/30/19 | | | 9/30/18 | | | 9/30/17 | | | 9/30/16 | | | 9/30/15 | |
Net asset value, beginning of period | | | $46.46 | | | | $43.02 | | | | $38.67 | | | | $36.17 | | | | $38.57 | |
| | |
| Income (loss) from investment operations | | | | | | | | | |
Net investment income (loss) (d) | | | $0.37 | | | | $0.36 | | | | $0.33 | (c) | | | $0.46 | | | | $0.27 | |
Net realized and unrealized gain (loss) | | | 1.86 | | | | 6.77 | | | | 6.11 | | | | 4.53 | | | | (0.52 | ) |
Total from investment operations | | | $2.23 | | | | $7.13 | | | | $6.44 | | | | $4.99 | | | | $(0.25 | ) |
| | |
| Less distributions declared to shareholders | | | | | | | | | |
From net investment income | | | $(0.35 | ) | | | $(0.44 | ) | | | $(0.37 | ) | | | $(0.27 | ) | | | $(0.25 | ) |
From net realized gain | | | (4.22 | ) | | | (3.25 | ) | | | (1.72 | ) | | | (2.22 | ) | | | (1.90 | ) |
Total distributions declared to shareholders | | | $(4.57 | ) | | | $(3.69 | ) | | | $(2.09 | ) | | | $(2.49 | ) | | | $(2.15 | ) |
Net asset value, end of period (x) | | | $44.12 | | | | $46.46 | | | | $43.02 | | | | $38.67 | | | | $36.17 | |
Total return (%) (r)(s)(t)(x) | | | 6.44 | | | | 17.50 | | | | 17.46 | (c) | | | 14.39 | | | | (0.92 | ) |
| | |
Ratios (%) (to average net assets)
and Supplemental data: | | | | | | | | | |
Expenses before expense reductions (f) | | | 0.80 | | | | 0.82 | | | | 0.82 | (c) | | | 0.83 | | | | 0.82 | |
Expenses after expense reductions (f) | | | N/A | | | | N/A | | | | 0.82 | (c) | | | 0.83 | | | | 0.82 | |
Net investment income (loss) | | | 0.88 | | | | 0.81 | | | | 0.83 | (c) | | | 1.24 | | | | 0.70 | |
Portfolio turnover | | | 32 | | | | 33 | | | | 38 | | | | 47 | | | | 44 | |
Net assets at end of period (000 omitted) | | | $44,941 | | | | $45,930 | | | | $45,780 | | | | $56,488 | | | | $51,952 | |
| | |
| Supplemental Ratios (%): | | | | | | | | | |
Ratio of expenses to average net assets after
expense reductions excluding short sale
expenses and interest expense and fees (f) | | | 0.78 | | | | 0.81 | | | | 0.81 | (c) | | | 0.82 | | | | 0.82 | |
See Notes to Financial Statements
27
Financial Highlights – continued
| | | | | | | | | | | | | | | | | | | | |
| Class R4 | | Year ended | |
| | | | | |
| | | 9/30/19 | | | 9/30/18 | | | 9/30/17 | | | 9/30/16 | | | 9/30/15 | |
Net asset value, beginning of period | | | $46.88 | | | | $43.31 | | | | $38.91 | | | | $36.40 | | | | $38.81 | |
| | |
| Income (loss) from investment operations | | | | | | | | | |
Net investment income (loss) (d) | | | $0.47 | | | | $0.43 | | | | $0.43 | (c) | | | $0.56 | | | | $0.37 | |
Net realized and unrealized gain (loss) | | | 1.88 | | | | 6.88 | | | | 6.16 | | | | 4.55 | | | | (0.52 | ) |
Total from investment operations | | | $2.35 | | | | $7.31 | | | | $6.59 | | | | $5.11 | | | | $(0.15 | ) |
| | |
| Less distributions declared to shareholders | | | | | | | | | |
From net investment income | | | $(0.48 | ) | | | $(0.49 | ) | | | $(0.47 | ) | | | $(0.38 | ) | | | $(0.36 | ) |
From net realized gain | | | (4.22 | ) | | | (3.25 | ) | | | (1.72 | ) | | | (2.22 | ) | | | (1.90 | ) |
Total distributions declared to shareholders | | | $(4.70 | ) | | | $(3.74 | ) | | | $(2.19 | ) | | | $(2.60 | ) | | | $(2.26 | ) |
Net asset value, end of period (x) | | | $44.53 | | | | $46.88 | | | | $43.31 | | | | $38.91 | | | | $36.40 | |
Total return (%) (r)(s)(t)(x) | | | 6.69 | | | | 17.84 | | | | 17.77 | (c) | | | 14.66 | | | | (0.68 | ) |
| | |
Ratios (%) (to average net assets)
and Supplemental data: | | | | | | | | | |
Expenses before expense reductions (f) | | | 0.55 | | | | 0.57 | | | | 0.57 | (c) | | | 0.58 | | | | 0.57 | |
Expenses after expense reductions (f) | | | N/A | | | | N/A | | | | 0.57 | (c) | | | 0.58 | | | | 0.57 | |
Net investment income (loss) | | | 1.13 | | | | 0.97 | | | | 1.08 | (c) | | | 1.52 | | | | 0.96 | |
Portfolio turnover | | | 32 | | | | 33 | | | | 38 | | | | 47 | | | | 44 | |
Net assets at end of period (000 omitted) | | | $16,869 | | | | $17,148 | | | | $49,141 | | | | $57,922 | | | | $46,669 | |
| | |
| Supplemental Ratios (%): | | | | | | | | | |
Ratio of expenses to average net assets after
expense reductions excluding short sale
expenses and interest expense and fees (f) | | | 0.53 | | | | 0.56 | | | | 0.56 | (c) | | | 0.57 | | | | 0.57 | |
See Notes to Financial Statements
28
Financial Highlights – continued
| | | | | | | | | | | | | | | | | | | | |
| Class R6 | | Year ended | |
| | | | | |
| | | 9/30/19 | | | 9/30/18 | | | 9/30/17 | | | 9/30/16 | | | 9/30/15 | |
Net asset value, beginning of period | | | $46.82 | | | | $43.33 | | | | $38.94 | | | | $36.42 | | | | $38.82 | |
| | |
| Income (loss) from investment operations | | | | | | | | | |
Net investment income (loss) (d) | | | $0.50 | | | | $0.51 | | | | $0.46 | (c) | | | $0.58 | | | | $0.41 | |
Net realized and unrealized gain (loss) | | | 1.86 | | | | 6.83 | | | | 6.16 | | | | 4.58 | | | | (0.53 | ) |
Total from investment operations | | | $2.36 | | | | $7.34 | | | | $6.62 | | | | $5.16 | | | | $(0.12 | ) |
| | |
| Less distributions declared to shareholders | | | | | | | | | |
From net investment income | | | $(0.52 | ) | | | $(0.60 | ) | | | $(0.51 | ) | | | $(0.42 | ) | | | $(0.38 | ) |
From net realized gain | | | (4.22 | ) | | | (3.25 | ) | | | (1.72 | ) | | | (2.22 | ) | | | (1.90 | ) |
Total distributions declared to shareholders | | | $(4.74 | ) | | | $(3.85 | ) | | | $(2.23 | ) | | | $(2.64 | ) | | | $(2.28 | ) |
Net asset value, end of period (x) | | | $44.44 | | | | $46.82 | | | | $43.33 | | | | $38.94 | | | | $36.42 | |
Total return (%) (r)(s)(t)(x) | | | 6.75 | | | | 17.92 | | | | 17.86 | (c) | | | 14.80 | | | | (0.59 | ) |
| | |
Ratios (%) (to average net assets)
and Supplemental data: | | | | | | | | | |
Expenses before expense reductions (f) | | | 0.48 | | | | 0.48 | | | | 0.49 | (c) | | | 0.48 | | | | 0.48 | |
Expenses after expense reductions (f) | | | N/A | | | | N/A | | | | 0.49 | (c) | | | 0.48 | | | | 0.48 | |
Net investment income (loss) | | | 1.19 | | | | 1.15 | | | | 1.16 | (c) | | | 1.57 | | | | 1.05 | |
Portfolio turnover | | | 32 | | | | 33 | | | | 38 | | | | 47 | | | | 44 | |
Net assets at end of period (000 omitted) | | | $1,433,024 | | | | $1,441,866 | | | | $1,393,491 | | | | $1,374,807 | | | | $1,347,779 | |
| | |
| Supplemental Ratios (%): | | | | | | | | | |
Ratio of expenses to average net assets after
expense reductions excluding short sale
expenses and interest expense and fees (f) | | | 0.46 | | | | 0.47 | | | | 0.47 | (c) | | | 0.48 | | | | 0.48 | |
| (c) | Amount reflects aone-time reimbursement of expenses by the custodian (or former custodian) without which net investment income and performance would be lower and expenses would be higher. |
| (d) | Per share data is based on average shares outstanding. |
| (f) | Ratios do not reflect reductions from fees paid indirectly, if applicable. |
| (r) | Certain expenses have been reduced without which performance would have been lower. |
| (s) | From time to time the fund may receive proceeds from litigation settlements, without which performance would be lower. |
| (t) | Total returns do not include any applicable sales charges. |
| (x) | The net asset values and total returns have been calculated on net assets which include adjustments made in accordance with U.S. generally accepted accounting principles required at period end for financial reporting purposes. |
See Notes to Financial Statements
29
NOTES TO FINANCIAL STATEMENTS
(1) Business and Organization
MFS Research Fund (the fund) is a diversified series of MFS Series Trust V (the trust). The trust is organized as a Massachusetts business trust and is registered under the Investment Company Act of 1940, as amended, as anopen-end management investment company.
The fund is an investment company and accordingly follows the investment company accounting and reporting guidance of the Financial Accounting Standards Board (FASB) Accounting Standards Codification Topic 946 Financial Services – Investment Companies.
(2) Significant Accounting Policies
General– The preparation of financial statements in conformity with U.S. generally accepted accounting principles requires management to make estimates and assumptions that affect the reported amounts of assets and liabilities, and disclosure of contingent assets and liabilities at the date of the financial statements and the reported amounts of increases and decreases in net assets from operations during the reporting period. Actual results could differ from those estimates. In the preparation of these financial statements, management has evaluated subsequent events occurring after the date of the fund’s Statement of Assets and Liabilities through the date that the financial statements were issued.
Balance Sheet Offsetting– The fund’s accounting policy with respect to balance sheet offsetting is that, absent an event of default by the counterparty or a termination of the agreement, the International Swaps and Derivatives Association (ISDA) Master Agreement, or similar agreement, does not result in an offset of reported amounts of financial assets and financial liabilities in the Statement of Assets and Liabilities across transactions between the fund and the applicable counterparty. The fund’s right to setoff may be restricted or prohibited by the bankruptcy or insolvency laws of the particular jurisdiction to which a specific master netting agreement counterparty is subject. Balance sheet offsetting disclosures, to the extent applicable to the fund, have been included in the fund’s Significant Accounting Policies note under the captions for each of the fund’sin-scope financial instruments and transactions.
Investment Valuations– Equity securities, including restricted equity securities and equity securities sold short, are generally valued at the last sale or official closing price on their primary market or exchange as provided by a third-party pricing service. Equity securities, for which there were no sales reported that day, are generally valued at the last quoted daily bid quotation on their primary market or exchange as provided by a third-party pricing service. Equity securities sold short, for which there were no sales reported for that day, are generally valued at the last quoted daily ask quotation on their primary market or exchange as provided by a third-party pricing service.Short-term instruments with a maturity at issuance of 60 days or less may be valued at amortized cost, which approximates market value.Open-end investment companies are generally valued at net asset value per share. Securities and other assets generally valued on the basis of information from a third-party pricing service may also be valued at a broker/dealer bid quotation. In determining values, third-party pricing services can utilize both transaction data and market information such as yield, quality, coupon
30
Notes to Financial Statements – continued
rate, maturity, type of issue, trading characteristics, and other market data. The values of foreign securities and other assets and liabilities expressed in foreign currencies are converted to U.S. dollars using the mean of bid and asked prices for rates provided by a third-party pricing service.
The Board of Trustees has delegated primary responsibility for determining or causing to be determined the value of the fund’s investments (including any fair valuation) to the adviser pursuant to valuation policies and procedures approved by the Board. If the adviser determines that reliable market quotations are not readily available, investments are valued at fair value as determined in good faith by the adviser in accordance with such procedures under the oversight of the Board of Trustees. Under the fund’s valuation policies and procedures, market quotations are not considered to be readily available for most types of debt instruments and floating rate loans and many types of derivatives. These investments are generally valued at fair value based on information from third-party pricing services. In addition, investments may be valued at fair value if the adviser determines that an investment’s value has been materially affected by events occurring after the close of the exchange or market on which the investment is principally traded (such as foreign exchange or market) and prior to the determination of the fund’s net asset value, or after the halt of trading of a specific security where trading does not resume prior to the close of the exchange or market on which the security is principally traded. Events that occur after foreign markets close (such as developments in foreign markets and significant movements in the U.S. markets) and prior to the determination of the fund’s net asset value may be deemed to have a material effect on the value of securities traded in foreign markets. Accordingly, the fund’s foreign equity securities may often be valued at fair value. The adviser generally relies on third-party pricing services or other information (such as the correlation with price movements of similar securities in the same or other markets; the type, cost and investment characteristics of the security; the business and financial condition of the issuer; and trading and other market data) to assist in determining whether to fair value and at what value to fair value an investment. The value of an investment for purposes of calculating the fund’s net asset value can differ depending on the source and method used to determine value. When fair valuation is used, the value of an investment used to determine the fund’s net asset value may differ from quoted or published prices for the same investment. There can be no assurance that the fund could obtain the fair value assigned to an investment if it were to sell the investment at the same time at which the fund determines its net asset value per share.
Various inputs are used in determining the value of the fund’s assets or liabilities. These inputs are categorized into three broad levels. In certain cases, the inputs used to measure fair value may fall into different levels of the fair value hierarchy. In such cases, an investment’s level within the fair value hierarchy is based on the lowest level of input that is significant to the fair value measurement. The fund’s assessment of the significance of a particular input to the fair value measurement in its entirety requires judgment, and considers factors specific to the investment. Level 1 includes unadjusted quoted prices in active markets for identical assets or liabilities. Level 2 includes other significant observable market-based inputs (including quoted prices for similar securities, interest rates, prepayment speed, and credit risk). Level 3 includes
31
Notes to Financial Statements – continued
unobservable inputs, which may include the adviser’s own assumptions in determining the fair value of investments. The following is a summary of the levels used as of September 30, 2019 in valuing the fund’s assets or liabilities:
| | | | | | | | | | | | | | | | |
| | | | |
| Financial Instruments | | Level 1 | | | Level 2 | | | Level 3 | | | Total | |
| Equity Securities | | | $5,866,304,464 | | | | $— | | | | $— | | | | $5,866,304,464 | |
| Mutual Funds | | | 89,761,455 | | | | — | | | | — | | | | 89,761,455 | |
| Total | | | $5,956,065,919 | | | | $— | | | | $— | | | | $5,956,065,919 | |
| Securities Sold Short | | | $(26,005,389 | ) | | | $— | | | | $— | | | | $(26,005,389 | ) |
For further information regarding security characteristics, see the Portfolio of Investments.
Foreign Currency Translation– Purchases and sales of foreign investments, income, and expenses are converted into U.S. dollars based upon currency exchange rates prevailing on the respective dates of such transactions or on the reporting date for foreign denominated receivables and payables. Gains and losses attributable to foreign currency exchange rates on sales of securities are recorded for financial statement purposes as net realized gains and losses on investments. Gains and losses attributable to foreign exchange rate movements on receivables, payables, income and expenses are recorded for financial statement purposes as foreign currency transaction gains and losses. That portion of both realized and unrealized gains and losses on investments that results from fluctuations in foreign currency exchange rates is not separately disclosed.
Short Sales– The fund entered into short sales whereby it sells a security it does not own in anticipation of a decline in the value of that security. The fund will realize a gain if the security price decreases and a loss if the security price increases between the date of the short sale and the date on which the fund replaces the borrowed security. Losses from short sales can exceed the proceeds of the security sold; and they can also exceed the potential loss from an ordinary buy and sell transaction. The amount of any premium, dividends, or interest the fund may be required to pay in connection with a short sale will be recognized as a fund expense. During the year ended September 30, 2019, this expense amounted to $1,103,936. The fund segregates cash or marketable securities in an amount that, when combined with the amount of proceeds from the short sale deposited with the broker, at least equals the current market value of the security sold short.
Security Loans– Under its Securities Lending Agency Agreement with the fund, JPMorgan Chase and Co., as lending agent, loans the securities of the fund to certain qualified institutions (the “Borrowers”) approved by the fund. Security loans can be terminated at the discretion of either the lending agent or the fund and the related securities must be returned within the earlier of the standard trade settlement period for such securities or within three business days. The loans are collateralized by cash and/or U.S. Treasury and federal agency obligations in an amount typically at least equal to the market value of the securities loaned. On loans collateralized by cash, the cash collateral is invested in a money market fund. The market value of the loaned securities is determined at the close of business of the fund and any additional required collateral is delivered to the fund on the next business day. The lending agent provides the fund with indemnification against Borrower default. In the event of Borrower
32
Notes to Financial Statements – continued
default, the lending agent will, for the benefit of the fund, either purchase securities identical to those loaned or, when such purchase is commercially impracticable, pay the fund the market value of the loaned securities. In return, the lending agent assumes the fund’s rights to the related collateral. If the collateral value is less than the cost to purchase identical securities, the lending agent is responsible for the shortfall, but only to the extent that such shortfall is not due to a decline in collateral value resulting from collateral reinvestment for which the fund bears the risk of loss. A portion of the income generated upon investment of the collateral is remitted to the Borrowers, and the remainder is allocated between the fund and the lending agent. On loans collateralized by U.S. Treasury and/or federal agency obligations, a fee is received from the Borrower, and is allocated between the fund and the lending agent. Income from securities lending is separately reported in the Statement of Operations. The dividend and interest income earned on the securities loaned is accounted for in the same manner as other dividend and interest income. At September 30, 2019, there were no securities on loan or collateral outstanding.
Indemnifications– Under the fund’s organizational documents, its officers and Trustees may be indemnified against certain liabilities and expenses arising out of the performance of their duties to the fund. Additionally, in the normal course of business, the fund enters into agreements with service providers that may contain indemnification clauses. The fund’s maximum exposure under these agreements is unknown as this would involve future claims that may be made against the fund that have not yet occurred.
Investment Transactions and Income– Investment transactions are recorded on the trade date. Dividends received in cash are recorded on theex-dividend date. Certain dividends from foreign securities will be recorded when the fund is informed of the dividend if such information is obtained subsequent to theex-dividend date. Dividend payments received in additional securities are recorded on theex-dividend date in an amount equal to the value of the security on such date.
The fund may receive proceeds from litigation settlements. Any proceeds received from litigation involving portfolio holdings are reflected in the Statement of Operations in realized gain/loss if the security has been disposed of by the fund or in unrealized gain/loss if the security is still held by the fund. Any other proceeds from litigation not related to portfolio holdings are reflected as other income in the Statement of Operations.
Fees Paid Indirectly– The fund’s custody fee may be reduced by a credit earned under an arrangement that measures the value of U.S. dollars deposited with the custodian by the fund. The amount of the credit, for the year ended September 30, 2019, is shown as a reduction of total expenses in the Statement of Operations.
Tax Matters and Distributions– The fund intends to qualify as a regulated investment company, as defined under Subchapter M of the Internal Revenue Code, and to distribute all of its taxable income, including realized capital gains. As a result, no provision for federal income tax is required. The fund’s federal tax returns, when filed, will remain subject to examination by the Internal Revenue Service for a three year period. Management has analyzed the fund’s tax positions taken on federal and
33
Notes to Financial Statements – continued
state tax returns for all open tax years and does not believe that there are any uncertain tax positions that require recognition of a tax liability. Foreign taxes, if any, have been accrued by the fund in the accompanying financial statements in accordance with the applicable foreign tax law. Foreign income taxes may be withheld by certain countries in which the fund invests. Additionally, capital gains realized by the fund on securities issued in or by certain foreign countries may be subject to capital gains tax imposed by those countries.
Distributions to shareholders are recorded on theex-dividend date. Income and capital gain distributions are determined in accordance with income tax regulations, which may differ from U.S. generally accepted accounting principles. Certain capital accounts in the financial statements are periodically adjusted for permanent differences in order to reflect their tax character. These adjustments have no impact on net assets or net asset value per share. Temporary differences which arise from recognizing certain items of income, expense, gain or loss in different periods for financial statement and tax purposes will reverse at some time in the future.
Book/tax differences primarily relate to wash sale loss deferrals, treating a portion of the proceeds from redemptions as a distribution for tax purposes and partnership adjustments.
The tax character of distributions declared to shareholders for the last two fiscal years is as follows:
| | | | | | | | |
| | |
| | | Year ended | | | Year ended | |
| | |
| | | 9/30/19 | | | 9/30/18 | |
| Ordinary income (including any short-term capital gains) | | | $79,979,245 | | | | $116,701,049 | |
| Long-term capital gains | | | 491,539,312 | | | | 340,520,945 | |
| | |
| Total distributions | | | $571,518,557 | | | | $457,221,994 | |
The federal tax cost and the tax basis components of distributable earnings were as follows:
| | | | |
| |
| As of 9/30/19 | | | |
| |
| Cost of investments | | | $4,117,480,788 | |
| Gross appreciation | | | 1,895,688,132 | |
| |
| Gross depreciation | | | (83,108,390 | ) |
| Net unrealized appreciation (depreciation) | | | $1,812,579,742 | |
| |
| Undistributed ordinary income | | | 37,661,197 | |
| Undistributed long-term capital gain | | | 152,607,610 | |
| Other temporary differences | | | 9,062,098 | |
Multiple Classes of Shares of Beneficial Interest– The fund offers multiple classes of shares, which differ in their respective distribution and service fees. The fund’s income, realized and unrealized gain (loss), and common expenses are allocated to shareholders based on the daily net assets of each class. Dividends are declared separately for each class. Differences in per share dividend rates are generally due to differences in separate class expenses. Class B shares will convert to Class A shares approximately eight years after purchase. Class C shares will convert to Class A shares
34
Notes to Financial Statements – continued
approximately ten years after purchase. The fund’s distributions declared to shareholders as reported in the Statements of Changes in Net Assets are presented by class as follows:
| | | | | | | | |
| | |
| | | Year
ended
9/30/19 | | | Year
ended
9/30/18 | |
| Class A | | | $138,147,679 | | | | $225,457,016 | |
| Class B | | | 2,091,496 | | | | 1,826,737 | |
| Class C | | | 7,652,002 | | | | 11,266,042 | |
| Class I | | | 269,979,758 | | | | 90,800,295 | |
| Class R1 | | | 489,361 | | | | 375,982 | |
| Class R2 | | | 2,084,724 | | | | 2,161,462 | |
| Class R3 | | | 4,199,214 | | | | 3,784,934 | |
| Class R4 | | | 1,753,534 | | | | 1,319,764 | |
| Class R6 | | | 145,120,789 | | | | 120,229,762 | |
| Total | | | $571,518,557 | | | | $457,221,994 | |
(3) Transactions with Affiliates
Investment Adviser– The fund has an investment advisory agreement with MFS to provide overall investment management and related administrative services and facilities to the fund. The management fee is computed daily and paid monthly at the following annual rates based on the fund’s average daily net assets:
| | | | |
| Up to $5 billion | | | 0.43 | % |
| In excess of $5 billion and up to $10 billion | | | 0.40 | % |
| In excess of $10 billion | | | 0.37 | % |
The management fee incurred for the year ended September 30, 2019 was equivalent to an annual effective rate of 0.43% of the fund’s average daily net assets.
Distributor– MFS Fund Distributors, Inc. (MFD), a wholly-owned subsidiary of MFS, as distributor, received $75,160 for the year ended September 30, 2019, as its portion of the initial sales charge on sales of Class A shares of the fund.
The Board of Trustees has adopted a distribution plan for certain share classes pursuant to Rule12b-1 of the Investment Company Act of 1940.
The fund’s distribution plan provides that the fund will pay MFD for services provided by MFD and financial intermediaries in connection with the distribution and servicing of certain share classes. One component of the plan is a distribution fee paid to MFD and another component of the plan is a service fee paid to MFD. MFD may subsequently pay all, or a portion, of the distribution and/or service fees to financial intermediaries.
35
Notes to Financial Statements – continued
Distribution Plan Fee Table:
| | | | | | | | | | | | | | | | | | | | |
| | | | | |
| | | Distribution
Fee Rate (d) | | | Service
Fee Rate (d) | | | Total
Distribution
Plan (d) | | | Annual
Effective
Rate (e) | | | Distribution
and Service
Fee | |
| Class A | | | — | | | | 0.25% | | | | 0.25% | | | | 0.24% | | | | $3,426,006 | |
| Class B | | | 0.75% | | | | 0.25% | | | | 1.00% | | | | 0.99% | | | | 187,129 | |
| Class C | | | 0.75% | | | | 0.25% | | | | 1.00% | | | | 1.00% | | | | 709,882 | |
| Class R1 | | | 0.75% | | | | 0.25% | | | | 1.00% | | | | 1.00% | | | | 45,229 | |
| Class R2 | | | 0.25% | | | | 0.25% | | | | 0.50% | | | | 0.50% | | | | 100,227 | |
| Class R3 | | | — | | | | 0.25% | | | | 0.25% | | | | 0.25% | | | | 104,044 | |
| Total Distribution and Service Fees | | | | | | | | | | | | $4,572,517 | |
| (d) | In accordance with the distribution plan for certain classes, the fund pays distribution and/or service fees equal to these annual percentage rates of each class’s average daily net assets. The distribution and service fee rates disclosed by class represent the current rates in effect at the end of the reporting period. Any rate changes, if applicable, are detailed below. |
| (e) | The annual effective rates represent actual fees incurred under the distribution plan for the year ended September 30, 2019 based on each class’s average daily net assets. MFD has voluntarily agreed to rebate a portion of each class’s 0.25% service fee attributable to accounts for which MFD retains the 0.25% service fee except for accounts attributable to MFS or its affiliates’ seed money. For the year ended September 30, 2019, this rebate amounted to $149,620, $1,179, and $1,106 for Class A, Class B, and Class C, respectively, and is included in the reduction of total expenses in the Statement of Operations. |
Certain Class A shares are subject to a contingent deferred sales charge (CDSC) in the event of a shareholder redemption within 18 months of purchase. Class B shares are subject to a CDSC in the event of a shareholder redemption within six years of purchase. Class C shares are subject to a CDSC in the event of a shareholder redemption within 12 months of purchase. All contingent deferred sales charges are paid to MFD and during the year ended September 30, 2019, were as follows:
| | | | |
| |
| | | Amount | |
| Class A | | | $3,617 | |
| Class B | | | 19,569 | |
| Class C | | | 5,023 | |
Shareholder Servicing Agent– MFS Service Center, Inc. (MFSC), a wholly-owned subsidiary of MFS, receives a fee from the fund for its services as shareholder servicing agent calculated as a percentage of the average daily net assets of the fund as determined periodically under the supervision of the fund’s Board of Trustees. For the year ended September 30, 2019, the fee was $365,451, which equated to 0.0066% annually of the fund’s average daily net assets. MFSC also receives payment from the fund forout-of-pocket expenses,sub-accounting and other shareholder servicing costs which may be paid to affiliated and unaffiliated service providers. Class R6 shares do not incursub-accounting fees. For the year ended September 30, 2019, theseout-of-pocket expenses,sub-accounting and other shareholder servicing costs amounted to $2,927,210.
Administrator– MFS provides certain financial, legal, shareholder communications, compliance, and other administrative services to the fund. Under an administrative services agreement, the fund reimburses MFS the costs incurred to provide these services. The fund is charged an annual fixed amount of $17,500 plus a fee based on
36
Notes to Financial Statements – continued
average daily net assets. The administrative services fee incurred for the year ended September 30, 2019 was equivalent to an annual effective rate of 0.0104% of the fund’s average daily net assets.
Trustees’ and Officers’ Compensation– The fund pays compensation to independent Trustees in the form of a retainer, attendance fees, and additional compensation to Board and Committee chairpersons. The fund does not pay compensation directly to Trustees or officers of the fund who are also officers of the investment adviser, all of whom receive remuneration from MFS for their services to the fund. Certain officers and Trustees of the fund are officers or directors of MFS, MFD, and MFSC.
Prior to December 31, 2001, the fund had an unfunded defined benefit plan (“DB plan”) for independent Trustees. As of December 31, 2001, the Board took action to terminate the DB plan with respect to then-current and any future independent Trustees, such that the DB plan covers only certain of those former independent Trustees who retired on or before December 31, 2001. Effective January 1, 2002, accrued benefits under the DB plan for then-current independent Trustees who continued were credited to an unfunded retirement deferral plan (the “Retirement Deferral plan”), which was established for and exists solely with respect to these credited amounts, and is not available for other deferrals by these or other independent Trustees. Although the Retirement Deferral plan is unfunded, amounts deferred under the plan are periodically adjusted for investment experience as if they had been invested in shares of the fund. The DB plan resulted in a net decrease in pension expense of $696 and the Retirement Deferral plan, which terminated on December 31, 2018, resulted in a net decrease in expense of $8,495. Both amounts are included in “Independent Trustees’ compensation” in the Statement of Operations for the year ended September 30, 2019. The liability for deferred retirement benefits payable to those former independent Trustees under the DB Plan amounted to $9,302 at September 30, 2019, and is included in “Payable for independent Trustees’ compensation” in the Statement of Assets and Liabilities.
Other– This fund and certain other funds managed by MFS (the funds) had entered into a service agreement (the ISO Agreement) which provided for payment of fees solely by the funds to Tarantino LLC in return for the provision of services of an Independent Senior Officer (ISO) for the funds. Frank L. Tarantino served as the ISO and was an officer of the funds and the sole member of Tarantino LLC. Effective June 30, 2019, Mr. Tarantino retired from his position as ISO for the funds, and the ISO Agreement was terminated. For the year ended September 30, 2019, the fee paid by the fund under this agreement was $9,200 and is included in “Miscellaneous” expense in the Statement of Operations. MFS had agreed to bear all expenses associated with office space, other administrative support, and supplies provided to the ISO.
The fund invests in the MFS Institutional Money Market Portfolio which is managed by MFS and seeks current income consistent with preservation of capital and liquidity. This money market fund does not pay a management fee to MFS.
The fund is permitted to engage in purchase and sale transactions with funds and accounts for which MFS serves as investment adviser orsub-adviser (“cross-trades”) pursuant to a policy adopted by the Board of Trustees. This policy has been designed to
37
Notes to Financial Statements – continued
ensure that cross-trades conducted by the fund comply with Rule17a-7 under the Investment Company Act of 1940. During the year ended September 30, 2019, the fund engaged in purchase and sale transactions pursuant to this policy, which amounted to $782,574 and $1,264,342, respectively. The sales transactions resulted in net realized gains (losses) of $(143,146).
The adviser has voluntarily undertaken to reimburse the fund from its own resources on a quarterly basis for the cost of investment research embedded in the cost of the fund’s securities trades. This agreement may be rescinded at any time. For the year ended September 30, 2019, this reimbursement amounted to $249,971, which is included in “Other” income in the Statement of Operations.
(4) Portfolio Securities
For the year ended September 30, 2019, purchases and sales of investments, other than short sales and short-term obligations, aggregated $1,761,425,884 and $1,992,449,360, respectively.
(5) Shares of Beneficial Interest
The fund’s Declaration of Trust permits the Trustees to issue an unlimited number of full and fractional shares of beneficial interest. Transactions in fund shares were as follows:
| | | | | | | | | | | | | | | | |
| | | Year ended
9/30/19 | | | Year ended
9/30/18 | |
| | | | |
| | | Shares | | | Amount | | | Shares | | | Amount | |
| Shares sold | | | | | | | | | | | | | | | | |
Class A | | | 2,105,552 | | | | $87,442,939 | | | | 9,065,994 | | | | $393,829,095 | |
Class B | | | 24,679 | | | | 902,292 | | | | 46,660 | | | | 1,867,841 | |
Class C | | | 263,241 | | | | 9,771,940 | | | | 228,965 | | | | 9,105,615 | |
Class I | | | 13,770,747 | | | | 591,220,611 | | | | 41,994,689 | | | | 1,940,081,525 | |
Class R1 | | | 7,267 | | | | 267,565 | | | | 9,337 | | | | 363,733 | |
Class R2 | | | 104,526 | | | | 4,310,220 | | | | 76,306 | | | | 3,258,571 | |
Class R3 | | | 353,229 | | | | 14,728,714 | | | | 155,544 | | | | 6,802,522 | |
Class R4 | | | 101,388 | | | | 4,368,463 | | | | 72,981 | | | | 3,223,315 | |
Class R6 | | | 1,318,964 | | | | 53,037,725 | | | | 1,426,465 | | | | 61,935,165 | |
| | | 18,049,593 | | | | $766,050,469 | | | | 53,076,941 | | | | $2,420,467,382 | |
| | | | |
| Shares issued to shareholders in reinvestment of distributions | | | | | | | | | | | | | | | | |
Class A | | | 3,344,566 | | | | $127,696,067 | | | | 5,123,208 | | | | $216,097,174 | |
Class B | | | 59,825 | | | | 2,057,393 | | | | 46,740 | | | | 1,799,052 | |
Class C | | | 215,967 | | | | 7,370,963 | | | | 287,937 | | | | 10,993,423 | |
Class I | | | 6,827,037 | | | | 267,483,300 | | | | 2,064,006 | | | | 89,288,888 | |
Class R1 | | | 14,638 | | | | 489,361 | | | | 10,010 | | | | 375,982 | |
Class R2 | | | 53,649 | | | | 1,976,977 | | | | 47,102 | | | | 1,926,937 | |
Class R3 | | | 110,914 | | | | 4,199,214 | | | | 89,543 | | | | 3,755,448 | |
Class R4 | | | 43,713 | | | | 1,667,190 | | | | 31,252 | | | | 1,319,764 | |
Class R6 | | | 3,739,653 | | | | 142,293,781 | | | | 2,805,788 | | | | 118,235,897 | |
| | | 14,409,962 | | | | $555,234,246 | | | | 10,505,586 | | | | $443,792,565 | |
38
Notes to Financial Statements – continued
| | | | | | | | | | | | | | | | |
| | | Year ended
9/30/19 | | | Year ended
9/30/18 | |
| | | | |
| | | Shares | | | Amount | | | Shares | | | Amount | |
| Shares reacquired | | | | | | | | | | | | | | | | |
Class A | | | (3,979,669 | ) | | | $(164,663,141 | ) | | | (44,128,636 | ) | | | $(1,978,195,847 | ) |
Class B | | | (144,438 | ) | | | (5,396,240 | ) | | | (147,191 | ) | | | (5,918,797 | ) |
Class C | | | (531,554 | ) | | | (19,689,950 | ) | | | (2,052,926 | ) | | | (79,678,308 | ) |
Class I | | | (15,916,977 | ) | | | (673,612,552 | ) | | | (10,775,031 | ) | | | (494,586,536 | ) |
Class R1 | | | (33,359 | ) | | | (1,276,373 | ) | | | (8,037 | ) | | | (313,375 | ) |
Class R2 | | | (118,138 | ) | | | (4,668,529 | ) | | | (276,935 | ) | | | (11,877,316 | ) |
Class R3 | | | (434,046 | ) | | | (18,215,953 | ) | | | (320,813 | ) | | | (14,023,442 | ) |
Class R4 | | | (132,068 | ) | | | (5,679,892 | ) | | | (873,106 | ) | | | (38,880,285 | ) |
Class R6 | | | (3,613,131 | ) | | | (152,449,670 | ) | | | (5,597,413 | ) | | | (247,206,198 | ) |
| | | (24,903,380 | ) | | | $(1,045,652,300 | ) | | | (64,180,088 | ) | | | $(2,870,680,104 | ) |
| | | | |
| Net change | | | | | | | | | | | | | | | | |
Class A | | | 1,470,449 | | | | $50,475,865 | | | | (29,939,434 | ) | | | $(1,368,269,578 | ) |
Class B | | | (59,934 | ) | | | (2,436,555 | ) | | | (53,791 | ) | | | (2,251,904 | ) |
Class C | | | (52,346 | ) | | | (2,547,047 | ) | | | (1,536,024 | ) | | | (59,579,270 | ) |
Class I | | | 4,680,807 | | | | 185,091,359 | | | | 33,283,664 | | | | 1,534,783,877 | |
Class R1 | | | (11,454 | ) | | | (519,447 | ) | | | 11,310 | | | | 426,340 | |
Class R2 | | | 40,037 | | | | 1,618,668 | | | | (153,527 | ) | | | (6,691,808 | ) |
Class R3 | | | 30,097 | | | | 711,975 | | | | (75,726 | ) | | | (3,465,472 | ) |
Class R4 | | | 13,033 | | | | 355,761 | | | | (768,873 | ) | | | (34,337,206 | ) |
Class R6 | | | 1,445,486 | | | | 42,881,836 | | | | (1,365,160 | ) | | | (67,035,136 | ) |
| | | 7,556,175 | | | | $275,632,415 | | | | (597,561 | ) | | | $(6,420,157 | ) |
Class T shares were not publicly available for sale during the period. Please see the fund’s prospectus for details.
Effective June 1, 2019, purchases of the fund’s Class B shares are closed to new and existing investors subject to certain exceptions. Please see the fund’s prospectus for details.
The fund is one of several mutual funds in which certain MFS funds may invest. The MFS funds do not invest in the underlying funds for the purpose of exercising management or control. At the end of the period, the MFS Moderate Allocation Fund, the MFS Growth Allocation Fund, the MFS Conservative Allocation Fund, and the MFS Aggressive Growth Allocation Fund were the owners of record of approximately 8%, 7%, 3%, and 3%, respectively, of the value of outstanding voting shares of the fund. In addition, the MFS Lifetime 2020 Fund, the MFS Lifetime 2025 Fund, the MFS Lifetime 2030 Fund, the MFS Lifetime 2035 Fund, the MFS Lifetime 2040 Fund, the MFS Lifetime 2045 Fund, the MFS Lifetime 2050 Fund, the MFS Lifetime 2055 Fund, the MFS Lifetime 2060 Fund, and the MFS Lifetime Income Fund were each the owners of record of less than 1% of the value of outstanding voting shares of the fund.
(6) Line of Credit
The fund and certain other funds managed by MFS participate in a $1.25 billion unsecured committed line of credit, subject to a $1 billion sublimit, provided by a syndicate of banks under a credit agreement. Borrowings may be made for temporary
39
Notes to Financial Statements – continued
financing needs. Interest is charged to each fund, based on its borrowings, generally at a rate equal to the highest of one month LIBOR, the Federal Funds Effective Rate and the Overnight Bank Funding Rate, plus an agreed upon spread. A commitment fee, based on the average daily, unused portion of the committed line of credit, is allocated among the participating funds. In addition, the fund and other funds managed by MFS have established unsecured uncommitted borrowing arrangements with certain banks for temporary financing needs. Interest is charged to each fund, based on its borrowings, at rates equal to customary reference rates plus an agreed upon spread. For the year ended September 30, 2019, the fund’s commitment fee and interest expense were $32,082 and $0, respectively, and are included in “Interest expense and fees” in the Statement of Operations.
(7) Investments in Affiliated Issuers
An affiliated issuer may be considered one in which the fund owns 5% or more of the outstanding voting securities, or a company which is under common control. For the purposes of this report, the following were affiliated issuers:
| | | | | | | | | | | | | | | | | | | | | | | | |
| | | | | | |
| Affiliated Issuers | | Beginning
Value | | | Purchases | | | Sales
Proceeds | | | Realized
Gain
(Loss) | | | Change in
Unrealized
Appreciation or
Depreciation | | | Ending
Value | |
| MFS Institutional Money Market Portfolio | | | $45,535,634 | | | | $692,935,910 | | | | $648,717,118 | | | | $6,045 | | | | $984 | | | | $89,761,455 | |
| | | | | | |
| Affiliated Issuers | | | | | | | | | | | | | | Dividend
Income | | | Capital Gain
Distributions | |
| MFS Institutional Money Market Portfolio | | | | | | | | | | | | $954,803 | | | | $— | |
40
REPORT OF INDEPENDENT REGISTERED PUBLIC ACCOUNTING FIRM
To the Board of Trustees of MFS Series Trust V and the Shareholders of MFS Research Fund:
Opinion on the Financial Statements and Financial Highlights
We have audited the accompanying statement of assets and liabilities of MFS Research Fund (the “Fund”), including the portfolio of investments, as of September 30, 2019, the related statement of operations for the year then ended, the statements of changes in net assets for each of the two years in the period then ended, the financial highlights for each of the five years in the period then ended, and the related notes. In our opinion, the financial statements and financial highlights present fairly, in all material respects, the financial position of the Fund as of September 30, 2019, and the results of its operations for the year then ended, the changes in its net assets for each of the two years in the period then ended, and the financial highlights for each of the five years in the period then ended, in conformity with accounting principles generally accepted in the United States of America.
Basis for Opinion
These financial statements and financial highlights are the responsibility of the Fund’s management. Our responsibility is to express an opinion on the Fund’s financial statements and financial highlights based on our audits. We are a public accounting firm registered with the Public Company Accounting Oversight Board (United States) (PCAOB) and are required to be independent with respect to the Fund in accordance with the U.S. federal securities laws and the applicable rules and regulations of the Securities and Exchange Commission and the PCAOB.
We conducted our audits in accordance with the standards of the PCAOB. Those standards require that we plan and perform the audit to obtain reasonable assurance about whether the financial statements and financial highlights are free of material misstatement, whether due to error or fraud. The Fund is not required to have, nor were we engaged to perform, an audit of its internal control over financial reporting. As part of our audits we are required to obtain an understanding of internal control over financial reporting but not for the purpose of expressing an opinion on the effectiveness of the Fund’s internal control over financial reporting. Accordingly, we express no such opinion.
Our audits included performing procedures to assess the risks of material misstatement of the financial statements and financial highlights, whether due to error or fraud, and performing procedures that respond to those risks. Such procedures included examining, on a test basis, evidence regarding the amounts and disclosures in the financial statements and financial highlights. Our audits also included evaluating the accounting principles used and significant estimates made by management, as well as evaluating the overall presentation of the financial statements and financial highlights. Our procedures included confirmation of securities owned as of September 30, 2019,
41
Report of Independent Registered Public Accounting Firm – continued
by correspondence with the custodian and brokers; when replies were not received from brokers, we performed other auditing procedures. We believe that our audits provide a reasonable basis for our opinion.
DELOITTE & TOUCHE LLP
Boston, Massachusetts
November 15, 2019
We have served as the auditor of one or more of the MFS investment companies since 1924.
42
TRUSTEES AND OFFICERS — IDENTIFICATION AND BACKGROUND
The Trustees and Officers of the Trust, as of November 1, 2019, are listed below, together with their principal occupations during the past five years. (Their titles may have varied during that period.) The address of each Trustee and Officer is 111 Huntington Avenue, Boston, Massachusetts 02199-7618.
| | | | | | | | | | |
Name, Age | | Position(s)
Held with Fund | | Trustee/Officer Since (h) | | Number of
MFS Funds
overseen
by the
Trustee | | Principal
Occupations During the Past Five Years | | Other Directorships
During the Past
Five Years (j) |
| INTERESTED TRUSTEES |
Robert J. Manning (k)
(age 56) | | Trustee | | February 2004 | | 133 | | Massachusetts Financial Services Company, Executive Chairman (since January 2017); Director; Chairman of the Board; Chief Executive Officer (until 2015);Co-Chief Executive Officer (2015-2016) | | N/A |
| | | | | |
Robin A. Stelmach (k) (age 58) | | Trustee | | January 2014 | | 133 | | Massachusetts Financial Services Company, Vice Chair (since January 2017); Chief Operating Officer and Executive Vice President (until January 2017) | | N/A |
| INDEPENDENT TRUSTEES |
John P. Kavanaugh (age 64) | | Trustee and Chair of Trustees | | January 2009 | | 133 | | Private investor | | N/A |
| | | | | |
Steven E. Buller (age 68) | | Trustee | | February 2014 | | 133 | | Financial Accounting Standards Advisory Council, Chairman (2014-2015); Public Company Accounting Oversight Board, Standing Advisory Group, Member (until 2014); BlackRock, Inc. (investment management), Managing Director (until 2014), BlackRock Finco UK (investment management), Director (until 2014) | | N/A |
43
Trustees and Officers – continued
| | | | | | | | | | |
Name, Age | | Position(s)
Held with Fund | | Trustee/Officer Since (h) | | Number of
MFS Funds
overseen
by the
Trustee | | Principal
Occupations During the Past Five Years | | Other Directorships
During the Past
Five Years (j) |
John A. Caroselli (age 65) | | Trustee | | March 2017 | | 133 | | JC Global Advisors, LLC (management consulting), President (since 2015); First Capital Corporation (commercial finance), Executive Vice President (until 2015) | | N/A |
| | | | | |
Maureen R. Goldfarb (age 64) | | Trustee | | January 2009 | | 133 | | Private investor | | N/A |
| | | | | |
Michael Hegarty
(age 74) | | Trustee | | December 2004 | | 133 | | Private investor | | Rouse Properties Inc., Director (until 2016); Capmark Financial Group Inc., Director (until 2015) |
| | | | | |
Peter D. Jones
(age 64) | | Trustee | | January 2019 | | 133 | | Franklin Templeton Distributors, Inc. (investment management), President (until 2015); Franklin Templeton Institutional, LLC (investment management), Chairman (until 2015) | | N/A |
| | | | | |
James W. Kilman, Jr.
(age 58) | | Trustee | | January 2019 | | 133 | | Burford Capital Limited (finance and investment management), Chief Financial Officer (since 2019); KielStrand Capital LLC (family office and merchant bank), Chief Executive Officer (since 2016); Morgan Stanley & Co. (financial services), Vice Chairman of Investment Banking,Co-Head of Diversified Financials Coverage – Financial Institutions Investment Banking Group (until 2016) | | Alpha-En Corporation, Director (since 2016) |
44
Trustees and Officers – continued
| | | | | | | | | | |
Name, Age | | Position(s)
Held with Fund | | Trustee/Officer Since (h) | | Number of
MFS Funds
overseen
by the
Trustee | | Principal
Occupations During the Past Five Years | | Other Directorships
During the Past
Five Years (j) |
Clarence Otis, Jr. (age 63) | | Trustee | | March 2017 | | 133 | | Darden Restaurants, Inc., Chief Executive Officer (until 2014) | | VF Corporation, Director; Verizon Communications, Inc., Director; The Travelers Companies, Director; Federal Reserve Bank of Atlanta, Director (until 2015) |
| | | | | |
Maryanne L. Roepke (age 63) | | Trustee | | May 2014 | | 133 | | American Century Investments (investment management), Senior Vice President and Chief Compliance Officer (until 2014) | | N/A |
| | | | | |
Laurie J. Thomsen
(age 62) | | Trustee | | March 2005 | | 133 | | Private investor | | The Travelers Companies, Director; Dycom Industries, Inc., Director (since 2015) |
| | | | | | | | |
Name, Age | | Position(s) Held
with Fund | | Trustee/Officer
Since (h) | | Number of
MFS Funds
for which
the Person
is an Officer | | Principal
Occupations During
the Past Five Years |
| OFFICERS | | | | | | | | |
Christopher R. Bohane (k)
(age 45) | | Assistant Secretary and Assistant Clerk | | July 2005 | | 133 | | Massachusetts Financial Services Company, Vice President and Assistant General Counsel |
| | | | |
Kino Clark (k) (age 51) | | Assistant Treasurer | | January 2012 | | 133 | | Massachusetts Financial Services Company, Vice President |
45
Trustees and Officers – continued
| | | | | | | | |
Name, Age | | Position(s) Held
with Fund | | Trustee/Officer
Since (h) | | Number of
MFS Funds
for which
the Person
is an Officer | | Principal
Occupations During
the Past Five Years |
John W. Clark, Jr. (k) (age 52) | | Assistant Treasurer | | April 2017 | | 133 | | Massachusetts Financial Services Company, Vice President (since March 2017); Deutsche Bank (financial services), Department Head – Treasurer’s Office (until February 2017) |
| | | | |
Thomas H. Connors (k) (age 60) | | Assistant Secretary and Assistant Clerk | | September 2012 | | 133 | | Massachusetts Financial Services Company, Vice President and Senior Counsel |
| | | | |
David L. DiLorenzo (k)
(age 51) | | President | | July 2005 | | 133 | | Massachusetts Financial Services Company, Senior Vice President |
| | | | |
Heidi W. Hardin (k) (age 52) | | Secretary and Clerk | | April 2017 | | 133 | | Massachusetts Financial Services Company, Executive Vice President and General Counsel (since March 2017); Harris Associates (investment management), General Counsel (from September 2015 to January 2017); Janus Capital Management LLC (investment management), Senior Vice President and General Counsel (until September 2015) |
| | | | |
Brian E. Langenfeld (k) (age 46) | | Assistant Secretary and Assistant Clerk | | June 2006 | | 133 | | Massachusetts Financial Services Company, Vice President and Senior Counsel |
| | | | |
Amanda S. Mooradian (k) (age 40) | | Assistant Secretary and Assistant Clerk | | September 2018 | | 133 | | Massachusetts Financial Services Company, Assistant Vice President and Counsel |
46
Trustees and Officers – continued
| | | | | | | | |
Name, Age | | Position(s) Held
with Fund | | Trustee/Officer
Since (h) | | Number of
MFS Funds
for which
the Person
is an Officer | | Principal
Occupations During
the Past Five Years |
Susan A. Pereira (k)
(age 48) | | Assistant Secretary and Assistant Clerk | | July 2005 | | 133 | | Massachusetts Financial Services Company, Vice President and Assistant General Counsel |
| | | | |
Kasey L. Phillips (k) (age 48) | | Assistant Treasurer | | September 2012 | | 133 | | Massachusetts Financial Services Company, Vice President |
| | | | |
Matthew A. Stowe (k) (age 44) | | Assistant Secretary and Assistant Clerk | | October 2014 | | 133 | | Massachusetts Financial Services Company, Vice President and Assistant General Counsel |
| | | | |
Martin J. Wolin (k) (age 52) | | Chief Compliance Officer | | July 2015 | | 133 | | Massachusetts Financial Services Company, Senior Vice President and Chief Compliance Officer (since July 2015); Mercer (financial service provider), Chief Risk and Compliance Officer, North America and Latin America (until June 2015) |
| | | | |
James O. Yost (k)
(age 59) | | Treasurer | | September 1990 | | 133 | | Massachusetts Financial Services Company, Senior Vice President |
| (h) | Date first appointed to serve as Trustee/officer of an MFS Fund. Each Trustee has served continuously since appointment unless indicated otherwise. For the period from December 15, 2004 until February 22, 2005, Mr. Manning served as Advisory Trustee. From January 2012 through December 2016, Messrs. DiLorenzo and Yost served as Treasurer and Deputy Treasurer of the Funds, respectively. |
| (j) | Directorships or trusteeships of companies required to report to the Securities and Exchange Commission (i.e., “public companies”). |
| (k) | “Interested person” of the Trust within the meaning of the Investment Company Act of 1940 (referred to as the 1940 Act), which is the principal federal law governing investment companies like the fund, as a result of a position with MFS. The address of MFS is 111 Huntington Avenue, Boston, Massachusetts 02199-7618. |
Each Trustee (other than Messrs. Jones and Kilman) has been elected by shareholders and each Trustee and Officer holds office until his or her successor is chosen and qualified or until his or her earlier death, resignation, retirement or removal. Messrs. Jones and Kilman became Trustees of the Funds on January 1, 2019. The Trust does
47
Trustees and Officers – continued
not hold annual meetings for the purpose of electing Trustees, and Trustees are not elected for fixed terms. Under the terms of the Board’s retirement policy, an Independent Trustee shall retire at the end of the calendar year in which he or she reaches the earlier of 75 years of age or 15 years of service on the Board (or, in the case of any Independent Trustee who joined the Board prior to 2015, 20 years of service on the Board).
Messrs. Buller, Hegarty, Kilman and Otis and Ms. Roepke are members of the Trust’s Audit Committee.
Each of the Interested Trustees and certain Officers hold comparable officer positions with certain affiliates of MFS.
The Statement of Additional Information for a Fund includes further information about the Trustees and is available without charge upon request by calling1-800-225-2606.
| | |
| Investment Adviser | | Custodian |
Massachusetts Financial Services Company
111 Huntington Avenue Boston, MA 02199-7618 | | JPMorgan Chase Bank, NA 4 Metrotech Center New York, NY 11245 |
| Distributor | | Independent Registered Public Accounting Firm |
MFS Fund Distributors, Inc.
111 Huntington Avenue Boston, MA 02199-7618 | | Deloitte & Touche LLP 200 Berkeley Street Boston, MA 02116 |
| Portfolio Manager(s) | | |
| Joseph MacDougall | | |
48
BOARD REVIEW OF INVESTMENT ADVISORY AGREEMENT
The Investment Company Act of 1940 requires that both the full Board of Trustees and a majority of thenon-interested (“independent”) Trustees, voting separately, annually approve the continuation of the Fund’s investment advisory agreement with MFS. The Trustees consider matters bearing on the Fund and its advisory arrangements at their meetings throughout the year, including a review of performance data at each regular meeting. In addition, the independent Trustees met several times over the course of three months beginning in May and ending in July, 2019 (“contract review meetings”) for the specific purpose of considering whether to approve the continuation of the investment advisory agreement for the Fund and the other investment companies that the Board oversees (the “MFS Funds”). The independent Trustees were assisted in their evaluation of the Fund’s investment advisory agreement by independent legal counsel, from whom they received separate legal advice and with whom they met separately from MFS during various contract review meetings. The independent Trustees were also assisted in this process by the MFS Funds’ Independent Senior Officer, a senior officer appointed by and reporting to the independent Trustees.
In connection with their deliberations regarding the continuation of the investment advisory agreement, the Trustees, including the independent Trustees, considered such information and factors as they believed, in light of the legal advice furnished to them and their own business judgment, to be relevant. The investment advisory agreement for the Fund was considered separately, although the Trustees also took into account the common interests of all MFS Funds in their review. As described below, the Trustees considered the nature, quality, and extent of the various investment advisory, administrative, and shareholder services performed by MFS under the existing investment advisory agreement and other arrangements with the Fund.
In connection with their contract review meetings, the Trustees received and relied upon materials that included, among other items: (i) information provided by Broadridge Financial Solutions, Inc. (“Broadridge”), an independent third party, on the investment performance of the Fund for various time periods ended December 31, 2018 and the investment performance of a group of funds with substantially similar investment classifications/objectives (the “Broadridge performance universe”), (ii) information provided by Broadridge on the Fund’s advisory fees and other expenses and the advisory fees and other expenses of comparable funds identified by Broadridge as well as all other funds in the same investment classification/category (the “Broadridge expense group and universe”), (iii) information provided by MFS on the advisory fees of portfolios of other clients of MFS, including institutional separate accounts and other clients, (iv) information as to whether and to what extent applicable expense waivers, reimbursements or fee “breakpoints” are observed for the Fund, (v) information regarding MFS’ financial results and financial condition, including MFS’ and certain of its affiliates’ estimated profitability from services performed for the Fund and the MFS Funds as a whole, and compared to MFS’ institutional business, (vi) MFS’ views regarding the outlook for the mutual fund industry and the strategic business plans of MFS, (vii) descriptions of various functions performed by MFS for the Funds, such as compliance monitoring and portfolio trading practices, and (viii) information regarding the overall organization of MFS, including information about MFS’ senior management
49
Board Review of Investment Advisory Agreement – continued
and other personnel providing investment advisory, administrative and other services to the Fund and the other MFS Funds. The comparative performance, fee and expense information prepared and provided by Broadridge was not independently verified and the independent Trustees did not independently verify any information provided to them by MFS.
The Trustees’ conclusion as to the continuation of the investment advisory agreement was based on a comprehensive consideration of all information provided to the Trustees and not the result of any single factor. Some of the factors that figured particularly in the Trustees’ deliberations are described below, although individual Trustees may have evaluated the information presented differently from one another, giving different weights to various factors. It is also important to recognize that the fee arrangements for the Fund and other MFS Funds are the result of years of review and discussion between the independent Trustees and MFS, that certain aspects of such arrangements may receive greater scrutiny in some years than in others, and that the Trustees’ conclusions may be based, in part, on their consideration of these same arrangements during the course of the year and in prior years.
Based on information provided by Broadridge and MFS, the Trustees reviewed the Fund’s total return investment performance as well as the Broadridge performance universe over various time periods. The Trustees placed particular emphasis on the total return performance of the Fund’s Class A shares in comparison to the performance of funds in its Broadridge performance universe over the five-year period ended December 31, 2018, which the Trustees believed was a long enough period to reflect differing market conditions. The total return performance of the Fund’s Class A shares was in the 3rd quintile relative to the other funds in the universe for this five-year period (the 1st quintile being the best performers and the 5th quintile being the worst performers). The total return performance of the Fund’s Class A shares was in the 2nd quintile for each of theone- and three-year periods ended December 31, 2018 relative to the Broadridge performance universe. Because of the passage of time, these performance results may differ from the performance results for more recent periods, including those shown elsewhere in this report.
In the course of their deliberations, the Trustees took into account information provided by MFS in connection with the contract review meetings, as well as during investment review meetings conducted with portfolio management personnel during the course of the year regarding the Fund’s performance. After reviewing these and related factors, the Trustees concluded, within the context of their overall conclusions regarding the investment advisory agreement, that they were satisfied with MFS’ responses and efforts relating to investment performance.
In assessing the reasonableness of the Fund’s advisory fee, the Trustees considered, among other information, the Fund’s advisory fee and the total expense ratio of the Fund’s Class A shares as a percentage of average daily net assets and the advisory fee and total expense ratios of the Broadridge expense group based on information provided by Broadridge. The Trustees considered that, according to the data provided by Broadridge (which takes into account any fee reductions or expense limitations that were in effect during the Fund’s last fiscal year), the Fund’s effective advisory fee rate and total expense ratio were each lower than the Broadridge expense group median.
50
Board Review of Investment Advisory Agreement – continued
The Trustees also considered the advisory fees charged by MFS to any institutional separate accounts advised by MFS (“separate accounts”) and unaffiliated investment companies for which MFS serves as subadviser (“subadvised funds”) that have comparable investment strategies to the Fund, if any. In comparing these fees, the Trustees considered information provided by MFS as to the generally broader scope of services provided by MFS to the Fund, as well as the more extensive regulatory burdens imposed on MFS in managing the Fund, in comparison to separate accounts and subadvised funds. The Trustees also considered the higher demands placed on MFS’ investment personnel and trading infrastructure as a result of the daily cashin-flows andout-flows of the Fund in comparison to separate accounts.
The Trustees also considered whether the Fund may benefit from any economies of scale in the management of the Fund in the event of growth in assets of the Fund. They noted that the Fund’s advisory fee rate schedule is subject to contractual breakpoints that reduce the Fund’s advisory fee rate on average daily net assets over $5 billion and $10 billion. The Trustees concluded that the breakpoints were sufficient to allow the Fund to benefit from economies of scale as its assets grow.
The Trustees also considered information prepared by MFS relating to MFS’ costs and profits with respect to the Fund, the MFS Funds considered as a group, and other investment companies and accounts advised by MFS, as well as MFS’ methodologies used to determine and allocate its costs to the MFS Funds, the Fund and other accounts and products for purposes of estimating profitability.
After reviewing these and other factors described herein, the Trustees concluded, within the context of their overall conclusions regarding the investment advisory agreement, that the advisory fees charged to the Fund represent reasonable compensation in light of the services being provided by MFS to the Fund.
In addition, the Trustees considered MFS’ resources and related efforts to continue to retain, attract and motivate capable personnel to serve the Fund. The Trustees also considered current and developing conditions in the financial services industry, including the presence of large and well-capitalized companies which are spending, and appear to be prepared to continue to spend, substantial sums to engage personnel and to provide services to competing investment companies. In this regard, the Trustees also considered the financial resources of MFS and its ultimate parent, Sun Life Financial Inc. The Trustees also considered the advantages and possible disadvantages to the Fund of having an adviser that also serves other investment companies as well as other accounts.
The Trustees also considered the nature, quality, cost, and extent of administrative, transfer agency, and distribution services provided to the Fund by MFS and its affiliates under agreements and plans other than the investment advisory agreement, including any12b-1 fees the Fund pays to MFS Fund Distributors, Inc., an affiliate of MFS. The Trustees also considered the nature, extent and quality of certain other services MFS performs or arranges for on the Fund’s behalf, which may include securities lending programs, directed expense payment programs, class action recovery programs, and MFS’ interaction with third-party service providers, principally custodians andsub-custodians. The Trustees concluded that the variousnon-advisory services provided by MFS and its affiliates on behalf of the Fund were satisfactory.
51
Board Review of Investment Advisory Agreement – continued
The Trustees consideredso-called“fall-out benefits” to MFS such as reputational value derived from serving as investment manager to the MFS Funds. The Trustees also considered that, effective January 3, 2018, MFS had discontinued its historic practice of obtaining investment research from portfolio brokerage commissions paid by certain MFS Funds and would thereafter directly pay for or voluntarily reimburse a Fund, if applicable, for the costs of external research acquired through the use of the Fund’s portfolio brokerage commissions.
Based on their evaluation of factors that they deemed to be material, including those factors described above, the Board of Trustees, including the independent Trustees, concluded that the Fund’s investment advisory agreement with MFS should be continued for an additionalone-year period, commencing August 1, 2019.
52
PROXY VOTING POLICIES AND INFORMATION
MFS votes proxies on behalf of the fund pursuant to proxy voting policies and procedures that are available without charge, upon request, by calling1-800-225-2606, by visitingmfs.com/proxyvoting,or by visiting the SEC’s Web site athttp://www.sec.gov.
Information regarding how the fund voted proxies relating to portfolio securities during the most recent twelve-month period ended June 30 is available by August 31 of each year without charge by visitingmfs.com/proxyvoting,or by visiting the SEC’s Web site athttp://www.sec.gov.
QUARTERLY PORTFOLIO DISCLOSURE
The fund files a complete schedule of portfolio holdings with the SEC for the first and third quarters of each fiscal year on Form N-Q or as an exhibit to its reports onForm N-PORT (for first and third fiscal quarters ending March 31, 2019 or after). The fund’s Form N-Q or Form N-PORT reports are available on the SEC’s website athttp://www.sec.gov.A shareholder can obtain the portfolio holdings report for the first and third quarters of the fund’s fiscal year atmfs.com/openendfunds by choosing the fund’s name and then selecting the “Resources” tab and clicking on “Prospectus and Reports”.
FURTHER INFORMATION
From time to time, MFS may post important information about the fund or the MFS funds on the MFS web site (mfs.com). This information is available athttps://www.mfs.com/en-us/what-we-do/announcements.htmlor atmfs.com/openendfundsby choosing the fund’s name.
INFORMATION ABOUT FUND CONTRACTS AND LEGAL CLAIMS
The fund has entered into contractual arrangements with an investment adviser, administrator, distributor, shareholder servicing agent, 529 program manager (if applicable), and custodian who each provide services to the fund. Unless expressly stated otherwise, shareholders are not parties to, or intended beneficiaries of these contractual arrangements, and these contractual arrangements are not intended to create any shareholder right to enforce them against the service providers or to seek any remedy under them against the service providers, either directly or on behalf of the fund.
Under the Trust’s By-Laws and Declaration of Trust, any claims asserted against or on behalf of the MFS Funds, including claims against Trustees and Officers, must be brought in state and federal courts located within the Commonwealth of Massachusetts.
FEDERAL TAX INFORMATION (unaudited)
The fund will notify shareholders of amounts for use in preparing 2019 income tax forms in January 2020. The following information is provided pursuant to provisions of the Internal Revenue Code.
The fund designates the maximum amount allowable as qualified dividend income eligible to be taxed at the same rate as long-term capital gain.
The fund designates $555,796,000 as capital gain dividends paid during the fiscal year.
For corporate shareholders, 82.23% of the ordinary income dividends paid during the fiscal year qualify for the corporate dividends received deduction.
The fund designates the maximum amount allowable as Section 199A dividends as defined in Proposed Treasury Regulation §1.199A-3(d).
53
rev. 3/16
| | | | |
| | | |
FACTS | | WHAT DOES MFS DO WITH YOUR PERSONAL INFORMATION? | |  |
| | |
| Why? | | Financial companies choose how they share your personal information. Federal law gives consumers the right to limit some but not all sharing. Federal law also requires us to tell you how we collect, share, and protect your personal information. Please read this notice carefully to understand what we do. |
| | |
| What? | | The types of personal information we collect and share depend on the product or service you have with us. This information can include: • Social Security number and account balances • Account transactions and transaction history • Checking account information and wire transfer instructions When you areno longer our customer, we continue to share your information as described in this notice. |
| | |
| How? | | All financial companies need to share customers’ personal information to run their everyday business. In the section below, we list the reasons financial companies can share their customers’ personal information; the reasons MFS chooses to share; and whether you can limit this sharing. |
| | | | |
Reasons we can share your
personal information | | Does MFS
share? | | Can you limit
this sharing? |
For our everyday business purposes – such as to process your transactions, maintain your account(s), respond to court orders and legal investigations, or report to credit bureaus | | Yes | | No |
For our marketing purposes – to offer our products and services to you | | No | | We don’t share |
For joint marketing with other financial companies | | No | | We don’t share |
For our affiliates’ everyday business purposes – information about your transactions and experiences | | No | | We don’t share |
For our affiliates’ everyday business purposes – information about your creditworthiness | | No | | We don’t share |
| For nonaffiliates to market to you | | No | | We don’t share |
| | |
| | |
| Questions? | | Call800-225-2606 or go tomfs.com. |
54
| | |
| Who we are |
| Who is providing this notice? | | MFS Funds, MFS Investment Management, MFS Institutional Advisors, Inc., and MFS Heritage Trust Company. |
| | |
| What we do |
| How does MFS protect my personal information? | | To protect your personal information from unauthorized access and use, we use security measures that comply with federal law. These measures include procedural, electronic, and physical safeguards for the protection of the personal information we collect about you. |
| How does MFS collect my personal information? | | We collect your personal information, for example, when you • open an account or provide account information • direct us to buy securities or direct us to sell your securities • make a wire transfer We also collect your personal information from others, such as credit bureaus, affiliates, or other companies. |
| Why can’t I limit all sharing? | | Federal law gives you the right to limit only • sharing for affiliates’ everyday business purposes – information about your creditworthiness • affiliates from using your information to market to you • sharing for nonaffiliates to market to you State laws and individual companies may give you additional rights to limit sharing. |
| | |
| Definitions |
| Affiliates | | Companies related by common ownership or control. They can be financial and nonfinancial companies. • MFS does not share personal information with affiliates, except for everyday business purposes as described on page one of this notice. |
| Nonaffiliates | | Companies not related by common ownership or control. They can be financial and nonfinancial companies. • MFS does not share with nonaffiliates so they can market to you. |
| Joint marketing | | A formal agreement between nonaffiliated financial companies that together market financial products or services to you. • MFS doesn’t jointly market. |
| | |
| Other important information |
| If you own an MFS product or receive an MFS service in the name of a third party such as a bank or broker-dealer, their privacy policy may apply to you instead of ours. |
55
Save paper with eDelivery.

| MFS® will send you prospectuses, |
reports, and proxies directly viae-mail so you will get information faster with less mailbox clutter.
To sign up:
1. Go to mfs.com.
2. Log in via MFS® Access.
3. Select eDelivery.
If you own your MFS fund shares through a financial institution or a retirement plan, MFS® TALK, MFS® Access, or eDelivery may not be available to you.
CONTACT
WEB SITE
mfs.com
MFS TALK
1-800-637-8255
24 hours a day
ACCOUNT SERVICE AND LITERATURE
Shareholders
1-800-225-2606
Financial advisors
1-800-343-2829
Retirement plan services
1-800-637-1255
MAILING ADDRESS
MFS Service Center, Inc.
P.O. Box 219341
Kansas City, MO 64121-9341
OVERNIGHT MAIL
MFS Service Center, Inc.
Suite 219341
430 W 7th Street
Kansas City, MO 64105-1407
Annual Report
September 30, 2019

MFS® Total Return Fund

Beginning on January 1, 2021, as permitted by regulations adopted by the U.S. Securities and Exchange Commission, paper copies of the fund’s annual and semiannual shareholder reports will no longer be sent by mail, unless you specifically request paper copies of the reports. Instead, the complete reports will be made available on the fund’s Web site (funds.mfs.com), and you will be notified by mail each time a report is posted and provided with a Web site link to access the report.
If you are already signed up to receive shareholder reports by email, you will not be affected by this change and you need not take any action. You may sign up to receive shareholder reports and other communications from the fund by email by contacting your financial intermediary (such as a broker-dealer or bank) or, if you hold your shares directly with the fund, by calling 1-800-225-2606 or by logging on to MFS Access at mfs.com.
Beginning on January 1, 2019, you may elect to receive all future reports in paper free of charge. Contact your financial intermediary to request that you continue to receive paper copies of your shareholder reports. If you invest directly with the fund, you can call 1-800-225-2606 or send an email request to orderliterature@mfs.com to let the fund know that you wish to continue receiving paper copies of your shareholder reports. Your election to receive reports in paper will apply to all funds held in your account if you invest through your financial intermediary or all funds held with the MFS fund complex if you invest directly.
MTR-ANN
MFS® Total Return Fund
CONTENTS
The report is prepared for the general information of shareholders.
It is authorized for distribution to prospective investors only when preceded or accompanied by a current prospectus.
NOT FDIC INSURED• MAY LOSE VALUE• NO BANK GUARANTEE

LETTER FROM THE EXECUTIVE CHAIR
Dear Shareholders:
Slowing global growth, low inflation, and increasing trade friction between the United States and China have been hallmarks of the past 12 months. After experiencing an
uptick in market volatility in late 2018, markets steadied during the first half of 2019, thanks in large measure to the adoption of a dovish policy stance on the part of global central banks, focused on supporting economic growth. The U.S. and China have raised tariffs on each other, heightening tensions and uncertainty. While British Prime Minister Boris Johnson has negotiated a reworked withdrawal agreement with the European Union, Parliament has not yet approved the deal, leading the EU to grant the United Kingdom a Brexit delay until no later than January 31, 2020. The combination of Brexit uncertainty and the deteriorating outlook for global trade has hampered business confidence and investment in the U.K. and Europe.
Markets expect that the longest economic expansion in U.S. history will continue for the time being, albeit at a slower pace. In an effort to prolong the expansion, the U.S. Federal Reserve lowered interest rates for the first time in more than a decade in July and again in September and October. Similarly, the European Central Bank loosened policy in September. While markets have grown more risk averse, the accommodative monetary environment has helped push global interest rates towardrecord-low levels and has been somewhat supportive of risk assets despite the unsettled economic and geopolitical backdrop.
Since launching the first U.S.open-end mutual fund in 1924, MFS® has been committed to a single purpose: to create value by allocating capital responsibly for clients. Through our powerful global investment platform, we combine collective expertise, thoughtful risk management, and long-term discipline to uncover what we believe are the best investment opportunities in the market.
Respectfully,

Robert J. Manning
Executive Chair
MFS Investment Management
November 15, 2019
The opinions expressed in this letter are subject to change and may not be relied upon for investment advice. No forecasts can be guaranteed.
1
PORTFOLIO COMPOSITION
Portfolio structure (i)
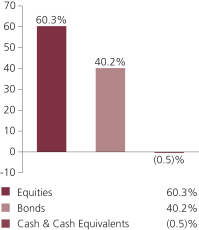
| | | | |
| Top ten holdings (i) | |
| U.S. Treasury Notes, 1.75%, 11/30/2021 | | | 2.6% | |
| U.S. Treasury Notes, 1.75%, 9/30/2022 | | | 2.1% | |
| U.S. Treasury Bonds, 2.875%, 5/15/2043 | | | 2.0% | |
| JPMorgan Chase & Co. | | | 1.9% | |
| Comcast Corp., “A” | | | 1.7% | |
| U.S. Treasury Notes, 1.625%, 5/31/2023 | | | 1.3% | |
| Fannie Mae, 3.5%, 30 Years | | | 1.3% | |
| Microsoft Corp. | | | 1.2% | |
| Ginnie Mae, 3%, 30 Years | | | 1.2% | |
| Citigroup, Inc. | | | 1.2% | |
| | | | |
| Composition including fixed income credit quality (a)(i) | |
| AAA | | | 3.9% | |
| AA | | | 0.6% | |
| A | | | 3.2% | |
| BBB | | | 7.3% | |
| BB | | | 0.1% | |
| B (o) | | | 0.0% | |
| CCC (o) | | | 0.0% | |
| U.S. Government | | | 12.0% | |
| Federal Agencies | | | 12.6% | |
| Not Rated | | | 0.5% | |
| Non-Fixed Income | | | 60.3% | |
| Cash & Cash Equivalents | | | (0.5)% | |
|
| GICS equity sectors (g) | |
| Financials | | | 14.1% | |
| Health Care | | | 9.4% | |
| Industrials | | | 8.6% | |
| Information Technology | | | 7.7% | |
| Consumer Staples | | | 4.9% | |
| Consumer Discretionary | | | 3.5% | |
| Energy | | | 3.3% | |
| Utilities | | | 2.9% | |
| Communication Services | | | 2.6% | |
| Materials | | | 2.0% | |
| Real Estate | | | 1.3% | |
2
Portfolio Composition – continued
| | | | |
| Fixed income sectors (i) | |
| Mortgage-Backed Securities | | | 12.6% | |
| U.S. Treasury Securities | | | 12.0% | |
| Investment Grade Corporates | | | 10.7% | |
| Commercial Mortgage-Backed Securities | | | 2.7% | |
| Collateralized Debt Obligations | | | 1.2% | |
| Asset-Backed Securities | | | 0.4% | |
| Municipal Bonds | | | 0.3% | |
| Emerging Markets Bonds | | | 0.2% | |
| Non-U.S. Government Bonds | | | 0.1% | |
| U.S. Government Agencies (o) | | | 0.0% | |
| (a) | For all securities other than those specifically described below, ratings are assigned to underlying securities utilizing ratings from Moody’s, Fitch, and Standard & Poor’s rating agencies and applying the following hierarchy: If all three agencies provide a rating, the middle rating (after dropping the highest and lowest ratings) is assigned; if two of the three agencies rate a security, the lower of the two is assigned. Ratings are shown in the S&P and Fitch scale (e.g., AAA). Securities rated BBB or higher are considered investment grade. All ratings are subject to change. U.S. Government includes securities issued by the U.S. Department of the Treasury. Federal Agencies includes rated and unrated U.S. Agency fixed-income securities, U.S. Agency mortgage-backed securities, and collateralized mortgage obligations of U.S. Agency mortgage-backed securities. Not Rated includes fixed income securities and fixed income derivatives, which have not been rated by any rating agency.Non-Fixed Income includes equity securities (including convertible bonds and equity derivatives) and/or commodity-linked derivatives. The fund may or may not have held all of these instruments on this date. The fund is not rated by these agencies. |
| (g) | The Global Industry Classification Standard (GICS®) was developed by and/or is the exclusive property of MSCI, Inc. and S&P Global Market Intelligence Inc. (“S&P Global Market Intelligence”). GICS is a service mark of MSCI and S&P Global Market Intelligence and has been licensed for use by MFS. |
| (i) | For purposes of this presentation, the components include the value of securities, and reflect the impact of the equivalent exposure of derivative positions, if any. These amounts may be negative from time to time. Equivalent exposure is a calculated amount that translates the derivative position into a reasonable approximation of the amount of the underlying asset that the portfolio would have to hold at a given point in time to have the same price sensitivity that results from the portfolio’s ownership of the derivative contract. When dealing with derivatives, equivalent exposure is a more representative measure of the potential impact of a position on portfolio performance than value. The bond component will include any accrued interest amounts. |
Where the fund holds convertible bonds, they are treated as part of the equity portion of the portfolio.
Cash & Cash Equivalents includes any cash, investments in money market funds, short-term securities, and other assets less liabilities. Please see the Statement of Assets and Liabilities for additional information related to the fund’s cash position and other assets and liabilities.
From time to time Cash & Cash Equivalents may be negative due to timing of cash receipts and disbursements.
Percentages are based on net assets as of September 30, 2019.
The portfolio is actively managed and current holdings may be different.
3
MANAGEMENT REVIEW
Summary of Results
For the twelve months ended September 30, 2019, Class A shares of the MFS Total Return Fund (fund) provided a total return of 6.73%, at net asset value. This compares with a return of 4.25% and 10.30% for the fund’s benchmarks, the Standard & Poor’s 500 Stock Index (S&P 500 Index) and the Bloomberg Barclays U.S. Aggregate Bond Index (Bloomberg Index), respectively. The fund’s other benchmark, the MFS Total Return Blended Index (Blended Index), generated a return of 7.10%. The Blended Index reflects the blended returns of the equity and fixed income market indices, with percentage allocations to each index designed to resemble the equity and fixed income allocations of the fund. The market indices and related percentage allocations used to compile the Blended Index are set forth in the Performance Summary.
Market Environment
Changes in market sentiment, largely driven by uncertainty over the outcome of trade negotiations between the United States and China, contributed to periodic bouts of volatility during the reporting period. The global economy decelerated, led by weakness in China and Europe.
The deteriorating global growth backdrop, along with declining inflationary pressures, prompted the US Federal Reserve to adopt a more dovish posture beginning in early 2019, resulting in the first interest rate cut in over a decade at the end of July, followed by an additional cut in September. The Fed’s actions led to a sharp decline in long-term interest rates during the period’s second half, inverting portions of the US Treasury yield curve. Markets anticipate at least one more rate reduction before the end of 2019.
Globally, central banks have tilted more dovish as well, with the European Central Bank unveiling a package of easing measures including cutting overnight rates deeper into negative territory, restarting its bond-buying program and lengthening the term of cheap loans to banks to three years from two. The central banks of India and Australia are among those that have cut rates several times in recent months, while China has been more circumspect in increasing liquidity as it continues to attempt to deleverage its economy.
Emerging markets experienced considerable volatility through the end of 2018 as tighter global financial conditions exposed structural weakness in some countries. Those conditions improved in 2019 as the Fed became more dovish, but diminished hopes for a trade deal between the US and China weighed on sentiment. Idiosyncratic factors negatively impacted some emerging economies, such as Argentina and Turkey.
From a geopolitical perspective, uncertainty over Brexit remains high. While British Prime Minister Boris Johnson has negotiated a reworked withdrawal agreement with the European Union, Parliament has not yet approved the deal, leading the EU to grant the United Kingdom a Brexit delay until no later than January 31, 2020. The combination of Brexit uncertainty and the deteriorating outlook for global trade has hampered business confidence and investment in the UK and Europe.
4
Management Review – continued
Detractors from Performance
Within the equity portion of the fund, an underweight position and stock selection in theinformation technologysector detracted from performance relative to the S&P 500 Index. Within this sector, an overweight position in information technology company DXC Technology weakened relative results. The share price of DXC Technology fell after the company reported disappointing earnings results and full-year guidance, as clients transitioned to the cloud at a faster rate than anticipated, which put pressure on its legacy IT business. An underweight position in global software giant Microsoft also detracted from relative returns. The stock price of Microsoft advanced as the company reported strong results, with multiple segments doing well, and reiterated its guidance for double-digit revenue growth and flat margins. Not owning shares of debit and credit transaction processing company Mastercard further weighed on relative performance.
Stock selection within theconsumer staplessector also held back relative results. Here, the fund’s underweight position in shares of branded consumer packaged goods provider Procter & Gamble weighed on relative returns. The share price of Procter & Gamble rose as the company reported strong organic sales growth, driven by both volume and price. Organic sales increased in all six regions as the company maintained or expanded market share in a majority of its country and category combinations. An overweight position in drug store operator Walgreens Boots Alliance also hindered relative returns.
Elsewhere, the fund’s overweight holdings of pharmaceutical giant Pfizer, global health services provider Cigna, energy exploration and production company EOG Resources, custody bank State Street and oil field services company Schlumberger negatively impacted relative performance.
Within the fixed income portion of the fund, yield curve (y) positioning detracted from performance relative to the Bloomberg Index.
Contributors to Performance
Within the equity portion of the fund, stock selection within theindustrials, communication services, health careandconsumer discretionarysectors contributed to performance relative to the S&P 500 Index. Within theindustrials sector, an overweight position in global diversified technology manufacturer Johnson Controls International buoyed relative returns. The share price of Johnson Controls International rose on the back of earnings per share results that beat consensus estimates, driven by strong organic revenue growth, especially in the Asia Pacific region. Within thecommunication servicessector, an overweight position in cable services provider Comcast contributed to relative performance. The stock price of Comcast advanced as the company posted revenue results that were ahead of market estimates, helped by strong performance in its cable operations that benefited from an increase inhigh-speed data (HSD) customers. In addition, solid performance in NBC Universal further supported the stock price. Not owning shares of internet TV shows and movie subscription services provider Netflix also benefited relative returns. The stock price of Netflix suffered throughout the period after the company reported new subscription additions and market expectations that were below prior guidance figures, with most of the shortfall in both US and international markets, driven by a lighter slate of Netflix
5
Management Review – continued
releases. Within thehealth caresector, overweighting shares of healthcare equipment manufacturer Danaher and not holding the stock of poor-performing health insurance and Medicare/Medicaid provider UnitedHealth Group aided relative returns. Within theconsumer discretionarysector, an underweight position in internet retailer Amazon.com helped relative returns. The stock price of Amazon.com came under pressure as the company’s continued investments to boostone-day shipping capabilities causedrecord-low gross profit growth and lower-than-expected operating income.
In other sectors, avoiding shares of computer graphics processors maker NVIDIA and the fund’s holdings of global food company Nestle (b) (Switzerland) and real estate investment trust Medical Properties Trust (b) buoyed relative performance. An overweight position in risk management and human capital consulting services provider Aon also aided relative results.
Within the fixed income portion of the fund, security selection within both “BBB” and “AAA” rated (r) credit quality segments contributed to performance relative to the Bloomberg Index. A greater-than-benchmark exposure to bonds in theasset-backed securities sector also aided relative returns.
Respectfully,
Portfolio Manager(s)
Nevin Chitkara, Steven Gorham, Joshua Marston, Robert Persons, Jonathan Sage, and Brooks Taylor
| (b) | Security is not a benchmark constituent. |
| (h) | Security was not held in the portfolio at period end. |
| (r) | Bonds rated “BBB”, “Baa”, or higher are considered investment grade; bonds rated “BB”, “Ba”, or below are considerednon-investment grade. The source for bond quality ratings is Moody’s Investors Service, Standard & Poor’s and Fitch, Inc. and are applied using the following hierarchy: If all three agencies provide a rating, the middle rating (after dropping the highest and lowest ratings) is assigned; if two of the three agencies rate a security, the lower of the two is assigned. Ratings are shown in the S&P and Fitch scale (e.g., AAA). For securities which are not rated by any of the three agencies, the security is considered Not Rated. |
| (y) | A yield curve graphically depicts the yields of different maturity bonds of the same credit quality and type; a normal yield curve is upward sloping, with short-term rates lower than long-term rates. |
Note to Shareholders: Effective December 31, 2019, Johnathan Munko will be added as a Portfolio Manager of the Fund and Nevin Chitkara will no longer be a Portfolio Manager of the Fund. Effective December 31, 2020, Jonathan Sage and Brooks Taylor will no longer be Portfolio Managers of the Fund.
The views expressed in this report are those of the portfolio manager(s) only through the end of the period of the report as stated on the cover and do not necessarily reflect the views of MFS or any other person in the MFS organization. These views are subject to change at any time based on market or other conditions, and MFS disclaims any responsibility to update such views. These views may not be relied upon as investment advice or an indication of trading intent on behalf of any MFS portfolio. References to specific securities are not recommendations of such securities, and may not be representative of any MFS portfolio’s current or future investments.
6
PERFORMANCE SUMMARYTHROUGH 9/30/19
The following chart illustrates a representative class of the fund’s historical performance in comparison to its benchmark(s). Performance results include the deduction of the maximum applicable sales charge and reflect the percentage change in net asset value, including reinvestment of dividends and capital gains distributions. The performance of other share classes will be greater than or less than that of the class depicted below. Benchmarks are unmanaged and may not be invested in directly. Benchmark returns do not reflect sales charges, commissions or expenses. (See Notes to Performance Summary.)
Performance data shown represents past performance and is no guarantee of future results. Investment return and principal value fluctuate so your shares, when sold, may be worth more or less than the original cost; current performance may be lower or higher than quoted. The performance shown does not reflect the deduction of taxes, if any, that a shareholder would pay on fund distributions or the redemption of fund shares.
Growth of a Hypothetical $10,000 Investment
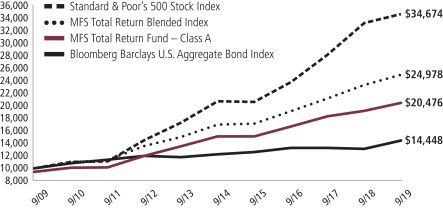
7
Performance Summary – continued
Total Returns through 9/30/19
Average annual without sales charge
| | | | | | | | | | | | | | |
| | | Share Class | | Class Inception Date | | 1-yr | | 5-yr | | 10-yr | | Life (t) | | |
| | | A | | 10/06/70 | | 6.73% | | 6.28% | | 8.07% | | N/A | | |
| | | B | | 8/23/93 | | 5.90% | | 5.47% | | 7.27% | | N/A | | |
| | | C | | 8/01/94 | | 5.87% | | 5.48% | | 7.27% | | N/A | | |
| | | I | | 1/02/97 | | 6.99% | | 6.54% | | 8.34% | | N/A | | |
| | | R1 | | 4/01/05 | | 5.87% | | 5.47% | | 7.27% | | N/A | | |
| | | R2 | | 10/31/03 | | 6.43% | | 6.00% | | 7.80% | | N/A | | |
| | | R3 | | 4/01/05 | | 6.71% | | 6.27% | | 8.07% | | N/A | | |
| | | R4 | | 4/01/05 | | 6.98% | | 6.54% | | 8.35% | | N/A | | |
| | | R6 | | 6/01/12 | | 7.07% | | 6.62% | | N/A | | 8.93% | | |
| | | 529A | | 7/31/02 | | 6.65% | | 6.23% | | 8.01% | | N/A | | |
| | | 529B | | 7/31/02 | | 6.16% | | 5.48% | | 7.23% | | N/A | | |
| | | 529C | | 7/31/02 | | 5.82% | | 5.41% | | 7.20% | | N/A | | |
| | | | | |
| Comparative benchmark(s) | | | | | | | | | | |
| | | Standard & Poor’s 500 Stock Index (f) | | 4.25% | | 10.84% | | 13.24% | | N/A | | |
| | | Bloomberg Barclays U.S. Aggregate Bond Index (f) | | 10.30% | | 3.38% | | 3.75% | | N/A | | |
| | | MFS Total Return Blended Index (f)(w) | | 7.10% | | 8.00% | | 9.59% | | N/A | | |
| | | | | |
| Average annual with sales charge | | | | | | | | | | |
| | | A
With Initial Sales Charge (5.75%) | | 0.59% | | 5.03% | | 7.43% | | N/A | | |
| | | B
With CDSC (Declining over six years from 4% to 0%) (v) | | 1.90% | | 5.14% | | 7.27% | | N/A | | |
| | | C
With CDSC (1% for 12 months) (v) | | 4.87% | | 5.48% | | 7.27% | | N/A | | |
| | | 529A
With Initial Sales Charge (5.75%) | | 0.52% | | 4.98% | | 7.37% | | N/A | | |
| | | 529B
With CDSC (Declining over six years from 4% to 0%) (v) | | 2.16% | | 5.16% | | 7.23% | | N/A | | |
| | | 529C
With CDSC (1% for 12 months) (v) | | 4.82% | | 5.41% | | 7.20% | | N/A | | |
CDSC – Contingent Deferred Sales Charge.
Class I, R1, R2, R3, R4, and R6 shares do not have a sales charge.
| (f) | Source: FactSet Research Systems Inc. |
| (t) | For the period from the class inception date through the stated period end (for those share classes with less than 10 years of performance history). No comparative benchmark performance information is provided for “life” periods. (See Notes to Performance Summary.) |
| (v) | Assuming redemption at the end of the applicable period. |
8
Performance Summary – continued
| (w) | As of September 30, 2019, the MFS Total Return Blended Index (a custom index) was comprised of 60% Standard & Poor’s 500 Stock Index and 40% Bloomberg Barclays U.S. Aggregate Bond Index. |
Benchmark Definition(s)
Bloomberg Barclays U.S. Aggregate Bond Index – a market capitalization-weighted index that measures the performance of the U.S. investment-grade, fixed rate bond market, with index components for government and corporate securities, mortgage pass-through securities, and asset-backed securities with at least one year to final maturity.
Standard & Poor’s 500 Stock Index – a market capitalization-weighted index of 500 widely held equity securities, designed to measure broad U.S. equity performance.
It is not possible to invest directly in an index.
Notes to Performance Summary
Class 529 shares are only available in conjunction with qualified tuition programs, such as the MFS 529 Savings Plan. There also is an additional fee, which is detailed in the program description, on qualified tuition programs. If this fee was reflected, the performance for Class 529 shares would have been lower. This annual fee is waived for Oregon residents and for those accounts with assets of $25,000 or more.
Average annual total return represents the average annual change in value for each share class for the periods presented. Life returns are presented where the share class has less than 10 years of performance history and represent the average annual total return from the class inception date to the stated period end date. As the fund’s share classes may have different inception dates, the life returns may represent different time periods and may not be comparable. As a result, no comparative benchmark performance information is provided for life periods.
Performance results reflect any applicable expense subsidies and waivers in effect during the periods shown. Without such subsidies and waivers the fund’s performance results would be less favorable. Please see the prospectus and financial statements for complete details.
Performance results do not include adjustments made for financial reporting purposes in accordance with U.S. generally accepted accounting principles and may differ from amounts reported in the financial highlights.
From time to time the fund may receive proceeds from litigation settlements, without which performance would be lower.
9
EXPENSE TABLE
Fund expenses borne by the shareholders during the period, April 1, 2019 through September 30, 2019
As a shareholder of the fund, you incur two types of costs: (1) transaction costs, including sales charges (loads) on certain purchase or redemption payments, and (2) ongoing costs, including management fees; distribution and service(12b-1) fees; and other fund expenses. This example is intended to help you understand your ongoing costs (in dollars) of investing in the fund and to compare these costs with the ongoing costs of investing in other mutual funds.
The example is based on an investment of $1,000 invested at the beginning of the period and held for the entire period April 1, 2019 through September 30, 2019.
Actual Expenses
The first line for each share class in the following table provides information about actual account values and actual expenses. You may use the information in this line, together with the amount you invested, to estimate the expenses that you paid over the period. Simply divide your account value by $1,000 (for example, an $8,600 account value divided by $1,000 = 8.6), then multiply the result by the number in the first line under the heading entitled “Expenses Paid During Period” to estimate the expenses you paid on your account during this period.
Hypothetical Example for Comparison Purposes
The second line for each share class in the following table provides information about hypothetical account values and hypothetical expenses based on the fund’s actual expense ratio and an assumed rate of return of 5% per year before expenses, which is not the fund’s actual return. The hypothetical account values and expenses may not be used to estimate the actual ending account balance or expenses you paid for the period. You may use this information to compare the ongoing costs of investing in the fund and other funds. To do so, compare this 5% hypothetical example with the 5% hypothetical examples that appear in the shareholder reports of the other funds.
Please note that the expenses shown in the table are meant to highlight your ongoing costs only and do not reflect any transactional costs, such as sales charges (loads). Therefore, the second line for each share class in the table is useful in comparing ongoing costs only, and will not help you determine the relative total costs of owning different funds. In addition, if these transactional costs were included, your costs would have been higher.
10
Expense Table – continued
| | | | | | | | | | | | | | | | | | |
Share
Class | | | | Annualized
Expense
Ratio | | | Beginning
Account Value
4/01/19 | | | Ending
Account Value
9/30/19 | | | Expenses
Paid During
Period (p)
4/01/19-9/30/19 | |
| A | | Actual | | | 0.71% | | | | $1,000.00 | | | | $1,054.98 | | | | $3.66 | |
| | Hypothetical (h) | | | 0.71% | | | | $1,000.00 | | | | $1,021.51 | | | | $3.60 | |
| B | | Actual | | | 1.46% | | | | $1,000.00 | | | | $1,050.83 | | | | $7.51 | |
| | Hypothetical (h) | | | 1.46% | | | | $1,000.00 | | | | $1,017.75 | | | | $7.38 | |
| C | | Actual | | | 1.47% | | | | $1,000.00 | | | | $1,050.56 | | | | $7.56 | |
| | Hypothetical (h) | | | 1.47% | | | | $1,000.00 | | | | $1,017.70 | | | | $7.44 | |
| I | | Actual | | | 0.47% | | | | $1,000.00 | | | | $1,056.29 | | | | $2.42 | |
| | Hypothetical (h) | | | 0.47% | | | | $1,000.00 | | | | $1,022.71 | | | | $2.38 | |
| R1 | | Actual | | | 1.47% | | | | $1,000.00 | | | | $1,051.07 | | | | $7.56 | |
| | Hypothetical (h) | | | 1.47% | | | | $1,000.00 | | | | $1,017.70 | | | | $7.44 | |
| R2 | | Actual | | | 0.97% | | | | $1,000.00 | | | | $1,053.42 | | | | $4.99 | |
| | Hypothetical (h) | | | 0.97% | | | | $1,000.00 | | | | $1,020.21 | | | | $4.91 | |
| R3 | | Actual | | | 0.72% | | | | $1,000.00 | | | | $1,054.91 | | | | $3.71 | |
| | Hypothetical (h) | | | 0.72% | | | | $1,000.00 | | | | $1,021.46 | | | | $3.65 | |
| R4 | | Actual | | | 0.47% | | | | $1,000.00 | | | | $1,056.20 | | | | $2.42 | |
| | Hypothetical (h) | | | 0.47% | | | | $1,000.00 | | | | $1,022.71 | | | | $2.38 | |
| R6 | | Actual | | | 0.40% | | | | $1,000.00 | | | | $1,056.65 | | | | $2.06 | |
| | Hypothetical (h) | | | 0.40% | | | | $1,000.00 | | | | $1,023.06 | | | | $2.03 | |
| 529A | | Actual | | | 0.75% | | | | $1,000.00 | | | | $1,054.94 | | | | $3.86 | |
| | Hypothetical (h) | | | 0.75% | | | | $1,000.00 | | | | $1,021.31 | | | | $3.80 | |
| 529B | | Actual | | | 1.03% | | | | $1,000.00 | | | | $1,053.69 | | | | $5.30 | |
| | Hypothetical (h) | | | 1.03% | | | | $1,000.00 | | | | $1,019.90 | | | | $5.22 | |
| 529C | | Actual | | | 1.52% | | | | $1,000.00 | | | | $1,050.37 | | | | $7.81 | |
| | Hypothetical (h) | | | 1.52% | | | | $1,000.00 | | | | $1,017.45 | | | | $7.69 | |
| (h) | 5% class return per year before expenses. |
| (p) | “Expenses Paid During Period” are equal to each class’s annualized expense ratio, as shown above, multiplied by the average account value over the period, multiplied by 183/365 (to reflect theone-half year period). Expenses paid do not include any applicable sales charges (loads). If these transaction costs had been included, your costs would have been higher. |
Notes to Expense Table
For the period from June 1, 2019 through September 30, 2019, the distribution fee for Class 529B was not imposed. Had the distribution fee been imposed throughout the entire six month period, the annualized expense ratio, the actual expenses paid during the period,
11
Expense Table – continued
and the hypothetical expenses paid during the period would have been approximately 1.52%, $7.83, and $7.69 for Class 529B. See Note 3 in the Notes to Financial Statements for additional information.
Each class with a Rule12b-1 service fee is subject to a rebate of a portion of such fee. Such rebates are included in the expense ratios above. For Class A and Class 529A shares, this rebate reduced the expense ratios above by 0.01% and 0.02%, respectively. See Note 3 in the Notes to Financial Statements for additional information.
12
PORTFOLIO OF INVESTMENTS
9/30/19
The Portfolio of Investments is a complete list of all securities owned by your fund. It is categorized by broad-based asset classes.
| | | | | | | | |
| Common Stocks - 59.8% | | | | | | | | |
| | |
| Issuer | | Shares/Par | | | Value ($) | |
| Aerospace - 2.6% | | | | | | | | |
| Honeywell International, Inc. | | | 410,178 | | | $ | 69,402,118 | |
| L3Harris Technologies, Inc. | | | 58,876 | | | | 12,283,889 | |
| Lockheed Martin Corp. | | | 83,325 | | | | 32,501,749 | |
| Northrop Grumman Corp. | | | 95,225 | | | | 35,689,378 | |
| United Technologies Corp. | | | 343,123 | | | | 46,843,152 | |
| | | | | | | | |
| | | �� | | | | $ | 196,720,286 | |
| Airlines - 0.2% | | | | | | | | |
| Delta Air Lines, Inc. | | | 202,646 | | | $ | 11,672,410 | |
| | |
| Alcoholic Beverages - 0.7% | | | | | | | | |
| Diageo PLC | | | 780,660 | | | $ | 31,992,149 | |
| Molson Coors Brewing Co. | | | 331,084 | | | | 19,037,330 | |
| | | | | | | | |
| | | | | | | $ | 51,029,479 | |
| Apparel Manufacturers - 0.4% | | | | | | | | |
| Hanesbrands, Inc. | | | 165,098 | | | $ | 2,529,301 | |
| LVMH Moet Hennessy Louis Vuitton SE | | | 30,406 | | | | 12,084,873 | |
| NIKE, Inc., “B” | | | 159,557 | | | | 14,985,594 | |
| | | | | | | | |
| | | | | | | $ | 29,599,768 | |
| Automotive - 0.9% | | | | | | | | |
| Aptiv PLC | | | 155,640 | | | $ | 13,606,049 | |
| Harley-Davidson, Inc. | | | 46,717 | | | | 1,680,410 | |
| Lear Corp. | | | 360,011 | | | | 42,445,297 | |
| Magna International, Inc. | | | 154,951 | | | | 8,259,531 | |
| | | | | | | | |
| | | | | | | $ | 65,991,287 | |
| Broadcasting - 0.2% | | | | | | | | |
| Omnicom Group, Inc. | | | 151,723 | | | $ | 11,879,911 | |
| | |
| Brokerage & Asset Managers - 1.5% | | | | | | | | |
| BlackRock, Inc. | | | 59,174 | | | $ | 26,370,301 | |
| Blackstone Group, Inc. | | | 385,365 | | | | 18,821,227 | |
| Charles Schwab Corp. | | | 254,525 | | | | 10,646,781 | |
| Invesco Ltd. | | | 1,105,987 | | | | 18,735,420 | |
| NASDAQ, Inc. | | | 183,414 | | | | 18,222,181 | |
| T. Rowe Price Group, Inc. | | | 166,078 | | | | 18,974,411 | |
| | | | | | | | |
| | | | | | | $ | 111,770,321 | |
13
Portfolio of Investments – continued
| | | | | | | | |
| | |
| Issuer | | Shares/Par | | | Value ($) | |
| Common Stocks - continued | | | | | | | | |
| Business Services - 2.4% | | | | | | | | |
| Accenture PLC, “A” | | | 352,268 | | | $ | 67,758,750 | |
| Amdocs Ltd. | | | 229,798 | | | | 15,191,946 | |
| Cognizant Technology Solutions Corp., “A” | | | 103,648 | | | | 6,246,347 | |
| DXC Technology Co. | | | 341,308 | | | | 10,068,586 | |
| Equifax, Inc. | | | 159,009 | | | | 22,367,796 | |
| Fidelity National Information Services, Inc. | | | 258,565 | | | | 34,327,089 | |
| Fiserv, Inc. (a) | | | 218,492 | | | | 22,633,586 | |
| | | | | | | | |
| | | | | | | $ | 178,594,100 | |
| Cable TV - 1.7% | | | | | | | | |
| Comcast Corp., “A” | | | 2,784,756 | | | $ | 125,536,801 | |
| | |
| Chemicals - 1.3% | | | | | | | | |
| 3M Co. | | | 148,692 | | | $ | 24,444,965 | |
| Celanese Corp. | | | 121,668 | | | | 14,878,780 | |
| PPG Industries, Inc. | | | 484,226 | | | | 57,385,623 | |
| | | | | | | | |
| | | | | | | $ | 96,709,368 | |
| Computer Software - 2.0% | | | | | | | | |
| Adobe Systems, Inc. (a) | | | 157,421 | | | $ | 43,487,551 | |
| Microsoft Corp. | | | 661,643 | | | | 91,988,226 | |
| Oracle Corp. | | | 269,827 | | | | 14,848,580 | |
| | | | | | | | |
| | | | | | | $ | 150,324,357 | |
| Computer Software - Systems - 0.7% | | | | | | | | |
| Apple, Inc. | | | 129,632 | | | $ | 29,033,679 | |
| Hitachi Ltd. | | | 549,800 | | | | 20,589,565 | |
| | | | | | | | |
| | | | | | | $ | 49,623,244 | |
| Construction - 0.9% | | | | | | | | |
| Masco Corp. | | | 384,563 | | | $ | 16,028,586 | |
| Sherwin-Williams Co. | | | 31,665 | | | | 17,411,634 | |
| Stanley Black & Decker, Inc. | | | 214,037 | | | | 30,909,083 | |
| | | | | | | | |
| | | | | | | $ | 64,349,303 | |
| Consumer Products - 0.7% | | | | | | | | |
| Colgate-Palmolive Co. | | | 44,959 | | | $ | 3,304,936 | |
| Kimberly-Clark Corp. | | | 241,349 | | | | 34,283,626 | |
| Procter & Gamble Co. | | | 29,407 | | | | 3,657,643 | |
| Reckitt Benckiser Group PLC | | | 165,048 | | | | 12,874,181 | |
| | | | | | | | |
| | | | | | | $ | 54,120,386 | |
| Containers - 0.1% | | | | | | | | |
| Crown Holdings, Inc. (a) | | | 137,363 | | | $ | 9,074,200 | |
14
Portfolio of Investments – continued
| | | | | | | | |
| | |
| Issuer | | Shares/Par | | | Value ($) | |
| Common Stocks - continued | | | | | | | | |
| Electrical Equipment - 0.9% | | | | | | | | |
| Johnson Controls International PLC | | | 1,455,590 | | | $ | 63,885,845 | |
| Schneider Electric SE | | | 48,226 | | | | 4,231,396 | |
| | | | | | | | |
| | | | | | | $ | 68,117,241 | |
| Electronics - 2.1% | | | | | | | | |
| Analog Devices, Inc. | | | 107,327 | | | $ | 11,991,646 | |
| Applied Materials, Inc. | | | 281,023 | | | | 14,023,048 | |
| Intel Corp. | | | 278,410 | | | | 14,346,467 | |
| Marvell Technology Group Ltd. | | | 406,095 | | | | 10,140,192 | |
| Maxim Integrated Products, Inc. | | | 207,919 | | | | 12,040,589 | |
| NXP Semiconductors N.V. | | | 59,681 | | | | 6,512,391 | |
| Taiwan Semiconductor Manufacturing Co. Ltd., ADR | | | 660,978 | | | | 30,722,258 | |
| Texas Instruments, Inc. | | | 430,572 | | | | 55,647,125 | |
| | | | | | | | |
| | | | | | | $ | 155,423,716 | |
| Energy - Independent - 0.7% | | | | | | | | |
| EOG Resources, Inc. | | | 234,354 | | | $ | 17,393,754 | |
| Noble Energy, Inc. | | | 340,216 | | | | 7,641,251 | |
| Phillips 66 | | | 104,418 | | | | 10,692,403 | |
| Pioneer Natural Resources Co. | | | 78,245 | | | | 9,840,874 | |
| Valero Energy Corp. | | | 120,134 | | | | 10,240,222 | |
| | | | | | | | |
| | | | | | | $ | 55,808,504 | |
| Energy - Integrated - 1.4% | | | | | | | | |
| BP PLC | | | 3,143,151 | | | $ | 19,933,922 | |
| Chevron Corp. | | | 232,995 | | | | 27,633,207 | |
| Eni S.p.A. | | | 1,139,949 | | | | 17,437,068 | |
| Exxon Mobil Corp. | | | 376,245 | | | | 26,566,660 | |
| Hess Corp. | | | 170,356 | | | | 10,303,131 | |
| Suncor Energy, Inc. | | | 223,131 | | | | 7,038,264 | |
| | | | | | | | |
| | | | | | | $ | 108,912,252 | |
| Food & Beverages - 2.1% | | | | | | | | |
| Archer Daniels Midland Co. | | | 436,862 | | | $ | 17,941,922 | |
| Coca-Cola European Partners PLC | | | 175,798 | | | | 9,747,999 | |
| Danone S.A. | | | 188,430 | | | | 16,598,753 | |
| General Mills, Inc. | | | 350,263 | | | | 19,306,497 | |
| Ingredion, Inc. | | | 135,906 | | | | 11,108,956 | |
| J.M. Smucker Co. | | | 166,896 | | | | 18,361,898 | |
| Mondelez International, Inc. | | | 186,948 | | | | 10,341,963 | |
| Nestle S.A. | | | 395,606 | | | | 42,919,912 | |
| PepsiCo, Inc. | | | 65,461 | | | | 8,974,703 | |
| | | | | | | | |
| | | | | | | $ | 155,302,603 | |
15
Portfolio of Investments – continued
| | | | | | | | |
| | |
| Issuer | | Shares/Par | | | Value ($) | |
| Common Stocks - continued | | | | | | | | |
| Food & Drug Stores - 0.1% | | | | | | | | |
| Kroger Co. | | | 444,369 | | | $ | 11,455,833 | |
| | |
| Furniture & Appliances - 0.3% | | | | | | | | |
| Whirlpool Corp. | | | 127,339 | | | $ | 20,165,404 | |
| | |
| Gaming & Lodging - 0.1% | | | | | | | | |
| Marriott International, Inc., “A” | | | 74,860 | | | $ | 9,310,338 | |
| | |
| General Merchandise - 0.2% | | | | | | | | |
| Dollar Tree, Inc. (a) | | | 122,834 | | | $ | 14,022,730 | |
| | |
| Health Maintenance Organizations - 0.6% | | | | | | | | |
| Cigna Corp. | | | 300,438 | | | $ | 45,603,484 | |
| | |
| Insurance - 3.7% | | | | | | | | |
| Aon PLC | | | 325,174 | | | $ | 62,943,931 | |
| Chubb Ltd. | | | 400,253 | | | | 64,616,844 | |
| Marsh & McLennan Cos., Inc. | | | 166,701 | | | | 16,678,435 | |
| MetLife, Inc. | | | 963,444 | | | | 45,436,019 | |
| Prudential Financial, Inc. | | | 175,620 | | | | 15,797,019 | |
| Samsung Fire & Marine Insurance Co. Ltd. | | | 16,697 | | | | 3,107,464 | |
| Travelers Cos., Inc. | | | 351,072 | | | | 52,200,896 | |
| Zurich Insurance Group AG | | | 58,137 | | | | 22,251,725 | |
| | | | | | | | |
| | | | | | | $ | 283,032,333 | |
| Internet - 0.3% | | | | | | | | |
| Alphabet, Inc., “A” (a) | | | 18,174 | | | $ | 22,192,998 | |
| Facebook, Inc., “A” (a) | | | 23,424 | | | | 4,171,346 | |
| | | | | | | | |
| | | | | | | $ | 26,364,344 | |
| Leisure & Toys - 0.1% | | | | | | | | |
| Electronic Arts, Inc. (a) | | | 116,070 | | | $ | 11,353,967 | |
| | |
| Machinery & Tools - 2.4% | | | | | | | | |
| AGCO Corp. | | | 356,929 | | | $ | 27,019,525 | |
| Cummins, Inc. | | | 54,004 | | | | 8,784,831 | |
| Deere & Co. | | | 64,887 | | | | 10,945,139 | |
| Eaton Corp. PLC | | | 804,096 | | | | 66,860,582 | |
| Illinois Tool Works, Inc. | | | 289,570 | | | | 45,314,809 | |
| Ingersoll-Rand Co. PLC, “A” | | | 131,202 | | | | 16,165,399 | |
| Regal Beloit Corp. | | | 47,074 | | | | 3,429,341 | |
| | | | | | | | |
| | | | | | | $ | 178,519,626 | |
16
Portfolio of Investments – continued
| | | | | | | | |
| | |
| Issuer | | Shares/Par | | | Value ($) | |
| Common Stocks - continued | | | | | | | | |
| Major Banks - 5.8% | | | | | | | | |
| Bank of America Corp. | | | 2,253,838 | | | $ | 65,744,454 | |
| Bank of New York Mellon Corp. | | | 761,746 | | | | 34,438,537 | |
| BNP Paribas | | | 79,572 | | | | 3,874,207 | |
| Goldman Sachs Group, Inc. | | | 219,622 | | | | 45,512,267 | |
| JPMorgan Chase & Co. | | | 1,244,552 | | | | 146,471,325 | |
| Morgan Stanley | | | 619,542 | | | | 26,435,857 | |
| PNC Financial Services Group, Inc. | | | 293,898 | | | | 41,192,744 | |
| State Street Corp. | | | 360,652 | | | | 21,346,992 | |
| Sumitomo Mitsui Financial Group, Inc. | | | 100,500 | | | | 3,451,971 | |
| Wells Fargo & Co. | | | 1,005,626 | | | | 50,723,775 | |
| | | | | | | | |
| | | | | | | $ | 439,192,129 | |
| Medical & Health Technology & Services - 1.1% | | | | | | | | |
| HCA Healthcare, Inc. | | | 317,789 | | | $ | 38,268,151 | |
| McKesson Corp. | | | 235,264 | | | | 32,151,178 | |
| Walgreens Boots Alliance, Inc. | | | 185,586 | | | | 10,264,762 | |
| | | | | | | | |
| | | | | | | $ | 80,684,091 | |
| Medical Equipment - 3.5% | | | | | | | | |
| Abbott Laboratories | | | 596,557 | | | $ | 49,913,924 | |
| Danaher Corp. | | | 527,805 | | | | 76,230,876 | |
| Medtronic PLC | | | 673,902 | | | | 73,199,235 | |
| Thermo Fisher Scientific, Inc. | | | 186,268 | | | | 54,254,280 | |
| Zimmer Biomet Holdings, Inc. | | | 104,472 | | | | 14,340,872 | |
| | | | | | | | |
| | | | | | | $ | 267,939,187 | |
| Metals & Mining - 0.2% | | | | | | | | |
| Rio Tinto PLC | | | 320,305 | | | $ | 16,576,347 | |
| | |
| Natural Gas - Distribution - 0.2% | | | | | | | | |
| Sempra Energy | | | 88,669 | | | $ | 13,088,431 | |
| | |
| Natural Gas - Pipeline - 0.9% | | | | | | | | |
| Enbridge, Inc. | | | 182,690 | | | $ | 6,408,765 | |
| Enterprise Products Partners LP | | | 992,347 | | | | 28,361,277 | |
| EQM Midstream Partners LP | | | 234,099 | | | | 7,655,038 | |
| Equitrans Midstream Corp. | | | 625,407 | | | | 9,099,672 | |
| MPLX LP (a) | | | 200,679 | | | | 5,621,019 | |
| Plains GP Holdings LP | | | 441,062 | | | | 9,363,746 | |
| | | | | | | | |
| | | | | | | $ | 66,509,517 | |
| Network & Telecom - 0.6% | | | | | | | | |
| Cisco Systems, Inc. | | | 932,805 | | | $ | 46,089,895 | |
17
Portfolio of Investments – continued
| | | | | | | | |
| | |
| Issuer | | Shares/Par | | | Value ($) | |
| Common Stocks - continued | | | | | | | | |
| Oil Services - 0.2% | | | | | | | | |
| Schlumberger Ltd. | | | 482,165 | | | $ | 16,475,578 | |
| | |
| Other Banks & Diversified Financials - 3.0% | | | | | | | | |
| American Express Co. | | | 100,110 | | | $ | 11,841,011 | |
| BB&T Corp. | | | 441,313 | | | | 23,552,875 | |
| Citigroup, Inc. | | | 1,295,219 | | | | 89,473,729 | |
| Intesa Sanpaolo S.p.A. | | | 2,700,223 | | | | 6,402,732 | |
| ORIX Corp. | | | 462,200 | | | | 6,917,082 | |
| SunTrust Banks, Inc. | | | 205,003 | | | | 14,104,206 | |
| Synchrony Financial | | | 189,933 | | | | 6,474,816 | |
| U.S. Bancorp | | | 981,507 | | | | 54,316,597 | |
| Visa, Inc., “A” | | | 86,597 | | | | 14,895,550 | |
| | | | | | | | |
| | | | | | | $ | 227,978,598 | |
| Pharmaceuticals - 4.2% | | | | | | | | |
| Bayer AG | | | 227,461 | | | $ | 16,038,017 | |
| Bristol-Myers Squibb Co. | | | 406,777 | | | | 20,627,662 | |
| Elanco Animal Health, Inc. (a) | | | 481,096 | | | | 12,792,343 | |
| Eli Lilly & Co. | | | 335,749 | | | | 37,546,811 | |
| Johnson & Johnson | | | 681,059 | | | | 88,115,413 | |
| Merck & Co., Inc. | | �� | 206,254 | | | | 17,362,462 | |
| Mylan N.V. (a) | | | 188,095 | | | | 3,720,519 | |
| Novartis AG | | | 39,045 | | | | 3,385,556 | |
| Pfizer, Inc. | | | 2,312,796 | | | | 83,098,760 | |
| Roche Holding AG | | | 122,348 | | | | 35,605,407 | |
| | | | | | | | |
| | | | | | | $ | 318,292,950 | |
| Printing & Publishing - 0.2% | | | | | | | | |
| Moody’s Corp. | | | 64,894 | | | $ | 13,292,238 | |
| Transcontinental, Inc. | | | 357,835 | | | | 4,181,066 | |
| | | | | | | | |
| | | | | | | $ | 17,473,304 | |
| Railroad & Shipping - 1.2% | | | | | | | | |
| Canadian National Railway Co. | | | 101,257 | | | $ | 9,098,954 | |
| Union Pacific Corp. | | | 485,287 | | | | 78,606,788 | |
| | | | | | | | |
| | | | | | | $ | 87,705,742 | |
| Real Estate - 1.3% | | | | | | | | |
| Brixmor Property Group, Inc., REIT | | | 307,171 | | | $ | 6,232,499 | |
| EPR Properties, REIT | | | 233,260 | | | | 17,928,364 | |
| Medical Properties Trust, Inc., REIT | | | 1,447,098 | | | | 28,305,237 | |
| Public Storage, Inc., REIT | | | 26,204 | | | | 6,427,055 | |
| Simon Property Group, Inc., REIT | | | 65,671 | | | | 10,221,691 | |
| STORE Capital Corp., REIT | | | 795,383 | | | | 29,755,278 | |
| | | | | | | | |
| | | | | | | $ | 98,870,124 | |
18
Portfolio of Investments – continued
| | | | | | | | |
| | |
| Issuer | | Shares/Par | | | Value ($) | |
| Common Stocks - continued | | | | | | | | |
| Restaurants - 0.7% | | | | | | | | |
| Chipotle Mexican Grill, Inc., “A” (a) | | | 12,705 | | | $ | 10,678,171 | |
| Starbucks Corp. | | | 377,845 | | | | 33,409,055 | |
| U.S. Foods Holding Corp. (a) | | | 217,631 | | | | 8,944,634 | |
| | | | | | | | |
| | | | | | | $ | 53,031,860 | |
| Specialty Chemicals - 0.5% | | | | | | | | |
| Axalta Coating Systems Ltd. (a) | | | 416,535 | | | $ | 12,558,530 | |
| Corteva, Inc. | | | 217,272 | | | | 6,083,616 | |
| DuPont de Nemours, Inc. | | | 254,690 | | | | 18,161,944 | |
| | | | | | | | |
| | | | | | | $ | 36,804,090 | |
| Specialty Stores - 1.1% | | | | | | | | |
| Amazon.com, Inc. (a) | | | 18,634 | | | $ | 32,346,947 | |
| Best Buy Co., Inc. | | | 73,974 | | | | 5,103,466 | |
| Target Corp. | | | 357,513 | | | | 38,221,715 | |
| Tractor Supply Co. | | | 79,373 | | | | 7,178,494 | |
| | | | | | | | |
| | | | | | | $ | 82,850,622 | |
| Telephone Services - 0.3% | | | | | | | | |
| Verizon Communications, Inc. | | | 369,561 | | | $ | 22,306,702 | |
| | |
| Tobacco - 1.0% | | | | | | | | |
| Altria Group, Inc. | | | 153,552 | | | $ | 6,280,277 | |
| British American Tobacco PLC | | | 302,288 | | | | 11,178,222 | |
| Japan Tobacco, Inc. | | | 561,800 | | | | 12,310,662 | |
| Philip Morris International, Inc. | | | 627,792 | | | | 47,668,246 | |
| | | | | | | | |
| | | | | | | $ | 77,437,407 | |
| Trucking - 0.1% | | | | | | | | |
| United Parcel Service, Inc., “B” | | | 86,078 | | | $ | 10,313,866 | |
| | |
| Utilities - Electric Power - 2.4% | | | | | | | | |
| Duke Energy Corp. | | | 452,565 | | | $ | 43,382,881 | |
| Exelon Corp. | | | 795,712 | | | | 38,440,847 | |
| FirstEnergy Corp. | | | 449,496 | | | | 21,679,192 | |
| NextEra Energy, Inc. | | | 19,754 | | | | 4,602,484 | |
| Public Service Enterprise Group, Inc. | | | 219,604 | | | | 13,633,016 | |
| Southern Co. | | | 664,962 | | | | 41,074,703 | |
| WEC Energy Group, Inc. | | | 117,152 | | | | 11,141,155 | |
| Xcel Energy, Inc. | | | 126,319 | | | | 8,196,840 | |
| | | | | | | | |
| | | | | | | $ | 182,151,118 | |
| Total Common Stocks (Identified Cost, $2,872,331,967) | | | $ | 4,512,159,154 | |
19
Portfolio of Investments – continued
| | | | | | | | |
| Bonds - 40.0% | | | | | | | | |
| | |
| Issuer | | Shares/Par | | | Value ($) | |
| Aerospace - 0.1% | | | | | | | | |
| L3Harris Technologies, Inc., 3.85%, 6/15/2023 (n) | | $ | 8,173,000 | | | $ | 8,608,985 | |
| | |
| Apparel Manufacturers - 0.1% | | | | | | | | |
| Tapestry, Inc., 4.125%, 7/15/2027 | | $ | 4,186,000 | | | $ | 4,268,309 | |
| | |
| Asset-Backed & Securitized - 4.3% | | | | | | | | |
| ALM Loan Funding, CLO, 2013-7R2A, “A1B2”, FLR, 3.703% (LIBOR - 3mo. + 1.4%), 10/15/2027 (z) | | $ | 13,305,000 | | | $ | 13,213,408 | |
| ALM V Ltd.,2012-5A, “A2R3”, FLR, 3.55% (LIBOR - 3mo. + 1.25%), 10/18/2027 (z) | | | 10,945,000 | | | | 10,846,966 | |
| AREIT CRE Trust, 2018-CRE2, “A”, FLR, 3.008% (LIBOR - 1mo. + 0.98%), 11/14/2035 (z) | | | 11,150,738 | | | | 11,150,738 | |
| AREIT CRE Trust, 2019-CRE3, FLR, 3.328% (LIBOR - 1mo. + 1.3%), 9/14/2036 (n) | | | 10,151,500 | | | | 10,157,845 | |
| Avis Budget Rental Car Funding LLC,2019-1A, “A”, 3.45%, 3/20/2023 (n) | | | 11,630,000 | | | | 11,945,658 | |
| Bancorp Commercial Mortgage Trust, 2018-CRE4, “A”, FLR, 2.927% (LIBOR - 1mo. + 0.9%), 9/15/2035 (z) | | | 9,446,146 | | | | 9,443,294 | |
| Bancorp Commercial Mortgage Trust, 2019-CRE6, FLR, 3.566% (LIBOR - 1mo. + 1.3%), 9/15/2036 (z) | | | 10,512,013 | | | | 10,518,583 | |
| Bayview Financial Revolving Mortgage Loan Trust, FLR, 3.643% (LIBOR - 1mo. + 1.6%), 12/28/2040 (z) | | | 2,746,867 | | | | 2,725,035 | |
| BDS Ltd.,2019-FL4, “A”, FLR, 3.128% (LIBOR - 1mo. + 1.10%), 8/15/2036 (z) | | | 7,275,500 | | | | 7,277,777 | |
| BDS Ltd., FLR, 3.425% (LIBOR - 1mo. + 1.4%), 8/15/2035 (z) | | | 12,606,500 | | | | 12,606,327 | |
| Chesapeake Funding II LLC,2016-2A, “A2”, FLR, 3.027% (LIBOR - 1mo. + 1%), 6/15/2028 (z) | | | 699,098 | | | | 699,636 | |
| Chesapeake Funding II LLC,2018-1A, “A1”, 3.04%, 4/15/2030 (n) | | | 3,554,840 | | | | 3,593,440 | |
| Commercial Mortgage Pass-Through Certificates, 2019-BN17, “A4”, 3.714%, 4/15/2052 | | | 8,356,000 | | | | 9,210,409 | |
| Commercial Mortgage Trust,2015-DC1, “A5”, 3.35%, 2/10/2048 | | | 7,000,000 | | | | 7,348,286 | |
| Commercial Mortgage Trust, 2015-LC21, “A4”, 3.708%, 7/10/2048 | | | 9,641,397 | | | | 10,343,649 | |
| Commercial Mortgage Trust,2015-PC1, “A5”, 3.902%, 7/10/2050 | | | 11,000,000 | | | | 11,881,532 | |
| CSAIL Commercial Mortgage Trust,2015-C2, “A4”, 3.504%, 6/15/2057 | | | 5,534,308 | | | | 5,865,536 | |
| Cutwater CLO Ltd.,2015-1A, “AR”, FLR, 3.523% (LIBOR - 3mo. + 1.22%), 1/15/2029 (n) | | | 13,305,000 | | | | 13,314,859 | |
| Dryden Senior Loan Fund,2013-26A, “AR”, CLO, FLR, 3.203% (LIBOR - 3mo. + 0.9%), 4/15/2029 (z) | | | 8,528,000 | | | | 8,510,458 | |
20
Portfolio of Investments – continued
| | | | | | | | |
| | |
| Issuer | | Shares/Par | | | Value ($) | |
| Bonds - continued | | | | | | | | |
| Asset-Backed & Securitized - continued | | | | | | | | |
| Dryden Senior Loan Fund,2018-55A, “A1”, CLO, FLR, 3.323% (LIBOR - 3mo. + 1.02%), 4/15/2031 (n) | | $ | 11,647,598 | | | $ | 11,575,965 | |
| Exantas Capital Corp. CLO Ltd., 2018-RS06, “A”, FLR, 2.855% (LIBOR - 3mo. + 1.4%), 6/15/2035 (n) | | | 1,110,175 | | | | 1,109,481 | |
| Figueroa CLO Ltd.,2014-1A, “BR”, FLR, 3.803% (LIBOR - 3mo. + 1.5%), 1/15/2027 (n) | | | 3,980,000 | | | | 3,968,888 | |
| Ford Credit Auto Owner Trust,2014-2, “A”, 2.31%, 4/15/2026 (n) | | | 3,092,000 | | | | 3,092,021 | |
| Fort Cre LLC,2018-1A, “A1”, FLR, 3.396% (LIBOR - 1mo. + 1.35%), 11/16/2035 (n) | | | 4,954,000 | | | | 4,953,866 | |
| GMAC Mortgage Corp. Loan Trust, 3.66%, 10/25/2036 | | | 722,808 | | | | 763,556 | |
| GS Mortgage Securities Trust, 2015-GC30, “A4”, 3.382%, 5/10/2050 | | | 10,734,280 | | | | 11,372,138 | |
| JPMBB Commercial Mortgage Securities Trust,2015-C28, “A4”, 3.227%, 10/15/2048 | | | 13,361,337 | | | | 14,002,622 | |
| KKR Real Estate Financial Trust, Inc.,2018-FL1, “A”, FLR, 3.125% (LIBOR - 1mo. + 1.1%), 6/15/2036 (n) | | | 6,595,500 | | | | 6,603,744 | |
| Magnetite XVI Ltd.,2015-16A, “AR”, FLR, 3.1% (LIBOR - 3mo. + 0.8%), 1/18/2028 (z) | | | 5,000,000 | | | | 4,997,455 | |
| Morgan Stanley Bank of America Merrill Lynch Trust,2017-C34, “A4”, 3.536%, 11/15/2052 | | | 4,195,516 | | | | 4,528,377 | |
| Morgan Stanley Capital I Trust,2017-H1, “A5”, 3.53%, 6/15/2050 | | | 3,903,759 | | | | 4,200,253 | |
| Mountain Hawk CLO Ltd.,2014-3A, “BR”, FLR, 4.099% (LIBOR - 3mo. + 1.8%), 4/18/2025 (n) | | | 13,096,831 | | | | 13,084,992 | |
| Navistar Financial Dealer Note Master Owner Trust II,2018-1, “A”, FLR, 2.648% (LIBOR - 1mo. + 0.63%), 9/25/2023 (z) | | | 7,710,000 | | | | 7,719,498 | |
| Neuberger Berman CLO Ltd., FLR, 3.103% (LIBOR - 3mo. + 0.8%), 1/15/2028 (z) | | | 5,725,000 | | | | 5,715,159 | |
| Oaktree CLO Ltd.,2015-1A, “A2AR”, FLR, 3.628% (LIBOR - 3mo. + 1.35%), 10/20/2027 (n) | | | 2,435,945 | | | | 2,409,432 | |
| Residential Funding Mortgage Securities, Inc., 5.32%, 12/25/2035 | | | 1,248,751 | | | | 1,225,476 | |
| Sound Point CLO Ltd.,2015-3A, “AR”, FLR, 3.168% (LIBOR -3mo. + 0.89%), 1/20/2028 (n) | | | 3,225,000 | | | | 3,212,468 | |
| UBS Commercial Mortgage Trust,2019-C16, “A4”, 3.605%, 4/15/2052 | | | 30,000,000 | | | | 32,634,972 | |
| UBS Commercial Mortgage Trust,2019-C17, “A4”, 2.921%, 9/15/2052 | | | 7,465,644 | | | | 7,681,049 | |
| Wells Fargo Commercial Mortgage Trust, 2015-NXS1, “A5”, 3.148%, 5/15/2048 | | | 6,507,931 | | | | 6,793,210 | |
| | | | | | | | |
| | | | | | | $ | 322,298,058 | |
21
Portfolio of Investments – continued
| | | | | | | | |
| | |
| Issuer | | Shares/Par | | | Value ($) | |
| Bonds - continued | | | | | | | | |
| Automotive - 0.2% | | | | | | | | |
| General Motors Co., 6.75%, 4/01/2046 | | $ | 3,268,000 | | | $ | 3,738,320 | |
| General Motors Financial Co., Inc., 4.35%, 4/09/2025 | | | 3,361,000 | | | | 3,500,978 | |
| Lear Corp., 3.8%, 9/15/2027 | | | 7,427,000 | | | | 7,464,679 | |
| Lear Corp., 4.25%, 5/15/2029 | | | 3,446,000 | | | | 3,539,179 | |
| | | | | | | | |
| | | | | | | $ | 18,243,156 | |
| Broadcasting - 0.1% | | | | | | | | |
| Fox Corp., 4.03%, 1/25/2024 (n) | | $ | 7,984,000 | | | $ | 8,489,142 | |
| | |
| Brokerage & Asset Managers - 0.5% | | | | | | | | |
| Charles Schwab Corp., 3.2%, 1/25/2028 | | $ | 7,026,000 | | | $ | 7,375,919 | |
| E*TRADE Financial Corp., 2.95%, 8/24/2022 | | | 2,227,000 | | | | 2,262,784 | |
| E*TRADE Financial Corp., 3.8%, 8/24/2027 | | | 3,239,000 | | | | 3,379,120 | |
| E*TRADE Financial Corp., 4.5%, 6/20/2028 | | | 3,325,000 | | | | 3,620,586 | |
| Intercontinental Exchange, Inc., 2.35%, 9/15/2022 | | | 4,411,000 | | | | 4,446,778 | |
| Intercontinental Exchange, Inc., 4%, 10/15/2023 | | | 7,055,000 | | | | 7,529,533 | |
| Raymond James Financial, Inc., 4.95%, 7/15/2046 | | | 6,556,000 | | | | 7,833,151 | |
| | | | | | | | |
| | | | | | | $ | 36,447,871 | |
| Building - 0.2% | | | | | | | | |
| CRH America Finance, Inc., 4.5%, 4/04/2048 (n) | | $ | 3,379,000 | | | $ | 3,635,386 | |
| Martin Marietta Materials, Inc., 3.5%, 12/15/2027 | | | 2,740,000 | | | | 2,811,690 | |
| Masco Corp., 4.375%, 4/01/2026 | | | 5,605,000 | | | | 6,016,221 | |
| | | | | | | | |
| | | | | | | $ | 12,463,297 | |
| Business Services - 0.3% | | | | | | | | |
| Fidelity National Information Services, Inc., 4.5%, 8/15/2046 | | $ | 1,829,000 | | | $ | 2,120,289 | |
| Fidelity National Information Services, Inc., 4.75%, 5/15/2048 | | | 7,719,000 | | | | 9,363,126 | |
| Fiserv, Inc., 4.4%, 7/01/2049 | | | 5,204,000 | | | | 5,806,721 | |
| Verisk Analytics, Inc., 4.125%, 3/15/2029 | | | 7,699,000 | | | | 8,482,684 | |
| | | | | | | | |
| | | | | | | $ | 25,772,820 | |
| Cable TV - 0.2% | | | | | | | | |
| Charter Communications Operating LLC/Charter | | | | | | | | |
| Communications Operating Capital Corp., 4.908%, 7/23/2025 | | $ | 5,325,000 | | | $ | 5,841,287 | |
| Time Warner Entertainment Co. LP, 8.375%, 7/15/2033 | | | 7,170,000 | | | | 9,917,469 | |
| | | | | | | | |
| | | | | | | $ | 15,758,756 | |
| Chemicals - 0.1% | | | | | | | | |
| Sherwin-Williams Co., 4.5%, 6/01/2047 | | $ | 5,394,000 | | | $ | 6,044,624 | |
| | |
| Computer Software - 0.2% | | | | | | | | |
| Dell International LLC/EMC Corp., 4.9%, 10/01/2026 (n) | | $ | 5,910,000 | | | $ | 6,334,949 | |
| Microsoft Corp., 4.25%, 2/06/2047 | | | 6,521,000 | | | | 8,090,100 | |
| | | | | | | | |
| | | | | | | $ | 14,425,049 | |
22
Portfolio of Investments – continued
| | | | | | | | |
| | |
| Issuer | | Shares/Par | | | Value ($) | |
| Bonds - continued | | | | | | | | |
| Computer Software - Systems - 0.2% | | | | | | | | |
| Apple, Inc., 2.85%, 2/23/2023 | | $ | 9,582,000 | | | $ | 9,864,154 | |
| Apple, Inc., 3.35%, 2/09/2027 | | | 3,208,000 | | | | 3,429,746 | |
| Apple, Inc., 3.85%, 5/04/2043 | | | 5,286,000 | | | | 5,926,845 | |
| | | | | | | | |
| | | | | | | $ | 19,220,745 | |
| Conglomerates - 0.2% | | | | | | | | |
| Roper Technologies, Inc., 4.2%, 9/15/2028 | | $ | 2,666,000 | | | $ | 2,927,832 | |
| Roper Technologies, Inc. , 2.95%, 9/15/2029 | | | 1,686,000 | | | | 1,690,091 | |
| United Technologies Corp., 4.125%, 11/16/2028 | | | 5,363,000 | | | | 6,067,622 | |
| Wabtec Corp., 4.95%, 9/15/2028 | | | 6,210,000 | | | | 6,847,653 | |
| Westinghouse Air Brake Technologies Corp., 4.4%, 3/15/2024 | | | 1,213,000 | | | | 1,291,879 | |
| | | | | | | | |
| | | | | | | $ | 18,825,077 | |
| Consumer Products - 0.2% | | | | | | | | |
| Reckitt Benckiser Treasury Services PLC, 3.625%, 9/21/2023 (n) | | $ | 6,003,000 | | | $ | 6,289,022 | |
| Reckitt Benckiser Treasury Services PLC, 2.75%, 6/26/2024 (n) | | | 6,336,000 | | | | 6,450,377 | |
| | | | | | | | |
| | | | | | | $ | 12,739,399 | |
| Consumer Services - 0.6% | | | | | | | | |
| Expedia Group, Inc., 3.25%, 2/15/2030 (z) | | $ | 6,708,000 | | | $ | 6,688,870 | |
| Experian Finance PLC, 4.25%, 2/01/2029 (n) | | | 5,108,000 | | | | 5,737,380 | |
| IHS Markit Ltd., 3.625%, 5/01/2024 | | | 1,224,000 | | | | 1,268,186 | |
| IHS Markit Ltd., 4%, 3/01/2026 (n) | | | 6,653,000 | | | | 7,005,609 | |
| IHS Markit Ltd., 4.25%, 5/01/2029 | | | 1,836,000 | | | | 1,974,490 | |
| Priceline Group, Inc., 2.75%, 3/15/2023 | | | 12,304,000 | | | | 12,595,638 | |
| Visa, Inc., 3.15%, 12/14/2025 | | | 9,366,000 | | | | 9,982,970 | |
| | | | | | | | |
| | | | | | | $ | 45,253,143 | |
| Electronics - 0.2% | | | | | | | | |
| Broadcom Corp./Broadcom Cayman Finance Ltd., 3.875%, 1/15/2027 | | $ | 3,327,000 | | | $ | 3,341,040 | |
| Broadcom Corp./Broadcom Cayman Finance Ltd., 3.5%, 1/15/2028 | | | 9,409,000 | | | | 9,169,982 | |
| Broadcom, Inc., 4.25%, 4/15/2026 (n) | | | 5,014,000 | | | | 5,178,996 | |
| | | | | | | | |
| | | | | | | $ | 17,690,018 | |
| Energy - Integrated - 0.2% | | | | | | | | |
| BP Capital Markets PLC, 4.742%, 3/11/2021 | | $ | 4,892,000 | | | $ | 5,070,186 | |
| Eni S.p.A., 4.75%, 9/12/2028 (n) | | | 5,928,000 | | | | 6,725,768 | |
| | | | | | | | |
| | | | | | | $ | 11,795,954 | |
| Financial Institutions - 0.2% | | | | | | | | |
| AerCap Ireland Capital Ltd., 4.875%, 1/16/2024 | | $ | 1,093,000 | | | $ | 1,180,261 | |
| AerCap Ireland Capital Ltd., 3.65%, 7/21/2027 | | | 9,238,000 | | | | 9,399,553 | |
| Avolon Holdings Funding Ltd., 4.375%, 5/01/2026 (n) | | | 2,464,000 | | | | 2,548,515 | |
| | | | | | | | |
| | | | | | | $ | 13,128,329 | |
23
Portfolio of Investments – continued
| | | | | | | | |
| | |
| Issuer | | Shares/Par | | | Value ($) | |
| Bonds - continued | | | | | | | | |
| Food & Beverages - 0.3% | | | | | | | | |
| Anheuser-Busch InBev S.A., 8%, 11/15/2039 | | $ | 5,850,000 | | | $ | 9,152,599 | |
| Conagra Brands, Inc., 5.3%, 11/01/2038 | | | 751,000 | | | | 867,439 | |
| Conagra Brands, Inc., 5.4%, 11/01/2048 | | | 1,531,000 | | | | 1,816,296 | |
| Constellation Brands, Inc., 3.5%, 5/09/2027 | | | 9,893,000 | | | | 10,347,335 | |
| Diageo Capital PLC, 2.375%, 10/24/2029 | | | 3,896,000 | | | | 3,860,780 | |
| | | | | | | | |
| | | | | | | $ | 26,044,449 | |
| Forest & Paper Products - 0.1% | | | | | | | | |
| Suzano Austria GmbH, 6%, 1/15/2029 | | $ | 4,985,000 | | | $ | 5,418,695 | |
| | |
| Gaming & Lodging - 0.2% | | | | | | | | |
| GLP Capital LP/GLP Financing II, Inc., 5.3%, 1/15/2029 | | $ | 5,487,000 | | | $ | 6,047,826 | |
| Las Vegas Sands Corp., 3.9%, 8/08/2029 | | | 3,182,000 | | | | 3,263,770 | |
| Marriott International, Inc., 4%, 4/15/2028 | | | 6,516,000 | | | | 6,971,754 | |
| | | | | | | | |
| | | | | | | $ | 16,283,350 | |
| Insurance - 0.3% | | | | | | | | |
| American International Group, Inc., 4.875%, 6/01/2022 | | $ | 10,460,000 | | | $ | 11,178,686 | |
| American International Group, Inc., 3.75%, 7/10/2025 | | | 8,000,000 | | | | 8,452,539 | |
| | | | | | | | |
| | | | | | | $ | 19,631,225 | |
| Insurance - Health - 0.2% | | | | | | | | |
| UnitedHealth Group, Inc., 3.75%, 7/15/2025 | | $ | 9,796,000 | | | $ | 10,532,920 | |
| UnitedHealth Group, Inc., 3.5%, 8/15/2039 | | | 1,303,000 | | | | 1,356,409 | |
| | | | | | | | |
| | | | | | | $ | 11,889,329 | |
| Insurance - Property & Casualty - 0.3% | | | | | | | | |
| Aon Corp., 3.75%, 5/02/2029 | | $ | 5,438,000 | | | $ | 5,801,813 | |
| Berkshire Hathaway, Inc., 3.125%, 3/15/2026 | | | 3,183,000 | | | | 3,358,938 | |
| Hartford Financial Services Group, Inc., 3.6%, 8/19/2049 | | | 3,261,000 | | | | 3,281,672 | |
| Liberty Mutual Group, Inc., 4.85%, 8/01/2044 (z) | | | 3,992,000 | | | | 4,013,706 | |
| Marsh & McLennan Cos., Inc., 4.8%, 7/15/2021 | | | 5,360,000 | | | | 5,566,824 | |
| Marsh & McLennan Cos., Inc., 4.75%, 3/15/2039 | | | 2,844,000 | | | | 3,432,151 | |
| | | | | | | | |
| | | | | | | $ | 25,455,104 | |
| International Market Quasi-Sovereign - 0.1% | | | | | | | | |
| Temasek Financial I Ltd. (Republic of Singapore), 2.375%, 1/23/2023 (n) | | $ | 10,140,000 | | | $ | 10,281,205 | |
| | |
| Machinery & Tools - 0.1% | | | | | | | | |
| CNH Industrial Capital LLC, 4.2%, 1/15/2024 | | $ | 6,456,000 | | | $ | 6,812,389 | |
| | |
| Major Banks - 1.7% | | | | | | | | |
| ABN AMRO Bank N.V., 4.8%, 4/18/2026 (n) | | $ | 6,400,000 | | | $ | 6,927,130 | |
| Bank of America Corp., 4.1%, 7/24/2023 | | | 7,970,000 | | | | 8,503,340 | |
24
Portfolio of Investments – continued
| | | | | | | | |
| | |
| Issuer | | Shares/Par | | | Value ($) | |
| Bonds - continued | | | | | | | | |
| Major Banks - continued | | | | | | | | |
| Bank of America Corp., 3.004%, 12/20/2023 | | $ | 1,833,000 | | | $ | 1,871,983 | |
| Bank of America Corp., 4.125%, 1/22/2024 | | | 10,657,000 | | | | 11,470,013 | |
| Bank of America Corp., 3.366% to 1/23/2025, FLR (LIBOR - 3mo. + 0.81%) to 1/23/2026 | | | 5,404,000 | | | | 5,620,901 | |
| Bank of America Corp., 3.5%, 4/19/2026 | | | 10,585,000 | | | | 11,237,829 | |
| Goldman Sachs Group, Inc., 3.85%, 1/26/2027 | | | 6,353,000 | | | | 6,736,540 | |
| JPMorgan Chase & Co., 3.2%, 1/25/2023 | | | 14,643,000 | | | | 15,122,390 | |
| JPMorgan Chase & Co., 3.782% to 2/01/2027, FLR (LIBOR - 3mo. + 1.337%) to 2/01/2028 | | | 16,313,000 | | | | 17,452,964 | |
| JPMorgan Chase & Co., 3.897%, 1/23/2049 | | | 3,658,000 | | | | 4,070,158 | |
| Morgan Stanley, 3.125%, 1/23/2023 | | | 1,002,000 | | | | 1,027,789 | |
| Morgan Stanley, 3.875%, 4/29/2024 | | | 6,520,000 | | | | 6,936,170 | |
| Morgan Stanley, 4%, 7/23/2025 | | | 2,939,000 | | | | 3,170,532 | |
| Morgan Stanley, 3.625%, 1/20/2027 | | | 14,924,000 | | | | 15,802,182 | |
| Wells Fargo & Co., 3.75%, 1/24/2024 | | | 10,183,000 | | | | 10,775,038 | |
| | | | | | | | |
| | | | | | | $ | 126,724,959 | |
| Medical & Health Technology & Services - 0.6% | | | | | | | | |
| Alcon, Inc., 3.8%, 9/23/2049 (z) | | $ | 948,000 | | | $ | 989,602 | |
| Becton, Dickinson and Co., 3.125%, 11/08/2021 | | | 3,168,000 | | | | 3,220,595 | |
| Becton, Dickinson and Co., 4.669%, 6/06/2047 | | | 6,553,000 | | | | 7,738,950 | |
| HCA, Inc., 5.125%, 6/15/2039 | | | 2,427,000 | | | | 2,647,080 | |
| Laboratory Corp. of America Holdings, 3.2%, 2/01/2022 | | | 1,494,000 | | | | 1,524,399 | |
| Laboratory Corp. of America Holdings, 4.7%, 2/01/2045 | | | 6,000,000 | | | | 6,680,736 | |
| Northwell Healthcare, Inc., 3.979%, 11/01/2046 | | | 520,000 | | | | 569,271 | |
| Northwell Healthcare, Inc., 4.26%, 11/01/2047 | | | 4,156,000 | | | | 4,641,680 | |
| Thermo Fisher Scientific, Inc., 2.95%, 9/19/2026 | | | 7,303,000 | | | | 7,524,040 | |
| Thermo Fisher Scientific, Inc., 3.2%, 8/15/2027 | | | 7,755,000 | | | | 8,106,938 | |
| | | | | | | | |
| | | | | | | $ | 43,643,291 | |
| Medical Equipment - 0.3% | | | | | | | | |
| Abbott Laboratories, 4.9%, 11/30/2046 | | $ | 6,534,000 | | | $ | 8,429,121 | |
| Boston Scientific Corp., 3.75%, 3/01/2026 | | | 2,105,000 | | | | 2,249,512 | |
| Zimmer Biomet Holdings, Inc., 3.55%, 4/01/2025 | | | 7,149,000 | | | | 7,505,772 | |
| Zimmer Biomet Holdings, Inc., FLR, 2.914% (LIBOR - 3mo. + 0.75%), 3/19/2021 | | | 2,923,000 | | | | 2,923,051 | |
| | | | | | | | |
| | | | | | | $ | 21,107,456 | |
| Metals & Mining - 0.1% | | | | | | | | |
| Glencore Funding LLC, 4.125%, 5/30/2023 (n) | | $ | 4,071,000 | | | $ | 4,260,373 | |
| | |
| Midstream - 0.6% | | | | | | | | |
| APT Pipelines Ltd., 4.2%, 3/23/2025 (n) | | $ | 9,121,000 | | | $ | 9,658,253 | |
| APT Pipelines Ltd., 4.25%, 7/15/2027 (n) | | | 822,000 | | | | 883,836 | |
25
Portfolio of Investments – continued
| | | | | | | | |
| | |
| Issuer | | Shares/Par | | | Value ($) | |
| Bonds - continued | | | | | | | | |
| Midstream - continued | | | | | | | | |
| Enterprise Products Operating LLC, 4.2%, 1/31/2050 | | $ | 2,777,000 | | | $ | 2,969,880 | |
| Kinder Morgan Energy Partners LP, 4.15%, 2/01/2024 | | | 5,700,000 | | | | 6,059,916 | |
| MPLX LP, 4.5%, 4/15/2038 | | | 2,748,000 | | | | 2,848,483 | |
| ONEOK, Inc., 4.95%, 7/13/2047 | | | 7,952,000 | | | | 8,621,204 | |
| Plains All American Pipeline, 3.55%, 12/15/2029 | | | 2,703,000 | | | | 2,642,272 | |
| Sabine Pass Liquefaction LLC, 5%, 3/15/2027 | | | 9,458,000 | | | | 10,428,558 | |
| | | | | | | | |
| | | | | | | $ | 44,112,402 | |
| Mortgage-Backed - 12.5% | | | | | | | | |
| Fannie Mae, 5%, 12/01/2019 - 3/01/2042 | | $ | 10,412,206 | | | $ | 11,490,911 | |
| Fannie Mae, 4.58%, 1/01/2021 | | | 242,839 | | | | 244,500 | |
| Fannie Mae, 6%, 1/01/2021 - 7/01/2037 | | | 7,636,155 | | | | 8,611,764 | |
| Fannie Mae, 3.99%, 7/01/2021 | | | 277,188 | | | | 284,625 | |
| Fannie Mae, 2.67%, 3/01/2022 | | | 854,831 | | | | 870,425 | |
| Fannie Mae, 2.73%, 4/01/2023 | | | 616,107 | | | | 631,780 | |
| Fannie Mae, 2.41%, 5/01/2023 | | | 934,503 | | | | 948,897 | |
| Fannie Mae, 2.55%, 5/01/2023 | | | 878,714 | | | | 896,335 | |
| Fannie Mae, 2.59%, 5/01/2023 | | | 923,967 | | | | 943,778 | |
| Fannie Mae, 2.62%, 5/01/2023 | | | 614,283 | | | | 628,028 | |
| Fannie Mae, 5.25%, 8/01/2024 | | | 943,023 | | | | 1,052,154 | |
| Fannie Mae, 3.5%, 5/25/2025 - 1/01/2047 | | | 98,598,992 | | | | 103,128,033 | |
| Fannie Mae, 2.7%, 7/01/2025 | | | 1,007,000 | | | | 1,043,335 | |
| Fannie Mae, 3.43%, 6/01/2026 | | | 1,140,085 | | | | 1,233,866 | |
| Fannie Mae, 4.54%, 7/01/2026 | | | 958,925 | | | | 1,083,162 | |
| Fannie Mae, 2.28%, 11/01/2026 | | | 1,365,189 | | | | 1,385,001 | |
| Fannie Mae, 2.672%, 12/25/2026 | | | 4,588,000 | | | | 4,737,579 | |
| Fannie Mae, 3.95%, 1/01/2027 | | | 923,198 | | | | 1,030,669 | |
| Fannie Mae, 3%, 11/01/2028 - 11/01/2046 | | | 34,643,034 | | | | 35,644,787 | |
| Fannie Mae, 4.01%, 1/01/2029 | | | 776,313 | | | | 878,525 | |
| Fannie Mae, 4.96%, 6/01/2030 | | | 525,983 | | | | 615,133 | |
| Fannie Mae, 6.5%, 6/01/2031 - 7/01/2037 | | | 2,840,344 | | | | 3,220,226 | |
| Fannie Mae, 5.5%, 2/01/2033 - 4/01/2040 | | | 13,674,880 | | | | 15,303,944 | |
| Fannie Mae, 4.5%, 8/01/2033 - 6/01/2044 | | | 30,763,120 | | | | 33,309,766 | |
| Fannie Mae, 3.25%, 5/25/2040 | | | 720,533 | | | | 750,760 | |
| Fannie Mae, 4%, 9/01/2040 - 6/01/2047 | | | 80,667,451 | | | | 85,950,112 | |
| Fannie Mae, 2%, 10/25/2040 - 4/25/2046 | | | 4,713,018 | | | | 4,681,383 | |
| Fannie Mae, TBA, 3%, 10/01/2034 - 11/01/2034 | | | 27,507,999 | | | | 28,111,927 | |
| Fannie Mae, TBA, 2.5%, 11/01/2034 | | | 18,037,500 | | | | 18,187,930 | |
| Fannie Mae, TBA, 5%, 11/01/2049 | | | 2,250,000 | | | | 2,411,455 | |
| Freddie Mac, 1.869%, 11/25/2019 | | | 641,065 | | | | 640,041 | |
| Freddie Mac, 5.5%, 2/01/2020 - 10/01/2035 | | | 2,867,441 | | | | 3,211,616 | |
| Freddie Mac, 2.313%, 3/25/2020 | | | 573,543 | | | | 572,967 | |
| Freddie Mac, 5%, 4/01/2020 - 7/01/2041 | | | 6,118,666 | | | | 6,776,235 | |
26
Portfolio of Investments – continued
| | | | | | | | |
| | |
| Issuer | | Shares/Par | | | Value ($) | |
| Bonds - continued | | | | | | | | |
| Mortgage-Backed - continued | | | | | | | | |
| Freddie Mac, 3.808%, 8/25/2020 | | $ | 5,751,189 | | | $ | 5,810,236 | |
| Freddie Mac, 3.034%, 10/25/2020 | | | 1,740,334 | | | | 1,750,995 | |
| Freddie Mac, 6%, 5/01/2021 - 6/01/2037 | | | 3,105,205 | | | | 3,531,887 | |
| Freddie Mac, 2.791%, 1/25/2022 | | | 3,221,000 | | | | 3,267,767 | |
| Freddie Mac, 2.51%, 11/25/2022 | | | 4,700,000 | | | | 4,770,925 | |
| Freddie Mac, 3.111%, 2/25/2023 | | | 5,200,000 | | | | 5,379,738 | |
| Freddie Mac, 3.32%, 2/25/2023 | | | 2,023,000 | | | | 2,107,105 | |
| Freddie Mac, 3.25%, 4/25/2023 | | | 6,006,000 | | | | 6,245,582 | |
| Freddie Mac, 3.06%, 7/25/2023 | | | 4,461,000 | | | | 4,623,387 | |
| Freddie Mac, 3.458%, 8/25/2023 | | | 5,373,000 | | | | 5,644,876 | |
| Freddie Mac, 1.016%, 4/25/2024 (i) | | | 11,277,651 | | | | 364,355 | |
| Freddie Mac, 0.63%, 7/25/2024 (i) | | | 40,823,000 | | | | 994,603 | |
| Freddie Mac, 0.736%, 7/25/2024 (i) | | | 13,958,572 | | | | 355,631 | |
| Freddie Mac, 4.5%, 8/01/2024 - 5/01/2042 | | | 5,227,978 | | | | 5,641,062 | |
| Freddie Mac, 0.431%, 8/25/2024 (i) | | | 44,106,000 | | | | 746,723 | |
| Freddie Mac, 0.531%, 8/25/2024 (i) | | | 81,906,350 | | | | 1,444,296 | |
| Freddie Mac, 3.064%, 8/25/2024 | | | 2,295,000 | | | | 2,395,564 | |
| Freddie Mac, 0.49%, 10/25/2024 (i) | | | 60,001,826 | | | | 953,183 | |
| Freddie Mac, 3.171%, 10/25/2024 | | | 3,005,000 | | | | 3,164,675 | |
| Freddie Mac, 0.4%, 11/25/2024 (i) | | | 44,690,000 | | | | 660,692 | |
| Freddie Mac, 2.67%, 12/25/2024 | | | 3,687,000 | | | | 3,802,540 | |
| Freddie Mac, 3.329%, 5/25/2025 | | | 4,698,000 | | | | 5,013,259 | |
| Freddie Mac, 3.01%, 7/25/2025 | | | 1,275,000 | | | | 1,340,693 | |
| Freddie Mac, 3.151%, 11/25/2025 | | | 2,984,000 | | | | 3,168,067 | |
| Freddie Mac, 3.5%, 12/01/2025 - 10/25/2058 | | | 76,935,691 | | | | 80,208,858 | |
| Freddie Mac, 2.673%, 3/25/2026 | | | 6,105,000 | | | | 6,332,527 | |
| Freddie Mac, 3.413%, 12/25/2026 | | | 2,318,000 | | | | 2,520,883 | |
| Freddie Mac, 3.43%, 1/25/2027 | | | 2,273,257 | | | | 2,472,797 | |
| Freddie Mac, 3.224%, 3/25/2027 | | | 3,711,000 | | | | 3,988,382 | |
| Freddie Mac, 0.774%, 6/25/2027 (i) | | | 39,273,000 | | | | 1,869,454 | |
| Freddie Mac, 0.89%, 6/25/2027 (i) | | | 12,770,733 | | | | 644,229 | |
| Freddie Mac, 0.713%, 7/25/2027 (i) | | | 34,197,148 | | | | 1,389,628 | |
| Freddie Mac, 0.461%, 8/25/2027 (i) | | | 27,934,000 | | | | 745,821 | |
| Freddie Mac, 0.566%, 8/25/2027 (i) | | | 18,229,259 | | | | 560,338 | |
| Freddie Mac, 3.244%, 8/25/2027 | | | 2,336,000 | | | | 2,520,555 | |
| Freddie Mac, 0.405%, 9/25/2027 (i) | | | 30,183,000 | | | | 701,990 | |
| Freddie Mac, 0.496%, 9/25/2027 (i) | | | 24,846,320 | | | | 672,013 | |
| Freddie Mac, 0.325%, 11/25/2027 (i) | | | 47,333,000 | | | | 820,413 | |
| Freddie Mac, 0.419%, 11/25/2027 (i) | | | 34,074,317 | | | | 735,995 | |
| Freddie Mac, 0.456%, 11/25/2027 (i) | | | 30,394,737 | | | | 756,428 | |
| Freddie Mac, 0.37%, 12/25/2027 (i) | | | 29,308,000 | | | | 620,699 | |
| Freddie Mac, 0.413%, 12/25/2027 (i) | | | 32,765,000 | | | | 794,931 | |
| Freddie Mac, 0.494%, 12/25/2027 (i) | | | 52,354,910 | | | | 1,450,582 | |
27
Portfolio of Investments – continued
| | | | | | | | |
| | |
| Issuer | | Shares/Par | | | Value ($) | |
| Bonds - continued | | | | | | | | |
| Mortgage-Backed - continued | | | | | | | | |
| Freddie Mac, 3.65%, 2/25/2028 | | $ | 2,634,000 | | | $ | 2,919,781 | |
| Freddie Mac, 3.9%, 4/25/2028 | | | 4,975,000 | | | | 5,611,342 | |
| Freddie Mac, 1.089%, 7/25/2029 (i) | | | 858,352 | | | | 78,852 | |
| Freddie Mac, 2.5%, 11/01/2031 | | | 397,278 | | | | 401,124 | |
| Freddie Mac, 0.448%, 11/25/2032 (i) | | | 25,920,649 | | | | 816,135 | |
| Freddie Mac, 3%, 8/01/2033 - 3/01/2048 | | | 61,865,612 | | | | 63,649,863 | |
| Freddie Mac, 6.5%, 5/01/2034 - 7/01/2037 | | | 1,657,862 | | | | 1,860,148 | |
| Freddie Mac, 4%, 8/01/2037 - 8/01/2047 | | | 49,392,215 | | | | 52,054,965 | |
| Ginnie Mae, 2.5%, 7/20/2032 | | | 950,000 | | | | 954,220 | |
| Ginnie Mae, 6%, 9/15/2032 - 1/15/2038 | | | 2,872,764 | | | | 3,290,600 | |
| Ginnie Mae, 5.5%, 12/15/2032 - 4/20/2035 | | | 2,422,592 | | | | 2,747,761 | |
| Ginnie Mae, 4.5%, 7/15/2033 - 5/20/2049 | | | 14,048,004 | | | | 14,985,345 | |
| Ginnie Mae, 5%, 7/20/2033 - 10/15/2034 | | | 802,170 | | | | 888,914 | |
| Ginnie Mae, 4%, 1/20/2041 - 7/20/2049 | | | 28,808,261 | | | | 30,212,092 | |
| Ginnie Mae, 3.5%, 12/15/2041 - 8/20/2049 | | | 60,167,870 | | | | 62,698,203 | |
| Ginnie Mae, 3%, 4/20/2045 - 3/20/2048 | | | 65,446,409 | | | | 67,296,412 | |
| Ginnie Mae, 0.661%, 2/16/2059 (i) | | | 20,797,220 | | | | 1,208,566 | |
| Ginnie Mae, TBA, 3%, 10/01/2049 - 11/01/2049 | | | 23,025,000 | | | | 23,611,779 | |
| Ginnie Mae, TBA, 3.5%, 11/01/2049 | | | 7,875,000 | | | | 8,154,163 | |
| Ginnie Mae, TBA, 4%, 11/01/2049 | | | 2,475,000 | | | | 2,572,792 | |
| Ginnie Mae, TBA, 4.5%, 11/01/2049 | | | 36,330,000 | | | | 37,930,279 | |
| | | | | | | | |
| | | | | | | $ | 947,439,349 | |
| Municipals - 0.3% | | | | | | | | |
| New Jersey Economic Development Authority State Pension Funding Rev., “A”, 7.425%, 2/15/2029 | | $ | 8,500,000 | | | $ | 10,857,900 | |
| New Jersey Turnpike Authority Rev. (Build America Bonds), “F”, 7.414%, 1/01/2040 | | | 5,815,000 | | | | 9,369,709 | |
| | | | | | | | |
| | | | | | | $ | 20,227,609 | |
| Natural Gas - Distribution - 0.1% | | | | | | | | |
| NiSource, Inc., 2.95%, 9/01/2029 | | $ | 5,114,000 | | | $ | 5,141,705 | |
| NiSource, Inc., 5.65%, 2/01/2045 | | | 2,500,000 | | | | 3,221,648 | |
| | | | | | | | |
| | | | | | | $ | 8,363,353 | |
| Network & Telecom - 0.1% | | | | | | | | |
| AT&T, Inc., 3%, 6/30/2022 | | $ | 6,074,000 | | | $ | 6,199,884 | |
| AT&T, Inc., 5.45%, 3/01/2047 | | | 4,507,000 | | | | 5,452,310 | |
| | | | | | | | |
| | | | | | | $ | 11,652,194 | |
| Oils - 0.2% | | | | | | | | |
| Marathon Petroleum Corp., 4.75%, 9/15/2044 | | $ | 5,246,000 | | | $ | 5,637,912 | |
| Valero Energy Corp., 4.9%, 3/15/2045 | | | 7,872,000 | | | | 8,790,146 | |
| | | | | | | | |
| | | | | | | $ | 14,428,058 | |
28
Portfolio of Investments – continued
| | | | | | | | |
| | |
| Issuer | | Shares/Par | | | Value ($) | |
| Bonds - continued | | | | | | | | |
| Other Banks & Diversified Financials - 0.2% | | | | | | | | |
| Banco de Credito del Peru, 5.375%, 9/16/2020 | | $ | 4,872,000 | | | $ | 5,005,980 | |
| BBVA Bancomer S.A. de C.V., 6.75%, 9/30/2022 (n) | | | 4,730,000 | | | | 5,138,010 | |
| Capital One Financial Corp., 3.75%, 3/09/2027 | | | 7,855,000 | | | | 8,245,365 | |
| | | | | | | | |
| | | | | | | $ | 18,389,355 | |
| Pollution Control - 0.1% | | | | | | | | |
| Republic Services, Inc., 3.95%, 5/15/2028 | | $ | 4,185,000 | | | $ | 4,630,606 | |
| | |
| Retailers - 0.3% | | | | | | | | |
| Best Buy Co., Inc., 4.45%, 10/01/2028 | | $ | 7,794,000 | | | $ | 8,465,589 | |
| Dollar Tree, Inc., 4%, 5/15/2025 | | | 3,262,000 | | | | 3,456,329 | |
| Dollar Tree, Inc., 4.2%, 5/15/2028 | | | 1,553,000 | | | | 1,668,737 | |
| Home Depot, Inc., 5.95%, 4/01/2041 | | | 1,578,000 | | | | 2,259,033 | |
| Home Depot, Inc., 3.9%, 6/15/2047 | | | 4,506,000 | | | | 5,158,836 | |
| | | | | | | | |
| | | | | | | $ | 21,008,524 | |
| Telecommunications - Wireless - 0.3% | | | | | | | | |
| American Tower Corp., REIT, 3%, 6/15/2023 | | $ | 3,756,000 | | | $ | 3,842,126 | |
| American Tower Corp., REIT, 3.6%, 1/15/2028 | | | 3,756,000 | | | | 3,954,010 | |
| American Tower Trust I, REIT, 3.07%, 3/15/2023 (n) | | | 5,960,000 | | | | 6,056,227 | |
| Crown Castle International Corp., 3.65%, 9/01/2027 | | | 9,353,000 | | | | 9,902,983 | |
| | | | | | | | |
| | | | | | | $ | 23,755,346 | |
| Transportation - Services - 0.1% | | | | | | | | |
| ERAC USA Finance LLC, 7%, 10/15/2037 (n) | | $ | 6,381,000 | | | $ | 9,035,780 | |
| | |
| U.S. Government Agencies and Equivalents - 0.0% | | | | | | | | |
| Small Business Administration, 4.35%, 7/01/2023 | | $ | 82,676 | | | $ | 85,438 | |
| Small Business Administration, 4.77%, 4/01/2024 | | | 260,401 | | | | 271,008 | |
| Small Business Administration, 5.18%, 5/01/2024 | | | 438,133 | | | | 459,550 | |
| Small Business Administration, 5.52%, 6/01/2024 | | | 222,440 | | | | 234,260 | |
| Small Business Administration, 4.99%, 9/01/2024 | | | 420,993 | | | | 439,925 | |
| Small Business Administration, 4.95%, 3/01/2025 | | | 358,706 | | | | 375,014 | |
| | | | | | | | |
| | | | | | | $ | 1,865,195 | |
| U.S. Treasury Obligations - 12.0% | | | | | | | | |
| U.S. Treasury Bonds, 4.5%, 2/15/2036 | | $ | 7,818,000 | | | $ | 10,777,235 | |
| U.S. Treasury Bonds, 5%, 5/15/2037 | | | 2,452,000 | | | | 3,616,221 | |
| U.S. Treasury Bonds, 3.5%, 2/15/2039 | | | 13,220,000 | | | | 16,560,116 | |
| U.S. Treasury Bonds, 4.5%, 8/15/2039 | | | 4,987,000 | | | | 7,092,644 | |
| U.S. Treasury Bonds, 2.875%, 5/15/2043 | | | 132,488,000 | | | | 151,900,597 | |
| U.S. Treasury Bonds, 2.5%, 2/15/2045 | | | 5,313,000 | | | | 5,716,871 | |
| U.S. Treasury Bonds, 3%, 11/15/2045 | | | 215,000 | | | | 253,608 | |
| U.S. Treasury Bonds, 2.875%, 11/15/2046 | | | 44,148,000 | | | | 51,084,065 | |
| U.S. Treasury Bonds, 3%, 2/15/2048 | | | 38,202,000 | | | | 45,357,414 | |
| U.S. Treasury Notes, 3.125%, 5/15/2021 | | | 22,007,000 | | | | 22,492,701 | |
29
Portfolio of Investments – continued
| | | | | | | | |
| | |
| Issuer | | Shares/Par | | | Value ($) | |
| Bonds - continued | | | | | | | | |
| U.S. Treasury Obligations - continued | | | | | | | | |
| U.S. Treasury Notes, 1.75%, 11/30/2021 | | $ | 195,770,000 | | | $ | 196,205,894 | |
| U.S. Treasury Notes, 1.75%, 9/30/2022 | | | 160,226,000 | | | | 161,020,872 | |
| U.S. Treasury Notes, 1.625%, 5/31/2023 | | | 97,252,200 | | | | 97,442,145 | |
| U.S. Treasury Notes, 2.5%, 8/15/2023 | | | 59,187,000 | | | | 61,242,361 | |
| U.S. Treasury Notes, 2.25%, 8/15/2027 | | | 27,750,000 | | | | 29,010,674 | |
| U.S. Treasury Notes, 2.375%, 5/15/2029 | | | 41,500,000 | | | | 44,071,054 | |
| | | | | | | | |
| | | | | | | $ | 903,844,472 | |
| Utilities - Electric Power - 0.8% | | | | | | | | |
| Berkshire Hathaway Energy Co., 3.75%, 11/15/2023 | | $ | 3,550,000 | | | $ | 3,769,311 | |
| Duke Energy Corp., 2.65%, 9/01/2026 | | | 1,590,000 | | | | 1,600,264 | |
| Duke Energy Progress LLC, 3.45%, 3/15/2029 | | | 7,168,000 | | | | 7,736,502 | |
| Enel Finance International N.V., 2.65%, 9/10/2024 | | | 6,544,000 | | | | 6,551,021 | |
| Enel Finance International N.V., 4.875%, 6/14/2029 (n) | | | 6,677,000 | | | | 7,577,428 | |
| Enel Finance International N.V., 4.75%, 5/25/2047 (n) | | | 2,194,000 | | | | 2,481,303 | |
| Evergy, Inc., 2.9%, 9/15/2029 | | | 5,701,000 | | | | 5,672,170 | |
| Exelon Corp., 3.4%, 4/15/2026 | | | 9,718,000 | | | | 10,157,713 | |
| Jersey Central Power & Light Co., 4.3%, 1/15/2026 (z) | | | 4,533,000 | | | | 4,962,250 | |
| Oncor Electric Delivery Co. LLC, 5.75%, 3/15/2029 | | | 4,555,000 | | | | 5,764,503 | |
| PPL Capital Funding, Inc., 5%, 3/15/2044 | | | 1,773,000 | | | | 2,069,762 | |
| PPL Corp., 3.4%, 6/01/2023 | | | 4,920,000 | | | | 5,063,692 | |
| | | | | | | | |
| | | | | | | $ | 63,405,919 | |
| Total Bonds (Identified Cost, $2,875,465,852) | | | | | | $ | 3,021,182,719 | |
| | |
| Convertible Preferred Stocks - 0.4% | | | | | | | | |
| Medical Equipment - 0.1% | | | | | | | | |
| Danaher Corp., 4.75% | | | 3,976 | | | $ | 4,532,839 | |
| |
| Utilities - Electric Power - 0.3% | | | | | |
| CenterPoint Energy, Inc., 7% | | | 493,865 | | | $ | 25,809,385 | |
Total Convertible Preferred Stocks
(Identified Cost, $29,229,447) | | | $ | 30,342,224 | |
| | |
| Preferred Stocks - 0.1% | | | | | | | | |
| Electronics - 0.1% | | | | | | | | |
| Samsung Electronics Co. Ltd. (Identified Cost, $4,975,034) | | | 148,696 | | | $ | 4,886,943 | |
| | |
| Investment Companies (h) - 1.3% | | | | | | | | |
| Money Market Funds - 1.3% | | | | | | | | |
MFS Institutional Money Market Portfolio, 2.09% (v)
(Identified Cost, $100,752,515) | | | 100,761,592 | | | $ | 100,761,592 | |
| | |
| Other Assets, Less Liabilities - (1.6)% | | | | | | | (121,073,836 | ) |
| Net Assets - 100.0% | | | | | | $ | 7,548,258,796 | |
30
Portfolio of Investments – continued
| (a) | Non-income producing security. |
| (h) | An affiliated issuer, which may be considered one in which the fund owns 5% or more of the outstanding voting securities, or a company which is under common control. At period end, the aggregate values of the fund’s investments in affiliated issuers and in unaffiliated issuers were $100,761,592 and $7,568,571,040, respectively. |
| (i) | Interest only security for which the fund receives interest on notional principal (Par amount). Par amount shown is the notional principal and does not reflect the cost of the security. |
| (n) | Securities exempt from registration under Rule 144A of the Securities Act of 1933. These securities may be sold in the ordinary course of business in transactions exempt from registration, normally to qualified institutional buyers. At period end, the aggregate value of these securities was $218,326,333, representing 2.9% of net assets. |
| (v) | Affiliated issuer that is available only to investment companies managed by MFS. The rate quoted for the MFS Institutional Money Market Portfolio is the annualizedseven-day yield of the fund at period end. |
| (z) | Restricted securities are not registered under the Securities Act of 1933 and are subject to legal restrictions on resale. These securities generally may be resold in transactions exempt from registration or to the public if the securities are subsequently registered. Disposal of these securities may involve time-consuming negotiations and prompt sale at an acceptable price may be difficult. The fund holds the following restricted securities: |
| | | | | | | | | | |
| Restricted Securities | | Acquisition
Date | | Cost | | | Value | |
| Alcon, Inc., 3.8%, 9/23/2049 | | 9/16/19 | | | $946,313 | | | | $989,602 | |
| ALM Loan Funding, CLO, 2013-7R2A, “A1B2”, FLR, 3.703% (LIBOR - 3mo. + 1.4%), 10/15/2027 | | 9/21/18 | | | 13,305,000 | | | | 13,213,408 | |
| ALM V Ltd.,2012-5A, “A2R3”, FLR, 3.55% (LIBOR - 3mo. + 1.25%), 10/18/2027 | | 10/04/17 | | | 10,945,000 | | | | 10,846,966 | |
| AREIT CRE Trust, 2018-CRE2, “A”, FLR, 3.008% | | | | | | | | | | |
| (LIBOR - 1mo. + 0.98%), 11/14/2035 | | 10/30/18 | | | 11,150,738 | | | | 11,150,738 | |
| Bancorp Commercial Mortgage Trust, 2018-CRE4, “A”, FLR, 2.927% (LIBOR - 1mo. + 0.9%), 9/15/2035 | | 9/17/18-9/11/19 | | | 9,445,915 | | | | 9,443,294 | |
| Bancorp Commercial Mortgage Trust, 2019-CRE6, FLR, 3.566% (LIBOR - 1mo. + 1.3%), 9/15/2036 | | 9/13/19 | | | 10,512,013 | | | | 10,518,583 | |
| Bayview Financial Revolving Mortgage Loan Trust, FLR, 3.643% (LIBOR - 1mo. + 1.6%), 12/28/2040 | | 3/01/06 | | | 2,746,867 | | | | 2,725,035 | |
| BDS Ltd.,2019-FL4, “A”, FLR, 3.128% (LIBOR - 1mo. + 1.10%), 8/15/2036 | | 7/17/19 | | | 7,275,500 | | | | 7,277,777 | |
| BDS Ltd., FLR, 3.425% (LIBOR - 1mo. + 1.4%), 8/15/2035 | | 7/25/18-10/29/18 | | | 12,615,251 | | | | 12,606,327 | |
| Chesapeake Funding II LLC,2016-2A, “A2”, FLR, 3.027% (LIBOR - 1mo. + 1%), 6/15/2028 | | 6/14/16 | | | 699,098 | | | | 699,636 | |
| Dryden Senior Loan Fund,2013-26A, “AR”, CLO, FLR, 3.203% (LIBOR - 3mo. + 0.9%), 4/15/2029 | | 4/09/18 | | | 8,528,000 | | | | 8,510,458 | |
| Expedia Group, Inc., 3.25%, 2/15/2030 | | 9/11/19 | | | 6,656,149 | | | | 6,688,870 | |
| Jersey Central Power & Light Co., 4.3%, 1/15/2026 | | 2/05/19 | | | 4,594,225 | | | | 4,962,250 | |
| Liberty Mutual Group, Inc., 4.85%, 8/01/2044 | | 5/25/16-11/01/16 | | | 3,985,573 | | | | 4,013,706 | |
| Magnetite XVI Ltd.,2015-16A, “AR”, FLR, 3.1% (LIBOR - 3mo. + 0.8%), 1/18/2028 | | 1/18/18 | | | 5,000,000 | | | | 4,997,455 | |
31
Portfolio of Investments – continued
| | | | | | | | | | |
| Restricted Securities - continued | | Acquisition
Date | | Cost | | | Value | |
| Navistar Financial Dealer Note Master Owner Trust II,2018-1, “A”, FLR, 2.648% (LIBOR - 1mo. + 0.63%), 9/25/2023 | | 9/17/18 | | | $7,710,000 | | | | $7,719,498 | |
| Neuberger Berman CLO Ltd., FLR, 3.103% (LIBOR - 3mo. + 0.8%), 1/15/2028 | | 9/19/18 | | | 5,708,187 | | | | 5,715,159 | |
| Total Restricted Securities | | | | | | | | | $122,078,762 | |
| % of Net assets | | | | | | | | | 1.6% | |
The following abbreviations are used in this report and are defined:
| ADR | | American Depositary Receipt |
| CLO | | Collateralized Loan Obligation |
| FLR | | Floating Rate. Interest rate resets periodically based on the parenthetically disclosed reference rate plus a spread (if any). Theperiod-end rate reported may not be the current rate. All reference rates are USD unless otherwise noted. |
| LIBOR | | London Interbank Offered Rate |
| REIT | | Real Estate Investment Trust |
See Notes to Financial Statements
32
Financial Statements
STATEMENT OF ASSETS AND LIABILITIES
At 9/30/19
This statement represents your fund’s balance sheet, which details the assets and liabilities comprising the total value of the fund.
| | | | |
| Assets | | | | |
Investments in unaffiliated issuers, at value (identified cost, $5,782,002,300) | | | $7,568,571,040 | |
Investments in affiliated issuers, at value (identified cost, $100,752,515) | | | 100,761,592 | |
Receivables for | | | | |
Investments sold | | | 3,749,163 | |
Investments sold on an extended settlement basis | | | 102,343,432 | |
Fund shares sold | | | 4,068,628 | |
Interest and dividends | | | 24,514,123 | |
Other assets | | | 3,078 | |
Total assets | | | $7,804,011,056 | |
| |
| Liabilities | | | | |
Payable to custodian | | | $989,571 | |
Payables for | | | | |
Distributions | | | 1,054,065 | |
Investments purchased | | | 16,048,066 | |
Investments purchased on an extended settlement basis | | | 223,814,815 | |
Fund shares reacquired | | | 10,072,863 | |
Payable to affiliates | | | | |
Investment adviser | | | 287,872 | |
Administrative services fee | | | 6,315 | |
Shareholder servicing costs | | | 2,980,223 | |
Distribution and service fees | | | 167,317 | |
Program manager fees | | | 192 | |
Payable for independent Trustees’ compensation | | | 9,737 | |
Accrued expenses and other liabilities | | | 321,224 | |
Total liabilities | | | $255,752,260 | |
Net assets | | | $7,548,258,796 | |
| |
| Net assets consist of | | | | |
Paid-in capital | | | $5,698,926,770 | |
Total distributable earnings (loss) | | | 1,849,332,026 | |
Net assets | | | $7,548,258,796 | |
Shares of beneficial interest outstanding | | | 388,481,797 | |
33
Statement of Assets and Liabilities – continued
| | | | | | | | | | | | |
| | | |
| | | Net assets | | | Shares
outstanding | | | Net asset value
per share (a) | |
Class A | | | $4,666,094,628 | | | | 240,315,504 | | | | $19.42 | |
Class B | | | 124,981,868 | | | | 6,424,789 | | | | 19.45 | |
Class C | | | 602,144,539 | | | | 30,793,303 | | | | 19.55 | |
Class I | | | 663,463,785 | | | | 34,179,002 | | | | 19.41 | |
Class R1 | | | 10,507,955 | | | | 541,876 | | | | 19.39 | |
Class R2 | | | 165,892,671 | | | | 8,515,395 | | | | 19.48 | |
Class R3 | | | 290,210,362 | | | | 14,934,897 | | | | 19.43 | |
Class R4 | | | 236,164,886 | | | | 12,149,593 | | | | 19.44 | |
Class R6 | | | 753,665,545 | | | | 38,816,681 | | | | 19.42 | |
Class 529A | | | 26,157,720 | | | | 1,351,103 | | | | 19.36 | |
Class 529B | | | 981,059 | | | | 50,441 | | | | 19.45 | |
Class 529C | | | 7,993,778 | | | | 409,213 | | | | 19.53 | |
| (a) | Maximum offering price per share was equal to the net asset value per share for all share classes, except for Classes A and 529A, for which the maximum offering prices per share were $20.60 [100 / 94.25 x $19.42] and $20.54 [100 / 94.25 x $19.36], respectively. On sales of $50,000 or more, the maximum offering prices of Class A and Class 529A shares are reduced. A contingent deferred sales charge may be imposed on redemptions of Class A, Class B, Class C, Class 529B, and Class 529C shares. Redemption price per share was equal to the net asset value per share for Classes I, R1, R2, R3, R4, R6, and 529A. |
See Notes to Financial Statements
34
Financial Statements
STATEMENT OF OPERATIONS
Year ended 9/30/19
This statement describes how much your fund earned in investment income and accrued in expenses. It also describes any gains and/or losses generated by fund operations.
| | | | |
| Net investment income (loss) | | | | |
Income | | | | |
Dividends | | | $121,360,506 | |
Interest | | | 93,127,465 | |
Dividends from affiliated issuers | | | 2,831,985 | |
Income on securities loaned | | | 543,741 | |
Other | | | 206,824 | |
Foreign taxes withheld | | | (1,705,437 | ) |
Total investment income | | | $216,365,084 | |
Expenses | | | | |
Management fee | | | $25,826,301 | |
Distribution and service fees | | | 20,981,471 | |
Shareholder servicing costs | | | 7,199,356 | |
Program manager fees | | | 17,161 | |
Administrative services fee | | | 579,866 | |
Independent Trustees’ compensation | | | 100,274 | |
Custodian fee | | | 303,026 | |
Shareholder communications | | | 286,140 | |
Audit and tax fees | | | 85,242 | |
Legal fees | | | 71,883 | |
Miscellaneous | | | 353,295 | |
Total expenses | | | $55,804,015 | |
Fees paid indirectly | | | (17,506 | ) |
Reduction of expenses by distributor | | | (338,528 | ) |
Net expenses | | | $55,447,981 | |
Net investment income (loss) | | | $160,917,103 | |
| |
| Realized and unrealized gain (loss) | | | | |
Realized gain (loss) (identified cost basis) | | | | |
Unaffiliated issuers | | | $134,482,965 | |
Affiliated issuers | | | 4,853 | |
Foreign currency | | | 10,148 | |
Net realized gain (loss) | | | $134,497,966 | |
Change in unrealized appreciation or depreciation | | | | |
Unaffiliated issuers | | | $171,792,487 | |
Affiliated issuers | | | 4,731 | |
Translation of assets and liabilities in foreign currencies | | | (28,954 | ) |
Net unrealized gain (loss) | | | $171,768,264 | |
Net realized and unrealized gain (loss) | | | $306,266,230 | |
Change in net assets from operations | | | $467,183,333 | |
See Notes to Financial Statements
35
Financial Statements
STATEMENTS OF CHANGES IN NET ASSETS
These statements describe the increases and/or decreases in net assets resulting from operations, any distributions, and any shareholder transactions.
| | | | | | | | |
| | | Year ended | |
| | | 9/30/19 | | | 9/30/18 | |
| Change in net assets | | | | | | |
| | |
| From operations | | | | | | | | |
Net investment income (loss) | | | $160,917,103 | | | | $149,491,081 | |
Net realized gain (loss) | | | 134,497,966 | | | | 263,860,144 | |
Net unrealized gain (loss) | | | 171,768,264 | | | | (53,775,441 | ) |
Change in net assets from operations | | | $467,183,333 | | | | $359,575,784 | |
Total distributions to shareholders | | | $(338,868,704 | ) | | | $(442,732,304 | ) |
Change in net assets from fund share transactions | | | $(378,374,769 | ) | | | $(20,898,018 | ) |
Total change in net assets | | | $(250,060,140 | ) | | | $(104,054,538 | ) |
| | |
| Net assets | | | | | | | | |
At beginning of period | | | 7,798,318,936 | | | | 7,902,373,474 | |
At end of period | | | $7,548,258,796 | | | | $7,798,318,936 | |
See Notes to Financial Statements
36
Financial Statements
FINANCIAL HIGHLIGHTS
The financial highlights table is intended to help you understand the fund’s financial performance for the past 5 years. Certain information reflects financial results for a single fund share. The total returns in the table represent the rate that an investor would have earned (or lost) on an investment in the fund share class (assuming reinvestment of all distributions) held for the entire period.
| | | | | | | | | | | | | | | | | | | | |
| Class A | | Year ended | |
| | | | | |
| | | 9/30/19 | | | 9/30/18 | | | 9/30/17 | | | 9/30/16 | | | 9/30/15 | |
Net asset value, beginning of period | | | $19.09 | | | | $19.29 | | | | $18.19 | | | | $17.38 | | | | $18.16 | |
| | |
| Income (loss) from investment operations | | | | | | | | | |
Net investment income (loss) (d) | | | $0.41 | | | | $0.37 | | | | $0.38 | (c) | | | $0.35 | | | | $0.43 | |
Net realized and unrealized gain (loss) | | | 0.78 | | | | 0.53 | | | | 1.36 | | | | 1.41 | | | | (0.40 | ) |
Total from investment operations | | | $1.19 | | | | $0.90 | | | | $1.74 | | | | $1.76 | | | | $0.03 | |
| | |
| Less distributions declared to shareholders | | | | | | | | | |
From net investment income | | | $(0.39 | ) | | | $(0.38 | ) | | | $(0.39 | ) | | | $(0.44 | ) | | | $(0.38 | ) |
From net realized gain | | | (0.47 | ) | | | (0.72 | ) | | | (0.25 | ) | | | (0.51 | ) | | | (0.43 | ) |
Total distributions declared to shareholders | | | $(0.86 | ) | | | $(1.10 | ) | | | $(0.64 | ) | | | $(0.95 | ) | | | $(0.81 | ) |
Net asset value, end of period (x) | | | $19.42 | | | | $19.09 | | | | $19.29 | | | | $18.19 | | | | $17.38 | |
Total return (%) (r)(s)(t)(x) | | | 6.73 | | | | 4.71 | | | | 9.78 | (c) | | | 10.50 | | | | 0.01 | |
| | |
Ratios (%) (to average net assets)
and Supplemental data: | | | | | | | | | |
Expenses before expense reductions (f) | | | 0.73 | | | | 0.73 | | | | 0.74 | (c) | | | 0.74 | | | | 0.74 | |
Expenses after expense reductions (f) | | | 0.72 | | | | 0.72 | | | | 0.73 | (c) | | | 0.73 | | | | 0.74 | |
Net investment income (loss) | | | 2.20 | | | | 1.95 | | | | 2.03 | (c) | | | 1.99 | | | | 2.35 | |
Portfolio turnover | | | 39 | | | | 33 | | | | 38 | | | | 32 | | | | 45 | |
Net assets at end of period (000 omitted) | | | $4,666,095 | | | | $4,838,039 | | | | $4,779,558 | | | | $4,733,090 | | | | $4,492,707 | |
See Notes to Financial Statements
37
Financial Highlights – continued
| | | | | | | | | | | | | | | | | | | | |
| Class B | | Year ended | |
| | | | | |
| | | 9/30/19 | | | 9/30/18 | | | 9/30/17 | | | 9/30/16 | | | 9/30/15 | |
Net asset value, beginning of period | | | $19.12 | | | | $19.31 | | | | $18.21 | | | | $17.40 | | | | $18.18 | |
| | |
| Income (loss) from investment operations | | | | | | | | | |
Net investment income (loss) (d) | | | $0.27 | | | | $0.23 | | | | $0.24 | (c) | | | $0.22 | | | | $0.29 | |
Net realized and unrealized gain (loss) | | | 0.77 | | | | 0.53 | | | | 1.36 | | | | 1.40 | | | | (0.41 | ) |
Total from investment operations | | | $1.04 | | | | $0.76 | | | | $1.60 | | | | $1.62 | | | | $(0.12 | ) |
| | |
| Less distributions declared to shareholders | | | | | | | | | |
From net investment income | | | $(0.24 | ) | | | $(0.23 | ) | | | $(0.25 | ) | | | $(0.30 | ) | | | $(0.23 | ) |
From net realized gain | | | (0.47 | ) | | | (0.72 | ) | | | (0.25 | ) | | | (0.51 | ) | | | (0.43 | ) |
Total distributions declared to shareholders | | | $(0.71 | ) | | | $(0.95 | ) | | | $(0.50 | ) | | | $(0.81 | ) | | | $(0.66 | ) |
Net asset value, end of period (x) | | | $19.45 | | | | $19.12 | | | | $19.31 | | | | $18.21 | | | | $17.40 | |
Total return (%) (r)(s)(t)(x) | | | 5.90 | | | | 3.94 | | | | 8.94 | (c) | | | 9.66 | | | | (0.75 | ) |
| | |
Ratios (%) (to average net assets)
and Supplemental data: | | | | | | | | | |
Expenses before expense reductions (f) | | | 1.48 | | | | 1.48 | | | | 1.49 | (c) | | | 1.49 | | | | 1.49 | |
Expenses after expense reductions (f) | | | 1.47 | | | | 1.48 | | | | 1.48 | (c) | | | 1.49 | | | | 1.49 | |
Net investment income (loss) | | | 1.44 | | | | 1.19 | | | | 1.29 | (c) | | | 1.24 | | | | 1.56 | |
Portfolio turnover | | | 39 | | | | 33 | | | | 38 | | | | 32 | | | | 45 | |
Net assets at end of period (000 omitted) | | | $124,982 | | | | $152,200 | | | | $184,889 | | | | $205,806 | | | | $208,889 | |
| |
| Class C | | Year ended | |
| | | | | |
| | | 9/30/19 | | | 9/30/18 | | | 9/30/17 | | | 9/30/16 | | | 9/30/15 | |
Net asset value, beginning of period | | | $19.21 | | | | $19.40 | | | | $18.29 | | | | $17.48 | | | | $18.25 | |
| | |
| Income (loss) from investment operations | | | | | | | | | |
Net investment income (loss) (d) | | | $0.27 | | | | $0.23 | | | | $0.24 | (c) | | | $0.22 | | | | $0.29 | |
Net realized and unrealized gain (loss) | | | 0.78 | | | | 0.53 | | | | 1.37 | | | | 1.41 | | | | (0.39 | ) |
Total from investment operations | | | $1.05 | | | | $0.76 | | | | $1.61 | | | | $1.63 | | | | $(0.10 | ) |
| | |
| Less distributions declared to shareholders | | | | | | | | | |
From net investment income | | | $(0.24 | ) | | | $(0.23 | ) | | | $(0.25 | ) | | | $(0.31 | ) | | | $(0.24 | ) |
From net realized gain | | | (0.47 | ) | | | (0.72 | ) | | | (0.25 | ) | | | (0.51 | ) | | | (0.43 | ) |
Total distributions declared to shareholders | | | $(0.71 | ) | | | $(0.95 | ) | | | $(0.50 | ) | | | $(0.82 | ) | | | $(0.67 | ) |
Net asset value, end of period (x) | | | $19.55 | | | | $19.21 | | | | $19.40 | | | | $18.29 | | | | $17.48 | |
Total return (%) (r)(s)(t)(x) | | | 5.92 | | | | 3.91 | | | | 8.95 | (c) | | | 9.62 | | | | (0.68 | ) |
| | |
Ratios (%) (to average net assets)
and Supplemental data: | | | | | | | | | |
Expenses before expense reductions (f) | | | 1.48 | | | | 1.48 | | | | 1.49 | (c) | | | 1.49 | | | | 1.49 | |
Expenses after expense reductions (f) | | | 1.48 | | | | 1.48 | | | | 1.49 | (c) | | | 1.49 | | | | 1.49 | |
Net investment income (loss) | | | 1.44 | | | | 1.18 | | | | 1.28 | (c) | | | 1.24 | | | | 1.60 | |
Portfolio turnover | | | 39 | | | | 33 | | | | 38 | | | | 32 | | | | 45 | |
Net assets at end of period (000 omitted) | | | $602,145 | | | | $695,252 | | | | $1,054,574 | | | | $1,102,670 | | | | $965,137 | |
See Notes to Financial Statements
38
Financial Highlights – continued
| | | | | | | | | | | | | | | | | | | | |
| Class I | | Year ended | |
| | | | | |
| | | 9/30/19 | | | 9/30/18 | | | 9/30/17 | | | 9/30/16 | | | 9/30/15 | |
Net asset value, beginning of period | | | $19.08 | | | | $19.28 | | | | $18.18 | | | | $17.38 | | | | $18.15 | |
| | |
| Income (loss) from investment operations | | | | | | | | | |
Net investment income (loss) (d) | | | $0.45 | | | | $0.42 | | | | $0.39 | (c) | | | $0.39 | | | | $0.47 | |
Net realized and unrealized gain (loss) | | | 0.78 | | | | 0.52 | | | | 1.40 | | | | 1.40 | | | | (0.39 | ) |
Total from investment operations | | | $1.23 | | | | $0.94 | | | | $1.79 | | | | $1.79 | | | | $0.08 | |
| | |
| Less distributions declared to shareholders | | | | | | | | | |
From net investment income | | | $(0.43 | ) | | | $(0.42 | ) | | | $(0.44 | ) | | | $(0.48 | ) | | | $(0.42 | ) |
From net realized gain | | | (0.47 | ) | | | (0.72 | ) | | | (0.25 | ) | | | (0.51 | ) | | | (0.43 | ) |
Total distributions declared to shareholders | | | $(0.90 | ) | | | $(1.14 | ) | | | $(0.69 | ) | | | $(0.99 | ) | | | $(0.85 | ) |
Net asset value, end of period (x) | | | $19.41 | | | | $19.08 | | | | $19.28 | | | | $18.18 | | | | $17.38 | |
Total return (%) (r)(s)(t)(x) | | | 6.99 | | | | 4.97 | | | | 10.06 | (c) | | | 10.71 | | | | 0.31 | |
| | |
Ratios (%) (to average net assets)
and Supplemental data: | | | | | | | | | |
Expenses before expense reductions (f) | | | 0.48 | | | | 0.48 | | | | 0.49 | (c) | | | 0.49 | | | | 0.49 | |
Expenses after expense reductions (f) | | | N/A | | | | N/A | | | | N/A | | | | N/A | | | | 0.49 | |
Net investment income (loss) | | | 2.44 | | | | 2.20 | | | | 2.10 | (c) | | | 2.22 | | | | 2.56 | |
Portfolio turnover | | | 39 | | | | 33 | | | | 38 | | | | 32 | | | | 45 | |
Net assets at end of period (000 omitted) | | | $663,464 | | | | $662,998 | | | | $593,250 | | | | $329,965 | | | | $213,734 | |
| |
| Class R1 | | Year ended | |
| | | | | |
| | | 9/30/19 | | | 9/30/18 | | | 9/30/17 | | | 9/30/16 | | | 9/30/15 | |
Net asset value, beginning of period | | | $19.06 | | | | $19.26 | | | | $18.17 | | | | $17.36 | | | | $18.14 | |
| | |
| Income (loss) from investment operations | | | | | | | | | |
Net investment income (loss) (d) | | | $0.27 | | | | $0.23 | | | | $0.24 | (c) | | | $0.22 | | | | $0.28 | |
Net realized and unrealized gain (loss) | | | 0.77 | | | | 0.52 | | | | 1.35 | | | | 1.41 | | | | (0.39 | ) |
Total from investment operations | | | $1.04 | | | | $0.75 | | | | $1.59 | | | | $1.63 | | | | $(0.11 | ) |
| | |
| Less distributions declared to shareholders | | | | | | | | | |
From net investment income | | | $(0.24 | ) | | | $(0.23 | ) | | | $(0.25 | ) | | | $(0.31 | ) | | | $(0.24 | ) |
From net realized gain | | | (0.47 | ) | | | (0.72 | ) | | | (0.25 | ) | | | (0.51 | ) | | | (0.43 | ) |
Total distributions declared to shareholders | | | $(0.71 | ) | | | $(0.95 | ) | | | $(0.50 | ) | | | $(0.82 | ) | | | $(0.67 | ) |
Net asset value, end of period (x) | | | $19.39 | | | | $19.06 | | | | $19.26 | | | | $18.17 | | | | $17.36 | |
Total return (%) (r)(s)(t)(x) | | | 5.93 | | | | 3.93 | | | | 8.90 | (c) | | | 9.68 | | | | (0.75 | ) |
| | |
Ratios (%) (to average net assets)
and Supplemental data: | | | | | | | | | |
Expenses before expense reductions (f) | | | 1.48 | | | | 1.48 | | | | 1.49 | (c) | | | 1.49 | | | | 1.49 | |
Expenses after expense reductions (f) | | | N/A | | | | N/A | | | | N/A | | | | N/A | | | | 1.49 | |
Net investment income (loss) | | | 1.44 | | | | 1.19 | | | | 1.28 | (c) | | | 1.24 | | | | 1.56 | |
Portfolio turnover | | | 39 | | | | 33 | | | | 38 | | | | 32 | | | | 45 | |
Net assets at end of period (000 omitted) | | | $10,508 | | | | $12,068 | | | | $12,517 | | | | $14,031 | | | | $13,964 | |
See Notes to Financial Statements
39
Financial Highlights – continued
| | | | | | | | | | | | | | | | | | | | |
| Class R2 | | Year ended | |
| | | | | |
| | | 9/30/19 | | | 9/30/18 | | | 9/30/17 | | | 9/30/16 | | | 9/30/15 | |
Net asset value, beginning of period | | | $19.15 | | | | $19.34 | | | | $18.24 | | | | $17.43 | | | | $18.21 | |
| | |
| Income (loss) from investment operations | | | | | | | | | |
Net investment income (loss) (d) | | | $0.36 | | | | $0.32 | | | | $0.33 | (c) | | | $0.31 | | | | $0.39 | |
Net realized and unrealized gain (loss) | | | 0.78 | | | | 0.54 | | | | 1.36 | | | | 1.40 | | | | (0.41 | ) |
Total from investment operations | | | $1.14 | | | | $0.86 | | | | $1.69 | | | | $1.71 | | | | $(0.02 | ) |
| | | |
| Less distributions declared to shareholders | | | | | | | | | | | | | |
From net investment income | | | $(0.34 | ) | | | $(0.33 | ) | | | $(0.34 | ) | | | $(0.39 | ) | | | $(0.33 | ) |
From net realized gain | | | (0.47 | ) | | | (0.72 | ) | | | (0.25 | ) | | | (0.51 | ) | | | (0.43 | ) |
Total distributions declared to shareholders | | | $(0.81 | ) | | | $(1.05 | ) | | | $(0.59 | ) | | | $(0.90 | ) | | | $(0.76 | ) |
Net asset value, end of period (x) | | | $19.48 | | | | $19.15 | | | | $19.34 | | | | $18.24 | | | | $17.43 | |
Total return (%) (r)(s)(t)(x) | | | 6.43 | | | | 4.48 | | | | 9.48 | (c) | | | 10.19 | | | | (0.24 | ) |
| | | |
Ratios (%) (to average net assets)
and Supplemental data: | | | | | | | | | | | | | |
Expenses before expense reductions (f) | | | 0.98 | | | | 0.98 | | | | 0.99 | (c) | | | 0.99 | | | | 0.99 | |
Expenses after expense reductions (f) | | | 0.98 | | | | 0.98 | | | | 0.99 | (c) | | | N/A | | | | 0.99 | |
Net investment income (loss) | | | 1.94 | | | | 1.69 | | | | 1.76 | (c) | | | 1.73 | | | | 2.11 | |
Portfolio turnover | | | 39 | | | | 33 | | | | 38 | | | | 32 | | | | 45 | |
Net assets at end of period (000 omitted) | | | $165,893 | | | | $194,859 | | | | $229,263 | | | | $205,848 | | | | $168,609 | |
| |
| Class R3 | | Year ended | |
| | | | | |
| | | 9/30/19 | | | 9/30/18 | | | 9/30/17 | | | 9/30/16 | | | 9/30/15 | |
Net asset value, beginning of period | | | $19.10 | | | | $19.30 | | | | $18.20 | | | | $17.39 | | | | $18.17 | |
| | | |
| Income (loss) from investment operations | | | | | | | | | | | | | |
Net investment income (loss) (d) | | | $0.41 | | | | $0.37 | | | | $0.37 | (c) | | | $0.35 | | | | $0.43 | |
Net realized and unrealized gain (loss) | | | 0.78 | | | | 0.53 | | | | 1.37 | | | | 1.41 | | | | (0.41 | ) |
Total from investment operations | | | $1.19 | | | | $0.90 | | | | $1.74 | | | | $1.76 | | | | $0.02 | |
| | | |
| Less distributions declared to shareholders | | | | | | | | | | | | | |
From net investment income | | | $(0.39 | ) | | | $(0.38 | ) | | | $(0.39 | ) | | | $(0.44 | ) | | | $(0.37 | ) |
From net realized gain | | | (0.47 | ) | | | (0.72 | ) | | | (0.25 | ) | | | (0.51 | ) | | | (0.43 | ) |
Total distributions declared to shareholders | | | $(0.86 | ) | | | $(1.10 | ) | | | $(0.64 | ) | | | $(0.95 | ) | | | $(0.80 | ) |
Net asset value, end of period (x) | | | $19.43 | | | | $19.10 | | | | $19.30 | | | | $18.20 | | | | $17.39 | |
Total return (%) (r)(s)(t)(x) | | | 6.71 | | | | 4.70 | | | | 9.77 | (c) | | | 10.48 | | | | 0.00 | |
| | | |
Ratios (%) (to average net assets)
and Supplemental data: | | | | | | | | | | | | | |
Expenses before expense reductions (f) | | | 0.73 | | | | 0.73 | | | | 0.74 | (c) | | | 0.74 | | | | 0.74 | |
Expenses after expense reductions (f) | | | N/A | | | | 0.73 | | | | N/A | | | | N/A | | | | 0.74 | |
Net investment income (loss) | | | 2.19 | | | | 1.94 | | | | 2.01 | (c) | | | 1.99 | | | | 2.35 | |
Portfolio turnover | | | 39 | | | | 33 | | | | 38 | | | | 32 | | | | 45 | |
Net assets at end of period (000 omitted) | | | $290,210 | | | | $325,625 | | | | $331,072 | | | | $297,313 | | | | $251,635 | |
See Notes to Financial Statements
40
Financial Highlights – continued
| | | | | | | | | | | | | | | | | | | | |
| Class R4 | | Year ended | |
| | | | | |
| | | 9/30/19 | | | 9/30/18 | | | 9/30/17 | | | 9/30/16 | | | 9/30/15 | |
Net asset value, beginning of period | | | $19.11 | | | | $19.31 | | | | $18.20 | | | | $17.40 | | | | $18.17 | |
| | | |
| Income (loss) from investment operations | | | | | | | | | | | | | |
Net investment income (loss) (d) | | | $0.46 | | | | $0.42 | | | | $0.43 | (c) | | | $0.39 | | | | $0.48 | |
Net realized and unrealized gain (loss) | | | 0.77 | | | | 0.52 | | | | 1.37 | | | | 1.40 | | | | (0.40 | ) |
Total from investment operations | | | $1.23 | | | | $0.94 | | | | $1.80 | | | | $1.79 | | | | $0.08 | |
| | | |
| Less distributions declared to shareholders | | | | | | | | | | | | | |
From net investment income | | | $(0.43 | ) | | | $(0.42 | ) | | | $(0.44 | ) | | | $(0.48 | ) | | | $(0.42 | ) |
From net realized gain | | | (0.47 | ) | | | (0.72 | ) | | | (0.25 | ) | | | (0.51 | ) | | | (0.43 | ) |
Total distributions declared to shareholders | | | $(0.90 | ) | | | $(1.14 | ) | | | $(0.69 | ) | | | $(0.99 | ) | | | $(0.85 | ) |
Net asset value, end of period (x) | | | $19.44 | | | | $19.11 | | | | $19.31 | | | | $18.20 | | | | $17.40 | |
Total return (%) (r)(s)(t)(x) | | | 6.98 | | | | 4.96 | | | | 10.10 | (c) | | | 10.69 | | | | 0.31 | |
| | | |
Ratios (%) (to average net assets)
and Supplemental data: | | | | | | | | | | | | | |
Expenses before expense reductions (f) | | | 0.48 | | | | 0.48 | | | | 0.49 | (c) | | | 0.49 | | | | 0.49 | |
Expenses after expense reductions (f) | | | N/A | | | | N/A | | | | N/A | | | | N/A | | | | 0.49 | |
Net investment income (loss) | | | 2.45 | | | | 2.19 | | | | 2.29 | (c) | | | 2.23 | | | | 2.62 | |
Portfolio turnover | | | 39 | | | | 33 | | | | 38 | | | | 32 | | | | 45 | |
Net assets at end of period (000 omitted) | | | $236,165 | | | | $249,073 | | | | $291,662 | | | | $297,677 | | | | $287,976 | |
| |
| Class R6 | | Year ended | |
| | | | | |
| | | 9/30/19 | | | 9/30/18 | | | 9/30/17 | | | 9/30/16 | | | 9/30/15 | |
Net asset value, beginning of period | | | $19.09 | | | | $19.29 | | | | $18.19 | | | | $17.38 | | | | $18.16 | |
| | | |
| Income (loss) from investment operations | | | | | | | | | | | | | |
Net investment income (loss) (d) | | | $0.47 | | | | $0.44 | | | | $0.42 | (c) | | | $0.41 | | | | $0.55 | |
Net realized and unrealized gain (loss) | | | 0.78 | | | | 0.52 | | | | 1.38 | | | | 1.41 | | | | (0.47 | ) |
Total from investment operations | | | $1.25 | | | | $0.96 | | | | $1.80 | | | | $1.82 | | | | $0.08 | |
| | | |
| Less distributions declared to shareholders | | | | | | | | | | | | | |
From net investment income | | | $(0.45 | ) | | | $(0.44 | ) | | | $(0.45 | ) | | | $(0.50 | ) | | | $(0.43 | ) |
From net realized gain | | | (0.47 | ) | | | (0.72 | ) | | | (0.25 | ) | | | (0.51 | ) | | | (0.43 | ) |
Total distributions declared to shareholders | | | $(0.92 | ) | | | $(1.16 | ) | | | $(0.70 | ) | | | $(1.01 | ) | | | $(0.86 | ) |
Net asset value, end of period (x) | | | $19.42 | | | | $19.09 | | | | $19.29 | | | | $18.19 | | | | $17.38 | |
Total return (%) (r)(s)(t)(x) | | | 7.07 | | | | 5.06 | | | | 10.14 | (c) | | | 10.86 | | | | 0.34 | |
| | | |
Ratios (%) (to average net assets)
and Supplemental data: | | | | | | | | | | | | | |
Expenses before expense reductions (f) | | | 0.40 | | | | 0.40 | | | | 0.40 | (c) | | | 0.41 | | | | 0.41 | |
Expenses after expense reductions (f) | | | N/A | | | | N/A | | | | N/A | | | | N/A | | | | 0.41 | |
Net investment income (loss) | | | 2.52 | | | | 2.29 | | | | 2.27 | (c) | | | 2.31 | | | | 3.02 | |
Portfolio turnover | | | 39 | | | | 33 | | | | 38 | | | | 32 | | | | 45 | |
Net assets at end of period (000 omitted) | | | $753,666 | | | | $632,943 | | | | $389,609 | | | | $169,348 | | | | $67,900 | |
See Notes to Financial Statements
41
Financial Highlights – continued
| | | | | | | | | | | | | | | | | | | | |
| Class 529A | | Year ended | |
| | | | | |
| | | 9/30/19 | | | 9/30/18 | | | 9/30/17 | | | 9/30/16 | | | 9/30/15 | |
Net asset value, beginning of period | | | $19.03 | | | | $19.24 | | | | $18.14 | | | | $17.34 | | | | $18.12 | |
| | | |
| Income (loss) from investment operations | | | | | | | | | | | | | |
Net investment income (loss) (d) | | | $0.40 | | | | $0.36 | | | | $0.37 | (c) | | | $0.34 | | | | $0.42 | |
Net realized and unrealized gain (loss) | | | 0.78 | | | | 0.52 | | | | 1.36 | | | | 1.40 | | | | (0.40 | ) |
Total from investment operations | | | $1.18 | | | | $0.88 | | | | $1.73 | | | | $1.74 | | | | $0.02 | |
| | | |
| Less distributions declared to shareholders | | | | | | | | | | | | | |
From net investment income | | | $(0.38 | ) | | | $(0.37 | ) | | | $(0.38 | ) | | | $(0.43 | ) | | | $(0.37 | ) |
From net realized gain | | | (0.47 | ) | | | (0.72 | ) | | | (0.25 | ) | | | (0.51 | ) | | | (0.43 | ) |
Total distributions declared to shareholders | | | $(0.85 | ) | | | $(1.09 | ) | | | $(0.63 | ) | | | $(0.94 | ) | | | $(0.80 | ) |
Net asset value, end of period (x) | | | $19.36 | | | | $19.03 | | | | $19.24 | | | | $18.14 | | | | $17.34 | |
Total return (%) (r)(s)(t)(x) | | | 6.71 | | | | 4.63 | | | | 9.77 | (c) | | | 10.42 | | | | (0.03 | ) |
| | | |
Ratios (%) (to average net assets)
and Supplemental data: | | | | | | | | | | | | | |
Expenses before expense reductions (f) | | | 0.78 | | | | 0.79 | | | | 0.84 | (c) | | | 0.84 | | | | 0.84 | |
Expenses after expense reductions (f) | | | 0.76 | | | | 0.77 | | | | 0.77 | (c) | | | 0.77 | | | | 0.78 | |
Net investment income (loss) | | | 2.16 | | | | 1.91 | | | | 1.97 | (c) | | | 1.95 | | | | 2.31 | |
Portfolio turnover | | | 39 | | | | 33 | | | | 38 | | | | 32 | | | | 45 | |
Net assets at end of period (000 omitted) | | | $26,158 | | | | $24,945 | | | | $23,275 | | | | $21,204 | | | | $18,177 | |
| |
| Class 529B | | Year ended | |
| | | | | |
| | | 9/30/19 | | | 9/30/18 | | | 9/30/17 | | | 9/30/16 | | | 9/30/15 | |
Net asset value, beginning of period | | | $19.11 | | | | $19.31 | | | | $18.21 | | | | $17.40 | | | | $18.17 | |
| | | |
| Income (loss) from investment operations | | | | | | | | | | | | | |
Net investment income (loss) (d) | | | $0.30 | | | | $0.22 | | | | $0.23 | (c) | | | $0.21 | | | | $0.27 | |
Net realized and unrealized gain (loss) | | | 0.79 | | | | 0.52 | | | | 1.36 | | | | 1.41 | | | | (0.38 | ) |
Total from investment operations | | | $1.09 | | | | $0.74 | | | | $1.59 | | | | $1.62 | | | | $(0.11 | ) |
| | | |
| Less distributions declared to shareholders | | | | | | | | | | | | | |
From net investment income | | | $(0.28 | ) | | | $(0.22 | ) | | | $(0.24 | ) | | | $(0.30 | ) | | | $(0.23 | ) |
From net realized gain | | | (0.47 | ) | | | (0.72 | ) | | | (0.25 | ) | | | (0.51 | ) | | | (0.43 | ) |
Total distributions declared to shareholders | | | $(0.75 | ) | | | $(0.94 | ) | | | $(0.49 | ) | | | $(0.81 | ) | | | $(0.66 | ) |
Net asset value, end of period (x) | | | $19.45 | | | | $19.11 | | | | $19.31 | | | | $18.21 | | | | $17.40 | |
Total return (%) (r)(s)(t)(x) | | | 6.16 | | | | 3.86 | | | | 8.88 | (c) | | | 9.60 | | | | (0.75 | ) |
| | | |
Ratios (%) (to average net assets)
and Supplemental data: | | | | | | | | | | | | | |
Expenses before expense reductions (f) | | | 1.29 | | | | 1.54 | | | | 1.59 | (c) | | | 1.59 | | | | 1.59 | |
Expenses after expense reductions (f) | | | N/A | | | | 1.53 | | | | 1.53 | (c) | | | 1.54 | | | | 1.54 | |
Net investment income (loss) | | | 1.63 | | | | 1.14 | | | | 1.23 | (c) | | | 1.19 | | | | 1.50 | |
Portfolio turnover | | | 39 | | | | 33 | | | | 38 | | | | 32 | | | | 45 | |
Net assets at end of period (000 omitted) | | | $981 | | | | $1,228 | | | | $1,483 | | | | $1,580 | | | | $1,721 | |
See Notes to Financial Statements
42
Financial Highlights – continued
| | | | | | | | | | | | | | | | | | | | |
| Class 529C | | Year ended | |
| | | | | |
| | | 9/30/19 | | | 9/30/18 | | | 9/30/17 | | | 9/30/16 | | | 9/30/15 | |
Net asset value, beginning of period | | | $19.20 | | | | $19.39 | | | | $18.28 | | | | $17.47 | | | | $18.25 | |
| | | | |
| Income (loss) from investment operations | | | | | | | | | | | | | | | | | |
Net investment income (loss) (d) | | | $0.26 | | | | $0.22 | | | | $0.23 | (c) | | | $0.21 | | | | $0.28 | |
Net realized and unrealized gain (loss) | | | 0.77 | | | | 0.53 | | | | 1.37 | | | | 1.41 | | | | (0.40 | ) |
Total from investment operations | | | $1.03 | | | | $0.75 | | | | $1.60 | | | | $1.62 | | | | $(0.12 | ) |
| | | | |
| Less distributions declared to shareholders | | | | | | | | | | | | | | | | | |
From net investment income | | | $(0.23 | ) | | | $(0.22 | ) | | | $(0.24 | ) | | | $(0.30 | ) | | | $(0.23 | ) |
From net realized gain | | | (0.47 | ) | | | (0.72 | ) | | | (0.25 | ) | | | (0.51 | ) | | | (0.43 | ) |
Total distributions declared to shareholders | | | $(0.70 | ) | | | $(0.94 | ) | | | $(0.49 | ) | | | $(0.81 | ) | | | $(0.66 | ) |
Net asset value, end of period (x) | | | $19.53 | | | | $19.20 | | | | $19.39 | | | | $18.28 | | | | $17.47 | |
Total return (%) (r)(s)(t)(x) | | | 5.82 | | | | 3.89 | | | | 8.91 | (c) | | | 9.57 | | | | (0.79 | ) |
| | | | |
Ratios (%) (to average net assets)
and Supplemental data: | | | | | | | | | | | | | | | | | |
Expenses before expense reductions (f) | | | 1.53 | | | | 1.54 | | | | 1.59 | (c) | | | 1.59 | | | | 1.59 | |
Expenses after expense reductions (f) | | | 1.53 | | | | 1.53 | | | | 1.53 | (c) | | | 1.54 | | | | 1.54 | |
Net investment income (loss) | | | 1.39 | | | | 1.14 | | | | 1.22 | (c) | | | 1.18 | | | | 1.55 | |
Portfolio turnover | | | 39 | | | | 33 | | | | 38 | | | | 32 | | | | 45 | |
Net assets at end of period (000 omitted) | | | $7,994 | | | | $9,088 | | | | $11,223 | | | | $10,428 | | | | $8,222 | |
| (c) | Amount reflects aone-time reimbursement of expenses by the custodian (or former custodian) without which net investment income and performance would be lower and expenses would be higher. |
| (d) | Per share data is based on average shares outstanding. |
| (f) | Ratios do not reflect reductions from fees paid indirectly, if applicable. |
| (r) | Certain expenses have been reduced without which performance would have been lower. |
| (s) | From time to time the fund may receive proceeds from litigation settlements, without which performance would be lower. |
| (t) | Total returns do not include any applicable sales charges. |
| (x) | The net asset values and total returns have been calculated on net assets which include adjustments made in accordance with U.S. generally accepted accounting principles required at period end for financial reporting purposes. |
See Notes to Financial Statements
43
NOTES TO FINANCIAL STATEMENTS
(1) Business and Organization
MFS Total Return Fund (the fund) is a diversified series of MFS Series Trust V (the trust). The trust is organized as a Massachusetts business trust and is registered under the Investment Company Act of 1940, as amended, as anopen-end management investment company.
The fund is an investment company and accordingly follows the investment company accounting and reporting guidance of the Financial Accounting Standards Board (FASB) Accounting Standards Codification Topic 946 Financial Services – Investment Companies.
(2) Significant Accounting Policies
General – The preparation of financial statements in conformity with U.S. generally accepted accounting principles requires management to make estimates and assumptions that affect the reported amounts of assets and liabilities, and disclosure of contingent assets and liabilities at the date of the financial statements and the reported amounts of increases and decreases in net assets from operations during the reporting period. Actual results could differ from those estimates. In the preparation of these financial statements, management has evaluated subsequent events occurring after the date of the fund’s Statement of Assets and Liabilities through the date that the financial statements were issued.
In March 2017, the FASB issued Accounting Standards Update2017-08, Receivables – Nonrefundable Fees and Other Costs (Subtopic310-20) – Premium Amortization on Purchased Callable Debt Securities (“ASU2017-08”). For entities that purchased callable debt securities at a premium, ASU2017-08 requires that the premium be amortized to the earliest call date. ASU2017-08 will be effective for fiscal years beginning after December 15, 2018, and interim periods within those fiscal years. Management has evaluated the potential impacts of ASU2017-08 and believes that adoption of ASU2017-08 will not have a material effect on the fund’s overall financial position or its overall results of operations.
Balance Sheet Offsetting – The fund’s accounting policy with respect to balance sheet offsetting is that, absent an event of default by the counterparty or a termination of the agreement, the International Swaps and Derivatives Association (ISDA) Master Agreement, or similar agreement, does not result in an offset of reported amounts of financial assets and financial liabilities in the Statement of Assets and Liabilities across transactions between the fund and the applicable counterparty. The fund’s right to setoff may be restricted or prohibited by the bankruptcy or insolvency laws of the particular jurisdiction to which a specific master netting agreement counterparty is subject. Balance sheet offsetting disclosures, to the extent applicable to the fund, have been included in the fund’s Significant Accounting Policies note under the captions for each of the fund’sin-scope financial instruments and transactions.
Investment Valuations – Equity securities, including restricted equity securities, are generally valued at the last sale or official closing price on their primary market or exchange as provided by a third-party pricing service. Equity securities, for which there were no sales reported that day, are generally valued at the last quoted daily bid
44
Notes to Financial Statements – continued
quotation on their primary market or exchange as provided by a third-party pricing service. Debt instruments and floating rate loans, including restricted debt instruments, are generally valued at an evaluated or composite bid as provided by a third-party pricing service. Short-term instruments with a maturity at issuance of 60 days or less may be valued at amortized cost, which approximates market value.Open-end investment companies are generally valued at net asset value per share. Securities and other assets generally valued on the basis of information from a third-party pricing service may also be valued at a broker/dealer bid quotation. In determining values, third-party pricing services can utilize both transaction data and market information such as yield, quality, coupon rate, maturity, type of issue, trading characteristics, and other market data. The values of foreign securities and other assets and liabilities expressed in foreign currencies are converted to U.S. dollars using the mean of bid and asked prices for rates provided by a third-party pricing service.
The Board of Trustees has delegated primary responsibility for determining or causing to be determined the value of the fund’s investments (including any fair valuation) to the adviser pursuant to valuation policies and procedures approved by the Board. If the adviser determines that reliable market quotations are not readily available, investments are valued at fair value as determined in good faith by the adviser in accordance with such procedures under the oversight of the Board of Trustees. Under the fund’s valuation policies and procedures, market quotations are not considered to be readily available for most types of debt instruments and floating rate loans and many types of derivatives. These investments are generally valued at fair value based on information from third-party pricing services. In addition, investments may be valued at fair value if the adviser determines that an investment’s value has been materially affected by events occurring after the close of the exchange or market on which the investment is principally traded (such as foreign exchange or market) and prior to the determination of the fund’s net asset value, or after the halt of trading of a specific security where trading does not resume prior to the close of the exchange or market on which the security is principally traded. Events that occur after foreign markets close (such as developments in foreign markets and significant movements in the U.S. markets) and prior to the determination of the fund’s net asset value may be deemed to have a material effect on the value of securities traded in foreign markets. Accordingly, the fund’s foreign equity securities may often be valued at fair value. The adviser generally relies on third-party pricing services or other information (such as the correlation with price movements of similar securities in the same or other markets; the type, cost and investment characteristics of the security; the business and financial condition of the issuer; and trading and other market data) to assist in determining whether to fair value and at what value to fair value an investment. The value of an investment for purposes of calculating the fund’s net asset value can differ depending on the source and method used to determine value. When fair valuation is used, the value of an investment used to determine the fund’s net asset value may differ from quoted or published prices for the same investment. There can be no assurance that the fund could obtain the fair value assigned to an investment if it were to sell the investment at the same time at which the fund determines its net asset value per share.
Various inputs are used in determining the value of the fund’s assets or liabilities. These inputs are categorized into three broad levels. In certain cases, the inputs used to
45
Notes to Financial Statements – continued
measure fair value may fall into different levels of the fair value hierarchy. In such cases, an investment’s level within the fair value hierarchy is based on the lowest level of input that is significant to the fair value measurement. The fund’s assessment of the significance of a particular input to the fair value measurement in its entirety requires judgment, and considers factors specific to the investment. Level 1 includes unadjusted quoted prices in active markets for identical assets or liabilities. Level 2 includes other significant observable market-based inputs (including quoted prices for similar securities, interest rates, prepayment speed, and credit risk). Level 3 includes unobservable inputs, which may include the adviser’s own assumptions in determining the fair value of investments. The following is a summary of the levels used as of September 30, 2019 in valuing the fund’s assets or liabilities:
| | | | | | | | | | | | | | | | |
| | | | |
| Financial Instruments | | Level 1 | | | Level 2 | | | Level 3 | | | Total | |
| Equity Securities: | | | | | | | | | | | | | | | | |
United States | | | $4,140,770,939 | | | | $— | | | | $— | | | | $4,140,770,939 | |
Switzerland | | | 104,162,599 | | | | — | | | | — | | | | 104,162,599 | |
United Kingdom | | | 102,302,821 | | | | — | | | | — | | | | 102,302,821 | |
Japan | | | — | | | | 43,269,280 | | | | — | | | | 43,269,280 | |
France | | | 36,789,229 | | | | — | | | | — | | | | 36,789,229 | |
Canada | | | 34,986,581 | | | | — | | | | — | | | | 34,986,581 | |
Taiwan | | | 30,722,257 | | | | — | | | | — | | | | 30,722,257 | |
Italy | | | 23,839,800 | | | | — | | | | — | | | | 23,839,800 | |
Germany | | | 16,038,017 | | | | — | | | | — | | | | 16,038,017 | |
Other Countries | | | 6,512,391 | | | | 7,994,407 | | | | — | | | | 14,506,798 | |
| U.S. Treasury Bonds & U.S. Government Agency & Equivalents | | | — | | | | 905,709,666 | | | | — | | | | 905,709,666 | |
| Non-U.S. Sovereign Debt | | | — | | | | 10,281,205 | | | | — | | | | 10,281,205 | |
| Municipal Bonds | | | — | | | | 20,227,609 | �� | | | — | | | | 20,227,609 | |
| U.S. Corporate Bonds | | | — | | | | 701,274,975 | | | | — | | | | 701,274,975 | |
| Residential Mortgage-Backed Securities | | | — | | | | 949,428,380 | | | | — | | | | 949,428,380 | |
| Commercial Mortgage-Backed Securities | | | — | | | | 199,683,690 | | | | — | | | | 199,683,690 | |
| Asset-Backed Securities (including CDOs) | | | — | | | | 120,625,337 | | | | — | | | | 120,625,337 | |
| Foreign Bonds | | | — | | | | 113,951,857 | | | | — | | | | 113,951,857 | |
| Mutual Funds | | | 100,761,592 | | | | — | | | | — | | | | 100,761,592 | |
| Total | | | $4,596,886,226 | | | | $3,072,446,406 | | | | $— | | | | $7,669,332,632 | |
For further information regarding security characteristics, see the Portfolio of Investments.
Foreign Currency Translation– Purchases and sales of foreign investments, income, and expenses are converted into U.S. dollars based upon currency exchange rates prevailing on the respective dates of such transactions or on the reporting date for foreign denominated receivables and payables. Gains and losses attributable to foreign currency exchange rates on sales of securities are recorded for financial statement purposes as net realized gains and losses on investments. Gains and losses attributable to foreign exchange rate movements on receivables, payables, income and expenses are recorded for financial statement purposes as foreign currency transaction gains and losses. That portion of both realized and unrealized gains and losses on investments that results from fluctuations in foreign currency exchange rates is not separately disclosed.
46
Notes to Financial Statements – continued
Security Loans– Under its Securities Lending Agency Agreement with the fund, JPMorgan Chase and Co., as lending agent, loans the securities of the fund to certain qualified institutions (the “Borrowers”) approved by the fund. Security loans can be terminated at the discretion of either the lending agent or the fund and the related securities must be returned within the earlier of the standard trade settlement period for such securities or within three business days. The loans are collateralized by cash and/or U.S. Treasury and federal agency obligations in an amount typically at least equal to the market value of the securities loaned. On loans collateralized by cash, the cash collateral is invested in a money market fund. The market value of the loaned securities is determined at the close of business of the fund and any additional required collateral is delivered to the fund on the next business day. The lending agent provides the fund with indemnification against Borrower default. In the event of Borrower default, the lending agent will, for the benefit of the fund, either purchase securities identical to those loaned or, when such purchase is commercially impracticable, pay the fund the market value of the loaned securities. In return, the lending agent assumes the fund’s rights to the related collateral. If the collateral value is less than the cost to purchase identical securities, the lending agent is responsible for the shortfall, but only to the extent that such shortfall is not due to a decline in collateral value resulting from collateral reinvestment for which the fund bears the risk of loss. A portion of the income generated upon investment of the collateral is remitted to the Borrowers, and the remainder is allocated between the fund and the lending agent. On loans collateralized by U.S. Treasury and/or federal agency obligations, a fee is received from the Borrower, and is allocated between the fund and the lending agent. Income from securities lending is separately reported in the Statement of Operations. The dividend and interest income earned on the securities loaned is accounted for in the same manner as other dividend and interest income. At September 30, 2019, there were no securities on loan or collateral outstanding.
TBA Dollar Roll Transactions– The fund enters into TBA dollar roll transactions in which the fund sells TBA mortgage-backed securities to financial institutions and simultaneously agrees to repurchase similar (same issuer, type and coupon) securities at a later date at an agreed-upon price. During the period between the sale and repurchase, the fund will not be entitled to receive interest and principal payments on the securities sold. The fund accounts for dollar roll transactions as purchases and sales and realizes gains and losses on these transactions. TBA dollar roll transactions involve the risk that the market value of the securities that the fund is required to purchase may decline below the agreed upon repurchase price of those securities.
Indemnifications– Under the fund’s organizational documents, its officers and Trustees may be indemnified against certain liabilities and expenses arising out of the performance of their duties to the fund. Additionally, in the normal course of business, the fund enters into agreements with service providers that may contain indemnification clauses. The fund’s maximum exposure under these agreements is unknown as this would involve future claims that may be made against the fund that have not yet occurred.
Investment Transactions and Income– Investment transactions are recorded on the trade date. Interest income is recorded on the accrual basis. All premium and discount is amortized or accreted for financial statement purposes in accordance with U.S.
47
Notes to Financial Statements – continued
generally accepted accounting principles. Some securities may be purchased on a “when-issued” or “forward delivery” basis, which means that the securities will be delivered to the fund at a future date, usually beyond customary settlement time. Dividends received in cash are recorded on theex-dividend date. Certain dividends from foreign securities will be recorded when the fund is informed of the dividend if such information is obtained subsequent to theex-dividend date. Dividend and interest payments received in additional securities are recorded on theex-dividend orex-interest date in an amount equal to the value of the security on such date.
The fund may receive proceeds from litigation settlements. Any proceeds received from litigation involving portfolio holdings are reflected in the Statement of Operations in realized gain/loss if the security has been disposed of by the fund or in unrealized gain/loss if the security is still held by the fund. Any other proceeds from litigation not related to portfolio holdings are reflected as other income in the Statement of Operations.
The fund invests a significant portion of its assets in asset-backed and/ormortgage-backed securities. For these securities, the value of the debt instrument also depends on the credit quality and adequacy of the underlying assets or collateral as well as whether there is a security interest in the underlying assets or collateral. Enforcing rights, if any, against the underlying assets or collateral may be difficult. U.S. Government securities not supported as to the payment of principal or interest by the U.S. Treasury, such as those issued by Fannie Mae, Freddie Mac, and the Federal Home Loan Banks, are subject to greater credit risk than are U.S. Government securities supported by the U.S. Treasury, such as those issued by Ginnie Mae.
The fund purchased or sold debt securities on a when-issued or delayed delivery basis, or in a “To Be Announced” (TBA) or “forward commitment” transaction with delivery or payment to occur at a later date beyond the normal settlement period. When the fund sells securities on a when-issued, delayed delivery, or forward commitment basis, the fund typically owns or has the right to acquire securities equivalent in kind and amount to the delivered securities. At the time a fund enters into a commitment to purchase or sell a security, the transaction is recorded and the value of the security acquired or sold is reflected in the fund’s net asset value. The price of such security and the date that the security will be delivered and paid for are fixed at the time the transaction is negotiated. The value of the security may vary with market fluctuations. TBA securities resulting from these transactions are included in the Portfolio of Investments. TBA purchase commitments and TBA sale commitments are held at carrying amount, which approximates fair value and are categorized as level 2 within the fair value hierarchy. No interest accrues to the fund until payment takes place. At the time that a fund enters into this type of transaction, the fund is required to have sufficient cash and/or liquid securities to cover its commitments. Losses may arise due to changes in the value of the underlying securities prior to settlement date or if the counterparty does not perform under the contract’s terms, or if the issuer does not issue the securities due to political, economic or other factors.
To mitigate the counterparty credit risk on TBA securities and other types of forward settling mortgage-backed securities, the fund whenever possible enters into a Master Securities Forward Transaction Agreement (“MSFTA”) on a bilateral basis with each of the counterparties with whom it undertakes a significant volume of transactions. The
48
Notes to Financial Statements – continued
MSFTA gives each party to the agreement the right to terminate all transactions traded under such agreement if there is a specified deterioration in the credit quality of the other party. Upon an event of default or a termination of the MSFTA, thenon-defaulting party has the right to close out all transactions traded under such agreement and to net amounts owed under each transaction to one net amount payable by one party to the other. This right to close out and net payments across all transactions traded under the MSFTA could result in a reduction of the fund’s credit risk to such counterparty equal to any amounts payable by the fund under the applicable transactions, if any.
For mortgage-backed securities traded under a MSFTA, the collateral and margining requirements are contract specific. Collateral amounts across all transactions traded under such agreement are netted and an amount is posted from one party to the other to collateralize such obligations. Cash that has been pledged to cover the fund’s collateral or margin obligations under a MSFTA, if any, will be reported separately on the Statement of Assets and Liabilities as restricted cash. Securities pledged as collateral or margin for the same purpose, if any, are noted in the Portfolio of Investments.
Fees Paid Indirectly– The fund’s custody fee may be reduced by a credit earned under an arrangement that measures the value of U.S. dollars deposited with the custodian by the fund. The amount of the credit, for the year ended September 30, 2019, is shown as a reduction of total expenses in the Statement of Operations.
Tax Matters and Distributions– The fund intends to qualify as a regulated investment company, as defined under Subchapter M of the Internal Revenue Code, and to distribute all of its taxable income, including realized capital gains. As a result, no provision for federal income tax is required. The fund’s federal tax returns, when filed, will remain subject to examination by the Internal Revenue Service for a three year period. Management has analyzed the fund’s tax positions taken on federal and state tax returns for all open tax years and does not believe that there are any uncertain tax positions that require recognition of a tax liability. Foreign taxes, if any, have been accrued by the fund in the accompanying financial statements in accordance with the applicable foreign tax law. Foreign income taxes may be withheld by certain countries in which the fund invests. Additionally, capital gains realized by the fund on securities issued in or by certain foreign countries may be subject to capital gains tax imposed by those countries.
Distributions to shareholders are recorded on theex-dividend date. Income and capital gain distributions are determined in accordance with income tax regulations, which may differ from U.S. generally accepted accounting principles. Certain capital accounts in the financial statements are periodically adjusted for permanent differences in order to reflect their tax character. These adjustments have no impact on net assets or net asset value per share. Temporary differences which arise from recognizing certain items of income, expense, gain or loss in different periods for financial statement and tax purposes will reverse at some time in the future.
Book/tax differences primarily relate to amortization and accretion of debt securities, wash sale loss deferrals, treating a portion of the proceeds from redemptions as a distribution for tax purposes, and partnership adjustments.
49
Notes to Financial Statements – continued
The tax character of distributions declared to shareholders for the last two fiscal years is as follows:
| | | | | | | | |
| | |
| | | Year ended
9/30/19 | | | Year ended
9/30/18 | |
| Ordinary income (including any short-term capital gains) | | | $151,457,015 | | | | $176,137,023 | |
| Long-term capital gains | | | 187,411,689 | | | | 266,595,281 | |
| | |
| Total distributions | | | $338,868,704 | | | | $442,732,304 | |
The federal tax cost and the tax basis components of distributable earnings were as follows:
| | | | |
| |
| As of 9/30/19 | | | |
| |
| Cost of investments | | | $5,930,170,716 | |
| Gross appreciation | | | 1,822,142,975 | |
| |
| Gross depreciation | | | (82,981,059 | ) |
| Net unrealized appreciation (depreciation) | | | $1,739,161,916 | |
| |
| Undistributed ordinary income | | | 25,133,701 | |
| Undistributed long-term capital gain | | | 100,038,052 | |
| Other temporary differences | | | (15,001,643 | ) |
Multiple Classes of Shares of Beneficial Interest– The fund offers multiple classes of shares, which differ in their respective distribution, service, and program manager fees. The fund’s income, realized and unrealized gain (loss), and common expenses are allocated to shareholders based on the daily net assets of each class. Dividends are declared separately for each class. Differences in per share dividend rates are generally due to differences in separate class expenses. Class B and Class 529B shares will convert to Class A and Class 529A shares, respectively, approximately eight years after purchase. Class C and Class 529C shares will convert to Class A and Class 529A shares, respectively, approximately ten years after purchase. The fund’s distributions declared to shareholders as reported in the Statements of Changes in Net Assets are presented by class as follows:
| | | | | | | | |
| | |
| | | Year
ended
9/30/19 | | | Year
ended
9/30/18 | |
| Class A | | | $210,257,354 | | | | $270,943,070 | |
| Class B | | | 5,370,954 | | | | 8,525,060 | |
| Class C | | | 24,601,179 | | | | 48,451,142 | |
| Class I | | | 31,083,162 | | | | 36,680,946 | |
| Class R1 | | | 419,199 | | | | 612,265 | |
| Class R2 | | | 7,849,093 | | | | 11,722,893 | |
| Class R3 | | | 14,302,727 | | | | 18,515,402 | |
| Class R4 | | | 11,580,802 | | | | 16,439,081 | |
| Class R6 | | | 31,913,119 | | | | 28,909,721 | |
| Class 529A | | | 1,126,162 | | | | 1,332,569 | |
| Class 529B | | | 43,150 | | | | 68,530 | |
| Class 529C | | | 321,803 | | | | 531,625 | |
| Total | | | $338,868,704 | | | | $442,732,304 | |
50
Notes to Financial Statements – continued
(3) Transactions with Affiliates
Investment Adviser– The fund has an investment advisory agreement with MFS to provide overall investment management and related administrative services and facilities to the fund. The management fee is computed daily and paid monthly at the following annual rates based on the fund’s average daily net assets:
| | | | |
| Up to $6.3 billion | | | 0.35 | % |
| In excess of $6.3 billion | | | 0.34 | % |
The management fee incurred for the year ended September 30, 2019 was equivalent to an annual effective rate of 0.35% of the fund’s average daily net assets.
Distributor– MFS Fund Distributors, Inc. (MFD), a wholly-owned subsidiary of MFS, as distributor, received $630,909 and $8,885 for the year ended September 30, 2019, as its portion of the initial sales charge on sales of Class A and Class 529A shares of the fund, respectively.
The Board of Trustees has adopted a distribution plan for certain share classes pursuant to Rule12b-1 of the Investment Company Act of 1940.
The fund’s distribution plan provides that the fund will pay MFD for services provided by MFD and financial intermediaries in connection with the distribution and servicing of certain share classes. One component of the plan is a distribution fee paid to MFD and another component of the plan is a service fee paid to MFD. MFD may subsequently pay all, or a portion, of the distribution and/or service fees to financial intermediaries.
Distribution Plan Fee Table:
| | | | | | | | | | | | | | | | | | | | |
| | | | | |
| | | Distribution
Fee Rate (d) | | | Service
Fee Rate (d) | | | Total
Distribution
Plan (d) | | | Annual
Effective
Rate (e) | | | Distribution
and Service
Fee | |
| Class A | | | — | | | | 0.25% | | | | 0.25% | | | | 0.24% | | | | $11,433,107 | |
| Class B | | | 0.75% | | | | 0.25% | | | | 1.00% | | | | 1.00% | | | | 1,354,679 | |
| Class C | | | 0.75% | | | | 0.25% | | | | 1.00% | | | | 1.00% | | | | 6,301,672 | |
| Class R1 | | | 0.75% | | | | 0.25% | | | | 1.00% | | | | 1.00% | | | | 108,801 | |
| Class R2 | | | 0.25% | | | | 0.25% | | | | 0.50% | | | | 0.50% | | | | 881,983 | |
| Class R3 | | | — | | | | 0.25% | | | | 0.25% | | | | 0.25% | | | | 748,495 | |
| Class 529A | | | — | | | | 0.25% | | | | 0.25% | | | | 0.24% | | | | 62,653 | |
| Class 529B | | | 0.75% | | | | 0.25% | | | | 1.00% | | | | 0.76% | | | | 8,014 | |
| Class 529C | | | 0.75% | | | | 0.25% | | | | 1.00% | | | | 1.00% | | | | 82,067 | |
| Total Distribution and Service Fees | | | | | | | | | | | | $20,981,471 | |
| (d) | In accordance with the distribution plan for certain classes, the fund pays distribution and/or service fees equal to these annual percentage rates of each class’s average daily net assets. The distribution and service fee rates disclosed by class represent the current rates in effect at the end of the reporting period. Any rate changes, if applicable, are detailed below. |
| (e) | The annual effective rates represent actual fees incurred under the distribution plan for the year ended September 30, 2019 based on each class’s average daily net assets. MFD has voluntarily agreed to rebate a portion of each class’s 0.25% service fee attributable to accounts for which MFD retains the 0.25% service fee except for accounts attributable to MFS or its affiliates’ seed money. For the year ended September 30, 2019, this rebate amounted to $327,858, $3,287, $3,556, $34, $3,703, and $90 for Class A, Class B, Class C, Class R2, Class 529A, and Class 529C, respectively, and is included in the reduction of total expenses in the Statement of Operations. For the period from June 1, 2019 through September 30, 2019, |
51
Notes to Financial Statements – continued
| | the 0.75% distribution fee was not imposed for Class 529B shares due to the sales charge limitations contained in Financial Industry Regulatory Authority (“FINRA”) Rule 2341. |
Certain Class A shares are subject to a contingent deferred sales charge (CDSC) in the event of a shareholder redemption within 18 months of purchase. Class B and Class 529B shares are subject to a CDSC in the event of a shareholder redemption within six years of purchase. Class C and Class 529C shares are subject to a CDSC in the event of a shareholder redemption within 12 months of purchase. All contingent deferred sales charges are paid to MFD and during the year ended September 30, 2019, were as follows:
| | | | |
| |
| | | Amount | |
| Class A | | | $18,793 | |
| Class B | | | 153,944 | |
| Class C | | | 38,643 | |
| Class 529B | | | — | |
| Class 529C | | | 311 | |
The fund has entered into and may from time to time enter into contracts with program managers and other parties which administer the tuition programs through which an investment in the fund’s 529 share classes is made. The fund has entered into an agreement with MFD pursuant to which MFD receives an annual fee of up to 0.05% of the average daily net assets attributable to each 529 share class. The services provided by MFD, or a third party with which MFD contracts, include recordkeeping and tax reporting and account services, as well as services designed to maintain the program’s compliance with the Internal Revenue Code and other regulatory requirements. Program manager fees for the year ended September 30, 2019, were as follows:
| | | | |
| |
| | | Fee | |
| Class 529A | | | $12,531 | |
| Class 529B | | | 527 | |
| Class 529C | | | 4,103 | |
| Total Program Manager Fees | | | $17,161 | |
Shareholder Servicing Agent– MFS Service Center, Inc. (MFSC), a wholly-owned subsidiary of MFS, receives a fee from the fund for its services as shareholder servicing agent calculated as a percentage of the average daily net assets of the fund as determined periodically under the supervision of the fund’s Board of Trustees. For the year ended September 30, 2019, the fee was $997,119, which equated to 0.0135% annually of the fund’s average daily net assets. MFSC also receives payment from the fund forout-of-pocket expenses,sub-accounting and other shareholder servicing costs which may be paid to affiliated and unaffiliated service providers. Class R6 shares do not incursub-accounting fees. For the year ended September 30, 2019, theseout-of-pocket expenses,sub-accounting and other shareholder servicing costs amounted to $6,202,237.
Administrator– MFS provides certain financial, legal, shareholder communications, compliance, and other administrative services to the fund. Under an administrative services agreement, the fund reimburses MFS the costs incurred to provide these services. The fund is charged an annual fixed amount of $17,500 plus a fee based on
52
Notes to Financial Statements – continued
average daily net assets. The administrative services fee incurred for the year ended September 30, 2019 was equivalent to an annual effective rate of 0.0078% of the fund’s average daily net assets.
Trustees’ and Officers’ Compensation– The fund pays compensation to independent Trustees in the form of a retainer, attendance fees, and additional compensation to Board and Committee chairpersons. The fund does not pay compensation directly to Trustees or officers of the fund who are also officers of the investment adviser, all of whom receive remuneration from MFS for their services to the fund. Certain officers and Trustees of the fund are officers or directors of MFS, MFD, and MFSC.
Prior to December 31, 2001, the fund had an unfunded defined benefit plan (“DB plan”) for independent Trustees. As of December 31, 2001, the Board took action to terminate the DB plan with respect to then-current and any future independent Trustees, such that the DB plan covers only certain of those former independent Trustees who retired on or before December 31, 2001. Effective January 1, 2002, accrued benefits under the DB plan for then-current independent Trustees who continued were credited to an unfunded retirement deferral plan (the “Retirement Deferral plan”), which was established for and exists solely with respect to these credited amounts, and is not available for other deferrals by these or other independent Trustees. Although the Retirement Deferral plan is unfunded, amounts deferred under the plan are periodically adjusted for investment experience as if they had been invested in shares of the fund. The DB plan resulted in a pension expense of $3,189 and the Retirement Deferral plan, which terminated on December 31, 2018, resulted in a net decrease in expense of $1,912. Both amounts are included in “Independent Trustees’ compensation” in the Statement of Operations for the year ended September 30, 2019. The liability for deferred retirement benefits payable to those former independent Trustees under the DB Plan amounted to $8,885 at September 30, 2019, and is included in “Payable for independent Trustees’ compensation” in the Statement of Assets and Liabilities.
Other– This fund and certain other funds managed by MFS (the funds) had entered into a service agreement (the ISO Agreement) which provided for payment of fees solely by the funds to Tarantino LLC in return for the provision of services of an Independent Senior Officer (ISO) for the funds. Frank L. Tarantino served as the ISO and was an officer of the funds and the sole member of Tarantino LLC. Effective June 30, 2019, Mr. Tarantino retired from his position as ISO for the funds, and the ISO Agreement was terminated. For the year ended September 30, 2019, the fee paid by the fund under this agreement was $11,774 and is included in “Miscellaneous” expense in the Statement of Operations. MFS had agreed to bear all expenses associated with office space, other administrative support, and supplies provided to the ISO.
The fund invests in the MFS Institutional Money Market Portfolio which is managed by MFS and seeks current income consistent with preservation of capital and liquidity. This money market fund does not pay a management fee to MFS.
The fund is permitted to engage in purchase and sale transactions with funds and accounts for which MFS serves as investment adviser orsub-adviser (“cross-trades”)
53
Notes to Financial Statements – continued
pursuant to a policy adopted by the Board of Trustees. This policy has been designed to ensure that cross-trades conducted by the fund comply with Rule17a-7 under the Investment Company Act of 1940. During the year ended September 30, 2019, the fund engaged in purchase and sale transactions pursuant to this policy, which amounted to $5,895,895 and $2,803,194, respectively. The sales transactions resulted in net realized gains (losses) of $(379,994).
The adviser has voluntarily undertaken to reimburse the fund from its own resources on a quarterly basis for the cost of investment research embedded in the cost of the fund’s securities trades. This agreement may be rescinded at any time. For the year ended September 30, 2019, this reimbursement amounted to $116,893, which is included in “Other” income in the Statement of Operations.
(4) Portfolio Securities
For the year ended September 30, 2019, purchases and sales of investments, other than short-term obligations, were as follows:
| | | | | | | | |
| | |
| | | Purchases | | | Sales | |
| U.S. Government securities | | | $1,312,309,854 | | | | $1,543,458,877 | |
| Non-U.S. Government securities | | | $1,529,318,435 | | | | $1,719,761,788 | |
(5) Shares of Beneficial Interest
The fund’s Declaration of Trust permits the Trustees to issue an unlimited number of full and fractional shares of beneficial interest. Transactions in fund shares were as follows:
| | | | | | | | | | | | | | | | |
| | | Year ended
9/30/19 | | | Year ended
9/30/18 | |
| | | | |
| | | Shares | | | Amount | | | Shares | | | Amount | |
| Shares sold | | | | | | | | | | | | | | | | |
Class A | | | 18,618,887 | | | | $346,766,979 | | | | 36,934,125 | | | | $697,768,615 | |
Class B | | | 383,732 | | | | 7,049,344 | | | | 560,046 | | | | 10,702,413 | |
Class C | | | 3,520,077 | | | | 65,513,224 | | | | 5,157,975 | | | | 99,101,028 | |
Class I | | | 8,159,266 | | | | 151,260,489 | | | | 10,855,960 | | | | 206,798,807 | |
Class R1 | | | 46,688 | | | | 863,741 | | | | 52,099 | | | | 991,091 | |
Class R2 | | | 912,698 | | | | 16,963,457 | | | | 1,499,742 | | | | 28,745,575 | |
Class R3 | | | 2,749,285 | | | | 51,134,535 | | | | 3,371,565 | | | | 64,191,234 | |
Class R4 | | | 1,892,602 | | | | 35,338,325 | | | | 2,148,550 | | | | 40,999,361 | |
Class R6 | | | 11,795,111 | | | | 219,137,566 | | | | 19,116,127 | | | | 364,590,115 | |
Class 529A | | | 218,500 | | | | 4,019,574 | | | | 236,276 | | | | 4,447,044 | |
Class 529B | | | 4,104 | | | | 75,986 | | | | 6,481 | | | | 123,842 | |
Class 529C | | | 59,890 | | | | 1,125,876 | | | | 74,574 | | | | 1,438,389 | |
| | | 48,360,840 | | | | $899,249,096 | | | | 80,013,520 | | | | $1,519,897,514 | |
54
Notes to Financial Statements – continued
| | | | | | | | | | | | | | | | |
| | | Year ended
9/30/19 | | | Year ended
9/30/18 | |
| | | | |
| | | Shares | | | Amount | | | Shares | | | Amount | |
Shares issued to shareholders in
reinvestment of distributions | | | | | | | | | | | | | |
Class A | | | 11,177,674 | | | | $197,957,221 | | | | 13,284,909 | | | | $253,700,013 | |
Class B | | | 282,412 | | | | 4,954,540 | | | | 406,678 | | | | 7,784,564 | |
Class C | | | 1,217,147 | | | | 21,463,934 | | | | 2,269,650 | | | | 43,673,743 | |
Class I | | | 1,463,785 | | | | 25,994,476 | | | | 1,588,772 | | | | 30,328,903 | |
Class R1 | | | 23,943 | | | | 419,199 | | | | 32,082 | | | | 612,265 | |
Class R2 | | | 406,782 | | | | 7,201,287 | | | | 546,858 | | | | 10,479,873 | |
Class R3 | | | 808,503 | | | | 14,302,727 | | | | 968,403 | | | | 18,514,384 | |
Class R4 | | | 614,085 | | | | 10,901,577 | | | | 823,114 | | | | 15,744,180 | |
Class R6 | | | 1,563,855 | | | | 27,854,002 | | | | 1,286,514 | | | | 24,547,116 | |
Class 529A | | | 63,731 | | | | 1,126,036 | | | | 69,963 | | | | 1,332,410 | |
Class 529B | | | 2,448 | | | | 43,129 | | | | 3,579 | | | | 68,505 | |
Class 529C | | | 18,269 | | | | 321,619 | | | | 27,643 | | | | 531,401 | |
| | | 17,642,634 | | | | $312,539,747 | | | | 21,308,165 | | | | $407,317,357 | |
| | | | |
| Shares reacquired | | | | | | | | | | | | | | | | |
Class A | | | (42,945,544 | ) | | | $(796,147,665 | ) | | | (44,572,477 | ) | | | $(849,085,142 | ) |
Class B | | | (2,201,789 | ) | | | (40,945,250 | ) | | | (2,580,524 | ) | | | (49,311,014 | ) |
Class C | | | (10,127,414 | ) | | | (188,903,197 | ) | | | (25,600,384 | ) | | | (484,592,825 | ) |
Class I | | | (10,187,316 | ) | | | (187,800,899 | ) | | | (8,468,819 | ) | | | (161,107,713 | ) |
Class R1 | | | (161,787 | ) | | | (2,994,396 | ) | | | (100,884 | ) | | | (1,923,890 | ) |
Class R2 | | | (2,980,801 | ) | | | (55,478,364 | ) | | | (3,722,133 | ) | | | (71,072,940 | ) |
Class R3 | | | (5,669,798 | ) | | | (104,821,153 | ) | | | (4,447,381 | ) | | | (84,751,623 | ) |
Class R4 | | | (3,392,392 | ) | | | (62,287,575 | ) | | | (5,044,418 | ) | | | (95,942,177 | ) |
Class R6 | | | (7,702,565 | ) | | | (143,304,372 | ) | | | (7,443,344 | ) | | | (142,039,647 | ) |
Class 529A | | | (241,662 | ) | | | (4,477,559 | ) | | | (205,625 | ) | | | (3,910,122 | ) |
Class 529B | | | (20,369 | ) | | | (377,909 | ) | | | (22,591 | ) | | | (430,966 | ) |
Class 529C | | | (142,363 | ) | | | (2,625,273 | ) | | | (207,648 | ) | | | (3,944,830 | ) |
| | | (85,773,800 | ) | | | $(1,590,163,612 | ) | | | (102,416,228 | ) | | | $(1,948,112,889 | ) |
| | | | |
| Net change | | | | | | | | | | | | | | | | |
Class A | | | (13,148,983 | ) | | | $(251,423,465 | ) | | | 5,646,557 | | | | $102,383,486 | |
Class B | | | (1,535,645 | ) | | | (28,941,366 | ) | | | (1,613,800 | ) | | | (30,824,037 | ) |
Class C | | | (5,390,190 | ) | | | (101,926,039 | ) | | | (18,172,759 | ) | | | (341,818,054 | ) |
Class I | | | (564,265 | ) | | | (10,545,934 | ) | | | 3,975,913 | | | | 76,019,997 | |
Class R1 | | | (91,156 | ) | | | (1,711,456 | ) | | | (16,703 | ) | | | (320,534 | ) |
Class R2 | | | (1,661,321 | ) | | | (31,313,620 | ) | | | (1,675,533 | ) | | | (31,847,492 | ) |
Class R3 | | | (2,112,010 | ) | | | (39,383,891 | ) | | | (107,413 | ) | | | (2,046,005 | ) |
Class R4 | | | (885,705 | ) | | | (16,047,673 | ) | | | (2,072,754 | ) | | | (39,198,636 | ) |
Class R6 | | | 5,656,401 | | | | 103,687,196 | | | | 12,959,297 | | | | 247,097,584 | |
Class 529A | | | 40,569 | | | | 668,051 | | | | 100,614 | | | | 1,869,332 | |
Class 529B | | | (13,817 | ) | | | (258,794 | ) | | | (12,531 | ) | | | (238,619 | ) |
Class 529C | | | (64,204 | ) | | | (1,177,778 | ) | | | (105,431 | ) | | | (1,975,040 | ) |
| | | (19,770,326 | ) | | | $(378,374,769 | ) | | | (1,094,543 | ) | | | $(20,898,018 | ) |
55
Notes to Financial Statements – continued
Class T shares were not publicly available for sale during the period. Please see the fund’s prospectus for details.
Effective June 1, 2019, purchases of the fund’s Class B and Class 529B shares are closed to new and existing investors subject to certain exceptions. Please see the fund’s prospectus for details.
(6) Line of Credit
The fund and certain other funds managed by MFS participate in a $1.25 billion unsecured committed line of credit, subject to a $1 billion sublimit, provided by a syndicate of banks under a credit agreement. Borrowings may be made for temporary financing needs. Interest is charged to each fund, based on its borrowings, generally at a rate equal to the highest of one month LIBOR, the Federal Funds Effective Rate and the Overnight Bank Funding Rate, plus an agreed upon spread. A commitment fee, based on the average daily, unused portion of the committed line of credit, is allocated among the participating funds. In addition, the fund and other funds managed by MFS have established unsecured uncommitted borrowing arrangements with certain banks for temporary financing needs. Interest is charged to each fund, based on its borrowings, at rates equal to customary reference rates plus an agreed upon spread. For the year ended September 30, 2019, the fund’s commitment fee and interest expense were $43,041 and $0, respectively, and are included in “Miscellaneous” expense in the Statement of Operations.
(7) Investments in Affiliated Issuers
An affiliated issuer may be considered one in which the fund owns 5% or more of the outstanding voting securities, or a company which is under common control. For the purposes of this report, the following were affiliated issuers:
| | | | | | | | | | | | | | | | | | | | | | | | |
| | | | | | |
| Affiliated Issuers | | Beginning
Value | | | Purchases | | | Sales
Proceeds | | | Realized
Gain
(Loss) | | | Change in
Unrealized
Appreciation or
Depreciation | | | Ending
Value | |
| MFS Institutional Money Market Portfolio | | | $171,189,079 | | | | $1,180,996,127 | | | | $1,251,433,198 | | | | $4,853 | | | | $4,731 | | | | $100,761,592 | |
| | | | | | |
| Affiliated Issuers | | | | | | | | | | | | | | Dividend
Income | | | Capital Gain
Distributions | |
| MFS Institutional Money Market Portfolio | | | | | | | | | | | | $2,831,985 | | | | $— | |
56
REPORT OF INDEPENDENT REGISTERED PUBLIC ACCOUNTING FIRM
To the Board of Trustees of MFS Series Trust V and the Shareholders of MFS Total Return Fund:
Opinion on the Financial Statements and Financial Highlights
We have audited the accompanying statement of assets and liabilities of MFS Total Return Fund (the “Fund”), including the portfolio of investments, as of September 30, 2019, the related statement of operations for the year then ended, the statements of changes in net assets for each of the two years in the period then ended, the financial highlights for each of the five years in the period then ended, and the related notes. In our opinion, the financial statements and financial highlights present fairly, in all material respects, the financial position of the Fund as of September 30, 2019, and the results of its operations for the year then ended, the changes in its net assets for each of the two years in the period then ended, and the financial highlights for each of the five years in the period then ended, in conformity with accounting principles generally accepted in the United States of America.
Basis for Opinion
These financial statements and financial highlights are the responsibility of the Fund’s management. Our responsibility is to express an opinion on the Fund’s financial statements and financial highlights based on our audits. We are a public accounting firm registered with the Public Company Accounting Oversight Board (United States) (PCAOB) and are required to be independent with respect to the Fund in accordance with the U.S. federal securities laws and the applicable rules and regulations of the Securities and Exchange Commission and the PCAOB.
We conducted our audits in accordance with the standards of the PCAOB. Those standards require that we plan and perform the audit to obtain reasonable assurance about whether the financial statements and financial highlights are free of material misstatement, whether due to error or fraud. The Fund is not required to have, nor were we engaged to perform, an audit of its internal control over financial reporting. As part of our audits we are required to obtain an understanding of internal control over financial reporting but not for the purpose of expressing an opinion on the effectiveness of the Fund’s internal control over financial reporting. Accordingly, we express no such opinion.
Our audits included performing procedures to assess the risks of material misstatement of the financial statements and financial highlights, whether due to error or fraud, and performing procedures that respond to those risks. Such procedures included examining, on a test basis, evidence regarding the amounts and disclosures in the financial statements and financial highlights. Our audits also included evaluating the accounting principles used and significant estimates made by management, as well as evaluating the overall presentation of the financial statements and financial highlights. Our procedures included confirmation of securities owned as of September 30, 2019,
57
Report of Independent Registered Public Accounting Firm – continued
by correspondence with the custodian and brokers; when replies were not received from brokers, we performed other auditing procedures. We believe that our audits provide a reasonable basis for our opinion.
DELOITTE & TOUCHE LLP
Boston, Massachusetts
November 15, 2019
We have served as the auditor of one or more of the MFS investment companies since 1924.
58
TRUSTEES AND OFFICERS — IDENTIFICATION AND BACKGROUND
The Trustees and Officers of the Trust, as of November 1, 2019, are listed below, together with their principal occupations during the past five years. (Their titles may have varied during that period.) The address of each Trustee and Officer is 111 Huntington Avenue, Boston, Massachusetts 02199-7618.
| | | | | | | | | | |
Name, Age | | Position(s)
Held with Fund | | Trustee/Officer Since (h) | | Number of
MFS Funds
overseen
by the
Trustee | | Principal
Occupations During the Past Five Years | | Other Directorships
During the Past
Five Years (j) |
| INTERESTED TRUSTEES |
Robert J. Manning (k)
(age 56) | | Trustee | | February 2004 | | 133 | | Massachusetts Financial Services Company, Executive Chairman (since January 2017); Director; Chairman of the Board; Chief Executive Officer (until 2015);Co-Chief Executive Officer (2015-2016) | | N/A |
| | | | | |
Robin A. Stelmach (k) (age 58) | | Trustee | | January 2014 | | 133 | | Massachusetts Financial Services Company, Vice Chair (since January 2017); Chief Operating Officer and Executive Vice President (until January 2017) | | N/A |
| INDEPENDENT TRUSTEES |
John P. Kavanaugh (age 64) | | Trustee and Chair of Trustees | | January 2009 | | 133 | | Private investor | | N/A |
| | | | | |
Steven E. Buller (age 68) | | Trustee | | February 2014 | | 133 | | Financial Accounting Standards Advisory Council, Chairman (2014-2015); Public Company Accounting Oversight Board, Standing Advisory Group, Member (until 2014); BlackRock, Inc. (investment management), Managing Director (until 2014), BlackRock Finco UK (investment management), Director (until 2014) | | N/A |
59
Trustees and Officers – continued
| | | | | | | | | | |
Name, Age | | Position(s)
Held with Fund | | Trustee/Officer Since (h) | | Number of
MFS Funds
overseen
by the
Trustee | | Principal
Occupations During the Past Five Years | | Other Directorships
During the Past
Five Years (j) |
John A. Caroselli (age 65) | | Trustee | | March 2017 | | 133 | | JC Global Advisors, LLC (management consulting), President (since 2015); First Capital Corporation (commercial finance), Executive Vice President (until 2015) | | N/A |
| | | | | |
Maureen R. Goldfarb (age 64) | | Trustee | | January 2009 | | 133 | | Private investor | | N/A |
| | | | | |
Michael Hegarty
(age 74) | | Trustee | | December 2004 | | 133 | | Private investor | | Rouse Properties Inc., Director (until 2016); Capmark Financial Group Inc., Director (until 2015) |
| | | | | |
Peter D. Jones
(age 64) | | Trustee | | January 2019 | | 133 | | Franklin Templeton Distributors, Inc. (investment management), President (until 2015); Franklin Templeton Institutional, LLC (investment management), Chairman (until 2015) | | N/A |
| | | | | |
James W. Kilman, Jr.
(age 58) | | Trustee | | January 2019 | | 133 | | Burford Capital Limited (finance and investment management), Chief Financial Officer (since 2019); KielStrand Capital LLC (family office and merchant bank), Chief Executive Officer (since 2016); Morgan Stanley & Co. (financial services), Vice Chairman of Investment Banking,Co-Head of Diversified Financials Coverage – Financial Institutions Investment Banking Group (until 2016) | | Alpha-En Corporation, Director (since 2016) |
60
Trustees and Officers – continued
| | | | | | | | | | |
Name, Age | | Position(s)
Held with Fund | | Trustee/Officer Since (h) | | Number of
MFS Funds
overseen
by the
Trustee | | Principal
Occupations During the Past Five Years | | Other Directorships
During the Past
Five Years (j) |
Clarence Otis, Jr. (age 63) | | Trustee | | March 2017 | | 133 | | Darden Restaurants, Inc., Chief Executive Officer (until 2014) | | VF Corporation, Director; Verizon Communications, Inc., Director; The Travelers Companies, Director; Federal Reserve Bank of Atlanta, Director (until 2015) |
| | | | | |
Maryanne L. Roepke (age 63) | | Trustee | | May 2014 | | 133 | | American Century Investments (investment management), Senior Vice President and Chief Compliance Officer (until 2014) | | N/A |
| | | | | |
Laurie J. Thomsen
(age 62) | | Trustee | | March 2005 | | 133 | | Private investor | | The Travelers Companies, Director; Dycom Industries, Inc., Director (since 2015) |
| | | | | | | | |
Name, Age | | Position(s) Held
with Fund | | Trustee/Officer
Since (h) | | Number of
MFS Funds
for which
the Person
is an Officer | | Principal
Occupations During
the Past Five Years |
| OFFICERS | | | | | | | | |
Christopher R. Bohane (k)
(age 45) | | Assistant Secretary and Assistant Clerk | | July 2005 | | 133 | | Massachusetts Financial Services Company, Vice President and Assistant General Counsel |
| | | | |
Kino Clark (k) (age 51) | | Assistant Treasurer | | January 2012 | | 133 | | Massachusetts Financial Services Company, Vice President |
61
Trustees and Officers – continued
| | | | | | | | |
Name, Age | | Position(s) Held
with Fund | | Trustee/Officer
Since (h) | | Number of
MFS Funds
for which
the Person
is an Officer | | Principal
Occupations During
the Past Five Years |
John W. Clark, Jr. (k) (age 52) | | Assistant Treasurer | | April 2017 | | 133 | | Massachusetts Financial Services Company, Vice President (since March 2017); Deutsche Bank (financial services), Department Head – Treasurer’s Office (until February 2017) |
| | | | |
Thomas H. Connors (k) (age 60) | | Assistant Secretary and Assistant Clerk | | September 2012 | | 133 | | Massachusetts Financial Services Company, Vice President and Senior Counsel |
| | | | |
David L. DiLorenzo (k)
(age 51) | | President | | July 2005 | | 133 | | Massachusetts Financial Services Company, Senior Vice President |
| | | | |
Heidi W. Hardin (k) (age 52) | | Secretary and Clerk | | April 2017 | | 133 | | Massachusetts Financial Services Company, Executive Vice President and General Counsel (since March 2017); Harris Associates (investment management), General Counsel (from September 2015 to January 2017); Janus Capital Management LLC (investment management), Senior Vice President and General Counsel (until September 2015) |
| | | | |
Brian E. Langenfeld (k) (age 46) | | Assistant Secretary and Assistant Clerk | | June 2006 | | 133 | | Massachusetts Financial Services Company, Vice President and Senior Counsel |
| | | | |
Amanda S. Mooradian (k) (age 40) | | Assistant Secretary and Assistant Clerk | | September 2018 | | 133 | | Massachusetts Financial Services Company, Assistant Vice President and Counsel |
62
Trustees and Officers – continued
| | | | | | | | |
Name, Age | | Position(s) Held
with Fund | | Trustee/Officer
Since (h) | | Number of
MFS Funds
for which
the Person
is an Officer | | Principal
Occupations During
the Past Five Years |
Susan A. Pereira (k)
(age 48) | | Assistant Secretary and Assistant Clerk | | July 2005 | | 133 | | Massachusetts Financial Services Company, Vice President and Assistant General Counsel |
| | | | |
Kasey L. Phillips (k) (age 48) | | Assistant Treasurer | | September 2012 | | 133 | | Massachusetts Financial Services Company, Vice President |
| | | | |
Matthew A. Stowe (k) (age 44) | | Assistant Secretary and Assistant Clerk | | October 2014 | | 133 | | Massachusetts Financial Services Company, Vice President and Assistant General Counsel |
| | | | |
Martin J. Wolin (k) (age 52) | | Chief Compliance Officer | | July 2015 | | 133 | | Massachusetts Financial Services Company, Senior Vice President and Chief Compliance Officer (since July 2015); Mercer (financial service provider), Chief Risk and Compliance Officer, North America and Latin America (until June 2015) |
| | | | |
James O. Yost (k)
(age 59) | | Treasurer | | September 1990 | | 133 | | Massachusetts Financial Services Company, Senior Vice President |
| (h) | Date first appointed to serve as Trustee/officer of an MFS Fund. Each Trustee has served continuously since appointment unless indicated otherwise. For the period from December 15, 2004 until February 22, 2005, Mr. Manning served as Advisory Trustee. From January 2012 through December 2016, Messrs. DiLorenzo and Yost served as Treasurer and Deputy Treasurer of the Funds, respectively. |
| (j) | Directorships or trusteeships of companies required to report to the Securities and Exchange Commission (i.e., “public companies”). |
| (k) | “Interested person” of the Trust within the meaning of the Investment Company Act of 1940 (referred to as the 1940 Act), which is the principal federal law governing investment companies like the fund, as a result of a position with MFS. The address of MFS is 111 Huntington Avenue, Boston, Massachusetts 02199-7618. |
Each Trustee (other than Messrs. Jones and Kilman) has been elected by shareholders and each Trustee and Officer holds office until his or her successor is chosen and qualified or until his or her earlier death, resignation, retirement or removal. Messrs. Jones and Kilman became Trustees of the Funds on January 1, 2019. The Trust does
63
Trustees and Officers – continued
not hold annual meetings for the purpose of electing Trustees, and Trustees are not elected for fixed terms. Under the terms of the Board’s retirement policy, an Independent Trustee shall retire at the end of the calendar year in which he or she reaches the earlier of 75 years of age or 15 years of service on the Board (or, in the case of any Independent Trustee who joined the Board prior to 2015, 20 years of service on the Board).
Messrs. Buller, Hegarty, Kilman and Otis and Ms. Roepke are members of the Trust’s Audit Committee.
Each of the Interested Trustees and certain Officers hold comparable officer positions with certain affiliates of MFS.
The Statement of Additional Information for a Fund includes further information about the Trustees and is available without charge upon request by calling1-800-225-2606.
| | |
| Investment Adviser | | Custodian |
Massachusetts Financial Services Company
111 Huntington Avenue Boston, MA 02199-7618 | | JPMorgan Chase Bank, NA 4 Metrotech Center New York, NY 11245 |
| Distributor | | Independent Registered Public Accounting Firm |
MFS Fund Distributors, Inc.
111 Huntington Avenue Boston, MA 02199-7618 | | Deloitte & Touche LLP 200 Berkeley Street Boston, MA 02116 |
| Portfolio Manager(s) | | |
Nevin Chitkara Steven Gorham Joshua Marston Robert Persons Jonathan Sage Brooks Taylor | | |
64
BOARD REVIEW OF INVESTMENT ADVISORY AGREEMENT
The Investment Company Act of 1940 requires that both the full Board of Trustees and a majority of thenon-interested (“independent”) Trustees, voting separately, annually approve the continuation of the Fund’s investment advisory agreement with MFS. The Trustees consider matters bearing on the Fund and its advisory arrangements at their meetings throughout the year, including a review of performance data at each regular meeting. In addition, the independent Trustees met several times over the course of three months beginning in May and ending in July, 2019 (“contract review meetings”) for the specific purpose of considering whether to approve the continuation of the investment advisory agreement for the Fund and the other investment companies that the Board oversees (the “MFS Funds”). The independent Trustees were assisted in their evaluation of the Fund’s investment advisory agreement by independent legal counsel, from whom they received separate legal advice and with whom they met separately from MFS during various contract review meetings. The independent Trustees were also assisted in this process by the MFS Funds’ Independent Senior Officer, a senior officer appointed by and reporting to the independent Trustees.
In connection with their deliberations regarding the continuation of the investment advisory agreement, the Trustees, including the independent Trustees, considered such information and factors as they believed, in light of the legal advice furnished to them and their own business judgment, to be relevant. The investment advisory agreement for the Fund was considered separately, although the Trustees also took into account the common interests of all MFS Funds in their review. As described below, the Trustees considered the nature, quality, and extent of the various investment advisory, administrative, and shareholder services performed by MFS under the existing investment advisory agreement and other arrangements with the Fund.
In connection with their contract review meetings, the Trustees received and relied upon materials that included, among other items: (i) information provided by Broadridge Financial Solutions, Inc. (“Broadridge”), an independent third party, on the investment performance of the Fund for various time periods ended December 31, 2018 and the investment performance of a group of funds with substantially similar investment classifications/objectives (the “Broadridge performance universe”), (ii) information provided by Broadridge on the Fund’s advisory fees and other expenses and the advisory fees and other expenses of comparable funds identified by Broadridge as well as all other funds in the same investment classification/category (the “Broadridge expense group and universe”), (iii) information provided by MFS on the advisory fees of portfolios of other clients of MFS, including institutional separate accounts and other clients, (iv) information as to whether and to what extent applicable expense waivers, reimbursements or fee “breakpoints” are observed for the Fund, (v) information regarding MFS’ financial results and financial condition, including MFS’ and certain of its affiliates’ estimated profitability from services performed for the Fund and the MFS Funds as a whole, and compared to MFS’ institutional business, (vi) MFS’ views regarding the outlook for the mutual fund industry and the strategic business plans of MFS, (vii) descriptions of various functions performed by MFS for the Funds, such as compliance monitoring and portfolio trading practices, and (viii) information regarding the overall organization of MFS, including information
65
Board Review of Investment Advisory Agreement – continued
about MFS’ senior management and other personnel providing investment advisory, administrative and other services to the Fund and the other MFS Funds. The comparative performance, fee and expense information prepared and provided by Broadridge was not independently verified and the independent Trustees did not independently verify any information provided to them by MFS.
The Trustees’ conclusion as to the continuation of the investment advisory agreement was based on a comprehensive consideration of all information provided to the Trustees and not the result of any single factor. Some of the factors that figured particularly in the Trustees’ deliberations are described below, although individual Trustees may have evaluated the information presented differently from one another, giving different weights to various factors. It is also important to recognize that the fee arrangements for the Fund and other MFS Funds are the result of years of review and discussion between the independent Trustees and MFS, that certain aspects of such arrangements may receive greater scrutiny in some years than in others, and that the Trustees’ conclusions may be based, in part, on their consideration of these same arrangements during the course of the year and in prior years.
Based on information provided by Broadridge and MFS, the Trustees reviewed the Fund’s total return investment performance as well as the Broadridge performance universe over various time periods. The Trustees placed particular emphasis on the total return performance of the Fund’s Class A shares in comparison to the performance of funds in its Broadridge performance universe over the five-year period ended December 31, 2018, which the Trustees believed was a long enough period to reflect differing market conditions. The total return performance of the Fund’s Class A shares was in the 1st quintile relative to the other funds in the universe for this five-year period (the 1st quintile being the best performers and the 5th quintile being the worst performers). The total return performance of the Fund’s Class A shares was in the 3rd quintile for theone-year period and the 2nd quintile for the three-year period ended December 31, 2018 relative to the Broadridge performance universe. Because of the passage of time, these performance results may differ from the performance results for more recent periods, including those shown elsewhere in this report.
In the course of their deliberations, the Trustees took into account information provided by MFS in connection with the contract review meetings, as well as during investment review meetings conducted with portfolio management personnel during the course of the year regarding the Fund’s performance. After reviewing these and related factors, the Trustees concluded, within the context of their overall conclusions regarding the investment advisory agreement, that they were satisfied with MFS’ responses and efforts relating to investment performance.
In assessing the reasonableness of the Fund’s advisory fee, the Trustees considered, among other information, the Fund’s advisory fee and the total expense ratio of the Fund’s Class A shares as a percentage of average daily net assets and the advisory fee and total expense ratios of the Broadridge expense group based on information provided by Broadridge. The Trustees considered that, according to the data provided by Broadridge (which takes into account any fee reductions or expense limitations that were in effect during the Fund’s last fiscal year), the Fund’s effective advisory fee rate and total expense ratio were each lower than the Broadridge expense group median.
66
Board Review of Investment Advisory Agreement – continued
The Trustees also considered the advisory fees charged by MFS to any institutional separate accounts advised by MFS (“separate accounts”) and unaffiliated investment companies for which MFS serves as subadviser (“subadvised funds”) that have comparable investment strategies to the Fund, if any. In comparing these fees, the Trustees considered information provided by MFS as to the generally broader scope of services provided by MFS to the Fund, as well as the more extensive regulatory burdens imposed on MFS in managing the Fund, in comparison to separate accounts and subadvised funds. The Trustees also considered the higher demands placed on MFS’ investment personnel and trading infrastructure as a result of the daily cashin-flows andout-flows of the Fund in comparison to separate accounts.
The Trustees also considered whether the Fund may benefit from any economies of scale in the management of the Fund in the event of growth in assets of the Fund. They noted that the Fund’s advisory fee rate schedule is subject to a contractual breakpoint that reduces the Fund’s advisory fee rate on average daily net assets over $6.3 billion. The Trustees concluded that the breakpoint was sufficient to allow the Fund to benefit from economies of scale as its assets grow.
The Trustees also considered information prepared by MFS relating to MFS’ costs and profits with respect to the Fund, the MFS Funds considered as a group, and other investment companies and accounts advised by MFS, as well as MFS’ methodologies used to determine and allocate its costs to the MFS Funds, the Fund and other accounts and products for purposes of estimating profitability.
After reviewing these and other factors described herein, the Trustees concluded, within the context of their overall conclusions regarding the investment advisory agreement, that the advisory fees charged to the Fund represent reasonable compensation in light of the services being provided by MFS to the Fund.
In addition, the Trustees considered MFS’ resources and related efforts to continue to retain, attract and motivate capable personnel to serve the Fund. The Trustees also considered current and developing conditions in the financial services industry, including the presence of large and well-capitalized companies which are spending, and appear to be prepared to continue to spend, substantial sums to engage personnel and to provide services to competing investment companies. In this regard, the Trustees also considered the financial resources of MFS and its ultimate parent, Sun Life Financial Inc. The Trustees also considered the advantages and possible disadvantages to the Fund of having an adviser that also serves other investment companies as well as other accounts.
The Trustees also considered the nature, quality, cost, and extent of administrative, transfer agency, and distribution services provided to the Fund by MFS and its affiliates under agreements and plans other than the investment advisory agreement, including any12b-1 fees the Fund pays to MFS Fund Distributors, Inc., an affiliate of MFS. The Trustees also considered the nature, extent and quality of certain other services MFS performs or arranges for on the Fund’s behalf, which may include securities lending programs, directed expense payment programs, class action recovery programs, and MFS’ interaction with third-party service providers, principally custodians andsub-custodians. The Trustees concluded that the variousnon-advisory services provided by MFS and its affiliates on behalf of the Fund were satisfactory.
67
Board Review of Investment Advisory Agreement – continued
The Trustees consideredso-called“fall-out benefits” to MFS such as reputational value derived from serving as investment manager to the MFS Funds. The Trustees also considered that, effective January 3, 2018, MFS had discontinued its historic practice of obtaining investment research from portfolio brokerage commissions paid by certain MFS Funds and would thereafter directly pay for or voluntarily reimburse a Fund, if applicable, for the costs of external research acquired through the use of the Fund’s portfolio brokerage commissions.
Based on their evaluation of factors that they deemed to be material, including those factors described above, the Board of Trustees, including the independent Trustees, concluded that the Fund’s investment advisory agreement with MFS should be continued for an additionalone-year period, commencing August 1, 2019.
68
PROXY VOTING POLICIES AND INFORMATION
MFS votes proxies on behalf of the fund pursuant to proxy voting policies and procedures that are available without charge, upon request, by calling1-800-225-2606, by visitingmfs.com/proxyvoting,or by visiting the SEC’s Web site athttp://www.sec.gov.
Information regarding how the fund voted proxies relating to portfolio securities during the most recent twelve-month period ended June 30 is available by August 31 of each year without charge by visitingmfs.com/proxyvoting,or by visiting the SEC’s Web site athttp://www.sec.gov.
QUARTERLY PORTFOLIO DISCLOSURE
The fund files a complete schedule of portfolio holdings with the SEC for the first and third quarters of each fiscal year on Form N-Q or as an exhibit to its reports onForm N-PORT (for first and third fiscal quarters ending March 31, 2019 or after). The fund’s Form N-Q or Form N-PORT reports are available on the SEC’s website athttp://www.sec.gov.A shareholder can obtain the portfolio holdings report for the first and third quarters of the fund’s fiscal year atmfs.com/openendfunds by choosing the fund’s name and then selecting the “Resources” tab and clicking on “Prospectus and Reports”.
FURTHER INFORMATION
From time to time, MFS may post important information about the fund or the MFS funds on the MFS web site (mfs.com). This information is available athttps://www.mfs.com/en-us/what-we-do/announcements.htmlor atmfs.com/openendfundsby choosing the fund’s name.
INFORMATION ABOUT FUND CONTRACTS AND LEGAL CLAIMS
The fund has entered into contractual arrangements with an investment adviser, administrator, distributor, shareholder servicing agent, 529 program manager (if applicable), and custodian who each provide services to the fund. Unless expressly stated otherwise, shareholders are not parties to, or intended beneficiaries of these contractual arrangements, and these contractual arrangements are not intended to create any shareholder right to enforce them against the service providers or to seek any remedy under them against the service providers, either directly or on behalf of the fund.
Under the Trust’s By-Laws and Declaration of Trust, any claims asserted against or on behalf of the MFS Funds, including claims against Trustees and Officers, must be brought in state and federal courts located within the Commonwealth of Massachusetts.
FEDERAL TAX INFORMATION (unaudited)
The fund will notify shareholders of amounts for use in preparing 2019 income tax forms in January 2020. The following information is provided pursuant to provisions of the Internal Revenue Code.
The fund designates the maximum amount allowable as qualified dividend income eligible to be taxed at the same rate as long-term capital gain.
The fund designates $213,246,000 as capital gain dividends paid during the fiscal year.
For corporate shareholders, 53.85% of the ordinary income dividends paid during the fiscal year qualify for the corporate dividends received deduction.
The fund designates the maximum amount allowable as Section 199A dividends as defined in Proposed Treasury Regulation §1.199A-3(d).
69
rev. 3/16
| | | | |
| | | |
FACTS | | WHAT DOES MFS DO WITH YOUR PERSONAL INFORMATION? | |  |
| | |
| Why? | | Financial companies choose how they share your personal information. Federal law gives consumers the right to limit some but not all sharing. Federal law also requires us to tell you how we collect, share, and protect your personal information. Please read this notice carefully to understand what we do. |
| | |
| What? | | The types of personal information we collect and share depend on the product or service you have with us. This information can include: • Social Security number and account balances • Account transactions and transaction history • Checking account information and wire transfer instructions When you areno longer our customer, we continue to share your information as described in this notice. |
| | |
| How? | | All financial companies need to share customers’ personal information to run their everyday business. In the section below, we list the reasons financial companies can share their customers’ personal information; the reasons MFS chooses to share; and whether you can limit this sharing. |
| | | | |
Reasons we can share your
personal information | | Does MFS
share? | | Can you limit
this sharing? |
For our everyday business purposes – such as to process your transactions, maintain your account(s), respond to court orders and legal investigations, or report to credit bureaus | | Yes | | No |
For our marketing purposes – to offer our products and services to you | | No | | We don’t share |
For joint marketing with other financial companies | | No | | We don’t share |
For our affiliates’ everyday business purposes – information about your transactions and experiences | | No | | We don’t share |
For our affiliates’ everyday business purposes – information about your creditworthiness | | No | | We don’t share |
| For nonaffiliates to market to you | | No | | We don’t share |
| | |
| | |
| Questions? | | Call800-225-2606 or go tomfs.com. |
70
| | |
| Who we are |
| Who is providing this notice? | | MFS Funds, MFS Investment Management, MFS Institutional Advisors, Inc., and MFS Heritage Trust Company. |
| | |
| What we do |
| How does MFS protect my personal information? | | To protect your personal information from unauthorized access and use, we use security measures that comply with federal law. These measures include procedural, electronic, and physical safeguards for the protection of the personal information we collect about you. |
| How does MFS collect my personal information? | | We collect your personal information, for example, when you • open an account or provide account information • direct us to buy securities or direct us to sell your securities • make a wire transfer We also collect your personal information from others, such as credit bureaus, affiliates, or other companies. |
| Why can’t I limit all sharing? | | Federal law gives you the right to limit only • sharing for affiliates’ everyday business purposes – information about your creditworthiness • affiliates from using your information to market to you • sharing for nonaffiliates to market to you State laws and individual companies may give you additional rights to limit sharing. |
| | |
| Definitions |
| Affiliates | | Companies related by common ownership or control. They can be financial and nonfinancial companies. • MFS does not share personal information with affiliates, except for everyday business purposes as described on page one of this notice. |
| Nonaffiliates | | Companies not related by common ownership or control. They can be financial and nonfinancial companies. • MFS does not share with nonaffiliates so they can market to you. |
| Joint marketing | | A formal agreement between nonaffiliated financial companies that together market financial products or services to you. • MFS doesn’t jointly market. |
| | |
| Other important information |
| If you own an MFS product or receive an MFS service in the name of a third party such as a bank or broker-dealer, their privacy policy may apply to you instead of ours. |
71
Save paper with eDelivery.

| MFS® will send you prospectuses, |
reports, and proxies directly viae-mail so you will get information faster with less mailbox clutter.
To sign up:
1. Go to mfs.com.
2. Log in via MFS® Access.
3. Select eDelivery.
If you own your MFS fund shares through a financial institution or a retirement plan, MFS® TALK, MFS® Access, or eDelivery may not be available to you.
CONTACT
WEB SITE
mfs.com
MFS TALK
1-800-637-8255
24 hours a day
ACCOUNT SERVICE AND LITERATURE
Shareholders
1-800-225-2606
Financial advisors
1-800-343-2829
Retirement plan services
1-800-637-1255
MAILING ADDRESS
MFS Service Center, Inc.
P.O. Box 219341
Kansas City, MO 64121-9341
OVERNIGHT MAIL
MFS Service Center, Inc.
Suite 219341
430 W 7th Street
Kansas City, MO 64105-1407
The Registrant has adopted a Code of Ethics (the “Code”) pursuant to Section 406 of the Sarbanes-Oxley Act and as defined in FormN-CSR that applies to the Registrant’s principal executive officer and principal financial and accounting officer. During the period covered by this report, the Registrant has not amended any provision in the Code that relates to an element of the Code’s definition enumerated in paragraph (b) of Item 2 of this FormN-CSR. During the period covered by this report, the Registrant did not grant a waiver, including an implicit waiver, from any provision of the Code.
A copy of the Code is attached hereto asEX-99.COE.
| ITEM 3. | AUDIT COMMITTEE FINANCIAL EXPERT. |
Messrs. Steven E. Buller, Michael Hegarty, James Kilman, and Clarence Otis, Jr. and Ms. Maryanne L. Roepke, members of the Audit Committee, have been determined by the Board of Trustees in their reasonable business judgment to meet the definition of “audit committee financial expert” as such term is defined in FormN-CSR. In addition, Messrs. Buller, Hegarty, Kilman, and Otis and Ms. Roepke are “independent” members of the Audit Committee (as such term has been defined by the Securities and Exchange Commission in regulations implementing Section 407 of the Sarbanes-Oxley Act of 2002). The Securities and Exchange Commission has stated that the designation of a person as an audit committee financial expert pursuant to this Item 3 on the FormN-CSR does not impose on such a person any duties, obligations or liability that are greater than the duties, obligations or liability imposed on such person as a member of the Audit Committee and the Board of Trustees in the absence of such designation or identification.
| ITEM 4. | PRINCIPAL ACCOUNTANT FEES AND SERVICES. |
Items 4(a) through 4(d) and 4(g):
The Board of Trustees has appointed Deloitte & Touche LLP (“Deloitte”) to serve as independent accountants to certain series of the Registrant and Ernst & Young LLP (“E&Y”) to serve in the same capacity to certain other series of the Registrant (each a “Fund” and collectively the “Funds”). The tables below set forth the audit fees billed to each Fund as well as fees fornon-audit services provided to each Fund and/or to each Fund’s investment adviser, Massachusetts Financial Services Company (“MFS”), and to various entities either controlling, controlled by, or under common control with MFS that provide ongoing services to the Funds (“MFS Related Entities”).
For the fiscal years ended September 30, 2019 and 2018, audit fees billed to each Fund by Deloitte and E&Y were as follows:
| | | | | | | | |
| | | Audit Fees | |
| | | 2019 | | | 2018 | |
Fees billed by Deloitte: | | | | | | | | |
MFS Research Fund | | | 45,758 | | | | 44,747 | |
MFS Total Return Fund | | | 72,156 | | | | 70,552 | |
| | | | | | | | |
Total | | | 117,914 | | | | 115,299 | |
| |
| | | Audit Fees | |
| | | 2019 | | | 2018 | |
Fees billed by E&Y: | | | | | | | | |
MFS International New Discovery Fund | | | 50,899 | | | | 49,773 | |
For the fiscal years ended September 30, 2019 and 2018, fees billed by Deloitte and E&Y for audit-related, tax and other services provided to each Fund and for audit-related, tax and other services provided to MFS and MFS Related Entities were as follows:
| | | | | | | | | | | | | | | | | | | | | | | | |
| | | Audit-Related Fees1 | | | Tax Fees2 | | | All Other Fees3 | |
| | | 2019 | | | 2018 | | | 2019 | | | 2018 | | | 2019 | | | 2018 | |
Fees billed by Deloitte: | | | | | | | | | | | | | | | | | | | | | | | | |
To MFS Research Fund | | | 0 | | | | 0 | | | | 7,004 | | | | 6,847 | | | | 0 | | | | 0 | |
To MFS Total Return Fund | | | 0 | | | | 0 | | | | 10,044 | | | | 9,476 | | | | 0 | | | | 0 | |
Total fees billed by Deloitte To above Funds: | | | 0 | | | | 0 | | | | 17,048 | | | | 16,323 | | | | 0 | | | | 0 | |
| | | |
| | | Audit-Related Fees1 | | | Tax Fees2 | | | All Other Fees3 | |
| | | 2019 | | | 2018 | | | 2019 | | | 2018 | | | 2019 | | | 2018 | |
Fees billed by Deloitte: | | | | | | | | | | | | | | | | | | | | | | | | |
To MFS and MFS Related Entities of MFS Research Fund* | | | 0 | | | | 0 | | | | 0 | | | | 0 | | | | 3,790 | | | | 5,390 | |
To MFS and MFS Related Entities of MFS Total Return Fund* | | | 0 | | | | 0 | | | | 0 | | | | 0 | | | | 3,790 | | | | 5,390 | |
| | | | | | | | |
| | | Aggregate Fees for Non-audit
Services | |
| | | 2019 | | | 2018 | |
Fees billed by Deloitte | | | | | | | | |
To MFS Research Fund, MFS and MFS Related Entities# | | | 10,794 | | | | 12,237 | |
To MFS Total Return Fund, MFS and MFS Related Entities# | | | 13,834 | | | | 14,866 | |
| | | | | | | | | | | | | | | | | | | | | | | | |
| | | Audit-Related Fees1 | | | Tax Fees2 | | | All Other Fees4 | |
| | | 2019 | | | 2018 | | | 2019 | | | 2018 | | | 2019 | | | 2018 | |
Fees billed by E&Y: | | | | | | | | | | | | | | | | | | | | | | | | |
To MFS International New Discovery Fund | | | 0 | | | | 0 | | | | 9,642 | | | | 9,432 | | | | 2,723 | | | | 2,599 | |
| | | |
| | | Audit-Related Fees1 | | | Tax Fees2 | | | All Other Fees4 | |
| | | 2019 | | | 2018 | | | 2019 | | | 2018 | | | 2019 | | | 2018 | |
Fees billed by E&Y: | | | | | | | | | | | | | | | | | | | | | | | | |
To MFS and MFS Related Entities of MFS International New Discovery Fund* | | | 1,679,277 | | | | 1,728,076 | | | | 0 | | | | 0 | | | | 104,750 | | | | 102,450 | |
| | | | | | | | |
| | | Aggregate Fees for Non-audit
Services | |
| | | 2019 | | | 2018 | |
Fees billed by E&Y: | | | | | | | | |
To MFS International New Discovery Fund, MFS and MFS Related Entities# | | | 1,933,592 | | | | 2,090,257 | |
| * | This amount reflects the fees billed to MFS and MFS Related Entities fornon-audit services relating directly to the operations and financial reporting of the Funds (portions of which services also related to the operations and financial reporting of other funds within the MFS Funds complex). |
| # | This amount reflects the aggregate fees billed by Deloitte or E&Y fornon-audit services rendered to the Funds and fornon-audit services rendered to MFS and the MFS Related Entities. |
| 1 | The fees included under “Audit-Related Fees” are fees related to assurance and related services that are reasonably related to the performance of the audit or review of financial statements, but not reported under ‘‘Audit Fees,’’ including accounting consultations, agreed-upon procedure reports, attestation reports, comfort letters and internal control reviews. |
| 2 | The fees included under “Tax Fees” are fees associated with tax compliance, tax advice and tax planning, including services relating to the filing or amendment of federal, state or local income tax returns, regulated investment company qualification reviews and tax distribution and analysis. |
| 3 | The fees included under “All Other Fees” are fees for products and services provided by Deloitte other than those reported under “Audit Fees,” “Audit-Related Fees” and “Tax Fees”. |
| 4 | The fees included under “All Other Fees” are fees for products and services provided by E&Y other than those reported under “Audit Fees,” “Audit-Related Fees” and “Tax Fees,” including fees for services related to review of internal controls and review of Rule38a-1 compliance program. |
Item 4(e)(1):
Set forth below are the policies and procedures established by the Audit Committee of the Board of Trustees relating to thepre-approval of audit andnon-audit related services:
To the extent required by applicable law,pre-approval by the Audit Committee of the Board is needed for all audit and permissiblenon-audit services rendered to the Fund and all permissiblenon-audit services rendered to MFS or MFS Related Entities if the services relate directly to the operations and financial reporting of the Registrant.Pre-approval is currently on anengagement-by-engagement basis. In the eventpre-approval of such services is necessary between regular meetings of the Audit Committee and it is not practical to wait to seekpre-approval at the next regular meeting of the Audit Committee,pre-approval of such services may be referred to the Chair of the Audit Committee for approval; provided that the Chair may notpre-approve any individual engagement for such services exceeding $50,000 or multiple engagements for such services in the aggregate exceeding $100,000 in each period between regular meetings of the Audit Committee. Any engagementpre-approved by the Chair between regular meetings of the Audit Committee shall be presented for ratification by the entire Audit Committee at its next regularly scheduled meeting.
Item 4(e)(2):
None, or 0%, of the services relating to the Audit-Related Fees, Tax Fees and All Other Fees paid by the Fund and MFS and MFS Related Entities relating directly to the operations and financial reporting of the Registrant disclosed above were approved by the audit committee pursuant to paragraphs (c)(7)(i)(C) of Rule2-01 of RegulationS-X (which permits audit committee approval after the start of the engagement with respect to services other than audit, review or attest services, if certain conditions are satisfied).
Item 4(f):
Not applicable.
Item 4(h):
The Registrant’s Audit Committee has considered whether the provision by a Registrant’s independent registered public accounting firm ofnon-audit services to MFS and MFS Related Entities that were notpre-approved by the Committee (because such services did not relate directly to the operations and financial reporting of the Registrant) was compatible with maintaining the independence of the independent registered public accounting firm as the Registrant’s principal auditors.
| ITEM 5. | AUDIT COMMITTEE OF LISTED REGISTRANTS. |
Not applicable to the Registrant.
A schedule of investments of each series of the Registrant is included as part of the report to shareholders of such series under Item 1 of this FormN-CSR.
| ITEM 7. | DISCLOSURE OF PROXY VOTING POLICIES AND PROCEDURES FORCLOSED-END MANAGEMENT INVESTMENT COMPANIES. |
Not applicable to the Registrant.
| ITEM 8. | PORTFOLIO MANAGERS OFCLOSED-END MANAGEMENT INVESTMENT COMPANIES. |
Not applicable to the Registrant.
| ITEM 9. | PURCHASES OF EQUITY SECURITIES BYCLOSED-END MANAGEMENT INVESTMENT COMPANY AND AFFILIATED PURCHASERS. |
Not applicable to the Registrant.
| ITEM 10. | SUBMISSION OF MATTERS TO A VOTE OF SECURITY HOLDERS. |
There were no material changes to the procedures by which shareholders may send recommendations to the Board for nominees to the Registrant’s Board since the Registrant last provided disclosure as to such procedures in response to the requirements of Item 407 (c)(2)(iv) of RegulationS-K or this Item.
| ITEM 11. | CONTROLS AND PROCEDURES. |
| (a) | Based upon their evaluation of the effectiveness of the registrant’s disclosure controls and procedures (as defined in Rule30a-3(c) under the Investment Company Act of 1940 (the “Act”)) as conducted within 90 days of the filing date of this report on FormN-CSR, the registrant’s principal financial officer and principal executive officer have concluded that those disclosure controls and procedures provide reasonable assurance that the material information required to be disclosed by the registrant on this report is recorded, processed, summarized and reported within the time periods specified in the Securities and Exchange Commission’s rules and forms. |
| (b) | There were no changes in the registrant’s internal controls over financial reporting (as defined in Rule30a-3(d) under the Act) that occurred during the period covered by the report that have materially affected, or are reasonably likely to materially affect, the registrant’s internal control over financial reporting. |
| ITEM 12. | DISCLOSURE OF SECURITIES LENDING ACTIVITIES FORCLOSED-END MANAGEMENT INVESTMENT COMPANIES. |
Not applicable to the Registrant.
| | |
| (a) | | (1) Any code of ethics, or amendment thereto, that is the subject of the disclosure required by Item 2, to the extent that the registrant intends to satisfy the Item 2 requirements through filing of an exhibit: Attached hereto asEX-99.COE. |
| |
| | (2) A separate certification for each principal executive officer and principal financial officer of the registrant as required by Rule30a-2(a) under the Act (17 CFR270.30a-2): Attached hereto asEX-99.302CERT. |
| |
| | (3) Any written solicitation to purchase securities under Rule23c-1 under the Act (17 CFR270.23c-1) sent or given during the period covered by the report by or on behalf of the registrant to 10 or more persons. Not applicable. |
| |
| | (4) Change in the registrant’s independent public accountant. Not applicable. |
| (b) | If the report is filed under Section 13(a) or 15(d) of the Exchange Act, provide the certifications required by Rule30a-2(b) under the Act (17 CFR270.30a-2(b)), Rule13a-14(b) or Rule15d-14(b) under the Exchange Act (17 CFR240.13a-14(b) or240.15d-14(b)) and Section 1350 of Chapter 63 of Title 18 of the United States Code (18 U.S.C. 1350) as an exhibit. A certification furnished pursuant to this paragraph will not be deemed “filed” for the purposes of Section 18 of the Exchange Act (15 U.S.C. 78r), or otherwise subject to the liability of that section. Such certification will not be deemed to be incorporated by reference into any filing under the Securities Act of 1933 or the Exchange Act, except to the extent that the registrant specifically incorporates it by reference. Attached hereto asEX-99.906CERT. |
Notice
A copy of the Amended and Restated Declaration of Trust, as amended, of the Registrant is on file with the Secretary of State of The Commonwealth of Massachusetts and notice is hereby given that this instrument is executed on behalf of the Registrant by an officer of the Registrant as an officer and not individually and the obligations of or arising out of this instrument are not binding upon any of the Trustees or shareholders individually, but are binding only upon the assets and property of the respective constituent series of the Registrant.
SIGNATURES
Pursuant to the requirements of the Securities Exchange Act of 1934 and the Investment Company Act of 1940, the registrant has duly caused this report to be signed on its behalf by the undersigned, thereunto duly authorized.
(Registrant) MFS SERIES TRUST V
| | |
| By (Signature and Title)* | | DAVID L. DILORENZO |
| | David L. DiLorenzo, President |
Date: November 15, 2019
Pursuant to the requirements of the Securities Exchange Act of 1934 and the Investment Company Act of 1940, this report has been signed below by the following persons on behalf of the registrant and in the capacities and on the dates indicated.
| | |
| By (Signature and Title)* | | DAVID L. DILORENZO |
| | David L. DiLorenzo, President
(Principal Executive Officer) |
Date: November 15, 2019
| | |
| By (Signature and Title)* | | JAMES O. YOST |
| | James O. Yost, Treasurer (Principal Financial Officer and Accounting Officer) |
Date: November 15, 2019
| * | Print name and title of each signing officer under his or her signature. |