UNITED STATES
SECURITIES AND EXCHANGE COMMISSION Washington, D.C. 20549
FORM N-CSR
CERTIFIED SHAREHOLDER REPORT OF REGISTERED MANAGEMENT INVESTMENT COMPANIES
Investment Company Act file number 811-02031
MFS SERIES TRUST V
(Exact name of registrant as specified in charter)
111 Huntington Avenue, Boston, Massachusetts 02199 (Address of principal executive offices) (Zip code)
Christopher R. Bohane
Massachusetts Financial Services Company
111 Huntington Avenue
Boston, Massachusetts 02199
(Name and address of agents for service)
Registrant's telephone number, including area code: (617) 954-5000
Date of fiscal year end: September 30
Date of reporting period: September 30, 2022
ITEM 1. REPORTS TO STOCKHOLDERS.
Item 1(a):
Annual Report
September 30, 2022
MFS® International New Discovery Fund
MFS® International New Discovery Fund
| 1 |
| 2 |
| 4 |
| 7 |
| 10 |
| 12 |
| 26 |
| 28 |
| 29 |
| 30 |
| 36 |
| 50 |
| 52 |
| 56 |
| 60 |
| 60 |
| 60 |
| 60 |
| 60 |
| 61 |
The report is prepared for the general information of shareholders. It is authorized for distribution to prospective investors only when preceded or accompanied by a current prospectus.
NOT FDIC INSURED • MAY LOSE VALUE • NO BANK GUARANTEE
LETTER FROM THE CHAIR AND CEO
Dear Shareholders:
Global markets have recently been buffeted by a series of crosscurrents, including rising inflation, tighter financial conditions, and evolving geopolitical tensions. Consequently, at a time when global growth faces multiple headwinds, central banks have been presented with the challenge of reining in rising prices without tipping economies into recession. The U.S. Federal Reserve has made it clear that rates must move higher and tighter policy must be sustained to restore price stability and that this will likely bring some pain to households and businesses. Against that backdrop, richly valued, interest rate–sensitive growth equities have been hit particularly hard by rising interest rates. Volatility in fixed income and currency markets has picked up, with fiscal policy missteps in the United Kingdom leading to a crisis of market confidence that ultimately resulted in the ousting of Prime Minister Liz Truss. That episode could forewarn other governments to avoid policy overreach.
There are, however, encouraging signs for the markets. The latest wave of COVID-19 cases appears to be receding in Asia, and cases outside Asia, while numerous, appear to be causing fewer serious illnesses. Meanwhile, unemployment is low and global supply chain bottlenecks are easing, though lingering coronavirus restrictions in China and disruptions stemming from Russia’s invasion of Ukraine could hamper these advances. Additionally, easier Chinese monetary and regulatory policies and the record pace of corporate stock buybacks are supportive elements, albeit in an otherwise turbulent investment environment.
It is important to have a deep understanding of company fundamentals during times of market transition, and we have built our unique global research platform to do just that.
At MFS®, we put our clients’ assets to work responsibly by carefully navigating increasingly complex global capital markets. Our investment team is guided by a commitment to long-term fundamental investing. Our global investment platform — combining collective expertise, long-term discipline, and thoughtful risk management — seeks to uncover what we believe are the best, most durable investment ideas in markets around the world, enabling us to potentially create value for investors.
Respectfully,
Michael W. Roberge
Chair and Chief Executive Officer
MFS Investment Management
November 14, 2022
The opinions expressed in this letter are subject to change and may not be relied upon for investment advice. No forecasts can be guaranteed.
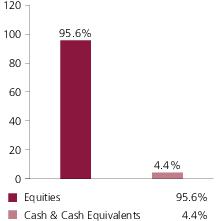
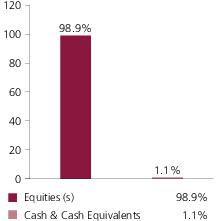
Portfolio structure
Top ten holdings
| NS Solutions Corp. | 1.6% |
| OBIC Co. Ltd. | 1.6% |
| Symrise AG | 1.3% |
| Daiseki Co. Ltd. | 1.2% |
| T. Hasegawa Co. Ltd. | 1.2% |
| Croda International PLC | 0.9% |
| Dollarama, Inc. | 0.9% |
| RS Group PLC | 0.8% |
| Cellnex Telecom S.A. | 0.8% |
| GEA Group AG | 0.8% |
GICS equity sectors (g)
| Industrials | 18.4% |
| Information Technology | 13.5% |
| Materials | 12.8% |
| Consumer Discretionary | 11.2% |
| Consumer Staples | 9.8% |
| Financials | 8.3% |
| Health Care | 7.9% |
| Communication Services | 5.8% |
| Real Estate | 4.1% |
| Utilities | 2.1% |
| Energy | 1.7% |
Issuer country weightings (x)
| Japan | 32.0% |
| United Kingdom | 12.1% |
| Germany | 4.9% |
| Australia | 4.9% |
| United States | 4.5% |
| France | 3.7% |
| India | 3.5% |
| Hong Kong | 2.8% |
| Brazil | 2.8% |
| Other Countries | 28.8% |
Currency exposure weightings (y)
| Japanese Yen | 32.0% |
| Euro | 15.7% |
| British Pound Sterling | 12.5% |
| United States Dollar | 5.6% |
| Australian Dollar | 5.0% |
| Hong Kong Dollar | 4.7% |
| Indian Rupee | 2.9% |
| Brazilian Real | 2.6% |
| Swiss Franc | 2.5% |
| Other Currencies | 16.5% |
Portfolio Composition - continued
| (g) | The Global Industry Classification Standard (GICS®) was developed by and/or is the exclusive property of MSCI, Inc. and S&P Global Market Intelligence Inc. (“S&P Global Market Intelligence”). GICS is a service mark of MSCI and S&P Global Market Intelligence and has been licensed for use by MFS. MFS has applied its own internal sector/industry classification methodology for equity securities and non-equity securities that are unclassified by GICS. |
| (x) | Represents the portfolio’s exposure to issuer countries as a percentage of a portfolio’s net assets. For purposes of this presentation, United States includes Cash & Cash Equivalents. |
| (y) | Represents the portfolio’s exposure to a particular currency as a percentage of a portfolio's net assets. For purposes of this presentation, United States Dollar includes Cash & Cash Equivalents. |
Cash & Cash Equivalents includes any cash, investments in money market funds, short-term securities, and other assets less liabilities. Please see the Statement of Assets and Liabilities for additional information related to the fund’s cash position and other assets and liabilities.
Percentages are based on net assets as of September 30, 2022.
The portfolio is actively managed and current holdings may be different.
Management Review
Summary of Results
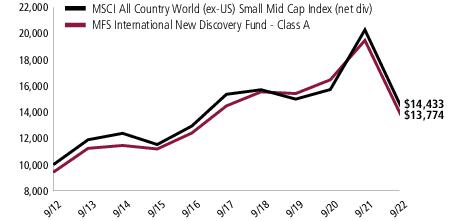
For the twelve months ended September 30, 2022, Class A shares of the MFS International New Discovery Fund (fund) provided a total return of -29.31%, at net asset value. This compares with a return of -28.85% for the fund's benchmark, the MSCI All Country World (ex-US) Small Mid Cap Index (net div).
Market Environment
During the reporting period, markets continued to grapple with the strongest global inflationary pressures in decades along with signs of slowing economic growth. Intermittent coronavirus flareups, particularly in China, where home-grown vaccines have proved less effective than elsewhere, have kept supply chains stretched for longer than expected. At the same time, the reopening of the economy in the parts of the world where the virus has been better contained has led to a shift in consumption patterns in favor of services, straining already tight labor markets in most developed economies, while reducing demand for manufactured goods, primarily from Asia. As a result of Russia’s invasion of Ukraine, geopolitical considerations, such as sanctions and trade bans, have resulted in additional supply chain tumult and volatile global energy prices. Taken together, these factors have contributed to market volatility.
The ripple effects from the Russian invasion further complicated the mission central banks must undertake to rein in surging inflation. Energy shocks have historically resulted in global growth slowdowns, if not pullbacks, so policymakers will find themselves in the difficult position of trying to restrain inflation without tipping economies into recession. Despite the challenging macroeconomic and geopolitical environment, policymakers remained focused on corralling inflation, although investors appeared to have expected varying degrees of action from the central banks. The Fed was expected to be the most hawkish developed market central bank and the European Central Bank less so, given the growth-depleting effects on Europe's economy stemming from the invasion, while the Bank of Japan remained on the monetary sidelines, leading to a dramatic weakening of the yen.
Against an environment of rising labor and volatile materials prices, higher interest rates and waning fiscal and monetary stimulus, investor anxiety appeared to have increased over the potential that corporate profit margins may be past peak for this cycle. That said, tentative signs that supply chain bottlenecks (particularly semiconductors) may be easing, low levels of unemployment across developed markets and somewhat easier prices for raw materials were supportive factors for the macroeconomic backdrop.
Detractors from Performance
The fund’s underweight position, and to a lesser extent, stock selection in the energy sector detracted from performance relative to the MSCI All Country World (ex-US) Small Mid Cap Index. There were no individual securities within this sector, either in the fund or in the benchmark, that were among the fund's top relative detractors for the reporting period.
Management Review - continued
Security selection within the industrials sector further held back relative performance. Within this sector, the fund’s overweight position in logistics company SG Holdings (Japan) detracted from relative returns. The stock price of SG Holdings came under pressure due to declining cargo volumes from e-commerce retailers
The fund’s underweight position and stock selection in the utilities sector weakened relative returns. There were no individual securities within this sector, either in the fund or in the benchmark, that were among the fund's top relative detractors for the reporting period.
Elsewhere, the fund’s overweight positions in food delivery website operator Just Eat Takeaway (Netherlands), real estate company LEG Immobilien (Germany), construction and building material producer Breedon Group (United Kingdom), bakery retailer Greggs (United Kingdom), software development company Douzone Bizon (South Korea), salmon products manufacturer Bakkafrost P/F (Norway) and circuit board manufacturer WIN Semiconductors (Taiwan) detracted from relative returns. The share price of Just Eat Takeaway fell after the firm reported a larger-than-expected slowdown in seasonal orders, paired with high investments required to defend its market share. The fund’s holdings of telecommunications services provider Cellnex Telecom(b) (Spain) and online betting and gaming operator Flutter Entertainment(b) (Ireland) further weighed on relative performance.
During the reporting period, the fund’s relative currency exposure, resulting primarily from differences between the fund's and the benchmark's exposures to holdings of securities denominated in foreign currencies, was another detractor from relative performance. All of MFS’ investment decisions are driven by the fundamentals of each individual opportunity and as such, it is common for our funds to have different currency exposure than the benchmark.
Contributors to Performance
Favorable stock selection within the health care, consumer discretionary and information technology sectors contributed to the fund’s relative performance. Within the health care sector, an overweight position in pharmaceutical products manufacturer Kalbe Farma (Indonesia) benefited relative returns. The share price of Kalbe Farma rose as the company reported strong business results, including double-digit sales growth and improved profitability due to more stringent cost controls, and raised its full-year outlook. Within the consumer discretionary sector, the fund’s holdings of automotive vehicle manufacturer Mahindra & Mahindra(b) (India), travel products and solutions company MakeMyTrip(b) (India), and overweight position in dollar store operator Dollarama (Canada), benefited relative performance. The stock price of Dollarama advanced as the company reported above-forecasted same-store sales and solid gross margin performance. The easing of COVID-19 restrictions, coupled with Dollarama’s low-cost customer value proposition during this inflationary environment, helped drive improved in-store traffic and sales. Within the information technology sector, holdings of semiconductor products manufacturer Silicon Motion Technology(b)(h) (Taiwan) were among the fund’s top relative contributors.
Stocks in other sectors that helped relative performance included the fund’s overweight positions in heavy equipment retailer PT United Tractors (Indonesia), fragrance and food company T. Hasegawa (Japan), shopping mall operator Multiplan Empreendimentos
Management Review - continued
Imobiliarios (Brazil), intellectual property services provider IPH (Australia) and brewing company China Resources Beer Holdings(b) (China). The stock price of PT United Tractors appreciated, driven by heavy equipment sales growth in its coal mining segment.
The fund’s cash and/or cash equivalents position during the period further bolstered relative performance. Under normal market conditions, the fund strives to be fully invested and generally holds cash to buy new holdings and to provide liquidity. In a period when equity markets fell, as measured by the fund’s benchmark, holding cash benefited performance versus the benchmark, which has no cash position.
Respectfully,
Portfolio Manager(s)
Peter Fruzzetti, Jose Luis Garcia, Lionel Gomez, Robert Lau, Sandeep Mehta, and Nicholas Spratt
Note to Shareholders: Effective April 15, 2023, Jose Luis Garcia will no longer be a Portfolio Manager of the fund.
| (b) | Security is not a benchmark constituent. |
| (h) | Security was not held in the portfolio at period end. |
The views expressed in this report are those of the portfolio manager(s) only through the end of the period of the report as stated on the cover and do not necessarily reflect the views of MFS or any other person in the MFS organization. These views are subject to change at any time based on market or other conditions, and MFS disclaims any responsibility to update such views. These views may not be relied upon as investment advice or an indication of trading intent on behalf of any MFS portfolio. References to specific securities are not recommendations of such securities, and may not be representative of any MFS portfolio’s current or future investments.
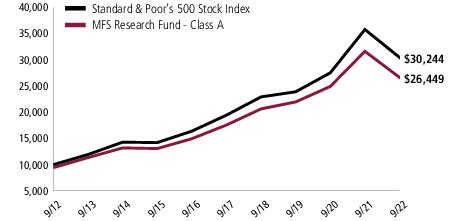
Performance Summary THROUGH 9/30/22
The following chart illustrates a representative class of the fund’s historical performance in comparison to its benchmark(s). Performance results include the deduction of the maximum applicable sales charge and reflect the percentage change in net asset value, including reinvestment of dividends and capital gains distributions. The performance of other share classes will be greater than or less than that of the class depicted below. Benchmarks are unmanaged and may not be invested in directly. Benchmark returns do not reflect sales charges, commissions or expenses. (See Notes to Performance Summary.)
Performance data shown represents past performance and is no guarantee of future results. Investment return and principal value fluctuate so your shares, when sold, may be worth more or less than the original cost; current performance may be lower or higher than quoted. The performance shown does not reflect the deduction of taxes, if any, that a shareholder would pay on fund distributions or the redemption of fund shares.
Growth of a Hypothetical $10,000 Investment
Performance Summary - continued
Total Returns through 9/30/22
Average annual without sales charge
| Share Class | Class Inception Date | 1-yr | 5-yr | 10-yr |
| A | 10/09/97 | (29.31)% | (1.00)% | 3.87% |
| B | 10/02/00 | (29.85)% | (1.74)% | 3.09% |
| C | 10/02/00 | (29.84)% | (1.74)% | 3.09% |
| I | 10/09/97 | (29.15)% | (0.76)% | 4.12% |
| R1 | 4/01/05 | (29.84)% | (1.74)% | 3.09% |
| R2 | 10/31/03 | (29.48)% | (1.25)% | 3.61% |
| R3 | 4/01/05 | (29.32)% | (1.01)% | 3.86% |
| R4 | 4/01/05 | (29.16)% | (0.76)% | 4.12% |
| R6 | 6/01/12 | (29.06)% | (0.63)% | 4.25% |
Comparative benchmark(s)
| MSCI All Country World (ex-US) Small Mid Cap Index (net div) (f) | (28.85)% | (1.25)% | 3.74% |
Average annual with sales charge
| | | | |
A
With Initial Sales Charge (5.75%) | (33.38)% | (2.17)% | 3.25% |
B
With CDSC (Declining over six years from 4% to 0%) (v) | (32.54)% | (2.08)% | 3.09% |
C
With CDSC (1% for 12 months) (v) | (30.51)% | (1.74)% | 3.09% |
CDSC – Contingent Deferred Sales Charge.
Class I, R1, R2, R3, R4, and R6 shares do not have a sales charge.
| (f) | Source: FactSet Research Systems Inc. |
| (v) | Assuming redemption at the end of the applicable period. |
Benchmark Definition(s)
MSCI All Country World (ex-U.S.) Small Mid Cap Index(e) (net div) – a free float weighted index that is designed to measure equity market performance of small and mid cap companies across global developed and emerging market countries, excluding the United States. Index returns do not take into account any investment-related fees and expenses.
It is not possible to invest directly in an index.
| (e) | Morgan Stanley Capital International (“MSCI”) makes no express or implied warranties or representations and shall have no liability whatsoever with respect to any MSCI data contained herein. The MSCI data may not be further redistributed or used as a basis for other indices or any securities or financial products. This report is not approved, reviewed, or produced by MSCI. |
Notes to Performance Summary
Average annual total return represents the average annual change in value for each share class for the periods presented.
Performance Summary - continued
Performance results reflect any applicable expense subsidies and waivers in effect during the periods shown. Without such subsidies and waivers the fund's performance results would be less favorable. Please see the prospectus and financial statements for complete details.
Performance results do not include adjustments made for financial reporting purposes in accordance with U.S. generally accepted accounting principles and may differ from amounts reported in the financial highlights.
From time to time the fund may receive proceeds from litigation settlements, without which performance would be lower.
Expense Table
Fund expenses borne by the shareholders during the period,
April 1, 2022 through September 30, 2022
As a shareholder of the fund, you incur two types of costs: (1) transaction costs, including sales charges (loads) on certain purchase or redemption payments, and (2) ongoing costs, including management fees; distribution and service (12b-1) fees; and other fund expenses. This example is intended to help you understand your ongoing costs (in dollars) of investing in the fund and to compare these costs with the ongoing costs of investing in other mutual funds.
The example is based on an investment of $1,000 invested at the beginning of the period and held for the entire period April 1, 2022 through September 30, 2022.
Actual Expenses
The first line for each share class in the following table provides information about actual account values and actual expenses. You may use the information in this line, together with the amount you invested, to estimate the expenses that you paid over the period. Simply divide your account value by $1,000 (for example, an $8,600 account value divided by $1,000 = 8.6), then multiply the result by the number in the first line under the heading entitled “Expenses Paid During Period” to estimate the expenses you paid on your account during this period.
Hypothetical Example for Comparison Purposes
The second line for each share class in the following table provides information about hypothetical account values and hypothetical expenses based on the fund’s actual expense ratio and an assumed rate of return of 5% per year before expenses, which is not the fund’s actual return. The hypothetical account values and expenses may not be used to estimate the actual ending account balance or expenses you paid for the period. You may use this information to compare the ongoing costs of investing in the fund and other funds. To do so, compare this 5% hypothetical example with the 5% hypothetical examples that appear in the shareholder reports of the other funds.
Please note that the expenses shown in the table are meant to highlight your ongoing costs only and do not reflect any transactional costs, such as sales charges (loads). Therefore, the second line for each share class in the table is useful in comparing ongoing costs only, and will not help you determine the relative total costs of owning different funds. In addition, if these transactional costs were included, your costs would have been higher.
Expense Table - continued
Share
Class | | Annualized
Expense
Ratio | Beginning
Account Value
4/01/22 | Ending
Account Value
9/30/22 | Expenses
Paid During
Period (p)
4/01/22-9/30/22 |
| A | Actual | 1.30% | $1,000.00 | $794.07 | $5.85 |
| Hypothetical (h) | 1.30% | $1,000.00 | $1,018.55 | $6.58 |
| B | Actual | 2.05% | $1,000.00 | $791.03 | $9.20 |
| Hypothetical (h) | 2.05% | $1,000.00 | $1,014.79 | $10.35 |
| C | Actual | 2.05% | $1,000.00 | $791.36 | $9.21 |
| Hypothetical (h) | 2.05% | $1,000.00 | $1,014.79 | $10.35 |
| I | Actual | 1.05% | $1,000.00 | $794.98 | $4.72 |
| Hypothetical (h) | 1.05% | $1,000.00 | $1,019.80 | $5.32 |
| R1 | Actual | 2.05% | $1,000.00 | $791.26 | $9.21 |
| Hypothetical (h) | 2.05% | $1,000.00 | $1,014.79 | $10.35 |
| R2 | Actual | 1.55% | $1,000.00 | $793.25 | $6.97 |
| Hypothetical (h) | 1.55% | $1,000.00 | $1,017.30 | $7.84 |
| R3 | Actual | 1.30% | $1,000.00 | $794.13 | $5.85 |
| Hypothetical (h) | 1.30% | $1,000.00 | $1,018.55 | $6.58 |
| R4 | Actual | 1.05% | $1,000.00 | $794.98 | $4.72 |
| Hypothetical (h) | 1.05% | $1,000.00 | $1,019.80 | $5.32 |
| R6 | Actual | 0.91% | $1,000.00 | $795.46 | $4.10 |
| Hypothetical (h) | 0.91% | $1,000.00 | $1,020.51 | $4.61 |
| (h) | 5% class return per year before expenses. |
| (p) | “Expenses Paid During Period” are equal to each class’s annualized expense ratio, as shown above, multiplied by the average account value over the period, multiplied by 183/365 (to reflect the one-half year period). Expenses paid do not include any applicable sales charges (loads). If these transaction costs had been included, your costs would have been higher. |
Portfolio of Investments
9/30/22
The Portfolio of Investments is a complete list of all securities owned by your fund. It is categorized by broad-based asset classes.
| Issuer | | | Shares/Par | Value ($) |
| Common Stocks – 95.4% |
| Aerospace & Defense – 1.0% | |
| Babcock International Group PLC (a) | | 1,393,969 | $4,304,420 |
| LISI Group | | 578,778 | 10,108,310 |
| MTU Aero Engines Holding AG | | 38,986 | 5,883,123 |
| Saab AB, “B” | | 138,860 | 4,319,625 |
| Singapore Technologies Engineering Ltd. | | 12,378,800 | 30,685,505 |
| | | | | $55,300,983 |
| Airlines – 0.7% | |
| Auckland International Airport Ltd. (a) | | 312,696 | $1,260,002 |
| Enav S.p.A. | | 4,662,291 | 16,983,934 |
| Grupo Aeroportuario del Pacifico S.A.B. de C.V. (l) | | 569,903 | 7,203,198 |
| Grupo Aeroportuario del Sureste S.A.B. de C.V., ADR | | 28,809 | 5,651,462 |
| Mainfreight Ltd. | | 262,213 | 9,866,787 |
| | | | | $40,965,383 |
| Alcoholic Beverages – 0.8% | |
| Carlsberg Group | | 132,479 | $15,457,585 |
| China Resources Beer Holdings Co. Ltd. | | 4,316,000 | 29,896,412 |
| | | | | $45,353,997 |
| Apparel Manufacturers – 0.6% | |
| Burberry Group PLC | | 574,654 | $11,459,245 |
| Coats Group PLC | | 5,250,030 | 2,969,192 |
| Eclat Textile Co. Ltd. | | 540,000 | 6,607,018 |
| Pacific Textiles Holdings Ltd. | | 38,809,000 | 12,112,903 |
| | | | | $33,148,358 |
| Automotive – 1.9% | |
| Cie Plastic Omnium S.A. | | 319,197 | $4,162,289 |
| Daikyonishikawa Corp. | | 332,421 | 1,224,423 |
| Hero MotoCorp Ltd. | | 591,167 | 18,381,541 |
| Koito Manufacturing Co. Ltd. | | 1,291,600 | 17,700,525 |
| Mahindra & Mahindra Ltd. | | 922,321 | 14,246,057 |
| NGK Spark Plug Co. Ltd | | 748,600 | 13,278,127 |
| Stanley Electric Co. Ltd. | | 871,131 | 13,666,443 |
| TS Tech Co. Ltd. | | 997,300 | 9,799,542 |
| USS Co. Ltd. | | 800,800 | 12,325,127 |
| | | | | $104,784,074 |
Portfolio of Investments – continued
| Issuer | | | Shares/Par | Value ($) |
| Common Stocks – continued |
| Biotechnology – 0.6% | |
| Abcam PLC (a) | | 495,341 | $7,389,304 |
| Virbac S.A. | | 88,791 | 23,069,136 |
| | | | | $30,458,440 |
| Broadcasting – 0.4% | |
| 4imprint Group PLC | | 116,006 | $4,370,138 |
| Nippon Television Holdings, Inc. | | 767,100 | 6,141,430 |
| TBS Holdings, Inc. | | 891,400 | 9,763,843 |
| | | | | $20,275,411 |
| Brokerage & Asset Managers – 2.8% | |
| ASX Ltd. | | 136,228 | $6,264,083 |
| Bolsa Mexicana de Valores S.A. de C.V. | | 5,389,000 | 9,014,892 |
| Euronext N.V. | | 228,582 | 14,464,260 |
| Hargreaves Lansdown PLC | | 432,848 | 4,154,621 |
| IPH Ltd. | | 6,574,487 | 39,582,193 |
| JAFCO Group Co. Ltd. | | 197,100 | 2,899,371 |
| Japan Exchange Group, Inc. | | 145,300 | 1,964,161 |
| Moscow Exchange MICEX-RTS PJSC (a)(u) | | 7,428,305 | 0 |
| Omni Bridgeway Ltd. (a) | | 5,790,314 | 13,914,906 |
| Partners Group Holding AG | | 3,296 | 2,647,901 |
| Pinnacle Investment Management Group Ltd. (l) | | 1,139,173 | 5,957,036 |
| Rathbones Group PLC | | 963,150 | 17,561,741 |
| Schroders PLC | | 4,326,635 | 18,732,069 |
| TMX Group Ltd. | | 191,146 | 17,582,083 |
| | | | | $154,739,317 |
| Business Services – 6.9% | |
| AEON Delight Co. Ltd. | | 295,700 | $5,802,646 |
| Amadeus Fire AG | | 135,656 | 11,189,683 |
| Bunzl PLC | | 774,450 | 23,568,159 |
| Central Automotive Products Ltd. | | 47,300 | 718,340 |
| Compass Group PLC | | 1,325,120 | 26,488,106 |
| Comture Corp. | | 667,200 | 10,456,585 |
| Doshisha Co. Ltd. | | 141,800 | 1,413,849 |
| Eurofins Scientific SE | | 33,073 | 1,961,186 |
| Fuji Soft, Inc. (l) | | 339,500 | 19,130,226 |
| Fullcast Holdings Co., Ltd. | | 747,500 | 13,077,836 |
| Gruppo Mutuionline S.p.A. | | 143,416 | 2,816,341 |
| Imdex Ltd. | | 7,956,130 | 8,994,844 |
| Intertek Group PLC | | 495,834 | 20,398,904 |
| Iwatani Corp. | | 493,800 | 18,622,437 |
| Johnson Service Group PLC (a) | | 2,118,752 | 1,862,694 |
| Karnov Group AB (a) | | 1,201,680 | 5,868,678 |
Portfolio of Investments – continued
| Issuer | | | Shares/Par | Value ($) |
| Common Stocks – continued |
| Business Services – continued | |
| NS Solutions Corp. | | 3,613,300 | $86,626,179 |
| Pasona Group, Inc. | | 612,500 | 8,487,118 |
| RS Group PLC | | 4,251,051 | 45,364,404 |
| San-Ai Obbli Co. Ltd. | | 3,112,500 | 24,065,817 |
| SCSK Corp. | | 848,700 | 12,734,130 |
| Sohgo Security Services Co. Ltd. | | 569,000 | 14,328,426 |
| Thoughtworks Holding, Inc. (a) | | 105,309 | 1,104,691 |
| TIS, Inc. | | 546,200 | 14,502,972 |
| | | | | $379,584,251 |
| Chemicals – 0.9% | |
| Borregaard ASA | | 112,533 | $1,329,085 |
| IMCD Group N.V. | | 208,397 | 24,732,322 |
| JCU Corp. | | 817,100 | 16,430,705 |
| KH Neochem Co. Ltd. | | 409,600 | 7,479,847 |
| | | | | $49,971,959 |
| Computer Software – 3.6% | |
| ARGO GRAPHICS, Inc. | | 688,500 | $17,226,807 |
| Douzone Bizon Co. Ltd. | | 447,057 | 9,732,284 |
| EMIS Group PLC | | 489,193 | 10,301,743 |
| OBIC Business Consultants Co. Ltd. | | 91,900 | 2,827,685 |
| OBIC Co. Ltd. | | 651,800 | 86,419,931 |
| Oracle Corp. Japan | | 255,700 | 13,498,576 |
| PCA Corp. (h) | | 1,398,900 | 9,878,227 |
| Sage Group PLC | | 679,854 | 5,230,620 |
| SimCorp A/S | | 68,114 | 3,813,129 |
| Temairazu, Inc. (l) | | 261,400 | 9,487,748 |
| Totvs S.A. | | 1,920,700 | 10,450,294 |
| Wisetech Global Ltd. | | 605,647 | 19,892,836 |
| | | | | $198,759,880 |
| Computer Software - Systems – 2.6% | |
| Alten S.A. | | 139,757 | $15,301,432 |
| Amadeus IT Group S.A. (a) | | 600,104 | 27,778,183 |
| Cancom SE | | 431,801 | 10,293,475 |
| DTS Corp. | | 633,900 | 15,075,759 |
| Elecom Co. Ltd. | | 850,200 | 8,497,807 |
| Kardex Holding AG | | 91,953 | 12,171,624 |
| Pole To Win Holdings, Inc. | | 1,706,900 | 10,920,952 |
| Temenos AG | | 86,543 | 5,827,368 |
| Toshiba Tec Corp. | | 209,700 | 5,430,815 |
Portfolio of Investments – continued
| Issuer | | | Shares/Par | Value ($) |
| Common Stocks – continued |
| Computer Software - Systems – continued | |
| Venture Corp. Ltd. | | 2,727,700 | $31,067,385 |
| | | | | $142,364,800 |
| Conglomerates – 0.3% | |
| Ansell Ltd. | | 1,061,273 | $16,974,359 |
| Construction – 3.6% | |
| Bellway PLC | | 610,687 | $11,550,053 |
| Breedon Group PLC | | 67,967,739 | 40,302,952 |
| Fletcher Building Ltd. (l) | | 1,719,119 | 4,662,450 |
| Forterra PLC (h) | | 15,323,819 | 40,036,956 |
| Grupo Cementos de Chihuahua S.A.B. de C.V. | | 2,221,736 | 13,315,302 |
| Ibstock PLC | | 4,040,123 | 7,361,969 |
| Kingspan Group PLC | | 68,375 | 3,031,835 |
| Marshalls PLC | | 1,037,459 | 3,389,405 |
| PT Indocement Tunggal Prakarsa Tbk | | 24,754,200 | 15,443,435 |
| Reliance Worldwide Corp. | | 4,834,770 | 10,337,082 |
| Rinnai Corp. | | 89,900 | 6,453,817 |
| Somfy S.A. | | 92,596 | 8,630,202 |
| Techtronic Industries Co. Ltd. | | 1,483,000 | 14,010,564 |
| Toto Ltd. | | 145,700 | 4,865,095 |
| Zhejiang Supor Co. Ltd. (a) | | 2,302,302 | 14,977,041 |
| | | | | $198,368,158 |
| Consumer Products – 2.0% | |
| Amorepacific Corp. | | 208,183 | $14,708,824 |
| Dabur India Ltd. | | 2,506,366 | 17,561,499 |
| Essity AB | | 864,312 | 17,060,831 |
| Kobayashi Pharmaceutical Co. Ltd. | | 273,600 | 15,951,109 |
| Lion Corp. | | 1,082,500 | 12,200,555 |
| Mitsubishi Pencil Co. Ltd. | | 231,500 | 2,256,937 |
| PZ Cussons PLC | | 364,404 | 789,355 |
| Uni-Charm Corp. | | 883,600 | 28,882,126 |
| | | | | $109,411,236 |
| Consumer Services – 1.5% | |
| Afya Ltd. (a) | | 559,664 | $7,589,044 |
| Asante, Inc. | | 170,200 | 1,780,876 |
| Carsales.com Ltd. | | 582,054 | 6,926,440 |
| Heian Ceremony Service Co. | | 363,967 | 1,941,426 |
| Localiza Rent a Car S.A. | | 1,036,200 | 11,734,770 |
| Meitec Corp. | | 1,115,700 | 17,720,979 |
| Park24 Co. Ltd. (a) | | 358,200 | 4,625,688 |
| Seek Ltd. | | 762,170 | 9,222,087 |
Portfolio of Investments – continued
| Issuer | | | Shares/Par | Value ($) |
| Common Stocks – continued |
| Consumer Services – continued | |
| Trip.com Group Ltd. (a) | | 364,981 | $9,970,207 |
| Webjet Ltd. (a)(l) | | 3,441,422 | 10,403,181 |
| | | | | $81,914,698 |
| Containers – 1.7% | |
| Mayr-Melnhof Karton AG | | 133,652 | $17,153,893 |
| Toyo Seikan Group Holdings, Ltd. | | 1,427,000 | 17,222,416 |
| Verallia | | 1,784,413 | 40,005,125 |
| Viscofan S.A. | | 372,627 | 20,344,293 |
| | | | | $94,725,727 |
| Electrical Equipment – 2.5% | |
| Advantech Co. Ltd. | | 1,994,191 | $18,207,324 |
| Bharat Heavy Electricals Ltd. | | 14,453,222 | 10,541,360 |
| Halma PLC | | 552,548 | 12,441,685 |
| Legrand S.A. | | 604,998 | 39,088,249 |
| LS Electric Co. Ltd. | | 622,072 | 20,179,975 |
| OMRON Corp. | | 163,021 | 7,430,117 |
| Orbia Advance Corp. S.A.B. de C.V. | | 2,872,244 | 4,817,617 |
| Sagami Rubber Industries Co. Ltd. | | 264,700 | 1,386,224 |
| TAKUMA Co. Ltd. | | 969,000 | 8,316,451 |
| Voltronic Power Technology Corp. | | 350,659 | 15,352,389 |
| | | | | $137,761,391 |
| Electronics – 3.1% | |
| Amano Corp. | | 246,720 | $4,150,768 |
| ASM International N.V. | | 102,384 | 22,907,400 |
| ASM Pacific Technology Ltd. | | 3,105,500 | 18,694,787 |
| Cembre S.p.A. | | 542,000 | 12,592,000 |
| Chroma Ate, Inc. | | 5,253,000 | 29,444,328 |
| Fukui Computer Holdings, Inc. | | 205,100 | 4,806,550 |
| Hirose Electric Co. Ltd. | | 87,800 | 11,411,267 |
| INTER ACTION Corp. | | 467,700 | 4,927,934 |
| Iriso Electronics Co. Ltd. | | 218,500 | 5,985,991 |
| Melexis N.V. | | 178,211 | 12,058,220 |
| Tripod Technology Corp. | | 7,069,000 | 20,700,682 |
| WIN Semiconductors Corp. | | 2,853,000 | 11,133,925 |
| Zuken, Inc. | | 559,300 | 13,506,208 |
| | | | | $172,320,060 |
| Energy - Independent – 0.6% | |
| PT United Tractors Tbk | | 14,165,800 | $30,536,358 |
Portfolio of Investments – continued
| Issuer | | | Shares/Par | Value ($) |
| Common Stocks – continued |
| Energy - Integrated – 0.4% | |
| Capricorn Energy PLC (a) | | 545,875 | $1,493,267 |
| Galp Energia SGPS S.A., “B” | | 2,267,659 | 21,733,137 |
| | | | | $23,226,404 |
| Engineering - Construction – 0.7% | |
| Comsys Holdings Corp. (l) | | 384,800 | $6,516,535 |
| Corporacion Inmobiliaria Vesta S.A.B. de C.V. | | 4,200,348 | 7,825,272 |
| Doosan Bobcat, Inc. | | 830,627 | 16,480,550 |
| JGC Holdings Corp. | | 257,000 | 3,220,803 |
| Prologis Peroperty Mexico S.A. de C.V., REIT | | 1,795,595 | 4,563,991 |
| | | | | $38,607,151 |
| Entertainment – 1.2% | |
| CTS Eventim AG (a) | | 779,051 | $32,464,400 |
| Toei Co. Ltd. (l) | | 79,400 | 9,460,891 |
| Toho Co. Ltd. | | 605,800 | 21,830,944 |
| | | | | $63,756,235 |
| Food & Beverages – 6.0% | |
| ARIAKE JAPAN Co. Ltd. | | 308,900 | $10,646,975 |
| AVI Ltd. | | 4,871,301 | 19,545,560 |
| Bakkafrost P/f | | 525,592 | 20,815,646 |
| Britvic PLC | | 655,513 | 5,211,707 |
| Cranswick PLC | | 995,669 | 29,793,941 |
| Ezaki Glico Co. Ltd. | | 454,000 | 11,182,961 |
| Greencore Group PLC (a) | | 1,183,806 | 950,488 |
| Gruma S.A.B. de C.V. | | 662,620 | 6,346,702 |
| Kato Sangyo Co. Ltd. | | 648,500 | 14,985,050 |
| Kerry Group PLC | | 206,732 | 18,365,606 |
| Kikkoman Corp. | | 121,900 | 6,853,591 |
| Morinaga & Co. Ltd. | | 878,000 | 24,076,908 |
| Orion Corp. | | 370,291 | 26,534,593 |
| S Foods, Inc. | | 841,000 | 17,635,839 |
| Shenguan Holdings Group Ltd. | | 13,203,505 | 477,633 |
| T. Hasegawa Co. Ltd. (h)(l) | | 3,128,400 | 64,351,878 |
| Takasago International Corp. | | 161,300 | 2,954,489 |
| Tate & Lyle PLC | | 376,983 | 2,842,123 |
| Tingyi (Cayman Islands) Holdings Corp. | | 13,534,000 | 23,165,255 |
| Universal Robina Corp. | | 13,463,790 | 26,181,186 |
| | | | | $332,918,131 |
Portfolio of Investments – continued
| Issuer | | | Shares/Par | Value ($) |
| Common Stocks – continued |
| Food & Drug Stores – 1.5% | |
| Cosmos Pharmaceutical Corp. | | 59,200 | $5,841,244 |
| DFI Retail Group Holdings Ltd. | | 6,359,109 | 14,646,427 |
| JM Holdings Co. Ltd. | | 253,700 | 2,934,212 |
| Patlac Corp. | | 463,300 | 14,284,008 |
| San-A Co. Ltd. | | 87,700 | 2,644,998 |
| Sendas Distribuidora S.A. | | 1,753,600 | 5,705,169 |
| Spencer's Retail Ltd. (a) | | 723,473 | 682,505 |
| Sugi Holdings Co. Ltd. | | 234,200 | 9,401,658 |
| Sundrug Co. Ltd. | | 1,075,300 | 26,027,427 |
| | | | | $82,167,648 |
| Forest & Paper Products – 0.2% | |
| Suzano S.A. | | 1,122,200 | $9,257,445 |
| Furniture & Appliances – 1.0% | |
| Codan Ltd. | | 1,797,141 | $6,444,508 |
| Howden Joinery Group PLC | | 2,242,658 | 12,478,099 |
| Paramount Bed Holdings Co. Ltd. (l) | | 1,356,400 | 24,041,094 |
| SEB S.A. | | 162,083 | 10,166,284 |
| Zojirushi Corp. | | 177,300 | 1,913,091 |
| | | | | $55,043,076 |
| Gaming & Lodging – 0.8% | |
| Flutter Entertainment PLC (a) | | 238,874 | $26,179,213 |
| Shangri-La Asia Ltd. (a) | | 29,944,000 | 20,790,074 |
| | | | | $46,969,287 |
| General Merchandise – 1.1% | |
| Dollarama, Inc. | | 841,907 | $48,331,867 |
| Falabella S.A. | | 3,015,393 | 6,012,033 |
| Magazine Luiza S.A. (a) | | 5,190,959 | 4,311,084 |
| Seria Co. Ltd. (l) | | 183,200 | 3,188,318 |
| | | | | $61,843,302 |
| Insurance – 1.9% | |
| Admiral Group PLC | | 212,870 | $4,517,653 |
| AUB Group Ltd. | | 2,779,348 | 33,725,055 |
| Hiscox Ltd. | | 1,978,378 | 19,342,108 |
| Samsung Fire & Marine Insurance Co. Ltd. | | 174,448 | 22,376,513 |
| Steadfast Group Ltd. | | 7,747,030 | 22,828,475 |
| | | | | $102,789,804 |
Portfolio of Investments – continued
| Issuer | | | Shares/Par | Value ($) |
| Common Stocks – continued |
| Internet – 2.4% | |
| Allegro.EU S.A. (a) | | 1,061,840 | $4,546,346 |
| Auto Trader Group PLC | | 1,816,185 | 10,297,330 |
| Demae-Can Co. Ltd. (a)(l) | | 607,900 | 2,335,331 |
| Digital Garage, Inc. | | 353,700 | 8,376,493 |
| Kakaku.com, Inc. | | 556,300 | 9,353,495 |
| MakeMyTrip Ltd. (a) | | 1,069,505 | 32,833,803 |
| Moneysupermarket.com Group PLC | | 8,111,982 | 16,723,582 |
| Proto Corp. | | 1,137,400 | 8,106,774 |
| Rakuten Group, Inc. | | 119,300 | 511,886 |
| Rightmove PLC | | 2,982,371 | 15,819,002 |
| Scout24 AG | | 468,540 | 23,749,443 |
| | | | | $132,653,485 |
| Leisure & Toys – 1.0% | |
| DeNA Co. Ltd. | | 339,900 | $4,295,427 |
| GungHo Online Entertainment, Inc. | | 326,600 | 5,020,970 |
| Kawai Musical Instruments Manufacturing Co. Ltd. | | 119,800 | 2,086,757 |
| Konami Group Corp. | | 80,900 | 3,733,932 |
| NCSoft Corp. | | 46,283 | 11,085,030 |
| Thule Group AB | | 296,227 | 5,883,481 |
| VTech Holdings Ltd. | | 3,825,465 | 21,860,532 |
| | | | | $53,966,129 |
| Machinery & Tools – 5.6% | |
| Aalberts Industries N.V. | | 314,000 | $10,260,253 |
| AirTAC International Group | | 306,000 | 7,000,341 |
| Azbil Corp. (l) | | 820,800 | 21,423,459 |
| Carel Industries S.p.A. | | 139,219 | 2,601,540 |
| Daifuku Co. Ltd. (l) | | 84,700 | 3,985,400 |
| Fuji Seal International, Inc. | | 1,662,300 | 17,604,519 |
| Fujitec Co. Ltd. (l) | | 1,443,300 | 29,172,260 |
| Fukushima Galilei Co. Ltd. | | 610,000 | 14,987,540 |
| GEA Group AG | | 1,326,234 | 43,334,520 |
| Haitian International Holdings Ltd. (a) | | 13,725,000 | 25,827,549 |
| METAWATER Co. Ltd. | | 1,086,000 | 14,257,185 |
| MISUMI Group, Inc. | | 225,900 | 4,806,237 |
| MonotaRO Co. Ltd. | | 663,700 | 10,032,134 |
| Nabtesco Corp. | | 815,900 | 16,706,558 |
| Nissei ASB Machine Co. Ltd. | | 151,400 | 3,744,987 |
| Obara Group, Inc. (l) | | 128,500 | 2,845,830 |
| Rational AG | | 2,758 | 1,347,064 |
| Rotork PLC | | 2,206,516 | 5,751,447 |
| Seven Group Holdings Ltd. | | 980,316 | 10,535,545 |
| Shima Seiki Manufacturing Ltd. (l) | | 191,900 | 2,670,792 |
Portfolio of Investments – continued
| Issuer | | | Shares/Par | Value ($) |
| Common Stocks – continued |
| Machinery & Tools – continued | |
| SIG Combibloc Group AG | | 1,599,421 | $32,495,613 |
| Spirax-Sarco Engineering PLC | | 110,367 | 12,677,895 |
| THK Co. Ltd. | | 133,700 | 2,313,265 |
| Valmet Oyj | | 369,810 | 7,458,305 |
| VAT Group AG | | 39,758 | 8,026,605 |
| | | | | $311,866,843 |
| Major Banks – 0.2% | |
| Resona Holdings, Inc. | | 3,014,300 | $10,996,686 |
| Medical & Health Technology & Services – 1.5% | |
| ARATA Corp. | | 148,400 | $4,214,219 |
| Arvida Group Ltd. | | 4,691,293 | 3,780,694 |
| AS ONE Corp. | | 358,400 | 14,743,032 |
| BML, Inc. | | 587,500 | 13,253,271 |
| Burning Rock Biotech Ltd., ADR (a)(l) | | 285,384 | 682,068 |
| DKSH Holding Ltd. | | 45,850 | 3,322,475 |
| Guangzhou KingMed Diagnostics Group Co. Ltd. | | 668,700 | 5,971,097 |
| Hapvida Participacoes e Investimentos S.A. | | 4,186,300 | 5,874,719 |
| Hogy Medical Co. Ltd. | | 79,600 | 1,952,463 |
| ICON PLC (a) | | 40,266 | 7,400,086 |
| Medipal Holdings Corp. | | 724,100 | 9,178,186 |
| Ryman Healthcare Ltd. | | 1,571,180 | 7,518,108 |
| Selcuk Ecza Deposu Ticaret ve Sanayi A.S. | | 2,590,718 | 3,219,745 |
| | | | | $81,110,163 |
| Medical Equipment – 3.4% | |
| ConvaTec Group PLC | | 3,915,066 | $8,873,355 |
| Demant A.S. (a) | | 271,692 | 6,695,191 |
| Eiken Chemical Co. Ltd. | | 753,900 | 9,355,382 |
| Fukuda Denshi Co. Ltd. | | 312,700 | 15,512,928 |
| Gerresheimer AG | | 540,504 | 26,542,221 |
| JEOL Ltd. | | 239,800 | 7,904,250 |
| Nakanishi, Inc. | | 2,268,700 | 41,193,092 |
| Nihon Kohden Corp. | | 521,600 | 11,018,697 |
| PerkinElmer, Inc. | | 20,198 | 2,430,425 |
| Shimadzu Corp. | | 624,700 | 16,260,880 |
| Smith & Nephew PLC | | 1,794,613 | 20,704,169 |
| Sonova Holding AG | | 104,118 | 22,896,558 |
| Straumann Group | | 11,710 | 1,065,718 |
| | | | | $190,452,866 |
Portfolio of Investments – continued
| Issuer | | | Shares/Par | Value ($) |
| Common Stocks – continued |
| Metals & Mining – 0.7% | |
| Deterra Royalties Ltd. | | 3,908,506 | $10,000,304 |
| Iluka Resources Ltd. | | 2,666,873 | 15,372,207 |
| MOIL Ltd. | | 6,090,545 | 11,188,912 |
| | | | | $36,561,423 |
| Natural Gas - Distribution – 1.3% | |
| China Resources Gas Group Ltd. | | 6,976,000 | $22,018,814 |
| DCC PLC | | 419,603 | 21,829,641 |
| Italgas S.p.A. | | 5,939,723 | 27,609,863 |
| | | | | $71,458,318 |
| Network & Telecom – 0.1% | |
| NOHMI BOSAI Ltd. | | 678,100 | $7,534,033 |
| Other Banks & Diversified Financials – 4.2% | |
| AEON Financial Service Co. Ltd. | | 2,490,600 | $24,691,008 |
| AEON Thana Sinsap Public Co. Ltd. | | 2,563,700 | 11,180,505 |
| Allfunds Group PLC | | 645,334 | 4,730,655 |
| Banco Santander Chile S.A. | | 157,118,269 | 5,489,344 |
| Bancolombia S.A., ADR | | 188,347 | 4,590,016 |
| Bank of Kyoto Ltd. | | 430,900 | 15,749,748 |
| Chiba Bank Ltd. (l) | | 3,432,551 | 18,475,487 |
| Credicorp Ltd. | | 45,767 | 5,620,188 |
| E.Sun Financial Holding Co. Ltd. | | 20,629,379 | 16,675,022 |
| FinecoBank S.p.A. | | 921,506 | 11,326,313 |
| Iress Ltd. | | 1,560,926 | 8,818,825 |
| Julius Baer Group Ltd. | | 391,642 | 17,041,659 |
| Jyske Bank A.S. (a) | | 285,747 | 14,742,106 |
| Metropolitan Bank & Trust Co. | | 27,226,417 | 22,524,200 |
| Shizuoka Bank Ltd. (l) | | 3,409,900 | 20,821,543 |
| Shriram Transport Finance Co. Ltd. | | 1,710,637 | 25,129,477 |
| Zenkoku Hosho Co. Ltd. | | 180,300 | 5,967,151 |
| | | | | $233,573,247 |
| Pharmaceuticals – 1.9% | |
| Daito Pharmaceutical Co. Ltd. | | 632,900 | $10,720,260 |
| Genomma Lab Internacional S.A., “B” (l) | | 10,386,264 | 7,137,510 |
| Hypera S.A. | | 1,439,745 | 11,810,267 |
| Ipca Laboratories Ltd. | | 1,514,795 | 16,939,741 |
| Kalbe Farma Tbk PT | | 320,876,300 | 38,562,051 |
| Santen Pharmaceutical Co. Ltd. | | 2,042,300 | 13,686,755 |
| Suzuken Co. Ltd./Aichi Japan | | 339,200 | 7,733,939 |
| | | | | $106,590,523 |
Portfolio of Investments – continued
| Issuer | | | Shares/Par | Value ($) |
| Common Stocks – continued |
| Pollution Control – 1.4% | |
| ALS Ltd. | | 1,231,065 | $7,925,768 |
| Daiseki Co. Ltd. | | 2,215,440 | 67,592,049 |
| | | | | $75,517,817 |
| Precious Metals & Minerals – 0.5% | |
| Agnico Eagle Mines Ltd. | | 642,196 | $27,131,834 |
| Compania de Minas Buenaventura S.A.A., ADR | | 392,797 | 2,643,524 |
| | | | | $29,775,358 |
| Printing & Publishing – 0.4% | |
| China Literature Ltd. (a) | | 2,235,200 | $6,251,108 |
| Wolters Kluwer N.V. | | 177,849 | 17,315,569 |
| | | | | $23,566,677 |
| Railroad & Shipping – 0.5% | |
| Rumo S.A. | | 2,763,468 | $9,467,107 |
| Sankyu, Inc. | | 610,100 | 17,626,681 |
| | | | | $27,093,788 |
| Real Estate – 3.5% | |
| Big Yellow Group PLC, REIT | | 1,051,241 | $12,379,082 |
| CapitaLand India Trusts IEU, REIT | | 12,556,800 | 9,129,530 |
| CapitaLand Investment Ltd. | | 5,080,900 | 12,238,539 |
| CDL Hospitality Trusts, REIT | | 460,877 | 373,164 |
| Cedar Woods Properties Ltd. | | 1,914,153 | 4,896,476 |
| City Developments Ltd. | | 2,898,600 | 15,281,298 |
| Embassy Office Parks REIT | | 3,371,200 | 14,331,627 |
| ESR Group Ltd. | | 6,615,600 | 16,687,226 |
| LEG Immobilien SE | | 642,550 | 38,640,302 |
| Mapletree Commercial Trust, REIT | | 10,507,100 | 12,549,885 |
| Midland Holdings Ltd. (a)(h) | | 43,113,000 | 3,066,471 |
| Shaftesbury PLC, REIT | | 1,325,995 | 5,415,699 |
| Swire Properties Ltd. | | 6,712,000 | 14,423,559 |
| TAG Immobilien AG | | 766,358 | 6,170,033 |
| Unite Group PLC, REIT | | 2,860,013 | 27,120,507 |
| | | | | $192,703,398 |
| Restaurants – 1.6% | |
| Cafe de Coral Holdings Ltd. | | 16,092,000 | $19,899,625 |
| Greggs PLC | | 1,678,687 | 31,817,935 |
| Sodexo | | 490,376 | 36,880,827 |
| | | | | $88,598,387 |
Portfolio of Investments – continued
| Issuer | | | Shares/Par | Value ($) |
| Common Stocks – continued |
| Specialty Chemicals – 4.9% | |
| Air Water, Inc. | | 783,300 | $9,263,109 |
| Croda International PLC | | 691,556 | 49,400,778 |
| Essentra PLC | | 10,681,931 | 21,475,666 |
| Japan Pure Chemical Co. Ltd. | | 41,700 | 666,983 |
| Kansai Paint Co. Ltd. | | 1,037,000 | 14,666,890 |
| Kureha Corp. | | 137,000 | 8,378,646 |
| Nihon Parkerizing Co. Ltd. | | 1,049,600 | 6,765,596 |
| Nitto Denko Corp. | | 144,400 | 7,829,544 |
| NOF Corp. | | 320,000 | 11,602,407 |
| Sika AG | | 168,977 | 33,837,346 |
| SK KAKEN Co. Ltd. | | 118,100 | 31,293,685 |
| Symrise AG | | 735,961 | 72,452,434 |
| Taisei Lamick Co. Ltd. | | 219,800 | 4,162,729 |
| | | | | $271,795,813 |
| Specialty Stores – 2.2% | |
| ABC-Mart, Inc. | | 192,300 | $8,277,683 |
| Just Eat Takeaway (a) | | 1,208,551 | 18,425,738 |
| Just Eat Takeaway.com (a) | | 75,723 | 1,169,572 |
| Kitanotatsujin Corp. | | 1,132,600 | 2,016,694 |
| Lojas Renner S.A. | | 2,236,999 | 11,549,199 |
| Multiplan Empreendimentos Imobiliarios S.A. | | 4,621,720 | 20,708,143 |
| Nick Scali Ltd. | | 400,116 | 2,359,923 |
| Nishimatsuya Chain Co. Ltd. (l) | | 1,316,100 | 12,161,720 |
| Ryohin Keikaku Co. Ltd. | | 1,186,100 | 9,845,688 |
| Shimamura Co. Ltd. | | 52,800 | 4,461,715 |
| Vipshop Holdings Ltd., ADR (a) | | 810,507 | 6,816,364 |
| ZOZO, Inc. | | 1,281,600 | 25,626,687 |
| | | | | $123,419,126 |
| Telecommunications - Wireless – 0.8% | |
| Cellnex Telecom S.A. | | 1,466,587 | $45,216,879 |
| Telephone Services – 1.0% | |
| Helios Towers PLC (a) | | 3,888,393 | $4,868,411 |
| Hellenic Telecommunications Organization S.A. | | 1,901,706 | 27,676,940 |
| Infrastrutture Wireless Italiane S.p.A. | | 1,249,006 | 10,920,252 |
| NOS, SGPS S.A. | | 2,166,413 | 7,073,666 |
| Operadora de Sites Mexicanos, S.A. de C.V., REIT, “A-1” (l) | | 6,836,700 | 5,682,681 |
| | | | | $56,221,950 |
| Tobacco – 0.6% | |
| Swedish Match AB | | 3,231,010 | $31,988,008 |
Portfolio of Investments – continued
| Issuer | | | Shares/Par | Value ($) |
| Common Stocks – continued |
| Trucking – 1.6% | |
| Freightways Ltd. | | 2,126,298 | $11,661,830 |
| Hamakyorex Co. Ltd. | | 114,900 | 2,496,401 |
| Seino Holdings Co. Ltd. | | 3,715,600 | 29,831,326 |
| Senko Group Holdings Co. Ltd. | | 657,300 | 4,350,735 |
| SG Holdings Co. Ltd. | | 1,043,800 | 14,185,355 |
| Trancom Co. Ltd. | | 95,100 | 4,981,962 |
| Yamato Holdings Co. Ltd. | | 1,477,400 | 22,116,445 |
| | | | | $89,624,054 |
| Utilities - Electric Power – 1.0% | |
| CESC Ltd. | | 30,954,810 | $29,281,152 |
| Energisa S.A., IEU | | 1,279,200 | 9,933,669 |
| Equatorial Energia S.A. | | 2,025,500 | 10,100,559 |
| Transmissora Alianca de Energia Eletrica S.A., IEU | | 1,121,343 | 8,096,677 |
| | | | | $57,412,057 |
| Utilities - Water – 0.2% | |
| Aguas Andinas S.A., “A” | | 36,715,629 | $7,128,372 |
| Companhia de Saneamento Basico do Estado de Sao Paulo | | 485,700 | 4,465,917 |
| | | | | $11,594,289 |
| Total Common Stocks (Identified Cost, $5,549,729,632) | | $5,275,588,640 |
| Preferred Stocks – 0.2% |
| Metals & Mining – 0.2% | | | | |
| Gerdau S.A. (Identified Cost, $10,492,018) | | 2,660,500 | $12,053,838 |
| | Strike
Price | First
Exercise | | |
| Rights – 0.0% |
| Other Banks & Diversified Financials – 0.0% |
| Localiza Rent a Car S.A. (1 share for 1 right, Expiration 11/11/2022) (a) (Identified Cost, $0) | BRL 50.35 | 11/11/22 | 3,179 | $6,329 |
Portfolio of Investments – continued
| Issuer | | | Shares/Par | Value ($) |
| Investment Companies (h) – 4.1% |
| Money Market Funds – 4.1% | |
| MFS Institutional Money Market Portfolio, 2.64% (v) (Identified Cost, $225,019,152) | | | 225,023,753 | $225,046,256 |
| Collateral for Securities Loaned – 0.1% |
| JPMorgan U.S. Government Money Market Fund - Class IM Shares, 2.72% (j) (Identified Cost, $7,542,791) | | | 7,542,791 | $7,542,791 |
|
|
| Other Assets, Less Liabilities – 0.2% | | 8,996,151 |
| Net Assets – 100.0% | $5,529,234,005 |
| (a) | Non-income producing security. | | | |
| (h) | An affiliated issuer, which may be considered one in which the fund owns 5% or more of the outstanding voting securities, or a company which is under common control. At period end, the aggregate values of the fund's investments in affiliated issuers and in unaffiliated issuers were $342,379,788 and $5,177,858,066, respectively. | | | |
| (j) | The rate quoted is the annualized seven-day yield of the fund at period end. | | | |
| (l) | A portion of this security is on loan. See Note 2 for additional information. | | | |
| (u) | The security was valued using significant unobservable inputs and is considered level 3 under the fair value hierarchy. For further information about the fund’s level 3 holdings, please see Note 2 in the Notes to Financial Statements. | | | |
| (v) | Affiliated issuer that is available only to investment companies managed by MFS. The rate quoted for the MFS Institutional Money Market Portfolio is the annualized seven-day yield of the fund at period end. | | | |
| The following abbreviations are used in this report and are defined: |
| ADR | American Depositary Receipt |
| IEU | International Equity Unit |
| REIT | Real Estate Investment Trust |
| Abbreviations indicate amounts shown in currencies other than the U.S. dollar. All amounts are stated in U.S. dollars unless otherwise indicated. A list of abbreviations is shown below: |
| BRL | Brazilian Real |
See Notes to Financial Statements
Financial Statements
Statement of Assets and Liabilities
At 9/30/22
This statement represents your fund’s balance sheet, which details the assets and liabilities comprising the total value of the fund.
| Assets | |
| Investments in unaffiliated issuers, at value, including $42,557,199 of securities on loan (identified cost, $5,429,944,077) | $5,177,858,066 |
| Investments in affiliated issuers, at value (identified cost, $362,839,516) | 342,379,788 |
| Cash | 1,885,875 |
| Receivables for | |
| Investments sold | 4,523,610 |
| Fund shares sold | 6,710,054 |
| Interest and dividends | 29,166,463 |
| Other assets | 2,348 |
| Total assets | $5,562,526,204 |
| Liabilities | |
| Payable to custodian | $147,481 |
| Payables for | |
| Investments purchased | 8,554,625 |
| Fund shares reacquired | 12,559,576 |
| Collateral for securities loaned, at value (c) | 7,542,791 |
| Payable to affiliates | |
| Investment adviser | 264,070 |
| Administrative services fee | 3,502 |
| Shareholder servicing costs | 826,073 |
| Distribution and service fees | 10,448 |
| Payable for independent Trustees' compensation | 15,678 |
| Deferred country tax expense payable | 2,418,002 |
| Accrued expenses and other liabilities | 949,953 |
| Total liabilities | $33,292,199 |
| Net assets | $5,529,234,005 |
| Net assets consist of | |
| Paid-in capital | $5,501,628,467 |
| Total distributable earnings (loss) | 27,605,538 |
| Net assets | $5,529,234,005 |
| Shares of beneficial interest outstanding | 206,361,568 |
| (c) | Non-cash collateral is not included. |
Statement of Assets and Liabilities – continued
| | Net assets | Shares
outstanding | Net asset value
per share (a) |
| Class A | $546,844,772 | 21,042,556 | $25.99 |
| Class B | 2,150,935 | 86,485 | 24.87 |
| Class C | 14,754,905 | 606,060 | 24.35 |
| Class I | 734,604,804 | 27,293,292 | 26.92 |
| Class R1 | 1,196,042 | 50,814 | 23.54 |
| Class R2 | 14,567,812 | 579,790 | 25.13 |
| Class R3 | 109,711,915 | 4,270,606 | 25.69 |
| Class R4 | 82,389,813 | 3,170,725 | 25.98 |
| Class R6 | 4,023,013,007 | 149,261,240 | 26.95 |
| (a) | Maximum offering price per share was equal to the net asset value per share for all share classes, except for Class A, for which the maximum offering price per share was $27.58 [100 / 94.25 x $25.99]. On sales of $50,000 or more, the maximum offering price of Class A shares is reduced. A contingent deferred sales charge may be imposed on redemptions of Class A, Class B, and Class C shares. Redemption price per share was equal to the net asset value per share for Classes I, R1, R2, R3, R4, and R6. |
See Notes to Financial Statements
Financial Statements
Statement of Operations
Year ended 9/30/22
This statement describes how much your fund earned in investment income and accrued in expenses. It also describes any gains and/or losses generated by fund operations.
| Net investment income (loss) | |
| Income | |
| Dividends | $162,550,943 |
| Dividends from affiliated issuers | 5,275,143 |
| Income on securities loaned | 258,172 |
| Other | 1,222 |
| Foreign taxes withheld | (14,259,241) |
| Total investment income | $153,826,239 |
| Expenses | |
| Management fee | $61,875,358 |
| Distribution and service fees | 2,646,695 |
| Shareholder servicing costs | 3,098,178 |
| Program manager fees | 3,149 |
| Administrative services fee | 649,368 |
| Independent Trustees' compensation | 96,946 |
| Custodian fee | 1,794,949 |
| Shareholder communications | 220,752 |
| Audit and tax fees | 83,562 |
| Legal fees | 31,057 |
| Miscellaneous | 373,293 |
| Total expenses | $70,873,307 |
| Fees paid indirectly | (3,776) |
| Reduction of expenses by investment adviser and distributor | (1,012,021) |
| Net expenses | $69,857,510 |
| Net investment income (loss) | $83,968,729 |
| Realized and unrealized gain (loss) |
| Realized gain (loss) (identified cost basis) | |
| Unaffiliated issuers (net of $1,844,487 country tax) | $364,702,164 |
| Affiliated issuers | (10,132) |
| Foreign currency | (5,935,229) |
| Net realized gain (loss) | $358,756,803 |
| Change in unrealized appreciation or depreciation | |
| Unaffiliated issuers (net of $446,275 decrease in deferred country tax) | $(2,757,703,181) |
| Affiliated issuers | (43,758,594) |
| Translation of assets and liabilities in foreign currencies | (1,007,094) |
| Net unrealized gain (loss) | $(2,802,468,869) |
| Net realized and unrealized gain (loss) | $(2,443,712,066) |
| Change in net assets from operations | $(2,359,743,337) |
See Notes to Financial Statements
Financial Statements
Statements of Changes in Net Assets
These statements describe the increases and/or decreases in net assets resulting from operations, any distributions, and any shareholder transactions.
| | Year ended |
| | 9/30/22 | 9/30/21 |
| Change in net assets | | |
| From operations | | |
| Net investment income (loss) | $83,968,729 | $78,615,737 |
| Net realized gain (loss) | 358,756,803 | 297,914,556 |
| Net unrealized gain (loss) | (2,802,468,869) | 902,522,964 |
| Change in net assets from operations | $(2,359,743,337) | $1,279,053,257 |
| Total distributions to shareholders | $(403,492,683) | $(294,377,309) |
| Change in net assets from fund share transactions | $79,421,966 | $446,999,628 |
| Total change in net assets | $(2,683,814,054) | $1,431,675,576 |
| Net assets | | |
| At beginning of period | 8,213,048,059 | 6,781,372,483 |
| At end of period | $5,529,234,005 | $8,213,048,059 |
See Notes to Financial Statements
Financial Statements
Financial Highlights
The financial highlights table is intended to help you understand the fund's financial performance for the past 5 years. Certain information reflects financial results for a single fund share. The total returns in the table represent the rate that an investor would have earned (or lost) on an investment in the fund share class (assuming reinvestment of all distributions) held for the entire period.
| Class A | Year ended |
| | 9/30/22 | 9/30/21 | 9/30/20 | 9/30/19 | 9/30/18 |
| Net asset value, beginning of period | $38.59 | $33.91 | $32.56 | $35.00 | $33.42 |
| Income (loss) from investment operations |
| Net investment income (loss) (d) | $0.27 | $0.27 | $0.13 | $0.29 | $0.22 |
| Net realized and unrealized gain (loss) | (11.06) | 5.80 | 2.09 | (0.82) | 2.22 |
| Total from investment operations | $(10.79) | $6.07 | $2.22 | $(0.53) | $2.44 |
| Less distributions declared to shareholders |
| From net investment income | $(0.37) | $(0.03) | $(0.35) | $(0.20) | $(0.28) |
| From net realized gain | (1.44) | (1.36) | (0.52) | (1.71) | (0.58) |
| Total distributions declared to shareholders | $(1.81) | $(1.39) | $(0.87) | $(1.91) | $(0.86) |
| Net asset value, end of period (x) | $25.99 | $38.59 | $33.91 | $32.56 | $35.00 |
| Total return (%) (r)(s)(t)(x) | (29.31) | 18.25 | 6.83 | (0.85) | 7.40 |
Ratios (%) (to average net assets)
and Supplemental data: |
| Expenses before expense reductions (f) | 1.30 | 1.28 | 1.29 | 1.29 | 1.30 |
| Expenses after expense reductions (f) | 1.28 | 1.27 | 1.28 | 1.28 | 1.29 |
| Net investment income (loss) | 0.84 | 0.73 | 0.39 | 0.90 | 0.62 |
| Portfolio turnover | 12 | 11 | 25 | 14 | 21 |
| Net assets at end of period (000 omitted) | $546,845 | $885,605 | $871,605 | $1,015,817 | $1,163,703 |
See Notes to Financial Statements
Financial Highlights – continued
| Class B | Year ended |
| | 9/30/22 | 9/30/21 | 9/30/20 | 9/30/19 | 9/30/18 |
| Net asset value, beginning of period | $36.95 | $32.73 | $31.42 | $33.86 | $32.36 |
| Income (loss) from investment operations |
| Net investment income (loss) (d) | $0.00(w) | $(0.04) | $(0.13) | $0.04 | $(0.05) |
| Net realized and unrealized gain (loss) | (10.59) | 5.62 | 2.02 | (0.77) | 2.16 |
| Total from investment operations | $(10.59) | $5.58 | $1.89 | $(0.73) | $2.11 |
| Less distributions declared to shareholders |
| From net investment income | $(0.05) | $— | $(0.06) | $— | $(0.03) |
| From net realized gain | (1.44) | (1.36) | (0.52) | (1.71) | (0.58) |
| Total distributions declared to shareholders | $(1.49) | $(1.36) | $(0.58) | $(1.71) | $(0.61) |
| Net asset value, end of period (x) | $24.87 | $36.95 | $32.73 | $31.42 | $33.86 |
| Total return (%) (r)(s)(t)(x) | (29.85) | 17.37 | 6.03 | (1.57) | 6.59 |
Ratios (%) (to average net assets)
and Supplemental data: |
| Expenses before expense reductions (f) | 2.05 | 2.03 | 2.04 | 2.04 | 2.05 |
| Expenses after expense reductions (f) | 2.03 | 2.02 | 2.03 | 2.03 | 2.03 |
| Net investment income (loss) | 0.01 | (0.11) | (0.43) | 0.12 | (0.14) |
| Portfolio turnover | 12 | 11 | 25 | 14 | 21 |
| Net assets at end of period (000 omitted) | $2,151 | $5,180 | $5,875 | $9,834 | $13,212 |
| Class C | Year ended |
| | 9/30/22 | 9/30/21 | 9/30/20 | 9/30/19 | 9/30/18 |
| Net asset value, beginning of period | $36.17 | $32.06 | $30.80 | $33.24 | $31.78 |
| Income (loss) from investment operations |
| Net investment income (loss) (d) | $0.01 | $(0.05) | $(0.12) | $0.03 | $(0.08) |
| Net realized and unrealized gain (loss) | (10.38) | 5.52 | 1.98 | (0.76) | 2.15 |
| Total from investment operations | $(10.37) | $5.47 | $1.86 | $(0.73) | $2.07 |
| Less distributions declared to shareholders |
| From net investment income | $(0.01) | $— | $(0.08) | $— | $(0.03) |
| From net realized gain | (1.44) | (1.36) | (0.52) | (1.71) | (0.58) |
| Total distributions declared to shareholders | $(1.45) | $(1.36) | $(0.60) | $(1.71) | $(0.61) |
| Net asset value, end of period (x) | $24.35 | $36.17 | $32.06 | $30.80 | $33.24 |
| Total return (%) (r)(s)(t)(x) | (29.84) | 17.39 | 6.04 | (1.60) | 6.58 |
Ratios (%) (to average net assets)
and Supplemental data: |
| Expenses before expense reductions (f) | 2.05 | 2.03 | 2.04 | 2.04 | 2.04 |
| Expenses after expense reductions (f) | 2.03 | 2.02 | 2.03 | 2.03 | 2.03 |
| Net investment income (loss) | 0.03 | (0.14) | (0.40) | 0.10 | (0.25) |
| Portfolio turnover | 12 | 11 | 25 | 14 | 21 |
| Net assets at end of period (000 omitted) | $14,755 | $30,413 | $42,312 | $60,916 | $84,044 |
See Notes to Financial Statements
Financial Highlights – continued
| Class I | Year ended |
| | 9/30/22 | 9/30/21 | 9/30/20 | 9/30/19 | 9/30/18 |
| Net asset value, beginning of period | $39.91 | $35.02 | $33.59 | $36.06 | $34.41 |
| Income (loss) from investment operations |
| Net investment income (loss) (d) | $0.37 | $0.35 | $0.18 | $0.39 | $0.32 |
| Net realized and unrealized gain (loss) | (11.44) | 6.02 | 2.21 | (0.86) | 2.27 |
| Total from investment operations | $(11.07) | $6.37 | $2.39 | $(0.47) | $2.59 |
| Less distributions declared to shareholders |
| From net investment income | $(0.48) | $(0.12) | $(0.44) | $(0.29) | $(0.36) |
| From net realized gain | (1.44) | (1.36) | (0.52) | (1.71) | (0.58) |
| Total distributions declared to shareholders | $(1.92) | $(1.48) | $(0.96) | $(2.00) | $(0.94) |
| Net asset value, end of period (x) | $26.92 | $39.91 | $35.02 | $33.59 | $36.06 |
| Total return (%) (r)(s)(t)(x) | (29.13) | 18.54 | 7.12 | (0.62) | 7.65 |
Ratios (%) (to average net assets)
and Supplemental data: |
| Expenses before expense reductions (f) | 1.05 | 1.03 | 1.04 | 1.04 | 1.05 |
| Expenses after expense reductions (f) | 1.03 | 1.02 | 1.03 | 1.03 | 1.04 |
| Net investment income (loss) | 1.08 | 0.91 | 0.55 | 1.18 | 0.87 |
| Portfolio turnover | 12 | 11 | 25 | 14 | 21 |
| Net assets at end of period (000 omitted) | $734,605 | $1,235,625 | $1,230,970 | $2,049,197 | $2,094,665 |
See Notes to Financial Statements
Financial Highlights – continued
| Class R1 | Year ended |
| | 9/30/22 | 9/30/21 | 9/30/20 | 9/30/19 | 9/30/18 |
| Net asset value, beginning of period | $35.12 | $31.16 | $30.01 | $32.44 | $31.03 |
| Income (loss) from investment operations |
| Net investment income (loss) (d) | $0.03 | $(0.02) | $(0.13) | $0.04 | $(0.07) |
| Net realized and unrealized gain (loss) | (10.05) | 5.34 | 1.94 | (0.76) | 2.09 |
| Total from investment operations | $(10.02) | $5.32 | $1.81 | $(0.72) | $2.02 |
| Less distributions declared to shareholders |
| From net investment income | $(0.12) | $— | $(0.14) | $— | $(0.03) |
| From net realized gain | (1.44) | (1.36) | (0.52) | (1.71) | (0.58) |
| Total distributions declared to shareholders | $(1.56) | $(1.36) | $(0.66) | $(1.71) | $(0.61) |
| Net asset value, end of period (x) | $23.54 | $35.12 | $31.16 | $30.01 | $32.44 |
| Total return (%) (r)(s)(t)(x) | (29.84) | 17.41 | 6.03 | (1.61) | 6.59 |
Ratios (%) (to average net assets)
and Supplemental data: |
| Expenses before expense reductions (f) | 2.05 | 2.03 | 2.04 | 2.04 | 2.05 |
| Expenses after expense reductions (f) | 2.03 | 2.02 | 2.03 | 2.03 | 2.04 |
| Net investment income (loss) | 0.11 | (0.07) | (0.45) | 0.14 | (0.21) |
| Portfolio turnover | 12 | 11 | 25 | 14 | 21 |
| Net assets at end of period (000 omitted) | $1,196 | $1,658 | $1,622 | $2,320 | $2,471 |
| Class R2 | Year ended |
| | 9/30/22 | 9/30/21 | 9/30/20 | 9/30/19 | 9/30/18 |
| Net asset value, beginning of period | $37.36 | $32.92 | $31.63 | $34.02 | $32.51 |
| Income (loss) from investment operations |
| Net investment income (loss) (d) | $0.19 | $0.15 | $0.01 | $0.22 | $0.12 |
| Net realized and unrealized gain (loss) | (10.71) | 5.65 | 2.07 | (0.81) | 2.17 |
| Total from investment operations | $(10.52) | $5.80 | $2.08 | $(0.59) | $2.29 |
| Less distributions declared to shareholders |
| From net investment income | $(0.27) | $— | $(0.27) | $(0.09) | $(0.20) |
| From net realized gain | (1.44) | (1.36) | (0.52) | (1.71) | (0.58) |
| Total distributions declared to shareholders | $(1.71) | $(1.36) | $(0.79) | $(1.80) | $(0.78) |
| Net asset value, end of period (x) | $25.13 | $37.36 | $32.92 | $31.63 | $34.02 |
| Total return (%) (r)(s)(t)(x) | (29.48) | 17.95 | 6.58 | (1.10) | 7.13 |
Ratios (%) (to average net assets)
and Supplemental data: |
| Expenses before expense reductions (f) | 1.55 | 1.53 | 1.54 | 1.54 | 1.55 |
| Expenses after expense reductions (f) | 1.53 | 1.52 | 1.53 | 1.53 | 1.54 |
| Net investment income (loss) | 0.60 | 0.42 | 0.03 | 0.71 | 0.35 |
| Portfolio turnover | 12 | 11 | 25 | 14 | 21 |
| Net assets at end of period (000 omitted) | $14,568 | $24,443 | $24,546 | $43,493 | $48,630 |
See Notes to Financial Statements
Financial Highlights – continued
| Class R3 | Year ended |
| | 9/30/22 | 9/30/21 | 9/30/20 | 9/30/19 | 9/30/18 |
| Net asset value, beginning of period | $38.19 | $33.58 | $32.25 | $34.69 | $33.14 |
| Income (loss) from investment operations |
| Net investment income (loss) (d) | $0.26 | $0.29 | $0.13 | $0.29 | $0.20 |
| Net realized and unrealized gain (loss) | (10.92) | 5.72 | 2.08 | (0.83) | 2.21 |
| Total from investment operations | $(10.66) | $6.01 | $2.21 | $(0.54) | $2.41 |
| Less distributions declared to shareholders |
| From net investment income | $(0.40) | $(0.04) | $(0.36) | $(0.19) | $(0.28) |
| From net realized gain | (1.44) | (1.36) | (0.52) | (1.71) | (0.58) |
| Total distributions declared to shareholders | $(1.84) | $(1.40) | $(0.88) | $(1.90) | $(0.86) |
| Net asset value, end of period (x) | $25.69 | $38.19 | $33.58 | $32.25 | $34.69 |
| Total return (%) (r)(s)(t)(x) | (29.32) | 18.25 | 6.86 | (0.88) | 7.39 |
Ratios (%) (to average net assets)
and Supplemental data: |
| Expenses before expense reductions (f) | 1.30 | 1.28 | 1.29 | 1.29 | 1.30 |
| Expenses after expense reductions (f) | 1.28 | 1.27 | 1.28 | 1.28 | 1.29 |
| Net investment income (loss) | 0.79 | 0.78 | 0.42 | 0.92 | 0.58 |
| Portfolio turnover | 12 | 11 | 25 | 14 | 21 |
| Net assets at end of period (000 omitted) | $109,712 | $201,807 | $142,713 | $132,789 | $146,726 |
| Class R4 | Year ended |
| | 9/30/22 | 9/30/21 | 9/30/20 | 9/30/19 | 9/30/18 |
| Net asset value, beginning of period | $38.57 | $33.89 | $32.54 | $35.00 | $33.43 |
| Income (loss) from investment operations |
| Net investment income (loss) (d) | $0.34 | $0.32 | $0.21 | $0.36 | $0.31 |
| Net realized and unrealized gain (loss) | (11.04) | 5.84 | 2.10 | (0.82) | 2.21 |
| Total from investment operations | $(10.70) | $6.16 | $2.31 | $(0.46) | $2.52 |
| Less distributions declared to shareholders |
| From net investment income | $(0.45) | $(0.12) | $(0.44) | $(0.29) | $(0.37) |
| From net realized gain | (1.44) | (1.36) | (0.52) | (1.71) | (0.58) |
| Total distributions declared to shareholders | $(1.89) | $(1.48) | $(0.96) | $(2.00) | $(0.95) |
| Net asset value, end of period (x) | $25.98 | $38.57 | $33.89 | $32.54 | $35.00 |
| Total return (%) (r)(s)(t)(x) | (29.16) | 18.56 | 7.10 | (0.61) | 7.65 |
Ratios (%) (to average net assets)
and Supplemental data: |
| Expenses before expense reductions (f) | 1.05 | 1.03 | 1.04 | 1.04 | 1.05 |
| Expenses after expense reductions (f) | 1.03 | 1.02 | 1.03 | 1.03 | 1.04 |
| Net investment income (loss) | 1.02 | 0.85 | 0.66 | 1.14 | 0.87 |
| Portfolio turnover | 12 | 11 | 25 | 14 | 21 |
| Net assets at end of period (000 omitted) | $82,390 | $182,567 | $260,005 | $276,550 | $318,571 |
See Notes to Financial Statements
Financial Highlights – continued
| Class R6 | Year ended |
| | 9/30/22 | 9/30/21 | 9/30/20 | 9/30/19 | 9/30/18 |
| Net asset value, beginning of period | $39.97 | $35.06 | $33.64 | $36.11 | $34.45 |
| Income (loss) from investment operations |
| Net investment income (loss) (d) | $0.43 | $0.42 | $0.28 | $0.44 | $0.37 |
| Net realized and unrealized gain (loss) | (11.48) | 6.02 | 2.13 | (0.87) | 2.27 |
| Total from investment operations | $(11.05) | $6.44 | $2.41 | $(0.43) | $2.64 |
| Less distributions declared to shareholders |
| From net investment income | $(0.53) | $(0.17) | $(0.47) | $(0.33) | $(0.40) |
| From net realized gain | (1.44) | (1.36) | (0.52) | (1.71) | (0.58) |
| Total distributions declared to shareholders | $(1.97) | $(1.53) | $(0.99) | $(2.04) | $(0.98) |
| Net asset value, end of period (x) | $26.95 | $39.97 | $35.06 | $33.64 | $36.11 |
| Total return (%) (r)(s)(t)(x) | (29.06) | 18.74 | 7.20 | (0.47) | 7.79 |
Ratios (%) (to average net assets)
and Supplemental data: |
| Expenses before expense reductions (f) | 0.91 | 0.90 | 0.92 | 0.92 | 0.93 |
| Expenses after expense reductions (f) | 0.90 | 0.89 | 0.91 | 0.91 | 0.92 |
| Net investment income (loss) | 1.26 | 1.08 | 0.84 | 1.34 | 1.02 |
| Portfolio turnover | 12 | 11 | 25 | 14 | 21 |
| Net assets at end of period (000 omitted) | $4,023,013 | $5,635,101 | $4,191,916 | $3,385,991 | $2,654,886 |
| (d) | Per share data is based on average shares outstanding. |
| (f) | Ratios do not reflect reductions from fees paid indirectly, if applicable. See Note 2 in the Notes to Financial Statements for additional information. |
| (r) | Certain expenses have been reduced without which performance would have been lower. |
| (s) | From time to time the fund may receive proceeds from litigation settlements, without which performance would be lower. |
| (t) | Total returns do not include any applicable sales charges. |
| (w) | Per share amount was less than $0.01. |
| (x) | The net asset values and total returns have been calculated on net assets which include adjustments made in accordance with U.S. generally accepted accounting principles required at period end for financial reporting purposes. |
See Notes to Financial Statements
Notes to Financial Statements
(1) Business and Organization
MFS International New Discovery Fund (the fund) is a diversified series of MFS Series Trust V (the trust). The trust is organized as a Massachusetts business trust and is registered under the Investment Company Act of 1940, as amended, as an open-end management investment company.
The fund is an investment company and accordingly follows the investment company accounting and reporting guidance of the Financial Accounting Standards Board (FASB) Accounting Standards Codification Topic 946 Financial Services - Investment Companies.
(2) Significant Accounting Policies
General — The preparation of financial statements in conformity with U.S. generally accepted accounting principles requires management to make estimates and assumptions that affect the reported amounts of assets and liabilities, and disclosure of contingent assets and liabilities at the date of the financial statements and the reported amounts of increases and decreases in net assets from operations during the reporting period. Actual results could differ from those estimates. In the preparation of these financial statements, management has evaluated subsequent events occurring after the date of the fund’s Statement of Assets and Liabilities through the date that the financial statements were issued. The fund will generally focus on securities of small size companies which may be more volatile than those of larger companies. The fund invests in foreign securities, including securities of emerging market issuers. Investments in foreign securities are vulnerable to the effects of changes in the relative values of the local currency and the U.S. dollar and to the effects of changes in each country’s market, economic, industrial, political, regulatory, geopolitical, environmental, public health, and other conditions. Investments in emerging markets can involve additional and greater risks than the risks associated with investments in developed foreign markets. Emerging markets can have less developed markets, greater custody and operational risk, less developed legal, regulatory, accounting, and auditing systems, greater government involvement in the economy, greater risk of new or inconsistent government treatment of or restrictions on issuers and instruments, and greater political, social, and economic instability than developed markets.
In June 2022, the FASB issued Accounting Standards Update 2022-03, Fair Value Measurement (Topic 820) – Fair Value Measurement of Equity Securities Subject to Contractual Sale Restrictions (“ASU 2022-03”), which affects all entities that have investments in equity securities measured at fair value that are subject to contractual sale restrictions. ASU 2022-03 clarifies that a contractual restriction on the sale of an equity security is a characteristic of the reporting entity holding the equity security rather than a characteristic of the asset and, therefore, is not considered in measuring the fair value of the equity security. The fund decided to early adopt ASU 2022-03 effective as of June 30, 2022 as the guidance in ASU 2022-03 was consistent with the fund’s existing practices for fair value measurement.
Balance Sheet Offsetting — The fund's accounting policy with respect to balance sheet offsetting is that, absent an event of default by the counterparty or a termination of the agreement, the International Swaps and Derivatives Association (ISDA) Master Agreement, or similar agreement, does not result in an offset of reported amounts of financial assets and financial liabilities in the Statement of Assets and Liabilities across transactions between the fund and the applicable counterparty. The fund's right to
Notes to Financial Statements - continued
setoff may be restricted or prohibited by the bankruptcy or insolvency laws of the particular jurisdiction to which a specific master netting agreement counterparty is subject. Balance sheet offsetting disclosures, to the extent applicable to the fund, have been included in the fund’s Significant Accounting Policies note under the captions for each of the fund’s in-scope financial instruments and transactions.
Investment Valuations — Subject to its oversight, the fund's Board of Trustees has delegated primary responsibility for determining or causing to be determined the value of the fund’s investments to MFS as the fund's adviser, pursuant to the fund’s valuation policy and procedures which have been adopted by the adviser and approved by the Board. Effective September 8, 2022, and in accordance with Rule 2a-5 under the Investment Company Act of 1940, the Board of Trustees designated the adviser as the “valuation designee” of the fund. If the adviser, as valuation designee, determines that reliable market quotations are not readily available for an investment, the investment is valued at fair value as determined in good faith by the adviser in accordance with the adviser’s fair valuation policy and procedures.
Under the fund's valuation policy and procedures, equity securities, including restricted equity securities, are generally valued at the last sale or official closing price on their primary market or exchange as provided by a third-party pricing service. Equity securities, for which there were no sales reported that day, are generally valued at the last quoted daily bid quotation on their primary market or exchange as provided by a third-party pricing service. Short-term instruments with a maturity at issuance of 60 days or less may be valued at amortized cost, which approximates market value.
Open-end investment companies are generally valued at net asset value per share. The values of foreign securities and other assets and liabilities expressed in foreign currencies are converted to U.S. dollars using the mean of bid and asked prices for rates provided by a third-party pricing service.
Under the fund’s valuation policy and procedures, market quotations are not considered to be readily available for debt instruments, floating rate loans, and many types of derivatives. These investments are generally valued at fair value based on information from third-party pricing services or otherwise determined by the adviser in accordance with the adviser’s fair valuation policy and procedures. Securities and other assets generally valued on the basis of information from a third-party pricing service may also be valued at a broker/dealer bid quotation. In determining values, third-party pricing services can utilize both transaction data and market information such as yield, quality, coupon rate, maturity, type of issue, trading characteristics, spreads and other market data. An investment may also be valued at fair value if the adviser determines that the investment’s value has been materially affected by events occurring after the close of the exchange or market on which the investment is principally traded (such as foreign exchange or market) and prior to the determination of the fund’s net asset value, or after the halt of trading of a specific security where trading does not resume prior to the close of the exchange or market on which the security is principally traded. Events that occur after foreign markets close (such as developments in foreign markets and significant movements in the U.S. markets) and prior to the determination of the fund’s net asset value may be deemed to have a material effect on the value of securities traded in foreign markets. Accordingly, the fund’s foreign equity securities may often be valued at fair value. The adviser generally relies on third-party pricing services or other information (such as the correlation with price movements of similar securities in the same or other markets; the type, cost and investment characteristics of the security; the business and financial condition of the issuer; and trading and other
Notes to Financial Statements - continued
market data) to assist in determining whether to fair value and at what value to fair value an investment. The value of an investment for purposes of calculating the fund’s net asset value can differ depending on the source and method used to determine value. When fair valuation is used, the value of an investment used to determine the fund’s net asset value may differ from quoted or published prices for the same investment. There can be no assurance that the fund could obtain the fair value assigned to an investment if it were to sell the investment at the same time at which the fund determines its net asset value per share.
Various inputs are used in determining the value of the fund's assets or liabilities. These inputs are categorized into three broad levels. In certain cases, the inputs used to measure fair value may fall into different levels of the fair value hierarchy. In such cases, an investment's level within the fair value hierarchy is based on the lowest level of input that is significant to the fair value measurement. The fund's assessment of the significance of a particular input to the fair value measurement in its entirety requires judgment, and considers factors specific to the investment. Level 1 includes unadjusted quoted prices in active markets for identical assets or liabilities. Level 2 includes other significant observable market-based inputs (including quoted prices for similar securities, interest rates, prepayment speed, and credit risk). Level 3 includes significant unobservable inputs, which may include the adviser's own assumptions in determining the fair value of investments. The following is a summary of the levels used as of September 30, 2022 in valuing the fund's assets and liabilities:
| Financial Instruments | Level 1 | Level 2 | Level 3 | Total |
| Equity Securities: | | | | |
| Japan | $252,918,744 | $1,518,336,087 | $— | $1,771,254,831 |
| United Kingdom | 74,713,569 | 591,828,706 | — | 666,542,275 |
| Germany | 216,811,132 | 55,255,566 | — | 272,066,698 |
| Australia | 43,725,359 | 227,650,774 | — | 271,376,133 |
| France | 8,630,202 | 195,207,098 | — | 203,837,300 |
| India | 58,354,342 | 132,763,332 | — | 191,117,674 |
| Hong Kong | 49,590,203 | 106,601,965 | — | 156,192,168 |
| Brazil | 153,107,901 | 6,329 | — | 153,114,230 |
| China | 22,475,473 | 123,578,075 | — | 146,053,548 |
| Other Countries | 401,379,174 | 1,054,714,776 | 0 | 1,456,093,950 |
| Mutual Funds | 232,589,047 | — | — | 232,589,047 |
| Total | $1,514,295,146 | $4,005,942,708 | $0 | $5,520,237,854 |
For further information regarding security characteristics, see the Portfolio of Investments.
The following is a reconciliation of level 3 assets for which significant unobservable inputs were used to determine fair value. The table presents the activity of level 3 securities held at the beginning and the end of the period.
| | Equity
Securities |
| Balance as of 9/30/21 | $— |
| Transfers into level 3 | 0 |
| Balance as of 9/30/22 | $0 |
At September 30, 2022, the fund held one level 3 security.
Notes to Financial Statements - continued
Foreign Currency Translation — Purchases and sales of foreign investments, income, and expenses are converted into U.S. dollars based upon currency exchange rates prevailing on the respective dates of such transactions or on the reporting date for foreign denominated receivables and payables. Gains and losses attributable to foreign currency exchange rates on sales of securities are recorded for financial statement purposes as net realized gains and losses on investments. Gains and losses attributable to foreign exchange rate movements on receivables, payables, income and expenses are recorded for financial statement purposes as foreign currency transaction gains and losses. That portion of both realized and unrealized gains and losses on investments that results from fluctuations in foreign currency exchange rates is not separately disclosed.
Security Loans — Under its Securities Lending Agency Agreement with the fund, JPMorgan Chase and Co., as lending agent, loans the securities of the fund to certain qualified institutions (the “Borrowers”) approved by the fund. Security loans can be terminated at the discretion of either the lending agent or the fund and the related securities must be returned within the earlier of the standard trade settlement period for such securities or within three business days. The loans are collateralized by cash and/or U.S. Treasury and federal agency obligations in an amount typically at least equal to the market value of the securities loaned. On loans collateralized by cash, the cash collateral is invested in a money market fund. The market value of the loaned securities is determined at the close of business of the fund and any additional required collateral is delivered to the fund on the next business day. The lending agent provides the fund with indemnification against Borrower default. In the event of Borrower default, the lending agent will, for the benefit of the fund, either purchase securities identical to those loaned or, when such purchase is commercially impracticable, pay the fund the market value of the loaned securities. In return, the lending agent assumes the fund's rights to the related collateral. If the collateral value is less than the cost to purchase identical securities, the lending agent is responsible for the shortfall, but only to the extent that such shortfall is not due to a decline in collateral value resulting from collateral reinvestment for which the fund bears the risk of loss. At period end, the fund had investment securities on loan, all of which were classified as equity securities in the fund's Portfolio of Investments, with a fair value of $42,557,199. The fair value of the fund's investment securities on loan and a related liability of $7,542,791 for cash collateral received on securities loaned are both presented gross in the Statement of Assets and Liabilities. Additionally, these loans were collateralized by U.S. Treasury Obligations of $37,474,081 held by the lending agent. The collateral on securities loaned exceeded the value of securities on loan at period end. The liability for cash collateral for securities loaned is carried at fair value, which is categorized as level 2 within the fair value hierarchy. A portion of the income generated upon investment of the collateral is remitted to the Borrowers, and the remainder is allocated between the fund and the lending agent. On loans collateralized by U.S. Treasury and/or federal agency obligations, a fee is received from the Borrower, and is allocated between the fund and the lending agent. Income from securities lending is separately reported in the Statement of Operations. The dividend and interest income earned on the securities loaned is accounted for in the same manner as other dividend and interest income.
Indemnifications — Under the fund's organizational documents, its officers and Trustees may be indemnified against certain liabilities and expenses arising out of the performance of their duties to the fund. Additionally, in the normal course of business,
Notes to Financial Statements - continued
the fund enters into agreements with service providers that may contain indemnification clauses. The fund's maximum exposure under these agreements is unknown as this would involve future claims that may be made against the fund that have not yet occurred.
Investment Transactions and Income — Investment transactions are recorded on the trade date. Interest income is recorded on the accrual basis. Dividends received in cash are recorded on the ex-dividend date. Certain dividends from foreign securities will be recorded when the fund is informed of the dividend if such information is obtained subsequent to the ex-dividend date. Dividend payments received in additional securities are recorded on the ex-dividend date in an amount equal to the value of the security on such date. In determining the net gain or loss on securities sold, the cost of securities is determined on the identified cost basis.
The fund may receive proceeds from litigation settlements. Any proceeds received from litigation involving portfolio holdings are reflected in the Statement of Operations in realized gain/loss if the security has been disposed of by the fund or in unrealized gain/loss if the security is still held by the fund. Any other proceeds from litigation not related to portfolio holdings are reflected as other income in the Statement of Operations.
Fees Paid Indirectly — The fund's custody fee may be reduced by a credit earned under an arrangement that measures the value of U.S. dollars deposited with the custodian by the fund. The amount of the credit, for the year ended September 30, 2022, is shown as a reduction of total expenses in the Statement of Operations.
Tax Matters and Distributions — The fund intends to qualify as a regulated investment company, as defined under Subchapter M of the Internal Revenue Code, and to distribute all of its taxable income, including realized capital gains. As a result, no provision for federal income tax is required. The fund’s federal tax returns, when filed, will remain subject to examination by the Internal Revenue Service for a three year period. Management has analyzed the fund’s tax positions taken on federal and state tax returns for all open tax years and does not believe that there are any uncertain tax positions that require recognition of a tax liability. Foreign taxes, if any, have been accrued by the fund in the accompanying financial statements in accordance with the applicable foreign tax law. Foreign income taxes may be withheld by certain countries in which the fund invests. Additionally, capital gains realized by the fund on securities issued in or by certain foreign countries may be subject to capital gains tax imposed by those countries.
Distributions to shareholders are recorded on the ex-dividend date. Income and capital gain distributions are determined in accordance with income tax regulations, which may differ from U.S. generally accepted accounting principles. Certain capital accounts in the financial statements are periodically adjusted for permanent differences in order to reflect their tax character. These adjustments have no impact on net assets or net asset value per share. Temporary differences which arise from recognizing certain items of income, expense, gain or loss in different periods for financial statement and tax purposes will reverse at some time in the future.
Book/tax differences primarily relate to passive foreign investment companies, wash sale loss deferrals, treating a portion of the proceeds from redemptions as a distribution for tax purposes, and foreign taxes.
Notes to Financial Statements - continued
The tax character of distributions declared to shareholders for the last two fiscal years is as follows:
| | Year ended
9/30/22 | Year ended
9/30/21 |
| Ordinary income (including any short-term capital gains) | $151,654,086 | $30,813,285 |
| Long-term capital gains | 251,838,597 | 263,564,024 |
| Total distributions | $403,492,683 | $294,377,309 |
The federal tax cost and the tax basis components of distributable earnings were as follows:
| As of 9/30/22 | |
| Cost of investments | $5,824,631,936 |
| Gross appreciation | 1,039,705,421 |
| Gross depreciation | (1,344,099,503) |
| Net unrealized appreciation (depreciation) | $(304,394,082) |
| Undistributed ordinary income | 45,421,158 |
| Undistributed long-term capital gain | 289,510,884 |
| Other temporary differences | (2,932,422) |
| Total distributable earnings (loss) | $27,605,538 |
Multiple Classes of Shares of Beneficial Interest — The fund offers multiple classes of shares, which differ in their respective distribution, service, and program manager fees. The fund's income, realized and unrealized gain (loss), and common expenses are allocated to shareholders based on the daily net assets of each class. Dividends are declared separately for each class. Differences in per share dividend rates are generally due to differences in separate class expenses. Class B and Class C shares will convert to Class A shares approximately eight years after purchase. Effective March 21, 2022, all Class 529B and Class 529C shares were converted into Class 529A shares. Effective
Notes to Financial Statements - continued
May 20, 2022, all Class 529A shares were redeemed. The fund’s distributions declared to shareholders as reported in the Statements of Changes in Net Assets are presented by class as follows:
| | Year
ended
9/30/22 | | Year
ended
9/30/21 |
| Class A | $40,558,715 | | $34,439,503 |
| Class B | 195,811 | | 226,041 |
| Class C | 1,150,960 | | 1,691,213 |
| Class I | 58,815,770 | | 49,800,067 |
| Class R1 | 71,241 | | 63,826 |
| Class R2 | 1,080,274 | | 985,810 |
| Class R3 | 9,283,025 | | 5,729,175 |
| Class R4 | 7,139,611 | | 10,931,144 |
| Class R6 | 284,691,435 | | 190,105,108 |
| Class 529A | 468,895 | | 353,468 |
| Class 529B | 3,931 | | 5,468 |
| Class 529C | 33,015 | | 46,486 |
| Total | $403,492,683 | | $294,377,309 |
(3) Transactions with Affiliates
Note regarding references to Class 529A, Class 529B, and Class 529C shares in this “Note (3) Transactions with Affiliates”: Effective March 21, 2022, all Class 529B and Class 529C shares were converted into Class 529A shares. Effective May 20, 2022, all Class 529A shares were redeemed. Accordingly, information with respect to Class 529B and Class 529C shares is for the period ending March 21, 2022, and information with respect to Class 529A shares is for the period ending May 20, 2022.
Investment Adviser — The fund has an investment advisory agreement with MFS to provide overall investment management and related administrative services and facilities to the fund. The management fee is computed daily and paid monthly at the following annual rates based on the fund's average daily net assets:
| Up to $500 million | 0.975% |
| In excess of $500 million and up to $1 billion | 0.925% |
| In excess of $1 billion and up to $3 billion | 0.90% |
| In excess of $3 billion and up to $5 billion | 0.85% |
| In excess of $5 billion and up to $10 billion | 0.80% |
| In excess of $10 billion | 0.75% |
MFS has agreed in writing to reduce its management fee by a specified amount if certain MFS mutual fund assets exceed thresholds agreed to by MFS and the fund's Board of Trustees. Effective March 1, 2022, MFS has also agreed in writing to waive at least 0.01% of its management fee as part of this agreement. The agreement to waive at least 0.01% of the management fee will continue until modified by the fund's Board of Trustees, but such agreement will continue at least until January 31, 2024. For the year ended September 30, 2022, this management fee reduction amounted to $1,009,461, which is included in the reduction of total expenses in the Statement of Operations. The management fee incurred for the year ended September 30, 2022 was equivalent to an annual effective rate of 0.85% of the fund's average daily net assets.
Notes to Financial Statements - continued
Distributor — MFS Fund Distributors, Inc. (MFD), a wholly-owned subsidiary of MFS, as distributor, received $20,045 and $1,462 for the year ended September 30, 2022, as its portion of the initial sales charge on sales of Class A and Class 529A shares of the fund, respectively.
The Board of Trustees has adopted a distribution plan for certain share classes pursuant to Rule 12b-1 of the Investment Company Act of 1940.
The fund's distribution plan provides that the fund will pay MFD for services provided by MFD and financial intermediaries in connection with the distribution and servicing of certain share classes. One component of the plan is a distribution fee paid to MFD and another component of the plan is a service fee paid to MFD. MFD may subsequently pay all, or a portion, of the distribution and/or service fees to financial intermediaries.
Distribution Plan Fee Table:
| | Distribution
Fee Rate (d) | Service
Fee Rate (d) | Total
Distribution
Plan (d) | Annual
Effective
Rate (e) | Distribution
and Service
Fee |
| Class A | — | 0.25% | 0.25% | 0.25% | $ 1,834,656 |
| Class B | 0.75% | 0.25% | 1.00% | 1.00% | 38,637 |
| Class C | 0.75% | 0.25% | 1.00% | 1.00% | 229,983 |
| Class R1 | 0.75% | 0.25% | 1.00% | 1.00% | 14,484 |
| Class R2 | 0.25% | 0.25% | 0.50% | 0.50% | 101,409 |
| Class R3 | — | 0.25% | 0.25% | 0.25% | 409,168 |
| Class 529A | — | 0.25% | 0.25% | 0.22% | 14,784 |
| Class 529B | 0.75% | 0.25% | 1.00% | 0.25% | 90 |
| Class 529C | 0.75% | 0.25% | 1.00% | 1.00% | 3,484 |
| Total Distribution and Service Fees | | | | | $2,646,695 |
| (d) | In accordance with the distribution plan for certain classes, the fund pays distribution and/or service fees equal to these annual percentage rates of each class’s average daily net assets. The distribution and service fee rates disclosed by class represent the current rates in effect at the end of the reporting period. Any rate changes, if applicable, are detailed below. |
| (e) | The annual effective rates represent actual fees incurred under the distribution plan for the year ended September 30, 2022 based on each class's average daily net assets. MFD has voluntarily agreed to rebate a portion of each class's 0.25% service fee attributable to accounts for which there is no financial intermediary specified on the account except for accounts attributable to MFS or its affiliates' seed money. For the year ended September 30, 2022, this rebate amounted to $429, $35, $41, $2,052, and $3 for Class A, Class R2, Class R3, Class 529A, and Class 529C shares, respectively, and is included in the reduction of total expenses in the Statement of Operations. For the year ended September 30, 2022, the 0.75% distribution fee was not imposed for Class 529B shares due to the sales charge limitations contained in Financial Industry Regulatory Authority (“FINRA”) Rule 2341. |
Certain Class A shares are subject to a contingent deferred sales charge (CDSC) in the event of a shareholder redemption within 18 months of purchase. Class B and Class 529B shares are subject to a CDSC in the event of a shareholder redemption within six years of purchase. Class C and Class 529C shares are subject to a CDSC in the event of
Notes to Financial Statements - continued
a shareholder redemption within 12 months of purchase. All contingent deferred sales charges are paid to MFD and during the year ended September 30, 2022, were as follows:
| | Amount |
| Class A | $739 |
| Class B | 4,287 |
| Class C | 562 |
| Class 529B | — |
| Class 529C | 8 |
The fund has entered into and may from time to time enter into contracts with program managers and other parties which administer the tuition programs through which an investment in the fund’s 529 share classes is made. The fund has entered into an agreement with MFD pursuant to which MFD receives an annual fee of up to 0.05% of the average daily net assets attributable to each 529 share class. As described above, all Class 529A, Class 529B, and Class 529C shares were redeemed on or before May 20, 2022. Accordingly, the foregoing agreement between the fund and MFD was terminated effective May 20, 2022. The services provided by MFD, or a third party with which MFD contracts, include recordkeeping and tax reporting and account services, as well as services designed to maintain the program’s compliance with the Internal Revenue Code and other regulatory requirements. Program manager fees for the year ended September 30, 2022, were as follows:
| | Fee |
| Class 529A | $2,957 |
| Class 529B | 18 |
| Class 529C | 174 |
| Total Program Manager Fees | $3,149 |
Shareholder Servicing Agent — MFS Service Center, Inc. (MFSC), a wholly-owned subsidiary of MFS, receives a fee from the fund for its services as shareholder servicing agent calculated as a percentage of the average daily net assets of the fund as determined periodically under the supervision of the fund's Board of Trustees. For the year ended September 30, 2022, the fee was $172,282, which equated to 0.0024% annually of the fund's average daily net assets. MFSC also receives reimbursement from the fund for out-of-pocket expenses, sub-accounting and other shareholder servicing costs which may be paid to affiliated and unaffiliated service providers. Class R6 shares do not incur sub-accounting fees. For the year ended September 30, 2022, these out-of-pocket expenses, sub-accounting and other shareholder servicing costs amounted to $2,925,896.
Administrator — MFS provides certain financial, legal, shareholder communications, compliance, and other administrative services to the fund. Under an administrative services agreement, the fund reimburses MFS the costs incurred to provide these services. The fund is charged an annual fixed amount of $17,500 plus a fee based on average daily net assets. The administrative services fee incurred for the year ended September 30, 2022 was equivalent to an annual effective rate of 0.0091% of the fund's average daily net assets.
Notes to Financial Statements - continued
Trustees’ and Officers’ Compensation — The fund pays compensation to independent Trustees in the form of a retainer, attendance fees, and additional compensation to Board and Committee chairpersons. The fund does not pay compensation directly to Trustees or officers of the fund who are also officers of the investment adviser, all of whom receive remuneration from MFS for their services to the fund. Certain officers and Trustees of the fund are officers or directors of MFS, MFD, and MFSC.
Other — The fund invests in the MFS Institutional Money Market Portfolio which is managed by MFS and seeks current income consistent with preservation of capital and liquidity. This money market fund does not pay a management fee to MFS but does incur investment and operating costs.
The fund is permitted to engage in purchase and sale transactions with funds and accounts for which MFS serves as investment adviser or sub-adviser (“cross-trades”) pursuant to a policy adopted by the Board of Trustees. This policy has been designed to ensure that cross-trades conducted by the fund comply with Rule 17a-7 under the Investment Company Act of 1940. During the year ended September 30, 2022, the fund engaged in sale transactions pursuant to this policy, which amounted to $6,617,608. The sales transactions resulted in net realized gains (losses) of $828,548.
(4) Portfolio Securities
For the year ended September 30, 2022, purchases and sales of investments, other than short-term obligations, aggregated $811,897,610 and $1,225,366,086, respectively.
(5) Shares of Beneficial Interest
The fund's Declaration of Trust permits the Trustees to issue an unlimited number of full and fractional shares of beneficial interest. Transactions in fund shares were as follows:
| | Year ended
9/30/22 | | Year ended
9/30/21 |
| | Shares | Amount | | Shares | Amount |
| Shares sold | | | | | |
| Class A | 1,023,143 | $33,970,510 | | 1,633,368 | $60,461,808 |
| Class B | 58 | 1,984 | | 70 | 2,445 |
| Class C | 10,852 | 331,084 | | 19,171 | 670,704 |
| Class I | 3,526,867 | 122,378,252 | | 4,466,640 | 176,060,527 |
| Class R1 | 9,526 | 281,112 | | 7,224 | 248,475 |
| Class R2 | 101,721 | 3,217,527 | | 87,614 | 3,181,716 |
| Class R3 | 1,051,751 | 37,466,728 | | 2,418,020 | 88,308,082 |
| Class R4 | 553,764 | 18,112,531 | | 923,114 | 34,339,882 |
| Class R6 | 16,208,229 | 575,363,909 | | 27,999,530 | 1,071,646,468 |
| Class 529A | 39,063 | 1,282,894 | | 42,151 | 1,534,486 |
| Class 529C | 892 | 29,321 | | 2,414 | 82,279 |
| | 22,525,866 | $792,435,852 | | 37,599,316 | $1,436,536,872 |
Notes to Financial Statements - continued
| | Year ended
9/30/22 | | Year ended
9/30/21 |
| | Shares | Amount | | Shares | Amount |
Shares issued to shareholders
in reinvestment of distributions | | | | | |
| Class A | 1,009,595 | $36,870,405 | | 852,189 | $30,389,063 |
| Class B | 5,528 | 194,428 | | 6,527 | 224,197 |
| Class C | 32,746 | 1,127,105 | | 49,239 | 1,655,408 |
| Class I | 1,458,992 | 55,076,952 | | 1,273,747 | 46,886,629 |
| Class R1 | 2,141 | 71,240 | | 1,955 | 63,826 |
| Class R2 | 30,289 | 1,071,615 | | 28,076 | 971,154 |
| Class R3 | 257,147 | 9,283,025 | | 162,346 | 5,729,175 |
| Class R4 | 179,428 | 6,538,372 | | 291,429 | 10,366,130 |
| Class R6 | 7,081,328 | 267,390,965 | | 4,773,203 | 175,749,343 |
| Class 529A | 12,747 | 455,719 | | 9,862 | 344,770 |
| Class 529B | 117 | 3,931 | | 166 | 5,468 |
| Class 529C | 998 | 32,942 | | 1,437 | 46,486 |
| | 10,071,056 | $378,116,699 | | 7,450,176 | $272,431,649 |
| Shares reacquired | | | | | |
| Class A | (3,938,988) | $(129,035,209) | | (5,243,494) | $(197,696,673) |
| Class B | (59,284) | (1,789,431) | | (45,929) | (1,630,289) |
| Class C | (278,446) | (8,460,526) | | (547,318) | (19,016,756) |
| Class I | (8,651,169) | (288,754,908) | | (9,935,921) | (381,178,465) |
| Class R1 | (8,065) | (246,053) | | (14,029) | (479,802) |
| Class R2 | (206,456) | (6,406,185) | | (207,156) | (7,529,035) |
| Class R3 | (2,322,289) | (76,361,082) | | (1,546,835) | (57,369,357) |
| Class R4 | (2,295,925) | (80,799,395) | | (4,153,168) | (154,392,635) |
| Class R6 | (15,027,341) | (489,236,861) | | (11,326,477) | (440,173,690) |
| Class 529A | (309,521) | (9,204,770) | | (48,527) | (1,776,855) |
| Class 529B | (2,428) | (74,067) | | (2,588) | (87,821) |
| Class 529C | (25,377) | (762,098) | | (19,215) | (637,515) |
| | (33,125,289) | $(1,091,130,585) | | (33,090,657) | $(1,261,968,893) |
Notes to Financial Statements - continued
| | Year ended
9/30/22 | | Year ended
9/30/21 |
| | Shares | Amount | | Shares | Amount |
| Net change | | | | | |
| Class A | (1,906,250) | $(58,194,294) | | (2,757,937) | $(106,845,802) |
| Class B | (53,698) | (1,593,019) | | (39,332) | (1,403,647) |
| Class C | (234,848) | (7,002,337) | | (478,908) | (16,690,644) |
| Class I | (3,665,310) | (111,299,704) | | (4,195,534) | (158,231,309) |
| Class R1 | 3,602 | 106,299 | | (4,850) | (167,501) |
| Class R2 | (74,446) | (2,117,043) | | (91,466) | (3,376,165) |
| Class R3 | (1,013,391) | (29,611,329) | | 1,033,531 | 36,667,900 |
| Class R4 | (1,562,733) | (56,148,492) | | (2,938,625) | (109,686,623) |
| Class R6 | 8,262,216 | 353,518,013 | | 21,446,256 | 807,222,121 |
| Class 529A | (257,711) | (7,466,157) | | 3,486 | 102,401 |
| Class 529B | (2,311) | (70,136) | | (2,422) | (82,353) |
| Class 529C | (23,487) | (699,835) | | (15,364) | (508,750) |
| | (528,367) | $79,421,966 | | 11,958,835 | $446,999,628 |
The fund is one of several mutual funds in which certain MFS funds may invest. The MFS funds do not invest in the underlying funds for the purpose of exercising management or control. At the end of the period, the MFS International Diversification Fund, the MFS Growth Allocation Fund, the MFS Aggressive Growth Allocation Fund, and the Moderate Allocation Fund were the owners of record of approximately 52%, 2%, 2%, and 1%, respectively, of the value of outstanding voting shares of the fund. In addition, the MFS Lifetime 2030 Fund, the MFS Lifetime 2035 Fund, the MFS Lifetime 2040 Fund, the MFS Lifetime 2045 Fund, the MFS Lifetime 2050 Fund, the MFS Lifetime 2055 Fund, the MFS Lifetime 2060 Fund, and the MFS Lifetime 2065 Fund were each the owners of record of less than 1% of the value of outstanding voting shares of the fund.
Effective June 1, 2019, purchases of the fund’s Class B and Class 529B shares were closed to new and existing investors subject to certain exceptions. Effective at the close of business on November 29, 2019, purchases of the fund were closed to new investors subject to certain exceptions. Effective after the close of business on March 18, 2022, all sales of Class 529B and Class 529C shares were suspended, and Class 529B and Class 529C shares were converted into Class 529A shares of the fund effective March 21, 2022. Effective after the close of business on May 13, 2022, all sales and redemptions of Class 529A shares were suspended, and all Class 529A shares were redeemed on May 20, 2022.
(6) Line of Credit
The fund and certain other funds managed by MFS participate in a $1.45 billion unsecured committed line of credit of which $1.2 billion is reserved for use by the fund and certain other MFS U.S. funds. The line of credit is provided by a syndicate of banks under a credit agreement. Borrowings may be made for temporary financing needs. Interest is charged to each fund, based on its borrowings, generally at a rate equal to the highest of 1) Daily Simple SOFR (Secured Overnight Financing Rate) plus 0.10%, 2)
Notes to Financial Statements - continued
the Federal Funds Effective Rate, or 3) the Overnight Bank Funding Rate, each plus an agreed upon spread. A commitment fee, based on the average daily unused portion of the committed line of credit, is allocated among the participating funds. The line of credit expires on March 16, 2023 unless extended or renewed. In addition, the fund and other funds managed by MFS have established unsecured uncommitted borrowing arrangements with certain banks for temporary financing needs. Interest is charged to each fund, based on its borrowings, at rates equal to customary reference rates plus an agreed upon spread. For the year ended September 30, 2022, the fund’s commitment fee and interest expense were $30,470 and $0, respectively, and are included in “Miscellaneous” expense in the Statement of Operations.
(7) Investments in Affiliated Issuers
An affiliated issuer may be considered one in which the fund owns 5% or more of the outstanding voting securities, or a company which is under common control. For the purposes of this report, the following were affiliated issuers:
| Affiliated Issuers | Beginning
Value | Purchases | Sales
Proceeds | Realized
Gain
(Loss) | Change in
Unrealized
Appreciation or
Depreciation | Ending
Value |
| Forterra PLC | $57,296,296 | $— | $— | $— | $(17,259,340) | $40,036,956 |
| MFS Institutional Money Market Portfolio | 45,980,405 | 1,352,007,224 | 1,172,957,983 | (10,132) | 26,742 | 225,046,256 |
| Midland Holdings Ltd. | 6,537,244 | — | — | — | (3,470,773) | 3,066,471 |
| PCA Corp. | 22,610,843 | — | — | — | (12,732,616) | 9,878,227 |
| T. Hasegawa Co. Ltd. | 74,674,485 | — | — | — | (10,322,607) | 64,351,878 |
| | $207,099,273 | $1,352,007,224 | $1,172,957,983 | $(10,132) | $(43,758,594) | $342,379,788 |
| Affiliated Issuers | Dividend
Income | Capital Gain
Distributions |
| Forterra PLC | $2,062,311 | $— |
| MFS Institutional Money Market Portfolio | 1,590,375 | — |
| Midland Holdings Ltd. | — | — |
| PCA Corp. | 247,158 | — |
| T. Hasegawa Co. Ltd. | 1,375,299 | — |
| | $5,275,143 | $— |
(8) LIBOR Transition
Certain of the fund's investments, including investments in certain debt instruments and derivatives (if any), as well as borrowings by the fund and certain other contractual arrangements of the fund, may be based on the London Interbank Offered Rate (“LIBOR”). In 2017, the regulatory authority that oversees financial services firms in the United Kingdom announced plans to transition away from LIBOR by the end of 2021. In March 2021, the administrator of LIBOR announced the extension of the publication of the more commonly used U.S. dollar LIBOR settings to the end of June 2023. Although the full impacts of the transition away from LIBOR are not fully known, the transition may result in, among other things, an increase in volatility or illiquidity of the markets for instruments that currently rely on LIBOR to determine interest rates and this could have an adverse impact on the fund's performance. With respect to the fund's
Notes to Financial Statements - continued
accounting for investments, including investments in certain debt instruments and derivatives, as well as borrowings by the fund and any other contractual arrangements of the fund that undergo reference rate-related modifications as a result of the transition, management will rely upon the relief provided by FASB Codification Topic 848 – Reference Rate Reform (Topic 848). The guidance in Topic 848 permits the fund to account for those modified contracts as a continuation of the existing contracts. Management is still evaluating the impact to the fund of the June 30, 2023 planned discontinuation of the more commonly used U.S. dollar LIBOR settings.
(9) Russia and Ukraine Conflict
The fund invests in securities and/or derivative instruments that are economically tied to Russia and/or Ukraine. Escalation of the conflict between Russia and Ukraine in late February 2022 caused market volatility and disruption in the tradability of Russian securities, including closure of the local securities market, temporary restriction on securities sales by non-residents, and disruptions to clearance and payment systems. To the extent that the fund is unable to sell securities, whether due to market constraints or to the sanctions imposed on Russia by the United States and other countries, those securities are considered illiquid and the value of those securities reflects their illiquid classification. Management continues to monitor these events and to evaluate the related impacts on fund performance.
Report of Independent Registered Public Accounting Firm
To the Shareholders of MFS International New Discovery Fund and the Board of Trustees of MFS Series Trust V
Opinion on the Financial Statements
We have audited the accompanying statement of assets and liabilities of MFS International New Discovery Fund (the “Fund”) (one of the funds constituting MFS Series Trust V (the “Trust”)), including the portfolio of investments, as of September 30, 2022, and the related statement of operations for the year then ended, the statements of changes in net assets for each of the two years in the period then ended, the financial highlights for each of the five years in the period then ended and the related notes (collectively referred to as the “financial statements”). In our opinion, the financial statements present fairly, in all material respects, the financial position of the Fund (one of the funds constituting MFS Series Trust V) at September 30, 2022, the results of its operations for the year then ended, the changes in its net assets for each of the two years in the period then ended and its financial highlights for each of the five years in the period then ended, in conformity with U.S. generally accepted accounting principles.
Basis for Opinion
These financial statements are the responsibility of the Trust’s management. Our responsibility is to express an opinion on the Fund’s financial statements based on our audits. We are a public accounting firm registered with the Public Company Accounting Oversight Board (United States) (“PCAOB”) and are required to be independent with respect to the Trust in accordance with the U.S. federal securities laws and the applicable rules and regulations of the Securities and Exchange Commission and the PCAOB.
We conducted our audits in accordance with the standards of the PCAOB. Those standards require that we plan and perform the audit to obtain reasonable assurance about whether the financial statements are free of material misstatement, whether due to error or fraud. The Trust is not required to have, nor were we engaged to perform, an audit of the Trust’s internal control over financial reporting. As part of our audits, we are required to obtain an understanding of internal control over financial reporting but not for the purpose of expressing an opinion on the effectiveness of the Trust’s internal control over financial reporting. Accordingly, we express no such opinion.
Our audits included performing procedures to assess the risks of material misstatement of the financial statements, whether due to error or fraud, and performing procedures that respond to those risks. Such procedures included examining, on a test basis, evidence regarding the amounts and disclosures in the financial statements. Our procedures included confirmation of securities owned as of September 30, 2022, by correspondence with the custodian, brokers and others; when replies were not received from brokers and others, we performed other auditing procedures. Our audits also
Report of Independent Registered Public Accounting Firm – continued
included evaluating the accounting principles used and significant estimates made by management, as well as evaluating the overall presentation of the financial statements. We believe that our audits provide a reasonable basis for our opinion.
We have served as the auditor of one or more MFS investment companies since 1993.
Boston, Massachusetts
November 14, 2022
Trustees and Officers — Identification and Background
The Trustees and Officers of the Trust, as of November 1, 2022, are listed below, together with their principal occupations during the past five years. (Their titles may have varied during that period.) The address of each Trustee and Officer is 111 Huntington Avenue, Boston, Massachusetts 02199-7618.
| Name, Age | | Position(s) Held with Fund | | Trustee/Officer Since(h) | | Number of MFS Funds overseen by the Trustee | | Principal Occupations During
the Past Five Years | | Other Directorships During
the Past Five Years (j) |
| INTERESTED TRUSTEES | | | | | | | | | | |
Michael W. Roberge (k)
(age 56) | | Trustee | | January 2021 | | 136 | | Massachusetts Financial Services Company, Chairman (since January 2021); Chief Executive Officer (since January 2017); Director; Chairman of the Board (since January 2022); President (until December 2018); Chief Investment Officer (until December 2018) | | N/A |
| INDEPENDENT TRUSTEES | | | | | | | | | | |
John P. Kavanaugh
(age 67) | | Trustee and Chair of Trustees | | January 2009 | | 136 | | Private investor | | N/A |
Steven E. Buller
(age 71) | | Trustee | | February 2014 | | 136 | | Private investor | | N/A |
John A. Caroselli
(age 68) | | Trustee | | March 2017 | | 136 | | Private investor; JC Global Advisors, LLC (management consulting), President (since 2015) | | N/A |
Maureen R. Goldfarb
(age 67) | | Trustee | | January 2009 | | 136 | | Private investor | | N/A |
Peter D. Jones
(age 67) | | Trustee | | January 2019 | | 136 | | Private investor | | N/A |
James W. Kilman, Jr.
(age 61) | | Trustee | | January 2019 | | 136 | | Burford Capital Limited (finance and investment management), Senior Advisor (since May 3, 2021), Chief Financial Officer (2019 - May 2, 2021); KielStrand Capital LLC (family office), Chief Executive Officer (since 2016) | | Alpha-En Corporation, Director (2016-2019) |
Trustees and Officers - continued
| Name, Age | | Position(s) Held with Fund | | Trustee/Officer Since(h) | | Number of MFS Funds overseen by the Trustee | | Principal Occupations During
the Past Five Years | | Other Directorships During
the Past Five Years (j) |
Clarence Otis, Jr.
(age 66) | | Trustee | | March 2017 | | 136 | | Private investor | | VF Corporation, Director; Verizon Communications, Inc., Director; The Travelers Companies, Director |
Maryanne L. Roepke
(age 66) | | Trustee | | May 2014 | | 136 | | Private investor | | N/A |
Laurie J. Thomsen
(age 65) | | Trustee | | March 2005 | | 136 | | Private investor | | The Travelers Companies, Director; Dycom Industries, Inc., Director |
| Name, Age | | Position(s) Held with
Fund | | Trustee/Officer Since(h) | | Number of MFS Funds for which the Person is an Officer | | Principal Occupations During
the Past Five Years |
| OFFICERS | | | | | | | | |
Christopher R. Bohane (k)
(age 48) | | Assistant Secretary and Assistant Clerk | | July 2005 | | 136 | | Massachusetts Financial Services Company, Senior Vice President and Senior Managing Counsel |
Kino Clark (k)
(age 54) | | Assistant Treasurer | | January 2012 | | 136 | | Massachusetts Financial Services Company, Vice President |
John W. Clark, Jr. (k)
(age 55) | | Assistant Treasurer | | April 2017 | | 136 | | Massachusetts Financial Services Company, Vice President |
David L. DiLorenzo (k)
(age 54) | | President | | July 2005 | | 136 | | Massachusetts Financial Services Company, Senior Vice President |
Heidi W. Hardin (k)
(age 55) | | Secretary and Clerk | | April 2017 | | 136 | | Massachusetts Financial Services Company, Executive Vice President and General Counsel |
Brian E. Langenfeld (k)
(age 49) | | Assistant Secretary and Assistant Clerk | | June 2006 | | 136 | | Massachusetts Financial Services Company, Vice President and Managing Counsel |
Trustees and Officers - continued
| Name, Age | | Position(s) Held with
Fund | | Trustee/Officer Since(h) | | Number of MFS Funds for which the Person is an Officer | | Principal Occupations During
the Past Five Years |
Rosa E. Licea-Mailloux(k)
(age 46) | | Chief Compliance Officer | | March 2022 | | 136 | | Massachusetts Financial Services Company, Vice President (since 2018); Director of Corporate Compliance (2018-2021), Senior Director Compliance (2021-2022), Senior Managing Director of North American Compliance & Chief Compliance Officer (since March 2022); Natixis Investment Managers (investment management), Funds Chief Compliance Officer, Deputy General Counsel & Senior Vice President (until 2018) |
Amanda S. Mooradian (k)
(age 43) | | Assistant Secretary and Assistant Clerk | | September 2018 | | 136 | | Massachusetts Financial Services Company, Assistant Vice President and Senior Counsel |
Susan A. Pereira (k)
(age 51) | | Assistant Secretary and Assistant Clerk | | July 2005 | | 136 | | Massachusetts Financial Services Company, Vice President and Managing Counsel |
Kasey L. Phillips (k)
(age 51) | | Assistant Treasurer | | September 2012 | | 136 | | Massachusetts Financial Services Company, Vice President |
Matthew A. Stowe (k)
(age 47) | | Assistant Secretary and Assistant Clerk | | October 2014 | | 136 | | Massachusetts Financial Services Company, Vice President and Senior Managing Counsel |
William B. Wilson(k)
(age 40) | | Assistant Secretary and Assistant Clerk | | October 2022 | | 136 | | Massachusetts Financial Services Company, Assistant Vice President and Counsel |
James O. Yost (k)
(age 62) | | Treasurer | | September 1990 | | 136 | | Massachusetts Financial Services Company, Senior Vice President |
| (h) | Date first appointed to serve as Trustee/Officer of an MFS Fund. Each Trustee has served continuously since appointment unless indicated otherwise. From January 2012 through December 2016, Messrs. DiLorenzo and Yost served as Treasurer and Deputy Treasurer of the Funds, respectively. |
| (j) | Directorships or trusteeships of companies required to report to the Securities and Exchange Commission (i.e., “public companies”). |
| (k) | “Interested person” of the Trust within the meaning of the Investment Company Act of 1940 (referred to as the 1940 Act), which is the principal federal law governing investment companies like the fund, as a result of a position with MFS. The address of MFS is 111 Huntington Avenue, Boston, Massachusetts 02199-7618. |
Trustees and Officers - continued
Each Trustee (other than Messrs. Jones, Kilman and Roberge) has been elected by shareholders and each Trustee and Officer holds office until his or her successor is chosen and qualified or until his or her earlier death, resignation, retirement or removal. Mr. Roberge became a Trustee of the Funds on January 1, 2021 and Messrs. Jones and Kilman became Trustees of the Funds on January 1, 2019. The Trust does not hold annual meetings for the purpose of electing Trustees, and Trustees are not elected for fixed terms. Under the terms of the Board's retirement policy, an Independent Trustee shall retire at the end of the calendar year in which he or she reaches the earlier of 75 years of age or 15 years of service on the Board (or, in the case of any Independent Trustee who joined the Board prior to 2015, 20 years of service on the Board).
Messrs. Buller, Kilman and Otis and Ms. Roepke are members of the Trust’s Audit Committee.
Each of the Interested Trustees and certain Officers hold comparable officer positions with certain affiliates of MFS.
The Statement of Additional Information for a Fund includes further information about the Trustees and is available without charge upon request by calling 1-800-225-2606.
| Investment Adviser | Custodian |
Massachusetts Financial Services Company
111 Huntington Avenue
Boston, MA 02199-7618 | JPMorgan Chase Bank, NA
4 Metrotech Center
New York, NY 11245 |
| Distributor | Independent Registered Public Accounting Firm |
MFS Fund Distributors, Inc.
111 Huntington Avenue
Boston, MA 02199-7618 | Ernst & Young LLP
200 Clarendon Street
Boston, MA 02116 |
| Portfolio Manager(s) | |
Peter Fruzzetti
Jose Luis Garcia
Lionel Gomez
Robert Lau
Sandeep Mehta
Nicholas Spratt | |
Board Review of Investment Advisory Agreement
MFS International New Discovery Fund
The Investment Company Act of 1940 requires that both the full Board of Trustees and a majority of the non-interested (“independent”) Trustees, voting separately, annually approve the continuation of the Fund’s investment advisory agreement with MFS. The Trustees consider matters bearing on the Fund and its advisory arrangements at their meetings throughout the year, including a review of performance data at each regular meeting. In addition, the independent Trustees met several times over the course of three months beginning in May and ending in July, 2022 (“contract review meetings”) for the specific purpose of considering whether to approve the continuation of the investment advisory agreement for the Fund and the other investment companies that the Board oversees (the “MFS Funds”). The independent Trustees were assisted in their evaluation of the Fund’s investment advisory agreement by independent legal counsel, from whom they received separate legal advice and with whom they met separately from MFS during various contract review meetings. The independent Trustees were also assisted in this process by an independent consultant who was retained by and reported to the independent Trustees.
In connection with their deliberations regarding the continuation of the investment advisory agreement, the Trustees, including the independent Trustees, considered such information and factors as they believed, in light of the legal advice furnished to them and their own business judgment, to be relevant. The investment advisory agreement for the Fund was considered separately, although the Trustees also took into account the common interests of all MFS Funds in their review. As described below, the Trustees considered the nature, quality, and extent of the various investment advisory, administrative, and shareholder services performed by MFS under the existing investment advisory agreement and other arrangements with the Fund.
In connection with their contract review meetings, the Trustees received and relied upon materials that included, among other items: (i) information provided by Broadridge Financial Solutions, Inc. (“Broadridge”), an independent third party, on the investment performance of the Fund for various time periods ended December 31, 2021 and the investment performance of a group of funds with substantially similar investment classifications/objectives (the “Broadridge performance universe”), (ii) information provided by Broadridge on the Fund’s advisory fees and other expenses and the advisory fees and other expenses of comparable funds identified by Broadridge as well as all other funds in the same investment classification/category (the “Broadridge expense group and universe”), (iii) information provided by MFS on the advisory fees of portfolios of other clients of MFS, including institutional separate accounts and other clients, (iv) information as to whether and to what extent applicable expense waivers, reimbursements or fee “breakpoints” are observed for the Fund, (v) information regarding MFS’ financial results and financial condition, including MFS’ and certain of its affiliates’ estimated profitability from services performed for the Fund and the MFS Funds as a whole, and compared to MFS’ institutional business, (vi) MFS’ views regarding the outlook for the mutual fund industry and the strategic business plans of MFS, (vii) descriptions of various functions performed by MFS for the Funds, such as compliance monitoring and portfolio trading practices, and (viii) information regarding the overall organization of MFS, including information about
Board Review of Investment Advisory Agreement - continued
MFS’ senior management and other personnel providing investment advisory, administrative and other services to the Fund and the other MFS Funds. The comparative performance, fee and expense information prepared and provided by Broadridge was not independently verified and the independent Trustees did not independently verify any information provided to them by MFS.
The Trustees’ conclusion as to the continuation of the investment advisory agreement was based on a comprehensive consideration of all information provided to the Trustees and not the result of any single factor. Some of the factors that figured particularly in the Trustees’ deliberations are described below, although individual Trustees may have evaluated the information presented differently from one another, giving different weights to various factors. It is also important to recognize that the fee arrangements for the Fund and other MFS Funds are the result of years of review and discussion between the independent Trustees and MFS, that certain aspects of such arrangements may receive greater scrutiny in some years than in others, and that the Trustees’ conclusions may be based, in part, on their consideration of these same arrangements during the course of the year and in prior years.
Based on information provided by Broadridge and MFS, the Trustees reviewed the Fund’s total return investment performance as well as the Broadridge performance universe over various time periods. The Trustees placed particular emphasis on the total return performance of the Fund’s Class I shares in comparison to the performance of funds in its Broadridge performance universe over the five-year period ended December 31, 2021, which the Trustees believed was a long enough period to reflect differing market conditions. The total return performance of the Fund’s Class I shares was in the 4th quintile relative to the other funds in the universe for this five-year period (the 1st quintile being the best performers and the 5th quintile being the worst performers). The total return performance of the Fund’s Class I shares was in the 4th quintile for the one-year period and the 5th quintile for the three-year period ended December 31, 2021 relative to the Broadridge performance universe. Because of the passage of time, these performance results may differ from the performance results for more recent periods, including those shown elsewhere in this report.
The Trustees expressed continued concern to MFS about the substandard investment performance of the Fund. In the course of their deliberations, the Trustees took into account information provided by MFS in connection with the contract review meetings, as well as during investment review meetings conducted with portfolio management personnel during the course of the year, as to MFS’ efforts to improve the Fund’s performance, including assigning an additional portfolio manager for the Fund effective September 1, 2021. In addition, the Trustees requested that they receive a separate update on the Fund’s performance at each of their regular meetings. After reviewing these and related factors, the Trustees concluded, within the context of their overall conclusions regarding the investment advisory agreement, that MFS’ responses and efforts and plans to improve investment performance were sufficient to support approval of the continuance of the investment advisory agreement for an additional one-year period, but that they would continue to closely monitor the performance of the Fund.
In assessing the reasonableness of the Fund’s advisory fee, the Trustees considered, among other information, the Fund’s advisory fee and the total expense ratio of the Fund’s Class I shares as a percentage of average daily net assets and the advisory fee
Board Review of Investment Advisory Agreement - continued
and total expense ratios of the Broadridge expense group based on information provided by Broadridge. The Trustees considered that, according to the data provided by Broadridge (which takes into account any fee reductions or expense limitations that were in effect during the Fund’s last fiscal year), the Fund’s effective advisory fee rate and total expense ratio were each lower than the Broadridge expense group median.
The Trustees also considered the advisory fees charged by MFS to any institutional separate accounts advised by MFS (“separate accounts”) and unaffiliated investment companies for which MFS serves as subadviser (“subadvised funds”) that have comparable investment strategies to the Fund, if any. In comparing these fees, the Trustees considered information provided by MFS as to the generally broader scope of services provided by MFS to the Fund, as well as the more extensive regulatory burdens imposed on MFS in managing the Fund, in comparison to separate accounts and subadvised funds. The Trustees also considered the higher demands placed on MFS’ investment personnel and trading infrastructure as a result of the daily cash in-flows and out-flows of the Fund in comparison to separate accounts.
The Trustees also considered whether the Fund may benefit from any economies of scale in the management of the Fund in the event of growth in assets of the Fund and/or growth in assets of the MFS Funds as a whole. They noted that the Fund’s advisory fee rate schedule is subject to contractual breakpoints that reduce the Fund’s advisory fee rate on average daily net assets over $500 million, $1 billion, $3 billion, $5 billion and $10 billion. The Trustees also noted that MFS has agreed in writing to waive a portion of the management fees of certain MFS Funds, including the Fund, if the total combined assets of certain funds within the MFS Funds’ complex increase above agreed upon thresholds (the “group fee waiver”), enabling the Fund’s shareholders to share in the benefits from any economies of scale at the complex level. The group fee waiver is reviewed and renewed annually between the Board and MFS. The Trustees concluded that the breakpoints and the group fee waiver were sufficient to allow the Fund to benefit from economies of scale as its assets and overall complex assets grow.
The Trustees also considered information prepared by MFS relating to MFS’ costs and profits with respect to the Fund, the MFS Funds considered as a group, and other investment companies and accounts advised by MFS, as well as MFS’ methodologies used to determine and allocate its costs to the MFS Funds, the Fund and other accounts and products for purposes of estimating profitability.
After reviewing these and other factors described herein, the Trustees concluded, within the context of their overall conclusions regarding the investment advisory agreement, that the advisory fees charged to the Fund represent reasonable compensation in light of the services being provided by MFS to the Fund.
In addition, the Trustees considered MFS’ resources and related efforts to continue to retain, attract and motivate capable personnel to serve the Fund. The Trustees also considered current and developing conditions in the financial services industry, including the presence of large and well-capitalized companies which are spending, and appear to be prepared to continue to spend, substantial sums to engage personnel and to provide services to competing investment companies. In this regard, the Trustees
Board Review of Investment Advisory Agreement - continued
also considered the financial resources of MFS and its ultimate parent, Sun Life Financial Inc. The Trustees also considered the advantages and possible disadvantages to the Fund of having an adviser that also serves other investment companies as well as other accounts.
The Trustees also considered the nature, quality, cost, and extent of administrative, transfer agency, and distribution services provided to the Fund by MFS and its affiliates under agreements and plans other than the investment advisory agreement, including any 12b-1 fees the Fund pays to MFS Fund Distributors, Inc., an affiliate of MFS. The Trustees also considered the nature, extent and quality of certain other services MFS performs or arranges for on the Fund’s behalf, which may include securities lending programs, directed expense payment programs, class action recovery programs, and MFS’ interaction with third-party service providers, principally custodians and sub-custodians. The Trustees concluded that the various non-advisory services provided by MFS and its affiliates on behalf of the Fund were satisfactory.
The Trustees considered so-called “fall-out benefits” to MFS such as reputational value derived from serving as investment manager to the MFS Funds. The Trustees also considered that MFS discontinued its historic practice of obtaining investment research from portfolio brokerage commissions paid by certain MFS Funds effective January 2018, and directly pays or voluntarily reimburses a Fund, if applicable, for the costs of external research acquired through the use of the Fund’s portfolio brokerage commissions.
Based on their evaluation of factors that they deemed to be material, including those factors described above, the Board of Trustees, including the independent Trustees, concluded that the Fund’s investment advisory agreement with MFS should be continued for an additional one-year period, commencing August 1, 2022.
Proxy Voting Policies and Information
MFS votes proxies on behalf of the fund pursuant to proxy voting policies and procedures that are available without charge, upon request, by calling 1-800-225-2606, by visiting mfs.com/proxyvoting, or by visiting the SEC’s Web site at http://www.sec.gov.
Information regarding how the fund voted proxies relating to portfolio securities during the most recent twelve-month period ended June 30 is available by August 31 of each year without charge by visiting mfs.com/proxyvoting, or by visiting the SEC’s Web site at http://www.sec.gov.
Quarterly Portfolio Disclosure
The fund files a complete schedule of portfolio holdings with the SEC for the first and third quarters of each fiscal year as an exhibit to its reports on Form N-PORT. The fund's Form N-PORT reports are available on the SEC's Web site at http://www.sec.gov. A shareholder can obtain the portfolio holdings report for the first and third quarters of the fund's fiscal year at mfs.com/openendfunds by choosing the fund's name and then scrolling to the “Resources” section and clicking on the “Prospectus and Reports” tab.
Further Information
From time to time, MFS may post important information about the fund or the MFS Funds on the MFS Web site (mfs.com). This information is available at https://www.mfs.com/announcements or at mfs.com/openendfunds by choosing the fund’s name and then scrolling to the “Resources” section and clicking on the “Announcements” tab, if any.
Information About Fund Contracts and Legal Claims
The fund has entered into contractual arrangements with an investment adviser, administrator, distributor, shareholder servicing agent, and custodian who each provide services to the fund. Unless expressly stated otherwise, shareholders are not parties to, or intended beneficiaries of these contractual arrangements, and these contractual arrangements are not intended to create any shareholder right to enforce them against the service providers or to seek any remedy under them against the service providers, either directly or on behalf of the fund.
Under the Trust’s By-Laws and Declaration of Trust, any claims asserted against or on behalf of the MFS Funds, including claims against Trustees and Officers, must be brought in state and federal courts located within the Commonwealth of Massachusetts.
Federal Tax Information (unaudited)
The fund will notify shareholders of amounts for use in preparing 2022 income tax forms in January 2023. The following information is provided pursuant to provisions of the Internal Revenue Code.
The fund designates the maximum amount allowable as qualified dividend income eligible to be taxed at the same rate as long-term capital gain.
The fund designates $303,024,000 as capital gain dividends paid during the fiscal year.
Income derived from foreign sources was $166,242,039. The fund intends to pass through foreign tax credits of $15,891,137 for the fiscal year.
| FACTS | WHAT DOES MFS DO WITH YOUR PERSONAL INFORMATION? |
| Why? | Financial companies choose how they share your personal information. Federal law gives consumers the right to limit some but not all sharing. Federal law also requires us to tell you how we collect, share, and protect your personal information. Please read this notice carefully to understand what we do. |
| What? | The types of personal information we collect and share depend on the product or service you have with us. This information can include: |
| • Social Security number and account balances |
| • Account transactions and transaction history |
| • Checking account information and wire transfer instructions |
| When you are no longer our customer, we continue to share your information as described in this notice. |
| How? | All financial companies need to share customers' personal information to run their everyday business. In the section below, we list the reasons financial companies can share their customers' personal information; the reasons MFS chooses to share; and whether you can limit this sharing. |
Reasons we can share your
personal information | Does MFS share? | Can you limit
this sharing? |
For our everyday business purposes –
such as to process your transactions, maintain your
account(s), respond to court orders and legal
investigations, or report to credit bureaus | Yes | No |
For our marketing purposes –
to offer our products and services to you | No | We don't share |
For joint marketing with other
financial companies | No | We don't share |
For our affiliates' everyday business purposes –
information about your transactions and experiences | No | We don't share |
For our affiliates' everyday business purposes –
information about your creditworthiness | No | We don't share |
| For nonaffiliates to market to you | No | We don't share |
| Questions? | Call 800-225-2606 or go to mfs.com. |
| Who we are |
| Who is providing this notice? | MFS Funds, MFS Investment Management, MFS Institutional Advisors, Inc., and MFS Heritage Trust Company. |
| What we do |
How does MFS
protect my personal
information? | To protect your personal information from unauthorized access and use, we use security measures that comply with federal law. These measures include procedural, electronic, and physical safeguards for the protection of the personal information we collect about you. |
How does MFS
collect my personal
information? | We collect your personal information, for example, when you |
| • open an account or provide account information |
| • direct us to buy securities or direct us to sell your securities |
| • make a wire transfer |
| We also collect your personal information from others, such as credit bureaus, affiliates, or other companies. |
| Why can't I limit all sharing? | Federal law gives you the right to limit only |
| • sharing for affiliates' everyday business purposes – information about your creditworthiness |
| • affiliates from using your information to market to you |
| • sharing for nonaffiliates to market to you |
| State laws and individual companies may give you additional rights to limit sharing. |
| Definitions |
| Affiliates | Companies related by common ownership or control. They can be financial and nonfinancial companies. |
| • MFS does not share personal information with affiliates, except for everyday business purposes as described on page one of this notice. |
| Nonaffiliates | Companies not related by common ownership or control. They can be financial and nonfinancial companies. |
| • MFS does not share with nonaffiliates so they can market to you. |
| Joint marketing | A formal agreement between nonaffiliated financial companies that together market financial products or services to you. |
| • MFS doesn't jointly market. |
| Other important information |
| If you own an MFS product or receive an MFS service in the name of a third party such as a bank or broker-dealer, their privacy policy may apply to you instead of ours. |
Save paper with eDelivery.
MFS® will send you prospectuses, reports, and proxies directly via e-mail so you will get information faster with less mailbox clutter.
To sign up:
1. Go to mfs.com.
2. Log in via MFS® Access.
3. Select eDelivery.
If you own your MFS fund shares through a financial institution or a retirement plan, MFS® TALK, MFS® Access, or eDelivery may not be available to you.
CONTACT
WEB SITE
mfs.com
MFS TALK
1-800-637-8255
24 hours a day
ACCOUNT SERVICE AND LITERATURE
Shareholders
1-800-225-2606
Financial advisors
1-800-343-2829
Retirement plan services
1-800-637-1255
MAILING ADDRESS
MFS Service Center, Inc.
P.O. Box 219341
Kansas City, MO 64121-9341
OVERNIGHT MAIL
MFS Service Center, Inc.
Suite 219341
430 W 7th Street
Kansas City, MO 64105-1407
Annual Report
September 30, 2022
| 1 |
| 2 |
| 5 |
| 8 |
| 11 |
| 13 |
| 33 |
| 35 |
| 37 |
| 38 |
| 44 |
| 61 |
| 63 |
| 67 |
| 71 |
| 71 |
| 71 |
| 71 |
| 71 |
| 73 |
The report is prepared for the general information of shareholders. It is authorized for distribution to prospective investors only when preceded or accompanied by a current prospectus.
NOT FDIC INSURED • MAY LOSE VALUE • NO BANK GUARANTEE
LETTER FROM THE CHAIR AND CEO
Dear Shareholders:
Global markets have recently been buffeted by a series of crosscurrents, including rising inflation, tighter financial conditions, and evolving geopolitical tensions. Consequently, at a time when global growth faces multiple headwinds, central banks have been presented with the challenge of reining in rising prices without tipping economies into recession. The U.S. Federal Reserve has made it clear that rates must move higher and tighter policy must be sustained to restore price stability and that this will likely bring some pain to households and businesses. Against that backdrop, richly valued, interest rate–sensitive growth equities have been hit particularly hard by rising interest rates. Volatility in fixed income and currency markets has picked up, with fiscal policy missteps in the United Kingdom leading to a crisis of market confidence that ultimately resulted in the ousting of Prime Minister Liz Truss. That episode could forewarn other governments to avoid policy overreach.
There are, however, encouraging signs for the markets. The latest wave of COVID-19 cases appears to be receding in Asia, and cases outside Asia, while numerous, appear to be causing fewer serious illnesses. Meanwhile, unemployment is low and global supply chain bottlenecks are easing, though lingering coronavirus restrictions in China and disruptions stemming from Russia’s invasion of Ukraine could hamper these advances. Additionally, easier Chinese monetary and regulatory policies and the record pace of corporate stock buybacks are supportive elements, albeit in an otherwise turbulent investment environment.
It is important to have a deep understanding of company fundamentals during times of market transition, and we have built our unique global research platform to do just that.
At MFS®, we put our clients’ assets to work responsibly by carefully navigating increasingly complex global capital markets. Our investment team is guided by a commitment to long-term fundamental investing. Our global investment platform — combining collective expertise, long-term discipline, and thoughtful risk management — seeks to uncover what we believe are the best, most durable investment ideas in markets around the world, enabling us to potentially create value for investors.
Respectfully,
Michael W. Roberge
Chair and Chief Executive Officer
MFS Investment Management
November 14, 2022
The opinions expressed in this letter are subject to change and may not be relied upon for investment advice. No forecasts can be guaranteed.
Portfolio structure (i)
Top ten holdings (i)
| U.S. Treasury Note 5 yr Future - DEC 2022 | 3.1% |
| U.S. Treasury Notes, 1.375%, 1/31/2025 | 3.0% |
| U.S. Treasury Notes, 0.375%, 11/30/2025 | 2.4% |
| Goldman Sachs Group, Inc. | 2.1% |
| UMBS, TBA, 2.5%, 30 year | 2.0% |
| Microsoft Corp. | 2.0% |
| Charles Schwab Corp. | 1.9% |
| Cigna Corp. | 1.8% |
| UMBS, TBA, 2%, 30 year | 1.7% |
| Johnson & Johnson | 1.6% |
Composition including fixed income credit quality (a)(i)
| AAA | 4.3% |
| AA | 1.8% |
| A | 4.0% |
| BBB | 9.0% |
| BB | 0.1% |
| B (o) | 0.0% |
| CCC (o) | 0.0% |
| U.S. Government | 10.9% |
| Federal Agencies | 11.7% |
| Not Rated | 2.8% |
| Non-Fixed Income | 57.5% |
| Cash & Cash Equivalents | 0.7% |
| Other | (2.8)% |
GICS equity sectors (g)
| Financials | 14.2% |
| Health Care | 10.4% |
| Industrials | 8.3% |
| Information Technology | 7.0% |
| Consumer Staples | 4.3% |
| Communication Services | 3.3% |
| Energy | 2.6% |
| Consumer Discretionary | 2.3% |
| Utilities | 2.2% |
| Materials | 1.9% |
| Convertible Debt | 0.7% |
| Real Estate | 0.3% |
Portfolio Composition - continued
Fixed income sectors (i)
| U.S. Treasury Securities | 13.6% |
| Investment Grade Corporates | 12.9% |
| Mortgage-Backed Securities | 11.7% |
| Collateralized Debt Obligations | 3.4% |
| Commercial Mortgage-Backed Securities | 2.0% |
| Asset-Backed Securities | 0.4% |
| Municipal Bonds | 0.3% |
| Non-U.S. Government Bonds | 0.1% |
| Emerging Markets Bonds | 0.1% |
| High Yield Corporates | 0.1% |
| U.S. Government Agencies (o) | 0.0% |
| (a) | For all securities other than those specifically described below, ratings are assigned to underlying securities utilizing ratings from Moody’s, Fitch, and Standard & Poor’s rating agencies and applying the following hierarchy: If all three agencies provide a rating, the middle rating (after dropping the highest and lowest ratings) is assigned; if two of the three agencies rate a security, the lower of the two is assigned. If none of the 3 rating agencies above assign a rating, but the security is rated by DBRS Morningstar, then the DBRS Morningstar rating is assigned. If none of the 4 rating agencies listed above rate the security, but the security is rated by the Kroll Bond Rating Agency (KBRA), then the KBRA rating is assigned. Ratings are shown in the S&P and Fitch scale (e.g., AAA). Securities rated BBB or higher are considered investment grade. All ratings are subject to change. U.S. Government includes securities issued by the U.S. Department of the Treasury. Federal Agencies includes rated and unrated U.S. Agency fixed-income securities, U.S. Agency mortgage-backed securities, and collateralized mortgage obligations of U.S. Agency mortgage-backed securities. |
Not Rated includes fixed income securities and fixed income derivatives that have not been rated by any rating agency. Non-Fixed Income includes equity securities (including convertible bonds and equity derivatives) and/or commodity-linked derivatives. The fund may or may not have held all of these instruments on this date. The fund is not rated by these agencies.
| (g) | The Global Industry Classification Standard (GICS®) was developed by and/or is the exclusive property of MSCI, Inc. and S&P Global Market Intelligence Inc. (“S&P Global Market Intelligence”). GICS is a service mark of MSCI and S&P Global Market Intelligence and has been licensed for use by MFS. MFS has applied its own internal sector/industry classification methodology for equity securities and non-equity securities that are unclassified by GICS. |
| (i) | For purposes of this presentation, the components include the value of securities, and reflect the impact of the equivalent exposure of derivative positions, if any. These amounts may be negative from time to time. Equivalent exposure is a calculated amount that translates the derivative position into a reasonable approximation of the amount of the underlying asset that the portfolio would have to hold at a given point in time to have the same price sensitivity that results from the portfolio’s ownership of the derivative contract. When dealing with derivatives, equivalent exposure is a more representative measure of the potential impact of a position on portfolio performance than value. The bond component will include any accrued interest amounts. |
Where the fund holds convertible bonds, they are treated as part of the equity portion of the portfolio.
Portfolio Composition - continued
Cash & Cash Equivalents includes any cash, investments in money market funds, short-term securities, and other assets less liabilities. Please see the Statement of Assets and Liabilities for additional information related to the fund’s cash position and other assets and liabilities.
Other includes equivalent exposure from currency derivatives and/or any offsets to derivative positions and may be negative.
Percentages are based on net assets as of September 30, 2022.
The portfolio is actively managed and current holdings may be different.
Management Review
Summary of Results
For the twelve months ended September 30, 2022, Class A shares of the MFS Total Return Fund (fund) provided a total return of -12.61%, at net asset value. This compares with a return of -15.47% and -14.60% for the fund’s benchmarks, the Standard & Poor’s 500 Stock Index (S&P 500 Index) and the Bloomberg U.S. Aggregate Bond Index (Bloomberg Index), respectively. The fund’s other benchmark, the MFS Total Return Blended Index (Blended Index), generated a return of -14.85%. The Blended Index reflects the blended returns of the equity and fixed income market indices, with percentage allocations to each index designed to resemble the equity and fixed income allocations of the fund. The market indices and related percentage allocations used to compile the Blended Index are set forth in the Performance Summary.
Market Environment
During the reporting period, markets continued to grapple with the strongest global inflationary pressures in decades along with signs of slowing economic growth. Intermittent coronavirus flareups, particularly in China, where home-grown vaccines have proved less effective than elsewhere, have kept supply chains stretched for longer than expected. At the same time, the reopening of the economy in the parts of the world where the virus has been better contained has led to a shift in consumption patterns in favor of services, straining already tight labor markets in most developed economies, while reducing demand for manufactured goods, primarily from Asia. As a result of Russia’s invasion of Ukraine, geopolitical considerations, such as sanctions and trade bans, have resulted in additional supply chain tumult and volatile global energy prices. Taken together, these factors have contributed to market volatility.
The ripple effects from the Russian invasion further complicated the mission central banks must undertake to rein in surging inflation. Energy shocks have historically resulted in global growth slowdowns, if not pullbacks, so policymakers will find themselves in the difficult position of trying to restrain inflation without tipping economies into recession. Despite the challenging macroeconomic and geopolitical environment, policymakers remained focused on corralling inflation, although investors appeared to have expected varying degrees of action from the central banks. The Fed was expected to be the most hawkish developed market central bank and the European Central Bank less so, given the growth-depleting effects on Europe's economy stemming from the invasion, while the Bank of Japan remained on the monetary sidelines, leading to a dramatic weakening of the yen.
Against an environment of rising labor and volatile materials prices, higher interest rates and waning fiscal and monetary stimulus, investor anxiety appeared to have increased over the potential that corporate profit margins may be past peak for this cycle. That said, tentative signs that supply chain bottlenecks (particularly semiconductors) may be easing, low levels of unemployment across developed markets and somewhat easier prices for raw materials were supportive factors for the macroeconomic backdrop.
Management Review - continued
Contributors to Performance
Within the equity portion of the fund, both stock selection and an overweight position in the health care sector supported performance relative to the S&P 500 Index. Within this sector, the fund’s overweight positions in global health services provider Cigna, health services and information technology company McKesson and pharmaceutical company Merck & Co. bolstered relative results. The share price of Cigna advanced as the company posted strong results within its Healthcare division, particularly better-than-anticipated medical loss ratio rebates and stronger operating income growth.
The fund’s underweight position and security selection in the communication services sector also aided relative returns. Here, not owning shares of social networking services provider Meta Platforms, and an underweight position in technology company Alphabet, bolstered relative performance. The share price of Meta Platforms declined over rising competition from Tiktok, Apple's App Tracking Transparency headwinds and incremental e-commerce and supply chain issues. Additionally, Meta Platform's softer-than-expected outlook for the remainder of the year appeared to have weighed on the stock price, reflecting uncertain macroeconomic conditions and further weakening of online advertisement demand.
Stocks in other sectors that supported relative performance included the fund’s overweight positions in oil and gas company ConocoPhillips, global integrated energy company Hess and independent oil and gas exploration and production company Pioneer Natural Resources. The share price of ConocoPhillips benefited from stronger-than-expected earnings growth led by a combination of strong production volumes and higher commodity prices. In addition, ConocoPhillips significantly increased its 2022 capital return targets, which further supported the stock price. Not owning shares of internet retailer Amazon.com and digital payment technology developer PayPal further bolstered relative results as both stocks underperformed the benchmark.
Within the fixed income portion of the fund, a shorter duration(d) stance strengthened the fund’s performance relative to the Bloomberg Index, as interest rates rose throughout the reporting period.
Detractors from Performance
Within the equity portion of the fund, stock selection within the materials sector held back performance relative to the S&P 500 Index, however, there were no individual stocks within this sector, either in the fund or in the benchmark, that were among the fund's top relative detractors over the reporting period.
Individual stocks in other sectors that weakened relative returns included the fund's overweight positions in cable services provider Comcast, power and hand tools manufacturer Stanley Black & Decker, global financial services firm JPMorgan Chase and vehicle components manufacturer Aptiv. The share price of Comcast suffered from higher-than-expected broadband and video subscriber losses due to increased competitive pressure and lower customer acquisition opportunities, owing to fewer household moves, reflecting the macroeconomic backdrop. Not owning shares of computer and personal electronics maker Apple, integrated oil and gas company Exxon Mobil, health insurance and Medicare/Medicaid provider UnitedHealth Group, integrated energy company Chevron, electric vehicle manufacturer Tesla and
Management Review - continued
pharmaceutical company Eli Lilly further dampened relative performance. The share price of Apple advanced due to better-than-expected revenue growth led by fewer supply chain impacts. Despite ongoing component shortages impacting Mac and iPad sales and global currency headwinds, Apple continued to demonstrate the strength of its product ecosystem with broad-based growth. iPhone and Services Segment sales remained strong across all regions with revenue growth ahead of estimates.
Within the fixed income portion of the fund, asset allocation and security selection decisions detracted from performance relative to the Bloomberg Index. From a sector perspective, the fund's underweight allocation to the treasury sector held back relative returns. Security selection within the financial institutions sector, particularly bond selection within the “A” and “BBB” rated(r) credit quality segments, further weakened the fund’s relative performance.
Respectfully,
Portfolio Manager(s)
Steven Gorham, Alexander Mackey, Joshua Marston, Johnathan Munko, and Henry Peabody
| (d) | Duration is a measure of how much a bond’s price is likely to fluctuate with general changes in interest rates, e.g., if rates rise 1.00%, a bond with a 5-year duration is likely to lose about 5.00% of its value. |
| (r) | Securities rated “BBB”, “Baa”, or higher are considered investment grade; securities rated “BB”, “Ba”, or below are considered non-investment grade. Ratings are assigned to underlying securities utilizing ratings from Moody's, Fitch, and Standard & Poor's and applying the following hierarchy: If all three agencies provide a rating, the middle rating (after dropping the highest and lowest ratings) is assigned; if two of the three agencies rate a security, the lower of the two is assigned. If none of the 3 rating agencies above assign a rating, but the security is rated by DBRS Morningstar, then the DBRS Morningstar rating is assigned. If none of the 4 rating agencies listed above rate the security, but the security is rated by the Kroll Bond Rating Agency (KBRA), then the KBRA rating is assigned. Ratings are shown in the S&P and Fitch scale (e.g., AAA). For securities that are not rated by any of the rating agencies, the security is considered Not Rated. |
The views expressed in this report are those of the portfolio manager(s) only through the end of the period of the report as stated on the cover and do not necessarily reflect the views of MFS or any other person in the MFS organization. These views are subject to change at any time based on market or other conditions, and MFS disclaims any responsibility to update such views. These views may not be relied upon as investment advice or an indication of trading intent on behalf of any MFS portfolio. References to specific securities are not recommendations of such securities, and may not be representative of any MFS portfolio’s current or future investments.
Performance Summary THROUGH 9/30/22
The following chart illustrates a representative class of the fund’s historical performance in comparison to its benchmark(s). Performance results include the deduction of the maximum applicable sales charge and reflect the percentage change in net asset value, including reinvestment of dividends and capital gains distributions. The performance of other share classes will be greater than or less than that of the class depicted below. Benchmarks are unmanaged and may not be invested in directly. Benchmark returns do not reflect sales charges, commissions or expenses. (See Notes to Performance Summary.)
Performance data shown represents past performance and is no guarantee of future results. Investment return and principal value fluctuate so your shares, when sold, may be worth more or less than the original cost; current performance may be lower or higher than quoted. The performance shown does not reflect the deduction of taxes, if any, that a shareholder would pay on fund distributions or the redemption of fund shares.
Growth of a Hypothetical $10,000 Investment
Performance Summary - continued
Total Returns through 9/30/22
Average annual without sales charge
| Share Class | Class Inception Date | 1-yr | 5-yr | 10-yr |
| A | 10/06/70 | (12.61)% | 4.11% | 6.45% |
| B | 8/23/93 | (13.25)% | 3.34% | 5.66% |
| C | 8/01/94 | (13.26)% | 3.34% | 5.66% |
| I | 1/02/97 | (12.39)% | 4.38% | 6.72% |
| R1 | 4/01/05 | (13.28)% | 3.34% | 5.65% |
| R2 | 10/31/03 | (12.83)% | 3.86% | 6.18% |
| R3 | 4/01/05 | (12.60)% | 4.11% | 6.45% |
| R4 | 4/01/05 | (12.37)% | 4.37% | 6.72% |
| R6 | 6/01/12 | (12.32)% | 4.45% | 6.80% |
Comparative benchmark(s)
| Standard & Poor's 500 Stock Index (f) | (15.47)% | 9.24% | 11.70% |
| Bloomberg U.S. Aggregate Bond Index (f) | (14.60)% | (0.27)% | 0.89% |
| MFS Total Return Blended Index (f)(w) | (14.85)% | 5.70% | 7.50% |
Average annual with sales charge
| | | | |
A
With Initial Sales Charge (5.75%) | (17.63)% | 2.88% | 5.83% |
B
With CDSC (Declining over six years from 4% to 0%) (v) | (16.48)% | 3.01% | 5.66% |
C
With CDSC (1% for 12 months) (v) | (14.07)% | 3.34% | 5.66% |
CDSC – Contingent Deferred Sales Charge.
Class I, R1, R2, R3, R4, and R6 shares do not have a sales charge.
| (f) | Source: FactSet Research Systems Inc. |
| (v) | Assuming redemption at the end of the applicable period. |
| (w) | The MFS Total Return Blended Index (a custom index) was comprised of the following at the beginning and at the end of the reporting period: |
| | 9/30/22 |
| Standard & Poor's 500 Stock Index | 60% |
| Bloomberg U.S. Aggregate Bond Index | 40% |
Benchmark Definition(s)
Bloomberg U.S. Aggregate Bond Index(a) – a market capitalization-weighted index that measures the performance of the U.S. investment-grade, fixed rate bond market, with index components for government and corporate securities, mortgage pass-through securities, and asset-backed securities with at least one year to final maturity.
Standard & Poor's 500 Stock Index(g) – a market capitalization-weighted index of 500 widely held equity securities, designed to measure broad U.S. equity performance.
Performance Summary - continued
It is not possible to invest directly in an index.
| (a) | Source: Bloomberg Index Services Limited. BLOOMBERG® is a trademark and service mark of Bloomberg Finance L.P. and its affiliates (collectively “Bloomberg”). Bloomberg or Bloomberg's licensors own all proprietary rights in the Bloomberg Indices. Bloomberg neither approves or endorses this material, or guarantees the accuracy or completeness of any information herein, or makes any warranty, express or implied, as to the results to be obtained therefrom and, to the maximum extent allowed by law, neither shall have any liability or responsibility for injury or damages arising in connection therewith. |
| (g) | “Standard & Poor's®” and “S&P®” are registered trademarks of Standard & Poor's Financial Services LLC (“S&P”) and Dow Jones is a registered trademark of Dow Jones Trademark Holdings LLC (“Dow Jones”) and have been licensed for use by S&P Dow Jones Indices LLC and sublicensed for certain purposes by MFS. The S&P 500® is a product of S&P Dow Jones Indices LLC, and has been licensed for use by MFS. MFS's product(s) is not sponsored, endorsed, sold, or promoted by S&P Dow Jones Indices LLC, Dow Jones, S&P, or their respective affiliates, and neither S&P Dow Jones Indices LLC, Dow Jones, S&P, nor their respective affiliates make any representation regarding the advisability of investing in such product(s). |
Notes to Performance Summary
Average annual total return represents the average annual change in value for each share class for the periods presented.
Performance results reflect any applicable expense subsidies and waivers in effect during the periods shown. Without such subsidies and waivers the fund's performance results would be less favorable. Please see the prospectus and financial statements for complete details.
Performance results do not include adjustments made for financial reporting purposes in accordance with U.S. generally accepted accounting principles and may differ from amounts reported in the financial highlights.
From time to time the fund may receive proceeds from litigation settlements, without which performance would be lower.
Expense Table
Fund expenses borne by the shareholders during the period,
April 1, 2022 through September 30, 2022
As a shareholder of the fund, you incur two types of costs: (1) transaction costs, including sales charges (loads) on certain purchase or redemption payments, and (2) ongoing costs, including management fees; distribution and service (12b-1) fees; and other fund expenses. This example is intended to help you understand your ongoing costs (in dollars) of investing in the fund and to compare these costs with the ongoing costs of investing in other mutual funds.
The example is based on an investment of $1,000 invested at the beginning of the period and held for the entire period April 1, 2022 through September 30, 2022.
Actual Expenses
The first line for each share class in the following table provides information about actual account values and actual expenses. You may use the information in this line, together with the amount you invested, to estimate the expenses that you paid over the period. Simply divide your account value by $1,000 (for example, an $8,600 account value divided by $1,000 = 8.6), then multiply the result by the number in the first line under the heading entitled “Expenses Paid During Period” to estimate the expenses you paid on your account during this period.
Hypothetical Example for Comparison Purposes
The second line for each share class in the following table provides information about hypothetical account values and hypothetical expenses based on the fund’s actual expense ratio and an assumed rate of return of 5% per year before expenses, which is not the fund’s actual return. The hypothetical account values and expenses may not be used to estimate the actual ending account balance or expenses you paid for the period. You may use this information to compare the ongoing costs of investing in the fund and other funds. To do so, compare this 5% hypothetical example with the 5% hypothetical examples that appear in the shareholder reports of the other funds.
Please note that the expenses shown in the table are meant to highlight your ongoing costs only and do not reflect any transactional costs, such as sales charges (loads). Therefore, the second line for each share class in the table is useful in comparing ongoing costs only, and will not help you determine the relative total costs of owning different funds. In addition, if these transactional costs were included, your costs would have been higher.
Expense Table - continued
Share
Class | | Annualized
Expense
Ratio | Beginning
Account Value
4/01/22 | Ending
Account Value
9/30/22 | Expenses
Paid During
Period (p)
4/01/22-9/30/22 |
| A | Actual | 0.72% | $1,000.00 | $874.59 | $3.38 |
| Hypothetical (h) | 0.72% | $1,000.00 | $1,021.46 | $3.65 |
| B | Actual | 1.47% | $1,000.00 | $871.50 | $6.90 |
| Hypothetical (h) | 1.47% | $1,000.00 | $1,017.70 | $7.44 |
| C | Actual | 1.47% | $1,000.00 | $871.79 | $6.90 |
| Hypothetical (h) | 1.47% | $1,000.00 | $1,017.70 | $7.44 |
| I | Actual | 0.47% | $1,000.00 | $876.13 | $2.21 |
| Hypothetical (h) | 0.47% | $1,000.00 | $1,022.71 | $2.38 |
| R1 | Actual | 1.47% | $1,000.00 | $871.56 | $6.90 |
| Hypothetical (h) | 1.47% | $1,000.00 | $1,017.70 | $7.44 |
| R2 | Actual | 0.97% | $1,000.00 | $873.95 | $4.56 |
| Hypothetical (h) | 0.97% | $1,000.00 | $1,020.21 | $4.91 |
| R3 | Actual | 0.72% | $1,000.00 | $874.70 | $3.38 |
| Hypothetical (h) | 0.72% | $1,000.00 | $1,021.46 | $3.65 |
| R4 | Actual | 0.47% | $1,000.00 | $876.31 | $2.21 |
| Hypothetical (h) | 0.47% | $1,000.00 | $1,022.71 | $2.38 |
| R6 | Actual | 0.39% | $1,000.00 | $876.48 | $1.83 |
| Hypothetical (h) | 0.39% | $1,000.00 | $1,023.11 | $1.98 |
| (h) | 5% class return per year before expenses. |
| (p) | “Expenses Paid During Period” are equal to each class’s annualized expense ratio, as shown above, multiplied by the average account value over the period, multiplied by 183/365 (to reflect the one-half year period). Expenses paid do not include any applicable sales charges (loads). If these transaction costs had been included, your costs would have been higher. |
Portfolio of Investments
9/30/22
The Portfolio of Investments is a complete list of all securities owned by your fund. It is categorized by broad-based asset classes.
| Issuer | | | Shares/Par | Value ($) |
| Common Stocks – 56.2% |
| Aerospace & Defense – 2.3% | |
| Honeywell International, Inc. | | 354,594 | $59,206,560 |
| Howmet Aerospace, Inc. | | 907,179 | 28,059,047 |
| L3Harris Technologies, Inc. | | 229,905 | 47,781,156 |
| Northrop Grumman Corp. | | 53,825 | 25,314,974 |
| | | | | $160,361,737 |
| Alcoholic Beverages – 0.4% | |
| Constellation Brands, Inc., “A” | | 115,706 | $26,575,354 |
| Automotive – 1.5% | |
| Aptiv PLC (a) | | 401,082 | $31,368,623 |
| Lear Corp. | | 288,365 | 34,514,407 |
| LKQ Corp. | | 884,258 | 41,692,765 |
| | | | | $107,575,795 |
| Broadcasting – 0.5% | |
| Omnicom Group, Inc. | | 446,942 | $28,197,571 |
| Warner Bros. Discovery, Inc. (a) | | 644,697 | 7,414,015 |
| | | | | $35,611,586 |
| Brokerage & Asset Managers – 3.1% | |
| Cboe Global Markets, Inc. | | 233,781 | $27,438,876 |
| Charles Schwab Corp. | | 1,888,672 | 135,738,857 |
| Invesco Ltd. | | 1,365,802 | 18,711,487 |
| NASDAQ, Inc. | | 722,076 | 40,927,268 |
| | | | | $222,816,488 |
| Business Services – 2.6% | |
| Accenture PLC, “A” | | 138,179 | $35,553,457 |
| Amdocs Ltd. | | 527,950 | 41,945,628 |
| Cognizant Technology Solutions Corp., “A” | | 414,762 | 23,823,929 |
| Equifax, Inc. | | 76,666 | 13,142,852 |
| Fidelity National Information Services, Inc. | | 453,677 | 34,284,371 |
| Fiserv, Inc. (a) | | 352,177 | 32,953,202 |
| | | | | $181,703,439 |
| Cable TV – 1.2% | |
| Comcast Corp., “A” | | 3,002,602 | $88,066,317 |
| Chemicals – 0.5% | |
| PPG Industries, Inc. | | 341,233 | $37,771,081 |
Portfolio of Investments – continued
| Issuer | | | Shares/Par | Value ($) |
| Common Stocks – continued |
| Computer Software – 2.2% | |
| Microsoft Corp. | | 612,752 | $142,709,941 |
| Oracle Corp. | | 270,747 | 16,534,519 |
| | | | | $159,244,460 |
| Construction – 1.6% | |
| Masco Corp. | | 1,303,345 | $60,853,178 |
| Stanley Black & Decker, Inc. | | 430,786 | 32,399,415 |
| Vulcan Materials Co. | | 148,090 | 23,355,274 |
| | | | | $116,607,867 |
| Consumer Products – 0.2% | |
| Kimberly-Clark Corp. | | 111,848 | $12,587,374 |
| Consumer Services – 0.2% | |
| Booking Holdings, Inc. (a) | | 6,400 | $10,516,544 |
| Electrical Equipment – 1.0% | |
| Johnson Controls International PLC | | 1,398,218 | $68,820,290 |
| Electronics – 2.3% | |
| Applied Materials, Inc. | | 352,440 | $28,875,409 |
| Intel Corp. | | 1,317,038 | 33,940,069 |
| NXP Semiconductors N.V. | | 281,670 | 41,549,142 |
| Taiwan Semiconductor Manufacturing Co. Ltd., ADR | | 313,148 | 21,469,427 |
| Texas Instruments, Inc. | | 230,226 | 35,634,380 |
| | | | | $161,468,427 |
| Energy - Independent – 2.6% | |
| ConocoPhillips | | 776,499 | $79,466,908 |
| Hess Corp. | | 534,498 | 58,254,937 |
| Pioneer Natural Resources Co. | | 227,399 | 49,238,705 |
| | | | | $186,960,550 |
| Food & Beverages – 1.8% | |
| Archer Daniels Midland Co. | | 338,770 | $27,254,047 |
| Danone S.A. | | 354,695 | 16,712,121 |
| General Mills, Inc. | | 385,352 | 29,521,817 |
| J.M. Smucker Co. | | 109,842 | 15,093,389 |
| Mondelez International, Inc. | | 317,858 | 17,428,154 |
| PepsiCo, Inc. | | 124,073 | 20,256,158 |
| | | | | $126,265,686 |
| General Merchandise – 0.1% | |
| Dollar Tree, Inc. (a) | | 72,308 | $9,841,119 |
Portfolio of Investments – continued
| Issuer | | | Shares/Par | Value ($) |
| Common Stocks – continued |
| Health Maintenance Organizations – 1.8% | |
| Cigna Corp. | | 473,384 | $131,349,858 |
| Insurance – 3.2% | |
| Aon PLC | | 274,078 | $73,417,274 |
| Chubb Ltd. | | 371,551 | 67,577,696 |
| Travelers Cos., Inc. | | 208,769 | 31,983,410 |
| Willis Towers Watson PLC | | 268,619 | 53,976,302 |
| | | | | $226,954,682 |
| Internet – 0.5% | |
| Alphabet, Inc., “A” (a) | | 383,977 | $36,727,400 |
| Leisure & Toys – 0.3% | |
| Electronic Arts, Inc. | | 182,536 | $21,121,240 |
| Machinery & Tools – 2.6% | |
| Eaton Corp. PLC | | 724,199 | $96,579,178 |
| Ingersoll Rand, Inc. | | 794,988 | 34,391,181 |
| PACCAR, Inc. | | 26,687 | 2,233,435 |
| Regal Rexnord Corp. | | 364,841 | 51,209,083 |
| | | | | $184,412,877 |
| Major Banks – 6.2% | |
| Bank of America Corp. | | 2,831,520 | $85,511,904 |
| Goldman Sachs Group, Inc. | | 511,254 | 149,822,985 |
| JPMorgan Chase & Co. | | 1,082,078 | 113,077,151 |
| Morgan Stanley | | 698,943 | 55,223,486 |
| PNC Financial Services Group, Inc. | | 244,871 | 36,588,625 |
| | | | | $440,224,151 |
| Medical & Health Technology & Services – 1.4% | |
| ICON PLC (a) | | 111,778 | $20,542,561 |
| McKesson Corp. | | 164,692 | 55,973,870 |
| Quest Diagnostics, Inc. | | 202,125 | 24,798,716 |
| | | | | $101,315,147 |
| Medical Equipment – 2.5% | |
| Becton, Dickinson and Co. | | 95,698 | $21,324,385 |
| Danaher Corp. | | 259,707 | 67,079,721 |
| Medtronic PLC | | 667,146 | 53,872,040 |
| Thermo Fisher Scientific, Inc. | | 69,283 | 35,139,645 |
| | | | | $177,415,791 |
| Metals & Mining – 0.2% | |
| Rio Tinto PLC | | 204,178 | $11,059,000 |
Portfolio of Investments – continued
| Issuer | | | Shares/Par | Value ($) |
| Common Stocks – continued |
| Other Banks & Diversified Financials – 1.7% | |
| Northern Trust Corp. | | 392,027 | $33,541,830 |
| Truist Financial Corp. | | 2,074,718 | 90,333,222 |
| | | | | $123,875,052 |
| Pharmaceuticals – 4.6% | |
| Bayer AG | | 605,552 | $27,944,967 |
| Johnson & Johnson | | 712,367 | 116,372,273 |
| Merck & Co., Inc. | | 1,291,345 | 111,210,632 |
| Organon & Co. | | 566,866 | 13,264,664 |
| Roche Holding AG | | 102,403 | 33,389,424 |
| Vertex Pharmaceuticals, Inc. (a) | | 93,831 | 27,167,828 |
| | | | | $329,349,788 |
| Railroad & Shipping – 1.0% | |
| Union Pacific Corp. | | 354,502 | $69,064,080 |
| Real Estate – 0.3% | |
| STORE Capital Corp., REIT | | 774,817 | $24,275,017 |
| Restaurants – 0.2% | |
| Wendy's Co. | | 843,253 | $15,760,398 |
| Specialty Chemicals – 0.8% | |
| Axalta Coating Systems Ltd. (a) | | 1,555,464 | $32,758,072 |
| DuPont de Nemours, Inc. | | 548,961 | 27,667,634 |
| | | | | $60,425,706 |
| Specialty Stores – 0.9% | |
| Home Depot, Inc. | | 32,436 | $8,950,390 |
| Ross Stores, Inc. | | 105,413 | 8,883,154 |
| Wal-Mart Stores, Inc. | | 358,335 | 46,476,049 |
| | | | | $64,309,593 |
| Telecommunications - Wireless – 0.8% | |
| T-Mobile US, Inc. (a) | | 428,969 | $57,554,771 |
| Tobacco – 0.9% | |
| Philip Morris International, Inc. | | 769,056 | $63,839,338 |
| Utilities - Electric Power – 2.2% | |
| Duke Energy Corp. | | 423,500 | $39,393,970 |
| Exelon Corp. | | 824,234 | 30,875,806 |
| PG&E Corp. (a) | | 3,032,913 | 37,911,412 |
| Southern Co. | | 744,313 | 50,613,284 |
| | | | | $158,794,472 |
| Total Common Stocks (Identified Cost, $2,718,481,204) | | $4,010,622,475 |
Portfolio of Investments – continued
| Issuer | | | Shares/Par | Value ($) |
| Bonds – 41.5% |
| Aerospace & Defense – 0.1% |
| BAE Systems PLC, 3.4%, 4/15/2030 (n) | | $ | 3,048,000 | $2,639,693 |
| Huntington Ingalls Industries, Inc., 3.844%, 5/01/2025 | | | 1,566,000 | 1,500,699 |
| Raytheon Technologies Corp., 4.125%, 11/16/2028 | | | 4,900,000 | 4,578,113 |
| | | | | $8,718,505 |
| Asset-Backed & Securitized – 5.8% |
| ACRES 2021-FL2 Issuer Ltd., “AS”, FLR, 4.689% (LIBOR - 1mo. + 1.75%), 1/15/2037 (n) | | $ | 6,082,500 | $5,850,673 |
| Allegro CLO Ltd., 2016-1A, “BR2”, FLR, 4.062% (LIBOR - 3mo. + 1.55%), 1/15/2030 (n) | | | 7,806,564 | 7,471,202 |
| Arbor Realty Trust, Inc., CLO, 2020-FL1, “AS”, FLR, 4.359% (LIBOR - 1mo. + 1.4%), 2/15/2035 (n) | | | 3,610,000 | 3,503,458 |
| Arbor Realty Trust, Inc., CLO, 2021-FL1, “AS”, FLR, 4.017% (LIBOR - 1mo. + 1.2%), 12/15/2035 (n) | | | 6,771,500 | 6,533,624 |
| Arbor Realty Trust, Inc., CLO, 2021-FL2, “B”, FLR, 4.418% (LIBOR - 1mo. + 1.6%), 5/15/2036 (n) | | | 1,950,000 | 1,847,093 |
| Arbor Realty Trust, Inc., CLO, 2021-FL3, “B”, FLR, 4.417% (LIBOR - 1mo. + 1.6%), 8/15/2034 (n) | | | 5,818,000 | 5,410,740 |
| Arbor Realty Trust, Inc., CLO, 2022-FL1, “B”, FLR, 4.385% (SOFR - 30 day + 2.1%), 1/15/2037 (n) | | | 16,706,500 | 16,163,006 |
| AREIT 2019-CRE3 Trust, “AS”, FLR, 4.336% (LIBOR - 1mo. + 1.3%), 9/14/2036 (n) | | | 10,151,500 | 10,129,624 |
| AREIT 2022-CRE6 Trust, “B”, FLR, 4.134% (SOFR - 30 day + 1.85%), 1/16/2037 (n) | | | 10,151,500 | 9,619,825 |
| Bayview Financial Revolving Mortgage Loan Trust, FLR, 4.713% (LIBOR - 1mo. + 1.6%), 12/28/2040 (n) | | | 1,225,420 | 1,455,622 |
| BDS 2019-FL4 Ltd., “A”, FLR, 4.039% (LIBOR - 1mo. + 1.10%), 8/15/2036 (n) | | | 531,483 | 531,483 |
| BSPRT 2021-FL6 Issuer Ltd., “AS”, FLR, 4.118% (LIBOR - 1mo. + 1.3%), 3/15/2036 (n) | | | 17,122,500 | 16,432,018 |
| BSPRT 2021-FL7 Issuer Ltd., “B”, FLR, 4.867% (LIBOR - 1mo. + 2.05%), 12/15/2038 (n) | | | 2,794,000 | 2,695,746 |
| BSPRT 2022-FL8 Issuer Ltd., “B”, FLR, 4.335% (SOFR - 30 day + 2.05%), 2/15/2037 (n) | | | 5,979,000 | 5,826,127 |
| Business Jet Securities LLC, 2021-1A, “A”, 2.162%, 4/15/2036 (n) | | | 3,701,374 | 3,249,632 |
| BXMT 2021-FL4 Ltd., “AS”, FLR, 4.117% (LIBOR - 1mo. + 1.3%), 5/15/2038 (n) | | | 16,816,500 | 16,459,477 |
| CHCP 2021-FL1 Ltd., “AS”, FLR, 4.336% (LIBOR - 1mo. + 1.3%) 2/15/2038 (n) | | | 7,049,000 | 6,873,452 |
| Columbia Cent CLO 28 Ltd., “A-2-R”, 4.563%, 11/07/2030 (n) | | | 11,264,069 | 10,657,195 |
| Commercial Mortgage Trust, 2015-DC1, “A5”, 3.35%, 2/10/2048 | | | 7,000,000 | 6,682,999 |
Portfolio of Investments – continued
| Issuer | | | Shares/Par | Value ($) |
| Bonds – continued |
| Asset-Backed & Securitized – continued |
| Commercial Mortgage Trust, 2015-LC21, “A4”, 3.708%, 7/10/2048 | | $ | 9,641,397 | $9,241,750 |
| Commercial Mortgage Trust, 2015-PC1, “A5”, 3.902%, 7/10/2050 | | | 11,000,000 | 10,586,601 |
| Credit Acceptance Auto Loan Trust, 2021-3A, “B”, 1.38%, 7/15/2030 (n) | | | 3,623,000 | 3,286,520 |
| CSAIL Commercial Mortgage Trust, 2015-C2, “A4”, 3.504%, 6/15/2057 | | | 5,534,308 | 5,272,277 |
| Cutwater 2015-1A Ltd., “AR”, FLR, 3.732% (LIBOR - 3mo. + 1.22%), 1/15/2029 (n) | | | 5,440,801 | 5,389,125 |
| Dryden Senior Loan Fund, 2013-26A, “AR”, CLO, FLR, 3.412% (LIBOR - 3mo. + 0.9%), 4/15/2029 (n) | | | 7,766,312 | 7,601,892 |
| Dryden Senior Loan Fund, 2018-55A, “A1”, CLO, FLR, 3.532% (LIBOR - 3mo. + 1.02%), 4/15/2031 (n) | | | 11,647,598 | 11,418,280 |
| GMAC Mortgage Corp. Loan Trust, 5.805%, 10/25/2036 | | | 229,541 | 230,730 |
| GS Mortgage Securities Trust, 2015-GC30, ���A4”, 3.382%, 5/10/2050 | | | 10,734,280 | 10,212,634 |
| JPMBB Commercial Mortgage Securities Trust, 2015-C28, “A4”, 3.227%, 10/15/2048 | | | 13,361,337 | 12,684,420 |
| LCCM 2021-FL2 Trust, “B”, FLR, 4.718% (LIBOR - 1mo. + 1.9%), 12/13/2038 (n) | | | 8,231,500 | 7,975,690 |
| LoanCore 2021-CRE5 Ltd., “AS”, FLR, 4.567% (LIBOR - 1mo. + 1.75%), 7/15/2036 (n) | | | 16,915,500 | 16,281,730 |
| Magnetite XVI Ltd., 2015-16A, “AR”, FLR, 3.54% (LIBOR - 3mo. + 0.8%), 1/18/2028 (n) | | | 3,856,810 | 3,801,140 |
| MF1 2020-FL4 Ltd., “A”, FLR, 4.66% (LIBOR - 1mo. + 1.7%), 11/15/2035 (n) | | | 3,873,348 | 3,854,755 |
| MF1 2021-FL5 Ltd., “AS”, FLR, 4.159% (LIBOR - 1mo. + 1.2%), 7/15/2036 (n) | | | 17,497,000 | 17,012,263 |
| MF1 2022-FL8 Ltd., “B”, FLR, 4.234% (SOFR - 30 day + 1.95%), 2/19/2037 (n) | | | 7,392,231 | 7,065,873 |
| MidOcean Credit CLO, 2013-2A, “BR”, FLR, 4.456% (LIBOR - 3mo. + 1.65%), 1/29/2030 (n) | | | 12,682,806 | 12,083,962 |
| Morgan Stanley Bank of America Merrill Lynch Trust, 2017-C34, “A4”, 3.536%, 11/15/2052 | | | 4,195,516 | 3,862,322 |
| Neuberger Berman CLO Ltd., 2013-15A, “BR2”, FLR, 3.862% (LIBOR - 3mo. + 1.35%), 10/15/2029 (n) | | | 5,618,950 | 5,310,953 |
| Neuberger Berman CLO Ltd., 2015-20A, “ARR”, FLR, 3.672% (LIBOR - 3mo. + 1.16%), 7/15/2034 (n) | | | 5,725,000 | 5,470,117 |
| Oaktree CLO 2019-1A Ltd., “BR”, FLR, 4.509% (LIBOR - 3mo. + 1.75%), 4/22/2030 (n) | | | 16,678,518 | 15,634,409 |
| PFP III 2021-7 Ltd., “AS”, FLR, 3.967% (LIBOR - 1mo. + 1.15%), 4/14/2038 (n) | | | 12,525,375 | 11,990,253 |
Portfolio of Investments – continued
| Issuer | | | Shares/Par | Value ($) |
| Bonds – continued |
| Asset-Backed & Securitized – continued |
| ReadyCap Commercial Mortgage Trust, 2021-FL5, “A”, FLR, 4.084% (LIBOR - 1mo. + 1%), 4/25/2038 (z) | | $ | 8,211,002 | $7,934,628 |
| ReadyCap Commercial Mortgage Trust, 2021-FL7, “B”, FLR, 4.884% (LIBOR - 1mo. + 1.8%), 11/25/2036 (z) | | | 3,695,000 | 3,506,132 |
| Residential Funding Mortgage Securities, Inc., 4.352%, 12/25/2035 | | | 140,906 | 140,292 |
| Santander Drive Auto Receivables Trust, 2022-6, “A2”, 4.37%, 5/15/2025 | | | 3,880,000 | 3,866,155 |
| Santander Retail Auto Lease Trust, 2020-A, “B”, 1.88%, 3/20/2024 (n) | | | 4,984,000 | 4,958,645 |
| Starwood Commercial Mortgage, 2022-FL3, “AS”, FLR, 4.085% (SOFR - 30 day + 1.8%), 11/15/2038 (n) | | | 17,154,000 | 16,416,920 |
| TPG Real Estate Finance, 2021-FL4, “A”, FLR, 4.139% (LIBOR - 1mo. + 1.2%), 3/15/2038 (n) | | | 16,676,500 | 16,311,968 |
| UBS Commercial Mortgage Trust, 2019-C16, “A4”, 3.605%, 4/15/2052 | | | 10,000,000 | 8,966,323 |
| UBS Commercial Mortgage Trust, 2019-C17, “A4”, 2.921%, 9/15/2052 | | | 7,465,644 | 6,318,922 |
| Verizon Owner Trust, 2020-A, “B”, 1.98%, 7/22/2024 | | | 7,967,000 | 7,846,153 |
| Voya CLO 2012-4A Ltd., “A2R3”, FLR, 3.962% (LIBOR - 3mo. + 1.45%), 10/15/2030 (n) | | | 6,439,259 | 6,031,416 |
| Wells Fargo Commercial Mortgage Trust, 2015-NXS1, “A5”, 3.148%, 5/15/2048 | | | 6,507,931 | 6,175,574 |
| | | | | $412,133,820 |
| Automotive – 0.5% |
| General Motors Co., 6.75%, 4/01/2046 | | $ | 2,545,000 | $2,317,246 |
| Hyundai Capital America, 2.65%, 2/10/2025 (n) | | | 2,611,000 | 2,433,019 |
| Hyundai Capital America, 3%, 2/10/2027 (n) | | | 4,584,000 | 4,070,738 |
| Lear Corp., 4.25%, 5/15/2029 | | | 2,163,000 | 1,906,650 |
| Magna International, Inc., 2.45%, 6/15/2030 | | | 6,114,000 | 4,950,963 |
| Stellantis N.V., 2.691%, 9/15/2031 (n) | | | 10,166,000 | 7,253,011 |
| Volkswagen Group of America Finance LLC, 3.35%, 5/13/2025 (n) | | | 12,232,000 | 11,602,324 |
| | | | | $34,533,951 |
| Broadcasting – 0.3% |
| Magallanes, Inc., 5.05%, 3/15/2042 (n) | | $ | 6,397,000 | $4,786,516 |
| Magallanes, Inc., 5.141%, 3/15/2052 (n) | | | 5,588,000 | 4,061,462 |
| Walt Disney Co., 3.5%, 5/13/2040 | | | 11,311,000 | 8,734,846 |
| | | | | $17,582,824 |
Portfolio of Investments – continued
| Issuer | | | Shares/Par | Value ($) |
| Bonds – continued |
| Brokerage & Asset Managers – 0.2% |
| Intercontinental Exchange, Inc., 2.1%, 6/15/2030 | | $ | 6,958,000 | $5,535,068 |
| Morgan Stanley Domestic Holdings, Inc., 4.5%, 6/20/2028 | | | 3,038,000 | 2,888,289 |
| Raymond James Financial, Inc., 4.95%, 7/15/2046 | | | 5,992,000 | 5,280,013 |
| | | | | $13,703,370 |
| Building – 0.2% |
| Martin Marietta Materials, Inc., 2.5%, 3/15/2030 | | $ | 622,000 | $499,597 |
| Masco Corp., 2%, 2/15/2031 | | | 12,460,000 | 9,332,188 |
| Vulcan Materials Co., 3.5%, 6/01/2030 | | | 1,246,000 | 1,065,779 |
| | | | | $10,897,564 |
| Business Services – 0.5% |
| Equinix, Inc., 2.625%, 11/18/2024 | | $ | 9,037,000 | $8,552,354 |
| Equinix, Inc., 1.8%, 7/15/2027 | | | 5,883,000 | 4,916,221 |
| Experian Finance PLC, 4.25%, 2/01/2029 (n) | | | 4,011,000 | 3,637,007 |
| Fiserv, Inc., 2.65%, 6/01/2030 | | | 2,445,000 | 1,982,289 |
| Global Payments, Inc., 1.2%, 3/01/2026 | | | 6,442,000 | 5,544,275 |
| Global Payments, Inc., 2.9%, 11/15/2031 | | | 8,226,000 | 6,289,353 |
| RELX Capital, Inc., 3%, 5/22/2030 | | | 2,015,000 | 1,699,993 |
| Verisk Analytics, Inc., 4.125%, 3/15/2029 | | | 5,997,000 | 5,470,524 |
| | | | | $38,092,016 |
| Cable TV – 0.4% |
| Charter Communications Operating LLC/Charter Communications Operating Capital Corp., 4.908%, 7/23/2025 | | $ | 4,865,000 | $4,744,149 |
| Charter Communications Operating LLC/Charter Communications Operating Capital Corp., 6.384%, 10/23/2035 | | | 3,413,000 | 3,129,936 |
| Charter Communications Operating LLC/Charter Communications Operating Capital Corp., 3.5%, 6/01/2041 | | | 6,803,000 | 4,347,377 |
| Charter Communications Operating LLC/Charter Communications Operating Capital Corp., 5.375%, 5/01/2047 | | | 1,390,000 | 1,075,209 |
| Charter Communications Operating LLC/Charter Communications Operating Capital Corp., 5.25%, 4/01/2053 | | | 5,724,000 | 4,383,184 |
| Cox Communications, Inc., 1.8%, 10/01/2030 (n) | | | 4,310,000 | 3,180,050 |
| Time Warner Entertainment Co. LP, 8.375%, 7/15/2033 | | | 6,553,000 | 6,990,464 |
| | | | | $27,850,369 |
| Chemicals – 0.1% |
| RPM International, Inc., 2.95%, 1/15/2032 | | $ | 4,666,000 | $3,591,066 |
| Sherwin-Williams Co., 2.3%, 5/15/2030 | | | 4,950,000 | 3,953,709 |
| | | | | $7,544,775 |
| Computer Software – 0.1% |
| Dell International LLC/EMC Corp., 4.9%, 10/01/2026 | | $ | 4,603,000 | $4,434,209 |
Portfolio of Investments – continued
| Issuer | | | Shares/Par | Value ($) |
| Bonds – continued |
| Conglomerates – 0.3% |
| Carrier Global Corp., 3.377%, 4/05/2040 | | $ | 10,528,000 | $7,611,294 |
| Roper Technologies, Inc., 4.2%, 9/15/2028 | | | 2,076,000 | 1,939,061 |
| Roper Technologies, Inc., 2.95%, 9/15/2029 | | | 1,310,000 | 1,102,825 |
| Roper Technologies, Inc., 2%, 6/30/2030 | | | 4,196,000 | 3,212,718 |
| Westinghouse Air Brake Technologies Corp., 4.4%, 3/15/2024 | | | 966,000 | 947,809 |
| Westinghouse Air Brake Technologies Corp., 3.2%, 6/15/2025 | | | 2,623,000 | 2,445,029 |
| Westinghouse Air Brake Technologies Corp., 4.95%, 9/15/2028 | | | 6,723,000 | 6,214,615 |
| | | | | $23,473,351 |
| Consumer Products – 0.1% |
| GSK Consumer Healthcare Capital US LLC, 3.375%, 3/24/2029 (n) | | $ | 6,157,000 | $5,366,116 |
| Consumer Services – 0.1% |
| Booking Holdings, Inc., 4.625%, 4/13/2030 | | $ | 4,593,000 | $4,316,661 |
| Electrical Equipment – 0.1% |
| Arrow Electronics, Inc., 2.95%, 2/15/2032 | | $ | 9,575,000 | $7,282,673 |
| Electronics – 0.3% |
| Broadcom, Inc., 4.15%, 11/15/2030 | | $ | 1,641,000 | $1,420,359 |
| Broadcom, Inc., 4.3%, 11/15/2032 | | | 4,290,000 | 3,602,033 |
| Broadcom, Inc., 3.469%, 4/15/2034 (n) | | | 3,891,000 | 2,919,238 |
| Broadcom, Inc., 3.187%, 11/15/2036 (n) | | | 7,412,000 | 5,069,409 |
| Broadcom, Inc., 4.926%, 5/15/2037 (n) | | | 2,223,000 | 1,833,022 |
| NXP B.V./NXP Funding LLC/NXP USA, Inc., 2.5%, 5/11/2031 | | | 7,167,000 | 5,386,049 |
| NXP B.V./NXP Funding LLC/NXP USA, Inc., 3.25%, 5/11/2041 | | | 6,143,000 | 4,028,953 |
| | | | | $24,259,063 |
| Energy - Independent – 0.0% |
| Diamondback Energy, Inc., 4.4%, 3/24/2051 | | $ | 1,158,000 | $872,307 |
| Energy - Integrated – 0.3% |
| BP Capital Markets America, Inc., 2.721%, 1/12/2032 | | $ | 13,688,000 | $11,120,100 |
| Eni S.p.A., 4.75%, 9/12/2028 (n) | | | 11,589,000 | 10,914,659 |
| | | | | $22,034,759 |
| Financial Institutions – 0.6% |
| AerCap Ireland Capital DAC/AerCap Global Aviation Trust, 4.875%, 1/16/2024 | | $ | 1,093,000 | $1,075,263 |
| AerCap Ireland Capital DAC/AerCap Global Aviation Trust, 2.45%, 10/29/2026 | | | 13,587,000 | 11,462,085 |
| AerCap Ireland Capital DAC/AerCap Global Aviation Trust, 3.65%, 7/21/2027 | | | 7,729,000 | 6,749,547 |
| Air Lease Corp., 2.2%, 1/15/2027 | | | 4,561,000 | 3,861,707 |
| Air Lease Corp., 2.875%, 1/15/2032 | | | 5,987,000 | 4,512,438 |
Portfolio of Investments – continued
| Issuer | | | Shares/Par | Value ($) |
| Bonds – continued |
| Financial Institutions – continued |
| Avolon Holdings Funding Ltd., 4.375%, 5/01/2026 (n) | | $ | 2,248,000 | $2,010,937 |
| Avolon Holdings Funding Ltd., 3.25%, 2/15/2027 (n) | | | 7,097,000 | 5,943,342 |
| Avolon Holdings Funding Ltd., 2.528%, 11/18/2027 (n) | | | 5,867,000 | 4,589,580 |
| Park Aerospace Holdings Ltd., 5.5%, 2/15/2024 (n) | | | 2,057,000 | 2,013,597 |
| | | | | $42,218,496 |
| Food & Beverages – 0.4% |
| Anheuser-Busch InBev S.A., 8%, 11/15/2039 | | $ | 9,558,000 | $11,369,787 |
| Anheuser-Busch InBev Worldwide, Inc., 4.375%, 4/15/2038 | | | 2,398,000 | 2,047,534 |
| Constellation Brands, Inc., 3.5%, 5/09/2027 | | | 5,197,000 | 4,802,585 |
| Diageo Capital PLC, 2.375%, 10/24/2029 | | | 8,369,000 | 6,999,035 |
| Keurig Dr Pepper, Inc., 3.2%, 5/01/2030 | | | 986,000 | 838,895 |
| | | | | $26,057,836 |
| Gaming & Lodging – 0.3% |
| GLP Capital LP/GLP Financing II, Inc., 5.3%, 1/15/2029 | | $ | 5,014,000 | $4,570,044 |
| Las Vegas Sands Corp., 3.9%, 8/08/2029 | | | 2,476,000 | 2,047,102 |
| Marriott International, Inc., 4%, 4/15/2028 | | | 5,286,000 | 4,786,452 |
| Marriott International, Inc., 4.625%, 6/15/2030 | | | 6,716,000 | 6,069,117 |
| Marriott International, Inc., 2.85%, 4/15/2031 | | | 23,000 | 18,059 |
| Marriott International, Inc., 2.75%, 10/15/2033 | | | 5,250,000 | 3,810,951 |
| | | | | $21,301,725 |
| Insurance – 0.4% |
| AIA Group Ltd., 3.375%, 4/07/2030 (n) | | $ | 7,948,000 | $7,058,458 |
| Corebridge Financial, Inc., 3.9%, 4/05/2032 (n) | | | 11,118,000 | 9,384,360 |
| Metropolitan Life Global Funding I, 3.3%, 3/21/2029 (n) | | | 15,225,000 | 13,440,102 |
| | | | | $29,882,920 |
| Insurance - Health – 0.1% |
| Humana, Inc., 3.7%, 3/23/2029 | | $ | 6,169,000 | $5,532,059 |
| Insurance - Property & Casualty – 0.4% |
| Aon Corp., 3.75%, 5/02/2029 | | $ | 13,224,000 | $11,894,506 |
| Aon Corp./Aon Global Holdings PLC, 2.6%, 12/02/2031 | | | 1,057,000 | 826,441 |
| Brown & Brown, Inc., 4.2%, 3/17/2032 | | | 7,012,000 | 5,994,717 |
| Fairfax Financial Holdings Ltd., 5.625%, 8/16/2032 (n) | | | 10,369,000 | 9,560,524 |
| Liberty Mutual Group, Inc., 3.951%, 10/15/2050 (n) | | | 3,061,000 | 2,059,502 |
| | | | | $30,335,690 |
| International Market Quasi-Sovereign – 0.1% |
| Temasek Financial I Ltd. (Republic of Singapore), 2.375%, 1/23/2023 (n) | | $ | 10,140,000 | $10,079,363 |
Portfolio of Investments – continued
| Issuer | | | Shares/Par | Value ($) |
| Bonds – continued |
| Machinery & Tools – 0.2% |
| Ashtead Capital, Inc., 5.5%, 8/11/2032 (n) | | $ | 10,029,000 | $9,308,064 |
| CNH Industrial Capital LLC, 4.2%, 1/15/2024 | | | 5,288,000 | 5,208,570 |
| CNH Industrial Capital LLC, 1.875%, 1/15/2026 | | | 1,459,000 | 1,299,121 |
| | | | | $15,815,755 |
| Major Banks – 2.7% |
| Bank of America Corp., 3.004%, 12/20/2023 | | $ | 1,671,000 | $1,662,128 |
| Bank of America Corp., 3.366% to 1/23/2025, FLR (LIBOR - 3mo. + 0.81%) to 1/23/2026 | | | 4,937,000 | 4,677,759 |
| Bank of America Corp., 3.5%, 4/19/2026 | | | 8,221,000 | 7,722,860 |
| Bank of America Corp., 2.572% to 10/20/2031, FLR (SOFR + 1.21%) to 10/20/2032 | | | 11,722,000 | 8,965,317 |
| Barclays PLC, 2.894% to 11/24/2031, FLR (CMT - 1yr. + 1.3%) to 11/24/2032 | | | 3,616,000 | 2,614,226 |
| Capital One Financial Corp., 3.75%, 3/09/2027 | | | 5,440,000 | 5,008,064 |
| Capital One Financial Corp., 3.273% to 3/01/2029, FLR (SOFR - 1 day + 1.79%) to 3/01/2030 | | | 12,356,000 | 10,331,250 |
| Credit Suisse Group AG, 3.091% to 5/14/2031, FLR (SOFR - 1 day + 1.73%) to 5/14/2032 (n) | | | 3,997,000 | 2,806,045 |
| Deutsche Bank AG, 2.311% to 11/16/2026, FLR (SOFR - 1 day + 1.219%) to 11/16/2027 | | | 2,877,000 | 2,333,717 |
| Goldman Sachs Group, Inc., 2.6%, 2/07/2030 | | | 10,872,000 | 8,766,921 |
| Goldman Sachs Group, Inc., 2.383% to 7/21/2031, FLR (SOFR - 1 day + 1.248%) to 7/21/2032 | | | 9,008,000 | 6,791,904 |
| HSBC Holdings PLC, 4.7% to 9/09/2031, FLR (CMT - 1yr. + 3.25%) to 9/09/2169 | | | 3,072,000 | 2,181,632 |
| HSBC Holdings PLC, 4% to 9/09/2026, FLR (CMT - 1yr. + 3.222%) to 9/09/2170 | | | 1,215,000 | 972,000 |
| JPMorgan Chase & Co., 3.782% to 2/01/2027, FLR (LIBOR - 3mo. + 1.337%) to 2/01/2028 | | | 12,711,000 | 11,653,875 |
| JPMorgan Chase & Co., 2.739% to 10/15/2029, FLR (SOFR - 1 day + 1.51%) to 10/15/2030 | | | 2,910,000 | 2,366,092 |
| JPMorgan Chase & Co., 2.956% to 5/13/2030, FLR (SOFR - 1 day + 2.515%) to 5/13/2031 | | | 1,546,000 | 1,224,581 |
| JPMorgan Chase & Co., 2.545% to 11/08/2031, FLR (SOFR - 1 day + 1.18%) to 11/08/2032 | | | 15,046,000 | 11,417,133 |
| JPMorgan Chase & Co., 2.963% to 1/25/2032, FLR (SOFR - 1 day + 1.26%) to 1/25/2033 | | | 5,837,000 | 4,588,376 |
| JPMorgan Chase & Co., 3.109% to 4/22/2040, FLR (SOFR - 1 day + 2.46%) to 4/22/2041 | | | 7,872,000 | 5,453,631 |
| JPMorgan Chase & Co., 3.897% to 1/23/2048, FLR (LIBOR - 3mo. + 1.22%) to 1/23/2049 | | | 2,847,000 | 2,108,156 |
Portfolio of Investments – continued
| Issuer | | | Shares/Par | Value ($) |
| Bonds – continued |
| Major Banks – continued |
| Mitsubishi UFJ Financial Group, Inc., 2.852% to 1/19/2032, FLR (CMT - 1yr. + 1.1%) to 1/19/2033 | | $ | 9,207,000 | $7,134,527 |
| Morgan Stanley, 3.875%, 4/29/2024 | | | 2,290,000 | 2,248,120 |
| Morgan Stanley, 4%, 7/23/2025 | | | 2,685,000 | 2,598,799 |
| Morgan Stanley, 2.699% to 1/22/2030, FLR (SOFR - 1 day + 1.143%) to 1/22/2031 | | | 19,340,000 | 15,680,301 |
| Morgan Stanley, 2.943% to 1/21/2032, FLR (SOFR - 1 day + 1.29%) to 1/21/2033 | | | 10,273,000 | 8,121,456 |
| Royal Bank of Canada, 1.15%, 6/10/2025 | | | 8,937,000 | 8,064,574 |
| State Street Corp., 2.901% to 3/30/2025, FLR (SOFR + 2.6%) to 3/30/2026 | | | 1,121,000 | 1,058,120 |
| Sumitomo Mitsui Financial Group, Inc., 2.472%, 1/14/2029 | | | 17,106,000 | 14,033,430 |
| UBS Group AG, 2.095% to 2/11/2031, FLR (CMT - 1yr. + 1.0%) to 2/11/2032 (n) | | | 20,862,000 | 15,161,822 |
| Wells Fargo & Co., 3.35% to 3/02/2032, FLR (SOFR - 1 day + 1.5%) to 3/02/2033 | | | 17,236,000 | 13,977,846 |
| | | | | $191,724,662 |
| Medical & Health Technology & Services – 0.4% |
| Alcon, Inc., 2.6%, 5/27/2030 (n) | | $ | 944,000 | $761,584 |
| Becton, Dickinson and Co., 4.669%, 6/06/2047 | | | 5,389,000 | 4,626,679 |
| Cigna Corp., 3.2%, 3/15/2040 | | | 1,517,000 | 1,090,553 |
| HCA Healthcare, Inc., 4.375%, 3/15/2042 (n) | | | 4,148,000 | 3,100,028 |
| HCA, Inc., 4.125%, 6/15/2029 | | | 5,801,000 | 5,087,418 |
| HCA, Inc., 5.125%, 6/15/2039 | | | 5,707,000 | 4,789,159 |
| Laboratory Corp. of America Holdings, 4.7%, 2/01/2045 | | | 3,373,000 | 2,788,050 |
| Northwell Healthcare, Inc., 3.979%, 11/01/2046 | | | 490,000 | 381,876 |
| Northwell Healthcare, Inc., 4.26%, 11/01/2047 | | | 3,797,000 | 3,039,088 |
| | | | | $25,664,435 |
| Medical Equipment – 0.1% |
| Boston Scientific Corp., 2.65%, 6/01/2030 | | $ | 5,104,000 | $4,234,980 |
| Metals & Mining – 0.4% |
| Anglo American Capital PLC, 3.875%, 3/16/2029 (n) | | $ | 1,639,000 | $1,408,417 |
| Anglo American Capital PLC, 5.625%, 4/01/2030 (n) | | | 4,259,000 | 4,029,422 |
| Anglo American Capital PLC, 2.625%, 9/10/2030 (n) | | | 14,840,000 | 11,422,890 |
| Glencore Funding LLC, 4.125%, 5/30/2023 (n) | | | 3,717,000 | 3,693,434 |
| Glencore Funding LLC, 2.5%, 9/01/2030 (n) | | | 5,444,000 | 4,163,176 |
| Glencore Funding LLC, 2.85%, 4/27/2031 (n) | | | 2,292,000 | 1,773,311 |
| | | | | $26,490,650 |
Portfolio of Investments – continued
| Issuer | | | Shares/Par | Value ($) |
| Bonds – continued |
| Midstream – 0.4% |
| Cheniere Corpus Christi Holdings LLC, 3.7%, 11/15/2029 | | $ | 5,846,000 | $5,069,741 |
| Enbridge, Inc., 2.5%, 1/15/2025 | | | 3,055,000 | 2,868,285 |
| Kinder Morgan Energy Partners LP, 4.15%, 2/01/2024 | | | 4,439,000 | 4,378,520 |
| ONEOK, Inc., 4.95%, 7/13/2047 | | | 7,267,000 | 5,592,264 |
| Plains All American Pipeline LP, 3.8%, 9/15/2030 | | | 6,093,000 | 5,109,054 |
| Sabine Pass Liquefaction LLC, 4.5%, 5/15/2030 | | | 1,665,000 | 1,516,764 |
| Spectra Energy Partners LP, 3.375%, 10/15/2026 | | | 2,677,000 | 2,469,567 |
| Targa Resources Corp., 4.2%, 2/01/2033 | | | 2,470,000 | 2,057,012 |
| | | | | $29,061,207 |
| Mortgage-Backed – 11.7% | |
| Fannie Mae, 2.73%, 4/01/2023 | | $ | 568,484 | $567,023 |
| Fannie Mae, 2.41%, 5/01/2023 | | | 862,482 | 858,937 |
| Fannie Mae, 2.62%, 5/01/2023 | | | 565,566 | 563,444 |
| Fannie Mae, 5.25%, 8/01/2024 | | | 872,692 | 876,637 |
| Fannie Mae, 5%, 3/25/2025 - 3/01/2042 | | | 4,608,793 | 4,636,972 |
| Fannie Mae, 4.54%, 7/01/2026 | | | 888,903 | 887,962 |
| Fannie Mae, 3.95%, 1/01/2027 | | | 857,419 | 839,657 |
| Fannie Mae, 3%, 11/01/2028 - 9/01/2046 | | | 8,064,710 | 7,518,511 |
| Fannie Mae, 6.5%, 6/01/2031 - 7/01/2037 | | | 1,470,573 | 1,521,241 |
| Fannie Mae, 2.5%, 11/01/2031 | | | 177,449 | 164,261 |
| Fannie Mae, 5.5%, 2/01/2033 - 4/01/2040 | | | 6,830,713 | 6,938,626 |
| Fannie Mae, 3%, 2/25/2033 (i) | | | 863,764 | 80,737 |
| Fannie Mae, 4.5%, 8/01/2033 - 6/01/2044 | | | 11,831,382 | 11,570,438 |
| Fannie Mae, 6%, 1/01/2034 - 7/01/2037 | | | 3,938,017 | 4,052,232 |
| Fannie Mae, 3.5%, 4/01/2038 - 7/01/2046 | | | 31,781,703 | 29,214,228 |
| Fannie Mae, 3.25%, 5/25/2040 | | | 268,930 | 250,978 |
| Fannie Mae, 4%, 9/01/2040 - 6/01/2047 | | | 26,189,823 | 24,952,163 |
| Fannie Mae, 2%, 10/25/2040 - 4/25/2046 | | | 773,117 | 717,479 |
| Fannie Mae, 4%, 7/25/2046 (i) | | | 856,346 | 163,772 |
| Fannie Mae, UMBS, 2%, 4/01/2037 - 9/01/2052 | | | 95,877,070 | 80,155,242 |
| Fannie Mae, UMBS, 2.5%, 8/01/2037 - 7/01/2052 | | | 131,913,259 | 111,503,411 |
| Fannie Mae, UMBS, 1.5%, 2/01/2042 | | | 482,730 | 384,466 |
| Fannie Mae, UMBS, 3%, 6/01/2051 - 6/01/2052 | | | 17,385,199 | 15,245,068 |
| Fannie Mae, UMBS, 3.5%, 5/01/2052 | | | 2,168,040 | 1,953,667 |
| Fannie Mae, UMBS, 4.5%, 9/01/2052 | | | 3,175,004 | 3,033,212 |
| Fannie Mae, UMBS, 5%, 9/01/2052 | | | 6,999,307 | 6,825,656 |
| Freddie Mac, 2.51%, 11/25/2022 | | | 2,926,886 | 2,920,397 |
| Freddie Mac, 3.111%, 2/25/2023 | | | 4,512,634 | 4,497,571 |
| Freddie Mac, 3.32%, 2/25/2023 | | | 1,883,552 | 1,876,688 |
| Freddie Mac, 3.25%, 4/25/2023 - 11/25/2061 | | | 7,728,445 | 7,502,090 |
| Freddie Mac, 3.06%, 7/25/2023 | | | 1,116,000 | 1,104,346 |
| Freddie Mac, 3.458%, 8/25/2023 | | | 2,556,682 | 2,534,617 |
Portfolio of Investments – continued
| Issuer | | | Shares/Par | Value ($) |
| Bonds – continued |
| Mortgage-Backed – continued | |
| Freddie Mac, 1.043%, 4/25/2024 (i) | | $ | 7,498,244 | $85,371 |
| Freddie Mac, 0.623%, 7/25/2024 (i) | | | 40,823,000 | 367,881 |
| Freddie Mac, 0.714%, 7/25/2024 (i) | | | 12,365,593 | 92,804 |
| Freddie Mac, 4.5%, 8/01/2024 - 5/01/2042 | | | 1,883,683 | 1,847,550 |
| Freddie Mac, 0.433%, 8/25/2024 (i) | | | 44,106,000 | 358,361 |
| Freddie Mac, 0.503%, 8/25/2024 (i) | | | 72,499,526 | 512,854 |
| Freddie Mac, 3.064%, 8/25/2024 | | | 2,246,364 | 2,189,012 |
| Freddie Mac, 0.469%, 10/25/2024 (i) | | | 53,299,381 | 282,940 |
| Freddie Mac, 3.171%, 10/25/2024 | | | 3,005,000 | 2,920,810 |
| Freddie Mac, 0.399%, 11/25/2024 (i) | | | 44,690,000 | 244,159 |
| Freddie Mac, 2.67%, 12/25/2024 | | | 3,687,000 | 3,540,901 |
| Freddie Mac, 3.329%, 5/25/2025 | | | 4,623,000 | 4,474,309 |
| Freddie Mac, 3.01%, 7/25/2025 | | | 1,275,000 | 1,221,833 |
| Freddie Mac, 3.5%, 12/01/2025 - 10/25/2058 | | | 15,140,086 | 13,988,167 |
| Freddie Mac, 0.775%, 6/25/2027 (i) | | | 39,273,000 | 1,083,248 |
| Freddie Mac, 0.887%, 6/25/2027 (i) | | | 12,560,773 | 356,247 |
| Freddie Mac, 0.709%, 7/25/2027 (i) | | | 33,594,234 | 766,046 |
| Freddie Mac, 0.459%, 8/25/2027 (i) | | | 27,934,000 | 432,424 |
| Freddie Mac, 0.557%, 8/25/2027 (i) | | | 17,669,713 | 310,667 |
| Freddie Mac, 0.406%, 9/25/2027 (i) | | | 30,183,000 | 410,887 |
| Freddie Mac, 0.324%, 11/25/2027 (i) | | | 47,333,000 | 479,114 |
| Freddie Mac, 0.416%, 11/25/2027 (i) | | | 33,613,029 | 413,750 |
| Freddie Mac, 0.458%, 11/25/2027 (i) | | | 29,876,106 | 429,598 |
| Freddie Mac, 0.375%, 12/25/2027 (i) | | | 29,308,000 | 364,785 |
| Freddie Mac, 0.415%, 12/25/2027 (i) | | | 32,765,000 | 478,926 |
| Freddie Mac, 0.493%, 12/25/2027 (i) | | | 51,385,874 | 828,757 |
| Freddie Mac, 1.218%, 7/25/2029 (i) | | | 855,592 | 50,509 |
| Freddie Mac, 1.268%, 8/25/2029 (i) | | | 13,362,762 | 824,656 |
| Freddie Mac, 1.916%, 4/25/2030 (i) | | | 2,500,000 | 270,349 |
| Freddie Mac, 1.985%, 4/25/2030 (i) | | | 7,819,828 | 878,138 |
| Freddie Mac, 1.766%, 5/25/2030 (i) | | | 4,048,749 | 411,702 |
| Freddie Mac, 1.905%, 5/25/2030 (i) | | | 8,995,049 | 984,039 |
| Freddie Mac, 1.436%, 6/25/2030 (i) | | | 3,687,431 | 308,900 |
| Freddie Mac, 1.703%, 8/25/2030 (i) | | | 3,331,192 | 332,879 |
| Freddie Mac, 1.262%, 9/25/2030 (i) | | | 2,196,896 | 164,290 |
| Freddie Mac, 1.172%, 11/25/2030 (i) | | | 4,320,889 | 303,666 |
| Freddie Mac, 0.421%, 1/25/2031 (i) | | | 17,107,966 | 354,848 |
| Freddie Mac, 0.873%, 1/25/2031 (i) | | | 6,541,106 | 340,973 |
| Freddie Mac, 1.026%, 1/25/2031 (i) | | | 4,767,487 | 294,896 |
| Freddie Mac, 0.612%, 3/25/2031 (i) | | | 13,860,277 | 462,756 |
| Freddie Mac, 0.828%, 3/25/2031 (i) | | | 5,934,811 | 297,037 |
| Freddie Mac, 1.333%, 5/25/2031 (i) | | | 2,518,959 | 207,890 |
| Freddie Mac, 1.039%, 7/25/2031 (i) | | | 4,010,843 | 263,894 |
Portfolio of Investments – continued
| Issuer | | | Shares/Par | Value ($) |
| Bonds – continued |
| Mortgage-Backed – continued | |
| Freddie Mac, 0.607%, 8/25/2031 (i) | | $ | 5,126,459 | $180,739 |
| Freddie Mac, 0.632%, 9/25/2031 (i) | | | 16,898,337 | 613,038 |
| Freddie Mac, 0.955%, 9/25/2031 (i) | | | 5,075,984 | 306,034 |
| Freddie Mac, 0.441%, 11/25/2031 (i) | | | 25,136,487 | 661,761 |
| Freddie Mac, 0.597%, 12/25/2031 (i) | | | 23,600,379 | 857,928 |
| Freddie Mac, 0.664%, 12/25/2031 (i) | | | 40,016,231 | 1,632,006 |
| Freddie Mac, 0.436%, 11/25/2032 (i) | | | 24,735,523 | 532,375 |
| Freddie Mac, 3%, 2/15/2033 (i) | | | 1,076,779 | 71,145 |
| Freddie Mac, 6%, 3/01/2033 - 6/01/2037 | | | 1,572,104 | 1,637,398 |
| Freddie Mac, 5%, 9/01/2033 - 7/01/2041 | | | 2,417,673 | 2,433,431 |
| Freddie Mac, 5.5%, 12/01/2033 - 10/01/2035 | | | 1,464,367 | 1,494,263 |
| Freddie Mac, 6.5%, 5/01/2034 - 7/01/2037 | | | 592,446 | 612,918 |
| Freddie Mac, 5.5%, 2/15/2036 (i) | | | 162,035 | 27,226 |
| Freddie Mac, 4%, 8/01/2037 - 4/01/2044 | | | 5,563,504 | 5,301,140 |
| Freddie Mac, 3%, 1/01/2038 - 2/25/2059 | | | 24,520,086 | 21,985,224 |
| Freddie Mac, 4.5%, 12/15/2040 (i) | | | 128,299 | 11,724 |
| Freddie Mac, 4%, 8/15/2044 (i) | | | 177,397 | 22,284 |
| Freddie Mac, UMBS, 5%, 7/01/2035 - 8/01/2052 | | | 794,996 | 784,688 |
| Freddie Mac, UMBS, 6%, 1/01/2036 - 3/01/2036 | | | 113,274 | 115,363 |
| Freddie Mac, UMBS, 2%, 7/01/2037 - 8/01/2052 | | | 110,520,561 | 90,965,236 |
| Freddie Mac, UMBS, 3.5%, 12/01/2046 - 9/01/2052 | | | 13,202,547 | 11,945,990 |
| Freddie Mac, UMBS, 4%, 8/01/2047 - 5/01/2052 | | | 11,200,976 | 10,508,036 |
| Freddie Mac, UMBS, 3%, 10/01/2047 - 4/01/2052 | | | 9,646,759 | 8,438,456 |
| Freddie Mac, UMBS, 2.5%, 4/01/2048 - 6/01/2052 | | | 44,341,193 | 37,341,586 |
| Freddie Mac, UMBS, 4.5%, 8/01/2052 - 10/01/2052 | | | 14,725,005 | 14,067,405 |
| Ginnie Mae, 6%, 9/15/2032 - 1/15/2038 | | | 1,462,146 | 1,548,710 |
| Ginnie Mae, 5.5%, 12/15/2032 - 4/20/2035 | | | 1,153,569 | 1,207,617 |
| Ginnie Mae, 4.5%, 7/15/2033 - 9/20/2052 | | | 22,240,540 | 21,396,825 |
| Ginnie Mae, 5%, 7/20/2033 - 8/20/2052 | | | 4,628,306 | 4,549,285 |
| Ginnie Mae, 4%, 1/20/2041 - 9/20/2052 | | | 5,404,590 | 5,121,854 |
| Ginnie Mae, 3.5%, 12/15/2041 - 3/20/2048 | | | 8,175,463 | 7,566,339 |
| Ginnie Mae, 3%, 4/20/2045 - 6/20/2052 | | | 28,241,805 | 25,196,882 |
| Ginnie Mae, 2.5%, 8/20/2051 - 6/20/2052 | | | 37,228,028 | 32,099,168 |
| Ginnie Mae, 2%, 1/20/2052 | | | 10,405,664 | 8,699,268 |
| Ginnie Mae, 0.585%, 2/16/2059 (i) | | | 7,015,671 | 254,383 |
| Ginnie Mae, TBA, 3%, 10/20/2052 | | | 8,625,000 | 7,621,333 |
| Ginnie Mae, TBA, 3.5%, 10/20/2052 - 11/21/2052 | | | 20,219,718 | 18,382,560 |
| Ginnie Mae, TBA, 4%, 10/20/2052 | | | 11,475,000 | 10,715,229 |
| Ginnie Mae, TBA, 4.5%, 10/20/2052 | | | 12,000,000 | 11,485,781 |
| Ginnie Mae, TBA, 5%, 10/20/2052 | | | 13,225,000 | 12,943,003 |
| UMBS, TBA, 2.5%, 10/18/2037 - 10/13/2052 | | | 14,782,500 | 12,815,045 |
| UMBS, TBA, 3%, 10/18/2037 - 10/13/2052 | | | 29,825,000 | 26,219,319 |
| UMBS, TBA, 2%, 10/13/2052 | | | 14,550,000 | 11,777,543 |
Portfolio of Investments – continued
| Issuer | | | Shares/Par | Value ($) |
| Bonds – continued |
| Mortgage-Backed – continued | |
| UMBS, TBA, 5.5%, 10/13/2052 - 11/25/2052 | | $ | 11,575,000 | $11,487,402 |
| UMBS, TBA, 6%, 10/13/2052 | | | 2,075,000 | 2,107,989 |
| UMBS, TBA, 4%, 11/25/2052 | | | 6,075,000 | 5,631,240 |
| | | | | $832,518,721 |
| Municipals – 0.3% |
| New Jersey Economic Development Authority State Pension Funding Rev., Taxable, “A”, NPFG, 7.425%, 2/15/2029 | | $ | 8,500,000 | $9,098,777 |
| New Jersey Turnpike Authority Rev., Taxable (Build America Bonds), “F”, 7.414%, 1/01/2040 | | | 5,815,000 | 7,114,266 |
| State of Florida, Taxable, “A”, 2.154%, 7/01/2030 | | | 4,514,000 | 3,624,064 |
| | | | | $19,837,107 |
| Natural Gas - Distribution – 0.1% |
| NiSource, Inc., 2.95%, 9/01/2029 | | $ | 3,979,000 | $3,358,409 |
| NiSource, Inc., 5.65%, 2/01/2045 | | | 1,946,000 | 1,801,316 |
| | | | | $5,159,725 |
| Natural Gas - Pipeline – 0.1% |
| APT Pipelines Ltd., 4.2%, 3/23/2025 (n) | | $ | 8,334,000 | $7,980,342 |
| APT Pipelines Ltd., 4.25%, 7/15/2027 (n) | | | 777,000 | 719,602 |
| | | | | $8,699,944 |
| Network & Telecom – 0.3% |
| AT&T, Inc., 2.75%, 6/01/2031 | | $ | 6,826,000 | $5,464,006 |
| AT&T, Inc., 3.65%, 9/15/2059 | | | 5,210,000 | 3,375,562 |
| Verizon Communications, Inc., 3.15%, 3/22/2030 | | | 3,413,000 | 2,903,050 |
| Verizon Communications, Inc., 2.55%, 3/21/2031 | | | 4,203,000 | 3,355,793 |
| Verizon Communications, Inc., 4.272%, 1/15/2036 | | | 4,812,000 | 4,105,813 |
| Verizon Communications, Inc., 4.812%, 3/15/2039 | | | 6,030,000 | 5,307,459 |
| | | | | $24,511,683 |
| Oils – 0.2% |
| Marathon Petroleum Corp., 4.75%, 9/15/2044 | | $ | 2,845,000 | $2,282,185 |
| Phillips 66 Co., 2.15%, 12/15/2030 | | | 9,976,000 | 7,686,132 |
| Valero Energy Corp., 6.625%, 6/15/2037 | | | 6,797,000 | 6,764,978 |
| | | | | $16,733,295 |
| Other Banks & Diversified Financials – 0.2% |
| Macquarie Group Ltd., 4.442% to 6/21/2032, FLR (SOFR - 1 day + 2.405%) to 6/21/2033 (n) | | $ | 19,423,000 | $16,552,417 |
| Pollution Control – 0.0% |
| Republic Services, Inc., 1.45%, 2/15/2031 | | $ | 2,765,000 | $2,064,390 |
Portfolio of Investments – continued
| Issuer | | | Shares/Par | Value ($) |
| Bonds – continued |
| Real Estate - Office – 0.0% |
| Boston Properties Ltd. LP, REIT, 2.55%, 4/01/2032 | | $ | 4,222,000 | $3,112,983 |
| Real Estate - Retail – 0.1% |
| Brixmor Operating Partnership LP, REIT, 4.125%, 5/15/2029 | | $ | 567,000 | $492,823 |
| Brixmor Operating Partnership LP, REIT, 4.05%, 7/01/2030 | | | 5,371,000 | 4,524,765 |
| Realty Income Corp., REIT, 3.25%, 1/15/2031 | | | 1,594,000 | 1,360,213 |
| | | | | $6,377,801 |
| Retailers – 0.1% |
| Alimentation Couche-Tard, Inc., 3.439%, 5/13/2041 (n) | | $ | 6,827,000 | $4,650,272 |
| Best Buy Co., Inc., 4.45%, 10/01/2028 | | | 5,549,000 | 5,185,294 |
| | | | | $9,835,566 |
| Specialty Stores – 0.1% |
| Genuine Parts Co., 2.75%, 2/01/2032 | | $ | 9,067,000 | $7,017,419 |
| Telecommunications - Wireless – 0.6% |
| American Tower Corp., REIT, 3%, 6/15/2023 | | $ | 2,324,000 | $2,294,113 |
| American Tower Corp., REIT, 3.6%, 1/15/2028 | | | 2,895,000 | 2,568,780 |
| American Tower Trust I, REIT, 3.07%, 3/15/2048 (n) | | | 5,228,000 | 5,191,718 |
| Crown Castle, Inc., REIT, 1.35%, 7/15/2025 | | | 2,267,000 | 2,034,395 |
| Crown Castle, Inc., REIT, 3.65%, 9/01/2027 | | | 7,941,000 | 7,188,632 |
| Rogers Communications, Inc., 3.8%, 3/15/2032 (n) | | | 17,162,000 | 14,842,579 |
| T-Mobile USA, Inc., 2.05%, 2/15/2028 | | | 6,192,000 | 5,138,146 |
| T-Mobile USA, Inc., 4.5%, 4/15/2050 | | | 7,223,000 | 5,782,402 |
| | | | | $45,040,765 |
| Tobacco – 0.2% |
| B.A.T. International Finance PLC, 4.448%, 3/16/2028 | | $ | 13,867,000 | $12,359,069 |
| Transportation - Services – 0.1% |
| ERAC USA Finance LLC, 7%, 10/15/2037 (n) | | $ | 5,241,000 | $5,471,285 |
| U.S. Government Agencies and Equivalents – 0.0% |
| Small Business Administration, 4.35%, 7/01/2023 | | $ | 14,474 | $14,405 |
| Small Business Administration, 4.77%, 4/01/2024 | | | 56,847 | 56,231 |
| Small Business Administration, 5.18%, 5/01/2024 | | | 104,336 | 103,684 |
| Small Business Administration, 5.52%, 6/01/2024 | | | 46,179 | 46,282 |
| Small Business Administration, 4.99%, 9/01/2024 | | | 99,499 | 97,691 |
| Small Business Administration, 4.95%, 3/01/2025 | | | 106,674 | 107,148 |
| | | | | $425,441 |
| U.S. Treasury Obligations – 10.7% |
| U.S. Treasury Bonds, 3.5%, 2/15/2039 | | $ | 5,140,000 | $4,893,641 |
| U.S. Treasury Bonds, 1.375%, 11/15/2040 | | | 15,000,000 | 9,696,680 |
| U.S. Treasury Bonds, 1.75%, 8/15/2041 | | | 28,989,000 | 19,820,096 |
Portfolio of Investments – continued
| Issuer | | | Shares/Par | Value ($) |
| Bonds – continued |
| U.S. Treasury Obligations – continued |
| U.S. Treasury Bonds, 2.375%, 2/15/2042 | | $ | 9,700,000 | $7,432,625 |
| U.S. Treasury Bonds, 2.875%, 5/15/2043 | | | 55,466,000 | 45,713,951 |
| U.S. Treasury Bonds, 2.5%, 2/15/2045 | | | 5,313,000 | 4,050,540 |
| U.S. Treasury Bonds, 3%, 11/15/2045 | | | 215,000 | 179,424 |
| U.S. Treasury Bonds, 2.875%, 11/15/2046 | | | 14,148,000 | 11,553,832 |
| U.S. Treasury Bonds, 3%, 2/15/2048 | | | 22,502,000 | 18,943,871 |
| U.S. Treasury Bonds, 2.375%, 11/15/2049 | | | 151,800,000 | 114,312,516 |
| U.S. Treasury Bonds, 1.875%, 11/15/2051 | | | 9,015,000 | 5,961,521 |
| U.S. Treasury Bonds, 2.25%, 2/15/2052 | | | 25,958,400 | 18,860,400 |
| U.S. Treasury Notes, 0.5%, 11/30/2023 | | | 36,000,000 | 34,454,531 |
| U.S. Treasury Notes, 2.25%, 3/31/2024 | | | 18,511,700 | 17,956,349 |
| U.S. Treasury Notes, 1.375%, 1/31/2025 (f) | | | 231,500,000 | 216,832,304 |
| U.S. Treasury Notes, 0.375%, 11/30/2025 | | | 193,700,000 | 171,734,722 |
| U.S. Treasury Notes, 2.5%, 3/31/2027 | | | 50,000,000 | 46,707,031 |
| U.S. Treasury Notes, 2.75%, 4/30/2027 | | | 15,067,600 | 14,219,459 |
| | | | | $763,323,493 |
| Utilities - Electric Power – 0.8% |
| American Transmission Systems, Inc., 2.65%, 1/15/2032 (n) | | $ | 1,738,000 | $1,364,380 |
| Duke Energy Corp., 2.65%, 9/01/2026 | | | 1,236,000 | 1,121,330 |
| Duke Energy Corp., 4.5%, 8/15/2032 | | | 10,428,000 | 9,430,262 |
| Duke Energy Progress LLC, 3.45%, 3/15/2029 | | | 5,584,000 | 5,062,994 |
| Enel Finance International N.V., 2.65%, 9/10/2024 | | | 2,783,000 | 2,633,981 |
| Enel Finance International N.V., 4.75%, 5/25/2047 (n) | | | 2,194,000 | 1,606,049 |
| Evergy, Inc., 2.9%, 9/15/2029 | | | 5,207,000 | 4,301,700 |
| Exelon Corp., 4.05%, 4/15/2030 | | | 5,246,000 | 4,754,745 |
| FirstEnergy Corp., 3.4%, 3/01/2050 | | | 3,479,000 | 2,278,745 |
| Georgia Power Co., 3.7%, 1/30/2050 | | | 482,000 | 349,372 |
| Jersey Central Power & Light Co., 4.3%, 1/15/2026 (n) | | | 4,141,000 | 3,975,081 |
| Jersey Central Power & Light Co., 2.75%, 3/01/2032 (n) | | | 2,958,000 | 2,346,932 |
| Oncor Electric Delivery Co. LLC, 5.75%, 3/15/2029 | | | 3,548,000 | 3,647,798 |
| Pacific Gas & Electric Co., 2.1%, 8/01/2027 | | | 1,561,000 | 1,261,863 |
| Pacific Gas & Electric Co., 3%, 6/15/2028 | | | 4,502,000 | 3,709,405 |
| Pacific Gas & Electric Co., 2.5%, 2/01/2031 | | | 6,796,000 | 4,945,122 |
| Pacific Gas & Electric Co., 3.3%, 8/01/2040 | | | 3,004,000 | 1,923,033 |
| Xcel Energy, Inc., 3.4%, 6/01/2030 | | | 3,122,000 | 2,709,150 |
| | | | | $57,421,942 |
| Utilities - Gas – 0.0% |
| East Ohio Gas Co., 2%, 6/15/2030 (n) | | $ | 3,679,000 | $2,860,888 |
| Total Bonds (Identified Cost, $3,387,106,936) | | $2,960,820,045 |
Portfolio of Investments – continued
| Issuer | | | Shares/Par | Value ($) |
| Convertible Preferred Stocks – 0.7% |
| Automotive – 0.1% | |
| Aptiv PLC, 5.5% | | 122,000 | $11,614,400 |
| Medical Equipment – 0.3% | |
| Boston Scientific Corp., 5.5% | | 214,080 | $21,669,178 |
| Telecommunications - Wireless – 0.3% | |
| T-Mobile USA, Inc., 5.25% (a) | | 16,855 | $18,998,386 |
| Total Convertible Preferred Stocks (Identified Cost, $50,225,524) | $52,281,964 |
| Preferred Stocks – 0.6% |
| Computer Software - Systems – 0.2% | | | | |
| Samsung Electronics Co. Ltd. | | 327,955 | $10,671,167 |
| Consumer Products – 0.4% | | | | |
| Henkel AG & Co. KGaA | | 535,898 | $32,048,121 |
| Total Preferred Stocks (Identified Cost, $57,603,958) | | $42,719,288 |
| Investment Companies (h) – 2.5% |
| Money Market Funds – 2.5% | |
| MFS Institutional Money Market Portfolio, 2.64% (v) (Identified Cost, $177,270,992) | | | 177,278,346 | $177,296,073 |
|
|
| Other Assets, Less Liabilities – (1.5)% | | (110,283,228) |
| Net Assets – 100.0% | $7,133,456,617 |
| (a) | Non-income producing security. |
| (f) | All or a portion of the security has been segregated as collateral for open futures contracts. |
| (h) | An affiliated issuer, which may be considered one in which the fund owns 5% or more of the outstanding voting securities, or a company which is under common control. At period end, the aggregate values of the fund's investments in affiliated issuers and in unaffiliated issuers were $177,296,073 and $7,066,443,772, respectively. |
| (i) | Interest only security for which the fund receives interest on notional principal (Par amount). Par amount shown is the notional principal and does not reflect the cost of the security. |
| (n) | Securities exempt from registration under Rule 144A of the Securities Act of 1933. These securities may be sold in the ordinary course of business in transactions exempt from registration, normally to qualified institutional buyers. At period end, the aggregate value of these securities was $569,701,675, representing 8.0% of net assets. |
| (v) | Affiliated issuer that is available only to investment companies managed by MFS. The rate quoted for the MFS Institutional Money Market Portfolio is the annualized seven-day yield of the fund at period end. |
| (z) | Restricted securities are not registered under the Securities Act of 1933 and are subject to legal restrictions on resale. These securities generally may be resold in transactions exempt from registration or to the public if the securities are subsequently registered. Disposal of these securities may involve time-consuming negotiations and prompt sale at an acceptable price may be difficult. The fund holds the following restricted securities: |
Portfolio of Investments – continued
| Restricted Securities | Acquisition
Date | Cost | Value |
| ReadyCap Commercial Mortgage Trust, 2021-FL5, “A”, FLR, 4.084% (LIBOR - 1mo. + 1%), 4/25/2038 | 3/19/21 | $8,211,002 | $7,934,628 |
| ReadyCap Commercial Mortgage Trust, 2021-FL7, “B”, FLR, 4.884% (LIBOR - 1mo. + 1.8%), 11/25/2036 | 11/12/21 | 3,695,000 | 3,506,132 |
| Total Restricted Securities | | | $11,440,760 |
| % of Net assets | | | 0.2% |
| The following abbreviations are used in this report and are defined: |
| ADR | American Depositary Receipt |
| CLO | Collateralized Loan Obligation |
| CMT | Constant Maturity Treasury |
| FLR | Floating Rate. Interest rate resets periodically based on the parenthetically disclosed reference rate plus a spread (if any). The period-end rate reported may not be the current rate. All reference rates are USD unless otherwise noted. |
| LIBOR | London Interbank Offered Rate |
| NPFG | National Public Finance Guarantee Corp. |
| REIT | Real Estate Investment Trust |
| SOFR | Secured Overnight Financing Rate |
| TBA | To Be Announced |
| UMBS | Uniform Mortgage-Backed Security |
Derivative Contracts at 9/30/22
| Futures Contracts |
| Description | Long/
Short | Currency | Contracts | Notional
Amount | Expiration
Date | Value/Unrealized
Appreciation
(Depreciation) |
| Asset Derivatives |
| Interest Rate Futures | | |
| U.S. Treasury Ultra Note 10 yr | Short | USD | 847 | $100,356,266 | December – 2022 | $1,877,896 |
| Liability Derivatives |
| Interest Rate Futures | | |
| U.S. Treasury Note 2 yr | Long | USD | 219 | $44,980,547 | December – 2022 | $(710,036) |
| U.S. Treasury Note 5 yr | Long | USD | 2,040 | 219,315,939 | December – 2022 | (7,625,618) |
| U.S. Treasury Ultra Bond | Long | USD | 284 | 38,908,000 | December – 2022 | (3,065,011) |
| | | | | | | $(11,400,665) |
At September 30, 2022, the fund had liquid securities with an aggregate value of $3,577,965 to cover any collateral for certain derivative contracts.
See Notes to Financial Statements
Financial Statements
Statement of Assets and Liabilities
At 9/30/22
This statement represents your fund’s balance sheet, which details the assets and liabilities comprising the total value of the fund.
| Assets | |
| Investments in unaffiliated issuers, at value (identified cost, $6,213,417,622) | $7,066,443,772 |
| Investments in affiliated issuers, at value (identified cost, $177,270,992) | 177,296,073 |
| Cash | 7,228 |
| Foreign currency, at value (identified cost, $500) | 511 |
| Restricted cash for MBS/TBA | 1,295,327 |
| Receivables for | |
| Investments sold | 14,308,282 |
| TBA sale commitments | 19,304,327 |
| Fund shares sold | 5,852,539 |
| Interest and dividends | 26,427,093 |
| Other assets | 2,430 |
| Total assets | $7,310,937,582 |
| Liabilities | |
| Payables for | |
| Distributions | $598,517 |
| Net daily variation margin on open futures contracts | 612,388 |
| Investments purchased | 8,418,524 |
| TBA purchase commitments | 155,928,827 |
| Fund shares reacquired | 9,443,437 |
| Payable to affiliates | |
| Investment adviser | 138,265 |
| Administrative services fee | 3,502 |
| Shareholder servicing costs | 1,795,737 |
| Distribution and service fees | 84,296 |
| Payable for independent Trustees' compensation | 22,085 |
| Accrued expenses and other liabilities | 435,387 |
| Total liabilities | $177,480,965 |
| Net assets | $7,133,456,617 |
| Net assets consist of | |
| Paid-in capital | $6,074,545,453 |
| Total distributable earnings (loss) | 1,058,911,164 |
| Net assets | $7,133,456,617 |
| Shares of beneficial interest outstanding | 401,168,580 |
Statement of Assets and Liabilities – continued
| | Net assets | Shares
outstanding | Net asset value
per share (a) |
| Class A | $4,462,807,291 | 251,104,204 | $17.77 |
| Class B | 48,448,530 | 2,717,453 | 17.83 |
| Class C | 325,550,816 | 18,150,283 | 17.94 |
| Class I | 871,532,447 | 49,053,150 | 17.77 |
| Class R1 | 8,391,234 | 472,723 | 17.75 |
| Class R2 | 88,487,132 | 4,957,707 | 17.85 |
| Class R3 | 222,264,852 | 12,493,456 | 17.79 |
| Class R4 | 203,954,442 | 11,460,925 | 17.80 |
| Class R6 | 902,019,873 | 50,758,679 | 17.77 |
| (a) | Maximum offering price per share was equal to the net asset value per share for all share classes, except for Class A, for which the maximum offering price per share was $18.85 [100 / 94.25 x $17.77]. On sales of $50,000 or more, the maximum offering price of Class A shares is reduced. A contingent deferred sales charge may be imposed on redemptions of Class A, Class B, and Class C shares. Redemption price per share was equal to the net asset value per share for Classes I, R1, R2, R3, R4, and R6. |
See Notes to Financial Statements
Financial Statements
Statement of Operations
Year ended 9/30/22
This statement describes how much your fund earned in investment income and accrued in expenses. It also describes any gains and/or losses generated by fund operations.
| Net investment income (loss) | |
| Income | |
| Dividends | $105,054,479 |
| Interest | 75,951,934 |
| Dividends from affiliated issuers | 2,079,160 |
| Other | 1,289,402 |
| Income on securities loaned | 5,113 |
| Foreign taxes withheld | (859,667) |
| Total investment income | $183,520,421 |
| Expenses | |
| Management fee | $28,523,274 |
| Distribution and service fees | 18,798,406 |
| Shareholder servicing costs | 7,211,231 |
| Program manager fees | 12,975 |
| Administrative services fee | 649,368 |
| Independent Trustees' compensation | 110,391 |
| Custodian fee | 332,738 |
| Shareholder communications | 227,673 |
| Audit and tax fees | 78,965 |
| Legal fees | 35,535 |
| Miscellaneous | 370,284 |
| Total expenses | $56,350,840 |
| Fees paid indirectly | (7,100) |
| Reduction of expenses by distributor | (36,350) |
| Net expenses | $56,307,390 |
| Net investment income (loss) | $127,213,031 |
Statement of Operations – continued
| Realized and unrealized gain (loss) |
| Realized gain (loss) (identified cost basis) | |
| Unaffiliated issuers | $295,445,081 |
| Affiliated issuers | (25,995) |
| Futures contracts | (7,639,159) |
| Foreign currency | (165,314) |
| Net realized gain (loss) | $287,614,613 |
| Change in unrealized appreciation or depreciation | |
| Unaffiliated issuers | $(1,441,307,926) |
| Affiliated issuers | 25,081 |
| Futures contracts | (9,522,769) |
| Translation of assets and liabilities in foreign currencies | (256,205) |
| Net unrealized gain (loss) | $(1,451,061,819) |
| Net realized and unrealized gain (loss) | $(1,163,447,206) |
| Change in net assets from operations | $(1,036,234,175) |
See Notes to Financial Statements
Financial Statements
Statements of Changes in Net Assets
These statements describe the increases and/or decreases in net assets resulting from operations, any distributions, and any shareholder transactions.
| | Year ended |
| | 9/30/22 | 9/30/21 |
| Change in net assets | | |
| From operations | | |
| Net investment income (loss) | $127,213,031 | $111,186,859 |
| Net realized gain (loss) | 287,614,613 | 634,668,501 |
| Net unrealized gain (loss) | (1,451,061,819) | 666,392,886 |
| Change in net assets from operations | $(1,036,234,175) | $1,412,248,246 |
| Total distributions to shareholders | $(682,742,351) | $(525,709,005) |
| Change in net assets from fund share transactions | $365,177,591 | $97,080,425 |
| Total change in net assets | $(1,353,798,935) | $983,619,666 |
| Net assets | | |
| At beginning of period | 8,487,255,552 | 7,503,635,886 |
| At end of period | $7,133,456,617 | $8,487,255,552 |
See Notes to Financial Statements
Financial Statements
Financial Highlights
The financial highlights table is intended to help you understand the fund's financial performance for the past 5 years. Certain information reflects financial results for a single fund share. The total returns in the table represent the rate that an investor would have earned (or lost) on an investment in the fund share class (assuming reinvestment of all distributions) held for the entire period.
| Class A | Year ended |
| | 9/30/22 | 9/30/21 | 9/30/20 | 9/30/19 | 9/30/18 |
| Net asset value, beginning of period | $22.04 | $19.78 | $19.42 | $19.09 | $19.29 |
| Income (loss) from investment operations |
| Net investment income (loss) (d) | $0.31 | $0.28 | $0.36 | $0.41 | $0.37 |
| Net realized and unrealized gain (loss) | (2.83) | 3.36 | 0.63 | 0.78 | 0.53 |
| Total from investment operations | $(2.52) | $3.64 | $0.99 | $1.19 | $0.90 |
| Less distributions declared to shareholders |
| From net investment income | $(0.26) | $(0.33) | $(0.37) | $(0.39) | $(0.38) |
| From net realized gain | (1.49) | (1.05) | (0.26) | (0.47) | (0.72) |
| Total distributions declared to shareholders | $(1.75) | $(1.38) | $(0.63) | $(0.86) | $(1.10) |
| Net asset value, end of period (x) | $17.77 | $22.04 | $19.78 | $19.42 | $19.09 |
| Total return (%) (r)(s)(t)(x) | (12.61) | 19.02 | 5.21 | 6.73 | 4.71 |
Ratios (%) (to average net assets)
and Supplemental data: |
| Expenses before expense reductions (f) | 0.72 | 0.72 | 0.73 | 0.73 | 0.73 |
| Expenses after expense reductions (f) | 0.72 | 0.72 | 0.72 | 0.72 | 0.72 |
| Net investment income (loss) | 1.52 | 1.32 | 1.87 | 2.20 | 1.95 |
| Portfolio turnover | 88 | 112 | 92 | 39 | 33 |
| Net assets at end of period (000 omitted) | $4,462,807 | $5,207,735 | $4,476,559 | $4,666,095 | $4,838,039 |
See Notes to Financial Statements
Financial Highlights – continued
| Class B | Year ended |
| | 9/30/22 | 9/30/21 | 9/30/20 | 9/30/19 | 9/30/18 |
| Net asset value, beginning of period | $22.10 | $19.82 | $19.45 | $19.12 | $19.31 |
| Income (loss) from investment operations |
| Net investment income (loss) (d) | $0.15 | $0.12 | $0.22 | $0.27 | $0.23 |
| Net realized and unrealized gain (loss) | (2.82) | 3.38 | 0.63 | 0.77 | 0.53 |
| Total from investment operations | $(2.67) | $3.50 | $0.85 | $1.04 | $0.76 |
| Less distributions declared to shareholders |
| From net investment income | $(0.11) | $(0.17) | $(0.22) | $(0.24) | $(0.23) |
| From net realized gain | (1.49) | (1.05) | (0.26) | (0.47) | (0.72) |
| Total distributions declared to shareholders | $(1.60) | $(1.22) | $(0.48) | $(0.71) | $(0.95) |
| Net asset value, end of period (x) | $17.83 | $22.10 | $19.82 | $19.45 | $19.12 |
| Total return (%) (r)(s)(t)(x) | (13.25) | 18.16 | 4.44 | 5.90 | 3.94 |
Ratios (%) (to average net assets)
and Supplemental data: |
| Expenses before expense reductions (f) | 1.47 | 1.47 | 1.48 | 1.48 | 1.48 |
| Expenses after expense reductions (f) | 1.47 | 1.47 | 1.48 | 1.47 | 1.48 |
| Net investment income (loss) | 0.73 | 0.57 | 1.12 | 1.44 | 1.19 |
| Portfolio turnover | 88 | 112 | 92 | 39 | 33 |
| Net assets at end of period (000 omitted) | $48,449 | $80,923 | $94,906 | $124,982 | $152,200 |
| Class C | Year ended |
| | 9/30/22 | 9/30/21 | 9/30/20 | 9/30/19 | 9/30/18 |
| Net asset value, beginning of period | $22.23 | $19.92 | $19.55 | $19.21 | $19.40 |
| Income (loss) from investment operations |
| Net investment income (loss) (d) | $0.16 | $0.12 | $0.22 | $0.27 | $0.23 |
| Net realized and unrealized gain (loss) | (2.85) | 3.41 | 0.63 | 0.78 | 0.53 |
| Total from investment operations | $(2.69) | $3.53 | $0.85 | $1.05 | $0.76 |
| Less distributions declared to shareholders |
| From net investment income | $(0.11) | $(0.17) | $(0.22) | $(0.24) | $(0.23) |
| From net realized gain | (1.49) | (1.05) | (0.26) | (0.47) | (0.72) |
| Total distributions declared to shareholders | $(1.60) | $(1.22) | $(0.48) | $(0.71) | $(0.95) |
| Net asset value, end of period (x) | $17.94 | $22.23 | $19.92 | $19.55 | $19.21 |
| Total return (%) (r)(s)(t)(x) | (13.26) | 18.22 | 4.41 | 5.92 | 3.91 |
Ratios (%) (to average net assets)
and Supplemental data: |
| Expenses before expense reductions (f) | 1.47 | 1.47 | 1.48 | 1.48 | 1.48 |
| Expenses after expense reductions (f) | 1.47 | 1.47 | 1.48 | 1.48 | 1.48 |
| Net investment income (loss) | 0.75 | 0.57 | 1.12 | 1.44 | 1.18 |
| Portfolio turnover | 88 | 112 | 92 | 39 | 33 |
| Net assets at end of period (000 omitted) | $325,551 | $450,129 | $482,340 | $602,145 | $695,252 |
See Notes to Financial Statements
Financial Highlights – continued
| Class I | Year ended |
| | 9/30/22 | 9/30/21 | 9/30/20 | 9/30/19 | 9/30/18 |
| Net asset value, beginning of period | $22.04 | $19.77 | $19.41 | $19.08 | $19.28 |
| Income (loss) from investment operations |
| Net investment income (loss) (d) | $0.36 | $0.34 | $0.41 | $0.45 | $0.42 |
| Net realized and unrealized gain (loss) | (2.83) | 3.37 | 0.63 | 0.78 | 0.52 |
| Total from investment operations | $(2.47) | $3.71 | $1.04 | $1.23 | $0.94 |
| Less distributions declared to shareholders |
| From net investment income | $(0.31) | $(0.39) | $(0.42) | $(0.43) | $(0.42) |
| From net realized gain | (1.49) | (1.05) | (0.26) | (0.47) | (0.72) |
| Total distributions declared to shareholders | $(1.80) | $(1.44) | $(0.68) | $(0.90) | $(1.14) |
| Net asset value, end of period (x) | $17.77 | $22.04 | $19.77 | $19.41 | $19.08 |
| Total return (%) (r)(s)(t)(x) | (12.39) | 19.38 | 5.47 | 6.99 | 4.97 |
Ratios (%) (to average net assets)
and Supplemental data: |
| Expenses before expense reductions (f) | 0.47 | 0.47 | 0.48 | 0.48 | 0.48 |
| Expenses after expense reductions (f) | N/A | N/A | N/A | N/A | N/A |
| Net investment income (loss) | 1.77 | 1.57 | 2.11 | 2.44 | 2.20 |
| Portfolio turnover | 88 | 112 | 92 | 39 | 33 |
| Net assets at end of period (000 omitted) | $871,532 | $1,008,628 | $848,687 | $663,464 | $662,998 |
See Notes to Financial Statements
Financial Highlights – continued
| Class R1 | Year ended |
| | 9/30/22 | 9/30/21 | 9/30/20 | 9/30/19 | 9/30/18 |
| Net asset value, beginning of period | $22.02 | $19.75 | $19.39 | $19.06 | $19.26 |
| Income (loss) from investment operations |
| Net investment income (loss) (d) | $0.16 | $0.12 | $0.22 | $0.27 | $0.23 |
| Net realized and unrealized gain (loss) | (2.83) | 3.37 | 0.63 | 0.77 | 0.52 |
| Total from investment operations | $(2.67) | $3.49 | $0.85 | $1.04 | $0.75 |
| Less distributions declared to shareholders |
| From net investment income | $(0.11) | $(0.17) | $(0.23) | $(0.24) | $(0.23) |
| From net realized gain | (1.49) | (1.05) | (0.26) | (0.47) | (0.72) |
| Total distributions declared to shareholders | $(1.60) | $(1.22) | $(0.49) | $(0.71) | $(0.95) |
| Net asset value, end of period (x) | $17.75 | $22.02 | $19.75 | $19.39 | $19.06 |
| Total return (%) (r)(s)(t)(x) | (13.28) | 18.20 | 4.42 | 5.93 | 3.93 |
Ratios (%) (to average net assets)
and Supplemental data: |
| Expenses before expense reductions (f) | 1.47 | 1.47 | 1.48 | 1.48 | 1.48 |
| Expenses after expense reductions (f) | N/A | N/A | N/A | N/A | N/A |
| Net investment income (loss) | 0.76 | 0.57 | 1.12 | 1.44 | 1.19 |
| Portfolio turnover | 88 | 112 | 92 | 39 | 33 |
| Net assets at end of period (000 omitted) | $8,391 | $10,420 | $9,119 | $10,508 | $12,068 |
| Class R2 | Year ended |
| | 9/30/22 | 9/30/21 | 9/30/20 | 9/30/19 | 9/30/18 |
| Net asset value, beginning of period | $22.13 | $19.85 | $19.48 | $19.15 | $19.34 |
| Income (loss) from investment operations |
| Net investment income (loss) (d) | $0.26 | $0.23 | $0.31 | $0.36 | $0.32 |
| Net realized and unrealized gain (loss) | (2.84) | 3.38 | 0.64 | 0.78 | 0.54 |
| Total from investment operations | $(2.58) | $3.61 | $0.95 | $1.14 | $0.86 |
| Less distributions declared to shareholders |
| From net investment income | $(0.21) | $(0.28) | $(0.32) | $(0.34) | $(0.33) |
| From net realized gain | (1.49) | (1.05) | (0.26) | (0.47) | (0.72) |
| Total distributions declared to shareholders | $(1.70) | $(1.33) | $(0.58) | $(0.81) | $(1.05) |
| Net asset value, end of period (x) | $17.85 | $22.13 | $19.85 | $19.48 | $19.15 |
| Total return (%) (r)(s)(t)(x) | (12.83) | 18.75 | 4.97 | 6.43 | 4.48 |
Ratios (%) (to average net assets)
and Supplemental data: |
| Expenses before expense reductions (f) | 0.97 | 0.97 | 0.98 | 0.98 | 0.98 |
| Expenses after expense reductions (f) | N/A | N/A | N/A | 0.98 | 0.98 |
| Net investment income (loss) | 1.26 | 1.07 | 1.62 | 1.94 | 1.69 |
| Portfolio turnover | 88 | 112 | 92 | 39 | 33 |
| Net assets at end of period (000 omitted) | $88,487 | $118,257 | $125,160 | $165,893 | $194,859 |
See Notes to Financial Statements
Financial Highlights – continued
| Class R3 | Year ended |
| | 9/30/22 | 9/30/21 | 9/30/20 | 9/30/19 | 9/30/18 |
| Net asset value, beginning of period | $22.06 | $19.79 | $19.43 | $19.10 | $19.30 |
| Income (loss) from investment operations |
| Net investment income (loss) (d) | $0.31 | $0.28 | $0.36 | $0.41 | $0.37 |
| Net realized and unrealized gain (loss) | (2.83) | 3.37 | 0.63 | 0.78 | 0.53 |
| Total from investment operations | $(2.52) | $3.65 | $0.99 | $1.19 | $0.90 |
| Less distributions declared to shareholders |
| From net investment income | $(0.26) | $(0.33) | $(0.37) | $(0.39) | $(0.38) |
| From net realized gain | (1.49) | (1.05) | (0.26) | (0.47) | (0.72) |
| Total distributions declared to shareholders | $(1.75) | $(1.38) | $(0.63) | $(0.86) | $(1.10) |
| Net asset value, end of period (x) | $17.79 | $22.06 | $19.79 | $19.43 | $19.10 |
| Total return (%) (r)(s)(t)(x) | (12.60) | 19.05 | 5.20 | 6.71 | 4.70 |
Ratios (%) (to average net assets)
and Supplemental data: |
| Expenses before expense reductions (f) | 0.72 | 0.72 | 0.73 | 0.73 | 0.73 |
| Expenses after expense reductions (f) | N/A | N/A | N/A | N/A | 0.73 |
| Net investment income (loss) | 1.51 | 1.32 | 1.86 | 2.19 | 1.94 |
| Portfolio turnover | 88 | 112 | 92 | 39 | 33 |
| Net assets at end of period (000 omitted) | $222,265 | $294,584 | $284,813 | $290,210 | $325,625 |
| Class R4 | Year ended |
| | 9/30/22 | 9/30/21 | 9/30/20 | 9/30/19 | 9/30/18 |
| Net asset value, beginning of period | $22.07 | $19.80 | $19.44 | $19.11 | $19.31 |
| Income (loss) from investment operations |
| Net investment income (loss) (d) | $0.36 | $0.34 | $0.41 | $0.46 | $0.42 |
| Net realized and unrealized gain (loss) | (2.83) | 3.37 | 0.63 | 0.77 | 0.52 |
| Total from investment operations | $(2.47) | $3.71 | $1.04 | $1.23 | $0.94 |
| Less distributions declared to shareholders |
| From net investment income | $(0.31) | $(0.39) | $(0.42) | $(0.43) | $(0.42) |
| From net realized gain | (1.49) | (1.05) | (0.26) | (0.47) | (0.72) |
| Total distributions declared to shareholders | $(1.80) | $(1.44) | $(0.68) | $(0.90) | $(1.14) |
| Net asset value, end of period (x) | $17.80 | $22.07 | $19.80 | $19.44 | $19.11 |
| Total return (%) (r)(s)(t)(x) | (12.37) | 19.35 | 5.47 | 6.98 | 4.96 |
Ratios (%) (to average net assets)
and Supplemental data: |
| Expenses before expense reductions (f) | 0.47 | 0.47 | 0.48 | 0.48 | 0.48 |
| Expenses after expense reductions (f) | N/A | N/A | N/A | N/A | N/A |
| Net investment income (loss) | 1.77 | 1.57 | 2.11 | 2.45 | 2.19 |
| Portfolio turnover | 88 | 112 | 92 | 39 | 33 |
| Net assets at end of period (000 omitted) | $203,954 | $252,366 | $251,641 | $236,165 | $249,073 |
See Notes to Financial Statements
Financial Highlights – continued
| Class R6 | Year ended |
| | 9/30/22 | 9/30/21 | 9/30/20 | 9/30/19 | 9/30/18 |
| Net asset value, beginning of period | $22.04 | $19.77 | $19.42 | $19.09 | $19.29 |
| Income (loss) from investment operations |
| Net investment income (loss) (d) | $0.38 | $0.35 | $0.42 | $0.47 | $0.44 |
| Net realized and unrealized gain (loss) | (2.83) | 3.37 | 0.63 | 0.78 | 0.52 |
| Total from investment operations | $(2.45) | $3.72 | $1.05 | $1.25 | $0.96 |
| Less distributions declared to shareholders |
| From net investment income | $(0.33) | $(0.40) | $(0.44) | $(0.45) | $(0.44) |
| From net realized gain | (1.49) | (1.05) | (0.26) | (0.47) | (0.72) |
| Total distributions declared to shareholders | $(1.82) | $(1.45) | $(0.70) | $(0.92) | $(1.16) |
| Net asset value, end of period (x) | $17.77 | $22.04 | $19.77 | $19.42 | $19.09 |
| Total return (%) (r)(s)(t)(x) | (12.32) | 19.47 | 5.50 | 7.07 | 5.06 |
Ratios (%) (to average net assets)
and Supplemental data: |
| Expenses before expense reductions (f) | 0.39 | 0.39 | 0.40 | 0.40 | 0.40 |
| Expenses after expense reductions (f) | N/A | N/A | N/A | N/A | N/A |
| Net investment income (loss) | 1.85 | 1.65 | 2.19 | 2.52 | 2.29 |
| Portfolio turnover | 88 | 112 | 92 | 39 | 33 |
| Net assets at end of period (000 omitted) | $902,020 | $1,023,815 | $895,481 | $753,666 | $632,943 |
| (d) | Per share data is based on average shares outstanding. |
| (f) | Ratios do not reflect reductions from fees paid indirectly, if applicable. See Note 2 in the Notes to Financial Statements for additional information. |
| (r) | Certain expenses have been reduced without which performance would have been lower. |
| (s) | From time to time the fund may receive proceeds from litigation settlements, without which performance would be lower. |
| (t) | Total returns do not include any applicable sales charges. |
| (x) | The net asset values and total returns have been calculated on net assets which include adjustments made in accordance with U.S. generally accepted accounting principles required at period end for financial reporting purposes. |
See Notes to Financial Statements
Notes to Financial Statements
(1) Business and Organization
MFS Total Return Fund (the fund) is a diversified series of MFS Series Trust V (the trust). The trust is organized as a Massachusetts business trust and is registered under the Investment Company Act of 1940, as amended, as an open-end management investment company.
The fund is an investment company and accordingly follows the investment company accounting and reporting guidance of the Financial Accounting Standards Board (FASB) Accounting Standards Codification Topic 946 Financial Services - Investment Companies.
(2) Significant Accounting Policies
General — The preparation of financial statements in conformity with U.S. generally accepted accounting principles requires management to make estimates and assumptions that affect the reported amounts of assets and liabilities, and disclosure of contingent assets and liabilities at the date of the financial statements and the reported amounts of increases and decreases in net assets from operations during the reporting period. Actual results could differ from those estimates. In the preparation of these financial statements, management has evaluated subsequent events occurring after the date of the fund’s Statement of Assets and Liabilities through the date that the financial statements were issued.
In June 2022, the FASB issued Accounting Standards Update 2022-03, Fair Value Measurement (Topic 820) – Fair Value Measurement of Equity Securities Subject to Contractual Sale Restrictions (“ASU 2022-03”), which affects all entities that have investments in equity securities measured at fair value that are subject to contractual sale restrictions. ASU 2022-03 clarifies that a contractual restriction on the sale of an equity security is a characteristic of the reporting entity holding the equity security rather than a characteristic of the asset and, therefore, is not considered in measuring the fair value of the equity security. The fund decided to early adopt ASU 2022-03 effective as of June 30, 2022 as the guidance in ASU 2022-03 was consistent with the fund’s existing practices for fair value measurement.
Balance Sheet Offsetting — The fund's accounting policy with respect to balance sheet offsetting is that, absent an event of default by the counterparty or a termination of the agreement, the International Swaps and Derivatives Association (ISDA) Master Agreement, or similar agreement, does not result in an offset of reported amounts of financial assets and financial liabilities in the Statement of Assets and Liabilities across transactions between the fund and the applicable counterparty. The fund's right to setoff may be restricted or prohibited by the bankruptcy or insolvency laws of the particular jurisdiction to which a specific master netting agreement counterparty is subject. Balance sheet offsetting disclosures, to the extent applicable to the fund, have been included in the fund’s Significant Accounting Policies note under the captions for each of the fund’s in-scope financial instruments and transactions.
Investment Valuations — Subject to its oversight, the fund's Board of Trustees has delegated primary responsibility for determining or causing to be determined the value of the fund’s investments to MFS as the fund's adviser, pursuant to the fund’s valuation policy and procedures which have been adopted by the adviser and approved by the Board. Effective September 8, 2022, and in accordance with Rule 2a-5 under the Investment Company Act of 1940, the Board of Trustees designated the adviser as the
Notes to Financial Statements - continued
“valuation designee” of the fund. If the adviser, as valuation designee, determines that reliable market quotations are not readily available for an investment, the investment is valued at fair value as determined in good faith by the adviser in accordance with the adviser’s fair valuation policy and procedures.
Under the fund's valuation policy and procedures, equity securities, including restricted equity securities, are generally valued at the last sale or official closing price on their primary market or exchange as provided by a third-party pricing service. Equity securities, for which there were no sales reported that day, are generally valued at the last quoted daily bid quotation on their primary market or exchange as provided by a third-party pricing service. Debt instruments and floating rate loans, including restricted debt instruments, are generally valued at an evaluated or composite bid as provided by a third-party pricing service. Short-term instruments with a maturity at issuance of 60 days or less may be valued at amortized cost, which approximates market value.
Futures contracts are generally valued at last posted settlement price on their primary exchange as provided by a third-party pricing service. Futures contracts for which there were no trades that day for a particular position are generally valued at the closing bid quotation on their primary exchange as provided by a third-party pricing service.
Open-end investment companies are generally valued at net asset value per share. The values of foreign securities and other assets and liabilities expressed in foreign currencies are converted to U.S. dollars using the mean of bid and asked prices for rates provided by a third-party pricing service.
Under the fund’s valuation policy and procedures, market quotations are not considered to be readily available for debt instruments, floating rate loans, and many types of derivatives. These investments are generally valued at fair value based on information from third-party pricing services or otherwise determined by the adviser in accordance with the adviser’s fair valuation policy and procedures. Securities and other assets generally valued on the basis of information from a third-party pricing service may also be valued at a broker/dealer bid quotation. In determining values, third-party pricing services can utilize both transaction data and market information such as yield, quality, coupon rate, maturity, type of issue, trading characteristics, spreads and other market data. An investment may also be valued at fair value if the adviser determines that the investment’s value has been materially affected by events occurring after the close of the exchange or market on which the investment is principally traded (such as foreign exchange or market) and prior to the determination of the fund’s net asset value, or after the halt of trading of a specific security where trading does not resume prior to the close of the exchange or market on which the security is principally traded. Events that occur after foreign markets close (such as developments in foreign markets and significant movements in the U.S. markets) and prior to the determination of the fund’s net asset value may be deemed to have a material effect on the value of securities traded in foreign markets. Accordingly, the fund’s foreign equity securities may often be valued at fair value. The adviser generally relies on third-party pricing services or other information (such as the correlation with price movements of similar securities in the same or other markets; the type, cost and investment characteristics of the security; the business and financial condition of the issuer; and trading and other market data) to assist in determining whether to fair value and at what value to fair value an investment. The value of an investment for purposes of calculating the fund’s net asset value can differ depending on the source and method used to determine value. When fair valuation is used, the value of an investment used to determine the fund’s net asset value may differ from quoted or published prices for the same
Notes to Financial Statements - continued
investment. There can be no assurance that the fund could obtain the fair value assigned to an investment if it were to sell the investment at the same time at which the fund determines its net asset value per share.
Various inputs are used in determining the value of the fund's assets or liabilities. These inputs are categorized into three broad levels. In certain cases, the inputs used to measure fair value may fall into different levels of the fair value hierarchy. In such cases, an investment's level within the fair value hierarchy is based on the lowest level of input that is significant to the fair value measurement. The fund's assessment of the significance of a particular input to the fair value measurement in its entirety requires judgment, and considers factors specific to the investment. Level 1 includes unadjusted quoted prices in active markets for identical assets or liabilities. Level 2 includes other significant observable market-based inputs (including quoted prices for similar securities, interest rates, prepayment speed, and credit risk). Level 3 includes significant unobservable inputs, which may include the adviser's own assumptions in determining the fair value of investments. Other financial instruments are derivative instruments, such as futures contracts. The following is a summary of the levels used as of September 30, 2022 in valuing the fund's assets and liabilities:
| Financial Instruments | Level 1 | Level 2 | Level 3 | Total |
| Equity Securities: | | | | |
| United States | $3,933,331,114 | $18,998,386 | $— | $3,952,329,500 |
| Germany | 32,048,121 | 27,944,967 | — | 59,993,088 |
| Switzerland | — | 33,389,424 | — | 33,389,424 |
| Taiwan | 21,469,427 | — | — | 21,469,427 |
| France | — | 16,712,121 | — | 16,712,121 |
| United Kingdom | — | 11,059,000 | — | 11,059,000 |
| South Korea | — | 10,671,167 | — | 10,671,167 |
| U.S. Treasury Bonds & U.S. Government Agencies & Equivalents | — | 763,748,934 | — | 763,748,934 |
| Non - U.S. Sovereign Debt | — | 10,079,363 | — | 10,079,363 |
| Municipal Bonds | — | 19,837,107 | — | 19,837,107 |
| U.S. Corporate Bonds | — | 650,687,903 | — | 650,687,903 |
| Residential Mortgage-Backed Securities | — | 832,889,743 | — | 832,889,743 |
| Commercial Mortgage-Backed Securities | — | 144,484,731 | — | 144,484,731 |
| Asset-Backed Securities (including CDOs) | — | 267,278,067 | — | 267,278,067 |
| Foreign Bonds | — | 271,814,197 | — | 271,814,197 |
| Mutual Funds | 177,296,073 | — | — | 177,296,073 |
| Total | $4,164,144,735 | $3,079,595,110 | $— | $7,243,739,845 |
| Other Financial Instruments | | | | |
| Futures Contracts – Assets | $1,877,896 | $— | $— | $1,877,896 |
| Futures Contracts – Liabilities | (11,400,665) | — | — | (11,400,665) |
For further information regarding security characteristics, see the Portfolio of Investments.
Notes to Financial Statements - continued
Foreign Currency Translation — Purchases and sales of foreign investments, income, and expenses are converted into U.S. dollars based upon currency exchange rates prevailing on the respective dates of such transactions or on the reporting date for foreign denominated receivables and payables. Gains and losses attributable to foreign currency exchange rates on sales of securities are recorded for financial statement purposes as net realized gains and losses on investments. Gains and losses attributable to foreign exchange rate movements on receivables, payables, income and expenses are recorded for financial statement purposes as foreign currency transaction gains and losses. That portion of both realized and unrealized gains and losses on investments that results from fluctuations in foreign currency exchange rates is not separately disclosed.
Derivatives — The fund uses derivatives primarily to increase or decrease exposure to a particular market or segment of the market, or security, to increase or decrease interest rate or currency exposure, or as alternatives to direct investments. Derivatives are used for hedging or non-hedging purposes. While hedging can reduce or eliminate losses, it can also reduce or eliminate gains. When the fund uses derivatives as an investment to increase market exposure, or for hedging purposes, gains and losses from derivative instruments may be substantially greater than the derivative’s original cost.
The derivative instruments used by the fund during the period were futures contracts. Depending on the type of derivative, a fund may exit a derivative position by entering into an offsetting transaction with a counterparty or exchange, negotiating an agreement with the derivative counterparty, or novating the position to a third party. The fund may be unable to promptly close out a futures position in instances where the daily fluctuation in the price for that type of future exceeds the daily limit set by the exchange. The fund's period end derivatives, as presented in the Portfolio of Investments and the associated Derivative Contract tables, generally are indicative of the volume of its derivative activity during the period.
The following table presents, by major type of derivative contract, the fair value, on a gross basis, of the asset and liability components of derivatives held by the fund at September 30, 2022 as reported in the Statement of Assets and Liabilities:
| | | Fair Value (a) |
| Risk | Derivative Contracts | Asset Derivatives | Liability Derivatives |
| Interest Rate | Futures Contracts | $1,877,896 | $(11,400,665) |
| (a) | Values presented in this table for futures contracts correspond to the values reported in the Portfolio of Investments. Only the current day net variation margin for futures contracts is reported separately within the Statement of Assets and Liabilities. |
The following table presents, by major type of derivative contract, the realized gain (loss) on derivatives held by the fund for the year ended September 30, 2022 as reported in the Statement of Operations:
| Risk | Futures
Contracts |
| Interest Rate | $(7,639,159) |
Notes to Financial Statements - continued
The following table presents, by major type of derivative contract, the change in unrealized appreciation or depreciation on derivatives held by the fund for the year ended September 30, 2022 as reported in the Statement of Operations:
| Risk | Futures
Contracts |
| Interest Rate | $(9,522,769) |
Derivative counterparty credit risk is managed through formal evaluation of the creditworthiness of all potential counterparties. On certain, but not all, uncleared derivatives, the fund attempts to reduce its exposure to counterparty credit risk whenever possible by entering into an ISDA Master Agreement on a bilateral basis. The ISDA Master Agreement gives each party to the agreement the right to terminate all transactions traded under such agreement if there is a specified deterioration in the credit quality of the other party. Upon an event of default or a termination of the ISDA Master Agreement, the non-defaulting party has the right to close out all transactions traded under such agreement and to net amounts owed under each agreement to one net amount payable by one party to the other. This right to close out and net payments across all transactions traded under the ISDA Master Agreement could result in a reduction of the fund's credit risk to such counterparty equal to any amounts payable by the fund under the applicable transactions, if any.
Collateral and margin requirements differ by type of derivative. For cleared derivatives (e.g., futures contracts, cleared swaps, and exchange-traded options), margin requirements are set by the clearing broker and the clearing house and collateral, in the form of cash or securities, is posted by the fund directly with the clearing broker. Collateral terms are counterparty agreement specific for uncleared derivatives (e.g., forward foreign currency exchange contracts, uncleared swap agreements, and uncleared options) and collateral, in the form of cash and securities, is held in segregated accounts with the fund's custodian in connection with these agreements. For derivatives traded under an ISDA Master Agreement, which contains a collateral support annex, the collateral requirements are netted across all transactions traded under such counterparty-specific agreement and an amount is posted from one party to the other to collateralize such obligations. Cash that has been segregated or delivered to cover the fund's collateral or margin obligations under derivative contracts, if any, will be reported separately in the Statement of Assets and Liabilities as restricted cash for uncleared derivatives and/or deposits with brokers for cleared derivatives. Securities pledged as collateral or margin for the same purpose, if any, are noted in the Portfolio of Investments. The fund may be required to make payments of interest on uncovered collateral or margin obligations with the broker. Any such payments are included in “Miscellaneous” expense in the Statement of Operations.
Futures Contracts — The fund entered into futures contracts which may be used to hedge against or obtain broad market exposure, interest rate exposure, currency exposure, or to manage duration. A futures contract represents a commitment for the future purchase or sale of an asset at a specified price on a specified date.
Upon entering into a futures contract, the fund is required to deposit with the broker, either in cash or securities, an initial margin in an amount equal to a specified percentage of the notional amount of the contract. Subsequent payments (variation margin) are made or received by the fund each day, depending on the daily fluctuations
Notes to Financial Statements - continued
in the value of the contract, and are recorded for financial statement purposes as unrealized gain or loss by the fund until the contract is closed or expires at which point the gain or loss on futures contracts is realized.
The fund bears the risk of interest rates, exchange rates or securities prices moving unexpectedly, in which case, the fund may not achieve the anticipated benefits of the futures contracts and may realize a loss. While futures contracts may present less counterparty risk to the fund since the contracts are exchange traded and the exchange’s clearinghouse guarantees payments to the broker, there is still counterparty credit risk due to the insolvency of the broker. The fund’s maximum risk of loss due to counterparty credit risk is equal to the margin posted by the fund to the broker plus any gains or minus any losses on the outstanding futures contracts.
Security Loans — Under its Securities Lending Agency Agreement with the fund, JPMorgan Chase and Co., as lending agent, loans the securities of the fund to certain qualified institutions (the “Borrowers”) approved by the fund. Security loans can be terminated at the discretion of either the lending agent or the fund and the related securities must be returned within the earlier of the standard trade settlement period for such securities or within three business days. The loans are collateralized by cash and/or U.S. Treasury and federal agency obligations in an amount typically at least equal to the market value of the securities loaned. On loans collateralized by cash, the cash collateral is invested in a money market fund. The market value of the loaned securities is determined at the close of business of the fund and any additional required collateral is delivered to the fund on the next business day. The lending agent provides the fund with indemnification against Borrower default. In the event of Borrower default, the lending agent will, for the benefit of the fund, either purchase securities identical to those loaned or, when such purchase is commercially impracticable, pay the fund the market value of the loaned securities. In return, the lending agent assumes the fund's rights to the related collateral. If the collateral value is less than the cost to purchase identical securities, the lending agent is responsible for the shortfall, but only to the extent that such shortfall is not due to a decline in collateral value resulting from collateral reinvestment for which the fund bears the risk of loss. A portion of the income generated upon investment of the collateral is remitted to the Borrowers, and the remainder is allocated between the fund and the lending agent. On loans collateralized by U.S. Treasury and/or federal agency obligations, a fee is received from the Borrower, and is allocated between the fund and the lending agent. Income from securities lending is separately reported in the Statement of Operations. The dividend and interest income earned on the securities loaned is accounted for in the same manner as other dividend and interest income. At September 30, 2022, there were no securities on loan or collateral outstanding.
Indemnifications — Under the fund's organizational documents, its officers and Trustees may be indemnified against certain liabilities and expenses arising out of the performance of their duties to the fund. Additionally, in the normal course of business, the fund enters into agreements with service providers that may contain indemnification clauses. The fund's maximum exposure under these agreements is unknown as this would involve future claims that may be made against the fund that have not yet occurred.
Investment Transactions and Income — Investment transactions are recorded on the trade date. Some securities may be purchased or sold on an extended settlement basis, which means that the receipt or delivery of the securities by the fund and related
Notes to Financial Statements - continued
payments occur at a future date, usually beyond the customary settlement period.
Interest income is recorded on the accrual basis. All premium and discount is amortized or accreted for financial statement purposes in accordance with U.S. generally accepted accounting principles. Dividends received in cash are recorded on the ex-dividend date. Certain dividends from foreign securities will be recorded when the fund is informed of the dividend if such information is obtained subsequent to the ex-dividend date. Dividend and interest payments received in additional securities are recorded on the ex-dividend or ex-interest date in an amount equal to the value of the security on such date. In determining the net gain or loss on securities sold, the cost of securities is determined on the identified cost basis.
The fund may receive proceeds from litigation settlements. Any proceeds received from litigation involving portfolio holdings are reflected in the Statement of Operations in realized gain/loss if the security has been disposed of by the fund or in unrealized gain/loss if the security is still held by the fund. Any other proceeds from litigation not related to portfolio holdings are reflected as other income in the Statement of Operations.
The fund invests a significant portion of its assets in asset-backed and/or mortgage-backed securities. For these securities, the value of the debt instrument also depends on the credit quality and adequacy of the underlying assets or collateral as well as whether there is a security interest in the underlying assets or collateral. Enforcing rights, if any, against the underlying assets or collateral may be difficult. U.S. Government securities not supported as to the payment of principal or interest by the U.S. Treasury, such as those issued by Fannie Mae, Freddie Mac, and the Federal Home Loan Banks, are subject to greater credit risk than are U.S. Government securities supported by the U.S. Treasury, such as those issued by Ginnie Mae.
The fund may purchase or sell mortgage-backed securities on a “To Be Announced” (TBA) basis. A TBA transaction is subject to extended settlement and typically does not designate the actual security to be delivered, but instead includes an approximate principal amount. The price of the TBA security and the date that it will be settled are fixed at the time the transaction is negotiated. The value of the security varies with market fluctuations and no interest accrues to the fund until settlement takes place. TBA purchase and sale commitments are held at carrying amount, which approximates fair value and are categorized as level 2 within the fair value hierarchy and included in TBA purchase and TBA sale commitments in the Statement of Assets and Liabilities. Losses may arise as a result of changes in the value of the TBA investment prior to settlement date or due to counterparty non-performance. At the time that it enters into a TBA transaction, the fund is required to have sufficient cash and/or liquid securities to cover its commitments.
The fund may also enter into mortgage dollar rolls, typically TBA dollar rolls, in which the fund sells TBA mortgage-backed securities to financial institutions and simultaneously agrees to repurchase similar (same issuer, type and coupon) securities at a later date at an agreed-upon price. During the period between the sale and repurchase, the fund will not be entitled to receive interest and principal payments on the securities sold. The fund accounts for dollar roll transactions as purchases and sales and realizes gains and losses on these transactions. Dollar roll transactions involve the risk that the market value of the securities that the fund is required to purchase may decline below the agreed upon repurchase price of those securities.
Notes to Financial Statements - continued
To mitigate the counterparty credit risk on TBA transactions, mortgage dollar rolls, and other types of forward settling mortgage-backed and asset-backed security transactions, the fund whenever possible enters into a Master Securities Forward Transaction Agreement (“MSFTA”) on a bilateral basis with each of the counterparties with whom it undertakes a significant volume of transactions. The MSFTA gives each party to the agreement the right to terminate all transactions traded under such agreement if there is a specified deterioration in the credit quality of the other party. Upon an event of default or a termination of the MSFTA, the non-defaulting party has the right to close out all transactions traded under such agreement and to net amounts owed under each transaction to one net amount payable by one party to the other. This right to close out and net payments across all transactions traded under the MSFTA could result in a reduction of the fund's credit risk to such counterparty equal to any amounts payable by the fund under the applicable transactions, if any.
For mortgage-backed and asset-backed securities traded under a MSFTA, the collateral and margining requirements are contract specific. Collateral amounts across all transactions traded under such agreement are netted and an amount is posted from one party to the other to collateralize such obligations. Cash that has been pledged to cover the fund's collateral or margin obligations under a MSFTA, if any, will be reported separately on the Statement of Assets and Liabilities as restricted cash. Securities pledged as collateral or margin for the same purpose, if any, are noted in the Portfolio of Investments.
Fees Paid Indirectly — The fund's custody fee may be reduced by a credit earned under an arrangement that measures the value of U.S. dollars deposited with the custodian by the fund. The amount of the credit, for the year ended September 30, 2022, is shown as a reduction of total expenses in the Statement of Operations.
Tax Matters and Distributions — The fund intends to qualify as a regulated investment company, as defined under Subchapter M of the Internal Revenue Code, and to distribute all of its taxable income, including realized capital gains. As a result, no provision for federal income tax is required. The fund’s federal tax returns, when filed, will remain subject to examination by the Internal Revenue Service for a three year period. Management has analyzed the fund’s tax positions taken on federal and state tax returns for all open tax years and does not believe that there are any uncertain tax positions that require recognition of a tax liability. Foreign taxes, if any, have been accrued by the fund in the accompanying financial statements in accordance with the applicable foreign tax law. Foreign income taxes may be withheld by certain countries in which the fund invests. Additionally, capital gains realized by the fund on securities issued in or by certain foreign countries may be subject to capital gains tax imposed by those countries.
Distributions to shareholders are recorded on the ex-dividend date. Income and capital gain distributions are determined in accordance with income tax regulations, which may differ from U.S. generally accepted accounting principles. Certain capital accounts in the financial statements are periodically adjusted for permanent differences in order to reflect their tax character. These adjustments have no impact on net assets or net asset value per share. Temporary differences which arise from recognizing certain items of income, expense, gain or loss in different periods for financial statement and tax purposes will reverse at some time in the future.
Notes to Financial Statements - continued
Book/tax differences primarily relate to amortization and accretion of debt securities, wash sale loss deferrals, derivative transactions, and treating a portion of the proceeds from redemptions as a distribution for tax purposes.
The tax character of distributions declared to shareholders for the last two fiscal years is as follows:
| | Year ended
9/30/22 | Year ended
9/30/21 |
| Ordinary income (including any short-term capital gains) | $136,491,411 | $130,815,448 |
| Long-term capital gains | 546,250,940 | 394,893,557 |
| Total distributions | $682,742,351 | $525,709,005 |
The federal tax cost and the tax basis components of distributable earnings were as follows:
| As of 9/30/22 | |
| Cost of investments | $6,426,846,526 |
| Gross appreciation | 1,457,591,263 |
| Gross depreciation | (650,220,713) |
| Net unrealized appreciation (depreciation) | $807,370,550 |
| Undistributed ordinary income | 30,315,410 |
| Undistributed long-term capital gain | 235,019,406 |
| Other temporary differences | (13,794,202) |
| Total distributable earnings (loss) | $1,058,911,164 |
Multiple Classes of Shares of Beneficial Interest — The fund offers multiple classes of shares, which differ in their respective distribution, service, and program manager fees. The fund's income, realized and unrealized gain (loss), and common expenses are allocated to shareholders based on the daily net assets of each class. Dividends are declared separately for each class. Differences in per share dividend rates are generally due to differences in separate class expenses. Class B and Class C shares will convert to Class A shares approximately eight years after purchase. Effective March 21, 2022, all Class 529B and Class 529C shares were converted into Class 529A shares. Effective
Notes to Financial Statements - continued
May 20, 2022, all Class 529A shares were redeemed. The fund’s distributions declared to shareholders as reported in the Statements of Changes in Net Assets are presented by class as follows:
| | Year
ended
9/30/22 | | Year
ended
9/30/21 |
| Class A | $418,611,116 | | $314,457,241 |
| Class B | 5,538,194 | | 5,472,113 |
| Class C | 31,577,135 | | 28,320,585 |
| Class I | 84,020,236 | | 61,737,826 |
| Class R1 | 729,791 | | 562,049 |
| Class R2 | 8,866,198 | | 7,898,350 |
| Class R3 | 21,993,557 | | 19,311,267 |
| Class R4 | 20,304,676 | | 17,160,737 |
| Class R6 | 88,095,200 | | 68,391,391 |
| Class 529A | 2,584,106 | | 1,945,462 |
| Class 529B | 43,713 | | 49,722 |
| Class 529C | 378,429 | | 402,262 |
| Total | $682,742,351 | | $525,709,005 |
(3) Transactions with Affiliates
Note regarding references to Class 529A, Class 529B, and Class 529C shares in this “Note (3) Transactions with Affiliates”: Effective March 21, 2022, all Class 529B and Class 529C shares were converted into Class 529A shares. Effective May 20, 2022, all Class 529A shares were redeemed. Accordingly, information with respect to Class 529B and Class 529C shares is for the period ending March 21, 2022, and information with respect to Class 529A shares is for the period ending May 20, 2022.
Investment Adviser — The fund has an investment advisory agreement with MFS to provide overall investment management and related administrative services and facilities to the fund. For the period from October 1, 2021 through July 31, 2022, the management fee was computed daily and paid monthly at the following annual rates based on the fund's average daily net assets:
| Up to $6.3 billion | 0.35% |
| In excess of $6.3 billion | 0.34% |
Effective August 1, 2022, the management fee is computed daily and paid monthly at the following annual rates based on the fund's average daily net assets:
| Up to $6.3 billion | 0.35% |
| In excess of $6.3 billion and up to $10 billion | 0.34% |
| In excess of $10 billion | 0.33% |
The management fee incurred for the year ended September 30, 2022 was equivalent to an annual effective rate of 0.35% of the fund's average daily net assets.
Distributor — MFS Fund Distributors, Inc. (MFD), a wholly-owned subsidiary of MFS, as distributor, received $374,039 and $5,471 for the year ended September 30, 2022, as its portion of the initial sales charge on sales of Class A and Class 529A shares of the fund, respectively.
Notes to Financial Statements - continued
The Board of Trustees has adopted a distribution plan for certain share classes pursuant to Rule 12b-1 of the Investment Company Act of 1940.
The fund's distribution plan provides that the fund will pay MFD for services provided by MFD and financial intermediaries in connection with the distribution and servicing of certain share classes. One component of the plan is a distribution fee paid to MFD and another component of the plan is a service fee paid to MFD. MFD may subsequently pay all, or a portion, of the distribution and/or service fees to financial intermediaries.
Distribution Plan Fee Table:
| | Distribution
Fee Rate (d) | Service
Fee Rate (d) | Total
Distribution
Plan (d) | Annual
Effective
Rate (e) | Distribution
and Service
Fee |
| Class A | — | 0.25% | 0.25% | 0.25% | $ 12,685,624 |
| Class B | 0.75% | 0.25% | 1.00% | 1.00% | 671,909 |
| Class C | 0.75% | 0.25% | 1.00% | 1.00% | 4,069,808 |
| Class R1 | 0.75% | 0.25% | 1.00% | 1.00% | 96,183 |
| Class R2 | 0.25% | 0.25% | 0.50% | 0.50% | 537,053 |
| Class R3 | — | 0.25% | 0.25% | 0.25% | 654,142 |
| Class 529A | — | 0.25% | 0.25% | 0.23% | 57,717 |
| Class 529B | 0.75% | 0.25% | 1.00% | 0.03% | 71 |
| Class 529C | 0.75% | 0.25% | 1.00% | 0.99% | 25,899 |
| Total Distribution and Service Fees | | | | | $18,798,406 |
| (d) | In accordance with the distribution plan for certain classes, the fund pays distribution and/or service fees equal to these annual percentage rates of each class’s average daily net assets. The distribution and service fee rates disclosed by class represent the current rates in effect at the end of the reporting period. Any rate changes, if applicable, are detailed below. |
| (e) | The annual effective rates represent actual fees incurred under the distribution plan for the year ended September 30, 2022 based on each class's average daily net assets. MFD has voluntarily agreed to rebate a portion of each class's 0.25% service fee attributable to accounts for which there is no financial intermediary specified on the account except for accounts attributable to MFS or its affiliates' seed money. For the year ended September 30, 2022, this rebate amounted to $30,165, $136, $82, $5,668, and $299 for Class A, Class B, Class C, Class 529A, and Class 529C shares, respectively, and is included in the reduction of total expenses in the Statement of Operations. For the year ended September 30, 2022, the 0.75% distribution fee was not imposed for Class 529B shares due to the sales charge limitations contained in Financial Industry Regulatory Authority (“FINRA”) Rule 2341. |
Certain Class A shares are subject to a contingent deferred sales charge (CDSC) in the event of a shareholder redemption within 18 months of purchase. Class B and Class 529B shares are subject to a CDSC in the event of a shareholder redemption within six years of purchase. Class C and Class 529C shares are subject to a CDSC in the event of
Notes to Financial Statements - continued
a shareholder redemption within 12 months of purchase. All contingent deferred sales charges are paid to MFD and during the year ended September 30, 2022, were as follows:
| | Amount |
| Class A | $153,011 |
| Class B | 37,218 |
| Class C | 19,362 |
| Class 529B | — |
| Class 529C | 159 |
During the year ended September 30, 2022, to meet the requirements of FINRA Rule 2341, MFD returned $612 of the CDSC collected for Class 529B which had the effect of further reducing the annual effective distribution fee rate for this class by 0.22%.
The fund has entered into and may from time to time enter into contracts with program managers and other parties which administer the tuition programs through which an investment in the fund’s 529 share classes is made. The fund has entered into an agreement with MFD pursuant to which MFD receives an annual fee of up to 0.05% of the average daily net assets attributable to each 529 share class. As described above, all Class 529A, Class 529B, and Class 529C shares were redeemed on or before May 20, 2022. Accordingly, the foregoing agreement between the fund and MFD was terminated effective May 20, 2022. The services provided by MFD, or a third party with which MFD contracts, include recordkeeping and tax reporting and account services, as well as services designed to maintain the program’s compliance with the Internal Revenue Code and other regulatory requirements. Program manager fees for the year ended September 30, 2022, were as follows:
| | Fee |
| Class 529A | $11,544 |
| Class 529B | 136 |
| Class 529C | 1,295 |
| Total Program Manager Fees | $12,975 |
Shareholder Servicing Agent — MFS Service Center, Inc. (MFSC), a wholly-owned subsidiary of MFS, receives a fee from the fund for its services as shareholder servicing agent calculated as a percentage of the average daily net assets of the fund as determined periodically under the supervision of the fund's Board of Trustees. For the year ended September 30, 2022, the fee was $1,190,818, which equated to 0.0145% annually of the fund's average daily net assets. MFSC also receives reimbursement from the fund for out-of-pocket expenses, sub-accounting and other shareholder servicing costs which may be paid to affiliated and unaffiliated service providers. Class R6 shares do not incur sub-accounting fees. For the year ended September 30, 2022, these out-of-pocket expenses, sub-accounting and other shareholder servicing costs amounted to $6,020,413.
Administrator — MFS provides certain financial, legal, shareholder communications, compliance, and other administrative services to the fund. Under an administrative services agreement, the fund reimburses MFS the costs incurred to provide these
Notes to Financial Statements - continued
services. The fund is charged an annual fixed amount of $17,500 plus a fee based on average daily net assets. The administrative services fee incurred for the year ended September 30, 2022 was equivalent to an annual effective rate of 0.0079% of the fund's average daily net assets.
Trustees’ and Officers’ Compensation — The fund pays compensation to independent Trustees in the form of a retainer, attendance fees, and additional compensation to Board and Committee chairpersons. The fund does not pay compensation directly to Trustees or officers of the fund who are also officers of the investment adviser, all of whom receive remuneration from MFS for their services to the fund. Certain officers and Trustees of the fund are officers or directors of MFS, MFD, and MFSC.
Prior to December 31, 2001, the fund had an unfunded defined benefit plan (“DB plan”) for independent Trustees. As of December 31, 2001, the Board took action to terminate the DB plan with respect to then-current and any future independent Trustees, such that the DB plan covers only certain of those former independent Trustees who retired on or before December 31, 2001. The DB plan resulted in a pension expense of $1,261 and is included in “Independent Trustees’ compensation” in the Statement of Operations for the year ended September 30, 2022. The liability for deferred retirement benefits payable to those former independent Trustees under the DB plan amounted to $3,061 at September 30, 2022, and is included in “Payable for independent Trustees’ compensation” in the Statement of Assets and Liabilities.
Other — The fund invests in the MFS Institutional Money Market Portfolio which is managed by MFS and seeks current income consistent with preservation of capital and liquidity. This money market fund does not pay a management fee to MFS but does incur investment and operating costs.
The fund is permitted to engage in purchase and sale transactions with funds and accounts for which MFS serves as investment adviser or sub-adviser (“cross-trades”) pursuant to a policy adopted by the Board of Trustees. This policy has been designed to ensure that cross-trades conducted by the fund comply with Rule 17a-7 under the Investment Company Act of 1940. During the year ended September 30, 2022, the fund engaged in purchase and sale transactions pursuant to this policy, which amounted to $3,105,947 and $2,096,114, respectively. The sales transactions resulted in net realized gains (losses) of $(330,244).
The adviser has voluntarily undertaken to reimburse the fund from its own resources on a quarterly basis for the cost of investment research embedded in the cost of the fund’s securities trades. This agreement may be rescinded at any time. For the year ended September 30, 2022, this reimbursement amounted to $64,699, which is included in “Other” income in the Statement of Operations.
(4) Portfolio Securities
For the year ended September 30, 2022, purchases and sales of investments, other than short-term obligations, were as follows:
| | Purchases | Sales |
| U.S. Government securities | $5,892,719,726 | $5,824,208,386 |
| Non-U.S. Government securities | 1,198,927,417 | 1,448,759,770 |
Notes to Financial Statements - continued
(5) Shares of Beneficial Interest
The fund's Declaration of Trust permits the Trustees to issue an unlimited number of full and fractional shares of beneficial interest. Transactions in fund shares were as follows:
| | Year ended
9/30/22 | | Year ended
9/30/21 |
| | Shares | Amount | | Shares | Amount |
| Shares sold | | | | | |
| Class A | 33,466,090 | $685,904,737 | | 35,529,198 | $759,881,984 |
| Class B | 64,882 | 1,352,760 | | 46,486 | 983,047 |
| Class C | 2,025,034 | 42,058,580 | | 2,380,447 | 51,310,840 |
| Class I | 8,055,892 | 165,126,705 | | 8,858,172 | 191,141,092 |
| Class R1 | 65,465 | 1,324,712 | | 29,456 | 627,029 |
| Class R2 | 1,082,159 | 22,119,106 | | 789,919 | 16,983,114 |
| Class R3 | 1,890,128 | 38,458,674 | | 2,862,773 | 61,700,508 |
| Class R4 | 1,620,907 | 32,981,077 | | 1,730,353 | 37,112,969 |
| Class R6 | 10,669,076 | 220,675,812 | | 15,376,841 | 327,670,573 |
| Class 529A | 434,771 | 8,989,314 | | 329,670 | 6,949,344 |
| Class 529B | 1,403 | 30,325 | | 4,078 | 89,728 |
| Class 529C | 13,616 | 288,833 | | 26,351 | 563,293 |
| | 59,389,423 | $1,219,310,635 | | 67,963,744 | $1,455,013,521 |
Shares issued to shareholders
in reinvestment of distributions | | | | | |
| Class A | 18,694,354 | $395,412,895 | | 14,434,166 | $296,393,488 |
| Class B | 242,070 | 5,165,735 | | 247,057 | 5,050,768 |
| Class C | 1,394,909 | 29,934,385 | | 1,297,727 | 26,675,466 |
| Class I | 3,465,621 | 73,200,874 | | 2,590,417 | 53,267,913 |
| Class R1 | 34,376 | 729,791 | | 27,566 | 562,049 |
| Class R2 | 413,882 | 8,810,700 | | 380,528 | 7,822,050 |
| Class R3 | 1,038,015 | 21,991,573 | | 939,021 | 19,285,982 |
| Class R4 | 887,010 | 18,764,485 | | 785,493 | 16,165,395 |
| Class R6 | 3,882,876 | 81,967,596 | | 2,947,213 | 60,642,279 |
| Class 529A | 120,661 | 2,564,548 | | 94,299 | 1,931,150 |
| Class 529B | 2,039 | 43,713 | | 2,420 | 49,722 |
| Class 529C | 17,529 | 377,330 | | 19,467 | 399,533 |
| | 30,193,342 | $638,963,625 | | 23,765,374 | $488,245,795 |
Notes to Financial Statements - continued
| | Year ended
9/30/22 | | Year ended
9/30/21 |
| | Shares | Amount | | Shares | Amount |
| Shares reacquired | | | | | |
| Class A | (37,317,685) | $(760,718,025) | | (40,066,467) | $(858,849,436) |
| Class B | (1,251,172) | (25,461,990) | | (1,420,536) | (30,486,053) |
| Class C | (5,522,629) | (112,793,492) | | (7,633,154) | (162,165,756) |
| Class I | (8,240,538) | (167,418,678) | | (8,603,031) | (182,746,361) |
| Class R1 | (100,431) | (2,095,634) | | (45,392) | (967,177) |
| Class R2 | (1,882,649) | (38,756,685) | | (2,132,728) | (45,729,878) |
| Class R3 | (3,787,075) | (79,296,111) | | (4,839,810) | (103,749,396) |
| Class R4 | (2,482,485) | (50,562,583) | | (3,790,796) | (81,540,416) |
| Class R6 | (10,243,653) | (208,928,217) | | (17,157,352) | (371,245,410) |
| Class 529A | (2,103,345) | (40,378,179) | | (249,602) | (5,354,059) |
| Class 529B | (35,628) | (744,598) | | (12,318) | (265,047) |
| Class 529C | (286,953) | (5,942,477) | | (146,530) | (3,079,902) |
| | (73,254,243) | $(1,493,096,669) | | (86,097,716) | $(1,846,178,891) |
| Net change | | | | | |
| Class A | 14,842,759 | $320,599,607 | | 9,896,897 | $197,426,036 |
| Class B | (944,220) | (18,943,495) | | (1,126,993) | (24,452,238) |
| Class C | (2,102,686) | (40,800,527) | | (3,954,980) | (84,179,450) |
| Class I | 3,280,975 | 70,908,901 | | 2,845,558 | 61,662,644 |
| Class R1 | (590) | (41,131) | | 11,630 | 221,901 |
| Class R2 | (386,608) | (7,826,879) | | (962,281) | (20,924,714) |
| Class R3 | (858,932) | (18,845,864) | | (1,038,016) | (22,762,906) |
| Class R4 | 25,432 | 1,182,979 | | (1,274,950) | (28,262,052) |
| Class R6 | 4,308,299 | 93,715,191 | | 1,166,702 | 17,067,442 |
| Class 529A | (1,547,913) | (28,824,317) | | 174,367 | 3,526,435 |
| Class 529B | (32,186) | (670,560) | | (5,820) | (125,597) |
| Class 529C | (255,808) | (5,276,314) | | (100,712) | (2,117,076) |
| | 16,328,522 | $365,177,591 | | 5,631,402 | $97,080,425 |
Effective June 1, 2019, purchases of the fund’s Class B and Class 529B shares were closed to new and existing investors subject to certain exceptions. Effective after the close of business on March 18, 2022, all sales of Class 529B and Class 529C shares were suspended, and Class 529B and Class 529C shares were converted into Class 529A shares of the fund effective March 21, 2022. Effective after the close of business on May 13, 2022, all sales and redemptions of Class 529A shares were suspended, and all Class 529A shares were redeemed on May 20, 2022.
(6) Line of Credit
The fund and certain other funds managed by MFS participate in a $1.45 billion unsecured committed line of credit of which $1.2 billion is reserved for use by the fund and certain other MFS U.S. funds. The line of credit is provided by a syndicate of banks under a credit agreement. Borrowings may be made for temporary financing needs.
Notes to Financial Statements - continued
Interest is charged to each fund, based on its borrowings, generally at a rate equal to the highest of 1) Daily Simple SOFR (Secured Overnight Financing Rate) plus 0.10%, 2) the Federal Funds Effective Rate, or 3) the Overnight Bank Funding Rate, each plus an agreed upon spread. A commitment fee, based on the average daily unused portion of the committed line of credit, is allocated among the participating funds. The line of credit expires on March 16, 2023 unless extended or renewed. In addition, the fund and other funds managed by MFS have established unsecured uncommitted borrowing arrangements with certain banks for temporary financing needs. Interest is charged to each fund, based on its borrowings, at rates equal to customary reference rates plus an agreed upon spread. For the year ended September 30, 2022, the fund’s commitment fee and interest expense were $34,570 and $0, respectively, and are included in “Miscellaneous” expense in the Statement of Operations.
(7) Investments in Affiliated Issuers
An affiliated issuer may be considered one in which the fund owns 5% or more of the outstanding voting securities, or a company which is under common control. For the purposes of this report, the following were affiliated issuers:
| Affiliated Issuers | Beginning
Value | Purchases | Sales
Proceeds | Realized
Gain
(Loss) | Change in
Unrealized
Appreciation or
Depreciation | Ending
Value |
| MFS Institutional Money Market Portfolio | $589,409,208 | $1,573,774,860 | $1,985,887,081 | $(25,995) | $25,081 | $177,296,073 |
| Affiliated Issuers | Dividend
Income | Capital Gain
Distributions |
| MFS Institutional Money Market Portfolio | $2,079,160 | $— |
(8) LIBOR Transition
Certain of the fund's investments, including investments in certain debt instruments and derivatives (if any), as well as borrowings by the fund and certain other contractual arrangements of the fund, may be based on the London Interbank Offered Rate (“LIBOR”). In 2017, the regulatory authority that oversees financial services firms in the United Kingdom announced plans to transition away from LIBOR by the end of 2021. In March 2021, the administrator of LIBOR announced the extension of the publication of the more commonly used U.S. dollar LIBOR settings to the end of June 2023. Although the full impacts of the transition away from LIBOR are not fully known, the transition may result in, among other things, an increase in volatility or illiquidity of the markets for instruments that currently rely on LIBOR to determine interest rates and this could have an adverse impact on the fund's performance. With respect to the fund's accounting for investments, including investments in certain debt instruments and derivatives, as well as borrowings by the fund and any other contractual arrangements of the fund that undergo reference rate-related modifications as a result of the transition, management will rely upon the relief provided by FASB Codification Topic 848 – Reference Rate Reform (Topic 848). The guidance in Topic 848 permits the fund
Notes to Financial Statements - continued
to account for those modified contracts as a continuation of the existing contracts. Management is still evaluating the impact to the fund of the June 30, 2023 planned discontinuation of the more commonly used U.S. dollar LIBOR settings.
(9) Russia and Ukraine Conflict
The market disruptions, which began in late February 2022, associated with geopolitical events related to the conflict between Russia and Ukraine may adversely affect the value of the fund’s assets and thus the fund’s performance. Management continues to monitor these events and to evaluate the related impacts, if any, to the fund.
Report of Independent Registered Public Accounting Firm
To the Board of Trustees of MFS Series Trust V and the Shareholders of MFS Total Return Fund:
Opinion on the Financial Statements and Financial Highlights
We have audited the accompanying statement of assets and liabilities of MFS Total Return Fund (the “Fund”), including the portfolio of investments, as of September 30, 2022, the related statement of operations for the year then ended, the statements of changes in net assets for each of the two years in the period then ended, the financial highlights for each of the five years in the period then ended, and the related notes. In our opinion, the financial statements and financial highlights present fairly, in all material respects, the financial position of the Fund as of September 30, 2022, and the results of its operations for the year then ended, the changes in its net assets for each of the two years in the period then ended, and the financial highlights for each of the five years in the period then ended, in conformity with accounting principles generally accepted in the United States of America.
Basis for Opinion
These financial statements and financial highlights are the responsibility of the Fund’s management. Our responsibility is to express an opinion on the Fund's financial statements and financial highlights based on our audits. We are a public accounting firm registered with the Public Company Accounting Oversight Board (United States) (PCAOB) and are required to be independent with respect to the Fund in accordance with the U.S. federal securities laws and the applicable rules and regulations of the Securities and Exchange Commission and the PCAOB.
We conducted our audits in accordance with the standards of the PCAOB. Those standards require that we plan and perform the audit to obtain reasonable assurance about whether the financial statements and financial highlights are free of material misstatement, whether due to error or fraud. The Fund is not required to have, nor were we engaged to perform, an audit of its internal control over financial reporting. As part of our audits we are required to obtain an understanding of internal control over financial reporting but not for the purpose of expressing an opinion on the effectiveness of the Fund's internal control over financial reporting. Accordingly, we express no such opinion.
Our audits included performing procedures to assess the risks of material misstatement of the financial statements and financial highlights, whether due to error or fraud, and performing procedures that respond to those risks. Such procedures included examining, on a test basis, evidence regarding the amounts and disclosures in the financial statements and financial highlights. Our audits also included evaluating the accounting principles used and significant estimates made by management, as well as evaluating the overall presentation of the financial statements and financial highlights.
Report of Independent Registered Public Accounting Firm – continued
Our procedures included confirmation of securities owned as of September 30, 2022, by correspondence with the custodian and brokers; when replies were not received from brokers, we performed other auditing procedures. We believe that our audits provide a reasonable basis for our opinion.
DELOITTE & TOUCHE LLP
Boston, Massachusetts
November 14, 2022
We have served as the auditor of one or more of the MFS investment companies since 1924.
Trustees and Officers — Identification and Background
The Trustees and Officers of the Trust, as of November 1, 2022, are listed below, together with their principal occupations during the past five years. (Their titles may have varied during that period.) The address of each Trustee and Officer is 111 Huntington Avenue, Boston, Massachusetts 02199-7618.
| Name, Age | | Position(s) Held with Fund | | Trustee/Officer Since(h) | | Number of MFS Funds overseen by the Trustee | | Principal Occupations During
the Past Five Years | | Other Directorships During
the Past Five Years (j) |
| INTERESTED TRUSTEES | | | | | | | | | | |
Michael W. Roberge (k)
(age 56) | | Trustee | | January 2021 | | 136 | | Massachusetts Financial Services Company, Chairman (since January 2021); Chief Executive Officer (since January 2017); Director; Chairman of the Board (since January 2022); President (until December 2018); Chief Investment Officer (until December 2018) | | N/A |
| INDEPENDENT TRUSTEES | | | | | | | | | | |
John P. Kavanaugh
(age 67) | | Trustee and Chair of Trustees | | January 2009 | | 136 | | Private investor | | N/A |
Steven E. Buller
(age 71) | | Trustee | | February 2014 | | 136 | | Private investor | | N/A |
John A. Caroselli
(age 68) | | Trustee | | March 2017 | | 136 | | Private investor; JC Global Advisors, LLC (management consulting), President (since 2015) | | N/A |
Maureen R. Goldfarb
(age 67) | | Trustee | | January 2009 | | 136 | | Private investor | | N/A |
Peter D. Jones
(age 67) | | Trustee | | January 2019 | | 136 | | Private investor | | N/A |
James W. Kilman, Jr.
(age 61) | | Trustee | | January 2019 | | 136 | | Burford Capital Limited (finance and investment management), Senior Advisor (since May 3, 2021), Chief Financial Officer (2019 - May 2, 2021); KielStrand Capital LLC (family office), Chief Executive Officer (since 2016) | | Alpha-En Corporation, Director (2016-2019) |
Trustees and Officers - continued
| Name, Age | | Position(s) Held with Fund | | Trustee/Officer Since(h) | | Number of MFS Funds overseen by the Trustee | | Principal Occupations During
the Past Five Years | | Other Directorships During
the Past Five Years (j) |
Clarence Otis, Jr.
(age 66) | | Trustee | | March 2017 | | 136 | | Private investor | | VF Corporation, Director; Verizon Communications, Inc., Director; The Travelers Companies, Director |
Maryanne L. Roepke
(age 66) | | Trustee | | May 2014 | | 136 | | Private investor | | N/A |
Laurie J. Thomsen
(age 65) | | Trustee | | March 2005 | | 136 | | Private investor | | The Travelers Companies, Director; Dycom Industries, Inc., Director |
| Name, Age | | Position(s) Held with
Fund | | Trustee/Officer Since(h) | | Number of MFS Funds for which the Person is an Officer | | Principal Occupations During
the Past Five Years |
| OFFICERS | | | | | | | | |
Christopher R. Bohane (k)
(age 48) | | Assistant Secretary and Assistant Clerk | | July 2005 | | 136 | | Massachusetts Financial Services Company, Senior Vice President and Senior Managing Counsel |
Kino Clark (k)
(age 54) | | Assistant Treasurer | | January 2012 | | 136 | | Massachusetts Financial Services Company, Vice President |
John W. Clark, Jr. (k)
(age 55) | | Assistant Treasurer | | April 2017 | | 136 | | Massachusetts Financial Services Company, Vice President |
David L. DiLorenzo (k)
(age 54) | | President | | July 2005 | | 136 | | Massachusetts Financial Services Company, Senior Vice President |
Heidi W. Hardin (k)
(age 55) | | Secretary and Clerk | | April 2017 | | 136 | | Massachusetts Financial Services Company, Executive Vice President and General Counsel |
Brian E. Langenfeld (k)
(age 49) | | Assistant Secretary and Assistant Clerk | | June 2006 | | 136 | | Massachusetts Financial Services Company, Vice President and Managing Counsel |
Trustees and Officers - continued
| Name, Age | | Position(s) Held with
Fund | | Trustee/Officer Since(h) | | Number of MFS Funds for which the Person is an Officer | | Principal Occupations During
the Past Five Years |
Rosa E. Licea-Mailloux(k)
(age 46) | | Chief Compliance Officer | | March 2022 | | 136 | | Massachusetts Financial Services Company, Vice President (since 2018); Director of Corporate Compliance (2018-2021), Senior Director Compliance (2021-2022), Senior Managing Director of North American Compliance & Chief Compliance Officer (since March 2022); Natixis Investment Managers (investment management), Funds Chief Compliance Officer, Deputy General Counsel & Senior Vice President (until 2018) |
Amanda S. Mooradian (k)
(age 43) | | Assistant Secretary and Assistant Clerk | | September 2018 | | 136 | | Massachusetts Financial Services Company, Assistant Vice President and Senior Counsel |
Susan A. Pereira (k)
(age 51) | | Assistant Secretary and Assistant Clerk | | July 2005 | | 136 | | Massachusetts Financial Services Company, Vice President and Managing Counsel |
Kasey L. Phillips (k)
(age 51) | | Assistant Treasurer | | September 2012 | | 136 | | Massachusetts Financial Services Company, Vice President |
Matthew A. Stowe (k)
(age 47) | | Assistant Secretary and Assistant Clerk | | October 2014 | | 136 | | Massachusetts Financial Services Company, Vice President and Senior Managing Counsel |
William B. Wilson(k)
(age 40) | | Assistant Secretary and Assistant Clerk | | October 2022 | | 136 | | Massachusetts Financial Services Company, Assistant Vice President and Counsel |
James O. Yost (k)
(age 62) | | Treasurer | | September 1990 | | 136 | | Massachusetts Financial Services Company, Senior Vice President |
| (h) | Date first appointed to serve as Trustee/Officer of an MFS Fund. Each Trustee has served continuously since appointment unless indicated otherwise. From January 2012 through December 2016, Messrs. DiLorenzo and Yost served as Treasurer and Deputy Treasurer of the Funds, respectively. |
| (j) | Directorships or trusteeships of companies required to report to the Securities and Exchange Commission (i.e., “public companies”). |
| (k) | “Interested person” of the Trust within the meaning of the Investment Company Act of 1940 (referred to as the 1940 Act), which is the principal federal law governing investment companies like the fund, as a result of a position with MFS. The address of MFS is 111 Huntington Avenue, Boston, Massachusetts 02199-7618. |
Trustees and Officers - continued
Each Trustee (other than Messrs. Jones, Kilman and Roberge) has been elected by shareholders and each Trustee and Officer holds office until his or her successor is chosen and qualified or until his or her earlier death, resignation, retirement or removal. Mr. Roberge became a Trustee of the Funds on January 1, 2021 and Messrs. Jones and Kilman became Trustees of the Funds on January 1, 2019. The Trust does not hold annual meetings for the purpose of electing Trustees, and Trustees are not elected for fixed terms. Under the terms of the Board's retirement policy, an Independent Trustee shall retire at the end of the calendar year in which he or she reaches the earlier of 75 years of age or 15 years of service on the Board (or, in the case of any Independent Trustee who joined the Board prior to 2015, 20 years of service on the Board).
Messrs. Buller, Kilman and Otis and Ms. Roepke are members of the Trust’s Audit Committee.
Each of the Interested Trustees and certain Officers hold comparable officer positions with certain affiliates of MFS.
The Statement of Additional Information for a Fund includes further information about the Trustees and is available without charge upon request by calling 1-800-225-2606.
| Investment Adviser | Custodian |
Massachusetts Financial Services Company
111 Huntington Avenue
Boston, MA 02199-7618 | JPMorgan Chase Bank, NA
4 Metrotech Center
New York, NY 11245 |
| Distributor | Independent Registered Public Accounting Firm |
MFS Fund Distributors, Inc.
111 Huntington Avenue
Boston, MA 02199-7618 | Deloitte & Touche LLP
200 Berkeley Street
Boston, MA 02116 |
| Portfolio Manager(s) | |
Steven Gorham
Alexander Mackey
Joshua Marston
Johnathan Munko
Henry Peabody | |
Board Review of Investment Advisory Agreement
MFS Total Return Fund
The Investment Company Act of 1940 requires that both the full Board of Trustees and a majority of the non-interested (“independent”) Trustees, voting separately, annually approve the continuation of the Fund’s investment advisory agreement with MFS. The Trustees consider matters bearing on the Fund and its advisory arrangements at their meetings throughout the year, including a review of performance data at each regular meeting. In addition, the independent Trustees met several times over the course of three months beginning in May and ending in July, 2022 (“contract review meetings”) for the specific purpose of considering whether to approve the continuation of the investment advisory agreement for the Fund and the other investment companies that the Board oversees (the “MFS Funds”). The independent Trustees were assisted in their evaluation of the Fund’s investment advisory agreement by independent legal counsel, from whom they received separate legal advice and with whom they met separately from MFS during various contract review meetings. The independent Trustees were also assisted in this process by an independent consultant who was retained by and reported to the independent Trustees.
In connection with their deliberations regarding the continuation of the investment advisory agreement, the Trustees, including the independent Trustees, considered such information and factors as they believed, in light of the legal advice furnished to them and their own business judgment, to be relevant. The investment advisory agreement for the Fund was considered separately, although the Trustees also took into account the common interests of all MFS Funds in their review. As described below, the Trustees considered the nature, quality, and extent of the various investment advisory, administrative, and shareholder services performed by MFS under the existing investment advisory agreement and other arrangements with the Fund.
In connection with their contract review meetings, the Trustees received and relied upon materials that included, among other items: (i) information provided by Broadridge Financial Solutions, Inc. (“Broadridge”), an independent third party, on the investment performance of the Fund for various time periods ended December 31, 2021 and the investment performance of a group of funds with substantially similar investment classifications/objectives (the “Broadridge performance universe”), (ii) information provided by Broadridge on the Fund’s advisory fees and other expenses and the advisory fees and other expenses of comparable funds identified by Broadridge as well as all other funds in the same investment classification/category (the “Broadridge expense group and universe”), (iii) information provided by MFS on the advisory fees of portfolios of other clients of MFS, including institutional separate accounts and other clients, (iv) information as to whether and to what extent applicable expense waivers, reimbursements or fee “breakpoints” are observed for the Fund, (v) information regarding MFS’ financial results and financial condition, including MFS’ and certain of its affiliates’ estimated profitability from services performed for the Fund and the MFS Funds as a whole, and compared to MFS’ institutional business, (vi) MFS’ views regarding the outlook for the mutual fund industry and the strategic business plans of MFS, (vii) descriptions of various functions performed by MFS for the Funds, such as compliance monitoring and portfolio trading practices, and (viii) information regarding the overall organization of MFS, including information about
Board Review of Investment Advisory Agreement - continued
MFS’ senior management and other personnel providing investment advisory, administrative and other services to the Fund and the other MFS Funds. The comparative performance, fee and expense information prepared and provided by Broadridge was not independently verified and the independent Trustees did not independently verify any information provided to them by MFS.
The Trustees’ conclusion as to the continuation of the investment advisory agreement was based on a comprehensive consideration of all information provided to the Trustees and not the result of any single factor. Some of the factors that figured particularly in the Trustees’ deliberations are described below, although individual Trustees may have evaluated the information presented differently from one another, giving different weights to various factors. It is also important to recognize that the fee arrangements for the Fund and other MFS Funds are the result of years of review and discussion between the independent Trustees and MFS, that certain aspects of such arrangements may receive greater scrutiny in some years than in others, and that the Trustees’ conclusions may be based, in part, on their consideration of these same arrangements during the course of the year and in prior years.
Based on information provided by Broadridge and MFS, the Trustees reviewed the Fund’s total return investment performance as well as the Broadridge performance universe over various time periods. The Trustees placed particular emphasis on the total return performance of the Fund’s Class I shares in comparison to the performance of funds in its Broadridge performance universe over the five-year period ended December 31, 2021, which the Trustees believed was a long enough period to reflect differing market conditions. The total return performance of the Fund’s Class I shares was in the 3rd quintile relative to the other funds in the universe for this five-year period (the 1st quintile being the best performers and the 5th quintile being the worst performers). The total return performance of the Fund’s Class I shares was in the 2nd quintile for the one-year period and the 3rd quintile for the three-year period ended December 31, 2021 relative to the Broadridge performance universe. Because of the passage of time, these performance results may differ from the performance results for more recent periods, including those shown elsewhere in this report.
In the course of their deliberations, the Trustees took into account information provided by MFS in connection with the contract review meetings, as well as during investment review meetings conducted with portfolio management personnel during the course of the year regarding the Fund’s performance. After reviewing these and related factors, the Trustees concluded, within the context of their overall conclusions regarding the investment advisory agreement, that they were satisfied with MFS’ responses and efforts relating to investment performance.
In assessing the reasonableness of the Fund’s advisory fee, the Trustees considered, among other information, the Fund’s advisory fee and the total expense ratio of the Fund’s Class I shares as a percentage of average daily net assets and the advisory fee and total expense ratios of the Broadridge expense group based on information provided by Broadridge. The Trustees considered that, according to the data provided by Broadridge (which takes into account any fee reductions or expense limitations that were in effect during the Fund’s last fiscal year), the Fund’s effective advisory fee rate and total expense ratio were each lower than the Broadridge expense group median.
Board Review of Investment Advisory Agreement - continued
The Trustees also considered the advisory fees charged by MFS to any institutional separate accounts advised by MFS (“separate accounts”) and unaffiliated investment companies for which MFS serves as subadviser (“subadvised funds”) that have comparable investment strategies to the Fund, if any. In comparing these fees, the Trustees considered information provided by MFS as to the generally broader scope of services provided by MFS to the Fund, as well as the more extensive regulatory burdens imposed on MFS in managing the Fund, in comparison to separate accounts and subadvised funds. The Trustees also considered the higher demands placed on MFS’ investment personnel and trading infrastructure as a result of the daily cash in-flows and out-flows of the Fund in comparison to separate accounts.
The Trustees also considered whether the Fund may benefit from any economies of scale in the management of the Fund in the event of growth in assets of the Fund. They noted that the Fund’s advisory fee rate schedule is subject to a contractual breakpoint that reduces the Fund’s advisory fee rate on average daily net assets over $6.3 billion. They also noted that MFS has agreed to implement an additional contractual breakpoint that reduces its advisory fee rate on the Fund’s average daily net assets over $10 billion effective August 1, 2022. The Trustees concluded that the breakpoints were sufficient to allow the Fund to benefit from economies of scale as its assets grow.
The Trustees also considered information prepared by MFS relating to MFS’ costs and profits with respect to the Fund, the MFS Funds considered as a group, and other investment companies and accounts advised by MFS, as well as MFS’ methodologies used to determine and allocate its costs to the MFS Funds, the Fund and other accounts and products for purposes of estimating profitability.
After reviewing these and other factors described herein, the Trustees concluded, within the context of their overall conclusions regarding the investment advisory agreement, that the advisory fees charged to the Fund represent reasonable compensation in light of the services being provided by MFS to the Fund.
In addition, the Trustees considered MFS’ resources and related efforts to continue to retain, attract and motivate capable personnel to serve the Fund. The Trustees also considered current and developing conditions in the financial services industry, including the presence of large and well-capitalized companies which are spending, and appear to be prepared to continue to spend, substantial sums to engage personnel and to provide services to competing investment companies. In this regard, the Trustees also considered the financial resources of MFS and its ultimate parent, Sun Life Financial Inc. The Trustees also considered the advantages and possible disadvantages to the Fund of having an adviser that also serves other investment companies as well as other accounts.
The Trustees also considered the nature, quality, cost, and extent of administrative, transfer agency, and distribution services provided to the Fund by MFS and its affiliates under agreements and plans other than the investment advisory agreement, including any 12b-1 fees the Fund pays to MFS Fund Distributors, Inc., an affiliate of MFS. The Trustees also considered the nature, extent and quality of certain other services MFS performs or arranges for on the Fund’s behalf, which may include securities lending programs, directed expense payment programs, class action recovery programs,
Board Review of Investment Advisory Agreement - continued
and MFS’ interaction with third-party service providers, principally custodians and sub-custodians. The Trustees concluded that the various non-advisory services provided by MFS and its affiliates on behalf of the Fund were satisfactory.
The Trustees considered so-called “fall-out benefits” to MFS such as reputational value derived from serving as investment manager to the MFS Funds. The Trustees also considered that MFS discontinued its historic practice of obtaining investment research from portfolio brokerage commissions paid by certain MFS Funds effective January 2018, and directly pays or voluntarily reimburses a Fund, if applicable, for the costs of external research acquired through the use of the Fund’s portfolio brokerage commissions.
Based on their evaluation of factors that they deemed to be material, including those factors described above, the Board of Trustees, including the independent Trustees, concluded that the Fund’s investment advisory agreement with MFS should be continued for an additional one-year period, commencing August 1, 2022.
Proxy Voting Policies and Information
MFS votes proxies on behalf of the fund pursuant to proxy voting policies and procedures that are available without charge, upon request, by calling 1-800-225-2606, by visiting mfs.com/proxyvoting, or by visiting the SEC’s Web site at http://www.sec.gov.
Information regarding how the fund voted proxies relating to portfolio securities during the most recent twelve-month period ended June 30 is available by August 31 of each year without charge by visiting mfs.com/proxyvoting, or by visiting the SEC’s Web site at http://www.sec.gov.
Quarterly Portfolio Disclosure
The fund files a complete schedule of portfolio holdings with the SEC for the first and third quarters of each fiscal year as an exhibit to its reports on Form N-PORT. The fund's Form N-PORT reports are available on the SEC's Web site at http://www.sec.gov. A shareholder can obtain the portfolio holdings report for the first and third quarters of the fund's fiscal year at mfs.com/openendfunds by choosing the fund's name and then scrolling to the “Resources” section and clicking on the “Prospectus and Reports” tab.
Further Information
From time to time, MFS may post important information about the fund or the MFS Funds on the MFS Web site (mfs.com). This information is available at https://www.mfs.com/announcements or at mfs.com/openendfunds by choosing the fund’s name and then scrolling to the “Resources” section and clicking on the “Announcements” tab, if any.
Information About Fund Contracts and Legal Claims
The fund has entered into contractual arrangements with an investment adviser, administrator, distributor, shareholder servicing agent, and custodian who each provide services to the fund. Unless expressly stated otherwise, shareholders are not parties to, or intended beneficiaries of these contractual arrangements, and these contractual arrangements are not intended to create any shareholder right to enforce them against the service providers or to seek any remedy under them against the service providers, either directly or on behalf of the fund.
Under the Trust’s By-Laws and Declaration of Trust, any claims asserted against or on behalf of the MFS Funds, including claims against Trustees and Officers, must be brought in state and federal courts located within the Commonwealth of Massachusetts.
Federal Tax Information (unaudited)
The fund will notify shareholders of amounts for use in preparing 2022 income tax forms in January 2023. The following information is provided pursuant to provisions of the Internal Revenue Code.
The fund designates the maximum amount allowable as qualified dividend income eligible to be taxed at the same rate as long-term capital gain.
The fund designates $619,312,000 as capital gain dividends paid during the fiscal year.
For corporate shareholders, 60.89% of the ordinary income dividends paid during the fiscal year qualify for the corporate dividends received deduction.
Federal Tax Information (unaudited) - continued
The fund designates the maximum amount allowable as Section 199A dividends as defined in Proposed Treasury Regulation §1.199A-3(d).
The fund intends to pass through the maximum amount allowable as Section 163(j) Interest Dividends as defined in Treasury Regulation §1.163(j)-1(b).
| FACTS | WHAT DOES MFS DO WITH YOUR PERSONAL INFORMATION? |
| Why? | Financial companies choose how they share your personal information. Federal law gives consumers the right to limit some but not all sharing. Federal law also requires us to tell you how we collect, share, and protect your personal information. Please read this notice carefully to understand what we do. |
| What? | The types of personal information we collect and share depend on the product or service you have with us. This information can include: |
| • Social Security number and account balances |
| • Account transactions and transaction history |
| • Checking account information and wire transfer instructions |
| When you are no longer our customer, we continue to share your information as described in this notice. |
| How? | All financial companies need to share customers' personal information to run their everyday business. In the section below, we list the reasons financial companies can share their customers' personal information; the reasons MFS chooses to share; and whether you can limit this sharing. |
Reasons we can share your
personal information | Does MFS share? | Can you limit
this sharing? |
For our everyday business purposes –
such as to process your transactions, maintain your
account(s), respond to court orders and legal
investigations, or report to credit bureaus | Yes | No |
For our marketing purposes –
to offer our products and services to you | No | We don't share |
For joint marketing with other
financial companies | No | We don't share |
For our affiliates' everyday business purposes –
information about your transactions and experiences | No | We don't share |
For our affiliates' everyday business purposes –
information about your creditworthiness | No | We don't share |
| For nonaffiliates to market to you | No | We don't share |
| Questions? | Call 800-225-2606 or go to mfs.com. |
| Who we are |
| Who is providing this notice? | MFS Funds, MFS Investment Management, MFS Institutional Advisors, Inc., and MFS Heritage Trust Company. |
| What we do |
How does MFS
protect my personal
information? | To protect your personal information from unauthorized access and use, we use security measures that comply with federal law. These measures include procedural, electronic, and physical safeguards for the protection of the personal information we collect about you. |
How does MFS
collect my personal
information? | We collect your personal information, for example, when you |
| • open an account or provide account information |
| • direct us to buy securities or direct us to sell your securities |
| • make a wire transfer |
| We also collect your personal information from others, such as credit bureaus, affiliates, or other companies. |
| Why can't I limit all sharing? | Federal law gives you the right to limit only |
| • sharing for affiliates' everyday business purposes – information about your creditworthiness |
| • affiliates from using your information to market to you |
| • sharing for nonaffiliates to market to you |
| State laws and individual companies may give you additional rights to limit sharing. |
| Definitions |
| Affiliates | Companies related by common ownership or control. They can be financial and nonfinancial companies. |
| • MFS does not share personal information with affiliates, except for everyday business purposes as described on page one of this notice. |
| Nonaffiliates | Companies not related by common ownership or control. They can be financial and nonfinancial companies. |
| • MFS does not share with nonaffiliates so they can market to you. |
| Joint marketing | A formal agreement between nonaffiliated financial companies that together market financial products or services to you. |
| • MFS doesn't jointly market. |
| Other important information |
| If you own an MFS product or receive an MFS service in the name of a third party such as a bank or broker-dealer, their privacy policy may apply to you instead of ours. |
Save paper with eDelivery.
MFS® will send you prospectuses, reports, and proxies directly via e-mail so you will get information faster with less mailbox clutter.
To sign up:
1. Go to mfs.com.
2. Log in via MFS® Access.
3. Select eDelivery.
If you own your MFS fund shares through a financial institution or a retirement plan, MFS® TALK, MFS® Access, or eDelivery may not be available to you.
CONTACT
WEB SITE
mfs.com
MFS TALK
1-800-637-8255
24 hours a day
ACCOUNT SERVICE AND LITERATURE
Shareholders
1-800-225-2606
Financial advisors
1-800-343-2829
Retirement plan services
1-800-637-1255
MAILING ADDRESS
MFS Service Center, Inc.
P.O. Box 219341
Kansas City, MO 64121-9341
OVERNIGHT MAIL
MFS Service Center, Inc.
Suite 219341
430 W 7th Street
Kansas City, MO 64105-1407
Annual Report
September 30, 2022
| 1 |
| 2 |
| 3 |
| 5 |
| 8 |
| 10 |
| 16 |
| 18 |
| 20 |
| 21 |
| 30 |
| 41 |
| 43 |
| 47 |
| 51 |
| 51 |
| 51 |
| 51 |
| 51 |
| 53 |
The report is prepared for the general information of shareholders. It is authorized for distribution to prospective investors only when preceded or accompanied by a current prospectus.
NOT FDIC INSURED • MAY LOSE VALUE • NO BANK GUARANTEE
LETTER FROM THE CHAIR AND CEO
Dear Shareholders:
Global markets have recently been buffeted by a series of crosscurrents, including rising inflation, tighter financial conditions, and evolving geopolitical tensions. Consequently, at a time when global growth faces multiple headwinds, central banks have been presented with the challenge of reining in rising prices without tipping economies into recession. The U.S. Federal Reserve has made it clear that rates must move higher and tighter policy must be sustained to restore price stability and that this will likely bring some pain to households and businesses. Against that backdrop, richly valued, interest rate–sensitive growth equities have been hit particularly hard by rising interest rates. Volatility in fixed income and currency markets has picked up, with fiscal policy missteps in the United Kingdom leading to a crisis of market confidence that ultimately resulted in the ousting of Prime Minister Liz Truss. That episode could forewarn other governments to avoid policy overreach.
There are, however, encouraging signs for the markets. The latest wave of COVID-19 cases appears to be receding in Asia, and cases outside Asia, while numerous, appear to be causing fewer serious illnesses. Meanwhile, unemployment is low and global supply chain bottlenecks are easing, though lingering coronavirus restrictions in China and disruptions stemming from Russia’s invasion of Ukraine could hamper these advances. Additionally, easier Chinese monetary and regulatory policies and the record pace of corporate stock buybacks are supportive elements, albeit in an otherwise turbulent investment environment.
It is important to have a deep understanding of company fundamentals during times of market transition, and we have built our unique global research platform to do just that.
At MFS®, we put our clients’ assets to work responsibly by carefully navigating increasingly complex global capital markets. Our investment team is guided by a commitment to long-term fundamental investing. Our global investment platform — combining collective expertise, long-term discipline, and thoughtful risk management — seeks to uncover what we believe are the best, most durable investment ideas in markets around the world, enabling us to potentially create value for investors.
Respectfully,
Michael W. Roberge
Chair and Chief Executive Officer
MFS Investment Management
November 14, 2022
The opinions expressed in this letter are subject to change and may not be relied upon for investment advice. No forecasts can be guaranteed.
Portfolio structure
Top ten holdings
| Microsoft Corp. | 7.0% |
| Alphabet, Inc., “A” | 4.3% |
| Amazon.com, Inc. | 3.9% |
| Apple, Inc. | 3.4% |
| Visa, Inc., “A” | 2.2% |
| ConocoPhillips | 1.8% |
| JPMorgan Chase & Co. | 1.6% |
| Danaher Corp. | 1.6% |
| Charles Schwab Corp. | 1.6% |
| Accenture PLC, “A” | 1.5% |
Global equity sectors (k)
| Technology | 29.0% |
| Health Care | 15.7% |
| Financial Services | 13.9% |
| Capital Goods | 13.1% |
| Consumer Cyclicals | 11.8% |
| Energy | 7.9% |
| Consumer Staples | 5.1% |
| Telecommunications/Cable Television (s) | 2.4% |
| (k) | The sectors set forth above and the associated portfolio composition are based on MFS’ own custom sector classification methodology. |
| (s) | Includes securities sold short. |
Cash & Cash Equivalents includes any cash, investments in money market funds, short-term securities, and other assets less liabilities. Please see the Statement of Assets and Liabilities for additional information related to the fund’s cash position and other assets and liabilities.
Percentages are based on net assets as of September 30, 2022.
The portfolio is actively managed and current holdings may be different.
Management Review
Summary of Results
For the twelve months ended September 30, 2022, Class A shares of the MFS Research Fund (fund) provided a total return of -16.34%, at net asset value. This compares with a return of -15.47% for the fund’s benchmark, the Standard & Poor’s 500 Stock Index (S&P 500 Index).
Market Environment
During the reporting period, markets continued to grapple with the strongest global inflationary pressures in decades along with signs of slowing economic growth. Intermittent coronavirus flareups, particularly in China, where home-grown vaccines have proved less effective than elsewhere, have kept supply chains stretched for longer than expected. At the same time, the reopening of the economy in the parts of the world where the virus has been better contained has led to a shift in consumption patterns in favor of services, straining already tight labor markets in most developed economies, while reducing demand for manufactured goods, primarily from Asia. As a result of Russia’s invasion of Ukraine, geopolitical considerations, such as sanctions and trade bans, have resulted in additional supply chain tumult and volatile global energy prices. Taken together, these factors have contributed to market volatility.
The ripple effects from the Russian invasion further complicated the mission central banks must undertake to rein in surging inflation. Energy shocks have historically resulted in global growth slowdowns, if not pullbacks, so policymakers will find themselves in the difficult position of trying to restrain inflation without tipping economies into recession. Despite the challenging macroeconomic and geopolitical environment, policymakers remained focused on corralling inflation, although investors appeared to have expected varying degrees of action from the central banks. The Fed was expected to be the most hawkish developed market central bank and the European Central Bank less so, given the growth-depleting effects on Europe's economy stemming from the invasion, while the Bank of Japan remained on the monetary sidelines, leading to a dramatic weakening of the yen.
Against an environment of rising labor and volatile materials prices, higher interest rates and waning fiscal and monetary stimulus, investor anxiety appeared to have increased over the potential that corporate profit margins may be past peak for this cycle. That said, tentative signs that supply chain bottlenecks (particularly semiconductors) may be easing, low levels of unemployment across developed markets and somewhat easier prices for raw materials were supportive factors for the macroeconomic backdrop.
Detractors from Performance
Stock selection in the technology sector was a primary detractor from performance relative to the S&P 500 Index. Within this sector, an underweight position in computer and personal electronics maker Apple, and the fund's overweight positions in software company Adobe Systems, customer information software manager salesforce.com and technology company Alphabet, hindered relative results. The share price of Apple advanced due to better-than-feared revenue growth led by lower supply chain impacts versus expectations. Despite ongoing component shortages impacting Mac and iPad sales and global currency headwinds, the company continued to demonstrate the
Management Review - continued
strength of its product ecosystem with broad-based growth. iPhone and Services Segment sales remained strong across all regions with revenue growth ahead of estimates. Additionally, holding shares of software development company Atlassian(b) further dampened relative returns.
Stock selection in the capital goods sector held back relative results, led by not holding shares of electric vehicle manufacturer Tesla.
Individual stocks in other sectors that weighed on relative returns included not holding shares of integrated oil and gas company Exxon Mobil, health insurance and Medicare/Medicaid provider UnitedHealth Group and integrated energy company Chevron. The share price of Exxon Mobil appreciated as the company reported solid financial results, driven by revenue growth, a strong energy price environment, and expanded margins in its refining segment. In addition, an overweight position in cable services provider Charter Communications further weakened relative performance.
Contributors to Performance
Stock selection in the health care sector contributed to relative performance. Within this sector, the fund's overweight positions in biopharmaceutical company Vertex Pharmaceuticals, global health services provider Cigna and health services and information technology company McKesson, and an overweight position in pharmaceutical company Eli Lilly & Co, supported relative returns. The share price of Cigna advanced, driven by strong results within its healthcare division, particularly better-than-anticipated medical loss ratio rebates and stronger operating income growth.
Stock selection in the financial services sector also benefited relative performance. However, there were no individual stocks within this sector, either in the fund or in the benchmark, that were among the fund's top relative contributors during the reporting period.
Elsewhere, the fund's overweight position in oil and gas company ConocoPhillips, and not holding shares of digital payment technology developer PayPal, computer graphics processor maker NVIDIA, subscription video services provider Netflix, media conglomerate Walt Disney and cable services provider Comcast, bolstered relative performance. The share price of ConocoPhillips benefited from stronger-than-expected earnings growth led by a combination of strong production volumes and higher commodity prices. In addition, the company significantly increased its 2022 capital return targets, which further supported the stock price.
Respectfully,
Portfolio Manager(s)
Joseph MacDougall
| (b) | Security is not a benchmark constituent. |
The views expressed in this report are those of the portfolio manager(s) only through the end of the period of the report as stated on the cover and do not necessarily reflect the views of MFS or any other person in the MFS organization. These views are subject to change at any time based on market or other conditions, and MFS disclaims any responsibility to update such views. These views may not be relied upon as investment advice or an indication of trading intent on behalf of any MFS portfolio. References to specific securities are not recommendations of such securities, and may not be representative of any MFS portfolio’s current or future investments.
Performance Summary THROUGH 9/30/22
The following chart illustrates a representative class of the fund’s historical performance in comparison to its benchmark(s). Performance results include the deduction of the maximum applicable sales charge and reflect the percentage change in net asset value, including reinvestment of dividends and capital gains distributions. The performance of other share classes will be greater than or less than that of the class depicted below. Benchmarks are unmanaged and may not be invested in directly. Benchmark returns do not reflect sales charges, commissions or expenses. (See Notes to Performance Summary.)
Performance data shown represents past performance and is no guarantee of future results. Investment return and principal value fluctuate so your shares, when sold, may be worth more or less than the original cost; current performance may be lower or higher than quoted. The performance shown does not reflect the deduction of taxes, if any, that a shareholder would pay on fund distributions or the redemption of fund shares.
Growth of a Hypothetical $10,000 Investment
Performance Summary - continued
Total Returns through 9/30/22
Average annual without sales charge
| Share Class | Class Inception Date | 1-yr | 5-yr | 10-yr |
| A | 10/13/71 | (16.34)% | 8.54% | 10.87% |
| B | 9/07/93 | (16.97)% | 7.72% | 10.04% |
| C | 1/03/94 | (16.97)% | 7.72% | 10.04% |
| I | 1/02/97 | (16.15)% | 8.81% | 11.14% |
| R1 | 4/01/05 | (16.98)% | 7.72% | 10.03% |
| R2 | 10/31/03 | (16.55)% | 8.26% | 10.59% |
| R3 | 4/01/05 | (16.34)% | 8.53% | 10.86% |
| R4 | 4/01/05 | (16.15)% | 8.80% | 11.14% |
| R6 | 5/01/06 | (16.09)% | 8.88% | 11.23% |
Comparative benchmark(s)
| Standard & Poor’s 500 Stock Index (f) | (15.47)% | 9.24% | 11.70% |
Average annual with sales charge
| | | | |
A
With Initial Sales Charge (5.75%) | (21.15)% | 7.26% | 10.22% |
B
With CDSC (Declining over six years from 4% to 0%) (v) | (20.10)% | 7.43% | 10.04% |
C
With CDSC (1% for 12 months) (v) | (17.75)% | 7.72% | 10.04% |
CDSC – Contingent Deferred Sales Charge.
Class I, R1, R2, R3, R4, and R6 shares do not have a sales charge.
| (f) | Source: FactSet Research Systems Inc. |
| (v) | Assuming redemption at the end of the applicable period. |
Benchmark Definition(s)
Standard & Poor's 500 Stock Index(g) – a market capitalization-weighted index of 500 widely held equity securities, designed to measure broad U.S. equity performance.
It is not possible to invest directly in an index.
| (g) | “Standard & Poor's®” and “S&P®” are registered trademarks of Standard & Poor's Financial Services LLC (“S&P”) and Dow Jones is a registered trademark of Dow Jones Trademark Holdings LLC (“Dow Jones”) and have been licensed for use by S&P Dow Jones Indices LLC and sublicensed for certain purposes by MFS. The S&P 500® is a product of S&P Dow Jones Indices LLC, and has been licensed for use by MFS. MFS's product(s) is not sponsored, endorsed, sold, or promoted by S&P Dow Jones Indices LLC, Dow Jones, S&P, or their respective affiliates, and neither S&P Dow Jones Indices LLC, Dow Jones, S&P, nor their respective affiliates make any representation regarding the advisability of investing in such product(s). |
Notes to Performance Summary
Average annual total return represents the average annual change in value for each share class for the periods presented.
Performance Summary - continued
Performance results reflect any applicable expense subsidies and waivers in effect during the periods shown. Without such subsidies and waivers the fund's performance results would be less favorable. Please see the prospectus and financial statements for complete details.
Performance results do not include adjustments made for financial reporting purposes in accordance with U.S. generally accepted accounting principles and may differ from amounts reported in the financial highlights.
From time to time the fund may receive proceeds from litigation settlements, without which performance would be lower.
Expense Table
Fund expenses borne by the shareholders during the period,
April 1, 2022 through September 30, 2022
As a shareholder of the fund, you incur two types of costs: (1) transaction costs, including sales charges (loads) on certain purchase or redemption payments, and (2) ongoing costs, including management fees; distribution and service (12b-1) fees; and other fund expenses. This example is intended to help you understand your ongoing costs (in dollars) of investing in the fund and to compare these costs with the ongoing costs of investing in other mutual funds.
The example is based on an investment of $1,000 invested at the beginning of the period and held for the entire period April 1, 2022 through September 30, 2022.
Actual Expenses
The first line for each share class in the following table provides information about actual account values and actual expenses. You may use the information in this line, together with the amount you invested, to estimate the expenses that you paid over the period. Simply divide your account value by $1,000 (for example, an $8,600 account value divided by $1,000 = 8.6), then multiply the result by the number in the first line under the heading entitled “Expenses Paid During Period” to estimate the expenses you paid on your account during this period.
Hypothetical Example for Comparison Purposes
The second line for each share class in the following table provides information about hypothetical account values and hypothetical expenses based on the fund’s actual expense ratio and an assumed rate of return of 5% per year before expenses, which is not the fund’s actual return. The hypothetical account values and expenses may not be used to estimate the actual ending account balance or expenses you paid for the period. You may use this information to compare the ongoing costs of investing in the fund and other funds. To do so, compare this 5% hypothetical example with the 5% hypothetical examples that appear in the shareholder reports of the other funds.
Please note that the expenses shown in the table are meant to highlight your ongoing costs only and do not reflect any transactional costs, such as sales charges (loads). Therefore, the second line for each share class in the table is useful in comparing ongoing costs only, and will not help you determine the relative total costs of owning different funds. In addition, if these transactional costs were included, your costs would have been higher.
Expense Table - continued
Share
Class | | Annualized
Expense
Ratio | Beginning
Account Value
4/01/22 | Ending
Account Value
9/30/22 | Expenses
Paid During
Period (p)
4/01/22-9/30/22 |
| A | Actual | 0.80% | $1,000.00 | $823.30 | $3.66 |
| Hypothetical (h) | 0.80% | $1,000.00 | $1,021.06 | $4.05 |
| B | Actual | 1.55% | $1,000.00 | $820.36 | $7.07 |
| Hypothetical (h) | 1.55% | $1,000.00 | $1,017.30 | $7.84 |
| C | Actual | 1.55% | $1,000.00 | $820.27 | $7.07 |
| Hypothetical (h) | 1.55% | $1,000.00 | $1,017.30 | $7.84 |
| I | Actual | 0.55% | $1,000.00 | $824.35 | $2.52 |
| Hypothetical (h) | 0.55% | $1,000.00 | $1,022.31 | $2.79 |
| R1 | Actual | 1.55% | $1,000.00 | $820.25 | $7.07 |
| Hypothetical (h) | 1.55% | $1,000.00 | $1,017.30 | $7.84 |
| R2 | Actual | 1.05% | $1,000.00 | $822.35 | $4.80 |
| Hypothetical (h) | 1.05% | $1,000.00 | $1,019.80 | $5.32 |
| R3 | Actual | 0.80% | $1,000.00 | $823.35 | $3.66 |
| Hypothetical (h) | 0.80% | $1,000.00 | $1,021.06 | $4.05 |
| R4 | Actual | 0.55% | $1,000.00 | $824.30 | $2.52 |
| Hypothetical (h) | 0.55% | $1,000.00 | $1,022.31 | $2.79 |
| R6 | Actual | 0.48% | $1,000.00 | $824.57 | $2.20 |
| Hypothetical (h) | 0.48% | $1,000.00 | $1,022.66 | $2.43 |
| (h) | 5% fund return per year before expenses. |
| (p) | “Expenses Paid During Period” are equal to each class’s annualized expense ratio, as shown above, multiplied by the average account value over the period, multiplied by 183/365 (to reflect the one-half year period). Expenses paid do not include any applicable sales charges (loads). If these transaction costs had been included, your costs would have been higher. |
Notes to Expense Table
Expense ratios include 0.03% of investment related expenses from short sales (See Note 2 of the Notes to Financial Statements).
Portfolio of Investments
9/30/22
The Portfolio of Investments is a complete list of all securities owned by your fund. It is categorized by broad-based asset classes.
| Issuer | | | Shares/Par | Value ($) |
| Common Stocks – 99.4% |
| Aerospace & Defense – 4.3% | |
| General Dynamics Corp. | | 167,549 | $35,548,871 |
| Honeywell International, Inc. | | 438,207 | 73,167,423 |
| Howmet Aerospace, Inc. | | 1,223,333 | 37,837,690 |
| L3Harris Technologies, Inc. | | 178,624 | 37,123,426 |
| Northrop Grumman Corp. | | 101,142 | 47,569,106 |
| Raytheon Technologies Corp. | | 772,576 | 63,243,071 |
| | | | | $294,489,587 |
| Alcoholic Beverages – 0.7% | |
| Constellation Brands, Inc., “A” | | 203,354 | $46,706,347 |
| Apparel Manufacturers – 0.8% | |
| NIKE, Inc., “B” | | 626,566 | $52,080,166 |
| Automotive – 0.3% | |
| Aptiv PLC (a) | | 274,385 | $21,459,651 |
| Biotechnology – 0.2% | |
| Illumina, Inc. (a) | | 88,498 | $16,884,533 |
| Broadcasting – 0.1% | |
| Warner Bros. Discovery, Inc. (a) | | 817,713 | $9,403,699 |
| Brokerage & Asset Managers – 2.1% | |
| Charles Schwab Corp. | | 1,482,888 | $106,575,161 |
| CME Group, Inc. | | 189,273 | 33,525,926 |
| | | | | $140,101,087 |
| Business Services – 4.4% | |
| Accenture PLC, “A” | | 393,585 | $101,269,420 |
| Cognizant Technology Solutions Corp., “A” | | 603,438 | 34,661,479 |
| Equifax, Inc. | | 156,789 | 26,878,338 |
| Fidelity National Information Services, Inc. | | 602,598 | 45,538,331 |
| Fiserv, Inc. (a) | | 678,084 | 63,448,320 |
| Global Payments, Inc. | | 187,495 | 20,258,835 |
| Thoughtworks Holding, Inc. (a) | | 803,395 | 8,427,614 |
| | | | | $300,482,337 |
| Cable TV – 1.0% | |
| Cable One, Inc. | | 26,615 | $22,703,926 |
| Charter Communications, Inc., “A” (a) | | 147,511 | 44,747,462 |
| | | | | $67,451,388 |
Portfolio of Investments – continued
| Issuer | | | Shares/Par | Value ($) |
| Common Stocks – continued |
| Computer Software – 12.2% | |
| Adobe Systems, Inc. (a) | | 189,870 | $52,252,224 |
| Atlassian Corp. PLC, “A” (a) | | 159,311 | 33,549,304 |
| Black Knight, Inc. (a) | | 776,731 | 50,277,798 |
| Cadence Design Systems, Inc. (a) | | 437,536 | 71,506,508 |
| Elastic N.V. (a) | | 287,341 | 20,613,843 |
| Microsoft Corp. (s) | | 2,032,766 | 473,431,201 |
| NICE Systems Ltd., ADR (a) | | 146,167 | 27,514,476 |
| Palo Alto Networks, Inc. (a) | | 100,187 | 16,409,629 |
| Salesforce, Inc. (a) | | 571,017 | 82,135,085 |
| | | | | $827,690,068 |
| Computer Software - Systems – 4.1% | |
| Apple, Inc. (s) | | 1,673,210 | $231,237,622 |
| Constellation Software, Inc. | | 35,840 | 49,869,842 |
| | | | | $281,107,464 |
| Construction – 2.1% | |
| AZEK Co., Inc. (a) | | 1,073,963 | $17,849,265 |
| Masco Corp. | | 803,249 | 37,503,696 |
| Sherwin-Williams Co. | | 206,888 | 42,360,318 |
| Vulcan Materials Co. | | 279,579 | 44,092,404 |
| | | | | $141,805,683 |
| Consumer Products – 1.3% | |
| Colgate-Palmolive Co. | | 719,999 | $50,579,930 |
| Kimberly-Clark Corp. | | 321,158 | 36,143,121 |
| | | | | $86,723,051 |
| Consumer Services – 0.3% | |
| Bright Horizons Family Solutions, Inc. (a) | | 389,830 | $22,473,698 |
| Electrical Equipment – 1.5% | |
| Johnson Controls International PLC | | 1,141,859 | $56,202,300 |
| TE Connectivity Ltd. | | 334,084 | 36,869,510 |
| Vertiv Holdings Co. | | 1,050,742 | 10,213,212 |
| | | | | $103,285,022 |
| Electronics – 2.4% | |
| Applied Materials, Inc. | | 673,314 | $55,164,616 |
| Lam Research Corp. | | 101,432 | 37,124,112 |
| NXP Semiconductors N.V. | | 490,594 | 72,367,521 |
| | | | | $164,656,249 |
Portfolio of Investments – continued
| Issuer | | | Shares/Par | Value ($) |
| Common Stocks – continued |
| Energy - Independent – 4.4% | |
| ConocoPhillips | | 1,185,072 | $121,280,268 |
| Diamondback Energy, Inc. | | 324,634 | 39,105,412 |
| Hess Corp. | | 549,858 | 59,929,023 |
| Pioneer Natural Resources Co. | | 186,909 | 40,471,406 |
| Valero Energy Corp. | | 328,380 | 35,087,403 |
| | | | | $295,873,512 |
| Energy - Renewables – 0.1% | |
| Generac Holdings, Inc. (a) | | 49,462 | $8,811,161 |
| Food & Beverages – 2.5% | |
| Hostess Brands, Inc. (a) | | 782,506 | $18,185,439 |
| Mondelez International, Inc. | | 966,176 | 52,975,430 |
| Oatly Group AB, ADR (a) | | 2,588,947 | 6,808,931 |
| PepsiCo, Inc. | | 544,594 | 88,910,417 |
| | | | | $166,880,217 |
| Gaming & Lodging – 0.4% | |
| Marriott International, Inc., “A” | | 202,911 | $28,435,948 |
| General Merchandise – 1.6% | |
| Dollar General Corp. | | 187,585 | $44,994,138 |
| Dollar Tree, Inc. (a) | | 244,722 | 33,306,664 |
| Five Below, Inc. (a) | | 208,234 | 28,667,575 |
| | | | | $106,968,377 |
| Health Maintenance Organizations – 2.2% | |
| Cigna Corp. | | 350,518 | $97,258,229 |
| Humana, Inc. | | 103,915 | 50,418,519 |
| | | | | $147,676,748 |
| Insurance – 3.1% | |
| Aon PLC | | 278,785 | $74,678,138 |
| Chubb Ltd. | | 306,877 | 55,814,789 |
| Reinsurance Group of America, Inc. | | 304,091 | 38,257,688 |
| Willis Towers Watson PLC | | 194,036 | 38,989,594 |
| | | | | $207,740,209 |
| Internet – 5.2% | |
| Alphabet, Inc., “A” (a)(s) | | 3,028,112 | $289,638,913 |
| Alphabet, Inc., “C” (a) | | 471,067 | 45,293,092 |
| Gartner, Inc. (a) | | 60,813 | 16,826,349 |
| | | | | $351,758,354 |
Portfolio of Investments – continued
| Issuer | | | Shares/Par | Value ($) |
| Common Stocks – continued |
| Leisure & Toys – 0.8% | |
| Electronic Arts, Inc. | | 454,374 | $52,575,616 |
| Machinery & Tools – 2.0% | |
| Ingersoll Rand, Inc. | | 707,680 | $30,614,237 |
| PACCAR, Inc. | | 391,332 | 32,750,575 |
| Regal Rexnord Corp. | | 150,757 | 21,160,252 |
| Roper Technologies, Inc. | | 58,493 | 21,036,423 |
| Wabtec Corp. | | 390,891 | 31,798,983 |
| | | | | $137,360,470 |
| Major Banks – 3.5% | |
| JPMorgan Chase & Co. | | 1,061,909 | $110,969,491 |
| Morgan Stanley | | 960,239 | 75,868,483 |
| PNC Financial Services Group, Inc. | | 357,614 | 53,434,684 |
| | | | | $240,272,658 |
| Medical & Health Technology & Services – 1.6% | |
| ICON PLC (a) | | 232,140 | $42,662,689 |
| McKesson Corp. | | 188,413 | 64,035,926 |
| | | | | $106,698,615 |
| Medical Equipment – 5.7% | |
| Becton, Dickinson and Co. | | 221,955 | $49,458,233 |
| Boston Scientific Corp. (a) | | 1,799,065 | 69,677,787 |
| Danaher Corp. | | 426,812 | 110,241,272 |
| Envista Holdings Corp. (a) | | 897,433 | 29,444,777 |
| Maravai Lifesciences Holdings, Inc., “A” (a) | | 1,163,580 | 29,706,197 |
| Medtronic PLC | | 708,520 | 57,212,990 |
| STERIS PLC | | 231,811 | 38,545,533 |
| | | | | $384,286,789 |
| Natural Gas - Pipeline – 0.2% | |
| Enterprise Products Partners LP | | 692,784 | $16,474,404 |
| Network & Telecom – 0.6% | |
| Equinix, Inc., REIT | | 76,002 | $43,232,978 |
| Other Banks & Diversified Financials – 4.2% | |
| Moody's Corp. | | 125,114 | $30,416,464 |
| Northern Trust Corp. | | 378,212 | 32,359,819 |
| Truist Financial Corp. | | 1,567,163 | 68,234,277 |
| Visa, Inc., “A” | | 858,601 | 152,530,468 |
| | | | | $283,541,028 |
Portfolio of Investments – continued
| Issuer | | | Shares/Par | Value ($) |
| Common Stocks – continued |
| Pharmaceuticals – 6.0% | |
| Eli Lilly & Co. | | 311,974 | $100,876,793 |
| Johnson & Johnson | | 419,818 | 68,581,468 |
| Merck & Co., Inc. | | 1,129,009 | 97,230,255 |
| Vertex Pharmaceuticals, Inc. (a) | | 338,914 | 98,129,160 |
| Zoetis, Inc. | | 292,677 | 43,401,072 |
| | | | | $408,218,748 |
| Railroad & Shipping – 1.3% | |
| Canadian Pacific Railway Ltd. | | 890,263 | $59,398,347 |
| CSX Corp. | | 1,169,447 | 31,154,068 |
| | | | | $90,552,415 |
| Real Estate – 1.1% | |
| Extra Space Storage, Inc., REIT | | 174,392 | $30,119,242 |
| STORE Capital Corp., REIT | | 1,331,632 | 41,720,031 |
| | | | | $71,839,273 |
| Restaurants – 1.4% | |
| Starbucks Corp. | | 775,127 | $65,312,201 |
| Wendy's Co. | | 1,628,774 | 30,441,786 |
| | | | | $95,753,987 |
| Specialty Chemicals – 1.5% | |
| Air Products & Chemicals, Inc. | | 155,716 | $36,239,785 |
| Axalta Coating Systems Ltd. (a) | | 877,631 | 18,482,909 |
| DuPont de Nemours, Inc. | | 944,723 | 47,614,039 |
| | | | | $102,336,733 |
| Specialty Stores – 6.4% | |
| Amazon.com, Inc. (a)(s) | | 2,315,482 | $261,649,466 |
| Home Depot, Inc. | | 315,305 | 87,005,262 |
| Ross Stores, Inc. | | 462,720 | 38,993,414 |
| Target Corp. | | 313,834 | 46,569,827 |
| | | | | $434,217,969 |
| Telecommunications - Wireless – 1.9% | |
| SBA Communications Corp., REIT | | 283,862 | $80,801,318 |
| T-Mobile US, Inc. (a) | | 361,966 | 48,564,978 |
| | | | | $129,366,296 |
| Tobacco – 0.7% | |
| Philip Morris International, Inc. (s) | | 537,333 | $44,604,012 |
Portfolio of Investments – continued
| Issuer | | | Shares/Par | Value ($) |
| Common Stocks – continued |
| Utilities - Electric Power – 3.2% | |
| American Electric Power Co., Inc. | | 351,454 | $30,383,198 |
| Duke Energy Corp. | | 569,969 | 53,018,517 |
| NextEra Energy, Inc. | | 731,432 | 57,351,583 |
| PG&E Corp. (a) | | 2,435,082 | 30,438,525 |
| Southern Co. | | 714,009 | 48,552,612 |
| | | | | $219,744,435 |
| Total Common Stocks (Identified Cost, $5,016,580,130) | | $6,752,020,982 |
| Investment Companies (h) – 0.3% |
| Money Market Funds – 0.3% | |
| MFS Institutional Money Market Portfolio, 2.64% (v) (Identified Cost, $20,050,590) | | | 20,052,215 | $20,054,221 |
| Securities Sold Short – (0.5)% |
| Telecommunications - Wireless – (0.5)% |
| Crown Castle, Inc., REIT (Proceeds Received, $31,963,062) | | | (247,822) | $(35,822,670) |
|
|
| Other Assets, Less Liabilities – 0.8% | | 51,606,395 |
| Net Assets – 100.0% | $6,787,858,928 |
| (a) | Non-income producing security. | | | |
| (h) | An affiliated issuer, which may be considered one in which the fund owns 5% or more of the outstanding voting securities, or a company which is under common control. At period end, the aggregate values of the fund's investments in affiliated issuers and in unaffiliated issuers were $20,054,221 and $6,752,020,982, respectively. | | | |
| (s) | Security or a portion of the security was pledged to cover collateral requirements for securities sold short. | | | |
| (v) | Affiliated issuer that is available only to investment companies managed by MFS. The rate quoted for the MFS Institutional Money Market Portfolio is the annualized seven-day yield of the fund at period end. | | | |
| The following abbreviations are used in this report and are defined: |
| ADR | American Depositary Receipt |
| REIT | Real Estate Investment Trust |
At September 30, 2022, the fund had cash collateral of $224,279 and other liquid securities with an aggregate value of $140,894,749 to cover any collateral or margin obligations for securities sold short. Restricted cash and/or deposits with brokers in the Statement of Assets and Liabilities are comprised of cash collateral.
See Notes to Financial Statements
Financial Statements
Statement of Assets and Liabilities
At 9/30/22
This statement represents your fund’s balance sheet, which details the assets and liabilities comprising the total value of the fund.
| Assets | |
| Investments in unaffiliated issuers, at value (identified cost, $5,016,580,130) | $6,752,020,982 |
| Investments in affiliated issuers, at value (identified cost, $20,050,590) | 20,054,221 |
| Cash | 30,558 |
| Deposits with brokers for | |
| Securities sold short | 224,279 |
| Receivables for | |
| Investments sold | 48,863,100 |
| Fund shares sold | 4,981,915 |
| Interest and dividends | 7,496,472 |
| Other assets | 2,604 |
| Total assets | $6,833,674,131 |
| Liabilities | |
| Payables for | |
| Securities sold short, at value (proceeds received, $31,963,062) | $35,822,670 |
| Fund shares reacquired | 8,030,414 |
| Payable to affiliates | |
| Investment adviser | 160,449 |
| Administrative services fee | 3,502 |
| Shareholder servicing costs | 1,167,448 |
| Distribution and service fees | 19,741 |
| Payable for independent Trustees' compensation | 20,428 |
| Accrued expenses and other liabilities | 590,551 |
| Total liabilities | $45,815,203 |
| Net assets | $6,787,858,928 |
| Net assets consist of | |
| Paid-in capital | $4,663,372,034 |
| Total distributable earnings (loss) | 2,124,486,894 |
| Net assets | $6,787,858,928 |
| Shares of beneficial interest outstanding | 143,770,376 |
Statement of Assets and Liabilities – continued
| | Net assets | Shares
outstanding | Net asset value
per share (a) |
| Class A | $1,198,757,059 | 25,780,852 | $46.50 |
| Class B | 7,126,373 | 175,153 | 40.69 |
| Class C | 47,651,169 | 1,182,512 | 40.30 |
| Class I | 3,665,406,378 | 76,343,393 | 48.01 |
| Class R1 | 2,933,024 | 74,479 | 39.38 |
| Class R2 | 32,035,659 | 720,946 | 44.44 |
| Class R3 | 34,132,979 | 741,242 | 46.05 |
| Class R4 | 11,619,575 | 249,642 | 46.55 |
| Class R6 | 1,788,196,712 | 38,502,157 | 46.44 |
| (a) | Maximum offering price per share was equal to the net asset value per share for all share classes, except for Class A, for which the maximum offering price per share was $49.34 [100 / 94.25 x $46.50]. On sales of $50,000 or more, the maximum offering price of Class A shares is reduced. A contingent deferred sales charge may be imposed on redemptions of Class A, Class B, and Class C shares. Redemption price per share was equal to the net asset value per share for Classes I, R1, R2, R3, R4, and R6. |
See Notes to Financial Statements
Financial Statements
Statement of Operations
Year ended 9/30/22
This statement describes how much your fund earned in investment income and accrued in expenses. It also describes any gains and/or losses generated by fund operations.
| Net investment income (loss) | |
| Income | |
| Dividends | $106,939,674 |
| Dividends from affiliated issuers | 337,009 |
| Other | 133,201 |
| Income on securities loaned | 23,547 |
| Foreign taxes withheld | (349,998) |
| Total investment income | $107,083,433 |
| Expenses | |
| Management fee | $34,263,592 |
| Distribution and service fees | 4,685,560 |
| Shareholder servicing costs | 4,700,343 |
| Administrative services fee | 649,368 |
| Independent Trustees' compensation | 107,788 |
| Custodian fee | 279,426 |
| Shareholder communications | 170,507 |
| Audit and tax fees | 65,582 |
| Legal fees | 36,188 |
| Dividend and interest expense on securities sold short | 1,826,365 |
| Interest expense and fees | 34,445 |
| Miscellaneous | 282,758 |
| Total expenses | $47,101,922 |
| Fees paid indirectly | (366) |
| Reduction of expenses by distributor | (11,871) |
| Net expenses | $47,089,685 |
| Net investment income (loss) | $59,993,748 |
Statement of Operations – continued
| Realized and unrealized gain (loss) |
| Realized gain (loss) (identified cost basis) | |
| Unaffiliated issuers | $415,003,601 |
| Affiliated issuers | (96) |
| Foreign currency | (1,034) |
| Net realized gain (loss) | $415,002,471 |
| Change in unrealized appreciation or depreciation | |
| Unaffiliated issuers | $(1,803,942,433) |
| Affiliated issuers | 3,631 |
| Securities sold short | 6,691,293 |
| Translation of assets and liabilities in foreign currencies | (1,218) |
| Net unrealized gain (loss) | $(1,797,248,727) |
| Net realized and unrealized gain (loss) | $(1,382,246,256) |
| Change in net assets from operations | $(1,322,252,508) |
See Notes to Financial Statements
Financial Statements
Statements of Changes in Net Assets
These statements describe the increases and/or decreases in net assets resulting from operations, any distributions, and any shareholder transactions.
| | Year ended |
| | 9/30/22 | 9/30/21 |
| Change in net assets | | |
| From operations | | |
| Net investment income (loss) | $59,993,748 | $44,576,437 |
| Net realized gain (loss) | 415,002,471 | 427,710,229 |
| Net unrealized gain (loss) | (1,797,248,727) | 1,307,473,496 |
| Change in net assets from operations | $(1,322,252,508) | $1,779,760,162 |
| Total distributions to shareholders | $(482,432,724) | $(353,381,538) |
| Change in net assets from fund share transactions | $110,267,716 | $478,783,631 |
| Total change in net assets | $(1,694,417,516) | $1,905,162,255 |
| Net assets | | |
| At beginning of period | 8,482,276,444 | 6,577,114,189 |
| At end of period | $6,787,858,928 | $8,482,276,444 |
See Notes to Financial Statements
Financial Statements
Financial Highlights
The financial highlights table is intended to help you understand the fund's financial performance for the past 5 years. Certain information reflects financial results for a single fund share. The total returns in the table represent the rate that an investor would have earned (or lost) on an investment in the fund share class (assuming reinvestment of all distributions) held for the entire period.
| Class A | Year ended |
| | 9/30/22 | 9/30/21 | 9/30/20 | 9/30/19 | 9/30/18 |
| Net asset value, beginning of period | $58.66 | $48.66 | $44.50 | $46.73 | $43.26 |
| Income (loss) from investment operations |
| Net investment income (loss) (d) | $0.29 | $0.20 | $0.33 | $0.37 | $0.35 |
| Net realized and unrealized gain (loss) | (9.17) | 12.41 | 5.52 | 1.90 | 6.83 |
| Total from investment operations | $(8.88) | $12.61 | $5.85 | $2.27 | $7.18 |
| Less distributions declared to shareholders |
| From net investment income | $(0.19) | $(0.28) | $(0.35) | $(0.28) | $(0.46) |
| From net realized gain | (3.09) | (2.33) | (1.34) | (4.22) | (3.25) |
| Total distributions declared to shareholders | $(3.28) | $(2.61) | $(1.69) | $(4.50) | $(3.71) |
| Net asset value, end of period (x) | $46.50 | $58.66 | $48.66 | $44.50 | $46.73 |
| Total return (%) (r)(s)(t)(x) | (16.34) | 26.85 | 13.46 | 6.46 | 17.51 |
Ratios (%) (to average net assets)
and Supplemental data: |
| Expenses before expense reductions (f) | 0.79 | 0.78 | 0.79 | 0.80 | 0.82 |
| Expenses after expense reductions (f) | 0.78 | 0.78 | 0.78 | 0.79 | 0.81 |
| Net investment income (loss) | 0.52 | 0.37 | 0.72 | 0.89 | 0.81 |
| Portfolio turnover | 17 | 26 | 36 | 32 | 33 |
| Net assets at end of period (000 omitted) | $1,198,757 | $1,536,575 | $1,290,401 | $1,452,740 | $1,456,897 |
| Supplemental Ratios (%): |
| Ratios of expenses to average net assets after expense reductions excluding short sale expenses and interest expense and fees (f) | 0.76 | 0.76 | 0.77 | 0.77 | 0.80 |
See Notes to Financial Statements
Financial Highlights – continued
| Class B | Year ended |
| | 9/30/22 | 9/30/21 | 9/30/20 | 9/30/19 | 9/30/18 |
| Net asset value, beginning of period | $51.91 | $43.39 | $39.84 | $42.40 | $39.55 |
| Income (loss) from investment operations |
| Net investment income (loss) (d) | $(0.12) | $(0.19) | $(0.01) | $0.05 | $0.03 |
| Net realized and unrealized gain (loss) | (8.01) | 11.04 | 4.93 | 1.66 | 6.21 |
| Total from investment operations | $(8.13) | $10.85 | $4.92 | $1.71 | $6.24 |
| Less distributions declared to shareholders |
| From net investment income | $— | $— | $(0.03) | $(0.05) | $(0.14) |
| From net realized gain | (3.09) | (2.33) | (1.34) | (4.22) | (3.25) |
| Total distributions declared to shareholders | $(3.09) | $(2.33) | $(1.37) | $(4.27) | $(3.39) |
| Net asset value, end of period (x) | $40.69 | $51.91 | $43.39 | $39.84 | $42.40 |
| Total return (%) (r)(s)(t)(x) | (16.97) | 25.91 | 12.61 | 5.63 | 16.65 |
Ratios (%) (to average net assets)
and Supplemental data: |
| Expenses before expense reductions (f) | 1.53 | 1.53 | 1.54 | 1.55 | 1.57 |
| Expenses after expense reductions (f) | 1.53 | 1.53 | 1.54 | 1.54 | 1.56 |
| Net investment income (loss) | (0.25) | (0.39) | (0.03) | 0.14 | 0.06 |
| Portfolio turnover | 17 | 26 | 36 | 32 | 33 |
| Net assets at end of period (000 omitted) | $7,126 | $12,047 | $13,373 | $17,765 | $21,445 |
| Supplemental Ratios (%): |
| Ratios of expenses to average net assets after expense reductions excluding short sale expenses and interest expense and fees (f) | 1.51 | 1.51 | 1.52 | 1.52 | 1.55 |
See Notes to Financial Statements
Financial Highlights – continued
| Class C | Year ended |
| | 9/30/22 | 9/30/21 | 9/30/20 | 9/30/19 | 9/30/18 |
| Net asset value, beginning of period | $51.44 | $43.02 | $39.53 | $42.05 | $39.27 |
| Income (loss) from investment operations |
| Net investment income (loss) (d) | $(0.11) | $(0.19) | $(0.01) | $0.05 | $0.01 |
| Net realized and unrealized gain (loss) | (7.94) | 10.94 | 4.90 | 1.65 | 6.17 |
| Total from investment operations | $(8.05) | $10.75 | $4.89 | $1.70 | $6.18 |
| Less distributions declared to shareholders |
| From net investment income | $— | $— | $(0.06) | $— | $(0.15) |
| From net realized gain | (3.09) | (2.33) | (1.34) | (4.22) | (3.25) |
| Total distributions declared to shareholders | $(3.09) | $(2.33) | $(1.40) | $(4.22) | $(3.40) |
| Net asset value, end of period (x) | $40.30 | $51.44 | $43.02 | $39.53 | $42.05 |
| Total return (%) (r)(s)(t)(x) | (16.97) | 25.90 | 12.62 | 5.64 | 16.62 |
Ratios (%) (to average net assets)
and Supplemental data: |
| Expenses before expense reductions (f) | 1.54 | 1.53 | 1.55 | 1.55 | 1.57 |
| Expenses after expense reductions (f) | 1.54 | 1.53 | 1.54 | 1.55 | 1.56 |
| Net investment income (loss) | (0.24) | (0.38) | (0.03) | 0.13 | 0.03 |
| Portfolio turnover | 17 | 26 | 36 | 32 | 33 |
| Net assets at end of period (000 omitted) | $47,651 | $68,140 | $70,785 | $71,371 | $78,122 |
| Supplemental Ratios (%): |
| Ratios of expenses to average net assets after expense reductions excluding short sale expenses and interest expense and fees (f) | 1.51 | 1.51 | 1.53 | 1.53 | 1.55 |
See Notes to Financial Statements
Financial Highlights – continued
| Class I | Year ended |
| | 9/30/22 | 9/30/21 | 9/30/20 | 9/30/19 | 9/30/18 |
| Net asset value, beginning of period | $60.47 | $50.09 | $45.74 | $48.03 | $44.35 |
| Income (loss) from investment operations |
| Net investment income (loss) (d) | $0.44 | $0.35 | $0.45 | $0.49 | $0.50 |
| Net realized and unrealized gain (loss) | (9.47) | 12.77 | 5.70 | 1.93 | 6.99 |
| Total from investment operations | $(9.03) | $13.12 | $6.15 | $2.42 | $7.49 |
| Less distributions declared to shareholders |
| From net investment income | $(0.34) | $(0.41) | $(0.46) | $(0.49) | $(0.56) |
| From net realized gain | (3.09) | (2.33) | (1.34) | (4.22) | (3.25) |
| Total distributions declared to shareholders | $(3.43) | $(2.74) | $(1.80) | $(4.71) | $(3.81) |
| Net asset value, end of period (x) | $48.01 | $60.47 | $50.09 | $45.74 | $48.03 |
| Total return (%) (r)(s)(t)(x) | (16.15) | 27.16 | 13.76 | 6.68 | 17.83 |
Ratios (%) (to average net assets)
and Supplemental data: |
| Expenses before expense reductions (f) | 0.54 | 0.53 | 0.55 | 0.55 | 0.57 |
| Expenses after expense reductions (f) | N/A | N/A | N/A | N/A | N/A |
| Net investment income (loss) | 0.77 | 0.62 | 0.97 | 1.13 | 1.09 |
| Portfolio turnover | 17 | 26 | 36 | 32 | 33 |
| Net assets at end of period (000 omitted) | $3,665,406 | $4,577,919 | $3,492,027 | $2,835,696 | $2,752,743 |
| Supplemental Ratios (%): |
| Ratios of expenses to average net assets after expense reductions excluding short sale expenses and interest expense and fees (f) | 0.51 | 0.51 | 0.53 | 0.53 | 0.56 |
See Notes to Financial Statements
Financial Highlights – continued
| Class R1 | Year ended |
| | 9/30/22 | 9/30/21 | 9/30/20 | 9/30/19 | 9/30/18 |
| Net asset value, beginning of period | $50.34 | $42.14 | $38.72 | $41.37 | $38.69 |
| Income (loss) from investment operations |
| Net investment income (loss) (d) | $(0.11) | $(0.18) | $(0.02) | $0.04 | $0.03 |
| Net realized and unrealized gain (loss) | (7.76) | 10.71 | 4.81 | 1.60 | 6.06 |
| Total from investment operations | $(7.87) | $10.53 | $4.79 | $1.64 | $6.09 |
| Less distributions declared to shareholders |
| From net investment income | $— | $— | $(0.03) | $(0.07) | $(0.16) |
| From net realized gain | (3.09) | (2.33) | (1.34) | (4.22) | (3.25) |
| Total distributions declared to shareholders | $(3.09) | $(2.33) | $(1.37) | $(4.29) | $(3.41) |
| Net asset value, end of period (x) | $39.38 | $50.34 | $42.14 | $38.72 | $41.37 |
| Total return (%) (r)(s)(t)(x) | (16.98) | 25.92 | 12.62 | 5.62 | 16.64 |
Ratios (%) (to average net assets)
and Supplemental data: |
| Expenses before expense reductions (f) | 1.54 | 1.53 | 1.54 | 1.55 | 1.57 |
| Expenses after expense reductions (f) | 1.54 | 1.53 | N/A | N/A | N/A |
| Net investment income (loss) | (0.23) | (0.39) | (0.04) | 0.12 | 0.07 |
| Portfolio turnover | 17 | 26 | 36 | 32 | 33 |
| Net assets at end of period (000 omitted) | $2,933 | $3,416 | $3,596 | $4,187 | $4,947 |
| Supplemental Ratios (%): |
| Ratios of expenses to average net assets after expense reductions excluding short sale expenses and interest expense and fees (f) | 1.51 | 1.51 | 1.53 | 1.53 | 1.56 |
See Notes to Financial Statements
Financial Highlights – continued
| Class R2 | Year ended |
| | 9/30/22 | 9/30/21 | 9/30/20 | 9/30/19 | 9/30/18 |
| Net asset value, beginning of period | $56.29 | $46.78 | $42.85 | $45.23 | $41.97 |
| Income (loss) from investment operations |
| Net investment income (loss) (d) | $0.14 | $0.06 | $0.20 | $0.25 | $0.24 |
| Net realized and unrealized gain (loss) | (8.76) | 11.92 | 5.33 | 1.82 | 6.60 |
| Total from investment operations | $(8.62) | $11.98 | $5.53 | $2.07 | $6.84 |
| Less distributions declared to shareholders |
| From net investment income | $(0.14) | $(0.14) | $(0.26) | $(0.23) | $(0.33) |
| From net realized gain | (3.09) | (2.33) | (1.34) | (4.22) | (3.25) |
| Total distributions declared to shareholders | $(3.23) | $(2.47) | $(1.60) | $(4.45) | $(3.58) |
| Net asset value, end of period (x) | $44.44 | $56.29 | $46.78 | $42.85 | $45.23 |
| Total return (%) (r)(s)(t)(x) | (16.55) | 26.53 | 13.19 | 6.18 | 17.21 |
Ratios (%) (to average net assets)
and Supplemental data: |
| Expenses before expense reductions (f) | 1.04 | 1.03 | 1.04 | 1.05 | 1.07 |
| Expenses after expense reductions (f) | N/A | N/A | N/A | N/A | N/A |
| Net investment income (loss) | 0.27 | 0.12 | 0.47 | 0.63 | 0.56 |
| Portfolio turnover | 17 | 26 | 36 | 32 | 33 |
| Net assets at end of period (000 omitted) | $32,036 | $43,862 | $19,726 | $21,738 | $21,137 |
| Supplemental Ratios (%): |
| Ratios of expenses to average net assets after expense reductions excluding short sale expenses and interest expense and fees (f) | 1.01 | 1.02 | 1.03 | 1.03 | 1.06 |
See Notes to Financial Statements
Financial Highlights – continued
| Class R3 | Year ended |
| | 9/30/22 | 9/30/21 | 9/30/20 | 9/30/19 | 9/30/18 |
| Net asset value, beginning of period | $58.12 | $48.23 | $44.12 | $46.46 | $43.02 |
| Income (loss) from investment operations |
| Net investment income (loss) (d) | $0.28 | $0.20 | $0.32 | $0.37 | $0.36 |
| Net realized and unrealized gain (loss) | (9.08) | 12.29 | 5.48 | 1.86 | 6.77 |
| Total from investment operations | $(8.80) | $12.49 | $5.80 | $2.23 | $7.13 |
| Less distributions declared to shareholders |
| From net investment income | $(0.18) | $(0.27) | $(0.35) | $(0.35) | $(0.44) |
| From net realized gain | (3.09) | (2.33) | (1.34) | (4.22) | (3.25) |
| Total distributions declared to shareholders | $(3.27) | $(2.60) | $(1.69) | $(4.57) | $(3.69) |
| Net asset value, end of period (x) | $46.05 | $58.12 | $48.23 | $44.12 | $46.46 |
| Total return (%) (r)(s)(t)(x) | (16.34) | 26.85 | 13.46 | 6.44 | 17.50 |
Ratios (%) (to average net assets)
and Supplemental data: |
| Expenses before expense reductions (f) | 0.79 | 0.78 | 0.79 | 0.80 | 0.82 |
| Expenses after expense reductions (f) | N/A | N/A | N/A | N/A | N/A |
| Net investment income (loss) | 0.52 | 0.37 | 0.72 | 0.88 | 0.81 |
| Portfolio turnover | 17 | 26 | 36 | 32 | 33 |
| Net assets at end of period (000 omitted) | $34,133 | $43,493 | $40,434 | $44,941 | $45,930 |
| Supplemental Ratios (%): |
| Ratios of expenses to average net assets after expense reductions excluding short sale expenses and interest expense and fees (f) | 0.76 | 0.76 | 0.78 | 0.78 | 0.81 |
See Notes to Financial Statements
Financial Highlights – continued
| Class R4 | Year ended |
| | 9/30/22 | 9/30/21 | 9/30/20 | 9/30/19 | 9/30/18 |
| Net asset value, beginning of period | $58.72 | $48.71 | $44.53 | $46.88 | $43.31 |
| Income (loss) from investment operations |
| Net investment income (loss) (d) | $0.42 | $0.34 | $0.43 | $0.47 | $0.43 |
| Net realized and unrealized gain (loss) | (9.16) | 12.40 | 5.55 | 1.88 | 6.88 |
| Total from investment operations | $(8.74) | $12.74 | $5.98 | $2.35 | $7.31 |
| Less distributions declared to shareholders |
| From net investment income | $(0.34) | $(0.40) | $(0.46) | $(0.48) | $(0.49) |
| From net realized gain | (3.09) | (2.33) | (1.34) | (4.22) | (3.25) |
| Total distributions declared to shareholders | $(3.43) | $(2.73) | $(1.80) | $(4.70) | $(3.74) |
| Net asset value, end of period (x) | $46.55 | $58.72 | $48.71 | $44.53 | $46.88 |
| Total return (%) (r)(s)(t)(x) | (16.13) | 27.16 | 13.76 | 6.69 | 17.84 |
Ratios (%) (to average net assets)
and Supplemental data: |
| Expenses before expense reductions (f) | 0.53 | 0.53 | 0.54 | 0.55 | 0.57 |
| Expenses after expense reductions (f) | N/A | N/A | N/A | N/A | N/A |
| Net investment income (loss) | 0.76 | 0.62 | 0.97 | 1.13 | 0.97 |
| Portfolio turnover | 17 | 26 | 36 | 32 | 33 |
| Net assets at end of period (000 omitted) | $11,620 | $16,260 | $14,246 | $16,869 | $17,148 |
| Supplemental Ratios (%): |
| Ratios of expenses to average net assets after expense reductions excluding short sale expenses and interest expense and fees (f) | 0.51 | 0.51 | 0.53 | 0.53 | 0.56 |
See Notes to Financial Statements
Financial Highlights – continued
| Class R6 | Year ended |
| | 9/30/22 | 9/30/21 | 9/30/20 | 9/30/19 | 9/30/18 |
| Net asset value, beginning of period | $58.60 | $48.62 | $44.44 | $46.82 | $43.33 |
| Income (loss) from investment operations |
| Net investment income (loss) (d) | $0.46 | $0.38 | $0.47 | $0.50 | $0.51 |
| Net realized and unrealized gain (loss) | (9.15) | 12.37 | 5.53 | 1.86 | 6.83 |
| Total from investment operations | $(8.69) | $12.75 | $6.00 | $2.36 | $7.34 |
| Less distributions declared to shareholders |
| From net investment income | $(0.38) | $(0.44) | $(0.48) | $(0.52) | $(0.60) |
| From net realized gain | (3.09) | (2.33) | (1.34) | (4.22) | (3.25) |
| Total distributions declared to shareholders | $(3.47) | $(2.77) | $(1.82) | $(4.74) | $(3.85) |
| Net asset value, end of period (x) | $46.44 | $58.60 | $48.62 | $44.44 | $46.82 |
| Total return (%) (r)(s)(t)(x) | (16.09) | 27.25 | 13.85 | 6.75 | 17.92 |
Ratios (%) (to average net assets)
and Supplemental data: |
| Expenses before expense reductions (f) | 0.47 | 0.46 | 0.48 | 0.48 | 0.48 |
| Expenses after expense reductions (f) | N/A | N/A | N/A | N/A | N/A |
| Net investment income (loss) | 0.84 | 0.68 | 1.04 | 1.19 | 1.15 |
| Portfolio turnover | 17 | 26 | 36 | 32 | 33 |
| Net assets at end of period (000 omitted) | $1,788,197 | $2,180,565 | $1,632,527 | $1,433,024 | $1,441,866 |
| Supplemental Ratios (%): |
| Ratios of expenses to average net assets after expense reductions excluding short sale expenses and interest expense and fees (f) | 0.45 | 0.45 | 0.46 | 0.46 | 0.47 |
| (d) | Per share data is based on average shares outstanding. |
| (f) | Ratios do not reflect reductions from fees paid indirectly, if applicable. See Note 2 in the Notes to Financial Statements for additional information. |
| (r) | Certain expenses have been reduced without which performance would have been lower. |
| (s) | From time to time the fund may receive proceeds from litigation settlements, without which performance would be lower. |
| (t) | Total returns do not include any applicable sales charges. |
| (x) | The net asset values and total returns have been calculated on net assets which include adjustments made in accordance with U.S. generally accepted accounting principles required at period end for financial reporting purposes. |
See Notes to Financial Statements
Notes to Financial Statements
(1) Business and Organization
MFS Research Fund (the fund) is a diversified series of MFS Series Trust V (the trust). The trust is organized as a Massachusetts business trust and is registered under the Investment Company Act of 1940, as amended, as an open-end management investment company.
The fund is an investment company and accordingly follows the investment company accounting and reporting guidance of the Financial Accounting Standards Board (FASB) Accounting Standards Codification Topic 946 Financial Services - Investment Companies.
(2) Significant Accounting Policies
General — The preparation of financial statements in conformity with U.S. generally accepted accounting principles requires management to make estimates and assumptions that affect the reported amounts of assets and liabilities, and disclosure of contingent assets and liabilities at the date of the financial statements and the reported amounts of increases and decreases in net assets from operations during the reporting period. Actual results could differ from those estimates. In the preparation of these financial statements, management has evaluated subsequent events occurring after the date of the fund’s Statement of Assets and Liabilities through the date that the financial statements were issued.
In June 2022, the FASB issued Accounting Standards Update 2022-03, Fair Value Measurement (Topic 820) – Fair Value Measurement of Equity Securities Subject to Contractual Sale Restrictions (“ASU 2022-03”), which affects all entities that have investments in equity securities measured at fair value that are subject to contractual sale restrictions. ASU 2022-03 clarifies that a contractual restriction on the sale of an equity security is a characteristic of the reporting entity holding the equity security rather than a characteristic of the asset and, therefore, is not considered in measuring the fair value of the equity security. The fund decided to early adopt ASU 2022-03 effective as of June 30, 2022 as the guidance in ASU 2022-03 was consistent with the fund’s existing practices for fair value measurement.
Balance Sheet Offsetting — The fund's accounting policy with respect to balance sheet offsetting is that, absent an event of default by the counterparty or a termination of the agreement, the International Swaps and Derivatives Association (ISDA) Master Agreement, or similar agreement, does not result in an offset of reported amounts of financial assets and financial liabilities in the Statement of Assets and Liabilities across transactions between the fund and the applicable counterparty. The fund's right to setoff may be restricted or prohibited by the bankruptcy or insolvency laws of the particular jurisdiction to which a specific master netting agreement counterparty is subject. Balance sheet offsetting disclosures, to the extent applicable to the fund, have been included in the fund’s Significant Accounting Policies note under the captions for each of the fund’s in-scope financial instruments and transactions.
Investment Valuations — Subject to its oversight, the fund's Board of Trustees has delegated primary responsibility for determining or causing to be determined the value of the fund’s investments to MFS as the fund's adviser, pursuant to the fund’s valuation policy and procedures which have been adopted by the adviser and approved by the Board. Effective September 8, 2022, and in accordance with Rule 2a-5 under the Investment Company Act of 1940, the Board of Trustees designated the adviser as the
Notes to Financial Statements - continued
“valuation designee” of the fund. If the adviser, as valuation designee, determines that reliable market quotations are not readily available for an investment, the investment is valued at fair value as determined in good faith by the adviser in accordance with the adviser’s fair valuation policy and procedures.
Under the fund's valuation policy and procedures, equity securities, including restricted equity securities and equity securities sold short, are generally valued at the last sale or official closing price on their primary market or exchange as provided by a third-party pricing service. Equity securities, for which there were no sales reported that day, are generally valued at the last quoted daily bid quotation on their primary market or exchange as provided by a third-party pricing service. Equity securities sold short, for which there were no sales reported that day, are generally valued at the last quoted daily ask quotation on their primary market or exchange as provided by a third-party pricing service. Short-term instruments with a maturity at issuance of 60 days or less may be valued at amortized cost, which approximates market value. Open-end investment companies are generally valued at net asset value per share. The values of foreign securities and other assets and liabilities expressed in foreign currencies are converted to U.S. dollars using the mean of bid and asked prices for rates provided by a third-party pricing service.
Under the fund’s valuation policy and procedures, market quotations are not considered to be readily available for debt instruments, floating rate loans, and many types of derivatives. These investments are generally valued at fair value based on information from third-party pricing services or otherwise determined by the adviser in accordance with the adviser’s fair valuation policy and procedures. Securities and other assets generally valued on the basis of information from a third-party pricing service may also be valued at a broker/dealer bid quotation. In determining values, third-party pricing services can utilize both transaction data and market information such as yield, quality, coupon rate, maturity, type of issue, trading characteristics, spreads and other market data. An investment may also be valued at fair value if the adviser determines that the investment’s value has been materially affected by events occurring after the close of the exchange or market on which the investment is principally traded (such as foreign exchange or market) and prior to the determination of the fund’s net asset value, or after the halt of trading of a specific security where trading does not resume prior to the close of the exchange or market on which the security is principally traded. Events that occur after foreign markets close (such as developments in foreign markets and significant movements in the U.S. markets) and prior to the determination of the fund’s net asset value may be deemed to have a material effect on the value of securities traded in foreign markets. Accordingly, the fund’s foreign equity securities may often be valued at fair value. The adviser generally relies on third-party pricing services or other information (such as the correlation with price movements of similar securities in the same or other markets; the type, cost and investment characteristics of the security; the business and financial condition of the issuer; and trading and other market data) to assist in determining whether to fair value and at what value to fair value an investment. The value of an investment for purposes of calculating the fund’s net asset value can differ depending on the source and method used to determine value. When fair valuation is used, the value of an investment used to determine the fund’s net asset value may differ from quoted or published prices for the same investment. There can be no assurance that the fund could obtain the fair value assigned to an investment if it were to sell the investment at the same time at which the fund determines its net asset value per share.
Notes to Financial Statements - continued
Various inputs are used in determining the value of the fund's assets or liabilities. These inputs are categorized into three broad levels. In certain cases, the inputs used to measure fair value may fall into different levels of the fair value hierarchy. In such cases, an investment's level within the fair value hierarchy is based on the lowest level of input that is significant to the fair value measurement. The fund's assessment of the significance of a particular input to the fair value measurement in its entirety requires judgment, and considers factors specific to the investment. Level 1 includes unadjusted quoted prices in active markets for identical assets or liabilities. Level 2 includes other significant observable market-based inputs (including quoted prices for similar securities, interest rates, prepayment speed, and credit risk). Level 3 includes significant unobservable inputs, which may include the adviser's own assumptions in determining the fair value of investments. The following is a summary of the levels used as of September 30, 2022 in valuing the fund's assets and liabilities:
| Financial Instruments | Level 1 | Level 2 | Level 3 | Total |
| Equity Securities | $6,752,020,982 | $— | $— | $6,752,020,982 |
| Mutual Funds | 20,054,221 | — | — | 20,054,221 |
| Total | $6,772,075,203 | $— | $— | $6,772,075,203 |
| Securities Sold Short | $(35,822,670) | $— | $— | $(35,822,670) |
For further information regarding security characteristics, see the Portfolio of Investments.
Foreign Currency Translation — Purchases and sales of foreign investments, income, and expenses are converted into U.S. dollars based upon currency exchange rates prevailing on the respective dates of such transactions or on the reporting date for foreign denominated receivables and payables. Gains and losses attributable to foreign currency exchange rates on sales of securities are recorded for financial statement purposes as net realized gains and losses on investments. Gains and losses attributable to foreign exchange rate movements on receivables, payables, income and expenses are recorded for financial statement purposes as foreign currency transaction gains and losses. That portion of both realized and unrealized gains and losses on investments that results from fluctuations in foreign currency exchange rates is not separately disclosed.
Short Sales — The fund entered into short sales whereby it sells a security it does not own in anticipation of a decline in the value of that security. The fund will realize a gain if the security price decreases and a loss if the security price increases between the date of the short sale and the date on which the fund replaces the borrowed security. Losses from short sales can exceed the proceeds of the security sold; and they can also exceed the potential loss from an ordinary buy and sell transaction. The amount of any premium, dividends, or interest the fund may be required to pay in connection with a short sale will be recognized as a fund expense. During the year ended September 30, 2022, this expense amounted to $1,826,365. The fund segregates cash or marketable securities in an amount that, when combined with the amount of proceeds from the short sale deposited with the broker, at least equals the current market value of the security sold short.
Security Loans — Under its Securities Lending Agency Agreement with the fund, JPMorgan Chase and Co., as lending agent, loans the securities of the fund to certain qualified institutions (the “Borrowers”) approved by the fund. Security loans can be terminated at the discretion of either the lending agent or the fund and the related
Notes to Financial Statements - continued
securities must be returned within the earlier of the standard trade settlement period for such securities or within three business days. The loans are collateralized by cash and/or U.S. Treasury and federal agency obligations in an amount typically at least equal to the market value of the securities loaned. On loans collateralized by cash, the cash collateral is invested in a money market fund. The market value of the loaned securities is determined at the close of business of the fund and any additional required collateral is delivered to the fund on the next business day. The lending agent provides the fund with indemnification against Borrower default. In the event of Borrower default, the lending agent will, for the benefit of the fund, either purchase securities identical to those loaned or, when such purchase is commercially impracticable, pay the fund the market value of the loaned securities. In return, the lending agent assumes the fund's rights to the related collateral. If the collateral value is less than the cost to purchase identical securities, the lending agent is responsible for the shortfall, but only to the extent that such shortfall is not due to a decline in collateral value resulting from collateral reinvestment for which the fund bears the risk of loss. A portion of the income generated upon investment of the collateral is remitted to the Borrowers, and the remainder is allocated between the fund and the lending agent. On loans collateralized by U.S. Treasury and/or federal agency obligations, a fee is received from the Borrower, and is allocated between the fund and the lending agent. Income from securities lending is separately reported in the Statement of Operations. The dividend and interest income earned on the securities loaned is accounted for in the same manner as other dividend and interest income. At September 30, 2022, there were no securities on loan or collateral outstanding.
Indemnifications — Under the fund's organizational documents, its officers and Trustees may be indemnified against certain liabilities and expenses arising out of the performance of their duties to the fund. Additionally, in the normal course of business, the fund enters into agreements with service providers that may contain indemnification clauses. The fund's maximum exposure under these agreements is unknown as this would involve future claims that may be made against the fund that have not yet occurred.
Investment Transactions and Income — Investment transactions are recorded on the trade date. Dividends received in cash are recorded on the ex-dividend date. Certain dividends from foreign securities will be recorded when the fund is informed of the dividend if such information is obtained subsequent to the ex-dividend date. Dividend payments received in additional securities are recorded on the ex-dividend date in an amount equal to the value of the security on such date. In determining the net gain or loss on securities sold, the cost of securities is determined on the identified cost basis.
The fund may receive proceeds from litigation settlements. Any proceeds received from litigation involving portfolio holdings are reflected in the Statement of Operations in realized gain/loss if the security has been disposed of by the fund or in unrealized gain/loss if the security is still held by the fund. Any other proceeds from litigation not related to portfolio holdings are reflected as other income in the Statement of Operations.
Fees Paid Indirectly — The fund's custody fee may be reduced by a credit earned under an arrangement that measures the value of U.S. dollars deposited with the custodian by the fund. The amount of the credit, for the year ended September 30, 2022, is shown as a reduction of total expenses in the Statement of Operations.
Notes to Financial Statements - continued
Tax Matters and Distributions — The fund intends to qualify as a regulated investment company, as defined under Subchapter M of the Internal Revenue Code, and to distribute all of its taxable income, including realized capital gains. As a result, no provision for federal income tax is required. The fund’s federal tax returns, when filed, will remain subject to examination by the Internal Revenue Service for a three year period. Management has analyzed the fund’s tax positions taken on federal and state tax returns for all open tax years and does not believe that there are any uncertain tax positions that require recognition of a tax liability. Foreign taxes, if any, have been accrued by the fund in the accompanying financial statements in accordance with the applicable foreign tax law. Foreign income taxes may be withheld by certain countries in which the fund invests. Additionally, capital gains realized by the fund on securities issued in or by certain foreign countries may be subject to capital gains tax imposed by those countries.
Distributions to shareholders are recorded on the ex-dividend date. Income and capital gain distributions are determined in accordance with income tax regulations, which may differ from U.S. generally accepted accounting principles. Certain capital accounts in the financial statements are periodically adjusted for permanent differences in order to reflect their tax character. These adjustments have no impact on net assets or net asset value per share. Temporary differences which arise from recognizing certain items of income, expense, gain or loss in different periods for financial statement and tax purposes will reverse at some time in the future.
Book/tax differences primarily relate to wash sale loss deferrals, treating a portion of the proceeds from redemptions as a distribution for tax purposes, and partnership adjustments.
The tax character of distributions declared to shareholders for the last two fiscal years is as follows:
| | Year ended
9/30/22 | Year ended
9/30/21 |
| Ordinary income (including any short-term capital gains) | $104,031,455 | $58,736,825 |
| Long-term capital gains | 378,401,269 | 294,644,713 |
| Total distributions | $482,432,724 | $353,381,538 |
The federal tax cost and the tax basis components of distributable earnings were as follows:
| As of 9/30/22 | |
| Cost of investments | $5,031,902,150 |
| Gross appreciation | 2,244,899,341 |
| Gross depreciation | (540,548,958) |
| Net unrealized appreciation (depreciation) | $1,704,350,383 |
| Undistributed ordinary income | 43,818,939 |
| Undistributed long-term capital gain | 359,448,420 |
| Other temporary differences | 16,869,152 |
| Total distributable earnings (loss) | $2,124,486,894 |
Notes to Financial Statements - continued
Multiple Classes of Shares of Beneficial Interest — The fund offers multiple classes of shares, which differ in their respective distribution and service fees. The fund's income, realized and unrealized gain (loss), and common expenses are allocated to shareholders based on the daily net assets of each class. Dividends are declared separately for each class. Differences in per share dividend rates are generally due to differences in separate class expenses. Class B and Class C shares will convert to Class A shares approximately eight years after purchase. The fund’s distributions declared to shareholders as reported in the Statements of Changes in Net Assets are presented by class as follows:
| | Year
ended
9/30/22 | | Year
ended
9/30/21 |
| Class A | $85,011,553 | | $67,772,858 |
| Class B | 683,436 | | 678,032 |
| Class C | 3,981,765 | | 3,758,024 |
| Class I | 258,213,877 | | 184,417,277 |
| Class R1 | 207,362 | | 154,178 |
| Class R2 | 2,424,401 | | 965,562 |
| Class R3 | 2,423,554 | | 2,113,247 |
| Class R4 | 906,505 | | 792,558 |
| Class R6 | 128,580,271 | | 92,729,802 |
| Total | $482,432,724 | | $353,381,538 |
(3) Transactions with Affiliates
Investment Adviser — The fund has an investment advisory agreement with MFS to provide overall investment management and related administrative services and facilities to the fund. The management fee is computed daily and paid monthly at the following annual rates based on the fund's average daily net assets:
| Up to $5 billion | 0.43% |
| In excess of $5 billion and up to $10 billion | 0.40% |
| In excess of $10 billion | 0.37% |
The management fee incurred for the year ended September 30, 2022 was equivalent to an annual effective rate of 0.42% of the fund's average daily net assets.
Distributor — MFS Fund Distributors, Inc. (MFD), a wholly-owned subsidiary of MFS, as distributor, received $73,349 for the year ended September 30, 2022, as its portion of the initial sales charge on sales of Class A shares of the fund.
The Board of Trustees has adopted a distribution plan for certain share classes pursuant to Rule 12b-1 of the Investment Company Act of 1940.
The fund's distribution plan provides that the fund will pay MFD for services provided by MFD and financial intermediaries in connection with the distribution and servicing of certain share classes. One component of the plan is a distribution fee paid to MFD and another component of the plan is a service fee paid to MFD. MFD may subsequently pay all, or a portion, of the distribution and/or service fees to financial intermediaries.
Notes to Financial Statements - continued
Distribution Plan Fee Table:
| | Distribution
Fee Rate (d) | Service
Fee Rate (d) | Total
Distribution
Plan (d) | Annual
Effective
Rate (e) | Distribution
and Service
Fee |
| Class A | — | 0.25% | 0.25% | 0.25% | $ 3,635,934 |
| Class B | 0.75% | 0.25% | 1.00% | 1.00% | 100,263 |
| Class C | 0.75% | 0.25% | 1.00% | 1.00% | 612,984 |
| Class R1 | 0.75% | 0.25% | 1.00% | 1.00% | 33,089 |
| Class R2 | 0.25% | 0.25% | 0.50% | 0.50% | 199,969 |
| Class R3 | — | 0.25% | 0.25% | 0.25% | 103,321 |
| Total Distribution and Service Fees | | | | | $4,685,560 |
| (d) | In accordance with the distribution plan for certain classes, the fund pays distribution and/or service fees equal to these annual percentage rates of each class’s average daily net assets. The distribution and service fee rates disclosed by class represent the current rates in effect at the end of the reporting period. Any rate changes, if applicable, are detailed below. |
| (e) | The annual effective rates represent actual fees incurred under the distribution plan for the year ended September 30, 2022 based on each class's average daily net assets. MFD has voluntarily agreed to rebate a portion of each class's 0.25% service fee attributable to accounts for which there is no financial intermediary specified on the account except for accounts attributable to MFS or its affiliates' seed money. For the year ended September 30, 2022, this rebate amounted to $11,801, $60, $6, and $4 for Class A, Class B, Class C, and Class R1 shares, respectively, and is included in the reduction of total expenses in the Statement of Operations. |
Certain Class A shares are subject to a contingent deferred sales charge (CDSC) in the event of a shareholder redemption within 18 months of purchase. Class B shares are subject to a CDSC in the event of a shareholder redemption within six years of purchase. Class C shares are subject to a CDSC in the event of a shareholder redemption within 12 months of purchase. All contingent deferred sales charges are paid to MFD and during the year ended September 30, 2022, were as follows:
| | Amount |
| Class A | $2,569 |
| Class B | 5,350 |
| Class C | 4,079 |
Shareholder Servicing Agent — MFS Service Center, Inc. (MFSC), a wholly-owned subsidiary of MFS, receives a fee from the fund for its services as shareholder servicing agent calculated as a percentage of the average daily net assets of the fund as determined periodically under the supervision of the fund's Board of Trustees. For the year ended September 30, 2022, the fee was $457,792, which equated to 0.0056% annually of the fund's average daily net assets. MFSC also receives reimbursement from the fund for out-of-pocket expenses, sub-accounting and other shareholder servicing costs which may be paid to affiliated and unaffiliated service providers. Class R6 shares do not incur sub-accounting fees. For the year ended September 30, 2022, these out-of-pocket expenses, sub-accounting and other shareholder servicing costs amounted to $4,242,551.
Notes to Financial Statements - continued
Administrator — MFS provides certain financial, legal, shareholder communications, compliance, and other administrative services to the fund. Under an administrative services agreement, the fund reimburses MFS the costs incurred to provide these services. The fund is charged an annual fixed amount of $17,500 plus a fee based on average daily net assets. The administrative services fee incurred for the year ended September 30, 2022 was equivalent to an annual effective rate of 0.0079% of the fund's average daily net assets.
Trustees’ and Officers’ Compensation — The fund pays compensation to independent Trustees in the form of a retainer, attendance fees, and additional compensation to Board and Committee chairpersons. The fund does not pay compensation directly to Trustees or officers of the fund who are also officers of the investment adviser, all of whom receive remuneration from MFS for their services to the fund. Certain officers and Trustees of the fund are officers or directors of MFS, MFD, and MFSC.
Prior to December 31, 2001, the fund had an unfunded defined benefit plan (“DB plan”) for independent Trustees. As of December 31, 2001, the Board took action to terminate the DB plan with respect to then-current and any future independent Trustees, such that the DB plan covers only certain of those former independent Trustees who retired on or before December 31, 2001. The DB plan resulted in a pension expense of $0 and is included in “Independent Trustees’ compensation” in the Statement of Operations for the year ended September 30, 2022. The liability for deferred retirement benefits payable to those former independent Trustees under the DB plan amounted to $2,068 at September 30, 2022, and is included in “Payable for independent Trustees’ compensation” in the Statement of Assets and Liabilities.
Other — The fund invests in the MFS Institutional Money Market Portfolio which is managed by MFS and seeks current income consistent with preservation of capital and liquidity. This money market fund does not pay a management fee to MFS but does incur investment and operating costs.
The fund is permitted to engage in purchase and sale transactions with funds and accounts for which MFS serves as investment adviser or sub-adviser (“cross-trades”) pursuant to a policy adopted by the Board of Trustees. This policy has been designed to ensure that cross-trades conducted by the fund comply with Rule 17a-7 under the Investment Company Act of 1940. During the year ended September 30, 2022, the fund engaged in purchase transactions pursuant to this policy, which amounted to $928,177.
The adviser has voluntarily undertaken to reimburse the fund from its own resources on a quarterly basis for the cost of investment research embedded in the cost of the fund’s securities trades. This agreement may be rescinded at any time. For the year ended September 30, 2022, this reimbursement amounted to $132,414, which is included in “Other” income in the Statement of Operations.
(4) Portfolio Securities
For the year ended September 30, 2022, purchases and sales of investments, other than short sales and short-term obligations, aggregated $1,367,954,709 and $1,628,757,698, respectively.
Notes to Financial Statements - continued
(5) Shares of Beneficial Interest
The fund's Declaration of Trust permits the Trustees to issue an unlimited number of full and fractional shares of beneficial interest. Transactions in fund shares were as follows:
| | Year ended
9/30/22 | | Year ended
9/30/21 |
| | Shares | Amount | | Shares | Amount |
| Shares sold | | | | | |
| Class A | 1,051,786 | $58,311,873 | | 1,313,253 | $71,287,336 |
| Class B | 1,037 | 53,432 | | 3,231 | 160,404 |
| Class C | 126,260 | 6,160,769 | | 188,990 | 9,089,790 |
| Class I | 12,746,586 | 727,917,046 | | 23,675,631 | 1,305,128,456 |
| Class R1 | 9,121 | 403,052 | | 2,812 | 132,274 |
| Class R2 | 111,029 | 5,868,109 | | 506,350 | 28,710,716 |
| Class R3 | 117,360 | 6,469,189 | | 106,727 | 5,598,895 |
| Class R4 | 37,571 | 2,164,599 | | 40,205 | 2,171,262 |
| Class R6 | 1,861,296 | 103,067,406 | | 4,722,739 | 266,568,742 |
| | 16,062,046 | $910,415,475 | | 30,559,938 | $1,688,847,875 |
Shares issued to shareholders
in reinvestment of distributions | | | | | |
| Class A | 1,321,232 | $78,296,097 | | 1,254,465 | $62,535,102 |
| Class B | 12,948 | 675,501 | | 15,181 | 673,937 |
| Class C | 73,864 | 3,816,563 | | 82,820 | 3,642,408 |
| Class I | 4,189,873 | 255,875,509 | | 3,558,639 | 182,487,033 |
| Class R1 | 4,106 | 207,362 | | 3,583 | 154,178 |
| Class R2 | 42,696 | 2,422,998 | | 20,034 | 960,037 |
| Class R3 | 41,294 | 2,423,554 | | 42,787 | 2,113,247 |
| Class R4 | 14,051 | 831,800 | | 14,773 | 735,552 |
| Class R6 | 2,154,549 | 127,204,589 | | 1,825,081 | 90,651,764 |
| | 7,854,613 | $471,753,973 | | 6,817,363 | $343,953,258 |
| Shares reacquired | | | | | |
| Class A | (2,785,111) | $(154,253,367) | | (2,891,567) | $(156,164,737) |
| Class B | (70,900) | (3,458,392) | | (94,521) | (4,570,173) |
| Class C | (342,258) | (16,472,060) | | (592,574) | (28,172,778) |
| Class I | (16,302,923) | (923,270,505) | | (21,243,735) | (1,177,600,668) |
| Class R1 | (6,604) | (314,997) | | (23,864) | (1,066,978) |
| Class R2 | (212,046) | (11,192,643) | | (168,829) | (8,821,278) |
| Class R3 | (165,730) | (9,096,817) | | (239,523) | (12,837,540) |
| Class R4 | (78,897) | (4,525,719) | | (70,543) | (3,744,743) |
| Class R6 | (2,726,427) | (149,317,232) | | (2,915,000) | (161,038,607) |
| | (22,690,896) | $(1,271,901,732) | | (28,240,156) | $(1,554,017,502) |
Notes to Financial Statements - continued
| | Year ended
9/30/22 | | Year ended
9/30/21 |
| | Shares | Amount | | Shares | Amount |
| Net change | | | | | |
| Class A | (412,093) | $(17,645,397) | | (323,849) | $(22,342,299) |
| Class B | (56,915) | (2,729,459) | | (76,109) | (3,735,832) |
| Class C | (142,134) | (6,494,728) | | (320,764) | (15,440,580) |
| Class I | 633,536 | 60,522,050 | | 5,990,535 | 310,014,821 |
| Class R1 | 6,623 | 295,417 | | (17,469) | (780,526) |
| Class R2 | (58,321) | (2,901,536) | | 357,555 | 20,849,475 |
| Class R3 | (7,076) | (204,074) | | (90,009) | (5,125,398) |
| Class R4 | (27,275) | (1,529,320) | | (15,565) | (837,929) |
| Class R6 | 1,289,418 | 80,954,763 | | 3,632,820 | 196,181,899 |
| | 1,225,763 | $110,267,716 | | 9,137,145 | $478,783,631 |
The fund is one of several mutual funds in which certain MFS funds may invest. The MFS funds do not invest in the underlying funds for the purpose of exercising management or control. At the end of the period, the MFS Growth Allocation Fund, the MFS Moderate Allocation Fund, the MFS Aggressive Growth Allocation Fund, and the MFS Conservative Allocation Fund were the owners of record of approximately 8%, 7%, 3%, and 3%, respectively, of the value of outstanding voting shares of the fund.
In addition, the MFS Lifetime 2025 Fund, the MFS Lifetime 2030 Fund, the MFS Lifetime 2035 Fund, the MFS Lifetime 2040 Fund, the MFS Lifetime 2045 Fund, the MFS Lifetime 2050 Fund, the MFS Lifetime 2055 Fund, the MFS Lifetime 2060 Fund, the MFS Lifetime 2065 Fund, and the MFS Lifetime Income Fund were each the owners of record of less than 1% of the value of outstanding voting shares of the fund.
Effective June 1, 2019, purchases of the fund’s Class B shares were closed to new and existing investors subject to certain exceptions.
(6) Line of Credit
The fund and certain other funds managed by MFS participate in a $1.45 billion unsecured committed line of credit of which $1.2 billion is reserved for use by the fund and certain other MFS U.S. funds. The line of credit is provided by a syndicate of banks under a credit agreement. Borrowings may be made for temporary financing needs. Interest is charged to each fund, based on its borrowings, generally at a rate equal to the highest of 1) Daily Simple SOFR (Secured Overnight Financing Rate) plus 0.10%, 2) the Federal Funds Effective Rate, or 3) the Overnight Bank Funding Rate, each plus an agreed upon spread. A commitment fee, based on the average daily unused portion of the committed line of credit, is allocated among the participating funds. The line of credit expires on March 16, 2023 unless extended or renewed. In addition, the fund and other funds managed by MFS have established unsecured uncommitted borrowing arrangements with certain banks for temporary financing needs. Interest is charged to each fund, based on its borrowings, at rates equal to customary reference rates plus an agreed upon spread. For the year ended September 30, 2022, the fund’s commitment fee and interest expense were $34,442 and $0, respectively, and are included in “Interest expense and fees” in the Statement of Operations.
Notes to Financial Statements - continued
(7) Investments in Affiliated Issuers
An affiliated issuer may be considered one in which the fund owns 5% or more of the outstanding voting securities, or a company which is under common control. For the purposes of this report, the following were affiliated issuers:
| Affiliated Issuers | Beginning
Value | Purchases | Sales
Proceeds | Realized
Gain
(Loss) | Change in
Unrealized
Appreciation or
Depreciation | Ending
Value |
| MFS Institutional Money Market Portfolio | $90,355,775 | $716,636,483 | $786,941,572 | $(96) | $3,631 | $20,054,221 |
| Affiliated Issuers | Dividend
Income | Capital Gain
Distributions |
| MFS Institutional Money Market Portfolio | $337,009 | $— |
(8) LIBOR Transition
Certain of the fund's investments, including investments in certain debt instruments and derivatives (if any), as well as borrowings by the fund and certain other contractual arrangements of the fund, may be based on the London Interbank Offered Rate (“LIBOR”). In 2017, the regulatory authority that oversees financial services firms in the United Kingdom announced plans to transition away from LIBOR by the end of 2021. In March 2021, the administrator of LIBOR announced the extension of the publication of the more commonly used U.S. dollar LIBOR settings to the end of June 2023. Although the full impacts of the transition away from LIBOR are not fully known, the transition may result in, among other things, an increase in volatility or illiquidity of the markets for instruments that currently rely on LIBOR to determine interest rates and this could have an adverse impact on the fund's performance. With respect to the fund's accounting for investments, including investments in certain debt instruments and derivatives, as well as borrowings by the fund and any other contractual arrangements of the fund that undergo reference rate-related modifications as a result of the transition, management will rely upon the relief provided by FASB Codification Topic 848 – Reference Rate Reform (Topic 848). The guidance in Topic 848 permits the fund to account for those modified contracts as a continuation of the existing contracts. Management is still evaluating the impact to the fund of the June 30, 2023 planned discontinuation of the more commonly used U.S. dollar LIBOR settings.
(9) Russia and Ukraine Conflict
The market disruptions, which began in late February 2022, associated with geopolitical events related to the conflict between Russia and Ukraine may adversely affect the value of the fund’s assets and thus the fund’s performance. Management continues to monitor these events and to evaluate the related impacts, if any, to the fund.
Report of Independent Registered Public Accounting Firm
To the Board of Trustees of MFS Series Trust V and the Shareholders of
MFS Research Fund:
Opinion on the Financial Statements and Financial Highlights
We have audited the accompanying statement of assets and liabilities of MFS Research Fund (the “Fund”), including the portfolio of investments, as of September 30, 2022, the related statement of operations for the year then ended, the statements of changes in net assets for each of the two years in the period then ended, the financial highlights for each of the five years in the period then ended, and the related notes. In our opinion, the financial statements and financial highlights present fairly, in all material respects, the financial position of the Fund as of September 30, 2022, and the results of its operations for the year then ended, the changes in its net assets for each of the two years in the period then ended, and the financial highlights for each of the five years in the period then ended, in conformity with accounting principles generally accepted in the United States of America.
Basis for Opinion
These financial statements and financial highlights are the responsibility of the Fund’s management. Our responsibility is to express an opinion on the Fund's financial statements and financial highlights based on our audits. We are a public accounting firm registered with the Public Company Accounting Oversight Board (United States) (PCAOB) and are required to be independent with respect to the Fund in accordance with the U.S. federal securities laws and the applicable rules and regulations of the Securities and Exchange Commission and the PCAOB.
We conducted our audits in accordance with the standards of the PCAOB. Those standards require that we plan and perform the audit to obtain reasonable assurance about whether the financial statements and financial highlights are free of material misstatement, whether due to error or fraud. The Fund is not required to have, nor were we engaged to perform, an audit of its internal control over financial reporting. As part of our audits we are required to obtain an understanding of internal control over financial reporting but not for the purpose of expressing an opinion on the effectiveness of the Fund's internal control over financial reporting. Accordingly, we express no such opinion.
Our audits included performing procedures to assess the risks of material misstatement of the financial statements and financial highlights, whether due to error or fraud, and performing procedures that respond to those risks. Such procedures included examining, on a test basis, evidence regarding the amounts and disclosures in the financial statements and financial highlights. Our audits also included evaluating the accounting principles used and significant estimates made by management, as well as
Report of Independent Registered Public Accounting Firm – continued
evaluating the overall presentation of the financial statements and financial highlights. Our procedures included confirmation of securities owned as of September 30, 2022, by correspondence with the custodian and brokers. We believe that our audits provide a reasonable basis for our opinion.
DELOITTE & TOUCHE LLP
Boston, Massachusetts
November 14, 2022
We have served as the auditor of one or more of the MFS investment companies since 1924.
Trustees and Officers — Identification and Background
The Trustees and Officers of the Trust, as of November 1, 2022, are listed below, together with their principal occupations during the past five years. (Their titles may have varied during that period.) The address of each Trustee and Officer is 111 Huntington Avenue, Boston, Massachusetts 02199-7618.
| Name, Age | | Position(s) Held with Fund | | Trustee/Officer Since(h) | | Number of MFS Funds overseen by the Trustee | | Principal Occupations During
the Past Five Years | | Other Directorships During
the Past Five Years (j) |
| INTERESTED TRUSTEES | | | | | | | | | | |
Michael W. Roberge (k)
(age 56) | | Trustee | | January 2021 | | 136 | | Massachusetts Financial Services Company, Chairman (since January 2021); Chief Executive Officer (since January 2017); Director; Chairman of the Board (since January 2022); President (until December 2018); Chief Investment Officer (until December 2018) | | N/A |
| INDEPENDENT TRUSTEES | | | | | | | | | | |
John P. Kavanaugh
(age 67) | | Trustee and Chair of Trustees | | January 2009 | | 136 | | Private investor | | N/A |
Steven E. Buller
(age 71) | | Trustee | | February 2014 | | 136 | | Private investor | | N/A |
John A. Caroselli
(age 68) | | Trustee | | March 2017 | | 136 | | Private investor; JC Global Advisors, LLC (management consulting), President (since 2015) | | N/A |
Maureen R. Goldfarb
(age 67) | | Trustee | | January 2009 | | 136 | | Private investor | | N/A |
Peter D. Jones
(age 67) | | Trustee | | January 2019 | | 136 | | Private investor | | N/A |
James W. Kilman, Jr.
(age 61) | | Trustee | | January 2019 | | 136 | | Burford Capital Limited (finance and investment management), Senior Advisor (since May 3, 2021), Chief Financial Officer (2019 - May 2, 2021); KielStrand Capital LLC (family office), Chief Executive Officer (since 2016) | | Alpha-En Corporation, Director (2016-2019) |
Trustees and Officers - continued
| Name, Age | | Position(s) Held with Fund | | Trustee/Officer Since(h) | | Number of MFS Funds overseen by the Trustee | | Principal Occupations During
the Past Five Years | | Other Directorships During
the Past Five Years (j) |
Clarence Otis, Jr.
(age 66) | | Trustee | | March 2017 | | 136 | | Private investor | | VF Corporation, Director; Verizon Communications, Inc., Director; The Travelers Companies, Director |
Maryanne L. Roepke
(age 66) | | Trustee | | May 2014 | | 136 | | Private investor | | N/A |
Laurie J. Thomsen
(age 65) | | Trustee | | March 2005 | | 136 | | Private investor | | The Travelers Companies, Director; Dycom Industries, Inc., Director |
| Name, Age | | Position(s) Held with
Fund | | Trustee/Officer Since(h) | | Number of MFS Funds for which the Person is an Officer | | Principal Occupations During
the Past Five Years |
| OFFICERS | | | | | | | | |
Christopher R. Bohane (k)
(age 48) | | Assistant Secretary and Assistant Clerk | | July 2005 | | 136 | | Massachusetts Financial Services Company, Senior Vice President and Senior Managing Counsel |
Kino Clark (k)
(age 54) | | Assistant Treasurer | | January 2012 | | 136 | | Massachusetts Financial Services Company, Vice President |
John W. Clark, Jr. (k)
(age 55) | | Assistant Treasurer | | April 2017 | | 136 | | Massachusetts Financial Services Company, Vice President |
David L. DiLorenzo (k)
(age 54) | | President | | July 2005 | | 136 | | Massachusetts Financial Services Company, Senior Vice President |
Heidi W. Hardin (k)
(age 55) | | Secretary and Clerk | | April 2017 | | 136 | | Massachusetts Financial Services Company, Executive Vice President and General Counsel |
Brian E. Langenfeld (k)
(age 49) | | Assistant Secretary and Assistant Clerk | | June 2006 | | 136 | | Massachusetts Financial Services Company, Vice President and Managing Counsel |
Trustees and Officers - continued
| Name, Age | | Position(s) Held with
Fund | | Trustee/Officer Since(h) | | Number of MFS Funds for which the Person is an Officer | | Principal Occupations During
the Past Five Years |
Rosa E. Licea-Mailloux(k)
(age 46) | | Chief Compliance Officer | | March 2022 | | 136 | | Massachusetts Financial Services Company, Vice President (since 2018); Director of Corporate Compliance (2018-2021), Senior Director Compliance (2021-2022), Senior Managing Director of North American Compliance & Chief Compliance Officer (since March 2022); Natixis Investment Managers (investment management), Funds Chief Compliance Officer, Deputy General Counsel & Senior Vice President (until 2018) |
Amanda S. Mooradian (k)
(age 43) | | Assistant Secretary and Assistant Clerk | | September 2018 | | 136 | | Massachusetts Financial Services Company, Assistant Vice President and Senior Counsel |
Susan A. Pereira (k)
(age 51) | | Assistant Secretary and Assistant Clerk | | July 2005 | | 136 | | Massachusetts Financial Services Company, Vice President and Managing Counsel |
Kasey L. Phillips (k)
(age 51) | | Assistant Treasurer | | September 2012 | | 136 | | Massachusetts Financial Services Company, Vice President |
Matthew A. Stowe (k)
(age 47) | | Assistant Secretary and Assistant Clerk | | October 2014 | | 136 | | Massachusetts Financial Services Company, Vice President and Senior Managing Counsel |
William B. Wilson(k)
(age 40) | | Assistant Secretary and Assistant Clerk | | October 2022 | | 136 | | Massachusetts Financial Services Company, Assistant Vice President and Counsel |
James O. Yost (k)
(age 62) | | Treasurer | | September 1990 | | 136 | | Massachusetts Financial Services Company, Senior Vice President |
| (h) | Date first appointed to serve as Trustee/Officer of an MFS Fund. Each Trustee has served continuously since appointment unless indicated otherwise. From January 2012 through December 2016, Messrs. DiLorenzo and Yost served as Treasurer and Deputy Treasurer of the Funds, respectively. |
| (j) | Directorships or trusteeships of companies required to report to the Securities and Exchange Commission (i.e., “public companies”). |
| (k) | “Interested person” of the Trust within the meaning of the Investment Company Act of 1940 (referred to as the 1940 Act), which is the principal federal law governing investment companies like the fund, as a result of a position with MFS. The address of MFS is 111 Huntington Avenue, Boston, Massachusetts 02199-7618. |
Trustees and Officers - continued
Each Trustee (other than Messrs. Jones, Kilman and Roberge) has been elected by shareholders and each Trustee and Officer holds office until his or her successor is chosen and qualified or until his or her earlier death, resignation, retirement or removal. Mr. Roberge became a Trustee of the Funds on January 1, 2021 and Messrs. Jones and Kilman became Trustees of the Funds on January 1, 2019. The Trust does not hold annual meetings for the purpose of electing Trustees, and Trustees are not elected for fixed terms. Under the terms of the Board's retirement policy, an Independent Trustee shall retire at the end of the calendar year in which he or she reaches the earlier of 75 years of age or 15 years of service on the Board (or, in the case of any Independent Trustee who joined the Board prior to 2015, 20 years of service on the Board).
Messrs. Buller, Kilman and Otis and Ms. Roepke are members of the Trust’s Audit Committee.
Each of the Interested Trustees and certain Officers hold comparable officer positions with certain affiliates of MFS.
The Statement of Additional Information for a Fund includes further information about the Trustees and is available without charge upon request by calling 1-800-225-2606.
| Investment Adviser | Custodian |
Massachusetts Financial Services Company
111 Huntington Avenue
Boston, MA 02199-7618 | JPMorgan Chase Bank, NA
4 Metrotech Center
New York, NY 11245 |
| Distributor | Independent Registered Public Accounting Firm |
MFS Fund Distributors, Inc.
111 Huntington Avenue
Boston, MA 02199-7618 | Deloitte & Touche LLP
200 Berkeley Street
Boston, MA 02116 |
| Portfolio Manager(s) | |
| Joseph MacDougall | |
Board Review of Investment Advisory Agreement
MFS Research Fund
The Investment Company Act of 1940 requires that both the full Board of Trustees and a majority of the non-interested (“independent”) Trustees, voting separately, annually approve the continuation of the Fund’s investment advisory agreement with MFS. The Trustees consider matters bearing on the Fund and its advisory arrangements at their meetings throughout the year, including a review of performance data at each regular meeting. In addition, the independent Trustees met several times over the course of three months beginning in May and ending in July, 2022 (“contract review meetings”) for the specific purpose of considering whether to approve the continuation of the investment advisory agreement for the Fund and the other investment companies that the Board oversees (the “MFS Funds”). The independent Trustees were assisted in their evaluation of the Fund’s investment advisory agreement by independent legal counsel, from whom they received separate legal advice and with whom they met separately from MFS during various contract review meetings. The independent Trustees were also assisted in this process by an independent consultant who was retained by and reported to the independent Trustees.
In connection with their deliberations regarding the continuation of the investment advisory agreement, the Trustees, including the independent Trustees, considered such information and factors as they believed, in light of the legal advice furnished to them and their own business judgment, to be relevant. The investment advisory agreement for the Fund was considered separately, although the Trustees also took into account the common interests of all MFS Funds in their review. As described below, the Trustees considered the nature, quality, and extent of the various investment advisory, administrative, and shareholder services performed by MFS under the existing investment advisory agreement and other arrangements with the Fund.
In connection with their contract review meetings, the Trustees received and relied upon materials that included, among other items: (i) information provided by Broadridge Financial Solutions, Inc. (“Broadridge”), an independent third party, on the investment performance of the Fund for various time periods ended December 31, 2021 and the investment performance of a group of funds with substantially similar investment classifications/objectives (the “Broadridge performance universe”), (ii) information provided by Broadridge on the Fund’s advisory fees and other expenses and the advisory fees and other expenses of comparable funds identified by Broadridge as well as all other funds in the same investment classification/category (the “Broadridge expense group and universe”), (iii) information provided by MFS on the advisory fees of portfolios of other clients of MFS, including institutional separate accounts and other clients, (iv) information as to whether and to what extent applicable expense waivers, reimbursements or fee “breakpoints” are observed for the Fund, (v) information regarding MFS’ financial results and financial condition, including MFS’ and certain of its affiliates’ estimated profitability from services performed for the Fund and the MFS Funds as a whole, and compared to MFS’ institutional business, (vi) MFS’ views regarding the outlook for the mutual fund industry and the strategic business plans of MFS, (vii) descriptions of various functions performed by MFS for the Funds, such as compliance monitoring and portfolio trading practices, and (viii) information regarding the overall organization of MFS, including information about
Board Review of Investment Advisory Agreement - continued
MFS’ senior management and other personnel providing investment advisory, administrative and other services to the Fund and the other MFS Funds. The comparative performance, fee and expense information prepared and provided by Broadridge was not independently verified and the independent Trustees did not independently verify any information provided to them by MFS.
The Trustees’ conclusion as to the continuation of the investment advisory agreement was based on a comprehensive consideration of all information provided to the Trustees and not the result of any single factor. Some of the factors that figured particularly in the Trustees’ deliberations are described below, although individual Trustees may have evaluated the information presented differently from one another, giving different weights to various factors. It is also important to recognize that the fee arrangements for the Fund and other MFS Funds are the result of years of review and discussion between the independent Trustees and MFS, that certain aspects of such arrangements may receive greater scrutiny in some years than in others, and that the Trustees’ conclusions may be based, in part, on their consideration of these same arrangements during the course of the year and in prior years.
Based on information provided by Broadridge and MFS, the Trustees reviewed the Fund’s total return investment performance as well as the Broadridge performance universe over various time periods. The Trustees placed particular emphasis on the total return performance of the Fund’s Class I shares in comparison to the performance of funds in its Broadridge performance universe over the five-year period ended December 31, 2021, which the Trustees believed was a long enough period to reflect differing market conditions. The total return performance of the Fund’s Class I shares was in the 2nd quintile relative to the other funds in the universe for this five-year period (the 1st quintile being the best performers and the 5th quintile being the worst performers). The total return performance of the Fund’s Class I shares was in the 4th quintile for the one-year period and the 3rd quintile for the three-year period ended December 31, 2021 relative to the Broadridge performance universe. Because of the passage of time, these performance results may differ from the performance results for more recent periods, including those shown elsewhere in this report.
In the course of their deliberations, the Trustees took into account information provided by MFS in connection with the contract review meetings, as well as during investment review meetings conducted with portfolio management personnel during the course of the year regarding the Fund’s performance. After reviewing these and related factors, the Trustees concluded, within the context of their overall conclusions regarding the investment advisory agreement, that they were satisfied with MFS’ responses and efforts relating to investment performance.
In assessing the reasonableness of the Fund’s advisory fee, the Trustees considered, among other information, the Fund’s advisory fee and the total expense ratio of the Fund’s Class I shares as a percentage of average daily net assets and the advisory fee and total expense ratios of the Broadridge expense group based on information provided by Broadridge. The Trustees considered that, according to the data provided by Broadridge (which takes into account any fee reductions or expense limitations that were in effect during the Fund’s last fiscal year), the Fund’s effective advisory fee rate and total expense ratio were each lower than the Broadridge expense group median.
Board Review of Investment Advisory Agreement - continued
The Trustees also considered the advisory fees charged by MFS to any institutional separate accounts advised by MFS (“separate accounts”) and unaffiliated investment companies for which MFS serves as subadviser (“subadvised funds”) that have comparable investment strategies to the Fund, if any. In comparing these fees, the Trustees considered information provided by MFS as to the generally broader scope of services provided by MFS to the Fund, as well as the more extensive regulatory burdens imposed on MFS in managing the Fund, in comparison to separate accounts and subadvised funds. The Trustees also considered the higher demands placed on MFS’ investment personnel and trading infrastructure as a result of the daily cash in-flows and out-flows of the Fund in comparison to separate accounts.
The Trustees also considered whether the Fund may benefit from any economies of scale in the management of the Fund in the event of growth in assets of the Fund. They noted that the Fund’s advisory fee rate schedule is subject to contractual breakpoints that reduce the Fund’s advisory fee rate on average daily net assets over $5 billion and $10 billion. The Trustees concluded that the breakpoints were sufficient to allow the Fund to benefit from economies of scale as its assets grow.
The Trustees also considered information prepared by MFS relating to MFS’ costs and profits with respect to the Fund, the MFS Funds considered as a group, and other investment companies and accounts advised by MFS, as well as MFS’ methodologies used to determine and allocate its costs to the MFS Funds, the Fund and other accounts and products for purposes of estimating profitability.
After reviewing these and other factors described herein, the Trustees concluded, within the context of their overall conclusions regarding the investment advisory agreement, that the advisory fees charged to the Fund represent reasonable compensation in light of the services being provided by MFS to the Fund.
In addition, the Trustees considered MFS’ resources and related efforts to continue to retain, attract and motivate capable personnel to serve the Fund. The Trustees also considered current and developing conditions in the financial services industry, including the presence of large and well-capitalized companies which are spending, and appear to be prepared to continue to spend, substantial sums to engage personnel and to provide services to competing investment companies. In this regard, the Trustees also considered the financial resources of MFS and its ultimate parent, Sun Life Financial Inc. The Trustees also considered the advantages and possible disadvantages to the Fund of having an adviser that also serves other investment companies as well as other accounts.
The Trustees also considered the nature, quality, cost, and extent of administrative, transfer agency, and distribution services provided to the Fund by MFS and its affiliates under agreements and plans other than the investment advisory agreement, including any 12b-1 fees the Fund pays to MFS Fund Distributors, Inc., an affiliate of MFS. The Trustees also considered the nature, extent and quality of certain other services MFS performs or arranges for on the Fund’s behalf, which may include securities lending programs, directed expense payment programs, class action recovery programs, and MFS’ interaction with third-party service providers, principally custodians and sub-custodians. The Trustees concluded that the various non-advisory services provided by MFS and its affiliates on behalf of the Fund were satisfactory.
Board Review of Investment Advisory Agreement - continued
The Trustees considered so-called “fall-out benefits” to MFS such as reputational value derived from serving as investment manager to the MFS Funds. The Trustees also considered that MFS discontinued its historic practice of obtaining investment research from portfolio brokerage commissions paid by certain MFS Funds effective January 2018, and directly pays or voluntarily reimburses a Fund, if applicable, for the costs of external research acquired through the use of the Fund’s portfolio brokerage commissions.
Based on their evaluation of factors that they deemed to be material, including those factors described above, the Board of Trustees, including the independent Trustees, concluded that the Fund’s investment advisory agreement with MFS should be continued for an additional one-year period, commencing August 1, 2022.
Proxy Voting Policies and Information
MFS votes proxies on behalf of the fund pursuant to proxy voting policies and procedures that are available without charge, upon request, by calling 1-800-225-2606, by visiting mfs.com/proxyvoting, or by visiting the SEC’s Web site at http://www.sec.gov.
Information regarding how the fund voted proxies relating to portfolio securities during the most recent twelve-month period ended June 30 is available by August 31 of each year without charge by visiting mfs.com/proxyvoting, or by visiting the SEC’s Web site at http://www.sec.gov.
Quarterly Portfolio Disclosure
The fund files a complete schedule of portfolio holdings with the SEC for the first and third quarters of each fiscal year as an exhibit to its reports on Form N-PORT. The fund's Form N-PORT reports are available on the SEC's Web site at http://www.sec.gov. A shareholder can obtain the portfolio holdings report for the first and third quarters of the fund's fiscal year at mfs.com/openendfunds by choosing the fund's name and then scrolling to the “Resources” section and clicking on the “Prospectus and Reports” tab.
Further Information
From time to time, MFS may post important information about the fund or the MFS Funds on the MFS Web site (mfs.com). This information is available at https://www.mfs.com/announcements or at mfs.com/openendfunds by choosing the fund’s name and then scrolling to the “Resources” section and clicking on the “Announcements” tab, if any.
Information About Fund Contracts and Legal Claims
The fund has entered into contractual arrangements with an investment adviser, administrator, distributor, shareholder servicing agent, and custodian who each provide services to the fund. Unless expressly stated otherwise, shareholders are not parties to, or intended beneficiaries of these contractual arrangements, and these contractual arrangements are not intended to create any shareholder right to enforce them against the service providers or to seek any remedy under them against the service providers, either directly or on behalf of the fund.
Under the Trust’s By-Laws and Declaration of Trust, any claims asserted against or on behalf of the MFS Funds, including claims against Trustees and Officers, must be brought in state and federal courts located within the Commonwealth of Massachusetts.
Federal Tax Information (unaudited)
The fund will notify shareholders of amounts for use in preparing 2022 income tax forms in January 2023. The following information is provided pursuant to provisions of the Internal Revenue Code.
The fund designates the maximum amount allowable as qualified dividend income eligible to be taxed at the same rate as long-term capital gain.
The fund designates $445,931,000 as capital gain dividends paid during the fiscal year.
For corporate shareholders, 80.11% of the ordinary income dividends paid during the fiscal year qualify for the corporate dividends received deduction.
Federal Tax Information (unaudited) - continued
The fund designates the maximum amount allowable as Section 199A dividends as defined in Proposed Treasury Regulation §1.199A-3(d).
| FACTS | WHAT DOES MFS DO WITH YOUR PERSONAL INFORMATION? |
| Why? | Financial companies choose how they share your personal information. Federal law gives consumers the right to limit some but not all sharing. Federal law also requires us to tell you how we collect, share, and protect your personal information. Please read this notice carefully to understand what we do. |
| What? | The types of personal information we collect and share depend on the product or service you have with us. This information can include: |
| • Social Security number and account balances |
| • Account transactions and transaction history |
| • Checking account information and wire transfer instructions |
| When you are no longer our customer, we continue to share your information as described in this notice. |
| How? | All financial companies need to share customers' personal information to run their everyday business. In the section below, we list the reasons financial companies can share their customers' personal information; the reasons MFS chooses to share; and whether you can limit this sharing. |
Reasons we can share your
personal information | Does MFS share? | Can you limit
this sharing? |
For our everyday business purposes –
such as to process your transactions, maintain your
account(s), respond to court orders and legal
investigations, or report to credit bureaus | Yes | No |
For our marketing purposes –
to offer our products and services to you | No | We don't share |
For joint marketing with other
financial companies | No | We don't share |
For our affiliates' everyday business purposes –
information about your transactions and experiences | No | We don't share |
For our affiliates' everyday business purposes –
information about your creditworthiness | No | We don't share |
| For nonaffiliates to market to you | No | We don't share |
| Questions? | Call 800-225-2606 or go to mfs.com. |
| Who we are |
| Who is providing this notice? | MFS Funds, MFS Investment Management, MFS Institutional Advisors, Inc., and MFS Heritage Trust Company. |
| What we do |
How does MFS
protect my personal
information? | To protect your personal information from unauthorized access and use, we use security measures that comply with federal law. These measures include procedural, electronic, and physical safeguards for the protection of the personal information we collect about you. |
How does MFS
collect my personal
information? | We collect your personal information, for example, when you |
| • open an account or provide account information |
| • direct us to buy securities or direct us to sell your securities |
| • make a wire transfer |
| We also collect your personal information from others, such as credit bureaus, affiliates, or other companies. |
| Why can't I limit all sharing? | Federal law gives you the right to limit only |
| • sharing for affiliates' everyday business purposes – information about your creditworthiness |
| • affiliates from using your information to market to you |
| • sharing for nonaffiliates to market to you |
| State laws and individual companies may give you additional rights to limit sharing. |
| Definitions |
| Affiliates | Companies related by common ownership or control. They can be financial and nonfinancial companies. |
| • MFS does not share personal information with affiliates, except for everyday business purposes as described on page one of this notice. |
| Nonaffiliates | Companies not related by common ownership or control. They can be financial and nonfinancial companies. |
| • MFS does not share with nonaffiliates so they can market to you. |
| Joint marketing | A formal agreement between nonaffiliated financial companies that together market financial products or services to you. |
| • MFS doesn't jointly market. |
| Other important information |
| If you own an MFS product or receive an MFS service in the name of a third party such as a bank or broker-dealer, their privacy policy may apply to you instead of ours. |
Save paper with eDelivery.
MFS® will send you prospectuses, reports, and proxies directly via e-mail so you will get information faster with less mailbox clutter.
To sign up:
1. Go to mfs.com.
2. Log in via MFS® Access.
3. Select eDelivery.
If you own your MFS fund shares through a financial institution or a retirement plan, MFS® TALK, MFS® Access, or eDelivery may not be available to you.
CONTACT
WEB SITE
mfs.com
MFS TALK
1-800-637-8255
24 hours a day
ACCOUNT SERVICE AND LITERATURE
Shareholders
1-800-225-2606
Financial advisors
1-800-343-2829
Retirement plan services
1-800-637-1255
MAILING ADDRESS
MFS Service Center, Inc.
P.O. Box 219341
Kansas City, MO 64121-9341
OVERNIGHT MAIL
MFS Service Center, Inc.
Suite 219341
430 W 7th Street
Kansas City, MO 64105-1407
Item 1(b):
Not applicable
ITEM 2. CODE OF ETHICS.
The Registrant has adopted a Code of Ethics (the "Code") pursuant to Section 406 of the Sarbanes-Oxley Act and as defined in Form N-CSR that applies to the Registrant's principal executive officer and principal financial and accounting officer. During the period covered by this report, the Registrant has not amended any provision in the Code that relates to an element of the Code's definition enumerated in paragraph (b) of Item 2 of this Form N-CSR. During the period covered by this report, the Registrant did not grant a waiver, including an implicit waiver, from any provision of the Code.
A copy of the Code is attached hereto as EX-99.COE.
ITEM 3. AUDIT COMMITTEE FINANCIAL EXPERT.
Messrs. Steven E. Buller, James Kilman, and Clarence Otis, Jr. and Ms. Maryanne L. Roepke, members of the Audit Committee, have been determined by the Board of Trustees in their reasonable business judgment to meet the definition of "audit committee financial expert" as such term is defined in Form N-CSR. In addition, Messrs. Buller, Kilman, and Otis and Ms. Roepke are "independent" members of the Audit Committee (as such term has been defined by the Securities and Exchange Commission in regulations implementing Section 407 of the Sarbanes-Oxley Act of 2002). The Securities and Exchange Commission has stated that the designation of a person as an audit committee financial expert pursuant to this Item 3 on the Form N-CSR does not impose on such a person any duties, obligations or liability that are greater than the duties, obligations or liability imposed on such person as a member of the Audit Committee and the Board of Trustees in the absence of such designation or identification.
ITEM 4. PRINCIPAL ACCOUNTANT FEES AND SERVICES.
Items 4(a) through 4(d) and 4(g):
The Board of Trustees has appointed Deloitte & Touche LLP ("Deloitte") to serve as independent accountants to certain series of the Registrant and Ernst & Young LLP ("E&Y") to serve in the same capacity to certain other series of the Registrant (each a "Fund" and collectively the "Funds"). The tables below set forth the audit fees billed to each Fund as well as fees for non-audit services provided to each Fund and/or to each Fund's investment adviser, Massachusetts Financial Services Company ("MFS"), and to various entities either controlling, controlled by, or under common control with MFS that provide ongoing services to the Funds ("MFS Related Entities").
For the fiscal years ended September 30, 2022 and 2021, audit fees billed to each Fund by Deloitte and E&Y were as follows:
Fees billed by Deloitte: | | Audit Fees |
| 2022 | | 2021 |
MFS Research Fund | 49,666 | | 47,162 |
MFS Total Return Fund | 76,859 | | 74,385 |
Total | 126,525 | | 121,547 |
| | |
Fees billed by E&Y: | | Audit Fees |
| 2022 | | 2021 |
MFS International New Discovery Fund | 53,754 | | 52,464 |
For the fiscal years ended September 30, 2022 and 2021, fees billed by Deloitte and E&Y for audit-related, tax and other services provided to each Fund and for audit-related, tax and other services provided to MFS and MFS Related Entities were as follows:
Fees billed by Deloitte: | Audit-Related Fees1 | Tax Fees2 | All Other Fees3 |
| 2022 | 2021 | 2022 | 2021 | 2022 | 2021 |
To MFS Research Fund | 0 | 0 | 400 | 7,873 | 0 | 0 |
To MFS Total Return Fund | 0 | 0 | 400 | 10,997 | 0 | 0 |
Total fees billed by Deloitte | 0 | 0 | 800 | 18,870 | 0 | 0 |
To above Funds: | | | | | | |
| | | | |
Fees billed by Deloitte: | Audit-Related Fees1 | Tax Fees2 | All Other Fees3 |
| 2022 | 2021 | 2022 | 2021 | 2022 | 2021 |
To MFS and MFS Related | | | | | | |
Entities of MFS Research Fund* | 0 | 0 | 0 | 0 | 3,790 | 5,390 |
To MFS and MFS Related | | | | | | | | | | | | | | | | | | | | |
Entities of MFS Total Return | | 0 | | | 0 | | | 0 | | 0 | | | | 3,790 | | 5,390 |
Fund* | | | | | | | | | | | | | | | | | | | | |
| | | | | | | | | | | | | |
Fees billed by Deloitte | | | | | Aggregate Fees for Non-audit Services | |
| | | | | 2022 | | | | | | 2021 | | | |
To MFS Research Fund, MFS and MFS | | | | | | | | | | | | | | | | | | |
Related Entities# | | | | | 4,190 | | | | | | 13,263 | | | |
To MFS Total Return Fund, MFS and MFS | | | | | | | | | | | | | | | | | | |
Related Entities# | | | | | 4,190 | | | | | | 16,387 | | | |
| | | | | | | | | | | | |
Fees billed by E&Y: | Audit-Related Fees1 | | | Tax Fees2 | | | | All Other Fees4 | |
| 2022 | | | 2021 | | 2022 | | 2021 | | 2022 | | 2021 | |
To MFS International New | | | | | | | | | | | | | | | | | | | | |
Discovery Fund | 0 | | | 0 | | 632 | | 9,936 | | 1,331 | | 2,630 | |
| | | | | | | | | |
Fees billed by E&Y: | Audit-Related Fees1 | | Tax Fees2 | | | | All Other Fees4 |
| 2022 | | | 2021 | | 2022 | | 2021 | | 2022 | | 2021 |
To MFS and MFS Related | | | | | | | | | | | | | | | | | | | | |
Entities of MFS International | 662,511 | | 1,668,649 | | 0 | | 0 | | | 111,415 | | 110,620 |
New Discovery Fund* | | | | | | | | | | | | | | | | | | | | |
| | | | | | |
Fees billed by E&Y: | | | | | | Aggregate Fees for Non-audit Services |
| | | | | | | 2022 | | | | | | 2021 | | |
To MFS International New Discovery Fund, | | | | | | | | | | | | | | | | |
MFS and MFS Related Entities# | | | | | 886,319 | | | | | | 2,028,265 | |
*This amount reflects the fees billed to MFS and MFS Related Entities for non-audit services relating directly to the operations and financial reporting of the Funds (portions of which services also related to the operations and financial reporting of other funds within the MFS Funds complex).
# This amount reflects the aggregate fees billed by Deloitte or E&Y for non-audit services rendered to the Funds and for non-audit services rendered to MFS and the MFS Related Entities.
1 The fees included under "Audit-Related Fees" are fees related to assurance and related services that are reasonably related to the performance of the audit or review of financial statements, but not reported under ''Audit Fees,'' including accounting consultations, agreed-upon procedure reports, attestation reports, comfort letters and internal control reviews.
2 The fees included under "Tax Fees" are fees associated with tax compliance, tax advice and tax planning, including services relating to the filing or amendment of federal, state or local income tax returns, regulated investment company qualification reviews and tax distribution and analysis.
3 The fees included under "All Other Fees" are fees for products and services provided by Deloitte other than those reported under "Audit Fees," "Audit-Related Fees" and "Tax Fees".
4 The fees included under "All Other Fees" are fees for products and services provided by E&Y other than those reported under "Audit Fees," "Audit-Related Fees" and "Tax Fees," including fees for services related to review of internal controls and review of Rule 38a-1 compliance program.
Item 4(e)(1):
Set forth below are the policies and procedures established by the Audit Committee of the Board of Trustees relating to the pre- approval of audit and non-audit related services:
To the extent required by applicable law, pre-approval by the Audit Committee of the Board is needed for all audit and permissible non-audit services rendered to the Fund and all permissible non-audit services rendered to MFS or MFS Related Entities if the services relate directly to the operations and financial reporting of the Registrant. Pre-approval is currently on an engagement-by- engagement basis. In the event pre-approval of such services is necessary between regular meetings of the Audit Committee and it is not practical to wait to seek pre-approval at the next regular meeting of the Audit Committee, pre-approval of such services may be referred to the Chair of the Audit Committee for approval; provided that the Chair may not pre-approve any individual engagement for such services exceeding $50,000 or multiple engagements for such services in the aggregate exceeding $100,000 in each period between regular meetings of the Audit Committee. Any engagement pre-approved by the Chair between regular meetings of the Audit Committee shall be presented for ratification by the entire Audit Committee at its next regularly scheduled meeting.
Item 4(e)(2):
None, or 0%, of the services relating to the Audit-Related Fees, Tax Fees and All Other Fees paid by the Fund and MFS and MFS Related Entities relating directly to the operations and financial reporting of the Registrant disclosed above were approved by the audit committee pursuant to paragraphs (c)(7)(i)(C) of Rule 2-01 of Regulation S-X (which permits audit committee approval after the start of the engagement with respect to services other than audit, review or attest services, if certain conditions are satisfied).
Item 4(f):
Not applicable.
Item 4(h):
The Registrant's Audit Committee has considered whether the provision by a Registrant's independent registered public accounting firm of non-audit services to MFS and MFS Related Entities that were not pre-approved by the Committee (because such services did not relate directly to the operations and financial reporting of the Registrant) was compatible with maintaining the independence of the independent registered public accounting firm as the Registrant's principal auditors.
ITEM 5. AUDIT COMMITTEE OF LISTED REGISTRANTS.
Not applicable to the Registrant.
ITEM 6. INVESTMENTS
A schedule of investments for each series covered by this Form N-CSR is included as part of the report to shareholders of such series under Item 1(a) of this Form N-CSR.
ITEM 7. DISCLOSURE OF PROXY VOTING POLICIES AND PROCEDURES FOR CLOSED-END MANAGEMENT INVESTMENT COMPANIES.
Not applicable to the Registrant.
ITEM 8. PORTFOLIO MANAGERS OF CLOSED-END MANAGEMENT INVESTMENT COMPANIES.
Not applicable to the Registrant.
ITEM 9. PURCHASES OF EQUITY SECURITIES BY CLOSED-END MANAGEMENT INVESTMENT COMPANY AND AFFILIATED PURCHASERS.
Not applicable to the Registrant.
ITEM 10. SUBMISSION OF MATTERS TO A VOTE OF SECURITY HOLDERS.
There were no material changes to the procedures by which shareholders may send recommendations to the Board for nominees to the Registrant's Board since the Registrant last provided disclosure as to such procedures in response to the requirements of Item 407 (c)(2)(iv) of Regulation S-K or this Item.
ITEM 11. CONTROLS AND PROCEDURES.
(a)Based upon their evaluation of the effectiveness of the registrant's disclosure controls and procedures (as defined in Rule 30a-3(c) under the Investment Company Act of 1940 (the "Act")) as conducted within 90 days of the filing date of this report on Form N-CSR, the registrant's principal financial officer and principal executive officer have concluded that those disclosure controls and procedures provide reasonable assurance that the material information required to be disclosed by the registrant on this report is recorded, processed, summarized and reported within the time periods specified in the Securities and Exchange Commission's rules and forms.
(b)There were no changes in the registrant's internal controls over financial reporting (as defined in Rule 30a-3(d) under the Act) that occurred during the period covered by the report that have materially affected, or are reasonably likely to materially affect, the registrant's internal control over financial reporting.
ITEM 12. DISCLOSURE OF SECURITIES LENDING ACTIVITIES FOR CLOSED-END MANAGEMENT INVESTMENT COMPANIES.
Not applicable to the Registrant.
ITEM 13. EXHIBITS.
(a)(1) Any code of ethics, or amendment thereto, that is the subject of the disclosure required by Item 2, to the extent that the registrant intends to satisfy the Item 2 requirements through filing of an exhibit: Attached hereto as EX-99.COE.
(2)A separate certification for each principal executive officer and principal financial officer of the registrant as required by Rule 30a-2(a) under the Act (17 CFR 270.30a-2): Attached hereto as EX-99.302CERT.
(3)Any written solicitation to purchase securities under Rule 23c-1 under the Act (17 CFR 270.23c-1) sent or given during the period covered by the report by or on behalf of the registrant to 10 or more persons. Not applicable.
(4)Change in the registrant's independent public accountant. Not applicable.
(b)If the report is filed under Section 13(a) or 15(d) of the Exchange Act, provide the certifications required by Rule 30a-2(b) under the Act (17 CFR 270.30a-2(b)), Rule 13a-14(b) or Rule 15d-14(b) under the Exchange Act (17 CFR 240.13a-14(b) or
240.15d-14(b)) and Section 1350 of Chapter 63 of Title 18 of the United States Code (18 U.S.C. 1350) as an exhibit. A certification furnished pursuant to this paragraph will not be deemed "filed" for the purposes of Section 18 of the Exchange Act (15 U.S.C. 78r), or otherwise subject to the liability of that section. Such certification will not be deemed to be incorporated by reference into any filing under the Securities Act of 1933 or the Exchange Act, except to the extent that the registrant specifically incorporates it by reference. Attached hereto as EX-99.906CERT.
Notice
A copy of the Amended and Restated Declaration of Trust, as amended, of the Registrant is on file with the Secretary of State of The Commonwealth of Massachusetts and notice is hereby given that this instrument is executed on behalf of the Registrant by an officer of the Registrant as an officer and not individually and the obligations of or arising out of this instrument are not binding upon any of the Trustees or shareholders individually, but are binding only upon the assets and property of the respective constituent series of the Registrant.
SIGNATURES
Pursuant to the requirements of the Securities Exchange Act of 1934 and the Investment Company Act of 1940, the registrant has duly caused this report to be signed on its behalf by the undersigned, thereunto duly authorized.
(Registrant) MFS SERIES TRUST V
By (Signature and Title)*
/S/ DAVID L. DILORENZO
David L. DiLorenzo, President
Date: November 14, 2022
Pursuant to the requirements of the Securities Exchange Act of 1934 and the Investment Company Act of 1940, this report has been signed below by the following persons on behalf of the registrant and in the capacities and on the dates indicated.
By (Signature and Title)*
/S/ DAVID L. DILORENZO
David L. DiLorenzo, President (Principal Executive Officer)
Date: November 14, 2022
By (Signature and Title)*
/S/ JAMES O. YOST
James O. Yost, Treasurer (Principal Financial Officer and Accounting Officer)
Date: November 14, 2022
* Print name and title of each signing officer under his or her signature.