Exhibit 6

| Management’s Discussion and Analysis | | | | | | |
| | | | | | | |
| | | | | | | |
| Highlights | | | | | | |
| (millions of Canadian dollars, unless otherwise stated) | 2004 | | 2003 | | 2002 | |
| | | | (Restated1) | | (Restated1) | |
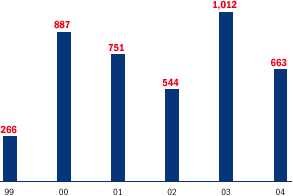
| Net income | 663 | | 1,012 | | 544 | |
| Dividends | 114 | | 90 | | 80 | |
| Per share2(Canadian dollars) | | | | | | |
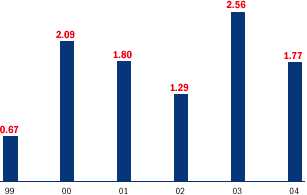
| Net income | 1.77 | | 2.56 | | 1.29 | |
| Dividends | 0.30 | | 0.23 | | 0.20 | |
| Production (mboe/d) | 438 | | 398 | | 445 | |
| Production per share2(boe/share) | 0.42 | | 0.38 | | 0.40 | |
| Average sales price3($/boe) | 42.75 | | 38.51 | | 32.89 | |
| Gross sales3 | 6,874 | | 5,610 | | 5,351 | |
| Operating costs3($/boe) | 7.04 | | 6.74 | | 6.44 | |
| DD&A, exploration and dry hole expense | 2,199 | | 1,899 | | 1,821 | |
| Cash provided by operating activities | 3,134 | | 2,592 | | 2,415 | |
| Exploration and development spending | 2,538 | | 2,180 | | 1,848 | |
| Total assets | 12,408 | | 11,780 | | 12,017 | |
| Total long-term debt and preferred securities | 2,457 | | 2,634 | | 3,428 | |
| Proved reserves additions (before acquisitions and divestitures) (mmboe) | 265 | | 143 | | 157 | |
| Proved reserves (mmboe) | 1,488 | | 1,362 | | 1,485 | |
| Reserves replacement ratio4 | 166% | | 99% | | 121% | |
1
| Restatement of prior years to effect retroactive adoption of the new accounting policy on asset retirement obligations as at January 1, 2004. See note 2 to the Consolidated Financial Statements.
|
2
| All per share amounts have been retroactively restated to reflect the impact of the Company’s three for one stock split. See note 9 to the Consolidated Financial Statements.
|
3
| During 2004, the Company reclassified transportation costs on a retroactive basis. Previously, these costs had been netted off against revenues or included as operating expenses. See note 2 to the Consolidated Financial Statements.
|
4
| See the MD&A section entitled Reserves Replacement for method of calculation.
|
This Management’s Discussion and Analysis (MD&A) dated March 14, 2005, should be read in conjunction with the Consolidated Financial Statements of the Company. In particular, note 20 provides segmented financial information that forms the basis for much of the following discussion and analysis. The Company’s Consolidated Financial Statements and the financial data included in the MD&A have been prepared in accordance with accounting principles generally accepted in Canada. A summary of the differences between accounting principles generally accepted in Canada (Canadian GAAP) and those generally accepted in the United States (US GAAP) is contained in note 21 to the Consolidated Financial Statements.
Unless otherwise stated, references to production and reserves represent Talisman’s working interest share (including royalty interests and net profits interests) before deduction of royalties. Throughout this MD&A the calculation of barrels of oil equivalent (boe) is calculated at a conversion rate of six thousand cubic feet (mcf) of natural gas for one barrel of oil and is based on an energy equivalence conversion method. BOEs may be misleading, particularly if used in isolation. A boe conversion ratio of 6 mcf:1 bbl is based on an energy equivalence conversion method primarily applicable at the burner tip and does not represent a value equivalence at the wellhead.
Dollar amounts included in the MD&A are expressed in Canadian dollars unless otherwise indicated. All comparative percentages are between the years ended December 31, 2004 and December 31, 2003, unless stated otherwise.
Talisman Energy Inc. has a number of subsidiaries which conduct business in various parts of the world. Talisman Energy Inc.’s financial statements are prepared on a consolidated basis. For ease of reference, throughout this MD&A the terms “Talisman” and the “Company” are used to refer collectively to Talisman Energy Inc., its direct and indirect subsidiaries and partnership interests held by Talisman Energy Inc. and its subsidiaries, unless the context indicates otherwise.
Additional information relating to the Company, including the Company’s Annual Information Form, can be found on the Canadian System for Electronic Document Analysis and Retrieval (SEDAR) at www.sedar.com. The Company’s annual report on Form 40-F may be found in the EDGAR database at www.sec.gov.
2 T A L I S M A N E N E R G Y I N C .
M a n a g e m e n t ’ s D i s c u s s i o n a n d A n a l y s i s
Talisman’s Performance Highlights in 2004
In 2004, total production averaged 438 mboe/d and the Company exited the year producing 452 mboe/d in December. Net income was $663 million ($1.77/share) as higher world commodity prices and increased production were partially offset by the impact of the stronger Canadian dollar in relation to its US counterpart and increased hedging losses, royalties, operating expenses, DD&A and taxes. Net income of $1,012 million in 2003 included the gain on the Sudan sale of $296 million and a $160 million gain from Canadian federal and provincial tax rate reductions.
During 2004, nine million shares were repurchased at an average price of $31.81/share, debt plus preferred securities decreased by $177 million and the Company’s semi-annual dividend rate increased 12.5% to $0.15/share.
Operational highlights for the year included the completion of the Angostura oil and gas field development located on Block 2(c) offshore Trinidad with first oil in January 2005 and the Monkman b-60-E deep gas well discovery in Canada. In the North Sea, first production from the Tartan North field was two months ahead of schedule and approval for the development of the Tweedsmuir fields was received. In Indonesia, an agreement was signed to sell an additional 2.3 tcf of natural gas from the Corridor PSC, in which Talisman has a 36% interest.
In 2004, production averaged 438 mboe/d, 10% above last year’s average. Production per share increased 11%. Talisman spent $2.5 billion on exploration and development activities and participated in drilling 641 successful wells in 2004. During 2003 and 2002, production averaged 398 mboe/d and 445 mboe/d, respectively. These figures include the results of the Sudan operations which were sold during the first quarter of 2003. Excluding Sudan operations, production averaged 385 mboe/d in both 2003 and 2002.
In 2004, Talisman added 265 mmboe of proved reserves, before acquisitions and dispositions, replacing 166% of production. Including acquisition and disposition activity, the Company added 286 mmboe of proved reserves, replacing 179% of production.
| Net Income | | Net Income Per Share |
| ( m i l l i o n s o f d o l l a r s ) | | ( d o l l a r s ) |
 | |  |
| | |
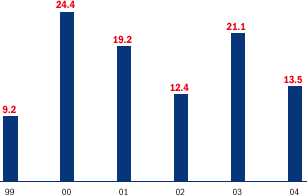
| Gross Sales | | Return on Equity |
| ( m i l l i o n o f d o l l a r s ) | | ( % ) |
 | |  |
M a n a g e m e n t ’ s D i s c u s s i o n a n d A n a l y s i s
2 0 0 4 A N N U A L R E P O R T 3
2004 Variances
The significant variances from 2003 as summarized in the net income variance table are:
- Higher commodity prices and increased production more than offset the impact of the strengthening of the Canadian dollar and higher royalties.
- Higher commodity prices increased hedging losses.
- Operating expense increased due to current year acquisitions in the North Sea.
- Current taxes rose as a result of increased commodity prices and higher production.
- Cash stock-based compensation payments increased by $35 million.
- The gain on the sale of the Sudan operations in 2003 was $296 million.
- Depreciation, depletion and amortization expense increased $215 million as a result of higher production and increased costs in North America.
- The non-cash portion of the stock-based compensation expense decreased by $49 million (before tax).
- Future taxes are lower in 2004 due to higher cash taxes.
2005 Outlook Summary
Talisman anticipates 2005 production per share to grow to approximately 0.44-0.47 boe/share. Additional discussion of management’s estimates and assumptions for 2005 can be found in the MD&A section entitled Outlook for 2005.
- Production is expected to average 445,000-475,000 boe/d, without acquisitions or dispositions.
- Production increases are expected in most of the Company’s geographic segments with the majority coming from international projects.
- Exploration and development spending is expected to be $3.1 billion ($1.4 billion in North America and $1.0 billion in the North Sea).
- The development of the Tweedsmuir and Tweedsmuir South fields in the North Sea will continue with anticipated production start-up in late 2006 (adding approximately 45,000 boe/d in 2007).
- The Trinidad development project started production in January 2005 and is expected to average 12,000-16,000 bbls/d, net to Talisman, in 2005.
- Long-term debt is expected to remain relatively unchanged at $2.5 billion.
| Net Income(millions of dollars) | | |
| 2003 Net income1 | 1,012 | |
| Favorable (unfavorable) | | |
| Cash items variance | | |
| Oil and liquids volumes | 164 | |
| Natural gas volumes | 342 | |
| Natural gas prices | 216 | |
| Natural gas foreign exchange price impact | (174) | |
| Oil and liquids prices | 1,020 | |
| Oil and liquids foreign exchange price impact | (304) | |
| Hedging — Commodities | (286) | |
| Royalties | (230) | |
| Other revenue | 9 | |
| Operating expense | (159) | |
| Transportation expense | (11) | |
| Interest expense | (21) | |
| Current taxes (including Petroleum Revenue Tax) | (301) | |
| General and administrative | (31) | |
| Stock-based compensation payments | (35) | |
| Other | 3 | |
| Total cash items variance | 202 | |
| Non-cash items | | |
| Gain on sale of Sudan | (296) | |
| Depreciation, depletion and amortization expense | (215) | |
| Dry hole expense | (60) | |
| Exploration expense | (25) | |
| Future taxes (including Petroleum Revenue Tax) | 72 | |
| Stock-based compensation (non-cash) | 49 | |
| Other | (76) | |
| Total non-cash items variance | (551) | |
| 2004 Net income | 663 | |
1
| Restatement of prior year to effect retroactive adoption of the new accounting policy on asset retirement obligations as at January 1, 2004. See note 6 to the Consolidated Financial Statements.
|
Sale of Sudan Operations
On March 12, 2003, Talisman completed the sale of an indirectly held subsidiary, which owned an interest in the Greater Nile Oil Project in Sudan, to ONGC Videsh Limited, a subsidiary of India’s national oil company. The aggregate amount realized by Talisman from the transaction (including interest and cash received by Talisman between September 1, 2002 and closing) was $1.13 billion (US$771 million). (See note 19 to the Consolidated Financial Statements.)
Segmented Results Review
Talisman is an independent international upstream oil and gas company whose main business activities include exploration, development, production, transporting and marketing of crude oil, natural gas and natural gas liquids. The Company’s operations in 2004 were conducted principally in four geographic segments: North America, the North Sea, Southeast Asia and Algeria. The Trinidad Angostura project began production in January 2005. Exploration is being advanced in other areas outside the principal geographic segments including Alaska, Colombia, Qatar and Peru. The Company’s indirectly held interest in the Greater Nile Oil Project in Sudan
4 T A L I S M A N E N E R G Y I N C .
M a n a g e m e n t ’ s D i s c u s s i o n a n d A n a l y s i s
was sold on March 12, 2003. The following is a brief summary of the financial results of each geographic segment. Additional geographic financial results disclosure may be found in note 20 of the Consolidated Financial Statements. The Company’s pre-tax segmented income as discussed below is before corporate general and administration, interest, stock-based compensation, taxes and non-segmented foreign exchange gains and losses. Effective January 1, 2004, with the adoption of the new hedge accounting rules (see notes 1(k) and 11 to the Consolidated Financial Statements) the Company allocates hedging gains and losses on the basis of the percentage of relative hedged production. More detailed analysis of the Company’s results can be found after this Segmented Results Review.
North America (excludes Alaska)
During 2004, the North America operations contributed $877 million or 51% of the Company’s pre-tax segmented income of $1.7 billion, down from $892 million (61% of $1.5 billion) in 2003. Gross sales in North America increased 9% to $3.1 billion due principally to higher commodity prices and natural gas production. North American production averaged 205,000 boe/d, up 1% over 2003, and represented 47% of the Company’s total production in 2004. North American operating expense increased 7% to $421 million due to increased natural gas volumes, higher processing fees and well workover and maintenance costs. DD&A increased to $785 million, up from $688 million due to higher production and 2003 acquisitions. Exploration expense increased to $123 million due to the expanded exploration budget. Total exploration and development spending for North America in 2004 was $1.5 billion, up 31% over 2003.
North Sea
The North Sea pre-tax segmented income increased to $486 million and accounted for 28% of the Company’s pre-tax segmented income during 2004, down from 30% in 2003. North Sea gross sales increased 30% to $2.4 billion due primarily to higher prices and increased liquids production, resulting from current year acquisitions. Production averaged 140,800 boe/d or 32% of the Company’s total production. This 7% increase in production also contributed to increases in operating expenses of $134 million and DD&A expense of $45 million. Royalty expense increased due to prior period adjustments in 2003. Dry hole expense increased to $109 million with the inclusion of costs associated with eight wells. Exploration and development spending for the North Sea was $507 million, up 2% from 2003.
Production
( m b o e / d )

Southeast Asia
Southeast Asia contributed 22% ($379 million) to the Company’s pre-tax segmented income in 2004. Gross sales increased 83% to $1.1 billion with a full year of production from PM-3 CAA in Malaysia/Vietnam and increases from Corridor in Indonesia. Southeast Asia production averaged 79,000 boe/d, an increase of 80% over 2003 and contributed 18% to the Company’s total production. Total operating expenses increased 14% from 2003 to $98 million, but unit costs were down 37% to $3.39 per boe as a result of the increase in production mainly related to the low unit cost PM-3 CAA volumes. DD&A expense increased with the growth in production. Capital spending for Southeast Asia was $255 million, down 19% from 2003.
Algeria
Algeria contributed 6% ($97 million) to the Company’s pre-tax segmented income in 2004. Gross sales increased 170% to $254 million with continuing production increases after startup in 2003. Production for 2004 averaged 13,500 bbls/d. Unit operating costs in 2004 decreased 31% to $3.51/bbl as a result of the production increases. Capital spending for Algeria was $8 million, down 76% from 2003 due to the completion of the initial development phase of the Greater MLN project.
Other Exploration and Development
Development continued on the Angostura oil and gas field located on Block 2(c) offshore Trinidad. Including exploratory drilling on the adjacent Block 3(a) and 3D seismic on the onshore Eastern Block, the Company spent $191 million in Trinidad during 2004. Production from the Angostura field started in January 2005. Elsewhere, during 2004 the Company spent $125 million, the majority of which was in Alaska, Colombia, Qatar and Peru.
Corporate Results Review
Revenue
Revenues from oil, liquids and natural gas sales in 2004 were $6.9 billion, up 23% over last year due to higher oil and liquids prices ($716 million), gas volumes ($342 million), oil and liquids volumes ($164 million) and natural gas prices ($42 million). As a result of higher prices, hedging losses in 2004 were $286 million greater than 2003.
| Daily Production Volumes | | | | | | |
| | 2004 | | 2003 | | 2002 | |
| Oil and liquids (mbbls/d) | | | | | | |
| North America | 57.4 | | 59.6 | | 62.7 | |
| North Sea | 121.9 | | 113.1 | | 127.5 | |
| Southeast Asia | 35.6 | | 24.4 | | 22.5 | |
| Algeria | 13.5 | | 6.6 | | — | |
| Sudan | — | | 13.0 | | 60.0 | |
| | 228.4 | | 216.7 | | 272.7 | |
| Natural gas (mmcf/d) | | | | | | |
| North America | 885 | | 864 | | 820 | |
| North Sea1 | 114 | | 109 | | 122 | |
| Southeast Asia | 260 | | 117 | | 94 | |
| | 1,259 | | 1,090 | | 1,036 | |
| Total (mboe/d @ 6:1) | 438 | | 398 | | 445 | |
| Production per share (boe/share) | 0.42 | | 0.38 | | 0.40 | |
1 Includes gas acquired for injection and subsequent resale of 5 mmcf/d in 2004.
M a n a g e m e n t ’ s D i s c u s s i o n a n d A n a l y s i s
2 0 0 4 A N N U A L R E P O R T 5
In 2004, production averaged 438 mboe/d for the year, 10% above last year’s average. Production per share increased 11%. The 2003 and 2002 production averages of 398 mboe/d and 445 mboe/d, respectively, include the results of the Sudan operations which were sold during the first quarter of 2003. Excluding the Sudan operations, production averaged 385 mboe/d in both 2003 and 2002. Production in 2004 was 14% higher than the previous year, excluding the Sudan production.
During 2004, North America natural gas production increased by 21 mmcf/d to 885 mmcf/d. This 2% growth in production is due to Talisman’s drilling program. During 2004, Talisman drilled 620 wells in North America with a 94% success rate. Significant production increases were achieved in Appalachia which averaged 89 mmcf/d, up 29 mmcf/d, and in Alberta Foothills, up 21 mmcf/d to 151 mmcf/d, as new wells were brought onstream, which more than offset decreases resulting from natural declines. North America oil and liquids production averaged 57,392 bbls/d during the year, down 4% from 2003 due to natural declines and the Company’s continued focus on natural gas.
North Sea oil and liquids production averaged 121,861 bbls/d, an increase of 8% over 2003, due to the impact of drilling results and asset acquisitions. During 2004, the Company completed a number of acquisitions, one of which increased the Company’s interest in a number of fields in the Flotta Catchment Area. The Company also acquired a 67% interest in the Galley field, as well as additional minor working interests in other North Sea fields and exploration blocks. During the fourth quarter, production averaged 127,943 bbls/d, up 15% over the third quarter, and exited 2004 with production of 132,000 bbls/d in December. North Sea production highlights for 2004 included the startup of the Tartan North development ahead of schedule in August. North Sea natural gas production increased 5% to 114 mmcf/d.
Southeast Asia oil and liquids production averaged 35,644 bbls/d in 2004, an increase of 46% over 2003. Total production for the year in Malaysia/Vietnam increased to 22,388 bbls/d from 8,672 the previous year, reflecting a full year of production from the PM-3 CAA Phase 2 development project, which came on stream in September 2003. Indonesia oil and liquids production averaged 13,255 bbls/d, down 16% from 2003 due to natural decline and the expiry of the Tanjung contract during the fourth quarter of 2004.
Southeast Asia natural gas production increased 122% to 260 mmcf/d in 2004. Natural gas production from PM-3 CAA Phase 2 increased to 119 mmcf/d in 2004, due to a full year of Phase 2 production. Natural gas sales in Indonesia averaged 141 mmcf/d with higher Corridor sales to Caltex and a full year of sales to Singapore, which commenced in September of 2003, under a 20 year contract with Gas Supply Pte Ltd.
Algeria oil production for 2004 averaged 13,537 bbls/d, up from 6,594 bbls/d in 2003 which reflected a partial year of production.
| Commodity Prices1 | | | | | | |
| | 2004 | | 20032 | | 20022 | |
| Oil and liquids ($/bbl) | | | | | | |
| North America | 42.11 | | 35.78 | | 32.81 | |
| North Sea | 48.29 | | 39.72 | | 38.76 | |
| Southeast Asia | 51.29 | | 41.35 | | 40.12 | |
| Algeria | 51.17 | | 39.01 | | — | |
| Sudan | — | | 43.89 | | 37.79 | |
| | 47.45 | | 39.09 | | 37.34 | |
| Natural gas ($/mcf) | | | | | | |
| North America | 6.83 | | 6.58 | | 4.20 | |
| North Sea | 5.55 | | 4.77 | | 4.16 | |
| Southeast Asia | 4.74 | | 5.72 | | 5.65 | |
| | 6.28 | | 6.30 | | 4.33 | |
| Company $/boe (6 mcf=1 boe) | 42.75 | | 38.51 | | 32.89 | |
| Hedging loss/(income) excluded from the above prices | | | | | | |
| Oil and liquids ($/bbl) | 5.42 | | 2.05 | | 0.09 | |
| Natural gas ($/mcf) | 0.07 | | 0.08 | | (0.22) | |
| Total $/boe (6mcf=1boe) | 3.02 | | 1.34 | | (0.46) | |
| Benchmark prices | | | | | | |
| WTI (US$/bbl) | 41.40 | | 30.99 | | 26.15 | |
| Dated Brent (US$/bbl) | 38.22 | | 28.83 | | 25.03 | |
| NYMEX (US$/mmbtu) | 6.09 | | 5.44 | | 3.25 | |
| AECO (C$/gj) | 6.44 | | 6.35 | | 3.86 | |
| US$/Canadian$ exchange rate | 0.768 | | 0.714 | | 0.637 | |
| Canadian$/Pound sterling exchange rate | 2.384 | | 2.288 | | 2.358 | |
1
| Prices exclude gains or losses related to hedging activities and do not include synthetic oil.
|
2
| During 2004, the Company reclassified transportation costs on a retroactive basis. Previously, these costs had been partially netted off against realized prices. See note 2 to the Consolidated Financial Statements.
|
World oil prices reached record levels during 2004, with WTI averaging US$41.40/bbl, a 34% increase over the 2003 WTI average of US$30.99/bbl. North American natural gas prices increased 12% over 2003 with NYMEX averaging US$6.09/mmbtu.
More than 90% of the Company’s revenues are either received in US dollars or are closely referenced to US dollars. The Company converts these revenues to Canadian dollars for reporting purposes. The strengthening of the Canadian dollar reduced Talisman’s reported oil and liquids price by $3.62/bbl to $47.45/bbl, a 21% increase over 2003. During the same time period, WTI increased 34% to average US$41.40 during 2004. Talisman’s North America oil and liquids price averaged $42.11/bbl, up 18% from last year. The Company’s North Sea oil and liquids price averaged $48.29/bbl, up 22% over 2003. The Company’s Southeast Asia oil and liquids price averaged $51.29/bbl, up 24% over 2003. The Company’s Algeria oil price averaged $51.17/bbl, up 31% over 2003, as the price was impacted by the timing of production liftings.
Talisman’s average natural gas price in North America increased 4% to $6.83/mcf. The strengthening of the Canadian dollar during 2004 reduced Talisman’s reported North America natural gas price by
6 T A L I S M A N E N E R G Y I N C .
M a n a g e m e n t ’ s D i s c u s s i o n a n d A n a l y s i s
$0.47/mcf. The Company’s North Sea natural gas price increased 16% as a result of an increase in the spot price due to tightening supply/demand fundamentals.
The Company’s natural gas price in Southeast Asia averaged $4.74/mcf, down 17% from 2003, due to the increase in sales from Malaysia/Vietnam, where prices are referenced to the Singapore fuel oil spot market and averaged $3.09/mcf in 2004. Gas production from Malaysia/Vietnam accounted for 46% of Southeast Asia gas production during the current year, up from 4% of total 2003 production for the area. A large portion of Corridor gas production which constituted approximately 51% of the Company’s 2004 gas sales in Southeast Asia, is exchanged for Duri crude oil on an energy equivalence relationship and is sold offshore with payment in US dollars, and averaged $6.38/mcf.
The Company’s average sales prices are before a net hedging loss of $480 million, comprised of a $0.07/mcf loss on gas hedges (2003 — $0.08/mcf loss) and a $5.42/bbl loss on oil hedges (2003 —$2.05/bbl loss). The physical and financial commodity price contracts for 2005 outstanding at year end are disclosed in notes 11 and 12 to the Consolidated Financial Statements with additional discussion in the MD&A section entitled Derivative Financial Instruments and Commodity Sales Contracts. Additional discussion of the expected impact of commodity price contracts on the Company’s 2005 results can be found in the Outlook for 2005 section of this MD&A. The Company’s accounting policy with respect to derivative financial instruments and commodity contracts is disclosed in note 1(k) to the Consolidated Financial Statements.
| Royalties1 | | | | | | | | | | | | |
| | | | | | | | | | | | | |
| | 2004 | | 20032 | | 20022 | |
| | Rates (%) | | $millions | | Rates (%) | | $millions | | Rates (%) | | $millions | |
| Oil and liquids | | | | | | | | | | | | |
| North America | 20 | | 174 | | 21 | | 155 | | 21 | | 149 | |
| North Sea | 1 | | 19 | | — | | (3)4 | | 74 | | | |
| Southeast Asia | 41 | | 277 | | 39 | | 143 | | 37 | | 122 | |
| Algeria | 38 | | 97 | | 49 | | 46 | | — | | — | |
| Sudan | — | | — | | 46 | | 97 | | 40 | | 328 | |
| | 14 | | 567 | | 14 | | 438 | | 18 | | 673 | |
| Natural gas | | | | | | | | | | | | |
| North America | 19 | | 425 | | 21 | | 432 | | 18 | | 224 | |
| North Sea | 8 | | 18 | | 6 | | 11 | | 12 | | 21 | |
| Southeast Asia | 25 | | 114 | | 5 | | 13 | | 4 | | 9 | |
| | 19 | | 557 | | 18 | | 456 | | 15 | | 254 | |
| | 16 | | 1,124 | | 16 | | 894 | | 17 | | 927 | |
1
| Royalty rates do not include synthetic oil.
|
2
| During 2004, the Company reclassified transportation costs as an expense on a retroactive basis. Previously, these costs had been partially netted off against revenues. This change has no impact on net income, but increased revenues, resulting in reduced royalty rates, which are percentages of reported prices. See note 2 to the Consolidated Financial Statements.
|
The consolidated royalty expense increased 26% to $1,124 million in 2004, due to higher commodity prices, increased volumes and rate increases in Southeast Asia.
In North America, natural gas royalties decreased slightly to $425 million, averaging 19%, down from 21% in 2003. This reflects higher gas cost allowance, operating costs and royalty holidays, in addition to the increase to 89 mmcf/d in the Company’s Appalachia production, which had a lower royalty rate.
In Southeast Asia, the natural gas royalty rate increased as a result of the impact of the payout of cost recovery pools at Corridor during the first quarter of 2004. Under the terms of the Corridor production sharing contract (PSC),after the Company has recovered its historical capital costs, the Government of Indonesia increases its share of production, which results in a higher royalty rate. Corridor’s natural gas royalty rate averaged 29% during 2004, compared to 5% in the prior year. The Southeast Asia royalty rate was also impacted by a higher proportion of Malaysia/Vietnam volumes at a royalty rate of 24%. Under the terms of the production sharing contract in Malaysia, 60% of gas production is available for cost recovery. The government receives 10% of production as royalty and the remaining 30% profit gas is split 50% to the government and 50% to the working interest owners. This results in a total royalty of 25%, which is combined with a 13% royalty rate in Vietna m for a blended rate of 24%. This royalty rate is expected to continue until the Malaysia gas cost pools are recovered in 2013, based on current forecasts of production and prices.
The Company’s oil and liquids royalty rate remained constant at 14%, while the amount of royalties paid increased 29% to $567 million. This increase is due primarily to a combination of higher prices and production increases in Southeast Asia and Algeria, partially offset by the sale of the Sudan operations. Southeast Asia oil and liquids royalties averaged 41% in 2004, up from 39% in 2003. The total expense almost doubled to $277 million due to production increases in Malaysia/Vietnam where rates, which are tied to production levels, reached a current maximum of 35%, up from 31% last year. Under the terms of the production sharing contract in Malaysia, 50% of oil production is available for cost recovery. The government receives 10% of production as royalty and the remaining 40% profit oil is split 70% to the government and 30% to the working interest owners. This results in a total royalty of 38%, which is combined with an 18% royalty rate in Vietnam for a blended rate o f 35%. This royalty rate is expected to continue until the Malaysia oil cost pools are recovered in the second half of 2006 based on current forecasts of production and prices. In 2007, the rate is expected to increase to approximately 41%.
In Algeria, the royalty expense more than doubled to $97 million as production increased 105% from last year, while the rate decreased to 38% from 49%.
Under the terms of the Algeria production sharing contractual arrangement, Talisman is subject to a 51% total government take, part of which is income tax, during the first five years of production. During the first four years of production, Talisman receives accelerated production entitlement. During the fifth year of the agreement, any accelerated production entitlement received by Talisman during the first four years in excess of 49% on a cumulative basis reverts to the government.
M a n a g e m e n t ’ s D i s c u s s i o n a n d A n a l y s i s
2 0 0 4 A N N U A L R E P O R T 7
Accordingly, during the first four years of production, Talisman will record a deferred royalty expense and liability for any production entitlement received in excess of 49%. During 2004, Talisman recorded deferred Algerian royalties of $18 million, for a total of $32 million to date. In both 2004 and 2003, total taxes and royalties combined to average a rate of 51%.
Operating Expenses and Unit Operating Costs
| | 2004 | | 20031 | | 20021 | |
| Oil and liquids | $/bbl | | $millions | | $/bbl | | $millions | | $/bbl | | $millions | |
| North America | 6.75 | | 135 | | 6.28 | | 131 | | 5.55 | | 121 | |
| North Sea | 13.27 | | 592 | | 11.51 | | 475 | | 9.87 | | 459 | |
| Southeast Asia | 5.57 | | 73 | | 7.22 | | 64 | | 7.77 | | 64 | |
| Algeria | 3.51 | | 17 | | 5.07 | | 12 | | — | | — | |
| Sudan | — | | — | | 3.73 | | 18 | | 3.82 | | 84 | |
| | 9.89 | | 817 | | 8.96 | | 700 | | 7.39 | | 728 | |
| Natural gas | $/mcf | | $millions | | $/mcf | | $millions | | $/mcf | | $millions | |
| North America | 0.79 | | 257 | | 0.75 | | 237 | | 0.71 | | 212 | |
| North Sea | 0.55 | | 23 | | 0.37 | | 14 | | 0.43 | | 19 | |
| Southeast Asia | 0.27 | | 25 | | 0.50 | | 22 | | 0.59 | | 21 | |
| | 0.66 | | 305 | | 0.69 | | 273 | | 0.67 | | 252 | |
| Company (boe) | 7.04 | | 1,122 | | 6.74 | | 973 | | 6.44 | | 980 | |
| Synthetic oil | 20.67 | | 23 | | 22.63 | | 22 | | 18.00 | | 19 | |
| Pipeline | — | | 53 | | — | | 44 | | — | | 49 | |
| | — | | 1,198 | | — | | 1,039 | | — | | 1,048 | |
1
| During 2004, the Company reclassified transportation costs on a retroactive basis. Previously, these costs had been partially included in operating expenses. See note 2 to the Consolidated Financial Statements.
|
Total operating expenses for the Company during 2004 were $1.2 billion, 15% higher than last year, with the North Sea comprising $134 million or almost 84% of the $159 million year-over-year increase. On a per unit basis, oil and liquids costs increased 10% to $9.89/bbl and natural gas costs averaged $0.66/mcf, a 4% decrease from 2003.
North America oil and liquids operating costs during 2004 were $135 million, an increase of 3% from 2003, due to increases in maintenance and well workovers, partially offset by reduced power costs. On a per unit basis, the increase in total costs coupled with a 4% decrease in volumes resulting in a 7% increase to $6.75/bbl. Unit operating costs for natural gas increased 5% to $0.79/mcf with higher processing and maintenance and well workover costs partially offset by reduced power costs and the lower unit operating costs ($0.25/mcf) in Appalachia.
In 2004, North Sea operating expenses of $615 million were up $126 million or 26% over last year due to the impact of increased production resulting from recent acquisitions and a 4% strengthening in the pound sterling against the Canadian dollar. The acquisitions resulted in an increase of $97 million of the $126 million increase over 2003. Unit operating costs averaged $11.93/boe which reflects increased maintenance and well workover costs as well as pipeline repair costs at Beatrice.
Southeast Asia unit operating costs decreased 37% to $3.39/boe, due to higher PM-3 CAA and Corridor sales volumes. Oil and liquids unit costs averaged $5.57/bbl, down 23% from the prior year.
In Malaysia/Vietnam, PM-3 CAA unit costs averaged $2.10/bbl, a 66% decrease from 2003, due to increased production volumes. Indonesia unit costs increased 46%, averaging $11.44/bbl, primarily reflecting increased costs and decreased volumes associated with the expiry of the Tanjung contract during the fourth quarter of 2004. Southeast Asia natural gas unit costs averaged $0.27/mcf, 46% less than 2003. At Corridor, total gas expenses decreased by $1 million and production increased by 26% for an average of $0.38/mcf, 25% less than last year. Malaysia/Vietnam averaged $0.12/mcf as production increased to 119 mmcf/d, up from 5 mmcf/d in 2003.
Algeria unit operating costs averaged $3.51/bbl, a decrease of 31% from $5.07/bbl, due to the production increase in 2004.
Transportation Expenses
Effective 2004, the Company began accounting for transportation costs as expenses, on a retroactive basis. Previously, these costs had been either netted off against the realized price or included as a component of operating costs, depending on the circumstances in the various geographic segments. Prior year comparatives were restated to reflect this change in accounting policy. See note 2 to the Consolidated Financial Statements for further details. The result of this reclassification, which had no impact on net income, is set forth in the table below:
| | 2004 | | 2003 | | 2002 | |
| Oil and liquids($/bbl) | | | $millions | | | | $millions | | | | $millions | |
| North America | 0.49 | | 10 | | 0.48 | | 10 | | 0.38 | | 9 | |
| North Sea | 1.14 | | 51 | | 1.16 | | 48 | | 1.24 | | 56 | |
| Southeast Asia | 0.23 | | 3 | | 0.41 | | 4 | | 0.82 | | 7 | |
| Algeria | 1.76 | | 9 | | 1.77 | | 4 | | — | | — | |
| Natural gas($/mcf) | | | | | | | | | | | | |
| North America | 0.20 | | 66 | | 0.21 | | 67 | | 0.24 | | 71 | |
| North Sea | 0.35 | | 14 | | 0.37 | | 15 | | 0.45 | | 20 | |
| Southeast Asia | 0.41 | | 39 | | 0.77 | | 33 | | 0.93 | | 31 | |
| | | | 192 | | | | 181 | | | | 194 | |
Depreciation, Depletion and Amortization Expense (includes accretion of ARO)
| | 2004 | | 20031 | | 20021 | |
| | $/boe | | $millions | | $/boe | | $millions | | $/boe | | $millions | |
| North America | 10.47 | | 785 | | 9.26 | | 688 | | 8.32 | | 606 | |
| North Sea | 12.83 | | 661 | | 12.85 | | 616 | | 12.54 | | 676 | |
| Southeast Asia | 6.02 | | 174 | | 5.92 | | 95 | | 6.24 | | 87 | |
| Algeria | 5.99 | | 30 | | 6.99 | | 17 | | — | | — | |
| Sudan | — | | — | | 3.98 | | 19 | | 4.24 | | 93 | |
| | 10.29 | | 1,650 | | 9.87 | | 1,435 | | 8.99 | | 1,462 | |
1
| Restatement of prior year to effect retroactive adoption of the new accounting policy on asset retirement obligations (ARO) as at January 1, 2004. See note 6 to the Consolidated Financial Statements.
|
The Company’s 2004 depreciation, depletion and amortization (DD&A) expense increased $215 million or 15% to $1.7 billion, with a per unit rate of $10.29/boe. During the fourth quarter of 2004, the Company
8 T A L I S M A N E N E R G Y I N C .
M a n a g e m e n t ’ s D i s c u s s i o n a n d A n a l y s i s
recorded an adjustment to DD&A related to prior quarters of the year and changed the estimated lives of certain assets. The DD&A rates in North America increased primarily due to higher drilling costs, increased capital expenditures on infrastructure projects and the inclusion of costs associated with US property and midstream acquisitions in 2003. In the North Sea, total expense increased 7% to $661 million due to the impact of increased production, while the unit rate remained constant. Total DD&A expense for Southeast Asia increased primarily as a result of increased production from Malaysia/Vietnam, which has a higher DD&A rate.
For additional information relating to DD&A refer to the MD&A section entitled Application of Critical Accounting Policies and to note 5 to the Consolidated Financial Statements.
| Dry Hole Expense | | | | | | |
| | | | | | | |
| (millions of dollars) | 2004 | | 2003 | | 2002 | |
| North America | 128 | | 135 | | 128 | |
| North Sea | 109 | | 69 | | 9 | |
| Southeast Asia | 25 | | 9 | | 4 | |
| Algeria | 4 | | 1 | | — | |
| Sudan | — | | — | | 13 | |
| Other | 45 | | 37 | | 20 | |
| | 311 | | 251 | | 174 | |
During 2004, the Company incurred dry hole expenses of $311 million, $60 million higher than last year. In the North Sea, a total of seven wells were expensed and accounted for the majority of the overall increase. The Company also wrote off two wells in Indonesia, four wells in Malaysia/Vietnam and four wells in the rest of the world.
Under the successful efforts method of accounting for oil and gas activities, the costs of unsuccessful and non-commercial exploration wells are written off to dry hole expense in the year such determination is made. Until such determination is made, the costs are included in non-depleted capital. At year end, $284 million of costs relating to exploration wells were included in non-depleted capital and not subject to DD&A pending final determination, the majority of which were drilled in 2004 (2003 — $283 million; 2002 — $353 million).
| Exploration Expense | | | | | | |
| | | | | | | |
| (millions of dollars) | 2004 | | 2003 | | 2002 | |
| North America | 123 | | 87 | | 66 | |
| North Sea | 28 | | 21 | | 20 | |
| Southeast Asia | 20 | | 17 | | 19 | |
| Algeria | — | | — | | 5 | |
| Sudan | — | | 5 | | 6 | |
| Other1 | 67 | | 83 | | 69 | |
| | 238 | | 213 | | 185 | |
1 Other includes Trinidad, Qatar and Alaska.
Exploration expense consists of geological and geophysical costs, seismic, land lease rentals and indirect exploration expenses. These costs are expensed as incurred under the successful efforts method of accounting.
Exploration expense is closely tied to the total amount of exploration activity in a year.
| Corporate and Other | | | | | | |
| | | | | | | |
| (millions of dollars) | 2004 | | 2003 | | 2002 | |
| G&A expense | 183 | | 152 | | 138 | |
| Interest expense | 158 | | 137 | | 164 | |
| Capitalized interest | 13 | | 24 | | 25 | |
| Stock-based compensation | 171 | | 185 | | — | |
| Preferred securities charges | 15 | | 38 | | 42 | |
| Other revenue | 85 | | 76 | | 80 | |
| Other expense | 89 | | 16 | | 113 | |
General and administrative (G&A) expense increased due to salary increases and additional personnel due to expanding investment and operations, additional documentation requirements associated with corporate governance initiatives, and higher legal and pension costs. On a unit basis, G&A was $1.14/boe (2003 — $1.05/boe; 2002 — $0.85/boe).
As a result of the reduction in the total balance of long-term debt and preferred securities, partially offset by higher effective interest rates during the year, the sum of interest on long-term debt, capitalized interest and preferred securities charges decreased by $13 million to $186 million. Interest capitalized over the last year is primarily associated with the Angostura development in Trinidad, which came on production in January 2005, and the Tweedsmuir development project in the North Sea.
During 2004, the Company redeemed its outstanding preferred securities, realizing a $23 million gain (net of tax), being the difference between the carrying value and the redemption cost. The redemptions were funded from current cash flow and bank borrowings, and gains were credited directly to retained earnings. Preferred securities charges, net of taxes, of $9 million have been charged directly to retained earnings. Preferred securities charges, before tax, totaled $15 million. Net income per share includes both the after tax gain on the redemption of, and after tax charges for, preferred securities.
Other revenue includes pipeline and custom treating revenues and miscellaneous income. Other expense for 2004 included foreign exchange losses of $30 million, property impairments in the North Sea at Iona and Claymore of $31 million, a net loss on property dispositions of $30 million, and a $20 million insurance expense adjustment partially offset by a gain on the unwinding of cross currency and interest rate swap contracts of $15 million. The loss on property dispositions was comprised of a loss of $49 million on a sale of North American assets partially offset by gains on other dispositions, principally the sale of the Madura property in Indonesia.
Stock-Based Compensation
Stock-based compensation expense relates to the appreciated value of the Company’s outstanding stock options and cash units at December 31, 2004, which was first expensed during 2003. The Company’s stock-based compensation expense is based on the difference between the Company’s share price and its stock options, or cash units exercise price. The $171 million expensed in 2004 was comprised of $89 million
M a n a g e m e n t ’ s D i s c u s s i o n a n d A n a l y s i s
2 0 0 4 A N N U A L R E P O R T 9
non-cash and $82 million cash. The number of options exercised in 2004 was high relative to historical trends. Over the course of the year, the average exercise price of all outstanding options increased from $17.55 per share to $19.58 per share.
The Company’s stock option plans were amended during 2003 to provide employees and directors who hold stock options with the choice upon exercise to purchase a share of the Company at the stated exercise price or to receive a cash payment in exchange for surrendering the option. The cash payment is equal to the appreciated value of the stock option as determined based on the difference between the option’s exercise price and the Company’s share price approximately at the time of surrender. The cash payment alternative is expected to result in reduced shareholder dilution in the future as it is anticipated that most holders of the stock options (now and in the future) will elect to take a cash payment. Such cash payments made by the Company to stock option holders are deductible by the Company for income tax purposes, making these plans more cost effective.
Since the introduction of the cash feature, approximately 98% of options that have been exercised, have been exercised for cash, resulting in reduced dilution of shares.
Additional stock-based compensation expense or recoveries in future periods is dependent on the movement of the Company’s share price and the number of outstanding options and cash units.
Income Taxes
The Company’s effective tax rate for 2004, after deducting Petroleum Revenue Tax (PRT), was 36% compared to 15% in 2003 and 44% in 2002. A number of events in the past two years have significantly impacted the Company’s effective tax rates including tax rate reductions in Canada, sale of the Company’s indirectly held interest in the Greater Nile Oil Project in Sudan in 2003 and a supplemental oil and gas tax enacted in the UK in 2002.
| Effective Income Tax Rate | | | | | | |
| (millions of dollars) | 2004 | | 20031 | | 20021 | |
| Income before tax | 1,165 | | 1,285 | | 1,101 | |
| Less PRT | | | | | | |
| Current | 124 | | 72 | | 91 | |
| Future | 5 | | 20 | | 33 | |
| | 129 | | 92 | | 124 | |
| | 1,036 | | 1,193 | | 977 | |
| Income tax expense/(recovery) | | | | | | |
| Current | 478 | | 229 | | 258 | |
| Future | (105) | | (48) | | 175 | |
| | 373 | | 181 | | 433 | |
| Effective income tax rate (%) | 36 | | 15 | | 44 | |
1
| Restatement of prior year to effect retroactive adoption of the new accounting policy on asset retirement obligations as at January 1, 2004. See note 6 to the Consolidated Financial Statements.
|
In 2004, the Company recorded a future tax recovery of $50 million due to a reduction in Canadian federal and provincial tax rates, compared to a $160 million recovery of future taxes in 2003 for both Canadian rates. A similar reduction in the Alberta corporate tax rate in 2002 resulted in a future tax recovery of $12 million. Effective April 17, 2002, the UK increased its corporate income tax rate applicable to North Sea oil and gas profits by enacting a 10% supplementary charge. This increased the Company’s future tax expense for 2002 by $128 million. Partially offsetting this tax increase was the acceleration of tax allowances for capital expenditures incurred after April 17, 2002.
A normalized effective tax rate after removing the impact of the Canadian and UK tax rate changes, the tax on unrealized foreign exchange gains on foreign denominated debt and the impact of the gain on disposal of the Sudan operations would have been 37% in 2004, 34% in 2003 and 35% in 2002. Foreign exchange rate fluctuations over the past two years have resulted in taxes on gains related to inter-company loans and non-Canadian dollar denominated debt, for which there is no corresponding component of the unrealized gain reflected in income before taxes. See note 15 to the Consolidated Financial Statements for additional information on the Company’s income taxes.
Current income tax expense increased to $478 million in 2004, due primarily to higher commodity prices and volumes, which resulted in increases in current taxes of $175 million in the North Sea, $50 million in Southeast Asia, $33 million in Algeria and $22 million in North America.
The UK Government levies PRT on North Sea fields which received development approval before April 1993, based on gross profit after allowable deductions, including capital and operating expenditures. PRT, which is deductible for purposes of calculating corporate income tax, increased as a result of both higher prices and volumes on fields in the UK subject to PRT.
| Capital Spending1,3 | | | | | | |
| | | | | | | |
| (millions of dollars) | 2004 | | 2003 | | 2002 | |
| North America | 1,500 | | 1,580 | | 939 | |
| North Sea | 721 | | 693 | | 518 | |
| Southeast Asia | 235 | | 316 | | 269 | |
| Algeria | 8 | | 34 | | 107 | |
| Trinidad | 191 | | 130 | | 78 | |
| Sudan | — | | 2 | | 98 | |
| Other2 | 125 | | 93 | | 43 | |
| Corporate, IS and Administrative | 26 | | 38 | | 26 | |
| | 2,806 | | 2,886 | | 2,078 | |
1
| Includes expenditures for exploration, development and asset acquisitions net of dispositions, but excludes the Sudan disposition in 2003.
|
2
| Other includes Colombia, Peru, Qatar and frontier North America.
|
3
| Includes interest costs which are capitalized on major development projects until facilities are completed and ready for use.
|
Natural gas continues to be the focus of the Company’s capital investment activities in North America, supplemented by low risk oil projects and strategic acquisitions. Of the $1.5 billion of capital spending in North America, $590 million related to exploration activities while development accounted for $862 million. The Company participated in 444 gas wells and 137 oil wells in North America and had a success rate of 94%. Development spending was concentrated in
10 T A L I S M A N E N E R G Y I N C .
M a n a g e m e n t ’ s D i s c u s s i o n a n d A n a l y s i s
the predominantly gas producing core areas in the Alberta Foothills, Greater Arch, Deep Basin, Monkman/BC Foothills, Edson and Appalachia regions. In addition, the Company spent $48 million on acquisitions ($110 million, net of dispositions of $62 million), including US properties ($93 million).
Total capital spending in the North Sea was $721 million including $150 million for exploration and $357 million for development with the remaining $214 million for net property acquisitions. Development activity included the Tweedsmuir project and drilling and recompletion activity within the Clyde, Buchan, Tartan, Piper and Claymore fields. In addition, development expenditures were incurred in Norway on the Gyda field. A total of 17 successful development wells were drilled during 2004 in the North Sea. Exploration drilling included the successful 21/1a North Buchan J5 well which added significant reserves to Tweedsmuir. During 2004, the Company completed a number of acquisitions, the most significant of which was the $176 million acquisition from Intrepid which resulted in an increase in the Company’s interests in a number of fields in the Flotta Catchment Area. The Company also acquired a 67% interest in the Galley field, as well as additional minor working interests in other North Sea fields and exploration blocks.
Malaysia/Vietnam accounted for a majority of the $235 million of total capital spending in Southeast Asia, due to the PM-3 CAA development and the South Angsi field development in PM305. Talisman participated in drilling 14 successful development wells in Malaysia/Vietnam during 2004. In addition, one successful exploration well was drilled in PM-3 CAA. A total of $3 million, net of proceeds on disposition, was spent in Indonesia. Talisman participated in drilling two unsuccessful wells in Indonesia during 2004.
Capital spending in Algeria totaled $8 million in 2004, as the Company participated in three successful wells during the year.
In Trinidad, a total of $191 million was spent on the Angostura development and exploration activity.
During 2004 the Company spent $63 million in Alaska on seismic, exploratory drilling and land acquisitions. Talisman spent $17 million in Colombia on exploration drilling during 2004, as well as $11 million on seismic acquisition in Qatar and $13 million on exploration in Peru.
Information related to details and funding of the 2005 capital expenditures program is included in the Outlook for 2005 section of this Management’s Discussions and Analysis.
Reserves Replacement
Talisman drilled 641 successful wells in 2004 and increased its total proved reserves by 9% to 1,488 mmboe at the end of 2004. The Company replaced 179% of conventional production from all sources and 166% through the drill bit. Talisman’s net proved reserves increased by 11% to 1,207 mmboe. Drilling related reserve additions totalled 265 mmboe. Talisman also acquired 21 mmboe of proved reserves.
Proved oil and liquids reserves increased 7% to 618 mmbbls. Talisman added a total of 121 mmbbls, including 85 mmbbls in the North Sea, 18 mmbbls in Southeast Asia, 13 mmbbls in Algeria and 13 mmbbls in North America, partially offset by an 8 mmbbls reduction in Trinidad. The majority (75%) of these reserve additions were through discoveries, additions, extensions and revisions. North America (30%) and the North Sea (48%) account for the majority of Talisman’s oil reserves. These are predominantly high quality crude oil and natural gas liquids. Talisman has virtually no heavy oil or bitumen reserves.
Talisman’s proved natural gas reserves increased by 11% in 2004, totaling 5.2 tcf at year end. Talisman’s North American natural gas reserves were 2.6 tcf at year end, unchanged from the previous year. In North America, the Company added a record 479 bcf through the drill bit (147% of production), offset by record natural gas production (325 bcf), minor net asset sales (50 bcf) and downward revisions to existing reserves (113 bcf). These numbers include Fortuna’s natural gas reserves in the northeastern US, which totalled 153 bcf (an increase of 40%) at year end, with the addition of 59 bcf through drilling activities.
Talisman’s proved international natural gas reserves increased 26% to 2.6 tcf at year end. The majority of this increase came from the addition of 695 bcf of proved undeveloped reserves in Indonesia as a result of an agreement to sell gas to PT Perusahaan Gas Negara (Persero), Tbk. (“PGN”), the Indonesian national gas transmission and distribution company. These reserves will be developed over the next two years, in anticipation of sales commencing in the first quarter of 2007.
Over the past three years, Talisman has added 565 mmboe of proved reserves through discoveries, additions and extensions (including revisions) and acquired 58 million boe of proved reserves net of dispositions (not including the impact of the sale of Talisman’s indirect interest in the Greater Nile Oil Project in Sudan). Approximately 90% of Talisman’s proved reserves have been independently evaluated over the past three years.
The reserves replacement ratio of 166% was calculated by dividing the sum of changes (revisions of estimates, improved recovery and discoveries) to estimated proved oil and gas reserves during 2004 by the Company’s 2004 conventional production. The reserves replacement ratio of 179% was calculated by dividing the sum of changes (revisions of estimates, improved recovery, discoveries, acquisitions and dispositions) to estimated proved oil and gas reserves during 2004 by the Company’s 2004 conventional production.
The Company’s management uses reserve replacement ratios, as described above, as an indicator of the Company’s ability to replenish annual production volumes and grow its reserves. It should be noted that a reserve replacement ratio is a statistical indicator that has limitations. As an annual measure, the ratio is limited because it typically varies widely based on the extent and timing of new discoveries, project sanctioning and property acquisitions. Its predictive and comparative value is also limited for the same reasons. In addition, since the ratio does not imbed the cost, value or timing of future production of new reserves, it cannot be used as a measure of value creation.
M a n a g e m e n t ’ s D i s c u s s i o n a n d A n a l y s i s
2 0 0 4 A N N U A L R E P O R T 11
Liquidity and Capital Resources
Talisman’s long-term debt at year end was $2.5 billion, down from a total of $2.6 billion of long-term debt ($2.2 billion) and preferred securities ($431 million) at the end of last year. During 2004, the Company generated $3.1 billion of cash provided by operating activities and spent $2.5 billion on exploration and development and a net $242 million on acquisitions. In addition, the Company financed the redemption of the preferred securities, repurchased nine million common shares and paid dividends of $114 million. At year end, the Company had drawn $328 million of its available $1,335 million bank lines of credit. The Company maintains a debt shelf prospectus in the US under the Multi-Jurisdictional Disclosure System under which it may issue up to US$1 billion of debt securities in the US public debt market until January 2006, at which time the current registration statement could no longer be used and a new registration statement would have to be filed.
In 2005, $241 million (US$200 million) of long-term debt matures. None of this debt has been classified as a current liability as the Company currently has the ability and intention to refinance amounts due within one year with existing bank facilities.
At December 31, 2004, the Company had an excess of current liabilities over current assets of $673 million. In 2005, cash provided by operating activities is expected to range between $3.6 and $3.8 billion, with capital expenditures of $3.1 billion, dividends of $110 million and share repurchases in the amount of approximately $300 million. The Company does not expect working capital to change significantly, but to the extent that funds are required to meet obligations, the Company can draw down on its existing bank credit facilities ($1.0 billion available for drawdown at December 31, 2004).
During 2004, the Company redeemed its outstanding preferred securities, realizing a $23 million gain (net of tax), being the difference between the carrying value and the redemption cost. The redemptions were funded from current cash flow and bank borrowings and gains were credited directly to retained earnings. See note 8 to the Consolidated Financial Statements.
During 2004, the Company implemented a three-for-one share split of its issued and outstanding common shares. All per share statistics included in this MD&A have been restated to reflect this share split. See note 9 to the Consolidated Financial Statements.
The Company repurchased 8,987,400 common shares under its normal course issuer bid (NCIB) during 2004 for a total of $286 million ($31.81/share). Subsequent to year end, the Company repurchased an additional 3,811,300 common shares as at March 2, 2005 under the NCIB for a total of $128 million ($33.57/share). The NCIB expires in March 2005 and the Company has received Board of Directors’ approval to renew the NCIB for another year. This will allow the Company to repurchase up to 5% of the Company’s common shares outstanding at the time of renewal.
Two common share dividends were paid in 2004 for a total of $114 million ($0.30/share). The Company’s dividend is determined semi-annually by the Board of Directors. At year end, there were 375 million common shares outstanding, down from 384 million at December 31, 2003. As at March 2, 2005, there were 371 million common shares outstanding, as well as 19,779,240 stock options outstanding.
At the end of 2004, Talisman’s ratio of debt to cash provided by operating activities was 0.78:1 and of debt to debt plus equity was 34%.
For additional information regarding the Company’s liquidity and capital resources, refer to note 7 to the Consolidated Financial Statements. In addition, refer to the Sensitivities table included in the Outlook Section of this MD&A for possible 2005 impacts of various factors on the Company’s estimated 2005 net income and cash provided by operating activities.
Talisman’s investment grade senior unsecured long-term debt credit ratings remain unchanged with Dominion Bond Rating Service (“DBRS”), Moody’s Investor Service, Inc. (“Moody’s”) and Standard & Poor’s (“S&P”) at BBB (high), Baa1 and BBB+, respectively.
Commitments and Off Balance Sheet Arrangements
As part of its normal business, the Company has entered into arrangements and incurred obligations that will impact the Company’s future operations and liquidity, some of which are reflected as liabilities in the Consolidated Financial Statements at year end. The principal commitments of the Company are in the form of debt repayments; abandonment obligations; settlements of derivative financial instruments; lease commitments relating to corporate offices and ocean-going vessels; firm commitments for gathering, processing and transmission services; minimum work commitments under various international agreements; other service contracts and fixed price commodity sales contracts.
Additional disclosure of the Company’s debt repayment obligations and significant commitments can be found in notes 7 and 12 to the Consolidated Financial Statements. A discussion of the Company’s derivative financial instruments and commodity sales contracts can be found in the next section of this MD&A.
12 T A L I S M A N E N E R G Y I N C .
M a n a g e m e n t ’ s D i s c u s s i o n a n d A n a l y s i s
The following table includes the Company’s expected future payment commitments and estimated timing of such payments.
| | | | | | Payments due by period1,2 (millions of dollars) | |
Commitments | | Recognized in financial statements | | Total | | Less than 1 year | | 1-3 years | | 4-5 years | | 6-10 years | | 11-15 years | | After 15 years | |
Long-term debt | | Yes — Liability | | 2,457 | | 241 | | 948 | | 318 | | 12 | | 577 | | 361 | |
Abandonment obligations3 | | Yes — Partially accrued as liability | | 2,639 | | 23 | | 96 | | 79 | | 181 | | 604 | | 1,656 | |
Office leases | | No | | 195 | | 23 | | 40 | | 34 | | 91 | | 7 | | — | |
Ocean-going vessel leases | | No | | 159 | | 85 | | 74 | | — | | — | | — | | — | |
Transportation and processing commitments | | No | | 1,012 | | 150 | | 206 | | 152 | | 281 | | 158 | | 65 | |
Minimum work commitments4 | | No | | 327 | | 269 | | 58 | | — | | — | | — | | — | |
Other service contracts | | No | | 143 | | 86 | | 21 | | 8 | | 19 | | 9 | | — | |
Stock options and cash units5 | | Yes — Partially accruedas liability | | 282 | | 160 | | 122 | | — | | — | | — | | — | |
Total | | | | 7,214 | | 1,037 | | 1,565 | | 591 | | 584 | | 1,355 | | 2,082 | |
1
| Payments exclude ongoing operating costs related to certain leases, interest on long-term debt, and payments made to settle derivative contracts.
|
2
| Payments denominated in foreign currencies have been translated at the December 31, 2004 exchange rate.
|
3
| The abandonment obligation represents management’s probability weighted, undiscounted best estimate of the cost and timing of future dismantlement, site restoration and abandonment obligations based on engineering estimates and in accordance with existing legislation and industry practice.
|
4
| Minimum work commitments include contracts awarded for capital projects and those commitments related to exploration or drilling obligations.
|
5
| The liability for stock options and cash units recognized on the balance sheet is based on the Company’s year end stock price and the number of options and cash units outstanding, adjusted for vesting terms. The amount included in this table includes the full value of unvested options and cash units. Timing of payments is based on vesting and expiry. Actual payments are dependent on the Company’s stock price at the time of exercise.
|
Derivative Financial Instruments and Commodity Sales Contracts
The Company manages its exposure to fluctuations in foreign exchange rates, interest rates, electricity costs and commodity prices in part through the use of derivative financial instruments and commodity sales contracts. The accounting policy with respect to derivative financial instruments and commodity sales contracts is set out in note 1(k) to the Consolidated Financial Statements. Derivative financial instruments and commodity sales contracts outstanding at December 31, 2004, including their respective fair values, are detailed in notes 11 and 12 to the Consolidated Financial Statements.
During 2004, the Company had commodity price derivative financial instruments covering 79,000 bbls/d or 35% of the Company’s 2004 worldwide oil and liquids production and 55 mmcf/d or 6% of the Company’s 2004 North American natural gas production. This resulted in a net decrease to recorded sales of $480 million (2003 — $194 million decrease; 2002 — $75 million increase). At December 31, 2004, the Company had outstanding commodity price derivative contracts that cover approximately 6,000 bbls/d (2%) of the Company’s anticipated 2005 worldwide oil and liquids production. An additional 15 mmcf/d (2%) of anticipated 2005 North American natural gas production has been committed under fixed price commodity sales contracts. The Company’s outstanding commodity price derivative contracts have been designated as hedges of the Company’s anticipated future commodity sales. See notes 11 and 12 to the Consolidated Financial Statements for additional detail s regarding the contracts outstanding at year end.
In order to support the Company’s investments in natural gas projects outside North America and the North Sea, Talisman has entered into a number of long-term sales contracts. In conjunction with the PM-3 CAA development project the Company has entered into a long-term firm supply contract for approximately 100 mmcf/d at prices referenced to the Singapore fuel oil spot market. The majority of Talisman’s Corridor natural gas production in Indonesia is currently sold to Caltex under long-term sales agreements, with the majority of the natural gas sales exchanged for crude oil on an energy equivalent relationship. The crude oil received from Caltex is then sold offshore. Sales to Singapore from Corridor are also under long-term sales agreements referenced to the spot price of fuel oil in Singapore. During 2004, the Company signed a long term contract to sell 2.3 tcf of Corridor natural gas to West Java, over a 17 year period with gas sales commencing in 2007, at a price of US$1.91/mcf, with no associated transportation costs. The Company’s share of sales will be approximately 810 bcf based on its 36% interest. The Company anticipates having sufficient production to meet all future delivery commitments.
Effective January 1, 2004, the Company’s US dollar cross currency and interest rate swap contracts were no longer designated as hedges of the £250 million Eurobond, which resulted in a revaluation of this debt and a deferred gain of $17 million which is being amortized over the period to 2009. The swap contracts were terminated in 2004 for net cash proceeds of $138 million and resulted in an additional gain of $15 million. The termination of these contracts did not accelerate recognition of the deferred gain into income.
The Company has established a system of internal controls to minimize risks associated with its derivatives program and credit risk associated with derivatives counterparties. The Board of Directors has authorized the Company to enter into commodity derivative agreements, which in aggregate do not exceed 40% of total estimated production. With the current high commodity prices and the Company’s strong balance sheet, management does not believe the capital expenditure program is under significant risk and has not actively renewed the derivatives program.
M a n a g e m e n t ’ s D i s c u s s i o n a n d A n a l y s i s
2 0 0 4 A N N U A L R E P O R T 13
Summary of Quarterly Results
The following is a summary of quarterly results of the Company for the eight most recently completed quarters:
| (millions of Canadian dollars, unless otherwise stated) | | | Three months ended | |
| 2004 | Total Year | | Dec. 31 | | Sept. 30 | | June 30 | | March 31 | |
| Gross Sales | 6,874 | | 1,828 | | 1,788 | | 1,705 | | 1,553 | |
| Total revenue | 5,355 | | 1,402 | | 1,355 | | 1,337 | | 1,261 | |
| Net income1 | 663 | | 121 | | 122 | | 197 | | 223 | |
| Net income available to common shareholders2 | 677 | | 121 | | 122 | | 200 | | 234 | |
| Total assets | 12,408 | | 12,408 | | 12,407 | | 13,007 | | 12,290 | |
| Total long-term liabilities | 5,934 | | 5,934 | | 5,883 | | 6,100 | | 5,860 | |
| Capital expenditures | | | | | | | | | | |
| Exploration | 952 | | 250 | | 280 | | 200 | | 222 | |
| Development | 1,586 | | 478 | | 407 | | 309 | | 392 | |
| Per common share (dollars) | | | | | | | | | | |
| Net income1,2 | 1.77 | | 0.32 | | 0.32 | | 0.52 | | 0.61 | |
| Diluted net income2,4 | 1.74 | | 0.31 | | 0.31 | | 0.51 | | 0.60 | |
| Daily average production | | | | | | | | | | |
| Oil and liquids (bbls/d) | 228,434 | | 235,612 | | 218,441 | | 229,579 | | 230,136 | |
| Natural gas (mmcf/d)3 | 1,259 | | 1,292 | | 1,263 | | 1,244 | | 1,236 | |
| Total (mboe/d) | 438 | | 451 | | 429 | | 437 | | 436 | |
| 2003 (Restated) | | | | | | | | | | |
| Gross Sales | 5,610 | | 1,351 | | 1,272 | | 1,220 | | 1,767 | |
| Total revenue | 4,598 | | 1,128 | | 1,077 | | 1,023 | | 1,370 | |
| Net income1 | 1,012 | | 108 | | 128 | | 202 | | 574 | |
| Net income available to common shareholders2 | 990 | | 103 | | 122 | | 197 | | 568 | |
| Total assets | 11,780 | | 11,780 | | 11,634 | | 11,481 | | 11,849 | |
| Total long-term liabilities | 5,544 | | 5,544 | | 5,594 | | 5,473 | | 5,981 | |
| Capital expenditures | | | | | | | | | | |
| Exploration | 784 | | 221 | | 215 | | 165 | | 183 | |
| Development | 1,396 | | 437 | | 360 | | 327 | | 272 | |
| Per common share (dollars) | | | | | | | | | | |
| Net income1,2 | 2.56 | | 0.27 | | 0.32 | | 0.51 | | 1.46 | |
| Diluted net income2,4 | 2.53 | | 0.24 | | 0.31 | | 0.50 | | 1.44 | |
| Daily average production | | | | | | | | | | |
| Oil and liquids (bbls/d) | 216,716 | | 229,166 | | 202,008 | | 188,682 | | 247,369 | |
| Natural gas (mmcf/d) | 1,090 | | 1,138 | | 1,064 | | 1,061 | | 1,096 | |
| Total (mboe/d) | 398 | | 419 | | 379 | | 365 | | 430 | |
1
| Net income and net income before discontinued operations and extraordinary items are the same.
|
2
| Net income available to common shareholders, net income per share and diluted net income per share are after preferred security charges and have been restated to include the gain on redemption of preferred securities in 2004. See note 17 to the Consolidated Financial Statements.
|
3
| Includes gas acquired for injection and subsequent resale of 5 mmcf/d in Total Year, 8 mmcf/d in June and March, and 3 mmcf/d in, Dec. and Sept.
|
4
| Diluted net income per common share is calculated using the treasury stock method, which gives effect to the potential dilution that could occur if convertible instruments, such as stock options, were exercised in exchange for common shares. However, since inception of the Company’s Stock Appreciation Rights Plan, only approximately 2% of stock options have been exercised for common shares, therefore the dilution was insignificant.
|
The following discussion highlights some of the more significant factors that impacted net income in the eight most recently completed quarters.
During the fourth quarter of 2004, revenue increased over the previous quarter as increases in total volumes combined with higher gas prices to more than offset the impact of a stronger Canadian dollar and increased hedging losses. Net income remained relatively constant in the quarter as reductions in stock-based compensation, operating expenses and dry hole costs were offset by increases in DD&A, impairments and G&A expenses as well as a loss on disposal of fixed assets.
In the third quarter, revenue rose over the second quarter as the increase in oil prices more than offset the reduction in production, resulting from maintenance shutdowns. Net income in the third quarter declined from the previous quarter, as the increase in revenue was more than offset by increases in hedging losses, dry hole costs, exploration expenses and current income taxes. In the first two quarters of 2004, revenue continued to rise due to increases in both commodity prices and production partially offset by increased hedging losses. These factors combined with the benefit of tax rate reductions to increase net income in the first quarter of 2004 over the last quarter of 2003.
14 T A L I S M A N E N E R G Y I N C .
M a n a g e m e n t ’ s D i s c u s s i o n a n d A n a l y s i s
A higher charge for stock-based compensation and reduced tax rate reductions resulted in a drop in net income during the second quarter of 2004 from the previous quarter.
In the first quarter of 2003, the gain on the sale of the Sudan operations increased net income by $296 million. The sale of these operations contributed to the drop in revenues and royalties during the following three quarters of 2003, which was partially offset by production increases in other areas and continued high commodity prices. Net income during the second quarter of 2003 was increased by $160 million due to a reduction in the Canadian federal and provincial tax rates. The Company began recording stock-based compensation in the second quarter of 2003. The second quarter’s net income was reduced by a $105 million ($70 million after tax) catch-up expense relating to outstanding stock options. The third and fourth quarters of 2003 included an additional $80 million ($50 million after tax) of stock-based compensation expense.
Application of Critical Accounting Policies and the Use of Estimates
The preparation of financial statements requires management to make estimates and assumptions that affect reported assets and liabilities, disclosures of contingencies and revenues and expenses. Management is also required to adopt accounting policies that require the use of significant estimates. Actual results could differ materially from those estimates. A summary of significant accounting policies adopted by Talisman can be found in note 1 to the Consolidated Financial Statements. In assisting the Company’s Audit Committee to fulfill its financial statement oversight role, management regularly meets with the Committee to review the Company’s significant accounting policies, estimates and any significant changes thereto including those discussed below.
Management believes the most critical accounting policies, including judgments in their application, that may have an impact on the Company’s financial results relate to the accounting for property, plant and equipment, asset retirement obligation and goodwill. The rate at which the Company’s assets are depreciated or otherwise written off and the asset retirement liability provided for, with the associated accretion expensed to the income statement, are subject to a number of judgments about future events, many of which are beyond management’s control. Reserves recognition is central to much of the accounting for an oil and gas company as described below.
Reserves Recognition
Underpinning Talisman’s oil and gas assets and goodwill are its oil and gas reserves. Detailed rules and industry practice, to which Talisman adheres, have been developed to provide uniform reserves recognition criteria. However, the process of estimating oil and gas reserves is inherently judgmental. There are two principal sources of uncertainty, technical and commercial. Technical reserves estimates are made using available geological and reservoir data as well as production performance data. As new data becomes available, including actual reservoir performance, reserves estimates may change. Reserves can be classified as proved or probable with decreasing levels of certainty as to the likelihood that the reserves will be ultimately produced.
Reserves recognition is also impacted by economic considerations. In order for reserves to be recognized they must be reasonably certain of being produced under existing economic and operating conditions, which is viewed as being at year end commodity prices with a cost profile based on current operations. In particular, in international operations consideration includes the status of field development planning and gas sales contracts. As economic conditions change, primarily as a result of changes in commodity prices and, to a lesser extent, operating and capital costs, marginally profitable production, typically experienced in the later years of a field’s life cycle, may be added to reserves or conversely may no longer qualify for reserves recognition.
The Company’s reserves and revisions to those reserves, though not separately reported on the Company’s balance sheet or income statement, impact the Company’s reported net income through the amortization of the Company’s property, plant and equipment (PP&E), asset and goodwill impairments and the provision for future asset retirement obligations.
The Reserves Committee of Talisman’s Board of Directors reviews the Company’s reserves booking process and related public disclosures and the report of the internal qualified reserves evaluator (IQRE). The primary responsibilities of the Reserves Committee of the Board of Directors include, amongst other things, reviewing the Company’s reserves booking process and recommending to the Board of Directors of Talisman the Company’s annual statement of reserves data and other oil and gas information. The IQRE reports the Company’s annual reserves data to the Reserves Committee and delivers a regulatory certificate regarding proved reserves and their related cash flows.
Depreciation, Depletion and Amortization Expense (DD&A)
A significant portion of the Company’s PP&E is amortized based on the unit of production method with the remaining assets being amortized equally over their expected useful lives. The unit of production method attempts to amortize the asset’s cost over its proved oil and gas reserves base. Accordingly, revisions to reserves or changes to management’s view as to the operational life span of an asset will impact the Company’s future DD&A expense.
As outlined in the Company’s DD&A accounting policy and PP&E notes (notes 1(d) and 5 to the Consolidated Financial Statements), $1.2 billion (2003 — $866 million) of the Company’s PP&E is not currently subject to DD&A. Approximately one quarter of these costs ($255 million) relate to the Angostura development project, which came on production in January 2005, at which time amortization commenced. The remainder of the $1.2 billion of non-depleted capital relates to the costs of other development projects ($478 million) which will be amortized when production commences, the costs of acquired unproved reserves ($133 million) and incomplete drilling activities, including those wells under evaluation or awaiting commencement of production ($284 million). Uncertainty exists with the treatment of these costs. For example, if the evaluation of the acquired probable reserves or recently drilled exploration wells were determined to be
M a n a g e m e n t ’ s D i s c u s s i o n a n d A n a l y s i s
2 0 0 4 A N N U A L R E P O R T 15
unsuccessful, the associated capitalized costs would be expensed in the year such determination is made, except that in the case of acquired probable reserves associated with producing fields, these costs would be amortized over the reserve base of the associated producing field. Accordingly, the rate at which these costs are written off depends on management’s view of the likelihood of the existence of economically producible reserves.
Successful Efforts Accounting
The successful efforts method is used to account for oil and gas exploration and development costs. Acquisition costs and development costs are capitalized and depleted using the unit of production method. Costs of drilling unsuccessful exploration wells and all other exploration costs, including geological and geophysical costs, are expensed.
The alternative method of accounting for oil and gas exploration and development costs is the full cost method. Under this method, costs of unsuccessful exploration wells as well as all other exploration costs are capitalized and added to the PP&E balance to be depleted on a unit of production basis in the future.
The differences between the full cost and successful efforts methods of accounting make it difficult to compare net income between companies that use different methods of accounting.
Asset Impairments
The Company’s oil and gas assets and goodwill are subject to impairment tests. An impairment charge is recorded in the year an asset is determined to be impaired under the successful efforts method. Individual oil and gas assets are considered impaired under the successful efforts method if their fair value falls below their carrying value. Goodwill is considered to be impaired if its fair value, principally determined based on discounted cash flows, falls below its carrying value. Both tests require management to make assumptions regarding cash flows well into the distant future that are subject to revisions due to changes in commodity prices, costs, recoverable reserves, production profiles and in the case of goodwill, discount rates. During the past three years, isolated asset impairments have occurred (2004 — $31 million, 2003 — $30 million; 2002 — $74 million), however, it is possible that future impairments may be material.
Purchase Price Allocations
The costs of corporate and asset acquisitions are allocated to the acquired assets and liabilities based on their fair value at the time of acquisition. In many cases the determination of fair value requires management to make certain assumptions and estimates regarding future events. Typically in determining fair value, management develops a number of possible future cash flow scenarios to which probabilities are judgmentally assigned. The allocation process is inherently subjective and impacts the amounts assigned to the various individually identifiable assets and liabilities as well as goodwill. The acquired assets and liabilities may span multiple geographical segments and may be amortized at different rates, or not at all as in the case of goodwill or initially for acquired probable reserves. Accordingly, the allocation process
impacts the Company’s reported assets and liabilities and future net income due to the impact on future depreciation, depletion and amortization expense and impairment tests.
Asset Retirement Obligations
Upon retirement of its oil and gas assets, the Company anticipates incurring substantial costs associated with abandonment and reclamation activities. Estimates of the associated costs are subject to uncertainty associated with the method, timing and extent of future retirement activities. Accordingly, the annual expense associated with future abandonment and reclamation activities is impacted by changes in the estimates of the expected costs and reserves. The total undiscounted abandonment liability is currently estimated at $2.6 billion, which is based on management’s probability weighted estimate of costs and in accordance with existing legislation and industry practice.
As indicated in the MD&A section entitled New Canadian Accounting Pronouncements, the accounting for Asset Retirement Obligations was adopted on a retroactive basis effective January 1, 2004. Under these accounting requirements, the fair value of the Company’s Asset Retirement Obligations (ARO) has been recorded as a liability on the Company’s balance sheet. In determining the fair value of the Company’s ARO liability, management developed a number of possible abandonment scenarios to which probabilities were judgmentally assigned. At December 31, 2004, the discounted fair value of the Company’s ARO liability is $1.3 billion, (2003 — $1.2 billion). As an indication of possible future changes in the estimated liability, if all of the Company’s abandonment obligations could be deferred by one additional year, the fair value of the liability would have decreased by approximately $60 million.
Foreign Exchange Accounting
Talisman’s worldwide operations expose the Company to transactions denominated in a number of different currencies, which are required to be translated into one currency for financial statement reporting purposes. Talisman’s foreign currency translation policy, as detailed in note 1(i) to the Consolidated Financial Statements, is designed to reflect the economic exposure of the Company’s operations to the various currencies. The adoption of the US dollar, effective for 2002, as the Company’s functional currency is a reflection of Talisman’s overall exposure to US dollar denominated transactions, assets and liabilities; oil prices are largely denominated in US dollars as is much of the Company’s corporate debt and international capital spending and operating costs. However, the Company’s operations in the UK and Canada are largely self-sufficient (self-sustaining) and their economic exposure is more closely tied to their respective domestic cur rencies. Accordingly, these operations are measured in UK pounds sterling and Canadian dollars, respectively. Currently, the Company’s foreign exchange translation exposure principally relates to US dollar denominated UK and Canadian oil sales.
As part of the adoption by the Company as at January 1, 2004, of the new accounting guideline on Hedging Relationships, AcG 13 and effective January, 2004, the Eurobond debt, denominated in UK pounds sterling, and the Company’s Canadian dollar debt were designated as hedges of the Company’s net investments in the UK and Canadian self-
16 T A L I S M A N E N E R G Y I N C .
M a n a g e m e n t ’ s D i s c u s s i o n a n d A n a l y s i s
sustaining operations, respectively. As such the unrealized foreign exchange gains and losses resulting from the translation of this debt are deferred and included in a separate component of shareholders’ equity described as cumulative foreign currency translation.
Production Sharing Contractual Arrangements
A significant portion of the Company’s operations outside North America and the North Sea are governed by production sharing contracts (PSCs). Under PSCs, Talisman, along with other working interest holders, typically bears all risk and costs for exploration, development and production. In return, if exploration is successful, Talisman recovers the sum of its investment and operating costs (‘cost oil’) from a percentage of the production and sale of the associated hydrocarbons. Talisman is also entitled to receive a share of the production in excess of cost oil (‘profit oil’). The sharing of profit oil varies between the working interest holders and the government from contract to contract. The cost oil, together with the Company’s share of profit oil represents Talisman’s hydrocarbon entitlement (working interest less royalties). Talisman records gross production, sales and reserves based on its working interest ownership. The difference betw een the Company’s working interest ownership and its entitlement is accounted for as a royalty expense. In addition, certain of the Company’s contractual arrangements in foreign jurisdictions stipulate that income taxes are paid out of the respective national oil company’s entitlement share of production. The Company includes such amounts in income tax expense at the statutory tax rate in effect at the time of production.
The amount of cost oil required to recover Talisman’s investment and costs in a PSC is dependent on commodity prices and consequently, Talisman’s share of profit oil is also impacted. Accordingly, the amount of royalty paid by Talisman over the term of a PSC and the corresponding net after royalty oil and gas reserves booked by the Company is dependent on the amount of initial investment and past costs yet to be recovered and anticipated future costs, commodity prices and production. As a result, when year end prices decrease, the amount of net after royalty reserves the Company books may increase and vice versa.
New Canadian Accounting Pronouncements
The Canadian Institute of Chartered Accountants (CICA) has issued a number of accounting pronouncements, some of which may impact the Company’s reported results and financial position in future periods.
Exchange of Non-monetary Assets
The CICA has issued an exposure draft to amend section 3830 and redefine when a transaction should be measured at fair value rather than book value. Under current rules, a transaction is a non-monetary transaction if the cash component is less than 10% of the value exchanged. The new test will be based on the commercial substance of the transaction and will require an assessment of the timing, amount and risk of the expected cash flows from the assets being exchanged. For example,
if a property that is currently producing is swapped for undeveloped land, the nature of the expected cash flows would be quite different and this transaction would be measured at fair value under the proposed rules. A final standard is expected during the first half of 2005.
Other Comprehensive Income/Financial Instruments
The CICA is expected to issue a new standard in early 2005, effective for the reporting of year-end 2006. The new standard will bring Canadian rules in line with current rules in the US. The standard introduces the concept of “Other Comprehensive Income” to Canadian GAAP and requires that an enterprise (a) classify items of other comprehensive income by their nature in a financial statement and (b) display the accumulated balance of other comprehensive income separately from retained earnings and additional paid-in capital in the equity section of a statement of financial position. Derivative contracts will be carried on the balance sheet at their mark-to-market value, with the change in value flowing to either net income or other comprehensive income. Gains and losses on instruments that are identified as hedges will flow initially to other comprehensive income and be brought into net income at the time the underlying hedged item is settled. It is expected that this standard will be effective for Talisman’s 2006 reporting. Any instruments that do not qualify for hedge accounting will be marked to market with the adjustment (tax effected) flowing through the income statement.
Talisman does not currently have any hedges in place that carry into 2006 so the impact would not be significant based on current positions.
Asset Retirement Obligations
Effective January 1, 2004, the CICA adopted a new accounting standard that changed the method of accruing for costs associated with the retirement of fixed assets which an entity is legally obligated to incur. The standard requires entities to record the fair value of a liability for an asset retirement obligation in the period it is incurred and a corresponding increase in the carrying amount of the related long-lived asset. The Company adopted this new accounting standard on a retroactive basis as at January 1, 2004. See note 6 to the Consolidated Financial Statements. The US has adopted a similar rule commencing January 1, 2003.
The accounting standard required the retroactive restatement of the Company’s financial statements upon adoption in 2004. The adjustment required to the December 31, 2003 balance sheet and income statement to implement this change in accounting was as follows:
| (millions of dollars, except per share amounts) | As Reported December 31, 2003 | | Adjustment upon adoption of ARO standard in 2004 | | Restated December 31,2003 | |
| Property, plant and equipment | 9,778 | | 415 | | 10,193 | |
| Provision for future site restoration | 840 | | 317 | | 1,157 | |
| Future income taxes | 2,088 | | 39 | | 2,127 | |
| Retained Earnings | 1,844 | | 59 | | 1,903 | |
| DD&A expense | 1,443 | | (8) | | 1,435 | |
| Future income tax (recovery) | (51) | | 3 | | (48) | |
| Net income | 1,007 | | 5 | | 1,012 | |
| Net income per share ($/share) | 2.55 | | 0.01 | | 2.56 | |
| Diluted net income per share ($/share) | 2.52 | | 0.01 | | 2.53 | |
M a n a g e m e n t ’ s D i s c u s s i o n a n d A n a l y s i s
2 0 0 4 A N N U A L R E P O R T 17
Impairments of Long-Lived Assets
The Company adopted the CICA new accounting standard on Impairment of Long-Lived Assets, effective January 1, 2004. Under this standard, if a long-term asset is identified as being impaired, as determined by its undiscounted future cash flows, the amount of impairment is to be calculated based on the asset’s fair value (present value of expected future cash flows). This is consistent with the US GAAP methodology. Prior to this standard, the impairment as calculated under Canadian GAAP was based on the asset’s undiscounted future cash flows.
Hedge Accounting
The CICA has issued a new accounting guideline on Hedging Relationships, (AcG 13), which was effective for 2004. This guideline, in addition to supplementing and interpreting existing hedging requirements under Canadian GAAP, established certain other conditions required before hedge accounting may be applied. As a result of this new guideline, effective January 1, 2004, the Company’s US dollar cross currency swap contracts and interest rate swap contracts were no longer designated as hedges of the Eurobond. These contracts were subsequently terminated in 2004 for proceeds of $138 million. As a result of these contracts no longer hedging the Eurobond debt, on January 1, 2004, the Company recorded a deferred gain of $17 million, which will be amortized over the period to 2009, the original term of the contracts. The termination of these contracts did not accelerate the recognition of the deferred gain into income. The debt is now revalued each period at the period end excha nge rate. The translation of this debt as at December 31, 2004 resulted in an increase to long-term debt of $106 million over the amount reported at December 31, 2003.
The Company’s long-term debt denominated in UK pounds sterling and Canadian dollars have been designated as hedges of the Company’s net investments in the UK and Canadian self-sustaining operations, respectively. Unrealized foreign exchange gains and losses resulting from the translation of this debt are deferred and included in a separate component of shareholders’ equity described as cumulative foreign currency translation. Had the Company not designated such debt as hedges of the Company’s net investments in its self-sustaining operations, the Company’s net income could have been subject to increased volatility in the future upon revaluation into US dollars of UK pounds sterling and Canadian dollar denominated debt.
Variable Interest Entities
The CICA’s new accounting guideline on Consolidation of Variable Interest Entities (AcG 15), was effective January 1, 2004. A variable interest entity (VIE) is a corporation, partnership, trust, or any other legal structure used for business purposes that either (i) does not have equity investors with voting rights or (ii) has equity investors that do not provide sufficient financial resources for the entity to support its activities. AcG 15 requires a VIE to be consolidated by a company if that company is subject to a majority of the risk of loss from the VIE’s activities, is entitled to receive a majority of the VIE’s residual returns, or both. Management has determined that this guideline does not impact the Company’s financial position, operating results or cash provided by operating activities.
18 T A L I S M A N E N E R G Y I N C .
M a n a g e m e n t ’ s D i s c u s s i o n a n d A n a l y s i s
Outlook for 20051
| | | | | | Estimated for 2005 | | Actual 2004 | |
| Cash provided by operating activities | | | | | 3.6-3.8 billion | | 3.1 billion | |
| | Estimated for 2005 | | Actual 2004 | |
| Exploration and development spending(millions of dollars) | Exploration | | Development | | Total E&D | | Total E&D | |
| North America | 571 | | 874 | | 1,445 | | 1,452 | |
| North Sea | 153 | | 872 | | 1,025 | | 507 | |
| Southeast Asia | 65 | | 245 | | 310 | | 255 | |
| Algeria | 8 | | 47 | | 55 | | 8 | |
| Trinidad | 65 | | 35 | | 100 | | 191 | |
| Other | 125 | | — | | 125 | | 125 | |
| | 987 | | 2,073 | | 3,060 | | 2,538 | |
| Production(daily average) | | | Lower 2005 estimate | | Upper 2005 estimate | | Actual 2004 | |
| Oil and liquids (bbls/d) | | | | | | | | |
| North America | | | 54,000 | | 56,000 | | 57,392 | |
| North Sea | | | 117,000 | | 125,000 | | 121,861 | |
| Southeast Asia | | | 33,000 | | 37,000 | | 35,644 | |
| Algeria | | | 15,000 | | 17,000 | | 13,537 | |
| Trinidad | | | 12,000 | | 16,000 | | — | |
| | | | 231,000 | | 251,000 | | 228,434 | |
| Natural gas (mmcf/d) | | | | | | | | |
| North America | | | 920 | | 940 | | 885 | |
| North Sea2 | | | 110 | | 120 | | 114 | |
| Southeast Asia | | | 255 | | 285 | | 260 | |
| | | | 1,285 | | 1,345 | | 1,259 | |
| Barrels of oil equivalent (mboe/d) | | | 445 | | 475 | | 438 | |
| Commodity price and exchange rate assumptions | | | | | Estimated for 2005 | | Actual 2004 | |
| US$/bbl WTI oil price | | | | | 40.00 | | 41.40 | |
| US$/mmbtu NYMEX natural gas price | | | | | 6.25 | | 6.09 | |
| US$/C$ exchange rate | | | | | 0.80 | | 2.25 | |
| C$/£ exchange rate | | | | | 0.77 | | 2.38 | |
1
| A 2005 estimate of net income and net income per share has not been provided due to the inherent difficulties of estimating certain non-cash expenses, such as dry hole, property impairments and non-cash stock based compensation. The Outlook for 2005 excludes acquisitions and dispositions, notably the Norway acquisition announced on February 1, 2005.
|
2
| Includes gas acquired for injection and subsequent resale (of 23, 23, and 5 mmcf/d in lower estimate, upper estimate and actual 2004, respectively).
|
Talisman expects to increase production 2-8% in 2005. Production for 2005 is expected to average approximately 445,000-475,000 boe/d with most of the increase coming from Trinidad, Malaysia and North America.
Unit operating costs are expected to decrease by 5-7% largely due to a projected stronger Canadian dollar and the commencement of low cost production in Trinidad. However, unit production costs, in addition to being impacted by currency exchange rates are dependent on achieving expected production levels. Net capital spending is expected to be $3.1 billion and excludes significant corporate and asset acquisitions. The Company anticipates participating in the drilling of 525 North American and 102 international wells during 2005 (gross).
North America
In 2005, natural gas will continue to be the focus of the Company’s exploration activities in North America, including deep gas exploration in Western Canada and the ongoing drilling program in northeastern United States, supplemented by low risk oil projects. North American natural gas production in 2005 is expected to increase between 3-5% to average between 920-940 mmcf/d, while oil and liquids is expected to average 54,000-56,000 bbls/d, as the Company will spend almost 90% of the North America budget on natural gas exploration and development. The Company expects to spend $1.4 billion on capital projects and drilling in 2005, virtually unchanged from 2004. The Company plans to participate in approximately 525 wells in 2005, including 10-12 high
M a n a g e m e n t ’ s D i s c u s s i o n a n d A n a l y s i s
2 0 0 4 A N N U A L R E P O R T 19
impact exploration wells. Unit operating costs are expected to increase slightly to approximately $5.50/boe due to higher taxes, processing costs and water handling charges.
North Sea
North Sea production is expected to average 117,000-125,000 bbls/d and 110-120 mmcf/d in 2005. The Company’s North Sea strategy is to focus on development projects and exploration opportunities adjacent to core operated properties and infrastructure. Capital spending is planned to increase by 102% over 2004, to just over $1.0 billion, with 85% related to development projects. The Company plans to drill 30 gross development wells (including service wells) and up to 10 gross exploration wells. This increase in spending is driven by the program to develop the Tweedsmuir field, with first production expected late in 2006. Total North Sea operating expenses are expected to decrease in 2005 due in part to a weakening of the pound sterling against the Canadian dollar. At planned exchange rates (approximately £1=C$2.25) unit operating costs could be in the $10.50-12.00/boe range.
Southeast Asia
Natural gas sales in Indonesia are expected to average 150-170 mmcf/d in 2005. The Phase 2 expansion of the gas processing facilities at Suban in the Corridor PSC accounts for $55 million of the planned total capital spending of $75 million in Indonesia during 2005. Oil and liquids production in Indonesia is expected to average 5,000-7,000 bbls/d with the expiry of the Tanjung and Jambi contracts in late 2004 and early 2005.
During 2005, Talisman’s oil and liquids production in Malaysia/Vietnam is expected to average between 28,000-30,000 bbls/d. Natural gas production is expected to average 105-115 mmcf/d during 2005.
Total forecasted capital spending during 2005 in Malaysia/Vietnam is expected to be $235 million. The Block PM-305 South Angsi project will be completed at a cost of $42 million, with first oil is expected mid-2005. Development in PM-3 CAA will continue. The sanction of the PM3 Northern Fields and other new field developments are planned for a total cost of $63 million in 2005. A total of $55 million is planned for exploration activities, including one well on Block PM-3, up to six wells on Block PM-305, up to two wells in Block 46/02 and one well on Block PM-314.
Operating costs in Southeast Asia are expected to decrease to approximately $2.60/boe in 2005 with additional oil volumes from PM-305 in Malaysia and additional anticipated natural gas sales in Indonesia.
Algeria
Production from the Ourhoud and MLN fields in Algeria is expected to average 15,000-17,000 bbls/d in 2005. Unit operating costs are expected to fall due to higher production. A capital budget of $55 million is estimated and includes drilling 10 wells in Ourhoud, four wells in Greater MLN, the expansion of the Greater MLN facility for full pressure maintenance and the start of the MLSE development.
Trinidad
With the completion of the Angostura oil and gas development in 2004, spending will drop in 2005. Capital spending is budgeted at $100 million, with approximately two-thirds directed towards exploration, with the drilling of 8 exploration wells, including two onshore wells. Production in Trinidad is expected to average 12,000-16,000 bbls/d.
Other
The Company is exploring in South America where it expects to spend $21 million in 2005 on exploration drilling in Peru and Colombia. The Company has budgeted to spend $22 million in Alaska during 2005. The Company also plans to spend an estimated $15 million in Qatar, which will include the drilling of an exploration well in Block 10.
Currently, Talisman has committed approximately 2% of its anticipated 2005 North American natural gas production under commodity sales contracts at an average price of C$3.50/mcf. In addition, approximately 6,000 bbls/d of the Company’s 2005 anticipated oil and liquids production has been hedged at an average price of US$26.97/bbl.
A summary of the contracts outstanding at year end can be found in notes 11 and 12 to the Consolidated Financial Statements. Additional discussion of the Company’s commodity price hedging program can be found in the MD&A section entitled ‘Derivative Financial Instruments and Commodity Sales Contracts’.
Liquidity
The Company’s 2005 year end debt position is anticipated to remain relatively unchanged, with cash from operating activities sufficient to fund capital spending, proposed share buy backs and dividend payments. Significant acquisitions or dispositions, a change from expected commodity prices or changes in the amount of share repurchases would impact the Company’s projected 2005 year end net debt position.
Sensitivities
Talisman’s financial performance is affected by factors such as changes in production volumes, commodity prices and exchange rates. The estimated impact of these factors on the Company’s 2005 financial performance is summarized in the following table and is based on a WTI oil price of US$40/bbl, a NYMEX natural gas price of US$6.25/mmbtu and exchange rates of C$1=US$0.80 and £1=C$2.25.
| Approximate Impact in 2005 | | | | |
| (millions of dollars) | Net Income | | Cash Provided by Operating Activities | |
| Volume changes | | | | |
| Oil — 1,000 bbls/d | 5 | | 8 | |
| Natural gas — 10 mmcf/d | 6 | | 14 | |
| Price changes1 | | | | |
| Oil — US$1.00/bbl | 51 | | 55 | |
| Natural gas (North America)2— C$0.10/mcf | 18 | | 24 | |
| Exchange rate changes | | | | |
| US$ increased by US$0.01 | 34 | | 50 | |
| £ increase by C$0.028 | (1) | | 3 | |
1
| The impact of commodity contracts outstanding for 2005 has been included.
|
2
| Price sensitivity on natural gas relates to North American natural gas only. The Company’s exposure to changes in North Sea and Malaysia/Vietnam natural gas prices is not material. Most of the Indonesia natural gas price is based on the price of crude oil and accordingly has been included in the price sensitivity for oil except for a small portion which is sold at a fixed price.
|
20 T A L I S M A N E N E R G Y I N C .
M a n a g e m e n t ’ s D i s c u s s i o n a n d A n a l y s i s
Risks and Uncertainties
Talisman is exposed to a number of risks inherent in exploring for, developing and producing crude oil and natural gas. This section describes the risks and other matters that would be most likely to influence an investor’s decision to purchase securities of Talisman.
The process of estimating oil and gas reserves is complex and involves a significant number of decisions and assumptions in evaluating available geological, geophysical, engineering and economic data; therefore, reserves estimates are inherently uncertain. Talisman prepares all of its reserves information internally. The Company may adjust estimates of proved reserves based on production history, results of exploration and development drilling, prevailing oil and gas prices and other factors, many of which are beyond the Company’s control. In addition, there are numerous uncertainties in forecasting the amounts and timing of future production, costs, expenses and the results of exploration and development projects. All estimates are, to some degree, uncertain and classifications of reserves are only attempts to define the degree of uncertainty involved. For these reasons, estimates of the economically recoverable oil and natural gas reserves attributable to any particular group of properties, the classification of such reserves based on risk of recovery and the standardized measure of discounted future net cash flows, prepared by different engineers or by the same engineers at different times, may vary substantially. Talisman’s actual production, taxes and development and operating expenditures with respect to its reserves will likely vary from such estimates, and such variances could be material.
Estimates with respect to reserves that may be developed and produced in the future are often based upon volumetric calculations and upon analogy to similar types of reservoirs, rather than upon actual production history. Estimates based on these methods generally are less reliable than those based on actual production history. Subsequent evaluation of the same reserves based upon production history will result in variations, which may be material, in the estimated reserves.
The Company’s future success depends largely on its ability to find, develop or acquire additional oil and gas reserves that are economically recoverable. Exploration and development drilling may not result in commercially productive reserves. Successful acquisitions require an assessment of a number of factors, many of which are uncertain. These factors include recoverable reserves, exploration potential, future oil and gas prices, operating costs and potential environmental and other liabilities. Such assessments are inexact and their accuracy is inherently uncertain.
The Company’s operations may be adversely affected by changes in governmental policies and legislation or social instability or other political or economic developments which are not within the control of Talisman including, among other things, a change in crude oil or natural gas pricing policy, the risks of war, terrorism, abduction, expropriation, nationalization, renegotiation or nullification of existing concessions and contracts, taxation policies, economic sanctions, the imposition of specific drilling obligations, the development and abandonment of fields, fluctuating exchange rates and currency controls. In addition, both Indonesia and Algeria are members of the Organization of Petroleum Exporting Countries (“OPEC”). Talisman’s operations in these countries may therefore be impacted by the application of OPEC production quotas. Indonesia, Algeria, Colombia and Peru have been subject to recent economic or political instability and social unrest, military or rebel hostilities. In addition, Talisman regularly evaluates opportunities worldwide, and may in the future engage in projects or acquire properties in other nations that are experiencing economic or political instability and social unrest or military hostilities or are subject to United Nations or United States sanctions.
Oil and gas drilling and producing operations are subject to many risks including the possibility of fire, explosions, mechanical failure, pipe failure, chemical spills, accidental flows of oil, natural gas or well fluids, sour gas releases, and other occurrences or accidents which could result in personal injury or loss of life, damage or destruction of properties, environmental damage, interruption of business, regulatory investigations and penalties and liability to third parties. The Company has developed a comprehensive health, safety and environment (HSE) management framework to mitigate physical risks. The Company also mitigates insurable risks to protect against significant losses by maintaining a comprehensive insurance program, while maintaining levels and amounts of risk within the Company which management believes to be acceptable. Talisman believes its liability, property and business interruption insurance is appropriate to its business and consistent with common industry practice, although such insurance will not provide coverage in all circumstances.
Talisman’s financial performance is highly sensitive to prevailing prices of crude oil and natural gas. Fluctuations in crude oil or natural gas prices could have a material adverse effect on the Company’s operations and financial condition, the value of its oil and natural gas reserves, and its level of spending for oil and gas exploration and development. Prices for crude oil and natural gas fluctuate in response to changes in the supply of and demand for crude oil and natural gas, market uncertainty and a variety of additional factors that are largely beyond the Company’s control. Oil prices are determined by international supply and demand. Factors which affect crude oil prices include the actions of OPEC, world economic conditions, government regulation, political stability in the Middle East and elsewhere, the availability of alternative fuel sources and weather conditions. Most natural gas prices realized by Talisman are affected primarily by North America n supply and demand, weather conditions and by prices of alternative sources of energy. The development of oil and natural gas discoveries in offshore areas is particularly dependent on the outlook for oil and natural gas prices because of the large amount of capital expenditure required for development prior to commencing production.
A substantial and extended decline in the prices of crude oil or natural gas could result in delay or cancellation of drilling, development or construction programs, or curtailment in production or result in unutilized long-term transportation commitments all of which could have a material adverse impact on the Company. The amount of cost oil required to
M a n a g e m e n t ’ s D i s c u s s i o n a n d A n a l y s i s
2 0 0 4 A N N U A L R E P O R T 21
recover Talisman’s investment and costs in various production sharing contracts is dependent on commodity prices, with higher commodity prices resulting in a lower amount of net after royalty oil and gas reserves booked by the Company.
Talisman conducts an annual assessment of the carrying value of its assets in accordance with Canadian GAAP. If oil and natural gas prices decline, the carrying value of the Company’s assets could be subject to downward revisions, which could adversely affect Talisman’s reported income for the periods in which the revisions are made. However, Talisman believes that estimates of forward-looking prices it uses in its planning process are realistic.
From time to time, Talisman is the subject of litigation arising out of the Company’s operations. Damages claimed under such litigation, including the litigation discussed below may be material or may be indeterminate and the outcome of such litigation may materially impact the Company’s financial condition or results of operations. While Talisman assesses the merits of each lawsuit and defends itself accordingly, the Company may be required to incur significant expenses or devote significant resources to defend itself against such litigation. These claims are not currently expected to have a material impact on the Company’s financial position.
Talisman continues to be subject to a lawsuit brought by the Presbyterian Church of Sudan and others commenced in November 2001 under theAlien Tort Claims Actin the United States District Court for the Southern District of New York. The lawsuit, which is seeking class action status, alleges that the Company conspired with, or aided and abetted, the Government of Sudan to commit violations of international law in connection with the Company’s now disposed of interest in oil operations in Sudan. In December 2004, Talisman filed a motion for judgement on the pleadings, seeking dismissal of the lawsuit on the grounds that the court lacks subject matter jurisdiction to hear the lawsuit, and filed its opposition papers to the certification of the lawsuit as a class action. No decision is expected on either of these motions prior to the end of March 2005. Talisman believes the lawsuit to be entir ely without merit and is continuing to vigorously defend itself and does not expect the lawsuit to have a material adverse effect.
All phases of the oil and natural gas business are subject to environmental regulation pursuant to a variety of laws and regulations in the countries in which Talisman does business. These regulatory regimes are laws of general application that apply to the Company’s business in the same manner as they apply to other companies or enterprises in the energy industry. Environmental legislation imposes, among other things, restrictions, liabilities and obligations in connection with the generation, handling, storage, transportation, treatment and disposal of hazardous substances and waste and in connection with spills, releases and emissions of various substances to the environment. Environmental legislation also requires that pipelines, wells, facility sites and other properties associated with Talisman’s operations be operated, maintained, abandoned and reclaimed to the satisfaction of applicable regulatory authorities. Certain types of operations, including exploration and development projects, may require the submission and approval of environmental impact assessments or permit applications. In some cases, exploration and development activities may be precluded or restricted due to designation of areas as environmentally sensitive areas. Compliance with environmental legislation can require significant expenditures and failure to comply with environmental legislation may result in the imposition of fines and penalties and liability for clean up costs and damages. Additionally, the Company’s business is subject to the trend toward increased civil liability for environmental matters. Although Talisman currently believes that the costs of complying with environmental legislation and dealing with environmental civil liabilities will not have a material adverse effect on the Company’s financial condition or results of operations, there can be no assurance that such costs in the future will not have such an effect. Talisman expects to incur site restoration costs over a prolonged period as existin g fields are depleted. The Company provides for future abandonment and reclamation costs in its consolidated financial statements in accordance with Canadian GAAP. Additional information regarding future abandonment and reclamation costs is set forth in the notes to the annual Consolidated Financial Statements.
In 1994, the United Nations’ Framework Convention on Climate Change came into force and three years later led to the Kyoto Protocol (the “Protocol”). The Protocol came into force on February 16, 2005 and requires certain nations to reduce their emissions of carbon dioxide and other greenhouse gases. Under the terms of the Protocol, Canada will be required to reduce its greenhouse gas (GHG) emissions to 6% below 1990 levels over the period beginning in 2008 and ending in 2012. Currently, Canadian oil and gas producers are in discussions with the provincial and federal levels of government regarding implementation mechanisms for the industry. It is premature to predict what impact implementation could have on Canadian oil and gas producers but it is likely that any mandated reduction in GHG emissions will result in increased costs. The federal government has stated that these costs would not be expected to exceed $15/tonne of carbon dioxide emissions reduced and th at producers would not be required to reduce GHG emissions per unit of production by more than 15%. The federal government has also indicated its support for several important principles that are intended to protect the competitiveness of the oil and gas industry beyond 2012, including a 10-year emissions target lock-in period for all new projects and additional flexibility mechanisms for achieving compliance.
The UK has also ratified the Kyoto Protocol, with a reduction commitment of 12.5% below 1990 levels by 2008 — 2012. Talisman’s UK installations will participate in the first phase of the European Union Emission Trading Scheme (“EU ETS”), which runs from 2005 to 2007, inclusive. The UK Government’s revised National Allocation Plan (“NAP”) for the first phase of the EU ETS has yet to be approved by the European Commission. The NAP will specify a cap on carbon dioxide emissions for the covered sectors, the methods for allocating emission allowances to covered installations and the number of emission allowances to be allocated to each covered installation. Cost of compliance will vary with a number of factors including the final allocation numbers and liquidity of the carbon markets.
22 T A L I S M A N E N E R G Y I N C .
M a n a g e m e n t ’ s D i s c u s s i o n a n d A n a l y s i s
Other companies operate some of the assets in which Talisman has interests. As a result, Talisman may have limited ability to exercise influence over operations of these assets or their associated costs, which could adversely affect the Company’s financial performance. The success and timing of Talisman’s activities on assets operated by others will therefore depend on a number of factors that may be outside of the Company’s control, including the timing and amount of capital expenditures, the operator’s expertise and financial resources, the approval of other participants, the selection of technology and the risk of management practices.
In Canada and the United States, the state or private land owners own oil and gas rights and lease those rights to corporations who are responsible for the development of such rights within the time frames described in the leases. This practice differs distinctly in some foreign countries in which Talisman does or may do business in the future. In those countries, the state often grants interests in large tracts of lands or offshore fields and maintains control over the development of the oil and gas rights, in some cases through equity participation in the exploration and development of the rights. This usually includes the imposition of obligations on Talisman to complete minimum work within specified timeframes. Transfers of interests typically require a state approval, which may delay or otherwise impede transfers. In addition, if a dispute arises in Talisman’s foreign operations, the Company may be subject to the exclusive jurisdiction of foreign arbitration tribunals or foreign courts.
The oil and gas industry, both within Canada and internationally, is highly competitive in all aspects of the business, including the acquisition of properties, the exploration for and development of new sources of supply and the marketing of current production. With respect to the exploration, development and marketing of oil and natural gas, the Company’s competitors include major integrated oil and gas companies, numerous other independent oil and gas companies, individual producers and operators and national oil companies. A number of the Company’s competitors have financial and other resources substantially in excess of those available to the Company. In addition, oil and gas producers in general compete indirectly against others engaged in supplying alternative forms of energy, fuel and related products to consumers.
Talisman’s Consolidated Financial Statements are presented in Canadian dollars. Results of operations are affected primarily by the exchange rates between the Canadian dollar, the United States dollar and United Kingdom pounds sterling. These exchange rates have varied substantially in the last five years. Most of the Company’s revenue is received in or is referenced to United States dollar denominated prices, while the majority of Talisman’s expenditures are denominated in Canadian dollars, United States dollars and United Kingdom pounds sterling. A change in the relative value of the Canadian dollar against the United States dollar would also result in an increase or decrease in Talisman’s United States dollar denominated debt, as expressed in Canadian dollars and the related interest expense. Talisman is also exposed to fluctuations in other foreign currencies.
The success of Talisman is dependent upon its management and the quality of its personnel. Failure to retain current employees or to attract and retain new employees with the necessary skills could have a materially adverse effect on Talisman’s growth and profitability.
Forward-Looking Statements
This MD&A contains forward-looking information as contemplated by Canadian securities regulators’ Form 51-102F1 and forward-looking statements within the meaning of the United StatesPrivate Securities Litigation Reform Act of 1995(collectively, “forward-looking statements”).
Identifying forward-looking statements
Forward-looking statements are included throughout this MD&A, including among other places, under the headings “Outlook for 2005” and “Economic Assumptions”. These statements include, among others, statements regarding:
- anticipated cash flow and cash flow per share;
- estimates of future sales, production and operations or financial performance;
- business plans for drilling, exploration and development;
- the estimated amounts and timing of capital expenditures;
- estimates of operating costs;
- business strategy and plans or budgets,
- outlook for oil and gas prices,
- anticipated liquidity, capital resources and debt levels;
- royalty rates and exchange rates;
- the merits or anticipated outcome of pending litigation; and
- other expectations, beliefs, plans, goals, objectives, assumptions, information and statements about possible future events, conditions, results of operations or performance.
Statements concerning oil and gas reserves contained in this MD&A under the headings “Depreciation, Depletion and Amortization Expense”, “Reserve Replacement”, “Asset Impairments”, “Outlook for 2005” and elsewhere may be deemed to be forward-looking statements as they involve the implied assessment that the resources described can be profitably produced in the future, based on certain estimates and assumptions.
Often, but not always, forward-looking statements use words or phrases such as: “expects”, “does not expect” or “is expected”, “anticipates” or “does not anticipate”, “plans” or “planned”, “estimates” or “estimated”, “projects” or “projected”, “forecasts” or “forecasted”, “believes”, “intends”, “likely”, “possible”, “probable”, “scheduled” or “positioned”, “goal” or “objective” or state that certain actions, events or results “may”, “could”, “would”, “might” or “will” be taken, occur or be achieved.
M a n a g e m e n t ’ s D i s c u s s i o n a n d A n a l y s i s
2 0 0 4 A N N U A L R E P O R T 23
Material factors that could cause actual results to differ materially from those in forward-looking statements
Forward-looking statements are based on current expectations, estimates and projections that involve a number of risks and uncertainties, which could cause actual results to differ materially from those anticipated by Talisman and described in the forward-looking statements. These risks and uncertainties include:
- the risks of the oil and gas industry, such as operational risks in exploring for, developing and producing crude oil and natural gas, and market demand;
- risks and uncertainties involving geology of oil and gas deposits;
- the uncertainty of reserves estimates and reserves life;
- the uncertainty of estimates and projections relating to production, costs and expenses;
- potential delays or changes in plans with respect to exploration or development projects or capital expenditures;
- fluctuations in oil and gas prices, foreign currency exchange rates and interest rates;
- health, safety and environmental risks;
- uncertainties as to the availability and cost of financing;
- uncertainties related to the litigation process, such as possible discovery of new evidence or acceptance of novel legal theories and the difficulties in predicting the decisions of judges and juries;
- risks in conducting foreign operations (for example, political and fiscal instability or the possibility of civil unrest or military action);
- general economic conditions;
- the effect of acts of, or actions against international terrorism; and
- the possibility that government policies or laws may change or governmental approvals may be delayed or withheld.
The foregoing list of risks and uncertainties is not exhaustive. Additional information on these and other factors which could affect the Company’s operations or financial results are included under the headings “Risks and Uncertainties” and “Outlook for 2005” and elsewhere in this MD&A. Additional information may also be found in the Company’s other reports on file with Canadian securities regulatory authorities and the United States Securities and Exchange Commission.
No obligation to update forward-looking statements
Forward-looking statements are based on the estimates and opinions of the Company’s management at the time the statements are made. The Company assumes no obligation to update forward-looking statements should circumstances or management’s estimates or opinions change.
Advisory
Reserves Data and Other Oil and Gas Information
Talisman’s disclosure of reserves data and other oil and gas information is made in reliance on an exemption granted to Talisman by Canadian securities regulatory authorities, which permits Talisman to provide disclosure in accordance with US disclosure requirements. The information provided by Talisman may differ from the corresponding information prepared in accordance with Canadian disclosure standards under National Instrument 51-101 (NI 51-101). Talisman’s proved reserves have been calculated using the standards contained in Regulation S-X of the U.S. Securities and Exchange Commission. U.S. practice is to disclose net proved reserves after deduction of estimated royalty burdens and including net profits interests. Talisman makes additional voluntary disclosure of gross proved reserves. Probable reserves, which Talisman also makes as voluntary disclosure, have been calculated using the definition for probable reserves set out by the Society of Petroleum Engineers /World Petroleum Congress (“SPE/WPC”). Further information about the differences between the U.S. requirements and the NI 51-101 requirements is set forth under the heading “Note Regarding Reserves Data and Other Oil and Gas Information” in Talisman’s Annual Information Form.
The exemption granted to Talisman also permits it to disclose internally evaluated reserves data. While Talisman annually obtains an independent audit of a portion of its reserves, no independent reserves evaluator or auditor was involved in the preparation of the reserves data disclosed in this MD&A.
24 T A L I S M A N E N E R G Y I N C .
M a n a g e m e n t ’ s D i s c u s s i o n a n d A n a l y s i s