
ANNUAL INFORMATION FORM
FOR THE YEAR ENDED DECEMBER 31, 2004
March 14, 2005
TABLE OF CONTENTS
| FORWARD-LOOKING STATEMENTS | 1 | |
| NOTE REGARDING RESERVES DATA AND OTHER OIL AND GAS | | |
| INFORMATION | 2 | |
| | | |
| EXCHANGE RATE INFORMATION | 3 | |
| | | |
| DEFINITIONS | 3 | |
| | | |
| CORPORATE STRUCTURE | 4 | |
| | | |
| GENERAL DEVELOPMENT OF THE BUSINESS | 4 | |
| North America | 4 | |
| International and Frontier | 5 | |
| | | |
| DESCRIPTION OF THE BUSINESS | 5 | |
| North America | 5 | |
| Canada | 7 | |
| United States | 9 | |
| Landholdings, Production and Productive Wells | 9 | |
| International and Frontier | 11 | |
| North Sea | 11 | |
| Southeast Asia | 15 | |
| Algeria | 18 | |
| Trinidad | 19 | |
| Colombia | 20 | |
| Peru | 20 | |
| Qatar | 20 | |
| Alaska | 20 | |
| Other | 20 | |
| Productive Wells and Acreage | 21 | |
| Drilling Activity | 22 | |
| Reserves Estimates | 25 | |
| Other Oil and Gas information | 27 | |
| Continuity of Net Proved Reserves | 27 | |
| Standardized Measure of Discounted Future Net Cash | | |
| Flows From Proved Reserves | 28 | |
| Results of Operations from Oil and Gas Producing | | |
| Activities | 30 | |
| Capitalized Costs Relating to Oil and Gas Activities | 30 | |
| Costs Incurred in Oil and Gas Activities | 31 | |
| Product Netbacks (Net) | 32 | |
| Supplemental Oil and Gas Information | 33 | |
| Continuity of Gross Proved Reserves | 33 | |
| Product Netbacks (Gross) | 34 | |
| Additional Information | 35 | |
| Competitive Conditions | 35 | |
| Social Responsibility and Environmental Protection | 35 | |
| Employees | 36 | |
| DESCRIPTION OF CAPITAL STRUCTURE | 36 | |
| Share Capital | 36 | |
| Ratings | 37 | |
| | | |
| MARKET FOR THE SECURITIES OF THE COMPANY | 37 | |
| Trading Price and Volume | 38 | |
| | | |
| DIVIDENDS | 38 | |
| | | |
| DIRECTORS AND OFFICERS | 39 | |
| Directors | 39 | |
| Officers | 41 | |
| Shareholdings of Directors and Executive Officers | 41 | |
| Conflicts of Interest | 42 | |
| | | |
| AUDIT COMMITTEE INFORMATION | 42 | |
| | | |
| LEGAL PROCEEDINGS | 42 | |
| | | |
| RISK FACTORS | 42 | |
| | | |
| TRANSFER AGENTS AND REGISTRARS | 45 | |
| | | |
| INTERESTS OF EXPERTS | 45 | |
| | | |
| ADDITIONAL INFORMATION | 45 | |
| | | |
| SCHEDULE A — REPORT ON RESERVES DATA BY TALISMAN’S | | |
| INTERNAL QUALIFIED RESERVES EVALUATOR | 46 | |
| | | |
| SCHEDULE B — REPORT OF MANAGEMENT AND DIRECTORS | | |
| ON OIL AND GAS DISCLOSURE | 47 | |
| | | |
| SCHEDULE C — AUDIT COMMITTEE INFORMATION | 49 | |
FORWARD-LOOKING STATEMENTS
This Annual Information Form contains or incorporates by reference statements that constitute “forward-looking statements” within the meaning of applicable securities legislation.
Unless the context indicates otherwise, a reference in this Annual Information Form to “Talisman” or the “Company” includes direct or indirect subsidiaries of Talisman Energy Inc. and partnership interests held by Talisman Energy Inc. and its subsidiaries.
Identifying forward-looking statements
Forward-looking statements are included throughout this Annual Information Form including, among other places, under the headings “General Development of the Business”, “Description of the Business” and “Legal Proceedings”. These statements include, among others, statements regarding:
- business strategy and plans or budgets;
- business plans for drilling, exploration and development;
- the estimated amounts and timing of capital expenditures;
- royalty rates and exchange rates;
- the merits and timing or anticipated outcome of pending litigation; and
- other expectations, beliefs, plans, goals, objectives, assumptions, information and statements about possible future events, conditions, results of operations or performance.
Statements concerning oil and gas reserves contained in this Annual Information Form under the headings “Description of the Business —Reserves Estimates” and elsewhere may be deemed to be forward-looking statements as they involve the implied assessment that the resources described can be profitably produced in the future, based on certain estimates and assumptions.
Often, but not always, forward-looking statements use words or phrases such as: “expects”, “does not expect” or “is expected”, “anticipates” or “does not anticipate”, “plans” or “planned”, “estimates” or “estimated”, “projects” or “projected”, “forecasts” or “forecasted”, “believes”, “intends”, “likely”, “possible”, “probable”, “scheduled”, “positioned”, “goals” or “objectives”, or state that certain actions, events or results “may”, “could”, “would”, “might” or “will” be taken, occur or be achieved.
Material factors that could cause actual results to differ materially from those in forward-looking statements
Forward-looking statements are based on current expectations, estimates and projections that involve a number of risks and uncertainties, which could cause actual results to differ materially from those anticipated by Talisman and described in the forward-looking statements. These risks and uncertainties include:
- the risks of the oil and gas industry, such as operational risks in exploring for, developing and producing crude oil and natural gas and market demand;
- risks and uncertainties involving geology of oil and gas deposits;
- the uncertainty of reserves estimates and reserves life;
- the uncertainty of estimates and projections relating to production, costs and expenses;
- potential delays or changes in plans with respect to exploration or development projects or capital expenditures;
- fluctuations in oil and gas prices, foreign currency exchange rates and interest rates;
- health, safety and environmental risks;
- uncertainties as to the availability and cost of financing;
- uncertainties related to the litigation process, such as possible discovery of new evidence or acceptance of novel legal theories and the difficulties in predicting the decisions of judges and juries;
- risks in conducting foreign operations (for example, political and fiscal instability or the possibility of civil unrest or military action);
- general economic conditions;
- the effect of acts of, or actions against international terrorism; and
- the possibility that government policies or laws may change or governmental approvals may be delayed or withheld.
A N N U A L I N F O R M A T I O N F O R M 1
We caution that the foregoing list of risks and uncertainties is not exhaustive. Additional information on these and other factors which could affect the Company’s operations or financial results are included under the heading “Risk Factors”, in the Report on Reserves Data by Talisman’s Internal Qualified Reserves Evaluator and the Report of Management and Directors on Oil and Gas Disclosure, attached as schedules to this Annual Information Form, and elsewhere in this Annual Information Form. Additional information may also be found in the Company’s other reports on file with Canadian securities regulatory authorities and the United States Securities and Exchange Commission (the “SEC”).
No obligation to update forward-looking statements
Forward-looking statements are based on the estimates and opinions of the Company’s management at the time the statements are made. The Company assumes no obligation to update forward-looking statements should circumstances or management’s estimates or opinions change.
NOTE REGARDING RESERVES DATA AND OTHER OIL AND GAS INFORMATION
National Instrument 51-101 (“NI 51-101”) of the Canadian Securities Administrators imposes oil and gas disclosure standards for Canadian public companies engaged in oil and gas activities. NI 51-101 and its companion policy specifically contemplate the granting of exemptions from some of the disclosure standards prescribed by NI 51-101 to companies that are active in the United States capital markets to permit the substitution of the disclosures required by the SEC rules in order to provide for comparability of oil and gas disclosure with that provided by U.S. and other international issuers. Talisman has obtained an exemption from Canadian securities regulatory authorities to permit it to provide disclosure in accordance with the relevant U.S. requirements. Accordingly, most of the reserves data and other oil and gas information included in this Annual Information Form is disclosed in accordance with U.S. disclosure requirements. Such information, as well as the info rmation that Talisman discloses in the future in reliance on the exemption, may differ from the corresponding information prepared in accordance with NI 51-101 standards.
The primary differences between the U.S. requirements and the NI 51-101 requirements are that (i) SEC require (and normally permit) disclosure only of proved reserves, whereas NI 51-101 requires disclosure of proved and probable reserves, and (ii) SEC rules require that the reserves and future net revenue be estimated under existing economic and operating conditions, whereas NI 51-101 requires disclosure of proved reserves and the associated future net revenue on a constant basis, and of proved, probable and proved plus probable reserves and the associated future net revenue on a forecast basis. The definitions of proved reserves differ, but Talisman does not believe that the differences in the definitions would result in any material difference in its reserves estimates for that category. The Canadian Oil and Gas Evaluation Handbook (“COGEH”, the reference source for the definition of proved reserves under NI 51-101) states that the differences in the estimated prove d reserves quantities based on constant prices should not be material.
Talisman has disclosed proved reserves (including continuity of reserves) using the standards contained in U.S. Regulation S-X and the standardized measure of discounted future net cash flows from proved reserves determined in accordance with Statement No. 69 of the U.S. Financial Accounting Standards Board (“FAS 69”). U.S. practice is to disclose net proved reserves, after deduction of estimated royalty burdens and including net profit interests. In addition, notwithstanding that Talisman is not required to disclose probable reserves, it has done so using the definition for probable reserves set out by the Society of Petroleum Engineers/World Petroleum Congress (“SPE/WPC”). Talisman does not believe that the differences in the SPE/WPC and NI 51-101 definitions of probable reserves would result in any material difference in its estimates of probable reserves disclosed in this Annual Information Form.
2 A N N U A L I N F O R M A T I O N F O R M
EXCHANGE RATE INFORMATION
Except where otherwise indicated, in this Annual Information Form all dollar amounts are stated in Canadian dollars.The following table sets forth the Canada/U.S. exchange rates on the last day of the years indicated as well as the high, low and average rates for such years. The high, low and average exchange rates for each year were identified or calculated from spot rates in effect on each trading day during the relevant year. The exchange rates shown are expressed as the number of U.S. dollars required to purchase one Canadian dollar. These exchange rates are based on those published on the Bank of Canada’s website as being in effect at approximately noon on each trading day (the “Bank of Canada noon rate”)
| Year ended December 31 | | | | 2002 | 2003 | 2004 |
| Year end | | | | | | 0.6331 | 0.7738 | 0.8308 |
| High | | | | | | | 0.6618 | 0.7738 | 0.8493 |
| Low | - | - | - | - | - | | 0.6199 | 0.6350 | 0.7159 |
| Average | - | - | - | - | | 0.6369 | 0.7156 | 0.7697 |
| | | | | | | | | | |
| | | | | | | | | | |
DEFINITIONS
The abbreviations set forth below have the following meanings:
| bbls | barrels |
| bcf | billion cubic feet |
| boe | barrels of oil equivalent |
| bbls/d | barrels per day |
| mbbls/d | thousand barrels per day |
| mmbbls | million barrels |
| mcf | thousand cubic feet |
| mmcf/d | million cubic feet per day |
liquids or NGLs natural gas liquids
Natural gas is converted to oil equivalent at the ratio of 6 mcf to 1 boe. Boe may be misleading, particularly if used in isolation. A boe conversion ratio of 6:1 is based on an energy equivalency conversion method primarily applicable at the burner tip and does not represent a value equivalency at the wellhead.
Gross acres means the total number of acres in which Talisman has a working interest. Net acres means the sum of the fractional working interests owned in gross acres expressed as whole numbers and fractions thereof.
Gross production means Talisman’s interest in production volumes (through working interests, royalty interests and net profits interests) before the deduction of royalties. Net production means Talisman’s interest in production volumes after deduction of royalties payable by Talisman.
Gross wells means the total number of wells in which the Company owns a working interest. Net wells means the sum of the fractional working interests owned in gross wells expressed as whole numbers and fractions thereof.
A N N U A L I N F O R M A T I O N F O R M 3
CORPORATE STRUCTURE
Talisman Energy Inc. is amalgamated under theCanada Business Corporations Act. The Company’s registered and principal office is located at Suite 3400, 888 Third Street S.W., Calgary, Alberta T2P 5C5.
In 2004, Talisman amended its Articles of Amalgamation to effect a three for one share subdivision.
The following table sets forth the material operating subsidiaries owned directly or indirectly by Talisman, their jurisdictions of incorporation and the percentage of voting securities beneficially owned, controlled or directed by Talisman as at December 31, 2004.
| | Jurisdiction of | Percentage of Voting | |
| Name of Subsidiary | Incorporation | Securities Owned1 | |
| Talisman Energy (UK) Limited | England | 100% | |
| Talisman North Sea Limited | England | 100% | |
| Talisman (Corridor) Ltd. | Barbados | 100% | |
| Petromet Resources Limited | Ontario, Canada | 100% | |
| Fortuna Energy Inc. | Delaware, U.S. | 100% | |
| Talisman Malaysia Limited | Barbados | 100% | |
Note:
1
| With the exception of Talisman Energy (UK) Limited and Talisman (Corridor) Ltd., none of the above subsidiaries has any non-voting securities outstanding. All of the non-voting securities of Talisman Energy (UK) Limited and Talisman (Corridor) Ltd. are directly or indirectly held by Talisman.
|
The above table does not include all of the subsidiaries of Talisman. The assets, sales and operating revenues of unnamed operating subsidiaries individually did not exceed 10%, and in the aggregate did not exceed 20%, of the total consolidated assets or total consolidated sales and operating revenues, respectively, of Talisman as at, and for the year ended, December 31, 2004.
Talisman Energy Inc. and Petromet Resources Limited (“Petromet”), an indirect subsidiary of Talisman, are partners in an Alberta general partnership named Talisman Energy Canada (the “Partnership”). Talisman is the managing partner of the Partnership. Talisman and Petromet contributed to the Partnership substantially all of their oil and gas assets located in Canada, including their interests in the facilities for processing, treating, storing and transporting the production from such assets. Since June 1, 2001, substantially all of Talisman’s and Petromet’s Canadian oil and gas operations have been carried on through the Partnership.
GENERAL DEVELOPMENT OF THE BUSINESS
Talisman is an independent, Canadian based, international upstream oil and gas company whose main business activities include exploration, development, production and marketing of crude oil, natural gas and natural gas liquids. The Company’s reporting segments are North America, the North Sea, Southeast Asia, Trinidad and Algeria, where there are ongoing production, development and exploration activities. The Company is active in a number of other international and frontier areas, including Alaska, Colombia, Peru and Qatar.
During the past three years, Talisman has developed its business and diversified its interests through a combination of exploration, development, acquisitions and dispositions as described below. Internationally, the Company’s exploration strategy is to pursue significant high impact opportunities to enhance production and value.
NORTH AMERICA
In October 2002, an indirect subsidiary of the Company acquired certain producing Trenton-Black River natural gas assets and additional undeveloped lands located in New York State. The same subsidiary subsequently acquired: (1) additional natural gas properties, working interests, production and facilities relating to the Trenton-Black River play in New York State in January 2003; and (2) all of Belden & Blake Corporation’s Trenton-Black River assets in New York, Pennsylvania, Ohio and West Virginia in June 2004 resulting in ownership of approximately 433,000 gross acres. The June 2004 acquisition effectively doubled the subsidiary’s existing net acreage held in the area.
In July 2003, a subsidiary of Talisman acquired various midstream assets in the Deep Basin area of northwestern Alberta through the purchase of Vista Midstream Solutions Ltd.
4 A N N U A L I N F O R M A T I O N F O R M
INTERNATIONAL AND FRONTIER
In 2002, Talisman expanded its exploration interests both offshore and onshore Trinidad. In 2003, the Company began the Angostura development project on offshore Block 2(c). Development continued through 2004 with production beginning in January 2005. Exploration is continuing in the onshore Eastern Block and in offshore Block 2(c) and Block 3(a).
In May 2002, a consortium in which Talisman is a member was awarded Block 46/02, a three million acre exploration block offshore Vietnam. In 2003, the Company completed the PM-3 Commercial Arrangement Area (“PM-3 CAA”) Phase 2/3 Development Project offshore Malaysia/Vietnam. Oil production from this project began in September 2003 and gas production and sales commenced in November 2003. Talisman Malaysia Limited signed a production sharing contract in March 2004 for Block PM-314 offshore Malaysia.
In December 2002, production commenced at the Ourhoud field (Talisman 2%) in Algeria with first oil sales in 2003. In June 2003, production commenced from the Greater MLN field (Talisman 35%).
Talisman completed the sale of its indirect interest in the Greater Nile Oil Project in Sudan to ONGC Videsh Limited, a subsidiary of India’s national oil company, in March 2003. An indirect subsidiary of Talisman had held a 25% interest in the Greater Nile Oil Project, which had been acquired in 1998.
In August 2003, a Talisman subsidiary was awarded four new exploration blocks in the United Kingdom North Sea (“UK North Sea”) and in December 2003, Talisman acquired interests in the Ross, Renee and Rubie fields in the UK North Sea. In early 2004, a Talisman subsidiary acquired an operated interest in the Galley field in the UK North Sea, and in May 2004, Talisman’s wholly owned subsidiaries acquired additional interests in the Flotta Catchment Area.
In September 2003, one of Talisman’s indirect wholly owned subsidiaries acquired the operated interests and associated assets of BP Norge AS in the Gyda field in the Norwegian sector of the North Sea. Two additional licenses were awarded later in 2003. In February 2004, Talisman’s subsidiary acquired an interest from ConocoPhillips Skandinavia AS in two more licences, including the Blane discovery. In December 2004, the subsidiary was awarded interests in five more licences in the Norwegian sector of the North Sea.
In the fourth quarter of 2004,Talisman Energy (UK) Limited acquired all of the outstanding shares of Intrepid Energy Beta Limited, which included an interest in a number of exploration licenses in the UK, Netherlands and German sectors of the North Sea.
In February 2005, Talisman Energy (UK) Limited acquired all of the outstanding shares in Pertra A.S., resulting in the addition of producing and undeveloped fields, as well as several blocks of operated and non-operated exploration acreage in the Norwegian sector of the North Sea.
Talisman announced in August 2004 an agreement for the sale of 2.3 trillion cubic feet of natural gas from the Corridor production sharing contract in Indonesia. A wholly owned subsidiary of Talisman has a 36% interest in the production sharing contract.
Since 2002, Talisman, through various wholly owned subsidiaries, has acquired non-operated interests in several blocks of exploration acreage in the Andean thrust and fold belt of Colombia and Peru. In 2004, the Company continued its ongoing exploration program on this acreage.
Through three separate transactions occurring in 2004, another indirect subsidiary of Talisman acquired an interest in over 400,000 gross acres of land in the North Slope of Alaska.
Talisman continually investigates strategic acquisitions, dispositions and other business opportunities, some of which may be material. In connection with any such transaction, the Company may incur debt or issue equity securities.
DESCRIPTION OF THE BUSINESS
Talisman is one of the largest independent oil and gas producers in Canada. The Company’s main business activities include exploration, development, production and marketing of crude oil, natural gas and natural gas liquids. Each of Talisman’s current areas of operations has exploration and development potential, which Talisman expects will provide for future growth.
All information in this section relating to assets owned or held by Talisman is as of December 31, 2004, unless indicated otherwise.
NORTH AMERICA
Talisman anticipates that it will spend approximately $1.4 billion on exploration and development in Canada and the U.S. in 2005. Of this, over 90% is directed towards natural gas. The Company plans to participate in drilling approximately 525 gross wells in 2005. In the past two years, the Company’s production growth has mainly been achieved through drilling activities.
A N N U A L I N F O R M A T I O N F O R M 5


6 A N N U A L I N F O R M A T I O N F O R M
CANADA
In Canada, the Company’s strategy is to continue oil and natural gas exploration and development with production emphasis on natural gas exploration focused on deeper portions of the Western Canada Sedimentary Basin. Utilization of existing infrastructure and a high level of operatorship enable Talisman to maintain control over costs, production and capital spending.
Exploration and development activities focus on gas opportunities to take advantage of Talisman’s expertise in medium to deep areas of the Western Canada Sedimentary Basin. The majority of this activity will be in the Alberta Foothills, Deep Basin, Edson area, Greater Arch, Monkman/BC Foothills and Southern Alberta Foothills regions.
Talisman’s Canadian exploration and development operations are organized around 13 core producing areas in Alberta, British Columbia, Ontario and Saskatchewan, which accounted for 92% of the Company’s Canadian production in 2004. The balance comprises production from joint venture properties and synthetic oil production from Talisman’s indirect interest in the Syncrude joint venture. Of the 13 core areas the following seven are the principal gas production areas, namely: Greater Arch, Deep Basin, Alberta Foothills, Edson area (in turn comprised of Bigstone/Wild River, Edson and West Whitecourt), Monkman/BC Foothills, Lac La Biche, and Ontario offshore. The following six core areas are the principal oil production areas, namely: Southern Alberta Foothills, Ontario onshore, Chauvin, Carlyle, Central Alberta and Shaunavon. Within its core areas, Talisman operates approximately 80% of its production with high working interests in a large number of facilities.
Seven of the more active core properties accounted for approximately 76% of the Company’s total Canadian production in 2004: Greater Arch, Deep Basin, Alberta Foothills, Edson area, Monkman/BC Foothills, Ontario (onshore and offshore) and Chauvin. Each of these areas is described in greater detail below.
Greater Arch
The Greater Arch remains Talisman’s largest natural gas producing area. Talisman holds operated interests ranging from 42% to 100% in gas plants at Teepee Creek, Belloy, Boundary Lake, George, Josephine and Shane, as well as interests in a number of other non-operated gas plants in the area. The Company has a large inventory of opportunities to explore which are adjacent to existing infrastructure. The Company’s average operated interest in oil and gas properties in the Greater Arch area is 68%. The Company expects that capital spending in 2005 in the Greater Arch area will be approximately $108 million, and plans to participate in drilling approximately 66 wells.
Deep Basin
Talisman owns a 100% working interest in the Cutbank complex, consisting of the Cutbank and Musreau gas plants, five major field compression stations and an extensive gas gathering system, all of which ran close to capacity throughout 2004. Talisman also holds 3% to 8% non-operated interests in the South Wapiti, Wapiti Deep Cut and Narraway gas plants. The Company expects that capital spending in 2005 in the Deep Basin area will be approximately $150 million, and plans to participate in drilling approximately 43 wells.
Alberta Foothills
Major operated facilities in the Alberta Foothills include an 80% interest in the Cordel dehydration facility and associated pipelines, interests ranging from 60% to 100% in the Erith pipeline and related facilities, a 38% interest in the Chungo/Bighorn gas gathering system, and a 45% interest in the Lovett River/Redcap pipeline system. Talisman has non-operated interests in Basing, Voyager, Stolberg and Brown Creek pipelines and associated facilities. The Company expects that capital spending in 2005 in the Alberta Foothills will be approximately $203 million, and plans to participate in drilling 29 wells (approximately half of which are in the Northern Alberta Foothills). Production from the Northern Alberta Foothills area will involve a significant pipeline connection with volumes expected to come on-stream in 2006.
Edson Area
The Company expects that capital spending in 2005 in the Edson area will be approximately $411 million, and plans to spend approximately $84 million on infrastructure and participate in drilling 147 wells. The properties comprising the larger Edson area (Bigstone/Wild River, Edson and West Whitecourt) are detailed below.
Bigstone/Wild River
Talisman holds operated interests ranging from 64% to 100% in the Bigstone West and Wild River gas plants. The Company is currently focusing on infill drilling in the Wild River area of its Bigstone/Wild River acreage. The Company expects that capital spending in 2005 in the Bigstone/Wild River area will be approximately $225 million (including $22 million for expansion of the Wild River gas plant), and plans to participate in drilling 76 wells, 70% of which will be drilled in the Wild River area.
A N N U A L I N F O R M A T I O N F O R M 7
Edson
Talisman holds operated interests ranging from 59% to 100% in the Edson and Medicine Lodge gas plants. Talisman is currently focusing on exploring and exploiting opportunities in the Edson core area. In 2004, Talisman completed the construction of a 10 megawatt co-generation power plant at its Edson gas processing facility, which is expected to reduce direct carbon dioxide emissions by 22,000 tonnes a year. The Company expects that capital spending in 2005 in the Edson area will be approximately $140 million, and plans to participate in drilling 46 wells.
West Whitecourt
Talisman holds a 51% operated interest in McLeod River gas plant as well as non-operated interests ranging from 10% to 12% in the Kaybob South Amalgamated and the West Whitecourt gas plants. Talisman is currently focusing on development drilling in the West Whitecourt area with expected capital spending in 2005 of approximately $46 million to drill 25 wells.
Monkman/BC Foothills
In the Monkman/BC Foothills area, Talisman holds 58% to 100% operated interests in the Bullmoose, Sukunka and West Sukunka dehydration plants, 29% to 32% non-operated interests in the Murray River and Brazion dehydration plants and a 50% interest in the Mink Highhat Gathering System. In 2004, Talisman drilled the b-60-E/93-P-5 well (“b-60-E”) in the Brazion area,which has produced up to 66 mmcf/d gross sales gas in early 2005. b-60-E production is expected to increase Monkman/BC Foothills production by approximately 25% to 35% above the 2004 production levels. Talisman continued to drill in the more mature Triassic play with two out of two wells testing at rates ranging from 16 to 19 mmcf/d. The Company expects that capital spending in 2005 in the Monkman/BC Foothills area will be approximately $88 million, including an expansion of the Bullmoose compressor station, and plans to participate in drilling approximately eight wells.
Ontario
Talisman currently has natural gas production in the offshore area of Lake Erie and oil production onshore. Talisman has a 100% interest in the Renwick, North Wheatley (East),Rochester and Hillman central facilities. In addition, Talisman has interests ranging from 65% to 100% in the Morpeth, Port Stanley, Port Alma, Port Maitland, Rochester and Nanticoke gas plants. Talisman’s drilling program will continue in 2005 with plans to participate in drilling five onshore oil wells and 20 offshore gas wells. The Company expects that capital spending in 2005 in Ontario will be approximately $15 million.
Chauvin
Chauvin is Talisman’s largest domestic oil producing core property. Talisman holds a 100% interest in the Chauvin pipeline, which transports approximately 38 mbbls/d of condensate blended crude. It also holds a 100% interest in the Chauvin Custom Treating Facility. The Company expects that capital spending in 2005 in the Chauvin area will be approximately $37 million, and plans to participate in drilling approximately 45 wells.
Other
In 2004, Talisman drilled a successful gas well in Central Alberta, which tested at 18 mmcf/d. Production from this well is planned to commence at approximately 15 mmcf/d in the first quarter of 2005. Mineral rights have been secured on five sections of land surrounding this well. The Company expects that capital spending in 2005 in the Central Alberta area will be approximately $20 million.
The Company is also exploring the potential for producing coal bed methane on lands in Alberta and British Columbia. Appraisal drilling and prospect evaluation commenced in 2002. The main focus in 2005 will continue to be the development of coal bed methane horizontal drilling and production technology to determine large-scale commercial viability. The Company expects that capital spending in 2005 in this area will be approximately $23 million, and plans to participate in drilling seven wells.
Talisman’s gas production in Turner Valley (a portion of the Southern Alberta Foothills core area), doubled in 2004 with the commissioning of the Little Chicago gas plant in January 2004. Talisman holds a 100% working interest in this gas plant. Successful multi-leg horizontal oil well drilling in Turner Valley in conjunction with a new oil battery is expected to increase liquids production in 2005. The nitrogen injection pilot project that has been underway for approximately two years is demonstrating increased oil production but requires further evaluation prior to planning of commercial expansion. The Company expects that capital spending in 2005 in the Southern Alberta Foothills area will be approximately $82 million, and plans to participate in drilling approximately 21 wells.
Talisman Midstream Operations
The Company’s Midstream Operations department operates over 640 kilometres of gathering pipelines, interconnected with multiple processing plants and downstream pipelines with an average throughput of approximately 390 mmcf/d in 2004. The Company’s 100% owned Central Foothills Gas Gathering System (“CFGGS”), the Columbia Minehead Gas Gathering System, and other midstream pipeline and processing
8 A N N U A L I N F O R M A T I O N F O R M
assets ranging from 75% to 100% ownership, support the exploration and development program in both the Alberta Foothills and Edson areas and also provide transportation processing revenues. The Company spent approximately $20.7 million to expand and optimize midstream assets in 2004. In 2005, the Company plans to spend $32 million to extend the CFGGS and Cutbank/Musreau pipeline systems and $22 million to add 75 mmcf/d of new processing capacity along the CFGGS and 30 mmcf/d at the Cutbank/Musreau pipeline.
Synthetic Oil
Talisman holds a 1.25% indirect interest in the Syncrude oil sands project (the “Syncrude Project”) through the Canadian Oil Sands Limited Partnership. The Syncrude Project is a joint venture established to recover shallow deposits of tar sands using open pit mining methods to extract the crude bitumen and employing delayed coking technology to upgrade it to a high-quality, light (32 degree, API) sweet, synthetic crude oil. The Syncrude Project, located near Fort McMurray, Alberta, exploits portions of the Athabasca oil sands deposit to produce Syncrude Sweet Blend® (“SSB”). Syncrude is in the final phases of the third stage of a large expansion program. Stage three is expected to cost $7.8 billion to increase capacity from the current level of 90 mmbbls per year to approximately 129 mmbbls per year. The expansion is expected to start-up in the fourth quarter of 2005 with production ramping up to full capacity by 2008. Since its start-up in 1978, Syncrud e has produced almost 1.6 billion barrels of synthetic crude oil. In 2004, Syncrude shipped 87 mmbbls of SSB, and approximately 13% of Canada’s crude oil needs are supplied by this joint venture. Talisman expects that its capital spending in 2005 related to the Syncrude Project, including expansion and sustaining capital, will be approximately $25 million.
UNITED STATES
Fortuna Energy Inc. (“Fortuna”), an indirect wholly owned subsidiary of Talisman, increased production primarily from deep horizontal Trenton-Black River formation gas wells in the Appalachia area from 60 mmcf/d in 2003 to 89 mmcf/d in 2004, with a record peak of 126 mmcf/d on January 12, 2005. In the second quarter of 2004, Fortuna expanded its Appalachia interests through the acquisition of an average 73% working interest in Belden & Blake Corporation’s Trenton-Black River interests. This acquisition effectively doubled Fortuna’s land holdings in the area. Fortuna expects that capital spending in 2005 in the Appalachia area will be approximately $102 million, and plans to participate in drilling 23 wells.
Talisman’s indirect wholly owned subsidiary, Fortuna (US) L.P., continues to explore for oil and gas in the western U.S. Fortuna (US) L.P. expects capital spending in 2005 in the U.S. will be approximately $14 million, and plans to participate in drilling two wells.
LANDHOLDINGS, PRODUCTION AND PRODUCTIVE WELLS
The following tables set forth Talisman’s North American landholdings, production and productive wells as at December 31, 2004.
| | Undeveloped Acreage | | Developed Acreage | | Total Acreage | |
| Property | (thousand acres) | | (thousand acres) | | (thousand acres) | |
| - | Gross | | Net | | Gross | | Net | | Gross | | Net | |
| North America | | | | | | | | | | | | |
| Canada | | | | | | | | | | | | |
| Greater Arch | 1,499.8 | | 1,061.7 | | 710.4 | | 340.4 | | 2,210.2 | | 1,402.1 | |
| Deep Basin | 479.7 | | 285.9 | | 234.2 | | 56.6 | | 713.9 | | 342.5 | |
| Alberta Foothills | 442.3 | | 236.7 | | 183.3 | | 72.1 | | 625.6 | | 308.8 | |
| Edson Area | 831.0 | | 579.0 | | 906.8 | | 466.5 | | 1,737.8 | | 1,045.5 | |
| Monkman/BC Foothills | 700.3 | | 396.3 | | 79.6 | | 40.8 | | 779.9 | | 437.1 | |
| Ontario | 752.5 | | 521.0 | | 365.3 | | 236.8 | | 1,117.8 | | 757.8 | |
| Chauvin | 75.0 | | 47.7 | | 80.4 | | 70.8 | | 155.4 | | 118.5 | |
| Other1 | 4,894.8 | | 1,162.1 | | 731.9 | | 497.2 | | 5,626.7 | | 1,659.3 | |
| United States2 | 1,506.3 | | 1,217.5 | | 27.5 | | 25.8 | | 1,533.8 | | 1,243.3 | |
| Total3 | 11,181.7 | | 5,507.9 | | 3,319.4 | | 1,807.0 | | 14,501.1 | | 7,314.9 | |
| Synthetic Oil | 477.3 | | 84.8 | | 11.0 | | 1.5 | | 488.3 | | 86.3 | |
| | | | | | | | | | | | | |
| Notes: | | | | | | | | | | | | |
| 1 | “Other” includes minor properties in Canada, but excludes Scotian Slope, synthetic oil in Alberta and coal leases in British Columbia. |
| 2 | “United States” excludes Alaska. |
| 3 | Fee acreage comprises 5% of the total gross number of acres and 6% of the net number of acres. Fee acreage for Gross Undeveloped totals 622.1; Gross Developed totals 63.0; Net Undeveloped totals 449.1; and Net Developed totals 22.0.
|
A N N U A L I N F O R M A T I O N F O R M 9
| | Oil & Liquids Production | | Natural Gas Production | | Productive Wells2,3,4as at | |
| (bbls/d) | | (mmcf/d) | | December 31, 2004 | |
| Property | Gross5 | | Net5 | | Gross6 | | Net6 | | Gross | | Net | |
| North America | | | | | | | | | | | | |
| Canada | | | | | | | | | | | | |
| Greater Arch | 7,387 | | 5,850 | | 158.5 | | 122.4 | | 1,341 | | 744.1 | |
| Deep Basin | 2,080 | | 1,830 | | 60.8 | | 44.6 | | 468 | | 90.8 | |
| Alberta Foothills | 227 | | 170 | | 151.0 | | 116.9 | | 195 | | 84.8 | |
| Edson Area | 4,393 | | 3,325 | | 208.5 | | 171.2 | | 985 | | 696.9 | |
| Monkman/BC Foothills | — | | — | | 70.5 | | 56.9 | | 62 | | 35.7 | |
| Ontario | 1,749 | | 1,473 | | 16.4 | | 13.8 | | 803 | | 566.4 | |
| Chauvin | 15,665 | | 13,121 | | 16.0 | | 13.0 | | 1,302 | | 1,195.3 | |
| Other1 | 22,892 | | 17,534 | | 114.3 | | 99.2 | | 4,802 | | 1,834.8 | |
| United States7 | — | | — | | 89.1 | | 76.7 | | 50 | | 46.5 | |
| Total | 54,393 | | 43,303 | | 885.1 | | 714.7 | | 10,008 | | 5,295.3 | |
| Synthetic Oil | 2,999 | | 2,868 | | — | | — | | — | | — | |
| | | | | | | | | | | | | |
| Notes: | | | | | | | | | | | | |
| 1 | “Other” includes minor producing properties in Canada. |
| 2 | “Productive Wells” means producing wells and wells capable of production. |
| 3 | Includes wells containing multiple completions as follows: |
| | Oil Wells | | Gas Wells | |
| Gross | 542.0 | | 970.0 | |
| Net | 273.0 | | 516.6 | |
4
| One or more completions in the same bore hole is counted as one well. A well is classified as an oil well if one of the multiple completions in a given well is an oil completion. |
| 5 | Includes approximately 692 bbls/d of liquids attributable to royalty interests and net profits interests. |
| 6 | Includes approximately 10.6 mmcf/d of gas attributable to royalty interests and net profits interests. |
| 7 | “United States” excludes Alaska. |
10 A N N U A L I N F O R M A T I O N F O R M
INTERNATIONAL AND FRONTIER
Talisman’s international and frontier strategy concentrates on opportunities in sedimentary basins that have a proved hydrocarbon system and significant reserves and production potential. Talisman has developed its international business through exploration, development drilling and corporate and property acquisitions in all reporting segments.
Talisman produces substantial oil and gas volumes from the North Sea, with ongoing exploration and development activities in the area. Talisman is also active in Southeast Asia, where development projects in Indonesia, Malaysia and Vietnam are expected to produce significant oil and gas production growth. Talisman also has producing interests in Algeria and Trinidad and exploration interests in other areas including Alaska, Colombia, Peru, Qatar, Falkland Islands and Papua New Guinea.
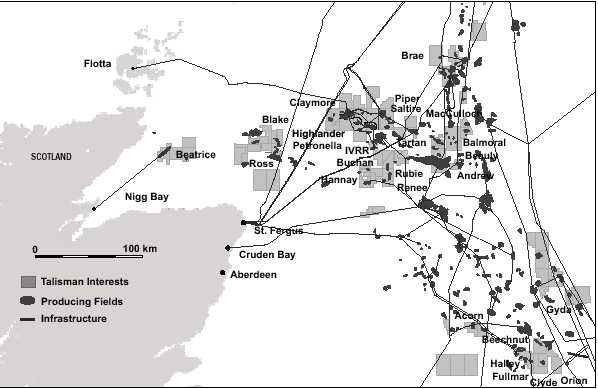
NORTH SEA
Talisman’s North Sea strategy is to develop commercial hubs around core operated properties and infrastructure, and to deliver growth by extending the life of these assets through low risk development opportunities, sub-sea tie-back developments, exploration, secondary recovery, cost reduction and increased third-party tariff revenue. The Company also has a portfolio of non-operated assets.
Talisman’s North Sea assets, which are held principally by Talisman Energy (UK) Limited,Talisman North Sea Limited and Talisman Energy Norge AS, include producing fields and exploration acreage in several areas of the North Sea. Talisman has three core North Sea operating areas: the Mid-North Sea Area (“MNS Area”), the Flotta Catchment Area (“FCA”) and Norway. Talisman also has a number of non-operated interest properties. At the end of 2004, Talisman operated approximately 65% of its North Sea production.
In 2005, Talisman’s capital program in the North Sea is expected to be approximately $1,025 million, with $153 million directed to exploration spending and $872 million directed to development. The Company’s 2005 North Sea drilling program includes participation in up to 10 exploration and 30 development wells (including service wells).
A N N U A L I N F O R M A T I O N F O R M 11
MNS Area Properties
Talisman holds interests ranging from 12% to 100% in a number of production facilities and pipelines in the MNS Area.
Clyde Area
The Company owns various operated interests in the Clyde area, including a 95% operated interest in the Clyde production platform, a 94% operated interest in the Orion field and a 13% non-operated interest in the Fulmar production platform. The Orion tie-back to Clyde was completed in 1999. In 2004, Talisman drilled two development wells on the Clyde field. In January 2004, operations finished on the Eta-2 30/17b exploration well with the wellbore being plugged and abandoned. Talisman made an oil discovery by drilling the Delta well at Block 30/17b. An unsuccessful well was drilled on the Flyndre prospect at Block 30/14-2. In December 2004, the Company spud the Jenny exploration well at Block 30/13c, which was drilling at year end 2004. In 2005, Talisman will drill the Medwin Terrace exploration prospect at Block 30/17b. The 2005 development program includes the drilling of two development wells, one at Clyde and one at Orion, and water injection facility upgrades on the Clyde platform. The Company expects that capital spending in 2005 in the Clyde area will be approximately $108 million.
Buchan Area
The Company has an average 99% operated working interest in the Buchan field, the Buchan floating production platform and the tie-in to the Forties pipeline. Talisman produced its first oil from the Hannay field in March 2002, where it operates with a 99% interest. In October 2002, Talisman drilled the J1 exploration well and in November 2003, the J5 exploration well, both resulting in significant new oil discoveries adjacent to the Buchan field. The discoveries were appraised by drilling the Tweedsmuir appraisal well in July 2004. Talisman holds a 94% interest in the field. In 2004, the Tweedsmuir development was approved and is the main focus of development activity in 2005, including the drilling of three Tweedsmuir development wells. The Company intends to start water injection into the Buchan field in 2005. In addition, the Company intends to drill the North Buchan J2 exploration prospect. The Company expects that capital spending in 2005 in the Buchan area will be approxi mately $474 million.
Ross/Blake Area
In the Ross/Blake area, Talisman has a 69% operated working interest in the Ross field and a 54% non-operated interest in the Blake field, both fields being sub-sea tie-backs to Bleo Holm, the leased Floating, Production, Storage and Offloading vessel. Production from the Blake Flank project commenced in September 2003. Also in 2003 a consortium, including Talisman (37.5%), was awarded Blocks 19/3 and 19/4 in the Twenty-first Licensing Round and a separate Talisman consortium was awarded Block 13/26b as an out-of-round award. Two unsuccessful exploration wells were drilled in the Ross/Blake area in 2004. The Company expects that capital spending in 2005 in the Ross/Blake area will be approximately $40 million, and plans to participate in drilling one exploration well and one development well.
Beatrice Area
Talisman holds a 100% operated interest in the Beatrice Alpha, Bravo and Charlie platforms, as well as the Beatrice/Nigg pipeline and the Nigg terminal. In 2004, Talisman received approval to construct an offshore wind farm demonstrator project adjacent to the Beatrice field.
Other MNS Area Properties
Talisman holds a 60% operated interest in the Beauly field located in Block 16/21c of the MNS. Beauly is a sub-sea tie-back to the Balmoral field. No capital spending is planned for Beauly in 2005.
FCA Properties
Talisman holds interests ranging from 13% to 100% in a number of production facilities and pipelines in the FCA, including an 80% interest in the Flotta terminal.
Piper Area
Talisman holds an 80% operated working interest in the Piper, Saltire, Chanter and Iona fields. In addition, Talisman has a 13% non-operated interest in the MacCulloch field. The Company expects that capital spending in 2005 in the Piper area will be approximately $70 million, including participation in one exploration and two development wells.
12 A N N U A L I N F O R M A T I O N F O R M
Claymore Area
In the Claymore area, Talisman holds a 72% and an 80% operated working interest in the Claymore and Scapa fields, respectively. In 2004, Talisman drilled three development wells on the Claymore field. The Company expects that capital spending in 2005 in the Claymore area will be approximately $89 million, which includes funding for three development wells.
THP Area
Talisman’s subsidiary holds a 100% operated working interest in the Tartan field and the Highlander and Petronella sub-sea tie-back satellite fields; Talisman also holds a 67% operated interest in the Galley field (collectively, “THP Area”). In 2003, Talisman made the North Tartan discovery and in August 2004 production commenced from the field. Also in 2004, Talisman drilled one development well on the Galley field and one unsuccessful exploration well in the THP Area. The Company expects that capital spending in 2005 in the THP Area will be approximately $86 million, and plans to participate in drilling one exploration and two development wells.
Other FCA Properties
Talisman’s subsidiary holds a 78% and 41% operated working interest in the Renee and Rubie fields, respectively. Both fields are sub-sea tie-backs to the Ivanhoe/Rob Roy field in which Talisman has a 23% non-operated interest. Capital spending by the Company in 2005 is expected to be minimal.
Norway
In September 2003, one of Talisman’s indirect wholly owned subsidiaries acquired the 61% operated interest in the Gyda field and associated assets. Two additional licences were awarded later in 2003. In February 2004, Talisman’s subsidiary acquired an interest in two more licences, including the Blane discovery. In December 2004, the subsidiary was awarded interests in five more licences in the Norwegian sector of the North Sea. Three of these licenses give Talisman an operated interest in lands in close proximity to its earlier acquired lands. The remaining two licences are for non-operated interests in lands further north, in the Viking Graben province. In February 2005, Talisman Energy (UK) Limited acquired all of the outstanding shares in Pertra A.S., resulting in the addition of the producing Varg field and undeveloped Varg South field as well as several blocks of operated and non-operated exploration acreage in the Norwegian sector of the North Sea. Production f rom the Varg oilfield is expected to be approximately 10,000 bbls/d net to Talisman. The Company expects that capital spending in 2005 in the Norwegian sector of the North Sea will be approximately $121 million, and plans to participate in drilling two exploration and two development wells.
Non-Operated Interest Properties
Brae Area
Talisman’s non-operated producing interests in the Brae area range from 13% to 18%. Talisman also holds an 8% non-operated interest in the Brae-St. Fergus gas pipeline and terminal. Production from the Brae field commenced in 2003 and in 2004 Talisman participated in one development well in the Brae area. The Company expects that capital spending in 2005 at Brae will be approximately $7 million, and plans to participate in drilling two development wells.
Other Non-Operated Interest Properties
A subsidiary of Talisman holds various non-operated producing interests including: Balmoral (15%), Stirling (15%), Glamis (15%), Andrew (3%), Wytch Farm (5%), Wareham (5%), Alba (2%) and Caledonia (3%) fields. In 2004, Talisman participated in drilling one exploration well and 15 development wells. The Company expects that capital spending in 2005 at its other non-operated interest properties will be approximately $28 million, and plans to participate in drilling two exploration and 13 development wells.
Talisman’s subsidiary holds non-operated producing interests in the Netherlands sector of the North Sea ranging from 2% to 20%. The Company’s interests are in the E, F, G and K sectors.
In the German sector, Talisman’s subsidiary holds a 50% non-operated working interest in one offshore licence, covering portions of blocks C, D, G and H.
A N N U A L I N F O R M A T I O N F O R M 13
Landholdings, Production and Productive Wells
The following tables set forth Talisman’s North Sea landholdings, production and productive wells as at December 31, 2004.
| Undeveloped Acreage | | Developed Acreage | | Total Acreage | |
| Property | (thousand acres) | | (thousand acres) | | (thousand acres) | |
| - | Gross | | Net | | Gross | | Net | | Gross | | Net | |
| Mid-North Sea Area | | | | | | | | | | | | |
| Clyde Area | 343.6 | | 151.2 | | 26.4 | | 21.5 | | 370.0 | | 172.7 | |
| Buchan Area | 326.8 | | 130.1 | | 19.9 | | 19.4 | | 346.7 | | 149.5 | |
| Ross/Blake Area | 315.9 | | 156.8 | | 17.8 | | 12.3 | | 333.7 | | 169.1 | |
| Beatrice Area | 47.6 | | 47.6 | | 11.0 | | 11.0 | | 58.6 | | 58.6 | |
| Other MNS | 66.5 | | 28.3 | | — | | — | | 66.5 | | 28.3 | |
| Flotta Catchment Area | | | | | | | | | | | | |
| Piper Area | 122.7 | | 63.0 | | 37.9 | | 24.6 | | 160.6 | | 87.6 | |
| Claymore Area | 88.2 | | 78.1 | | 23.6 | | 18.6 | | 111.8 | | 96.7 | |
| THP Area | 113.1 | | 64.0 | | 14.5 | | 14.5 | | 127.6 | | 78.5 | |
| Other FCA | 13.5 | | 3.8 | | 15.6 | | 7.7 | | 29.1 | | 11.5 | |
| Norway | 982.2 | | 524.9 | | 33.9 | | 20.7 | | 1,016.1 | | 545.6 | |
| Non-Operated Interests | | | | | | | | | | | | |
| Brae Area | 95.7 | | 15.5 | | 22.7 | | 4.1 | | 118.4 | | 19.6 | |
| Other Non-Operated Interests1 | 1,936.1 | | 857.2 | | 384.5 | | 92.9 | | 2,320.6 | | 950.1 | |
| Total | 4,451.9 | | 2,120.5 | | 607.8 | | 247.3 | | 5,059.7 | | 2,367.8 | |
Note:
1 “Other Non-Operated Interests” includes the Netherlands and Germany.
| Oil & Liquids Production | | Natural Gas Production | | Productive Wells1,2,3as at | |
| Property | (bbls/d) | | (mmcf/d) | | December 31,2004 | |
| - | Gross | | Net | | Gross | | Net | | Gross | | Net | |
| | | | | | | | | | | | |
| Mid-North Sea Area | | | | | | | | | | | | |
| Clyde Area | 14,215 | | 14,215 | | 1.8 | | 1.8 | | 24 | | 22.4 | |
| Buchan Area | 8,814 | | 8,620 | | 0.4 | | 0.4 | | 11 | | 10.9 | |
| Ross/Blake Area | 20,674 | | 20,674 | | 6.5 | | 6.5 | | 19 | | 11.3 | |
| Beatrice Area | 4,270 | | 4,270 | | — | | — | | 28 | | 28.0 | |
| Other MNS | 1,093 | | 1,093 | | 0.1 | | 0.1 | | 1 | | 0.6 | |
| Flotta Catchment Area | | | | | | | | | | | | |
| Piper Area | 16,885 | | 16,883 | | 0.8 | | 0.8 | | 34 | | 21.9 | |
| Claymore Area | 21,499 | | 21,572 | | — | | — | | 36 | | 27.0 | |
| THP Area | 13,896 | | 13,880 | | — | | — | | 27 | | 24.7 | |
| Other FCA | 3,063 | | 3,063 | | — | | — | | 14 | | 4.0 | |
| Norway | 5,862 | | 5,862 | | 3.4 | | 3.4 | | 19 | | 11.4 | |
| Non-Operated Interests | | | | | | | | | | | | |
| Brae Area | 7,111 | | 6,228 | | 83.4 | | 75.1 | | 75 | | 10.3 | |
| Other Non-Operated Interests | 4,479 | | 4,408 | | 17.3 | | 17.3 | | 160 | | 9.2 | |
| Total | 121,861 | | 120,768 | | 113.7 | | 105.4 | | 448 | | 181.7 | |
Notes:
| 1 | “Productive Wells” means producing wells and wells capable of production. |
| 2 | Includes wells containing multiple completions as follows: |
| | Oil Wells | | Gas Wells | |
| Gross | 19.0 | | — | |
| Net | 1.5 | | — | |
| 3 | One or more completions in the same bore hole is counted as one well. A well is classified as an oil well if one of the multiple completions in a given well is an oil completion. |
14 A N N U A L I N F O R M A T I O N F O R M
SOUTHEAST ASIA
The Company’s interests in Southeast Asia include operations in Indonesia, Malaysia and Vietnam and exploration acreage in Papua New Guinea.
In Indonesia, Talisman and its subsidiaries are pursuing a strategy of continued exploitation of existing oil properties and the development of the major natural gas discoveries at Corridor to deliver future production growth.
Talisman plans to spend approximately $75 million in Indonesia in 2005, primarily to participate in drilling two exploration wells and undertake expansion of the Corridor gas facilities.
Corridor PSC
Talisman (Corridor) Ltd. (“TCL”), an indirect wholly owned subsidiary of Talisman, has a 36% non-operated interest in the Corridor production sharing contract (“Corridor PSC Block”) and field production facilities.
In the Corridor PSC Block, TCL’s gas sales to PT Caltex Pacific Indonesia (“Caltex”) commenced in 1998 to the Duri steam flood project and were augmented by a further gas sales agreement with Caltex in 2000. In September 2003, TCL commenced gas sales to Gas Supply Pte. Ltd., located in Singapore, under the terms of a 20-year gas sales agreement. Talisman Transgasindo Ltd. has an indirect 6% interest in the Grissik to Duri pipeline and in the Grissik to Singapore pipeline completed in 2003.
In August 2004, ConocoPhillips (Grissik) Ltd.,as representative of the Corridor PSC contractors, entered into an agreement for the sale of gas to PT Perusahaan Gas Negara (Persero), Tbk, the Indonesian national gas transmission and distribution company. This agreement enables the sale of 2.3 trillion cubic feet (gross) of natural gas from the Corridor PSC Block to the West Java market over a 17-year period commencing in the first quarter of 2007. The Suban Phase 2 gas expansion project was approved in 2004 and includes the installation of two new 200 mmcf/d capacity gas trains, additional pipelines and infrastructure in the Corridor PSC Block.
In 2004, two unsuccessful non-operated exploration wells were drilled in the Corridor PSC Block. No further exploration activity is planned for the Corridor PSC Block in 2005.
The Company expects that capital spending in 2005 in the area will be approximately $63 million, primarily for Suban Phase 2 gas expansion.
A N N U A L I N F O R M A T I O N F O R M 15
Other Properties
Talisman and its subsidiaries hold a 40% non-operated interest in the Corridor technical assistance contract (the “Corridor TAC Block”), a 50% operated interest in the Ogan Komering production sharing contract (the “OK Block”) and a 25% non-operated interest in the offshore Nila production sharing contract (the “Nila Block”).
The enhanced oil recovery contract at Tanjung, in which Talisman held a 50% interest, expired in November 2004 and the enhanced oil recovery contract at Jambi, in which Talisman held a 40% interest, expired in January 2005.
In December 2004, Talisman sold Talisman (Madura) Ltd.,which holds a 25% non-operated interest in the Madura Offshore production sharing contract. Also in December 2004, Talisman participated in an unsuccessful exploration well on the Nila Block.
The 2005 program includes drilling up to two exploration wells on the OK Block. The Company expects that capital spending in 2005 in the area will be approximately $12 million.
Malaysia and Vietnam
In Malaysia and Vietnam, the Company’s strategy is to develop oil and natural gas fields and to deliver production growth through exploration and development. The Company operates three of its four working interest properties in Malaysia and Vietnam, being Block PM-3 CAA/Block 46-Cai Nuoc, Block PM-305 and Block PM-314. Block 46/02 is operated by a joint operating company. Total Malaysia and Vietnam capital spending in 2005 is expected to be $235 million. In addition, the Vietnam Oil and Gas Corporation advised Talisman Vietnam Limited (“TVL”) in December 2004 that TVL’s tender for Block 15-2/01, offshore Vietnam had been successful. The award is subject to agreement of a Petroleum Contract for Block 15-2/01.
Block PM-3 CAA and 46-Cai Nuoc
Two of Talisman’s indirect wholly owned subsidiaries hold interests in Block PM-3 CAA and associated production facilities in Malaysia and Vietnam: Talisman Malaysia Limited (26.4%) and Talisman Malaysia (PM3) Limited (15%). Talisman Vietnam Limited, another indirect wholly owned subsidiary, holds a 33.2% operated interest in the adjacent Block 46-Cai Nuoc area in Vietnam. Part of that area and part of the PM-3 CAA were unitized in 1998 to become the East Bunga Kekwa-Cai Nuoc unit.
In 2003, the Company completed Phase 2/3 of the PM-3 CAA Project, developing a number of fields located in the southeast portion of the block. The project involved the installation of four new wellhead platforms, a central processing platform, a compression annex platform, a floating storage and offloading vessel and interfield pipelines. Phase 2/3 oil production started in September 2003. Natural gas is sold under a long-term contract to Petroliam Nasional Berhad and Vietnam Oil and Gas Corporation, the national oil and gas companies of Malaysia and Vietnam, respectively.
In 2004, Phase 2/3 development drilling continued and the Company had a successful exploration program in the PM-3 CAA and Block 46-Cai Nuoc areas. At year end 2004 the Company was drilling a sidetrack to appraise a new West Bunga Orkid oil discovery. Development studies for these areas are underway.
The Company expects that capital spending in 2005 in the area will be approximately $137 million, and plans to participate in drilling two exploration and appraisal wells and five development wells (including service wells).
Block PM-305
Talisman Malaysia Limited holds a 60% operated working interest in Block PM-305 production sharing contract offshore Malaysia, approximately 250 kilometres southeast of Block PM-3 CAA. In 2003, the Company made an oil discovery 10 kilometres south of the Angsi field. Facilities construction is currently underway and South Angsi development drilling has begun. First oil is planned for mid 2005. Talisman drilled one unsuccessful exploration well on the block in 2004.
The Company expects that capital spending in 2005 in the area will be approximately $81 million, and plans to participate in drilling up to six exploration and nine development wells (including service wells).
Block PM-314
In March 2004, Talisman Malaysia Limited signed a production sharing contract for offshore Block PM-314 in Malaysia. Talisman Malaysia Limited holds a 60% operated working interest in that production sharing contract. The block covers 2.3 million acres immediately west of Block PM-305. In 2004, Talisman acquired a 3D seismic survey over part of the block and interpretation of that data is underway. The Company expects that capital spending in 2005 in the area will be approximately $6 million, and plans to participate in drilling one exploration well.
16 A N N U A L I N F O R M A T I O N F O R M
Block 46/02
In December 2002, Talisman (Vietnam 46/02) Ltd. signed a Petroleum Contract for a 30% interest in Block 46/02 in Vietnam. Talisman (Vietnam 46/02) Ltd. holds a 30% interest in the Truong Son Joint Operating Company (“JOC”),with the remainder held by PetroVietnam Exploration and Production Company (40%) and Petronas Carigali Overseas SDN BHD (30%),the wholly owned exploration and production subsidiaries of the national petroleum companies of Vietnam and Malaysia, respectively. In 2004, the Company drilled two more exploration wells. One was unsuccessful and the other discovered oil, which is being evaluated for potential development. The Company expects that capital spending in 2005 in Block 46/02 will be approximately $11 million, and plans to participate in drilling up to two exploration wells.
Papua New Guinea
The Company holds an operated interest in offshore Papua New Guinea Block PRL-1 (48%),which contains a natural gas discovery, and in Block PPL-244 (35%),which is exploration acreage.
Landholdings, Production and Productive Wells
The following tables set forth Talisman’s Southeast Asia landholdings, production and productive wells as at December 31, 2004.
| | Undeveloped Acreage | | Developed Acreage | | Total Acreage | |
| Property | (thousand acres) | | (thousand acres) | | (thousand acres) | |
| - | Gross | | Net | | Gross | | Net | | Gross | | Net | |
| Indonesia | | | | | | | | | | | | |
| Corridor PSC | 407.6 | | 146.8 | | 150.5 | | 54.2 | | 558.1 | | 201.0 | |
| Other1 | 1,603.5 | | 473.8 | | 117.2 | | 48.0 | | 1,720.7 | | 521.8 | |
| Malaysia and Vietnam | | | | | | | | | | | | |
| Block PM-3 CAA and 46-Cai Nuoc | 129.7 | | 52.6 | | 224.4 | | 92.5 | | 354.1 | | 145.1 | |
| Block PM-305 | 543.6 | | 326.2 | | — | | — | | 543.6 | | 326.2 | |
| Block PM-314 | 2,309.8 | | 1,385.9 | | — | | — | | 2,309.8 | | 1,385.9 | |
| Block 46/02 | 3,023.6 | | 907.1 | | — | | — | | 3,023.6 | | 907.1 | |
| Papua New Guinea | 858.2 | | 325.1 | | — | | — | | 858.2 | | 325.1 | |
| Total | 8,876.0 | | 3,617.5 | | 492.1 | | 194.7 | | 9,368.1 | | 3,812.2 | |
| | | | | | | | | | | | | |
| Note: | | | | | | | | | | | | |
| 1 | “Other” includes Corridor TAC Block, Tanjung Block, Jambi Block, Ogan Komering Block and Nila PSC Block. The enhanced oil recovery contract at Jambi expired in January 2005, but is included in this table as the Company’s interest was still in effect at year end 2004. |
| | Oil & Liquids Production | | Natural Gas Production | | Productive Wells2,3,4as at | |
| Property | (bbls/d) | | (mmcf/d) | | December 31, 2004 | |
| - | Gross | | Net1 | | Gross | | Net1 | | Gross | | Net | |
| Indonesia | | | | | | | | | | | | |
| Corridor PSC | 2,637 | | 948 | | 133 | | 99.3 | | 120 | | 42.9 | |
| Other5 | 10,618 | | 5,351 | | 8 | | 4.8 | | 590 | | 234.4 | |
| Malaysia and Vietnam | | | | | | | | | | | | |
| Block PM-3 CAA and 46-Cai Nuoc | 22,389 | | 14,585 | | 119 | | 89.9 | | 40 | | 16.3 | |
| Block PM-305 | — | | — | | — | | — | | — | | — | |
| Block PM 314 | — | | — | | — | | — | | — | | — | |
| Block 46/02 | — | | — | | — | | — | | — | | — | |
| Papua New Guinea | — | | — | | — | | — | | — | | — | |
| Total | 35,644 | | 20,884 | | 260 | | 194.0 | | 750 | | 293.6 | |
| Notes: | | | | | | | | | | | | |
| 1 | Interests of the Indonesian, Malaysian and Vietnam governments, other than working interests or income taxes, are accounted for as royalties. |
| 2 | “Productive Wells” means producing wells and wells capable of production. |
| 3 | Includes wells containing multiple completions4as follows: |
| | Oil Wells | | Gas Wells | |
| Gross | 99.0 | | — | |
| Net | 39.8 | | — | |
| 4 | One or more completions in the same bore hole is counted as one well. A well is classified as an oil well if one of the multiple completions in a given well is an oil completion. |
| 5 | “Other” includes the Corridor TAC Block, Tanjung Block, Jambi Block and OK Block. The enhanced oil recovery contract at Jambi expired in January 2005, but is included in this table as the Company’s interest was still in effect at year end 2004. |
A N N U A L I N F O R M A T I O N F O R M 17
ALGERIA
Talisman (Algeria) B.V., an indirect wholly owned subsidiary of Talisman, holds a 35% non-operated working interest in Block 405a and Block 215 under a production sharing contract with Algeria’s National Oil Company, Sonatrach. Block 405a contains the Greater Menzel Lejmat North (“Greater MLN”) field as well as a portion of the Ourhoud field.

In 2003, Phase 1 of the Greater MLN development project was completed with production commencing in June 2003. Greater MLN facilities include a central processing facility (“CPF”) and compression for gas injection. Crude oil is pipelined to the Mediterranean coast for export. Phase 2 expansion of the CPF for full pressure maintenance is currently under review, as is the development of the Menzel Lejmat South East field located to the south of Block 405a. The Company expects to relinquish a portion of Block 405a and all of Block 215 in 2005.
Ourhoud
Production at the Ourhoud field (Talisman 2%) commenced in December 2002 with first oil sales in 2003. Production from Ourhoud is anticipated to remain at plateau levels throughout 2005.
The Company expects that capital spending in 2005 in Algeria will be approximately $55 million, which includes funding for two exploration wells and 14 development wells (including service wells).
18 A N N U A L I N F O R M A T I O N F O R M
Landholdings, Production and Productive Wells
The following tables set forth Talisman’s Algerian landholdings, production and productive wells as at December 31, 2004.
| | Undeveloped Acreage | | Developed Acreage | | Total Acreage | |
| Property | (thousand acres) | | (thousand acres) | | (thousand acres) | |
| -- | Gross | | Net | | Gross | | Net | | Gross | | Net | |
| Greater MLN1 | 330.5 | | 115.7 | | 11.2 | | 3.9 | | 341.7 | | 119.6 | |
| Ourhoud | — | | — | | 65.6 | | 1.3 | | 65.6 | | 1.3 | |
| Other2 | 420.0 | | 147.0 | | — | | — | | 420.0 | | 147.0 | |
| Total | 750.5 | | 262.7 | | 76.8 | | 5.2 | | 827.3 | | 267.9 | |
| | | | | | | | | | | | | |
| Notes: | | | | | | | | | | | | |
| 1 “Greater MLN” includes MLSE acreage. | | | | | | | | | | | | |
| 2 “Other” includes Block 215 acreage. | | | | | | | | | | | | |
| | | | | | | | | | | | | |
| | Oil & Liquids Production | | Natural Gas Production | | Productive Wells2as at | |
| Property | (bbls/d) | | (mmcf/d) | | December 31, 2004 | |
| - | Gross | | Net1 | | Gross | | Net1 | | Gross | | Net | |
| Greater MLN | 9,053 | | 5,544 | | — | | — | | 14 | | 4.9 | |
| Ourhoud | 4,484 | | 2,794 | | — | | — | | 28 | | 0.6 | |
| Total | 13,537 | | 8,338 | | — | | — | | 42 | | 5.5 | |
| | | | | | | | | | | | | |
| Notes: | | | | | | | | | | | | |
| 1 | Interests of the Algerian government, other than working interests or income taxes, are accounted for as royalties. |
| 2 | “Productive Wells” means producing wells and wells capable of production. |
TRINIDAD
Talisman holds a 25% non-operated interest in the Angostura development portion of Block 2(c) and a 36% interest in the balance of Block 2(c) located to the south and retained for further exploration. The 36% interest is comprised of a 25% original interest plus an 11% share of the interest of a non-participating co-venturer, subject to a reinstatement right.
The Greater Angostura Project located in Block 2(c) was sanctioned in 2003 and in 2004 the installation of all field facilities was completed, including a central processing platform and three wellhead platforms. Oil production commenced in January 2005 with oil exported to a new onshore oil terminal located west of Galeota Point in the southeast of Trinidad. In 2004, the Company also drilled one successful exploration well on the block.
Talisman’s wholly owned subsidiary, Talisman (Trinidad Block 3a) Ltd., holds a 30% interest in the production sharing contract on Block 3(a), immediately to the east of Block 2(c). In February 2004, the Company finished drilling the Puncheon-1 exploration well, which tested oil at a rate of 4,443 bbls/d. The well has not been tied in.
In 2002, Talisman (Trinidad) Petroleum Ltd., a wholly owned subsidiary, acquired the right to earn an operated 65% interest in the onshore Eastern Block. This block is comprised of approximately 108 thousand gross acres (44 thousand hectares),of which the Government of Trinidad holds the mineral rights to approximately 95 thousand acres (38.5 thousand hectares) and the balance is freehold title. In 2004,the Company completed its 3D seismic acquisition covering much of the Eastern Block. Seismic data is being interpreted to define a drilling program which will commence in 2005.
The Company expects that capital spending in 2005 in Trinidad will be approximately $100 million, and plans to participate in drilling up to eight exploration and eight development wells (including service wells).
A N N U A L I N F O R M A T I O N F O R M 19
COLOMBIA
In Colombia, Talisman (Colombia) Oil & Gas Ltd.,a wholly owned subsidiary of Talisman, is focusing on an exploration program in a known hydrocarbon basin.
The subsidiary holds non-operated interests in three blocks in the Upper Magdalena Valley region, including Acevedo (70%),Altamizal (30%) and Huila Norte (30%). In 2004,50% of the Huila Norte Block was relinquished. The balance of that block, and the Acevedo and Altamizal blocks, commenced relinquishment in 2004 and are expected to be fully relinquished in 2005.
In the Llanos Foothills region of north-central Colombia, the subsidiary holds a 30% non-operated interest in the Tangara and Mundo Nuevo blocks. In July 2004, the Tangara-1 exploration well was spudded on the Tangara Block and the well was drilling at year end.
The Company expects that capital spending in 2005 in Colombia will be approximately $8 million in order to finish operations at Tangara-1 and to fund ongoing geologic and geophysical work.
PERU
In 2004, Talisman (Peru) Ltd., a wholly owned subsidiary of Talisman, acquired a 25% non-operated interest in Peru’s Block 64 in the Marañon Basin. An exploration well drilled in 2004, encountered drilling problems and was unable to reach the target formation.
The Company expects that capital spending in 2005 in Peru will be approximately $13 million, and plans to participate in drilling one exploration well, which was spud in late January 2005.
QATAR
Talisman Energy (Qatar) Inc.,a wholly owned subsidiary of Talisman, holds a 100% interest in an Exploration and Production Sharing Agreement for offshore Block 10 in Qatar. During 2004, the Company’s subsidiary completed a 3D seismic acquisition on the block. Interpretation of that data is expected to continue into 2005.
The Company expects that capital spending in 2005 in Qatar will be approximately $15 million. The Company plans to drill its first exploration well in late 2005.
ALASKA
In June 2003, the Company’s indirect wholly owned subsidiary, FEX L.P. (“FEX”) (formerly Fortuna Exploration LLP), entered into an agreement with Total E&P USA, Inc. (“Total”), through which the Company earned a 30% interest in certain lands in the Caribou Region of the National Petroleum Reserve — Alaska (“NPRA”). This represented the Company’s initial entry into Alaska. In October 2004, the Company entered into a further agreement with Total whereby FEX acquired a 100% working interest in the Caribou lands. In June 2004, FEX participated in a lease sale covering the Northwest Planning Area of the NPRA, acquiring a 100% interest in over 250,000 acres of land. In October 2004, FEX was successful at another lease sale, acquiring approximately 101,000 acres of State lands in the offshore Harrison Bay area. FEX expects capital spending in 2005 in the Alaska area will be approximately $22 million in 2005, primarily to conduct geologi c and geophysical work to further evaluate these newly acquired lands.
OTHER
Talisman’s strategy is to expand activity in core producing areas and to add new ventures where appropriate. The Company actively investigates new ventures outside core producing areas.
20 A N N U A L I N F O R M A T I O N F O R M
PRODUCTIVE WELLS AND ACREAGE
The following table shows the number of productive wells1in which the Company had a working interest, as well as developed and undeveloped acres assignable to such wells, as of December 31, 2004. Undeveloped acreage is considered to be those lease acres on which wells have not been drilled or completed to a point that would permit the production of commercial quantities of oil and gas regardless of whether or not such acreage contains proved reserves.
| | Productive Wells | | Developed | | Undeveloped | |
| - | Oil Wells2 | | Gas Wells2 | | Acres | | Acres | |
| North America3 | | | | | | | | |
| Gross | 5,351.0 | | 4,657.0 | | 3,330.4 | | 11,659.0 | |
| Net | 2,807.7 | | 2,487.5 | | 1,808.5 | | 5,592.7 | |
| North Sea | | | | | | | | |
| Gross | 424.0 | | 24.0 | | 607.8 | | 4,451.9 | |
| Net | 178.9 | | 2.8 | | 247.3 | | 2,120.5 | |
| Southeast Asia | | | | | | | | |
| Gross | 710.0 | | 40.0 | | 492.1 | | 8,876.0 | |
| Net | 279.0 | | 14.6 | | 194.7 | | 3,617.5 | |
| Algeria | | | | | | | | |
| Gross | 42.0 | | — | | 76.8 | | 750.5 | |
| Net | 5.5 | | — | | 5.2 | | 262.7 | |
| Trinidad | | | | | | | | |
| Gross | 11.0 | | — | | 23.5 | | 299.8 | |
| Net | 2.8 | | — | | 5.9 | | 130.1 | |
| Other4 | | | | | | | | |
| Gross | — | | — | | — | | 5,441.0 | |
| Net | — | | — | | — | | 2,675.6 | |
| Total | | | | | | | | |
| Gross | 6,538.0 | | 4,721.0 | | 4,530.6 | | 31,478.2 | |
| Net | 3,273.9 | | 2,504.9 | | 2,261.6 | | 14,399.1 | |
| | | | | | | | | |
| Notes: | | | | | | | | |
| 1 | “Productive Wells” means producing wells and wells capable of production. |
| 2 | Includes wells containing multiple completions as follows: |
| | Oil Wells | | Gas Wells | |
| 2003 | Gross | 490.0 | | 814.0 | |
| | Net | 263.1 | | 425.4 | |
| 2004 | Gross | 542.0 | | 970.0 | |
| - | Net | 273.0 | | 516.6 | |
One or more completions in the same bore hole is counted as one well. A well is classified as an oil well if one of the multiple completions in a given well is an oil completion.
| 3 | "North America" includes synthetic oil. |
| 4 | “Other” includes Alaska, Colombia, Peru, Qatar, Falkland Islands and Scotian Slope. |
A N N U A L I N F O R M A T I O N F O R M 21
DRILLING ACTIVITY
The following table sets forth the number of wells1Talisman has drilled and tested or participated in drilling and testing, and the net2interest of the Company in such wells for each of the last three fiscal years. The number of wells drilled refers to the number of wells completed at any time during the fiscal years, regardless of when drilling was initiated. The term “completion” refers to the installation of permanent equipment for the production of oil and gas, or, in the case of a dry hole, to reporting of abandonment to the appropriate agency.
| Year Ended | | | | Exploration | | Development | | Total | |
| December 31,2004 | | Oil3 | | Gas3 | | Dry4 | | Total | | Oil3 | | Gas3 | | Dry4 | | Total | | Oil3 | | Gas3 | | Dry4 | | Total | |
| North America | | | | | | | | | | | | | | | | | | | | | | | | | |
| | Canada | | Gross | | 16.0 | | 123.0 | | 15.0 | | 154.0 | | 121.0 | | 301.0 | | 23.0 | | 445.0 | | 137.0 | | 424.0 | | 38.0 | | 599.0 | |
| | | | Net | | 13.4 | | 64.0 | | 11.5 | | 88.9 | | 66.9 | | 183.0 | | 18.6 | | 268.5 | | 80.3 | | 247.0 | | 30.1 | | 357.4 | |
| | United States5 | Gross | | — | | 20.0 | | 1.0 | | 21.0 | | — | | — | | — | | — | | — | | 20.0 | | 1.0 | | 21.0 | |
| | | | Net | | — | | 15.9 | | 1.0 | | 16.9 | | — | | — | | — | | — | | — | | 15.9 | | 1.0 | | 16.9 | |
| North Sea6 | | Gross | | 3.0 | | — | | 6.0 | | 9.0 | | 17.0 | | — | | 1.0 | | 18.0 | | 20.0 | | — | | 7.0 | | 27.0 | |
| | | | Net | | 1.9 | | — | | 4.3 | | 6.2 | | 6.0 | | — | | 0.8 | | 6.8 | | 7.9 | | — | | 5.1 | | 13.0 | |
| Southeast Asia | | | | | | | | | | | | | | | | | | | | | | | | | |
| | Indonesia | | Gross | | — | | — | | 2.0 | | 2.0 | | 9.0 | | — | | — | | 9.0 | | 9.0 | | — | | 2.0 | | 11.0 | |
| | | | Net | | — | | — | | 0.7 | | 0.7 | | 3.8 | | — | | — | | 3.8 | | 3.8 | | — | | 0.7 | | 4.5 | |
| | Malaysia/ | | Gross | | 1.0 | | — | | 3.0 | | 4.0 | | 12.0 | | 2.0 | | 1.0 | | 15.0 | | 13.0 | | 2.0 | | 4.0 | | 19.0 | |
| | Vietnam | | Net | | 0.4 | | — | | 1.6 | | 2.0 | | 5.0 | | 0.8 | | 0.4 | | 6.2 | | 5.4 | | 0.8 | | 2.0 | | 8.2 | |
| Algeria | | Gross | | — | | — | | — | | — | | 3.0 | | — | | — | | 3.0 | | 3.0 | | — | | — | | 3.0 | |
| | | | Net | | — | | — | | — | | — | | 0.1 | | — | | — | | 0.1 | | 0.1 | | — | | — | | 0.1 | |
| Trinidad | | Gross | | 1.0 | | 1.0 | | — | | 2.0 | | 11.0 | | — | | 1.0 | | 12.0 | | 12.0 | | 1.0 | | 1.0 | | 14.0 | |
| | | | Net | | 0.3 | | 0.3 | | — | | 0.6 | | 2.8 | | — | | 0.3 | | 3.1 | | 3.1 | | 0.3 | | 0.3 | | 3.7 | |
| Other7 | | Gross | | — | | — | | 4.0 | | 4.0 | | — | | — | | — | | — | | — | | — | | 4.0 | | 4.0 | |
| | | | Net | | — | | — | | 1.6 | | 1.6 | | — | | — | | — | | — | | — | | — | | 1.6 | | 1.6 | |
| Total | | Gross | | 21.0 | | 144.0 | | 31.0 | | 196.0 | | 173.0 | | 303.0 | | 26.0 | | 502.0 | | 194.0 | | 447.0 | | 57.0 | | 698.0 | |
| | | | Net | | 16.0 | | 80.2 | | 20.7 | | 116.9 | | 84.6 | | 183.8 | | 20.1 | | 288.5 | | 100.6 | | 264.0 | | 40.8 | | 405.4 | |
| | | | | | | | | | | | | | | | | | | | | | | | | | | | | |
| | | | | | | | | | | | | | | | | | | | | | | | | | | | | |
| Year Ended | | | | Exploration | | Development | | Total | |
| December 31,2003 | | Oil3 | | Gas3 | | Dry4 | | Total | | Oil3 | | Gas3 | | Dry4 | | Total | | Oil3 | | Gas3 | | Dry4 | | Total | |
| North America | | | | | | | | | | | | | | | | | | | | | | | | | |
| | Canada | | Gross | | 14.0 | | 147.0 | | 21.0 | | 182.0 | | 190.0 | | 225.0 | | 21.0 | | 436.0 | | 204.0 | | 372.0 | | 42.0 | | 618.0 | |
| | | | Net | | 9.4 | | 100.9 | | 15.6 | | 125.9 | | 101.0 | | 132.7 | | 18.2 | | 251.9 | | 110.4 | | 233.6 | | 33.8 | | 377.8 | |
| | United States | Gross | | — | | 6.0 | | — | | 6.0 | | — | | — | | — | | — | | — | | 6.0 | | — | | 6.0 | |
| | | | Net | | — | | 4.2 | | — | | 4.2 | | — | | — | | — | | — | | — | | 4.2 | | — | | 4.2 | |
| North Sea6 | | Gross | | 3.0 | | — | | 2.0 | | 5.0 | | 12.0 | | 2.0 | | 3.0 | | 17.0 | | 15.0 | | 2.0 | | 5.0 | | 22.0 | |
| | | | Net | | 2.2 | | — | | 1.1 | | 3.3 | | 5.5 | | 0.2 | | 0.9 | | 6.6 | | 7.7 | | 0.2 | | 2.0 | | 9.9 | |
| Southeast Asia | | | | | | | | | | | | | | | | | | | | | | | | | |
| | Indonesia | | Gross | | — | | 1.0 | | 2.0 | | 3.0 | | 6.0 | | — | | — | | 6.0 | | 6.0 | | 1.0 | | 2.0 | | 9.0 | |
| | | | Net | | — | | 0.4 | | 0.5 | | 0.9 | | 2.6 | | — | | — | | 2.6 | | 2.6 | | 0.4 | | 0.5 | | 3.5 | |
| | Malaysia/ | | Gross | | 2.0 | | 4.0 | | 1.0 | | 7.0 | | 12.0 | | 9.0 | | — | | 21.0 | | 14.0 | | 13.0 | | 1.0 | | 28.0 | |
| | Vietnam | | Net | | 0.9 | | 1.6 | | 0.4 | | 2.9 | | 4.9 | | 3.6 | | — | | 8.5 | | 5.8 | | 5.2 | | 0.4 | | 11.4 | |
| Algeria | | Gross | | 1.0 | | — | | — | | 1.0 | | 11.0 | | — | | — | | 11.0 | | 12.0 | | — | | — | | 12.0 | |
| | | | Net | | 0.4 | | — | | — | | 0.4 | | 0.6 | | — | | — | | 0.6 | | 1.0 | | — | | — | | 1.0 | |
| Sudan | | Gross | | 2.0 | | — | | — | | 2.0 | | 1.0 | | — | | — | | 1.0 | | 3.0 | | — | | — | | 3.0 | |
| | | | Net | | 0.5 | | — | | — | | 0.5 | | 0.3 | | — | | — | | 0.3 | | 0.8 | | — | | — | | 0.8 | |
| Trinidad | | Gross | | 1.0 | | 2.0 | | — | | 3.0 | | — | | — | | — | | — | | 1.0 | | 2.0 | | — | | 3.0 | |
| | | | Net | | 0.4 | | 0.6 | | — | | 1.0 | | — | | — | | — | | — | | 0.4 | | 0.6 | | — | | 1.0 | |
| Other8 | | Gross | | — | | — | | 1.0 | | 1.0 | | — | | — | | — | | — | | — | | — | | 1.0 | | 1.0 | |
| | | | Net | | — | | — | | 0.3 | | 0.3 | | — | | — | | — | | — | | — | | — | | 0.3 | | 0.3 | |
| Total | | Gross | | 23.0 | | 160.0 | | 27.0 | | 210.0 | | 232.0 | | 236.0 | | 24.0 | | 492.0 | | 255.0 | | 396.0 | | 51.0 | | 702.0 | |
| | | | Net | | 13.8 | | 107.7 | | 17.9 | | 139.4 | | 114.9 | | 136.5 | | 19.1 | | 270.5 | | 128.7 | | 244.2 | | 37.0 | | 409.9 | |
| | | | | | | | | | | | | | | | | | | | | | | | | | | | | |
| | | | | | | | | | | | | | | | | | | | | | | | | | | | | |
| | | | | | | | | | | | | | | | | | | | | | | | | | | | | |
| | | | | | | | | | | | | | | | | | | | | | | | | | | | | |
| | | | | | | | | | | | | | | | | | | | | | | | | | | | | |
22 A N N U A L I N F O R M A T I O N F O R M
| Year Ended | | Exploration | | Development | | Total | |
| December 31,20029 | Oil3 | | Gas3 | | Dry4 | | Total | | Oil3 | | Gas3 | | Dry4 | | Total | | Oil3 | | Gas3 | | Dry4 | | Total | |
| North America | | | | | | | | | | | | | | | | | | | | | | | | | |
| Canada | Gross | 17.0 | | 95.0 | | 35.0 | | 147.0 | | 129.0 | | 127.0 | | 15.0 | | 271.0 | | 146.0 | | 222.0 | | 50.0 | | 418.0 | |
| | Net | 14.8 | | 66.4 | | 26.4 | | 107.6 | | 88.9 | | 70.9 | | 10.9 | | 170.7 | | 103.7 | | 137.3 | | 37.3 | | 278.3 | |
| United States | Gross | — | | 1.0 | | 5.0 | | 6.0 | | — | | — | | — | | — | | — | | 1.0 | | 5.0 | | 6.0 | |
| | Net | — | | 1.0 | | 3.4 | | 4.4 | | — | | — | | — | | — | | — | | 1.0 | | 3.4 | | 4.4 | |
| North Sea6 | Gross | 1.0 | | — | | 3.0 | | 4.0 | | 14.0 | | 2.0 | | 3.0 | | 19.0 | | 15.0 | | 2.0 | | 6.0 | | 23.0 | |
| | Net | 0.9 | | — | | 1.6 | | 2.5 | | 5.4 | | 0.1 | | 2.2 | | 7.7 | | 6.3 | | 0.1 | | 3.8 | | 10.2 | |
| Southeast Asia | | | | | | | | | | | | | | | | | | | | | | | | | |
| Indonesia | Gross | — | | 3.0 | | 2.0 | | 5.0 | | 5.0 | | — | | 1.0 | | 6.0 | | 5.0 | | 3.0 | | 3.0 | | 11.0 | |
| | Net | — | | 0.9 | | 1.0 | | 1.9 | | 2.5 | | — | | 0.4 | | 2.9 | | 2.5 | | 0.9 | | 1.4 | | 4.8 | |
| Malaysia/ | Gross | 1.0 | | 1.0 | | 2.0 | | 4.0 | | 2.0 | | — | | — | | 2.0 | | 3.0 | | 1.0 | | 2.0 | | 6.0 | |
| Vietnam | Net | 0.4 | | 0.4 | | 0.8 | | 1.6 | | 0.8 | | — | | — | | 0.8 | | 1.2 | | 0.4 | | 0.8 | | 2.4 | |
| Algeria | Gross | — | | — | | — | | — | | 8.0 | | — | | — | | 8.0 | | 8.0 | | — | | — | | 8.0 | |
| | Net | — | | — | | — | | — | | 0.8 | | — | | — | | 0.8 | | 0.8 | | — | | — | | 0.8 | |
| Sudan | Gross | 16.0 | | — | | 7.0 | | 23.0 | | 6.0 | | — | | 1.0 | | 7.0 | | 22.0 | | — | | 8.0 | | 30.0 | |
| | Net | 4.0 | | — | | 1.8 | | 5.8 | | 1.5 | | — | | 0.3 | | 1.8 | | 5.5 | | — | | 2.1 | | 7.6 | |
| Trinidad | Gross | 2.0 | | 1.0 | | 2.0 | | 5.0 | | — | | — | | — | | — | | 2.0 | | 1.0 | | 2.0 | | 5.0 | |
| | Net | 0.5 | | 0.3 | | 0.9 | | 1.7 | | — | | — | | — | | — | | 0.5 | | 0.3 | | 0.9 | | 1.7 | |
| Total | Gross | 37.0 | | 101.0 | | 56.0 | | 194.0 | | 164.0 | | 129.0 | | 20.0 | | 313.0 | | 201.0 | | 230.0 | | 76.0 | | 507.0 | |
| | Net | 20.6 | | 69.0 | | 35.9 | | 125.5 | | 99.9 | | 71.0 | | 13.8 | | 184.7 | | 120.5 | | 140.0 | | 49.7 | | 310.2 | |
| | | | | | | | | | | | | | | | | | | | | | | | | | |
| Notes: | | | | | | | | | | | | | | | | | | | | | | | | | |
| 1 | The number of wells refers to gross wellbores, which is the total number of wells Talisman has drilled or participated in drilling, with a working interest. Service wells, including water injection, gas injection, water source and water disposal wells are not included. Multilaterals from the same wellbore are counted as a single wellbore. Stratigraphic test wells are included. |
| 2 | “Net” wellbores are the aggregate of the percentage working interest of the Company in each of the gross wellbores. Data is rounded to the nearest decimal place and summed. |
| 3 | A productive oil or gas well is an exploratory or development well that is not a dry well. |
| 4 | A dry well (hole) is an exploratory or a development well found to be incapable of producing either oil or gas in sufficient quantities to justify completion as an oil or gas well. |
| 5 | “United States” excludes Alaska. |
| 6 | “North Sea” for 2004 and 2003, includes the United Kingdom, Norway and the Netherlands Continental Shelf and for 2002, includes the United Kingdom and the Netherlands Continental Shelf. |
| 7 | “Other” for the year ended December 31, 2004 includes Alaska, Colombia and Peru. |
| 8 | “Other” for the year ended December 31, 2003 includes Scotian Slope. |
| 9 | As discussed under the heading “Note Regarding Reserves Data and Other Oil and Gas Information”, in 2003 Talisman began stating oil and gas information in accordance with U.S. disclosure requirements. These requirements have been applied to prior year drilling statistics, resulting in some changes to figures previously reported for the year ended December 31, 2002. |
A N N U A L I N F O R M A T I O N F O R M 23
The following table shows the number of wells in the process of drilling or in active completion stages as of December 31, 2004.
| | | | |
| Wells in the process of drilling, suspended or active completion1 | |
| - | Exploration | | Development | |
North America | | | | |
| Gross | 110.0 | | 244.0 | |
| Net | 55.6 | | 106.4 | |
| North Sea | | | | |
| Gross | 1.0 | | 4.0 | |
| Net | 0.4 | | 1.0 | |
| Southeast Asia | | | | |
| Gross | 2.0 | | — | |
| Net | 0.7 | | — | |
| Algeria | | | | |
| Gross | — | | 1.0 | |
| Net | — | | 0.0 | |
| Trinidad | | | | |
| Gross | 1.0 | | — | |
| Net | 0.3 | | — | |
| Other2 | | | | |
| Gross | 1.0 | | — | |
| Net | 0.3 | | — | |
| Total | | | | |
| Gross | 115.0 | | 249.0 | |
| Net | 57.3 | | 107.5 | |
| 1 | The number of wells refers to gross wellbores, which is the total number of wells Talisman has drilled or participated in drilling, with a working interest. Service wells, including water injection, gas injection, water source and water disposal wells, are not included. Multilaterals from the same wellbore are counted as a single wellbore. Stratigraphic test wells are included. |
| 2 | “Other” includes Colombia. |
24 A N N U A L I N F O R M A T I O N F O R M
RESERVES ESTIMATES
Talisman’s oil and gas reserves are evaluated internally. The exemption under NI 51-101 described under “Note Regarding Reserves Data and Other Oil and Gas Information”, in addition to permitting Talisman to provide disclosure in accordance with U.S. standards, exempts Talisman from the requirement under NI 51-101 to have its reserves evaluated or audited by independent reserves evaluators. NI 51-101 and its companion policy specifically contemplate the granting of such an exemption to issuers such as Talisman who produce over 100,000 boe/d and are able to demonstrate the internal capability to generate reliable reserves data. The following discussion is provided pursuant to the requirements of the exemption.
Talisman understands that the purpose of the requirement under NI 51-101 for the involvement of independent qualified evaluators or auditors is to ensure that disclosure of reserves information reflects the conclusions of qualified professionals applying consistent standards and that such conclusions are not affected by adverse influences. Talisman believes that using independent evaluators or auditors would not materially enhance the reliability of its reserves estimates, in light of the expertise of its internal reserves evaluation personnel and the controls applied during its reserves evaluation process. Talisman believes that its internal resources are at least as extensive as, if not greater than, those which would be assigned by any independent evaluators or auditors engaged by the Company, and that its internal staff’s knowledge of and experience with the Company’s reserves enable the Company to prepare an evaluation at least equivalent to that of any independe nt evaluator or auditor.
As at December 2004, the Company’s internal reserves evaluation staff included 104 persons with full-time or part-time responsibility for reserves evaluation with an average of approximately 17 full-time or part-time years of relevant experience in evaluating reserves, of whom 47 were “qualified reserves evaluators” for purposes of NI 51-101. The Company’s internal reserves evaluation management personnel included approximately 26 persons with full-time or part-time responsibility for reserves evaluation management with an average of approximately 23 full-time or part-time years of relevant experience in evaluating and managing the evaluation of reserves, 14 of whom were qualified reserves evaluators for purposes of NI 51-101. The Company has appointed an Internal Qualified Reserves Evaluator (“IQRE”) who reports directly to the Chief Executive Officer and who is responsible for the preparation and validation of the Company’s reserves evaluati on and the submission to the Company’s Board of Directors of a report thereon as required by the NI 51-101 exemption. The Company’s IQRE is Michael Adams, a graduate of Imperial College, London University with a B.Sc. in Physical Chemistry and an M.Sc. in Petroleum Engineering. Mr. Adams has over 30 years of petroleum engineering experience internationally and in North America. He is a professional engineer registered in Alberta and a chartered engineer registered in the UK.
Talisman has adopted a corporate policy which prescribes procedures and standards to be followed in preparing its reserves data. The following summarizes Talisman’s current process for preparing and approving its publicly disclosed reserves data.
- All of Talisman’s proved reserves are evaluated annually. Talisman employs qualified, competent, experienced engineers to ensure consistently high levels of professionalism in the estimation of its reserves data. Technical, cost and economic assumptions underpinning reserves estimates are documented to provide a clear audit trail.
- Talisman conducts formal reviews during the proved reserves estimation process to ensure: the reasonableness, completeness and accuracy of input data; the appropriateness of the technical sub-surface methodology; the full understanding of reserve movements; and the correct use of reserves classifications. Peer review of input data and results is also common practice. All reserve estimates are reviewed and approved by the Executive Vice-Presidents of the operating areas and then submitted to the Company’s executive operating committee, comprised of the Chief Executive Officer and all the Executive Vice-Presidents of the Company, for review and approval. In addition, the IQRE conducts a separate review to ensure the effectiveness of the disclosure controls and that the reserves estimates are free from material misstatement. The reserves data and the report of the IQRE are then reviewed by the Reserves Committee of the Board of Directors. The Reserves Committee and the IQ RE have independent access to each other. Once approved by the Reserves Committee, the reserves data is submitted to the Board of Directors for final approval.
- Notwithstanding that Talisman is exempt from the independent evaluator requirements of NI 51-101, Talisman obtains annual audits by independent external engineering consultants of its reserve estimates for some of its properties on a rotating basis. Over the past three years, the Company’s estimates for approximately 90% of its current proved reserves (on a boe basis) have been independently audited. The audits have not revealed any material discrepancies. Talisman’s Reserves Data Policy and Procedures Manual (the “Reserves Manual”) was originally reviewed by external engineering consultants in 2003. The Reserves Manual was updated and re-issued in 2004 to reflect the latest industry practices and guidelines. Talisman also adopted new reserves software for its North American reserves estimating process in 2004. Talisman conducts periodic internal audits of the procedures, records and controls relating to the preparation of reserves data.
Accordingly, Talisman considers the reliability of its internally generated reserves data to be not materially less than would be afforded by the independent
A N N U A L I N F O R M A T I O N F O R M 25
evaluator requirements of NI 51-101.
The following table sets forth Talisman’s estimates of its proved developed, proved undeveloped, total proved, probable and total proved plus probable reserves as at December 31, 2004.
| | Proved | | Proved | | Total | | Total | | Total Proved | |
| | Developed2 | | Undeveloped3 | | Proved1 | | Probable4 | | and Probable | |
| - | Gross5 | | Net6 | | Gross5 | | Net6 | | Gross5 | | Net6 | | Gross5 | | Net6 | | Gross5 | | Net6 | |
| Oil and Natural Gas Liquids | | | | | | | | | | | | | | | | | | | | |
| (millions of barrels) | | | | | | | | | | | | | | | | | | | | |
| North America | | | | | | | | | | | | | | | | | | | | |
| Canada | 171.0 | | 142.6 | | 12.0 | | 9.6 | | 183.0 | | 152.2 | | 75.6 | | 61.3 | | 258.6 | | 213.5 | |
| United States | — | | — | | — | | — | | — | | — | | — | | — | | — | | — | |
| North Sea7 | 254.0 | | 252.3 | | 43.0 | | 42.8 | | 297.0 | | 295.1 | | 201.6 | | 200.7 | | 498.6 | | 495.8 | |
| Southeast Asia | | | | | | | | | | | | | | | | | | | | |
| Indonesia8 | 14.9 | | 7.3 | | 10.2 | | 3.3 | | 25.1 | | 10.6 | | 13.8 | | 5.1 | | 38.9 | | 15.7 | |
| Malaysia/Vietnam8 | 25.0 | | 11.9 | | 39.0 | | 23.7 | | 64.0 | | 35.6 | | 45.2 | | 16.6 | | 109.2 | | 52.2 | |
| Algeria8 | 27.9 | | 16.5 | | 9.3 | | 5.4 | | 37.2 | | 21.9 | | 43.4 | | 24.8 | | 80.6 | | 46.7 | |
| Trinidad8 | 11.0 | | 10.5 | | 0.4 | | 0.4 | | 11.4 | | 10.9 | | 3.7 | | 3.3 | | 15.1 | | 14.2 | |
| Total | 503.8 | | 441.1 | | 113.9 | | 85.2 | | 617.7 | | 526.3 | | 383.3 | | 311.8 | | 1,001.0 | | 838.1 | |
| Natural Gas | | | | | | | | | | | | | | | | | | | | |
| (billions of cubic feet) | | | | | | | | | | | | | | | | | | | | |
| North America | | | | | | | | | | | | | | | | | | | | |
| Canada | 2,056.2 | | 1,657.4 | | 426.1 | | 343.6 | | 2,482.3 | | 2,001.0 | | 1,225.0 | | 961.4 | | 3,707.3 | | 2,962.4 | |
| United States | 151.1 | | 130.8 | | 2.0 | | 1.7 | | 153.1 | | 132.5 | | 98.0 | | 85.7 | | 251.1 | | 218.2 | |
| North Sea7 | 160.6 | | 150.0 | | 27.3 | | 27.3 | | 187.9 | | 177.3 | | 77.3 | | 75.8 | | 265.2 | | 253.1 | |
| Southeast Asia | | | | | | | | | | | | | | | | | | | | |
| Indonesia8 | 767.1 | | 554.4 | | 930.5 | | 632.8 | | 1,697.6 | | 1,187.2 | | 859.2 | | 574.9 | | 2,556.8 | | 1,762.1 | |
| Malaysia/Vietnam8 | 91.1 | | 69.6 | | 394.7 | | 298.0 | | 485.8 | | 367.6 | | 286.5 | | 158.9 | | 772.3 | | 526.5 | |
| Algeria8 | — | | — | | — | | — | | — | | — | | — | | — | | — | | — | |
| Trinidad8 | — | | — | | 216.5 | | 216.5 | | 216.5 | | 216.5 | | 77.6 | | 77.6 | | 294.1 | | 294.1 | |
| Total | 3,226.1 | | 2,562.2 | | 1,997.1 | | 1,519.9 | | 5,223.2 | | 4,082.1 | | 2,623.6 | | 1,934.3 | | 7,846.8 | | 6,016.4 | |
| Synthetic Oil9 | | | | | | | | | | | | | | | | | | | | |
| (millions of barrels) | | | | | | | | | | | | | | | | | | | | |
| Canada | 41.2 | | 35.1 | | — | | — | | 41.2 | | 35.2 | | 23.9 | | 20.4 | | 65.1 | | 55.6 | |
| | | | | | | | | | | | | | | | | | | | | |
| Notes: | | | | | | | | | | | | | | | | | | | | |
| 1 | “Proved” reserves have been estimated in accordance with the SEC definition set out in Rule 4-10(a) of Regulation S-X under the Securities Exchange Act of 1934 as follows: Proved oil and gas reserves are the estimated quantities of crude oil, natural gas and natural gas liquids, which geological and engineering data demonstrate with reasonable certainty to be recoverable in future years from known reservoirs under existing economic and operating conditions. Prices include consideration of changes in existing prices provided only by contractual arrangements, but not on escalations based upon future conditions. |
| 2 | “Proved Developed” reserves are those reserves that can be expected to be recovered through existing wells with existing equipment and operating methods. Additional oil and gas expected to be obtained through the application of fluid injection or other improved recovery techniques for supplementing the natural forces and mechanisms of primary recovery are included as proved developed reserves only after testing by a pilot project or after the operation of an installed program has confirmed through production response that increased recovery will be achieved. |
| 3 | “Proved Undeveloped” reserves are those reserves that are expected to be recovered from new wells on undrilled acreage, or from existing wells for which a relatively major expenditure is required for recompletion. Inclusion of reserves on undrilled acreage is limited to those drilling units offsetting productive units that are reasonably certain of production when drilled. Proved reserves for other undrilled units are included only if it can be demonstrated with certainty that there is continuity of production from the existing productive formation. Estimates for proved undeveloped reserves are not attributed to any acreage for which an application of fluid injection or other improved recovery technique is contemplated, unless such techniques have been proved effective by actual tests in the area and in the same reservoir. |
| 4 | “Probable” reserves are less certain than proved reserves and have been estimated in accordance with the definition set out by the Society of Petroleum Engineers and the World Petroleum Congress (“SPE/WPC”). That is, probable reserves are those unproved reserves which analysis of geological and engineering data suggests are more likely than not to be recoverable. Probable reserves are estimated under the same existing economic and operating conditions used for proved reserves. |
| 5 | “Gross” proved reserves refer to the sum of (i) working interest reserves before deduction of royalty burdens payable, (ii) royalty interest reserves and (iii) net profits interests. Royalty interest reserves and net profits interests volumes for Canada were approximately 3.3 mmboe as at December 31, 2004. The inclusion of royalty interest and net profit interest volumes in gross reserves does not conform to COGEH standards applicable under NI 51-101. |
| 6 | “Net” reserves are the remaining reserves of Talisman, after deduction of estimated royalty burdens and including royalty interests and net profit interests in the amount set out in Note 5 above. The inclusion of net profit interest volumes in net reserves is consistent with SEC requirements for net reserves disclosure, but does not conform to COGEH standards applicable under NI 51-101. |
| 7 | “North Sea” includes the United Kingdom, Norway and the Netherlands Continental Shelf. |
| 8 | Interests of various governments, other than working interests or income taxes, are accounted for as royalties. Royalties are reflected in “net” reserves using effective rates over the life of the contract. |
| 9 | Talisman has not independently estimated synthetic oil reserves volumes. Reserves volumes reported herein are consistent with reserves estimates published by the general partner of the limited partnership through which Talisman has an indirect 1.25% interest in the Syncrude project.
|
A report on reserves data by Talisman’s IQRE and a report of management and directors on oil and gas disclosure are provided in Schedules A and B, respectively, to this Annual Information Form. The Company does not file estimates of its total oil and gas reserves with any U.S. agency or federal authority other than the SEC.
26 A N N U A L I N F O R M A T I O N F O R M
OTHER OIL AND GAS INFORMATION
The tables in this section set forth oil and gas information prepared by Talisman in accordance with U.S. disclosure standards, including FAS 69.
| CONTINUITY OF NET PROVED RESERVES1 | | | | | | | | | | | | | | | | | | |
| | North | | North | | Southeast | | | | | | | | | | | | | |
| | America2 | | Sea | | Asia | | | Algeria | | Sudan | | Trinidad | | Total | |
| Crude Oil and Liquids (mmbbls) | | | | | | | | | | | | | | | | | | | |
| Total Proved | | | | | | | | | | | | | | | | | | | |
| Proved reserves at December 31, 2001 | 175.8 | | 260.2 | | | 39.6 | | | | 16.9 | | 116.3 | | — | | 608.8 | |
| Discoveries, additions and extensions | 10.6 | | 13.5 | | | 5.8 | | | | 1.3 | | 19.0 | | 18.9 | | 69.1 | |
| Purchase of reserves | 1.1 | | 7.5 | | | — | | | | | — | | | — | | — | | 8.6 | |
| Sale of reserves | (3.7) | | (2.8) | | | — | | | | | — | | | — | | — | | (6.5) | |
| Net revisions and transfers | (2.5) | | 13.9 | | | (4.2) | | | | | (4.3) | | | (27.7) | | — | | (24.8) | |
| 2002 Production | (17.2) | | (44.7) | | | (5.1) | | | | | — | | | (13.3) | | — | | (80.3) | |
| Proved reserves at December 31, 2002 | 164.1 | | 247.6 | | | 36.1 | | | | 13.9 | | 94.3 | | 18.9 | | 574.9 | |
| Discoveries, additions and extensions | 13.1 | | 8.3 | | | 17.0 | | | | 2.3 | | | — | | — | | 40.7 | |
| Purchase of reserves | 1.1 | | 21.1 | | | — | | | | | — | | | — | | — | | 22.2 | |
| Sale of reserves | (4.6) | | — | | | - | | | | | — | | | (91.7) | | — | | (96.3) | |
| Net revisions and transfers | 1.1 | | 19.4 | | | 4.8 | | | | 0.5 | | | — | | (0.8) | | 25.0 | |
| 2003 Production | (16.4) | | (41.4) | | | (5.4) | | | | (0.1) | | | (2.6) | | — | | (65.9) | |
| Proved reserves at December 31, 2003 | 158.4 | | 255.0 | | | 52.5 | | | | 16.6 | | | — | | 18.1 | | 500.6 | |
| Discoveries, additions and extensions | 14.0 | | 29.7 | | | 2.0 | | | | 8.1 | | | — | | — | | 53.8 | |
| Purchase of reserves | 0.2 | | 34.0 | | | 0.9 | | | | | — | | | — | | — | | 35.1 | |
| Sale of reserves | (2.1) | | (3.3) | | | — | | | | | — | | | — | | — | | (5.4) | |
| Net revisions and transfers | (2.5) | | 24.0 | | | (1.3) | | | | | 0.3 | | | — | | — | | 13.3 | |
| 2004 Production | (15.8) | | (44.3) | | | (7.9) | | | | | (3.1) | | | — | | — | | (71.1) | |
| Proved reserves at December 31, 2004 | 152.2 | | 295.1 | | | 46.2 | | | | | 21.9 | | | — | | 10.9 | | 526.3 | |
| Proved Developed | | | | | | | | | | | | | | | | | | | |
| December 31, 2001 | 168.6 | | 203.8 | | | 13.3 | | | | | — | | 89.6 | | — | | 475.3 | |
| December 31, 2002 | 157.2 | | 210.8 | | | 11.9 | | | | 2.4 | | 84.1 | | — | | 466.4 | |
| December 31, 2003 | 155.4 | | 211.8 | | | 18.6 | | | | 14.6 | | | — | | — | | 400.4 | |
| December 31, 2004 | 142.6 | | 252.3 | | | 19.2 | | | | 16.5 | | | — | | 10.5 | | 441.1 | |
| Natural Gas (bcf) | | | | | | | | | | | | | | | | | | | |
| Total Proved | | | | | | | | | | | | | | | | | | | |
| Proved reserves at December 31, 2001 | 2,052.6 | | 267.3 | | 1,112.1 | | | | | — | | | — | | — | | 3,432.0 | |
| Discoveries, additions and extensions | 283.1 | | 14.0 | | | 11.7 | | | | | — | | | — | | 220.0 | | 528.8 | |
| Purchase of reserves | 31.5 | | 0.4 | | | — | | | | | — | | | — | | — | | 31.9 | |
| Sale of reserves | (26.7) | | — | | | — | | | | | — | | | — | | — | | (26.7) | |
| Net revisions and transfers | (110.8) | | (4.3) | | | (122.6) | | | | | — | | | — | | — | | (237.7) | |
| 2002 Production | (243.6) | | (39.5) | | | (32.3) | | | | | — | | | — | | — | | (315.4) | |
| Proved reserves at December 31, 2002 | 1,986.1 | | 237.9 | | | 968.9 | | | | | — | | | — | | 220.0 | | 3,412.9 | |
| Discoveries, additions and extensions | 276.3 | | 1.0 | | | 64.0 | | | | | — | | | — | | — | | 341.3 | |
| Purchase of reserves | 92.2 | | 14.4 | | | — | | | | | — | | | — | | — | | 106.6 | |
| Sale of reserves | (11.4) | | — | | | — | | | | | — | | | — | | — | | (11.4) | |
| Net revisions and transfers | (14.9) | | 19.8 | | | (6.1) | | | | | — | | | — | | (9.0) | | (10.2) | |
| 2003 Production | (247.6) | | (37.5) | | | (40.1) | | | | | — | | | — | | — | | (325.2) | |
| Proved reserves at December 31, 2003 | 2,080.7 | | 235.6 | | | 986.7 | | | | | — | | | — | | 211.0 | | 3,514.0 | |
| Discoveries, additions and extensions | 370.6 | | 8.0 | | | 521.9 | | | | | — | | | — | | — | | 900.5 | |
| Purchase of reserves | 19.1 | | 0.1 | | | — | | | | | — | | | — | | — | | 19.2 | |
| Sale of reserves | (57.1) | | (0.5) | | | - | | | | | - | | | - | | - | | (57.6) | |
| Net revisions and transfers | (19.2) | | (26.4) | | | 93.5 | | | | | - | | | - | | 5.5 | | 53.4 | |
| 2004 Production | (260.6) | | (39.5) | | | (47.3) | | | | | - | | | - | | - | | (347.4) | |
| Proved reserves at December 31, 2004 | 2,133.5 | | 177.3 | | 1,554.8 | | | | | — | | | — | | 216.5 | | 4,082.1 | |
| Proved Developed | | | | | | | | | | | | | | | | | | | |
| December 31, 2001 | 1,804.7 | | 213.8 | | | 252.0 | | | | | — | | | — | | — | | 2,270.5 | |
| December 31, 2002 | 1,746.9 | | 210.0 | | | 471.6 | | | | | — | | | — | | — | | 2,428.5 | |
| December 31, 2003 | 1,890.4 | | 200.7 | | | 593.9 | | | | | — | | | — | | — | | 2,685.0 | |
| December 31, 2004 | 1,788.2 | | 150.0 | | | 624.0 | | | | | — | | | — | | — | | 2,562.2 | |
| Notes: | | | | | | | | | | | | | | | | | | | |
1
| For definitions of reserves, see the notes found on page 26 of this Annual Information Form.
|
2
| North American net proved reserves exclude synthetic crude oil reserves: 2002 — 36.7 mmbbls; 2003 — 35.8 mmbbls; 2004 — 35.2 mmbbls.
|
A N N U A L I N F O R M A T I O N F O R M 27
STANDARDIZED MEASURE OF DISCOUNTED FUTURE NET CASH FLOWS FROM PROVED RESERVES
Future net cash flows were calculated by applying the respective year end prices to the Company’s estimated future production of proved reserves and deducting estimates of future development and asset retirement, production and transportation costs and income taxes. Future costs have been estimated based on existing economic and operating conditions. Future income taxes have been estimated based on statutory tax rates enacted at year end. The present values of the estimated future cash flows were determined by applying a 10% discount rate prescribed by the Financial Accounting Standards Board.
In order to increase the comparability between companies, the standardized measure of discounted future net cash flows necessarily employs uniform assumptions that do not necessarily reflect management’s best estimate of future events and anticipated outcomes. Accordingly, the Company does not believe that the standardized measure of discounted future net cash flows will be representative of actual future net cash flows and should not be considered to represent the fair market value of the oil and gas properties. Actual future net cash flows will differ significantly from those estimated due to, but not limited to, the following:
- production rates will differ from those estimated both in terms of timing and amount. For example, future production may include significant additional volumes from unproved reserves;
- future prices and economic conditions will differ from those at year end. For example, changes in prices increased the discounted future net cash flows by $3.5 billion in 2004;
- future production and development costs will be determined by future events and will differ from those at year end; and
- estimated income taxes will differ in terms of amounts and timing dependent on the above factors, changes in enacted rates and the impact of future expenditures on unproved properties.
The standardized measure of discounted net cash flows was prepared using the following prices:
| 2004 | | 2003 | | 2002 |
| Crude oil and liquids ($/bbl) | | | | | |
| North America | 34.27 | | 33.32 | | 42.07 |
| North Sea | 46.65 | | 37.89 | | 46.84 |
| Southeast Asia | 44.01 | | 41.71 | | 49.22 |
| Sudan | — | | — | | 44.09 |
| Algeria | 48.71 | | 38.91 | | 48.37 |
| Trinidad | 42.67 | | 39.12 | | 45.72 |
| 42.66 | | 37.04 | | 45.13 |
| | | | | |
| Natural Gas ($/mcf) | | | | | |
| North America | 7.32 | | 6.32 | | 6.06 |
| North Sea | 6.25 | | 5.55 | | 5.59 |
| Southeast Asia | 3.54 | - | 3.74 | - | 4.94 |
| Trinidad | 1.81 | - | 1.03 | - | 1.26 |
| 5.47 | | 5.17 | | 5.43 |
28 A N N U A L I N F O R M A T I O N F O R M
Discounted Future Net Cash Flows from Proved Reserves

| Principal Sources of Changes in Discounted Cash Flows | | | | | | | |
| | | | | | | | | | |
| Years ended December 31 (millions of Canadian dollars) | - | - | 2004 | | 2003 | | 2002 | |
| Sales of oil and gas produced, net of production costs | | | (3,866) | | (3,308) | | (3,307) | |
| Net change in prices | | | 3,506 | | (3,200) | | 9,709 | |
| Net change in transportation costs | | | (954) | | - | | - | |
| Net change in production costs | | | 410 | | (357) | | (1,990) | |
| Net change in future development and site restoration costs | | | (638) | | (87) | | (637) | |
| Development costs incurred during the year | | | 623 | | 672 | | 764 | |
| Extensions, discoveries and improved recovery | | | 2,386 | | 1,229 | | 1,863 | |
| Revisions of previous reserve estimates | | | (615) | | 92 | | 37 | |
| Net purchases and sales of reserves in place | | | 150 | | (1,225) | | 17 | |
| Accretion of discount | | | 1,263 | | 1,555 | | 972 | |
| Net change in taxes | | | (598) | | 2,399 | | (3,342) | |
| Other | - | - | 257 | - | (44) | - | (97) | |
| Net change | | | 1,924 | | (2,274) | | 3,989 | |
| Balance, beginning of year | - | - | 8,236 | - | 10,510 | - | 6,521 | |
| Balance, end of year | - | - | 10,160 | - | 8,236 | - | 10,510 | |
| | | | | | | | | |
A N N U A L I N F O R M A T I O N F O R M 29
RESULTS OF OPERATIONS FROM OIL AND GAS PRODUCING ACTIVITIES
|
| CAPITALIZED COSTS RELATED TO OIL AND GAS ACTIVITIES | | | | | | | | | | | | | |
30 A N N U A L I N F O R M A T I O N F O R M
| COSTS INCURRED IN OIL AND GAS ACTIVITIES | | | | | | | | | | | | | | | | |
| | | North | | North | | Southeast | | | | | | | | | | | |
Years ended December 31 (millions of Canadian dollars) | | America | | Sea | | Asia | | Sudan | | Algeria | | Trinidad | | Other | | Total | |
| 2004 | Property acquisition costs | Proved | 77 | | 233 | | - | | - | | - | | - | | - | | 310 | |
| | | Unproved | 165 | | 71 | | - | | - | | - | | - | | 39 | | 275 | |
| | Exploration costs | | 459 | | 150 | | 54 | | - | | - | | 34 | | 86 | | 783 | |
| | Development costs | | 785 | | 357 | | 201 | | - | | 8 | | 158 | | - | | 1,509 | |
| | Asset retirement cost | | 36 | | 51 | | 3 | | - | | - | | 7 | | - | | 97 | |
| | Total costs incurred | | 1,522 | | 862 | | 258 | | - | | 8 | | 199 | | 125 | | 2,974 | |
| 2003 | Property acquisition costs | Proved | 369 | | 189 | | - | | - | | - | | - | | - | | 558 | |
| | | Unproved | 184 | | 2 | | - | | - | | - | | - | | 3 | | 189 | |
| | Exploration costs | | 336 | | 99 | | 70 | | 7 | | 4 | | 58 | | 90 | | 664 | |
| | Development costs | | 600 | | 397 | | 246 | | (5)30 | | 72 | | - | | 1,340 | | | |
| | Asset retirement costs | | 125 | | 285 | | 5 | | - | | - | | - | | - | | 415 | |
| | Total costs incurred | | 1,614 | | 972 | | 321 | | 2 | | 34 | | 130 | | 93 | | 3,166 | |
| 2002 | Property acquisition costs | Proved | 174 | | 88 | | - | | - | | - | | - | | - | | 262 | |
| | | Unproved | 50 | | 13 | | - | | - | | - | | 9 | | - | | 72 | |
| | Exploration costs | | 271 | | 134 | | 36 | | 27 | | 3 | | 54 | | 43 | | 568 | |
| | Development costs | | 457 | | 297 | | 233 | | 71 | | 103 | | 14 | | - | | 1,175 | |
| | Total costs incurred | | 952 | | 532 | | 269 | | 98 | | 106 | | 77 | | 43 | | 2,077 | |
A N N U A L I N F O R M A T I O N F O R M 31
| PRODUCT NETBACKS (NET) | | | | | |
| | | | | | | | | | |
| The following table provides information on product netbacks net of royalties, expressed in U.S. Dollars. | | | | | |
| | | | | | | | | | |
Product Netbacks (net of royalties)1 | | | | | |
| (Net of Royalties) - US$ | 2004 | | 2003 | | 2002 |
| North America | | Oil and Liquids ($/bbl) | | | | | |
| | | | | Sales Price | 32.44 | | 25.64 | | 20.96 |
| | | | | Hedging (gain) | 5.81 | | 2.21 | | 0.04 |
| | | | | Transportation | 0.48 | | 0.44 | | 0.31 |
| | | | | Operating costs | 6.55 | | 5.67 | | 4.48 |
| | | | | | 19.60 | | 17.32 | | 16.13 |
| | | | Natural Gas ($/mcf) | | | | | |
| | | | | Sales Price | 5.26 | | 4.74 | | 2.70 |
| | | | | Hedging (gain) | 0.10 | | 0.10 | | (0.22) |
| | | | | Transportation | 0.19 | | 0.19 | | 0.18 |
| | | | | Operating costs | 0.76 | | 0.68 | | 0.56 |
| | | | | | 4.21 | | 3.77 | | 2.18 |
| North Sea | | Oil and Liquids ($/bbl) | | | | | |
| | | | | Sales Price | 37.23 | | 28.35 | | 24.68 |
| | | | | Hedging (gain) | 5.77 | | 1.43 | | 0.08 |
| | | | | Transportation | 0.89 | | 0.83 | | 0.82 |
| | | | | Operating costs | 10.28 | | 8.19 | | 6.56 |
| | | | | | 20.29 | | 17.90 | | 17.22 |
| | | | Natural Gas ($/mcf) | | | | | |
| | | | | Sales Price | 4.29 | | 3.41 | | 2.68 |
| | | | | Hedging (gain) | - | | - | | - |
| | | | | Transportation | 0.29 | | 0.28 | | 0.33 |
| | | | | Operating costs | 0.47 | | 0.28 | | 0.31 |
| | | | | | 3.53 | | 2.85 | | 2.04 |
| Southeast Asia | | Oil and Liquids ($/bbl) | | | | | |
| | | | | Sales Price | 39.49 | | 29.66 | | 25.80 |
| | | | | Hedging (gain) | - | | 2.78 | | 0.06 |
| | | | | Transportation | 0.30 | | 0.48 | | 0.84 |
| | | | | Operating costs | 7.32 | | 8.48 | | 7.92 |
| | | | | | 31.87 | | 17.92 | | 16.98 |
| | | | Natural Gas ($/mcf) | | | | | |
| | | | | Sales Price | 3.65 | | 4.12 | | 3.63 |
| | | | | Hedging (gain) | - | | - | | - |
| | | | | Transportation | 0.42 | | 0.59 | | 0.62 |
| | | | | Operating costs | 0.27 | | 0.38 | | 0.40 |
| | | | | | 2.96 | | 3.15 | | 2.61 |
| Algeria | | Oil and Liquids ($/bbl) | | | | | |
| | | | | Sales Price | 39.48 | | 27.84 | | - |
| | | | | Hedging (gain) | - | | 3.13 | | - |
| | | | | Transportation | 2.20 | | 2.55 | | - |
| | | | | Operating costs | 4.41 | | 7.06 | | - |
| | | | | | 32.87 | | 15.10 | | - |
| Sudan | | Oil and Liquids ($/bbl) | | | | | |
| | | | | Sales Price | - | | 31.33 | | 24.06 |
| | | | | Hedging (gain) | - | | - | | 0.08 |
| | | | | Operating costs | - | | 4.96 | | 4.02 |
| | | | | | - | | 26.37 | | 19.96 |
| Total Company | | Oil and Liquids ($/bbl) | | | | | |
| | | | | Sales Price | 36.57 | | 27.90 | | 23.85 |
| | | | | Hedging (gain) | 4.90 | | 1.71 | | 0.07 |
| | | | | Transportation | 0.79 | | 0.70 | | 0.58 |
| | | | | Operating costs | 8.87 | | 7.46 | | 5.78 |
| | | | | | 22.01 | | 18.03 | | 17.42 |
| | | | Natural Gas ($/mcf) | | | | | |
| | | | | Sales Price | 4.84 | | 4.50 | | 2.80 |
| | | | | Hedging (gain) | 0.07 | | 0.07 | | (0.17) |
| | | | | Transportation | 0.25 | | 0.25 | | 0.25 |
| | | | | Operating costs | 0.63 | | 0.59 | | 0.51 |
| | | | | | 3.89 | | 3.59 | | 2.21 |
| | | | | | | | | | |
| Note: | | | | | | | | |
| 1 | Netbacks do not include synthetic oil or pipeline operations. | | | | | |
32 A N N U A L I N F O R M A T I O N F O R M
SUPPLEMENTAL OIL AND GAS INFORMATION
| The following information is provided in addition to the information required under U.S. disclosure standards. |
| | | | | | | | | | | | | | | | | | | | |
| CONTINUITY OF GROSS PROVED RESERVES1 | | | | | | | | | | | | | |
| | North | | North | | Southeast | | | | | | | | | | | | | |
| - | America2 | - | Sea | - | Asia | - | Algeria | | | Sudan | | Trinidad | | Total | |
| Crude Oil and Liquids(mmbbls) | | | | | | | | | | | | | | | | | | | |
| Total Proved | | | | | | | | | | | | | | | | | | | |
| Proved reserves at December 31, 2001 | 212.3 | | 274.5 | | | 59.3 | | | 35.2 | | | 156.3 | | | — | | 737.6 | |
| Discoveries, additions and extensions | 13.0 | | 13.5 | | | 9.6 | | | 2.6 | | | 32.3 | | | 19.2 | | 90.2 | |
| Purchase of reserves | 1.4 | | 7.5 | | | — | | | — | | | | — | | | — | | 8.9 | |
| Sale of reserves | (4.6) | | (2.8) | | | — | | | — | | | | — | | | — | | (7.4) | |
| Net revisions and transfers | (1.2) | | 3.5 | | | — | | | (10.4) | | | (5.8) | | | — | | (13.9) | |
| 2002 Production | (21.8) | - | (46.5) | - | - | (8.3) | - | - | — | - | - | (21.9) | - | - | — | - | (98.5) | |
| Proved reserves at December 31, 2002 | 199.1 | | 249.7 | | | 60.6 | | | 27.4 | | | 160.9 | | | 19.2 | | 716.9 | |
| Discoveries, additions and extensions | 16.0 | | 8.2 | | | 25.2 | | | 3.9 | | | | — | | | — | | 53.3 | |
| Purchase of reserves | 1.3 | | 21.1 | | | — | | | — | | | | — | | | — | | 22.4 | |
| Sale of reserves | (5.3) | | — | | | — | | | — | | | (156.1) | | | — | | (161.4) | |
| Net revisions and transfers | (0.1) | | 18.7 | | | 7.6 | | | 0.1 | | | | — | | | — | | 26.3 | |
| 2003 Production | (20.8) | - | (41.3) | - | - | (9.0) | - | - | (2.4) | - | - | (4.8) | - | - | — | - | (78.3) | |
| Proved reserves at December 31, 2003 | 190.2 | | 256.4 | | | 84.4 | | | 29.0 | | | | — | | | 19.2 | | 579.2 | |
| Discoveries, additions and extensions | 17.3 | | 29.8 | | | 13.0 | | | 13.9 | | | | — | | | — | | 74.0 | |
| Purchase of reserves | 0.2 | | 34.1 | | | 1.3 | | | — | | | | — | | | — | | 35.6 | |
| Sale of reserves | (2.6) | | (3.3) | | | — | | | — | | | | — | | | — | | (5.9) | |
| Net revisions and transfers | (2.2) | | 24.6 | | | 3.4 | | | (0.7) | | | | — | | | (7.8) | | 17.3 | |
| 2004 Production | (19.9) | - | (44.6) | - | - | (13.0) | - | - | (5.0) | - | - | - | — | - | - | — | - | (82.5) | |
| Proved reserves at December 31, 2004 | 183.0 | - | 297.0 | - | - | 89.1 | -- | -- | 37.2 | - | - | - | — | - | - | 11.4 | - | 617.7 | |
| Proved Developed | | | | | | | | | | | | | | | | | | | |
| December 31, 2001 | 203.0 | | 215.7 | | | 20.4 | | | — | | | 120.4 | | | — | | 559.5 | |
| December 31, 2002 | 190.0 | | 212.6 | | | 19.7 | | | 4.8 | | | 143.4 | | | — | | 570.5 | |
| December 31, 2003 | 186.4 | | 213.0 | | | 29.5 | | | 25.5 | | | | — | | | — | | 454.4 | |
| December 31, 2004 | 171.0 | - | 254.0 | - | - | 39.9 | - | - | 27.9 | - | - | - | — | - | - | 11.0 | - | 503.8 | |
| Natural Gas(bcf) | | | | | | | | | | | | | | | | | | | |
| Total Proved | | | | | | | | | | | | | | | | | | | |
| Proved reserves at December 31, 2001 | 2,596.8 | | 302.2 | | 1,597.5 | | | — | | | | — | | | — | | 4,496.5 | |
| Discoveries, additions and extensions | 374.2 | | 15.4 | | | 19.7 | | | — | | | | — | | 223.5 | | 632.8 | |
| Purchase of reserves | 37.7 | | 0.4 | | | — | | | — | | | | — | | | — | | 38.1 | |
| Sale of reserves | (34.9) | | — | | | — | | | — | | | | — | | | — | | (34.9) | |
| Net revisions and transfers | (80.3) | | (11.3) | | | (54.4) | | | — | | | | — | | | — | | (146.0) | |
| 2002 Production | (300.1) | - | (44.6) | - | (34.5) | - | - | — | - | - | - | — | - | — | - | (379.2) | |
| Proved reserves at December 31, 2002 | 2,593.4 | | 262.1 | | 1,528.3 | | | — | | | | — | | 223.5 | | 4,607.3 | |
| Discoveries, additions and extensions | 351.5 | | 1.0 | | | 107.0 | | | — | | | | — | | | — | | 459.5 | |
| Purchase of reserves | 107.1 | | 14.4 | | | — | | | — | | | | — | | | — | | 121.5 | |
| Sale of reserves | (14.3) | | — | | — | | | — | | | | — | | — | | (14.3) | |
| Net revisions and transfers | (77.0) | | 17.5 | | (20.6) | | | — | | | | — | | — | | (80.1) | |
| 2003 Production | (315.8) | - | (39.9) | - | (42.7) | - | - | — | -- | - | - | — | | — | - | (398.4) | |
| Proved reserves at December 31, 2003 | 2,644.9 | | 255.1 | | 1,572.0 | | | — | | | | — | | 223.5 | | 4,695.5 | |
| Discoveries, additions and extensions | 478.5 | | 8.0 | | | 765.3 | | | — | | | | — | | | — | | 1,251.8 | |
| Purchase of reserves | 22.8 | | 0.1 | | | — | | | — | | | | — | | | — | | 22.9 | |
| Sale of reserves | (72.7) | | (0.5) | | | — | | | — | | | | — | | | — | | (73.2) | |
| Net revisions and transfers | (113.2) | | (33.2) | | | (58.7) | | | — | | | | — | | | (7.0) | | (212.1) | |
| 2004 Production | (324.9) | - | (41.6) | - | - | (95.2) | - | - | — | - | - | - | — | | - | (461.7) | - | — | |
| Proved reserves at December 31, 2004 | 2,635.4 | - | 187.9 | - | - | 2,183.4 | - | - | — | - | - | - | — | | - | 216.5 | - | 5,223.2 | |
| Proved Developed | | | | | | | | | | | | | | | | | | | |
| December 31, 2001 | 2,281.8 | | 247.4 | | | 358.5 | | | — | | | | — | | | — | | 2,887.7 | |
| December 31, 2002 | 2,278.7 | | 232.8 | | | 723.8 | | | — | | | | — | | | — | | 3,235.3 | |
| December 31, 2003 | 2,404.0 | | 220.1 | | | 920.9 | | | — | | | | — | | | — | | 3,545.0 | |
| December 31, 2004 | 2,207.3 | - | 160.6 | - | - | 858.2 | - | - | — | - | - | - | — | | - | — | - | 3,226.1 | |
| | | | | | | | | | | | | | | | | | | | |
| Notes: | | | | | | | | | | | | | | | | | | | |
| 1 | For definitions of reserves, see the notes found on page 26 of this Annual Information Form. |
| 2 | North American gross proved reserves exclude synthetic crude oil reserves: 2002 — 43.2 mmbbls; 2003 — 42.3 mmbbls; 2004 — 41.2 mmbbls. |
A N N U A L I N F O R M A T I O N F O R M 33
PRODUCT NETBACKS (GROSS)
The following table provides information on product netbacks on a gross basis expressed in Canadian dollars on a quarterly basis for the periods indicated.
Product Netbacks (gross)1
| | | | 2004 | | 2003 | | 2002 | |
| | | | Total | | Three months ended | | Total | | Three months ended | | Total | |
| C$ Gross | - | Year | | Dec 31 | | Sep 30 | | Jun 30 | | Mar 31 | | Year | | Dec 31 | | Sep 30 | | Jun 30 | | Mar 31 | | Year | |
| North | | Oil and liquids ($/bbl) | | | | | | | | | | | | | | | | | | | | | | |
| America | Sales price | 42.11 | | 44.05 | | 45.47 | | 41.39 | | 37.56 | | 35.78 | | 32.39 | | 33.94 | | 33.43 | | 43.17 | | 32.81 | |
| | | Hedging (gain) | 5.95 | | 8.64 | | 7.28 | | 4.81 | | 3.07 | | 2.45 | | 2.07 | | 2.05 | | 1.26 | | 4.38 | | 0.06 | |
| | | Royalties | 8.59 | | 8.76 | | 9.51 | | 8.52 | | 7.57 | | 7.37 | | 6.86 | | 6.81 | | 6.50 | | 9.27 | | 6.85 | |
| | | Transportation | 0.49 | | 0.46 | | 0.53 | | 0.48 | | 0.51 | | 0.48 | | 0.51 | | 0.51 | | 0.51 | | 0.43 | | 0.38 | |
| | | Operating costs | 6.75 | | 7.79 | | 6.64 | | 6.67 | | 5.90 | | 6.28 | | 6.76 | | 6.21 | | 5.89 | | 6.27 | | 5.55 | |
| | | - | 20.33 | | 18.40 | | 21.51 | | 20.91 | | 20.51 | | 19.20 | | 16.19 | | 18.36 | | 19.27 | | 22.82 | | 19.97 | |
| | Natural gas ($/mcf) | | | | | | | | | | - | | | | | | | | | - | | - | |
| | | Sales price | 6.83 | | 6.99 | | 6.63 | | 7.08 | | 6.61 | | 6.58 | | 5.31 | | 6.14 | | 6.63 | | 8.25 | | 4.20 | |
| | Hedging (gain) | 0.10 | | 0.04 | | 0.14 | | 0.16 | | 0.06 | - | 0.11 | | (0.04) | | 0.03 | | 0.12 | | 0.32 | | (0.28) | |
| | | Royalties | 1.31 | | 1.20 | | 1.29 | | 1.44 | | 1.32 | | 1.37 | | 1.08 | | 1.18 | | 1.54 | | 1.69 | | 0.75 | |
| | | Transportation | 0.20 | | 0.21 | | 0.20 | | 0.20 | | 0.19 | | 0.21 | | 0.20 | | 0.22 | | 0.22 | | 0.22 | | 0.24 | |
| - | - | Operating costs | 0.79 | | 0.80 | | 0.81 | | 0.80 | | 0.77 | | 0.75 | | 0.78 | | 0.77 | | 0.70 | | 0.76 | | 0.71 | |
| - | - | - | 4.43 | | 4.74 | | 4.19 | | 4.48 | | 4.27 | | 4.14 | | 3.29 | | 3.94 | | 4.05 | | 5.26 | | 2.78 | |
| North Sea | Oil and liquids ($/bbl) | | | | | | | | | | | | | | | | | | | | | | |
| | | Sales price | 48.29 | | 50.26 | | 54.57 | | 47.27 | | 41.55 | | 39.72 | | 38.81 | | 38.66 | | 35.29 | | 46.14 | | 38.76 | |
| | | Hedging (gain) | 7.36 | | 10.02 | | 10.31 | | 5.74 | | 3.55 | | 2.01 | | 2.07 | | 1.98 | | 0.14 | | 3.74 | | 0.12 | |
| | Royalties | 0.43 | | 0.52 | | 0.49 | | 0.60 | | 0.13 | - | (0.08) | | 0.60 | | (0.27) | | (0.89) | | 0.09 | | 1.60 | |
| | | Transportation | 1.14 | | 1.09 | | 1.28 | | 1.11 | | 1.11 | | 1.16 | | 0.99 | | 1.07 | | 1.31 | | 1.31 | | 1.24 | |
| | | Operating costs | 13.27 | | 11.84 | | 15.59 | | 13.07 | | 12.86 | | 11.51 | | 10.83 | | 11.05 | | 11.60 | | 12.73 | | 9.87 | |
| | | - | 26.09 | | 26.79 | | 26.90 | | 26.75 | | 23.90 | | 25.12 | | 24.32 | | 24.83 | | 23.13 | | 28.27 | | 25.93 | |
| | | Natural gas ($/mcf) | | | | | | | | | | | | | | | | | | | | | | |
| | | Sales price | 5.55 | | 6.08 | | 4.88 | | 5.17 | | 5.85 | | 4.77 | | 5.10 | | 4.26 | | 4.30 | | 5.15 | | 4.16 | |
| | | Hedging (gain) | — | | — | | — | | — | | — | | — | | — | | — | | — | | — | | — | |
| | | Royalties | 0.42 | | 0.37 | | 0.46 | | 0.13 | | 0.66 | | 0.28 | | 0.63 | | 0.09 | | 0.04 | | 0.25 | | 0.48 | |
| | | Transportation | 0.35 | | 0.38 | | 0.32 | | 0.31 | | 0.37 | | 0.37 | | 0.39 | | 0.39 | | 0.34 | | 0.35 | | 0.45 | |
| - | - | Operating costs | 0.55 | | 0.72 | | 0.69 | | 0.58 | | 0.28 | | 0.37 | | 0.33 | | 0.50 | | 0.18 | | 0.45 | | 0.43 | |
| - | - | - | 4.23 | | 4.61 | | 3.41 | | 4.15 | | 4.54 | | 3.75 | | 3.75 | | 3.28 | | 3.74 | | 4.10 | | 2.80 | |
| Southeast | Oil and liquids ($/bbl) | | | | | | | | | | | | | | | | | | | | | | |
| Asia | | Sales price | 51.29 | | 53.81 | | 56.95 | | 50.19 | | 44.10 | | 41.35 | | 41.56 | | 38.58 | | 38.15 | | 47.47 | | 40.12 | |
| | | Hedging (gain) | — | | — | | — | | — | | — | | 2.37 | | 2.10 | | 2.07 | | 1.26 | | 4.30 | | 0.06 | |
| | | Royalties | 21.24 | | 21.94 | | 23.37 | | 21.77 | | 17.82 | | 16.09 | | 15.69 | | 14.43 | | 15.86 | | 18.71 | | 14.83 | |
| | | Transportations | 0.23 | | 0.18 | | 0.20 | | 0.28 | | 0.25 | | 0.41 | | 0.27 | | 0.47 | | 0.44 | | 0.50 | | 0.82 | |
| | | Operating costs | 5.57 | | 5.60 | | 6.60 | | 5.30 | | 4.78 | | 7.22 | | 6.76 | | 6.98 | | 7.12 | | 8.26 | | 7.77 | |
| | - | - | 24.25 | | 26.09 | | 26.78 | | 22.84 | | 21.25 | | 15.26 | | 16.74 | | 14.63 | | 13.47 | | 15.70 | | 16.64 | |
| | | Natural gas ($/mcf) | | | | | | | | | | | | | | | | | | | | | | |
| | | Sales price | 4.74 | | 4.55 | | 5.03 | | 4.85 | | 4.50 | | 5.72 | | 5.31 | | 5.21 | | 5.86 | | 6.96 | | 5.65 | |
| | | Hedging (gain) | — | | — | | — | | — | | — | | — | | — | | — | | — | | — | | — | |
| | | Royalties | 1.19 | | 1.20 | | 1.39 | | 1.33 | | 0.81 | | 0.29 | | 0.33 | | 0.24 | | 0.27 | | 0.34 | | 0.25 | |
| | | Transportation | 0.41 | | 0.38 | | 0.40 | | 0.43 | | 0.42 | | 0.77 | | 0.68 | | 0.80 | | 0.81 | | 0.87 | | 0.93 | |
| - | - | Operating costs | 0.27 | | 0.25 | | 0.25 | | 0.28 | | 0.29 | | 0.50 | | 0.41 | | 0.53 | | 0.49 | | 0.64 | | 0.59 | |
| - | - | - | 2.87 | | 2.72 | | 2.99 | | 2.81 | | 2.98 | | 4.16 | | 3.89 | | 3.64 | | 4.29 | | 5.11 | | 3.88 | |
| Algeria | Oil ($/bbl) | | | | | | | | | | | | | | | | | | | | | | |
| | | Sales price | 51.17 | | 46.50 | | 63.98 | | 49.09 | | 44.62 | | 39.01 | | 39.70 | | 39.37 | | 35.05 | | 40.33 | | — | |
| | | Hedging (gain) | — | | — | | — | | — | | — | | 2.23 | | 2.11 | | 2.07 | | 1.26 | | 4.40 | | — | |
| | | Royalties | 19.65 | | 18.48 | | 20.15 | | 17.34 | | 22.59 | | 19.18 | | 18.52 | | 20.38 | | 18.04 | | 20.16 | | — | |
| | | Transportation | 1.76 | | 1.64 | | 1.79 | | 1.84 | | 1.80 | | 1.77 | | 1.64 | | 1.87 | | 1.88 | | 1.88 | | — | |
| | | Operating costs | 3.51 | | 3.77 | | 3.86 | | 4.75 | | 1.71 | | 5.07 | | 2.66 | | 10.37 | | 2.19 | | 4.35 | | — | |
| | | | 26.25 | | 22.61 | | 38.18 | | 25.16 | | 18.52 | | 10.76 | | 14.77 | | 4.68 | | 11.68 | | 9.54 | | — | |
34 A N N U A L I N F O R M A T I O N F O R M
| | | 2004 | | 2003 | | 2002 | |
| | | Total | | Three months ended | | Total | | Three months ended | | Total | |
| C$ Gross | - | Year | | Dec 31 | | Sep 30 | | Jun 30 | | Mar 31 | | Year | | Dec 31 | | Sep 30 | Jun 30 | | Mar 31 | | Year | |
| Sudan | Oil ($/bbl) | | | | | | | | | | | | | | | | | | | | | | |
| | Sales price | — | | — | | — | | — | | — | | 43.89 | | — | | — | | — | | 43.89 | | 37.79 | |
| | Hedging (gain) | — | | — | | — | | — | | — | | — | | — | | — | | — | | — | | 0.07 | |
| | Royalties | — | | — | | — | | — | | — | | 20.34 | | — | | — | | — | | 20.34 | | 14.94 | |
| - | Operating costs | — | | — | | — | | — | | — | | 3.73 | | — | | — | | — | | 3.73 | | 3.82 | |
| | - | — | | — | | — | | — | | — | | 19.82 | | — | | — | | — | | 19.82 | | 18.96 | |
| Total | Oil and liquids ($/bbl) | | | | | | | | | | | | | | | | | | | | | | |
| Company | Sales price | 47.45 | | 49.10 | | 53.30 | | 46.42 | | 41.15 | | 39.09 | | 37.68 | | 37.33 | 35.07 | | 44.98 | | 37.34 | |
| | Hedging (gain) | 5.42 | | 7.53 | | 7.15 | | 4.31 | | 2.67 | | 2.05 | | 2.08 | | 2.01 | 0.65 | | 3.14 | | 0.09 | |
| | Royalties | 6.84 | | 6.85 | | 7.86 | | 6.71 | | 6.00 | | 5.59 | | 5.13 | | 4.20 | 3.83 | | 8.53 | | 6.83 | |
| | Transportation | 0.88 | | 0.84 | | 0.95 | | 0.87 | | 0.87 | | 0.83 | | 0.81 | | 0.88 | 0.97 | | 0.75 | | 0.74 | |
| - | Operating costs | 9.89 | | 9.42 | | 11.08 | | 9.88 | | 9.26 | | 8.96 | | 8.85 | | 9.19 | 9.10 | | 8.74 | | 7.39 | |
| | - | 24.42 | | 24.46 | | 26.26 | | 24.65 | | 22.35 | | 21.66 | | 20.81 | | 21.05 | 20.52 | | 23.82 | | 22.29 | |
| | Natural gas ($/mcf) | | | | | | | | | | | | | | | | | | | | | | |
| | Sales price | 6.28 | | 6.38 | | 6.15 | | 6.47 | | 6.13 | | 6.30 | | 5.29 | | 5.87 | 6.36 | | 7.76 | | 4.33 | |
| Hedging (gain) | 0.07 | | 0.03 | | 0.10 | | 0.12 | | 0.04 | | 0.08 | | (0.03) | | 0.02 | 0.10 | | 0.25 | | (0.22) | |
| | Royalties | 1.21 | | 1.12 | | 1.25 | | 1.31 | | 1.15 | | 1.14 | | 0.93 | | 0.98 | 1.28 | | 1.40 | | 0.67 | |
| | Transportation | 0.26 | | 0.26 | | 0.25 | | 0.26 | | 0.25 | | 0.28 | | 0.29 | | 0.30 | 0.28 | | 0.29 | | 0.32 | |
| | Operating costs | 0.66 | | 0.67 | | 0.68 | | 0.68 | | 0.63 | | 0.69 | | 0.68 | | 0.72 | 0.64 | | 0.71 | | 0.67 | |
| - | - | 4.08 | | 4.30 | | 3.87 | | 4.10 | | 4.06 | | 4.11 | | 3.42 | | 3.85 | 4.06 | | 5.11 | | 2.89 | |
| | | | | | | | | | | | | | | | | | | | | | | | |
| Note: | | | | | | | | | | | | | | | | | | | | | | | |
| 1 Netbacks do not include synthetic oil or pipeline operations. | | | | | |
| | | | | | | | | | | | | | | | | | | | | | | | |
| | | | | | | | | | | | | | | | | | | | | | |
ADDITIONAL INFORMATION
Future commitments to buy, sell, exchange, process and transport oil or gas of the Company are described under note 12 entitled “Contingencies and Commitments” in the audited consolidated financial statements of the Company for the year ended December 31, 2004, which information is incorporated herein by reference.
COMPETITIVE CONDITIONS
The oil and gas industry, both within Canada and internationally, is highly competitive in all aspects of the business, including the acquisition of properties, the exploration for and development of new sources of supply and the marketing of current production. With respect to the exploration, development and marketing of oil and natural gas, the Company’s competitors include major integrated oil and gas companies, numerous other independent oil and gas companies, individual producers and operators and national oil companies. A number of the Company’s competitors have financial and other resources substantially in excess of those available to the Company. In addition, oil and gas producers in general compete indirectly against others engaged in supplying alternative forms of energy, fuel and related products to consumers.
SOCIAL RESPONSIBILITY AND ENVIRONMENTAL PROTECTION
Social Policies
Talisman has formal policies and procedures that support the Company’s commitment to corporate responsibility. Talisman’s Policy on Business Conduct and Ethics (the “Ethics Policy”), a statement of the Company’s ethical principles, is the foundation of the Company’s corporate responsibility framework. Every employee of Talisman is required to read the Ethics Policy and understand how it relates to his or her business dealings as a condition of employment. In addition, each employee is required to sign at least annually a declaration confirming his or her compliance with the Ethics Policy or disclosing any deviations therefrom, which declarations are reviewed by the Chief Executive Officer and reported to the Board of Directors. In 2004, Talisman adopted a security policy (the “Security Policy”), which is in the process of being implemented. Both the Ethics Policy and the Security Policy incorporate the Voluntary Principles on Security and Human Rights.
Health, Safety and Environmental Protection
Talisman’s corporate health, safety and environment (“HSE”) policy commits to three fundamental principles: providing safe and healthy operations, continuous improvement of the Company’s environmental performance and respecting the interests of neighbours and other stakeholders. Talisman maintains an integrated HSE management framework and processes to achieve its HSE objectives in a structured way. Internal guidance documents
A N N U A L I N F O R M A T I O N F O R M 35
(standards and plans),programs, activities and service arrangements support the implementation of these management processes. Talisman’s regional operations are empowered to organize their HSE programs and systems in ways that are locally meaningful and that address their unique risks and priorities. Talisman audits, both internally and externally, its operations periodically to support continuous improvement and demonstrate compliance. The Company also conducts environmental due diligence on all asset and corporate acquisitions to identify and properly account for pre-existing environmental liabilities.
The oil and gas industry is subject to safety and environmental regulation pursuant to extensive legislation, enacted by various levels of government, both in Canada and internationally. The Company maintains a comprehensive range of internal programs and controls to promote regulatory compliance and an appropriate level of safety and environmental protection across its operations. Public expectation regarding the industry’s safety and environmental performance remains high and this continues to translate into new and generally more rigorous policies, legislation and regulations. Within jurisdictions and sectors, these regulatory instruments apply generally and do not typically influence competitive position.
The Company does not anticipate making extraordinary material expenditures for environmental compliance during 2005. However, it does expect to incur site restoration costs over a prolonged period as existing fields become fully produced. Talisman provides for future abandonment and reclamation costs in its financial statements in accordance with Canadian generally accepted accounting principles. Additional information regarding future abandonment and reclamation costs is set forth under note 12 entitled “Contingencies and Commitments” in the audited consolidated financial statements of the Company for the year ended December 31, 2004, which information is incorporated herein by reference.
More information about Talisman’s social and environmental policies and its corporate responsibility performance is available on the Company’s corporate web site atwww.talisman-energy.com. The information available on the web site includes the Ethics Policy, Security Policy, Talisman’s annual Corporate Responsibility Report and HSE management framework.
EMPLOYEES
At December 31, 2004, Talisman’s permanent staff complement1was 1,870, as set forth in the table below.
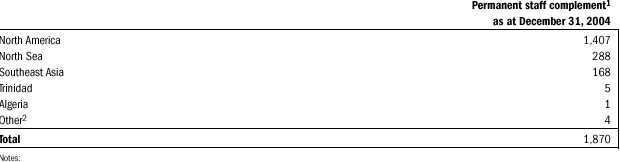
| 1 | Contractors and temporary staff are not included in complement numbers. |
| 2 | “Other” includes Qatar. |
DESCRIPTION OF CAPITAL STRUCTURE
SHARE CAPITAL
The Company’s authorized share capital consists of an unlimited number of common shares (“Common Shares”) without nominal or par value and an unlimited number of first and second preferred shares. All of the Common Shares are fully paid and non-assessable. As at the date of this Annual Information Form no preferred shares are outstanding.
Holders of Common Shares are entitled to receive notice of and to attend all annual and special meetings of shareholders. Each Common Share carries with it the right to one vote. Subject to the rights of holders of other classes of shares of the Company who are entitled to receive dividends in priority to or rateable with the Common Shares, the Board of Directors may, in its sole discretion, declare dividends on the Common Shares to the exclusion of any other class of shares of the Company. In the event of liquidation, dissolution or winding-up of the Company or any other distribution of assets of the Company among its shareholders for the purpose of winding-up its affairs, and subject to the rights of other classes of shares on a priority basis, the holders of Common Shares are entitled to participate rateably in any distribution of any assets of the Company.
36 A N N U A L I N F O R M A T I O N F O R M
The first preferred shares are issuable in one or more series, each series consisting of the number of shares and having the designation, rights, privileges, restrictions and conditions as are determined before issue by the Board of Directors of the Company. The first preferred shares rank on a parity with the first preferred shares of every other series with respect to declared or accumulated dividends and return of capital. In addition, the first preferred shares are entitled to a preference over the second preferred shares and the Common Shares with respect to the payment of dividends and the distribution of assets of the Company in the event of liquidation, dissolution or winding-up of the Company. The first preferred shares are not, except as required by law and as may be determined by the Board of Directors prior to the issuance of a series, entitled to notice of, or to vote at meetings of shareholders.
The second preferred shares are issuable in one or more series, each series consisting of the number of shares and having the designation, rights, privileges, restrictions and conditions as are determined before issue by the Board of Directors of the Company. The second preferred shares rank on a parity with the second preferred shares of every other series with respect to declared or accumulated dividends and return of capital. In addition, the second preferred shares are entitled to a preference over the Common Shares with respect to the payment of dividends and the distribution of assets of the Company in the event of liquidation, dissolution or winding-up of the Company. The first preferred shares are not, except as required by law and may be determined by the Board of Directors prior to the issuance of a series, entitled to notice of, or to vote at meetings of shareholders.
RATINGS
The Company’s senior unsecured long-term debt securities are rated “Baa1” by Moody’s Investors Service, Inc. (“Moody’s”) with a stable outlook, “BBB+” by Standard & Poor’s Corporation (“S&P”) with a stable outlook and “BBB(high)”with a stable trend by Dominion Bond Rating Service Limited (“DBRS”). Credit ratings are intended to provide investors with an independent measure of the credit quality of an issue of securities and are indicators of the likelihood of payment and of the capacity of a company to meet its financial commitment on the rated obligation in accordance with the terms of the rated obligation.
Moody’s credit ratings are on a long-term debt rating scale that ranges from Aaa to C, representing the range from least credit risk to greatest credit risk of such securities rated. Moody’s applies numerical modifiers 1, 2 and 3 in each generic rating classification from Aa through Caa in its long term debt rating system. The modifier 1 indicates that the issue ranks in the higher end of its generic rating category, the modifier 2 indicates a mid-range ranking and the modifier 3 indicates that the issue ranks in the lower end of that generic rating category. According to the Moody’s rating system, debt securities rated Baa1 are subject to moderate credit risk. They are considered medium-grade and as such, may possess certain speculative characteristics.
S&P’s credit ratings are on a long-term debt rating scale that ranges from AAA to D, representing the range from highest to lowest quality of such securities rated. The ratings from AA to CCC may be modified by the addition of a plus (+) or minus (-) sign to show relative standing within the major rating categories. According to S&P’s rating system, debt securities rated BBB exhibit adequate protection parameters. However, adverse economic conditions or changing circumstances are more likely to lead to a weakened capacity of the obligor to meet its financial commitments on the obligations. A stable rating outlook means that a rating is not likely to change.
DBRS’ credit ratings are on a long-term debt rating scale that ranges from AAA to D, representing the range from highest to lowest quality of such securities rated. Each rating category between AA and B is denoted by subcategories “high” and “low”, the absence of which indicates that the rating is in the “middle” of the category. According to DBRS’ rating system, long-term debt securities rated BBB are of adequate credit quality. Protection of interest and principal is considered acceptable, but entities so rated are fairly susceptible to adverse changes in financial and economic conditions, or there may be other adverse conditions present which reduce the strength of such entity and its rated securities.
The credit ratings assigned to Talisman’s debt securities by the rating agencies are not recommendations to buy, sell or hold the debt securities and may be revised or withdrawn entirely at any time by a rating agency. Credit ratings may not reflect the potential impact of all risks on the value of securities. In addition, real or anticipated changes in the rating assigned to a security will generally affect the market value of that security. There can be no assurance that a rating will remain in effect for a given period of time or that a rating will not be revised or withdrawn entirely by a rating agency in the future.
MARKET FOR THE SECURITIES OF THE COMPANY
The Common Shares of the Company are listed on the Toronto Stock Exchange (“TSX Exchange”) and New York Stock Exchange under the trading symbol TLM. The Company’s £250,000,000 6.625% Notes are listed on the London Stock Exchange.
A N N U A L I N F O R M A T I O N F O R M 37
TRADING PRICE AND VOLUME
The following sets out the high and low prices and the volume of trading for the Company’s Common Shares (as traded on the TSX Exchange) for the periods indicated.
| Year | Month | High | | Low | | Volume | |
| 2004 | December | 34.08 | | 30.30 | | 28,781,260 | |
| November | 33.80 | | 30.25 | | 44,735,716 | |
| October | 35.10 | | 31.65 | | 26,412,247 | |
| September | 32.99 | | 29.28 | | 26,574,196 | |
| August | 32.36 | | 28.57 | | 28,311,086 | |
| July | 31.95 | | 28.85 | | 26,428,203 | |
| June | 30.26 | | 26.13 | | 23,719,094 | |
| May1 | 28.60 | | 26.15 | | 33,866,232 | |
| April | 28.12 | | 25.56 | | 24,366,597 | |
| March | 27.27 | | 25.08 | | 29,976,492 | |
| February | 26.12 | | 23.68 | | 24,000,033 | |
| 2004 | January | 25.83 | | 23.52 | | 32,195,997 | |
Note:
1 | On May 4, 2004, Talisman effected a three for one stock split and the Company’s Common Shares began trading on a post-split basis on May 17, 2004. Trading prices and volumes from January 1, 2004 to May 14, 2004 have been adjusted to reflect this share split. |
DIVIDENDS
The Company paid semi-annual dividends over the last three-year period on its Common Shares as follows:
| Date | Rate Per Common Share1 | |
| June 28, 2002 | $ | 0.10 | |
| December 31, 2002 | $ | 0.10 | |
| June 30, 2003 | $ | 0.10 | |
| December 31, 2003 | $ | 0.13 | |
| June 30, 2004 | $ | 0.15 | |
| December 31, 2004 | $ | 0.15 | |
| | | | |
| | | |
Note:
| 1 | On May 4, 2004, Talisman effected a three for one stock split. The dividend rate per Common Share from June 28, 2002 to December 31, 2003 has been adjusted to reflect this share split. |
The Company’s dividend policy is subject to semi-annual review by the Board of Directors.
38 A N N U A L I N F O R M A T I O N F O R M
DIRECTORS AND OFFICERS
Information is given below with respect to each of the current directors and officers of the Company. The term of office of each director expires at the end of the 2005 annual meeting.
DIRECTORS
The directors of the Company are elected annually. The following table sets out the name, province or state and country of residence, year first elected to the Board and principal occupation within the past five years or more of each of the directors of the Company.
| Name, Province or State and | Year First Became | |
| Country of Residence | Director of the Company | Principal Occupation |
| | | |
| Douglas D. Baldwin2, 3, 4, 6 | 2001 | Chairman of the Board of the Company; director of various |
| Alberta, Canada | | corporations; from 1999 to 2001, President and Chief Executive |
| | | Officer of TransCanada PipeLines Limited (pipeline and power |
| | | company); from 1992 to 1998, Senior Vice-President and Director of |
| | | Imperial Oil Limited (natural resource company); from 1988 to |
| | | 1992, President and Chief Executive Officer, Esso Resources Canada |
| | | Limited (natural resource company). |
| | | |
| | | Other current directorships7: TransCanada Corporation, TransCanada |
| | | PipeLines Limited, UTS Energy Corporation, Citadel Group of Funds, |
| | | and Resolute Energy Inc. |
| | | |
| James W. Buckee2, 5 | 1992 | President and Chief Executive Officer of Talisman Energy Inc.; prior to |
| Alberta, Canada | | May 1993, President and Chief Operating Officer of the Company; |
| | | prior to August 1991, Manager, Planning of BP Exploration Company |
| | | Ltd. (natural resource company). |
| | | |
| | | Other current directorships7: None. |
| | | |
| Kevin S. Dunne3, 5, 6 | 2003 | Director of the Company; until March 2003, director of Talisman |
| Tortola, British Virgin Islands | | Energy Sweden AB (a wholly owned subsidiary of the Company); |
| | | from 1994 until 2001, held various international senior and |
| | | executive management positions with BP plc (international integrated |
| | | oil and gas company) including General Manager, Abu Dhabi |
| | | Company for Onshore Oil Operations (ADCO),a BP joint venture; |
| | | 1991 to 1994, Corporate Associate President, BP Indonesia; and |
| | | 1990 to 1991, Corporate Head of Strategy for the BP Group based |
| | | in London. |
| | | |
| | | Other current directorships7: None. |
| | | |
| Al L. Flood, C.M.1, 4 | 2000 | Director of various corporations; from June 1999 to March 2000, |
| Ontario, Canada | | Chairman of the Executive Committee of Canadian Imperial Bank of |
| | | Commerce (“CIBC”) (a Canadian chartered bank); prior to June |
| | | 1999, Chairman and Chief Executive Officer of CIBC and held various |
| | | positions in the domestic and international operations of CIBC. |
| | | |
| | | Other current directorships7: CIBC and Noranda Inc. |
| | | |
| Dale G. Parker1, 5 | 1993 | Director of various corporations and public administration and |
British Columbia, Canada | | financial institution advisor; prior to January 1998, President and Chief |
| | Executive Officer of Workers’ Compensation Board of British Columbia; |
| | prior to November 1994, President of White Spot Limited (food services |
| | company) and Executive Vice-President of Shato Holdings Ltd. (food |
| | processing and services and real estate company); prior to November |
| | 1993, Executive Vice-President and Chief Financial Officer of Shato |
| | Holdings Ltd.; prior to November 1992, Chairman and Chief Executive |
| | Officer of British Columbia Financial Institutions Commission (regulator |
| | of financial institutions). |
| | |
| | Other current directorships7: None. |
A N N U A L I N F O R M A T I O N F O R M 39
| Name, Province or State and | Year First Became | |
| Country of Residence | Director of the Company | Principal Occupation |
| | | |
| Lawrence G. Tapp3, 4 | 2001 | Chairman of ATS Automation Tooling Systems Inc. (industrial |
| British Columbia, Canada | | automation company); director of various corporations; from 1995 to |
| | | 2003, Dean of the Richard Ivey School of Business of the University |
| | | of Western Ontario; from 1992 to 1995, Executive in Residence of |
| | | the Faculty of Management and Adjunct Professor, University of Toronto; |
| | | from 1985 to 1992, Vice Chairman, President and Chief Executive |
| | | Officer of Lawson Mardon Group Limited (packaging conglomerate). |
| | | |
| | | Other current directorships7: ATS Automation Tooling Systems Inc., |
| | | Call-Net Enterprises Inc.,Wescast Industries Inc., CCL Industries Inc. and |
| | | Mainstreet Equity Corp. |
| | | |
| Stella M. Thompson2, 4, 5 | 1995 | Principal of Governance West Inc. (corporate governance consulting |
| Alberta, Canada | | company); President of Stellar Energy Ltd. (energy and management |
| | | consulting company); director of various corporations; prior to June |
| | | 1991, Vice-President, Planning, Business Information & Systems of |
| | | Petro-Canada Products (petroleum refining and marketing company). |
| | | |
| | | Other current directorships7: None. |
| | | |
| Robert G.Welty1, 3 | 2003 | Chairman, Chief Executive Officer and director of Sterling Resources Ltd. |
| Alberta, Canada | | (oil and gas exploration and development company) since 1998; |
| | | 1996 to 1997, President, Escondido Resources (International) Ltd. |
| | | (oil and gas exploration company); 1994 to 1995, President and |
| | | Chief Executive Officer of Canadian Fracmaster Ltd. (oil field service |
| | | company); 1992 to 1994, President and Chief Executive Officer of |
| | | Bow Valley Energy Inc. (oil and gas exploration and development |
| | | company); 1976 to 1988, President and Chief Executive Officer of |
| | | Asamera Inc. (oil and gas exploration and development company). |
| | | |
| | | Other current directorships7: Sterling Resources Ltd. and Pan-Ocean |
| | | Energy Corporation Limited. |
| | | |
| Charles W. Wilson1, 2, 6 | 2002 | Director of various corporations; from 1993 to 1999, President and |
| Colorado, United States | | Chief Executive Officer of Shell Canada (integrated oil and gas |
| | | company); from 1988 to 1993, Executive Vice President US |
| | | Downstream Oil and Chemical of Shell Oil US (integrated oil and gas |
| | | company); prior to 1988, Vice President US Refining and Marketing |
| | | of Shell Oil US and held various positions in the domestic and |
| | | international natural resource operations of Shell. |
| | |
| | Other current directorships7: ATCO Ltd., Akita Drilling Ltd., Big Rock |
| - | - | Brewery Ltd. and Canadian Utilities Limited. |
Notes:
1 | Member of the Audit Committee |
2 | Member of the Executive Committee |
3 | Member of the Governance and Nominating Committee |
4 | Member of the Management Succession and Compensation Committee |
5 | Member of the Pension Funds Committee |
6 | Member of the Reserves Committee |
7 | Refers only to issuers that are reporting issuers or the equivalent in a foreign jurisdiction |
40 A N N U A L I N F O R M A T I O N F O R M
OFFICERS
The following table sets out the name, province and country of residence and office held with Talisman of each of the executive officers and Assistant Corporate Secretaries of the Company.
| Name and Province or State | |
| and Country of Residence | Office |
| | |
| James W. Buckee | President and Chief Executive Officer |
| Alberta, Canada | |
| | |
| Ronald J. Eckhardt | Executive Vice-President, North American Operations |
| Alberta, Canada | |
| | |
| T. Nigel D. Hares | Executive Vice-President, Frontier and International Operations |
| Alberta, Canada | |
| | |
| Joseph E. Horler | Executive Vice-President, Marketing |
| Alberta, Canada | |
| | |
| Michael D. McDonald | Executive Vice-President, Finance and Chief Financial Officer |
| Alberta, Canada | |
| | |
| Robert M. Redgate | Executive Vice-President, Corporate Services |
| Alberta, Canada | |
| | |
| M. Jacqueline Sheppard | Executive Vice-President, Corporate and Legal, and Corporate Secretary |
| Alberta, Canada | |
| | |
| John ‘t Hart | Executive Vice-President, Exploration |
| Alberta, Canada | |
| | |
| Christine D. Lee | Assistant Corporate Secretary |
| Alberta, Canada | |
| | |
| Ardith D. Wagner | Assistant Corporate Secretary |
| Alberta, Canada | - |
In early 2003, the Company changed the titles of all its vice-presidents to better reflect the roles and responsibilities of their continuing offices. Mr. McDonald has held his current position since March 12, 2001. Prior to that date, he served as Vice-President, Business Development of the Company. Dr. ‘t Hart has held his current position since June 25, 2003. Prior to that, he served as Senior Manager, International Exploration of the Company since April 1, 2003 and prior to that, he served as Manager, International Exploration of the Company. Mr. Eckhardt has held his current position since October 1, 2003. Prior to that, he served as Vice-President, Southern District of North American Operations of the Company since January 23, 2003, and prior to that he served as Senior Manager, Western Operations and prior to that as Manager, Eastern Operations of the Company. All of the other executive officers of the Company have held their offices for at least five years.
Dale G. Parker, a director of the Company, was a director of Royal Oak Mines Inc., a publicly traded North American gold mining corporation, and a director of Agro Pacific Industries Ltd., a publicly traded agricultural corporation, when each corporation instituted proceedings under theCompanies’Creditors Arrangement Act(Canada). In 2003, Stella M. Thompson, a director of the Company, was a director of Laidlaw Inc., a public holding company, when it obtained an order in the United States Bankruptcy Court for the Western District of New York confirming its plan of reorganization and an order from the Ontario Superior Court of Justice under theCompanies’ Creditors Arrangement Act(Canada) recognizing and implementing the plan in Canada. In 2003, a small, private technology company, for which Michael McDo nald (an officer of the Company) served as a director, declared bankruptcy.
SHAREHOLDINGS OF DIRECTORS AND EXECUTIVE OFFICERS
As of March 1, 2005, the directors and executive officers of the Company, as a group, beneficially owned, directly or indirectly, or exercised control or direction over 391,395 Common Shares of the Company, representing 0.1% of the issued and outstanding Common Shares of the Company.
A N N U A L I N F O R M A T I O N F O R M 41
CONFLICTS OF INTEREST
Certain directors of the Corporation and its subsidiaries are associated with other reporting issuers or other corporations which may give rise to conflicts of interest. In accordance with theCanada Business Corporations Act, directors and officers of the Company are required to disclose to the Company the nature and extent of any interest that they have in a material contract or material transaction, whether made or proposed, with the Company, if the director or officer is: (a) a party to the contract or transaction; (b) is a director or an officer, or an individual acting in a similar capacity, of a party to the contract or transaction; or (c) has a material interest in a party to the contract or transaction.
As described in “Social Responsibility and Environmental Protection”,Talisman has adopted the Policy on Business Conduct and Ethics (previously defined as the “Ethics Policy”) which applies to all directors, officers and employees of Talisman and its subsidiaries. As required by the Ethics Policy, individuals representing Talisman must not enter into outside activities, including business interests or other employment, that might interfere with or be perceived to interfere with their performance at Talisman. In addition, Talisman officers and employees are required to abide by an internal Conflict of Interest in Employment Policy.
AUDIT COMMITTEE INFORMATION
Information concerning the Audit Committee of the Company, as required by Multilateral Instrument 52-110, is provided in Schedule C to this Annual Information Form.
LEGAL PROCEEDINGS
From time to time, Talisman is the subject of litigation arising out of the Company’s operations. Damages claimed under such litigation, including the litigation discussed below may be material or may be indeterminate and the outcome of such litigation may materially impact the Company’s financial condition or results of operations. While Talisman assesses the merits of each lawsuit and defends itself accordingly, the Company may be required to incur significant expenses or devote significant resources to defend itself against such litigation. These claims are not currently expected to have a material impact on the Company’s financial position.
Talisman continues to be subject to a lawsuit brought by the Presbyterian Church of Sudan and others commenced in November 2001 under theAlien Tort Claims Actin the United States District Court for the Southern District of New York. The lawsuit, which is seeking class action status, alleges that the Company conspired with, or aided and abetted, the Government of Sudan to commit violations of international law in connection with the Company’s now disposed of interest in oil operations in Sudan. In December 2004, Talisman filed a motion for judgement on the pleadings, seeking dismissal of the lawsuit on the grounds that the court lacks subject matter jurisdiction to hear the lawsuit, and filed its opposition papers to the certification of the lawsuit as a class action. No decision is expected on either of these motions prior to the end of March 2005. Talisman believes the lawsuit to be entirely without merit and is continuing to vigorously defe nd itself and does not expect the lawsuit to have a material adverse effect.
RISK FACTORS
Talisman is exposed to a number of risks inherent in exploring for, developing and producing crude oil and natural gas. This section describes the risks and other matters that would be most likely to influence an investor’s decision to purchase securities of Talisman.
Uncertainty of Reserves Estimates
The process of estimating oil and gas reserves is complex and involves a significant number of decisions and assumptions in evaluating available geological, geophysical, engineering and economic data; therefore, reserves estimates are inherently uncertain. Talisman prepares all of its reserves information internally. The Company may adjust estimates of proved reserves based on production history, results of exploration and development drilling, prevailing oil and gas prices and other factors, many of which are beyond the Company’s control. In addition, there are numerous uncertainties in forecasting the amounts and timing of future production, costs, expenses and the results of exploration and development projects. All estimates are, to some degree, uncertain and classifications of reserves are only attempts to define the degree of uncertainty involved. For these reasons, estimates of the economically recoverable oil and natural gas reserves attributable to any particular group of properties, the classification of such reserves based on risk of recovery and the standardized measure of discounted future net cash flows, prepared by different engineers or by the same engineers at different times, may vary substantially. Talisman’s actual production, taxes and development and operating expenditures with respect to its reserves will likely vary from such estimates, and such variances could be material.
Estimates with respect to reserves that may be developed and produced in the future are often based upon volumetric calculations and upon analogy to similar types of reservoirs, rather than upon actual production history. Estimates based on these methods generally are less reliable than those based on actual production history. Subsequent evaluation of the same reserves based upon production history will result in variations, which may be material, in the estimated reserves.
42 A N N U A L I N F O R M A T I O N F O R M
Ability to Find, Develop or Acquire Additional Reserves
The Company’s future success depends largely on its ability to find, develop or acquire additional oil and gas reserves that are economically recoverable. Exploration and development drilling may not result in commercially productive reserves. Successful acquisitions require an assessment of a number of factors, many of which are uncertain. These factors include recoverable reserves, exploration potential, future oil and gas prices, operating costs and potential environmental and other liabilities. Such assessments are inexact and their accuracy is inherently uncertain.
Political Risks
The Company’s operations may be adversely affected by changes in governmental policies and legislation or social instability or other political or economic developments which are not within the control of Talisman including, among other things, a change in crude oil or natural gas pricing policy, the risks of war, terrorism, abduction, expropriation, nationalization, renegotiation or nullification of existing concessions and contracts, taxation policies, economic sanctions, the imposition of specific drilling obligations, the development and abandonment of fields and fluctuating exchange rates and currency controls. In addition, both Indonesia and Algeria are members of the Organization of Petroleum Exporting Countries (“OPEC”). Talisman’s operations in these countries may therefore be impacted by the application of OPEC production quotas. Indonesia, Algeria, Colombia and Peru have been subject to recent economic or political instability and social unrest, m ilitary or rebel hostilities. In addition, Talisman regularly evaluates opportunities worldwide, and may in the future engage in projects or acquire properties in other nations that are experiencing economic or political instability and social unrest or military hostilities or are subject to United Nations or United States sanctions.
Operational Hazards and Responsibilities
Oil and gas drilling and producing operations are subject to many risks including the possibility of fire, explosions, mechanical failure, pipe failure, chemical spills, accidental flows of oil, natural gas or well fluids, sour gas releases, and other occurrences or accidents which could result in personal injury or loss of life, damage or destruction of properties, environmental damage, interruption of business, regulatory investigations and penalties and liability to third parties. The Company has developed a comprehensive HSE management framework to mitigate physical risks. The Company also mitigates insurable risks to protect against significant losses by maintaining a comprehensive insurance program, while maintaining levels and amounts of risk within the Company which management believes to be acceptable. Talisman believes its liability, property and business interruption insurance is appropriate to its business and consistent with common industry practice, although such insurance will not provide coverage in all circumstances.
Volatility of Oil and Natural Gas Prices
Talisman’s financial performance is highly sensitive to prevailing prices of crude oil and natural gas. Fluctuations in crude oil or natural gas prices could have a material adverse effect on the Company’s operations and financial condition, the value of its oil and natural gas reserves, and its level of spending for oil and gas exploration and development. Prices for crude oil and natural gas fluctuate in response to changes in the supply of and demand for crude oil and natural gas, market uncertainty and a variety of additional factors that are largely beyond the Company’s control. Oil prices are determined by international supply and demand. Factors which affect crude oil prices include the actions of OPEC, world economic conditions, government regulation, political stability in the Middle East and elsewhere, the availability of alternative fuel sources and weather conditions. Most natural gas prices realized by Talisman are affected primarily by North America n supply and demand, weather conditions and by prices of alternative sources of energy. The development of oil and natural gas discoveries in offshore areas is particularly dependent on the outlook for oil and natural gas prices because of the large amount of capital expenditure required for development prior to commencing production.
A substantial and extended decline in the prices of crude oil or natural gas could result in delay or cancellation of drilling, development or construction programs, or curtailment in production or result in unutilized long-term transportation commitments all of which could have a material adverse impact on the Company. The amount of cost oil required to recover Talisman’s investment and costs in various production sharing contracts is dependent on commodity prices, with higher commodity prices resulting in a lower amount of net after royalty oil and gas reserves booked by the Company.
Talisman conducts an annual assessment of the carrying value of its assets in accordance with Canadian generally accepted accounting principles (“GAAP”). If oil and natural gas prices decline, the carrying value of the Company’s assets could be subject to downward revisions, which could adversely affect Talisman’s reported income for the periods in which the revisions are made. However, Talisman believes that estimates of forward-looking prices it uses in its planning process are realistic.
A N N U A L I N F O R M A T I O N F O R M 43
Litigation
From time to time, Talisman is the subject of litigation arising out of the Company’s operations. Specific disclosure of current legal proceedings, and the risks associated with current proceedings and litigation generally, are disclosed under the heading “Legal Proceedings” in this Annual Information Form.
Environmental Risks
All phases of the oil and natural gas business are subject to environmental regulation pursuant to a variety of laws and regulations in the countries in which Talisman does business. These regulatory regimes are laws of general application that apply to the Company’s business in the same manner as they apply to other companies or enterprises in the energy industry. Environmental legislation imposes, among other things, restrictions, liabilities and obligations in connection with the generation, handling, storage, transportation, treatment and disposal of hazardous substances and waste and in connection with spills, releases and emissions of various substances to the environment. Environmental legislation also requires that pipelines, wells, facility sites and other properties associated with Talisman’s operations be operated, maintained, abandoned and reclaimed to the satisfaction of applicable regulatory authorities. Certain types of operations, including exploration and development projects, may require the submission and approval of environmental impact assessments or permit applications. In some cases, exploration and development activities may be precluded or restricted due to designation of areas as environmentally sensitive areas. Compliance with environmental legislation can require significant expenditures and failure to comply with environmental legislation may result in the imposition of fines and penalties and liability for clean up costs and damages. Additionally, the Company’s business is subject to the trend toward increased civil liability for environmental matters. Although Talisman currently believes that the costs of complying with environmental legislation and dealing with environmental civil liabilities will not have a material adverse effect on the Company’s financial condition or results of operations, there can be no assurance that such costs in the future will not have such an effect. Talisman expects to incur site restoration costs ove r a prolonged period as existing fields are depleted. The Company provides for future abandonment and reclamation costs in its annual consolidated financial statements in accordance with Canadian GAAP. Additional information regarding future abandonment and reclamation costs is set forth in the notes to the annual consolidated financial statements.
In 1994, the United Nations’ Framework Convention on Climate Change came into force and three years later led to the Kyoto Protocol (the “Protocol”). The Protocol came into force on February 16, 2005 and requires certain nations to reduce their emissions of carbon dioxide and other greenhouse gases. Under the terms of the Protocol, Canada will be required to reduce its greenhouse gas (“GHG”) emissions to 6% below 1990 levels over the period beginning in 2008 and ending in 2012. Currently, Canadian oil and gas producers are in discussions with the provincial and federal levels of government regarding implementation mechanisms for the industry. It is premature to predict what impact implementation could have on Canadian oil and gas producers but it is likely that any mandated reduction in GHG emissions will result in increased costs. The federal government has stated that these costs would not be expected to exceed $15/tonne of carbon dioxide emissions reduced and that producers would not be required to reduce GHG emissions per unit of production by more than 15%. The federal government has also indicated its support for several important principles that are intended to protect the competitiveness of the oil and gas industry beyond 2012, including a 10-year emissions target lock-in period for all new projects and additional flexibility mechanisms for achieving compliance.
The UK has also ratified the Kyoto Protocol, with a reduction commitment of 12.5% below 1990 levels by 2008 — 2012. Talisman’s UK installations will participate in the first phase of the European Union Emission Trading Scheme (“EU ETS”),which runs from 2005 to 2007, inclusive. The UK Government’s revised National Allocation Plan (“NAP”) for the first phase of the EU ETS has yet to be approved by the European Commission. The NAP will specify a cap on carbon dioxide emissions for the covered sectors, the methods for allocating emission allowances to covered installations and the number of emission allowances to be allocated to each covered installation. Cost of compliance will vary with a number of factors including the final allocation numbers and liquidity of the carbon markets.
Dependence on Other Operators
Other companies operate some of the assets in which Talisman has interests. As a result, Talisman may have limited ability to exercise influence over operations of these assets or their associated costs, which could adversely affect the Company’s financial performance. The success and timing of Talisman’s activities on assets operated by others will therefore depend on a number of factors that may be outside of the Company’s control, including the timing and amount of capital expenditures, the operator’s expertise and financial resources, the approval of other participants, the selection of technology and the risk of management practices.
Differences in Ownership Interests in Foreign Operations
In Canada and the United States, the state or private land owners own oil and gas rights and lease those rights to corporations who are responsible for the development of such rights within the time frames described in the leases. This practice differs distinctly in some foreign countries in which Talisman does or may do business in the future. In those countries, the state often grants interests in large tracts of lands or offshore fields and
44 A N N U A L I N F O R M A T I O N F O R M
maintains control over the development of the oil and gas rights, in some cases through equity participation in the exploration and development of the rights. This usually includes the imposition of obligations on Talisman to complete minimum work within specified timeframes. Transfers of interests typically require a state approval, which may delay or otherwise impede transfers. In addition, if a dispute arises in Talisman’s foreign operations, the Company may be subject to the exclusive jurisdiction of foreign arbitration tribunals or foreign courts.
Competition
The petroleum industry is highly competitive. Specific disclosure regarding competition is disclosed under the heading “Competitive Conditions” in this Annual Information Form.
Exchange Rate Fluctuations
Talisman’s consolidated financial statements are presented in Canadian dollars. Results of operations are affected primarily by the exchange rates between the Canadian dollar, the United States dollar and United Kingdom pounds sterling. These exchange rates have varied substantially in the last five years. Most of the Company’s revenue is received in or is referenced to United States dollar denominated prices, while the majority of Talisman’s expenditures are denominated in Canadian dollars, United States dollars and United Kingdom pound sterling. A change in the relative value of the Canadian dollar against the United States dollar would also result in an increase or decrease in Talisman’s United States dollar denominated debt, as expressed in Canadian dollars and the related interest expense. Talisman is also exposed to fluctuations in other foreign currencies.
Dependence on Management
The success of Talisman is dependent upon its management and the quality of its personnel. Failure to retain current employees or to attract and retain new employees with the necessary skills could have a materially adverse effect on Talisman’s growth and profitability.
TRANSFER AGENTS AND REGISTRARS
Computershare Trust Company of Canada at 600, 530 – 8th Avenue S.W., Calgary, Alberta, T2P 3S8, along with its co-transfer agent, Computershare Investor Services, LLC, is the transfer agent and registrar for the Common Shares of the Company. Computershare Trust Company of Canada also acts as trustee for various public debt securities and JP Morgan Chase, London Branch, of Trinity Tower, 9 Thomas More Street, London, E1W 1YT, United Kingdom, acts as trustee for the 6.625% unsecured notes listed on the London Stock Exchange. The Company has not retained transfer agents for any other outstanding securities.
INTERESTS OF EXPERTS
Talisman’s auditor is Ernst & Young LLP, Chartered Accountants, Ernst & Young Tower, 1000, 440 - 2nd Avenue S.W., Calgary, Alberta, T2P 5E9. The Company’s audited consolidated financial statements for the year ended December 31, 2004 have been filed under National Instrument 51-102 in reliance on the report of Ernst & Young LLP, independent chartered accountants, given on their authority as experts in auditing and accounting.
Mr. Michael Adams, an employee of Talisman, has provided the report on reserves data attached as Schedule A to this Annual Information Form in his capacity as Talisman’s Internal Qualified Reserves Evaluator. Mr. Adams owns less than 1% of the outstanding Common Shares.
ADDITIONAL INFORMATION
Additional information related to the Company may be found on SEDAR at www.sedar.com.
Additional information including directors’ and officers’ remuneration and indebtedness, principal holders of the Company’s securities and securities authorized for issuance under equity compensation plans, is contained in the Company’s management information circular for its most recent annual meeting of security holders that involved the election of directors. Additional financial information is provided in the Company’s audited consolidated financial statements for the year ended December 31, 2004 and related annual management’s discussion and analysis.
Copies of the Company’s Annual Report may be obtained from Talisman’s website atwww.talisman-energy.comor upon request from:
Investor Relations and Corporate Communications Department
Talisman Energy Inc.
Suite 3400, 888 Third Street S.W.
Calgary, Alberta, T2P 5C5
E-Mail: tlm@talisman-energy.com
A N N U A L I N F O R M A T I O N F O R M 45
SCHEDULE A
REPORT ON RESERVES DATA BY TALISMAN’S INTERNAL
QUALIFIED RESERVES EVALUATOR
To the Board of Directors of Talisman Energy Inc. (the “Company”):
1.
| The Company’s staff and I have evaluated the Company’s reserves data as at December 31, 2004. The reserves data, which has been prepared in accordance with U.S. disclosure requirements, including the relevant definitions, legal requirements and standards of the United States Securities and Exchange Commission and the United States Financial Accounting Standards Board (“U.S. Disclosure Requirements”), consist of the following:
|
| | (a)
| proved oil and gas reserves quantities estimated as at December 31, 2004; and
|
| | (b)
| the related standardized measure of discounted future net cash flows.
|
2.
| The reserves data are the responsibility of the Company’s management. Our responsibility is to express an opinion on the reserves data based on our evaluation.
|
3.
| We carried out our evaluation in accordance with standards set out in the Canadian Oil and Gas Evaluation Handbook (the “COGE Handbook”) prepared jointly by the Society of Petroleum Evaluation Engineers (Calgary Chapter) and the Canadian Institute of Mining, Metallurgy & Petroleum (Petroleum Society) applied in such modified manner as we considered necessary to reflect the terminology and standards of the U.S. Disclosure Requirements. We are not independent of the Company, within the meaning of the term “independent” under those standards.
|
4.
| Those standards require that we plan and perform an evaluation to obtain reasonable assurance as to whether the reserves data are free of material misstatement. An evaluation also includes assessing whether the reserves data are in accordance with principles and definitions presented in the COGE Handbook as modified as set out above.
|
| 5. | The following sets forth the standardized measure of discounted future net cash flows (after deducting income taxes) attributed to proved oil and gas reserve quantities, calculated using a discount rate of 10%, included in the reserves data of the Company evaluated for the year ended December 31, 2004: |
| Location of Reserves | Standardized Measure of Discounted Future Net Cash Flows | |
| (country or foreign geographic area) | (millions of Canadian dollars, after income taxes, 10% discount rate) | |
| Canada | $ | 5,354 | |
| United States | $ | 490 | |
| North Sea | $ | 2,154 | |
| Southeast Asia | $ | 1,504 | |
| Algeria | $ | 423 | |
| Trinidad | $ | 235 | |
| $ | 10,160 | |
6.
| In our opinion, the reserves data evaluated by us have, in all material respects, been determined in accordance with the COGE Handbook applied in the modified manner as set out above.
|
7.
| We have no responsibility to update our evaluation for events and circumstances occurring after the date of this report.
|
8.
| Reserves data are estimates only and not exact quantities. In addition, the reserves data are based on judgements regarding future events. Accordingly, actual results will vary and the variations may be material.
|
(Signed)
Michael Adams
Internal Qualified Reserves Evaluator
Talisman Energy Inc.
Calgary, Alberta
March 14, 2005
46 A N N U A L I N F O R M A T I O N F O R M
SCHEDULE B
REPORT ON MANAGEMENT AND DIRECTORS ON OIL AND GAS DISCLOSURE
Management of Talisman Energy Inc. (the “Company”) is responsible for the preparation and disclosure of information with respect to the Company’s oil and gas activities in accordance with securities regulatory requirements. This information includes reserves data prepared in accordance with U.S. disclosure requirements, including the relevant definitions, legal requirements and standards of the United States Securities and Exchange Commission and the United States Financial Accounting Standards Board (“U.S. Disclosure Requirements”), which consist of the following:
(a) proved oil and gas reserve quantities estimated as at December 31, 2004; and
(b) the related standardized measure of discounted future net cash flows.
The Company’s reserves evaluation staff, including our Internal Qualified Reserves Evaluator who is an employee of the Company, have evaluated the Company’s reserves data. The report of the Internal Qualified Reserves Evaluator accompanies this report.
The Reserves Committee of the Board of Directors has:
(a) reviewed the Company’s procedures for providing information to the Internal Qualified Reserves Evaluator;
(b) met with the Internal Qualified Reserves Evaluator to determine whether any restrictions placed by management affect the ability of the Internal Qualified Reserves Evaluator to report without reservation; and
(c) reviewed the reserves data with management and the Internal Qualified Reserves Evaluator.
The Reserves Committee of the Board of Directors has reviewed the Company’s procedures for assembling and reporting other information associated with oil and gas activities and has reviewed that information with management. The Board of Directors has, on the recommendation of the Reserves Committee, approved:
(a) the content and filing with securities regulatory authorities of the reserves data and other oil and gas information contained in the Annual Information Form accompanying this report;
(b) the filing of the report of the Internal Qualified Reserves Evaluator on the reserves data; and
(c) the content and filing of this report.
In our view, the reliability of the internally generated reserves data is not materially less than would be afforded by our involving independent qualified reserves evaluators or independent qualified reserves auditors to evaluate or audit and review the reserves data. The Company is therefore relying on an exemption, which it sought and was granted by securities regulatory authorities, from the requirement under securities legislation to involve independent qualified reserves evaluators or independent qualified reserves auditors.
The primary factors supporting the involvement of independent qualified reserves evaluators or independent qualified reserves auditors apply when (i) their knowledge of, and experience with, a reporting issuer’s reserves data are superior to that of the internal evaluators and (ii) the work of the independent qualified reserves evaluators or independent qualified reserves auditors is significantly less likely to be adversely influenced by self-interest or management of the reporting issuer than the work of internal reserves evaluation staff. In our view, neither of these factors applies in our circumstances.
A N N U A L I N F O R M A T I O N F O R M 47
Our view is based in large part on the following. Our reserves data were developed in accordance with standards set out in the Canadian Oil and Gas Evaluation Handbook applied in such modified manner as the Company considered necessary to reflect the terminology and standards of the U.S. Disclosure Requirements. Our procedures, records and controls relating to the accumulation of source data and preparation of reserves data by our internal reserves evaluation staff have been established, refined and documented over many years. Our internal reserves evaluation staff includes approximately 104 persons with full-time or part-time responsibility for reserves evaluation with an average of approximately 17 full-time or part-time years of relevant experience in evaluating reserves, of whom 47 are qualified reserves evaluators for purposes of securities regulatory requirements. Our internal reserves evaluation management personnel includes approximately 26 persons with full-time or par t-time responsibility for reserves evaluation management with an average of approximately 23 full-time or part-time years of relevant experience in evaluating and managing the evaluation of reserves, 14 of whom were qualified reserves evaluators for purposes of securities regulatory requirements.
Reserves data are estimates only, and are not exact quantities. In addition, the reserves data are based on judgements regarding future events. Accordingly, actual results will vary and the variations may be material.
(Signed)
James W. Buckee
President and Chief Executive Officer
(Signed)
T. Nigel D. Hares
Executive Vice-President,
Frontier and International Operations
(Signed)
Ronald J. Eckhardt
Executive Vice-President,
North American Operations
(Signed)
Charles W. Wilson
Director
(Signed) Kevin S. Dunne
Director
March 14, 2005
48 A N N U A L I N F O R M A T I O N F O R M
SCHEDULE C
AUDIT COMMITTEE INFORMATION
COMPOSITION OF AUDIT COMMITTEE
Talisman’s Audit Committee consists of Al L. Flood, Dale G. Parker, Robert G. Welty (Chairman) and Charles W. Wilson. The Board of Directors has determined that all members of the Audit Committee are “independent” and “financially literate” as defined in Multilateral Instrument 52-110 (“MI 52-110”). In addition,in accordance with New York Stock Exchange corporate governance listing standards, the Board of Directors has determined that Robert G. Welty is an audit committee financial expert.
MI 52-110 states that a member of an audit committee is independent if the member has no direct or indirect material relationship with the issuer. A material relationship is a relationship which could, in the view of the issuer’s Board of Directors, reasonably interfere with the exercise of a member’s independent judgement.
In addition, an individual is considered financially literate if he or she has the ability to read and understand a set of financial statements that present a breadth and level of complexity of accounting issues that are generally comparable to the breadth and complexity of the issues that can reasonably be expected to be raised by the issuers’ financial statements.
EDUCATION AND EXPERIENCE
The members of Talisman’s Audit Committee have education and experience relevant to the performance of their responsibilities as an Audit Committee member, which includes the following:
Al L. Flood held various positions in the Canadian Imperial Bank of Commerce (“CIBC”),including Chairman of the Executive Committee from 1999 to 2000, Chief Executive Officer and Chairman from 1992 to 1999, and director from 1989 to 2000. Mr. Flood currently serves on the board of directors of Canadian Imperial Bank of Commerce and Noranda Inc. Mr. Flood is a graduate of the program for management development, Graduate School of Business, Harvard University.
Dale G. Parker held various positions with the Bank of Montreal, including Executive Vice President & Group Executive, Commercial Banking. In 1985, he became President, Canadian Banking Operations for the Bank of British Columbia, and from 1987 to 1989, he served as Chairman, President and Chief Executive Officer of B.C. Bancorp (formerly the Bank of British Columbia). Mr. Parker also served as Chairman of the Financial Institutions Commission for British Columbia until 1994. Mr. Parker has served in executive capacities with other companies and institutions including President of White Spot Ltd. and President and Chief Executive Officer of the Worker’s Compensation Board of British Columbia. Mr. Parker completed the three year Executive Development Program at McGill University and the Advanced Management Program at Harvard Business School.
Robert G. Welty, Chairman of the Audit Committee, is currently Chairman, Chief Executive Officer and director of Sterling Resources Ltd., a publicly traded junior energy company with international activities. He served as President, Chief Executive Officer and Director of Canadian Fracmaster Ltd., an international oilfield service and production company, from 1994 to 1995. Mr. Welty was also President, Chief Executive Officer and Director of Bow Valley Energy Inc. from 1992 to 1994, a Calgary based international oil and gas company which was subsequently acquired by Talisman. He currently serves on the board of directors of Sterling Resources Ltd. and Pan-Ocean Energy Corporation Limited. Mr. Welty holds a B.A. Honors, Economics (First Class) from Simon Fraser University and is a Chartered Accountant.
Charles W. Wilson held various positions with the Shell group of companies, including President, Chief Executive Officer and Director of Shell Canada Limited from 1993 to 1999, Executive Vice President US Downstream Oil and Chemical of Shell Oil US from 1988 to 1993 and Vice-President US Refining and Marketing of Shell Oil US (1987 to 1988). He currently serves on the board of directors of ATCO Ltd., Akita Drilling Ltd., Big Rock Brewery Ltd. and Canadian Utilities Limited. Mr. Wilson has a BS., Civil Engineering and a M.S. Engineering from the University of New Mexico.
A N N U A L I N F O R M A T I O N F O R M 49
AUDIT FEES AND PRE-APPROVAL OF AUDIT SERVICES
The following table presents fees for the audits of the Company’s annual consolidated financial statements for 2004 and 2003 and for other services provided by Ernst & Young LLP:
| | 2004 | | | 2003 | |
| Audit fees | $ | 2,050,000 | | $ | 1,690,200 | |
| Audit-related fees | $ | 220,000 | | $ | 409,000 | |
Tax fees | $ | 1,334,000 | | $ | 1,147,400 | |
All other fees | $ | 30,000 | | $ | 92,400 | |
The audit-related fees are primarily for prospectus filings, pension plan audits and attestation procedures related to cost certifications and government compliance. Tax fees are primarily for tax compliance and tax advisory services. All other fees are primarily for advisory services. The Audit Committee has concluded that the provision of tax services is compatible with maintaining Ernst & Young’s independence.
Under the terms of reference of the Audit Committee which follow, the Audit Committee is required to review and pre-approve the objectives and scope of the external audit work and proposed fees. In addition, the Audit Committee is required to review and pre-approve all non-audit services, including tax services, the Company’s external auditors are to perform.
During 2003, the Audit Committee implemented specific procedures regarding the pre-approval of services to be provided by the Company’s external auditors. These procedures specify certain prohibited services that are not to be performed by the Company’s external auditors. In addition, these procedures require that at least annually, prior to the period in which the services are proposed to be provided, the Company’s management, in conjunction with the Company’s external auditors, prepares and submits to the Audit Committee a complete list of all proposed services and related fees to be provided to the Company by the Company’s external auditors. Under the Audit Committee pre-approval procedures, for those services proposed to be provided by the Company’s external auditors that have not been previously approved by the Audit Committee, the Audit Committee has delegated to the Chairman of the Audit Committee the authority to grant pre-approvals of such services. The decision to pre-approve a service covered under this procedure is presented to the full Audit Committee at the next scheduled meeting. At each of the Audit Committee’s regular meetings, the Audit Committee is provided an update as to the status of services previously approved.
Pursuant to these procedures since their implementation in 2003, 100% of each of the services relating to fees reported as audit-related, tax and all other were pre-approved by the Audit Committee or its delegate, the Chair of the Audit Committee.
The full text of the terms of reference for Talisman’s Audit Committee follows.
TERMS OF REFERENCE
AUDIT COMMITTEE
MISSION STATEMENT
The Audit Committee’s mission is to assist the Board in fulfilling its obligations by overseeing and monitoring the Company’s financial accounting and reporting process and the integrity of the Company’s financial statements and its internal control over financial reporting and the external financial audit process. To fulfill this mission, the Audit Committee has received this mandate and has been delegated certain authorities that it may exercise on behalf of the Board.
COMPOSITION
At the first meeting of the Board of Directors of the Company after the election of Directors at the annual meeting of shareholders, the Board shall appoint an Audit Committee comprised of not less than three and not more than six Directors of the Company. Each member of the Audit Committee shall be independent (as required by applicable securities laws and stock exchange rules). At least one member of the Audit Committee shall be an audit committee financial expert and all members of the Audit Committee shall have an appropriate level of financial literacy as required under applicable stock exchange rules and securities laws and determined by the Board from time to time. The Board may replace or remove from the Audit Committee any member at any time.
50 A N N U A L I N F O R M A T I O N F O R M
The Chair of the Audit Committee shall be appointed by the Board at the meeting of the Board referred to above. The Chair shall preside as chair at each Committee meeting, lead Committee discussion on meeting agenda items and report to the Board, on behalf of the Committee, with respect to the proceedings of each Committee meeting. The Audit Committee shall designate a Secretary to the Audit Committee who may be a member of the Audit Committee or an officer or employee of the Company. The Secretary shall keep minutes and records of all meetings of the Audit Committee. In the event that either the Chair or the Secretary is absent from any meeting, the members present shall designate any Director present to act as Chair and shall designate any Director, officer or employee of the Company to act as Secretary.
MEETINGS
Meetings of the Audit Committee, including telephone conference meetings, shall be held at such time and place as the Chair of the Audit Committee may determine. Notice of meetings shall be given to each member not less than 24 hours before the time of the meeting, provided that meetings of the Audit Committee may be held without formal notice if all of the members are present and do not object to notice not having been given, or if those absent waive notice in any manner before or after the meeting.
Notice of meeting may be given verbally or delivered personally, given by mail, facsimile or other electronic communication and need not be accompanied by an agenda or any other material. The notice shall however specify the purpose or purposes for which the meeting is being held.
At the request of the auditor of the Company (the “Auditor”), the Chief Executive Officer, the Chief Financial Officer or a member of the Audit Committee, the Chair shall call and convene a meeting of the Audit Committee.
Any three members of the Audit Committee shall constitute a quorum.
The Audit Committee shall meet at least quarterly.
Representatives of the Auditor and management of the Company shall have access to the Audit Committee each in the absence of the other.
The Auditor shall be notified of all meetings of the Audit Committee and, when appropriate, it may attend and be heard at any such meeting and shall attend if requested to do so by a member of the Audit Committee.
Any matter the Audit Committee does not unanimously approve will be referred to the Board for consideration.
No alteration to the roles and responsibilities of the Audit Committee shall be effective without the approval of the Board of Directors.
The Audit Committee shall review the adequacy of these Terms of Reference on an annual basis and recommend any changes it considers appropriate to the Governance and Nominating Committee, which shall in light of the Company’s governance structure and framework recommend any changes it considers appropriate to the Board of Directors.
ROLE AND RESPONSIBILITIES
A. FINANCIAL STATEMENTS AND OTHER FINANCIAL INFORMATION
The Audit Committee shall:
1.
| oversee the Company’s financial reporting process on behalf of the Board and report on the results of these activities to the Board;
|
2.
| review the Company’s annual financial statements and, if determined to be satisfactory, recommend them to the Board for approval;
|
3.
| review and, if determined to be satisfactory, recommend to the Board for approval the annual earnings press release and management’s discussion and analysis of operations contained in the annual report and their consistency with the financial statements;
|
4.
| review and, if determined to be satisfactory, approve the Company’s interim financial statements prior to their publication, filing or delivery to security holders;
|
5.
| review and, if determined to be satisfactory, approve all interim earnings press releases and management’s discussion and analysis of operations which accompanies interim financial statements;
|
6.
| ensure that adequate procedures are in place for the review of the Company’s public disclosure of financial information extracted or derived from the Company’s financial statements, other than the public disclosure referred to in items 2 to 5 above, and periodically assess the adequacy of those procedures;
|
7.
| review the appropriateness of any report or opinion proposed to be rendered in connection with the year-end consolidated financial statements;
|
A N N U A L I N F O R M A T I O N F O R M 51
8.
| review the nature, substance and appropriateness of significant accruals, reserves and other estimates;
|
9.
| review the appropriateness of impairment provisions;
|
10.
| review with the Auditor and with the management of the Company and, if determined to be satisfactory, approve on behalf of the Board all financial statements included in a prospectus or other similar document; and
|
11.
| review and assess regularly:
|
(a) the quality and acceptability of accounting policies and financial reporting practices used by the Company;
(b) any significant proposed changes in financial reporting and accounting policies and practices to be adopted by the Company;
(c) any new or pending developments, in accounting and reporting standards that may affect the Company;
(d) the key financial estimates and judgements of management that may be material to the financial reporting of the Company;
(e) policies related to financial disclosure risk assessment and management; and
(f) responses by management to material information requests from government or regulatory authorities which may have an impact on the financial reporting of the Company.
B. EXTERNAL AUDIT
The Auditor shall be ultimately accountable to the shareholders of the Company, who shall be represented by the Board of Directors and the Audit Committee in their dealings with the Auditor. The Audit Committee shall recommend to the Board the auditor that will be proposed at the annual shareholders’ meeting for appointment as the Auditor for the ensuing year. The Auditor shall report directly to the Audit Committee, which shall be responsible for compensation and retention of the Auditor and oversight of the Auditor’s work (including resolution of disagreements between management and the Auditor regarding financial reporting).
At least annually, the Audit Committee shall require that the Auditor provide a formal written statement describing: (i) the firm’s internal quality-control procedures; (ii) any material issues raised by the most recent internal quality-control review, or peer review, of the firm, or by any inquiry or investigation by governmental or professional authorities, within the preceding five years, respecting one or more independent audits carried out by the firm, and any steps taken to deal with any such issues; and (iii) all relationships between the Auditor and the Company.
With respect to (iii) above and for more clarity, annually the Audit Committee shall obtain a written letter from the Auditor pursuant to the Independence Standards Board standard #1 disclosing all relationships between the Auditor and its related entities and the Company and its related entities, and confirming the Auditor’s independence from the Company.
The Audit Committee shall not recommend to the Board that an auditor be appointed as the Auditor if the Company’s Chief Executive Officer, Chief Financial Officer or Controller was employed by the auditor and participated in any capacity in the Company’s audit during the one-year period preceding the date of the initiation of the Company’s audit for which the Audit Committee is recommending the appointment. The Audit Committee shall review management’s policies for hiring partners, employees and former partners and employees of the Auditor and former external auditor of the Company. The Audit Committee further shall ensure the independence of the Auditor by reviewing, and discussing with the Board if necessary, any relationships that may adversely affect the independence of the Auditor.
The Audit Committee shall review the planning and results of external audit activities and the ongoing relationship with the Auditor. In this regard the Audit Committee shall:
1.
| review and, if determined to be satisfactory, pre-approve the terms of the annual external audit engagement plan, including but not limited to the following:
|
| | (a) | engagement letter; |
| | (b) | objectives and scope of the external audit work; |
| (c) | materialitylimit; |
| (d) | areas of audit risk; |
| (e) | staffing; |
| (f) | timetable; and |
| (g) | proposed fees; |
52 A N N U A L I N F O R M A T I O N F O R M
2.
| annually, or as otherwise required by the Audit Committee, review a written report from the Auditor on the critical accounting policies of the Company;
|
3.
| review and, if determined to be satisfactory, pre-approve all non-audit services, including tax services, the Auditor is to perform, and it shall consider the impact the provision of such services could have on the independence of the external audit work. The Audit Committee may delegate this authority to grant pre-approvals to one or more designated members of the Audit Committee, provided that such delegates present their decisions to pre-approve services to the full Audit Committee at each of its scheduled meetings. The Audit Committee shall not permit the Auditor to perform any non-audit service prohibited by law applicable to the Company;
|
4.
| meet with the Auditor and management to discuss the Company’s annual financial statements and the Auditor’s report, the interim financial statements, and management’s discussion and analysis relating to both the annual and interim financial statements. Meetings with the Auditor and management shall be held separately, periodically, as scheduled by the Audit Committee;
|
5.
| review and advise the Board with respect to the plan, conduct and reporting of the annual external audit, including but not limited to the following:
|
| | (a)
| any audit problems or difficulties encountered, and management’s response thereto, and any restriction imposed by management during the annual audit;
|
| | (b)
| any significant accounting or financial reporting issue;
|
| | (c)
| the Auditor’s evaluation of the Company’s system of internal controls and related procedures and documentation;
|
| | (d)
| the post audit or management letter containing any of the Auditor’s findings or recommendations, including management’s response thereto and the subsequent follow-up to any identified control weaknesses; and
|
| | (e)
| any other matters that the Auditor brings to the attention of the Audit Committee;
|
6.
| prepare an Audit Committee report to be included in the Company’s annual corporate governance disclosure; and
|
7.
| fix the remuneration of the Auditor.
|
C.
| INTERNAL AUDIT
|
The Audit Committee shall oversee the internal audit function of the Company and the relationship of the internal auditor with management. Periodically, the Audit Committee shall meet separately with each of the internal auditor and management. To assist the Board in fulfilling its oversight and monitoring obligations in this area, the Audit Committee shall:
1.
| review and consider the appropriateness of the internal audit function and organizational framework;
|
2.
| be involved in the appointment or removal of the internal auditor;
|
3.
| support the independence of the internal audit function and the internal auditor;
|
4.
| review and consider the appropriateness of the internal audit plan and resources; and
|
5.
| review the findings of the internal auditor and consider the appropriateness of follow-up plans.
|
D.
| INTERNAL FINANCIAL CONTROL AND INFORMATION SYSTEMS
|
The Audit Committee will review and obtain reasonable assurance that the internal financial control and information systems are operating effectively to produce accurate, appropriate and timely financial information. In this regard the Audit Committee will:
1.
| obtain reasonable assurance by discussions with and reports from management, the internal auditor and the Auditor, that:
|
| | (a)
| the information systems, security of information and recovery plans are adequate and reliable; and
|
| | (b)
| the internal control systems and procedures are properly designed and effectively implemented;
|
2.
| review the appointment of the Chief Financial Officer and adequacy of accounting and finance resources, as required; and
|
3.
| ensure that direct and open communication exists among the Audit Committee, the Auditor and the internal auditor. |
A N N U A L I N F O R M A T I O N F O R M 53
E. INSURANCE
The Audit Committee shall review insurance coverage of significant business risks and uncertainties.
F. SUBSIDIARIES
The Audit Committee shall receive a report on the Company’s material Subsidiaries, as requested from time to time, concerning any material non-routine structures e.g. special purpose entities, off balance sheet items or partnership arrangements.
G. INVESTIGATIONS AND ACCESS TO MANAGEMENT
The Audit Committee shall have the authority to direct and to supervise the investigation into any matter brought to its attention within the scope of its duties. It shall establish procedures for the receipt, retention and treatment of (i) complaints the Company may receive regarding accounting, internal accounting controls, or auditing matters, and (ii) confidential,anonymous submissions from Company employees expressing concern regarding questionable accounting or auditing matters.
The Audit Committee has the authority to engage independent counsel and other advisers having special competencies, as it determines necessary to carry out its duties. The Audit Committee shall determine the appropriate amount of funding the Company shall provide for compensation of any such advisors.
In carrying out its responsibilities, the Audit Committee shall have access to such members of the Company’s management as appropriate, including the persons having responsibility for:
1.
| insurable risks, foreign currency and interest rate exposure and related derivatives;
|
2.
| tax exposures and related reserves;
|
3.
| systems security and system integrity recovery plans;
|
4.
| compliance with domestic and international regulatory requirements (such as the Corruption of Foreign Public Officials Act and Foreign Corrupt Practices Act) and material legal exposures;
|
5.
| plans and actions taken with respect to commodity price hedging;
|
6.
| financial accounting; and
|
7.
| internal audit.
|
The Audit Committee shall receive from management copies of any report of a material nature from regulators or government bodies which is relevant to the responsibilities of the Audit Committee set out in this mandate and of management’s responses thereto.
H. GENERAL
The Audit Committee shall review corporate policies that are within the scope of the roles and responsibilities specified by these terms of reference prior to submission for approval by the Board; monitor compliance on a regular basis; and ensure these policies are periodically reviewed and kept current.
The Audit Committee shall perform such other duties as may be assigned to it by the Board from time to time or as may be required by applicable law and stock exchange requirements.
In respect of matters within its purview under this mandate and delegation, the Audit Committee shall assist the Board in its oversight of the Company’s compliance with legal and regulatory requirements.
The Audit Committee shall report to the Board at each regularly scheduled Board meeting next succeeding any Committee meeting.
The Audit Committee shall evaluate its own performance annually.
54 A N N U A L I N F O R M A T I O N F O R M