Exhibit 99.1
Growing Forward
BMO Utility Conference
November 29, 2011
This presentation is made as of the date hereof and contains “forward-looking statements” as defined in Rule 3b-6 of the Securities Exchange Act of 1934, as amended, Rule 175 of the Securities Act of 1933, as amended, and relevant legal decisions. The forward-looking statements are subject to risks and uncertainties. They should be read in conjunction with “FORWARD-LOOKING STATEMENTS AND INFORMATION” and “RISK FACTORS” sections of CMS Energy’s and Consumers Energy’s Form 10-K for the year ended December 31 and as updated in subsequent 10-Qs. CMS Energy’s and Consumers Energy’s “FORWARD-LOOKING
STATEMENTS AND INFORMATION” and “RISK FACTORS” sections are incorporated herein by reference and discuss important factors that could cause CMS Energy’s and Consumers Energy’s results to differ materially from those anticipated in such statements. CMS Energy and Consumers Energy undertake no obligation to update any of the information presented herein to reflect facts, events or circumstances after the date hereof.
The presentation also includes non-GAAP measures when describing CMS Energy’s results of operations and financial performance. A reconciliation of each of these measures to the most directly comparable GAAP measure is included in the appendix and posted on our website at www.cmsenergy.com.
Reported earnings could vary because of several factors, such as legacy issues associated with prior asset sales. Because of those uncertainties, the company is not providing reported earnings guidance.
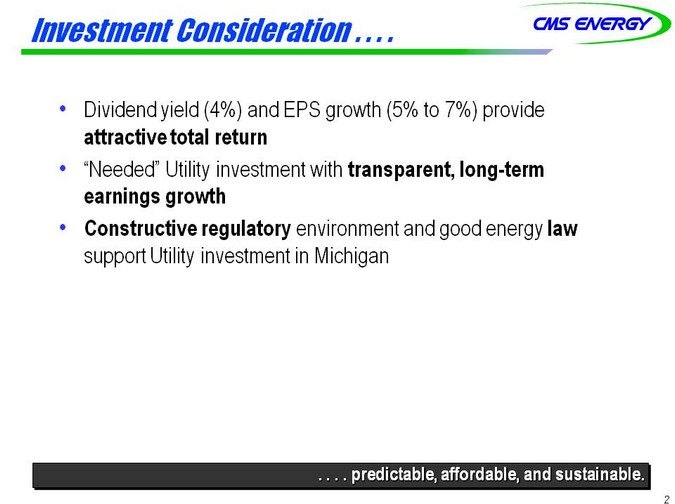
Investment Consideration . . . .
• Dividend yield (4%) and EPS growth (5% to 7%) provide attractive total return
• “Needed” Utility investment with transparent, long-term earnings growth
• Constructive regulatory environment and good energy law support Utility investment in Michigan
. . . . predictable, affordable, and sustainable.
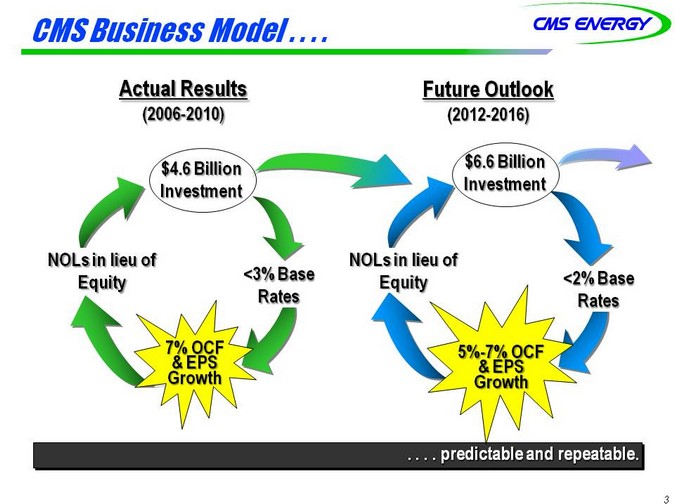
CMS Business Model . . . .
Actual Results
(2006-2010)
$4.6 Billion Investment
NOLs in lieu of Equity
<3% Base Rates
7% OCF
& EPS
Growth
Future Outlook
(2012-2016)
$6.6 Billion Investment
NOLs in lieu of Equity
<2% Base Rates
5%-7% OCF
& EPS
Growth
. . . . predictable and repeatable.
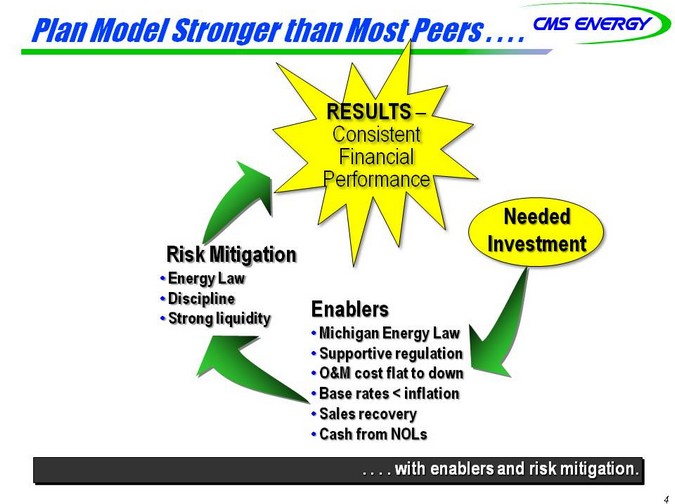
Plan Model Stronger than Most Peers . . . .
RESULTS –
Consistent Financial Performance
Risk Mitigation
• Energy Law
• Discipline
• Strong liquidity
Needed Investment
Enablers
• Michigan Energy Law
• Supportive regulation
• O&M cost flat to down
• Base rates < inflation
• Sales recovery
• Cash from NOLs
. . . . with enablers and risk mitigation.
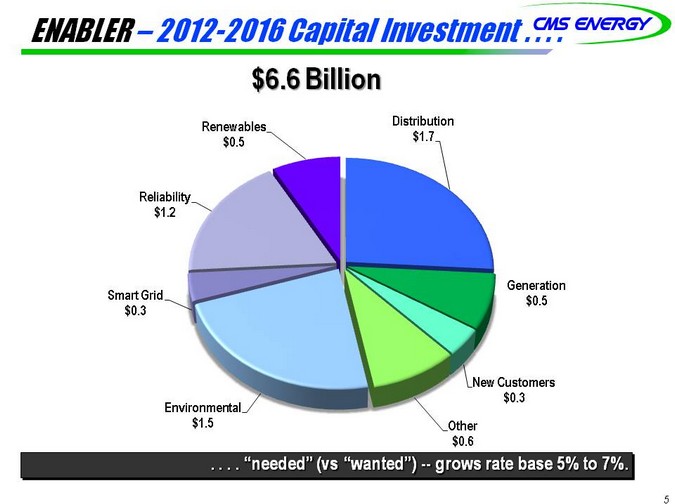
ENABLER – 2012-2016 Capital Investment . . . .
$6.6 Billion
Renewables $0.5
Reliability $1.2
Smart Grid $0.3
Environmental $1.5
Distribution $1.7
Generation $0.5
New Customers $0.3
Other $0.6
. . . . “needed” (vs “wanted”) - grows rate base 5% to 7%.
INVESTMENT – Clean Air Standards . . . .
• Cross-state Air Pollution Rule mandates SO2 and NOx reductions by January 2012
• Plan in place to achieve compliance
• Maximum Achievable Control Technology (MACT)
• Largest five coal units planned to be controlled – 2,000 MW
• Could result in retirement or mothballing of smaller coal plants – 950 MW
. . . . fully addressed in five-year plan.
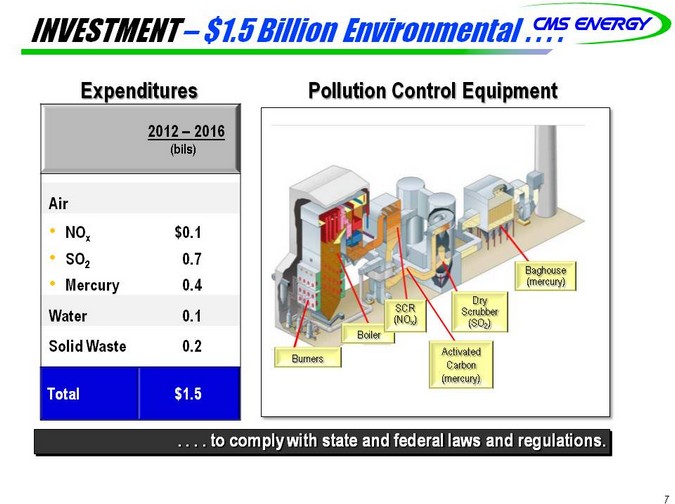
INVESTMENT – $1.5 Billion Environmental . . . .
Expenditures
2012 – 2016
(bils)
Air
• NOx $0.1
• SO2 0.7
• Mercury 0.4
Water 0.1
Solid Waste 0.2
Total $1.5
Pollution Control Equipment
Burners
Boiler
SCR (NOx)
Dry Scrubber (SO2)
Baghouse (mercury)
Activated Carbon (mercury)
. . . . to comply with state and federal laws and regulations.
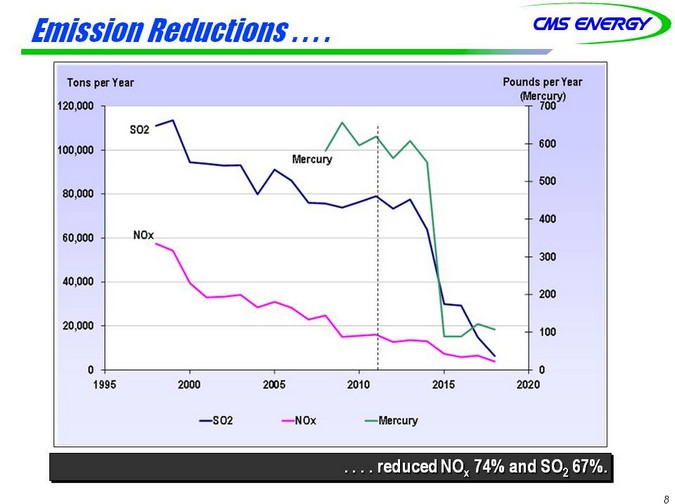
Emission Reductions . . . .
Tons per Year Pounds per Year (Mercury) 120,000 700 SO2 600 100,000 Mercury 500 80,000 400 60,000 NOx 300 40,000 200
20,000
100
0 0 1995 2000 2005 2010 2015 2020
SO2 NOx Mercury
. . . . reduced NOx 74% and SO2 67%.
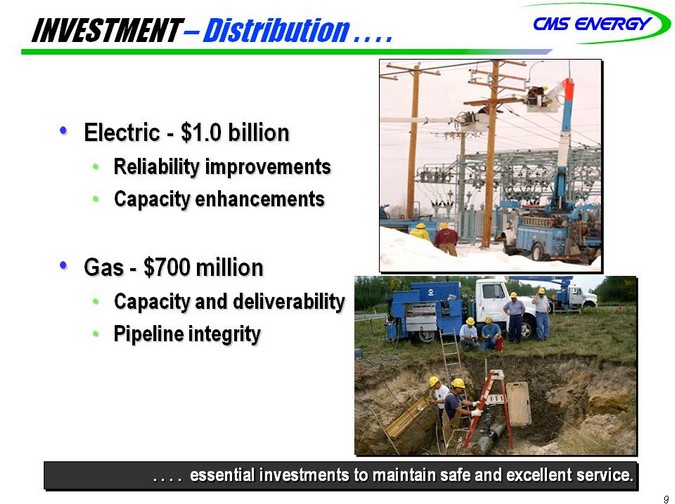
INVESTMENT – Distribution . . . .
• Electric - $1.0 billion
• Reliability improvements
• Capacity enhancements
• Gas - $700 million
• Capacity and deliverability
• Pipeline integrity
. . . . essential investments to maintain safe and excellent service.
9
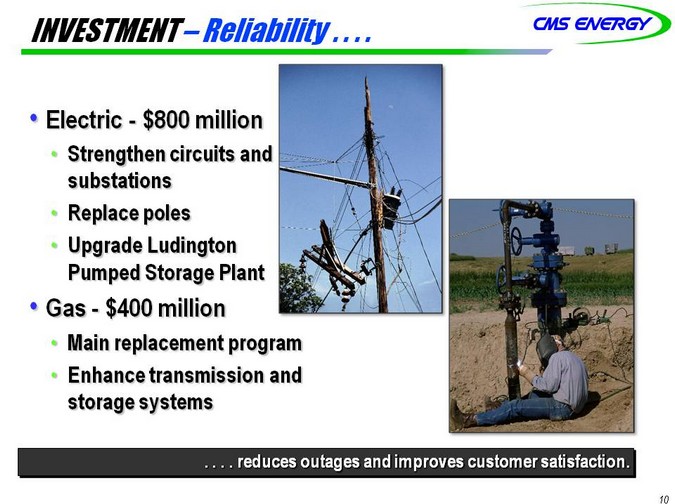
INVESTMENT – Reliability . . . .
• Electric—$800 million
• Strengthen circuits and substations
• Replace poles
• Upgrade Ludington Pumped Storage Plant
• Gas—$400 million
• Main replacement program
• Enhance transmission and storage systems
. .. . . reduces outages and improves customer satisfaction.
10
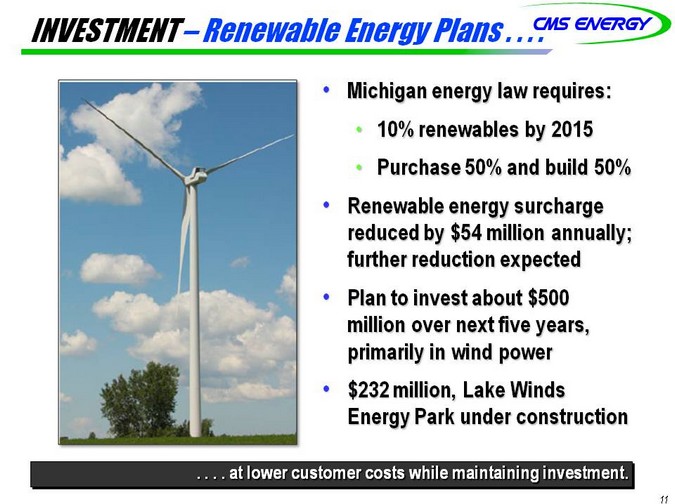
INVESTMENT – Renewable Energy Plans . . . .
• Michigan energy law requires:
• 10% renewables by 2015
• Purchase 50% and build 50%
• Renewable energy surcharge reduced by $54 million annually; further reduction expected
• Plan to invest about $500 million over next five years, primarily in wind power
• $232 million, Lake Winds Energy Park under construction
. . . . at lower customer costs while maintaining investment.
11
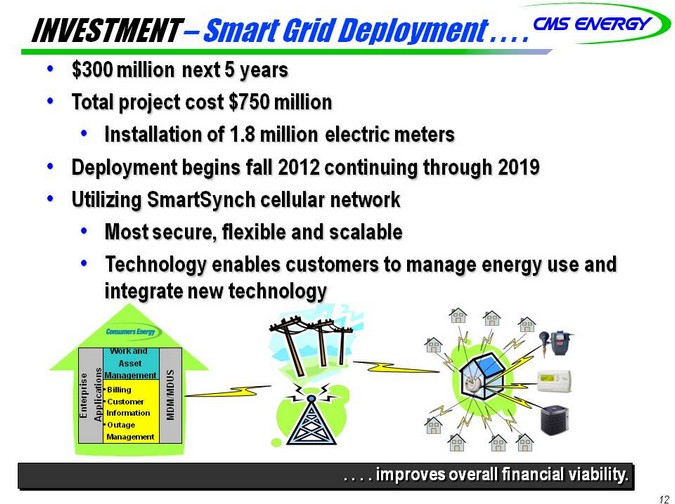
INVESTMENT – Smart Grid Deployment . . . .
• $300 million next 5 years
• Total project cost $750 million
• Installation of 1.8 million electric meters
• Deployment begins fall 2012 continuing through 2019
• Utilizing SmartSynch cellular network
• Most secure, flexible and scalable
• Technology enables customers to manage energy use and integrate new technology
Enterprise Applications
Work and Asset Management Billing Customer Information Outage Management
MDM/MDUS
. . . . improves overall financial viability.
12
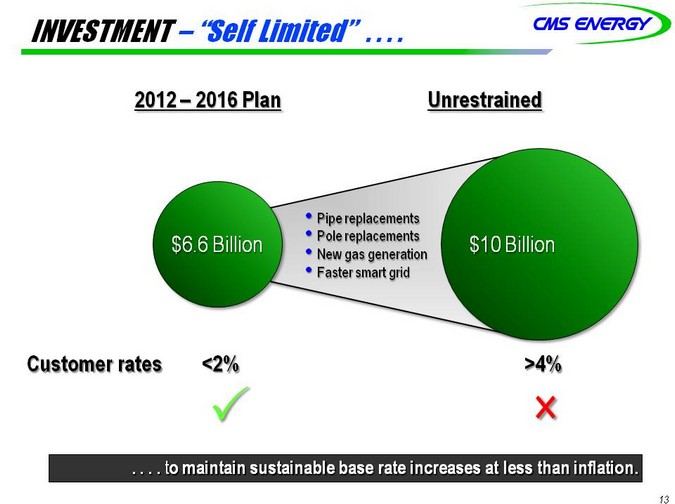
INVESTMENT – “Self Limited” . . . .
2012 – 2016 Plan Unrestrained
$6.6 Billion
• Pipe replacements
• Pole replacements
• New gas generation
• Faster smart grid
$10 Billion
Customer rates <2% >4%
. . . . to maintain sustainable base rate increases at less than inflation.
13
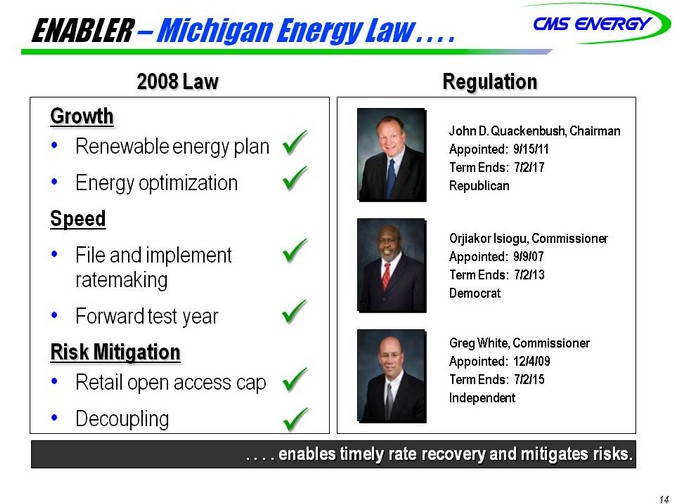
ENABLER – Michigan Energy Law . . . .
2008 Law Growth
• Renewable energy plan
• Energy optimization
Speed
• File and implement ratemaking
• Forward test year
Risk Mitigation
• Retail open access cap
• Decoupling
Regulation
John D. Quackenbush, Chairman Appointed: 9/15/11 Term Ends: 7/2/17 Republican
Orjiakor Isiogu, Commissioner Appointed: 9/9/07 Term Ends: 7/2/13 Democrat
Greg White, Commissioner Appointed: 12/4/09 Term Ends: 7/2/15 Independent
. . . . enables timely rate recovery and mitigates risks.
14
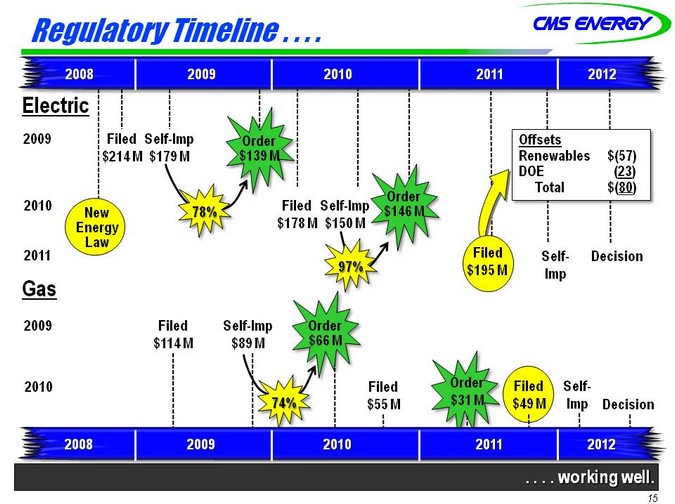
Regulatory Timeline . . . .
2008 2009 2010 2011 2012
Electric
2009
2010
2011
Gas
2009
2010
Filed Self-Imp $214 M $179 M
Order $139 M
New Energy Law
78%
Filed Self-Imp $178 M $150 M
Order $146 M
97%
Filed $114 M
Self-Imp
$89 M
Order
$66 M
74%
Filed
$55 M
Offsets
Renewables $(57) DOE (23) Total $(80)
Filed $195 M
Self-Imp
Decision
Order
$31 M
Filed
$49 M
Self-Imp
Decision
2008 2009 2010 2011 2012
. . . . working well.
15
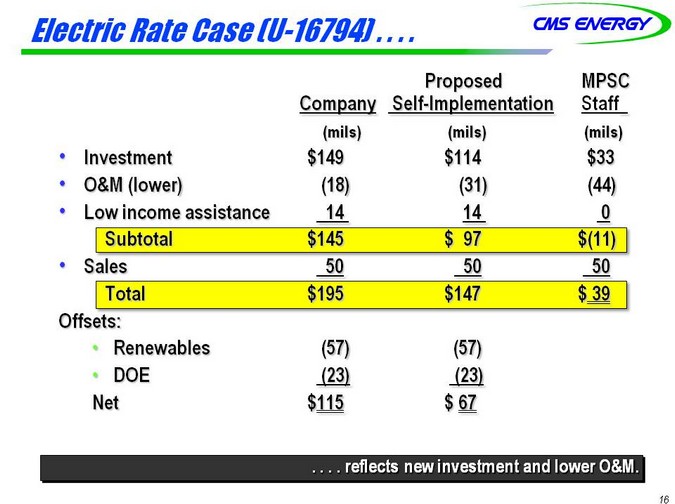
Electric Rate Case [U-16794] . . . .
Proposed MPSC
Company Self-Implementation Staff
(mils) (mils) (mils)
• Investment $149 $114 $33
• O&M (lower) (18) (31) (44)
• Low income assistance 14 14 0
Subtotal $145 $ 97 $(11)
• Sales 50 50 50
Total $195 $147 $ 39
Offsets:
• Renewables (57) (57)
• DOE (23) (23)
Net $115 $ 67
. . . . reflects new investment and lower O&M.
16
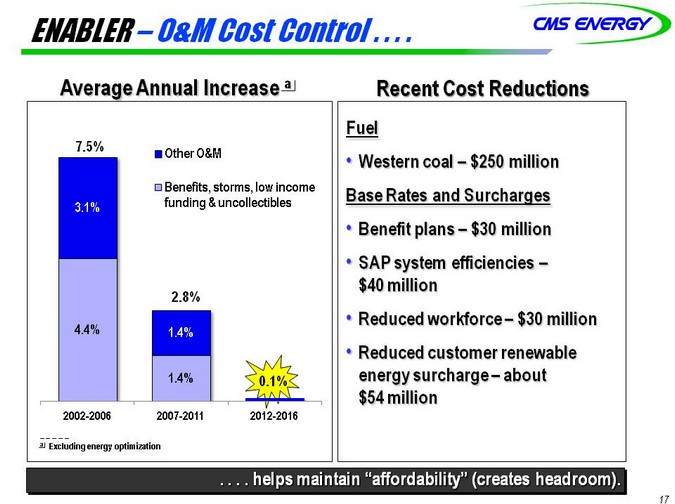
ENABLER – O&M Cost Control . . . .
Average Annual Increase a
7.5%
3.1% 4.4% 2002-2006
Other O&M
Benefits, storms, low income funding & uncollectibles
2.8%
1.4% 1.4% 2007-2011
0.1%
2012-2016
a Excluding energy optimization
Recent Cost Reductions
Fuel
• Western coal – $250 million Base Rates and Surcharges
• Benefit plans – $30 million
• SAP system efficiencies –$40 million
• Reduced workforce – $30 million
• Reduced customer renewable energy surcharge – about $54 million
. . . . helps maintain “affordability” (creates headroom).
17
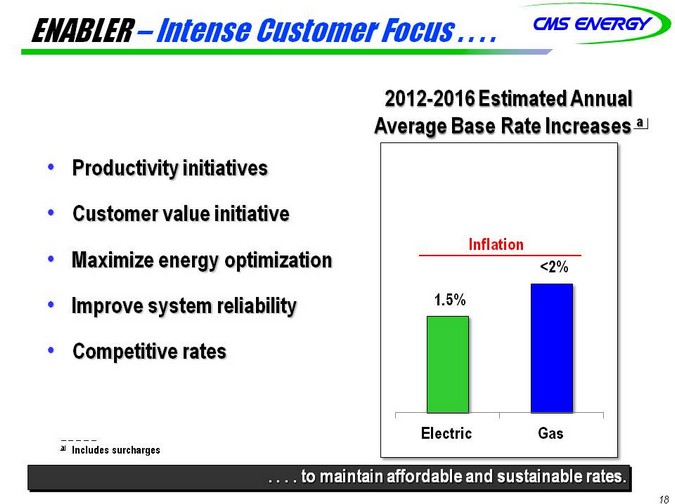
ENABLER – Intense Customer Focus . . . .
• Productivity initiatives
• Customer value initiative
• Maximize energy optimization
• Improve system reliability
• Competitive rates
a Includes surcharges
2012-2016 Estimated Annual Average Base Rate Increases a
Inflation <2% 1.5%
Electric Gas
. . . . to maintain affordable and sustainable rates.
18
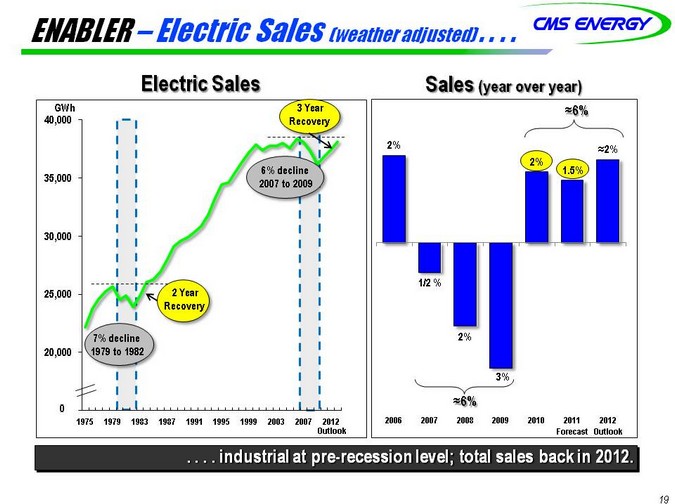
ENABLER – Electric Sales [weather adjusted] . . . .
Electric Sales
GWh 40,000
35,000 30,000 25,000 20,000 15,000 0
7% decline 1979 to 1982
6% decline 2007 to 2009
1975 1979 1983 1987 1991 1995 1999 2003 2007 Outlook 2012
Sales (year over year)
6%
2% 2% 2% 1.5%
1/2 %
2%
3%
6%
2006 2007 2008 2009 2010 2011 2012 Forecast Outlook
. . . . industrial at pre-recession level; total sales back in 2012.
19
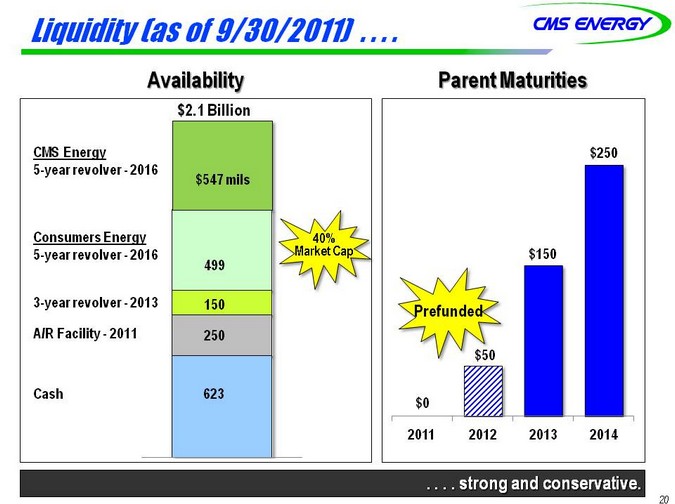
Liquidity (as of 9/30/2011) . . . .
Availability
$2.1 Billion
CMS Energy
5-year revolver - 2016 $547 mils
Consumers Energy
5-year revolver - 2016 499
3-year revolver - 2013 150
A/R Facility - 2011 250
Cash 623
40% Market Cap
Parent Maturities
$250
$150
Prefunded
$50
$0
2011 2012 2013 2014
. . . . strong and conservative.
20
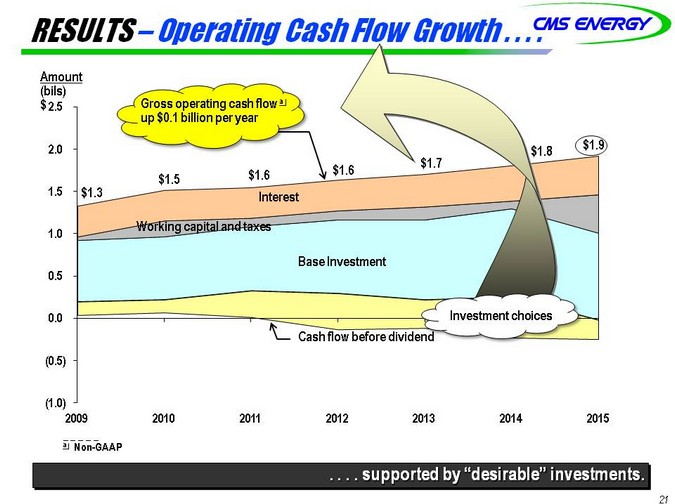
RESULTS – Operating Cash Flow Growth . . . .
Amount (bils) $ 2.5
2.0 1.5 1.0 0.5 0.0
(0.5)
(1.0)
Gross operating cash flow a up $0.1 billion per year
$1.8 $1.9 $1.7 $1.6 $1.6 $1.5 $1.3 Interest Working capital and taxes
Base Investment
Investment choices Cash flow before dividend
2009 2010 2011 2012 2013 2014 2015
a Non-GAAP
. . . . supported by “desirable” investments.
21
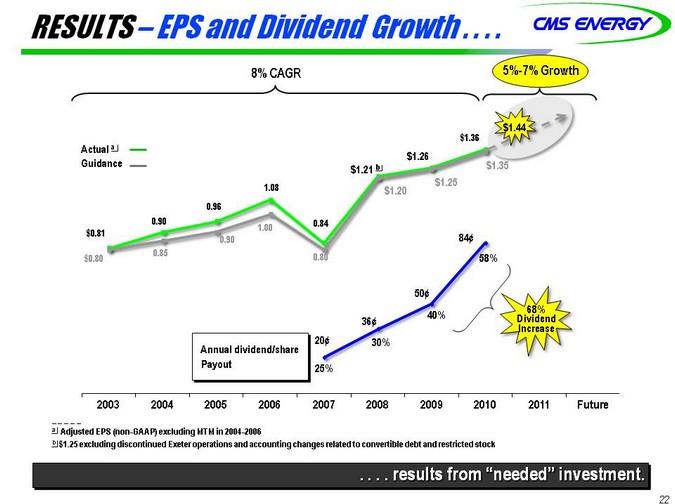
RESULTS – EPS and Dividend Growth . . . .
8% CAGR 5%-7% Growth
$1.44 $1.36 Actual a $1.26 Guidance b $1.35 $1.21 $1.25 1.08 $1.20 0.96 0.90 0.84 1.00 $0.81 84¢ 0.90 0.85 0.80 58% $0.80
50¢
68% 40% Dividend 36¢ Increase 20¢ 30% Annual dividend/share Payout 25%
2003 2004 2005 2006 2007 2008 2009 2010 2011 Future
a Adjusted EPS (non-GAAP) excluding MTM in 2004-2006 b $1.25 excluding discontinued Exeter operations and accounting changes related to convertible debt and restricted stock
. . . . results from “needed” investment.
22
Investment Consideration . . . .
• Dividend yield (4%) and EPS growth (5% to 7%) provide attractive total return
• “Needed” Utility investment with transparent, long-term earnings growth
• Constructive regulatory environment and good energy law support Utility investment in Michigan
. . . . predictable,redictable, affordable, and sustainable.
23
Appendix
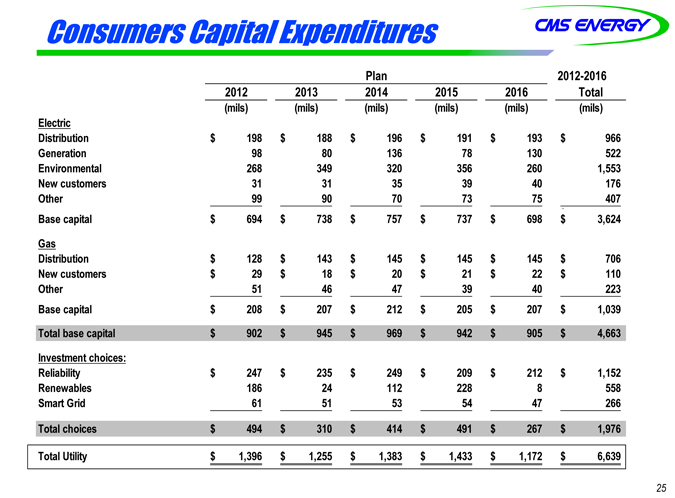
Consumers Capital Expenditures
Plan 2012-2016
2012 2013 2014 2015 2016 Total
(mils) (mils) (mils) (mils) (mils) (mils)
Electric
Distribution $ 198 $ 188 $ 196 $ 191 $ 193 $ 966
Generation 98 80 136 78 130 522
Environmental 268 349 320 356 260 1,553
New customers 31 31 35 39 40 176
Other 99 90 70 73 75 407
Base capital $ 694 $ 738 $ 757 $ 737 $ 698 $ 3,624
Gas
Distribution $ 128 $ 143 $ 145 $ 145 $ 145 $ 706
New customers $ 29 $ 18 $ 20 $ 21 $ 22 $ 110
Other 51 46 47 39 40 223
Base capital $ 208 $ 207 $ 212 $ 205 $ 207 $ 1,039
Total base capital $ 902 $ 945 $ 969 $ 942 $ 905 $ 4,663
Investment choices:
Reliability $ 247 $ 235 $ 249 $ 209 $ 212 $ 1,152
Renewables 186 24 112 228 8 558
Smart Grid 61 51 53 54 47 266
Total choices $ 494 $ 310 $ 414 $ 491 $ 267 $ 1,976
Total Utility $ 1,396 $ 1,255 $ 1,383 $ 1,433 $ 1,172 $ 6,639
25
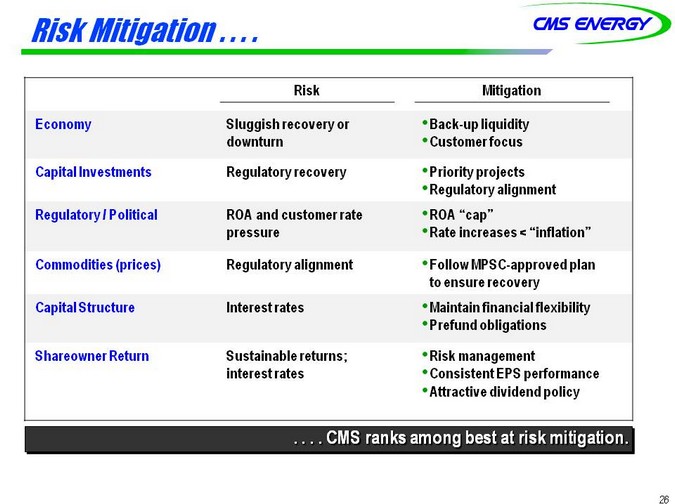
Risk Mitigation . . . .
Risk Mitigation
Economy Sluggish recovery or • Back-up liquidity
downturn • Customer focus
Capital Investments Regulatory recovery • Priority projects
• Regulatory alignment
Regulatory / Political ROA and customer rate • ROA “cap”
pressure • Rate increases < “inflation”
Commodities (prices) Regulatory alignment • Follow MPSC-approved plan
to ensure recovery
Capital Structure Interest rates • Maintain financial flexibility
• Prefund obligations
Shareowner Return Sustainable returns; • Risk management
interest rates • Consistent EPS performance
• Attractive dividend policy
. . . . CMS ranks among best at risk mitigation.
26
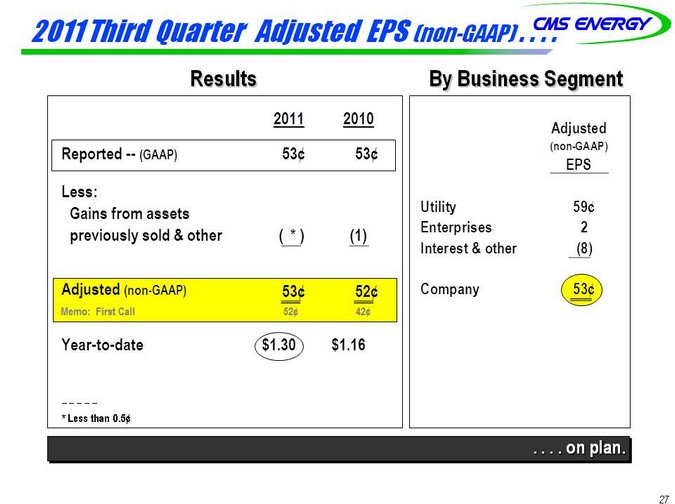
2011 Third Quarter Adjusted EPS (non-GAAP) . . . .
Results By Business Segment
2011 2010
Reported - - (GAAP) 53¢ 53¢
Less:
Gains from assets
previously sold & other ( * ) (1)
Adjusted (non-GAAP) 53¢ 52¢
Memo: First Call 52¢ 42¢
Year-to-date $1.30 $1.16
Adjusted
(non-GAAP)
EPS
Utility 59¢
Enterprises 2
Interest & other (8)
Company 53¢
. . . . on plan.
27
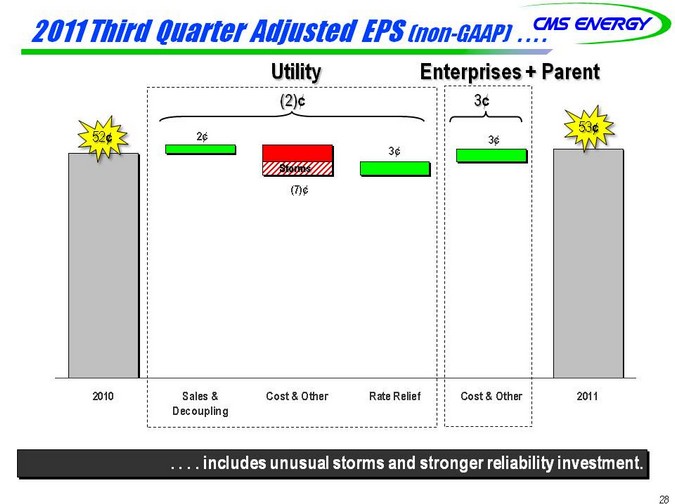
2011 Third Quarter Adjusted EPS (non-GAAP) . . . .
Utility Enterprises + Parent
53¢
52¢ 2¢ 3¢ 3¢ Storms (7)¢
2010
Sales & Decoupling
Cost & Other Rate Relief Cost & Other 2011
. . . . includes unusual storms and stronger reliability investment.
28
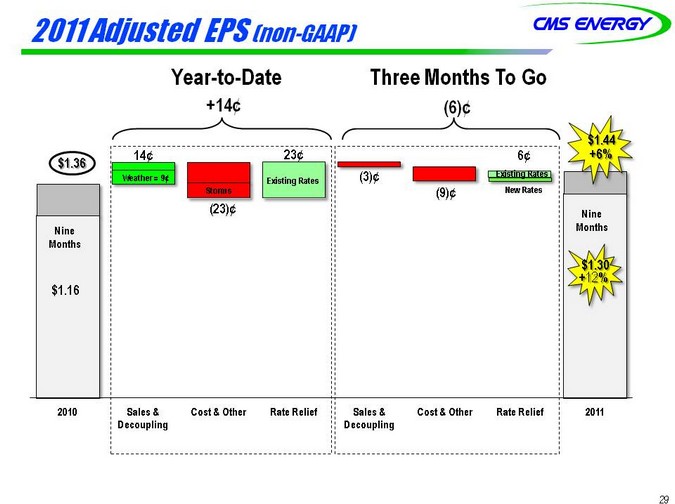
2011 Adjusted EPS (non-GAAP)
Year-to-Date Three Months To Go
+14¢ (6)¢
$1.44 14¢ 23¢ 6¢ +6% $1.36
Weather = 9¢ (3)¢ Existing Rates Existing Rates Storms (9)¢ New Rates
(23)¢ | Nine Nine Months Months |
+$ 12 1.% 30 $1.16
2010
Sales & Decoupling
Cost & Other Rate Relief
Sales & Decoupling
Cost & Other Rate Relief 2011
29
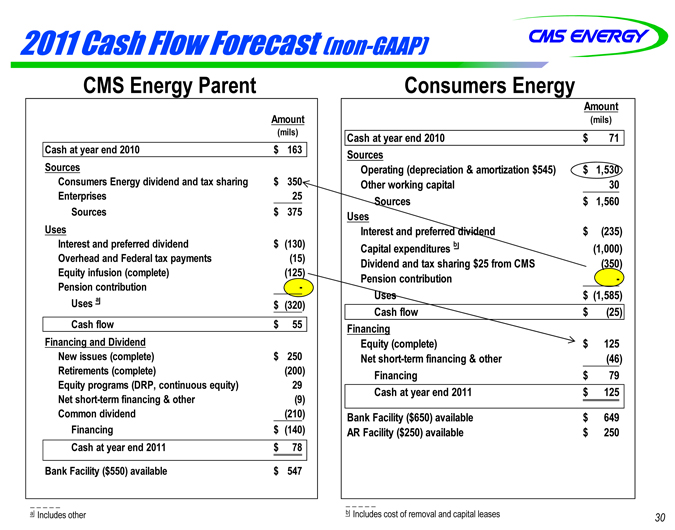
2011 Cash Flow Forecast (non-GAAP)
CMS Energy Parent Consumers Energy
Amount
(mils)
Cash at year end 2010 $ 163
Sources
Consumers Energy dividend and tax sharing $ 350
Enterprises 25
Sources $ 375
Uses
Interest and preferred dividend $ (130)
Overhead and Federal tax payments (15)
Equity infusion (complete) (125)
Pension contribution -
Uses a $ (320)
Cash flow $ 55
Financing and Dividend
New issues (complete) $ 250
Retirements (complete) (200)
Equity programs (DRP, continuous equity) 29
Net short-term financing & other (9)
Common dividend (210)
Financing $ (140)
Cash at year end 2011 $ 78
Bank Facility ($550) available $ 547
a Includes other
Amount
(mils)
Cash at year end 2010 $ 71
Sources
Operating (depreciation & amortization $545) $ 1,530
Other working capital 30
Sources $ 1,560
Uses
Interest and preferred dividend $ (235)
Capital expenditures b (1,000)
Dividend and tax sharing $25 from CMS (350)
Pension contribution -
Uses $ (1,585)
Cash flow $ (25)
Financing
Equity (complete) $ 125
Net short-term financing & other (46)
Financing $ 79
Cash at year end 2011 $ 125
Bank Facility ($650) available $ 649
AR Facility ($250) available $ 250
b Includes cost of removal and capital leases
30
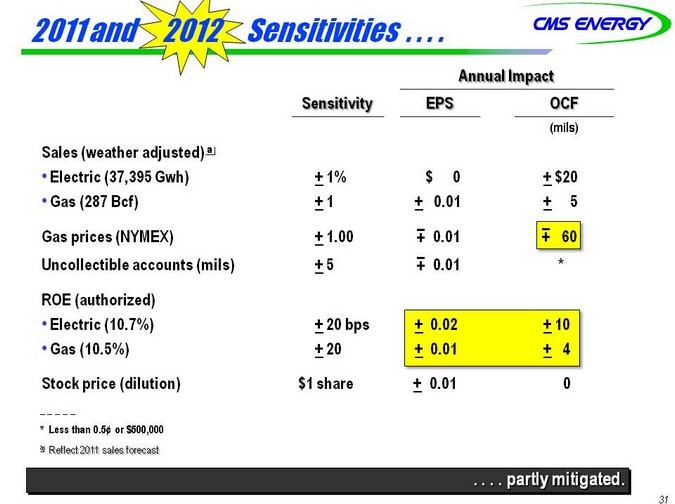
2011 and 2012 Sensitivities . . . .
Annual Impact
Sensitivity EPS OCF
(mils)
Sales (weather adjusted) a
• Electric (37,395 Gwh) + 1% $ 0 + $20
• Gas (287 Bcf) + 1 + 0.01 + 5
Gas prices (NYMEX) + 1.00 + 0.01 + 60
Uncollectible accounts (mils) + 5 + 0.01 *
ROE (authorized)
• Electric (10.7%) + 20 bps + 0.02 + 10
• Gas (10.5%) + 20 + 0.01 + 4
Stock price (dilution) $1 share + 0.01 0
* | Less than 0.5¢ or $500,000 |
a Reflect 2011 sales forecast
. . . . partly mitigated.
31
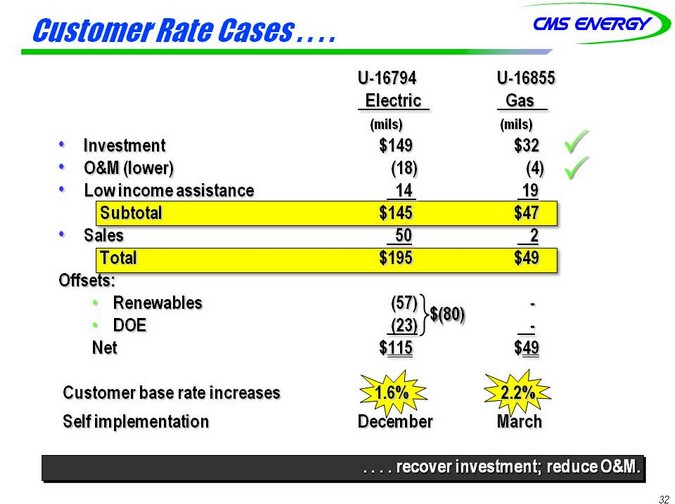
Customer Rate Cases . . . .
U-16794 U-16855
Electric Gas
(mils) (mils)
• Investment $149 $32
• O&M (lower) (18) (4)
• Low income assistance 14 19
Subtotal $145 $47
• Sales 50 2
Total $195 $49
Offsets:
• Renewables (57) -
$(80)
• DOE (23) -
Net $115 $49
Customer base rate increases 1.6% 2.2%
Self implementation December March
. . . . recover investment; reduce O&M.
32
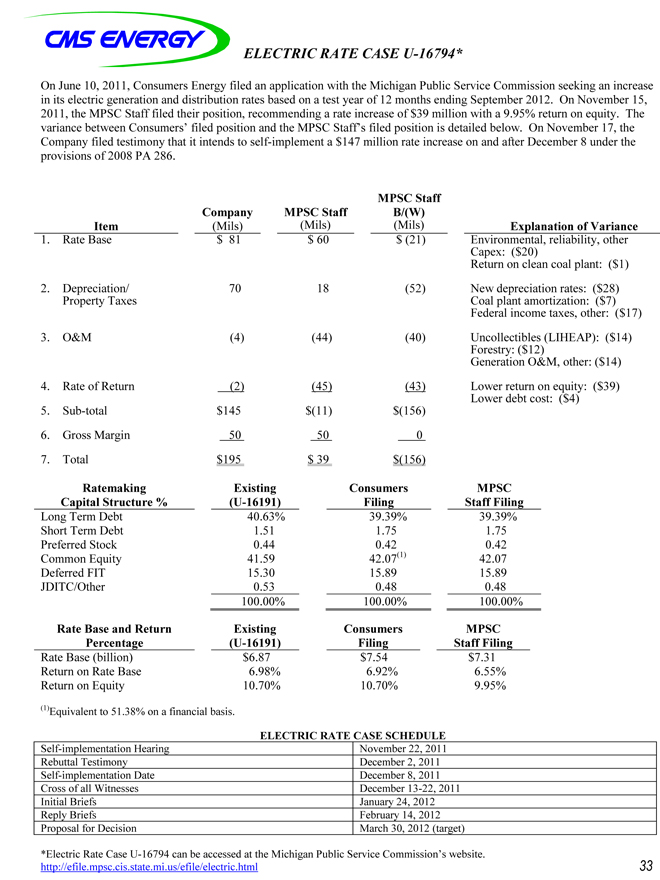
ELECTRIC RATE CASE U-16794*
On June 10, 2011, Consumers Energy filed an application with the Michigan Public Service Commission seeking an increase in its electric generation and distribution rates based on a test year of 12 months ending September 2012. On November 15, 2011, the MPSC Staff filed their position, recommending a rate increase of $39 million with a 9.95% return on equity. The variance between Consumers’ filed position and the MPSC Staff’s filed position is detailed below. On November 17, the Company filed testimony that it intends to self-implement a $147 million rate increase on and after December 8 under the provisions of 2008 PA 286.
MPSC Staff
Company MPSC Staff B/(W)
Item (Mils) (Mils) (Mils) Explanation of Variance
1. Rate Base $ 81 $ 60 $ (21) Environmental, reliability, other
Capex: ($20)
Return on clean coal plant: ($1)
2. Depreciation/ 70 18 (52) New depreciation rates: ($28)
Property Taxes Coal plant amortization: ($7)
Federal income taxes, other: ($17)
3. O&M (4) (44) (40) Uncollectibles (LIHEAP): ($14)
Forestry: ($12)
Generation O&M, other: ($14)
4. Rate of Return (2) (45) (43) Lower return on equity: ($39)
Lower debt cost: ($4)
5. Sub-total $145 $(11) $(156)
6. Gross Margin 50 50 0
7. Total $195 $ 39 $(156)
Ratemaking Existing Consumers MPSC
Capital Structure % (U-16191) Filing Staff Filing
Long Term Debt 40.63% 39.39% 39.39%
Short Term Debt 1.51 1.75 1.75
Preferred Stock 0.44 0.42 0.42
Common Equity 41.59 42.07(1) 42.07
Deferred FIT 15.30 15.89 15.89
JDITC/Other 0.53 0.48 0.48
100.00% 100.00% 100.00%
Rate Base and Return Existing Consumers MPSC
Percentage (U-16191) Filing Staff Filing
Rate Base (billion) $6.87 $7.54 $7.31
Return on Rate Base 6.98% 6.92% 6.55%
Return on Equity 10.70% 10.70% 9.95%
(1)Equivalent to 51.38% on a financial basis.
ELECTRIC RATE CASE SCHEDULE
Self-implementation Hearing November 22, 2011
Rebuttal Testimony December 2, 2011
Self-implementation Date December 8, 2011
Cross of all Witnesses December 13-22, 2011
Initial Briefs January 24, 2012
Reply Briefs February 14, 2012
Proposal for Decision March 30, 2012 (target)
*Electric Rate Case U-16794 can be accessed at the Michigan Public Service Commission’s website. http://efile.mpsc.cis.state.mi.us/efile/electric.html
33
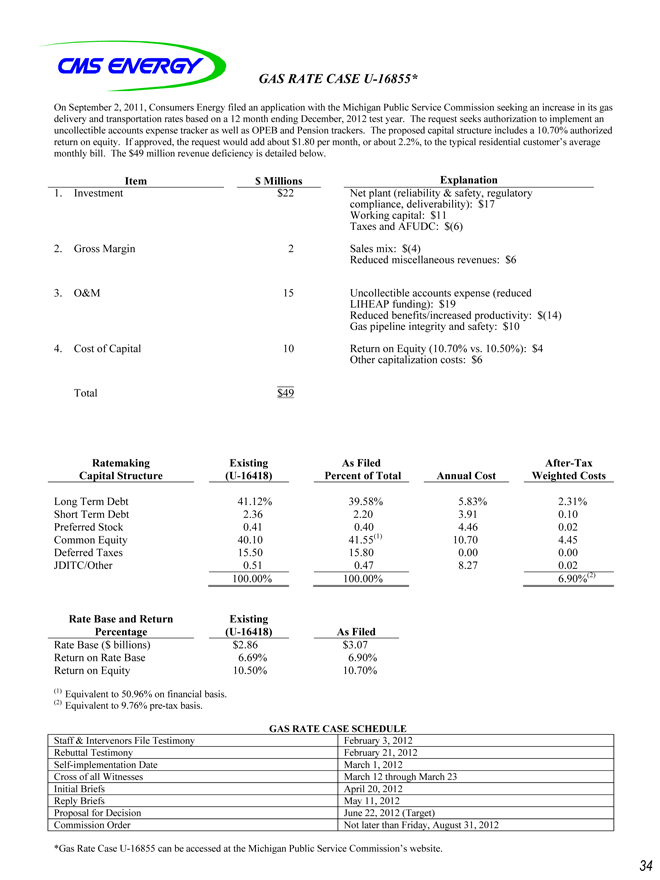
GAS RATE CASE U-16855*
On September 2, 2011, Consumers Energy filed an application with the Michigan Public Service Commission seeking an increase in its gas delivery and transportation rates based on a 12 month ending December, 2012 test year. The request seeks authorization to implement an uncollectible accounts expense tracker as well as OPEB and Pension trackers. The proposed capital structure includes a 10.70% authorized return on equity. If approved, the request would add about $1.80 per month, or about 2.2%, to the typical residential customer’s average monthly bill. The $49 million revenue deficiency is detailed below.
Item $ Millions Explanation
1. Investment $22 Net plant (reliability & safety, regulatory
compliance, deliverability): $17
Working capital: $11
Taxes and AFUDC: $(6)
2. Gross Margin 2 Sales mix: $(4)
Reduced miscellaneous revenues: $6
3. O&M 15 Uncollectible accounts expense (reduced
LIHEAP funding): $19
Reduced benefits/increased productivity: $(14)
Gas pipeline integrity and safety: $10
4. Cost of Capital 10 Return on Equity (10.70% vs. 10.50%): $4
Other capitalization costs: $6
Total $49
Ratemaking Existing As Filed After-Tax
Capital Structure (U-16418) Percent of Total Annual Cost Weighted Costs
Long Term Debt 41.12% 39.58% 5.83% 2.31%
Short Term Debt 2.36 2.20 3.91 0.10
Preferred Stock 0.41 0.40 4.46 0.02
Common Equity 40.10 41.55(1) 10.70 4.45
Deferred Taxes 15.50 15.80 0.00 0.00
JDITC/Other 0.51 0.47 8.27 0.02
100.00% 100.00% 6.90%(2)
Rate Base and Return Existing
Percentage (U-16418) As Filed
Rate Base ($ billions) $2.86 $3.07
Return on Rate Base 6.69% 6.90%
Return on Equity 10.50% 10.70%
(1) | Equivalent to 50.96% on financial basis. (2) Equivalent to 9.76% pre-tax basis. |
GAS RATE CASE SCHEDULE
Staff & Intervenors File Testimony February 3, 2012
Rebuttal Testimony February 21, 2012
Self-implementation Date March 1, 2012
Cross of all Witnesses March 12 through March 23
Initial Briefs April 20, 2012
Reply Briefs May 11, 2012
Proposal for Decision June 22, 2012 (Target)
Commission Order Not later than Friday, August 31, 2012
*Gas Rate Case U-16855 can be accessed at the Michigan Public Service Commission’s website.
34
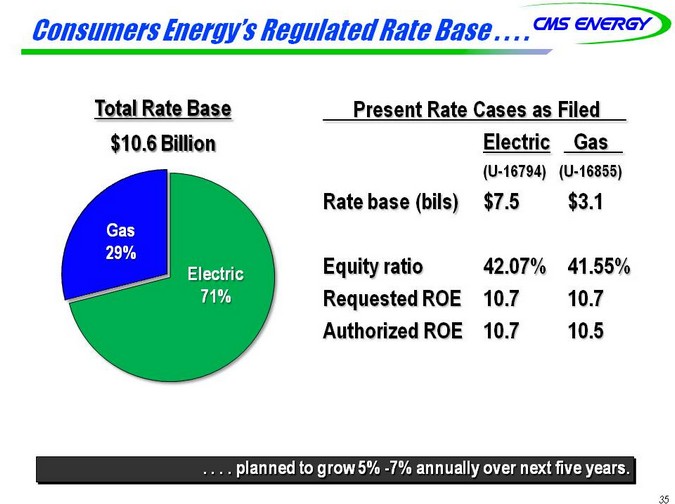
Consumers Energy’s Regulated Rate Base . . . .
Total Rate Base
$10.6 Billion
Gas 29%
Electric 71%
Present Rate Cases as Filed
Electric Gas
(U-16794) (U-16855)
Rate base (bils) $7.5 $3.1
Equity ratio 42.07% 41.55%
Requested ROE 10.7 10.7
Authorized ROE 10.7 10.5
. . . . planned to grow 5% -7% annually over next five years.
35
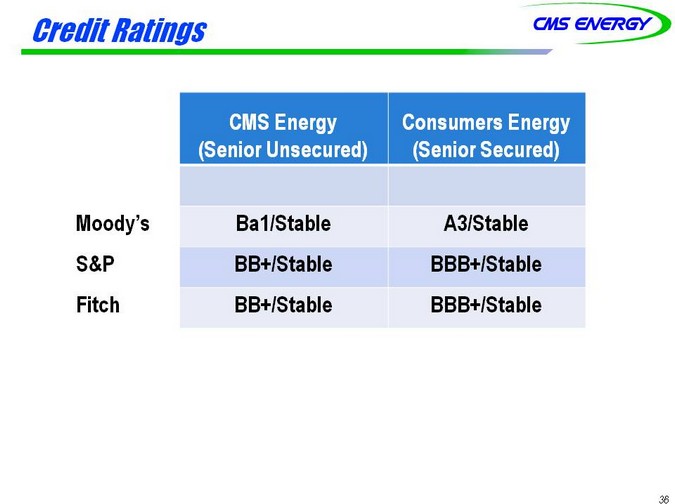
Credit Ratings
CMS Energy Consumers Energy
(Senior Unsecured) (Senior Secured)
Moody’s Ba1/Stable A3/Stable
S&P BB+/Stable BBB+/Stable
Fitch BB+/Stable BBB+/Stable
36
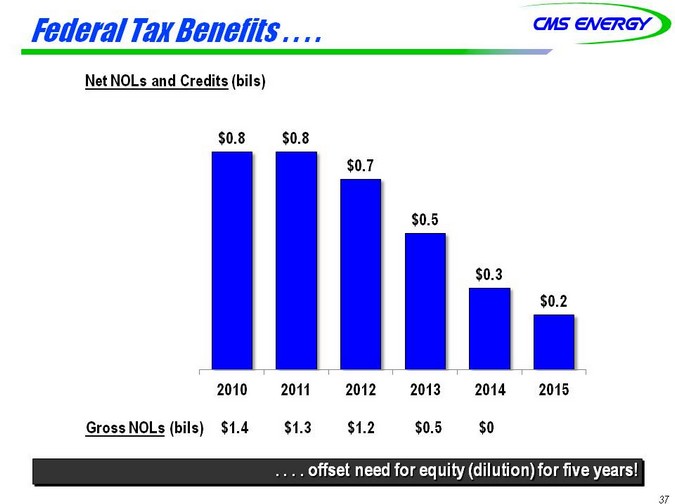
Federal Tax Benefits . . . .
Net NOLs and Credits (bils)
$0.8 $0.8 $0.7
$0.5
$0.3 $0.2
2010 2011 2012 2013 2014 2015
Gross NOLs (bils) $1.4 $1.3 $1.2 $0.5 $0
. . . . offset need for equity (dilution) for five years!
37
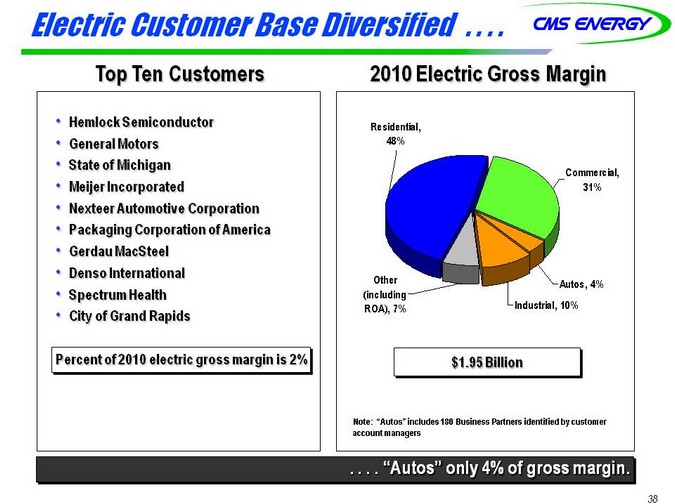
Electric Customer Base Diversified . . . .
Top Ten Customers
• Hemlock Semiconductor
• General Motors
• State of Michigan
• Meijer Incorporated
• Nexteer Automotive Corporation
• Packaging Corporation of America
• Gerdau MacSteel
• Denso International
• Spectrum Health
• City of Grand Rapids
Percent of 2010 electric gross margin is 2%
2010 Electric Gross Margin
Residential, 48%
Commercial, 31%
Other Autos, 4% (including ROA), 7% Industrial, 10%
$1.95 Billion
Note: “Autos” includes 180 Business Partners identified by customer account managers
. . . . “Autos” only 4% of gross margin.
38
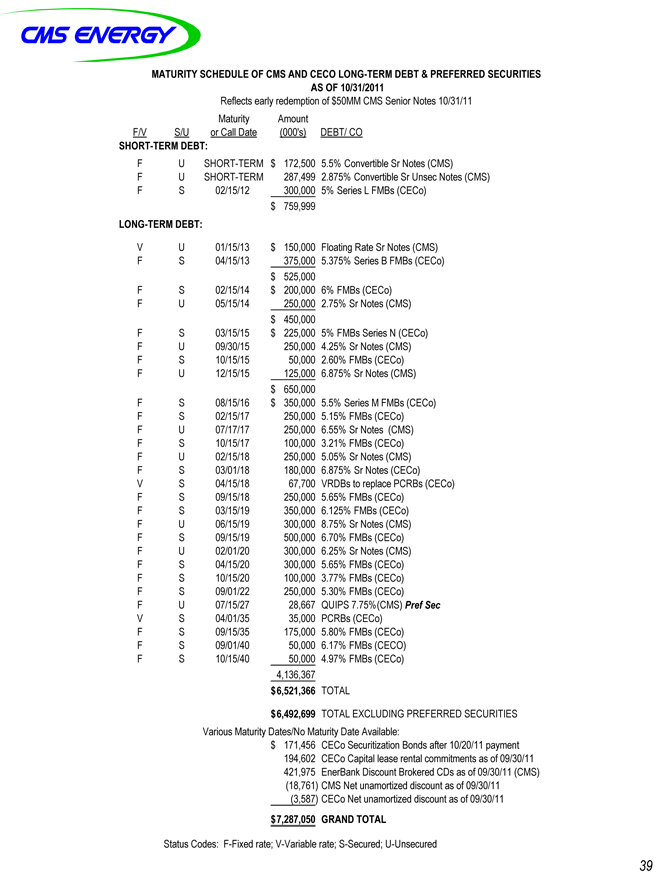
MATURITY SCHEDULE OF CMS AND CECO LONG-TERM DEBT & PREFERRED SECURITIES AS OF 10/31/2011
Reflects early redemption of $50MM CMS Senior Notes 10/31/11
Maturity Amount
F/V S/U or Call Date (000’s) DEBT/ CO
SHORT-TERM DEBT:
F U SHORT-TERM $ 172,500 5.5% Convertible Sr Notes (CMS)
F U SHORT-TERM 287,499 2.875% Convertible Sr Unsec Notes (CMS)
F S 02/15/12 300,000 5% Series L FMBs (CECo)
$ 759,999
LONG-TERM DEBT:
V U 01/15/13 $ 150,000 Floating Rate Sr Notes (CMS)
F S 04/15/13 375,000 5.375% Series B FMBs (CECo)
$ 525,000
F S 02/15/14 $ 200,000 6% FMBs (CECo)
F U 05/15/14 250,000 2.75% Sr Notes (CMS)
$ 450,000
F S 03/15/15 $ 225,000 5% FMBs Series N (CECo)
F U 09/30/15 250,000 4.25% Sr Notes (CMS)
F S 10/15/15 50,000 2.60% FMBs (CECo)
F U 12/15/15 125,000 6.875% Sr Notes (CMS)
$ 650,000
F S 08/15/16 $ 350,000 5.5% Series M FMBs (CECo)
F S 02/15/17 250,000 5.15% FMBs (CECo)
F U 07/17/17 250,000 6.55% Sr Notes (CMS)
F S 10/15/17 100,000 3.21% FMBs (CECo)
F U 02/15/18 250,000 5.05% Sr Notes (CMS)
F S 03/01/18 180,000 6.875% Sr Notes (CECo)
V S 04/15/18 67,700 VRDBs to replace PCRBs (CECo)
F S 09/15/18 250,000 5.65% FMBs (CECo)
F S 03/15/19 350,000 6.125% FMBs (CECo)
F U 06/15/19 300,000 8.75% Sr Notes (CMS)
F S 09/15/19 500,000 6.70% FMBs (CECo)
F U 02/01/20 300,000 6.25% Sr Notes (CMS)
F S 04/15/20 300,000 5.65% FMBs (CECo)
F S 10/15/20 100,000 3.77% FMBs (CECo)
F S 09/01/22 250,000 5.30% FMBs (CECo)
F U 07/15/27 28,667 QUIPS 7.75%(CMS) Pref Sec
V S 04/01/35 35,000 PCRBs (CECo)
F S 09/15/35 175,000 5.80% FMBs (CECo)
F S 09/01/40 50,000 6.17% FMBs (CECO)
F S 10/15/40 50,000 4.97% FMBs (CECo)
4,136,367
$ 6,521,366 TOTAL
$ 6,492,699 TOTAL EXCLUDING PREFERRED SECURITIES
Various Maturity Dates/No Maturity Date Available:
$ 171,456 CECo Securitization Bonds after 10/20/11 payment
194,602 CECo Capital lease rental commitments as of 09/30/11
421,975 EnerBank Discount Brokered CDs as of 09/30/11 (CMS)
(18,761) CMS Net unamortized discount as of 09/30/11
(3,587) CECo Net unamortized discount as of 09/30/11
$ 7,287,050 GRAND TOTAL
Status Codes: F-Fixed rate; V-Variable rate; S-Secured; U-Unsecured
39
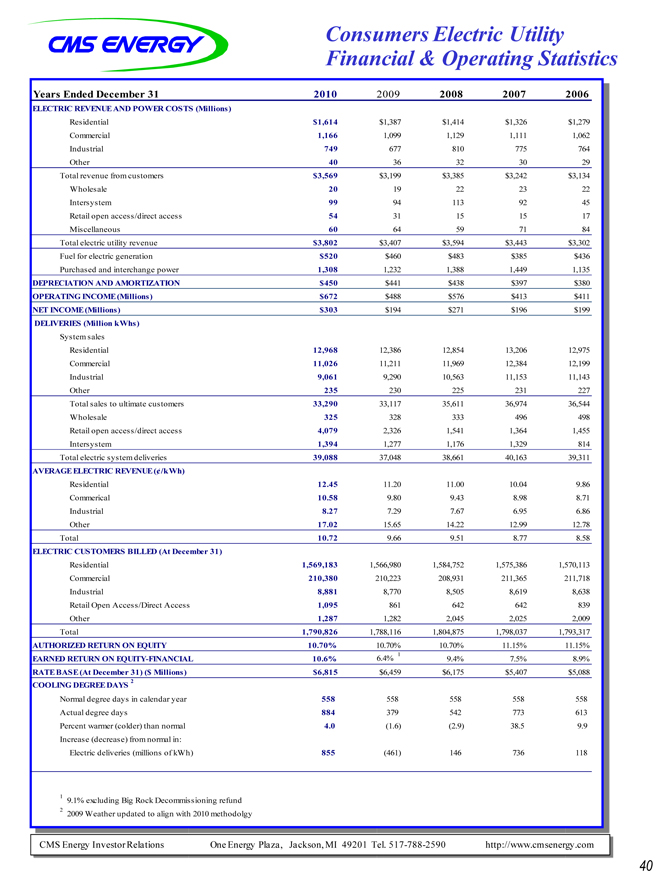
Consumers Electric Utility Financial & Operating Statistics
Years Ended December 31 2010 2009 2008 2007 2006
ELECTRIC REVENUE AND POWER COSTS (Millions)
Residential $1,614 $1,387 $1,414 $1,326 $1,279
Commercial 1,166 1,099 1,129 1,111 1,062
Industrial 749 677 810 775 764
Other 40 36 32 30 29
Total revenue from customers $3,569 $3,199 $3,385 $3,242 $3,134
Wholesale 20 19 22 23 22
Intersystem 99 94 113 92 45
Retail open access/direct access 54 31 15 15 17
Miscellaneous 60 64 59 71 84
Total electric utility revenue $3,802 $3,407 $3,594 $3,443 $3,302
Fuel for electric generation $520 $460 $483 $385 $436
Purchased and interchange power 1,308 1,232 1,388 1,449 1,135
DEPRECIATION AND AMORTIZATION $450 $441 $438 $397 $380
OPERATING INCOME (Millions) $672 $488 $576 $413 $411
NET INCOME (Millions) $303 $194 $271 $196 $199
DELIVERIES (Million kWhs)
System sales
Residential 12,968 12,386 12,854 13,206 12,975
Commercial 11,026 11,211 11,969 12,384 12,199
Industrial 9,061 9,290 10,563 11,153 11,143
Other 235 230 225 231 227
Total sales to ultimate customers 33,290 33,117 35,611 36,974 36,544
Wholesale 325 328 333 496 498
Retail open access/direct access 4,079 2,326 1,541 1,364 1,455
Intersystem 1,394 1,277 1,176 1,329 814
Total electric system deliveries 39,088 37,048 38,661 40,163 39,311
AVERAGE ELECTRIC REVENUE (¢/kWh)
Residential 12.45 11.20 11.00 10.04 9.86
Commerical 10.58 9.80 9.43 8.98 8.71
Industrial 8.27 7.29 7.67 6.95 6.86
Other 17.02 15.65 14.22 12.99 12.78
Total 10.72 9.66 9.51 8.77 8.58
ELECTRIC CUSTOMERS BILLED (At December 31)
Residential 1,569,183 1,566,980 1,584,752 1,575,386 1,570,113
Commercial 210,380 210,223 208,931 211,365 211,718
Industrial 8,881 8,770 8,505 8,619 8,638
Retail Open Access/Direct Access 1,095 861 642 642 839
Other 1,287 1,282 2,045 2,025 2,009
Total 1,790,826 1,788,116 1,804,875 1,798,037 1,793,317
AUTHORIZED RETURN ON EQUITY 10.70% 10.70% 10.70% 11.15% 11.15%
EARNED RETURN ON EQUITY-FINANCIAL 10.6% 6.4% 1 9.4% 7.5% 8.9%
RATE BASE (At December 31) ($ Millions) $6,815 $6,459 $6,175 $5,407 $5,088
COOLING DEGREE DAYS 2
Normal degree days in calendar year 558 558 558 558 558
Actual degree days 884 379 542 773 613
Percent warmer (colder) than normal 4.0 (1.6) (2.9) 38.5 9.9
Increase (decrease) from normal in:
Electric deliveries (millions of kWh) 855 (461) 146 736 118
1 | 9.1% excluding Big Rock Decommissioning refund |
2 | 2009 Weather updated to align with 2010 methodolgy |
CMS Energy Investor Relations One Energy Plaza, Jackson, MI 49201 Tel. 517-788-2590 http://www.cmsenergy.com
40
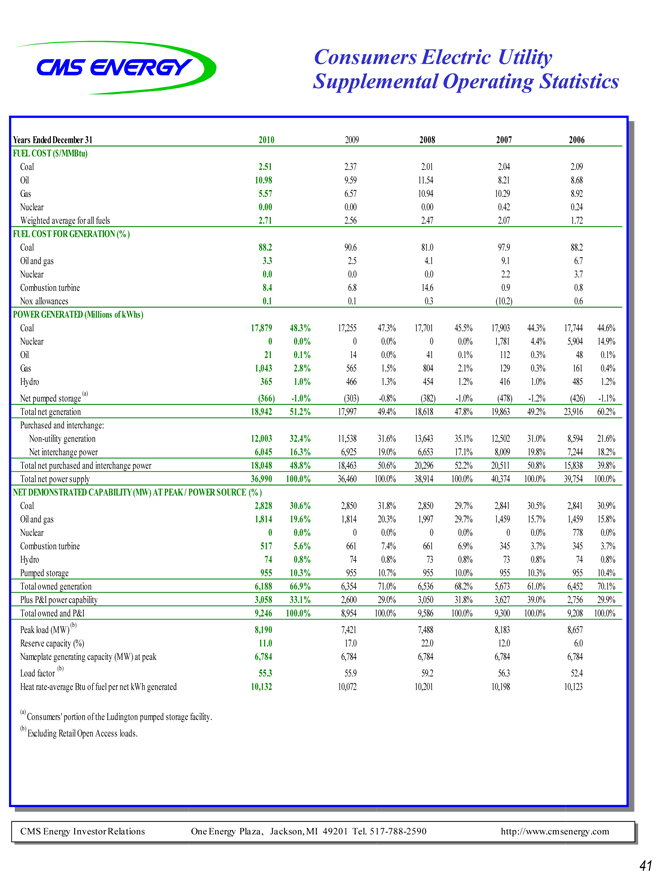
Consumers Electric Utility Supplemental Operating Statistics
Years Ended December 31 2010 2009 2008 2007 2006
FUEL COST ($/MMBtu)
Coal 2.51 2.37 2.01 2.04 2.09
Oil 10.98 9.59 11.54 8.21 8.68
Gas 5.57 6.57 10.94 10.29 8.92
Nuclear 0.00 0.00 0.00 0.42 0.24
Weighted average for all fuels 2.71 2.56 2.47 2.07 1.72
FUEL COST FOR GENERATION (%)
Coal 88.2 90.6 81.0 97.9 88.2
Oil and gas 3.3 2.5 4.1 9.1 6.7
Nuclear 0.0 0.0 0.0 2.2 3.7
Combustion turbine 8.4 6.8 14.6 0.9 0.8
Nox allowances 0.1 0.1 0.3 (10.2) 0.6
POWER GENERATED (Millions of kWhs)
Coal 17,879 48.3% 17,255 47.3% 17,701 45.5% 17,903 44.3% 17,744 44.6%
Nuclear 0 0.0% 0 0.0% 0 0.0% 1,781 4.4% 5,904 14.9%
Oil 21 0.1% 14 0.0% 41 0.1% 112 0.3% 48 0.1%
Gas 1,043 2.8% 565 1.5% 804 2.1% 129 0.3% 161 0.4%
Hydro 365 1.0% 466 1.3% 454 1.2% 416 1.0% 485 1.2%
Net pumped storage (a) (366) -1.0% (303) -0.8% (382) -1.0% (478) -1.2% (426) -1.1%
Total net generation 18,942 51.2% 17,997 49.4% 18,618 47.8% 19,863 49.2% 23,916 60.2%
Purchased and interchange:
Non-utility generation 12,003 32.4% 11,538 31.6% 13,643 35.1% 12,502 31.0% 8,594 21.6%
Net interchange power 6,045 16.3% 6,925 19.0% 6,653 17.1% 8,009 19.8% 7,244 18.2%
Total net purchased and interchange power 18,048 48.8% 18,463 50.6% 20,296 52.2% 20,511 50.8% 15,838 39.8%
Total net power supply 36,990 100.0% 36,460 100.0% 38,914 100.0% 40,374 100.0% 39,754 100.0%
NET DEMONSTRATED CAPABILITY (MW) AT PEAK / POWER SOURCE (%)
Coal 2,828 30.6% 2,850 31.8% 2,850 29.7% 2,841 30.5% 2,841 30.9%
Oil and gas 1,814 19.6% 1,814 20.3% 1,997 29.7% 1,459 15.7% 1,459 15.8%
Nuclear 0 0.0% 0 0.0% 0 0.0% 0 0.0% 778 0.0%
Combustion turbine 517 5.6% 661 7.4% 661 6.9% 345 3.7% 345 3.7%
Hydro 74 0.8% 74 0.8% 73 0.8% 73 0.8% 74 0.8%
Pumped storage 955 10.3% 955 10.7% 955 10.0% 955 10.3% 955 10.4%
Total owned generation 6,188 66.9% 6,354 71.0% 6,536 68.2% 5,673 61.0% 6,452 70.1%
Plus P&I power capability 3,058 33.1% 2,600 29.0% 3,050 31.8% 3,627 39.0% 2,756 29.9%
Total owned and P&I 9,246 100.0% 8,954 100.0% 9,586 100.0% 9,300 100.0% 9,208 100.0%
Peak load (MW) (b) 8,190 7,421 7,488 8,183 8,657
Reserve capacity (%) 11.0 17.0 22.0 12.0 6.0
Nameplate generating capacity (MW) at peak 6,784 6,784 6,784 6,784 6,784
Load factor (b) 55.3 55.9 59.2 56.3 52.4
Heat rate-average Btu of fuel per net kWh generated 10,132 10,072 10,201 10,198 10,123
(a) | Consumers’ portion of the Ludington pumped storage facility. |
(b) | Excluding Retail Open Access loads. |
CMS Energy Investor Relations One Energy Plaza, Jackson, MI 49201 Tel. 517-788-2590 http://www.cmsenergy.com
41
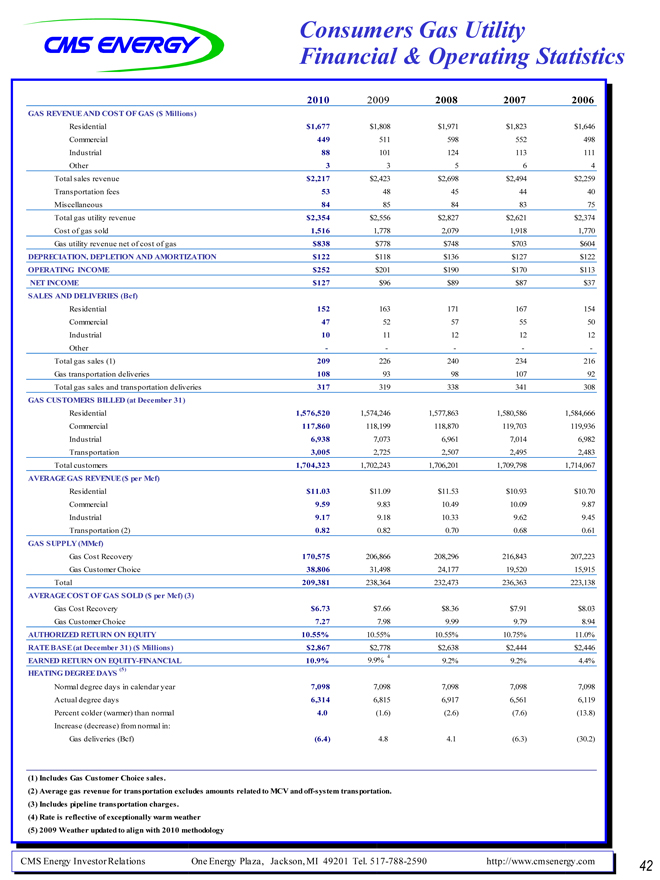
Consumers Gas Utility
Financial & Operating Statistics
2010 2009 2008 2007 2006
GAS REVENUE AND COST OF GAS ($ Millions)
Residential $1,677 $1,808 $1,971 $1,823 $1,646
Commercial 449 511 598 552 498
Industrial 88 101 124 113 111
Other 3 3 5 6 4
Total sales revenue $2,217 $2,423 $2,698 $2,494 $2,259
Transportation fees 53 48 45 44 40
Miscellaneous 84 85 84 83 75
Total gas utility revenue $2,354 $2,556 $2,827 $2,621 $2,374
Cost of gas sold 1,516 1,778 2,079 1,918 1,770
Gas utility revenue net of cost of gas $838 $778 $748 $703 $604
DEPRECIATION, DEPLETION AND AMORTIZATION $122 $118 $136 $127 $122
OPERATING INCOME $252 $201 $190 $170 $113
NET INCOME $127 $96 $89 $87 $37
SALES AND DELIVERIES (Bcf)
Residential 152 163 171 167 154
Commercial 47 52 57 55 50
Industrial 10 11 12 12 12
Other
Total gas sales (1) 209 226 240 234 216
Gas transportation deliveries 108 93 98 107 92
Total gas sales and transportation deliveries 317 319 338 341 308
GAS CUSTOMERS BILLED (at December 31)
Residential 1,576,520 1,574,246 1,577,863 1,580,586 1,584,666
Commercial 117,860 118,199 118,870 119,703 119,936
Industrial 6,938 7,073 6,961 7,014 6,982
Transportation 3,005 2,725 2,507 2,495 2,483
Total customers 1,704,323 1,702,243 1,706,201 1,709,798 1,714,067
AVERAGE GAS REVENUE ($ per Mcf)
Residential $11.03 $11.09 $11.53 $10.93 $10.70
Commercial 9.59 9.83 10.49 10.09 9.87
Industrial 9.17 9.18 10.33 9.62 9.45
Transportation (2) 0.82 0.82 0.70 0.68 0.61
GAS SUPPLY (MMcf)
Gas Cost Recovery 170,575 206,866 208,296 216,843 207,223
Gas Customer Choice 38,806 31,498 24,177 19,520 15,915
Total 209,381 238,364 232,473 236,363 223,138
AVERAGE COST OF GAS SOLD ($ per Mcf) (3)
Gas Cost Recovery $6.73 $7.66 $8.36 $7.91 $8.03
Gas Customer Choice 7.27 7.98 9.99 9.79 8.94
AUTHORIZED RETURN ON EQUITY 10.55% 10.55% 10.55% 10.75% 11.0%
RATE BASE (at December 31) ($ Millions) $2,867 $2,778 $2,638 $2,444 $2,446
EARNED RETURN ON EQUITY-FINANCIAL 10.9% 9.9% 4 9.2% 9.2% 4.4%
HEATING DEGREE DAYS (5)
Normal degree days in calendar year 7,098 7,098 7,098 7,098 7,098
Actual degree days 6,314 6,815 6,917 6,561 6,119
Percent colder (warmer) than normal 4.0 (1.6) (2.6) (7.6) (13.8)
Increase (decrease) from normal in:
Gas deliveries (Bcf) (6.4) 4.8 4.1 (6.3) (30.2)
(1) | Includes Gas Customer Choice sales. |
(2) Average gas revenue for transportation excludes amounts related to MCV and off-system transportation. (3) Includes pipeline transportation charges.
(4) | Rate is reflective of exceptionally warm weather (5) 2009 Weather updated to align with 2010 methodology |
CMS Energy Investor Relations One Energy Plaza, Jackson, MI 49201 Tel. 517-788-2590 http://www.cmsenergy.com
42
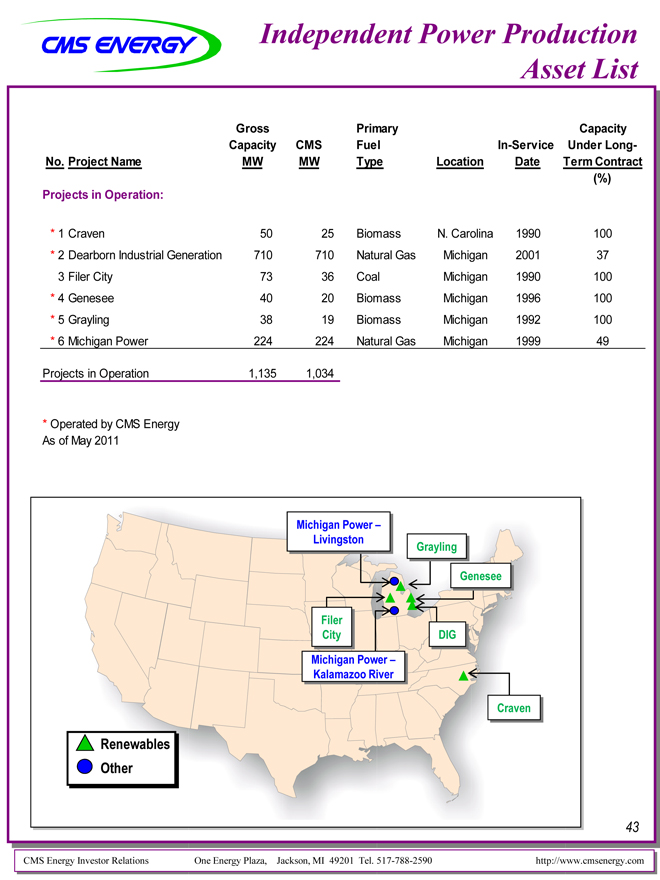
Independent Power Production
Asset List
Gross Primary Capacity
Capacity CMS Fuel In-Service Under Long-
No. Project Name MW MW Type Location Date Term Contract
(%)
Projects in Operation:
* | 1 Craven 50 25 Biomass N. Carolina 1990 100 |
* | 2 Dearborn Industrial Generation 710 710 Natural Gas Michigan 2001 37 |
3 | Filer City 73 36 Coal Michigan 1990 100 |
* | 4 Genesee 40 20 Biomass Michigan 1996 100 |
* | 5 Grayling 38 19 Biomass Michigan 1992 100 |
* | 6 Michigan Power 224 224 Natural Gas Michigan 1999 49 |
Projects in Operation 1,135 1,034
As of May 2011
Michigan Power –Livingston
Grayling
Genesee
Filer
City DIG Michigan Power –Kalamazoo River
Craven
Renewables Other
CMS Energy Investor Relations One Energy Plaza, Jackson, MI 49201 Tel. 517-788-2590 http://www.cmsenergy.com
43

GAAP Reconciliation
CMS Energy
Reconciliation of Gross Operating Cash Flow to GAAP Operating Activities
(unaudited)
(mils)
| | | | | | | | | | | | | | | | | | | | | | | | | | | | |
| | | 2009 | | | 2010 | | | 2011 | | | 2012 | | | 2013 | | | 2014 | | | 2015 | |
Consumers Operating Income + Depreciation & Amortization | | $ | 1,248 | | | $ | 1,498 | | | $ | 1,530 | | | $ | 1,601 | | | $ | 1,657 | | | $ | 1,757 | | | $ | 1,872 | |
Enterprises Project Cash Flows | | | 16 | | | | 39 | | | | 25 | | | | 35 | | | | 47 | | | | 47 | | | | 46 | |
| | | | | | | | | | | | | | | | | | | | | | | | | | | | |
Gross Operating Cash Flow | | $ | 1,264 | | | $ | 1,537 | | | $ | 1,555 | | | $ | 1,636 | | | $ | 1,704 | | | $ | 1,804 | | | $ | 1,918 | |
| | | | | | | |
Other operating activities including taxes, interest payments and working capital | | | (416 | ) | | | (578 | ) | | | (310 | ) | | | (406 | ) | | | (472 | ) | | | (439 | ) | | | (835 | ) |
| | | | | | | | | | | | | | | | | | | | | | | | | | | | |
Net cash provided by operating activities | | $ | 848 | | | $ | 959 | | | $ | 1,170 | | | $ | 1,230 | | | $ | 1,232 | | | $ | 1,365 | | | $ | 1,083 | |
| | | | | | | | | | | | | | | | | | | | | | | | | | | | |
2009-15 OCF
CMS ENERGY CORPORATION
Earnings Per Share By Year GAAP Reconciliation
(Unaudited)
| | | | | | | | | | | | | | | | | | | | | | | | | | | | | | | | |
| | | 2003 | | | 2004 | | | 2005 | | | 2006 | | | 2007 | | | 2008 | | | 2009 | | | 2010 | |
Reported earnings (loss) per share - GAAP | | ($ | 0.30 | ) | | $ | 0.64 | | | ($ | 0.44 | ) | | ($ | 0.41 | ) | | ($ | 1.02 | ) | | $ | 1.20 | | | $ | 0.91 | | | $ | 1.28 | |
| | | | | | | | | | | | | | | | | | | | | | | | | | | | | | | | |
After-tax items: | | | | | | | | | | | | | | | | | | | | | | | | | | | | | | | | |
Electric and gas utility | | | 0.21 | | | | (0.39 | ) | | | — | | | | — | | | | (0.07 | ) | | | 0.05 | | | | 0.33 | | | | 0.03 | |
Enterprises | | | 0.74 | | | | 0.62 | | | | 0.04 | | | | (0.02 | ) | | | 1.25 | | | | (0.02 | ) | | | 0.09 | | | | (0.03 | ) |
Corporate interest and other | | | 0.16 | | | | (0.03 | ) | | | 0.04 | | | | 0.27 | | | | (0.32 | ) | | | (0.02 | ) | | | 0.01 | | | | * | |
Discontinued operations (income) loss | | | (0.16 | ) | | | 0.02 | | | | (0.07 | ) | | | (0.03 | ) | | | 0.40 | | | | (* | ) | | | (0.08 | ) | | | 0.08 | |
Asset impairment charges, net | | | — | | | | — | | | | 1.82 | | | | 0.76 | | | | 0.60 | | | | — | | | | — | | | | — | |
Cumulative accounting changes | | | 0.16 | | | | 0.01 | | | | — | | | | — | | | | — | | | | — | | | | — | | | | — | |
| | | | | | | | | | | | | | | | | | | | | | | | | | | | | | | | |
Adjusted earnings per share, including MTM - non-GAAP | | $ | 0.81 | | | $ | 0.87 | | | $ | 1.39 | | | $ | 0.57 | | | $ | 0.84 | | | $ | 1.21 | (a) | | $ | 1.26 | | | $ | 1.36 | |
Mark-to-market impacts | | | | | | | 0.03 | | | | (0.43 | ) | | | 0.51 | | | | | | | | | | | | | | | | | |
| | | | | | | | | | | | | | | | | | | | | | | | | | | | | | | | |
Adjusted earnings per share, excluding MTM - non-GAAP | | | NA | | | $ | 0.90 | | | $ | 0.96 | | | $ | 1.08 | | | | NA | | | | NA | | | | NA | | | | NA | |
| | | | | | | | | | | | | | | | | | | | | | | | | | | | | | | | |
| * | Less than $500 thousand or $0.01 per share. |
| (a) | $1.25 excluding discontinued Exeter operations and accounting changes related to convertible debt and restricted stock. |
2003-10 EPS
CMS ENERGY CORPORATION
Earnings By Quarter and Year GAAP Reconciliation
(Unaudited)
| | | | | | | | | | | | | | | | | | | | |
(In millions, except per share amounts) | | 2010 | |
| | | 1Q | | | 2Q | | | 3Q | | | 4Q | | | YTD Dec | |
Reported net income - GAAP | | $ | 85 | | | $ | 80 | | | $ | 134 | | | $ | 25 | | | $ | 324 | |
| | | | | | | | | | | | | | | | | | | | |
After-tax items: | | | | | | | | | | | | | | | | | | | | |
Electric and gas utility | | | 6 | | | | * | | | | — | | | | — | | | | 6 | |
Enterprises | | | 1 | | | | (31 | ) | | | (2 | ) | | | 24 | | | | (8 | ) |
Corporate interest and other | | | * | | | | * | | | | — | | | | (* | ) | | | * | |
Discontinued operations loss | | | 1 | | | | 16 | | | | * | | | | 6 | | | | 23 | |
| | | | | | | | | | | | | | | | | | | | |
Adjusted income - non-GAAP | | $ | 93 | | | $ | 65 | | | $ | 132 | | | $ | 55 | | | $ | 345 | |
| | | | | | | | | | | | | | | | | | | | |
Average shares outstanding, basic | | | 228.0 | | | | 228.2 | | | | 229.0 | | | | 240.7 | | | | 231.5 | |
Average shares outstanding, diluted | | | 246.5 | | | | 247.6 | | | | 254.7 | | | | 258.4 | | | | 252.9 | |
| | | | | | | | | | | | | | | | | | | | |
Reported earnings per share - GAAP | | $ | 0.34 | | | $ | 0.32 | | | $ | 0.53 | | | $ | 0.09 | | | $ | 1.28 | |
| | | | | | | | | | | | | | | | | | | | |
After-tax items: | | | | | | | | | | | | | | | | | | | | |
Electric and gas utility | | | 0.03 | | | | * | | | | — | | | | — | | | | 0.03 | |
Enterprises | | | * | | | | (0.13 | ) | | | (0.01 | ) | | | 0.10 | | | | (0.03 | ) |
Corporate interest and other | | | * | | | | * | | | | — | | | | (* | ) | | | * | |
Discontinued operations loss | | | 0.01 | | | | 0.07 | | | | * | | | | 0.02 | | | | 0.08 | |
| | | | | | | | | | | | | | | | | | | | |
Adjusted earnings per share - non-GAAP | | $ | 0.38 | | | $ | 0.26 | | | $ | 0.52 | | | $ | 0.21 | | | $ | 1.36 | |
| | | | | | | | | | | | | | | | | | | | |
| | | | | | | | | | | | |
| |
(In millions, except per share amounts) | | 2011 | |
| | | 1Q | | | 2Q | | | 3Q | |
Reported net income - GAAP | | $ | 135 | | | $ | 100 | | | $ | 139 | |
| | | | | | | | | | | | |
After-tax items: | | | | | | | | | | | | |
Electric and gas utility | | | — | | | | — | | | | — | |
Enterprises | | | * | | | | (28 | ) | | | * | |
Corporate interest and other | | | — | | | | (4 | ) | | | — | |
Discontinued operations (income) loss | | | (2 | ) | | | * | | | | * | |
| | | | | | | | | | | | |
Adjusted income - non-GAAP | | $ | 133 | | | $ | 68 | | | $ | 139 | |
| | | | | | | | | | | | |
Average shares outstanding, basic | | | 250.0 | | | | 250.3 | | | | 251.3 | |
Average shares outstanding, diluted | | | 261.7 | | | | 261.9 | | | | 263.9 | |
| | | | | | | | | | | | |
Reported earnings per share - GAAP | | $ | 0.52 | | | $ | 0.38 | | | $ | 0.53 | |
| | | | | | | | | | | | |
After-tax items: | | | | | | | | | | | | |
Electric and gas utility | | | — | | | | — | | | | — | |
Enterprises | | | * | | | | (0.11 | ) | | | * | |
Corporate interest and other | | | — | | | | (0.01 | ) | | | — | |
Discontinued operations (income) loss | | | (0.01 | ) | | | * | | | | * | |
| | | | | | | | | | | | |
Adjusted earnings per share - non-GAAP | | $ | 0.51 | | | $ | 0.26 | | | $ | 0.53 | |
| | | | | | | | | | | | |
Note: Year-to-date (YTD) EPS may not equal sum of quarters due to share count differences.
* Less than $500 thousand or $0.01 per share.
2011 A-1
CMS Energy Corporation
Earnings Segment Results GAAP Reconciliation
(Unaudited)
| | | | | | | | | | | | | | | | |
| | | Three Months Ended | | | Nine Months Ended | |
September 30 | | 2011 | | | 2010 | | | 2011 | | | 2010 | |
Electric Utility | | | | | | | | | | | | | | | | |
Reported | | $ | 0.61 | | | $ | 0.61 | | | $ | 1.18 | | | $ | 1.12 | |
Downsizing Program | | | — | | | | — | | | | — | | | | 0.02 | |
| | | | | | | | | | | | | | | | |
Adjusted | | $ | 0.61 | | | $ | 0.61 | | | $ | 1.18 | | | $ | 1.14 | |
| | | | | | | | | | | | | | | | |
Gas Utility | | | | | | | | | | | | | | | | |
Reported | | $ | (0.02 | ) | | $ | 0.01 | | | $ | 0.34 | | | $ | 0.28 | |
Downsizing Program | | | — | | | | — | | | | — | | | | 0.01 | |
| | | | | | | | | | | | | | | | |
Adjusted | | $ | (0.02 | ) | | $ | 0.01 | | | $ | 0.34 | | | $ | 0.29 | |
| | | | | | | | | | | | | | | | |
Enterprises | | | | | | | | | | | | | | | | |
Reported | | $ | 0.02 | | | $ | 0.04 | | | $ | 0.14 | | | $ | 0.21 | |
Tax Changes | | | — | | | | — | | | | (0.11 | ) | | | — | |
Asset Sales Gains and Other | | | * | | | | (0.01 | ) | | | * | | | | (0.13 | ) |
| | | | | | | | | | | | | | | | |
Adjusted | | $ | 0.02 | | | $ | 0.03 | | | $ | 0.03 | | | $ | 0.08 | |
| | | | | | | | | | | | | | | | |
Corporate Interest and Other | | | | | | | | | | | | | | | | |
Reported | | $ | (0.08 | ) | | $ | (0.13 | ) | | $ | (0.24 | ) | | $ | (0.35 | ) |
Tax Changes | | | — | | | | — | | | | (0.01 | ) | | | — | |
Asset Sales Gains and Other | | | — | | | | — | | | | — | | | | * | |
| | | | | | | | | | | | | | | | |
Adjusted | | $ | (0.08 | ) | | $ | (0.13 | ) | | $ | (0.25 | ) | | $ | (0.35 | ) |
| | | | | | | | | | | | | | | | |
Discontinued Operations | | | | | | | | | | | | | | | | |
Reported | | $ | (* | ) | | $ | (* | ) | | $ | 0.01 | | | $ | (0.07 | ) |
Discontinued Operations (Income) Loss | | | * | | | | * | | | | (0.01 | ) | | | 0.07 | |
| | | | | | | | | | | | | | | | |
Adjusted | | $ | — | | | $ | — | | | $ | — | | | $ | — | |
| | | | | | | | | | | | | | | | |
Totals | | | | | | | | | | | | | | | | |
Reported | | $ | 0.53 | | | $ | 0.53 | | | $ | 1.43 | | | $ | 1.19 | |
Discontinued Operations (Income) Loss | | | * | | | | * | | | | (0.01 | ) | | | 0.07 | |
Downsizing Program | | | — | | | | — | | | | — | | | | 0.03 | |
Tax Changes | | | — | | | | — | | | | (0.12 | ) | | | — | |
Asset Sales Gains and Other | | | * | | | | (0.01 | ) | | | * | | | | (0.13 | ) |
| | | | | | | | | | | | | | | | |
Adjusted | | $ | 0.53 | | | $ | 0.52 | | | $ | 1.30 | | | $ | 1.16 | |
| | | | | | | | | | | | | | | | |
Average Common Shares Outstanding - Diluted (in millions) | | | 263.9 | | | | 254.7 | | | | 262.3 | | | | 249.8 | |
| | | | | | | | | | | | | | | | |
| * | Less than $0.01 per share. |
2011 A-2
Consumers Energy
2011 Forecasted Cash Flow GAAP Reconciliation (in millions) (unaudited)
| | | | | | | | | | | | | | | | | | | | | | | | | | | | | | | | | | | | | | |
| | | | Reclassifications From Sources and Uses to Statement of Cash Flows | | | |
Presentation Sources and Uses | | | Tax
Sharing
Operating | | | Interest
Payments
as Operating | | | Other Working
Capital
as Investing | | | Capital
Lease Pymts
as Financing | | | Securitization
Debt Pymts
as Financing | | | Preferred
Dividends
as Financing | | | Common
Dividends
as Financing | | | Consolidated Statements of Cash Flows |
Description | | non-GAAP
Amount | | | | | | | | | | GAAP
Amount | | | Description |
Cash at year end 2010 | | $ | 71 | | | $ | — | | | $ | — | | | $ | — | | | $ | — | | | $ | — | | | $ | — | | | $ | — | | | $ | 71 | | | Cash at year end 2010 |
| | | | | | | | | | |
Sources | | | | | | | | | | | | | | | | | | | | | | | | | | | | | | | | | | | | | | |
Operating | | $ | 1,530 | | | | | | | | | | | | | | | | | | | | | | | | | | | | | | | | | | | |
Other working capital | | | 30 | | | | | | | | | | | | | | | | | | | | | | | | | | | | | | | | | | | Net cash provided by |
| | | | | | | | | | | | | | | | | | | | | | | | | | | | | | | | | | | | | | |
Sources | | $ | 1,560 | | | $ | 25 | | | $ | (233 | ) | | $ | 25 | | | $ | 23 | | | $ | 37 | | | $ | — | | | $ | — | | | $ | 1,437 | | | operating activities |
| | | | | | | | | | |
Uses | | | | | | | | | | | | | | | | | | | | | | | | | | | | | | | | | | | | | | |
Interest and preferred dividends | | $ | (235 | ) | | | | | | | | | | | | | | | | | | | | | | | | | | | | | | | | | | |
Capital expenditures | | | (1,000 | ) | | | | | | | | | | | | | | | | | | | | | | | | | | | | | | | | | | |
Dividends/tax sharing to CMS | | | (350 | ) | | | | | | | | | | | | | | | | | | | | | | | | | | | | | | | | | | Net cash provided by |
| | | | | | | | | | | | | | | | | | | | | | | | | | | | | | | | | | | | | | |
Uses | | $ | (1,585 | ) | | $ | (25 | ) | | $ | 233 | | | $ | (25 | ) | | $ | — | | | $ | — | | | $ | 2 | | | $ | 375 | | | $ | (1,025 | ) | | investing activities |
| | | | | | | | | | | | | | | | | | | | | | | | | | | | | | | | | | | | | | Cash flow from |
| | | | | | | | | | | | | | | | | | | | | | | | | | | | | | | | | | | | | | |
Cash flow | | $ | (25 | ) | | $ | — | | | $ | — | | | $ | — | | | $ | 23 | | | $ | 37 | | | $ | 2 | | | $ | 375 | | | $ | 412 | | | operating and |
| | | | | | | | | | | | | | | | | | | | | | | | | | | | | | | | | | | | | | investing activities |
| | | | | | | | | | |
Financing | | | | | | | | | | | | | | | | | | | | | | | | | | | | | | | | | | | | | | |
Equity | | $ | 125 | | | | | | | | | | | | | | | | | | | | | | | | | | | | | | | | | | | |
New Issues | | | — | | | | | | | | | | | | | | | | | | | | | | | | | | | | | | | | | | | |
Retirements | | | — | | | | | | | | | | | | | | | | | | | | | | | | | | | | | | | | | | | |
Net short-term financing & other | | | (46 | ) | | | | | | | | | | | | | | | | | | | | | | | | | | | | | | | | | | Net cash provided by |
| | | | | | | | | | | | | | | | | | | | | | | | | | | | | | | | | | | | | | |
Financing | | $ | 79 | | | $ | — | | | $ | — | | | $ | — | | | $ | (23 | ) | | $ | (37 | )�� | | $ | (2 | ) | | $ | (375 | ) | | $ | (358 | ) | | financing activities |
| | | | | | | | | | | | | | | | | | | | | | | | | | | | | | | | | | | | | | |
Net change in cash | | $ | 54 | | | $ | — | | | $ | — | | | $ | — | | | $ | — | | | $ | — | | | $ | — | | | $ | — | | | $ | 54 | | | Net change in cash |
| | | | | | | | | | | | | | | | | | | | | | | | | | | | | | | | | | | | | | |
Cash at year end 2011 | | $ | 125 | | | $ | — | | | $ | — | | | $ | — | | | $ | — | | | $ | — | | | $ | — | | | $ | — | | | $ | 125 | | | Cash at year end 2011 |
| | | | | | | | | | | | | | | | | | | | | | | | | | | | | | | | | | | | | | |
2011 A-3
CMS Energy Parent
2011 Forecasted Cash Flow GAAP Reconciliation (in millions) (unaudited)
| | | | | | | | | | | | | | | | | | | | | | | | | | | | | | |
Presentation Sources and Uses | | | | | Reclassifications From Sources and Uses to Statement of Cash Flows | | | | | | |
Description | | non-GAAP
Amount | | | Interest
Payments
as Operating | | | Overheads &
Tax Payments
as Operating | | | Other
Uses (a)
as Operating | | | Preferred
Dividends
as Financing | | | Cash From
Consolidated
Companies | | | Consolidated Statements of Cash Flows |
| | | | | | | | GAAP
Amount | | | Description |
Cash at year end 2010 | | $ | 163 | | | $ | — | | | $ | — | | | $ | — | | | $ | — | | | $ | 13 | | | $ | 176 | | | Cash at year end 2010 |
Sources | | | | | | | | | | | | | | | | | | | | | | | | | | | | | | |
Consumers Energy dividends/tax sharing | | $ | 350 | | | | | | | | | | | | | | | | | | | | | | | | | | | |
Enterprises | | | 25 | | | | | | | | | | | | | | | | | | | | | | | | | | | Net cash provided by |
| | | | | | | | | | | | | | | | | | | | | | | | | | | | | | |
Sources | | $ | 375 | | | $ | (130 | ) | | $ | (15 | ) | | $ | (50 | ) | | $ | — | | | $ | 5 | | | $ | 185 | | | operating activities |
Uses | | | | | | | | | | | | | | | | | | | | | | | | | | | | | | |
Interest and preferred dividends | | $ | (130 | ) | | | | | | | | | | | | | | | | | | | | | | | | | | |
Overhead and Federal tax payments | | | (15 | ) | | | | | | | | | | | | | | | | | | | | | | | | | | |
Equity infusions | | | (125 | ) | | | | | | | | | | | | | | | | | | | | | | | | | | Net cash provided by |
| | | | | | | | | | | | | | | | | | | | | | | | | | | | | | |
Uses (a) | | $ | (320 | ) | | $ | 130 | | | $ | 15 | | | $ | 50 | | | $ | — | | | $ | (82 | ) | | $ | (207 | ) | | investing activities Cash flow from |
| | | | | | | | | | | | | | | | | | | | | | | | | | | | | | |
Cash flow | | $ | 55 | | | $ | — | | | $ | — | | | $ | — | | | $ | — | | | $ | (77 | ) | | $ | (22 | ) | | operating andinvesting activities |
Financing anddividends | | | | | | | | | | | | | | | | | | | | | | | | | | | | | | |
New Issues | | $ | 250 | | | | | | | | | | | | | | | | | | | | | | | | | | | |
Retirements | | | (200 | ) | | | | | | | | | | | | | | | | | | | | | | | | | | |
Equity programs (DRP, continuous equity) | | | 29 | | | | | | | | | | | | | | | | | | | | | | | | | | | |
Net short-term financing & other | | | (9 | ) | | | | | | | | | | | | | | | | | | | | | | | | | | |
Common dividend | | | (210 | ) | | | | | | | | | | | | | | | | | | | | | | | | | | Net cash provided by |
| | | | | | | | | | | | | | | | | | | | | | | | | | | | | | |
Financing | | $ | (140 | ) | | $ | — | | | $ | — | | | $ | — | | | $ | — | | | $ | 82 | | | $ | (58 | ) | | financing activities |
| | | | | | | | | | | | | | | | | | | | | | | | | | | | | | |
| | | | | | | | | | | | | | | | | | | | | | | | | | | | | | |
Net change in cash | | $ | (85 | ) | | $ | — | | | $ | — | | | $ | — | | | $ | — | | | $ | 5 | | | $ | (80 | ) | | Net change in cash |
| | | | | | | | | | | | | | | | | | | | | | | | | | | | | | |
| | | | | | | | | | | | | | | | | | | | | | | | | | | | | | |
Cash at year end 2011 | | $ | 78 | | | $ | — | | | $ | — | | | $ | — | | | $ | — | | | $ | 18 | | | $ | 96 | | | Cash at year end 2011 |
| | | | | | | | | | | | | | | | | | | | | | | | | | | | | | |
(a) Includes other and roundings | | | | | | | | | | | | | | | | | | | | | | | | | | | | | | |
2011 A-4
Consolidated CMS Energy
2011 Forecasted Consolidation of Consumers Energy and CMS Energy Parent Statements of Cash Flow (in millions) (unaudited)
| | | | | | | | | | | | | | | | | | | | | | | | | | |
| | | | | | | | | Eliminations/Reclassifications to Arrive at the Consolidated
Statement of Cash Flows | | | | | | |
Statements of Cash Flows | | | Consumers
Common Dividend
as Financing | | | Consumers
Preferred Dividend
as Operating | | | Equity
Infusions to
Consumers | | | Consolidated Statements of Cash Flow |
Description | | Consumers
Amount | | | CMS Parent
Amount | | | | | | Amount | | | Description |
Cash at year end 2010 | | $ | 71 | | | $ | 176 | | | $ | — | | | $ | — | | | $ | — | | | $ | 247 | | | Cash at year end 2010 |
| | | | | | | |
Net cash provided by operating activities | | $ | 1,437 | | | $ | 185 | | | $ | (375 | ) | | $ | (2 | ) | | $ | — | | | $ | 1,245 | | | Net cash provided by
operating activities |
| | | | | | | |
Net cash provided by investing activities | | | (1,025 | ) | | | (207 | ) | | | — | | | | — | | | | 125 | | | | (1,107 | ) | | Net cash provided by
investing activities |
| | | | | | | | | | | | | | | | | | | | | | | | | | |
Cash flow from operating and investing activities | | $ | 412 | | | $ | (22 | ) | | $ | (375 | ) | | $ | (2 | ) | | $ | 125 | | | $ | 138 | | | Cash flow from
operating and
investing activities |
| | | | | | | |
Net cash provided by financing activities | | $ | (358 | ) | | $ | (58 | ) | | $ | 375 | | | $ | 2 | | | $ | (125 | ) | | $ | (164 | ) | | Net cash provided by
financing activities |
| | | | | | | | | | | | | | | | | | | | | | | | | | |
Net change in cash | | $ | 54 | | | $ | (80 | ) | | $ | — | | | $ | — | | | $ | — | | | $ | (26 | ) | | Net change in cash |
| | | | | | | | | | | | | | | | | | | | | | | | | | |
Cash at year end 2011 | | $ | 125 | | | $ | 96 | | | $ | — | | | $ | — | | | $ | — | | | $ | 221 | | | Cash at year end 2011 |
| | | | | | | | | | | | | | | | | | | | | | | | | | |
2011 A-5