Exhibit 99.2
CMS ENERGY
Growing Forward
J.P. Morgan SMid Cap Conference
December 1, 2011
This presentation is made as of the date hereof and contains “forward-looking statements” as defined in Rule 3b-6 of the Securities Exchange Act of 1934, as amended, Rule 175 of the Securities Act of 1933, as amended, and relevant legal decisions. The forward-looking statements are subject to risks and uncertainties. They should be read in conjunction with “FORWARD-LOOKING STATEMENTS AND INFORMATION” and “RISK FACTORS” sections of CMS Energy’s and Consumers Energy’s Form 10-K for the year ended December 31 and as updated in subsequent 10-Qs. CMS Energy’s and Consumers Energy’s “FORWARD-LOOKING
STATEMENTS AND INFORMATION” and “RISK FACTORS” sections are incorporated herein by reference and discuss important factors that could cause CMS Energy’s and Consumers Energy’s results to differ materially from those anticipated in such statements. CMS Energy and Consumers Energy undertake no obligation to update any of the information presented herein to reflect facts, events or circumstances after the date hereof.
The presentation also includes non-GAAP measures when describing CMS Energy’s results of operations and financial performance. A reconciliation of each of these measures to the most directly comparable GAAP measure is included in the appendix and posted on our website at www.cmsenergy.com.
Reported earnings could vary because of several factors, such as legacy issues associated with prior asset sales. Because of those uncertainties, the company is not providing reported earnings guidance.
Investment Consideration . . . .
• Dividend yield (4%) and EPS growth (5% to 7%) provide attractive total return
• “Needed” Utility investment with transparent, self-funding, long-term earnings growth
• Constructive regulatory environment and good energy law support Utility investment in Michigan
. . . . predictable, affordable, and sustainable.
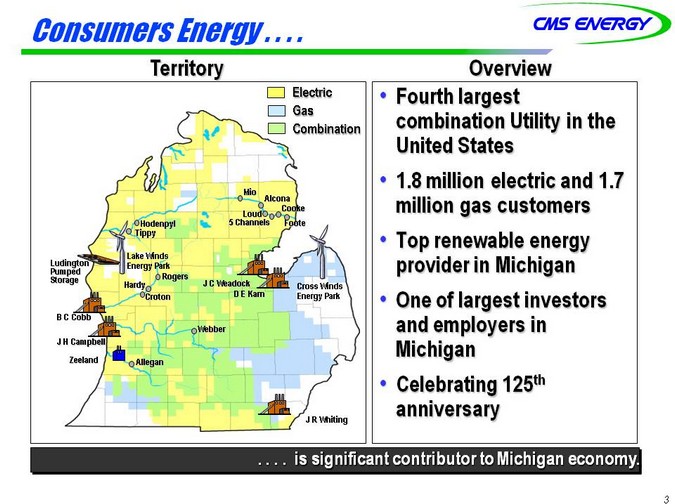
Consumers Energy . . . .
Territory Overview
Electric Gas Combination
Mio
Alcona Cooke Loud Hodenpyl 5 Channels Foote Tippy
Lake Winds Energy Park Ludington Pumped Storage Rogers
Hardy J C Weadock Cross Winds Croton D E Karn Energy Park B C Cobb Webber J H Campbell Zeeland Allegan
J R Whiting
• Fourth largest combination Utility in the United States
• 1.8 million electric and 1.7 million gas customers
• Top renewable energy provider in Michigan
• One of largest investors and employers in Michigan
• Celebrating 125th anniversary
. . . . is significant contributor to Michigan economy.
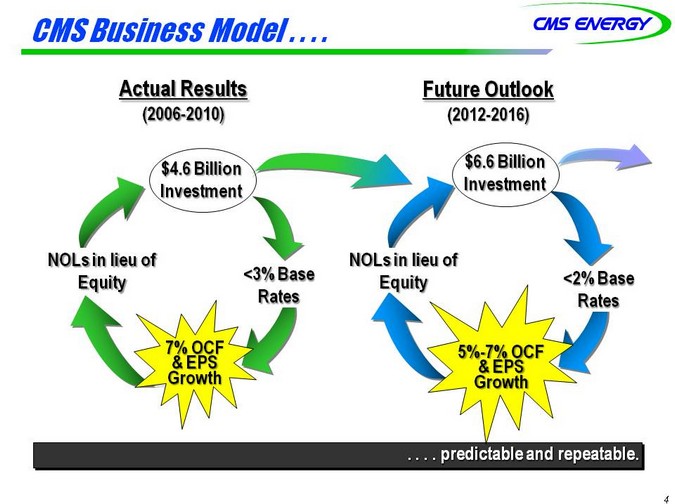
CMS Business Model . . . .
Actual Results Future Outlook
(2006-2010) (2012-2016)
$4.6 Billion $6.6 Billion Investment Investment
NOLs in lieu of NOLs in lieu of
Equity <3% Base Equity <2% Base Rates Rates
7% OCF 5%-7% OCF
& EPS & EPS
Growth Growth
. . . . predictable and repeatable.
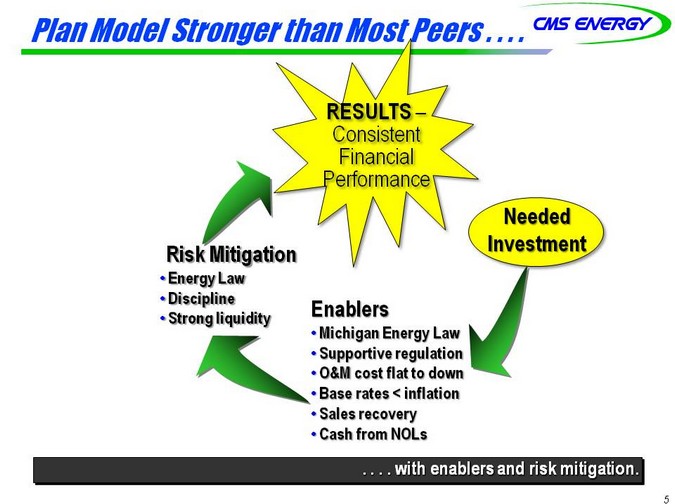
Plan Model Stronger than Most Peers . . . .
RESULTS –
Consistent Financial Performance
Needed Investment Risk Mitigation
• Energy Law
• Discipline Enablers
• Strong liquidity
• Michigan Energy Law
• Supportive regulation
• O&M cost flat to down
• Base rates < inflation
• Sales recovery
• Cash from NOLs
. . . . with enablers and risk mitigation.
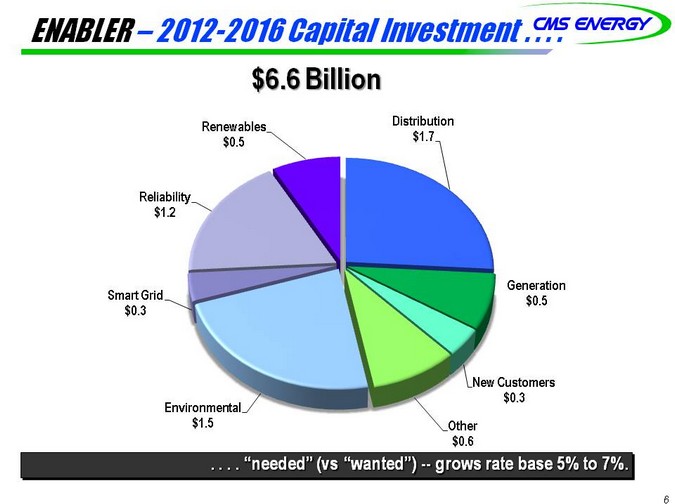
ENABLER – 2012-2016 Capital Investment . . . .
$6.6 Billion
Renewables Distribution $0.5 $1.7
Reliability $1.2
Generation Smart Grid $0.5 $0.3
New Customers $0.3 Environmental $1.5 Other $0.6
. . . . “needed” (vs “wanted”) — grows rate base 5% to 7%.

INVESTMENT – Reliability . . . .
• Electric—$800 million
• Strengthen circuits and substations
• Replace poles
• Upgrade Ludington Pumped Storage Plant
• Gas—$400 million
• Main replacement program
• Enhance transmission and storage systems
. .. . . reduces outages and improves customer satisfaction.
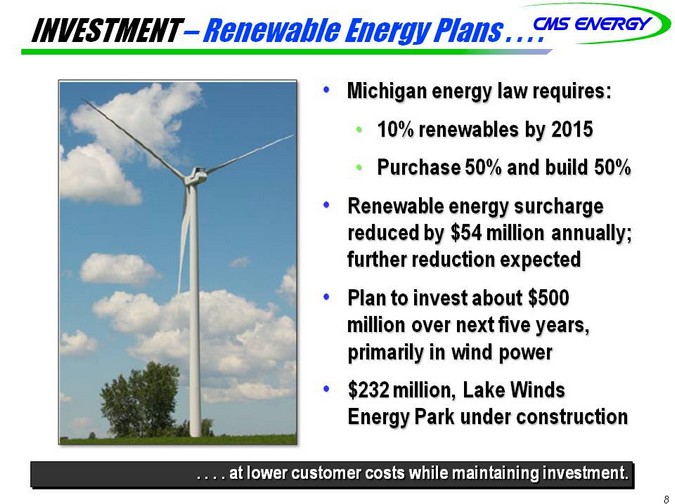
INVESTMENT – Renewable Energy Plans . . . .
• Michigan energy law requires:
• 10% renewables by 2015
• Purchase 50% and build 50%
• Renewable energy surcharge reduced by $54 million annually; further reduction expected
• Plan to invest about $500 million over next five years, primarily in wind power
• $232 million, Lake Winds Energy Park under construction
. . . . at lower customer costs while maintaining investment.
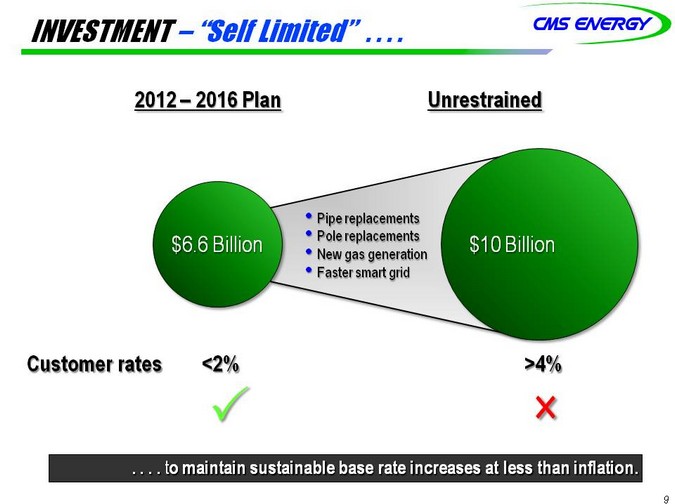
INVESTMENT – “Self Limited” . . . .
2012 – 2016 Plan Unrestrained
• Pipe replacements
$6.6 Billion • Pole replacements $10 Billion
• New gas generation
• Faster smart grid
Customer rates <2% >4%
. . . . to maintain sustainable base rate increases at less than inflation.
9
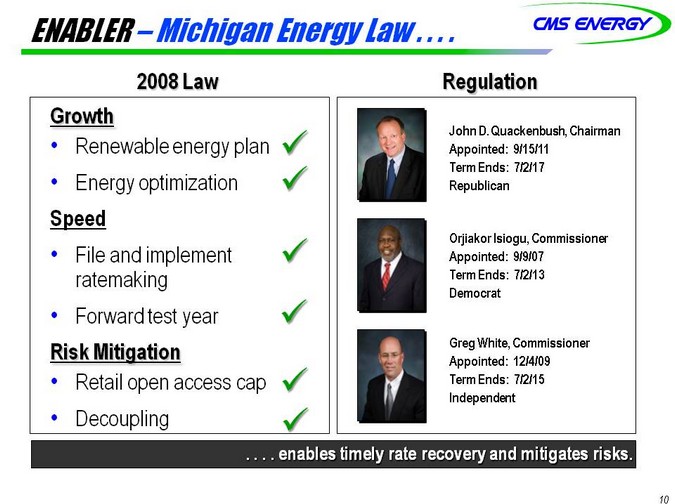
ENABLER – Michigan Energy Law . . . .
2008 Law Regulation
Growth
• Renewable energy plan
• Energy optimization
Speed
• File and implement ratemaking
• Forward test year
Risk Mitigation
• Retail open access cap
• Decoupling
John D. Quackenbush, Chairman Appointed: 9/15/11 Term Ends: 7/2/17 Republican
Orjiakor Isiogu, Commissioner Appointed: 9/9/07 Term Ends: 7/2/13 Democrat
Greg White, Commissioner Appointed: 12/4/09 Term Ends: 7/2/15 Independent
. . . . enables timely rate recovery and mitigates risks.
10
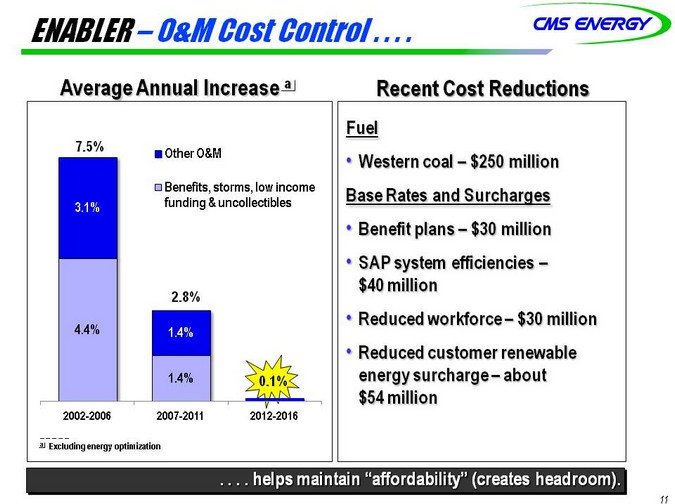
ENABLER – O&M Cost Control . . . .
Average Annual Increase a Recent Cost Reductions
7.5%
Other O&M
Benefits, storms, low income 3.1% funding & uncollectibles
2.8%
4.4% 1.4%
1.4% 0.1%
2002-2006 2007-2011 2012-2016
a Excluding energy optimization
Fuel
• Western coal – $250 million Base Rates and Surcharges
• Benefit plans – $30 million
• SAP system efficiencies –$40 million
• Reduced workforce – $30 million
• Reduced customer renewable energy surcharge – about $54 million
. . . . helps maintain “affordability” (creates headroom).
11
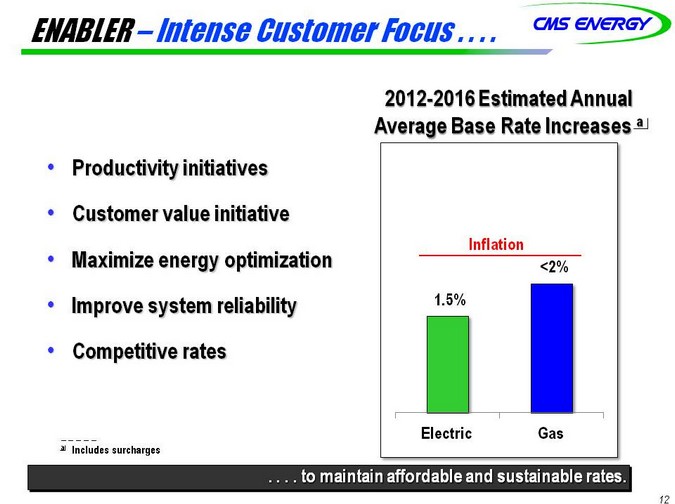
ENABLER – Intense Customer Focus . . . .
2012-2016 Estimated Annual Average Base Rate Increases a
Productivity initiatives Customer value initiative Maximize energy optimization Improve system reliability Competitive rates
Inflation <2% 1.5%
Electric Gas
a Includes surcharges
. . . . to maintain affordable and sustainable rates.
12
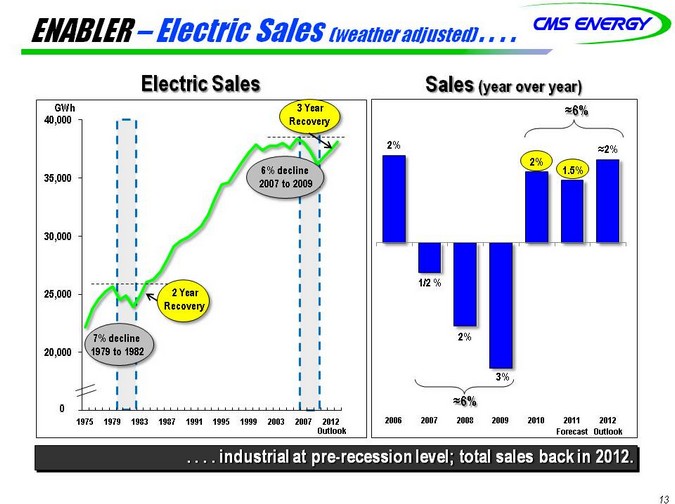
ENABLER – Electric Sales (weather adjusted) . . . .
Electric Sales Sales (year over year)
GWh 3 Year 40,000 Recovery
6% decline 35,000 2007 to 2009
30,000
25,000 2 Year Recovery
7% decline 20,000 1979 to 1982
0
1975 1979 1983 1987 1991 1995 1999 2003 2007 Outlook 2012
6%
2% 2% 2% 1.5%
1/2 %
2%
3%
6%
2006 2007 2008 2009 2010 2011 2012 Forecast Outlook
. . . . industrial at pre-recession level; total sales back in 2012.
13
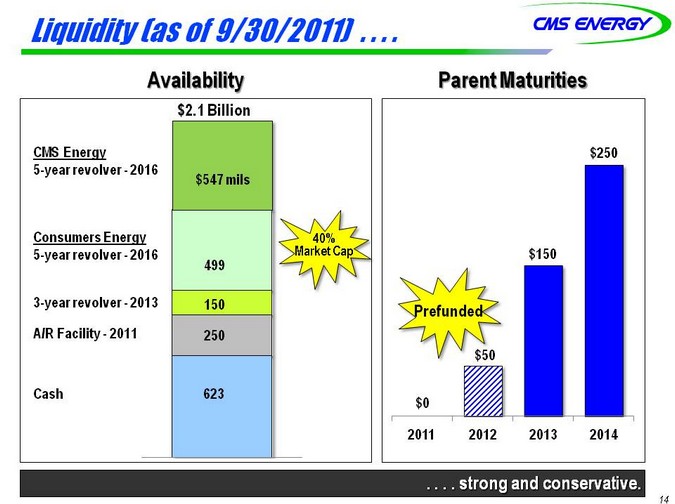
Liquidity (as of 9/30/2011) . . . .
Availability Parent Maturities
$2.1 Billion
CMS Energy
5-year revolver—2016 $547 mils
Consumers Energy 40% 5-year revolver—2016 499 Market Cap 3-year revolver—2013 150 A/R Facility—2011 250
Cash 623
$250
$150
Prefunded
$50
$0
2011 2012 2013 2014
. . . . strong and conservative.
14
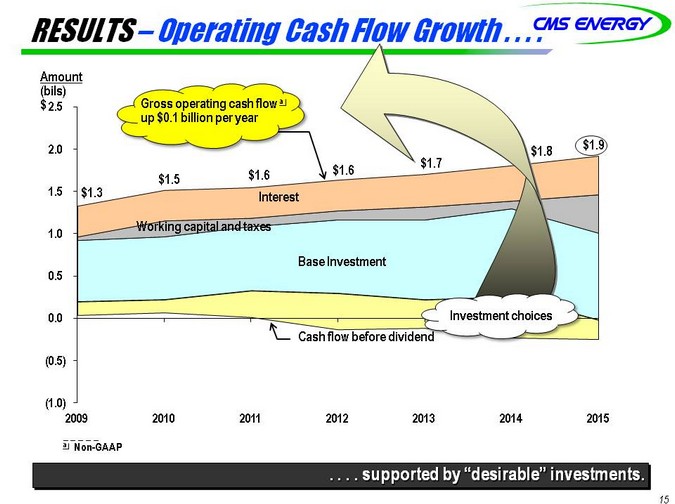
RESULTS – Operating Cash Flow Growth . . . .
Amount (bils) $ 2.5
2.0 1.5 1.0 0.5 0.0 (0.5) (1.0)
Gross operating cash flow a up $0.1 billion per year
$1.8 $1.9 $1.7 $1.6 $1.6 $1.5 $1.3 Interest Working capital and taxes
Base Investment
Investment choices Cash flow before dividend
2009 2010 2011 2012 2013 2014 2015
a Non-GAAP
. . . . supported by “desirable” investments.
15
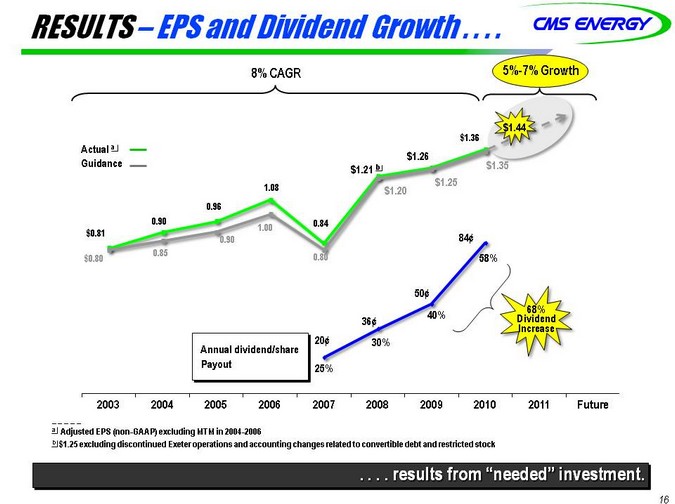
RESULTS – EPS and Dividend Growth . . . .
8% CAGR 5%-7% Growth
Actual a Guidance
1.08 0.96
0.90 0.84 1.00 $0.81 0.90 0.85 0.80 $0.80
$1.44 $1.36 $1.26 $1.21 b $1.35 $1.25 $1.20
Annual dividend/share Payout
50¢ 40% 36¢ 20¢ 30%
25%
84¢ 58%
68% Dividend Increase
2003 2004 2005 2006 2007 2008 2009 2010 2011 Future
a Adjusted EPS (non-GAAP) excluding MTM in 2004-2006 b $1.25 excluding discontinued Exeter operations and accounting changes related to convertible debt and restricted stock
. . . . results from “needed” investment.
16
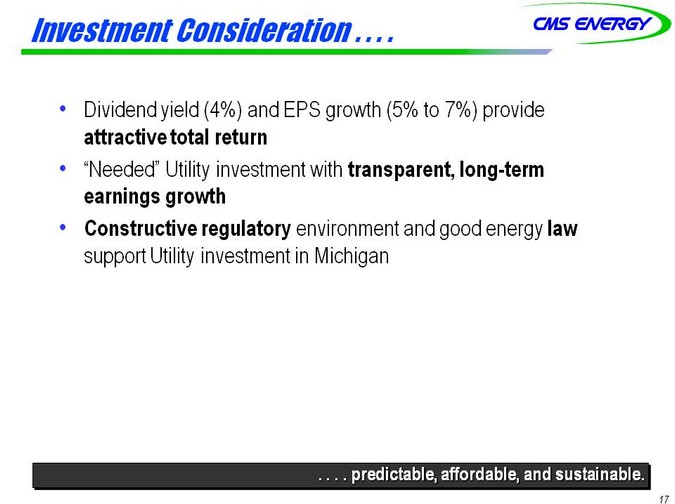
Investment Consideration . . . .
• Dividend yield (4%) and EPS growth (5% to 7%) provide attractive total return
• “Needed” Utility investment with transparent, long-term earnings growth
• Constructive regulatory environment and good energy law support Utility investment in Michigan
. . . . predictable, affordable, and sustainable.
17
Appendix
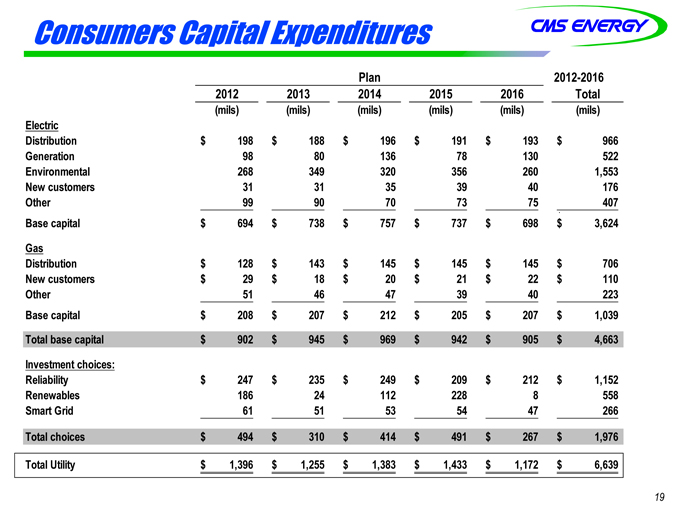
Consumers Capital Expenditures
Plan 2012-2016
2012 2013 2014 2015 2016 Total
(mils) (mils) (mils) (mils) (mils) (mils)
Electric
Distribution $ 198 $ 188 $ 196 $ 191 $ 193 $ 966
Generation 98 80 136 78 130 522
Environmental 268 349 320 356 260 1,553
New customers 31 31 35 39 40 176
Other 99 90 70 73 75 407
Base capital $ 694 $ 738 $ 757 $ 737 $ 698 $ 3,624
Gas
Distribution $ 128 $ 143 $ 145 $ 145 $ 145 $ 706
New customers $ 29 $ 18 $ 20 $ 21 $ 22 $ 110
Other 51 46 47 39 40 223
Base capital $ 208 $ 207 $ 212 $ 205 $ 207 $ 1,039
Total base capital $ 902 $ 945 $ 969 $ 942 $ 905 $ 4,663
Investment choices:
Reliability $ 247 $ 235 $ 249 $ 209 $ 212 $ 1,152
Renewables 186 24 112 228 8 558
Smart Grid 61 51 53 54 47 266
Total choices $ 494 $ 310 $ 414 $ 491 $ 267 $ 1,976
Total Utility $ 1,396 $ 1,255 $ 1,383 $ 1,433 $ 1,172 $ 6,639
19
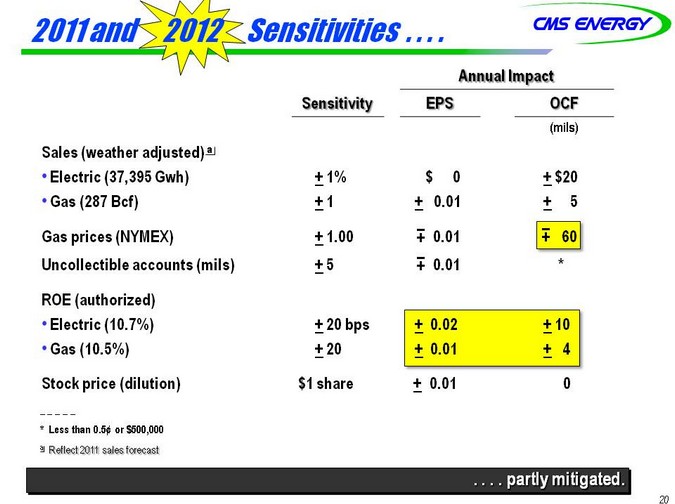
2011 and 2012 Sensitivities . . . .
Annual Impact
Sensitivity EPS OCF
(mils)
Sales (weather adjusted) a
• Electric (37,395 Gwh) + 1% $ 0 + $20
• Gas (287 Bcf) + 1 + 0.01 + 5
Gas prices (NYMEX) + 1.00 + 0.01 + 60
Uncollectible accounts (mils) + 5 + 0.01 *
ROE (authorized)
• Electric (10.7%) + 20 bps + 0.02 + 10
• Gas (10.5%) + 20 + 0.01 + 4
Stock price (dilution) $1 share + 0.01 0
* | Less than 0.5¢ or $500,000 a Reflect 2011 sales forecast |
. . . . partly mitigated.
20
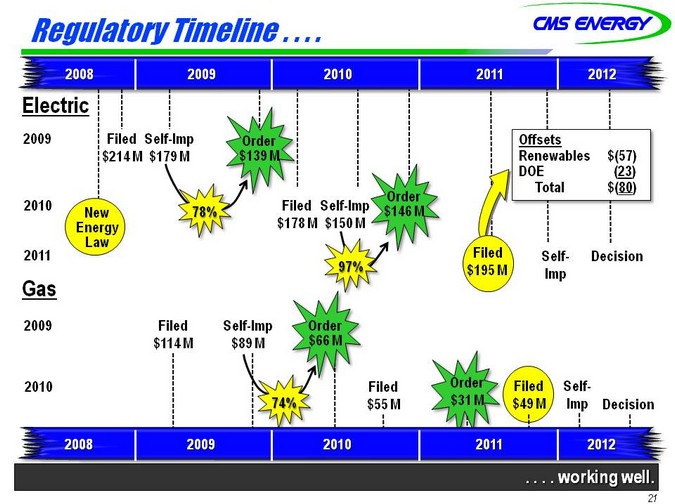
Regulatory Timeline . . . .
2008 2009 2010 2011 2012
Electric
2009
Filed Self-Imp $214 M $179 M
2010
2011
Gas
2009
2010
New Energy Law
Order $139 M
78%
Filed Self-Imp $178 M $150 M
Order $146 M
97%
Filed $114 M
Self-Imp
$89 M
Order
$66 M
74%
Filed
$55 M
Offsets
Renewables $(57) DOE (23) Total $(80)
Filed $195 M
Self-Imp
Decision
Order
$31 M
Filed
$49 M
Self-Imp
Decision
2008 2009 2010 2011 2012
. . . . working well.
21
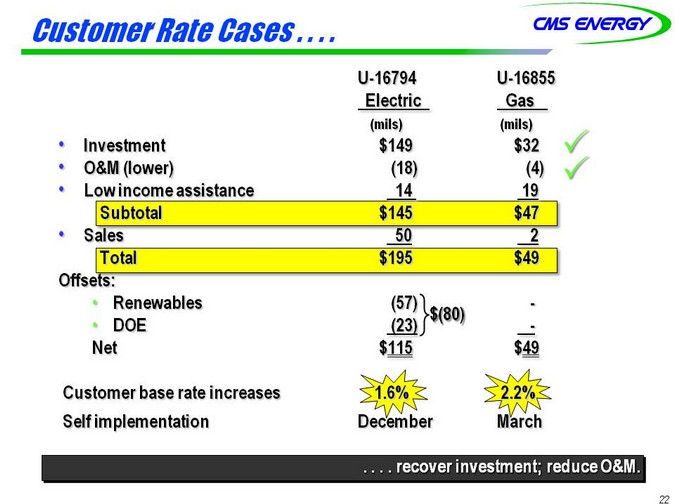
Customer Rate Cases . . . .
U-16794 U-16855
Electric Gas
(mils) (mils)
• Investment $149 $32
• O&M (lower) (18) (4)
• Low income assistance 14 19
Subtotal $145 $47
• Sales 50 2
Total $195 $49
Offsets:
• Renewables (57) -
$(80)
• DOE (23) -
Net $115 $49
Customer base rate increases Self implementation
1.6% December
2.2% March
. . . . recover investment; reduce O&M.
22
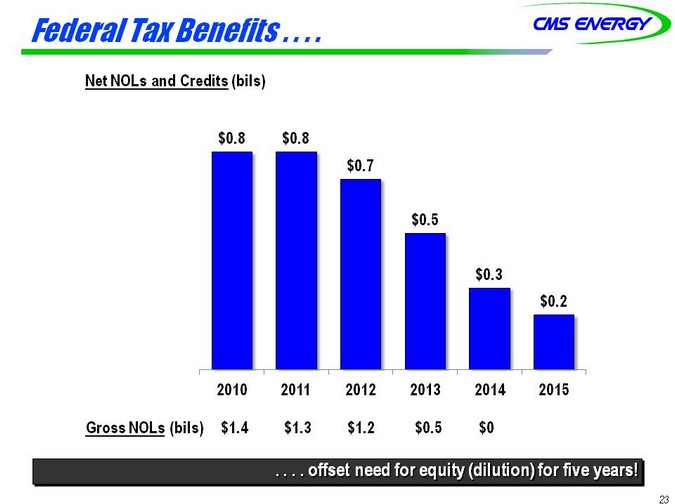
Federal Tax Benefits . . . .
Net NOLs and Credits (bils)
$0.8 $0.8 $0.7
$0.5
$0.3 $0.2
2010 2011 2012 2013 2014 2015
Gross NOLs (bils) $1.4 $1.3 $1.2 $0.5 $0
. . . . offset need for equity (dilution) for five years!
23
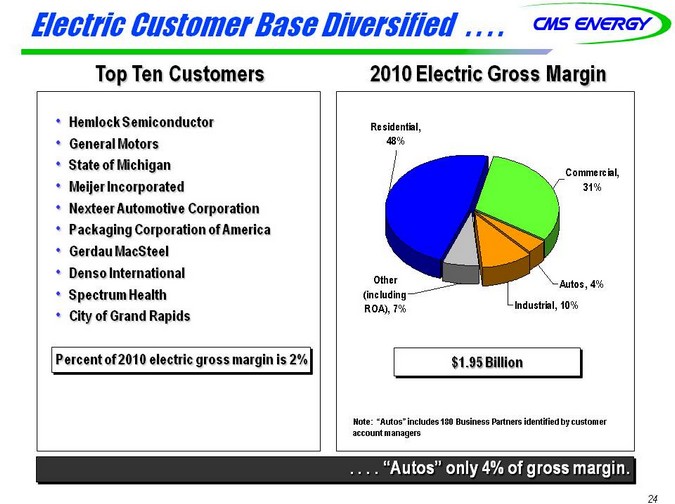
Electric Customer Base Diversified . . . .
Top Ten Customers 2010 Electric Gross Margin
• Hemlock Semiconductor
• General Motors
• State of Michigan
• Meijer Incorporated
• Nexteer Automotive Corporation
• Packaging Corporation of America
• Gerdau MacSteel
• Denso International
• Spectrum Health
• City of Grand Rapids
Percent of 2010 electric gross margin is 2%
Residential, 48%
Commercial, 31%
Other Autos, 4% (including ROA), 7% Industrial, 10%
$1.95 Billion
Note: “Autos” includes 180 Business Partners identified by customer account managers
. . . . “Autos” only 4% of gross margin.
24
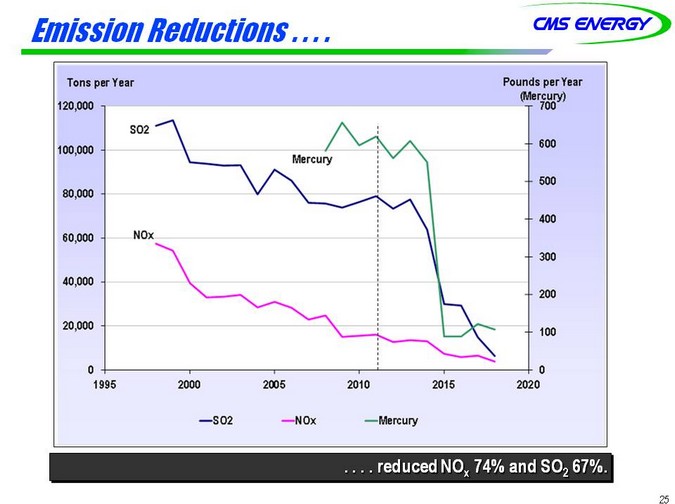
Emission Reductions . . . .
Tons per Year Pounds per Year (Mercury) 120,000 700 SO2 600 100,000 Mercury 500 80,000 400 60,000 NOx 300 40,000 200
20,000
100
0 0 1995 2000 2005 2010 2015 2020
SO2 NOx Mercury
. . . . reduced NOx 74% and SO2 67%.
25
GAAP Reconciliation
CMS Energy
Reconciliation of Gross Operating Cash Flow to GAAP Operating Activities
(unaudited)
(mils)
| | | | | | | | | | | | | | | | | | | | | | | | | | | | |
| | | 2009 | | | 2010 | | | 2011 | | | 2012 | | | 2013 | | | 2014 | | | 2015 | |
Consumers Operating Income + Depreciation & Amortization | | $ | 1,248 | | | $ | 1,498 | | | $ | 1,530 | | | $ | 1,601 | | | $ | 1,657 | | | $ | 1,757 | | | $ | 1,872 | |
Enterprises Project Cash Flows | | | 16 | | | | 39 | | | | 25 | | | | 35 | | | | 47 | | | | 47 | | | | 46 | |
| | | | | | | | | | | | | | | | | | | | | | | | | | | | |
Gross Operating Cash Flow | | $ | 1,264 | | | $ | 1,537 | | | $ | 1,555 | | | $ | 1,636 | | | $ | 1,704 | | | $ | 1,804 | | | $ | 1,918 | |
| | | | | | | |
Other operating activities including taxes, interest payments and working capital | | | (416 | ) | | | (578 | ) | | | (310 | ) | | | (406 | ) | | | (472 | ) | | | (439 | ) | | | (835 | ) |
| | | | | | | | | | | | | | | | | | | | | | | | | | | | |
Net cash provided by operating activities | | $ | 848 | | | $ | 959 | | | $ | 1,170 | | | $ | 1,230 | | | $ | 1,232 | | | $ | 1,365 | | | $ | 1,083 | |
| | | | | | | | | | | | | | | | | | | | | | | | | | | | |
2009-15 OCF
CMS ENERGY CORPORATION
Earnings Per Share By Year GAAP Reconciliation
(Unaudited)
| | | | | | | | | | | | | | | | | | | | | | | | | | | | | | | | |
| | | 2003 | | | 2004 | | | 2005 | | | 2006 | | | 2007 | | | 2008 | | | 2009 | | | 2010 | |
Reported earnings (loss) per share - GAAP | | ($ | 0.30 | ) | | $ | 0.64 | | | ($ | 0.44 | ) | | ($ | 0.41 | ) | | ($ | 1.02 | ) | | $ | 1.20 | | | $ | 0.91 | | | $ | 1.28 | |
| | | | | | | | | | | | | | | | | | | | | | | | | | | | | | | | |
After-tax items: | | | | | | | | | | | | | | | | | | | | | | | | | | | | | | | | |
Electric and gas utility | | | 0.21 | | | | (0.39 | ) | | | — | | | | — | | | | (0.07 | ) | | | 0.05 | | | | 0.33 | | | | 0.03 | |
Enterprises | | | 0.74 | | | | 0.62 | | | | 0.04 | | | | (0.02 | ) | | | 1.25 | | | | (0.02 | ) | | | 0.09 | | | | (0.03 | ) |
Corporate interest and other | | | 0.16 | | | | (0.03 | ) | | | 0.04 | | | | 0.27 | | | | (0.32 | ) | | | (0.02 | ) | | | 0.01 | | | | * | |
Discontinued operations (income) loss | | | (0.16 | ) | | | 0.02 | | | | (0.07 | ) | | | (0.03 | ) | | | 0.40 | | | | (* | ) | | | (0.08 | ) | | | 0.08 | |
Asset impairment charges, net | | | — | | | | — | | | | 1.82 | | | | 0.76 | | | | 0.60 | | | | — | | | | — | | | | — | |
Cumulative accounting changes | | | 0.16 | | | | 0.01 | | | | — | | | | — | | | | — | | | | — | | | | — | | | | — | |
| | | | | | | | | | | | | | | | | | | | | | | | | | | | | | | | |
Adjusted earnings per share, including MTM - non-GAAP | | $ | 0.81 | | | $ | 0.87 | | | $ | 1.39 | | | $ | 0.57 | | | $ | 0.84 | | | $ | 1.21 | (a) | | $ | 1.26 | | | $ | 1.36 | |
Mark-to-market impacts | | | | | | | 0.03 | | | | (0.43 | ) | | | 0.51 | | | | | | | | | | | | | | | | | |
| | | | | | | | | | | | | | | | | | | | | | | | | | | | | | | | |
Adjusted earnings per share, excluding MTM - non-GAAP | | | NA | | | $ | 0.90 | | | $ | 0.96 | | | $ | 1.08 | | | | NA | | | | NA | | | | NA | | | | NA | |
| | | | | | | | | | | | | | | | | | | | | | | | | | | | | | | | |
| * | Less than $500 thousand or $0.01 per share. |
| (a) | $1.25 excluding discontinued Exeter operations and accounting changes related to convertible debt and restricted stock. |
2003-10 EPS