| OMB APPROVAL |
OMB Number: 3235-0570 Expires: August 31, 2020 Estimated average burden hours per response: 20.6 |
UNITED STATES
SECURITIES AND EXCHANGE COMMISSION
Washington, D.C. 20549
FORM N-CSR
CERTIFIED SHAREHOLDER REPORT OF REGISTERED
MANAGEMENT INVESTMENT COMPANIES
| Investment Company Act file number | 811-02699 |
AIM Growth Series (Invesco Growth Series) | ||
| (Exact name of registrant as specified in charter) | ||
11 Greenway Plaza, Suite 1000 Houston, Texas 77046 | ||
| (Address of principal executive offices) (Zip code) | ||
Sheri Morris 11 Greenway Plaza, Suite 1000 Houston, Texas 77046 | ||
| (Name and address of agent for service) | ||
Registrant’s telephone number, including area code: (713) 626-1919
Date of fiscal year end: 12/31
Date of reporting period: 12/31/17
Item 1. Report to Stockholders.
|
| |||||
Annual Report to Shareholders
| December 31, 2017
| |||||
Invesco Alternative Strategies Fund | ||||||
Nasdaq: A: LQLAX ◾ C: LQLCX ◾ R: LQLRX ◾ Y: LQLYX ◾ R5: LQLFX ◾ R6: LQLSX | ||||||


Letters to Shareholders
 | Dear Shareholders: | |
This annual report includes information about your Fund, including performance data and a complete list of its investments as of the close of the reporting period. Inside is a discussion of how your Fund was managed and the factors that affected its performance during the reporting period. Major stock market indexes rose – and set record highs – throughout the reporting period. Generally positive economic data, strong corporate earnings and anticipated tax and regulatory reform contributed to the rally. The US economy expanded during the reporting period, with gross domestic product, the value of all goods and services produced, significantly increasing its growth rate from the first to the third quarter of the year. Tax reform legislation, enacted in December 2017, was a positive for the stock market, but its long-term economic impact was uncertain. Citing positive economic trends – specifically, realized and expected labor market conditions and inflation – the US Federal Reserve raised interest rates in March, June and |
December 2017. While US and global bond markets, as well as emerging market equities, sold off early in the reporting period, they recovered much of their losses during the reporting period. Overseas, economic data were mixed, prompting the European Central Bank and central banks in China and Japan, among other countries, to maintain extraordinarily accommodative monetary policies.
Short-term market volatility can prompt some investors to abandon their investment plans – and can cause others to settle for whatever returns the market has to offer. The investment professionals at Invesco, in contrast, invest with high conviction. This means that, no matter the asset class or the strategy, each investment team has a passion to exceed. We want to help investors achieve better outcomes, such as seeking higher returns, helping mitigate risk and generating income. Of course, investing with high conviction can’t guarantee a profit or ensure success; no investment strategy can. To learn more about how we invest with high conviction, visit invesco.com/HighConviction.
You, too, can invest with high conviction by maintaining a long-term investment perspective and by working with your financial adviser on a regular basis. During periods of short-term market volatility or uncertainty, your financial adviser can keep you focused on your long-term investment goals – a new home, a child’s college education or a secure retirement. He or she also can share research about the economy, the markets and individual investment options.
Visit our website for more information on your investments
Our website, invesco.com/us, offers a wide range of market insights and investment perspectives. On the website, you’ll find detailed information about our funds, including performance, holdings and portfolio manager commentaries. You can access information about your account by completing a simple, secure online registration. To do so, select “Log In” on the right side of the homepage, and then select “Register for Individual Account Access.”
In addition to the resources accessible on our website and through our mobile app, you can obtain timely updates to help you stay informed about the markets and the economy by connecting with Invesco on Twitter, LinkedIn or Facebook. You can access our blog at blog.invesco.us.com. Our goal is to provide you the information you want, when and where you want it.
Finally, I’m pleased to share with you Invesco’s commitment to both the Principles for Responsible Investment and to considering environmental, social and governance issues in our robust investment process. I invite you to learn more at invesco.com/esg.
Have questions?
For questions about your account, contact an Invesco client services representative at 800 959 4246. For Invesco-related questions or comments, please email me directly at phil@invesco.com.
All of us at Invesco look forward to serving your investment management needs. Thank you for investing with us.
Sincerely,

Philip Taylor
Senior Managing Director, Invesco Ltd.
2 Invesco Alternative Strategies Fund
| Dear Fellow Shareholders: Among the many important lessons I’ve learned in more than 40 years in a variety of business endeavors is the value of a trusted advocate. As independent chair of the Invesco Funds Board, I can assure you that the members of the Board are strong advocates for the interests of investors in Invesco’s mutual funds. We work hard to represent your interests through oversight of the quality of the investment management services your funds receive and other matters important to your investment, including but not limited to: | |||
∎ | Ensuring that Invesco offers a diverse lineup of mutual funds that your financial adviser can use to strive to meet your financial needs as your investment goals change over time. | |||
∎ | Monitoring how the portfolio management teams of the Invesco funds are performing in light of changing economic and market conditions. | |||

| ∎ | Assessing each portfolio management team’s investment performance within the context of the investment strategy described in the fund’s prospectus. |
| ∎ | Monitoring for potential conflicts of interests that may impact the nature of the services that your funds receive. |
We believe one of the most important services we provide our fund shareholders is the annual review of the funds’ advisory and sub-advisory contracts with Invesco Advisers and its affiliates. This review is required by the Investment Company Act of 1940 and focuses on the nature and quality of the services Invesco provides as the adviser to the Invesco funds and the reasonableness of the fees that it charges for those services. Each year, we spend months carefully reviewing information received from Invesco and a variety of independent sources, such as performance and fee data prepared by Lipper, Inc. (a subsidiary of Broadridge Financial Solutions, Inc.), an independent, third-party firm widely recognized as a leader in its field. We also meet with our independent legal counsel and other independent advisers to review and help us assess the information that we have received. Our goal is to assure that you receive quality investment management services for a reasonable fee.
I trust the measures outlined above provide assurance that you have a worthy advocate when it comes to choosing the Invesco Funds.
As always, please contact me at bruce@brucecrockett.com with any questions or concerns you may have. On behalf of the Board, we look forward to continuing to represent your interests and serving your needs.
.
Sincerely,

Bruce L. Crockett
Independent Chair
Invesco Funds Board of Trustees
3 Invesco Alternative Strategies Fund
Management’s Discussion of Fund Performance
Performance summary
For the year ended December 31, 2017, Class A shares of Invesco Alternative Strategies Fund (the Fund), at net asset value (NAV), outperformed the FTSE US 3-Month Treasury Bill Index, the Fund’s broad market/style-specific index.
Your Fund’s long-term performance appears later in this report.
Fund vs. Indexes
Total returns, 12/31/16 to 12/31/17, at net asset value (NAV). Performance shown does not include applicable contingent deferred sales charges (CDSC) or front-end sales charges, which would have reduced performance.
Class A Shares | 3.77 | % | |||
Class C Shares | 3.09 | ||||
Class R Shares | 3.57 | ||||
Class Y Shares | 4.10 | ||||
Class R5 Shares | 4.11 | ||||
Class R6 Shares | 4.11 | ||||
FTSE US 3-Month Treasury Bill Index▼ (Broad Market/Style-Specific Index) | 0.84 | ||||
Lipper Alternative Multi-Strategy Funds Classification Average∎ (Peer Group) | 4.70 | ||||
Source(s): ▼FactSet Research Systems Inc.; ∎Lipper Inc. |
| ||||
Market conditions and your Fund
Despite highly destructive hurricanes that threatened to derail a years-long economic recovery, the US economy continued to expand throughout the year ended December 31, 2017. Gross domestic product – the value of all goods and services produced in the US – expanded in the first three quarters of 2017.
Given signs of an improving economy, the US Federal Reserve (the Fed) raised interest rates three times during the reporting period, most recently in December 2017; each rate hike was 25 basis points.1 (A basis point is 0.01%.) The Fed pledged that “realized and expected economic conditions relative to its objectives of maximum employment and 2 percent inflation” will guide its future actions. At the close of the reporting period, Fed policy remained accommodative, and the fed funds target rate stood at a range of 1.25% to 1.50% – 75 basis points higher than at the start of the reporting period.1
US bond returns were positive for the year, with all fixed income sectors (Treasuries, government-related, corporate and securitized) posting positive returns,
primarily driven by strong macroeconomic conditions, muted market volatility and global investor demand for yield. A benign inflation outlook dampened long-term rates as the yield curve flattened, benefiting longer-maturity securities. In addition, the benign inflation environment allowed the Fed to remain less aggressive with rate hikes. The US corporate credit sector remained a key contributor to excess return for the year, with lower-rated investment grade securities outperforming higher-rated credits and comparable-maturity Treasuries. Tax cut legislation enacted in December included significant corporate tax reductions that were an additional catalyst for the positive tone in the credit market. The high yield sector also benefited from strong demand during the year, despite lofty valuations. Within structured securities, commercial mortgage-backed securities (MBS) were the primary outperformers, with asset-backed securities also performing well in midst of higher short-term rates. Agency MBS also outperformed on a relative basis, even as the Fed began to systematically de-lever its MBS and Treasury holdings.
Major US stock market indexes repeatedly hit all-time highs throughout the reporting period. The stock market rally that began after the 2016 presidential election continued throughout the reporting period, fueled by generally positive economic data, strong corporate earnings and improved consumer confidence. However, performance was highly concentrated, with more than two-thirds of the equity market’s gains linked to just three sectors: information technology, financials and health care. Finally, after much debate in Congress, a tax reform bill was signed into law in December 2017, which further strengthened stocks.
The Fund comprises “core” and “satellite” allocations. The core portfolio allocation is comprised of underlying alternative funds and strategies with an absolute return focus, which seek low correlation with traditional equity markets, and which seek to target lower volatility. The Fund’s satellite portfolio allocation includes underlying alternative funds that are directional, meaning they seek to perform well in specific economic environments, reflecting our near-term outlook for the markets. They tend to have higher volatility than underlying core allocation funds.
With another strong year for US equities, directional market exposures within our satellite allocation all posted positive returns for the reporting period, contributing to the Fund’s returns. These satellite allocations included Invesco Long/ Short Equity Fund, Invesco Global Infrastructure Fund and PowerShares DB Base Metals Fund, which benefited from increased industrial metals prices that were supported by strong manufacturing and import growth data out of China and by indications that China intended to cut production to curb pollution. The largest individual contributors to Fund performance were absolute return-focused holdings within the non-directional core allocation. Invesco Balanced-Risk
| Portfolio Composition* | ||
| By fund type, based on total investments | ||
| Alternative Funds | 59.4% | |
| Equity Funds | 38.1 | |
| Fixed Income Funds | 2.0 | |
| Money Market Funds | 0.5 |
| Total Net Assets | $2.6 million |
The Fund’s holdings are subject to change, and there is no assurance that the Fund will continue to hold any particular security.
Data presented here are as of December 31, 2017.
| * | Based on the Schedule of Investments, which classifies each underlying fund and other investments into broad asset classes based on their predominant investments. |
4 Invesco Alternative Strategies Fund
Allocation Fund posted positive returns, benefiting from its strategic exposures across equities, commodities and fixed income. Invesco Macro Allocation Strategy Fund also added to results.
Within the core allocations, Invesco Global Market Neutral Fund and Invesco All Cap Market Neutral Fund detracted from Fund performance due to short holdings that did not perform as expected, particularly those in the health care sector. Invesco Global Targeted Returns also detracted from Fund performance during the reporting period.
During the reporting period, the Fund added a position in Invesco Global Targeted Returns Fund to replace its position in Invesco Macro Long/Short Fund, which was liquidated and terminated on February 27, 2017.
Please note that some of the Fund’s underlying funds – including, but not limited to, Invesco All Cap Market Neutral Fund, Invesco Global Market Neutral Fund, Invesco Macro Allocation Strategy Fund, Invesco Balanced-Risk Allocation Fund, Invesco Macro Long/Short Fund, Invesco Long/Short Equity Fund, Invesco Global Targeted Returns Fund and Invesco Balanced-Risk Commodity Strategy Fund – may use derivatives, which may amplify traditional investment risks through the creation of leverage in the underlying funds. Please note that some of these underlying fund strategies may be principally implemented with derivative instruments that include futures and total return swaps. Therefore, performance of these underlying funds, both positive and negative, can be attributed to these instruments.
It has been our privilege to oversee Invesco Alternative Strategies Fund, and we thank you for your continued investment.
| 1 | Source: US Federal Reserve |
The views and opinions expressed in management’s discussion of Fund performance are those of Invesco Advisers, Inc. These views and opinions are subject to change at any time based on factors such as market and economic conditions. These views and opinions may not be relied upon as investment advice or recommendations, or as an offer for a particular security. The information is not a complete analysis of every aspect of any market, country, industry, security or the Fund. Statements of fact are from sources considered reliable, but Invesco Advisers, Inc. makes no representation or warranty as to their completeness or accuracy. Although historical performance is no guarantee of future results, these insights may help you understand our investment management philosophy.
See important Fund and, if applicable, index disclosures later in this report.
| Duy Nguyen Chartered Financial Analyst, Portfolio Manager and Chief Investment Officer of Invesco’s Global Solutions Development | |
| and Implementation Team, is manager of Invesco Alternative Strategies Fund. He joined Invesco in 2000. Mr. Nguyen earned a BBA from The University of Texas at Austin and an MS from the University of Houston. | ||

| Jacob Borbidge Chartered Financial Analyst, Portfolio Manager and Head of Research for Invesco’s Global Solutions | |
Development and Implementation Team, is manager of Invesco Alternative Strategies Fund. He joined Invesco in 2004. Mr. Borbidge earned a BS in mechanical engineering from Lehigh University and an MS in finance from the University of Houston.
Assisted by Invesco’s Global Solutions Development & Implementation Team | ||

5 Invesco Alternative Strategies Fund
Your Fund’s Long-Term Performance
Results of a $10,000 Investment – Oldest Share Class(es) since Inception
Fund and index data from 10/14/14
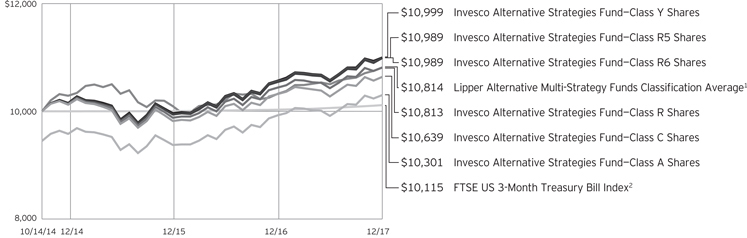
1 Source: Lipper Inc.
2 Source: FactSet Research Systems Inc.
Past performance cannot guarantee comparable future results.
The data shown in the chart include reinvested distributions, applicable sales charges and Fund expenses including management fees. Index results include reinvested dividends, but they do not reflect sales charges. Performance of the
peer group, if applicable, reflects fund expenses and management fees; performance of a market index does not. Performance shown in the chart and table(s) does not reflect deduction of taxes a shareholder would pay on Fund distributions or sale of Fund shares.
6 Invesco Alternative Strategies Fund
| Average Annual Total Returns | |||||
As of 12/31/17, including maximum applicable sales charges |
| ||||
Class A Shares | |||||
Inception (10/14/14) | 0.93 | % | |||
1 Year | -1.89 | ||||
Class C Shares | |||||
Inception (10/14/14) | 1.95 | % | |||
1 Year | 2.09 | ||||
Class R Shares | |||||
Inception (10/14/14) | 2.46 | % | |||
1 Year | 3.57 | ||||
Class Y Shares | |||||
Inception (10/14/14) | 3.01 | % | |||
1 Year | 4.10 | ||||
Class R5 Shares | |||||
| Inception (10/14/14) | 2.98 | % | |||
1 Year | 4.11 | ||||
Class R6 Shares | |||||
Inception (10/14/14) | 2.98 | % | |||
1 Year | 4.11 | ||||
The performance data quoted represent past performance and cannot guarantee comparable future results; current performance may be lower or higher. Please visit invesco.com/performance for the most recent month-end performance. Performance figures reflect reinvested distributions, changes in net asset value and the effect of the maximum sales charge unless otherwise stated. Investment return and principal value will fluctuate so that you may have a gain or loss when you sell shares.
The net annual Fund operating expense ratio set forth in the most recent Fund prospectus as of the date of this report for Class A, Class C, Class R, Class Y, Class R5 and Class R6 shares was 1.44%, 2.19%, 1.69%, 1.19%, 1.19% and 1.19%, respectively.1,2 The total annual Fund operating expense ratio set forth in the most recent Fund prospectus as of the date of this report for Class A, Class C, Class R, Class Y, Class R5 and Class R6 shares was 19.91%, 20.66%, 20.16%, 19.66%, 19.37% and 19.37%, respectively.1 The expense ratios presented above may vary from the expense ratios presented in other sections of this report that are based on expenses incurred during the period covered by this report.
Class A share performance reflects the maximum 5.50% sales charge, and Class C share performance reflects the applicable contingent deferred sales charge (CDSC) for the period involved. The CDSC on Class C shares is 1% for the first year after purchase. Class R, Class Y, Class R5 and Class R6 class shares do not have a front-end sales charge or a CDSC; therefore, performance is at net asset value.
The performance of the Fund’s share classes will differ primarily due to different sales charge structures and class expenses.
Fund performance reflects any applicable fee waivers and/or expense reimbursements. Had the adviser not waived fees and/or reimbursed expenses currently or in the past, returns would have been lower. See current prospectus for more information.
| 1 | The expense ratio includes acquired fund fees and expenses of the underlying funds in which the Fund invests of 1.14% for Invesco Alternative Strategies Fund. |
| 2 | Total annual Fund operating expenses after any contractual fee waivers and/or expense reimbursements by the adviser in effect through at least April 30, 2019. See current prospectus for more information. |
7 Invesco Alternative Strategies Fund
Invesco Alternative Strategies Fund’s investment objective is long-term capital appreciation.
| ∎ | Unless otherwise stated, information presented in this report is as of December 31, 2017, and is based on total net assets. |
| ∎ | Unless otherwise noted, all data provided by Invesco. |
| ∎ | To access your Fund’s reports/prospectus, visit invesco.com/fundreports. |
About share classes
| ∎ | Class R shares are generally available only to employer sponsored retirement and benefit plans. Please see the prospectus for more information. |
| ∎ | Class Y shares are available only to certain investors. Please see the prospectus for more information. |
| ∎ | Class R5 shares and Class R6 shares are available for use by retirement plans that meet certain standards and for institutional investors. Class R6 shares are also available through intermediaries that have established an agreement with Invesco Distributors, Inc. to make such shares available for use in retail omnibus accounts. Please see the prospectus for more information. |
Principal risks of investing in the Fund
| ∎ | Fund of funds risk. The Fund’s performance depends on that of the underlying funds in which it invests. Accordingly, the risks associated with an investment in the Fund include the risks associated with investments in the underlying funds. The Fund will indirectly pay a proportional share of the fees and expenses of the underlying funds in which it invests. There are risks that the Fund will vary from its target weightings (if any) in the underlying funds, that the underlying funds will not achieve their investment objectives, that the underlying funds’ performance may be lower than their represented asset classes, and that the Fund may withdraw its investments in an underlying fund at a disadvantageous time. |
| ∎ | Allocation risk. The Fund’s investment performance depends, in part, on how its assets are allocated among the underlying funds or asset classes. The Adviser’s evaluations and assumptions regarding the asset classes or the underlying funds in which the Fund invests may be incorrect, causing the Fund to be invested (or not invested) in one or more asset classes or underlying |
funds at an inopportune time, which could negatively affect the Fund’s performance. |
| ∎ | Exchange-traded funds risk. In addition to the risks associated with the underlying assets held by the exchange-traded fund, investments in exchange-traded funds are subject to the following additional risks: (1) an exchange-traded fund’s shares may trade above or below its net asset value; (2) an active trading market for the exchange-traded fund’s shares may not develop or be maintained; (3) trading an exchange-traded fund’s shares may be halted by the listing exchange; (4) a passively-managed exchange-traded fund may not track the performance of the reference asset; and (5) a passively managed exchange-traded fund may hold troubled securities. Investment in exchange-traded funds may involve duplication of management fees and certain other expenses, as the Fund or an underlying fund indirectly bears its proportionate share of any expenses paid by the exchange-traded funds in which it invests. Further, certain exchange-traded funds in which the Fund or an underlying fund may invest are leveraged, which may result in economic leverage, permitting the Fund or an underlying fund to gain exposure that is greater than would be the case in an unlevered instrument, and potentially resulting in greater volatility. |
The principal risks of investing in the Fund also include the risks of each underlying fund. These risks include the following:
| ∎ | Active trading risk. Active trading of portfolio securities may result in added expenses, a lower return and increased tax liability. |
| ∎ | Changing Fixed Income Market Conditions Risk. The current low interest rate environment was created in part by the Federal Reserve Board (FRB) and certain foreign central banks keeping the federal funds and equivalent foreign |
rates near, at or below zero. Increases in the federal funds and equivalent foreign rates may expose fixed income markets to heightened volatility and reduced liquidity for certain fixed income investments, particularly those with longer maturities. In addition, decreases in fixed income dealer market-making capacity may also potentially lead to heightened volatility and reduced liquidity in the fixed income markets. As a result, the value of an underlying fund’s investments and share price may decline. Changes in central bank policies could also result in higher than normal shareholder redemptions, which could potentially increase portfolio turnover and an underlying fund’s transaction costs. |
| ∎ | Commodities tax risk. The tax treatment of commodity-linked derivative instruments may be adversely affected by changes in legislation, regulations or other legally binding authority. If, as a result of any such adverse action, the income of an underlying fund from certain commodity-linked derivatives was treated as non-qualifying income, an underlying fund might fail to qualify as a regulated investment company and be subject to federal income tax at the fund level. As a result of a recent announcement by the Internal Revenue Service, an underlying fund intends to invest in commodity-linked notes: (a) directly, generally only to the extent that it obtains an opinion of counsel confirming that income from such investments should be qualifying income because such commodity-linked notes constitute securities under section 2(a) (36) of the 1940 Act or (b) indirectly through the Subsidiary. Should the Internal Revenue Service issue further guidance, or Congress enact legislation, that adversely affects the tax treatment of an underlying fund’s use of commodity-linked notes or a wholly-owned subsidiary (which guidance might be applied to the underlying fund retroactively), it could, among other consequences, limit the underlying fund’s ability to pursue its investment strategy. |
| ∎ | Commodity-linked notes risk. In addition to risks associated with the underlying commodities, investments in commodity-linked notes may be subject to additional risks, such as non- |
This report must be accompanied or preceded by a currently effective Fund prospectus, which contains more complete information, including sales charges and expenses. Investors should read it carefully before investing.
NOT FDIC INSURED | MAY LOSE VALUE | NO BANK GUARANTEE
8 Invesco Alternative Strategies Fund
payment of interest and loss of principal, counterparty risk, lack of a secondary market and risk of greater volatility than traditional equity and debt securities. The value of the commodity-linked notes an underlying fund buys may fluctuate significantly because the values of the underlying investments to which they are linked are themselves volatile. Additionally, certain commodity-linked notes employ “economic” leverage by requiring payment by the issuer of an amount that is a multiple of the price increase or decrease of the underlying commodity, commodity index, or other economic variable. Such economic leverage will increase the volatility of the value of these commodity-linked notes and an underlying fund to the extent it invests in such notes. |
| ∎ | Commodity risk. An underlying fund will concentrate its investments in commodities markets and will therefore have investment exposure to the commodities markets and one or more sectors of the commodities markets, which may subject an underlying fund to greater volatility than investments in traditional securities, such as stocks and bonds. Volatility in the commodities markets may be caused by changes in overall market movements, domestic and foreign political and economic events and policies, war, acts of terrorism, changes in domestic or foreign interest rates and/or investor expectations concerning interest rates, domestic and foreign inflation rates, investment and trading activities of mutual funds, hedge funds and commodities funds, and factors such as drought, floods, weather, livestock disease, embargoes, tariffs and other regulatory developments, or supply and demand disruptions. Because an underlying fund’s performance is linked to the performance of volatile commodities, investors should be willing to assume the risks of potentially significant fluctuations in the value of an underlying fund’s shares. |
| ∎ | Correlation risk. Because an underlying fund’s investment strategy seeks to balance risk across the four sectors of the commodities market and, within each commodity sector, to balance risk across different commodities, to the |
extent either the sectors of the commodities markets or the selected commodities become correlated in a way not anticipated by an underlying fund’s adviser an underlying fund’s risk allocation process may result in magnified risks and loss instead of balancing (reducing) the risk of loss. |
| ∎ | Debt securities risk. The prices of debt securities held by an underlying fund will be affected by changes in interest rates, the creditworthiness of the issuer and other factors. An increase in prevailing interest rates typically causes the value of existing debt securities to fall and often has a greater impact on longer-duration debt securities and higher quality debt securities. Falling interest rates will cause an underlying fund to reinvest the proceeds of debt securities that have been repaid by the issuer at lower interest rates. Falling interest rates may also reduce an underlying fund’s distributable income because interest payments on floating rate debt instruments held by an underlying fund will decline. An underlying fund could lose money on investments in debt securities if the issuer or borrower fails to meet its obligations to make interest payments and/or to repay principal in a timely manner. Changes in an issuer’s financial strength, the market’s perception of such strength or in the credit rating of the issuer or the security may affect the value of debt securities. An underlying fund’s adviser’s credit analysis may fail to anticipate such changes, which could result in buying a debt security at an inopportune time or failing to sell a debt security in advance of a price decline or other credit event. |
| ∎ | Derivatives risk. The value of a derivative instrument depends largely on (and is derived from) the value of an underlying security, currency, commodity, interest rate, index or other asset (each referred to as an underlying asset). In addition to risks relating to the underlying assets, the use of derivatives may include other, possibly greater, risks, including counterparty, leverage and liquidity risks. Counterparty risk is the risk that the counterparty to the derivative contract will default on its obligation to pay the underlying fund the amount owed or |
otherwise perform under the derivative contract. Derivatives create leverage risk because they do not require payment up front equal to the economic exposure created by owning the derivative. As a result, an adverse change in the value of the underlying asset could result in the underlying fund sustaining a loss that is substantially greater than the amount invested in the derivative, which may make the underlying fund’s returns more volatile and increase the risk of loss. Derivative instruments may also be less liquid than more traditional investments and the underlying fund may be unable to sell or close out its derivative positions at a desirable time or price. This risk may be more acute under adverse market conditions, during which the underlying fund may be most in need of liquidating its derivative positions. Derivatives may also be harder to value, less tax efficient and subject to changing government regulation that could impact the underlying fund’s ability to use certain derivatives or their cost. The SEC has proposed new regulations related to the use of derivatives and related instruments by registered investment companies. If adopted as proposed, these regulations would limit an underlying fund’s ability to engage in derivatives transactions and may result in increased costs or require an underlying fund to modify its investment strategies or to liquidate. Also, derivatives used for hedging or to gain or limit exposure to a particular market segment may not provide the expected benefits, particularly during adverse market conditions. These risks are greater for certain underlying funds than most other mutual funds because certain underlying funds will implement their investment strategy primarily through derivative instruments rather than direct investments in stocks/bonds. |
| ∎ | Emerging markets securities risk. Emerging markets (also referred to as developing markets) are generally subject to greater market volatility, political, social and economic instability, uncertain trading markets and more governmental limitations on foreign investment than more developed markets. In addition, companies operating in emerging markets may be subject to |
continued on page 10
9 Invesco Alternative Strategies Fund
lower trading volume and greater price fluctuations than companies in more developed markets. Securities law and the enforcement of systems of taxation in many emerging market countries may change quickly and unpredictably. In addition, investments in emerging markets securities may also be subject to additional transaction costs, delays in settlement procedures, and lack of timely information. |
| ∎ | Exchange-traded funds risk. In addition to the risks associated with the underlying assets held by the exchange-traded fund, investments in exchange-traded funds are subject to the following additional risks: (1) an exchange-traded fund’s shares may trade above or below its net asset value; (2) an active trading market for the exchange-traded fund’s shares may not develop or be maintained; (3) trading an exchange-traded fund’s shares may be halted by the listing exchange; (4) a passively-managed exchange-traded fund may not track the performance of the reference asset; and (5) a passively managed exchange-traded fund may hold troubled securities. Investment in exchange-traded funds may involve duplication of management fees and certain other expenses, as the Fund or an underlying fund indirectly bears its proportionate share of any expenses paid by the exchange-traded funds in which it invests. Further, certain exchange-traded funds in which the Fund or an underlying fund may invest are leveraged, which may result in economic leverage, permitting the Fund or an underlying fund to gain exposure that is greater than would be the case in an unlevered instrument, and potentially resulting in greater volatility. |
| ∎ | Exchange-traded notes risk. Exchange-traded notes are subject to credit risk, counterparty risk, and the risk that the value of the exchange-traded note may drop due to a downgrade in the issuer’s credit rating. The value of an exchange-traded note may also be influenced by time to maturity, level of supply and demand for the exchange-traded note, volatility and lack of liquidity in the underlying market, changes in the applicable interest rates, and economic, legal, political, or geographic events that affect the referenced underlying market or assets. An underlying fund will bear its proportionate share of any fees and expenses borne by an exchange-traded note in which it invests. For certain exchange-traded notes, there may |
be restrictions on an underlying fund’s right to redeem its investment in an exchange-traded note, which is meant to be held until maturity. |
| ∎ | Foreign currency tax risk. If the US Treasury Department were to exercise its authority to issue regulations that exclude from the definition of “qualifying income” foreign currency gains not directly related to an underlying fund’s business of investing in securities, the underlying fund may be unable to qualify as a regulated investment company for one or more years. In this event, the underlying fund’s Board of Trustees may authorize a significant change in investment strategy or other action. |
| ∎ | Foreign government debt risk. Investments in foreign government debt securities (sometimes referred to as sovereign debt securities) involve certain risks in addition to those relating to foreign securities or debt securities generally. The issuer of the debt or the governmental authorities that control the repayment of the debt may be unable or unwilling to repay principal or interest when due in accordance with the terms of such debt, and the Fund may have limited recourse in the event of a default against the defaulting government. Without the approval of debt holders, some governmental debtors have in the past been able to reschedule or restructure their debt payments or declare moratoria on payments. |
| ∎ | Foreign securities risk. An underlying fund’s foreign investments may be adversely affected by political and social instability, changes in economic or taxation policies, difficulty in enforcing obligations, decreased liquidity or increased volatility. Foreign investments also involve the risk of the possible seizure, nationalization or expropriation of the issuer or foreign deposits (in which an underlying fund could lose its entire investments in a certain market) and the possible adoption of foreign governmental restrictions such as exchange controls. Unless an underlying fund has hedged its foreign securities risk, foreign securities risk also involves the risk of negative foreign currency rate fluctuations, which may cause the value of securities denominated in such foreign currency (or other instruments through which an underlying fund has exposure to foreign currencies) to decline in value. Currency exchange rates may fluctuate significantly over short periods of time. Currency hedging strategies, if used, are not always successful. |
| ∎ | High yield debt securities (junk bond) risk. Investments in high yield debt securities (“junk bonds”) and other lower-rated securities will subject an underlying fund to substantial risk of loss. These securities are considered to be speculative with respect to the issuer’s ability to pay interest and principal when due, are more susceptible to default or decline in market value and are less liquid than investment grade debt securities. Prices of high yield debt securities tend to be very volatile. |
| ∎ | Investing in the European Union risk. Investments in certain countries in the European Union are susceptible to high economic risks associated with high levels of debt, such as investments in sovereign debt of Greece, Italy and Spain. Efforts of the member states to further unify their economic and monetary policies may increase the potential for the downward movement of one member state’s market to cause a similar effect on other member states’ markets. Separately, the European Union faces issues involving its membership, structure, procedures and policies. The exit of one or more member states from the European Union, such as the United Kingdom (UK) which has announced its intention to exit, would place its currency and banking system in jeopardy. The exit by the UK or other member states will likely result in increased volatility, illiquidity and potentially lower economic growth in the affected markets, which will adversely affect an underlying fund’s investments. |
| ∎ | Management risk. There is no guarantee that the underlying funds’ portfolio manager’s investment selection process will produce a portfolio effective at achieving the underlying fund’s respective investment objective. In addition, certain underlying funds’ investment strategies will likely cause the underlying fund to underperform the broader equity markets in which the underlying fund invests during market rallies. Further, the portfolio managers’ use of instruments that provide economic leverage increases the volatility of an underlying fund’s net asset value, which increases the potential of greater losses that may cause an underlying fund to liquidate positions when it may not be advantageous to do so. |
| ∎ | Market risk. The market values of an underlying fund’s investments, and therefore the value of an underlying fund’s shares, will go up and down, |
10 Invesco Alternative Strategies Fund
sometimes rapidly or unpredictably. Market risk may affect a single issuer, industry or section of the economy, or it may affect the market as a whole. Individual stock prices tend to go up and down more dramatically than those of certain other types of investments, such as bonds. During a general downturn in the financial markets, multiple asset classes may decline in value. When markets perform well, there can be no assurance that specific investments held by an underlying fund will rise in value. |
| ∎ | Preferred securities risk. Preferred securities are subject to issuer-specific and market risks applicable generally to equity securities. Preferred securities also may be subordinated to bonds or other debt instruments, subjecting them to a greater risk of non-payment, may be less liquid than many other securities, such as common stocks, and generally offer no voting rights with respect to the issuer. |
| ∎ | Sector focus risk. An underlying fund may from time to time invest a significant amount of its assets (i.e. over 25%) in one market sector or group of related industries. In this event, an underlying fund’s performance will depend to a greater extent on the overall condition of the sector or group of industries and there is increased risk that an underlying fund will lose significant value if conditions adversely affect that sector or group of industries. |
| ∎ | Short position risk. Because an underlying fund’s potential loss on a short position arises from increases in the value of the asset sold short, the underlying fund will incur a loss on a short position, which is theoretically unlimited, if the price of the asset sold short increases from the short sale price. The counterparty to a short position or other market factors may prevent an underlying fund from closing out a short position at a desirable time or price and may reduce or eliminate any gain or result in a loss. In a rising market, an underlying fund’s short positions will cause the underlying fund to underperform the overall market and its peers that do not engage in shorting. If an underlying fund holds both long and short positions, and both positions decline simultaneously, the short positions will not provide any buffer (hedge) from declines in value of the underlying fund’s long positions. Certain types of short positions involve leverage, which may exaggerate any |
| losses, potentially more than the actual cost of the investment, and will increase the volatility of an underlying fund’s returns. |
| ∎ | Small- and mid-capitalization companies risks. Small- and mid-capitalization companies tend to be more vulnerable to changing market conditions, may have little or no operating history or track record of success, and may have more limited product lines and markets, less experienced management and fewer financial resources than larger companies. These companies’ securities may be more volatile and less liquid than those of more established companies, and their returns may vary, sometimes significantly, from the overall securities market. |
| ∎ | Subsidiary risk. By investing in the Subsidiary, an underlying fund is indirectly exposed to risks associated with the Subsidiary’s investments. The Subsidiary is not registered under the Investment Company Act of 1940, as amended (1940 Act), and, except as otherwise noted in this prospectus, is not subject to the investor protections of the 1940 Act. Changes in the laws of the United States and/or the Cayman Islands, under which an underlying fund and the Subsidiary, respectively, are organized, could result in the inability of an underlying fund and/or the Subsidiary to operate as described in this prospectus and the SAI, and could negatively affect an underlying fund and its shareholders. |
| ∎ | US government obligations risk. Obligations of US government agencies and authorities receive varying levels of support and may not be backed by the full faith and credit of the US government, which could affect an underlying fund’s ability to recover should they default. No assurance can be given that the US government will provide financial support to its agencies and authorities if it is not obligated by law to do so. |
| ∎ | Volatility risk. Although an underlying fund’s investment strategy targets a specific volatility level, certain of an underlying fund’s investments may appreciate or decrease significantly in value over short periods of time. This may cause an underlying fund’s net asset value per share to experience significant increases or declines in value over short periods of time. |
About indexes used in this report
| ∎ | The FTSE US 3-Month Treasury Bill Index is an unmanaged index representative of three-month Treasury bills. |
| ∎ | The Lipper Alternative Multi-Strategy Funds Classification Average represents an average of all funds in the Lipper Alternative Multi-Strategy Funds classification. |
| ∎ | The Fund is not managed to track the performance of any particular index, including the index(es) described here, and consequently, the performance of the Fund may deviate significantly from the performance of the index(es). |
| ∎ | A direct investment cannot be made in an index. Unless otherwise indicated, index results include reinvested dividends, and they do not reflect sales charges. Performance of the peer group, if applicable, reflects fund expenses; performance of a market index does not. |
Other information
| ∎ | The returns shown in management’s discussion of Fund performance are based on net asset values (NAVs) calculated for shareholder transactions. Generally accepted accounting principles require adjustments to be made to the net assets of the Fund at period end for financial reporting purposes, and as such, the NAVs for shareholder transactions and the returns based on those NAVs may differ from the NAVs and returns reported in the Financial Highlights. |
11 Invesco Alternative Strategies Fund
Schedule of Investments
December 31, 2017
Invesco Alternative Strategies Fund
Schedule of Investments in Affiliated Issuers–99.87%(a)
| % of Net Assets 12/31/17 | Value 12/31/16 | Purchases at Cost | Proceeds from Sales | Change in Unrealized Appreciation (Depreciation) | Realized Gain (Loss) | Dividend Income | Shares 12/31/17 | Value 12/31/17 | ||||||||||||||||||||||||||||
Alternative Funds–24.13% |
| |||||||||||||||||||||||||||||||||||
Invesco Global Targeted Returns Fund | 19.53 | % | $ | — | $ | 553,170 | $ | (38,552 | ) | $ | (2,719 | ) | $ | (144 | ) | $ | — | 51,381 | $ | 511,755 | ||||||||||||||||
Powershares DB Base Metals Fund–ETF(b) | 2.56 | % | 36,867 | 28,493 | (12,825 | ) | 13,428 | 1,021 | — | 3,451 | 66,984 | |||||||||||||||||||||||||
Powershares DB Silver Fund–ETF(b) | 2.04 | % | 30,031 | 31,113 | (9,328 | ) | 2,285 | (583 | ) | 32 | 2,056 | 53,518 | ||||||||||||||||||||||||
Total Alternative Funds | 66,898 | 612,776 | (60,705 | ) | 12,994 | 294 | 32 | 632,257 | ||||||||||||||||||||||||||||
Asset Allocation Funds–31.30% |
| |||||||||||||||||||||||||||||||||||
Invesco Balanced-Risk Allocation Fund | 15.56 | % | 261,214 | 311,710 | (176,479 | ) | 17,141 | 18,521 | — | 37,033 | 407,737 | |||||||||||||||||||||||||
Invesco Balanced-Risk Commodity Strategy Fund–Class R6 | 2.46 | % | 35,302 | 33,555 | (8,211 | ) | 4,189 | (535 | ) | 28 | 8,993 | 64,300 | ||||||||||||||||||||||||
Invesco Macro Allocation Strategy Fund–Class R6(b) | 13.28 | % | 231,053 | 246,569 | (138,514 | ) | 18,451 | 5,418 | — | 36,706 | 347,980 | |||||||||||||||||||||||||
Total Asset Allocation Funds | 527,569 | 591,834 | (323,204 | ) | 39,781 | 23,404 | 28 | 820,017 | ||||||||||||||||||||||||||||
Domestic Equity Funds–16.89% |
| |||||||||||||||||||||||||||||||||||
Invesco All Cap Market Neutral Fund–Class R6(b) | 12.86 | % | 264,570 | 291,768 | (151,371 | ) | (64,429 | ) | 36,694 | — | 39,865 | 336,860 | ||||||||||||||||||||||||
Invesco Long/Short Equity Fund–Class R6 | 4.03 | % | 59,633 | 63,883 | (20,407 | ) | 1,304 | 8,364 | 7,459 | 8,793 | 105,513 | |||||||||||||||||||||||||
Total Domestic Equity Funds | 324,203 | 355,651 | (171,778 | ) | (63,125 | ) | 45,058 | 7,459 | 442,373 | |||||||||||||||||||||||||||
Fixed-Income Funds–1.97% | ||||||||||||||||||||||||||||||||||||
Invesco Floating Rate Fund–Class R6 | 1.97 | % | 30,701 | 24,162 | (3,172 | ) | (84 | ) | (27 | ) | 1,865 | 6,823 | 51,580 | |||||||||||||||||||||||
Foreign Equity Funds–21.19% | ||||||||||||||||||||||||||||||||||||
Invesco Global Infrastructure Fund–Class R6 | 3.71 | % | 59,858 | 48,592 | (19,385 | ) | 8,180 | 2,294 | 2,258 | 9,246 | 97,359 | |||||||||||||||||||||||||
Invesco Global Market Neutral Fund–Class R6(b) | 17.48 | % | 281,603 | 361,017 | (151,021 | ) | (32,037 | ) | 29,842 | — | 49,290 | 457,902 | ||||||||||||||||||||||||
Invesco Macro Long/Short Fund–Class R6(b) | 0.00 | % | 167,944 | 8,702 | (178,037 | ) | (3,641 | ) | 5,032 | — | — | — | ||||||||||||||||||||||||
Total Foreign Equity Funds | 509,405 | 418,311 | (348,443 | ) | (27,498 | ) | 37,168 | 2,258 | 555,261 | |||||||||||||||||||||||||||
Real Estate Funds–3.90% | ||||||||||||||||||||||||||||||||||||
Invesco Global Real Estate Fund–Class R6 | 3.90 | % | 59,701 | 47,842 | (12,724 | ) | 7,678 | 379 | 2,342 | 7,598 | 102,269 | |||||||||||||||||||||||||
Money Market Funds–0.49% | ||||||||||||||||||||||||||||||||||||
Invesco Government & Agency Portfolio–Institutional Class, 1.18%(d) | 0.17 | % | 5,459 | 669,043 | (669,993 | ) | — | — | 89 | 4,509 | 4,509 | |||||||||||||||||||||||||
Invesco Liquid Assets Portfolio–Institutional Class, 1.40%(d) | 0.12 | % | — | 5,981 | (2,761 | ) | — | — | 2 | 3,220 | 3,220 | |||||||||||||||||||||||||
Invesco Treasury Portfolio–Institutional Class, 1.17%(d) | 0.20 | % | 4,083 | 446,767 | (445,697 | ) | — | — | 58 | 5,153 | 5,153 | |||||||||||||||||||||||||
Total Money Market Funds | 9,542 | 1,121,791 | (1,118,451 | ) | — | — | 149 | 12,882 | ||||||||||||||||||||||||||||
TOTAL INVESTMENTS IN AFFILIATED ISSUERS | 99.87 | % | $ | 1,528,019 | $ | 3,172,367 | $ | (2,038,477 | ) | $ | (30,254 | ) | $ | 106,276 | (c) | $ | 14,133 | $ | 2,616,639 | |||||||||||||||||
OTHER ASSETS LESS LIABILITIES | 0.13 | % | 3,444 | |||||||||||||||||||||||||||||||||
NET ASSETS | 100.00 | % | $ | 2,620,083 | ||||||||||||||||||||||||||||||||
Investment Abbreviations:
ETF – Exchange Traded Fund
Notes to Schedule of Investments:
| (a) | Each underlying fund and the Fund are affiliated by either having the same investment adviser or an investment adviser under common control with the Fund’s investment adviser. |
| (b) | Non-income producing security. A security is determined to be non-income producing if the security has not declared a distribution in more than one year from the report date. |
| (c) | Includes $24,370, $14,997, $40,372, $7,264, $2,180, $31,502 and $607 of capital gains distributions from affiliated underlying funds for Invesco Balanced-Risk Allocation Fund, Invesco Macro Allocation Strategy Fund, Invesco All Cap Market Neutral Fund, Invesco Long/Short Equity Fund, Invesco Global Infrastructure Fund, Invesco Global Market Neutral Fund and Invesco Global Real Estate Fund, respectively. |
| (d) | The rate shown is the 7-day SEC standardized yield as of December 31, 2017. |
See accompanying Notes to Financial Statements which are an integral part of the financial statements.
12 Invesco Alternative Strategies Fund
Statement of Assets and Liabilities
December 31, 2017
Assets: | ||||
Investments in affiliated underlying funds, at value (Cost $2,640,857) | $ | 2,616,639 | ||
Receivable for: | ||||
Fund shares sold | 2,516 | |||
Dividends — affiliated underlying funds | 260 | |||
Fund expenses absorbed | 4,690 | |||
Investment for trustee deferred compensation and retirement plans | 8,152 | |||
Other assets | 30,801 | |||
Total assets | 2,663,058 | |||
Liabilities: | ||||
Payable for: | ||||
Investments purchased — affiliated underlying funds | 197 | |||
Accrued fees to affiliates | 2,158 | |||
Accrued trustees’ and officers’ fees and benefits | 640 | |||
Accrued other operating expenses | 31,828 | |||
Trustee deferred compensation and retirement plans | 8,152 | |||
Total liabilities | 42,975 | |||
Net assets applicable to shares outstanding | $ | 2,620,083 | ||
Net assets consist of: | ||||
Shares of beneficial interest | $ | 2,594,559 | ||
Undistributed net investment income | 3,705 | |||
Undistributed net realized gain | 46,037 | |||
Net unrealized appreciation (depreciation) | (24,218 | ) | ||
| $ | 2,620,083 | |||
Net Assets: | ||||
Class A | $ | 948,453 | ||
Class C | $ | 180,869 | ||
Class R | $ | 18,365 | ||
Class Y | $ | 1,452,754 | ||
Class R5 | $ | 9,821 | ||
Class R6 | $ | 9,821 | ||
Shares outstanding, no par value, | ||||
Class A | 96,847 | |||
Class C | 18,607 | |||
Class R | 1,879 | |||
Class Y | 147,893 | |||
Class R5 | 1,001 | |||
Class R6 | 1,001 | |||
Class A: | ||||
Net asset value per share | $ | 9.79 | ||
Maximum offering price per share | ||||
(Net asset value of $9.79 ¸ 94.50%) | $ | 10.36 | ||
Class C: | ||||
Net asset value and offering price per share | $ | 9.72 | ||
Class R: | ||||
Net asset value and offering price per share | $ | 9.77 | ||
Class Y: | ||||
Net asset value and offering price per share | $ | 9.82 | ||
Class R5: | ||||
Net asset value and offering price per share | $ | 9.81 | ||
Class R6: | ||||
Net asset value and offering price per share | $ | 9.81 | ||
See accompanying Notes to Financial Statements which are an integral part of the financial statements.
13 Invesco Alternative Strategies Fund
Statement of Operations
For the year ended December 31, 2017
Investment income: | ||||
Dividends from affiliated underlying funds | $ | 14,133 | ||
Expenses: | ||||
Advisory fees | 3,286 | |||
Administrative services fees | 50,000 | |||
Custodian fees | 8,406 | |||
Distribution fees: | ||||
Class A | 2,234 | |||
Class C | 1,779 | |||
Class R | 91 | |||
Transfer agent fees — A, C, R and Y | 5,935 | |||
Transfer agent fees — R5 | 10 | |||
Transfer agent fees — R6 | 10 | |||
Trustees’ and officers’ fees and benefits | 20,650 | |||
Registration and filing fees | 78,293 | |||
Reports to shareholders | 18,144 | |||
Professional services fees | 42,841 | |||
Other | 10,897 | |||
Total expenses | 242,576 | |||
Less: Fees waived, expenses reimbursed and expense offset arrangement(s) | (237,402 | ) | ||
Net expenses | 5,174 | |||
Net investment income | 8,959 | |||
Realized and unrealized gain (loss) from investments in affiliated underlying fund shares | ||||
Net realized gain (loss) on sales of affiliated underlying fund shares | (15,016 | ) | ||
Net realized gain from distributions of affiliated underlying fund shares | 121,292 | |||
| 106,276 | ||||
Change in net unrealized appreciation (depreciation) of affiliated underlying fund shares | (30,254 | ) | ||
Net gain from affiliated underlying funds | 76,022 | |||
Net increase in net assets resulting from operations | $ | 84,981 | ||
See accompanying Notes to Financial Statements which are an integral part of the financial statements.
14 Invesco Alternative Strategies Fund
Statement of Changes in Net Assets
For the years ended December 31, 2017 and 2016
| 2017 | 2016 | |||||||
Operations: | ||||||||
Net investment income | $ | 8,959 | $ | 39,848 | ||||
Net realized gain (loss) | 106,276 | (11,699 | ) | |||||
Change in net unrealized appreciation (depreciation) | (30,254 | ) | 44,710 | |||||
Net increase in net assets resulting from operations | 84,981 | 72,859 | ||||||
Distributions to shareholders from net investment income: | ||||||||
Class A | (6,842 | ) | (28,320 | ) | ||||
Class C | (356 | ) | (4,558 | ) | ||||
Class R | (99 | ) | (575 | ) | ||||
Class Y | (13,866 | ) | (17,612 | ) | ||||
Class R5 | (95 | ) | (353 | ) | ||||
Class R6 | (95 | ) | (353 | ) | ||||
Total distributions from net investment income | (21,353 | ) | (51,771 | ) | ||||
Distributions to shareholders from net realized gains: | ||||||||
Class A | (2,538 | ) | (264 | ) | ||||
Class C | (622 | ) | (52 | ) | ||||
Class R | (50 | ) | (6 | ) | ||||
Class Y | (3,917 | ) | (155 | ) | ||||
Class R5 | (27 | ) | (3 | ) | ||||
Class R6 | (27 | ) | (3 | ) | ||||
Total distributions from net realized gains | (7,181 | ) | (483 | ) | ||||
Share transactions–net: | ||||||||
Class A | 69,894 | 354,562 | ||||||
Class C | 16,225 | 56,719 | ||||||
Class R | 75 | (620 | ) | |||||
Class Y | 928,614 | 234,568 | ||||||
Net increase in net assets resulting from share transactions | 1,014,808 | 645,229 | ||||||
Net increase in net assets | 1,071,255 | 665,834 | ||||||
Net assets: | ||||||||
Beginning of year | 1,548,828 | 882,994 | ||||||
End of year (includes undistributed net investment income of $3,705 and $(796), respectively) | $ | 2,620,083 | $ | 1,548,828 | ||||
Notes to Financial Statements
December 31, 2017
NOTE 1—Significant Accounting Policies
Invesco Alternative Strategies Fund (the “Fund”) is a series portfolio of AIM Growth Series (Invesco Growth Series) (the “Trust”). The Trust is organized as a Delaware statutory trust and is registered under the Investment Company Act of 1940, as amended (the “1940 Act”), as an open-end series management investment company consisting of twenty-nine separate series portfolios, each authorized to issue an unlimited number of shares of beneficial interest. The assets, liabilities and operations of each portfolio are accounted for separately. Information presented in these financial statements pertains only to the Fund. Matters affecting each portfolio or class will be voted on exclusively by the shareholders of such portfolio or class.
The Fund’s investment objective is long-term capital appreciation.
The Fund is a “fund of funds”, in that it invests in other mutual funds (“underlying funds”) advised by Invesco Advisers, Inc. (the “Adviser” or “Invesco”) and exchange-traded funds advised by Invesco PowerShares Capital Management LLC (“PowerShares Capital”), an affiliate of Invesco. Invesco and PowerShares Capital are affiliates of each other as they are indirect, wholly-owned subsidiaries of Invesco Ltd. Invesco may change the Fund’s asset class allocations or the underlying funds without shareholder approval. The underlying funds may engage in a number of investment techniques and practices, which involve certain risks. Each underlying fund’s accounting policies are outlined in the underlying fund’s financial statements and are publicly available.
15 Invesco Alternative Strategies Fund
The Fund currently consists of six different classes of shares: Class A, Class C, Class R, Class Y, Class R5 and Class R6. Class Y shares are available only to certain investors. Class A shares are sold with a front-end sales charge unless certain waiver criteria are met and under certain circumstances load waived shares may be subject to contingent deferred sales charges (“CDSC”). Class C shares are sold with a CDSC. Class R, Class Y, Class R5 and Class R6 shares are sold at net asset value.
The Fund is an investment company and accordingly follows the investment company accounting and reporting guidance in accordance with Financial Accounting Standards Board Accounting Standards Codification Topic 946, Financial Services — Investment Companies.
The following is a summary of the significant accounting policies followed by the Fund in the preparation of its financial statements.
| A. | Security Valuations — Securities of investment companies that trade on an exchange are valued at the last sales price or official closing price as of the close of the customary trading session on the exchange where the security is principally traded. Investments in shares of funds that are not traded on an exchange are valued at the end-of-day net asset value per share of such fund. Securities in the underlying funds, including restricted securities, are valued in accordance with the valuation policy of such fund. The policies of the underlying funds affiliated with the Fund as a result of having the same investment adviser are set forth below. |
A security listed or traded on an exchange (except convertible securities) is valued at its last sales price or official closing price as of the close of the customary trading session on the exchange where the security is principally traded, or lacking any sales or official closing price on a particular day, the security may be valued at the closing bid price on that day. Securities traded in the over-the-counter market are valued based on prices furnished by independent pricing services or market makers. When such securities are valued by an independent pricing service they may be considered fair valued. Futures contracts are valued at the final settlement price set by an exchange on which they are principally traded. Listed options are valued at the mean between the last bid and asked prices from the exchange on which they are principally traded. Options not listed on an exchange are valued by an independent source at the mean between the last bid and asked prices. For purposes of determining net asset value (“NAV”) per share, futures and option contracts generally are valued 15 minutes after the close of the customary trading session of the New York Stock Exchange (“NYSE”).
Variable rate senior loan interests are fair valued using quotes provided by an independent pricing service. Quotes provided by the pricing service may reflect appropriate factors such as ratings, tranche type, industry, company performance, spread, individual trading characteristics, institution-size trading in similar groups of securities and other market data.
Investments in open-end and closed-end registered investment companies that do not trade on an exchange are valued at the end-of-day net asset value per share. Investments in open-end and closed-end registered investment companies that trade on an exchange are valued at the last sales price or official closing price as of the close of the customary trading session on the exchange where the security is principally traded.
Debt obligations (including convertible securities) and unlisted equities are fair valued using an evaluated quote provided by an independent pricing service. Evaluated quotes provided by the pricing service may be determined without exclusive reliance on quoted prices, and may reflect appropriate factors such as institution-size trading in similar groups of securities, developments related to specific securities, dividend rate (for unlisted equities), yield (for debt obligations), quality, type of issue, coupon rate (for debt obligations), maturity (for debt obligations), individual trading characteristics and other market data. Pricing services generally value debt obligations assuming orderly transactions of institutional round lot size, but a fund may hold or transact in the same securities in smaller, odd lot sizes. Odd lots often trade at lower prices than institutional round lots. Debt obligations are subject to interest rate and credit risks. In addition, all debt obligations involve some risk of default with respect to interest and/or principal payments.
Foreign securities’ (including foreign exchange contracts) prices are converted into U.S. dollar amounts using the applicable exchange rates as of the close of the NYSE. If market quotations are available and reliable for foreign exchange-traded equity securities, the securities will be valued at the market quotations. Because trading hours for certain foreign securities end before the close of the NYSE, closing market quotations may become unreliable. If between the time trading ends on a particular security and the close of the customary trading session on the NYSE, events occur that the investment adviser determines are significant and make the closing price unreliable, the Fund may fair value the security. If the event is likely to have affected the closing price of the security, the security will be valued at fair value in good faith using procedures approved by the Board of Trustees. Adjustments to closing prices to reflect fair value may also be based on a screening process of an independent pricing service to indicate the degree of certainty, based on historical data, that the closing price in the principal market where a foreign security trades is not the current value as of the close of the NYSE. Foreign securities’ prices meeting the approved degree of certainty that the price is not reflective of current value will be priced at the indication of fair value from the independent pricing service. Multiple factors may be considered by the independent pricing service in determining adjustments to reflect fair value and may include information relating to sector indices, American Depositary Receipts and domestic and foreign index futures. Foreign securities may have additional risks including exchange rate changes, potential for sharply devalued currencies and high inflation, political and economic upheaval, the relative lack of issuer information, relatively low market liquidity and the potential lack of strict financial and accounting controls and standards.
Securities for which market prices are not provided by any of the above methods may be valued based upon quotes furnished by independent sources. The last bid price may be used to value equity securities. The mean between the last bid and asked prices is used to value debt obligations, including corporate loans.
Securities for which market quotations are not readily available or became unreliable are valued at fair value as determined in good faith by or under the supervision of the Trust’s officers following procedures approved by the Board of Trustees. Issuer specific events, market trends, bid/asked quotes of brokers and information providers and other market data may be reviewed in the course of making a good faith determination of a security’s fair value.
The Fund may invest in securities that are subject to interest rate risk, meaning the risk that the prices will generally fall as interest rates rise and, conversely, the prices will generally rise as interest rates fall. Specific securities differ in their sensitivity to changes in interest rates depending on their individual characteristics. Changes in interest rates may result in increased market volatility, which may affect the value and/or liquidity of certain Fund investments.
Valuations change in response to many factors including the historical and prospective earnings of the issuer, the value of the issuer’s assets, general economic conditions, interest rates, investor perceptions and market liquidity. Because of the inherent uncertainties of valuation, the values reflected in the financial statements may materially differ from the value received upon actual sale of those investments.
16 Invesco Alternative Strategies Fund
| B. | Securities Transactions and Investment Income — Securities transactions are accounted for on a trade date basis. Realized gains or losses on sales are computed on the basis of specific identification of the securities sold. Distributions from ordinary income from underlying funds, if any, are recorded as dividend income on ex-dividend date. Distributions from gains from underlying funds, if any, are recorded as realized gains on the ex-dividend date. The following policies are followed by the underlying funds: Interest income (net of withholding tax, if any) is recorded on the accrual basis from settlement date. Bond premiums and discounts are amortized and/or accreted over the lives of the respective securities. Pay-in-kind interest income and non-cash dividend income received in the form of securities in-lieu of cash are recorded at the fair value of the securities received. Paydown gains and losses on mortgage and asset-backed securities are recorded as adjustments to interest income. |
The Fund may periodically participate in litigation related to Fund investments. As such, the Fund may receive proceeds from litigation settlements. Any proceeds received are included in the Statement of Operations as realized gain (loss) for investments no longer held and as unrealized gain (loss) for investments still held.
The Fund allocates income and realized and unrealized capital gains and losses to a class based on the relative net assets of each class.
| C. | Distributions — Distributions from net investment income and net realized capital gain, if any, are generally declared and paid annually and recorded on the ex-dividend date. The Fund may elect to treat a portion of the proceeds from redemptions as distributions for federal income tax purposes. |
| D. | Federal Income Taxes — The Fund intends to comply with the requirements of Subchapter M of the Internal Revenue Code of 1986, as amended (the “Internal Revenue Code”), necessary to qualify as a regulated investment company and to distribute substantially all of the Fund’s taxable earnings to shareholders. As such, the Fund will not be subject to federal income taxes on otherwise taxable income (including net realized capital gain) that is distributed to shareholders. Therefore, no provision for federal income taxes is recorded in the financial statements. |
The Fund recognizes the tax benefits of uncertain tax positions only when the position is more likely than not to be sustained. Management has analyzed the Fund’s uncertain tax positions and concluded that no liability for unrecognized tax benefits should be recorded related to uncertain tax positions. Management is not aware of any tax positions for which it is reasonably possible that the total amounts of unrecognized tax benefits will change materially in the next 12 months.
The Fund files tax returns in the U.S. Federal jurisdiction and certain other jurisdictions. Generally, the Fund is subject to examinations by such taxing authorities for up to three years after the filing of the return for the tax period.
| E. | Expenses — Expenses included in the accompanying financial statements reflect the expenses of the Fund and do not include any expenses of the underlying funds. The effects of the underlying funds expenses are included in the realized and unrealized gain/loss on the investments in the underlying funds. Estimated expenses of the underlying funds are discussed further in Note 11. |
Fees provided for under the Rule 12b-1 plan of a particular class of the Fund and which are directly attributable to that class are charged to the operations of such class. Transfer agency fees and expenses and other shareholder recordkeeping fees and expenses attributable to Class R5 and Class R6 are allocated to each share class based on relative net assets. Transfer agency fees and expenses and other shareholder recordkeeping fees and expenses relating to all other classes are allocated among those classes based on relative net assets. All other expenses are allocated among the classes based on relative net assets.
| F. | Accounting Estimates — The preparation of financial statements in conformity with accounting principles generally accepted in the United States of America (“GAAP”) requires management to make estimates and assumptions that affect the reported amounts of assets and liabilities at the date of the financial statements and the reported amounts of revenues and expenses during the reporting period including estimates and assumptions related to taxation. Actual results could differ from those estimates by a significant amount. In addition, the Fund monitors for material events or transactions that may occur or become known after the period-end date and before the date the financial statements are released to print. |
| G. | Indemnifications — Under the Trust’s organizational documents, each Trustee, officer, employee or other agent of the Trust is indemnified against certain liabilities that may arise out of the performance of their duties to the Fund. Additionally, in the normal course of business, the Fund enters into contracts, including the Fund’s servicing agreements, that contain a variety of indemnification clauses. The Fund’s maximum exposure under these arrangements is unknown as this would involve future claims that may be made against the Fund that have not yet occurred. The risk of material loss as a result of such indemnification claims is considered remote. |
NOTE 2—Advisory Fees and Other Fees Paid to Affiliates
The Trust has entered into a master investment advisory agreement with Invesco Advisers, Inc. (the “Adviser” or “Invesco”). Under the terms of the investment advisory agreement, the Fund accrues daily and pays monthly an advisory fee to the Adviser based on the annual rate of 0.15% of the Fund’s average daily net assets.
Under the terms of a master sub-advisory agreement between the Adviser and each of Invesco Asset Management Deutschland GmbH, Invesco Asset Management Limited, Invesco Asset Management (Japan) Limited, Invesco Hong Kong Limited, Invesco Senior Secured Management, Inc. and Invesco Canada Ltd. and separate sub-advisory agreements with Invesco PowerShares Capital Management LLC and Invesco Asset Management (India) Private Limited (collectively, the “Affiliated Sub-Advisers”) the Adviser, not the Fund, will pay 40% of the fees paid to the Adviser to any such Affiliated Sub-Adviser(s) that provide(s) discretionary investment management services to the Fund based on the percentage of assets allocated to such Affiliated Sub-Adviser(s).
The Adviser has contractually agreed, through at least April 30, 2019, to waive advisory fees and/or reimburse expenses to the extent necessary to limit total annual fund operating expenses after fee waiver and/or expense reimbursement (including prior fiscal year-end Acquired Fund Fees and Expenses of 1.14% and excluding certain items discussed below) of Class A, Class C, Class R, Class Y, Class R5 and Class R6 shares to 1.44%, 2.19%, 1.69%, 1.19%, 1.19% and 1.19%, respectively, of average daily net assets (the “expense limits”). In determining the Adviser’s obligation to reimburse expenses, the following expenses are not taken into account, and could cause the total annual fund operating expenses after expense reimbursement to exceed the numbers reflected above: (1) interest; (2) taxes; (3) dividend expense on short sales; (4) extraordinary or non-routine items, including litigation expenses; and (5) expenses that the Fund has incurred but did not actually pay because of an expense offset arrangement. Acquired Fund Fees and Expenses are not operating expenses of the Fund directly, but are fees and expenses, including management fees of the investment companies in which the Fund invests. Unless Invesco continues the fee waiver agreement, it will terminate on April 30, 2019. During its
17 Invesco Alternative Strategies Fund
term, the fee waiver agreement cannot be terminated or amended to increase the expense limits or reduce the advisory fee waiver without approval of the Board of Trustees.
Further, the Adviser has contractually agreed, through at least June 30, 2019, to waive the advisory fee payable by the Fund in an amount equal to 100% of the net advisory fees the Adviser receives from the affiliated money market funds on investments by the Fund of uninvested cash in such affiliated money market funds.
For the year ended December 31, 2017, the Adviser waived advisory fees of $3,286, reimbursed fund level expenses of $228,161 and reimbursed class level expenses of $2,399, $478, $49, $2,904, $10 and $10 of Class A, Class C, Class R, Class Y, Class R5 and Class R6 shares, respectively.
The Trust has entered into a master administrative services agreement with Invesco pursuant to which the Fund has agreed to pay Invesco for certain administrative costs incurred in providing accounting services to the Fund. For the year ended December 31, 2017, expenses incurred under the agreement are shown in the Statement of Operations as Administrative services fees.
The Trust has entered into a transfer agency and service agreement with Invesco Investment Services, Inc. (“IIS”) pursuant to which the Fund has agreed to pay IIS a fee for providing transfer agency and shareholder services to the Fund and reimburse IIS for certain expenses incurred by IIS in the course of providing such services. IIS may make payments to intermediaries that provide omnibus account services, sub-accounting services and/or networking services. All fees payable by IIS to intermediaries that provide omnibus account services or sub-accounting services are charged back to the Fund, subject to certain limitations approved by the Trust’s Board of Trustees. For the year ended December 31, 2017, expenses incurred under the agreement are shown in the Statement of Operations as Transfer agent fees.
The Trust has entered into master distribution agreements with Invesco Distributors, Inc. (“IDI”) to serve as the distributor for the Class A, Class C, Class R, Class Y, Class R5 and Class R6 shares of the Fund. The Trust has adopted plans pursuant to Rule 12b-1 under the 1940 Act with respect to the Fund’s Class A, Class C and Class R shares (collectively, the “Plans”). The Fund, pursuant to the Plans, pays IDI compensation at the annual rate of 0.25% of the Fund’s average daily net assets of Class A shares, 1.00% of the average daily net assets of Class C shares and 0.50% of the average daily net assets of Class R shares. The fees are accrued daily and paid monthly. Of the Plan payments, up to 0.25% of the average daily net assets of each class of shares may be paid to furnish continuing personal shareholder services to customers who purchase and own shares of such classes. Any amounts not paid as a service fee under the Plans would constitute an asset-based sales charge. Rules of the Financial Industry Regulatory Authority (“FINRA”) impose a cap on the total sales charges, including asset-based sales charges, that may be paid by any class of shares of the Fund. For the year ended December 31, 2017, expenses incurred under the Plans are shown in the Statement of Operations as Distribution fees.
Front-end sales commissions and CDSC (collectively, the “sales charges”) are not recorded as expenses of the Fund. Front-end sales commissions are deducted from proceeds from the sales of Fund shares prior to investment in Class A shares of the Fund. CDSC are deducted from redemption proceeds prior to remittance to the shareholder. During the year ended December 31, 2017, IDI advised the Fund that IDI retained $271 in front-end sales commissions from the sale of Class A shares and $13 from Class C shares for CDSC imposed on redemptions by shareholders.
The underlying Invesco funds pay no distribution fees for Class Y and Class R6, and the Fund pays no sales loads or other similar compensation to IDI for acquiring underlying fund shares.
Certain officers and trustees of the Trust are officers and directors of the Adviser, IIS and/or IDI.
NOTE 3—Additional Valuation Information
GAAP defines fair value as the price that would be received to sell an asset or paid to transfer a liability in an orderly transaction between market participants at the measurement date, under current market conditions. GAAP establishes a hierarchy that prioritizes the inputs to valuation methods, giving the highest priority to readily available unadjusted quoted prices in an active market for identical assets (Level 1) and the lowest priority to significant unobservable inputs (Level 3), generally when market prices are not readily available or are unreliable. Based on the valuation inputs, the securities or other investments are tiered into one of three levels. Changes in valuation methods may result in transfers in or out of an investment’s assigned level:
| Level 1 — | Prices are determined using quoted prices in an active market for identical assets. |
| Level 2 — | Prices are determined using other significant observable inputs. Observable inputs are inputs that other market participants may use in pricing a security. These may include quoted prices for similar securities, interest rates, prepayment speeds, credit risk, yield curves, loss severities, default rates, discount rates, volatilities and others. |
| Level 3 — | Prices are determined using significant unobservable inputs. In situations where quoted prices or observable inputs are unavailable (for example, when there is little or no market activity for an investment at the end of the period), unobservable inputs may be used. Unobservable inputs reflect the Fund’s own assumptions about the factors market participants would use in determining fair value of the securities or instruments and would be based on the best available information. |
As of December 31, 2017, all of the securities in this Fund were valued based on Level 1 inputs (see the Schedule of Investments for security categories). The level assigned to the securities valuations may not be an indication of the risk or liquidity associated with investing in those securities.
The Fund’s policy is to recognize transfers in and out of the valuation levels as of the end of the reporting period. During the year ended December 31, 2017, there were no material transfers between valuation levels.
NOTE 4—Expense Offset Arrangement(s)
The expense offset arrangement is comprised of transfer agency credits which result from balances in demand deposit accounts used by the transfer agent for clearing shareholder transactions. For the year ended December 31, 2017, the Fund received credits from this arrangement, which resulted in the reduction of the Fund’s total expenses of $105.
18 Invesco Alternative Strategies Fund
NOTE 5—Trustees’ and Officers’ Fees and Benefits
Trustees’ and Officers’ Fees and Benefits include amounts accrued by the Fund to pay remuneration to certain Trustees and Officers of the Fund. Trustees have the option to defer compensation payable by the Fund, and Trustees’ and Officers’ Fees and Benefits also include amounts accrued by the Fund to fund such deferred compensation amounts. Those Trustees who defer compensation have the option to select various Invesco Funds in which their deferral accounts shall be deemed to be invested. Obligations under the deferred compensation plan represent unsecured claims against the general assets of the Fund.
NOTE 6—Cash Balances
The Fund is permitted to temporarily carry a negative or overdrawn balance in its account with State Street Bank and Trust Company, the custodian bank. Such balances, if any at period-end, are shown in the Statement of Assets and Liabilities under the payable caption Amount due custodian. To compensate the custodian bank for such overdrafts, the overdrawn Fund may either (1) leave funds as a compensating balance in the account so the custodian bank can be compensated by earning the additional interest; or (2) compensate by paying the custodian bank at a rate agreed upon by the custodian bank and Invesco, not to exceed the contractually agreed upon rate.
NOTE 7—Distributions to Shareholders and Tax Components of Net Assets
Tax Character of Distributions to Shareholders Paid During the Fiscal Years Ended December 31, 2017 and 2016:
| 2017 | 2016 | |||||||
Ordinary income | $ | 25,442 | $ | 45,686 | ||||
Long-term capital gain | 3,092 | 6,568 | ||||||
Total distributions | $ | 28,534 | $ | 52,254 | ||||
Tax Components of Net Assets at Period-End:
| 2017 | ||||
Undistributed ordinary income | $ | 11,029 | ||
Undistributed long-term gain | 84,926 | |||
Net unrealized appreciation (depreciation) — investments | (64,028 | ) | ||
Temporary book/tax differences | (6,403 | ) | ||
Shares of beneficial interest | 2,594,559 | |||
Total net assets | $ | 2,620,083 | ||
The difference between book-basis and tax-basis unrealized appreciation (depreciation) is due to differences in the timing of recognition of gains and losses on investments for tax and book purposes. The Fund’s net unrealized appreciation (depreciation) difference is attributable primarily to wash sales.
The temporary book/tax differences are a result of timing differences between book and tax recognition of income and/or expenses. The Fund’s temporary book/tax differences are the result of the trustee deferral of compensation and retirement plan benefits.
Capital loss carryforward is calculated and reported as of a specific date. Results of transactions and other activity after that date may affect the amount of capital loss carryforward actually available for the Fund to utilize. Capital losses generated in years beginning after December 22, 2010 can be carried forward for an unlimited period, whereas previous losses expire in eight tax years. Capital losses with an expiration period may not be used to offset capital gains until all net capital losses without an expiration date have been utilized. Capital loss carryforwards with no expiration date will retain their character as either short-term or long-term capital losses instead of as short-term capital losses as under prior law. The ability to utilize capital loss carryforwards in the future may be limited under the Internal Revenue Code and related regulations based on the results of future transactions.
The Fund does not have a capital loss carryforward as of December 31, 2017.
NOTE 8—Investment Transactions
The aggregate amount of investment securities (other than short-term securities, U.S. Treasury obligations and money market funds, if any) purchased and sold by the Fund during the year ended December 31, 2017 was $2,050,576 and $920,026, respectively. Cost of investments, including any derivatives, on a tax basis includes the adjustments for financial reporting purposes as of the most recently completed federal income tax reporting period-end.
| Unrealized Appreciation (Depreciation) of Investments on a Tax Basis | ||||
Aggregate unrealized appreciation of investments | $ | 62,373 | ||
Aggregate unrealized (depreciation) of investments | (126,401 | ) | ||
Net unrealized appreciation (depreciation) of investments | $ | (64,028 | ) | |
Cost of investments for tax purposes is $2,680,667.
19 Invesco Alternative Strategies Fund
NOTE 9—Reclassification of Permanent Differences
Primarily as a result of differing book/tax treatment of distributions from underlying funds and partnerships, on December 31, 2017, undistributed net investment income was increased by $16,895 and undistributed net realized gain was decreased by $16,895. This reclassification had no effect on the net assets of the Fund.
NOTE 10—Share Information
| Summary of Share Activity | ||||||||||||||||
| Years ended December 31, | ||||||||||||||||
| 2017(a) | 2016 | |||||||||||||||
| Shares | Amount | Shares | Amount | |||||||||||||
Sold: | ||||||||||||||||
Class A | 28,060 | $ | 271,863 | 48,683 | $ | 463,511 | ||||||||||
Class C | 11,926 | 114,874 | 9,826 | 92,030 | ||||||||||||
Class R | 70 | 685 | — | — | ||||||||||||
Class Y | 101,400 | 979,722 | 47,768 | 455,982 | ||||||||||||
Issued as reinvestment of dividends: | ||||||||||||||||
Class A | 796 | 7,757 | 2,632 | 25,054 | ||||||||||||
Class C | 92 | 896 | 459 | 4,337 | ||||||||||||
Class R | 7 | 69 | 28 | 266 | ||||||||||||
Class Y | 900 | 8,792 | 1,471 | 14,034 | ||||||||||||
Reacquired: | ||||||||||||||||
Class A | (21,786 | ) | (209,726 | ) | (14,078 | ) | (134,003 | ) | ||||||||
Class C | (10,321 | ) | (99,545 | ) | (4,246 | ) | (39,648 | ) | ||||||||
Class R | (70 | ) | (679 | ) | (96 | ) | (886 | ) | ||||||||
Class Y | (6,166 | ) | (59,900 | ) | (24,896 | ) | (235,448 | ) | ||||||||
Net increase in share activity | 104,908 | $ | 1,014,808 | 67,551 | $ | 645,229 | ||||||||||
| (a) | There are entities that are record owners of more than 5% of the outstanding shares of the Fund and in the aggregate own 54% of the outstanding shares of the Fund. IDI has an agreement with these entities to sell Fund shares. The Fund, Invesco and/or Invesco affiliates may make payments to these entities, which are considered to be related to the Fund, for providing services to the Fund, Invesco and/or Invesco affiliates including but not limited to services such as securities brokerage, distribution, third party record keeping and account servicing. The Fund has no knowledge as to whether all or any portion of the shares owned of record by these entities are also owned beneficially. |
| In addition, 22% of the outstanding shares of the Fund are owned by the Adviser or an affiliate of the Adviser. |
20 Invesco Alternative Strategies Fund
NOTE 11—Financial Highlights
The following schedule presents financial highlights for a share of the Fund outstanding throughout the periods indicated.
| Net asset value, beginning of period | Net investment income (loss)(a) | Net gains (losses) on securities (both realized and unrealized) | Total from investment operations | Dividends from net investment income | Distributions from net realized gains | Total distributions | Net asset value, end of period | Total return(b) | Net assets, end of period (000’s omitted) | Ratio of expenses to average net assets with fee waivers and/or expenses absorbed(c) | Ratio of expenses to average net assets without fee waivers and/or expenses absorbed | Ratio of net investment income (loss) to average net assets | Portfolio turnover(d) | |||||||||||||||||||||||||||||||||||||||||||
Class A | ||||||||||||||||||||||||||||||||||||||||||||||||||||||||
Year ended 12/31/17 | $ | 9.54 | $ | 0.03 | $ | 0.32 | $ | 0.35 | $ | (0.07 | ) | $ | (0.03 | ) | $ | (0.10 | ) | $ | 9.79 | 3.66 | % | $ | 948 | 0.30 | %(e) | 11.13 | %(e) | 0.35 | %(e) | 43 | % | |||||||||||||||||||||||||
Year ended 12/31/16 | 9.32 | 0.32 | 0.24 | 0.56 | (0.34 | ) | (0.00 | ) | (0.34 | ) | 9.54 | 5.97 | 856 | 0.51 | 18.77 | 3.39 | 45 | |||||||||||||||||||||||||||||||||||||||
Year ended 12/31/15 | 9.95 | 0.41 | (0.62 | ) | (0.21 | ) | (0.40 | ) | (0.02 | ) | (0.42 | ) | 9.32 | (2.15 | ) | 489 | 0.52 | 47.31 | 4.19 | 52 | ||||||||||||||||||||||||||||||||||||
Year ended 12/31/14(f) | 10.00 | 0.15 | (0.01 | ) | 0.14 | (0.19 | ) | — | (0.19 | ) | 9.95 | 1.39 | 152 | 0.52 | (g) | 97.85 | (g) | 6.96 | (g) | 3 | ||||||||||||||||||||||||||||||||||||
Class C | ||||||||||||||||||||||||||||||||||||||||||||||||||||||||
Year ended 12/31/17 | 9.48 | (0.04 | ) | 0.32 | 0.28 | (0.01 | ) | (0.03 | ) | (0.04 | ) | 9.72 | 2.98 | 181 | 1.05 | (e) | 11.88 | (e) | (0.40 | )(e) | 43 | |||||||||||||||||||||||||||||||||||
Year ended 12/31/16 | 9.28 | 0.25 | 0.22 | 0.47 | (0.27 | ) | (0.00 | ) | (0.27 | ) | 9.48 | 5.10 | 160 | 1.26 | 19.52 | 2.64 | 45 | |||||||||||||||||||||||||||||||||||||||
Year ended 12/31/15 | 9.95 | 0.33 | (0.62 | ) | (0.29 | ) | (0.36 | ) | (0.02 | ) | (0.38 | ) | 9.28 | (2.90 | ) | 101 | 1.27 | 48.06 | 3.44 | 52 | ||||||||||||||||||||||||||||||||||||
Year ended 12/31/14(f) | 10.00 | 0.14 | (0.02 | ) | 0.12 | (0.17 | ) | — | (0.17 | ) | 9.95 | 1.23 | 21 | 1.27 | (g) | 98.60 | (g) | 6.21 | (g) | 3 | ||||||||||||||||||||||||||||||||||||
Class R | ||||||||||||||||||||||||||||||||||||||||||||||||||||||||
Year ended 12/31/17 | 9.52 | 0.01 | 0.32 | 0.33 | (0.05 | ) | (0.03 | ) | (0.08 | ) | 9.77 | 3.47 | 18 | 0.55 | (e) | 11.38 | (e) | 0.10 | (e) | 43 | ||||||||||||||||||||||||||||||||||||
Year ended 12/31/16 | 9.31 | 0.30 | 0.22 | 0.52 | (0.31 | ) | (0.00 | ) | (0.31 | ) | 9.52 | 5.64 | 18 | 0.76 | 19.02 | 3.14 | 45 | |||||||||||||||||||||||||||||||||||||||
Year ended 12/31/15 | 9.95 | 0.39 | (0.63 | ) | (0.24 | ) | (0.38 | ) | (0.02 | ) | (0.40 | ) | 9.31 | (2.38 | ) | 18 | 0.77 | 47.56 | 3.94 | 52 | ||||||||||||||||||||||||||||||||||||
Year ended 12/31/14(f) | 10.00 | 0.15 | (0.02 | ) | 0.13 | (0.18 | ) | — | (0.18 | ) | 9.95 | 1.34 | 18 | 0.77 | (g) | 98.10 | (g) | 6.71 | (g) | 3 | ||||||||||||||||||||||||||||||||||||
Class Y | ||||||||||||||||||||||||||||||||||||||||||||||||||||||||
Year ended 12/31/17 | 9.57 | 0.06 | 0.31 | 0.37 | (0.09 | ) | (0.03 | ) | (0.12 | ) | 9.82 | 3.88 | 1,453 | 0.05 | (e) | 10.88 | (e) | 0.60 | (e) | 43 | ||||||||||||||||||||||||||||||||||||
Year ended 12/31/16 | 9.34 | 0.35 | 0.23 | 0.58 | (0.35 | ) | (0.00 | ) | (0.35 | ) | 9.57 | 6.28 | 495 | 0.26 | 18.52 | 3.64 | 45 | |||||||||||||||||||||||||||||||||||||||
Year ended 12/31/15 | 9.96 | 0.44 | (0.63 | ) | (0.19 | ) | (0.41 | ) | (0.02 | ) | (0.43 | ) | 9.34 | (1.89 | ) | 256 | 0.27 | 47.06 | 4.44 | 52 | ||||||||||||||||||||||||||||||||||||
Year ended 12/31/14(f) | 10.00 | 0.16 | (0.01 | ) | 0.15 | (0.19 | ) | — | (0.19 | ) | 9.96 | 1.54 | 309 | 0.27 | (g) | 97.60 | (g) | 7.21 | (g) | 3 | ||||||||||||||||||||||||||||||||||||
Class R5 | ||||||||||||||||||||||||||||||||||||||||||||||||||||||||
Year ended 12/31/17 | 9.55 | 0.06 | 0.32 | 0.38 | (0.09 | ) | (0.03 | ) | (0.12 | ) | 9.81 | 4.00 | 10 | 0.05 | (e) | 10.72 | (e) | 0.60 | (e) | 43 | ||||||||||||||||||||||||||||||||||||
Year ended 12/31/16 | 9.33 | 0.35 | 0.22 | 0.57 | (0.35 | ) | (0.00 | ) | (0.35 | ) | 9.55 | 6.18 | 10 | 0.26 | 18.23 | 3.64 | 45 | |||||||||||||||||||||||||||||||||||||||
Year ended 12/31/15 | 9.95 | 0.44 | (0.63 | ) | (0.19 | ) | (0.41 | ) | (0.02 | ) | (0.43 | ) | 9.33 | (1.89 | ) | 9 | 0.27 | 46.77 | 4.44 | 52 | ||||||||||||||||||||||||||||||||||||
Year ended 12/31/14(f) | 10.00 | 0.16 | (0.02 | ) | 0.14 | (0.19 | ) | — | (0.19 | ) | 9.95 | 1.44 | 10 | 0.27 | (g) | 96.70 | (g) | 7.21 | (g) | 3 | ||||||||||||||||||||||||||||||||||||
Class R6 | ||||||||||||||||||||||||||||||||||||||||||||||||||||||||
Year ended 12/31/17 | 9.55 | 0.06 | 0.32 | 0.38 | (0.09 | ) | (0.03 | ) | (0.12 | ) | 9.81 | 4.00 | 10 | 0.05 | (e) | 10.72 | (e) | 0.60 | (e) | 43 | ||||||||||||||||||||||||||||||||||||
Year ended 12/31/16 | 9.33 | 0.35 | 0.22 | 0.57 | (0.35 | ) | (0.00 | ) | (0.35 | ) | 9.55 | 6.18 | 10 | 0.26 | 18.23 | 3.64 | 45 | |||||||||||||||||||||||||||||||||||||||
Year ended 12/31/15 | 9.95 | 0.44 | (0.63 | ) | (0.19 | ) | (0.41 | ) | (0.02 | ) | (0.43 | ) | 9.33 | (1.89 | ) | 9 | 0.27 | 46.77 | 4.44 | 52 | ||||||||||||||||||||||||||||||||||||
Year ended 12/31/14(f) | 10.00 | 0.16 | (0.02 | ) | 0.14 | (0.19 | ) | — | (0.19 | ) | 9.95 | 1.44 | 10 | 0.27 | (g) | 96.70 | (g) | 7.21 | (g) | 3 | ||||||||||||||||||||||||||||||||||||
| (a) | Calculated using average shares outstanding. |
| (b) | Includes adjustments in accordance with accounting principles generally accepted in the United States of America and as such, the net asset value for financial reporting purposes and the returns based upon those net asset values may differ from the net asset value and returns for shareholder transactions. Does not include sales charges and is not annualized for periods less than one year, if applicable. |
| (c) | In addition to the fees and expenses which the Fund bears directly, the Fund indirectly bears a pro rata share of the fees and expenses of the underlying funds in which the Fund invests. Because the underlying funds have varied expenses and fee levels and the Fund may own different proportions at different times, the amount of fees and expenses incurred indirectly by the Fund will vary. Estimated underlying fund expenses are not expenses that are incurred directly by the Fund. They are expenses that are incurred directly by the underlying funds and are deducted from the value of the funds the Fund invests in. The effect of the estimated underlying fund expenses that the Fund bears indirectly is included in the Fund’s total return. Estimated acquired fund fees from underlying funds were 1.04%, 1.14%, 1.02% and 1.73% for the years ended December 31, 2017, December 31, 2016, December 31, 2015 and the period October 14, 2014 (commencement date) through December 31, 2014, respectively. |
| (d) | Portfolio turnover is calculated at the fund level and is not annualized for periods less than one year, if applicable. |
| (e) | Ratios are based on average daily net assets (000’s omitted) of $894, $178, $18, $1,082, $10 and $10 for Class A, Class C, Class R, Class Y, Class R5 and Class R6 shares, respectively. |
| (f) | Commencement date of October 14, 2014. |
| (g) | Annualized. |
21 Invesco Alternative Strategies Fund
Report of Independent Registered Public Accounting Firm
To the Board of Trustees of AIM Growth Series (Invesco Growth Series) and Shareholders of Invesco Alternative Strategies Fund
Opinion on the Financial Statements
We have audited the accompanying statement of assets and liabilities, including the schedule of investments, of Invesco Alternative Strategies Fund (one of the funds constituting AIM Growth Series (Invesco Growth Series), hereafter referred to as the “Fund”) as of December 31, 2017, the related statement of operations for the year ended December 31, 2017, the statement of changes in net assets for each of the two years in the period ended December 31, 2017, including the related notes, and the financial highlights for each of the three years in the period ended December 31, 2017 and for the period October 14, 2014 (commencement of investment operation) through December 31, 2014 (collectively referred to as the “financial statements”). In our opinion, the financial statements present fairly, in all material respects, the financial position of the Fund as of December 31, 2017, the results of its operations for the year then ended, the changes in its net assets for each of the two years in the period ended December 31, 2017 and the financial highlights for each of the three years in the period ended December 31, 2017 and for the period October 14, 2014 (commencement of investment operation) through December 31, 2014 in conformity with accounting principles generally accepted in the United States of America.
Basis for Opinion
These financial statements are the responsibility of the Fund’s management. Our responsibility is to express an opinion on the Fund’s financial statements based on our audits. We are a public accounting firm registered with the Public Company Accounting Oversight Board (United States) (“PCAOB”) and are required to be independent with respect to the Fund in accordance with the U.S. federal securities laws and the applicable rules and regulations of the Securities and Exchange Commission and the PCAOB.
We conducted our audits of these financial statements in accordance with the standards of the PCAOB. Those standards require that we plan and perform the audit to obtain reasonable assurance about whether the financial statements are free of material misstatement, whether due to error or fraud.
Our audits included performing procedures to assess the risks of material misstatement of the financial statements, whether due to error or fraud, and performing procedures that respond to those risks. Such procedures included examining, on a test basis, evidence regarding the amounts and disclosures in the financial statements. Our audits also included evaluating the accounting principles used and significant estimates made by management, as well as evaluating the overall presentation of the financial statements. Our procedures included confirmation of securities owned as of December 31, 2017 by correspondence with the custodian and transfer agent. We believe that our audits provide a reasonable basis for our opinion.
PricewaterhouseCoopers LLP
Houston, TX
February 23, 2018
We have served as the auditor of one or more of the investment companies in the Invesco/PowerShares group of investment companies since at least 1995. We have not determined the specific year we began serving as auditor.
22 Invesco Alternative Strategies Fund
Calculating your ongoing Fund expenses
Example
As a shareholder of the Fund, you incur two types of costs: (1) transaction costs, which may include sales charges (loads) on purchase payments or contingent deferred sales charges on redemptions, if any; and (2) ongoing costs, including distribution and/or service (12b-1) fees, and other Fund expenses. This example is intended to help you understand your ongoing costs (in dollars) of investing in the Fund and to compare these costs with ongoing costs of investing in other mutual funds. The example is based on an investment of $1,000 invested at the beginning of the period and held for the entire period July 1, 2017, through December 31, 2017.
In addition to the fees and expenses which the Fund bears directly, the Fund indirectly bears a pro rata share of the fees and expenses of the underlying funds in which the Fund invests. The amount of fees and expenses incurred indirectly by the Fund will vary because the underlying funds have varied expenses and fee levels and the Fund may own different proportions of the underlying funds at different times. Estimated underlying fund expenses are not expenses that are incurred directly by the Fund. They are expenses that are incurred directly by the underlying funds and are deducted from the value of the underlying funds the Fund invests in. The effect of the estimated underlying fund expenses that the Fund bears indirectly are included in the Fund’s total return.
Actual expenses
The table below provides information about actual account values and actual expenses. You may use the information in this table, together with the amount you invested, to estimate the expenses that you paid over the period. Simply divide your account value by $1,000 (for example, an $8,600 account value divided by $1,000 = 8.6), then multiply the result by the number in the table under the heading entitled “Actual Expenses Paid During Period” to estimate the expenses you paid on your account during this period.
Hypothetical example for comparison purposes
The table below also provides information about hypothetical account values and hypothetical expenses based on the Fund’s actual expense ratio and an assumed rate of return of 5% per year before expenses, which is not the Fund’s actual return.
The hypothetical account values and expenses may not be used to estimate the actual ending account balance or expenses you paid for the period. You may use this information to compare the ongoing costs of investing in the Fund and other funds. To do so, compare this 5% hypothetical example with the 5% hypothetical examples that appear in the shareholder reports of the other funds.
Please note that the expenses shown in the table are meant to highlight your ongoing costs only and do not reflect any transaction costs, such as sales charges (loads) on purchase payments or contingent deferred sales charges on redemptions, if any. Therefore, the hypothetical information is useful in comparing ongoing costs only, and will not help you determine the relative total costs of owning different funds. In addition, expenses shown in the table do not include the expenses of the underlying funds, which are borne indirectly by the Fund. If transaction costs and indirect expenses were included, your costs would have been higher.
| Class | Beginning | ACTUAL | HYPOTHETICAL (5% annual return before expenses) | Annualized | ||||||||||||||||||||
| Ending Account Value (12/31/17)1 | Expenses Paid During Period2 | Ending Account Value (12/31/17) | Expenses Paid During Period2 | |||||||||||||||||||||
A | $1,000.00 | $1,038.80 | $1.54 | $1,023.69 | $1.53 | 0.30 | % | |||||||||||||||||
C | 1,000.00 | 1,035.20 | 5.39 | 1,019.91 | 5.35 | 1.05 | ||||||||||||||||||
R | 1,000.00 | 1,036.80 | 2.82 | 1,022.43 | 2.80 | 0.55 | ||||||||||||||||||
Y | 1,000.00 | 1,039.90 | 0.26 | 1,024.95 | 0.26 | 0.05 | ||||||||||||||||||
R5 | 1,000.00 | 1,040.00 | 0.26 | 1,024.95 | 0.26 | 0.05 | ||||||||||||||||||
R6 | 1,000.00 | 1,040.00 | 0.26 | 1,024.95 | 0.26 | 0.05 | ||||||||||||||||||
| 1 | The actual ending account value is based on the actual total return of the Fund for the period July 1, 2017 through December 31, 2017, after actual expenses and will differ from the hypothetical ending account value which is based on the Fund’s expense ratio and a hypothetical annual return of 5% before expenses. |
| 2 | Expenses are equal to the Fund’s annualized expense ratio as indicated above multiplied by the average account value over the period, multiplied by 184/365 to reflect the most recent fiscal half year. |
23 Invesco Alternative Strategies Fund
Tax Information
Form 1099-DIV, Form 1042-S and other year-end tax information provide shareholders with actual calendar year amounts that should be included in their tax returns. Shareholders should consult their tax advisors.
The following distribution information is being provided as required by the Internal Revenue Code or to meet a specific state’s requirement.
The Fund designates the following amounts or, if subsequently determined to be different, the maximum amount allowable for its fiscal year ended December 31, 2017:
Federal and State Income Tax | ||||
Long-Term Capital Gain Distributions | $ | 3,092 | ||
Qualified Dividend Income* | 12.42 | % | ||
Corporate Dividends Received Deduction* | 6.16 | % | ||
U.S. Treasury Obligations* | 10.71 | % | ||
| * | The above percentages are based on ordinary income dividends paid to shareholders during the Fund’s fiscal year. |
Non-Resident Alien Shareholders | ||||
Qualified Short-Term Gains | $ | 3,578 | ||
24 Invesco Alternative Strategies Fund
Trustees and Officers
The address of each trustee and officer is AIM Growth Series (Invesco Growth Series) (the “Trust”), 11 Greenway Plaza, Suite 1000, Houston, Texas 77046-1173. The trustees serve for the life of the Trust, subject to their earlier death, incapacitation, resignation, retirement or removal as more specifically provided in the Trust’s organizational documents. Each officer serves for a one year term or until their successors are elected and qualified. Column two below includes length of time served with predecessor entities, if any.
Name, Year of Birth and Position(s) Held with the Trust | Trustee and/ or Officer Since | Principal Occupation(s) During Past 5 Years | Number of Funds in Fund Complex Overseen by Trustee | Other Directorship(s) Held by Trustee During Past 5 Years | ||||
| Interested Persons | ||||||||
| Martin L. Flanagan1 — 1960 Trustee | 2007 | Executive Director, Chief Executive Officer and President, Invesco Ltd. (ultimate parent of Invesco and a global investment management firm); Trustee, The Invesco Funds; Vice Chair, Investment Company Institute; and Member of Executive Board, SMU Cox School of Business
Formerly: Advisor to the Board, Invesco Advisers, Inc. (formerly known as Invesco Institutional (N.A.), Inc.); Chairman and Chief Executive Officer, Invesco Advisers, Inc. (registered investment adviser); Director, Chairman, Chief Executive Officer and President, Invesco Holding Company (US), Inc. (formerly IVZ Inc.) (holding company), Invesco Group Services, Inc. (service provider) and Invesco North American Holdings, Inc. (holding company); Director, Chief Executive Officer and President, Invesco Holding Company Limited (parent of Invesco and a global investment management firm); Director, Invesco Ltd.; Chairman, Investment Company Institute and President, Co-Chief Executive Officer, Co-President, Chief Operating Officer and Chief Financial Officer, Franklin Resources, Inc. (global investment management organization) | 158 | None | ||||
| Philip A. Taylor2 — 1954 Trustee and Senior Vice President | 2006 | Head of the Americas and Senior Managing Director, Invesco Ltd.; Director, Invesco Advisers, Inc. (formerly known as Invesco Institutional (N.A.), Inc.) (registered investment adviser); Director, Chairman, Chief Executive Officer and President, Invesco Management Group, Inc. (formerly known as Invesco Aim Management Group, Inc.) (financial services holding company); Director and Chairman, Invesco Investment Services, Inc. (formerly known as Invesco Aim Investment Services, Inc.) (registered transfer agent); Chief Executive Officer, Invesco Corporate Class Inc. (corporate mutual fund company); Director, Chairman and Chief Executive Officer, Invesco Canada Ltd. (formerly known as Invesco Trimark Ltd./Invesco Trimark Ltèe) (registered investment adviser and registered transfer agent); Trustee and Senior Vice President, The Invesco Funds; Director, Invesco Investment Advisers LLC (formerly known as Van Kampen Asset Management).
Formerly: Co-Chairman, Co-President and Co-Chief Executive Officer, Invesco Advisers, Inc. (formerly known as Invesco Institutional (N.A.), Inc.) (registered investment adviser); Director, Chief Executive Officer and President, Van Kampen Exchange Corp; President and Principal Executive Officer, The Invesco Funds (other than AIM Treasurer’s Series Trust (Invesco Treasurer’s Series Trust), Short-Term Investments Trust and Invesco Management Trust); Executive Vice President, The Invesco Funds (AIM Treasurer’s Series Trust (Invesco Treasurer’s Series Trust), Short-Term Investments Trust and Invesco Management Trust only); Director and President, INVESCO Funds Group, Inc. (registered investment adviser and registered transfer agent); Director and Chairman, IVZ Distributors, Inc. (formerly known as INVESCO Distributors, Inc.) (registered broker dealer); Director, President and Chairman, Invesco Inc. (holding company), Invesco Canada Holdings Inc. (holding company), Trimark Investments Ltd./Placements Trimark Ltèe and Invesco Financial Services Ltd/Services Financiers Invesco Ltèe; Chief Executive Officer, Invesco Canada Fund Inc. (corporate mutual fund company); Director and Chairman, Van Kampen Investor Services Inc.; Director, Chief Executive Officer and President, 1371 Preferred Inc. (holding company) and Van Kampen Investments Inc.; Director and President, AIM GP Canada Inc. (general partner for limited partnerships) and Van Kampen Advisors, Inc.; Director and Chief Executive Officer, Invesco Trimark Dealer Inc. (registered broker dealer); Director, Invesco Distributors, Inc. (formerly known as Invesco Aim Distributors, Inc.) (registered broker dealer); Manager, Invesco PowerShares Capital Management LLC; Director, Chief Executive Officer and President, Invesco Advisers, Inc.; Director, Chairman, Chief Executive Officer and President, Invesco Aim Capital Management, Inc.; President, Invesco Trimark Dealer Inc. and Invesco Trimark Ltd./Invesco Trimark Ltèe; Director and President, AIM Trimark Corporate Class Inc. and AIM Trimark Canada Fund Inc.; Senior Managing Director, Invesco Holding Company Limited; Director and Chairman, Fund Management Company (former registered broker dealer); President and Principal Executive Officer, The Invesco Funds (AIM Treasurer’s Series Trust (Invesco Treasurer’s Series Trust), and Short-Term Investments Trust only); President, AIM Trimark Global Fund Inc. and AIM Trimark Canada Fund Inc. | 158 | None |
| 1 | Mr. Flanagan is considered an interested person (within the meaning of Section 2(a)(19) of the 1940 Act) of the Trust because he is an officer of the Adviser to the Trust, and an officer and a director of Invesco Ltd., ultimate parent of the Adviser. |
| 2 | Mr. Taylor is considered an interested person (within the meaning of Section 2(a)(19) of the 1940 Act) of the Trust because he is an officer and a director of the Adviser. |
T-1 Invesco Alternative Strategies Fund
Trustees and Officers—(continued)
Name, Year of Birth and Position(s) Held with the Trust | Trustee and/ or Officer Since | Principal Occupation(s) During Past 5 Years | Number of Funds in Fund Complex Overseen by Trustee | Other Directorship(s) Past 5 Years | ||||
| Independent Trustees | ||||||||
Bruce L. Crockett — 1944 Trustee and Chair | 2001 | Chairman, Crockett Technologies Associates (technology consulting company)
Formerly: Director, Captaris (unified messaging provider); Director, President and Chief Executive Officer, COMSAT Corporation; Chairman, Board of Governors of INTELSAT (international communications company); ACE Limited (insurance company); Independent Directors Council and Investment Company Institute: Member of the Audit Committee, Investment Company Institute; Member of the Executive Committee and Chair of the Governance Committee, Independent Directors Council | 158 | Director and Chairman of the Audit Committee, ALPS (Attorneys Liability Protection Society) (insurance company); Director and Member of the Audit Committee and Compensation Committee, Ferroglobe PLC (metallurgical company) | ||||
David C. Arch — 1945 Trustee | 2010 | Chairman of Blistex Inc. (consumer health care products manufacturer); Member, World Presidents’ Organization | 158 | Board member of the Illinois Manufacturers’ Association | ||||
Jack M. Fields — 1952 Trustee | 2001 | Chief Executive Officer, Twenty First Century Group, Inc. (government affairs company); and Chairman, Discovery Learning Alliance (non-profit)
Formerly: Owner and Chief Executive Officer, Dos Angeles Ranch L.P. (cattle, hunting, corporate entertainment); Director, Insperity, Inc. (formerly known as Administaff) (human resources provider); Chief Executive Officer, Texana Timber LP (sustainable forestry company); Director of Cross Timbers Quail Research Ranch (non-profit); and member of the U.S. House of Representatives | 158 | None | ||||
Cynthia Hostetler — 1962 Trustee | 2017 | Non-Executive Director and Trustee of a number of public and private business corporations
Formerly: Head of Investment Funds and Private Equity, Overseas Private Investment Corporation; President, First Manhattan Bancorporation, Inc.; Attorney, Simpson Thacher & Bartlett LLP | 158 | Vulcan Materials Company (construction materials company); Trilinc Global Impact Fund; Aberdeen Investment Funds (4 portfolios); Artio Global Investment LLC (mutual fund complex); Edgen Group, Inc. (specialized energy and infrastructure products distributor) | ||||
Eli Jones — 1961 Trustee | 2016 | Professor and Dean, Mays Business School — Texas A&M University
Formerly: Professor and Dean, Walton College of Business, University of Arkansas and E.J. Ourso College of Business, Louisiana State University; Director, Arvest Bank | 158 | Insperity, Inc. (formerly known as Administaff) (human resources provider) | ||||
Prema Mathai-Davis — 1950 Trustee | 2001 | Retired. | 158 | None | ||||
Teresa M. Ressel — 1962 Trustee | 2017 | Non-executive director and trustee of a number of public and private business corporations
Formerly: Chief Financial Officer, Olayan America, The Olayan Group (international investor/commercial/industrial); Chief Executive Officer, UBS Securities LLC; Group Chief Operating Officer, Americas, UBS AG; Assistant Secretary for Management & Budget and CFO, US Department of the Treasury | 158 | Atlantic Power Corporation (power generation company); ON Semiconductor Corp. (semiconductor supplier) | ||||
Ann Barnett Stern — 1957 Trustee | 2017 | President and Chief Executive Officer, Houston Endowment Inc. (private philanthropic institution)
Formerly: Executive Vice President and General Counsel, Texas Children’s Hospital; Attorney, Beck, Redden and Secrest, LLP; Business Law Instructor, University of St. Thomas; Attorney, Andrews & Kurth LLP | 158 | Federal Reserve Bank of Dallas | ||||
Raymond Stickel, Jr. — 1944 Trustee | 2005 | Retired.
Formerly: Director, Mainstay VP Series Funds, Inc. (25 portfolios); Partner, Deloitte & Touche | 158 | None | ||||
Robert C. Troccoli — 1949 Trustee | 2016 | Adjunct Professor, University of Denver — Daniels College of Business
Formerly: Senior Partner, KPMG LLP | 158 | None | ||||
Christopher L. Wilson — 1957 Trustee | 2017 | Non-executive director and trustee of a number of public and private business corporations
Formerly: Managing Partner, CT2, LLC (investing and consulting firm); President/Chief Executive Officer, Columbia Funds, Bank of America Corporation; President/Chief Executive Officer, CDC IXIS Asset Management Services, Inc.; Principal & Director of Operations, Scudder Funds, Scudder, Stevens & Clark, Inc.; Assistant Vice President, Fidelity Investments | 158 | TD Asset Management USA Inc. (mutual fund complex) (22 portfolios); ISO New England, Inc. (non-profit organization managing regional electricity market) |
T-2 Invesco Alternative Strategies Fund
Trustees and Officers—(continued)
Name, Year of Birth and Position(s) Held with the Trust | Trustee and/ or Officer Since | Principal Occupation(s) During Past 5 Years | Number of Funds in Fund Complex Overseen by Trustee | Other Directorship(s) Past 5 Years | ||||
| Other Officers | ||||||||
Sheri Morris — 1964 President, Principal Executive Officer and Treasurer | 1999 | President, Principal Executive Officer and Treasurer, The Invesco Funds; Vice President, Invesco Advisers, Inc. (formerly known as Invesco Institutional (N.A.), Inc.) (registered investment adviser); and Vice President, PowerShares Exchange-Traded Fund Trust, PowerShares Exchange-Traded Fund Trust II, PowerShares India Exchange-Traded Fund Trust, PowerShares Actively Managed Exchange-Traded Fund Trust, PowerShares Actively Managed Exchange-Traded Commodity Fund Trust and PowerShares Exchange-Traded Self-Indexed Fund Trust
Formerly: Vice President and Principal Financial Officer, The Invesco Funds; Vice President, Invesco Aim Advisers, Inc., Invesco Aim Capital Management, Inc. and Invesco Aim Private Asset Management, Inc.; Assistant Vice President and Assistant Treasurer, The Invesco Funds and Assistant Vice President, Invesco Advisers, Inc., Invesco Aim Capital Management, Inc. and Invesco Aim Private Asset Management, Inc.; and Treasurer, PowerShares Exchange-Traded Fund Trust, PowerShares Exchange-Traded Fund Trust II, PowerShares India Exchange-Traded Fund Trust and PowerShares Actively Managed Exchange-Traded Fund Trust | N/A | N/A | ||||
Russell C. Burk — 1958 Senior Vice President and Senior Officer | 2005 | Senior Vice President and Senior Officer, The Invesco Funds | N/A | N/A | ||||
John M. Zerr — 1962 Senior Vice President, Chief Legal Officer and Secretary | 2006 | Director, Senior Vice President, Secretary and General Counsel, Invesco Management Group, Inc. (formerly known as Invesco AIM Management Group, Inc.); Senior Vice President, Invesco Advisers, Inc. (formerly known as Invesco Institutional (N.A.), Inc.) (registered investment adviser); Senior Vice President and Secretary, Invesco Distributors, Inc. (formerly known as Invesco AIM Distributors, Inc.); Director, Vice President and Secretary, Invesco Investment Services, Inc. (formerly known as Invesco AIM Investment Services, Inc.) Senior Vice President, Chief Legal Officer and Secretary, The Invesco Funds; Managing Director, Invesco PowerShares Capital Management LLC; Director, Secretary and General Counsel, Invesco Investment Advisers LLC (formerly known as Van Kampen Asset Management); Secretary and General Counsel, Invesco Capital Markets, Inc. (formerly known as Van Kampen Funds Inc.) and Chief Legal Officer, PowerShares Exchange-Traded Fund Trust, PowerShares Exchange-Traded Fund Trust II, PowerShares India Exchange-Traded Fund Trust, PowerShares Actively Managed Exchange-Traded Fund Trust, PowerShares Actively Managed Exchange-Traded Commodity Fund Trust and PowerShares Exchange-Traded Self-Indexed Fund Trust; Manager and Secretary, Invesco Indexing LLC
Formerly: Director, Secretary, General Counsel and Senior Vice President, Van Kampen Exchange Corp.; Director, Vice President and Secretary, IVZ Distributors, Inc. (formerly known as INVESCO Distributors, Inc.); Director and Vice President, INVESCO Funds Group, Inc.; Director and Vice President, Van Kampen Advisors Inc.; Director, Vice President, Secretary and General Counsel, Van Kampen Investor Services Inc.; Director, Invesco Distributors, Inc. (formerly known as Invesco AIM Distributors, Inc.); Director, Senior Vice President, General Counsel and Secretary, Invesco AIM Advisers, Inc. and Van Kampen Investments Inc.; Director, Vice President and Secretary, Fund Management Company; Director, Senior Vice President, Secretary, General Counsel and Vice President, Invesco AIM Capital Management, Inc.; Chief Operating Officer and General Counsel, Liberty Ridge Capital, Inc. (an investment adviser); Vice President and Secretary, PBHG Funds (an investment company) and PBHG Insurance Series Fund (an investment company); Chief Operating Officer, General Counsel and Secretary, Old Mutual Investment Partners (a broker-dealer); General Counsel and Secretary, Old Mutual Fund Services (an administrator) and Old Mutual Shareholder Services (a shareholder servicing center); Executive Vice President, General Counsel and Secretary, Old Mutual Capital, Inc. (an investment adviser); and Vice President and Secretary, Old Mutual Advisors Funds (an investment company) | N/A | N/A | ||||
Gregory G. McGreevey — 1962 Senior Vice President | 2012 | Senior Managing Director, Invesco Ltd.; Director, Chairman, President, and Chief Executive Officer, Invesco Advisers, Inc. (formerly known as Invesco Institutional (N.A.), Inc.) (registered investment adviser); Senior Vice President, Invesco Management Group, Inc.; Director, Invesco Mortgage Capital, Inc. and Invesco Senior Secured Management, Inc.; and Senior Vice President, The Invesco Funds
Formerly: Assistant Vice President, The Invesco Funds | N/A | N/A | ||||
Kelli Gallegos — 1970 Vice President, Principal Financial Officer and Assistant Treasurer | 2008 | Vice President, Principal Financial Officer and Assistant Treasurer, The Invesco Funds; Assistant Treasurer, Invesco PowerShares Capital Management LLC, PowerShares Exchange-Traded Fund Trust, PowerShares Exchange-Traded Fund Trust II, PowerShares India Exchange-Traded Fund Trust, PowerShares Actively Managed Exchange-Traded Fund Trust, PowerShares Actively Managed Exchange-Traded Commodity Fund Trust and PowerShares Exchange-Traded Self-Indexed Fund Trust
Formerly: Assistant Vice President, The Invesco Funds | N/A | N/A |
T-3 Invesco Alternative Strategies Fund
Trustees and Officers—(continued)
Name, Year of Birth and Position(s) Held with the Trust | Trustee and/ or Officer Since | Principal Occupation(s) During Past 5 Years | Number of Funds in Fund Complex Overseen by Trustee | Other Directorship(s) Past 5 Years | ||||
| Other Officers—(continued) | ||||||||
Tracy Sullivan — 1962 Vice President, Chief Tax Officer and Assistant Treasurer | 2008 | Vice President, Chief Tax Officer and Assistant Treasurer, The Invesco Funds; Assistant Treasurer, Invesco PowerShares Capital Management LLC, PowerShares Exchange-Traded Fund Trust, PowerShares Exchange-Traded Fund Trust II, PowerShares India Exchange-Traded Fund Trust, PowerShares Actively Managed Exchange-Traded Fund Trust,PowerShares Actively Managed Exchange-Traded Commodity Fund Trust and PowerShares Exchange-Traded Self-Indexed Fund Trust
Formerly: Assistant Vice President, The Invesco Funds | N/A | N/A | ||||
Crissie M. Wisdom — 1969 Anti-Money Laundering Compliance Officer | 2013 | Anti-Money Laundering Compliance Officer, Invesco Advisers, Inc. (formerly known as Invesco Institutional (N.A.), Inc.) (registered investment adviser), Invesco Capital Markets, Inc. (formerly known as Van Kampen Funds Inc.), Invesco Distributors, Inc., Invesco Investment Services, Inc., Invesco Management Group, Inc., The Invesco Funds, and PowerShares Exchange-Traded Fund Trust, PowerShares Exchange-Traded Fund Trust II, PowerShares India Exchange-Traded Fund Trust, PowerShares Actively Managed Exchange-Traded Fund Trust,PowerShares Actively Managed Exchange-Traded Commodity Fund Trust and PowerShares Exchange-Traded Self-Indexed Fund Trust; Anti-Money Laundering Compliance Officer and Bank Secrecy Act Officer, INVESCO National Trust Company and Invesco Trust Company; and Fraud Prevention Manager and Controls and Risk Analysis Manager for Invesco Investment Services, Inc.
Formerly: Anti-Money Laundering Compliance Officer, Van Kampen Exchange Corp. | N/A | N/A | ||||
Robert R. Leveille — 1969 Chief Compliance Officer | 2016 | Chief Compliance Officer, Invesco Advisers, Inc. (registered investment adviser); and Chief Compliance Officer, The Invesco Funds
Formerly: Chief Compliance Officer, Putnam Investments and the Putnam Funds | N/A | N/A |
The Statement of Additional Information of the Trust includes additional information about the Fund’s Trustees and is available upon request, without charge, by calling 1.800.959.4246. Please refer to the Fund’s Statement of Additional Information for information on the Fund’s sub-advisers.
Office of the Fund 11 Greenway Plaza, Suite 1000 Houston, TX 77046-1173 | Investment Adviser Invesco Advisers, Inc. 1555 Peachtree Street, N.E. Atlanta, GA 30309 | Distributor Invesco Distributors, Inc. 11 Greenway Plaza, Suite 1000 Houston, TX 77046-1173 | Auditors PricewaterhouseCoopers LLP 1000 Louisiana Street, Suite 5800 Houston, TX 77002-5678 | |||
Counsel to the Fund Stradley Ronon Stevens & Young, LLP 2005 Market Street, Suite 2600 Philadelphia, PA 19103-7018 | Counsel to the Independent Trustees Goodwin Procter LLP 901 New York Avenue, N.W. Washington, D.C. 20001 | Transfer Agent Invesco Investment Services, Inc. 11 Greenway Plaza, Suite 1000 Houston, TX 77046-1173 | Custodian State Street Bank and Trust Company 225 Franklin Street Boston, MA 02110-2801 | |||
T-4 Invesco Alternative Strategies Fund
Explore High-Conviction Investing with Invesco

Go paperless with eDelivery
Visit invesco.com/edelivery to enjoy the convenience and security of anytime electronic access to your investment documents.
With eDelivery, you can elect to have any or all of the following materials delivered straight to your inbox to download, save and print from your own computer:
| ∎ | Fund reports and prospectuses |
| ∎ | Quarterly statements |
| ∎ | Daily confirmations |
| ∎ | Tax forms |
Invesco mailing information
Send general correspondence to Invesco Investment Services, Inc., P.O. Box 219078, Kansas City, MO 64121-9078.
Important notice regarding delivery of security holder documents
To reduce Fund expenses, only one copy of most shareholder documents may be mailed to shareholders with multiple accounts at the same address (Householding). Mailing of your shareholder documents may be householded indefinitely unless you instruct us otherwise. If you do not want the mailing of these documents to be combined with those for other members of your household, please contact Invesco Investment Services, Inc. at 800 959 4246 or contact your financial institution. We will begin sending you individual copies for each account within 30 days after receiving your request.
Fund holdings and proxy voting information
The Fund provides a complete list of its holdings four times in each fiscal year, at the quarter ends. For the second and fourth quarters, the lists appear in the Fund’s semiannual and annual reports to shareholders. For the first and third quarters, the Fund files the lists with the Securities and Exchange Commission (SEC) on Form N-Q. The most recent list of portfolio holdings is available at invesco.com/completeqtrholdings. Shareholders can also look up the Fund’s Forms N-Q on the SEC website at sec.gov. Copies of the Fund’s Forms N-Q may be reviewed and copied at the SEC Public Reference Room in Washington, D.C. You can obtain information on the operation of the Public Reference Room, including information about duplicating fee charges, by calling 202 551 8090 or 800 732 0330, or by electronic request at the following email address: publicinfo@sec.gov.
The SEC file numbers for the Fund are shown below.
| A description of the policies and procedures that the Fund uses to determine how to vote proxies relating to portfolio securities is available without charge, upon request, from our Client Services department at 800 959 4246 or at invesco.com/proxyguidelines. The information is also available on the SEC website, sec.gov. |
Information regarding how the Fund voted proxies related to its portfolio securities during the most recent 12-month period ended June 30 is available at invesco.com/proxysearch. The information is also available on the SEC website, sec.gov. Invesco Advisers, Inc. is an investment adviser; it provides investment advisory services to individual and institutional clients and does not sell securities. Invesco Distributors, Inc. is the US distributor for Invesco Ltd.’s retail mutual funds, exchange-traded funds and institutional money market funds. Both are wholly owned, indirect subsidiaries of Invesco Ltd. |  |
SEC file numbers: 811-02699 and 022-57526 | Invesco Distributors, Inc. | ALST-AR-1 | 02202018 | 1549 |
| ||||
 | Annual Report to Shareholders | December 31, 2017 | ||
| ||||
| Invesco Balanced-Risk Retirement Funds | ||||
| Invesco Balanced-Risk Retirement Now Fund | ||||
| Invesco Balanced-Risk Retirement 2020 Fund | ||||
| Invesco Balanced-Risk Retirement 2030 Fund | ||||
| Invesco Balanced-Risk Retirement 2040 Fund | ||||
| Invesco Balanced-Risk Retirement 2050 Fund | ||||

Letters to Shareholders
Philip Taylor | Dear Shareholders: This annual report includes information about your Fund, including performance data and a complete list of its investments as of the close of the reporting period. Inside is a discussion of how your Fund was managed and the factors that affected its performance during the reporting period. Major stock market indexes rose – and set record highs – throughout the reporting period. Generally positive economic data, strong corporate earnings and anticipated tax and regulatory reform contributed to the rally. The US economy expanded during the reporting period, with gross domestic product, the value of all goods and services produced, significantly increasing its growth rate from the first to the third quarter of the year. Tax reform legislation, enacted in December 2017, was a positive for the stock market, but its long-term economic impact was uncertain. Citing positive economic trends – specifically, realized and expected |

labor market conditions and inflation – the US Federal Reserve raised interest rates in March, June and December 2017. While US and global bond markets, as well as emerging market equities, sold off early in the reporting period, they recovered much of their losses during the reporting period. Overseas, economic data were mixed, prompting the European Central Bank and central banks in China and Japan, among other countries, to maintain extraordinarily accommodative monetary policies.
Short-term market volatility can prompt some investors to abandon their investment plans – and can cause others to settle for whatever returns the market has to offer. The investment professionals at Invesco, in contrast, invest with high conviction. This means that, no matter the asset class or the strategy, each investment team has a passion to exceed. We want to help investors achieve better outcomes, such as seeking higher returns, helping mitigate risk and generating income. Of course, investing with high conviction can’t guarantee a profit or ensure success; no investment strategy can. To learn more about how we invest with high conviction, visit invesco.com/HighConviction.
You, too, can invest with high conviction by maintaining a long-term investment perspective and by working with your financial adviser on a regular basis. During periods of short-term market volatility or uncertainty, your financial adviser can keep you focused on your long-term investment goals – a new home, a child’s college education or a secure retirement. He or she also can share research about the economy, the markets and individual investment options.
Visit our website for more information on your investments
Our website, invesco.com/us, offers a wide range of market insights and investment perspectives. On the website, you’ll find detailed information about our funds, including performance, holdings and portfolio manager commentaries. You can access information about your account by completing a simple, secure online registration. To do so, select “Log In” on the right side of the homepage, and then select “Register for Individual Account Access.”
In addition to the resources accessible on our website and through our mobile app, you can obtain timely updates to help you stay informed about the markets and the economy by connecting with Invesco on Twitter, LinkedIn or Facebook. You can access our blog at blog.invesco.us.com. Our goal is to provide you the information you want, when and where you want it.
Finally, I’m pleased to share with you Invesco’s commitment to both the Principles for Responsible Investment and to considering environmental, social and governance issues in our robust investment process. I invite you to learn more at invesco.com/esg.
Have questions?
For questions about your account, contact an Invesco client services representative at 800 959 4246. For Invesco-related questions or comments, please email me directly at phil@invesco.com.
All of us at Invesco look forward to serving your investment management needs. Thank you for investing with us.
Sincerely,

Philip Taylor
Senior Managing Director, Invesco Ltd.
2 Invesco Balanced-Risk Retirement Funds
Bruce Crockett | Dear Fellow Shareholders: Among the many important lessons I’ve learned in more than 40 years in a variety of business endeavors is the value of a trusted advocate. As independent chair of the Invesco Funds Board, I can assure you that the members of the Board are strong advocates for the interests of investors in Invesco’s mutual funds. We work hard to represent your interests through oversight of the quality of the investment management services your funds receive and other matters important to your investment, including but not limited to: ∎ Ensuring that Invesco offers a diverse lineup of mutual funds that your financial adviser can use to strive to meet your financial needs as your investment goals change over time. ∎ Monitoring how the portfolio management teams of the Invesco funds are performing in light of changing economic and market conditions. |

| ∎ | Assessing each portfolio management team’s investment performance within the context of the investment strategy described in the fund’s prospectus. |
| ∎ | Monitoring for potential conflicts of interests that may impact the nature of the services that your funds receive. |
We believe one of the most important services we provide our fund shareholders is the annual review of the funds’ advisory and sub-advisory contracts with Invesco Advisers and its affiliates. This review is required by the Investment Company Act of 1940 and focuses on the nature and quality of the services Invesco provides as the adviser to the Invesco funds and the reasonableness of the fees that it charges for those services. Each year, we spend months carefully reviewing information received from Invesco and a variety of independent sources, such as performance and fee data prepared by Lipper, Inc. (a subsidiary of Broadridge Financial Solutions, Inc.), an independent, third-party firm widely recognized as a leader in its field. We also meet with our independent legal counsel and other independent advisers to review and help us assess the information that we have received. Our goal is to assure that you receive quality investment management services for a reasonable fee.
I trust the measures outlined above provide assurance that you have a worthy advocate when it comes to choosing the Invesco Funds.
As always, please contact me at bruce@brucecrockett.com with any questions or concerns you may have. On behalf of the Board, we look forward to continuing to represent your interests and serving your needs.
Sincerely,

Bruce L. Crockett
Independent Chair
Invesco Funds Board of Trustees
| 3 Invesco Balanced-Risk Retirement Funds |
Management’s Discussion of Fund Performance
Performance summary - Invesco Balanced-Risk Retirement Now Fund For the year ended December 31, 2017, Class A shares of Invesco Balanced-Risk Retirement Now Fund (the Fund), at net asset value (NAV), underperformed the Custom Invesco Balanced-Risk Retirement Now Index. Your Fund’s long-term performance appears later in this report.
| ||
Fund vs. Indexes Total returns, 12/31/16 to 12/31/17, at net asset value (NAV). Performance shown does not include applicable contingent deferred sales charges (CDSC) or front-end sales charges, which would have reduced performance.
| ||
| Class A Shares | 6.11% | |
| Class AX Shares | 5.99 | |
| Class B Shares | 5.27 | |
| Class C Shares | 5.27 | |
| Class CX Shares | 5.27 | |
| Class R Shares | 5.84 | |
| Class RX Shares | 5.84 | |
| Class Y Shares | 6.51 | |
| Class R5 Shares | 6.39 | |
| Class R6 Shares | 6.39 | |
| S&P 500 Index▼ (Broad Market Index) | 21.83 | |
| Custom Invesco Balanced-Risk Allocation Broad Index⬛ (Style-Specific Index) | 14.25 | |
| Custom Invesco Balanced-Risk Retirement Now Index⬛ (Style-Specific Index) | 8.87 | |
| Lipper Mixed-Asset Target Today Index◆ (Peer Group Index) | 9.25 | |
Source(s): ▼FactSet Research Systems Inc.; ⬛Invesco, FactSet Research Systems Inc.; ◆Lipper Inc.
| ||
Market conditions and your Fund
Invesco Balanced-Risk Retirement Now Fund invests in a combination of Invesco Balanced-Risk Allocation Fund (IBRA) and affiliated money market funds to provide broad market diversification and execute the Fund’s glide path strategy with the goal of achieving real return and capital preservation for investors in retirement. As a result of the Fund’s strategy to invest in IBRA and affiliated money market funds, the Fund’s performance can be attributed to the performance of these underlying funds and the allocation of the Fund’s assets between the underlying funds.
For the year ended December 31, 2017, each of the asset classes in which IBRA invests (directly or indirectly through derivatives) provided positive
contributions to IBRA’s performance – and at NAV the Fund reported positive absolute performance. IBRA invests in derivatives, such as swaps and futures, which are expected to correspond to the performance of US and international fixed income, equity and commodity markets. The strategic allocation portion of the investment process involves first selecting representative assets for each asset class from a universe of more than 50 assets. Next, IBRA seeks to construct the portfolio so that an approximately equal amount of risk comes from equity, fixed income and commodity allocations. IBRA then makes tactical adjustments to its portfolio on a monthly basis to try and take advantage of short-term market dynamics, while remaining consistent with the balanced-risk long-term portfolio structure.
IBRA’s strategic exposure to equities, obtained through the use of swaps and futures, led results for the year, with all six markets in which IBRA invests – Europe ex-UK, Hong Kong, Japan, the UK, US large caps and US small caps – posting positive returns. Asian equities were the leading contributor as Japanese equity prices were boosted by increased exports. Hong Kong equities provided further positive influence from the Asian region, rising in sympathy with emerging markets, which enjoyed a substantial rally. While the prospect of less accommodative monetary policy from the European Central Bank (ECB) and Brexit (the UK’s plan to leave the European Union) remained sources of political and economic uncertainty, European and UK equities performed strongly due to improved economic data and positive confidence surveys. US equities – both large caps and small caps – contributed to IBRA’s performance for the year. The reporting period began with most major US stock market indexes hitting record highs following the US presidential election. Investors believed the new administration’s plans to reduce tax rates, scale back regulations and increase infrastructure spending had the potential to stimulate economic growth. That was called into question after the first quarter of 2017, when it appeared that enacting significant regulatory and tax reform might be more difficult than previously anticipated – although in December 2017, major tax reform legislation was enacted into law. Tactical positioning in US equities, obtained through the use of swaps and futures, contributed to IBRA’s performance for the year as overweight exposure to the asset class, relative to the Fund’s strategic exposure, proved timely.
IBRA’s exposure to commodities, obtained through the use of swaps, futures and commodity-linked notes,
also
Portfolio Composition |
| Asset Class* | Risk Allocation | % of Total Net Assets as of 12/31/17** | ||||||||
Equities | 42.43 | % | 25.87 | % | ||||||
Fixed Income | 19.11 | 37.77 | ||||||||
Commodities | 35.13 | 22.01 | ||||||||
Cash | 3.33 | 39.35 | ||||||||
Total | 100.00 | 125.00 | ||||||||
| * | Based on the expected market exposure through investments in the underlying funds. |
| ** | Due to the use of leverage, the percentages may not equal 100%. |
Total Net Assets | $ | 24.8 million |
The Fund’s holdings are subject to change, and there is no assurance that the Fund will continue to hold any particular security.
Data presented here are as of December 31, 2017.
Fund Nasdaq Symbols
|
| ||||
Class A Shares | IANAX | ||||
Class AX Shares | VIRAX | ||||
Class B Shares | IANBX | ||||
Class C Shares | IANCX | ||||
Class CX Shares | VIRCX | ||||
Class R Shares | IANRX | ||||
Class RX Shares | VIRRX | ||||
Class Y Shares | IANYX | ||||
Class R5 Shares | IANIX | ||||
Class R6 Shares | IANFX | ||||
4 Invesco Balanced-Risk Retirement Funds
contributed to its performance for the year, as gains in industrial metals, energy and precious metals outweighed losses in agriculture. Strategic positioning in industrial metals was the leading contributor to IBRA’s performance within the asset class, with gains in both aluminum and copper. Increased industrial metals prices were supported by strong manufacturing and import growth data out of China and by indications that China intended to cut production to curb pollution. IBRA’s strategic positioning within energy was also favorable as all assets, with the exception of natural gas, experienced gains. The energy commodity sector started the year plagued by high inventory levels and rising US production and rig counts. These conditions lasted throughout much of the first half of 2017. Oil and distillate prices rebounded in the third quarter of 2017 as the US rig count declined and expectations rose for an extension of OPEC’s production cuts. Severe weather also affected energy prices in the third quarter of 2017 as hurricanes forced refinery shutdowns that further boosted prices. Natural gas prices rose at the beginning of the year, but those gains were not enough to outweigh the losses from rising US output at the end of the year. Strategic positioning in precious metals contributed to IBRA’s performance for the reporting period, with gains in gold outweighing losses in silver. Precious metals were pressured as the US Federal Reserve raised short-term interest rates three times during the year – in March, June and December. Strategic positioning in agriculture was the sole detractor within the sector. Most agriculture assets posted losses except cotton, lean hogs and live cattle. Lean hogs and live cattle rose due to strong US export demand. Sugar was by far the leading detractor as production increased despite softer global demand. Tactical positioning within commodities, obtained through the use of futures, swaps and commodity-linked notes, slightly detracted from IBRA’s results for the year.
IBRA’s exposure to global government bonds, obtained through the use of swaps and futures,
contributed to results for the year led by Australia and the US. Despite expectations that the ECB would likely begin tapering its monetary policy accommodation, German government bonds also contributed to IBRA’s performance for the reporting period. Canadian government bonds were the largest detractor within the fixed income asset class as yields rose after the Central Bank
of Canada (BOC) raised rates in July. Yields spiked again in the third quarter of 2017 in response to a surprise rate hike by the BOC. UK bonds detracted as they continue to be consumed with Brexit and terrorism. IBRA’s tactical positioning within bonds detracted from performance for the reporting period as losses from overweight exposure to Canadian and UK government bonds, coupled with underweight exposure to German government bonds, outweighed gains from underweight exposure to Australian and US government bonds.
Please note that IBRA’s strategy is principally implemented with derivative instruments that include futures, commodity-linked notes and total return swaps. Therefore, all or most of the performance of the strategy, both positive and negative, can be attributed to these instruments. Derivatives can be a cost-effective way to gain exposure to asset classes. However, derivatives may amplify traditional investment risks through the creation of leverage and may be less liquid than traditional securities.
Thank you for your continued investment in Invesco Balanced-Risk Retirement Now Fund.
The views and opinions expressed in management’s discussion of Fund performance are those of Invesco Advisers, Inc. These views and opinions are subject to change at any time based on factors such as market and economic conditions. These views and opinions may not be relied upon as investment advice or recommendations, or as an offer for a particular security. The information is not a complete analysis of every aspect of any market, country, industry, security or the Fund. Statements of fact are from sources considered reliable, but Invesco Advisers, Inc. makes no representation or warranty as to their completeness or accuracy. Although historical performance is no guarantee of future results, these insights may help you understand our investment management philosophy.
See important Fund and, if applicable, index disclosures later in this report.
 |
Mark Ahnrud Chartered Financial Analyst, Portfolio Manager, is manager of Invesco Balanced-Risk Retirement Now Fund. | |
He joined Invesco in 2000. Mr. Ahnrud earned a BS in finance and investments from Babson College and an MBA from Duke University Fuqua School of Business.
 |
Chris Devine Chartered Financial Analyst, Portfolio Manager, is manager of Invesco Balanced-Risk Retirement Now Fund. | |
He joined Invesco in 1998. Mr. Devine earned a BA in economics from Wake Forest University and an MBA from the University of Georgia.
 |
Scott Hixon Chartered Financial Analyst, Portfolio Manager, is manager of Invesco Balanced-Risk Retirement Now Fund. | |
He joined Invesco in 1994. Mr. Hixon earned a BBA in finance from Georgia Southern University and an MBA in finance from Georgia State University.
 |
Christian Ulrich Chartered Financial Analyst, Portfolio Manager, is manager of Invesco Balanced-Risk Retirement Now Fund. | |
He joined Invesco in 2000. Mr. Ulrich earned the equivalent of a BBA from the KV Zurich Business School in Zurich, Switzerland.
 |
Scott Wolle Chartered Financial Analyst, Portfolio Manager, is manager of Invesco Balanced-Risk Retirement Now Fund. | |
He joined Invesco in 1999. Mr. Wolle earned a BS in finance from Virginia Polytechnic Institute and State University and an MBA from Duke University Fuqua School of Business.
Assisted by Invesco’s Global Asset
Allocation Team
| 5 Invesco Balanced-Risk Retirement Funds |
Management’s Discussion of Fund Performance
Performance summary - Invesco Balanced-Risk Retirement 2020 Fund For the year ended December 31, 2017, Class A shares of Invesco Balanced-Risk Retirement 2020 Fund (the Fund), at net asset value (NAV), underperformed the Custom Invesco Balanced-Risk Retirement 2020 Index. Your Fund’s long-term performance appears later in this report.
| ||
Fund vs. Indexes Total returns, 12/31/16 to 12/31/17, at net asset value (NAV). Performance shown does not include applicable contingent deferred sales charges (CDSC) or front-end sales charges, which would have reduced performance.
| ||
| Class A Shares | 7.24% | |
| Class AX Shares | 7.24 | |
| Class B Shares | 6.46 | |
| Class C Shares | 6.35 | |
| Class CX Shares | 6.48 | |
| Class R Shares | 6.99 | |
| Class RX Shares | 6.87 | |
| Class Y Shares | 7.52 | |
| Class R5 Shares | 7.48 | |
| Class R6 Shares | 7.47 | |
| S&P 500 Index▼ (Broad Market Index) | 21.83 | |
| Custom Invesco Balanced-Risk Allocation Broad Index⬛ (Style-Specific Index) | 14.25 | |
| Custom Invesco Balanced-Risk Retirement 2020 Index⬛ (Style-Specific Index) | 10.50 | |
| Lipper Mixed-Asset Target 2020 Funds Index◆ (Peer Group Index) | 13.12 | |
| Source(s): ◆FactSet Research Systems Inc.; ⬛Invesco, FactSet Research Systems Inc.; ◆Lipper Inc. | ||
Market conditions and your Fund
Invesco Balanced-Risk Retirement 2020 Fund invests in a combination of Invesco Balanced-Risk Allocation Fund (IBRA) and affiliated money market funds to provide broad market diversification and execute the Fund’s glide path strategy with the goal of achieving real return and capital preservation for investors in retirement. As a result of the Fund’s strategy to invest in IBRA and affiliated money market funds, the Fund’s performance can be attributed to the performance of these underlying funds and the allocation of the Fund’s assets between the underlying funds.
For the year ended December 31, 2017, each of the asset classes in which IBRA invests (directly or indirectly through derivatives) provided positive
contributions to IBRA’s performance – and at NAV the Fund reported positive absolute performance. IBRA invests in derivatives, such as swaps and futures, which are expected to correspond to the performance of US and international fixed income, equity and commodity markets. The strategic allocation portion of the investment process involves first selecting representative assets for each asset class from a universe of more than 50 assets. Next, IBRA seeks to construct the portfolio so that an approximately equal amount of risk comes from equity, fixed income and commodity allocations. IBRA then makes tactical adjustments to its portfolio on a monthly basis to try and take advantage of short-term market dynamics, while remaining consistent with the balanced-risk long-term portfolio structure.
IBRA’s strategic exposure to equities, obtained through the use of swaps and futures, led results for the year, with all six markets in which IBRA invests – Europe ex-UK, Hong Kong, Japan, the UK, US large caps and US small caps – posting positive returns. Asian equities were the leading contributor as Japanese equity prices were boosted by increased exports. Hong Kong equities provided further positive influence from the Asian region, rising in sympathy with emerging markets, which enjoyed a substantial rally. While the prospect of less accommodative monetary policy from the European Central Bank (ECB) and Brexit (the UK’s plan to leave the European Union) remained sources of political and economic uncertainty, European and UK equities performed strongly due to improved economic data and positive confidence surveys. US equities – both large caps and small caps – contributed to IBRA’s performance for the year. The reporting period began with most major US stock market indexes hitting record highs following the US presidential election. Investors believed the new administration’s plans to reduce tax rates, scale back regulations and increase infrastructure spending had the potential to stimulate economic growth. That was called into question after the first quarter of 2017, when it appeared that enacting significant regulatory and tax reform might be more difficult than previously anticipated – although in December 2017, major tax reform legislation was enacted into law. Tactical positioning in US equities, obtained through the use of swaps and futures, contributed to IBRA’s performance for the year as overweight exposure to the asset class, relative to the Fund’s strategic exposure, proved timely.
IBRA’s exposure to commodities, obtained through the use of swaps, futures and commodity-linked notes, also
Portfolio Composition |
| Asset Class* | Risk Allocation | % of Total Net Assets as of 12/31/17** | ||||||||
Equities | 42.99 | % | 30.60 | % | ||||||
Fixed Income | 19.36 | 44.66 | ||||||||
Commodities | 35.60 | 26.03 | ||||||||
Cash | 2.05 | 28.27 | ||||||||
Total | 100.00 | 129.56 | ||||||||
| * | Based on the expected market exposure through investments in the underlying funds. |
| ** | Due to the use of leverage, the percentages may not equal 100%. |
Total Net Assets | $64.9 million |
The Fund’s holdings are subject to change, and there is no assurance that the Fund will continue to hold any particular security.
Data presented here are as of December 31, 2017.
Fund Nasdaq Symbols
| ||
Class A Shares | AFTAX | |
Class AX Shares | VRCAX | |
Class B Shares | AFTBX | |
Class C Shares | AFTCX | |
Class CX Shares | VRCCX | |
Class R Shares | ATFRX | |
Class RX Shares | VRCRX | |
Class Y Shares | AFTYX | |
Class R5 Shares | AFTSX | |
Class R6 Shares | VRCFX | |
6 Invesco Balanced-Risk Retirement Funds
contributed to its performance for the year, as gains in industrial metals, energy and precious metals outweighed losses in agriculture. Strategic positioning in industrial metals was the leading contributor to IBRA’s performance within the asset class, with gains in both aluminum and copper. Increased industrial metals prices were supported by strong manufacturing and import growth data out of China and by indications that China intended to cut production to curb pollution. IBRA’s strategic positioning within energy was also favorable as all assets, with the exception of natural gas, experienced gains. The energy commodity sector started the year plagued by high inventory levels and rising US production and rig counts. These conditions lasted throughout much of the first half of 2017. Oil and distillate prices rebounded in the third quarter of 2017 as the US rig count declined and expectations rose for an extension of OPEC’s production cuts. Severe weather also affected energy prices in the third quarter of 2017 as hurricanes forced refinery shutdowns that further boosted prices. Natural gas prices rose at the beginning of the year, but those gains were not enough to outweigh the losses from rising US output at the end of the year. Strategic positioning in precious metals contributed to IBRA’s performance for the reporting period, with gains in gold outweighing losses in silver. Precious metals were pressured as the US Federal Reserve raised short-term interest rates three times during the year – in March, June and December. Strategic positioning in agriculture was the sole detractor within the sector. Most agriculture assets posted losses except cotton, lean hogs and live cattle. Lean hogs and live cattle rose due to strong US export demand. Sugar was by far the leading detractor as production increased despite softer global demand. Tactical positioning within commodities, obtained through the use of futures, swaps and commodity-linked notes, slightly detracted from IBRA’s results for the year.
IBRA’s exposure to global government bonds, obtained through the use of swaps and futures,
contributed to results for the year led by Australia and the US. Despite expectations that the ECB would likely begin tapering its monetary policy accommodation, German government bonds also contributed to IBRA’s performance for the reporting period. Canadian government bonds were the largest detractor within the fixed income asset class as yields rose after the Central Bank
of Canada (BOC) raised rates in July. Yields spiked again in the third quarter of 2017 in response to a surprise rate hike by the BOC. UK bonds detracted as they continue to be consumed with Brexit and terrorism. IBRA’s tactical positioning within bonds detracted from performance for the reporting period as losses from overweight exposure to Canadian and UK government bonds, coupled with underweight exposure to German government bonds, outweighed gains from underweight exposure to Australian and US government bonds.
Please note that IBRA’s strategy is principally implemented with derivative instruments that include futures, commodity-linked notes and total return swaps. Therefore, all or most of the performance of the strategy, both positive and negative, can be attributed to these instruments. Derivatives can be a cost-effective way to gain exposure to asset classes. However, derivatives may amplify traditional investment risks through the creation of leverage and may be less liquid than traditional securities.
Thank you for your continued investment in Invesco Balanced-Risk Retirement 2020 Fund.
The views and opinions expressed in management’s discussion of Fund performance are those of Invesco Advisers, Inc. These views and opinions are subject to change at any time based on factors such as market and economic conditions. These views and opinions may not be relied upon as investment advice or recommendations, or as an offer for a particular security. The information is not a complete analysis of every aspect of any market, country, industry, security or the Fund. Statements of fact are from sources considered reliable, but Invesco Advisers, Inc. makes no representation or warranty as to their completeness or accuracy. Although historical performance is no guarantee of future results, these insights may help you understand our investment management philosophy.
See important Fund and, if applicable, index disclosures later in this report.
|
Mark Ahnrud Chartered Financial Analyst, Portfolio Manager, is manager of Invesco Balanced-Risk Retirement 2020 Fund. | |
He joined Invesco in 2000. Mr. Ahnrud earned a BS in finance and investments from Babson College and an MBA from Duke University Fuqua School of Business.
|
Chris Devine Chartered Financial Analyst, Portfolio Manager, is manager of Invesco Balanced-Risk Retirement 2020 Fund. | |
He joined Invesco in 1998. Mr. Devine earned a BA in economics from Wake Forest University and an MBA from the University of Georgia.
|
Scott Hixon Chartered Financial Analyst, Portfolio Manager, is manager of Invesco Balanced-Risk Retirement 2020 Fund. | |
He joined Invesco in 1994. Mr. Hixon earned a BBA in finance from Georgia Southern University and an MBA in finance from Georgia State University.
|
Christian Ulrich Chartered Financial Analyst, Portfolio Manager, is manager of Invesco Balanced-Risk Retirement 2020 Fund. | |
He joined Invesco in 2000. Mr. Ulrich earned the equivalent of a BBA from the KV Zurich Business School in Zurich, Switzerland.
|
Scott Wolle Chartered Financial Analyst, Portfolio Manager, is manager of Invesco Balanced-Risk Retirement 2020 Fund. | |
He joined Invesco in 1999. Mr. Wolle earned a BS in finance from Virginia Polytechnic Institute and State University and an MBA from Duke University Fuqua School of Business.
Assisted by Invesco’s Global Asset
Allocation Team
| 7 Invesco Balanced-Risk Retirement Funds |
Management’s Discussion of Fund Performance
Performance summary - Invesco Balanced-Risk Retirement 2030 Fund For the year ended December 31, 2017, Class A shares of Invesco Balanced-Risk Retirement 2030 Fund (the Fund), at net asset value (NAV), underperformed the Custom Invesco Balanced-Risk Retirement 2030 Index. Your Fund’s long-term performance appears later in this report.
| ||
Fund vs. Indexes Total returns, 12/31/16 to 12/31/17, at net asset value (NAV). Performance shown does not include applicable contingent deferred sales charges (CDSC) or front-end sales charges, which would have reduced performance.
| ||
| Class A Shares | 10.20% | |
| Class AX Shares | 10.33 | |
| Class B Shares | 9.34 | |
| Class C Shares | 9.34 | |
| Class CX Shares | 9.47 | |
| Class R Shares | 9.97 | |
| Class RX Shares | 9.99 | |
| Class Y Shares | 10.46 | |
| Class R5 Shares | 10.55 | |
| Class R6 Shares | 10.43 | |
| S&P 500 Index▼ (Broad Market Index) | 21.83 | |
| Custom Invesco Balanced-Risk Allocation Broad Index⬛ (Style-Specific Index) | 14.25 | |
| Custom Invesco Balanced-Risk Retirement 2030 Index⬛ (Style-Specific Index) | 14.82 | |
| Lipper Mixed-Asset Target 2030 Funds Index◆ (Peer Group Index) | 16.97 | |
Source(s): ▼FactSet Research Systems Inc.; ⬛Invesco, FactSet Research Systems Inc.; ◆Lipper Inc.
| ||
Market conditions and your Fund
Invesco Balanced-Risk Retirement 2030 Fund invests in a combination of Invesco Balanced-Risk Allocation Fund (IBRA), Invesco Balanced-Risk Aggressive Allocation Fund (IBRAA) and affiliated money market funds to provide broad market diversification and execute the Fund’s glide path strategy which transitions from an accumulation strategy to a real return strategy at the target retirement date. As a result of the Fund’s strategy to invest in IBRA, IBRAA and affiliated money market funds, the Fund’s performance can be attributed to the performance of these underlying funds and the allocation of the Fund’s assets among the underlying funds.
For the year ended December 31, 2017, each of the asset classes in which IBRA and IBRAA invests (directly or
indirectly through derivatives) provided positive contributions to Fund performance – and the Fund at NAV reported positive absolute performance. IBRA and IBRAA invest in derivatives, such as swaps and futures, which are expected to correspond to the performance of US and international fixed income, equity and commodity markets. The strategic allocation portion of the investment process involves first selecting representative assets for each asset class from a universe of more than 50 assets. Next, IBRA and IBRAA seek to construct portfolios so that an approximately equal amount of risk comes from our equity, fixed income and commodity allocations. IBRA and IBRAA then make tactical adjustments to their portfolios on a monthly basis to try and take advantage of short-term market dynamics, while
remaining consistent with the balanced-risk long-term portfolio structure.
IBRA’s and IBRAA’s strategic exposure to equities, obtained through the use of swaps and futures, led results for the year, with all six markets in which IBRA and IBRAA invest – Europe ex-UK, Hong Kong, Japan, the UK, US large caps and US small caps – posting positive returns. Asian equities were the leading contributor as Japanese equity prices were boosted by increased exports. Hong Kong equities provided further positive influence from the Asian region, rising in sympathy with emerging markets, which enjoyed a substantial rally. While the prospect of less accommodative monetary policy from the European Central Bank (ECB) and Brexit (the UK’s plan to leave the European Union) remained sources of political and economic uncertainty, European and UK equities performed strongly due to improved economic data and positive confidence surveys. US equities – both large caps and small caps – contributed to IBRA’s and IBRAA’s performance for the year. The reporting period began with most major US stock market indexes hitting record highs following the US presidential election. Investors believed the new administration’s plans to reduce tax rates, scale back regulations and increase infrastructure spending had the potential to stimulate economic growth. That was called into question after the first quarter of 2017, when it appeared that enacting significant regulatory and tax reform might be more difficult than previously anticipated – although in December 2017, major tax reform legislation was enacted into law. Tactical positioning in US equities, obtained through the use of swaps and futures, contributed to IBRA’s and IBRAA’s performance for the year as overweight exposure to the asset class, relative to the Fund’s strategic exposure, proved timely.
| Portfolio Composition |
| Asset Class* | Risk Allocation | % of Total Net Assets as of 12/31/17** | ||||||||
| Equities | 43.88 | % | 44.21 | % | ||||||
| Fixed Income | 19.76 | 64.53 | ||||||||
| Commodities | 36.33 | 37.60 | ||||||||
| Cash | 0.03 | 0.67 | ||||||||
Total | 100.00 | 147.01 | ||||||||
| * | Based on the expected market exposure through investments in the underlying funds. |
| ** | Due to the use of leverage, the percentages may not equal 100%. |
Total Net Assets | $73.0 million |
The Fund’s holdings are subject to change, and there is no assurance that the Fund will continue to hold any particular security.
Data presented here are as of December 31, 2017.
Fund Nasdaq Symbols
| ||
Class A Shares | TNAAX | |
Class AX Shares | VREAX | |
Class B Shares | TNABX | |
Class C Shares | TNACX | |
Class CX Shares | VRECX | |
Class R Shares | TNARX | |
Class RX Shares | VRERX | |
Class Y Shares | TNAYX | |
Class R5 Shares | TNAIX | |
Class R6 Shares | TNAFX | |
8 Invesco Balanced-Risk Retirement Funds
IBRA’s and IBRAA’s exposure to commodities, obtained through the use of swaps, futures and commodity-linked notes, also contributed to IBRA’s and IBRAA’s performance for the year, as gains in industrial metals, energy and precious metals outweighed losses in agriculture. Strategic positioning in industrial metals was the leading contributor to IBRA’s and IBRAA’s performance within the asset class, with gains in both aluminum and copper. Increased industrial metals prices were supported by strong manufacturing and import growth data out of China and by indications that China intended to cut production to curb pollution. IBRA’s and IBRAA’s strategic positioning within energy was also favorable as all assets, with the exception of natural gas, experienced gains. The energy commodity sector started the year plagued by high inventory levels and rising US production and rig counts. These conditions lasted throughout much of the first half of 2017. Oil and distillate prices rebounded in the third quarter of 2017 as the US rig count declined and expectations rose for an extension of OPEC’s production cuts. Severe weather also affected energy prices in the third quarter of 2017 as hurricanes forced refinery shutdowns that further boosted prices. Natural gas prices rose at the beginning of the year, but those gains were not enough to outweigh the losses from rising US output at the end of the year. Strategic positioning in precious metals contributed to IBRA’s and IBRAA’s performance, with gains in gold outweighing losses in silver. Precious metals were pressured as the US Federal Reserve raised short-term interest rates three times during the year – in March, June and December. Strategic positioning in agriculture was the sole detractor within the sector. Most agriculture assets posted losses except cotton, lean hogs and live cattle. Lean hogs and live cattle rose due to strong US export demand. Sugar was by far the leading detractor as production increased despite softer global demand. Tactical positioning within commodities, obtained through the use of futures, swaps and commodity-linked notes, slightly detracted from IBRA’s and IBRAA’s results for the year.
IBRA’s and IBRAA’s exposure to global government bonds, obtained through the use of swaps and futures, contributed to results for the year led by Australia and the US. Despite expectations that the ECB would likely begin tapering its monetary policy accommodation, German
government bonds also contributed to IBRA’s and IBRAA’s performance for the reporting period. Canadian government bonds were the largest detractor within the fixed income asset class as yields rose after the Central Bank of Canada (BOC) raised rates in July. Yields spiked again in the third quarter of 2017 in response to a surprise rate hike by the BOC. UK bonds detracted as they continue to be consumed with Brexit and terrorism. IBRA’s and IBRAA’s tactical positioning within bonds detracted from performance for the reporting period as losses from overweight exposure to Canadian and UK government bonds, coupled with underweight exposure to German government bonds, outweighed gains from underweight exposure to Australian and US government bonds.
Please note that IBRA’s and IBRAA’s strategy is principally implemented with derivative instruments that include futures, commodity-linked notes and total return swaps. Therefore, all or most of the performance of the strategy, both positive and negative, can be attributed to these instruments. Derivatives can be a cost-effective way to gain exposure to asset classes. However, derivatives may amplify traditional investment risks through the creation of leverage and may be less liquid than traditional securities.
Thank you for your continued investment in Invesco Balanced-Risk Retirement 2030 Fund.
The views and opinions expressed in management’s discussion of Fund performance are those of Invesco Advisers, Inc. These views and opinions are subject to change at any time based on factors such as market and economic conditions. These views and opinions may not be relied upon as investment advice or recommendations, or as an offer for a particular security. The information is not a complete analysis of every aspect of any market, country, industry, security or the Fund. Statements of fact are from sources considered reliable, but Invesco Advisers, Inc. makes no representation or warranty as to their completeness or accuracy. Although historical performance is no guarantee of future results, these insights may help you understand our investment management philosophy.
See important Fund and, if applicable, index disclosures later in this report.
| Mark Ahnrud Chartered Financial Analyst, Portfolio Manager, is manager of Invesco Balanced-Risk Retirement 2030 Fund. He joined |
Invesco in 2000. Mr. Ahnrud earned a BS in finance and investments from Babson College and an MBA from Duke University Fuqua School of Business.
| Chris Devine Chartered Financial Analyst, Portfolio Manager, is manager of Invesco Balanced-Risk Retirement 2030 Fund. He joined | |
Invesco in 1998. Mr. Devine earned a BA in economics from Wake Forest University and an MBA from the University of Georgia.
| Scott Hixon Chartered Financial Analyst, Portfolio Manager, is manager of Invesco Balanced-Risk Retirement 2030 Fund. He joined | |
Invesco in 1994. Mr. Hixon earned a BBA in finance from Georgia Southern University and an MBA in finance from Georgia State University.
| Christian Ulrich Chartered Financial Analyst, Portfolio Manager, is manager of Invesco Balanced-Risk Retirement 2030 Fund. He joined | |
Invesco in 2000. Mr. Ulrich earned the equivalent of a BBA from the KV Zurich Business School in Zurich, Switzerland.
| Scott Wolle Chartered Financial Analyst, Portfolio Manager, is manager of Invesco Balanced-Risk Retirement 2030 Fund. He joined | |
Invesco in 1999. Mr. Wolle earned a BS in finance from Virginia Polytechnic Institute and State University and an MBA from Duke University Fuqua School of Business.
Assisted by Invesco’s Global Asset
Allocation Team
| 9 Invesco Balanced-Risk Retirement Funds |
Management’s Discussion of Fund Performance
Performance summary - Invesco Balanced-Risk Retirement 2040 Fund For the year ended December 31, 2017, Class A shares of Invesco Balanced-Risk Retirement 2040 Fund (the Fund), at net asset value (NAV), underperformed the Custom Invesco Balanced-Risk Retirement 2040 Index. Your Fund’s long-term performance appears later in this report.
| ||
Fund vs. Indexes Total returns, 12/31/16 to 12/31/17, at net asset value (NAV). Performance shown does not include applicable contingent deferred sales charges (CDSC) or front-end sales charges, which would have reduced performance.
| ||
| Class A Shares | 11.78% | |
| Class AX Shares | 11.79 | |
| Class B Shares | 10.93 | |
| Class C Shares | 10.95 | |
| Class CX Shares | 10.96 | |
| Class R Shares | 11.42 | |
| Class RX Shares | 11.57 | |
| Class Y Shares | 12.02 | |
| Class R5 Shares | 12.14 | |
| Class R6 Shares | 12.00 | |
| S&P 500 Index▼ (Broad Market Index) | 21.83 | |
| Custom Invesco Balanced-Risk Allocation Broad Index⬛ (Style-Specific Index) | 14.25 | |
| Custom Invesco Balanced-Risk Retirement 2040 Index⬛ (Style-Specific Index) | 15.78 | |
| Lipper Mixed-Asset Target 2040 Funds Index◆ (Peer Group Index) | 20.91 | |
Source(s): ▼FactSet Research Systems Inc.; ⬛Invesco, FactSet Research Systems Inc.; ◆Lipper Inc.
| ||
Market conditions and your Fund
Invesco Balanced-Risk Retirement 2040 Fund invests in a combination of Invesco Balanced-Risk Allocation Fund (IBRA), Invesco Balanced-Risk Aggressive Allocation Fund (IBRAA) and affiliated money market funds to provide broad market diversification and execute the Fund’s glide path strategy which transitions from an accumulation strategy to a real return strategy at the target retirement date. As a result of the Fund’s strategy to invest in IBRA, IBRAA and affiliated money market funds, the Fund’s performance can be attributed to the performance of these underlying funds and the allocation of the Fund’s assets among the underlying funds.
For the year ended December 31, 2017, each of the asset classes in which IBRA and IBRAA invests (directly or
indirectly through derivatives) provided positive contributions to Fund performance – and the Fund at NAV reported positive absolute performance. IBRA and IBRAA invest in derivatives, such as swaps and futures, which are expected to correspond to the performance of US and international fixed income, equity and commodity markets. The strategic allocation portion of the investment process involves first selecting representative assets for each asset class from a universe of more than 50 assets. Next, IBRA and IBRAA seek to construct portfolios so that an approximately equal amount of risk comes from our equity, fixed income and commodity allocations. IBRA and IBRAA then make tactical adjustments to their portfolios on a monthly basis to try and take advantage of short-term market dynamics, while
remaining consistent with the balanced-risk long-term portfolio structure.
IBRA’s and IBRAA’s strategic exposure to equities, obtained through the use of swaps and futures, led results for the year, with all six markets in which IBRA and IBRAA invest – Europe ex-UK, Hong Kong, Japan, the UK, US large caps and US small caps – posting positive returns. Asian equities were the leading contributor as Japanese equity prices were boosted by increased exports. Hong Kong equities provided further positive influence from the Asian region, rising in sympathy with emerging markets, which enjoyed a substantial rally. While the prospect of less accommodative monetary policy from the European Central Bank (ECB) and Brexit (the UK’s plan to leave the European Union) remained sources of political and economic uncertainty, European and UK equities performed strongly due to improved economic data and positive confidence surveys. US equities – both large caps and small caps – contributed to IBRA’s and IBRAA’s performance for the year. The reporting period began with most major US stock market indexes hitting record highs following the US presidential election. Investors believed the new administration’s plans to reduce tax rates, scale back regulations and increase infrastructure spending had the potential to stimulate economic growth. That was called into question after the first quarter of 2017, when it appeared that enacting significant regulatory and tax reform might be more difficult than previously anticipated – although in December 2017, major tax reform legislation was enacted into law. Tactical positioning in US equities, obtained through the use of swaps and futures, contributed to IBRA’s and IBRAA’s performance for the year as overweight exposure to the asset class, relative to the Fund’s strategic exposure, proved timely.
| Portfolio Composition | ||||||||||
| Asset Class* | Risk Allocation | % of Total Net Assets as of 12/31/17** | ||||||||
| Equities | 43.88 | % | 51.38 | % | ||||||
| Fixed Income | 19.76 | 74.99 | ||||||||
| Commodities | 36.33 | 43.70 | ||||||||
| Cash | 0.03 | 0.79 | ||||||||
Total | 100.00 | 170.86 | ||||||||
| * | Based on the expected market exposure through investments in the underlying funds. |
| ** | Due to the use of leverage, the percentages may not equal 100%. |
Total Net Assets
|
$53.7 million |
The Fund’s holdings are subject to change, and there is no assurance that the Fund will continue to hold any particular security.
Data presented here are as of December 31, 2017.
Fund Nasdaq Symbols
|
| ||||
| Class A Shares | TNDAX | ||||
| Class AX Shares | VRGAX | ||||
| Class B Shares | TNDBX | ||||
| Class C Shares | TNDCX | ||||
| Class CX Shares | VRGCX | ||||
| Class R Shares | TNDRX | ||||
| Class RX Shares | VRGRX | ||||
| Class Y Shares | TNDYX | ||||
| Class R5 Shares | TNDIX | ||||
| Class R6 Shares | TNDFX | ||||
10 Invesco Balanced-Risk Retirement Funds
IBRA’s and IBRAA’s exposure to commodities, obtained through the use of swaps, futures and commodity-linked notes, also contributed to IBRA’s and IBRAA’s performance for the year, as gains in industrial metals, energy and precious metals outweighed losses in agriculture. Strategic positioning in industrial metals was the leading contributor to IBRA’s and IBRAA’s performance within the asset class, with gains in both aluminum and copper. Increased industrial metals prices were supported by strong manufacturing and import growth data out of China and by indications that China intended to cut production to curb pollution. IBRA’s and IBRAA’s strategic positioning within energy was also favorable as all assets, with the exception of natural gas, experienced gains. The energy commodity sector started the year plagued by high inventory levels and rising US production and rig counts. These conditions lasted throughout much of the first half of 2017. Oil and distillate prices rebounded in the third quarter of 2017 as the US rig count declined and expectations rose for an extension of OPEC’s production cuts. Severe weather also affected energy prices in the third quarter of 2017 as hurricanes forced refinery shutdowns that further boosted prices. Natural gas prices rose at the beginning of the year, but those gains were not enough to outweigh the losses from rising US output at the end of the year. Strategic positioning in precious metals contributed to IBRA’s and IBRAA’s performance, with gains in gold outweighing losses in silver. Precious metals were pressured as the US Federal Reserve raised short-term interest rates three times during the year – in March, June and December. Strategic positioning in agriculture was the sole detractor within the sector. Most agriculture assets posted losses except cotton, lean hogs and live cattle. Lean hogs and live cattle rose due to strong US export demand. Sugar was by far the leading detractor as production increased despite softer global demand. Tactical positioning within commodities, obtained through the use of futures, swaps and commodity-linked notes, slightly detracted from IBRA’s and IBRAA’s results for the year.
IBRA’s and IBRAA’s exposure to global government bonds, obtained through the use of swaps and futures, contributed to results for the year led by Australia and the US. Despite expectations that the ECB would likely begin tapering its monetary policy accommodation, German government bonds also contributed to IBRA’s and IBRAA’s performance for the
reporting period. Canadian government bonds were the largest detractor within the fixed income asset class as yields rose after the Central Bank of Canada (BOC) raised rates in July. Yields spiked again in the third quarter of 2017 in response to a surprise rate hike by the BOC. UK bonds detracted as they continue to be consumed with Brexit and terrorism. IBRA’s and IBRAA’s tactical positioning within bonds detracted from performance for the reporting period as losses from overweight exposure to Canadian and UK government bonds, coupled with underweight exposure to German government bonds, outweighed gains from underweight exposure to Australian and US government bonds.
Please note that IBRA’s and IBRAA’s strategy is principally implemented with derivative instruments that include futures, commodity-linked notes and total return swaps. Therefore, all or most of the performance of the strategy, both positive and negative, can be attributed to these instruments. Derivatives can be a cost-effective way to gain exposure to asset classes. However, derivatives may amplify traditional investment risks through the creation of leverage and may be less liquid than traditional securities.
Thank you for your continued investment in Invesco Balanced-Risk Retirement 2040 Fund.
The views and opinions expressed in management’s discussion of Fund performance are those of Invesco Advisers, Inc. These views and opinions are subject to change at any time based on factors such as market and economic conditions. These views and opinions may not be relied upon as investment advice or recommendations, or as an offer for a particular security. The information is not a complete analysis of every aspect of any market, country, industry, security or the Fund. Statements of fact are from sources considered reliable, but Invesco Advisers, Inc. makes no representation or warranty as to their completeness or accuracy. Although historical performance is no guarantee of future results, these insights may help you understand our investment management philosophy.
See important Fund and, if applicable, index disclosures later in this report.
| Mark Ahnrud Chartered Financial Analyst, Portfolio Manager, is manager of Invesco Balanced-Risk Retirement 2040 Fund. He joined | |
| Invesco in 2000. Mr. Ahnrud earned a BS in finance and investments from Babson College and an MBA from Duke University Fuqua School of Business. | ||
| Chris Devine Chartered Financial Analyst, Portfolio Manager, is manager of Invesco Balanced-Risk Retirement 2040 Fund. He joined | |
| Invesco in 1998. Mr. Devine earned a BA in economics from Wake Forest University and an MBA from the University of Georgia. | ||
| Scott Hixon Chartered Financial Analyst, Portfolio Manager, is manager of Invesco Balanced-Risk Retirement 2040 Fund. He joined | |
| Invesco in 1994. Mr. Hixon earned a BBA in finance from Georgia Southern University and an MBA in finance from Georgia State University. | ||
| Christian Ulrich Chartered Financial Analyst, Portfolio Manager, is manager of Invesco Balanced-Risk Retirement 2040 Fund. He joined | |
| Invesco in 2000. Mr. Ulrich earned the equivalent of a BBA from the KV Zurich Business School in Zurich, Switzerland. | ||
| Scott Wolle Chartered Financial Analyst, Portfolio Manager, is manager of Invesco Balanced-Risk Retirement 2040 Fund. He joined | |
| Invesco in 1999. Mr. Wolle earned a BS in finance from Virginia Polytechnic Institute and State University and an MBA from Duke University Fuqua School of Business. | ||
Assisted by Invesco’s Global Asset
Allocation Team
| 11 Invesco Balanced-Risk Retirement Funds |
Management’s Discussion of Fund Performance
Performance summary - Invesco Balanced-Risk Retirement 2050 Fund For the year ended December 31, 2017, Class A shares of Invesco Balanced-Risk Retirement 2050 Fund (the Fund), at net asset value (NAV), underperformed the Custom Invesco Balanced-Risk Retirement 2050 Index. Your Fund’s long-term performance appears later in this report.
| ||
Fund vs. Indexes Total returns, 12/31/16 to 12/31/17, at net asset value (NAV). Performance shown does not include applicable contingent deferred sales charges (CDSC) or front-end sales charges, which would have reduced performance.
| ||
| Class A Shares | 13.16% | |
| Class AX Shares | 13.30 | |
| Class B Shares | 12.53 | |
| Class C Shares | 12.35 | |
| Class CX Shares | 12.51 | |
| Class R Shares | 12.96 | |
| Class RX Shares | 13.10 | |
| Class Y Shares | 13.67 | |
| Class R5 Shares | 13.65 | |
| Class R6 Shares | 13.63 | |
| S&P 500 Index▼ (Broad Market Index) | 21.83 | |
| Custom Invesco Balanced-Risk Allocation Broad Index⬛ (Style-Specific Index) | 14.25 | |
| Custom Invesco Balanced-Risk Retirement 2050 Index⬛ (Style-Specific Index) | 16.75 | |
| Lipper Mixed-Asset Target 2050 Funds Index◆ (Peer Group Index) | 21.69 | |
Source(s): ▼FactSet Research Systems Inc.; ⬛Invesco, FactSet Research Systems Inc.; ◆Lipper Inc.
| ||
Market conditions and your Fund
Invesco Balanced-Risk Retirement 2050 Fund invests in a combination of Invesco Balanced-Risk Allocation Fund (IBRA), Invesco Balanced-Risk Aggressive Allocation Fund (IBRAA) and affiliated money market funds to provide broad market diversification and execute the Fund’s glide path strategy which transitions from an accumulation strategy to a real return strategy at the target retirement date. As a result of the Fund’s strategy to invest in IBRA, IBRAA and affiliated money market funds, the Fund’s performance can be attributed to the performance of these underlying funds and the allocation of the Fund’s assets among the underlying funds.
For the year ended December 31, 2017, each of the asset classes in which IBRA and IBRAA invests (directly or
indirectly through derivatives) provided positive contributions to Fund performance – and the Fund at NAV reported positive absolute performance. IBRA and IBRAA invest in derivatives, such as swaps and futures, which are expected to correspond to the performance of US and international fixed income, equity and commodity markets. The strategic allocation portion of the investment process involves first selecting representative assets for each asset class from a universe of more than 50 assets. Next, IBRA and IBRAA seek to construct portfolios so that an approximately equal amount of risk comes from our equity, fixed income and commodity allocations. IBRA and IBRAA then make tactical adjustments to their portfolios on a monthly basis to try and take advantage of short-term market dynamics, while
remaining consistent with the balanced-risk long-term portfolio structure.
IBRA’s and IBRAA’s strategic exposure to equities, obtained through the use of swaps and futures, led results for the year, with all six markets in which IBRA and IBRAA invest – Europe ex-UK, Hong Kong, Japan, the UK, US large caps and US small caps – posting positive returns. Asian equities were the leading contributor as Japanese equity prices were boosted by increased exports. Hong Kong equities provided further positive influence from the Asian region, rising in sympathy with emerging markets, which enjoyed a substantial rally. While the prospect of less accommodative monetary policy from the European Central Bank (ECB) and Brexit (the UK’s plan to leave the European Union) remained sources of political and economic uncertainty, European and UK equities performed strongly due to improved economic data and positive confidence surveys. US equities – both large caps and small caps – contributed to IBRA’s and IBRAA’s performance for the year. The reporting period began with most major US stock market indexes hitting record highs following the US presidential election. Investors believed the new administration’s plans to reduce tax rates, scale back regulations and increase infrastructure spending had the potential to stimulate economic growth. That was called into question after the first quarter of 2017, when it appeared that enacting significant regulatory and tax reform might be more difficult than previously anticipated – although in December 2017, major tax reform legislation was enacted into law. Tactical positioning in US equities, obtained through the use of swaps and futures, contributed to IBRA’s and IBRAA’s performance for the year as overweight exposure to the asset class, relative to the Fund’s strategic exposure, proved timely.
| Portfolio Composition | ||||||||||
| Asset Class* | Risk Allocation | % of Total Net Assets as of 12/31/17** | ||||||||
| Equities | 43.89 | % | 57.88 | % | ||||||
| Fixed Income | 19.77 | 84.47 | ||||||||
| Commodities | 36.34 | 49.22 | ||||||||
| Cash | 0.00 | 0.00 | ||||||||
Total | 100.00 | 191.57 | ||||||||
| * | Based on the expected market exposure through investments in the underlying funds. |
| ** | Due to the use of leverage, the percentages may not equal 100%. |
| Total Net Assets | $ | 38.5 million |
The Fund’s holdings are subject to change, and there is no assurance that the Fund will continue to hold any particular security.
Data presented here are as of December 31, 2017.
Fund Nasdaq Symbols
|
| ||||
| Class A Shares | TNEAX | ||||
| Class AX Shares | VRIAX | ||||
| Class B Shares | TNEBX | ||||
| Class C Shares | TNECX | ||||
| Class CX Shares | VRICX | ||||
| Class R Shares | TNERX | ||||
| Class RX Shares | VRIRX | ||||
| Class Y Shares | TNEYX | ||||
| Class R5 Shares | TNEIX | ||||
| Class R6 Shares | TNEFX | ||||
12 Invesco Balanced-Risk Retirement Funds
IBRA’s and IBRAA’s exposure to commodities, obtained through the use of swaps, futures and commodity-linked notes, also contributed to IBRA’s and IBRAA’s performance for the year, as gains in industrial metals, energy and precious metals outweighed losses in agriculture. Strategic positioning in industrial metals was the leading contributor to IBRA’s and IBRAA’s performance within the asset class, with gains in both aluminum and copper. Increased industrial metals prices were supported by strong manufacturing and import growth data out of China and by indications that China intended to cut production to curb pollution. IBRA’s and IBRAA’s strategic positioning within energy was also favorable as all assets, with the exception of natural gas, experienced gains. The energy commodity sector started the year plagued by high inventory levels and rising US production and rig counts. These conditions lasted throughout much of the first half of 2017. Oil and distillate prices rebounded in the third quarter of 2017 as the US rig count declined and expectations rose for an extension of OPEC’s production cuts. Severe weather also affected energy prices in the third quarter of 2017 as hurricanes forced refinery shutdowns that further boosted prices. Natural gas prices rose at the beginning of the year, but those gains were not enough to outweigh the losses from rising US output at the end of the year. Strategic positioning in precious metals contributed to IBRA’s and IBRAA’s performance, with gains in gold outweighing losses in silver. Precious metals were pressured as the US Federal Reserve raised short-term interest rates three times during the year – in March, June and December. Strategic positioning in agriculture was the sole detractor within the sector. Most agriculture assets posted losses except cotton, lean hogs and live cattle. Lean hogs and live cattle rose due to strong US export demand. Sugar was by far the leading detractor as production increased despite softer global demand. Tactical positioning within commodities, obtained through the use of futures, swaps and commodity-linked notes, slightly detracted from IBRA’s and IBRAA’s results for the year.
IBRA’s and IBRAA’s exposure to global government bonds, obtained through the use of swaps and futures, contributed to results for the year led by Australia and the US. Despite expectations that the ECB would likely begin tapering its monetary policy accommodation, German
government bonds also contributed to IBRA’s and IBRAA’s performance for the reporting period. Canadian government bonds were the largest detractor within the fixed income asset class as yields rose after the Central Bank of Canada (BOC) raised rates in July. Yields spiked again in the third quarter of 2017 in response to a surprise rate hike by the BOC. UK bonds detracted as they continue to be consumed with Brexit and terrorism. IBRA’s and IBRAA’s tactical positioning within bonds detracted from performance for the reporting period as losses from overweight exposure to Canadian and UK government bonds, coupled with underweight exposure to German government bonds, outweighed gains from underweight exposure to Australian and US government bonds.
Please note that IBRA’s and IBRAA��s strategy is principally implemented with derivative instruments that include futures, commodity-linked notes and total return swaps. Therefore, all or most of the performance of the strategy, both positive and negative, can be attributed to these instruments. Derivatives can be a cost-effective way to gain exposure to asset classes. However, derivatives may amplify traditional investment risks through the creation of leverage and may be less liquid than traditional securities.
Thank you for your continued investment in Invesco Balanced-Risk Retirement 2050 Fund.
The views and opinions expressed in management’s discussion of Fund performance are those of Invesco Advisers, Inc. These views and opinions are subject to change at any time based on factors such as market and economic conditions. These views and opinions may not be relied upon as investment advice or recommendations, or as an offer for a particular security. The information is not a complete analysis of every aspect of any market, country, industry, security or the Fund. Statements of fact are from sources considered reliable, but Invesco Advisers, Inc. makes no representation or warranty as to their completeness or accuracy. Although historical performance is no guarantee of future results, these insights may help you understand our investment management philosophy.
See important Fund and, if applicable, index disclosures later in this report.
| Mark Ahnrud Chartered Financial Analyst, Portfolio Manager, is manager of Invesco Balanced-Risk Retirement 2050 Fund. He joined | |
| Invesco in 2000. Mr. Ahnrud earned a BS in finance and investments from Babson College and an MBA from Duke University Fuqua School of Business. | ||
| Chris Devine Chartered Financial Analyst, Portfolio Manager, is manager of Invesco Balanced-Risk Retirement 2050 Fund. He joined | |
| Invesco in 1998. Mr. Devine earned a BA in economics from Wake Forest University and an MBA from the University of Georgia. | ||
| Scott Hixon Chartered Financial Analyst, Portfolio Manager, is manager of Invesco Balanced-Risk Retirement 2050 Fund. He joined | |
| Invesco in 1994. Mr. Hixon earned a BBA in finance from Georgia Southern University and an MBA in finance from Georgia State University. | ||
| Christian Ulrich Chartered Financial Analyst, Portfolio Manager, is manager of Invesco Balanced-Risk Retirement 2050 Fund. He joined | |
| Invesco in 2000. Mr. Ulrich earned the equivalent of a BBA from the KV Zurich Business School in Zurich, Switzerland. | ||
| Scott Wolle Chartered Financial Analyst, Portfolio Manager, is manager of Invesco Balanced-Risk Retirement 2050 Fund. He joined | |
| Invesco in 1999. Mr. Wolle earned a BS in finance from Virginia Polytechnic Institute and State University and an MBA from Duke University Fuqua School of Business. | ||
| 13 Invesco Balanced-Risk Retirement Funds |
Invesco Balanced-Risk Retirement Now Fund’s Long-Term Performance
Results of a $10,000 Investment – Oldest Share Class(es)
Fund and index data from 12/31/07
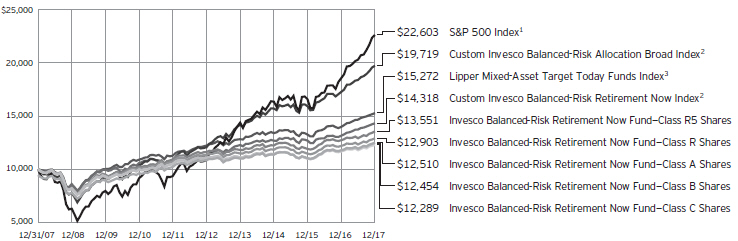
| 1 | Source: FactSet Research Systems Inc. |
| 2 | Source(s): Invesco, FactSet Research Systems Inc. |
| 3 | Source: Lipper Inc. |
Past performance cannot guarantee comparable future results.
The data shown in the chart include reinvested distributions, applicable sales charges and Fund expenses including management fees. Results for Class B shares are calculated as if a hypothetical shareholder had liquidated his entire investment in the Fund at the close of the reporting period and paid the contingent deferred sales charges, if applicable.
Index results include reinvested dividends, but they do not reflect sales charges. Performance of the peer group, if applicable, reflects fund expenses and management fees; performance of a market index does not. Performance shown in the chart and table(s) does not reflect deduction of taxes a shareholder would pay on Fund distributions or sale of Fund shares.
14 Invesco Balanced-Risk Retirement Funds
Average Annual Total Returns As of 12/31/17, including maximum applicable sales charges
| ||
Class A Shares | ||
Inception (1/31/07) | 2.40% | |
10 Years | 2.26 | |
5 Years | 1.71 | |
1 Year | 0.28 | |
Class AX Shares | ||
10 Years | 2.24% | |
5 Years | 1.69 | |
1 Year | 0.16 | |
Class B Shares | ||
Inception (1/31/07) | 2.35% | |
10 Years | 2.22 | |
5 Years | 1.78 | |
1 Year | 0.27 | |
Class C Shares | ||
Inception (1/31/07) | 2.16% | |
10 Years | 2.08 | |
5 Years | 2.14 | |
1 Year | 4.27 | |
Class CX Shares | ||
10 Years | 2.07% | |
5 Years | 2.11 | |
1 Year | 4.27 | |
Class R Shares | ||
Inception (1/31/07) | 2.66% | |
10 Years | 2.58 | |
5 Years | 2.60 | |
1 Year | 5.84 | |
Class RX Shares | ||
10 Years | 2.57% | |
5 Years | 2.60 | |
1 Year | 5.84 | |
Class Y Shares | ||
10 Years | 3.08% | |
5 Years | 3.11 | |
1 Year | 6.51 | |
Class R5 Shares | ||
Inception (1/31/07) | 3.17% | |
10 Years | 3.09 | |
5 Years | 3.11 | |
1 Year | 6.39 | |
Class R6 Shares | ||
10 Years | 2.97% | |
5 Years | 3.11 | |
1 Year | 6.39 | |
Class AX shares incepted on June 1, 2010. Performance shown prior to that date is that of Class A shares and includes the 12b-1 fees applicable to Class A shares.
Class CX and Class RX shares incepted on June 1, 2010. Performance shown prior to that date is that of Class A shares, restated to reflect the higher 12b-1 fees applicable to Class CX and Class RX shares.
Class Y shares incepted on October 3, 2008. Performance shown prior to that date is that of Class A shares and includes the 12b-1 fees applicable to Class A shares.
Class R6 shares incepted on September 24, 2012. Performance shown prior to that date is that of Class A shares and includes the 12b-1 fees applicable to Class A shares.
The performance data quoted represent past performance and cannot guarantee comparable future results; current performance may be lower or higher. Please visit invesco.com/performance for the most recent month-end performance. Performance figures reflect reinvested distributions, changes in net asset value and the effect of the maximum sales charge unless otherwise stated. Investment return and principal value will fluctuate so that you may have a gain or loss when you sell shares.
The net annual Fund operating expense ratio set forth in the most recent Fund prospectus as of the date of this report for Class A, Class AX, Class B, Class C, Class CX, Class R, Class RX, Class Y, Class R5 and Class R6 shares was 0.81%, 0.81%, 1.56%, 1.56%, 1.56%, 1.06%, 1.06%, 0.56%, 0.56% and 0.56%, respectively.1,2 The total annual Fund operating expense ratio set forth in the most recent Fund prospectus as of the date of this report for Class A, Class AX, Class B, Class C, Class CX, Class R, Class RX, Class Y, Class R5 and Class R6 shares was 1.88%, 1.88%, 2.63%, 2.63%, 2.63%, 2.13%, 2.13%, 1.63%, 1.54% and 1.47%, respectively.1 The expense ratios presented above may vary from the expense ratios presented in other sections of this report that are based on expenses incurred during the period covered by this report.
Class A and Class AX share performance reflects the maximum 5.50% sales charge, and Class B, Class C and Class CX share performance reflects the applicable contingent deferred sales charge (CDSC) for the period involved.
The CDSC on Class B shares declines from 5% beginning at the time of purchase to 0% at the beginning of the seventh year. The CDSC on Class C and Class CX shares is 1% for the first year after purchase. Class R, Class RX, Class Y, Class R5 and Class R6 shares do not have a front-end sales charge or a CDSC; therefore, performance is at net asset value.
The performance of the Fund’s share classes will differ primarily due to different sales charge structures and class expenses.
Fund performance reflects any applicable fee waivers and/or expense reimbursements. Had the adviser not waived fees and/or reimbursed expenses currently or in the past, returns would have been lower. See current prospectus for more information.
| 1 | The expense ratio includes acquired fund fees and expenses of the underlying funds in which the Fund invests of 0.56%. |
| 2 | Total annual Fund operating expenses after any contractual fee waivers and/or expense reimbursements by the adviser in effect through at least April 30, 2019. See current prospectus for more information. |
| 15 Invesco Balanced-Risk Retirement Funds |
Invesco Balanced-Risk Retirement 2020 Fund’s Long-Term Performance
Results of a $10,000 Investment – Oldest Share Class(es)
Fund and index data from 12/31/07
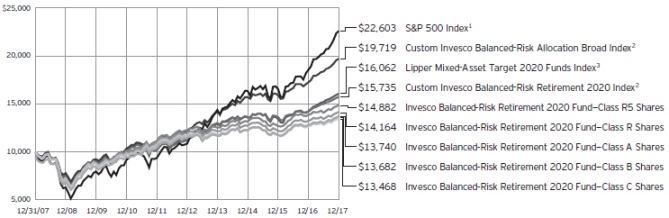
| 1 | Source: FactSet Research Systems Inc. |
| 2 | Source(s): Invesco, FactSet Research Systems Inc. |
| 3 | Source: Lipper Inc. |
Past performance cannot guarantee comparable future results.
The data shown in the chart include reinvested distributions, applicable sales charges and Fund expenses including management fees. Results for Class B shares are calculated as if a hypothetical shareholder had liquidated his entire investment in the Fund at the close of the reporting period and paid the contingent deferred sales charges, if applicable.
Index results include reinvested dividends, but they do not reflect sales charges. Performance of the peer group, if applicable, reflects fund expenses and management fees; performance of a market index does not. Performance shown in the chart and table(s) does not reflect deduction of taxes a shareholder would pay on Fund distributions or sale of Fund shares.
16 Invesco Balanced-Risk Retirement Funds
Average Annual Total Returns As of 12/31/17, including maximum applicable sales charges | ||
Class A Shares | ||
Inception (1/31/07) | 3.18% | |
10 Years | 3.23 | |
5 Years | 2.55 | |
1 Year | 1.30 | |
Class AX Shares | ||
10 Years | 3.23% | |
5 Years | 2.55 | |
1 Year | 1.30 | |
Class B Shares | ||
Inception (1/31/07) | 3.14% | |
10 Years | 3.18 | |
5 Years | 2.60 | |
1 Year | 1.46 | |
Class C Shares | ||
Inception (1/31/07) | 2.92% | |
10 Years | 3.02 | |
5 Years | 2.95 | |
1 Year | 5.35 | |
Class CX Shares | ||
10 Years | 3.04% | |
5 Years | 2.95 | |
1 Year | 5.48 | |
Class R Shares | ||
Inception (1/31/07) | 3.45% | |
10 Years | 3.54 | |
5 Years | 3.44 | |
1 Year | 6.99 | |
Class RX Shares | ||
10 Years | 3.55% | |
5 Years | 3.44 | |
1 Year | 6.87 | |
Class Y Shares | ||
10 Years | 4.04% | |
5 Years | 3.96 | |
1 Year | 7.52 | |
Class R5 Shares | ||
Inception (1/31/07) | 3.97% | |
10 Years | 4.06 | |
5 Years | 3.97 | |
1 Year | 7.48 | |
Class R6 Shares | ||
10 Years | 3.95% | |
5 Years | 3.96 | |
1 Year | 7.47 | |
Class AX shares incepted on June 1, 2010. Performance shown prior to that date is that of Class A shares and includes the 12b-1 fees applicable to Class A shares.
Class CX and Class RX shares incepted on June 1, 2010. Performance shown prior to that date is that of Class A shares, restated to reflect the higher 12b-1 fees applicable to Class CX and Class RX shares.
Class Y shares incepted on October 3, 2008. Performance shown prior to that date is that of Class A shares and includes the 12b-1 fees applicable to Class A shares.
Class R6 shares incepted on September 24, 2012. Performance shown prior to that date is that of Class A shares and includes the 12b-1 fees applicable to Class A shares.
The performance data quoted represent past performance and cannot guarantee comparable future results; current performance may be lower or higher. Please visit invesco.com/performance for the most recent month-end performance. Performance figures reflect reinvested distributions, changes in net asset value and the effect of the maximum sales charge unless otherwise stated. Investment return and principal value will fluctuate so that you may have a gain or loss when you sell shares.
The net annual Fund operating expense ratio set forth in the most recent Fund prospectus as of the date of this report for Class A, Class AX, Class B, Class C, Class CX, Class R, Class RX, Class Y, Class R5 and Class R6 shares was 0.91%, 0.91%, 1.66%, 1.66%, 1.66%, 1.16%, 1.16%, 0.66%, 0.66% and 0.66%, respectively.1,2 The total annual Fund operating expense ratio set forth in the most recent Fund prospectus as of the date of this report for Class A, Class AX, Class B, Class C, Class CX, Class R, Class RX, Class Y, Class R5 and Class R6 shares was 1.48%, 1.48%, 2.23%, 2.23%, 2.23%, 1.73%, 1.73%, 1.23%, 1.13% and 1.04%, respectively.1 The expense ratios presented above may vary from the expense ratios presented in other sections of this report that are based on expenses incurred during the period covered by this report.
Class A and Class AX share performance reflects the maximum 5.50% sales charge, and Class B, Class C and Class CX share performance reflects the applicable contingent deferred sales
charge (CDSC) for the period involved. The CDSC on Class B shares declines from 5% beginning at the time of purchase to 0% at the beginning of the seventh year. The CDSC on Class C and Class CX shares is 1% for the first year after purchase. Class R, Class RX, Class Y, Class R5 and Class R6 shares do not have a front-end sales charge or a CDSC; therefore, performance is at net asset value.
The performance of the Fund’s share classes will differ primarily due to different sales charge structures and class expenses.
Fund performance reflects any applicable fee waivers and/or expense reimbursements. Had the adviser not waived fees and/or reimbursed expenses currently or in the past, returns would have been lower. See current prospectus for more information.
| 1 | The expense ratio includes acquired fund fees and expenses of the underlying funds in which the Fund invests of 0.66%. |
| 2 | Total annual Fund operating expenses after any contractual fee waivers and/or expense reimbursements by the adviser in effect through at least April 30, 2019. See current prospectus for more information. |
| 17 Invesco Balanced-Risk Retirement Funds |
Invesco Balanced-Risk Retirement 2030 Fund’s Long-Term Performance
Results of a $10,000 Investment – Oldest Share Class(es)
Fund and index data from 12/31/07
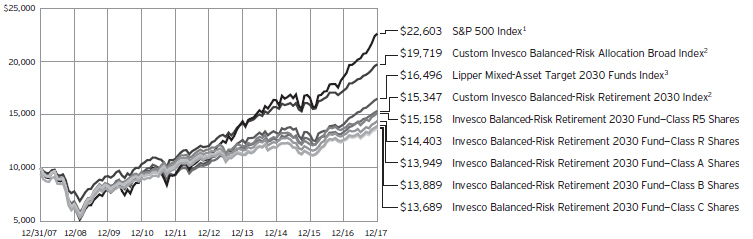
| 1 | Source: FactSet Research Systems Inc. |
| 2 | Source(s): Invesco, FactSet Research Systems Inc. |
| 3 | Source: Lipper Inc. |
Past performance cannot guarantee comparable future results.
The data shown in the chart include reinvested distributions, applicable sales charges and Fund expenses including management fees. Results for Class B shares are calculated as if a hypothetical shareholder had liquidated his entire investment in the Fund at the close of the reporting period and paid the contingent deferred sales charges, if applicable.
Index results include reinvested dividends, but they do not reflect sales charges. Performance of the peer group, if applicable, reflects fund expenses and management fees; performance of a market index does not. Performance shown in the chart and table(s) does not reflect deduction of taxes a shareholder would pay on Fund distributions or sale of Fund shares.
18 Invesco Balanced-Risk Retirement Funds
Average Annual Total Returns As of 12/31/17, including maximum applicable sales charges | ||
Class A Shares | ||
Inception (1/31/07) | 3.29% | |
10 Years | 3.38 | |
5 Years | 3.79 | |
1 Year | 4.19 | |
Class AX Shares | ||
10 Years | 3.39% | |
5 Years | 3.81 | |
1 Year | 4.30 | |
Class B Shares | ||
Inception (1/31/07) | 3.25% | |
10 Years | 3.34 | |
5 Years | 3.88 | |
1 Year | 4.34 | |
Class C Shares | ||
Inception (1/31/07) | 3.05% | |
10 Years | 3.19 | |
5 Years | 4.23 | |
1 Year | 8.34 | |
Class CX Shares | ||
10 Years | 3.22% | |
5 Years | 4.25 | |
1 Year | 8.47 | |
Class R Shares | ||
Inception (1/31/07) | 3.57% | |
10 Years | 3.72 | |
5 Years | 4.75 | |
1 Year | 9.97 | |
Class RX Shares | ||
10 Years | 3.73% | |
5 Years | 4.73 | |
1 Year | 9.99 | |
Class Y Shares | ||
10 Years | 4.22% | |
5 Years | 5.24 | |
1 Year | 10.46 | |
Class R5 Shares | ||
Inception (1/31/07) | 4.09% | |
10 Years | 4.25 | |
5 Years | 5.25 | |
1 Year | 10.55 | |
Class R6 Shares | ||
10 Years | 4.11% | |
5 Years | 5.23 | |
1 Year | 10.43 | |
Class AX shares incepted on June 1, 2010. Performance shown prior to that date is that of Class A shares and includes the 12b-1 fees applicable to Class A shares.
Class CX and Class RX shares incepted on June 1, 2010. Performance shown prior to that date is that of Class A shares, restated to reflect the higher 12b-1 fees applicable to Class CX and Class RX shares.
Class Y shares incepted on October 3, 2008. Performance shown prior to that date is that of Class A shares and includes the 12b-1 fees applicable to Class A shares.
Class R6 shares incepted on September 24, 2012. Performance shown prior to that date is that of Class A shares and includes the 12b-1 fees applicable to Class A shares.
The performance data quoted represent past performance and cannot guarantee comparable future results; current performance may be lower or higher. Please visit invesco.com/performance for the most recent month-end performance. Performance figures reflect reinvested distributions, changes in net asset value and the effect of the maximum sales charge unless otherwise stated. Investment return and principal value will fluctuate so that you may have a gain or loss when you sell shares.
The net annual Fund operating expense ratio set forth in the most recent Fund prospectus as of the date of this report for Class A, Class AX, Class B, Class C, Class CX, Class R, Class RX, Class Y, Class R5 and Class R6 shares was 1.08%, 1.08%, 1.83%, 1.83%, 1.83%, 1.33%, 1.33%, 0.83%, 0.83% and 0.83%, respectively.1,2 The total annual Fund operating expense ratio set forth in the most recent Fund prospectus as of the date of this report for Class A, Class AX, Class B, Class C, Class CX, Class R, Class RX, Class Y, Class R5 and Class R6 shares was 1.64%, 1.64%, 2.39%, 2.39%, 2.39%, 1.89%, 1.89%, 1.39%, 1.27% and 1.18%, respectively.1 The expense ratios presented above may vary from the expense ratios presented in other sections of this report that are based on expenses incurred during the period covered by this report.
Class A and Class AX share performance reflects the maximum 5.50% sales charge, and Class B, Class C and Class CX share performance reflects the applicable contingent deferred sales
charge (CDSC) for the period involved. The CDSC on Class B shares declines from 5% beginning at the time of purchase to 0% at the beginning of the seventh year. The CDSC on Class C and Class CX shares is 1% for the first year after purchase. Class R, Class RX, Class Y, Class R5 and Class R6 shares do not have a front-end sales charge or a CDSC; therefore, performance is at net asset value.
The performance of the Fund’s share classes will differ primarily due to different sales charge structures and class expenses.
Fund performance reflects any applicable fee waivers and/or expense reimbursements. Had the adviser not waived fees and/or reimbursed expenses currently or in the past, returns would have been lower. See current prospectus for more information.
| 1 | The expense ratio includes acquired fund fees and expenses of the underlying funds in which the Fund invests of 0.83%. |
| 2 | Total annual Fund operating expenses after any contractual fee waivers and/or expense reimbursements by the adviser in effect through at least April 30, 2019. See current prospectus for more information. |
| 19 Invesco Balanced-Risk Retirement Funds |
Invesco Balanced-Risk Retirement 2040 Fund’s Long-Term Performance
Results of a $10,000 Investment – Oldest Share Class(es)
Fund and index data from 12/31/07
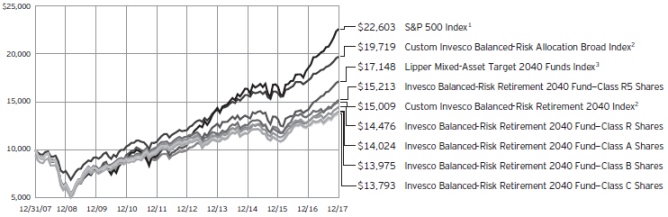
| 1 | Source: FactSet Research Systems Inc. |
| 2 | Source(s): Invesco, FactSet Research Systems Inc. |
| 3 | Source: Lipper Inc. |
Past performance cannot guarantee comparable future results.
The data shown in the chart include reinvested distributions, applicable sales charges and Fund expenses including management fees. Results for Class B shares are calculated as if a hypothetical shareholder had liquidated his entire investment in the Fund at the close of the reporting period and paid the contingent deferred sales charges, if applicable.
Index results include reinvested dividends, but they do not reflect sales charges. Performance of the peer group, if applicable, reflects fund expenses and management fees; performance of a market index does not. Performance shown in the chart and table(s) does not reflect deduction of taxes a shareholder would pay on Fund distributions or sale of Fund shares.
20 Invesco Balanced-Risk Retirement Funds
Average Annual Total Returns As of 12/31/17, including maximum applicable sales charges | ||
Class A Shares | ||
Inception (1/31/07) | 3.32% | |
10 Years | 3.44 | |
5 Years | 4.53 | |
1 Year | 5.63 | |
Class AX Shares | ||
10 Years | 3.43% | |
5 Years | 4.50 | |
1 Year | 5.64 | |
Class B Shares | ||
Inception (1/31/07) | 3.29% | |
10 Years | 3.40 | |
5 Years | 4.65 | |
1 Year | 5.93 | |
Class C Shares | ||
Inception (1/31/07) | 3.10% | |
10 Years | 3.27 | |
5 Years | 4.96 | |
1 Year | 9.95 | |
Class CX Shares | ||
10 Years | 3.27% | |
5 Years | 4.97 | |
1 Year | 9.96 | |
Class R Shares | ||
Inception (1/31/07) | 3.60% | |
10 Years | 3.77 | |
5 Years | 5.45 | |
1 Year | 11.42 | |
Class RX Shares | ||
10 Years | 3.77% | |
5 Years | 5.44 | |
1 Year | 11.57 | |
Class Y Shares | ||
10 Years | 4.26% | |
5 Years | 5.95 | |
1 Year | 12.02 | |
Class R5 Shares | ||
Inception (1/31/07) | 4.11% | |
10 Years | 4.28 | |
5 Years | 5.99 | |
1 Year | 12.14 | |
Class R6 Shares | ||
10 Years | 4.17% | |
5 Years | 5.97 | |
1 Year | 12.00 | |
Class AX shares incepted on June 1, 2010. Performance shown prior to that date is that of Class A shares and includes the 12b-1 fees applicable to Class A shares.
Class CX and Class RX shares incepted on June 1, 2010. Performance shown prior to that date is that of Class A shares, restated to reflect the higher 12b-1 fees applicable to Class CX and Class RX shares.
Class Y shares incepted on October 3, 2008. Performance shown prior to that date is that of Class A shares and includes the 12b-1 fees applicable to Class A shares.
Class R6 shares incepted on September 24, 2012. Performance shown prior to that date is that of Class A shares and includes the 12b-1 fees applicable to Class A shares.
The performance data quoted represent past performance and cannot guarantee comparable future results; current performance may be lower or higher. Please visit invesco.com/performance for the most recent month-end performance. Performance figures reflect reinvested distributions, changes in net asset value and the effect of the maximum sales charge unless otherwise stated. Investment return and principal value will fluctuate so that you may have a gain or loss when you sell shares.
The net annual Fund operating expense ratio set forth in the most recent Fund prospectus as of the date of this report for Class A, Class AX, Class B, Class C, Class CX, Class R, Class RX, Class Y, Class R5 and Class R6 shares was 1.12%, 1.12%, 1.87%, 1.87%, 1.87%, 1.37%, 1.37%, 0.87%, 0.87% and 0.87%, respectively.1,2 The total annual Fund operating expense ratio set forth in the most recent Fund prospectus as of the date of this report for Class A, Class AX, Class B, Class C, Class CX, Class R, Class RX, Class Y, Class R5 and Class R6 shares was 1.93%, 1.93%, 2.68%, 2.68%, 2.68%, 2.18%, 2.18%, 1.68%, 1.49% and 1.40%, respectively.1 The expense ratios presented above may vary from the expense ratios presented in other sections of this report that are based on expenses incurred during the period covered by this report.
Class A and Class AX share performance reflects the maximum 5.50% sales charge, and Class B, Class C and Class CX share performance reflects the applicable contingent deferred sales
charge (CDSC) for the period involved. The CDSC on Class B shares declines from 5% beginning at the time of purchase to 0% at the beginning of the seventh year. The CDSC on Class C and Class CX shares is 1% for the first year after purchase. Class R, Class RX, Class Y, Class R5 and Class R6 shares do not have a front-end sales charge or a CDSC; therefore, performance is at net asset value.
The performance of the Fund’s share classes will differ primarily due to different sales charge structures and class expenses.
Fund performance reflects any applicable fee waivers and/or expense reimbursements. Had the adviser not waived fees and/or reimbursed expenses currently or in the past, returns would have been lower. See current prospectus for more information.
| 1 | The expense ratio includes acquired fund fees and expenses of the underlying funds in which the Fund invests of 0.87%. |
| 2 | Total annual Fund operating expenses after any contractual fee waivers and/or expense reimbursements by the adviser in effect through at least April 30, 2019. See current prospectus for more information. |
| 21 Invesco Balanced-Risk Retirement Funds |
Invesco Balanced-Risk Retirement 2050 Fund’s Long-Term Performance
Results of a $10,000 Investment – Oldest Share Class(es)
Fund and index data from 12/31/07
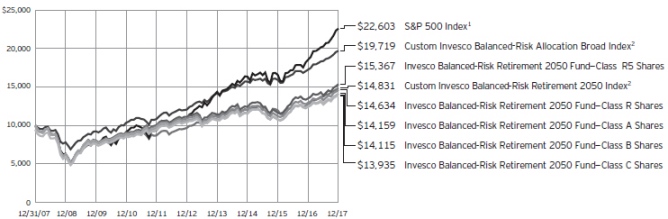
| 1 | Source: FactSet Research Systems Inc. |
| 2 | Source(s): Invesco, FactSet Research Systems Inc. |
Past performance cannot guarantee comparable future results.
The Lipper Mixed-Asset Target 2050 Funds Index is not shown on the chart as the index does not have sufficient performance history.
The data shown in the chart include reinvested distributions, applicable sales charges and Fund expenses including management fees. Results for Class B shares are calculated as if a hypothetical shareholder had liquidated his entire investment in the Fund at the close of the
reporting period and paid the contingent deferred sales charges, if applicable. Index results include reinvested dividends, but they do not reflect sales charges. Performance of the peer group, if applicable, reflects fund expenses and management fees; performance of a market index does not. Performance shown in the chart and table(s) does not reflect deduction of taxes a shareholder would pay on Fund distributions or sale of Fund shares.
22 Invesco Balanced-Risk Retirement Funds
Average Annual Total Returns As of 12/31/17, including maximum applicable sales charges | ||
Class A Shares | ||
Inception (1/31/07) | 3.39% | |
10 Years | 3.54 | |
5 Years | 5.17 | |
1 Year | 6.91 | |
Class AX Shares | ||
10 Years | 3.53% | |
5 Years | 5.16 | |
1 Year | 7.04 | |
Class B Shares | ||
Inception (1/31/07) | 3.34% | |
10 Years | 3.51 | |
5 Years | 5.38 | |
1 Year | 7.53 | |
Class C Shares | ||
Inception (1/31/07) | 3.17% | |
10 Years | 3.37 | |
5 Years | 5.62 | |
1 Year | 11.35 | |
Class CX Shares | ||
10 Years | 3.38% | |
5 Years | 5.66 | |
1 Year | 11.51 | |
Class R Shares | ||
Inception (1/31/07) | 3.67% | |
10 Years | 3.88 | |
5 Years | 6.14 | |
1 Year | 12.96 | |
Class RX Shares | ||
10 Years | 3.88% | |
5 Years | 6.14 | |
1 Year | 13.10 | |
Class Y Shares | ||
10 Years | 4.37% | |
5 Years | 6.67 | |
1 Year | 13.67 | |
Class R5 Shares | ||
Inception (1/31/07) | 4.18% | |
10 Years | 4.39 | |
5 Years | 6.67 | |
1 Year | 13.65 | |
Class R6 Shares | ||
10 Years | 4.28% | |
5 Years | 6.66 | |
1 Year | 13.63 | |
Class AX shares incepted on June 1, 2010. Performance shown prior to that date is that of Class A shares and includes the 12b-1 fees applicable to Class A shares.
Class CX and Class RX shares incepted on June 1, 2010. Performance shown prior to that date is that of Class A shares, restated to reflect the higher 12b-1 fees applicable to Class CX and Class RX shares.
Class Y shares incepted on October 3, 2008. Performance shown prior to that date is that of Class A shares and includes the 12b-1 fees applicable to Class A shares.
Class R6 shares incepted on September 24, 2012. Performance shown prior to that date is that of Class A shares and includes the 12b-1 fees applicable to Class A shares.
The performance data quoted represent past performance and cannot guarantee comparable future results; current performance may be lower or higher. Please visit invesco.com/performance for the most recent month-end performance. Performance figures reflect reinvested distributions, changes in net asset value and the effect of the maximum sales charge unless otherwise stated. Investment return and principal value will fluctuate so that you may have a gain or loss when you sell shares.
The net annual Fund operating expense ratio set forth in the most recent Fund prospectus as of the date of this report for Class A, Class AX, Class B, Class C, Class CX, Class R, Class RX, Class Y, Class R5 and Class R6 shares was 1.16%, 1.16%, 1.91%, 1.91%, 1.91%, 1.41%, 1.41%, 0.91%, 0.91% and 0.91%, respectively.1,2 The total annual Fund operating expense ratio set forth in the most recent Fund prospectus as of the date of this report for Class A, Class AX, Class B, Class C, Class CX, Class R, Class RX, Class Y, Class R5 and Class R6 shares was 2.48%, 2.48%, 3.23%, 3.23%, 3.23%, 2.73%, 2.73%, 2.23%, 1.93% and 1.86%, respectively.1 The expense ratios presented above may vary from the expense ratios presented in other sections of this report that are based on expenses incurred during the period covered by this report.
Class A and Class AX share performance reflects the maximum 5.50% sales charge, and Class B, Class C and Class CX share performance reflects the applicable contingent deferred sales charge (CDSC) for the period involved.
The CDSC on Class B shares declines from 5% beginning at the time of purchase to 0% at the beginning of the seventh year. The CDSC on Class C and Class CX shares is 1% for the first year after purchase. Class R, Class RX, Class Y, Class R5 and Class R6 shares do not have a front-end sales charge or a CDSC; therefore, performance is at net asset value.
The performance of the Fund’s share classes will differ primarily due to different sales charge structures and class expenses.
Fund performance reflects any applicable fee waivers and/or expense reimbursements. Had the adviser not waived fees and/or reimbursed expenses currently or in the past, returns would have been lower. See current prospectus for more information.
| 1 | The expense ratio includes acquired fund fees and expenses of the underlying funds in which the Fund invests of 0.91%. |
| 2 | Total annual Fund operating expenses after any contractual fee waivers and/or expense reimbursements by the adviser in effect through at least April 30, 2019. See current prospectus for more information. |
| 23 Invesco Balanced-Risk Retirement Funds |
Invesco Balanced-Risk Retirement Now Fund’s investment objective is to provide real return and, as a secondary objective, capital preservation.
Invesco Balanced-Risk Retirement 2020 Fund’s, Invesco Balanced-Risk Retirement 2030 Fund’s, Invesco Balanced-Risk Retirement 2040 Fund’s and Invesco Balanced-Risk Retirement 2050 Fund’s investment objective is to provide total return with a low to moderate correlation to traditional financial market indices, and as a secondary objective, capital preservation.
| ∎ | Unless otherwise stated, information presented in this report is as of December 31, 2017, and is based on total net assets. |
| ∎ | Unless otherwise noted, all data provided by Invesco. |
| ∎ | To access your Fund’s reports/prospectus, visit invesco.com/fundreports. |
About share classes
| ∎ | Class AX shares, Class CX shares, Class RX shares and Class Y shares are available only to certain investors. Please see the prospectus for more information. |
| ∎ | Effective January 26, 2018, after the close of the reporting period, all outstanding Class B shares were converted to Class A shares, in advance of their normally scheduled conversion. No CDSC was paid in connection with this early conversion. |
| ∎ | Class R shares are generally available only to employee benefit plans. Please see the prospectus for more information. |
| ∎ | Class R5 shares and Class R6 shares are available for use by retirement plans that meet certain standards and for institutional investors. Class R6 shares are also available through intermediaries that have established an agreement with Invesco Distributors, Inc. to make such shares available for use in retail omnibus accounts. Please see the prospectus for more information. |
The principal risks of investing in the Funds and the underlying funds are:
| ∎ | Allocation risk. The Fund’s investment performance depends, in part, on how its assets are allocated among the underlying funds or asset classes. The Adviser’s evaluations and assumptions regarding the asset classes or the underlying funds in which the Fund invests may be incorrect, causing the Fund to be invested (or not invested) in one or more asset classes or underlying funds at an inopportune time, which could negatively affect the Fund’s performance. |
| ∎ | Changing fixed income market conditions risk. The current low interest rate environment was created in part by the Federal Reserve Board (FRB) and certain foreign central banks keeping the federal funds and equivalent foreign rates near, at or below zero. Increases in the federal funds and equivalent foreign rates may expose fixed income markets to heightened volatility and reduced liquidity for certain fixed income investments, particularly those with longer maturities. In addition, decreases in fixed income dealer market-making capacity may also potentially lead to heightened volatility and reduced liquidity in the fixed income markets. As a result, the value of an underlying fund’s investments and share price may decline. Changes in central bank policies could also result in higher than normal shareholder redemptions, which could potentially increase portfolio turnover and an underlying fund’s transaction costs. |
| ∎ | Commodities tax risk. The tax treatment of commodity-linked derivative instruments may be adversely affected by changes in legislation, regulations or other legally binding authority. If, as a result of any such adverse action, the income of an underlying fund from certain commodity-linked derivatives was treated as non-qualifying income, an underlying fund might fail to qualify as a regulated investment company and be subject to federal income tax at the fund level. As a result of a recent announcement by the Internal Revenue Service, an underlying fund intends to invest in commodity-linked notes: (a) directly, generally only to the extent that it obtains an opinion of counsel confirming that income from such investments should be qualifying income because such commodity-linked notes |
constitute securities under section 2(a) (36) of the 1940 Act or (b) indirectly through the Subsidiary. Should the Internal Revenue Service issue further guidance, or Congress enact legislation, that adversely affects the tax treatment of an underlying fund’s use of commodity-linked notes or a wholly-owned subsidiary (which guidance might be applied to the underlying fund retroactively), it could, among other consequences, limit the underlying fund’s ability to pursue its investment strategy. |
| ∎ | Commodity-linked notes risk. In addition to risks associated with the underlying commodities, investments in commodity-linked notes may be subject to additional risks, such as non-payment of interest and loss of principal, counterparty risk, lack of a secondary market and risk of greater volatility than traditional equity and debt securities. The value of the commodity-linked notes an underlying fund buys may fluctuate significantly because the values of the underlying investments to which they are linked are themselves volatile. Additionally, certain commodity-linked notes employ “economic” leverage by requiring payment by the issuer of an amount that is a multiple of the price increase or decrease of the underlying commodity, commodity index, or other economic variable. Such economic leverage will increase the volatility of the value of these commodity-linked notes and an underlying fund to the extent it invests in such notes. |
| ∎ | Commodity risk. An underlying fund may have investment exposure to the commodities markets and/or a particular sector of the commodities markets, which may subject an underlying fund to greater volatility than investments in traditional securities, such as stocks and bonds. Volatility in the commodities markets may be caused by changes in overall market movements, domestic and foreign political and economic events and policies, war, acts of terrorism, changes in domestic or foreign |
This report must be accompanied or preceded by a currently effective Fund prospectus, which contains more complete information, including sales charges and expenses. Investors should read it carefully before investing.
| ||
NOT FDIC INSURED | MAY LOSE VALUE | NO BANK GUARANTEE |
| 24 Invesco Balanced-Risk Retirement Funds |
interest rates and/or investor expectations concerning interest rates, domestic and foreign inflation rates, investment and trading activities of mutual funds, hedge funds and commodities funds, and factors such as drought, floods, weather, livestock disease, embargoes, tariffs and other regulatory developments, or supply and demand disruptions. Because an underlying fund’s performance may be linked to the performance of volatile commodities, investors should be willing to assume the risks of potentially significant fluctuations in the value of an underlying fund’s shares. |
| ∎ | Correlation risk. Because an underlying fund’s investment strategy seeks to balance risk across three asset classes and, within each asset class, across different countries and investments, to the extent either the asset classes or the selected countries and investments become correlated in a way not anticipated an underlying fund’s adviser, an underlying fund’s risk allocation process may result in magnified risks and loss instead of balancing (reducing) the risk of loss. |
| ∎ | Debt securities risk. The prices of debt securities held by an underlying fund will be affected by changes in interest rates, the creditworthiness of the issuer and other factors. An increase in prevailing interest rates typically causes the value of existing debt securities to fall and often has a greater impact on longer-duration debt securities and higher quality debt securities. Falling interest rates will cause an underlying fund to reinvest the proceeds of debt securities that have been repaid by the issuer at lower interest rates. Falling interest rates may also reduce an underlying fund’s distributable income because interest payments on floating rate debt instruments held by an underlying fund will decline. An underlying fund could lose money on investments in debt securities if the issuer or borrower fails to meet its obligations to make interest payments and/or to repay principal in a timely manner. Changes in an issuer’s financial strength, the market’s perception of such strength or in the credit rating of the issuer or the security may affect the value of debt securities. An underlying fund’s adviser’s credit analysis may fail to anticipate such changes, which could result in buying a debt security at an inopportune time or failing to sell a debt security in advance of a price decline or other credit event. |
| ∎ | Derivatives risk. The value of a derivative instrument depends largely on (and is derived from) the value of an underlying security, currency, commodity, interest rate, index or other asset (each referred to as an underlying asset). In addition to risks relating to the underlying assets, the use of derivatives may include other, possibly greater, risks, including counterparty, leverage and liquidity risks. Counterparty risk is the risk that the counterparty to the derivative contract will default on its obligation to pay the underlying fund the amount owed or otherwise perform under the derivative contract. Derivatives create leverage risk because they do not require payment up front equal to the economic exposure created by owning the derivative. As a result, an adverse change in the value of the underlying asset could result in the underlying fund sustaining a loss that is substantially greater than the amount invested in the derivative, which may make the underlying fund’s returns more volatile and increase the risk of loss. Derivative instruments may also be less liquid than more traditional investments and the underlying fund may be unable to sell or close out its derivative positions at a desirable time or price. This risk may be more acute under adverse market conditions, during which the underlying fund may be most in need of liquidating its derivative positions. Derivatives may also be harder to value, less tax efficient and subject to changing government regulation that could impact the underlying fund’s ability to use certain derivatives or their cost. The SEC has proposed new regulations related to the use of derivatives and related instruments by registered investment companies. If adopted as proposed, these regulations would limit an underlying fund’s ability to engage in derivatives transactions and may result in increased costs or require an underlying fund to modify its investment strategies or to liquidate. Also, derivatives used for hedging or to gain or limit exposure to a particular market segment may not provide the expected benefits, particularly during adverse market conditions. These risks are greater for certain underlying funds than most other mutual funds because certain underlying funds will implement their investment strategy primarily through derivative instruments rather than direct investments in stocks/bonds. |
| ∎ | Emerging markets securities risk. Emerging markets (also referred to as developing markets) are generally subject to greater market volatility, political, social and economic instability, uncertain trading markets and more governmental limitations on foreign investment than more developed markets. In addition, companies operating in emerging markets may be subject to lower trading volume and greater price fluctuations than companies in more developed markets. Securities law and the enforcement of systems of taxation in many emerging market countries may change quickly and unpredictably. In addition, investments in emerging markets securities may also be subject to additional transaction costs, delays in settlement procedures, and lack of timely information. |
| ∎ | Exchange-traded funds risk. In addition to the risks associated with the underlying assets held by the exchange-traded fund, investments in exchange-traded funds are subject to the following additional risks: (1) an exchange-traded fund’s shares may trade above or below its net asset value; (2) an active trading market for the exchange-traded fund’s shares may not develop or be maintained; (3) trading an exchange-traded fund’s shares may be halted by the listing exchange; (4) a passively-managed exchange-traded fund may not track the performance of the reference asset; and (5) a passively managed exchange-traded fund may hold troubled securities. Investment in exchange-traded funds may involve duplication of management fees and certain other expenses, as the Fund or an underlying fund indirectly bears its proportionate share of any expenses paid by the exchange-traded funds in which it invests. Further, certain exchange-traded funds in which the Fund or an underlying fund may invest are leveraged, which may result in economic leverage, permitting the Fund or an underlying fund to gain exposure that is greater than would be the case in an unlevered instrument, and potentially resulting in greater volatility. |
| ∎ | Exchange-traded notes risk. Exchange-traded notes are subject to credit risk, counterparty risk, and the risk that the value of the exchange-traded note may drop due to a downgrade in the issuer’s credit rating. The value of an exchange-traded note may also be influenced by time to maturity, level of supply and demand for the exchange-traded note, |
continued on page 26
| 25 Invesco Balanced-Risk Retirement Funds |
continued from page 25
volatility and lack of liquidity in the underlying market, changes in the applicable interest rates, and economic, legal, political, or geographic events that affect the referenced underlying market or assets. An underlying fund will bear its proportionate share of any fees and expenses borne by an exchange-traded note in which it invests. For certain exchange-traded notes, there may be restrictions on an underlying fund’s right to redeem its investment in an exchange-traded note, which is meant to be held until maturity.
| ∎ | Foreign government debt risk. Investments in foreign government debt securities (sometimes referred to as sovereign debt securities) involve certain risks in addition to those relating to foreign securities or debt securities generally. The issuer of the debt or the governmental authorities that control the repayment of the debt may be unable or unwilling to repay principal or interest when due in accordance with the terms of such debt, and an underlying fund may have limited recourse in the event of a default against the defaulting government. Without the approval of debt holders, some governmental debtors have in the past been able to reschedule or restructure their debt payments or declare moratoria on payments. |
| ∎ | Foreign securities risk. An underlying fund’s foreign investments may be adversely affected by political and social instability, changes in economic or taxation policies, difficulty in enforcing obligations, decreased liquidity or increased volatility. Foreign investments also involve the risk of the possible seizure, nationalization or expropriation of the issuer or foreign deposits (in which an underlying fund could lose its entire investments in a certain market) and the possible adoption of foreign governmental restrictions such as exchange controls. Unless an underlying fund has hedged its foreign securities risk, foreign securities risk also involves the risk of negative foreign currency rate fluctuations, which may cause the value of securities denominated in such foreign currency (or other instruments through which an underlying fund has exposure to foreign currencies) to decline in value. Currency exchange rates may fluctuate significantly over short periods of time. Currency hedging strategies, if used, are not always successful. |
| ∎ | Fund of funds risk. The Fund’s performance depends on that of the underlying funds in which it invests. Accordingly, the risks associated with an investment in the Fund include the risks associated with investments in the underlying funds. The Fund will indirectly pay a proportional share of the fees and expenses of the underlying funds in which it invests. There are risks that the Fund will vary from its target weightings (if any) in the underlying funds, that the underlying funds will not achieve their investment objectives, that the underlying funds’ performance may be lower than their represented asset classes, and that the Fund may withdraw its investments in an underlying fund at a disadvantageous time. |
| ∎ | Management risk. An underlying fund is actively managed and depends heavily on an underlying fund’s adviser’s judgment about markets, interest rates or the attractiveness, relative values, liquidity, or potential appreciation of particular investments made for an underlying fund’s portfolio. An underlying fund could experience losses if these judgments prove to be incorrect. Because an underlying fund’s investment process relies heavily on its asset allocation process, market movements that are counter to the portfolio managers’ expectations may have a significant adverse effect on the Fund’s net asset value. Additionally, legislative, regulatory, or tax developments may adversely affect management of an underlying fund and, therefore, the ability of the underlying fund to achieve its investment objective. |
| ∎ | Market risk. The market values of an underlying fund’s investments, and therefore the value of an underlying fund’s shares, will go up and down, sometimes rapidly or unpredictably. Market risk may affect a single issuer, industry or section of the economy, or it may affect the market as a whole. Individual stock prices tend to go up and down more dramatically than those of certain other types of investments, such as bonds. During a general downturn in the financial markets, multiple asset classes may decline in value. When markets perform well, there can be no assurance that specific investments held by an underlying fund will rise in value. |
| ∎ | Money market fund risk. Although an underlying money market fund seeks to preserve the value of the Fund’s |
investment at $1.00 per share, the Fund may lose money by investing in an underlying money market fund. The share price of money market funds can fall below the $1.00 share price. An underlying money market fund’s sponsor has no legal obligation to provide financial support to an underlying money market fund, and you should not rely on or expect that the sponsor will enter into support agreements or take other actions to provide financial support to an underlying money market fund or maintain to an underlying money market fund’s $1.00 share price at any time. The credit quality of to an underlying money market fund’s holdings can change rapidly in certain markets, and the default of a single holding could have an adverse impact on an underlying money market fund’s share price. An underlying money market fund’s share price can also be negatively affected during periods of high redemption pressures, illiquid markets, and/or significant market volatility. While an underlying money market fund’s Board may elect to impose a fee upon the sale of the Fund’s shares or temporarily suspend the Fund’s ability to sell shares in the future if an underlying money market fund’s liquidity falls below required minimums because of market conditions or other factors, an underlying money market fund’s Board has not elected to do so at this time. Should an underlying money market fund’s Board elect to do so, such change would only become effective after shareholders were provided with specific advance notice of the change in an underlying money market fund’s policy and provided with the opportunity to redeem their shares in accordance with Rule 2a-7 before the policy change became effective. |
| ∎ | Non-diversification risk. The Fund is non-diversified and can invest a greater portion of its assets in the obligations or securities of a small number of issuers or any single issuer than a diversified fund can. A change in the value of one or a few issuers’ securities will therefore affect the value of the Fund more than if it was a diversified fund. |
| ∎ | Repurchase agreement risk. If the seller of a repurchase agreement defaults or otherwise does not fulfill its obligations, an underlying fund may incur delays and losses arising from selling the underlying securities, enforcing its rights, or declining collateral value. |
| 26 Invesco Balanced-Risk Retirement Funds |
| ∎ | Short position risk. Because an underlying fund’s potential loss on a short position arises from increases in the value of the asset sold short, the underlying fund will incur a loss on a short position, which is theoretically unlimited, if the price of the asset sold short increases from the short sale price. The counterparty to a short position or other market factors may prevent an underlying fund from closing out a short position at a desirable time or price and may reduce or eliminate any gain or result in a loss. In a rising market, an underlying fund’s short positions will cause the underlying fund to underperform the overall market and its peers that do not engage in shorting. If an underlying fund holds both long and short positions, and both positions decline simultaneously, the short positions will not provide any buffer (hedge) from declines in value of the underlying fund’s long positions. Certain types of short positions involve leverage, which may exaggerate any losses, potentially more than the actual cost of the investment, and will increase the volatility of an underlying fund’s returns. |
| ∎ | Subsidiary risk. By investing in the Subsidiary, an underlying fund is indirectly exposed to risks associated with the Subsidiary’s investments. The Subsidiary is not registered under the Investment Company Act of 1940, as amended (1940 Act), and, except as otherwise noted in this prospectus, is not subject to the investor protections of the 1940 Act. Changes in the laws of the United States and/or the Cayman Islands, under which an underlying fund and the Subsidiary, respectively, are organized, could result in the inability of an underlying fund and/or the Subsidiary to operate as described in this prospectus and the SAI, and could negatively affect an underlying fund and its shareholders. |
| ∎ | US government obligations risk. Obligations of US government agencies and authorities receive varying levels of support and may not be backed by the full faith and credit of the US government, which could affect an underlying fund’s ability to recover should they default. No assurance can be given that the US government will provide financial support to its agencies and authorities if it is not obligated by law to do so. |
| ∎ | Volatility risk. Although an underlying fund’s investment strategy targets a |
specific volatility level, certain of an underlying fund’s investments may appreciate or decrease significantly in value over short periods of time. This may cause an underlying fund’s net asset value per share to experience significant increases or declines in value over short periods of time. |
| ∎ | Yield risk. An underlying fund’s yield will vary as the short-term securities in its portfolio mature or are sold and the proceeds are reinvested in other securities. When interest rates are very low, an underlying fund’s expenses could absorb all or a portion of an underlying fund’s income and yield. Additionally, inflation may outpace and diminish investment returns over time. |
About indexes used in this report
| ∎ | The Bloomberg Barclays U.S. Aggregate Bond Index is an unmanaged index considered representative of the US investment grade, fixed-rate bond market. |
| ∎ | The Bloomberg Barclays U.S. Universal Index represents the union of the U.S. Aggregate Bond Index, the U.S. High-Yield Corporate Index, the 144A Index, the Eurodollar Index, the Emerging Markets Index and the non-ERISA portion of the CMBS Index. |
| ∎ | The Custom Invesco Balanced-Risk Allocation Broad Index consists of 60% S&P 500 Index and 40% Bloomberg Barclays U.S. Aggregate Bond Index. |
| ∎ | The Custom Invesco Balanced-Risk Retirement Now Index was created by Invesco to serve as a style-specific benchmark for Invesco Balanced-Risk Retirement Now Fund. From the inception of the Fund to November 4, 2009, the index comprised the Custom Independence Now Index, which included the following indexes: Russell 3000, MSCI EAFE, FTSE NAREIT Equity REITs, Barclays U.S. Universal and Three-month U.S. Treasury Bill. From November 4, 2009, through November 30, 2009, the index comprised the MSCI World Index, the JP Morgan Global Government Index and the Three-month U.S. Treasury Bill Index. Since December 1, 2009, the index has comprised the MSCI World Index, Bloomberg Barclays U.S. Aggregate Bond Index and FTSE US Three-Month Treasury Bill Index. The composition of the index may change based on the Fund’s target allocation. Therefore, the current composition of the index does |
not reflect its historical composition and will likely be altered in the future to better reflect the Fund’s objective. |
| ∎ | The Custom Invesco Balanced-Risk Retirement 2020 Index was created by Invesco to serve as a style-specific benchmark for Invesco Balanced-Risk Retirement 2020 Fund. From the inception of the Fund to November 4, 2009, the index comprised the Custom Independence 2020 Index, which included the following indexes: Russell 3000, MSCI EAFE, FTSE NAREIT Equity REITs and Bloomberg Barclays U.S. Universal. From November 4, 2009, through November 30, 2009, the index comprised the MSCI World Index and the JP Morgan Global Government Bond Index. Since December 1, 2009, the index has comprised the MSCI World Index, the Bloomberg Barclays U.S. Aggregate Bond Index and the U.S. 3-Month Treasury Bill Index. The composition of the index may change based on the Fund’s target asset allocation. Therefore, the current composition of the index does not reflect its historical composition and will likely be altered in the future to better reflect the Fund’s objective. |
| ∎ | The Custom Invesco Balanced-Risk Retirement 2030 Index was created by Invesco to serve as a style-specific benchmark for Invesco Balanced-Risk Retirement 2030 Fund. From the inception of the Fund to November 4, 2009, the index comprised the Custom Independence 2030 Index, which included the following indexes: Russell 3000, MSCI EAFE, FTSE NAREIT Equity REITs and Bloomberg Barclays U.S. Universal. From November 4, 2009, through November 30, 2009, the index comprised the MSCI World Index and the JP Morgan Global Government Bond Index. Since December 1, 2009, the index has comprised the MSCI World Index and the Bloomberg Barclays U.S. Aggregate Bond Index. The composition of the index may change based on the Fund’s target asset allocation. Therefore, the current composition of the index does not reflect its historical composition and will likely be altered in the future to better reflect the Fund’s objective. |
| ∎ | The Custom Invesco Balanced-Risk Retirement 2040 Index was created by Invesco to serve as a style-specific benchmark for Invesco Balanced-Risk Retirement 2040 Fund. From the inception of the Fund to November 4, 2009, |
continued on page 28
| 27 Invesco Balanced-Risk Retirement Funds |
continued from page 27
the index comprised the Custom Independence 2040 Index, which included the following indexes: Russell 3000, MSCI EAFE, FTSE NAREIT Equity REITs and Bloomberg Barclays U.S. Universal. From November 4, 2009, through November 30, 2009, the index comprised the MSCI World Index and the JP Morgan Global Government Bond Index. Since December 1, 2009, the index has comprised the MSCI World Index and the Bloomberg Barclays U.S. Aggregate Bond Index. The composition of the index may change based on the Fund’s target asset allocation. Therefore, the current composition of the index does not reflect its historical composition and will likely be altered in the future to better reflect the Fund’s objective.
| ∎ | The Custom Invesco Balanced-Risk Retirement 2050 Index was created by Invesco to serve as a style-specific benchmark for Invesco Balanced-Risk Retirement 2050 Fund. From the inception of the Fund to November 4, 2009, the index comprised the Custom Independence 2050 Index, which included the following indexes: Russell 3000, MSCI EAFE, FTSE NAREIT Equity REITs and Bloomberg Barclays U.S. Universal. From November 4, 2009, through November 30, 2009, the index comprised the MSCI World Index and the JP Morgan Global Government Bond Index. Since December 1, 2009, the index has comprised the MSCI World Index and the Bloomberg Barclays U.S. Aggregate Bond Index. The composition of the index may change based on the Fund’s target asset allocation. Therefore, the current composition of the index does not reflect its historical composition and will likely be altered in the future to better reflect the Fund’s objective. |
| ∎ | The FTSE NAREIT Equity REITs Index is an unmanaged index considered representative of US real estate investment trusts (REITs). |
| ∎ | The FTSE US 3-Month Treasury Bill Index is an unmanaged index representative of three-month US Treasury bills. |
| ∎ | The JP Morgan Global Government Bond Index tracks fixed-rate issuances from high-income countries spanning the globe. |
| ∎ | The Lipper Mixed-Asset Target Today Index is an unmanaged index considered representative of mixed-asset target today funds tracked by Lipper. |
| ∎ | The Lipper Mixed-Asset Target 2020 Index is an unmanaged index considered representative of mixed-asset target 2020 funds tracked by Lipper. |
| ∎ | The Lipper Mixed-Asset Target 2030 Index is an unmanaged index considered representative of mixed-asset target 2030 funds tracked by Lipper. |
| ∎ | The Lipper Mixed-Asset Target 2040 Index is an unmanaged index considered representative of mixed-asset target 2040 funds tracked by Lipper. |
| ∎ | The Lipper Mixed-Asset Target 2050 Index is an unmanaged index considered representative of mixed-asset target 2050 funds tracked by Lipper. |
| ∎ | The MSCI EAFE® Index is an unmanaged index considered representative of stocks of Europe, Australasia and the Far East. The index is computed using the net return, which withholds applicable taxes for non-resident investors. |
| ∎ | The MSCI WorldSM Index is an unmanaged index considered representative of stocks of developed countries. The index is computed using the net return, which withholds applicable taxes for non-resident investors. |
| ∎ | The Russell 3000® Index is an unmanaged index considered representative of the US stock market. The Russell 3000 Index is a trademark/service mark of the Frank Russell Co. Russell® is a trademark of the Frank Russell Co. |
| ∎ | The S&P 500® Index is an unmanaged index considered representative of the US stock market. |
| ∎ | The U.S. 3-Month Treasury Bill Index is tracked by Lipper to provide performance of the three-month US Treasury bill. |
| ∎ | The Fund is not managed to track the performance of any particular index, including the index(es) described here, and consequently, the performance of the Fund may deviate significantly from the performance of the index(es). |
| ∎ | A direct investment cannot be made in an index. Unless otherwise indicated, index results include reinvested dividends, and they do not reflect sales charges. Performance of the peer group, if applicable, reflects fund expenses; performance of a market index does not. |
Other information
| ∎ | The returns shown in management’s discussion of Fund performance are based on net asset values (NAVs) calculated for shareholder transactions. Generally accepted accounting principles require adjustments to be made to the net assets of the Fund at period end for financial reporting purposes, and as such, the NAVs for shareholder transactions and the returns based on those NAVs may differ from the NAVs and returns reported in the Financial Highlights. |
| 28 Invesco Balanced-Risk Retirement Funds |
Schedule of Investments
December 31, 2017
Invesco Balanced-Risk Retirement Now Fund
Schedule of Investments in Affiliated Issuers–100.08%(a)
| % of Net Assets 12/31/17 | Value 12/31/16 | Purchases at Cost | Proceeds from Sales | Change in Unrealized Appreciation | Realized Gain | Dividend Income | Shares 12/31/17 | Value 12/31/17 | ||||||||||||||||||||||||||||
Asset Allocation Funds–60.73% |
| |||||||||||||||||||||||||||||||||||
Invesco Balanced-Risk Allocation Fund–Class R6 | 60.73 | % | $ | 16,256,949 | $ | 1,504,552 | $ | (3,319,393 | ) | $ | 508,684 | $ | 984,531 | $ | — | 1,366,097 | $ | 15,040,728 | ||||||||||||||||||
Money Market Funds–39.35% |
| |||||||||||||||||||||||||||||||||||
Invesco Government & Agency Portfolio–Institutional Class, 1.18% (b) | 23.61 | % | 6,445,052 | 5,491,663 | (6,088,274 | ) | — | — | 48,080 | 5,848,441 | 5,848,441 | |||||||||||||||||||||||||
Invesco Liquid Assets Portfolio–Institutional Class, 1.40%(b) | 0.00 | % | — | 3,072,273 | (3,072,273 | ) | — | — | 164 | — | — | |||||||||||||||||||||||||
Invesco Treasury Portfolio–Institutional Class, 1.17%(b) | 15.74 | % | 4,296,701 | 3,008,900 | (3,406,641 | ) | — | — | 30,763 | 3,898,960 | 3,898,960 | |||||||||||||||||||||||||
Total Money Market Funds | 10,741,753 | 11,572,836 | (12,567,188 | ) | — | — | 79,007 | 9,747,401 | ||||||||||||||||||||||||||||
TOTAL INVESTMENTS IN AFFILIATED ISSUERS | 100.08 | % | $ | 26,998,702 | $ | 13,077,388 | $ | (15,886,581 | ) | $ | 508,684 | $ | 984,531 | (c) | $ | 79,007 | $ | 24,788,129 | ||||||||||||||||||
OTHER ASSETS LESS LIABILITIES | (0.08 | )% | (20,309 | ) | ||||||||||||||||||||||||||||||||
NET ASSETS | 100.00 | % | $ | 24,767,820 | ||||||||||||||||||||||||||||||||
Invesco Balanced-Risk Retirement 2020 Fund
Schedule of Investments in Affiliated Issuers–100.09%(a)
| % of Net Assets 12/31/17 | Value 12/31/16 | Purchases at Cost | Proceeds from Sales | Change in Unrealized Appreciation | Realized Gain | Dividend Income | Shares 12/31/17 | Value 12/31/17 | ||||||||||||||||||||||||||||
Asset Allocation Funds–71.82% |
| |||||||||||||||||||||||||||||||||||
Invesco Balanced-Risk Allocation Fund–Class R6 | 71.82 | % | $ | 51,665,053 | $ | 2,771,751 | $ | (9,721,698 | ) | $ | 1,871,372 | $ | 2,786,414 | $ | — | 4,232,619 | $ | 46,601,141 | ||||||||||||||||||
Money Market Funds–28.27% |
| |||||||||||||||||||||||||||||||||||
Invesco Government & Agency Portfolio–Institutional Class, 1.18%(b) | 16.96 | % | 10,696,253 | 7,896,833 | (7,586,369 | ) | — | — | 85,446 | 11,006,717 | 11,006,717 | |||||||||||||||||||||||||
Invesco Treasury Portfolio–Institutional Class, 1.17%(b) | 11.31 | % | 7,130,835 | 5,264,556 | (5,057,580 | ) | — | — | 54,580 | 7,337,811 | 7,337,811 | |||||||||||||||||||||||||
Total Money Market Funds | 17,827,088 | 13,161,389 | (12,643,949 | ) | — | — | 140,026 | 18,344,528 | ||||||||||||||||||||||||||||
TOTAL INVESTMENTS IN AFFILIATED ISSUERS | 100.09 | % | $ | 69,492,141 | $ | 15,933,140 | $ | (22,365,647 | ) | $ | 1,871,372 | $ | 2,786,414 | (d) | $ | 140,026 | $ | 64,945,669 | ||||||||||||||||||
OTHER ASSETS LESS LIABILITIES | (0.09 | )% | (57,014 | ) | ||||||||||||||||||||||||||||||||
NET ASSETS | 100.00 | % | $ | 64,888,655 | ||||||||||||||||||||||||||||||||
Notes to Schedule of Investments:
| (a) | Each underlying fund and the Fund are affiliated by either having the same investment adviser or an investment adviser under common control with the Fund’s investment adviser. |
| (b) | The rate shown is the 7 -day SEC standardized yield as of December 31, 2017. |
| (c) | Includes $894,595 of capital gains distributions from affiliated underlying funds for Invesco Balanced-Risk Allocation Fund. |
| (d) | Includes $2,771,751 of capital gains distributions from affiliated underlying funds for Invesco Balanced-Risk Allocation Fund. |
See accompanying Notes to Financial Statements which are an integral part of the financial statements.
29 Invesco Balanced-Risk Retirement Funds
Schedule of Investments—(continued)
December 31, 2017
Invesco Balanced-Risk Retirement 2030 Fund
Schedule of Investments in Affiliated Issuers–100.74%(a)
| % of Net Assets 12/31/17 | Value 12/31/16 | Purchases at Cost | Proceeds from Sales | Change in Unrealized Appreciation | Realized Gain | Dividend Income | Shares 12/31/17 | Value 12/31/17 | ||||||||||||||||||||||||||||
Asset Allocation Funds–100.07% |
| |||||||||||||||||||||||||||||||||||
Invesco Balanced-Risk Allocation Fund–Class R6 | 92.70 | % | $ | 71,111,737 | $ | 6,143,525 | $ | (12,100,002 | ) | $ | 3,162,345 | $ | 3,424,882 | $ | — | 6,148,606 | $ | 67,696,154 | ||||||||||||||||||
Invesco Balanced-Risk Aggressive Allocation Fund | 7.37 | % | 8,561,561 | 567,395 | (4,171,757 | ) | 824,782 | 91,848 | — | 633,913 | 5,381,921 | |||||||||||||||||||||||||
Total Asset Allocation Funds | 79,673,298 | 6,710,920 | (16,271,759 | ) | 3,987,127 | 3,516,730 | — | 73,078,075 | ||||||||||||||||||||||||||||
Money Market Funds–0.67% |
| |||||||||||||||||||||||||||||||||||
Invesco Government & Agency Portfolio–Institutional Class, 1.18%(b) | 0.40 | % | 182,293 | 7,480,481 | (7,368,031 | ) | — | — | 1,487 | 294,743 | 294,743 | |||||||||||||||||||||||||
Invesco Treasury Portfolio–Institutional Class, 1.17%(b) | 0.27 | % | 121,528 | 4,986,988 | (4,912,021 | ) | — | — | 949 | 196,495 | 196,495 | |||||||||||||||||||||||||
Total Money Market Funds | 303,821 | 12,467,469 | (12,280,052 | ) | — | — | 2,436 | 491,238 | ||||||||||||||||||||||||||||
TOTAL INVESTMENTS IN AFFILIATED ISSUERS | 100.74 | % | $ | 79,977,119 | $ | 19,178,389 | $ | (28,551,811 | ) | $ | 3,987,127 | $ | 3,516,730 | (c) | $ | 2,436 | $ | 73,569,313 | ||||||||||||||||||
OTHER ASSETS LESS LIABILITIES | (0.74 | )% | (544,139 | ) | ||||||||||||||||||||||||||||||||
NET ASSETS | 100.00 | % | $ | 73,025,174 | ||||||||||||||||||||||||||||||||
Invesco Balanced-Risk Retirement 2040 Fund
Schedule of Investments in Affiliated Issuers–100.53%(a)
| % of Net Assets 12/31/17 | Value 12/31/16 | Purchases at Cost | Proceeds from Sales | Change in Unrealized Appreciation | Realized Gain | Dividend Income | Shares 12/31/17 | Value 12/31/17 | ||||||||||||||||||||||||||||
Asset Allocation Funds–99.74% |
| |||||||||||||||||||||||||||||||||||
Invesco Balanced-Risk Allocation Fund–Class R6 | 58.06 | % | $ | 28,316,194 | $ | 5,611,918 | $ | (3,773,351 | ) | $ | 1,235,243 | $ | 1,630,574 | $ | — | 2,829,685 | $ | 31,154,838 | ||||||||||||||||||
Invesco Balanced-Risk Aggressive Allocation Fund | 41.68 | % | 22,758,100 | 3,356,877 | (4,808,186 | ) | 1,424,813 | 1,680,460 | — | 2,634,439 | 22,366,385 | |||||||||||||||||||||||||
Total Asset Allocation Funds | 51,074,294 | 8,968,795 | (8,581,537 | ) | 2,660,056 | 3,311,034 | — | 53,521,223 | ||||||||||||||||||||||||||||
Money Market Funds–0.79% |
| |||||||||||||||||||||||||||||||||||
Invesco Government & Agency Portfolio–Institutional Class, 1.18%(b) | 0.47 | % | 256,259 | 6,018,385 | (6,019,451 | ) | — | — | 1,224 | 255,193 | 255,193 | |||||||||||||||||||||||||
Invesco Treasury Portfolio–Institutional Class, 1.17%(b) | 0.32 | % | 170,840 | 4,012,257 | (4,012,968 | ) | — | — | 795 | 170,129 | 170,129 | |||||||||||||||||||||||||
Total Money Market Funds | 427,099 | 10,030,642 | (10,032,419 | ) | — | — | 2,019 | 425,322 | ||||||||||||||||||||||||||||
TOTAL INVESTMENTS IN AFFILIATED ISSUERS | 100.53 | % | $ | 51,501,393 | $ | 18,999,437 | $ | (18,613,956 | ) | $ | 2,660,056 | $ | 3,311,034 | (d) | $ | 2,019 | $ | 53,946,545 | ||||||||||||||||||
OTHER ASSETS LESS LIABILITIES | (0.53 | )% | (285,372 | ) | ||||||||||||||||||||||||||||||||
NET ASSETS | 100.00 | % | $ | 53,661,173 | ||||||||||||||||||||||||||||||||
Notes to Schedule of Investments:
| (a) | Each underlying fund and the Fund are affiliated by either having the same investment adviser or an investment adviser under common control with the Fund’s investment adviser. |
| (b) | The rate shown is the 7–day SEC standardized yield as of December 31, 2017. |
| (c) | Includes $4,046,333 and $491,908 of capital gains distributions from affiliated underlying funds for Invesco Balanced-Risk Allocation Fund and Invesco Balanced–Risk Aggressive Allocation Fund, respectively. |
| (d) | Includes $1,865,740 and $2,045,679 of capital gains distributions from affiliated underlying funds for Invesco Balanced-Risk Allocation Fund and Invesco Balanced–Risk Aggressive Allocation Fund, respectively. |
See accompanying Notes to Financial Statements which are an integral part of the financial statements.
30 Invesco Balanced-Risk Retirement Funds
Schedule of Investments—(continued)
December 31, 2017
Invesco Balanced-Risk Retirement 2050 Fund
Schedule of Investments in Affiliated Issuers–99.21%(a)
| % of Net Assets 12/31/17 | Value 12/31/16 | Purchases at Cost | Proceeds from Sales | Change in Unrealized Appreciation | Realized Gain | Dividend Income | Shares 12/31/17 | Value 12/31/17 | ||||||||||||||||||||||||||||
Asset Allocation Funds–99.21% |
| |||||||||||||||||||||||||||||||||||
Invesco Balanced-Risk Allocation Fund–Class R6 | 25.98 | % | $ | 7,396,287 | $ | 3,514,894 | $ | (1,141,375 | ) | $ | 301,771 | $ | 534,541 | $ | — | 908,312 | $ | 10,000,511 | ||||||||||||||||||
Invesco Balanced-Risk Aggressive Allocation Fund | 73.23 | % | 25,689,554 | 6,453,127 | (5,031,168 | ) | 1,489,758 | 2,185,467 | — | 3,319,321 | 28,181,038 | |||||||||||||||||||||||||
Total Asset Allocation Funds | 33,085,841 | 9,968,021 | (6,172,543 | ) | 1,791,529 | 2,720,008 | — | 38,181,549 | ||||||||||||||||||||||||||||
Money Market Funds–0.00% |
| |||||||||||||||||||||||||||||||||||
Invesco Government & Agency Portfolio–Institutional Class, 1.18%(b) | 0.00 | % | 430,976 | 5,486,678 | (5,917,654 | ) | — | — | 1,006 | — | — | |||||||||||||||||||||||||
Invesco Treasury Portfolio–Institutional Class, 1.17%(b) | 0.00 | % | 287,317 | 3,657,785 | (3,945,102 | ) | — | — | 643 | — | — | |||||||||||||||||||||||||
Total Money Market Funds | 718,293 | 9,144,463 | (9,862,756 | ) | — | — | 1,649 | — | ||||||||||||||||||||||||||||
TOTAL INVESTMENTS IN AFFILIATED ISSUERS | 99.21 | % | $ | 33,804,134 | $ | 19,112,484 | $ | (16,035,299 | ) | $ | 1,791,529 | $ | 2,720,008 | (c) | $ | 1,649 | $ | 38,181,549 | ||||||||||||||||||
OTHER ASSETS LESS LIABILITIES | 0.79 | % | 302,588 | |||||||||||||||||||||||||||||||||
NET ASSETS | 100.00 | % | $ | 38,484,137 | ||||||||||||||||||||||||||||||||
Notes to Schedule of Investments:
| (a) | Each underlying fund and the Fund are affiliated by either having the same investment adviser or an investment adviser under common control with the Fund’s investment adviser. |
| (b) | The rate shown is the 7–day SEC standardized yield as of December 31, 2017. |
| (c) | Includes $605,607 and $2,605,700 of capital gains distributions from affiliated underlying funds for Invesco Balanced-Risk Allocation Fund and Invesco Balanced–Risk Aggressive Allocation Fund, respectively. |
See accompanying Notes to Financial Statements which are an integral part of the financial statements.
31 Invesco Balanced-Risk Retirement Funds
Statement of Assets and Liabilities
December 31, 2017
| Invesco Balanced-Risk Retirement Now Fund | Invesco Balanced-Risk Retirement 2020 Fund | Invesco Balanced-Risk Retirement 2030 Fund | Invesco Balanced-Risk Retirement 2040 Fund | Invesco Balanced-Risk Retirement 2050 Fund | ||||||||||||||||||||||||||||||||||||
Assets: | ||||||||||||||||||||||||||||||||||||||||
Investments in affiliated underlying funds, at value | $ | 24,788,129 | $ | 64,945,669 | $ | 73,569,313 | $ | 53,946,545 | $ | 38,181,549 | ||||||||||||||||||||||||||||||
Cash | 20,942 | 30,499 | 33,642 | 30,379 | 380,056 | |||||||||||||||||||||||||||||||||||
Receivable for: | ||||||||||||||||||||||||||||||||||||||||
Fund shares sold | 3,649 | 112,611 | 148,939 | 85,518 | 251,158 | |||||||||||||||||||||||||||||||||||
Dividends from affiliated underlying funds | 8,956 | 16,978 | 310 | 207 | 252 | |||||||||||||||||||||||||||||||||||
Fund expenses absorbed | 5,637 | — | — | — | — | |||||||||||||||||||||||||||||||||||
Investment for trustee deferred compensation and retirement plans | 46,322 | 40,709 | 40,441 | 37,225 | 33,666 | |||||||||||||||||||||||||||||||||||
Other assets | 49,823 | 51,224 | 51,581 | 50,939 | 50,777 | |||||||||||||||||||||||||||||||||||
Total assets | 24,923,458 | 65,197,690 | 73,844,226 | 54,150,813 | 38,897,458 | |||||||||||||||||||||||||||||||||||
Liabilities: | ||||||||||||||||||||||||||||||||||||||||
Payable for: | ||||||||||||||||||||||||||||||||||||||||
Fund shares reacquired | 61,957 | 184,660 | 677,725 | 366,581 | 299,105 | |||||||||||||||||||||||||||||||||||
Accrued fees to affiliates | 17,423 | 51,614 | 68,206 | 56,003 | 51,291 | |||||||||||||||||||||||||||||||||||
Accrued trustees’ and officer’s fees and benefits | 587 | 635 | 762 | 752 | 663 | |||||||||||||||||||||||||||||||||||
Accrued operating expenses | 28,418 | 29,446 | 29,929 | 28,008 | 27,777 | |||||||||||||||||||||||||||||||||||
Trustee deferred compensation and retirement plans | 47,253 | 42,680 | 42,430 | 38,296 | 34,485 | |||||||||||||||||||||||||||||||||||
Total liabilities | 155,638 | 309,035 | 819,052 | 489,640 | 413,321 | |||||||||||||||||||||||||||||||||||
Net assets applicable to shares outstanding | $ | 24,767,820 | $ | 64,888,655 | $ | 73,025,174 | $ | 53,661,173 | $ | 38,484,137 | ||||||||||||||||||||||||||||||
Net assets consist of: | ||||||||||||||||||||||||||||||||||||||||
Shares of beneficial interest | $ | 23,957,526 | $ | 64,908,664 | $ | 75,077,333 | $ | 59,919,719 | $ | 41,222,060 | ||||||||||||||||||||||||||||||
Undistributed net investment income (loss) | (37,705 | ) | 756,141 | 1,342,724 | 1,152,866 | 476,031 | ||||||||||||||||||||||||||||||||||
Undistributed net realized gain (loss) | 465,785 | (1,957,117 | ) | (2,944,262 | ) | (3,045,631 | ) | (255,264 | ) | |||||||||||||||||||||||||||||||
Net unrealized appreciation (depreciation) | 382,214 | 1,180,967 | (450,621 | ) | (4,365,781 | ) | (2,958,690 | ) | ||||||||||||||||||||||||||||||||
| $ | 24,767,820 | $ | 64,888,655 | $ | 73,025,174 | $ | 53,661,173 | $ | 38,484,137 | |||||||||||||||||||||||||||||||
See accompanying Notes to Financial Statements which are an integral part of the financial statements.
32 Invesco Balanced-Risk Retirement Funds
Statement of Assets and Liabilities—(continued)
December 31, 2017
| Invesco Balanced-Risk Retirement Now Fund | Invesco Balanced-Risk Retirement 2020 Fund | Invesco Balanced-Risk Retirement 2030 Fund | Invesco Balanced-Risk Retirement 2040 Fund | Invesco Balanced-Risk Retirement 2050 Fund | ||||||||||||||||||||||||||||||||||||
Net Assets: | ||||||||||||||||||||||||||||||||||||||||
Class A | $ | 10,052,925 | $ | 36,409,143 | $ | 41,546,194 | $ | 32,003,913 | $ | 21,082,402 | ||||||||||||||||||||||||||||||
Class AX | $ | 7,608,479 | $ | 6,510,053 | $ | 4,629,083 | $ | 2,586,860 | $ | 1,025,147 | ||||||||||||||||||||||||||||||
Class B | $ | 27,474 | $ | 394,673 | $ | 310,931 | $ | 236,237 | $ | 90,736 | ||||||||||||||||||||||||||||||
Class C | $ | 3,423,473 | $ | 7,344,841 | $ | 11,936,301 | $ | 6,368,958 | $ | 5,853,375 | ||||||||||||||||||||||||||||||
Class CX | $ | 1,120,753 | $ | 1,138,459 | $ | 723,871 | $ | 212,562 | $ | 144,002 | ||||||||||||||||||||||||||||||
Class R | $ | 1,373,512 | $ | 7,005,500 | $ | 8,538,151 | $ | 7,650,059 | $ | 4,226,642 | ||||||||||||||||||||||||||||||
Class RX | $ | 87,195 | $ | 422,716 | $ | 561,159 | $ | 161,336 | $ | 57,812 | ||||||||||||||||||||||||||||||
Class Y | $ | 305,779 | $ | 1,921,442 | $ | 890,468 | $ | 848,623 | $ | 4,251,301 | ||||||||||||||||||||||||||||||
Class R5 | $ | 123,982 | $ | 728,127 | $ | 760,669 | $ | 411,814 | $ | 113,588 | ||||||||||||||||||||||||||||||
Class R6 | $ | 644,248 | $ | 3,013,701 | $ | 3,128,347 | $ | 3,180,811 | $ | 1,639,132 | ||||||||||||||||||||||||||||||
Shares outstanding, no par value, |
| |||||||||||||||||||||||||||||||||||||||
Class A | 1,187,474 | 4,024,917 | 4,770,035 | 4,029,053 | 2,704,600 | |||||||||||||||||||||||||||||||||||
Class AX | 899,916 | 719,661 | 530,931 | 326,151 | 131,363 | |||||||||||||||||||||||||||||||||||
Class B | 3,367 | 44,039 | 36,049 | 30,054 | 11,820 | |||||||||||||||||||||||||||||||||||
Class C | 418,890 | 821,239 | 1,384,200 | 811,028 | 760,799 | |||||||||||||||||||||||||||||||||||
Class CX | 137,260 | 127,363 | 83,913 | 27,125 | 18,729 | |||||||||||||||||||||||||||||||||||
Class R | 164,135 | 777,220 | 985,255 | 968,099 | 545,294 | |||||||||||||||||||||||||||||||||||
Class RX | 10,427 | 46,898 | 64,783 | 20,416 | 7,450 | |||||||||||||||||||||||||||||||||||
Class Y | 35,699 | 212,504 | 102,059 | 106,601 | 543,932 | |||||||||||||||||||||||||||||||||||
Class R5 | 14,481 | 80,067 | 86,873 | 51,637 | 14,514 | |||||||||||||||||||||||||||||||||||
Class R6 | 75,253 | 331,242 | 357,407 | 398,872 | 209,189 | |||||||||||||||||||||||||||||||||||
Class A: | ||||||||||||||||||||||||||||||||||||||||
Net asset value per share | $ | 8.47 | $ | 9.05 | $ | 8.71 | $ | 7.94 | $ | 7.80 | ||||||||||||||||||||||||||||||
Maximum offering price per share | $ | 8.96 | $ | 9.58 | $ | 9.22 | $ | 8.40 | $ | 8.25 | ||||||||||||||||||||||||||||||
Class AX: | ||||||||||||||||||||||||||||||||||||||||
Net asset value per share | $ | 8.45 | $ | 9.05 | $ | 8.72 | $ | 7.93 | $ | 7.80 | ||||||||||||||||||||||||||||||
Maximum offering price per share | $ | 8.94 | $ | 9.58 | $ | 9.23 | $ | 8.39 | $ | 8.25 | ||||||||||||||||||||||||||||||
Class B: | ||||||||||||||||||||||||||||||||||||||||
Net asset value and offering price per share | $ | 8.16 | $ | 8.96 | $ | 8.63 | $ | 7.86 | $ | 7.68 | ||||||||||||||||||||||||||||||
Class C: | ||||||||||||||||||||||||||||||||||||||||
Net asset value and offering price per share | $ | 8.17 | $ | 8.94 | $ | 8.62 | $ | 7.85 | $ | 7.69 | ||||||||||||||||||||||||||||||
Class CX: | ||||||||||||||||||||||||||||||||||||||||
Net asset value and offering price per share | $ | 8.17 | $ | 8.94 | $ | 8.63 | $ | 7.84 | $ | 7.69 | ||||||||||||||||||||||||||||||
Class R: | ||||||||||||||||||||||||||||||||||||||||
Net asset value and offering price per share | $ | 8.37 | $ | 9.01 | $ | 8.67 | $ | 7.90 | $ | 7.75 | ||||||||||||||||||||||||||||||
Class RX: | ||||||||||||||||||||||||||||||||||||||||
Net asset value and offering price per share | $ | 8.36 | $ | 9.01 | $ | 8.66 | $ | 7.90 | $ | 7.76 | ||||||||||||||||||||||||||||||
Class Y: | ||||||||||||||||||||||||||||||||||||||||
Net asset value and offering price per share | $ | 8.57 | $ | 9.04 | $ | 8.73 | $ | 7.96 | $ | 7.82 | ||||||||||||||||||||||||||||||
Class R5: | ||||||||||||||||||||||||||||||||||||||||
Net asset value and offering price per share | $ | 8.56 | $ | 9.09 | $ | 8.76 | $ | 7.98 | $ | 7.83 | ||||||||||||||||||||||||||||||
Class R6: | ||||||||||||||||||||||||||||||||||||||||
Net asset value and offering price per share | $ | 8.56 | $ | 9.10 | $ | 8.75 | $ | 7.97 | $ | 7.84 | ||||||||||||||||||||||||||||||
Cost of Investments in affiliated underlying funds | $ | 24,405,915 | $ | 63,764,702 | $ | 74,019,934 | $ | 58,312,326 | $ | 41,140,239 | ||||||||||||||||||||||||||||||
See accompanying Notes to Financial Statements which are an integral part of the financial statements.
33 Invesco Balanced-Risk Retirement Funds
Statement of Operations
For the year ended December 31, 2017
| Invesco Balanced-Risk Retirement Now Fund | Invesco Balanced-Risk Retirement 2020 Fund | Invesco Balanced-Risk Retirement 2030 Fund | Invesco Balanced-Risk Retirement 2040 Fund | Invesco Balanced-Risk Retirement 2050 Fund | ||||||||||||||||||||||||||||||||||||
Investment income: | ||||||||||||||||||||||||||||||||||||||||
Dividends from affiliated underlying funds | $ | 79,007 | $ | 140,026 | $ | 2,436 | $ | 2,019 | $ | 1,649 | ||||||||||||||||||||||||||||||
Expenses: | ||||||||||||||||||||||||||||||||||||||||
Administrative services fees | 50,000 | 50,000 | 50,000 | 50,000 | 50,000 | |||||||||||||||||||||||||||||||||||
Custodian fees | 5,968 | 6,195 | 7,198 | 6,328 | 6,325 | |||||||||||||||||||||||||||||||||||
Distribution fees: | ||||||||||||||||||||||||||||||||||||||||
Class A | 25,253 | 92,773 | 105,876 | 77,151 | 46,014 | |||||||||||||||||||||||||||||||||||
Class AX | 19,929 | 16,894 | 12,516 | 6,696 | 2,810 | |||||||||||||||||||||||||||||||||||
Class B | 429 | 5,289 | 6,153 | 3,197 | 1,915 | |||||||||||||||||||||||||||||||||||
Class C | 35,776 | 77,068 | 114,466 | 61,413 | 54,415 | |||||||||||||||||||||||||||||||||||
Class CX | 13,738 | 12,614 | 7,631 | 2,555 | 1,436 | |||||||||||||||||||||||||||||||||||
Class R | 8,366 | 36,175 | 42,521 | 35,924 | 19,335 | |||||||||||||||||||||||||||||||||||
Class RX | 387 | 2,073 | 2,554 | 710 | 341 | |||||||||||||||||||||||||||||||||||
Transfer agent fees — A, AX, B, C, CX, R, RX and Y | 46,394 | 125,015 | 152,037 | 131,685 | 120,876 | |||||||||||||||||||||||||||||||||||
Transfer agent fees — R5 | 121 | 657 | 1,004 | 430 | 235 | |||||||||||||||||||||||||||||||||||
Transfer agent fees — R6 | 222 | 287 | 325 | 352 | 297 | |||||||||||||||||||||||||||||||||||
Trustees’ and officers’ fees and benefits | 21,280 | 21,430 | 21,644 | 21,445 | 21,046 | |||||||||||||||||||||||||||||||||||
Registration and filing fees | 120,815 | 123,486 | 123,364 | 121,846 | 121,790 | |||||||||||||||||||||||||||||||||||
Reports to shareholders | 20,055 | 33,606 | 34,402 | 27,888 | 27,440 | |||||||||||||||||||||||||||||||||||
Professional services fees | 42,395 | 39,733 | 41,474 | 41,282 | 41,019 | |||||||||||||||||||||||||||||||||||
Other | 15,624 | 15,951 | 16,039 | 15,851 | 15,641 | |||||||||||||||||||||||||||||||||||
Total expenses | 426,752 | 659,246 | 739,204 | 604,753 | 530,935 | |||||||||||||||||||||||||||||||||||
Less: Expenses reimbursed and expense offset arrangement(s) | (323,025 | ) | (416,451 | ) | (447,641 | ) | (417,224 | ) | (404,758 | ) | ||||||||||||||||||||||||||||||
Net expenses | 103,727 | 242,795 | 291,563 | 187,529 | 126,177 | |||||||||||||||||||||||||||||||||||
Net investment income (loss) | (24,720 | ) | (102,769 | ) | (289,127 | ) | (185,510 | ) | (124,528 | ) | ||||||||||||||||||||||||||||||
Realized and unrealized gain (loss) from: | ||||||||||||||||||||||||||||||||||||||||
Net realized gain (loss) from affiliated underlying fund shares | 89,936 | 14,663 | (1,021,511 | ) | (600,385 | ) | (491,299 | ) | ||||||||||||||||||||||||||||||||
Net realized gain from distributions of affiliated underlying fund shares | 894,595 | 2,771,751 | 4,538,241 | 3,911,419 | 3,211,307 | |||||||||||||||||||||||||||||||||||
Net realized gain from affiliated underlying fund shares | 984,531 | 2,786,414 | 3,516,730 | 3,311,034 | 2,720,008 | |||||||||||||||||||||||||||||||||||
Change in net unrealized appreciation of affiliated underlying fund shares | 508,684 | 1,871,372 | 3,987,127 | 2,660,056 | 1,791,529 | |||||||||||||||||||||||||||||||||||
Net increase in net assets resulting from operations | $ | 1,468,495 | $ | 4,555,017 | $ | 7,214,730 | $ | 5,785,580 | $ | 4,387,009 | ||||||||||||||||||||||||||||||
See accompanying Notes to Financial Statements which are an integral part of the financial statements.
34 Invesco Balanced-Risk Retirement Funds
Statement of Changes in Net Assets
For the years ended December 31, 2017 and 2016
| Invesco Balanced-Risk Retirement Now Fund | Invesco Balanced-Risk Retirement 2020 Fund | |||||||||||||||||||||||
| 2017 | 2016 | 2017 | 2016 | |||||||||||||||||||||
Operations: | ||||||||||||||||||||||||
Net investment income (loss) | $ | (24,720 | ) | $ | 586,071 | $ | (102,769 | ) | $ | 1,872,940 | ||||||||||||||
Net realized gain (loss) | 984,531 | 645,355 | 2,786,414 | (1,820,194 | ) | |||||||||||||||||||
Change in net unrealized appreciation | 508,684 | 509,789 | 1,871,372 | 5,161,749 | ||||||||||||||||||||
Net increase in net assets resulting from operations | 1,468,495 | 1,741,215 | 4,555,017 | 5,214,495 | ||||||||||||||||||||
Distributions to shareholders from net investment income: | ||||||||||||||||||||||||
Class A | (184,495 | ) | (344,249 | ) | (1,048,141 | ) | (1,012,843 | ) | ||||||||||||||||
Class AX | (141,518 | ) | (292,065 | ) | (187,481 | ) | (192,430 | ) | ||||||||||||||||
Class B | (467 | ) | (2,587 | ) | (8,776 | ) | (12,956 | ) | ||||||||||||||||
Class C | (56,400 | ) | (103,700 | ) | (156,123 | ) | (147,366 | ) | ||||||||||||||||
Class CX | (18,362 | ) | (52,281 | ) | (24,144 | ) | (27,780 | ) | ||||||||||||||||
Class R | (24,770 | ) | (56,811 | ) | (189,975 | ) | (168,948 | ) | ||||||||||||||||
Class RX | (1,509 | ) | (2,411 | ) | (11,028 | ) | (9,999 | ) | ||||||||||||||||
Class Y | (6,014 | ) | (18,400 | ) | (60,386 | ) | (101,129 | ) | ||||||||||||||||
Class R5 | (2,316 | ) | (4,897 | ) | (22,480 | ) | (33,991 | ) | ||||||||||||||||
Class R6 | (12,149 | ) | (19,650 | ) | (93,145 | ) | (44,209 | ) | ||||||||||||||||
Total distributions from net investment income | (448,000 | ) | (897,051 | ) | (1,801,679 | ) | (1,751,651 | ) | ||||||||||||||||
Distributions to shareholders from net realized gains: | ||||||||||||||||||||||||
Class A | (153,160 | ) | (125,224 | ) | — | (193,903 | ) | |||||||||||||||||
Class AX | (117,197 | ) | (105,893 | ) | — | (36,840 | ) | |||||||||||||||||
Class B | (448 | ) | (1,075 | ) | — | (3,515 | ) | |||||||||||||||||
Class C | (54,327 | ) | (43,199 | ) | — | (39,982 | ) | |||||||||||||||||
Class CX | (17,671 | ) | (21,962 | ) | — | (7,537 | ) | |||||||||||||||||
Class R | (21,014 | ) | (22,324 | ) | — | (35,734 | ) | |||||||||||||||||
Class RX | (1,335 | ) | (825 | ) | — | (2,115 | ) | |||||||||||||||||
Class Y | (3,915 | ) | (6,502 | ) | — | (17,676 | ) | |||||||||||||||||
Class R5 | (1,862 | ) | (1,673 | ) | — | (5,941 | ) | |||||||||||||||||
Class R6 | (9,688 | ) | (6,957 | ) | — | (7,727 | ) | |||||||||||||||||
Total distributions from net realized gains | (380,617 | ) | (335,634 | ) | — | (350,970 | ) | |||||||||||||||||
Share transactions–net: | ||||||||||||||||||||||||
Class A | (327,525 | ) | (429,100 | ) | (3,710,264 | ) | (1,553,986 | ) | ||||||||||||||||
Class AX | (1,241,989 | ) | (842,999 | ) | (992,796 | ) | (1,008,681 | ) | ||||||||||||||||
Class B | (54,808 | ) | (90,219 | ) | (294,741 | ) | (380,539 | ) | ||||||||||||||||
Class C | (166,873 | ) | (339,846 | ) | (770,615 | ) | (634,438 | ) | ||||||||||||||||
Class CX | (549,427 | ) | (695,634 | ) | (381,498 | ) | (776,102 | ) | ||||||||||||||||
Class R | (401,132 | ) | 265,073 | (369,338 | ) | 713,367 | ||||||||||||||||||
Class RX | 18,440 | (128,735 | ) | (14,134 | ) | (148,363 | ) | |||||||||||||||||
Class Y | (167,412 | ) | (969,190 | ) | (1,800,648 | ) | (1,996,507 | ) | ||||||||||||||||
Class R5 | (18,828 | ) | (2,970,711 | ) | (499,582 | ) | (26,283,371 | ) | ||||||||||||||||
Class R6 | 53,244 | 150,625 | 1,414,917 | 182,246 | ||||||||||||||||||||
Net increase (decrease) in net assets resulting from share transactions | (2,856,310 | ) | (6,050,736 | ) | (7,418,699 | ) | (31,886,374 | ) | ||||||||||||||||
Net increase (decrease) in net assets | (2,216,432 | ) | (5,542,206 | ) | (4,665,361 | ) | (28,774,500 | ) | ||||||||||||||||
Net assets: | ||||||||||||||||||||||||
Beginning of year | 26,984,252 | 32,526,458 | 69,554,016 | 98,328,516 | ||||||||||||||||||||
End of year* | $ | 24,767,820 | $ | 26,984,252 | $ | 64,888,655 | $ | 69,554,016 | ||||||||||||||||
* Includes accumulated undistributed net investment income (loss) | $ | (37,705 | ) | $ | (14,880 | ) | $ | 756,141 | $ | 1,280,679 | ||||||||||||||
See accompanying Notes to Financial Statements which are an integral part of the financial statements.
35 Invesco Balanced-Risk Retirement Funds
Statement of Changes in Net Assets—(continued)
For the years ended December 31, 2017 and 2016
| Invesco Balanced-Risk Retirement 2030 Fund | Invesco Balanced-Risk Retirement 2040 Fund | |||||||||||||||||||||||
| 2017 | 2016 | 2017 | 2016 | |||||||||||||||||||||
Operations: | ||||||||||||||||||||||||
Net investment income (loss) | $ | (289,127 | ) | $ | 3,143,239 | $ | (185,510 | ) | $ | 2,635,696 | ||||||||||||||
Net realized gain (loss) | 3,516,730 | (2,482,753 | ) | 3,311,034 | (3,150,120 | ) | ||||||||||||||||||
Change in net unrealized appreciation | 3,987,127 | 7,910,598 | 2,660,056 | 6,542,673 | ||||||||||||||||||||
Net increase in net assets resulting from operations | 7,214,730 | 8,571,084 | 5,785,580 | 6,028,249 | ||||||||||||||||||||
Distributions to shareholders from net investment income: | ||||||||||||||||||||||||
Class A | (1,209,287 | ) | (2,022,276 | ) | (1,228,854 | ) | (1,441,292 | ) | ||||||||||||||||
Class AX | (132,906 | ) | (256,421 | ) | (99,407 | ) | (132,204 | ) | ||||||||||||||||
Class B | (7,606 | ) | (42,383 | ) | (7,722 | ) | (16,894 | ) | ||||||||||||||||
Class C | (255,594 | ) | (446,577 | ) | (202,087 | ) | (233,283 | ) | ||||||||||||||||
Class CX | (15,637 | ) | (31,226 | ) | (6,716 | ) | (11,853 | ) | ||||||||||||||||
Class R | (216,537 | ) | (374,006 | ) | (271,662 | ) | (307,139 | ) | ||||||||||||||||
Class RX | (14,739 | ) | (20,919 | ) | (5,775 | ) | (6,924 | ) | ||||||||||||||||
Class Y | (28,955 | ) | (159,889 | ) | (34,700 | ) | (72,931 | ) | ||||||||||||||||
Class R5 | (23,625 | ) | (142,093 | ) | (16,591 | ) | (35,989 | ) | ||||||||||||||||
Class R6 | (96,715 | ) | (102,211 | ) | (128,269 | ) | (107,400 | ) | ||||||||||||||||
Total distributions from net investment income | (2,001,601 | ) | (3,598,001 | ) | (2,001,783 | ) | (2,365,909 | ) | ||||||||||||||||
Distributions to shareholders from net realized gains: | ||||||||||||||||||||||||
Class A | — | (289,479 | ) | — | (446,744 | ) | ||||||||||||||||||
Class AX | — | (36,705 | ) | — | (40,978 | ) | ||||||||||||||||||
Class B | — | (7,308 | ) | — | (6,215 | ) | ||||||||||||||||||
Class C | — | (77,006 | ) | — | (85,817 | ) | ||||||||||||||||||
Class CX | — | (5,385 | ) | — | (4,360 | ) | ||||||||||||||||||
Class R | — | (56,877 | ) | — | (100,693 | ) | ||||||||||||||||||
Class RX | — | (3,181 | ) | — | (2,270 | ) | ||||||||||||||||||
Class Y | — | (21,701 | ) | — | (21,503 | ) | ||||||||||||||||||
Class R5 | — | (19,285 | ) | — | (10,611 | ) | ||||||||||||||||||
Class R6 | — | (13,872 | ) | — | (31,666 | ) | ||||||||||||||||||
Total distributions from net realized gains | — | (530,799 | ) | — | (750,857 | ) | ||||||||||||||||||
Share transactions–net: | ||||||||||||||||||||||||
Class A | (4,880,949 | ) | 389,628 | (918,895 | ) | 1,731,030 | ||||||||||||||||||
Class AX | (1,263,878 | ) | (592,483 | ) | (425,655 | ) | (249,871 | ) | ||||||||||||||||
Class B | (776,142 | ) | (550,680 | ) | (189,846 | ) | (199,594 | ) | ||||||||||||||||
Class C | (341,257 | ) | (1,325,115 | ) | 103,038 | 53,318 | ||||||||||||||||||
Class CX | (131,932 | ) | (373,995 | ) | (97,457 | ) | (40,294 | ) | ||||||||||||||||
Class R | (742,549 | ) | (1,438,734 | ) | 147,159 | (429,128 | ) | |||||||||||||||||
Class RX | 46,840 | (761,492 | ) | 13,324 | (514,480 | ) | ||||||||||||||||||
Class Y | (2,668,093 | ) | (1,852,382 | ) | (781,351 | ) | (1,629,956 | ) | ||||||||||||||||
Class R5 | (2,306,974 | ) | (24,740,635 | ) | (367,413 | ) | (22,385,227 | ) | ||||||||||||||||
Class R6 | 852,244 | 439,813 | 851,660 | 572,318 | ||||||||||||||||||||
Net increase (decrease) in net assets resulting from share transactions | (12,212,690 | ) | (30,806,075 | ) | (1,665,436 | ) | (23,091,884 | ) | ||||||||||||||||
Net increase (decrease) in net assets | (6,999,561 | ) | (26,363,791 | ) | 2,118,361 | (20,180,401 | ) | |||||||||||||||||
Net assets: | ||||||||||||||||||||||||
Beginning of year | 80,024,735 | 106,388,526 | 51,542,812 | 71,723,213 | ||||||||||||||||||||
End of year* | $ | 73,025,174 | $ | 80,024,735 | $ | 53,661,173 | $ | 51,542,812 | ||||||||||||||||
* Includes accumulated undistributed net investment income (loss) | $ | 1,342,724 | $ | 1,347,209 | $ | 1,152,866 | $ | 1,281,044 | ||||||||||||||||
See accompanying Notes to Financial Statements which are an integral part of the financial statements.
36 Invesco Balanced-Risk Retirement Funds
Statement of Changes in Net Assets—(continued)
For the years ended December 31, 2017 and 2016
| Invesco Balanced-Risk Retirement 2050 Fund | ||||||||||||
| 2017 | 2016 | |||||||||||
Operations: | ||||||||||||
Net investment income (loss) | $ | (124,528 | ) | $ | 1,946,463 | |||||||
Net realized gain (loss) | 2,720,008 | (471,009 | ) | |||||||||
Change in net unrealized appreciation | 1,791,529 | 2,387,672 | ||||||||||
Net increase in net assets resulting from operations | 4,387,009 | 3,863,126 | ||||||||||
Distributions to shareholders from net investment income: | ||||||||||||
Class A | (908,662 | ) | (1,211,728 | ) | ||||||||
Class AX | (42,705 | ) | (89,361 | ) | ||||||||
Class B | (3,790 | ) | (17,914 | ) | ||||||||
Class C | (199,531 | ) | (330,597 | ) | ||||||||
Class CX | (5,090 | ) | (9,249 | ) | ||||||||
Class R | (172,363 | ) | (244,337 | ) | ||||||||
Class RX | (2,426 | ) | (5,602 | ) | ||||||||
Class Y | (189,757 | ) | (217,224 | ) | ||||||||
Class R5 | (4,941 | ) | (50,643 | ) | ||||||||
Class R6 | (71,518 | ) | (73,865 | ) | ||||||||
Total distributions from net investment income | (1,600,783 | ) | (2,250,520 | ) | ||||||||
Distributions to shareholders from net realized gains: | ||||||||||||
Class A | — | (50,199 | ) | |||||||||
Class AX | — | (3,702 | ) | |||||||||
Class B | — | (822 | ) | |||||||||
Class C | — | (15,178 | ) | |||||||||
Class CX | — | (425 | ) | |||||||||
Class R | — | (10,476 | ) | |||||||||
Class RX | — | (240 | ) | |||||||||
Class Y | — | (8,722 | ) | |||||||||
Class R5 | — | (2,034 | ) | |||||||||
Class R6 | — | (2,966 | ) | |||||||||
Total distributions from net realized gains | — | (94,764 | ) | |||||||||
Share transactions–net: | ||||||||||||
Class A | 1,901,807 | 3,442,274 | ||||||||||
Class AX | (302,538 | ) | 125,233 | |||||||||
Class B | (172,108 | ) | (70,669 | ) | ||||||||
Class C | 139,359 | 691,638 | ||||||||||
Class CX | (9,581 | ) | (10,123 | ) | ||||||||
Class R | 340,032 | (510,406 | ) | |||||||||
Class RX | (28,422 | ) | (97,271 | ) | ||||||||
Class Y | 241,137 | 1,162,282 | ||||||||||
Class R5 | (610,780 | ) | (7,214,733 | ) | ||||||||
Class R6 | 522,727 | 460,380 | ||||||||||
Net increase (decrease) in net assets resulting from share transactions | 2,021,633 | (2,021,395 | ) | |||||||||
Net increase (decrease) in net assets | 4,807,859 | (503,553 | ) | |||||||||
Net assets: | ||||||||||||
Beginning of year | 33,676,278 | 34,179,831 | ||||||||||
End of year* | $ | 38,484,137 | $ | 33,676,278 | ||||||||
* Includes accumulated undistributed net investment income (loss) | $ | 476,031 | $ | 460,164 | ||||||||
See accompanying Notes to Financial Statements which are an integral part of the financial statements.
37 Invesco Balanced-Risk Retirement Funds
Notes to Financial Statements
December 31, 2017
NOTE 1—Significant Accounting Policies
AIM Growth Series (Invesco Growth Series) (the “Trust”) is organized as a Delaware statutory trust and is registered under the Investment Company Act of 1940, as amended (the “1940 Act”), as an open-end series management investment company consisting of twenty-nine separate series portfolios (each constituting a “Fund”), each authorized to issue an unlimited number of shares of beneficial interest. The Funds covered in this report, each a series portfolio of the Trust, are Invesco Balanced-Risk Retirement Now Fund, Invesco Balanced-Risk Retirement 2020 Fund, Invesco Balanced-Risk Retirement 2030 Fund, Invesco Balanced-Risk Retirement 2040 Fund and Invesco Balanced-Risk Retirement 2050 Fund (collectively, the “Funds”). The assets, liabilities and operations of each Fund are accounted for separately. Information presented in these financial statements pertains only to the Funds. Matters affecting each Fund or class will be voted on exclusively by the shareholders of such Fund or class.
The investment objectives of the Funds are: to provide real return and, as a secondary objective, capital preservation for Invesco Balanced-Risk Retirement Now Fund; and to provide total return with a low to moderate correlation to traditional financial market indices and, as a secondary objective, capital preservation for Invesco Balanced-Risk Retirement 2020 Fund, Invesco Balanced-Risk Retirement 2030 Fund, Invesco Balanced-Risk Retirement 2040 Fund and Invesco Balanced-Risk Retirement 2050 Fund.
Each Fund is a “fund of funds,” in that it invests in other mutual funds (“underlying funds”) advised by Invesco Advisers, Inc. (the “Adviser” or “Invesco”). The Adviser may change each Fund’s asset class allocations, the underlying funds or the target weightings in an underlying fund without shareholder approval. The underlying funds may engage in a number of investment techniques and practices, which involve certain risks. Each underlying fund’s accounting policies are outlined in the underlying fund’s financial statements and are publicly available.
Each Fund currently consists of ten different classes of shares: Class A, Class AX, Class B, Class C, Class CX, Class R, Class RX, Class Y, Class R5 and Class R6. Class AX, Class CX and Class RX shares are closed to new investors. Class Y shares are available only to certain investors. Class A shares and Class AX shares are sold with a front-end sales charge unless certain waiver criteria are met and under certain circumstances load waived shares may be subject to contingent deferred sales charges (“CDSC”). Class C and Class CX shares are sold with a CDSC. Class R, Class RX, Class Y, Class R5 and Class R6 shares are sold at net asset value. Effective November 30, 2010, new or additional investments in Class B shares are no longer permitted. Existing shareholders of Class B shares may continue to reinvest dividends and capital gains distributions in Class B shares until they convert to Class A shares. Also, shareholders in Class B shares will be able to exchange those shares for Class B shares of other Invesco Funds offering such shares until they convert to Class A shares. Generally, Class B shares will automatically convert to Class A shares on or about the month-end, which is at least eight years after the date of purchase. Redemption of Class B shares prior to the conversion date will be subject to a CDSC. Effective January 26, 2018, each of the Fund’s outstanding Class B shares were converted to Class A shares, in advance of their normally scheduled conversion. No CDSC was paid in connection with this early conversion.
Each Fund is an investment company and accordingly follows the investment company accounting and reporting guidance in accordance with Financial Accounting Standards Board Accounting Standards Codification Topic 946, Financial Services — Investment Companies.
The following is a summary of the significant accounting policies followed by the Funds in the preparation of their financial statements.
| A. | Security Valuations — Securities of investment companies that trade on an exchange are valued at the last sales price or official closing price as of the close of the customary trading session on the exchange where the security is principally traded. Investments in shares of funds that are not traded on an exchange are valued at the end-of-day net asset value per share of such fund. Securities in the underlying funds, including restricted securities, are valued in accordance with the valuation policy of such fund. The policies of the underlying funds affiliated with the Funds as a result of having the same investment adviser are set forth below. |
A security listed or traded on an exchange (except convertible securities) is valued at its last sales price or official closing price as of the close of the customary trading session on the exchange where the security is principally traded, or lacking any sales or official closing price on a particular day, the security may be valued at the closing bid price on that day. Securities traded in the over-the-counter market are valued based on prices furnished by independent pricing services or market makers. When such securities are valued by an independent pricing service they may be considered fair valued. Futures contracts are valued at the final settlement price set by an exchange on which they are principally traded. Listed options are valued at the mean between the last bid and asked prices from the exchange on which they are principally traded. Options not listed on an exchange are valued by an independent source at the mean between the last bid and asked prices. For purposes of determining net asset value (“NAV”) per share, futures and option contracts generally are valued 15 minutes after the close of the customary trading session of the New York Stock Exchange (“NYSE”).
Investments in open-end and closed-end registered investment companies that do not trade on an exchange are valued at the end-of-day net asset value per share. Investments in open-end and closed-end registered investment companies that trade on an exchange are valued at the last sales price or official closing price as of the close of the customary trading session on the exchange where the security is principally traded.
Debt obligations (including convertible securities) and unlisted equities are fair valued using an evaluated quote provided by an independent pricing service. Evaluated quotes provided by the pricing service may be determined without exclusive reliance on quoted prices, and may reflect appropriate factors such as institution-size trading in similar groups of securities, developments related to specific securities, dividend rate (for unlisted equities), yield (for debt obligations), quality, type of issue, coupon rate (for debt obligations), maturity (for debt obligations), individual trading characteristics and other market data. Pricing services generally value debt obligations assuming orderly transactions of institutional round lot size, but a fund may hold or transact in the same securities in smaller, odd lot sizes. Odd lots often trade at lower prices than institutional round lots. Debt obligations are subject to interest rate and credit risks. In addition, all debt obligations involve some risk of default with respect to interest and/or principal payments.
Swap agreements are fair valued using an evaluated quote, if available, provided by an independent pricing service. Evaluated quotes provided by the pricing service are valued based on a model which may include end-of-day net present values, spreads, ratings, industry, company performance and returns of referenced assets. Centrally cleared swap agreements are valued at the daily settlement price determined by the relevant exchange or clearinghouse.
Foreign securities’ (including foreign exchange contracts) prices are converted into U.S. dollar amounts using the applicable exchange rates as of the close of the NYSE. If market quotations are available and reliable for foreign exchange-traded equity securities, the securities will be valued
38 Invesco Balanced-Risk Retirement Funds
at the market quotations. Because trading hours for certain foreign securities end before the close of the NYSE, closing market quotations may become unreliable. If between the time trading ends on a particular security and the close of the customary trading session on the NYSE, events occur that the investment adviser determines are significant and make the closing price unreliable, the Fund may fair value the security. If the event is likely to have affected the closing price of the security, the security will be valued at fair value in good faith using procedures approved by the Board of Trustees. Adjustments to closing prices to reflect fair value may also be based on a screening process of an independent pricing service to indicate the degree of certainty, based on historical data, that the closing price in the principal market where a foreign security trades is not the current value as of the close of the NYSE. Foreign securities’ prices meeting the approved degree of certainty that the price is not reflective of current value will be priced at the indication of fair value from the independent pricing service. Multiple factors may be considered by the independent pricing service in determining adjustments to reflect fair value and may include information relating to sector indices, American Depositary Receipts and domestic and foreign index futures. Foreign securities may have additional risks including exchange rate changes, potential for sharply devalued currencies and high inflation, political and economic upheaval, the relative lack of issuer information, relatively low market liquidity and the potential lack of strict financial and accounting controls and standards.
Securities for which market prices are not provided by any of the above methods may be valued based upon quotes furnished by independent sources. The last bid price may be used to value equity securities. The mean between the last bid and asked prices is used to value debt obligations, including corporate loans.
Securities for which market quotations are not readily available or became unreliable are valued at fair value as determined in good faith by or under the supervision of the Trust’s officers following procedures approved by the Board of Trustees. Issuer specific events, market trends, bid/asked quotes of brokers and information providers and other market data may be reviewed in the course of making a good faith determination of a security’s fair value.
The Funds may invest in securities that are subject to interest rate risk, meaning the risk that the prices will generally fall as interest rates rise and, conversely, the prices will generally rise as interest rates fall. Specific securities differ in their sensitivity to changes in interest rates depending on their individual characteristics. Changes in interest rates may result in increased market volatility, which may affect the value and/or liquidity of certain of each Fund’s investments.
Valuations change in response to many factors including the historical and prospective earnings of the issuer, the value of the issuer’s assets, general economic conditions, interest rates, investor perceptions and market liquidity. Because of the inherent uncertainties of valuation, the values reflected in the financial statements may materially differ from the value received upon actual sale of those investments.
| B. | Securities Transactions and Investment Income — Securities transactions are accounted for on a trade date basis. Realized gains or losses on sales are computed on the basis of specific identification of the securities sold. Distributions from ordinary income from underlying funds, if any, are recorded as dividend income on ex-dividend date. Distributions from gains from underlying funds, if any, are recorded as realized gains on the ex-dividend date. The following policies are followed by the underlying funds: Interest income (net of withholding tax, if any) is recorded on the accrual basis from settlement date. Bond premiums and discounts are amortized and/or accreted over the lives of the respective securities. Pay-in-kind interest income and non-cash dividend income received in the form of securities in-lieu of cash are recorded at the fair value of the securities received. Paydown gains and losses on mortgage and asset-backed securities are recorded as adjustments to interest income. |
The Funds may periodically participate in litigation related to each Fund’s investments. As such, the Funds may receive proceeds from litigation settlements. Any proceeds received are included in the Statements of Operations as realized gain (loss) for investments no longer held and as unrealized gain (loss) for investments still held.
Each Fund allocates income and realized and unrealized capital gains and losses to a class based on the relative net assets of each class.
| C. | Distributions — Invesco Balanced-Risk Retirement Now Fund generally declares and pays dividends from net investment income, if any, quarterly. Invesco Balanced-Risk Retirement 2020 Fund, Invesco Balanced-Risk Retirement 2030 Fund, Invesco Balanced-Risk Retirement 2040 Fund and Invesco Balanced-Risk Retirement 2050 Fund generally declare and pay dividends from net investment income, if any, annually. Distributions from net realized capital gains, if any, are generally paid annually and recorded on the ex-dividend date. The Funds may elect to treat a portion of the proceeds from redemptions as distributions for federal income tax purposes. |
| D. | Federal Income Taxes — The Funds intend to comply with the requirements of Subchapter M of the Internal Revenue Code of 1986, as amended (the “Internal Revenue Code”), necessary to qualify as a regulated investment company and to distribute substantially all of the Funds’ taxable earnings to shareholders. As such, the Funds will not be subject to federal income taxes on otherwise taxable income (including net realized capital gain) that is distributed to shareholders. Therefore, no provision for federal income taxes is recorded in the financial statements. |
The Funds recognize the tax benefits of uncertain tax positions only when the position is more likely than not to be sustained. Management has analyzed each Fund’s uncertain tax positions and concluded that no liability for unrecognized tax benefits should be recorded related to uncertain tax positions. Management is not aware of any tax positions for which it is reasonably possible that the total amounts of unrecognized tax benefits will change materially in the next 12 months.
Each Fund files tax returns in the U.S. Federal jurisdiction and certain other jurisdictions. Generally, each Fund is subject to examinations by such taxing authorities for up to three years after the filing of the return for the tax period.
| E. | Expenses — Expenses included in the accompanying financial statements reflect the expenses of the Funds and do not include any expenses of the underlying funds. The effects of the underlying funds expenses are included in the realized and unrealized gain/loss on the investments in the underlying funds. Estimated expenses of the underlying funds are discussed further within Note 11. |
Fees provided for under the Rule 12b-1 plan of a particular class of each Fund and which are directly attributable to that class are charged to the operations of such class. Transfer agency fees and expenses and other shareholder recordkeeping fees and expenses attributable to Class R5 and Class R6 are allocated to each share class based on relative net assets. Sub-accounting fees attributable to Class R5 are charged to the operations of the class. Transfer agency fees and expenses and other shareholder recordkeeping fees and expenses relating to all other classes are allocated among those classes based on relative net assets. All other expenses are allocated among the classes based on relative net assets.
| F. | Accounting Estimates — The preparation of financial statements in conformity with accounting principles generally accepted in the United States of America (“GAAP”) requires management to make estimates and assumptions that affect the reported amounts of assets and liabilities at the date of the financial statements and the reported amounts of revenues and expenses during the reporting period including |
39 Invesco Balanced-Risk Retirement Funds
| estimates and assumptions related to taxation. Actual results could differ from those estimates by a significant amount. In addition, each Fund monitors for material events or transactions that may occur or become known after the period-end date and before the date the financial statements are released to print. |
| G. | Indemnifications — Under the Trust’s organizational documents, each Trustee, officer, employee or other agent of the Trust is indemnified against certain liabilities that may arise out of the performance of their duties to the Funds. Additionally, in the normal course of business, the Funds enter into contracts, including each Fund’s servicing agreements, that contain a variety of indemnification clauses. Each Fund’s maximum exposure under these arrangements is unknown as this would involve future claims that may be made against such Fund that have not yet occurred. The risk of material loss as a result of such indemnification claims is considered remote. |
| H. | Other Risks — The Funds and certain of the underlying funds are non-diversified and may invest in securities of fewer issuers than if it were diversified. Thus, the value of the Fund’s shares may vary more widely and the Fund may be subject to greater market and credit risk than if the Fund invested more broadly. |
NOTE 2—Advisory Fees and Other Fees Paid to Affiliates
The Trust has entered into a master investment advisory agreement with Invesco. Under the terms of the investment advisory agreement, the Funds do not pay an advisory fee. However, each Fund pays advisory fees to Invesco indirectly as a shareholder of the underlying funds.
Under the terms of a master sub-advisory agreement between the Adviser and each of Invesco Asset Management Deutschland GmbH, Invesco Asset Management Limited, Invesco Asset Management (Japan) Limited, Invesco Hong Kong Limited, Invesco Senior Secured Management, Inc. and Invesco Canada Ltd. and, for Invesco Balanced-Risk Retirement Now Fund, a separate sub-advisory agreement with Invesco PowerShares Capital Management LLC (collectively, the “Affiliated Sub-Advisers”) the Adviser, not the Funds, will pay 40% of the fees paid to the Adviser to any such Affiliated Sub-Adviser(s) that provide(s) discretionary investment management services to each Fund based on the percentage of assets allocated to such Sub-Adviser(s).
Invesco has contractually agreed, through at least April 30, 2019, to reimburse expenses to the extent necessary to limit total annual fund operating expenses after expense reimbursement (excluding certain items discussed below) of Class A, Class AX, Class B, Class C, Class CX, Class R, Class RX, Class Y, Class R5 and Class R6 shares for each Fund as shown in the following table (the “expense limits”):
| Class A/AX | Class B | Class C/CX | Class R/RX | Class Y | Class R5 | Class R6 | ||||||||||||||||||||||
Invesco Balanced-Risk Retirement Now Fund | 0.25 | % | 1.00 | % | 1.00 | % | 0.50 | % | 0.00 | % | 0.00 | % | 0.00 | % | ||||||||||||||
Invesco Balanced-Risk Retirement 2020 Fund | 0.25 | % | 1.00 | % | 1.00 | % | 0.50 | % | 0.00 | % | 0.00 | % | 0.00 | % | ||||||||||||||
Invesco Balanced-Risk Retirement 2030 Fund | 0.25 | % | 1.00 | % | 1.00 | % | 0.50 | % | 0.00 | % | 0.00 | % | 0.00 | % | ||||||||||||||
Invesco Balanced-Risk Retirement 2040 Fund | 0.25 | % | 1.00 | % | 1.00 | % | 0.50 | % | 0.00 | % | 0.00 | % | 0.00 | % | ||||||||||||||
Invesco Balanced-Risk Retirement 2050 Fund | 0.25 | % | 1.00 | % | 1.00 | % | 0.50 | % | 0.00 | % | 0.00 | % | 0.00 | % | ||||||||||||||
In determining Invesco’s obligation to reimburse expenses, the following expenses are not taken into account, and could cause the total annual fund operating expenses after expense reimbursement to exceed the numbers reflected above: (1) interest; (2) taxes; (3) dividend expense on short sales; (4) extraordinary or non-routine items, including litigation expenses; and (5) expenses that the Funds have incurred but did not actually pay because of an expense offset arrangement. Acquired Fund Fees and Expenses are not operating expenses of a Fund directly, but are fees and expenses, including management fees of the investment companies in which a Fund invests. As a result, the total annual fund operating expenses after expense reimbursement may exceed the expense limits above. Unless Invesco continues each Fund’s fee waiver agreement, it will terminate on April 30, 2019. During its term, the fee waiver agreement cannot be terminated or amended to increase the expense limits or reduce the advisory fee waiver without approval of the Board of Trustees.
For the year ended December 31, 2017, Invesco reimbursed the following expenses:
| Fund Level | Class A | Class AX | Class B | Class C | Class CX | Class R | Class RX | Class Y | Class R5 | Class R6 | ||||||||||||||||||||||||||||||||||
Invesco Balanced-Risk Retirement Now Fund | $ | 276,288 | $ | 18,362 | $ | 14,491 | $ | 78 | $ | 6,504 | $ | 2,497 | $ | 3,042 | $ | 141 | $ | 737 | $ | 121 | $ | 222 | ||||||||||||||||||||||
Invesco Balanced-Risk Retirement 2020 Fund | 290,492 | 71,808 | 13,077 | 1,023 | 14,913 | 2,441 | 14,000 | 802 | 5,648 | 657 | 287 | |||||||||||||||||||||||||||||||||
Invesco Balanced-Risk Retirement 2030 Fund | 294,275 | 88,874 | 10,507 | 1,291 | 24,021 | 1,601 | 17,846 | 1,072 | 4,740 | 1,004 | 325 | |||||||||||||||||||||||||||||||||
Invesco Balanced-Risk Retirement 2040 Fund | 284,757 | 82,029 | 7,119 | 850 | 16,324 | 679 | 19,097 | 378 | 3,199 | 430 | 352 | |||||||||||||||||||||||||||||||||
Invesco Balanced-Risk Retirement 2050 Fund | 283,350 | 65,700 | 4,012 | 683 | 19,423 | 513 | 13,803 | 244 | 14,374 | 235 | 297 | |||||||||||||||||||||||||||||||||
The Trust has entered into a master administrative services agreement with Invesco pursuant to which each Fund has agreed to pay Invesco for certain administrative costs incurred in providing accounting services to such Fund. For the year ended December 31, 2017, expenses incurred under the agreement are shown in the Statements of Operations as Administrative services fees.
The Trust has entered into a transfer agency and service agreement with Invesco Investment Services, Inc. (“IIS”) pursuant to which each Fund has agreed to pay IIS a fee for providing transfer agency and shareholder services to such Fund. For the year ended December 31, 2017, expenses incurred under the agreement are shown in the Statements of Operations as Transfer agent fees.
The Trust has entered into master distribution agreements with Invesco Distributors, Inc. (“IDI”) to serve as the distributor for the Class A, Class AX, Class B, Class C, Class CX, Class R, Class RX, Class Y, Class R5 and Class R6 shares of each Fund. The Trust has adopted plans pursuant to Rule 12b-1 under the 1940 Act with respect to each Fund’s Class A, Class AX, Class B, Class C, Class CX, Class R and Class RX shares (collectively, the “Plans”). Each Fund, pursuant to the Plans, pays IDI compensation at the annual rate of 0.25% of the average daily net assets of Class A shares, 1.00% of the average daily net assets of Class B and Class C shares and 0.50% of the average daily net assets of Class R shares. Also, each Fund, pursuant to the Plans, reimburses IDI up to a maximum annual rate of 0.25% of each Fund’s average daily net assets of Class AX shares, 1.00% of the average daily net assets of each Fund’s Class CX shares and 0.50% of each Fund’s average daily net assets of Class RX shares. The fees are accrued daily and paid monthly. Of the Plan payments, up to 0.25% of the average daily net assets of each class of shares may be paid to furnish continuing personal shareholder services to customers who purchase and own shares of such classes. Any amounts not paid as a service fee under the Plans would
40 Invesco Balanced-Risk Retirement Funds
constitute an asset-based sales charge. Rules of the Financial Industry Regulatory Authority (“FINRA”) impose a cap on the total sales charges, including asset-based sales charges, that may be paid by any class of shares of each Fund. For the year ended December 31, 2017, expenses incurred under the Plans are shown in the Statements of Operations as Distribution fees.
Front-end sales commissions and CDSC are not recorded as expenses of the Funds. Front-end sales commissions are deducted from proceeds from the sales of each Fund’s shares prior to investment in Class A and Class AX shares of the Funds. CDSC are deducted from redemption proceeds prior to remittance to the shareholder. During the year ended December 31, 2017, IDI advised the Funds that IDI retained the following in front-end sales commissions from the sale of Class A and Class AX shares and received the following in CDSC imposed on redemptions by shareholders:
| Front End Sales Charges | Contingent Deferred Sales Charges | |||||||||||||||||||||||||||
| Class A | Class AX | Class A | Class AX | Class B | Class C | Class CX | ||||||||||||||||||||||
Invesco Balanced-Risk Retirement Now Fund | $ | 3,662 | $ | 321 | $ | 0 | $ | 0 | $ | 0 | $ | 202 | $ | 0 | ||||||||||||||
Invesco Balanced-Risk Retirement 2020 Fund | 10,110 | 454 | 7 | 4 | 0 | 591 | 0 | |||||||||||||||||||||
Invesco Balanced-Risk Retirement 2030 Fund | 13,574 | 644 | 178 | 0 | 0 | 1,089 | 12 | |||||||||||||||||||||
Invesco Balanced-Risk Retirement 2040 Fund | 13,744 | 251 | 9 | 0 | 0 | 991 | 65 | |||||||||||||||||||||
Invesco Balanced-Risk Retirement 2050 Fund | 12,459 | 101 | 11 | 7 | 0 | 879 | 15 | |||||||||||||||||||||
The underlying Invesco Funds pay no distribution fees for Class R6 shares or shares of Invesco Balanced-Risk Aggressive Allocation Fund, and the Funds pay no sales loads or other similar compensation to IDI for acquiring underlying fund shares.
Certain officers and trustees of the Trust are officers and directors of the Adviser, IIS and/or IDI.
NOTE 3—Additional Valuation Information
GAAP defines fair value as the price that would be received to sell an asset or paid to transfer a liability in an orderly transaction between market participants at the measurement date, under current market conditions. GAAP establishes a hierarchy that prioritizes the inputs to valuation methods, giving the highest priority to readily available unadjusted quoted prices in an active market for identical assets (Level 1) and the lowest priority to significant unobservable inputs (Level 3), generally when market prices are not readily available or are unreliable. Based on the valuation inputs, the securities or other investments are tiered into one of three levels. Changes in valuation methods may result in transfers in or out of an investment’s assigned level:
| Level 1 — | Prices are determined using quoted prices in an active market for identical assets. |
| Level 2 — | Prices are determined using other significant observable inputs. Observable inputs are inputs that other market participants may use in pricing a security. These may include quoted prices for similar securities, interest rates, prepayment speeds, credit risk, yield curves, loss severities, default rates, discount rates, volatilities and others. |
| Level 3 — | Prices are determined using significant unobservable inputs. In situations where quoted prices or observable inputs are unavailable (for example, when there is little or no market activity for an investment at the end of the period), unobservable inputs may be used. Unobservable inputs reflect each Fund’s own assumptions about the factors market participants would use in determining fair value of the securities or instruments and would be based on the best available information. |
As of December 31, 2017, all of the securities in each Fund were valued based on Level 1 inputs (see the Schedule of Investments for security categories). The level assigned to the securities valuations may not be an indication of the risk or liquidity associated with investing in those securities. Because of the inherent uncertainties of valuation, the values reflected in the financial statements may materially differ from the value received upon actual sale of those investments.
Each Fund’s policy is to recognize transfers in and out of the valuation levels as of the end of the reporting period. During the year ended December 31, 2017, there were no material transfers between valuation levels.
NOTE 4—Expense Offset Arrangement(s)
The expense offset arrangements are comprised of transfer agency credits which result from balances in demand deposit accounts used by the transfer agent for clearing shareholder transactions. For the year ended December 31, 2017, the Funds received credits from these arrangements, which resulted in the reduction of the Funds’ total expenses of:
| Transfer Agent Credits | ||||
Invesco Balanced-Risk Retirement Now Fund | $ | 542 | ||
Invesco Balanced-Risk Retirement 2020 Fund | 1,303 | |||
Invesco Balanced-Risk Retirement 2030 Fund | 2,085 | |||
Invesco Balanced-Risk Retirement 2040 Fund | 2,010 | |||
Invesco Balanced-Risk Retirement 2050 Fund | 2,124 | |||
41 Invesco Balanced-Risk Retirement Funds
NOTE 5—Trustees’ and Officers’ Fees and Benefits
Trustees’ and Officers’ Fees and Benefits include amounts accrued by each Fund to pay remuneration to certain Trustees and Officers of such Fund. Trustees have the option to defer compensation payable by the Funds, and Trustees’ and Officers’ Fees and Benefits also include amounts accrued by each Fund to fund such deferred compensation amounts. Those Trustees who defer compensation have the option to select various Invesco Funds in which their deferral accounts shall be deemed to be invested. Finally, certain current Trustees were eligible to participate in a retirement plan that provided for benefits to be paid upon retirement to Trustees over a period of time based on the number of years of service. The Funds may have certain former Trustees who also participate in a retirement plan and receive benefits under such plan. Trustees’ and Officers’ Fees and Benefits include amounts accrued by each Fund to fund such retirement benefits. Obligations under the deferred compensation and retirement plans represent unsecured claims against the general assets of the Funds.
NOTE 6—Cash Balances
The Funds are permitted to temporarily carry a negative or overdrawn balance in their account with State Street Bank and Trust Company, the custodian bank. Such balances, if any at period-end, are shown in the Statements of Assets and Liabilities under the payable caption Amount due custodian. To compensate the custodian bank for such overdrafts, the overdrawn Fund may either (1) leave funds as a compensating balance in the account so the custodian bank can be compensated by earning the additional interest; or (2) compensate by paying the custodian bank at a rate agreed upon by the custodian bank and Invesco, not to exceed the contractually agreed upon rate.
NOTE 7—Distributions to Shareholders and Tax Components of Net Assets
Tax Character of Distributions to Shareholders Paid During the Fiscal Years Ended December 31, 2017 and 2016:
| 2017 | 2016 | |||||||||||||||||||||||
| Ordinary Income | Long-term Capital Gain | Total Distributions | Ordinary Income | Long-term Capital Gain | Total Distributions | |||||||||||||||||||
Invesco Balanced-Risk Retirement Now Fund | $ | 448,000 | $ | 380,617 | $ | 828,617 | $ | 897,051 | $ | 335,634 | $ | 1,232,685 | ||||||||||||
Invesco Balanced-Risk Retirement 2020 Fund | 1,801,679 | — | 1,801,679 | 1,757,431 | 345,190 | 2,102,621 | ||||||||||||||||||
Invesco Balanced-Risk Retirement 2030 Fund | 2,001,601 | — | 2,001,601 | 3,604,392 | 524,408 | 4,128,800 | ||||||||||||||||||
Invesco Balanced-Risk Retirement 2040 Fund | 2,001,783 | — | 2,001,783 | 2,382,400 | 734,366 | 3,116,766 | ||||||||||||||||||
Invesco Balanced-Risk Retirement 2050 Fund | 1,600,783 | — | 1,600,783 | 2,251,835 | 93,449 | 2,345,284 | ||||||||||||||||||
Tax Components of Net Assets at Period-End:
| Undistributed Ordinary Income | Undistributed Long-term Gain | Net Unrealized Appreciation (Depreciation) — Investments | Temporary Book/Tax Differences | Capital Loss Carryforward | Shares of Beneficial Interest | Total Net Assets | ||||||||||||||||||||||
Invesco Balanced-Risk Retirement Now Fund | $ | — | $ | 473,534 | $ | 374,465 | $ | (37,705 | ) | $ | — | $ | 23,957,526 | $ | 24,767,820 | |||||||||||||
Invesco Balanced-Risk Retirement 2020 Fund | 790,866 | — | 1,054,526 | (34,725 | ) | (1,830,676 | ) | 64,908,664 | 64,888,655 | |||||||||||||||||||
Invesco Balanced-Risk Retirement 2030 Fund | 1,377,205 | — | (911,473 | ) | (34,481 | ) | (2,483,410 | ) | 75,077,333 | 73,025,174 | ||||||||||||||||||
Invesco Balanced-Risk Retirement 2040 Fund | 1,183,577 | — | (4,986,545 | ) | (30,711 | ) | (2,424,867 | ) | 59,919,719 | 53,661,173 | ||||||||||||||||||
Invesco Balanced-Risk Retirement 2050 Fund | 503,441 | 434,905 | (3,648,859 | ) | (27,410 | ) | — | 41,222,060 | 38,484,137 | |||||||||||||||||||
The difference between book-basis and tax-basis unrealized appreciation (depreciation) is due to differences in the timing of recognition of gains and losses on investments for tax and book purposes. The Funds’ net unrealized appreciation (depreciation) differences are attributable primarily to wash sales.
The temporary book/tax differences are a result of timing differences between book and tax recognition of income and/or expenses. The Funds temporary book/tax differences are the result of the trustee deferral of compensation and retirement plan benefits.
Capital loss carryforward is calculated and reported as of a specific date. Results of transactions and other activity after that date may affect the amount of capital loss carryforward actually available for the Funds to utilize. Capital losses generated in years beginning after December 22, 2010 can be carried forward for an unlimited period, whereas previous losses expire in eight tax years. Capital losses with an expiration period may not be used to offset capital gains until all net capital losses without an expiration date have been utilized. Capital loss carryforwards with no expiration date will retain their character as either short-term or long-term capital losses instead of as short-term capital losses as under prior law. The ability to utilize capital loss carryforward in the future may be limited under the Internal Revenue Code and related regulations based on the results of future transactions.
The Funds have a capital loss carryforward as of December 31, 2017 as follows:
| Short-Term | Long-Term | |||||||||||
| Fund | Not Subject to Expiration | Not Subject to Expiration | Total* | |||||||||
Invesco Balanced-Risk Retirement 2020 Fund | $ | — | $ | 1,830,676 | $ | 1,830,676 | ||||||
Invesco Balanced-Risk Retirement 2030 Fund | 51,340 | 2,432,070 | 2,483,410 | |||||||||
Invesco Balanced-Risk Retirement 2040 Fund | 45,190 | 2,379,677 | 2,424,867 | |||||||||
| * | Capital loss carryforward as of the date listed above is reduced for limitations, if any, to the extent required by the Internal Revenue Code and may be further limited depending upon a variety of factors, including the realization of net unrealized gains or losses as of the date of any reorganization. |
42 Invesco Balanced-Risk Retirement Funds
NOTE 8—Investment Transactions
The aggregate amount of investment securities purchased and sold by each Fund and aggregate cost and the net unrealized appreciation (depreciation) of investments for tax purposes are as follows:
| For the year ended December 31, 2017* | At December 31, 2017 | |||||||||||||||||||||||
| Federal Tax Cost** | Unrealized | Unrealized | Net Unrealized Appreciation (Depreciation) | |||||||||||||||||||||
| Purchases | Sales | |||||||||||||||||||||||
Invesco Balanced-Risk Retirement Now Fund | $ | 1,504,552 | $ | 3,319,393 | $ | 24,413,664 | $ | 374,465 | $ | — | $ | 374,465 | ||||||||||||
Invesco Balanced-Risk Retirement 2020 Fund | 2,771,751 | 9,721,698 | 63,891,143 | 1,054,526 | — | 1,054,526 | ||||||||||||||||||
Invesco Balanced-Risk Retirement 2030 Fund | 6,710,920 | 16,271,759 | 74,480,786 | 217,632 | (1,129,105 | ) | (911,473 | ) | ||||||||||||||||
Invesco Balanced-Risk Retirement 2040 Fund | 8,968,795 | 8,581,537 | 58,933,090 | — | (4,986,545 | ) | (4,986,545 | ) | ||||||||||||||||
Invesco Balanced-Risk Retirement 2050 Fund | 9,968,021 | 6,172,543 | 41,830,408 | — | (3,648,859 | ) | (3,648,859 | ) | ||||||||||||||||
| * | Excludes U.S. Treasury obligations and money market funds, if any. |
| ** | Cost of investments, including any derivatives, on a tax basis includes the adjustments for financial reporting purposes as of the most recently completed federal income tax reporting period-end. |
NOTE 9—Reclassification of Permanent Differences
Primarily as a result of differing book/tax treatment of distributions from the underlying funds, on December 31, 2017, the following amounts were reclassified between undistributed net investment income (loss), undistributed net realized gain (loss) and shares of beneficial interest. These reclassifications had no effect on the net assets of each Fund.
| Undistributed Net Investment Income (Loss) | Undistributed Net Realized Gain (Loss) | Shares of Beneficial Interest | ||||||||||
Invesco Balanced-Risk Retirement Now Fund | $ | 449,895 | $ | (445,372 | ) | $ | (4,523 | ) | ||||
Invesco Balanced-Risk Retirement 2020 Fund | 1,379,910 | (1,379,910 | ) | — | ||||||||
Invesco Balanced-Risk Retirement 2030 Fund | 2,286,243 | (2,286,243 | ) | — | ||||||||
Invesco Balanced-Risk Retirement 2040 Fund | 2,059,115 | (2,059,115 | ) | — | ||||||||
Invesco Balanced-Risk Retirement 2050 Fund | 1,741,178 | (1,741,178 | ) | — | ||||||||
43 Invesco Balanced-Risk Retirement Funds
NOTE 10—Share Information
Invesco Balanced-Risk Retirement Now Fund
| Summary of Share Activity | ||||||||||||||||
| Years ended December 31, | ||||||||||||||||
| 2017(a) | 2016 | |||||||||||||||
| Shares | Amount | Shares | Amount | |||||||||||||
Sold: | ||||||||||||||||
Class A | 246,734 | $ | 2,077,368 | 238,242 | $ | 1,998,264 | ||||||||||
Class AX | 9,660 | 80,767 | 4,211 | 35,582 | ||||||||||||
Class B | 832 | 6,862 | 885 | 7,338 | ||||||||||||
Class C | 65,777 | 537,679 | 52,369 | 425,878 | ||||||||||||
Class CX | 518 | 4,211 | 6,167 | 49,786 | ||||||||||||
Class R | 59,787 | 498,640 | 56,236 | 462,373 | ||||||||||||
Class RX | 2,290 | 19,145 | 3,139 | 25,878 | ||||||||||||
Class Y | 39,309 | 333,894 | 78,375 | 675,625 | ||||||||||||
Class R5 | 819 | 6,988 | 3,366 | 27,559 | ||||||||||||
Class R6 | 26,194 | 222,636 | 21,810 | 184,755 | ||||||||||||
Issued as reinvestment of dividends: | ||||||||||||||||
Class A | 36,666 | 307,495 | 52,940 | 434,975 | ||||||||||||
Class AX | 29,690 | 248,691 | 46,272 | 379,281 | ||||||||||||
Class B | 113 | 914 | 420 | 3,348 | ||||||||||||
Class C | 11,793 | 95,521 | 15,850 | 126,497 | ||||||||||||
Class CX | 4,250 | 34,379 | 8,846 | 70,502 | ||||||||||||
Class R | 5,487 | 45,472 | 9,666 | 78,642 | ||||||||||||
Class RX | 307 | 2,544 | 348 | 2,828 | ||||||||||||
Class Y | 1,060 | 8,981 | 2,864 | 23,728 | ||||||||||||
Class R5 | 454 | 3,852 | 739 | 6,125 | ||||||||||||
Class R6 | 2,539 | 21,519 | 3,159 | 26,174 | ||||||||||||
Automatic conversion of Class B shares to Class A shares: | ||||||||||||||||
Class A | 5,418 | 45,590 | 9,500 | 78,287 | ||||||||||||
Class B | (5,593 | ) | (45,590 | ) | (9,779 | ) | (78,287 | ) | ||||||||
Reacquired: | ||||||||||||||||
Class A | (328,115 | ) | (2,757,978 | ) | (351,918 | ) | (2,940,626 | ) | ||||||||
Class AX | (187,258 | ) | (1,571,447 | ) | (148,623 | ) | (1,257,862 | ) | ||||||||
Class B | (2,092 | ) | (16,994 | ) | (2,763 | ) | (22,618 | ) | ||||||||
Class C | (97,770 | ) | (800,073 | ) | (110,344 | ) | (892,221 | ) | ||||||||
Class CX | (71,933 | ) | (588,017 | ) | (99,619 | ) | (815,922 | ) | ||||||||
Class R | (112,935 | ) | (945,244 | ) | (33,180 | ) | (275,942 | ) | ||||||||
Class RX | (381 | ) | (3,249 | ) | (18,824 | ) | (157,441 | ) | ||||||||
Class Y | (59,869 | ) | (510,287 | ) | (202,299 | ) | (1,668,543 | ) | ||||||||
Class R5 | (3,498 | ) | (29,668 | ) | (371,487 | ) | (3,004,395 | ) | ||||||||
Class R6 | (22,359 | ) | (190,911 | ) | (7,005 | ) | (60,304 | ) | ||||||||
Net increase (decrease) in share activity | (342,106 | ) | $ | (2,856,310 | ) | (740,437 | ) | $ | (6,050,736 | ) | ||||||
| (a) | There are entities that are record owners of more than 5% of the outstanding shares of the Fund and in the aggregate own 30% of the outstanding shares of the Fund. IDI has an agreement with these entities to sell Fund shares. The Fund, Invesco and/or Invesco affiliates may make payments to these entities, which are considered to be related to the Fund, for providing services to the Fund, Invesco and/or Invesco affiliates including but not limited to services such as securities brokerage, distribution, third party record keeping and account servicing. The Fund has no knowledge as to whether all or any portion of the shares owned of record by these entities are also owned beneficially. |
44 Invesco Balanced-Risk Retirement Funds
NOTE 10—Share Information—(continued)
Invesco Balanced-Risk Retirement 2020 Fund
| Summary of Share Activity | ||||||||||||||||
| Years ended December 31, | ||||||||||||||||
| 2017 | 2016 | |||||||||||||||
| Shares | Amount | Shares | Amount | |||||||||||||
Sold: | ||||||||||||||||
Class A | 671,330 | $ | 5,991,700 | 1,013,937 | $ | 8,869,411 | ||||||||||
Class AX | 48,510 | 427,492 | 24,281 | 209,639 | ||||||||||||
Class B | 1,712 | 15,272 | 6,460 | 55,839 | ||||||||||||
Class C | 167,251 | 1,485,454 | 244,536 | 2,083,309 | ||||||||||||
Class CX | 3,576 | 31,331 | 8,869 | 81,888 | ||||||||||||
Class R | 236,170 | 2,096,431 | 217,602 | 1,875,501 | ||||||||||||
Class RX | 9,463 | 83,817 | 12,544 | 108,324 | ||||||||||||
Class Y | 141,983 | 1,258,503 | 504,091 | 4,397,260 | ||||||||||||
Class R5 | 28,869 | 262,521 | 49,161 | 400,152 | ||||||||||||
Class R6 | 180,293 | 1,647,504 | 35,669 | 312,178 | ||||||||||||
Issued as reinvestment of dividends: | ||||||||||||||||
Class A | 115,070 | 1,029,874 | 136,979 | 1,182,132 | ||||||||||||
Class AX | 20,804 | 186,198 | 26,055 | 224,855 | ||||||||||||
Class B | 956 | 8,475 | 1,874 | 16,024 | ||||||||||||
Class C | 17,350 | 153,543 | 21,450 | 182,966 | ||||||||||||
Class CX | 2,728 | 24,145 | 4,140 | 35,317 | ||||||||||||
Class R | 21,298 | 189,975 | 23,800 | 204,682 | ||||||||||||
Class RX | 1,208 | 10,774 | 1,377 | 11,842 | ||||||||||||
Class Y | 6,324 | 56,598 | 10,634 | 91,767 | ||||||||||||
Class R5 | 2,454 | 22,089 | 4,558 | 39,524 | ||||||||||||
Class R6 | 10,317 | 92,854 | 5,949 | 51,631 | ||||||||||||
Automatic conversion of Class B shares to Class A shares: | ||||||||||||||||
Class A | 26,601 | 237,732 | 34,068 | 294,321 | ||||||||||||
Class B | (26,946 | ) | (237,732 | ) | (34,545 | ) | (294,321 | ) | ||||||||
Reacquired: | ||||||||||||||||
Class A | (1,229,613 | ) | (10,969,570 | ) | (1,367,030 | ) | (11,899,850 | ) | ||||||||
Class AX | (180,844 | ) | (1,606,486 | ) | (164,489 | ) | (1,443,175 | ) | ||||||||
Class B | (9,162 | ) | (80,756 | ) | (18,922 | ) | (158,081 | ) | ||||||||
Class C | (271,550 | ) | (2,409,612 | ) | (343,428 | ) | (2,900,713 | ) | ||||||||
Class CX | (49,757 | ) | (436,974 | ) | (102,754 | ) | (893,307 | ) | ||||||||
Class R | (298,596 | ) | (2,655,744 | ) | (158,505 | ) | (1,366,816 | ) | ||||||||
Class RX | (12,230 | ) | (108,725 | ) | (31,706 | ) | (268,529 | ) | ||||||||
Class Y | (348,348 | ) | (3,115,749 | ) | (769,190 | ) | (6,485,534 | ) | ||||||||
Class R5 | (88,083 | ) | (784,192 | ) | (3,269,761 | ) | (26,723,047 | ) | ||||||||
Class R6 | (36,271 | ) | (325,441 | ) | (21,578 | ) | (181,563 | ) | ||||||||
Net increase (decrease) in share activity | (837,133 | ) | $ | (7,418,699 | ) | (3,893,874 | ) | $ | (31,886,374 | ) | ||||||
45 Invesco Balanced-Risk Retirement Funds
NOTE 10—Share Information—(continued)
Invesco Balanced-Risk Retirement 2030 Fund
| Summary of Share Activity | ||||||||||||||||
| Years ended December 31, | ||||||||||||||||
| 2017(a) | 2016 | |||||||||||||||
| Shares | Amount | Shares | Amount | |||||||||||||
Sold: | ||||||||||||||||
Class A | 989,897 | $ | 8,365,292 | 1,005,534 | $ | 8,217,984 | ||||||||||
Class AX | 33,551 | 282,236 | 18,799 | 153,883 | ||||||||||||
Class B | 4,125 | 34,206 | 6,811 | 55,480 | ||||||||||||
Class C | 254,964 | 2,123,221 | 349,365 | 2,792,124 | ||||||||||||
Class CX | 4,795 | 40,042 | 1,642 | 13,338 | ||||||||||||
Class R | 278,984 | 2,366,723 | 409,410 | 3,308,624 | ||||||||||||
Class RX | 6,792 | 57,134 | 14,575 | 115,665 | ||||||||||||
Class Y | 179,611 | 1,508,598 | 245,309 | 2,032,919 | ||||||||||||
Class R5 | 11,929 | 99,869 | 113,812 | 892,304 | ||||||||||||
Class R6 | 168,765 | 1,442,757 | 60,398 | 497,281 | ||||||||||||
Issued as reinvestment of dividends: | ||||||||||||||||
Class A | 138,767 | 1,190,613 | 281,914 | 2,275,051 | ||||||||||||
Class AX | 15,120 | 129,889 | 35,857 | 289,366 | ||||||||||||
Class B | 895 | 7,606 | 6,202 | 49,615 | ||||||||||||
Class C | 29,814 | 253,419 | 64,287 | 513,655 | ||||||||||||
Class CX | 1,829 | 15,549 | 4,560 | 36,431 | ||||||||||||
Class R | 25,348 | 216,469 | 53,643 | 430,757 | ||||||||||||
Class RX | 1,675 | 14,291 | 2,902 | 23,276 | ||||||||||||
Class Y | 3,252 | 27,963 | 20,990 | 169,813 | ||||||||||||
Class R5 | 2,693 | 23,241 | 19,818 | 160,725 | ||||||||||||
Class R6 | 11,186 | 96,425 | 14,253 | 115,591 | ||||||||||||
Automatic conversion of Class B shares to Class A shares: | ||||||||||||||||
Class A | 69,573 | 586,231 | 53,684 | 439,581 | ||||||||||||
Class B | (70,437 | ) | (586,231 | ) | (54,415 | ) | (439,581 | ) | ||||||||
Reacquired: | ||||||||||||||||
Class A | (1,777,507 | ) | (15,023,085 | ) | (1,282,537 | ) | (10,542,988 | ) | ||||||||
Class AX | (198,515 | ) | (1,676,003 | ) | (124,277 | ) | (1,035,732 | ) | ||||||||
Class B | (27,630 | ) | (231,723 | ) | (27,312 | ) | (216,194 | ) | ||||||||
Class C | (327,942 | ) | (2,717,897 | ) | (583,164 | ) | (4,630,894 | ) | ||||||||
Class CX | (22,089 | ) | (187,523 | ) | (53,241 | ) | (423,764 | ) | ||||||||
Class R | (392,636 | ) | (3,325,741 | ) | (625,970 | ) | (5,178,115 | ) | ||||||||
Class RX | (2,969 | ) | (24,585 | ) | (110,554 | ) | (900,433 | ) | ||||||||
Class Y | (494,328 | ) | (4,204,654 | ) | (505,083 | ) | (4,055,114 | ) | ||||||||
Class R5 | (288,818 | ) | (2,430,084 | ) | (3,414,730 | ) | (25,793,664 | ) | ||||||||
Class R6 | (80,468 | ) | (686,938 | ) | (21,005 | ) | (173,059 | ) | ||||||||
Net increase (decrease) in share activity | (1,449,774 | ) | $ | (12,212,690 | ) | (4,018,523 | ) | $ | (30,806,075 | ) | ||||||
| (a) | There is an entity that is a record owner of more than 5% of the outstanding shares of the Fund and owns 7% of the outstanding shares of the Fund. IDI has an agreement with this entity to sell Fund shares. The Fund, Invesco and/or Invesco affiliates may make payments to this entity, which is considered to be related to the Fund, for providing services to the Fund, Invesco and/or Invesco affiliates including but not limited to services such as securities brokerage, distribution, third party record keeping and account servicing. The Fund has no knowledge as to whether all or any portion of the shares owned of record by this entity are also owned beneficially. |
46 Invesco Balanced-Risk Retirement Funds
NOTE 10—Share Information—(continued)
Invesco Balanced-Risk Retirement 2040 Fund
| Summary of Share Activity | ||||||||||||||||
| Years ended December 31, | ||||||||||||||||
| 2017(a) | 2016 | |||||||||||||||
| Shares | Amount | Shares | Amount | |||||||||||||
Sold: | ||||||||||||||||
Class A | 1,008,071 | $ | 7,759,721 | 1,029,750 | $ | 7,772,225 | ||||||||||
Class AX | 11,368 | 88,105 | 18,951 | 142,668 | ||||||||||||
Class B | 592 | 4,426 | 1,758 | 13,554 | ||||||||||||
Class C | 204,305 | 1,566,559 | 225,170 | 1,654,944 | ||||||||||||
Class CX | 2,560 | 19,896 | 3,426 | 24,216 | ||||||||||||
Class R | 252,133 | 1,936,528 | 277,953 | 2,062,605 | ||||||||||||
Class RX | 5,029 | 38,639 | 8,816 | 63,863 | ||||||||||||
Class Y | 59,142 | 455,018 | 98,270 | 733,329 | ||||||||||||
Class R5 | 8,401 | 65,128 | 48,230 | 330,835 | ||||||||||||
Class R6 | 187,530 | 1,461,197 | 91,473 | 687,316 | ||||||||||||
Issued as reinvestment of dividends: | ||||||||||||||||
Class A | 156,924 | 1,225,579 | 256,624 | 1,878,495 | ||||||||||||
Class AX | 12,744 | 99,407 | 23,469 | 171,561 | ||||||||||||
Class B | 999 | 7,722 | 3,187 | 23,109 | ||||||||||||
Class C | 25,907 | 199,974 | 43,497 | 314,916 | ||||||||||||
Class CX | 871 | 6,716 | 2,048 | 14,811 | ||||||||||||
Class R | 34,858 | 270,847 | 55,944 | 407,832 | ||||||||||||
Class RX | 700 | 5,435 | 1,187 | 8,655 | ||||||||||||
Class Y | 4,370 | 34,216 | 12,766 | 93,702 | ||||||||||||
Class R5 | 2,051 | 16,082 | 6,235 | 45,830 | ||||||||||||
Class R6 | 16,314 | 127,900 | 18,845 | 138,508 | ||||||||||||
Automatic conversion of Class B shares to Class A shares: | ||||||||||||||||
Class A | 21,173 | 163,240 | 19,880 | 148,984 | ||||||||||||
Class B | (21,446 | ) | (163,240 | ) | (20,180 | ) | (148,984 | ) | ||||||||
Reacquired: | ||||||||||||||||
Class A | (1,307,692 | ) | (10,067,435 | ) | (1,082,661 | ) | (8,068,674 | ) | ||||||||
Class AX | (79,296 | ) | (613,167 | ) | (74,122 | ) | (564,100 | ) | ||||||||
Class B | (4,938 | ) | (38,754 | ) | (11,746 | ) | (87,273 | ) | ||||||||
Class C | (215,872 | ) | (1,663,495 | ) | (261,246 | ) | (1,916,542 | ) | ||||||||
Class CX | (16,179 | ) | (124,069 | ) | (10,769 | ) | (79,321 | ) | ||||||||
Class R | (268,007 | ) | (2,060,216 | ) | (384,646 | ) | (2,899,565 | ) | ||||||||
Class RX | (4,074 | ) | (30,750 | ) | (78,322 | ) | (586,998 | ) | ||||||||
Class Y | (163,162 | ) | (1,270,585 | ) | (326,690 | ) | (2,456,987 | ) | ||||||||
Class R5 | (58,346 | ) | (448,623 | ) | (3,360,180 | ) | (22,761,892 | ) | ||||||||
Class R6 | (95,057 | ) | (737,437 | ) | (34,174 | ) | (253,506 | ) | ||||||||
Net increase (decrease) in share activity | (218,027 | ) | $ | (1,665,436 | ) | (3,397,257 | ) | $ | (23,091,884 | ) | ||||||
| (a) | There are entities that are record owners of more than 5% of the outstanding shares of the Fund and in the aggregate own 22% of the outstanding shares of the Fund. IDI has an agreement with these entities to sell Fund shares. The Fund, Invesco and/or Invesco affiliates may make payments to these entities, which are considered to be related to the Fund, for providing services to the Fund, Invesco and/or Invesco affiliates including but not limited to services such as securities brokerage, distribution, third party record keeping and account servicing. The Fund has no knowledge as to whether all or any portion of the shares owned of record by these entities are also owned beneficially. |
47 Invesco Balanced-Risk Retirement Funds
NOTE 10—Share Information—(continued)
Invesco Balanced-Risk Retirement 2050 Fund
| Summary of Share Activity | ||||||||||||||||
| Years ended December 31, | ||||||||||||||||
| 2017(a) | 2016 | |||||||||||||||
| Shares | Amount | Shares | Amount | |||||||||||||
Sold: | ||||||||||||||||
Class A | 1,396,059 | $ | 10,740,646 | 965,806 | $ | 7,134,840 | ||||||||||
Class AX | 10,760 | 80,802 | 20,742 | 158,181 | ||||||||||||
Class C | 238,119 | 1,773,135 | 272,919 | 1,974,275 | ||||||||||||
Class CX | 1,689 | 12,481 | 2,086 | 15,034 | ||||||||||||
Class R | 199,170 | 1,507,345 | 208,692 | 1,524,511 | ||||||||||||
Class RX | 2,208 | 16,637 | 5,598 | 39,389 | ||||||||||||
Class Y | 244,904 | 1,856,762 | 421,999 | 3,115,200 | ||||||||||||
Class R5 | 6,345 | 48,146 | 69,435 | 473,168 | ||||||||||||
Class R6 | 96,543 | 733,067 | 57,210 | 424,699 | ||||||||||||
Issued as reinvestment of dividends: | ||||||||||||||||
Class A | 118,086 | 903,361 | 176,857 | 1,257,448 | ||||||||||||
Class AX | 5,547 | 42,495 | 13,033 | 92,796 | ||||||||||||
Class B | 503 | 3,788 | 2,422 | 17,016 | ||||||||||||
Class C | 25,765 | 194,523 | 48,119 | 338,277 | ||||||||||||
Class CX | 674 | 5,090 | 1,378 | 9,673 | ||||||||||||
Class R | 21,899 | 166,650 | 35,991 | 254,813 | ||||||||||||
Class RX | 232 | 1,769 | 664 | 4,701 | ||||||||||||
Class Y | 24,489 | 187,833 | 31,182 | 222,328 | ||||||||||||
Class R5 | 580 | 4,456 | 7,265 | 51,872 | ||||||||||||
Class R6 | 9,249 | 71,124 | 10,654 | 76,176 | ||||||||||||
Automatic conversion of Class B shares to Class A shares: | ||||||||||||||||
Class A | 14,841 | 113,143 | 4,606 | 34,219 | ||||||||||||
Class B | (15,108 | ) | (113,143 | ) | (4,697 | ) | (34,219 | ) | ||||||||
Reacquired: | ||||||||||||||||
Class A | (1,292,673 | ) | (9,855,343 | ) | (687,129 | ) | (4,984,233 | ) | ||||||||
Class AX | (56,121 | ) | (425,835 | ) | (17,196 | ) | (125,744 | ) | ||||||||
Class B | (8,203 | ) | (62,753 | ) | (7,731 | ) | (53,466 | ) | ||||||||
Class C | (245,943 | ) | (1,828,299 | ) | (225,931 | ) | (1,620,914 | ) | ||||||||
Class CX | (3,644 | ) | (27,152 | ) | (4,801 | ) | (34,830 | ) | ||||||||
Class R | (176,301 | ) | (1,333,963 | ) | (316,302 | ) | (2,289,730 | ) | ||||||||
Class RX | (6,273 | ) | (46,828 | ) | (19,492 | ) | (141,361 | ) | ||||||||
Class Y | (236,502 | ) | (1,803,458 | ) | (301,268 | ) | (2,175,246 | ) | ||||||||
Class R5 | (88,543 | ) | (663,382 | ) | (1,179,238 | ) | (7,739,773 | ) | ||||||||
Class R6 | (36,777 | ) | (281,464 | ) | (5,404 | ) | (40,495 | ) | ||||||||
Net increase (decrease) in share activity | 251,574 | $ | 2,021,633 | (412,531 | ) | $ | (2,021,395 | ) | ||||||||
| (a) | There are entities that are record owners of more than 5% of the outstanding shares of the Fund and in the aggregate own 19% of the outstanding shares of the Fund. IDI has an agreement with these entities to sell Fund shares. The Fund, Invesco and/or Invesco affiliates may make payments to these entities, which are considered to be related to the Fund, for providing services to the Fund, Invesco and/or Invesco affiliates including but not limited to services such as securities brokerage, distribution, third party record keeping and account servicing. The Fund has no knowledge as to whether all or any portion of the shares owned of record by these entities are also owned beneficially. |
48 Invesco Balanced-Risk Retirement Funds
NOTE 11—Financial Highlights
The following schedules present financial highlights for a share of each Fund outstanding throughout the periods indicated.
Invesco Balanced-Risk Retirement Now Fund
| Net asset value, beginning of period | Net investment income (loss)(a) | Net gains (losses) on securities (both realized and unrealized) | Total from investment operations | Dividends from net investment income | Distributions from net realized gains | Total distributions | Net asset value, end of period | Total return(b) | Net assets, end of period (000’s omitted) | Ratio of expenses to average net assets with fee waivers and/or expense reimbursements(c) | Ratio of expenses to average net assets without fee waivers and/or expense reimbursements | Ratio of net investment income (loss) to average net assets | Portfolio turnover(d) | |||||||||||||||||||||||||||||||||||||||||||
Class A |
| |||||||||||||||||||||||||||||||||||||||||||||||||||||||
Year ended 12/31/17 | $ | 8.26 | $ | 0.00 | $ | 0.50 | $ | 0.50 | $ | (0.16 | ) | $ | (0.13 | ) | $ | (0.29 | ) | $ | 8.47 | 6.11 | % | $ | 10,053 | 0.25 | %(e) | 1.50 | %(e) | 0.05 | %(e) | 10 | % | |||||||||||||||||||||||||
Year ended 12/31/16 | 8.11 | 0.19 | 0.36 | 0.55 | (0.29 | ) | (0.11 | ) | (0.40 | ) | 8.26 | 6.74 | 10,130 | 0.25 | 1.32 | 2.20 | 10 | |||||||||||||||||||||||||||||||||||||||
Year ended 12/31/15 | 8.77 | 0.12 | (0.37 | ) | (0.25 | ) | (0.24 | ) | (0.17 | ) | (0.41 | ) | 8.11 | (2.81 | ) | 10,366 | 0.25 | 1.11 | 1.39 | 19 | ||||||||||||||||||||||||||||||||||||
Year ended 12/31/14 | 8.91 | 0.10 | 0.19 | 0.29 | (0.23 | ) | (0.20 | ) | (0.43 | ) | 8.77 | 3.32 | 14,273 | 0.25 | 0.96 | 1.13 | 9 | |||||||||||||||||||||||||||||||||||||||
Year ended 12/31/13 | 9.07 | (0.02 | ) | 0.14 | 0.12 | (0.20 | ) | (0.08 | ) | (0.28 | ) | 8.91 | 1.33 | 15,858 | 0.25 | 0.85 | (0.22 | ) | 16 | |||||||||||||||||||||||||||||||||||||
Class AX | ||||||||||||||||||||||||||||||||||||||||||||||||||||||||
Year ended 12/31/17 | 8.25 | 0.00 | 0.49 | 0.49 | (0.16 | ) | (0.13 | ) | (0.29 | ) | 8.45 | 5.99 | 7,608 | 0.25 | (e) | 1.50 | (e) | 0.05 | (e) | 10 | ||||||||||||||||||||||||||||||||||||
Year ended 12/31/16 | 8.10 | 0.18 | 0.37 | 0.55 | (0.29 | ) | (0.11 | ) | (0.40 | ) | 8.25 | 6.75 | 8,641 | 0.25 | 1.32 | 2.20 | 10 | |||||||||||||||||||||||||||||||||||||||
Year ended 12/31/15 | 8.76 | 0.12 | (0.37 | ) | (0.25 | ) | (0.24 | ) | (0.17 | ) | (0.41 | ) | 8.10 | (2.82 | ) | 9,283 | 0.25 | 1.11 | 1.39 | 19 | ||||||||||||||||||||||||||||||||||||
Year ended 12/31/14 | 8.90 | 0.10 | 0.20 | 0.30 | (0.24 | ) | (0.20 | ) | (0.44 | ) | 8.76 | 3.32 | 11,273 | 0.25 | 0.96 | 1.13 | 9 | |||||||||||||||||||||||||||||||||||||||
Year ended 12/31/13 | 9.06 | (0.02 | ) | 0.14 | 0.12 | (0.20 | ) | (0.08 | ) | (0.28 | ) | 8.90 | 1.33 | 14,817 | 0.25 | 0.85 | (0.22 | ) | 16 | |||||||||||||||||||||||||||||||||||||
Class B | ||||||||||||||||||||||||||||||||||||||||||||||||||||||||
Year ended 12/31/17 | 8.01 | (0.06 | ) | 0.48 | 0.42 | (0.14 | ) | (0.13 | ) | (0.27 | ) | 8.16 | 5.27 | 27 | 1.00 | (e) | 2.25 | (e) | (0.70 | )(e) | 10 | |||||||||||||||||||||||||||||||||||
Year ended 12/31/16 | 7.89 | 0.12 | 0.36 | 0.48 | (0.25 | ) | (0.11 | ) | (0.36 | ) | 8.01 | 6.03 | 81 | 1.00 | 2.07 | 1.45 | 10 | |||||||||||||||||||||||||||||||||||||||
Year ended 12/31/15 | 8.57 | 0.05 | (0.36 | ) | (0.31 | ) | (0.20 | ) | (0.17 | ) | (0.37 | ) | 7.89 | (3.55 | ) | 168 | 1.00 | 1.86 | 0.64 | 19 | ||||||||||||||||||||||||||||||||||||
Year ended 12/31/14 | 8.76 | 0.03 | 0.19 | 0.22 | (0.21 | ) | (0.20 | ) | (0.41 | ) | 8.57 | 2.55 | 341 | 1.00 | 1.71 | 0.38 | 9 | |||||||||||||||||||||||||||||||||||||||
Year ended 12/31/13 | 8.97 | (0.09 | ) | 0.14 | 0.05 | (0.18 | ) | (0.08 | ) | (0.26 | ) | 8.76 | 0.56 | 480 | 1.00 | 1.60 | (0.97 | ) | 16 | |||||||||||||||||||||||||||||||||||||
Class C | ||||||||||||||||||||||||||||||||||||||||||||||||||||||||
Year ended 12/31/17 | 8.02 | (0.06 | ) | 0.48 | 0.42 | (0.14 | ) | (0.13 | ) | (0.27 | ) | 8.17 | 5.27 | 3,423 | 1.00 | (e) | 2.25 | (e) | (0.70 | )(e) | 10 | |||||||||||||||||||||||||||||||||||
Year ended 12/31/16 | 7.89 | 0.12 | 0.37 | 0.49 | (0.25 | ) | (0.11 | ) | (0.36 | ) | 8.02 | 6.16 | 3,522 | 1.00 | 2.07 | 1.45 | 10 | |||||||||||||||||||||||||||||||||||||||
Year ended 12/31/15 | 8.58 | 0.05 | (0.37 | ) | (0.32 | ) | (0.20 | ) | (0.17 | ) | (0.37 | ) | 7.89 | (3.67 | ) | 3,799 | 1.00 | 1.86 | 0.64 | 19 | ||||||||||||||||||||||||||||||||||||
Year ended 12/31/14 | 8.76 | 0.03 | 0.20 | 0.23 | (0.21 | ) | (0.20 | ) | (0.41 | ) | 8.58 | 2.66 | 4,535 | 1.00 | 1.71 | 0.38 | 9 | |||||||||||||||||||||||||||||||||||||||
Year ended 12/31/13 | 8.98 | (0.09 | ) | 0.13 | 0.04 | (0.18 | ) | (0.08 | ) | (0.26 | ) | 8.76 | 0.45 | 5,084 | 1.00 | 1.60 | (0.97 | ) | 16 | |||||||||||||||||||||||||||||||||||||
Class CX | ||||||||||||||||||||||||||||||||||||||||||||||||||||||||
Year ended 12/31/17 | 8.01 | (0.06 | ) | 0.49 | 0.43 | (0.14 | ) | (0.13 | ) | (0.27 | ) | 8.17 | 5.40 | 1,121 | 1.00 | (e) | 2.25 | (e) | (0.70 | )(e) | 10 | |||||||||||||||||||||||||||||||||||
Year ended 12/31/16 | 7.89 | 0.12 | 0.36 | 0.48 | (0.25 | ) | (0.11 | ) | (0.36 | ) | 8.01 | 6.03 | 1,638 | 1.00 | 2.07 | 1.45 | 10 | |||||||||||||||||||||||||||||||||||||||
Year ended 12/31/15 | 8.57 | 0.05 | (0.36 | ) | (0.31 | ) | (0.20 | ) | (0.17 | ) | (0.37 | ) | 7.89 | (3.55 | ) | 2,281 | 1.00 | 1.86 | 0.64 | 19 | ||||||||||||||||||||||||||||||||||||
Year ended 12/31/14 | 8.76 | 0.03 | 0.20 | 0.23 | (0.22 | ) | (0.20 | ) | (0.42 | ) | 8.57 | 2.55 | 3,088 | 1.00 | 1.71 | 0.38 | 9 | |||||||||||||||||||||||||||||||||||||||
Year ended 12/31/13 | 8.97 | (0.09 | ) | 0.14 | 0.05 | (0.18 | ) | (0.08 | ) | (0.26 | ) | 8.76 | 0.56 | 3,861 | 1.00 | 1.60 | (0.97 | ) | 16 | |||||||||||||||||||||||||||||||||||||
Class R | ||||||||||||||||||||||||||||||||||||||||||||||||||||||||
Year ended 12/31/17 | 8.18 | (0.02 | ) | 0.49 | 0.47 | (0.15 | ) | (0.13 | ) | (0.28 | ) | 8.37 | 5.84 | 1,374 | 0.50 | (e) | 1.75 | (e) | (0.20 | )(e) | 10 | |||||||||||||||||||||||||||||||||||
Year ended 12/31/16 | 8.05 | 0.16 | 0.35 | 0.51 | (0.27 | ) | (0.11 | ) | (0.38 | ) | 8.18 | 6.37 | 1,732 | 0.50 | 1.57 | 1.95 | 10 | |||||||||||||||||||||||||||||||||||||||
Year ended 12/31/15 | 8.72 | 0.10 | (0.37 | ) | (0.27 | ) | (0.23 | ) | (0.17 | ) | (0.40 | ) | 8.05 | (3.08 | ) | 1,442 | 0.50 | 1.36 | 1.14 | 19 | ||||||||||||||||||||||||||||||||||||
Year ended 12/31/14 | 8.88 | 0.08 | 0.19 | 0.27 | (0.23 | ) | (0.20 | ) | (0.43 | ) | 8.72 | 3.02 | 1,656 | 0.50 | 1.21 | 0.88 | 9 | |||||||||||||||||||||||||||||||||||||||
Year ended 12/31/13 | 9.04 | (0.04 | ) | 0.14 | 0.10 | (0.18 | ) | (0.08 | ) | (0.26 | ) | 8.88 | 1.13 | 1,959 | 0.50 | 1.10 | (0.47 | ) | 16 | |||||||||||||||||||||||||||||||||||||
Class RX | ||||||||||||||||||||||||||||||||||||||||||||||||||||||||
Year ended 12/31/17 | 8.17 | (0.02 | ) | 0.49 | 0.47 | (0.15 | ) | (0.13 | ) | (0.28 | ) | 8.36 | 5.84 | 87 | 0.50 | (e) | 1.75 | (e) | (0.20 | )(e) | 10 | |||||||||||||||||||||||||||||||||||
Year ended 12/31/16 | 8.04 | 0.15 | 0.36 | 0.51 | (0.27 | ) | (0.11 | ) | (0.38 | ) | 8.17 | 6.38 | 67 | 0.50 | 1.57 | 1.95 | 10 | |||||||||||||||||||||||||||||||||||||||
Year ended 12/31/15 | 8.71 | 0.10 | (0.37 | ) | (0.27 | ) | (0.23 | ) | (0.17 | ) | (0.40 | ) | 8.04 | (3.09 | ) | 189 | 0.50 | 1.36 | 1.14 | 19 | ||||||||||||||||||||||||||||||||||||
Year ended 12/31/14 | 8.86 | 0.08 | 0.20 | 0.28 | (0.23 | ) | (0.20 | ) | (0.43 | ) | 8.71 | 3.14 | 181 | 0.50 | 1.21 | 0.88 | 9 | |||||||||||||||||||||||||||||||||||||||
Year ended 12/31/13 | 9.04 | (0.04 | ) | 0.13 | 0.09 | (0.19 | ) | (0.08 | ) | (0.27 | ) | 8.86 | 1.03 | 295 | 0.50 | 1.10 | (0.47 | ) | 16 | |||||||||||||||||||||||||||||||||||||
Class Y | ||||||||||||||||||||||||||||||||||||||||||||||||||||||||
Year ended 12/31/17 | 8.33 | 0.03 | 0.51 | 0.54 | (0.17 | ) | (0.13 | ) | (0.30 | ) | 8.57 | 6.51 | 306 | 0.00 | (e) | 1.25 | (e) | 0.30 | (e) | 10 | ||||||||||||||||||||||||||||||||||||
Year ended 12/31/16 | 8.18 | 0.20 | 0.36 | 0.56 | (0.30 | ) | (0.11 | ) | (0.41 | ) | 8.33 | 6.85 | 460 | 0.00 | 1.07 | 2.45 | 10 | |||||||||||||||||||||||||||||||||||||||
Year ended 12/31/15 | 8.84 | 0.14 | (0.38 | ) | (0.24 | ) | (0.25 | ) | (0.17 | ) | (0.42 | ) | 8.18 | (2.64 | ) | 1,442 | 0.00 | 0.86 | 1.64 | 19 | ||||||||||||||||||||||||||||||||||||
Year ended 12/31/14 | 8.96 | 0.13 | 0.19 | 0.32 | (0.24 | ) | (0.20 | ) | (0.44 | ) | 8.84 | 3.61 | 1,695 | 0.00 | 0.71 | 1.38 | 9 | |||||||||||||||||||||||||||||||||||||||
Year ended 12/31/13 | 9.11 | 0.00 | 0.13 | 0.13 | (0.20 | ) | (0.08 | ) | (0.28 | ) | 8.96 | 1.51 | 2,118 | 0.00 | 0.60 | 0.03 | 16 | |||||||||||||||||||||||||||||||||||||||
Class R5 | ||||||||||||||||||||||||||||||||||||||||||||||||||||||||
Year ended 12/31/17 | 8.33 | 0.03 | 0.50 | 0.53 | (0.17 | ) | (0.13 | ) | (0.30 | ) | 8.56 | 6.39 | 124 | 0.00 | (e) | 1.16 | (e) | 0.30 | (e) | 10 | ||||||||||||||||||||||||||||||||||||
Year ended 12/31/16 | 8.18 | 0.20 | 0.36 | 0.56 | (0.30 | ) | (0.11 | ) | (0.41 | ) | 8.33 | 6.85 | 139 | 0.00 | 0.98 | 2.45 | 10 | |||||||||||||||||||||||||||||||||||||||
Year ended 12/31/15 | 8.84 | 0.14 | (0.38 | ) | (0.24 | ) | (0.25 | ) | (0.17 | ) | (0.42 | ) | 8.18 | (2.64 | ) | 3,141 | 0.00 | 0.77 | 1.64 | 19 | ||||||||||||||||||||||||||||||||||||
Year ended 12/31/14 | 8.96 | 0.13 | 0.19 | 0.32 | (0.24 | ) | (0.20 | ) | (0.44 | ) | 8.84 | 3.61 | 9,573 | 0.00 | 0.63 | 1.38 | 9 | |||||||||||||||||||||||||||||||||||||||
Year ended 12/31/13 | 9.10 | 0.00 | 0.14 | 0.14 | (0.20 | ) | (0.08 | ) | (0.28 | ) | 8.96 | 1.63 | 7,802 | 0.00 | 0.54 | 0.03 | 16 | |||||||||||||||||||||||||||||||||||||||
Class R6 | ||||||||||||||||||||||||||||||||||||||||||||||||||||||||
Year ended 12/31/17 | 8.33 | 0.03 | 0.50 | 0.53 | (0.17 | ) | (0.13 | ) | (0.30 | ) | 8.56 | 6.39 | 644 | 0.00 | (e) | 1.10 | (e) | 0.30 | (e) | 10 | ||||||||||||||||||||||||||||||||||||
Year ended 12/31/16 | 8.18 | 0.20 | 0.36 | 0.56 | (0.30 | ) | (0.11 | ) | (0.41 | ) | 8.33 | 6.85 | 574 | 0.00 | 0.93 | 2.45 | 10 | |||||||||||||||||||||||||||||||||||||||
Year ended 12/31/15 | 8.84 | 0.14 | (0.38 | ) | (0.24 | ) | (0.25 | ) | (0.17 | ) | (0.42 | ) | 8.18 | (2.64 | ) | 416 | 0.00 | 0.69 | 1.64 | 19 | ||||||||||||||||||||||||||||||||||||
Year ended 12/31/14 | 8.96 | 0.13 | 0.20 | 0.33 | (0.25 | ) | (0.20 | ) | (0.45 | ) | 8.84 | 3.61 | 328 | 0.00 | 0.54 | 1.38 | 9 | |||||||||||||||||||||||||||||||||||||||
Year ended 12/31/13 | 9.10 | 0.00 | 0.14 | 0.14 | (0.20 | ) | (0.08 | ) | (0.28 | ) | 8.96 | 1.63 | 281 | 0.00 | 0.45 | 0.03 | 16 | |||||||||||||||||||||||||||||||||||||||
| (a) | Calculated using average shares outstanding. |
| (b) | Includes adjustments in accordance with accounting principles generally accepted in the United States of America and as such, the net asset value for financial reporting purposes and the returns based upon those net asset values may differ from the net asset value and returns for shareholder transactions. Does not include sales charges and is not annualized for periods less than one year, if applicable. |
| (c) | In addition to the fees and expenses which the Fund bears directly, the Fund indirectly bears a pro rata share of the fees and expenses of the underlying funds in which the Fund invests. Because the underlying funds have varied expenses and fee levels and the Fund may own different proportions at different times, the amount of fees and expenses incurred indirectly by the Fund will vary. Estimated underlying fund expenses are not expenses that are incurred directly by the Fund. They are expenses that are incurred directly by the underlying funds and are deducted from the value of the funds the Fund invests in. The effect of the estimated underlying fund expenses that the Fund bears indirectly is included in the Fund’s total return. Estimated acquired fund fees from underlying funds were 0.58%, 0.56%, 0.56%, 0.56% and 0.54% for the years ended December 31, 2017, December 31, 2016, December 31, 2015, December 31, 2014 and December 31, 2013, respectively. |
| (d) | Portfolio turnover is calculated at the fund level and is not annualized for periods less than one year, if applicable. |
| (e) | Ratios are based on average daily net assets (000’s omitted) of $10,101, $7,971, $43, $3,578, $1,374, $1,673, $77, $406, $121 and $624 for Class A, Class AX, Class B, Class C, Class CX, Class R, Class RX, Class Y, Class R5 and Class R6 shares, respectively. |
49 Invesco Balanced-Risk Retirement Funds
NOTE 11—Financial Highlights—(continued)
Invesco Balanced-Risk Retirement 2020 Fund
| Net asset value, beginning of period | Net investment income (loss)(a) | Net gains (losses) on securities (both realized and unrealized) | Total from investment operations | Dividends from net investment income | Distributions from net realized gains | Total distributions | Net asset value, end of period | Total return(b) | Net assets, end of period (000’s omitted) | Ratio of expenses to average net assets with fee waivers and/or expense reimbursements(c) | Ratio of expenses to average net assets without fee waivers and/or expense reimbursements | Ratio of net investment income (loss) to average net assets | Portfolio turnover(d) | |||||||||||||||||||||||||||||||||||||||||||
Class A |
| |||||||||||||||||||||||||||||||||||||||||||||||||||||||
Year ended 12/31/17 | $ | 8.69 | $ | (0.00 | ) | $ | 0.63 | $ | 0.63 | $ | (0.27 | ) | $ | — | $ | (0.27 | ) | $ | 9.05 | 7.24 | % | $ | 36,409 | 0.25 | %(e) | 0.88 | %(e) | (0.04 | )%(e) | 6 | % | |||||||||||||||||||||||||
Year ended 12/31/16 | 8.25 | 0.23 | 0.50 | 0.73 | (0.24 | ) | (0.05 | ) | (0.29 | ) | 8.69 | 8.77 | 38,580 | 0.25 | 0.82 | 2.67 | 11 | |||||||||||||||||||||||||||||||||||||||
Year ended 12/31/15 | 9.11 | 0.17 | (0.52 | ) | (0.35 | ) | (0.31 | ) | (0.20 | ) | (0.51 | ) | 8.25 | (3.79 | ) | 38,164 | 0.25 | 0.69 | 1.92 | 12 | ||||||||||||||||||||||||||||||||||||
Year ended 12/31/14 | 9.32 | 0.16 | 0.28 | 0.44 | (0.37 | ) | (0.28 | ) | (0.65 | ) | 9.11 | 4.81 | 47,303 | 0.25 | 0.67 | 1.65 | 7 | |||||||||||||||||||||||||||||||||||||||
Year ended 12/31/13 | 9.51 | (0.02 | ) | 0.21 | 0.19 | (0.31 | ) | (0.07 | ) | (0.38 | ) | 9.32 | 2.01 | 51,352 | 0.25 | 0.66 | (0.24 | ) | 16 | |||||||||||||||||||||||||||||||||||||
Class AX | ||||||||||||||||||||||||||||||||||||||||||||||||||||||||
Year ended 12/31/17 | 8.69 | 0.00 | 0.63 | 0.63 | (0.27 | ) | — | (0.27 | ) | 9.05 | 7.24 | 6,510 | 0.25 | (e) | 0.88 | (e) | (0.04 | )(e) | 6 | |||||||||||||||||||||||||||||||||||||
Year ended 12/31/16 | 8.25 | 0.23 | 0.50 | 0.73 | (0.24 | ) | (0.05 | ) | (0.29 | ) | 8.69 | 8.77 | 7,220 | 0.25 | 0.82 | 2.67 | 11 | |||||||||||||||||||||||||||||||||||||||
Year ended 12/31/15 | 9.10 | 0.17 | (0.51 | ) | (0.34 | ) | (0.31 | ) | (0.20 | ) | (0.51 | ) | 8.25 | (3.69 | ) | 7,802 | 0.25 | 0.69 | 1.92 | 12 | ||||||||||||||||||||||||||||||||||||
Year ended 12/31/14 | 9.31 | 0.16 | 0.28 | 0.44 | (0.37 | ) | (0.28 | ) | (0.65 | ) | 9.10 | 4.81 | 9,609 | 0.25 | 0.67 | 1.65 | 7 | |||||||||||||||||||||||||||||||||||||||
Year ended 12/31/13 | 9.51 | (0.02 | ) | 0.20 | 0.18 | (0.31 | ) | (0.07 | ) | (0.38 | ) | 9.31 | 1.90 | 11,986 | 0.25 | 0.66 | (0.24 | ) | 16 | |||||||||||||||||||||||||||||||||||||
Class B | ||||||||||||||||||||||||||||||||||||||||||||||||||||||||
Year ended 12/31/17 | 8.60 | (0.07 | ) | 0.62 | 0.55 | (0.19 | ) | — | (0.19 | ) | 8.96 | 6.46 | 395 | 1.00 | (e) | 1.63 | (e) | (0.79 | )(e) | 6 | ||||||||||||||||||||||||||||||||||||
Year ended 12/31/16 | 8.16 | 0.16 | 0.50 | 0.66 | (0.17 | ) | (0.05 | ) | (0.22 | ) | 8.60 | 8.00 | 667 | 1.00 | 1.57 | 1.92 | 11 | |||||||||||||||||||||||||||||||||||||||
Year ended 12/31/15 | 9.00 | 0.10 | (0.51 | ) | (0.41 | ) | (0.23 | ) | (0.20 | ) | (0.43 | ) | 8.16 | (4.48 | ) | 1,001 | 1.00 | 1.44 | 1.17 | 12 | ||||||||||||||||||||||||||||||||||||
Year ended 12/31/14 | 9.21 | 0.09 | 0.28 | 0.37 | (0.30 | ) | (0.28 | ) | (0.58 | ) | 9.00 | 4.03 | 1,715 | 1.00 | 1.42 | 0.90 | 7 | |||||||||||||||||||||||||||||||||||||||
Year ended 12/31/13 | 9.40 | (0.09 | ) | 0.20 | 0.11 | (0.23 | ) | (0.07 | ) | (0.30 | ) | 9.21 | 1.19 | 2,425 | 1.00 | 1.41 | (0.99 | ) | 16 | |||||||||||||||||||||||||||||||||||||
Class C | ||||||||||||||||||||||||||||||||||||||||||||||||||||||||
Year ended 12/31/17 | 8.59 | (0.07 | ) | 0.61 | 0.54 | (0.19 | ) | — | (0.19 | ) | 8.94 | 6.35 | 7,345 | 1.00 | (e) | 1.63 | (e) | (0.79 | )(e) | 6 | ||||||||||||||||||||||||||||||||||||
Year ended 12/31/16 | 8.15 | 0.16 | 0.50 | 0.66 | (0.17 | ) | (0.05 | ) | (0.22 | ) | 8.59 | 8.01 | 7,798 | 1.00 | 1.57 | 1.92 | 11 | |||||||||||||||||||||||||||||||||||||||
Year ended 12/31/15 | 8.98 | 0.10 | (0.50 | ) | (0.40 | ) | (0.23 | ) | (0.20 | ) | (0.43 | ) | 8.15 | (4.37 | ) | 8,032 | 1.00 | 1.44 | 1.17 | 12 | ||||||||||||||||||||||||||||||||||||
Year ended 12/31/14 | 9.20 | 0.09 | 0.27 | 0.36 | (0.30 | ) | (0.28 | ) | (0.58 | ) | 8.98 | 3.93 | 9,613 | 1.00 | 1.42 | 0.90 | 7 | |||||||||||||||||||||||||||||||||||||||
Year ended 12/31/13 | 9.38 | (0.09 | ) | 0.21 | 0.12 | (0.23 | ) | (0.07 | ) | (0.30 | ) | 9.20 | 1.29 | 10,108 | 1.00 | 1.41 | (0.99 | ) | 16 | |||||||||||||||||||||||||||||||||||||
Class CX | ||||||||||||||||||||||||||||||||||||||||||||||||||||||||
Year ended 12/31/17 | 8.58 | (0.07 | ) | 0.62 | 0.55 | (0.19 | ) | — | (0.19 | ) | 8.94 | 6.48 | 1,138 | 1.00 | (e) | 1.63 | (e) | (0.79 | )(e) | 6 | ||||||||||||||||||||||||||||||||||||
Year ended 12/31/16 | 8.15 | 0.16 | 0.49 | 0.65 | (0.17 | ) | (0.05 | ) | (0.22 | ) | 8.58 | 7.89 | 1,466 | 1.00 | 1.57 | 1.92 | 11 | |||||||||||||||||||||||||||||||||||||||
Year ended 12/31/15 | 8.99 | 0.10 | (0.51 | ) | (0.41 | ) | (0.23 | ) | (0.20 | ) | (0.43 | ) | 8.15 | (4.48 | ) | 2,124 | 1.00 | 1.44 | 1.17 | 12 | ||||||||||||||||||||||||||||||||||||
Year ended 12/31/14 | 9.20 | 0.09 | 0.28 | 0.37 | (0.30 | ) | (0.28 | ) | (0.58 | ) | 8.99 | 4.04 | 2,677 | 1.00 | 1.42 | 0.90 | 7 | |||||||||||||||||||||||||||||||||||||||
Year ended 12/31/13 | 9.38 | (0.09 | ) | 0.21 | 0.12 | (0.23 | ) | (0.07 | ) | (0.30 | ) | 9.20 | 1.29 | 2,951 | 1.00 | 1.41 | (0.99 | ) | 16 | |||||||||||||||||||||||||||||||||||||
Class R | ||||||||||||||||||||||||||||||||||||||||||||||||||||||||
Year ended 12/31/17 | 8.65 | (0.03 | ) | 0.63 | 0.60 | (0.24 | ) | — | (0.24 | ) | 9.01 | 6.99 | 7,006 | 0.50 | (e) | 1.13 | (e) | (0.29 | )(e) | 6 | ||||||||||||||||||||||||||||||||||||
Year ended 12/31/16 | 8.22 | 0.20 | 0.49 | 0.69 | (0.21 | ) | (0.05 | ) | (0.26 | ) | 8.65 | 8.40 | 7,083 | 0.50 | 1.07 | 2.42 | 11 | |||||||||||||||||||||||||||||||||||||||
Year ended 12/31/15 | 9.07 | 0.15 | (0.51 | ) | (0.36 | ) | (0.29 | ) | (0.20 | ) | (0.49 | ) | 8.22 | (3.98 | ) | 6,047 | 0.50 | 0.94 | 1.67 | 12 | ||||||||||||||||||||||||||||||||||||
Year ended 12/31/14 | 9.28 | 0.13 | 0.29 | 0.42 | (0.35 | ) | (0.28 | ) | (0.63 | ) | 9.07 | 4.55 | 7,564 | 0.50 | 0.92 | 1.40 | 7 | |||||||||||||||||||||||||||||||||||||||
Year ended 12/31/13 | 9.47 | (0.05 | ) | 0.22 | 0.17 | (0.29 | ) | (0.07 | ) | (0.36 | ) | 9.28 | 1.73 | 10,375 | 0.50 | 0.91 | (0.49 | ) | 16 | |||||||||||||||||||||||||||||||||||||
Class RX | ||||||||||||||||||||||||||||||||||||||||||||||||||||||||
Year ended 12/31/17 | 8.66 | (0.03 | ) | 0.62 | 0.59 | (0.24 | ) | — | (0.24 | ) | 9.01 | 6.87 | 423 | 0.50 | (e) | 1.13 | (e) | (0.29 | )(e) | 6 | ||||||||||||||||||||||||||||||||||||
Year ended 12/31/16 | 8.22 | 0.21 | 0.49 | 0.70 | (0.21 | ) | (0.05 | ) | (0.26 | ) | 8.66 | 8.52 | 419 | 0.50 | 1.07 | 2.42 | 11 | |||||||||||||||||||||||||||||||||||||||
Year ended 12/31/15 | 9.07 | 0.15 | (0.51 | ) | (0.36 | ) | (0.29 | ) | (0.20 | ) | (0.49 | ) | 8.22 | (3.98 | ) | 545 | 0.50 | 0.94 | 1.67 | 12 | ||||||||||||||||||||||||||||||||||||
Year ended 12/31/14 | 9.28 | 0.13 | 0.29 | 0.42 | (0.35 | ) | (0.28 | ) | (0.63 | ) | 9.07 | 4.55 | 848 | 0.50 | 0.92 | 1.40 | 7 | |||||||||||||||||||||||||||||||||||||||
Year ended 12/31/13 | 9.47 | (0.05 | ) | 0.22 | 0.17 | (0.29 | ) | (0.07 | ) | (0.36 | ) | 9.28 | 1.73 | 1,282 | 0.50 | 0.91 | (0.49 | ) | 16 | |||||||||||||||||||||||||||||||||||||
Class Y | ||||||||||||||||||||||||||||||||||||||||||||||||||||||||
Year ended 12/31/17 | 8.68 | 0.02 | 0.63 | 0.65 | (0.29 | ) | — | (0.29 | ) | 9.04 | 7.52 | 1,921 | 0.00 | (e) | 0.63 | (e) | 0.21 | (e) | 6 | |||||||||||||||||||||||||||||||||||||
Year ended 12/31/16 | 8.25 | 0.25 | 0.49 | 0.74 | (0.26 | ) | (0.05 | ) | (0.31 | ) | 8.68 | 8.92 | 3,583 | 0.00 | 0.57 | 2.92 | 11 | |||||||||||||||||||||||||||||||||||||||
Year ended 12/31/15 | 9.10 | 0.20 | (0.51 | ) | (0.31 | ) | (0.34 | ) | (0.20 | ) | (0.54 | ) | 8.25 | (3.40 | ) | 5,502 | 0.00 | 0.44 | 2.17 | 12 | ||||||||||||||||||||||||||||||||||||
Year ended 12/31/14 | 9.31 | 0.18 | 0.29 | 0.47 | (0.40 | ) | (0.28 | ) | (0.68 | ) | 9.10 | 5.09 | 7,416 | 0.00 | 0.42 | 1.90 | 7 | |||||||||||||||||||||||||||||||||||||||
Year ended 12/31/13 | 9.51 | 0.00 | 0.21 | 0.21 | (0.34 | ) | (0.07 | ) | (0.41 | ) | 9.31 | 2.16 | 8,497 | 0.00 | 0.41 | 0.01 | 16 | |||||||||||||||||||||||||||||||||||||||
Class R5 | ||||||||||||||||||||||||||||||||||||||||||||||||||||||||
Year ended 12/31/17 | 8.73 | 0.02 | 0.63 | 0.65 | (0.29 | ) | — | (0.29 | ) | 9.09 | 7.48 | 728 | 0.00 | (e) | 0.54 | (e) | 0.21 | (e) | 6 | |||||||||||||||||||||||||||||||||||||
Year ended 12/31/16 | 8.29 | 0.24 | 0.51 | 0.75 | (0.26 | ) | (0.05 | ) | (0.31 | ) | 8.73 | 9.00 | 1,194 | 0.00 | 0.47 | 2.92 | 11 | |||||||||||||||||||||||||||||||||||||||
Year ended 12/31/15 | 9.15 | 0.20 | (0.52 | ) | (0.32 | ) | (0.34 | ) | (0.20 | ) | (0.54 | ) | 8.29 | (3.50 | ) | 27,809 | 0.00 | 0.34 | 2.17 | 12 | ||||||||||||||||||||||||||||||||||||
Year ended 12/31/14 | 9.36 | 0.18 | 0.29 | 0.47 | (0.40 | ) | (0.28 | ) | (0.68 | ) | 9.15 | 5.07 | 36,230 | 0.00 | 0.31 | 1.90 | 7 | |||||||||||||||||||||||||||||||||||||||
Year ended 12/31/13 | 9.55 | 0.00 | 0.22 | 0.22 | (0.34 | ) | (0.07 | ) | (0.41 | ) | 9.36 | 2.26 | 32,091 | 0.00 | 0.32 | 0.01 | 16 | |||||||||||||||||||||||||||||||||||||||
Class R6 | ||||||||||||||||||||||||||||||||||||||||||||||||||||||||
Year ended 12/31/17 | 8.74 | 0.02 | 0.63 | 0.65 | (0.29 | ) | — | (0.29 | ) | 9.10 | 7.47 | 3,014 | 0.00 | (e) | 0.45 | (e) | 0.21 | (e) | 6 | |||||||||||||||||||||||||||||||||||||
Year ended 12/31/16 | 8.30 | 0.26 | 0.49 | 0.75 | (0.26 | ) | (0.05 | ) | (0.31 | ) | 8.74 | 8.99 | 1,545 | 0.00 | 0.38 | 2.92 | 11 | |||||||||||||||||||||||||||||||||||||||
Year ended 12/31/15 | 9.16 | 0.20 | (0.52 | ) | (0.32 | ) | (0.34 | ) | (0.20 | ) | (0.54 | ) | 8.30 | (3.49 | ) | 1,303 | 0.00 | 0.24 | 2.17 | 12 | ||||||||||||||||||||||||||||||||||||
Year ended 12/31/14 | 9.37 | 0.18 | 0.29 | 0.47 | (0.40 | ) | (0.28 | ) | (0.68 | ) | 9.16 | 5.06 | 1,136 | 0.00 | 0.22 | 1.90 | 7 | |||||||||||||||||||||||||||||||||||||||
Year ended 12/31/13 | 9.56 | 0.00 | 0.22 | 0.22 | (0.34 | ) | (0.07 | ) | (0.41 | ) | 9.37 | 2.25 | 901 | 0.00 | 0.23 | 0.01 | 16 | |||||||||||||||||||||||||||||||||||||||
| (a) | Calculated using average shares outstanding. |
| (b) | Includes adjustments in accordance with accounting principles generally accepted in the United States of America and as such, the net asset value for financial reporting purposes and the returns based upon those net asset values may differ from the net asset value and returns for shareholder transactions. Does not include sales charges and is not annualized for periods less than one year, if applicable. |
| (c) | In addition to the fees and expenses which the Fund bears directly, the Fund indirectly bears a pro rata share of the fees and expenses of the underlying funds in which the Fund invests. Because the underlying funds have varied expenses and fee levels and the Fund may own different proportions at different times, the amount of fees and expenses incurred indirectly by the Fund will vary. Estimated underlying fund expenses are not expenses that are incurred directly by the Fund. They are expenses that are incurred directly by the underlying funds and are deducted from the value of the funds the Fund invests in. The effect of the estimated underlying fund expenses that the Fund bears indirectly is included in the Fund’s total return. Estimated acquired fund fees from underlying funds were 0.60%, 0.66%, 0.70%, 0.73% and 0.71% for the years ended December 31, 2017, December 31, 2016, December 31, 2015, December 31, 2014 and December 31, 2013, respectively. |
| (d) | Portfolio turnover is calculated at the fund level and is not annualized for periods less than one year, if applicable. |
| (e) | Ratios are based on average daily net assets (000’s omitted) of $37,109, $6,758, $529, $7,707, $1,261, $7,235, $415, $2,919, $624 and $1,937 for Class A, Class AX, Class B, Class C, Class CX, Class R, Class RX, Class Y, Class R5 and Class R6 shares, respectively. |
50 Invesco Balanced-Risk Retirement Funds
NOTE 11—Financial Highlights—(continued)
Invesco Balanced-Risk Retirement 2030 Fund
| Net asset value, beginning of period | Net investment income (loss)(a) | Net gains (losses) on securities (both realized and unrealized) | Total from investment operations | Dividends from net investment income | Distributions from net realized gains | Total distributions | Net asset value, end of period | Total return(b) | Net assets, end of period (000’s omitted) | Ratio of expenses to average net assets with fee waivers and/or expense reimbursements(c) | Ratio of expenses to average net assets without fee waivers and/or expense reimbursements | Ratio of net investment income (loss) to average net assets | Portfolio turnover(d) | |||||||||||||||||||||||||||||||||||||||||||
Class A |
| |||||||||||||||||||||||||||||||||||||||||||||||||||||||
Year ended 12/31/17 | $ | 8.14 | $ | (0.02 | ) | $ | 0.85 | $ | 0.83 | $ | (0.26 | ) | $ | — | $ | (0.26 | ) | $ | 8.71 | 10.20 | % | $ | 41,546 | 0.25 | %(e) | 0.85 | %(e) | (0.25 | )%(e) | 9 | % | |||||||||||||||||||||||||
Year ended 12/31/16 | 7.67 | 0.32 | 0.61 | 0.93 | (0.40 | ) | (0.06 | ) | (0.46 | ) | 8.14 | 12.09 | 43,528 | 0.25 | 0.81 | 3.86 | 11 | |||||||||||||||||||||||||||||||||||||||
Year ended 12/31/15 | 8.79 | 0.24 | (0.69 | ) | (0.45 | ) | (0.40 | ) | (0.27 | ) | (0.67 | ) | 7.67 | (5.03 | ) | 40,600 | 0.25 | 0.69 | 2.74 | 17 | ||||||||||||||||||||||||||||||||||||
Year ended 12/31/14 | 9.04 | 0.24 | 0.31 | 0.55 | (0.50 | ) | (0.30 | ) | (0.80 | ) | 8.79 | 6.25 | 49,929 | 0.25 | 0.68 | 2.57 | 9 | |||||||||||||||||||||||||||||||||||||||
Year ended 12/31/13 | 9.23 | (0.02 | ) | 0.23 | 0.21 | (0.32 | ) | (0.08 | ) | (0.40 | ) | 9.04 | 2.28 | 51,749 | 0.25 | 0.68 | (0.25 | ) | 34 | |||||||||||||||||||||||||||||||||||||
Class AX | ||||||||||||||||||||||||||||||||||||||||||||||||||||||||
Year ended 12/31/17 | 8.14 | (0.02 | ) | 0.86 | 0.84 | (0.26 | ) | — | (0.26 | ) | 8.72 | 10.33 | 4,629 | 0.25 | (e) | 0.85 | (e) | (0.25 | )(e) | 9 | ||||||||||||||||||||||||||||||||||||
Year ended 12/31/16 | 7.69 | 0.31 | 0.60 | 0.91 | (0.40 | ) | (0.06 | ) | (0.46 | ) | 8.14 | 11.80 | 5,545 | 0.25 | 0.81 | 3.86 | 11 | |||||||||||||||||||||||||||||||||||||||
Year ended 12/31/15 | 8.80 | 0.24 | (0.68 | ) | (0.44 | ) | (0.40 | ) | (0.27 | ) | (0.67 | ) | 7.69 | (4.90 | ) | 5,767 | 0.25 | 0.69 | 2.74 | 17 | ||||||||||||||||||||||||||||||||||||
Year ended 12/31/14 | 9.04 | 0.24 | 0.32 | 0.56 | (0.50 | ) | (0.30 | ) | (0.80 | ) | 8.80 | 6.36 | 6,697 | 0.25 | 0.68 | 2.57 | 9 | |||||||||||||||||||||||||||||||||||||||
Year ended 12/31/13 | 9.23 | (0.02 | ) | 0.23 | 0.21 | (0.32 | ) | (0.08 | ) | (0.40 | ) | 9.04 | 2.27 | 8,353 | 0.25 | 0.68 | (0.25 | ) | 34 | |||||||||||||||||||||||||||||||||||||
Class B | ||||||||||||||||||||||||||||||||||||||||||||||||||||||||
Year ended 12/31/17 | 8.06 | (0.08 | ) | 0.84 | 0.76 | (0.19 | ) | — | (0.19 | ) | 8.63 | 9.47 | 311 | 1.00 | (e) | 1.60 | (e) | (1.00 | )(e) | 9 | ||||||||||||||||||||||||||||||||||||
Year ended 12/31/16 | 7.59 | 0.25 | 0.61 | 0.86 | (0.33 | ) | (0.06 | ) | (0.39 | ) | 8.06 | 11.32 | 1,040 | 1.00 | 1.56 | 3.11 | 11 | |||||||||||||||||||||||||||||||||||||||
Year ended 12/31/15 | 8.70 | 0.17 | (0.68 | ) | (0.51 | ) | (0.33 | ) | (0.27 | ) | (0.60 | ) | 7.59 | (5.77 | ) | 1,502 | 1.00 | 1.44 | 1.99 | 17 | ||||||||||||||||||||||||||||||||||||
Year ended 12/31/14 | 8.95 | 0.17 | 0.31 | 0.48 | (0.43 | ) | (0.30 | ) | (0.73 | ) | 8.70 | 5.51 | 2,157 | 1.00 | 1.43 | 1.82 | 9 | |||||||||||||||||||||||||||||||||||||||
Year ended 12/31/13 | 9.14 | (0.09 | ) | 0.23 | 0.14 | (0.25 | ) | (0.08 | ) | (0.33 | ) | 8.95 | 1.52 | 2,759 | 1.00 | 1.43 | (1.00 | ) | 34 | |||||||||||||||||||||||||||||||||||||
Class C | ||||||||||||||||||||||||||||||||||||||||||||||||||||||||
Year ended 12/31/17 | 8.06 | (0.08 | ) | 0.83 | 0.75 | (0.19 | ) | — | (0.19 | ) | 8.62 | 9.34 | 11,936 | 1.00 | (e) | 1.60 | (e) | (1.00 | )(e) | 9 | ||||||||||||||||||||||||||||||||||||
Year ended 12/31/16 | 7.59 | 0.25 | 0.61 | 0.86 | (0.33 | ) | (0.06 | ) | (0.39 | ) | 8.06 | 11.33 | 11,502 | 1.00 | 1.56 | 3.11 | 11 | |||||||||||||||||||||||||||||||||||||||
Year ended 12/31/15 | 8.69 | 0.17 | (0.67 | ) | (0.50 | ) | (0.33 | ) | (0.27 | ) | (0.60 | ) | 7.59 | (5.66 | ) | 12,119 | 1.00 | 1.44 | 1.99 | 17 | ||||||||||||||||||||||||||||||||||||
Year ended 12/31/14 | 8.95 | 0.17 | 0.30 | 0.47 | (0.43 | ) | (0.30 | ) | (0.73 | ) | 8.69 | 5.39 | 13,330 | 1.00 | 1.43 | 1.82 | 9 | |||||||||||||||||||||||||||||||||||||||
Year ended 12/31/13 | 9.13 | (0.09 | ) | 0.24 | 0.15 | (0.25 | ) | (0.08 | ) | (0.33 | ) | 8.95 | 1.64 | 12,050 | 1.00 | 1.43 | (1.00 | ) | 34 | |||||||||||||||||||||||||||||||||||||
Class CX | ||||||||||||||||||||||||||||||||||||||||||||||||||||||||
Year ended 12/31/17 | 8.06 | (0.08 | ) | 0.84 | 0.76 | (0.19 | ) | — | (0.19 | ) | 8.63 | 9.47 | 724 | 1.00 | (e) | 1.60 | (e) | (1.00 | )(e) | 9 | ||||||||||||||||||||||||||||||||||||
Year ended 12/31/16 | 7.59 | 0.25 | 0.61 | 0.86 | (0.33 | ) | (0.06 | ) | (0.39 | ) | 8.06 | 11.33 | 801 | 1.00 | 1.56 | 3.11 | 11 | |||||||||||||||||||||||||||||||||||||||
Year ended 12/31/15 | 8.69 | 0.17 | (0.67 | ) | (0.50 | ) | (0.33 | ) | (0.27 | ) | (0.60 | ) | 7.59 | (5.66 | ) | 1,111 | 1.00 | 1.44 | 1.99 | 17 | ||||||||||||||||||||||||||||||||||||
Year ended 12/31/14 | 8.95 | 0.17 | 0.30 | 0.47 | (0.43 | ) | (0.30 | ) | (0.73 | ) | 8.69 | 5.39 | 1,732 | 1.00 | 1.43 | 1.82 | 9 | |||||||||||||||||||||||||||||||||||||||
Year ended 12/31/13 | 9.13 | (0.09 | ) | 0.24 | 0.15 | (0.25 | ) | (0.08 | ) | (0.33 | ) | 8.95 | 1.64 | 1,821 | 1.00 | 1.43 | (1.00 | ) | 34 | |||||||||||||||||||||||||||||||||||||
Class R | ||||||||||||||||||||||||||||||||||||||||||||||||||||||||
Year ended 12/31/17 | 8.10 | (0.04 | ) | 0.84 | 0.80 | (0.23 | ) | — | (0.23 | ) | 8.67 | 9.97 | 8,538 | 0.50 | (e) | 1.10 | (e) | (0.50 | )(e) | 9 | ||||||||||||||||||||||||||||||||||||
Year ended 12/31/16 | 7.63 | 0.29 | 0.61 | 0.90 | (0.37 | ) | (0.06 | ) | (0.43 | ) | 8.10 | 11.85 | 8,693 | 0.50 | 1.06 | 3.61 | 11 | |||||||||||||||||||||||||||||||||||||||
Year ended 12/31/15 | 8.74 | 0.22 | (0.68 | ) | (0.46 | ) | (0.38 | ) | (0.27 | ) | (0.65 | ) | 7.63 | (5.21 | ) | 9,435 | 0.50 | 0.94 | 2.49 | 17 | ||||||||||||||||||||||||||||||||||||
Year ended 12/31/14 | 8.99 | 0.22 | 0.31 | 0.53 | (0.48 | ) | (0.30 | ) | (0.78 | ) | 8.74 | 6.02 | 11,531 | 0.50 | 0.93 | 2.32 | 9 | |||||||||||||||||||||||||||||||||||||||
Year ended 12/31/13 | 9.18 | (0.05 | ) | 0.24 | 0.19 | (0.30 | ) | (0.08 | ) | (0.38 | ) | 8.99 | 2.03 | 13,007 | 0.50 | 0.93 | (0.50 | ) | 34 | |||||||||||||||||||||||||||||||||||||
Class RX | ||||||||||||||||||||||||||||||||||||||||||||||||||||||||
Year ended 12/31/17 | 8.09 | (0.04 | ) | 0.84 | 0.80 | (0.23 | ) | — | (0.23 | ) | 8.66 | 9.99 | 561 | 0.50 | (e) | 1.10 | (e) | (0.50 | )(e) | 9 | ||||||||||||||||||||||||||||||||||||
Year ended 12/31/16 | 7.63 | 0.29 | 0.60 | 0.89 | (0.37 | ) | (0.06 | ) | (0.43 | ) | 8.09 | 11.72 | 480 | 0.50 | 1.06 | 3.61 | 11 | |||||||||||||||||||||||||||||||||||||||
Year ended 12/31/15 | 8.73 | 0.22 | (0.67 | ) | (0.45 | ) | (0.38 | ) | (0.27 | ) | (0.65 | ) | 7.63 | (5.09 | ) | 1,162 | 0.50 | 0.94 | 2.49 | 17 | ||||||||||||||||||||||||||||||||||||
Year ended 12/31/14 | 8.99 | 0.22 | 0.30 | 0.52 | (0.48 | ) | (0.30 | ) | (0.78 | ) | 8.73 | 5.89 | 1,139 | 0.50 | 0.93 | 2.32 | 9 | |||||||||||||||||||||||||||||||||||||||
Year ended 12/31/13 | 9.18 | (0.05 | ) | 0.24 | 0.19 | (0.30 | ) | (0.08 | ) | (0.38 | ) | 8.99 | 2.04 | 1,119 | 0.50 | 0.93 | (0.50 | ) | 34 | |||||||||||||||||||||||||||||||||||||
Class Y | ||||||||||||||||||||||||||||||||||||||||||||||||||||||||
Year ended 12/31/17 | 8.16 | 0.00 | 0.85 | 0.85 | (0.28 | ) | — | (0.28 | ) | 8.73 | 10.46 | 890 | 0.00 | (e) | 0.60 | (e) | 0.00 | (e) | 9 | |||||||||||||||||||||||||||||||||||||
Year ended 12/31/16 | 7.69 | 0.34 | 0.61 | 0.95 | (0.42 | ) | (0.06 | ) | (0.48 | ) | 8.16 | 12.35 | 3,374 | 0.00 | 0.56 | 4.11 | 11 | |||||||||||||||||||||||||||||||||||||||
Year ended 12/31/15 | 8.81 | 0.26 | (0.68 | ) | (0.42 | ) | (0.43 | ) | (0.27 | ) | (0.70 | ) | 7.69 | (4.75 | ) | 5,018 | 0.00 | 0.44 | 2.99 | 17 | ||||||||||||||||||||||||||||||||||||
Year ended 12/31/14 | 9.06 | 0.27 | 0.31 | 0.58 | (0.53 | ) | (0.30 | ) | (0.83 | ) | 8.81 | 6.51 | 5,730 | 0.00 | 0.43 | 2.82 | 9 | |||||||||||||||||||||||||||||||||||||||
Year ended 12/31/13 | 9.25 | 0.00 | 0.23 | 0.23 | (0.34 | ) | (0.08 | ) | (0.42 | ) | 9.06 | 2.52 | 5,406 | 0.00 | 0.43 | 0.00 | 34 | |||||||||||||||||||||||||||||||||||||||
Class R5 | ||||||||||||||||||||||||||||||||||||||||||||||||||||||||
Year ended 12/31/17 | 8.18 | 0.00 | 0.86 | 0.86 | (0.28 | ) | — | (0.28 | ) | 8.76 | 10.55 | 761 | 0.00 | (e) | 0.49 | (e) | 0.00 | (e) | 9 | |||||||||||||||||||||||||||||||||||||
Year ended 12/31/16 | 7.71 | 0.32 | 0.63 | 0.95 | (0.42 | ) | (0.06 | ) | (0.48 | ) | 8.18 | 12.31 | 2,953 | 0.00 | 0.44 | 4.11 | 11 | |||||||||||||||||||||||||||||||||||||||
Year ended 12/31/15 | 8.83 | 0.26 | (0.68 | ) | (0.42 | ) | (0.43 | ) | (0.27 | ) | (0.70 | ) | 7.71 | (4.74 | ) | 28,098 | 0.00 | 0.32 | 2.99 | 17 | ||||||||||||||||||||||||||||||||||||
Year ended 12/31/14 | 9.08 | 0.27 | 0.31 | 0.58 | (0.53 | ) | (0.30 | ) | (0.83 | ) | 8.83 | 6.50 | 41,595 | 0.00 | 0.30 | 2.82 | 9 | |||||||||||||||||||||||||||||||||||||||
Year ended 12/31/13 | 9.27 | 0.00 | 0.23 | 0.23 | (0.34 | ) | (0.08 | ) | (0.42 | ) | 9.08 | 2.52 | 35,104 | 0.00 | 0.33 | 0.00 | 34 | |||||||||||||||||||||||||||||||||||||||
Class R6 | ||||||||||||||||||||||||||||||||||||||||||||||||||||||||
Year ended 12/31/17 | 8.18 | 0.00 | 0.85 | 0.85 | (0.28 | ) | — | (0.28 | ) | 8.75 | 10.43 | 3,128 | 0.00 | (e) | 0.41 | (e) | 0.00 | (e) | 9 | |||||||||||||||||||||||||||||||||||||
Year ended 12/31/16 | 7.71 | 0.34 | 0.61 | 0.95 | (0.42 | ) | (0.06 | ) | (0.48 | ) | 8.18 | 12.31 | 2,109 | 0.00 | 0.35 | 4.11 | 11 | |||||||||||||||||||||||||||||||||||||||
Year ended 12/31/15 | 8.83 | 0.26 | (0.68 | ) | (0.42 | ) | (0.43 | ) | (0.27 | ) | (0.70 | ) | 7.71 | (4.74 | ) | 1,576 | 0.00 | 0.23 | 2.99 | 17 | ||||||||||||||||||||||||||||||||||||
Year ended 12/31/14 | 9.08 | 0.27 | 0.31 | 0.58 | (0.53 | ) | (0.30 | ) | (0.83 | ) | 8.83 | 6.50 | 1,250 | 0.00 | 0.21 | 2.82 | 9 | |||||||||||||||||||||||||||||||||||||||
Year ended 12/31/13 | 9.27 | 0.00 | 0.23 | 0.23 | (0.34 | ) | (0.08 | ) | (0.42 | ) | 9.08 | 2.52 | 905 | 0.00 | 0.24 | 0.00 | 34 | |||||||||||||||||||||||||||||||||||||||
| (a) | Calculated using average shares outstanding. |
| (b) | Includes adjustments in accordance with accounting principles generally accepted in the United States of America and as such, the net asset value for financial reporting purposes and the returns based upon those net asset values may differ from the net asset value and returns for shareholder transactions. Does not include sales charges and is not annualized for periods less than one year, if applicable. |
| (c) | In addition to the fees and expenses which the Fund bears directly, the Fund indirectly bears a pro rata share of the fees and expenses of the underlying funds in which the Fund invests. Because the underlying funds have varied expenses and fee levels and the Fund may own different proportions at different times, the amount of fees and expenses incurred indirectly by the Fund will vary. Estimated underlying fund expenses are not expenses that are incurred directly by the Fund. They are expenses that are incurred directly by the underlying funds and are deducted from the value of the funds the Fund invests in. The effect of the estimated underlying fund expenses that the Fund bears indirectly is included in the Fund’s total return. Estimated acquired fund fees from underlying funds were 0.86%, 0.83%, 0.88%, 0.89% and 0.87% for the years ended December 31, 2017, December 31, 2016, December 31, 2015, December 31, 2014 and December 31, 2013, respectively. |
| (d) | Portfolio turnover is calculated at the fund level and is not annualized for periods less than one year, if applicable. |
| (e) | Ratios are based on average daily net assets (000’s omitted) of $42,350, $5,007, $615, $11,447, $763, $8,504, $511, $2,259, $1,009 and $2,536 for Class A, Class AX, Class B, Class C, Class CX, Class R, Class RX, Class Y, Class R5 and Class R6 shares, respectively. |
51 Invesco Balanced-Risk Retirement Funds
NOTE 11—Financial Highlights—(continued)
Invesco Balanced-Risk Retirement 2040 Fund
| Net asset value, beginning of period | Net investment income (loss)(a) | Net gains (losses) on securities (both realized and unrealized) | Total from investment operations | Dividends from net investment income | Distributions from net realized gains | Total distributions | Net asset value, end of period | Total return(b) | Net assets, end of period (000’s omitted) | Ratio of expenses to average net assets with fee waivers and/or expense reimbursements(c) | Ratio of expenses to average net assets without fee waivers and/or expense reimbursements | Ratio of net investment income (loss) to average net assets | Portfolio turnover(d) | |||||||||||||||||||||||||||||||||||||||||||
Class A |
| |||||||||||||||||||||||||||||||||||||||||||||||||||||||
Year ended 12/31/17 | $ | 7.39 | $ | (0.02 | ) | $ | 0.88 | $ | 0.86 | $ | (0.31 | ) | $ | — | $ | (0.31 | ) | $ | 7.94 | 11.78 | % | $ | 32,004 | 0.25 | %(e) | 1.07 | %(e) | (0.25 | )%(e) | 17 | % | |||||||||||||||||||||||||
Year ended 12/31/16 | 6.91 | 0.38 | 0.59 | 0.97 | (0.37 | ) | (0.12 | ) | (0.49 | ) | 7.39 | 14.07 | 30,678 | 0.25 | 1.06 | 5.06 | 13 | |||||||||||||||||||||||||||||||||||||||
Year ended 12/31/15 | 8.07 | 0.27 | (0.74 | ) | (0.47 | ) | (0.45 | ) | (0.24 | ) | (0.69 | ) | 6.91 | (5.74 | ) | 27,131 | 0.25 | 0.85 | 3.32 | 28 | ||||||||||||||||||||||||||||||||||||
Year ended 12/31/14 | 8.34 | 0.31 | 0.29 | 0.60 | (0.59 | ) | (0.28 | ) | (0.87 | ) | 8.07 | 7.35 | 35,495 | 0.26 | 0.86 | 3.53 | 8 | |||||||||||||||||||||||||||||||||||||||
Year ended 12/31/13 | 8.76 | (0.02 | ) | 0.21 | 0.19 | (0.22 | ) | (0.39 | ) | (0.61 | ) | 8.34 | 2.23 | 33,816 | 0.25 | 0.87 | (0.25 | ) | 68 | |||||||||||||||||||||||||||||||||||||
Class AX | ||||||||||||||||||||||||||||||||||||||||||||||||||||||||
Year ended 12/31/17 | 7.38 | (0.02 | ) | 0.89 | 0.87 | (0.32 | ) | — | (0.32 | ) | 7.93 | 11.79 | 2,587 | 0.25 | (e) | 1.07 | (e) | (0.25 | )(e) | 17 | ||||||||||||||||||||||||||||||||||||
Year ended 12/31/16 | 6.90 | 0.38 | 0.59 | 0.97 | (0.37 | ) | (0.12 | ) | (0.49 | ) | 7.38 | 14.09 | 2,815 | 0.25 | 1.06 | 5.06 | 13 | |||||||||||||||||||||||||||||||||||||||
Year ended 12/31/15 | 8.06 | 0.27 | (0.74 | ) | (0.47 | ) | (0.45 | ) | (0.24 | ) | (0.69 | ) | 6.90 | (5.76 | ) | 2,851 | 0.25 | 0.85 | 3.32 | 28 | ||||||||||||||||||||||||||||||||||||
Year ended 12/31/14 | 8.34 | 0.31 | 0.28 | 0.59 | (0.59 | ) | (0.28 | ) | (0.87 | ) | 8.06 | 7.23 | 3,284 | 0.26 | 0.86 | 3.53 | 8 | |||||||||||||||||||||||||||||||||||||||
Year ended 12/31/13 | 8.75 | (0.02 | ) | 0.22 | 0.20 | (0.22 | ) | (0.39 | ) | (0.61 | ) | 8.34 | 2.34 | 3,493 | 0.25 | 0.87 | (0.25 | ) | 68 | |||||||||||||||||||||||||||||||||||||
Class B | ||||||||||||||||||||||||||||||||||||||||||||||||||||||||
Year ended 12/31/17 | 7.32 | (0.07 | ) | 0.87 | 0.80 | (0.26 | ) | — | (0.26 | ) | 7.86 | 10.93 | 236 | 1.00 | (e) | 1.82 | (e) | (1.00 | )(e) | 17 | ||||||||||||||||||||||||||||||||||||
Year ended 12/31/16 | 6.83 | 0.32 | 0.60 | 0.92 | (0.31 | ) | (0.12 | ) | (0.43 | ) | 7.32 | 13.52 | 401 | 1.00 | 1.81 | 4.31 | 13 | |||||||||||||||||||||||||||||||||||||||
Year ended 12/31/15 | 7.97 | 0.20 | (0.72 | ) | (0.52 | ) | (0.38 | ) | (0.24 | ) | (0.62 | ) | 6.83 | (6.39 | ) | 559 | 1.00 | 1.60 | 2.57 | 28 | ||||||||||||||||||||||||||||||||||||
Year ended 12/31/14 | 8.26 | 0.24 | 0.28 | 0.52 | (0.53 | ) | (0.28 | ) | (0.81 | ) | 7.97 | 6.38 | 925 | 1.01 | 1.61 | 2.78 | 8 | |||||||||||||||||||||||||||||||||||||||
Year ended 12/31/13 | 8.67 | (0.09 | ) | 0.22 | 0.13 | (0.15 | ) | (0.39 | ) | (0.54 | ) | 8.26 | 1.54 | 1,109 | 1.00 | 1.62 | (1.00 | ) | 68 | |||||||||||||||||||||||||||||||||||||
Class C | ||||||||||||||||||||||||||||||||||||||||||||||||||||||||
Year ended 12/31/17 | 7.31 | (0.07 | ) | 0.87 | 0.80 | (0.26 | ) | — | (0.26 | ) | 7.85 | 10.95 | 6,369 | 1.00 | (e) | 1.82 | (e) | (1.00 | )(e) | 17 | ||||||||||||||||||||||||||||||||||||
Year ended 12/31/16 | 6.82 | 0.32 | 0.60 | 0.92 | (0.31 | ) | (0.12 | ) | (0.43 | ) | 7.31 | 13.54 | 5,820 | 1.00 | 1.81 | 4.31 | 13 | |||||||||||||||||||||||||||||||||||||||
Year ended 12/31/15 | 7.96 | 0.20 | (0.72 | ) | (0.52 | ) | (0.38 | ) | (0.24 | ) | (0.62 | ) | 6.82 | (6.39 | ) | 5,382 | 1.00 | 1.60 | 2.57 | 28 | ||||||||||||||||||||||||||||||||||||
Year ended 12/31/14 | 8.25 | 0.24 | 0.28 | 0.52 | (0.53 | ) | (0.28 | ) | (0.81 | ) | 7.96 | 6.39 | 6,249 | 1.01 | 1.61 | 2.78 | 8 | |||||||||||||||||||||||||||||||||||||||
Year ended 12/31/13 | 8.66 | (0.09 | ) | 0.22 | 0.13 | (0.15 | ) | (0.39 | ) | (0.54 | ) | 8.25 | 1.54 | 5,999 | 1.00 | 1.62 | (1.00 | ) | 68 | |||||||||||||||||||||||||||||||||||||
Class CX | ||||||||||||||||||||||||||||||||||||||||||||||||||||||||
Year ended 12/31/17 | 7.30 | (0.08 | ) | 0.88 | 0.80 | (0.26 | ) | — | (0.26 | ) | 7.84 | 10.96 | 213 | 1.00 | (e) | 1.82 | (e) | (1.00 | )(e) | 17 | ||||||||||||||||||||||||||||||||||||
Year ended 12/31/16 | 6.81 | 0.32 | 0.60 | 0.92 | (0.31 | ) | (0.12 | ) | (0.43 | ) | 7.30 | 13.56 | 291 | 1.00 | 1.81 | 4.31 | 13 | |||||||||||||||||||||||||||||||||||||||
Year ended 12/31/15 | 7.95 | 0.20 | (0.72 | ) | (0.52 | ) | (0.38 | ) | (0.24 | ) | (0.62 | ) | 6.81 | (6.40 | ) | 308 | 1.00 | 1.60 | 2.57 | 28 | ||||||||||||||||||||||||||||||||||||
Year ended 12/31/14 | 8.24 | 0.24 | 0.28 | 0.52 | (0.53 | ) | (0.28 | ) | (0.81 | ) | 7.95 | 6.39 | 572 | 1.01 | 1.61 | 2.78 | 8 | |||||||||||||||||||||||||||||||||||||||
Year ended 12/31/13 | 8.65 | (0.09 | ) | 0.22 | 0.13 | (0.15 | ) | (0.39 | ) | (0.54 | ) | 8.24 | 1.54 | 563 | 1.00 | 1.62 | (1.00 | ) | 68 | |||||||||||||||||||||||||||||||||||||
Class R | ||||||||||||||||||||||||||||||||||||||||||||||||||||||||
Year ended 12/31/17 | 7.36 | (0.04 | ) | 0.88 | 0.84 | (0.30 | ) | — | (0.30 | ) | 7.90 | 11.42 | 7,650 | 0.50 | (e) | 1.32 | (e) | (0.50 | )(e) | 17 | ||||||||||||||||||||||||||||||||||||
Year ended 12/31/16 | 6.87 | 0.36 | 0.60 | 0.96 | (0.35 | ) | (0.12 | ) | (0.47 | ) | 7.36 | 14.00 | 6,981 | 0.50 | 1.31 | 4.81 | 13 | |||||||||||||||||||||||||||||||||||||||
Year ended 12/31/15 | 8.02 | 0.24 | (0.72 | ) | (0.48 | ) | (0.43 | ) | (0.24 | ) | (0.67 | ) | 6.87 | (5.93 | ) | 6,869 | 0.50 | 1.10 | 3.07 | 28 | ||||||||||||||||||||||||||||||||||||
Year ended 12/31/14 | 8.30 | 0.28 | 0.29 | 0.57 | (0.57 | ) | (0.28 | ) | (0.85 | ) | 8.02 | 7.00 | 8,650 | 0.51 | 1.11 | 3.28 | 8 | |||||||||||||||||||||||||||||||||||||||
Year ended 12/31/13 | 8.72 | (0.04 | ) | 0.21 | 0.17 | (0.20 | ) | (0.39 | ) | (0.59 | ) | 8.30 | 1.97 | 8,644 | 0.50 | 1.12 | (0.50 | ) | 68 | |||||||||||||||||||||||||||||||||||||
Class RX | ||||||||||||||||||||||||||||||||||||||||||||||||||||||||
Year ended 12/31/17 | 7.35 | (0.03 | ) | 0.88 | 0.85 | (0.30 | ) | — | (0.30 | ) | 7.90 | 11.57 | 161 | 0.50 | (e) | 1.32 | (e) | (0.50 | )(e) | 17 | ||||||||||||||||||||||||||||||||||||
Year ended 12/31/16 | 6.88 | 0.34 | 0.60 | 0.94 | (0.35 | ) | (0.12 | ) | (0.47 | ) | 7.35 | 13.68 | 138 | 0.50 | 1.31 | 4.81 | 13 | |||||||||||||||||||||||||||||||||||||||
Year ended 12/31/15 | 8.03 | 0.24 | (0.72 | ) | (0.48 | ) | (0.43 | ) | (0.24 | ) | (0.67 | ) | 6.88 | (5.91 | ) | 599 | 0.50 | 1.10 | 3.07 | 28 | ||||||||||||||||||||||||||||||||||||
Year ended 12/31/14 | 8.31 | 0.28 | 0.29 | 0.57 | (0.57 | ) | (0.28 | ) | (0.85 | ) | 8.03 | 6.99 | 683 | 0.51 | 1.11 | 3.28 | 8 | |||||||||||||||||||||||||||||||||||||||
Year ended 12/31/13 | 8.72 | (0.04 | ) | 0.22 | 0.18 | (0.20 | ) | (0.39 | ) | (0.59 | ) | 8.31 | 2.08 | 614 | 0.50 | 1.12 | (0.50 | ) | 68 | |||||||||||||||||||||||||||||||||||||
Class Y | ||||||||||||||||||||||||||||||||||||||||||||||||||||||||
Year ended 12/31/17 | 7.41 | 0.00 | 0.88 | 0.88 | (0.33 | ) | — | (0.33 | ) | 7.96 | 12.02 | 849 | 0.00 | (e) | 0.82 | (e) | 0.00 | (e) | 17 | |||||||||||||||||||||||||||||||||||||
Year ended 12/31/16 | 6.92 | 0.39 | 0.61 | 1.00 | (0.39 | ) | (0.12 | ) | (0.51 | ) | 7.41 | 14.47 | 1,528 | 0.00 | 0.81 | 5.31 | 13 | |||||||||||||||||||||||||||||||||||||||
Year ended 12/31/15 | 8.09 | 0.29 | (0.75 | ) | (0.46 | ) | (0.47 | ) | (0.24 | ) | (0.71 | ) | 6.92 | (5.58 | ) | 2,921 | 0.00 | 0.60 | 3.57 | 28 | ||||||||||||||||||||||||||||||||||||
Year ended 12/31/14 | 8.36 | 0.33 | 0.29 | 0.62 | (0.61 | ) | (0.28 | ) | (0.89 | ) | 8.09 | 7.61 | 2,338 | 0.01 | 0.61 | 3.78 | 8 | |||||||||||||||||||||||||||||||||||||||
Year ended 12/31/13 | 8.78 | 0.00 | 0.21 | 0.21 | (0.24 | ) | (0.39 | ) | (0.63 | ) | 8.36 | 2.49 | 2,716 | 0.00 | 0.62 | 0.00 | 68 | |||||||||||||||||||||||||||||||||||||||
Class R5 | ||||||||||||||||||||||||||||||||||||||||||||||||||||||||
Year ended 12/31/17 | 7.42 | 0.00 | 0.89 | 0.89 | (0.33 | ) | — | (0.33 | ) | 7.98 | 12.14 | 412 | 0.00 | (e) | 0.65 | (e) | 0.00 | (e) | 17 | |||||||||||||||||||||||||||||||||||||
Year ended 12/31/16 | 6.94 | 0.37 | 0.62 | 0.99 | (0.39 | ) | (0.12 | ) | (0.51 | ) | 7.42 | 14.29 | 739 | 0.00 | 0.62 | 5.31 | 13 | |||||||||||||||||||||||||||||||||||||||
Year ended 12/31/15 | 8.10 | 0.29 | (0.74 | ) | (0.45 | ) | (0.47 | ) | (0.24 | ) | (0.71 | ) | 6.94 | (5.44 | ) | 23,619 | 0.00 | 0.42 | 3.57 | 28 | ||||||||||||||||||||||||||||||||||||
Year ended 12/31/14 | 8.37 | 0.33 | 0.29 | 0.62 | (0.61 | ) | (0.28 | ) | (0.89 | ) | 8.10 | 7.59 | 25,848 | 0.01 | 0.44 | 3.78 | 8 | |||||||||||||||||||||||||||||||||||||||
Year ended 12/31/13 | 8.78 | 0.00 | 0.22 | 0.22 | (0.24 | ) | (0.39 | ) | (0.63 | ) | 8.37 | 2.60 | 21,149 | 0.00 | 0.47 | 0.00 | 68 | |||||||||||||||||||||||||||||||||||||||
Class R6 | ||||||||||||||||||||||||||||||||||||||||||||||||||||||||
Year ended 12/31/17 | 7.42 | 0.00 | 0.88 | 0.88 | (0.33 | ) | — | (0.33 | ) | 7.97 | 12.00 | 3,181 | 0.00 | (e) | 0.56 | (e) | 0.00 | (e) | 17 | |||||||||||||||||||||||||||||||||||||
Year ended 12/31/16 | 6.93 | 0.40 | 0.60 | 1.00 | (0.39 | ) | (0.12 | ) | (0.51 | ) | 7.42 | 14.45 | 2,152 | 0.00 | 0.53 | 5.31 | 13 | |||||||||||||||||||||||||||||||||||||||
Year ended 12/31/15 | 8.10 | 0.29 | (0.75 | ) | (0.46 | ) | (0.47 | ) | (0.24 | ) | (0.71 | ) | 6.93 | (5.58 | ) | 1,484 | 0.00 | 0.33 | 3.57 | 28 | ||||||||||||||||||||||||||||||||||||
Year ended 12/31/14 | 8.37 | 0.33 | 0.29 | 0.62 | (0.61 | ) | (0.28 | ) | (0.89 | ) | 8.10 | 7.59 | 1,270 | 0.01 | 0.35 | 3.78 | 8 | |||||||||||||||||||||||||||||||||||||||
Year ended 12/31/13 | 8.78 | 0.00 | 0.22 | 0.22 | (0.24 | ) | (0.39 | ) | (0.63 | ) | 8.37 | 2.60 | 970 | 0.00 | 0.37 | 0.00 | 68 | |||||||||||||||||||||||||||||||||||||||
| (a) | Calculated using average shares outstanding. |
| (b) | Includes adjustments in accordance with accounting principles generally accepted in the United States of America and as such, the net asset value for financial reporting purposes and the returns based upon those net asset values may differ from the net asset value and returns for shareholder transactions. Does not include sales charges and is not annualized for periods less than one year, if applicable. |
| (c) | In addition to the fees and expenses which the Fund bears directly, the Fund indirectly bears a pro rata share of the fees and expenses of the underlying funds in which the Fund invests. Because the underlying funds have varied expenses and fee levels and the Fund may own different proportions at different times, the amount of fees and expenses incurred indirectly by the Fund will vary. Estimated underlying fund expenses are not expenses that are incurred directly by the Fund. They are expenses that are incurred directly by the underlying funds and are deducted from the value of the funds the Fund invests in. The effect of the estimated underlying fund expenses that the Fund bears indirectly is included in the Fund’s total return. Estimated acquired fund fees from underlying funds were 0.90%, 0.87%, 0.98%, 0.99% and 0.99% for the years ended December 31, 2017, December 31, 2016, December 31, 2015, December 31, 2014 and December 31, 2013, respectively. |
| (d) | Portfolio turnover is calculated at the fund level and is not annualized for periods less than one year, if applicable. |
| (e) | Ratios are based on average daily net assets (000’s omitted) of $30,860, $2,678, $320, $6,141, $255, $7,185, $142, $1,203, $432 and $2,588 for Class A, Class AX, Class B, Class C, Class CX, Class R, Class RX, Class Y, Class R5 and Class R6 shares, respectively. |
52 Invesco Balanced-Risk Retirement Funds
NOTE 11—Financial Highlights—(continued)
Invesco Balanced-Risk Retirement 2050 Fund
| Net asset value, beginning of period | Net investment income (loss)(a) | Net gains (losses) on securities (both realized and unrealized) | Total from investment operations | Dividends from net investment income | Distributions from net realized gains | Total distributions | Net asset value, end of period | Total return(b) | Net assets, end of period (000’s omitted) | Ratio of expenses to average net assets with fee waivers and/or expense reimbursements(c) | Ratio of expenses to average net assets without fee waivers and/or expense reimbursements | Ratio of net investment income (loss) to average net assets | Portfolio turnover(d) | |||||||||||||||||||||||||||||||||||||||||||
Class A |
| |||||||||||||||||||||||||||||||||||||||||||||||||||||||
Year ended 12/31/17 | $ | 7.19 | $ | (0.02 | ) | $ | 0.97 | $ | 0.95 | $ | (0.34 | ) | $ | — | $ | (0.34 | ) | $ | 7.80 | 13.30 | % | $ | 21,082 | 0.25 | %(e) | 1.43 | %(e) | (0.25 | )%(e) | 18 | % | |||||||||||||||||||||||||
Year ended 12/31/16 | 6.70 | 0.49 | 0.57 | 1.06 | (0.55 | ) | (0.02 | ) | (0.57 | ) | 7.19 | 16.00 | 17,740 | 0.25 | 1.57 | 6.72 | 34 | |||||||||||||||||||||||||||||||||||||||
Year ended 12/31/15 | 7.98 | 0.31 | (0.83 | ) | (0.52 | ) | (0.48 | ) | (0.28 | ) | (0.76 | ) | 6.70 | (6.45 | ) | 13,456 | 0.25 | 1.31 | 3.97 | 22 | ||||||||||||||||||||||||||||||||||||
Year ended 12/31/14 | 8.21 | 0.40 | 0.27 | 0.67 | (0.63 | ) | (0.27 | ) | (0.90 | ) | 7.98 | 8.30 | 14,645 | 0.25 | 1.24 | 4.61 | 8 | |||||||||||||||||||||||||||||||||||||||
Year ended 12/31/13 | 8.68 | (0.02 | ) | 0.22 | 0.20 | (0.20 | ) | (0.47 | ) | (0.67 | ) | 8.21 | 2.42 | 13,570 | 0.25 | 1.31 | (0.25 | ) | 93 | |||||||||||||||||||||||||||||||||||||
Class AX | ||||||||||||||||||||||||||||||||||||||||||||||||||||||||
Year ended 12/31/17 | 7.19 | (0.01 | ) | 0.96 | 0.95 | (0.34 | ) | — | (0.34 | ) | 7.80 | 13.30 | 1,025 | 0.25 | (e) | 1.43 | (e) | (0.25 | )(e) | 18 | ||||||||||||||||||||||||||||||||||||
Year ended 12/31/16 | 6.71 | 0.48 | 0.57 | 1.05 | (0.55 | ) | (0.02 | ) | (0.57 | ) | 7.19 | 15.82 | 1,231 | 0.25 | 1.57 | 6.72 | 34 | |||||||||||||||||||||||||||||||||||||||
Year ended 12/31/15 | 7.99 | 0.31 | (0.83 | ) | (0.52 | ) | (0.48 | ) | (0.28 | ) | (0.76 | ) | 6.71 | (6.44 | ) | 1,037 | 0.25 | 1.31 | 3.97 | 22 | ||||||||||||||||||||||||||||||||||||
Year ended 12/31/14 | 8.21 | 0.40 | 0.28 | 0.68 | (0.63 | ) | (0.27 | ) | (0.90 | ) | 7.99 | 8.43 | 1,192 | 0.25 | 1.24 | 4.61 | 8 | |||||||||||||||||||||||||||||||||||||||
Year ended 12/31/13 | 8.69 | (0.02 | ) | 0.21 | 0.19 | (0.20 | ) | (0.47 | ) | (0.67 | ) | 8.21 | 2.30 | 1,230 | 0.25 | 1.31 | (0.25 | ) | 93 | |||||||||||||||||||||||||||||||||||||
Class B | ||||||||||||||||||||||||||||||||||||||||||||||||||||||||
Year ended 12/31/17 | 7.08 | (0.07 | ) | 0.95 | 0.88 | (0.28 | ) | — | (0.28 | ) | 7.68 | 12.53 | 91 | 1.00 | (e) | 2.18 | (e) | (1.00 | )(e) | 18 | ||||||||||||||||||||||||||||||||||||
Year ended 12/31/16 | 6.60 | 0.43 | 0.57 | 1.00 | (0.50 | ) | (0.02 | ) | (0.52 | ) | 7.08 | 15.26 | 245 | 1.00 | 2.32 | 5.97 | 34 | |||||||||||||||||||||||||||||||||||||||
Year ended 12/31/15 | 7.86 | 0.25 | (0.81 | ) | (0.56 | ) | (0.42 | ) | (0.28 | ) | (0.70 | ) | 6.60 | (7.11 | ) | 294 | 1.00 | 2.06 | 3.22 | 22 | ||||||||||||||||||||||||||||||||||||
Year ended 12/31/14 | 8.10 | 0.33 | 0.27 | 0.60 | (0.57 | ) | (0.27 | ) | (0.84 | ) | 7.86 | 7.55 | 348 | 1.00 | 1.99 | 3.86 | 8 | |||||||||||||||||||||||||||||||||||||||
Year ended 12/31/13 | 8.57 | (0.09 | ) | 0.22 | 0.13 | (0.13 | ) | (0.47 | ) | (0.60 | ) | 8.10 | 1.65 | 393 | 1.00 | 2.06 | (1.00 | ) | 93 | |||||||||||||||||||||||||||||||||||||
Class C | ||||||||||||||||||||||||||||||||||||||||||||||||||||||||
Year ended 12/31/17 | 7.10 | (0.07 | ) | 0.94 | 0.87 | (0.28 | ) | — | (0.28 | ) | 7.69 | 12.35 | 5,853 | 1.00 | (e) | 2.18 | (e) | (1.00 | )(e) | 18 | ||||||||||||||||||||||||||||||||||||
Year ended 12/31/16 | 6.61 | 0.43 | 0.58 | 1.01 | (0.50 | ) | (0.02 | ) | (0.52 | ) | 7.10 | 15.38 | 5,273 | 1.00 | 2.32 | 5.97 | 34 | |||||||||||||||||||||||||||||||||||||||
Year ended 12/31/15 | 7.87 | 0.25 | (0.81 | ) | (0.56 | ) | (0.42 | ) | (0.28 | ) | (0.70 | ) | 6.61 | (7.11 | ) | 4,283 | 1.00 | 2.06 | 3.22 | 22 | ||||||||||||||||||||||||||||||||||||
Year ended 12/31/14 | 8.12 | 0.33 | 0.26 | 0.59 | (0.57 | ) | (0.27 | ) | (0.84 | ) | 7.87 | 7.41 | 4,876 | 1.00 | 1.99 | 3.86 | 8 | |||||||||||||||||||||||||||||||||||||||
Year ended 12/31/13 | 8.59 | (0.09 | ) | 0.22 | 0.13 | (0.13 | ) | (0.47 | ) | (0.60 | ) | 8.12 | 1.65 | 3,924 | 1.00 | 2.06 | (1.00 | ) | 93 | |||||||||||||||||||||||||||||||||||||
Class CX | ||||||||||||||||||||||||||||||||||||||||||||||||||||||||
Year ended 12/31/17 | 7.09 | (0.07 | ) | 0.95 | 0.88 | (0.28 | ) | — | (0.28 | ) | 7.69 | 12.51 | 144 | 1.00 | (e) | 2.18 | (e) | (1.00 | )(e) | 18 | ||||||||||||||||||||||||||||||||||||
Year ended 12/31/16 | 6.61 | 0.43 | 0.57 | 1.00 | (0.50 | ) | (0.02 | ) | (0.52 | ) | 7.09 | 15.23 | 142 | 1.00 | 2.32 | 5.97 | 34 | |||||||||||||||||||||||||||||||||||||||
Year ended 12/31/15 | 7.87 | 0.25 | (0.81 | ) | (0.56 | ) | (0.42 | ) | (0.28 | ) | (0.70 | ) | 6.61 | (7.10 | ) | 141 | 1.00 | 2.06 | 3.22 | 22 | ||||||||||||||||||||||||||||||||||||
Year ended 12/31/14 | 8.11 | 0.33 | 0.27 | 0.60 | (0.57 | ) | (0.27 | ) | (0.84 | ) | 7.87 | 7.54 | 152 | 1.00 | 1.99 | 3.86 | 8 | |||||||||||||||||||||||||||||||||||||||
Year ended 12/31/13 | 8.58 | (0.09 | ) | 0.22 | 0.13 | (0.13 | ) | (0.47 | ) | (0.60 | ) | 8.11 | 1.65 | 134 | 1.00 | 2.06 | (1.00 | ) | 93 | |||||||||||||||||||||||||||||||||||||
Class R | ||||||||||||||||||||||||||||||||||||||||||||||||||||||||
Year ended 12/31/17 | 7.15 | (0.04 | ) | 0.96 | 0.92 | (0.32 | ) | — | (0.32 | ) | 7.75 | 12.96 | 4,227 | 0.50 | (e) | 1.68 | (e) | (0.50 | )(e) | 18 | ||||||||||||||||||||||||||||||||||||
Year ended 12/31/16 | 6.66 | 0.47 | 0.57 | 1.04 | (0.53 | ) | (0.02 | ) | (0.55 | ) | 7.15 | 15.80 | 3,578 | 0.50 | 1.82 | 6.47 | 34 | |||||||||||||||||||||||||||||||||||||||
Year ended 12/31/15 | 7.93 | 0.29 | (0.82 | ) | (0.53 | ) | (0.46 | ) | (0.28 | ) | (0.74 | ) | 6.66 | (6.63 | ) | 3,812 | 0.50 | 1.56 | 3.72 | 22 | ||||||||||||||||||||||||||||||||||||
Year ended 12/31/14 | 8.17 | 0.37 | 0.27 | 0.64 | (0.61 | ) | (0.27 | ) | (0.88 | ) | 7.93 | 7.96 | 5,548 | 0.50 | 1.49 | 4.36 | 8 | |||||||||||||||||||||||||||||||||||||||
Year ended 12/31/13 | 8.64 | (0.04 | ) | 0.22 | 0.18 | (0.18 | ) | (0.47 | ) | (0.65 | ) | 8.17 | 2.18 | 4,887 | 0.50 | 1.56 | (0.50 | ) | 93 | |||||||||||||||||||||||||||||||||||||
Class RX | ||||||||||||||||||||||||||||||||||||||||||||||||||||||||
Year ended 12/31/17 | 7.16 | (0.04 | ) | 0.96 | 0.92 | (0.32 | ) | — | (0.32 | ) | 7.76 | 12.94 | 58 | 0.50 | (e) | 1.68 | (e) | (0.50 | )(e) | 18 | ||||||||||||||||||||||||||||||||||||
Year ended 12/31/16 | 6.67 | 0.46 | 0.58 | 1.04 | (0.53 | ) | (0.02 | ) | (0.55 | ) | 7.16 | 15.79 | 81 | 0.50 | 1.82 | 6.47 | 34 | |||||||||||||||||||||||||||||||||||||||
Year ended 12/31/15 | 7.94 | 0.29 | (0.82 | ) | (0.53 | ) | (0.46 | ) | (0.28 | ) | (0.74 | ) | 6.67 | (6.63 | ) | 163 | 0.50 | 1.56 | 3.72 | 22 | ||||||||||||||||||||||||||||||||||||
Year ended 12/31/14 | 8.17 | 0.37 | 0.28 | 0.65 | (0.61 | ) | (0.27 | ) | (0.88 | ) | 7.94 | 8.09 | 214 | 0.50 | 1.49 | 4.36 | 8 | |||||||||||||||||||||||||||||||||||||||
Year ended 12/31/13 | 8.65 | (0.04 | ) | 0.21 | 0.17 | (0.18 | ) | (0.47 | ) | (0.65 | ) | 8.17 | 2.06 | 255 | 0.50 | 1.56 | (0.50 | ) | 93 | |||||||||||||||||||||||||||||||||||||
Class Y | ||||||||||||||||||||||||||||||||||||||||||||||||||||||||
Year ended 12/31/17 | 7.20 | 0.00 | 0.98 | 0.98 | (0.36 | ) | — | (0.36 | ) | 7.82 | 13.67 | 4,251 | 0.00 | (e) | 1.18 | (e) | 0.00 | (e) | 18 | |||||||||||||||||||||||||||||||||||||
Year ended 12/31/16 | 6.72 | 0.51 | 0.56 | 1.07 | (0.57 | ) | (0.02 | ) | (0.59 | ) | 7.20 | 16.06 | 3,681 | 0.00 | 1.32 | 6.97 | 34 | |||||||||||||||||||||||||||||||||||||||
Year ended 12/31/15 | 8.01 | 0.34 | (0.85 | ) | (0.51 | ) | (0.50 | ) | (0.28 | ) | (0.78 | ) | 6.72 | (6.29 | ) | 2,412 | 0.00 | 1.06 | 4.22 | 22 | ||||||||||||||||||||||||||||||||||||
Year ended 12/31/14 | 8.22 | 0.42 | 0.29 | 0.71 | (0.65 | ) | (0.27 | ) | (0.92 | ) | 8.01 | 8.81 | 3,381 | 0.00 | 0.99 | 4.86 | 8 | |||||||||||||||||||||||||||||||||||||||
Year ended 12/31/13 | 8.69 | 0.00 | 0.22 | 0.22 | (0.22 | ) | (0.47 | ) | (0.69 | ) | 8.22 | 2.68 | 1,941 | 0.00 | 1.06 | 0.00 | 93 | |||||||||||||||||||||||||||||||||||||||
Class R5 | ||||||||||||||||||||||||||||||||||||||||||||||||||||||||
Year ended 12/31/17 | 7.21 | 0.00 | 0.98 | 0.98 | (0.36 | ) | — | (0.36 | ) | 7.83 | 13.65 | 114 | 0.00 | (e) | 0.94 | (e) | 0.00 | (e) | 18 | |||||||||||||||||||||||||||||||||||||
Year ended 12/31/16 | 6.72 | 0.48 | 0.60 | 1.08 | (0.57 | ) | (0.02 | ) | (0.59 | ) | 7.21 | 16.21 | 693 | 0.00 | 1.02 | 6.97 | 34 | |||||||||||||||||||||||||||||||||||||||
Year ended 12/31/15 | 8.00 | 0.34 | (0.84 | ) | (0.50 | ) | (0.50 | ) | (0.28 | ) | (0.78 | ) | 6.72 | (6.17 | ) | 8,058 | 0.00 | 0.77 | 4.22 | 22 | ||||||||||||||||||||||||||||||||||||
Year ended 12/31/14 | 8.23 | 0.42 | 0.27 | 0.69 | (0.65 | ) | (0.27 | ) | (0.92 | ) | 8.00 | 8.53 | 18,171 | 0.00 | 0.70 | 4.86 | 8 | |||||||||||||||||||||||||||||||||||||||
Year ended 12/31/13 | 8.70 | 0.00 | 0.22 | 0.22 | (0.22 | ) | (0.47 | ) | (0.69 | ) | 8.23 | 2.68 | 14,065 | 0.00 | 0.81 | 0.00 | 93 | |||||||||||||||||||||||||||||||||||||||
Class R6 | ||||||||||||||||||||||||||||||||||||||||||||||||||||||||
Year ended 12/31/17 | 7.22 | 0.00 | 0.98 | 0.98 | (0.36 | ) | — | (0.36 | ) | 7.84 | 13.63 | 1,639 | 0.00 | (e) | 0.84 | (e) | 0.00 | (e) | 18 | |||||||||||||||||||||||||||||||||||||
Year ended 12/31/16 | 6.73 | 0.52 | 0.56 | 1.08 | (0.57 | ) | (0.02 | ) | (0.59 | ) | 7.22 | 16.18 | 1,012 | 0.00 | 0.95 | 6.97 | 34 | |||||||||||||||||||||||||||||||||||||||
Year ended 12/31/15 | 8.01 | 0.33 | (0.83 | ) | (0.50 | ) | (0.50 | ) | (0.28 | ) | (0.78 | ) | 6.73 | (6.16 | ) | 523 | 0.00 | 0.69 | 4.22 | 22 | ||||||||||||||||||||||||||||||||||||
Year ended 12/31/14 | 8.24 | 0.42 | 0.27 | 0.69 | (0.65 | ) | (0.27 | ) | (0.92 | ) | 8.01 | 8.52 | 430 | 0.00 | 0.61 | 4.86 | 8 | |||||||||||||||||||||||||||||||||||||||
Year ended 12/31/13 | 8.71 | 0.00 | 0.22 | 0.22 | (0.22 | ) | (0.47 | ) | (0.69 | ) | 8.24 | 2.67 | 290 | 0.00 | 0.72 | 0.00 | 93 | |||||||||||||||||||||||||||||||||||||||
| (a) | Calculated using average shares outstanding. |
| (b) | Includes adjustments in accordance with accounting principles generally accepted in the United States of America and as such, the net asset value for financial reporting purposes and the returns based upon those net asset values may differ from the net asset value and returns for shareholder transactions. Does not include sales charges and is not annualized for periods less than one year, if applicable. |
| (c) | In addition to the fees and expenses which the Fund bears directly, the Fund indirectly bears a pro rata share of the fees and expenses of the underlying funds in which the Fund invests. Because the underlying funds have varied expenses and fee levels and the Fund may own different proportions at different times, the amount of fees and expenses incurred indirectly by the Fund will vary. Estimated underlying fund expenses are not expenses that are incurred directly by the Fund. They are expenses that are incurred directly by the underlying funds and are deducted from the value of the funds the Fund invests in. The effect of the estimated underlying fund expenses that the Fund bears indirectly is included in the Fund’s total return. Estimated acquired fund fees from underlying funds were 0.93%, 0.91%, 1.09%, 1.10% and 1.11% for the years ended December 31, 2017, December 31, 2016, December 31, 2015, December 31, 2014 and December 31, 2013, respectively. |
| (d) | Portfolio turnover is calculated at the fund level and is not annualized for periods less than one year, if applicable. |
| (e) | Ratios are based on average daily net assets (000’s omitted) of $18,406, $1,124, $191, $5,441, $144, $3,867, $68, $4,027, $181 and $1,329 for Class A, Class AX, Class B, Class C, Class CX, Class R, Class RX, Class Y, Class R5 and Class R6 shares, respectively. |
53 Invesco Balanced-Risk Retirement Funds
Report of Independent Registered Public Accounting Firm
To the Board of Trustees of AIM Growth Series (Invesco Growth Series) and Shareholders of Invesco Balanced-Risk Retirement Now Fund, Invesco Balanced-Risk Retirement 2020 Fund, Invesco Balanced-Risk Retirement 2030 Fund, Invesco Balanced-Risk Retirement 2040 Fund and Invesco Balanced-Risk Retirement 2050 Fund
Opinions on the Financial Statements
We have audited the accompanying statements of assets and liabilities, including the schedules of investments, of Invesco Balanced-Risk Retirement Now Fund, Invesco Balanced-Risk Retirement 2020 Fund, Invesco Balanced-Risk Retirement 2030 Fund, Invesco Balanced-Risk Retirement 2040 Fund and Invesco Balanced-Risk Retirement 2050 Fund (five of the funds constituting AIM Growth Series (Invesco Growth Series), hereafter collectively referred to as the “Funds”) as of December 31, 2017, the related statements of operations for the year ended December 31, 2017, the statements of changes in net assets for each of the two years in the period ended December 31, 2017, including the related notes, and the financial highlights for each of the five years in the period ended December 31, 2017 (collectively referred to as the “financial statements”). In our opinion, the financial statements present fairly, in all material respects, the financial position of each of the Funds as of December 31, 2017, the results of each of their operations for the year then ended, the changes in each of their net assets for each of the two years in the period ended December 31, 2017 and each of the financial highlights for each of the five years in the period ended December 31, 2017 in conformity with accounting principles generally accepted in the United States of America.
Basis for Opinions
These financial statements are the responsibility of the Funds’ management. Our responsibility is to express an opinion on the Funds’ financial statements based on our audits. We are a public accounting firm registered with the Public Company Accounting Oversight Board (United States) (“PCAOB”) and are required to be independent with respect to the Funds in accordance with the U.S. federal securities laws and the applicable rules and regulations of the Securities and Exchange Commission and the PCAOB.
We conducted our audits of these financial statements in accordance with the standards of the PCAOB. Those standards require that we plan and perform the audit to obtain reasonable assurance about whether the financial statements are free of material misstatement, whether due to error or fraud.
Our audits included performing procedures to assess the risks of material misstatement of the financial statements, whether due to error or fraud, and performing procedures that respond to those risks. Such procedures included examining, on a test basis, evidence regarding the amounts and disclosures in the financial statements. Our audits also included evaluating the accounting principles used and significant estimates made by management, as well as evaluating the overall presentation of the financial statements. Our procedures included confirmation of securities owned as of December 31, 2017 by correspondence with the custodian and transfer agent. We believe that our audits provide a reasonable basis for our opinions.
PricewaterhouseCoopers LLP
Houston, TX
February 23, 2018
We have served as the auditor of one or more of the investment companies in the Invesco/PowerShares group of investment companies since at least 1995. We have not determined the specific year we began serving as auditor.
54 Invesco Balanced-Risk Retirement Funds
Calculating your ongoing Fund expenses
Example
As a shareholder of the Funds, you incur two types of costs: (1) transaction costs, which may include sales charges (loads) on purchase payments or contingent deferred sales charges on redemptions, if any; and (2) ongoing costs, including distribution and/or service (12b-1) fees, and other Fund expenses. This example is intended to help you understand your ongoing costs (in dollars) of investing in the Funds and to compare these costs with ongoing costs of investing in other mutual funds. The example is based on an investment of $1,000 invested at the beginning of the period and held for the entire period July 1, 2017, through December 31, 2017.
In addition to the fees and expenses which the Funds bear directly, the Funds indirectly bear a pro rata share of the fees and expenses of the underlying funds in which the Funds invest. The amount of fees and expenses incurred indirectly by the Funds will vary because the underlying funds have varied expenses and fee levels and the Funds may own different proportions of the underlying funds at different times. Estimated underlying fund expenses are not expenses that are incurred directly by the Funds. They are expenses that are incurred directly by the underlying funds and are deducted from the value of the underlying funds the Funds invest in. The effect of the estimated underlying fund expenses that the Funds bear indirectly are included in each Fund’s total return.
Actual expenses
The table below provides information about actual account values and actual expenses. You may use the information in this table, together with the amount you invested, to estimate the expenses that you paid over the period. Simply divide your account value by $1,000 (for example, an $8,600 account value divided by $1,000 = 8.6), then multiply the result by the number in the table under the heading entitled “Actual Expenses Paid During Period” to estimate the expenses you paid on your account during this period.
Hypothetical example for comparison purposes
The table below also provides information about hypothetical account values and hypothetical expenses based on each Fund’s actual expense ratio and an assumed rate of return of 5% per year before expenses, which is not each Fund’s actual return.
The hypothetical account values and expenses may not be used to estimate the actual ending account balance or expenses you paid for the period. You may use this information to compare the ongoing costs of investing in the Funds and other funds. To do so, compare this 5% hypothetical example with the 5% hypothetical examples that appear in the shareholder reports of the other funds.
Please note that the expenses shown in the table are meant to highlight your ongoing costs only and do not reflect any transaction costs, such as sales charges (loads) on purchase payments or contingent deferred sales charges on redemptions, if any. Therefore, the hypothetical information is useful in comparing ongoing costs only, and will not help you determine the relative total costs of owning different funds. In addition, expenses shown in the table do not include the expenses of the underlying funds, which are borne indirectly by the Funds. If transaction costs and indirect expenses were included, your costs would have been higher.
Invesco Balanced-Risk Retirement Now Fund
| Class | Beginning Account Value (07/01/17) | ACTUAL | HYPOTHETICAL (5% annual return before | Annualized | ||||||||||||||||||||
| Ending Account Value (12/31/17)1 | Expenses Paid During Period2 | Ending Account Value (12/31/17) | Expenses Paid During Period2 | |||||||||||||||||||||
| A | $ | 1,000.00 | $ | 1,047.60 | $ | 1.29 | $ | 1,023.95 | $ | 1.28 | 0.25 | % | ||||||||||||
| AX | 1,000.00 | 1,046.40 | 1.29 | 1,023.95 | 1.28 | 0.25 | ||||||||||||||||||
| B | 1,000.00 | 1,043.50 | 5.15 | 1,020.16 | 5.09 | 1.00 | ||||||||||||||||||
| C | 1,000.00 | 1,043.50 | 5.15 | 1,020.16 | 5.09 | 1.00 | ||||||||||||||||||
| CX | 1,000.00 | 1,042.20 | 5.15 | 1,020.16 | 5.09 | 1.00 | ||||||||||||||||||
| R | 1,000.00 | 1,046.70 | 2.58 | 1,022.68 | 2.55 | 0.50 | ||||||||||||||||||
| RX | 1,000.00 | 1,045.40 | 2.58 | 1,022.68 | 2.55 | 0.50 | ||||||||||||||||||
| Y | 1,000.00 | 1,048.50 | 0.00 | 1,025.21 | 0.00 | 0.00 | ||||||||||||||||||
| R5 | 1,000.00 | 1,048.50 | 0.00 | 1,025.21 | 0.00 | 0.00 | ||||||||||||||||||
| R6 | 1,000.00 | 1,048.50 | 0.00 | 1,025.21 | 0.00 | 0.00 | ||||||||||||||||||
55 Invesco Balanced-Risk Retirement Funds
Invesco Balanced-Risk Retirement 2020 Fund
| Class | Beginning Account Value (07/01/17) | ACTUAL | HYPOTHETICAL (5% annual return before | Annualized | ||||||||||||||||||||
| Ending Account Value (12/31/17)1 | Expenses Paid During Period2 | Ending Account Value (12/31/17) | Expenses Paid During Period2 | |||||||||||||||||||||
| A | $ | 1,000.00 | $ | 1,056.60 | $ | 1.30 | $ | 1,023.95 | $ | 1.28 | 0.25 | % | ||||||||||||
| AX | 1,000.00 | 1,056.60 | 1.30 | 1,023.95 | 1.28 | 0.25 | ||||||||||||||||||
| B | 1,000.00 | 1,051.20 | 5.17 | 1,020.16 | 5.09 | 1.00 | ||||||||||||||||||
| C | 1,000.00 | 1,051.30 | 5.17 | 1,020.16 | 5.09 | 1.00 | ||||||||||||||||||
| CX | 1,000.00 | 1,052.50 | 5.17 | 1,020.16 | 5.09 | 1.00 | ||||||||||||||||||
| R | 1,000.00 | 1,054.10 | 2.59 | 1,022.68 | 2.55 | 0.50 | ||||||||||||||||||
| RX | 1,000.00 | 1,054.10 | 2.59 | 1,022.68 | 2.55 | 0.50 | ||||||||||||||||||
| Y | 1,000.00 | 1,057.00 | 0.00 | 1,025.21 | 0.00 | 0.00 | ||||||||||||||||||
| R5 | 1,000.00 | 1,056.60 | 0.00 | 1,025.21 | 0.00 | 0.00 | ||||||||||||||||||
| R6 | 1,000.00 | 1,057.80 | 0.00 | 1,025.21 | 0.00 | (0.00 | ) | |||||||||||||||||
Invesco Balanced-Risk Retirement 2030 Fund
| Class | Beginning Account Value (07/01/17) | ACTUAL | HYPOTHETICAL (5% annual return before | Annualized | ||||||||||||||||||||
| Ending Account Value (12/31/17)1 | Expenses Paid During Period2 | Ending Account Value (12/31/17) | Expenses Paid During Period2 | |||||||||||||||||||||
| A | $ | 1,000.00 | $ | 1,079.50 | $ | 1.31 | $ | 1,023.95 | $ | 1.28 | 0.25 | % | ||||||||||||
| AX | 1,000.00 | 1,079.40 | 1.31 | 1,023.95 | 1.28 | 0.25 | ||||||||||||||||||
| B | 1,000.00 | 1,074.80 | 5.23 | 1,020.16 | 5.09 | 1.00 | ||||||||||||||||||
| C | 1,000.00 | 1,074.80 | 5.23 | 1,020.16 | 5.09 | 1.00 | ||||||||||||||||||
| CX | 1,000.00 | 1,076.00 | 5.23 | 1,020.16 | 5.09 | 1.00 | ||||||||||||||||||
| R | 1,000.00 | 1,078.40 | 2.62 | 1,022.68 | 2.55 | 0.50 | ||||||||||||||||||
| RX | 1,000.00 | 1,077.20 | 2.62 | 1,022.68 | 2.55 | 0.50 | ||||||||||||||||||
| Y | 1,000.00 | 1,080.70 | 0.00 | 1,025.21 | 0.00 | 0.00 | ||||||||||||||||||
| R5 | 1,000.00 | 1,081.70 | 0.00 | 1,025.21 | 0.00 | 0.00 | ||||||||||||||||||
| R6 | 1,000.00 | 1,080.50 | 0.00 | 1,025.21 | 0.00 | 0.00 | ||||||||||||||||||
Invesco Balanced-Risk Retirement 2040 Fund
| Class | Beginning Account Value (07/01/17) | ACTUAL | HYPOTHETICAL (5% annual return before | Annualized | ||||||||||||||||||||
| Ending Account Value (12/31/17)1 | Expenses Paid During Period2 | Ending Account Value (12/31/17) | Expenses Paid During Period2 | |||||||||||||||||||||
| A | $ | 1,000.00 | $ | 1,091.20 | $ | 1.32 | $ | 1,023.95 | $ | 1.28 | 0.25 | % | ||||||||||||
| AX | 1,000.00 | 1,091.30 | 1.32 | 1,023.95 | 1.28 | 0.25 | ||||||||||||||||||
| B | 1,000.00 | 1,087.00 | 5.26 | 1,020.16 | 5.09 | 1.00 | ||||||||||||||||||
| C | 1,000.00 | 1,087.10 | 5.26 | 1,020.16 | 5.09 | 1.00 | ||||||||||||||||||
| CX | 1,000.00 | 1,087.30 | 5.26 | 1,020.16 | 5.09 | 1.00 | ||||||||||||||||||
| R | 1,000.00 | 1,090.50 | 2.63 | 1,022.68 | 2.55 | 0.50 | ||||||||||||||||||
| RX | 1,000.00 | 1,090.50 | 2.63 | 1,022.68 | 2.55 | 0.50 | ||||||||||||||||||
| Y | 1,000.00 | 1,093.60 | 0.00 | 1,025.21 | 0.00 | 0.00 | ||||||||||||||||||
| R5 | 1,000.00 | 1,093.40 | 0.00 | 1,025.21 | 0.00 | 0.00 | ||||||||||||||||||
| R6 | 1,000.00 | 1,092.00 | 0.00 | 1,025.21 | 0.00 | 0.00 | ||||||||||||||||||
56 Invesco Balanced-Risk Retirement Funds
Invesco Balanced-Risk Retirement 2050 Fund
| Class | Beginning Account Value (07/01/17) | ACTUAL | HYPOTHETICAL (5% annual return before | Annualized | ||||||||||||||||||||
| Ending Account Value (12/31/17)1 | Expenses Paid During Period2 | Ending Account Value (12/31/17) | Expenses Paid During Period2 | |||||||||||||||||||||
| A | $ | 1,000.00 | $ | 1,102.40 | $ | 1.32 | $ | 1,023.95 | $ | 1.28 | 0.25 | % | ||||||||||||
| AX | 1,000.00 | 1,102.30 | 1.32 | 1,023.95 | 1.28 | 0.25 | ||||||||||||||||||
| B | 1,000.00 | 1,098.90 | 5.29 | 1,020.16 | 5.09 | 1.00 | ||||||||||||||||||
| C | 1,000.00 | 1,098.80 | 5.29 | 1,020.16 | 5.09 | 1.00 | ||||||||||||||||||
| CX | 1,000.00 | 1,098.80 | 5.29 | 1,020.16 | 5.09 | 1.00 | ||||||||||||||||||
| R | 1,000.00 | 1,101.90 | 2.65 | 1,022.68 | 2.55 | 0.50 | ||||||||||||||||||
| RX | 1,000.00 | 1,101.70 | 2.65 | 1,022.68 | 2.55 | 0.50 | ||||||||||||||||||
| Y | 1,000.00 | 1,104.50 | 0.00 | 1,025.21 | 0.00 | 0.00 | ||||||||||||||||||
| R5 | 1,000.00 | 1,105.90 | 0.00 | 1,025.21 | 0.00 | 0.00 | ||||||||||||||||||
| R6 | 1,000.00 | 1,105.70 | 0.00 | 1,025.21 | 0.00 | 0.00 | ||||||||||||||||||
| 1 | The actual ending account value is based on the actual total return of the Funds for the period July 1, 2017, through December 31, 2017, after actual expenses and will differ from the hypothetical ending account value which is based on each Fund’s expense ratio and a hypothetical annual return of 5% before expenses. |
| 2 | Expenses are equal to each Fund’s annualized expense ratio as indicated above multiplied by the average account value over the period, multiplied by 184/365 to reflect the most recent fiscal half year. |
57 Invesco Balanced-Risk Retirement Funds
Tax Information
Form 1099-DIV, Form 1042-S and other year-end tax information provide shareholders with actual calendar year amounts that should be included in their tax returns. Shareholders should consult their tax advisors.
The following distribution information is being provided as required by the Internal Revenue Code or to meet a specific state’s requirement.
The Funds designate the following amounts or, if subsequently determined to be different, the maximum amount allowable for their fiscal year ended December 31, 2017:
Federal and State Income Tax | ||||||||||||||||
| Long Term Capital Gain Distributions | Qualified Dividend Income* | Corporate Dividends Received Deduction* | U.S. Treasury Obligations* | |||||||||||||
Invesco Balanced-Risk Retirement Now Fund | $ | 380,617 | 0.00 | % | 0.00 | % | 9.08 | % | ||||||||
Invesco Balanced-Risk Retirement 2020 Fund | — | 0.00 | % | 0.00 | % | 8.50 | % | |||||||||
Invesco Balanced-Risk Retirement 2030 Fund | — | 0.00 | % | 0.00 | % | 7.32 | % | |||||||||
Invesco Balanced-Risk Retirement 2040 Fund | — | 0.00 | % | 0.00 | % | 5.94 | % | |||||||||
Invesco Balanced-Risk Retirement 2050 Fund | — | 0.00 | % | 0.00 | % | 4.98 | % | |||||||||
| * | The above percentages are based on ordinary income dividends paid to shareholders during each Fund’s fiscal year. |
58 Invesco Balanced-Risk Retirement Funds
Trustees and Officers
The address of each trustee and officer is AIM Growth Series (Invesco Growth Series) (the “Trust”), 11 Greenway Plaza, Suite 1000, Houston, Texas 77046-1173. The trustees serve for the life of the Trust, subject to their earlier death, incapacitation, resignation, retirement or removal as more specifically provided in the Trust’s organizational documents. Each officer serves for a one year term or until their successors are elected and qualified. Column two below includes length of time served with predecessor entities, if any.
Name, Year of Birth and Position(s) Held with the Trust | Trustee and/ or Officer Since | Principal Occupation(s) During Past 5 Years | Number of Funds in Fund Complex Overseen by Trustee | Other Directorship(s) Held by Trustee During Past 5 Years | ||||
| Interested Persons | ||||||||
| Martin L. Flanagan1 — 1960 Trustee | 2007 | Executive Director, Chief Executive Officer and President, Invesco Ltd. (ultimate parent of Invesco and a global investment management firm); Trustee, The Invesco Funds; Vice Chair, Investment Company Institute; and Member of Executive Board, SMU Cox School of Business
Formerly: Advisor to the Board, Invesco Advisers, Inc. (formerly known as Invesco Institutional (N.A.), Inc.); Chairman and Chief Executive Officer, Invesco Advisers, Inc. (registered investment adviser); Director, Chairman, Chief Executive Officer and President, Invesco Holding Company (US), Inc. (formerly IVZ Inc.) (holding company), Invesco Group Services, Inc. (service provider) and Invesco North American Holdings, Inc. (holding company); Director, Chief Executive Officer and President, Invesco Holding Company Limited (parent of Invesco and a global investment management firm); Director, Invesco Ltd.; Chairman, Investment Company Institute and President, Co-Chief Executive Officer, Co-President, Chief Operating Officer and Chief Financial Officer, Franklin Resources, Inc. (global investment management organization) | 158 | None | ||||
| Philip A. Taylor2 — 1954 Trustee and Senior Vice President | 2006 | Head of the Americas and Senior Managing Director, Invesco Ltd.; Director, Invesco Advisers, Inc. (formerly known as Invesco Institutional (N.A.), Inc.) (registered investment adviser); Director, Chairman, Chief Executive Officer and President, Invesco Management Group, Inc. (formerly known as Invesco Aim Management Group, Inc.) (financial services holding company); Director and Chairman, Invesco Investment Services, Inc. (formerly known as Invesco Aim Investment Services, Inc.) (registered transfer agent); Chief Executive Officer, Invesco Corporate Class Inc. (corporate mutual fund company); Director, Chairman and Chief Executive Officer, Invesco Canada Ltd. (formerly known as Invesco Trimark Ltd./Invesco Trimark Ltèe) (registered investment adviser and registered transfer agent); Trustee and Senior Vice President, The Invesco Funds; Director, Invesco Investment Advisers LLC (formerly known as Van Kampen Asset Management).
Formerly: Co-Chairman, Co-President and Co-Chief Executive Officer, Invesco Advisers, Inc. (formerly known as Invesco Institutional (N.A.), Inc.) (registered investment adviser); Director, Chief Executive Officer and President, Van Kampen Exchange Corp; President and Principal Executive Officer, The Invesco Funds (other than AIM Treasurer’s Series Trust (Invesco Treasurer’s Series Trust), Short-Term Investments Trust and Invesco Management Trust); Executive Vice President, The Invesco Funds (AIM Treasurer’s Series Trust (Invesco Treasurer’s Series Trust), Short-Term Investments Trust and Invesco Management Trust only); Director and President, INVESCO Funds Group, Inc. (registered investment adviser and registered transfer agent); Director and Chairman, IVZ Distributors, Inc. (formerly known as INVESCO Distributors, Inc.) (registered broker dealer); Director, President and Chairman, Invesco Inc. (holding company), Invesco Canada Holdings Inc. (holding company), Trimark Investments Ltd./Placements Trimark Ltèe and Invesco Financial Services Ltd/Services Financiers Invesco Ltèe; Chief Executive Officer, Invesco Canada Fund Inc. (corporate mutual fund company); Director and Chairman, Van Kampen Investor Services Inc.; Director, Chief Executive Officer and President, 1371 Preferred Inc. (holding company) and Van Kampen Investments Inc.; Director and President, AIM GP Canada Inc. (general partner for limited partnerships) and Van Kampen Advisors, Inc.; Director and Chief Executive Officer, Invesco Trimark Dealer Inc. (registered broker dealer); Director, Invesco Distributors, Inc. (formerly known as Invesco Aim Distributors, Inc.) (registered broker dealer); Manager, Invesco PowerShares Capital Management LLC; Director, Chief Executive Officer and President, Invesco Advisers, Inc.; Director, Chairman, Chief Executive Officer and President, Invesco Aim Capital Management, Inc.; President, Invesco Trimark Dealer Inc. and Invesco Trimark Ltd./Invesco Trimark Ltèe; Director and President, AIM Trimark Corporate Class Inc. and AIM Trimark Canada Fund Inc.; Senior Managing Director, Invesco Holding Company Limited; Director and Chairman, Fund Management Company (former registered broker dealer); President and Principal Executive Officer, The Invesco Funds (AIM Treasurer’s Series Trust (Invesco Treasurer’s Series Trust), and Short-Term Investments Trust only); President, AIM Trimark Global Fund Inc. and AIM Trimark Canada Fund Inc. | 158 | None |
| 1 | Mr. Flanagan is considered an interested person (within the meaning of Section 2(a)(19) of the 1940 Act) of the Trust because he is an officer of the Adviser to the Trust, and an officer and a director of Invesco Ltd., ultimate parent of the Adviser. |
| 2 | Mr. Taylor is considered an interested person (within the meaning of Section 2(a)(19) of the 1940 Act) of the Trust because he is an officer and a director of the Adviser. |
T-1 Invesco Balanced-Risk Retirement Funds
Trustees and Officers—(continued)
Name, Year of Birth and Position(s) Held with the Trust | Trustee and/ or Officer Since | Principal Occupation(s) During Past 5 Years | Number of Funds in Fund Complex Overseen by Trustee | Other Directorship(s) Past 5 Years | ||||
| Independent Trustees | ||||||||
Bruce L. Crockett — 1944 Trustee and Chair | 2001 | Chairman, Crockett Technologies Associates (technology consulting company)
Formerly: Director, Captaris (unified messaging provider); Director, President and Chief Executive Officer, COMSAT Corporation; Chairman, Board of Governors of INTELSAT (international communications company); ACE Limited (insurance company); Independent Directors Council and Investment Company Institute: Member of the Audit Committee, Investment Company Institute; Member of the Executive Committee and Chair of the Governance Committee, Independent Directors Council | 158 | Director and Chairman of the Audit Committee, ALPS (Attorneys Liability Protection Society) (insurance company); Director and Member of the Audit Committee and Compensation Committee, Ferroglobe PLC (metallurgical company) | ||||
David C. Arch — 1945 Trustee | 2010 | Chairman of Blistex Inc. (consumer health care products manufacturer); Member, World Presidents’ Organization | 158 | Board member of the Illinois Manufacturers’ Association | ||||
Jack M. Fields — 1952 Trustee | 2001 | Chief Executive Officer, Twenty First Century Group, Inc. (government affairs company); and Chairman, Discovery Learning Alliance (non-profit)
Formerly: Owner and Chief Executive Officer, Dos Angeles Ranch L.P. (cattle, hunting, corporate entertainment); Director, Insperity, Inc. (formerly known as Administaff) (human resources provider); Chief Executive Officer, Texana Timber LP (sustainable forestry company); Director of Cross Timbers Quail Research Ranch (non-profit); and member of the U.S. House of Representatives | 158 | None | ||||
Cynthia Hostetler — 1962 Trustee | 2017 | Non-Executive Director and Trustee of a number of public and private business corporations
Formerly: Head of Investment Funds and Private Equity, Overseas Private Investment Corporation; President, First Manhattan Bancorporation, Inc.; Attorney, Simpson Thacher & Bartlett LLP | 158 | Vulcan Materials Company (construction materials company); Trilinc Global Impact Fund; Aberdeen Investment Funds (4 portfolios); Artio Global Investment LLC (mutual fund complex); Edgen Group, Inc. (specialized energy and infrastructure products distributor) | ||||
Eli Jones — 1961 Trustee | 2016 | Professor and Dean, Mays Business School — Texas A&M University
Formerly: Professor and Dean, Walton College of Business, University of Arkansas and E.J. Ourso College of Business, Louisiana State University; Director, Arvest Bank | 158 | Insperity, Inc. (formerly known as Administaff) (human resources provider) | ||||
Prema Mathai-Davis — 1950 Trustee | 2001 | Retired. | 158 | None | ||||
Teresa M. Ressel — 1962 Trustee | 2017 | Non-executive director and trustee of a number of public and private business corporations
Formerly: Chief Financial Officer, Olayan America, The Olayan Group (international investor/commercial/industrial); Chief Executive Officer, UBS Securities LLC; Group Chief Operating Officer, Americas, UBS AG; Assistant Secretary for Management & Budget and CFO, US Department of the Treasury | 158 | Atlantic Power Corporation (power generation company); ON Semiconductor Corp. (semiconductor supplier) | ||||
Ann Barnett Stern — 1957 Trustee | 2017 | President and Chief Executive Officer, Houston Endowment Inc. (private philanthropic institution)
Formerly: Executive Vice President and General Counsel, Texas Children’s Hospital; Attorney, Beck, Redden and Secrest, LLP; Business Law Instructor, University of St. Thomas; Attorney, Andrews & Kurth LLP | 158 | Federal Reserve Bank of Dallas | ||||
Raymond Stickel, Jr. — 1944 Trustee | 2005 | Retired.
Formerly: Director, Mainstay VP Series Funds, Inc. (25 portfolios); Partner, Deloitte & Touche | 158 | None | ||||
Robert C. Troccoli — 1949 Trustee | 2016 | Adjunct Professor, University of Denver — Daniels College of Business
Formerly: Senior Partner, KPMG LLP | 158 | None | ||||
Christopher L. Wilson — 1957 Trustee | 2017 | Non-executive director and trustee of a number of public and private business corporations
Formerly: Managing Partner, CT2, LLC (investing and consulting firm); President/Chief Executive Officer, Columbia Funds, Bank of America Corporation; President/Chief Executive Officer, CDC IXIS Asset Management Services, Inc.; Principal & Director of Operations, Scudder Funds, Scudder, Stevens & Clark, Inc.; Assistant Vice President, Fidelity Investments | 158 | TD Asset Management USA Inc. (mutual fund complex) (22 portfolios); ISO New England, Inc. (non-profit organization managing regional electricity market) |
T-2 Invesco Balanced-Risk Retirement Funds
Trustees and Officers—(continued)
Name, Year of Birth and Position(s) Held with the Trust | Trustee and/ or Officer Since | Principal Occupation(s) During Past 5 Years | Number of Funds in Fund Complex Overseen by Trustee | Other Directorship(s) Past 5 Years | ||||
| Other Officers | ||||||||
Sheri Morris — 1964 President, Principal Executive Officer and Treasurer | 1999 | President, Principal Executive Officer and Treasurer, The Invesco Funds; Vice President, Invesco Advisers, Inc. (formerly known as Invesco Institutional (N.A.), Inc.) (registered investment adviser); and Vice President, PowerShares Exchange-Traded Fund Trust, PowerShares Exchange-Traded Fund Trust II, PowerShares India Exchange-Traded Fund Trust, PowerShares Actively Managed Exchange-Traded Fund Trust, PowerShares Actively Managed Exchange-Traded Commodity Fund Trust and PowerShares Exchange-Traded Self-Indexed Fund Trust
Formerly: Vice President and Principal Financial Officer, The Invesco Funds; Vice President, Invesco Aim Advisers, Inc., Invesco Aim Capital Management, Inc. and Invesco Aim Private Asset Management, Inc.; Assistant Vice President and Assistant Treasurer, The Invesco Funds and Assistant Vice President, Invesco Advisers, Inc., Invesco Aim Capital Management, Inc. and Invesco Aim Private Asset Management, Inc.; and Treasurer, PowerShares Exchange-Traded Fund Trust, PowerShares Exchange-Traded Fund Trust II, PowerShares India Exchange-Traded Fund Trust and PowerShares Actively Managed Exchange-Traded Fund Trust | N/A | N/A | ||||
Russell C. Burk — 1958 Senior Vice President and Senior Officer | 2005 | Senior Vice President and Senior Officer, The Invesco Funds | N/A | N/A | ||||
John M. Zerr — 1962 Senior Vice President, Chief Legal Officer and Secretary | 2006 | Director, Senior Vice President, Secretary and General Counsel, Invesco Management Group, Inc. (formerly known as Invesco AIM Management Group, Inc.); Senior Vice President, Invesco Advisers, Inc. (formerly known as Invesco Institutional (N.A.), Inc.) (registered investment adviser); Senior Vice President and Secretary, Invesco Distributors, Inc. (formerly known as Invesco AIM Distributors, Inc.); Director, Vice President and Secretary, Invesco Investment Services, Inc. (formerly known as Invesco AIM Investment Services, Inc.) Senior Vice President, Chief Legal Officer and Secretary, The Invesco Funds; Managing Director, Invesco PowerShares Capital Management LLC; Director, Secretary and General Counsel, Invesco Investment Advisers LLC (formerly known as Van Kampen Asset Management); Secretary and General Counsel, Invesco Capital Markets, Inc. (formerly known as Van Kampen Funds Inc.) and Chief Legal Officer, PowerShares Exchange-Traded Fund Trust, PowerShares Exchange-Traded Fund Trust II, PowerShares India Exchange-Traded Fund Trust, PowerShares Actively Managed Exchange-Traded Fund Trust, PowerShares Actively Managed Exchange-Traded Commodity Fund Trust and PowerShares Exchange-Traded Self-Indexed Fund Trust; Manager and Secretary, Invesco Indexing LLC
Formerly: Director, Secretary, General Counsel and Senior Vice President, Van Kampen Exchange Corp.; Director, Vice President and Secretary, IVZ Distributors, Inc. (formerly known as INVESCO Distributors, Inc.); Director and Vice President, INVESCO Funds Group, Inc.; Director and Vice President, Van Kampen Advisors Inc.; Director, Vice President, Secretary and General Counsel, Van Kampen Investor Services Inc.; Director, Invesco Distributors, Inc. (formerly known as Invesco AIM Distributors, Inc.); Director, Senior Vice President, General Counsel and Secretary, Invesco AIM Advisers, Inc. and Van Kampen Investments Inc.; Director, Vice President and Secretary, Fund Management Company; Director, Senior Vice President, Secretary, General Counsel and Vice President, Invesco AIM Capital Management, Inc.; Chief Operating Officer and General Counsel, Liberty Ridge Capital, Inc. (an investment adviser); Vice President and Secretary, PBHG Funds (an investment company) and PBHG Insurance Series Fund (an investment company); Chief Operating Officer, General Counsel and Secretary, Old Mutual Investment Partners (a broker-dealer); General Counsel and Secretary, Old Mutual Fund Services (an administrator) and Old Mutual Shareholder Services (a shareholder servicing center); Executive Vice President, General Counsel and Secretary, Old Mutual Capital, Inc. (an investment adviser); and Vice President and Secretary, Old Mutual Advisors Funds (an investment company) | N/A | N/A | ||||
Gregory G. McGreevey — 1962 Senior Vice President | 2012 | Senior Managing Director, Invesco Ltd.; Director, Chairman, President, and Chief Executive Officer, Invesco Advisers, Inc. (formerly known as Invesco Institutional (N.A.), Inc.) (registered investment adviser); Senior Vice President, Invesco Management Group, Inc.; Director, Invesco Mortgage Capital, Inc. and Invesco Senior Secured Management, Inc.; and Senior Vice President, The Invesco Funds
Formerly: Assistant Vice President, The Invesco Funds | N/A | N/A | ||||
Kelli Gallegos — 1970 Vice President, Principal Financial Officer and Assistant Treasurer | 2008 | Vice President, Principal Financial Officer and Assistant Treasurer, The Invesco Funds; Assistant Treasurer, Invesco PowerShares Capital Management LLC, PowerShares Exchange-Traded Fund Trust, PowerShares Exchange-Traded Fund Trust II, PowerShares India Exchange-Traded Fund Trust, PowerShares Actively Managed Exchange-Traded Fund Trust, PowerShares Actively Managed Exchange-Traded Commodity Fund Trust and PowerShares Exchange-Traded Self-Indexed Fund Trust
Formerly: Assistant Vice President, The Invesco Funds | N/A | N/A |
T-3 Invesco Balanced-Risk Retirement Funds
Trustees and Officers—(continued)
Name, Year of Birth and Position(s) Held with the Trust | Trustee and/ or Officer Since | Principal Occupation(s) During Past 5 Years | Number of Funds in Fund Complex Overseen by Trustee | Other Directorship(s) Past 5 Years | ||||
| Other Officers—(continued) | ||||||||
Tracy Sullivan — 1962 Vice President, Chief Tax Officer and Assistant Treasurer | 2008 | Vice President, Chief Tax Officer and Assistant Treasurer, The Invesco Funds; Assistant Treasurer, Invesco PowerShares Capital Management LLC, PowerShares Exchange-Traded Fund Trust, PowerShares Exchange-Traded Fund Trust II, PowerShares India Exchange-Traded Fund Trust, PowerShares Actively Managed Exchange-Traded Fund Trust,PowerShares Actively Managed Exchange-Traded Commodity Fund Trust and PowerShares Exchange-Traded Self-Indexed Fund Trust
Formerly: Assistant Vice President, The Invesco Funds | N/A | N/A | ||||
Crissie M. Wisdom — 1969 Anti-Money Laundering Compliance Officer | 2013 | Anti-Money Laundering Compliance Officer, Invesco Advisers, Inc. (formerly known as Invesco Institutional (N.A.), Inc.) (registered investment adviser), Invesco Capital Markets, Inc. (formerly known as Van Kampen Funds Inc.), Invesco Distributors, Inc., Invesco Investment Services, Inc., Invesco Management Group, Inc., The Invesco Funds, and PowerShares Exchange-Traded Fund Trust, PowerShares Exchange-Traded Fund Trust II, PowerShares India Exchange-Traded Fund Trust, PowerShares Actively Managed Exchange-Traded Fund Trust,PowerShares Actively Managed Exchange-Traded Commodity Fund Trust and PowerShares Exchange-Traded Self-Indexed Fund Trust; Anti-Money Laundering Compliance Officer and Bank Secrecy Act Officer, INVESCO National Trust Company and Invesco Trust Company; and Fraud Prevention Manager and Controls and Risk Analysis Manager for Invesco Investment Services, Inc.
Formerly: Anti-Money Laundering Compliance Officer, Van Kampen Exchange Corp. | N/A | N/A | ||||
Robert R. Leveille — 1969 Chief Compliance Officer | 2016 | Chief Compliance Officer, Invesco Advisers, Inc. (registered investment adviser); and Chief Compliance Officer, The Invesco Funds
Formerly: Chief Compliance Officer, Putnam Investments and the Putnam Funds | N/A | N/A |
The Statement of Additional Information of the Trust includes additional information about the Fund’s Trustees and is available upon request, without charge, by calling 1.800.959.4246. Please refer to the Fund’s Statement of Additional Information for information on the Fund’s sub-advisers.
Office of the Fund 11 Greenway Plaza, Suite 1000 Houston, TX 77046-1173 | Investment Adviser Invesco Advisers, Inc. 1555 Peachtree Street, N.E. Atlanta, GA 30309 | Distributor Invesco Distributors, Inc. 11 Greenway Plaza, Suite 1000 Houston, TX 77046-1173 | Auditors PricewaterhouseCoopers LLP 1000 Louisiana Street, Suite 5800 Houston, TX 77002-5678 | |||
Counsel to the Fund Stradley Ronon Stevens & Young, LLP 2005 Market Street, Suite 2600 Philadelphia, PA 19103-7018 | Counsel to the Independent Trustees Goodwin Procter LLP 901 New York Avenue, N.W. Washington, D.C. 20001 | Transfer Agent Invesco Investment Services, Inc. 11 Greenway Plaza, Suite 1000 Houston, TX 77046-1173 | Custodian State Street Bank and Trust Company 225 Franklin Street Boston, MA 02110-2801 | |||
T-4 Invesco Balanced-Risk Retirement Funds
Explore High-Conviction Investing with Invesco

Go paperless with eDelivery
Visit invesco.com/edelivery to enjoy the convenience and security of anytime electronic access to your investment documents.
With eDelivery, you can elect to have any or all of the following materials delivered straight to your inbox to download, save and print from your own computer:
| ∎ | Fund reports and prospectuses |
| ∎ | Quarterly statements |
| ∎ | Daily confirmations |
| ∎ | Tax forms |
Invesco mailing information
Send general correspondence to Invesco Investment Services, Inc., P.O. Box 219078, Kansas City, MO 64121-9078.
Important notice regarding delivery of security holder documents
To reduce Fund expenses, only one copy of most shareholder documents may be mailed to shareholders with multiple accounts at the same address (Householding). Mailing of your shareholder documents may be householded indefinitely unless you instruct us otherwise. If you do not want the mailing of these documents to be combined with those for other members of your household, please contact Invesco Investment Services, Inc. at 800 959 4246 or contact your financial institution. We will begin sending you individual copies for each account within 30 days after receiving your request.
Fund holdings and proxy voting information
The Fund provides a complete list of its holdings four times in each fiscal year, at the quarter ends. For the second and fourth quarters, the lists appear in the Fund’s semiannual and annual reports to shareholders. For the first and third quarters, the Fund files the lists with the Securities and Exchange Commission (SEC) on Form N-Q. The most recent list of portfolio holdings is available at invesco.com/completeqtrholdings. Shareholders can also look up the Fund’s Forms N-Q on the SEC website at sec.gov. Copies of the Fund’s Forms N-Q may be reviewed and copied at the SEC Public Reference Room in Washington, D.C. You can obtain information on the operation of the Public Reference Room, including information about duplicating fee charges, by calling 202 551 8090 or 800 732 0330, or by electronic request at the following email address: publicinfo@sec.gov. The SEC file numbers for the Fund are shown below.
A description of the policies and procedures that the Fund uses to determine how to vote proxies relating to portfolio securities is available without charge, upon request, from our Client Services department at 800 959 4246 or at invesco.com/proxyguidelines. The information is also available on the SEC website, sec.gov.
Information regarding how the Fund voted proxies related to its portfolio securities during the most recent 12-month period ended June 30 is available at invesco.com/proxysearch. The information is also available on the SEC website, sec.gov. Invesco Advisers, Inc. is an investment adviser; it provides investment advisory services to individual and institutional clients and does not sell securities. Invesco Distributors, Inc. is the US distributor for Invesco Ltd.’s retail mutual funds, exchange-traded funds and institutional money market funds. Both are wholly owned, indirect subsidiaries of Invesco Ltd. |  |
| SEC file numbers: 811-02699 and 002-57526 Invesco Distributors, Inc. | IBRR-AR-1 | 02222018 | 0824 |
| ||||
 |
Annual Report to Shareholders
|
December 31, 2017 | ||
| ||||
Invesco Allocation Funds Invesco Conservative Allocation Fund Invesco Growth Allocation Fund Invesco Moderate Allocation Fund | ||||

Invesco Conservative Allocation Fund’s Long-Term Performance
Results of a $10,000 Investment – Oldest Share Class(es)
Fund and index data from 12/31/07
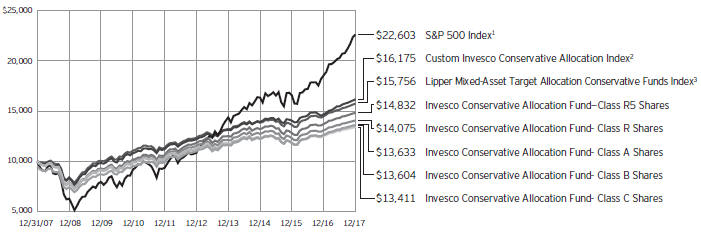
1 Source: FactSet Research Systems Inc.
2 Source(s): Invesco, FactSet Research Systems Inc.
3 Source: Lipper Inc.
Past performance cannot guarantee comparable future results.
The data shown in the chart include reinvested distributions, applicable sales charges and Fund expenses including management fees. Results for Class B shares are calculated as if a hypothetical shareholder had liquidated his entire investment in the Fund at the close of the reporting period and paid the contingent deferred sales charges, if applicable.
Index results include reinvested dividends, but they do not reflect sales charges. Performance of the peer group, if applicable, reflects fund expenses and management fees; performance of a market index does not. Performance shown in the chart and table(s) does not reflect deduction of taxes a shareholder would pay on Fund distributions or sale of Fund shares.
| 2 | Invesco Allocation Funds |
| Average Annual Total Returns | ||||
As of 12/31/17, including maximum applicable sales charges |
| |||
Class A Shares | ||||
Inception (4/29/05) | 4.16 | % | ||
10 Years | 3.15 | |||
5 Years | 3.16 | |||
1 Year | 1.92 | |||
Class B Shares | ||||
Inception (4/29/05) | 4.13 | % | ||
10 Years | 3.13 | |||
5 Years | 3.22 | |||
1 Year | 2.02 | |||
Class C Shares | ||||
Inception (4/29/05) | 3.86 | % | ||
10 Years | 2.98 | |||
5 Years | 3.57 | |||
1 Year | 6.02 | |||
Class R Shares | ||||
Inception (4/29/05) | 4.36 | % | ||
10 Years | 3.48 | |||
5 Years | 4.06 | |||
1 Year | 7.52 | |||
Class S Shares | ||||
10 Years | 3.80 | % | ||
5 Years | 4.44 | |||
1 Year | 7.97 | |||
Class Y Shares | ||||
10 Years | 3.95 | % | ||
5 Years | 4.61 | |||
1 Year | 8.15 | |||
Class R5 Shares | ||||
Inception (4/29/05) | 4.91 | % | ||
10 Years | 4.02 | |||
5 Years | 4.64 | |||
1 Year | 8.16 | |||
Class R6 Shares | ||||
10 Years | 3.74 | % | ||
5 Years | 4.35 | |||
1 Year | 8.00 | |||
Class S shares incepted on June 3, 2011. Performance shown prior to that date is that of Class A shares and includes the 12b-1 fees applicable to Class A shares.
Class Y shares incepted on October 3, 2008. Performance shown prior to that date is that of Class A shares and includes the 12b-1 fees applicable to Class A shares.
Class R6 shares incepted on April 4, 2017. Performance shown prior to that date is that of Class A shares and includes the 12b-1 fees applicable to Class A shares.
The performance data quoted represent past performance and cannot guarantee comparable future results; current performance may be lower or higher. Please visit invesco.com/performance for the most recent month-end performance. Performance figures reflect reinvested distributions, changes in net asset value and the effect of the maximum sales charge unless otherwise stated. Investment return and principal value will fluctuate so that you may have a gain or loss when you sell shares.
The total annual Fund operating expense ratio set forth in the most recent Fund prospectus as of the date of this report for Class A, Class B, Class C, Class R, Class S, Class Y, Class R5 and Class R6 was 1.05%, 1.80%, 1.80%, 1.30%, 0.95%, 0.80%, 0.75% and 0.70%, respectively.1 The expense ratios presented above may vary from the expense ratios presented in other sections of this report that are based on expenses incurred during the period covered by this report.
Class A share performance reflects the maximum 5.50% sales charge, and Class B and Class C share performance reflects the applicable contingent deferred sales charge (CDSC) for the period involved. The CDSC on Class B shares declines from 5% beginning at the time of purchase to 0% at the beginning of the seventh year. The CDSC on Class C shares is 1% for the first year after purchase. Class R, Class S, Class Y, Class R5 and Class R6 shares do not have a front-end sales charge or a CDSC; therefore, performance is at net asset value.
The performance of the Fund’s share classes will differ primarily due to different sales charge structures and class expenses.
Fund performance reflects any applicable fee waivers and/or expense reimbursements. Had the adviser not waived fees and/or reimbursed expenses currently or in the past, returns would have been lower. See current prospectus for more information.
| 1 | The expense ratio includes acquired fund fees and expenses of the underlying funds in which the Fund invests of 0.55% for Invesco Conservative Allocation Fund. |
| 3 | Invesco Allocation Funds |
Invesco Growth Allocation Fund’s Long-Term Performance
Results of a $10,000 Investment – Oldest Share Class(es)
Fund and index data from 12/31/07
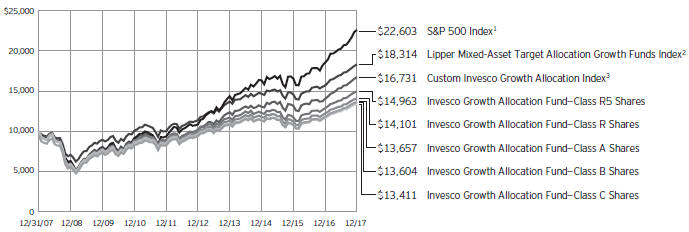
1 Source: FactSet Research Systems Inc.
2 Source: Lipper Inc.
3 Source(s): Invesco, FactSet Research Systems Inc.
Past performance cannot guarantee comparable future results.
The data shown in the chart include reinvested distributions, applicable sales charges and Fund expenses including management fees. Results for Class B shares are calculated as if a hypothetical shareholder had liquidated his entire investment in the Fund at the close of the reporting period and paid the contingent deferred sales charges, if applicable.
Index results include reinvested dividends, but they do not reflect sales charges. Performance of the peer group, if applicable, reflects fund expenses and management fees; performance of a market index does not. Performance shown in the chart and table(s) does not reflect deduction of taxes a shareholder would pay on Fund distributions or sale of Fund shares.
| 4 | Invesco Allocation Funds |
| Average Annual Total Returns | ||||
As of 12/31/17, including maximum applicable sales charges |
| |||
Class A Shares | ||||
Inception (4/30/04) | 5.73 | % | ||
10 Years | 3.17 | |||
5 Years | 6.49 | |||
1 Year | 9.41 | |||
Class B Shares | ||||
Inception (4/30/04) | 5.71 | % | ||
10 Years | 3.13 | |||
5 Years | 6.57 | |||
1 Year | 9.96 | |||
Class C Shares | ||||
Inception (4/30/04) | 5.38 | % | ||
10 Years | 2.98 | |||
5 Years | 6.89 | |||
1 Year | 13.94 | |||
Class R Shares | ||||
Inception (4/30/04) | 5.91 | % | ||
10 Years | 3.50 | |||
5 Years | 7.43 | |||
1 Year | 15.43 | |||
Class S Shares | ||||
10 Years | 3.84 | % | ||
5 Years | 7.80 | |||
1 Year | 15.90 | |||
Class Y Shares | ||||
10 Years | 4.00 | % | ||
5 Years | 7.97 | |||
1 Year | 16.08 | |||
Class R5 Shares | ||||
Inception (4/30/04) | 6.52 | % | ||
10 Years | 4.11 | |||
5 Years | 8.10 | |||
1 Year | 16.26 | |||
Class R6 Shares | ||||
10 Years | 3.78 | % | ||
5 Years | 7.75 | |||
1 Year | 16.05 | |||
Class S shares incepted on September 25, 2009. Performance shown prior to that date is that of Class A shares and includes the 12b-1 fees applicable to Class A shares.
Class Y shares incepted on October 3, 2008. Performance shown prior to that date is that of Class A shares and includes the 12b-1 fees applicable to Class A shares.
Class R6 shares incepted on April 4, 2017. Performance shown prior to that date is that of Class A shares and includes the 12b-1 fees applicable to Class A shares.
The performance data quoted represent past performance and cannot guarantee comparable future results; current performance may be lower or higher. Please visit invesco.com/performance for the most recent month-end performance. Performance figures reflect reinvested distributions, changes in net asset value and the effect of the maximum sales charge unless otherwise stated. Investment return and principal value will fluctuate so that you may have a gain or loss when you sell shares.
The total annual Fund operating expense ratio set forth in the most recent Fund prospectus as of the date of this report for Class A, Class B, Class C, Class R, Class S, Class Y, Class R5 and Class R6 shares was 1.15%, 1.90%, 1.90%, 1.40%, 1.05%, 0.90%, 0.77% and 0.72%, respectively.1 The expense ratios presented above may vary from the expense ratios presented in other sections of this report that are based on expenses incurred during the period covered by this report.
Class A share performance reflects the maximum 5.50% sales charge, and Class B and Class C share performance reflects the applicable contingent deferred sales charge (CDSC) for the period involved. The CDSC on Class B shares declines from 5% beginning at the time of purchase to 0% at the beginning of the seventh year. The CDSC on Class C shares is 1% for the first year after purchase. Class R, Class S, Class Y, Class R5 and Class R6 shares do not have a front-end sales charge or a CDSC; therefore, performance is at net asset value.
The performance of the Fund’s share classes will differ primarily due to different sales charge structures and class expenses.
Fund performance reflects any applicable fee waivers and/or expense reimbursements. Had the adviser not waived fees and/or reimbursed expenses currently or in the past, returns would have been lower. See current prospectus for more information.
| 1 | The expense ratio includes acquired fund fees and expenses of the underlying funds in which the Fund invests of 0.61% for Invesco Growth Allocation Fund. |
| 5 | Invesco Allocation Funds |
Invesco Moderate Allocation Fund’s Long-Term Performance
Results of a $10,000 Investment – Oldest Share Class(es)
Fund and index data from 12/31/07
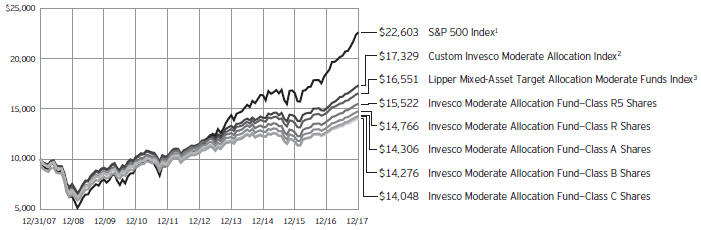
1 Source: FactSet Research Systems Inc.
2 Source(s): Invesco, FactSet Research Systems Inc.
3 Source: Lipper Inc.
Past performance cannot guarantee comparable future results.
The data shown in the chart include reinvested distributions, applicable sales charges and Fund expenses including management fees. Results for Class B shares are calculated as if a hypothetical shareholder had liquidated his entire investment in the Fund at the close of the reporting period and paid the contingent deferred sales charges, if applicable.
Index results include reinvested dividends, but they do not reflect sales charges. Performance of the peer group, if applicable, reflects fund expenses and management fees; performance of a market index does not. Performance shown in the chart and table(s) does not reflect deduction of taxes a shareholder would pay on Fund distributions or sale of Fund shares.
| 6 | Invesco Allocation Funds |
| Average Annual Total Returns | ||||
As of 12/31/17, including maximum applicable sales charges |
| |||
Class A Shares | ||||
Inception (4/30/04) | 5.29 | % | ||
10 Years | 3.65 | |||
5 Years | 4.98 | |||
1 Year | 6.48 | |||
Class B Shares | ||||
Inception (4/30/04) | 5.27 | % | ||
10 Years | 3.62 | |||
5 Years | 5.05 | |||
1 Year | 6.81 | |||
Class C Shares | ||||
Inception (4/30/04) | 4.94 | % | ||
10 Years | 3.46 | |||
5 Years | 5.38 | |||
1 Year | 10.82 | |||
Class R Shares | ||||
Inception (4/30/04) | 5.47 | % | ||
10 Years | 3.97 | |||
5 Years | 5.91 | |||
1 Year | 12.41 | |||
Class S Shares | ||||
10 Years | 4.31 | % | ||
5 Years | 6.27 | |||
1 Year | 12.70 | |||
Class Y Shares | ||||
10 Years | 4.47 | % | ||
5 Years | 6.43 | |||
1 Year | 12.85 | |||
Class R5 Shares | ||||
Inception (4/30/04) | 6.00 | % | ||
10 Years | 4.49 | |||
5 Years | 6.43 | |||
1 Year | 12.97 | |||
Class R6 Shares | ||||
10 Years | 4.25 | % | ||
5 Years | 6.20 | |||
1 Year | 12.82 | |||
Class S shares incepted on September 25, 2009. Performance shown prior to that date is that of Class A shares and includes the 12b-1 fees applicable to Class A shares.
Class Y shares incepted on October 3, 2008. Performance shown prior to that date is that of Class A shares and includes the 12b-1 fees applicable to Class A shares.
Class R6 shares incepted on April 4, 2017. Performance shown prior to that date is that of Class A shares and includes the 12b-1 fees applicable to Class A shares.
The performance data quoted represent past performance and cannot guarantee comparable future results; current performance may be lower or higher. Please visit invesco.com/performance for the most recent month-end performance. Performance figures reflect reinvested distributions, changes in net asset value and the effect of the maximum sales charge unless otherwise stated. Investment return and principal value will fluctuate so that you may have a gain or loss when you sell shares.
The total annual Fund operating expense ratio set forth in the most recent Fund prospectus as of the date of this report for Class A, Class B, Class C, Class R, Class S, Class Y, Class R5 and Class R6 shares was 1.06%, 1.81%, 1.81%, 1.31%, 0.96%, 0.81%, 0.75% and 0.69%, respectively.1 The expense ratios presented above may vary from the expense ratios presented in other sections of this report that are based on expenses incurred during the period covered by this report.
Class A share performance reflects the maximum 5.50% sales charge, and Class B and Class C share performance reflects the applicable contingent deferred sales charge (CDSC) for the period involved. The CDSC on Class B shares declines from 5% beginning at the time of purchase to 0% at the beginning of the seventh year. The CDSC on Class C shares is 1% for the first year after purchase. Class R, Class S, Class Y, Class R5 and Class R6 shares do not have a front-end sales charge or a CDSC; therefore, performance is at net asset value.
The performance of the Fund’s share classes will differ primarily due to different sales charge structures and class expenses.
Fund performance reflects any applicable fee waivers and/or expense reimbursements. Had the adviser not waived fees and/or reimbursed expenses currently or in the past, returns would have been lower. See current prospectus for more information.
| 1 | The expense ratio includes acquired fund fees and expenses of the underlying funds in which the Fund invests of 0.58% for Invesco Moderate Allocation Fund. |
| 7 | Invesco Allocation Funds |
Letters to Shareholders
Philip Taylor | Dear Shareholders: This annual report includes information about your Fund, including performance data and a complete list of its investments as of the close of the reporting period. Inside is a discussion of how your Fund was managed and the factors that affected its performance during the reporting period. Major stock market indexes rose – and set record highs – throughout the reporting period. Generally positive economic data, strong corporate earnings and anticipated tax and regulatory reform contributed to the rally. The US economy expanded during the reporting period, with gross domestic product, the value of all goods and services produced, significantly increasing its growth rate from the first to the third quarter of the year. Tax reform legislation, enacted in December 2017, was a positive for the stock market, but its long-term economic impact was uncertain. Citing positive economic trends – specifically, realized and expected labor market |

conditions and inflation – the US Federal Reserve raised interest rates in March, June and December 2017. While US and global bond markets, as well as emerging market equities, sold off early in the reporting period, they recovered much of their losses during the reporting period. Overseas, economic data were mixed, prompting the European Central Bank and central banks in China and Japan, among other countries, to maintain extraordinarily accommodative monetary policies.
Short-term market volatility can prompt some investors to abandon their investment plans – and can cause others to settle for whatever returns the market has to offer. The investment professionals at Invesco, in contrast, invest with high conviction. This means that, no matter the asset class or the strategy, each investment team has a passion to exceed. We want to help investors achieve better outcomes, such as seeking higher returns, helping mitigate risk and generating income. Of course, investing with high conviction can’t guarantee a profit or ensure success; no investment strategy can. To learn more about how we invest with high conviction, visit invesco.com/HighConviction.
You, too, can invest with high conviction by maintaining a long-term investment perspective and by working with your financial adviser on a regular basis. During periods of short-term market volatility or uncertainty, your financial adviser can keep you focused on your long-term investment goals – a new home, a child’s college education or a secure retirement. He or she also can share research about the economy, the markets and individual investment options.
Visit our website for more information on your investments
Our website, invesco.com/us, offers a wide range of market insights and investment perspectives. On the website, you’ll find detailed information about our funds, including performance, holdings and portfolio manager commentaries. You can access information about your account by completing a simple, secure online registration. To do so, select “Log In” on the right side of the homepage, and then select “Register for Individual Account Access.”
In addition to the resources accessible on our website and through our mobile app, you can obtain timely updates to help you stay informed about the markets and the economy by connecting with Invesco on Twitter, LinkedIn or Facebook. You can access our blog at blog.invesco.us.com. Our goal is to provide you the information you want, when and where you want it.
Finally, I’m pleased to share with you Invesco’s commitment to both the Principles for Responsible Investment and to considering environmental, social and governance issues in our robust investment process. I invite you to learn more at invesco.com/esg.
Have questions?
For questions about your account, contact an Invesco client services representative at 800 959 4246. For Invesco-related questions or comments, please email me directly at phil@invesco.com.
All of us at Invesco look forward to serving your investment management needs. Thank you for investing with us.
| Sincerely, |
|
| Philip Taylor |
| Senior Managing Director, Invesco Ltd. |

| 8 | Invesco Allocation Funds |
Bruce Crockett | Dear Fellow Shareholders: Among the many important lessons I’ve learned in more than 40 years in a variety of business endeavors is the value of a trusted advocate. As independent chair of the Invesco Funds Board, I can assure you that the members of the Board are strong advocates for the interests of investors in Invesco’s mutual funds. We work hard to represent your interests through oversight of the quality of the investment management services your funds receive and other matters important to your investment, including but not limited to: ∎ Ensuring that Invesco offers a diverse lineup of mutual funds that your financial adviser can use to strive to meet your financial needs as your investment goals change over time. ∎ Monitoring how the portfolio management teams of the Invesco funds are performing in light of changing economic and market conditions. |

∎ Assessing each portfolio management team’s investment performance within the context of the investment strategy described in the fund’s prospectus.
∎ Monitoring for potential conflicts of interests that may impact the nature of the services that your funds receive.
We believe one of the most important services we provide our fund shareholders is the annual review of the funds’ advisory and sub-advisory contracts with Invesco Advisers and its affiliates. This review is required by the Investment Company Act of 1940 and focuses on the nature and quality of the services Invesco provides as the adviser to the Invesco funds and the reasonableness of the fees that it charges for those services. Each year, we spend months carefully reviewing information received from Invesco and a variety of independent sources, such as performance and fee data prepared by Lipper, Inc. (a subsidiary of Broadridge Financial Solutions, Inc.), an independent, third-party firm widely recognized as a leader in its field. We also meet with our independent legal counsel and other independent advisers to review and help us assess the information that we have received. Our goal is to assure that you receive quality investment management services for a reasonable fee.
I trust the measures outlined above provide assurance that you have a worthy advocate when it comes to choosing the Invesco Funds.
As always, please contact me at bruce@brucecrockett.com with any questions or concerns you may have. On behalf of the Board, we look forward to continuing to represent your interests and serving your needs.
Sincerely,

Bruce L. Crockett
Independent Chair
Invesco Funds Board of Trustees
| 9 | Invesco Allocation Funds |
Management’s Discussion of Fund Performance
Performance summary – Invesco Conservative Allocation Fund For the year ended December 31, 2017, Class A shares of Invesco Conservative Allocation Fund (the Fund), at net asset value (NAV), underperformed the Fund’s style-specific index, the Custom Invesco Conservative Allocation Index. Your Fund’s long-term performance appears later in this report.
|
| |||
Fund vs. Indexes Total returns, 12/31/16 to 12/31/17, at net asset value (NAV). Performance shown does not include applicable contingent deferred sales charges (CDSC) or front-end sales charges, which would have reduced performance.
|
| |||
Class A Shares | 7.87 | % | ||
Class B Shares | 7.02 | |||
Class C Shares | 7.02 | |||
Class R Shares | 7.52 | |||
Class S Shares | 7.97 | |||
Class Y Shares | 8.15 | |||
Class R5 Shares | 8.16 | |||
Class R6 Shares* | 8.00 | |||
S&P 500 Indexq (Broad Market Index) | 21.83 | |||
Custom Invesco Conservative Allocation Index⬛ (Style-Specific Index) | 10.13 | |||
Lipper Mixed-Asset Target Allocation Conservative Funds Index◆ (Peer Group Index) | 8.78 | |||
Source(s): qFactSet Research Systems Inc.; ⬛Invesco, FactSet Research Systems Inc.; ◆Lipper Inc.
|
| |||
*Class R6 shares incepted on April 4, 2017. See page 3 for more information.
|
| |||
Market conditions and your Fund
Despite highly destructive hurricanes that threatened to derail a years-long economic recovery, the US economy continued to expand throughout the year ended December 31, 2017. Gross domestic product – the value of all goods and services produced in the US – expanded in the first three quarters of 2017.
Given signs of an improving economy, the US Federal Reserve (the Fed) raised interest rates three times during the reporting period, most recently in December 2017; each rate hike was 25 basis points.1 (A basis point is 0.01%.) The Fed pledged that “realized and expected economic conditions relative to its objectives of maximum employment and 2 percent inflation” will guide its future actions. At the close of the reporting period, Fed policy remained accommodative, and the fed funds target rate stood at a range of 1.25% to 1.50% – 75
basis points higher than at the start of the reporting period.1
Higher inventories and a worsening outlook caused oil prices and many energy stocks to decline during the first half of 2017. However, oil prices rose significantly in the second half of the reporting period as expectations for lower supplies increased, partly due to continued OPEC production cuts, and demand began normalizing.
Major US stock market indexes repeatedly hit all-time highs throughout the reporting period. The stock market rally that began after the 2016 presidential election continued throughout the reporting period, fueled by generally positive economic data, strong corporate earnings and improved consumer confidence. Finally, after much debate in Congress, a tax reform bill was signed into law in December 2017, which further strengthened stocks.
Strategic asset class exposures in the Fund are obtained through underlying mutual funds, exchange-traded funds and other pooled investment vehicles targeting a pre-defined level of risk. From an asset class perspective, the Fund’s exposure to US equities through underlying funds was the largest contributor to Fund performance. Specifically, Invesco Equally-Weighted S&P 500 Fund was the largest contributor to Fund performance during the reporting period. PowerShares Russell Top 200 Pure Growth Portfolio also added to returns, in line with broader large-cap growth equities. Within our fixed income allocation, Invesco Core Plus Bond Fund was the largest contributor to Fund performance during the reporting period.
Although no asset classes detracted from absolute Fund performance, underweight exposure to international developed equities versus the Fund’s style-specific benchmark detracted from relative performance, as did tepid returns from allocations to fixed income. In terms of individual holdings, Invesco All Cap Market Neutral Fund detracted from Fund performance due to short holdings that did not perform as expected, particularly those in the health care sector. Invesco Global Targeted Returns Fund also detracted from Fund performance. These non-directional alternatives allocations are included in an effort to reduce the overall risk of the Fund while providing an alternative source of return. Such alternatives allocations tend not to move in lockstep with equities, so in a bull equity market, they can underperform equities. Although Invesco Diversified Dividend Fund posted positive returns, it under-performed the broader equity market during the reporting period.
As part of the Fund’s strategic annual rebalance, we sold its holdings in Invesco Endeavor Fund and established a position in Invesco Global Targeted Returns Fund. Please note that some of the Fund’s
| Portfolio Composition* | ||||
| By fund type, based on total investments | ||||
Fixed Income Funds | 59.7% | |||
Equity Funds | 31.9 | |||
Alternative Funds | 8.0 | |||
Money Market Funds | 0.4 | |||
| * | Based on the Schedule of Investments, which classifies each underlying fund and other investments into broad asset classes based on their predominant investments. |
Total Net Assets
| $323.3 million
|
The Fund’s holdings are subject to change, and there is no assurance that the Fund will continue to hold any particular security.
Data presented here are as of December 31, 2017.
| Fund Nasdaq Symbols | ||
Class A Shares | CAAMX | |
Class B Shares | CMBAX | |
Class C Shares | CACMX | |
Class R Shares | CMARX | |
Class S Shares | CMASX | |
Class Y Shares | CAAYX | |
Class R5 Shares | CMAIX | |
Class R6 Shares | CNSSX | |
| 10 | Invesco Allocation Funds |
underlying holdings – including, but not limited to, Invesco Balanced-Risk Allocation Fund and Invesco Global Targeted Returns Fund – may use derivatives, including futures, which may create economic leverage in the underlying funds. Therefore, performance of these underlying funds, both positive and negative, can also be attributed to these instruments.
It has been our privilege to oversee Invesco Conservative Allocation Fund, and we thank you for your continued investment.
1 Source: US Federal Reserve
The views and opinions expressed in management’s discussion of Fund performance are those of Invesco Advisers, Inc. These views and opinions are subject to change at any time based on factors such as market and economic conditions. These views and opinions may not be relied upon as investment advice or recommendations, or as an offer for a particular security. The information is not a complete analysis of every aspect of any market, country, industry, security or the Fund. Statements of fact are from sources considered reliable, but Invesco Advisers, Inc. makes no representation or warranty as to their completeness or accuracy. Although historical performance is no guarantee of future results, these insights may help you understand our investment management philosophy.
See important Fund and, if applicable, index disclosures later in this report.
 | Jacob Borbidge Chartered Financial Analyst, Portfolio Manager and Head of Research for Invesco’s Global Solutions | |
| Development and Implementation Team, is manager of Invesco Conservative Allocation Fund. He joined Invesco in 2004. Mr. Borbidge earned a BS in mechanical engineering from Lehigh University and an MS in finance from the University of Houston. | ||
 | Duy Nguyen Chartered Financial Analyst, Portfolio Manager and Chief Investment Officer of Invesco’s Global | |
| Solutions Development and Implementation Team, is manager of Invesco Conservative Allocation Fund. He joined Invesco in 2000. Mr. Nguyen earned a BBA from The University of Texas at Austin and an MS from the University of Houston. | ||
Assisted by Invesco’s Global Solutions Development & Implementation Team
| 11 | Invesco Allocation Funds |
Management’s Discussion of Fund Performance
Performance summary – Invesco Growth Allocation Fund For the year ended December 31, 2017, Class A shares of Invesco Growth Allocation Fund (the Fund), at net asset value (NAV), underperformed the Fund’s style-specific index, the Custom Invesco Growth Allocation Index. Your Fund’s long-term performance appears later in this report.
|
| |||
Fund vs. Indexes Total returns, 12/31/16 to 12/31/17, at net asset value (NAV). Performance shown does not include applicable contingent deferred sales charges (CDSC) or front-end sales charges, which would have reduced performance.
|
| |||
Class A Shares | 15.77 | % | ||
Class B Shares | 14.96 | |||
Class C Shares | 14.94 | |||
Class R Shares | 15.43 | |||
Class S Shares | 15.90 | |||
Class Y Shares | 16.08 | |||
Class R5 Shares | 16.26 | |||
Class R6 Shares* | 16.05 | |||
S&P 500 Indexq (Broad Market Index) | 21.83 | |||
Custom Invesco Growth Allocation Index⬛ (Style-Specific Index) | 19.13 | |||
Lipper Mixed-Asset Target Allocation Growth Funds Index◆ (Peer Group Index) | 16.67 | |||
Source(s): qFactSet Research Systems Inc.; ⬛Invesco, FactSet Research Systems Inc.; ◆Lipper Inc.
|
| |||
*Class R6 shares incepted on April 4, 2017. See page 5 for more information.
|
| |||
Market conditions and your Fund
Despite highly destructive hurricanes that threatened to derail a years-long economic recovery, the US economy continued to expand throughout the year ended December 31, 2017. Gross domestic product – the value of all goods and services produced in the US – expanded in the first three quarters of 2017.
Given signs of an improving economy, the US Federal Reserve (the Fed) raised interest rates three times during the reporting period, most recently in December 2017; each rate hike was 25 basis points.1 (A basis point is 0.01%.) The Fed pledged that “realized and expected economic conditions relative to its objectives of maximum employment and 2 percent inflation” will guide its future actions. At the close of the reporting period, Fed policy remained accommodative, and the fed funds target rate stood at a range of 1.25% to 1.50% – 75
basis points higher than at the start of the reporting period.1
Higher inventories and a worsening outlook caused oil prices and many energy stocks to decline during the first half of 2017. However, oil prices rose significantly in the second half of the reporting period as expectations for lower supplies increased, partly due to continued OPEC production cuts, and demand began normalizing.
Major US stock market indexes repeatedly hit all-time highs throughout the reporting period. The stock market rally that began after the 2016 presidential election continued throughout the reporting period, fueled by generally positive economic data, strong corporate earnings and improved consumer confidence. Finally, after much debate in Congress, a tax reform bill was signed into law in December 2017, which further strengthened stocks.
Strategic asset class exposures in the Fund are obtained through underlying mutual funds, exchange-traded funds and other pooled investment vehicles targeting a pre-defined level of risk. From an asset class perspective, the Fund’s exposure to US equities through underlying funds was the largest contributor to Fund performance. Specifically, PowerShares Russell Top 200 Pure Growth Portfolio was the largest contributor to Fund performance during the reporting period. The portfolio posted strong positive returns consistent with those of broader large-cap growth equities. Invesco Equally-Weighted S&P 500 Fund and Invesco American Franchise Fund also added to Fund performance during the reporting period.
No asset classes detracted from absolute Fund performance. However, within the Fund’s US equity allocation, exposure to mid- and small-cap equities held in some of the underlying funds underperformed relative to their representative asset classes. Underweight exposure to international equities versus the Fund’s style-specific benchmark also detracted from the Fund’s relative performance. In terms of individual holdings, Invesco All Cap Market Neutral Fund detracted from Fund performance due to short holdings that did not perform as expected, particularly those in the health care sector. This non-directional alternatives allocation is included in an effort to reduce the overall risk of the Fund while providing an alternative source of return. Such alternatives allocations tend not to move in lockstep with equities, so in a bull equity market, they can underperform equities. Although Invesco Diversified Dividend Fund and Invesco Equally-Weighted S&P 500 Fund posted positive returns, they underperformed the broader equity market during the reporting period.
As part of the Fund’s strategic annual rebalance, we sold its holdings in Invesco
| Portfolio Composition* | ||||
| By fund type, based on total investments | ||||
Equity Funds | 79.7% | |||
Fixed Income Funds | 13.0 | |||
Alternative Funds | 7.0 | |||
Money Market Funds | 0.3 | |||
| * | Based on the Schedule of Investments, which classifies each underlying fund and other investments into broad asset classes based on their predominant investments. |
Total Net Assets
|
$1.1 billion
|
The Fund’s holdings are subject to change, and there is no assurance that the Fund will continue to hold any particular security.
Data presented here are as of December 31, 2017.
| Fund Nasdaq Symbols | ||
Class A Shares | AADAX | |
Class B Shares | AAEBX | |
Class C Shares | AADCX | |
Class R Shares | AADRX | |
Class S Shares | AADSX | |
Class Y Shares | AADYX | |
Class R5 Shares | AADIX | |
Class R6 Shares | AAESX | |
| 12 | Invesco Allocation Funds |
Endeavor Fund. Please note that some of the Fund’s underlying holdings – including, but not limited to, Invesco Balanced-Risk Allocation Fund – may use derivatives, including futures, which may create economic leverage in the underlying funds. Therefore, performance of these underlying funds, both positive and negative, can also be attributed to these instruments.
It has been our privilege to oversee Invesco Growth Allocation Fund, and we thank you for your continued investment.
1 Source: US Federal Reserve
The views and opinions expressed in management’s discussion of Fund performance are those of Invesco Advisers, Inc. These views and opinions are subject to change at any time based on factors such as market and economic conditions. These views and opinions may not be relied upon as investment advice or recommendations, or as an offer for a particular security. The information is not a complete analysis of every aspect of any market, country, industry, security or the Fund. Statements of fact are from sources considered reliable, but Invesco Advisers, Inc. makes no representation or warranty as to their completeness or accuracy. Although historical performance is no guarantee of future results, these insights may help you understand our investment management philosophy.
See important Fund and, if applicable, index disclosures later in this report.
 | Jacob Borbidge Chartered Financial Analyst, Portfolio Manager and Head of Research for Invesco’s Global Solutions | |
| Development and Implementation Team, is manager of Invesco Growth Allocation Fund. He joined Invesco in 2004. Mr. Borbidge earned a BS in mechanical engineering from Lehigh University and an MS in finance from the University of Houston. | ||
 | Duy Nguyen Chartered Financial Analyst, Portfolio Manager and Chief Investment Officer of Invesco’s Global | |
| Solutions Development and Implementation Team, is manager of Invesco Growth Allocation Fund. He joined Invesco in 2000. Mr. Nguyen earned a BBA from The University of Texas at Austin and an MS from the University of Houston. | ||
Assisted by Invesco’s Global Solutions Development & Implementation Team
| 13 | Invesco Allocation Funds |
Management’s Discussion of Fund Performance
Performance summary – Invesco Moderate Allocation Fund For the year ended December 31, 2017, Class A shares of Invesco Moderate Allocation Fund (the Fund), at net asset value (NAV), underperformed the Fund’s style-specific index, the Custom Invesco Moderate Allocation Index. Your Fund’s long-term performance appears later in this report.
|
| |||
Fund vs. Indexes Total returns, 12/31/16 to 12/31/17, at net asset value (NAV). Performance shown does not include applicable contingent deferred sales charges (CDSC) or front-end sales charges, which would have reduced performance.
|
| |||
Class A Shares | 12.66 | % | ||
Class B Shares | 11.81 | |||
Class C Shares | 11.82 | |||
Class R Shares | 12.41 | |||
Class S Shares | 12.70 | |||
Class Y Shares | 12.85 | |||
Class R5 Shares | 12.97 | |||
Class R6 Shares* | 12.82 | |||
S&P 500 Indexq (Broad Market Index) | 21.83 | |||
Custom Invesco Moderate Allocation Index⬛ (Style-Specific Index) | 15.02 | |||
Lipper Mixed-Asset Target Allocation Moderate Funds Index◆ (Peer Group Index) | 13.37 | |||
Source(s): qFactSet Research Systems Inc.; ⬛Invesco, FactSet Research Systems Inc.; ◆Lipper Inc.
|
| |||
*Class R6 shares incepted on April 4, 2017. See page 7 for more information.
|
| |||
Market conditions and your Fund
Despite highly destructive hurricanes that threatened to derail a years-long economic recovery, the US economy continued to expand throughout the year ended December 31, 2017. Gross domestic product – the value of all goods and services produced in the US – expanded in the first three quarters of 2017.
Given signs of an improving economy, the US Federal Reserve (the Fed) raised interest rates three times during the reporting period, most recently in December 2017; each rate hike was 25 basis points.1 (A basis point is 0.01%.) The Fed pledged that “realized and expected economic conditions relative to its objectives of maximum employment and 2 percent inflation” will guide its future actions. At the close of the reporting period, Fed policy remained accommodative, and the fed funds target rate
stood at a range of 1.25% to 1.50% – 75 basis points higher than at the start of the reporting period.1
Higher inventories and a worsening outlook caused oil prices and many energy stocks to decline during the first half of 2017. However, oil prices rose significantly in the second half of the reporting period as expectations for lower supplies increased, partly due to continued OPEC production cuts, and demand began normalizing.
Major US stock market indexes repeatedly hit all-time highs throughout the reporting period. The stock market rally that began after the 2016 presidential election continued throughout the reporting period, fueled by generally positive economic data, strong corporate earnings and improved consumer confidence. Finally, after much debate in Congress, a tax reform bill was signed into law in
December 2017, which further strengthened stocks.
Strategic asset class exposures in the Fund are obtained through underlying mutual funds, exchange-traded funds and other pooled investment vehicles targeting a pre-defined level of risk. From an asset class perspective, the Fund’s exposure to US equities through underlying funds was the largest contributor to Fund performance. Specifically, PowerShares Russell Top 200 Pure Growth Portfolio was the largest contributor to Fund performance during the reporting period. The portfolio posted strong positive returns consistent with those of broader large-cap growth equities. Invesco Equally-Weighted S&P 500 Fund and Invesco American Franchise Fund also added to Fund performance during the reporting period.
No asset classes detracted from absolute Fund performance. However, within the Fund’s US equity allocation, exposure to mid- and small-cap equities through underlying funds underperformed relative to their representative asset classes. Underweight exposure to international equities versus the Fund’s style-specific benchmark also detracted from the Fund’s relative performance. In terms of individual holdings, Invesco All Cap Market Neutral Fund detracted from Fund performance due to short holdings that did not perform as expected, particularly those in the health care sector. This non-directional alternatives allocation is included in an effort to reduce the overall risk of the Fund while providing an alternative source of return. Such alternatives allocations tend not to move in lockstep with equities, so in a bull equity market, they can underperform equities. Although Invesco Diversified Dividend Fund and Invesco Equally-Weighted S&P 500 Fund posted positive returns, they under-performed the broader equity market during the reporting period.
| Portfolio Composition* | ||||
| By fund type, based on total investments | ||||
Equity Funds | 58.8% | |||
Fixed Income Funds | 33.9 | |||
Alternative Funds | 7.0 | |||
Money Market Funds | 0.3 | |||
| * | Based on the Schedule of Investments, which classifies each underlying fund and other investments into broad asset classes based on their predominant investments. |
Total Net Assets
|
$776.6 million
|
The Fund’s holdings are subject to change, and there is no assurance that the Fund will continue to hold any particular security.
Data presented here are as of December 31, 2017.
| Fund Nasdaq Symbols | ||
Class A Shares | AMKAX | |
Class B Shares | AMKBX | |
Class C Shares | AMKCX | |
Class R Shares | AMKRX | |
Class S Shares | AMKSX | |
Class Y Shares | ABKYX | |
Class R5 Shares | AMLIX | |
Class R6 Shares | AMLSX | |
| 14 | Invesco Allocation Funds |
As part of the fund’s strategic annual rebalance, we sold its holdings in Invesco Endeavor Fund and PowerShares S&P Small Cap Low Volatility Portfolio. Please note that some of the Fund’s underlying holdings – including, but not limited to, Invesco Balanced-Risk Allocation Fund – may use derivatives, including futures, which may create economic leverage in the underlying funds. Therefore, performance of these underlying funds, both positive and negative, can also be attributed to these instruments.
It has been our privilege to oversee Invesco Moderate Allocation Fund, and we thank you for your continued investment.
1 Source: US Federal Reserve
The views and opinions expressed in management’s discussion of Fund performance are those of Invesco Advisers, Inc. These views and opinions are subject to change at any time based on factors such as market and economic conditions. These views and opinions may not be relied upon as investment advice or recommendations, or as an offer for a particular security. The information is not a complete analysis of every aspect of any market, country, industry, security or the Fund. Statements of fact are from sources considered reliable, but Invesco Advisers, Inc. makes no representation or warranty as to their completeness or accuracy. Although historical performance is no guarantee of future results, these insights may help you understand our investment management philosophy.
See important Fund and, if applicable, index disclosures later in this report.
 | Jacob Borbidge Chartered Financial Analyst, Portfolio Manager and Head of Research for Invesco’s Global Solutions | |
| Development and Implementation Team, is manager of Invesco Moderate Allocation Fund. He joined Invesco in 2004. Mr. Borbidge earned a BS in mechanical engineering from Lehigh University and an MS in finance from the University of Houston. | ||
 | Duy Nguyen Chartered Financial Analyst, Portfolio Manager and Chief Investment Officer of Invesco’s Global | |
| Solutions Development and Implementation Team, is manager of Invesco Moderate Allocation Fund. He joined Invesco in 2000. Mr. Nguyen earned a BBA from The University of Texas at Austin and an MS from the University of Houston. | ||
Assisted by Invesco’s Global Solutions Development & Implementation Team
| 15 | Invesco Allocation Funds |
Invesco Conservative Allocation Fund’s investment objective is total return consistent with a lower level of risk relative to the broad stock market.
Invesco Growth Allocation Fund’s investment objective is long-term growth of capital consistent with a higher level of risk relative to the broad stock market.
Invesco Moderate Allocation Fund’s investment objective is total return consistent with a moderate level of risk relative to the broad stock market.
| ∎ | Unless otherwise stated, information presented in this report is as of December 31, 2017, and is based on total net assets. |
| ∎ | Unless otherwise noted, all data provided by Invesco. |
| ∎ | To access your Fund’s reports/prospectus, visit invesco.com/fundreports. |
About share classes
| ∎ | Effective January 26, 2018, after the close of the reporting period, all outstanding Class B shares were converted to Class A shares, in advance of their normally scheduled conversion. No CDSC was paid in connection with this early conversion. |
| ∎ | Class R shares are generally available only to employer sponsored retirement and benefit plans. Please see the prospectus for more information. |
| ∎ | Class S shares and Class Y shares are available only to certain investors. Please see the prospectus for more information. |
| ∎ | Class R5 shares and Class R6 shares are available for use by retirement plans that meet certain standards and for institutional investors. Class R6 shares are also available through intermediaries that have established an agreement with Invesco Distributors, Inc. to make such shares available for use in retail omnibus accounts. Please see the prospectus for more information. |
Principal risks of investing in the Fund
Invesco
| Invesco Growth
|
Invesco
| ||||
Active trading risk | x | x | x | |||
Allocation risk | x | x | x | |||
Borrowing risk | x | |||||
Changing fixed income market conditions risk | x | x | ||||
Collateralized loan obligations risk | x | x | ||||
Commodities tax risk | x | x | x | |||
Commodity-linked notes risk | x | x | x | |||
Commodity risk | x | x | x | |||
Debt securities risk | x | x | ||||
Depositary receipts risk | x | x | ||||
Derivatives risk | x | x | x | |||
Dollar roll transactions risk | x | |||||
Emerging markets securities risk | x | x | ||||
Exchange-traded fund industry concentration risk | x | x | x | |||
Exchange-traded funds risk | x | x | x | |||
Foreign government debt risk | x | x | ||||
Foreign securities risk | x | x | x | |||
Fund of funds risk | x | x | x | |||
Growth investing risk | x | |||||
High yield debt securities (junk bond) risk | x | x | ||||
Indexing risk | x | x | ||||
Liquidity risk | x | x | ||||
Management risk | x | x | x | |||
Market risk | x | x | x | |||
Market trading risk | x | |||||
Mortgage- and asset-backed securities risk | x | x | ||||
Municipal securities risk | x | x | ||||
Non-diversification risk | x | x | ||||
Real estate investment trust (REIT) risk/real estate risk | x |
| 16 | Invesco Allocation Funds |
Invesco
| Invesco Growth
|
Invesco
| ||||
Sector focus risk | x | |||||
Small- and mid-capitalization companies risks | x | |||||
TBA transactions risk | x | x | ||||
US government obligations risk | x | x | ||||
Value investing style risk | x | x | x | |||
When-issued, delayed delivery and forward commitment risks | x | x | ||||
Zero coupon or pay-in-kind securities risk | x | x |
Principal risks defined
| ∎ | Active trading risk. Active trading of portfolio securities may result in added expenses, a lower return and increased tax liability. |
| ∎ | Allocation risk. The Fund’s investment performance depends, in part, on how its assets are allocated among the underlying funds or asset classes. The Adviser’s evaluations and assumptions regarding the asset classes or the underlying funds in which the Fund invests may be incorrect, causing the Fund to be invested (or not invested) in one or more asset classes or underlying funds at an inopportune time, which could negatively affect the Fund’s performance. |
| ∎ | Borrowing risk. Borrowing money to buy securities exposes an underlying fund to leverage and will cause an underlying fund’s share price to be more volatile because leverage will exaggerate the effect of any increase or decrease in the value of an underlying fund’s portfolio securities. Borrowing money may also require an underlying fund to liquidate positions when it may not be advantageous to do so. In addition, an underlying fund will incur interest expenses and other fees on borrowed money. There can be no assurance that an underlying fund’s borrowing strategy will enhance and not reduce the underlying fund’s returns. |
| ∎ | Changing fixed income market conditions risk. The current low interest rate environment was created in part by the Federal Reserve Board (FRB) and certain foreign central banks keeping the federal funds and equivalent foreign rates near, at or below zero. Increases in the federal funds and equivalent foreign rates may expose fixed income |
markets to heightened volatility and reduced liquidity for certain fixed income investments, particularly those with longer maturities. In addition, decreases in fixed income dealer market-making capacity may also potentially lead to heightened volatility and reduced liquidity in the fixed income markets. As a result, the value of an underlying fund’s investments and share price may decline. Changes in central bank policies could also result in higher than normal shareholder redemptions, which could potentially increase portfolio turnover and an underlying fund’s transaction costs.
| ∎ | Collateralized loan obligations risk. CLOs are subject to the risks of substantial losses due to actual defaults by underlying borrowers, which will be greater during periods of economic or financial stress. CLOs may also lose value due to collateral defaults and disappearance of subordinate tranches, market anticipation of defaults, and investor aversion to CLO securities as a class. The risks of CLOs will be greater if an underlying fund invests in CLOs that hold loans of uncreditworthy borrowers or if an underlying fund holds subordinate tranches of the CLO that absorbs losses from the defaults before senior tranches. In addition, CLOs carry risks including interest rate risk and credit risk. |
| ∎ | Commodities tax risk. The tax treatment of commodity-linked derivative instruments may be adversely affected by changes in legislation, regulations or other legally binding authority. If, as a result of any such adverse action, the income of an underlying fund from certain commodity-linked derivatives was treated as non-qualifying income, an underlying fund might fail to qualify as |
This report must be accompanied or preceded by a currently effective Fund prospectus, which contains more complete information, including sales charges and expenses. Investors should read it carefully before investing.
|
| a regulated investment company and be subject to federal income tax at the fund level. As a result of a recent announcement by the Internal Revenue Service, an underlying fund intends to invest in commodity-linked notes: (a) directly, generally only to the extent that it obtains an opinion of counsel confirming that income from such investments should be qualifying income because such commodity-linked notes constitute securities under section 2(a) (36) of the 1940 Act or (b) indirectly through the Subsidiary. Should the Internal Revenue Service issue further guidance, or Congress enact legislation, that adversely affects the tax treatment of an underlying fund’s use of commodity-linked notes or a wholly-owned subsidiary (which guidance might be applied to the underlying fund retroactively), it could, among other consequences, limit the underlying fund’s ability to pursue its investment strategy. |
| ∎ | Commodity-linked notes risk. In addition to risks associated with the underlying commodities, investments in commodity-linked notes may be subject to additional risks, such as non-payment of interest and loss of principal, counterparty risk, lack of a secondary market and risk of greater volatility than traditional equity and debt securities. The value of the commodity-linked notes an underlying fund buys may fluctuate significantly because the values of the underlying investments to which they are linked are themselves volatile. Additionally, certain commodity-linked notes employ “economic” leverage by requiring payment by the issuer of an amount that is a multiple of the price increase or decrease of the underlying commodity, commodity index, or other economic variable. Such economic leverage will increase the volatility of the value of these commodity-linked notes and an underlying fund to the extent it invests in such notes. |
continued on page 18
| NOT FDIC INSURED | MAY LOSE VALUE | NO BANK GUARANTEE |
| 17 | Invesco Allocation Funds |
continued from page 17
| ∎ | Commodity risk. An underlying fund may have investment exposure to the commodities markets and/or a particular sector of the commodities markets, which may subject an underlying fund to greater volatility than investments in traditional securities, such as stocks and bonds. Volatility in the commodities markets may be caused by changes in overall market movements, domestic and foreign political and economic events and policies, war, acts of terrorism, changes in domestic or foreign interest rates and/or investor expectations concerning interest rates, domestic and foreign inflation rates, investment and trading activities of mutual funds, hedge funds and commodities funds, and factors such as drought, floods, weather, livestock disease, embargoes, tariffs and other regulatory developments, or supply and demand disruptions. Because an underlying fund’s performance may be linked to the performance of volatile commodities, investors should be willing to assume the risks of potentially significant fluctuations in the value of an underlying fund’s shares. |
| ∎ | Debt securities risk. The prices of debt securities held by an underlying fund will be affected by changes in interest rates, the creditworthiness of the issuer and other factors. An increase in prevailing interest rates typically causes the value of existing debt securities to fall and often has a greater impact on longer-duration debt securities and higher quality debt securities. Falling interest rates will cause an underlying fund to reinvest the proceeds of debt securities that have been repaid by the issuer at lower interest rates. Falling interest rates may also reduce an underlying fund’s distributable income because interest payments on floating rate debt instruments held by an underlying fund will decline. An underlying fund could lose money on investments in debt securities if the issuer or borrower fails to meet its obligations to make interest payments and/or to repay principal in a timely manner. Changes in an issuer’s financial strength, the market’s perception of such strength or in the credit rating of the issuer or the security may affect the value of debt securities. An underlying fund’s adviser’s credit analysis may fail to anticipate such changes, which could result in buying a debt security at an inopportune time or failing to sell a debt security in advance of a |
price decline or other credit event. |
| ∎ | Depositary receipts risk. Investing in depositary receipts involve the same risks as direct investments in foreign securities. In addition, the underlying issuers of certain depositary receipts are under no obligation to distribute shareholder communications or pass through any voting rights with respect to the deposited securities to the holders of such receipts. An underlying fund may therefore receive less timely information or have less control than if it invested directly in the foreign issuer. |
| ∎ | Derivatives risk. The value of a derivative instrument depends largely on (and is derived from) the value of an underlying security, currency, commodity, interest rate, index or other asset (each referred to as an underlying asset). In addition to risks relating to the underlying assets, the use of derivatives may include other, possibly greater, risks, including counterparty, leverage and liquidity risks. Counterparty risk is the risk that the counterparty to the derivative contract will default on its obligation to pay the underlying fund the amount owed or otherwise perform under the derivative contract. Derivatives create leverage risk because they do not require payment up front equal to the economic exposure created by owning the derivative. As a result, an adverse change in the value of the underlying asset could result in the underlying fund sustaining a loss that is substantially greater than the amount invested in the derivative, which may make the underlying fund’s returns more volatile and increase the risk of loss. Derivative instruments may also be less liquid than more traditional investments and the underlying fund may be unable to sell or close out its derivative positions at a desirable time or price. This risk may be more acute under adverse market conditions, during which the underlying fund may be most in need of liquidating its derivative positions. Derivatives may also be harder to value, less tax efficient and subject to changing government regulation that could impact the underlying fund’s ability to use certain derivatives or their cost. The SEC has proposed new regulations related to the use of derivatives and related instruments by registered investment companies. If adopted as proposed, these regulations would limit an underlying fund’s ability to engage in derivatives transactions and may result in increased costs or |
require an underlying fund to modify its investment strategies or to liquidate. Also, derivatives used for hedging or to gain or limit exposure to a particular market segment may not provide the expected benefits, particularly during adverse market conditions. These risks are greater for certain underlying funds than most other mutual funds because certain underlying funds will implement their investment strategy primarily through derivative instruments rather than direct investments in stocks/bonds. |
| ∎ | Dollar roll transactions risk. Dollar roll transactions occur in connection with TBA transactions and involve the risk that the market value of the securities an underlying fund is required to purchase may decline below the agreed upon purchase price of those securities. Dollar roll transactions add a form of leverage to an underlying fund’s portfolio, which may make the Fund’s returns more volatile and increase the risk of loss. In addition, dollar roll transactions may increase an underlying fund’s portfolio turnover, which may result in increased brokerage costs and may lower an underlying fund’s actual return. |
| ∎ | Emerging markets securities risk. Emerging markets (also referred to as developing markets) are generally subject to greater market volatility, political, social and economic instability, uncertain trading markets and more governmental limitations on foreign investment than more developed markets. In addition, companies operating in emerging markets may be subject to lower trading volume and greater price fluctuations than companies in more developed markets. Securities law and the enforcement of systems of taxation in many emerging market countries may change quickly and unpredictably. In addition, investments in emerging markets securities may also be subject to additional transaction costs, delays in settlement procedures, and lack of timely information. |
| ∎ | Exchange-traded fund industry concentration risk. In following its methodology, an underlying exchange-traded fund’s underlying index from time to time may be concentrated to a significant degree in securities of issuers located in a single industry or sector. To the extent that an underlying fund’s underlying index concentrates in the securities of issuers in a particular industry or sector, an underlying fund |
| 18 | Invesco Allocation Funds |
will also concentrate its investments to approximately the same extent. By concentrating its investments in an industry or sector, an underlying fund faces more risks than if it were diversified broadly over numerous industries or sectors. Such industry-based risks, any of which may adversely affect the companies in which an underlying fund invests, may include, but are not limited to, the following: general economic conditions or cyclical market patterns that could negatively affect supply and demand in a particular industry; competition for resources, adverse labor relations, political or world events; obsolescence of technologies; and increased competition or new product introductions that may affect the profitability or viability of companies in an industry. In addition, at times, such industry or sector may be out of favor and underperform other industries or the market as a whole. |
| ∎ | Exchange-traded funds risk. In addition to the risks associated with the underlying assets held by the exchange-traded fund, investments in exchange-traded funds are subject to the following additional risks: (1) an exchange-traded fund’s shares may trade above or below its net asset value; (2) an active trading market for the exchange-traded fund’s shares may not develop or be maintained; (3) trading an exchange-traded fund’s shares may be halted by the listing exchange; (4) a passively- managed exchange-traded fund may not track the performance of the reference asset; and (5) a passively managed exchange-traded fund may hold troubled securities. Investment in exchange-traded funds may involve duplication of management fees and certain other expenses, as the Fund or an underlying fund indirectly bears its proportionate share of any expenses paid by the exchange-traded funds in which it invests. Further, certain exchange- traded funds in which the Fund or an underlying fund may invest are lever aged, which may result in economic leverage, permitting the Fund or an underlying fund to gain exposure that is greater than would be the case in an unlevered instrument, and potentially resulting in greater volatility. |
| ∎ | Foreign government debt risk. Investments in foreign government debt securities (sometimes referred to as sovereign debt securities) involve certain risks in addition to those relating to |
foreign securities or debt securities generally. The issuer of the debt or the governmental authorities that control the repayment of the debt may be unable or unwilling to repay principal or interest when due in accordance with the terms of such debt, and an underlying fund may have limited recourse in the event of a default against the defaulting government. Without the approval of debt holders, some governmental debtors have in the past been able to reschedule or restructure their debt payments or declare moratoria on payments. |
| ∎ | Foreign securities risk. An underlying fund’s foreign investments may be adversely affected by political and social instability, changes in economic or taxation policies, difficulty in enforcing obligations, decreased liquidity or increased volatility. Foreign investments also involve the risk of the possible seizure, nationalization or expropriation of the issuer or foreign deposits (in which an underlying fund could lose its entire investments in a certain market) and the possible adoption of foreign governmental restrictions such as exchange controls. Unless an underlying fund has hedged its foreign securities risk, foreign securities risk also involves the risk of negative foreign currency rate fluctuations, which may cause the value of securities denominated in such foreign currency (or other instruments through which an underlying fund has exposure to foreign currencies) to decline in value. Currency exchange rates may fluctuate significantly over short periods of time. Currency hedging strategies, if used, are not always successful. |
| ∎ | Fund of funds risk. The Fund’s performance depends on that of the underlying funds in which it invests. Accordingly, the risks associated with an investment in the Fund include the risks associated with investments in the underlying funds. The Fund will indirectly pay a proportional share of the fees and expenses of the underlying funds in which it invests. There are risks that the Fund will vary from its target weightings (if any) in the underlying funds, that the underlying funds will not achieve their investment objectives, that the underlying funds’ performance may be lower than their represented asset classes, and that the Fund may withdraw its investments in an underlying fund at a disadvantageous time. |
| ∎ | Growth investing risk. Growth stocks tend to be more expensive relative to the issuing company’s earnings or assets compared with other types of stock. As a result, they tend to be more sensitive to changes in, or investors’ expectations of, the issuing company’s earnings and can be more volatile. |
| ∎ | High yield debt securities (junk bond) risk. Investments in high yield debt securities (“junk bonds”) and other lower-rated securities will subject an underlying fund to substantial risk of loss. These securities are considered to be speculative with respect to the issuer’s ability to pay interest and principal when due, are more susceptible to default or decline in market value and are less liquid than investment grade debt securities. Prices of high yield debt securities tend to be very volatile. |
| ∎ | Indexing risk. An underlying fund is operated as a passively managed index fund and, therefore, the adverse performance of a particular security necessarily will not result in the elimination of the security from the underlying fund’s portfolio. Ordinarily, the underlying fund’s adviser will not sell the underlying fund’s portfolio securities except to reflect additions or deletions of the securities that comprise the underlying fund’s underlying index, or as may be necessary to raise cash to pay underlying fund shareholders who sell underlying fund shares. As such, the underlying fund will be negatively affected by declines in the securities represented by its underlying index. Also, there is no guarantee that the underlying fund’s adviser will be able to correlate the underlying fund’s performance with that of its underlying index. |
| ∎ | Liquidity risk. An underlying fund may be unable to sell illiquid investments at the time or price it desires and, as a result, could lose its entire investment in such investments. Liquid securities can become illiquid during periods of market stress. If a significant amount of the an underlying fund’s securities become illiquid, an underlying fund may not be able to timely pay redemption proceeds and may need to sell securities at significantly reduced prices. |
| ∎ | Management risk. An underlying fund is actively managed and depends heavily on an underlying fund’s adviser’s judgment about markets, interest rates or the attractiveness, relative values, liquidity, or potential appreciation of particular investments made for an |
| continued on page 20 |
| 19 | Invesco Allocation Funds |
continued from page 19
underlying fund’s portfolio. An underlying fund could experience losses if these judgments prove to be incorrect. Additionally, legislative, regulatory, or tax developments may adversely affect management of an underlying fund and, therefore, the ability of the underlying fund to achieve its investment objective. |
| ∎ | Market risk. The market values of an underlying fund’s investments, and therefore the value of an underlying fund’s shares, will go up and down, sometimes rapidly or unpredictably. Market risk may affect a single issuer, industry or section of the economy, or it may affect the market as a whole. Individual stock prices tend to go up and down more dramatically than those of certain other types of investments, such as bonds. During a general downturn in the financial markets, multiple asset classes may decline in value. When markets perform well, there can be no assurance that specific investments held by an underlying fund will rise in value. |
| ∎ | Market trading risk. An underlying exchange-traded fund faces numerous market trading risks, including the potential lack of an active market for its shares, losses from trading in secondary markets, and disruption in the creation/redemption process of an underlying fund (such as from an underlying fund’s failure to meet the requirements for continued listing on an exchange). Shares of an underlying fund may trade in the secondary market at times when an underlying fund does not accept orders to purchase its shares. Shares of an underlying fund, similar to shares of other issuers listed on a stock exchange, may be sold short and are therefore subject to the risk of increased volatility associated with short selling. Any of these factors may lead to an underlying fund’s shares trading at a premium or discount to an underlying fund’s NAV. |
| ∎ | Mortgage- and asset-backed securities risk. Mortgage- and asset-backed securities are subject to prepayment or call risk, which is the risk that a borrower’s payments may be received earlier or later than expected due to changes in prepayment rates on underlying loans. This could result in an underlying fund reinvesting these early payments at lower interest rates, thereby reducing an underlying fund’s income. Mortgage-and asset-backed securities also |
are subject to extension risk, which is the risk that an unexpected rise in interest rates could reduce the rate of prepayments, causing the price of the mortgage- and asset-backed securities and an underlying fund’s share price to fall. An unexpectedly high rate of defaults on the mortgages held by a mortgage pool will adversely affect the value of mortgage-backed securities and will result in losses to an underlying fund. An underlying fund may invest in mortgage pools that include subprime mortgages, which are loans made to borrowers with weakened credit histories or with lower capacity to make timely payments on their mortgages. Privately issued mortgage-related securities are not subject to the same underwriting requirements as those with government or government-sponsored entity guarantees and, therefore, mortgage loans underlying privately issued mortgage-related securities may have less favorable collateral, credit risk or other underwriting characteristics, and wider variances in interest rate, term, size, purpose and borrower characteristics. |
| ∎ | Municipal securities risk. The risk of a municipal obligation generally depends on the financial and credit status of the issuer. Constitutional amendments, legislative enactments, executive orders, administrative regulations, voter initiatives, and the issuer’s regional economic conditions may affect the municipal security’s value, interest payments, repayment of principal and an underlying fund’s ability to sell the security. Failure of a municipal security issuer to comply with applicable tax requirements may make income paid thereon taxable, resulting in a decline in the security’s value. In addition, there could be changes in applicable tax laws or tax treatments that reduce or eliminate the current federal income tax exemption on municipal securities or otherwise adversely affect the current federal or state tax status of municipal securities. |
| ∎ | Non-diversification risk. An underlying fund is non-diversified and can invest a greater portion of its assets in the obligations or securities of small number of issuers or any single issuer than a diversified fund can. A change in the value of one or a few issuers’ securities will therefore affect the value of an underlying fund more than would occur in a diversified fund. |
| ∎ | REIT risk/real estate risk. An underlying fund concentrates its investments in the securities of real estate and real estate related companies. Investments in real estate related instruments may be affected by economic, legal, cultural, environmental or technological factors that affect property values, rents or occupancies of real estate related to an underlying fund’s holdings. Real estate companies, including REITs or similar structures, tend to be small- and mid-cap companies and their shares may be more volatile and less liquid than larger companies. The value of investments in real estate related companies may be affected by the quality of management, the ability to repay loans, the utilization of leverage and financial covenants related thereto, whether the company carries adequate insurance and environmental factors. If a real estate related company defaults on certain types of debt obligations, an underlying fund may own real estate directly, which involves additional risks such as environmental liabilities; difficulty in valuing and selling the real estate; and economic or regulatory changes. |
| ∎ | Sector focus risk. An underlying fund may from time to time invest a significant amount of its assets (i.e. over 25%) in one market sector or group of related industries. In this event, an underlying fund’s performance will depend to a greater extent on the overall condition of the sector or group of industries and there is increased risk that an underlying fund will lose significant value if conditions adversely affect that sector or group of industries. |
| ∎ | Small- and mid-capitalization companies risks. Investing in securities of small and mid-capitalization companies involves greater risk than customarily is associated with investing in larger, more established companies. Stocks of small- and mid-capitalization companies tend to be more vulnerable to changing market conditions, may have little or no operating history or track record of success, and may have more limited product lines and markets, less experienced management and fewer financial resources than larger companies. These companies’ securities may be more volatile and less liquid than those of more established companies. These securities may have returns that vary, sometimes significantly, from the overall securities market. |
| 20 | Invesco Allocation Funds |
| ∎ | TBA transactions risk. TBA transactions involve the risk of loss if the securities received are less favorable than what was anticipated by an underlying fund when entering into the TBA transaction, or if the counterparty fails to deliver the securities. When an underlying fund enters into a short sale of a TBA mortgage it does not own, an underlying fund may have to purchase deliverable mortgages to settle the short sale at a higher price than anticipated, thereby causing a loss. As there is no limit on how much the price of mortgage securities can increase, an underlying fund’s exposure is unlimited. An underlying fund may not always be able to purchase mortgage securities to close out the short position at a particular time or at an acceptable price. In addition, taking short positions results in a form of leverage, which could increase the volatility of an underlying fund’s share price. |
| ∎ | US government obligations risk. Obligations of US government agencies and authorities receive varying levels of support and may not be backed by the full faith and credit of the US government, which could affect an underlying fund’s ability to recover should they default. No assurance can be given that the US government will provide financial support to its agencies and authorities if it is not obligated by law to do so. |
| ∎ | Value investing style risk. A value investing style subjects an underlying fund to the risk that the valuations never improve or that the returns on value equity securities are less than returns on other styles of investing or the overall stock market. |
| ∎ | When-issued, delayed delivery and forward commitment risks. When-issued and delayed delivery transactions subject an underlying fund to market risk because the value or yield of a security at delivery may be more or less than the purchase price or yield generally available when delivery occurs, and counterparty risk because an underlying fund relies on the buyer or seller, as the case may be, to consummate the transaction. These transactions also have a leveraging effect on an underlying fund because an underlying fund commits to purchase securities that it does not have to pay for until a later date, which increases an underlying fund’s overall investment exposure and, as a result, its volatility. |
| ∎ | Zero coupon or pay-in-kind securities risk. The value, interest rates, and liquidity of non-cash paying instruments, such as zero coupon and pay-in-kind securities, are subject to greater fluctuation than other types of securities. The higher yields and interest rates on pay-in-kind securities reflect the payment deferral and increased credit risk associated with such instruments and that such investments may represent a higher credit risk than loans that periodically pay interest. |
About indexes used in this report
| ∎ | The S&P 500® Index is an unmanaged index considered representative of the US stock market. |
| ∎ | The Custom Invesco Conservative Allocation Index, created by Invesco to serve as a benchmark for Invesco Conservative Allocation Fund, is composed of the following indexes: S&P 500 Index, MSCI EAFE Index and Bloomberg Barclays U.S. Aggregate Bond Index. The composition may change based on the Fund’s target asset allocation. Therefore, the current composition of the index does not reflect its historical composition and will likely be altered in the future to better reflect the Fund’s objective. |
| ∎ | The Lipper Mixed-Asset Target Allocation Conservative Funds Index is an unmanaged index considered representative of mixed-asset target allocation conservative funds tracked by Lipper. |
| ∎ | The Custom Invesco Growth Allocation Index, created by Invesco to serve as a benchmark for Invesco Growth Allocation Fund, is composed of the following indexes: S&P 500 Index, MSCI EAFE Index and Bloomberg Barclays U.S. Aggregate Bond Index. The composition of the index may change based on the Fund’s target asset allocation. Therefore, the current composition of the index does not reflect its historical composition and will likely be altered in the future to better reflect the Fund’s objective. |
| ∎ | The Lipper Mixed-Asset Target Allocation Growth Funds Index is an unmanaged index considered representative of mixed-asset target allocation growth funds tracked by Lipper. |
| ∎ | The Custom Invesco Moderate Allocation Index, created by Invesco to serve as a benchmark for Invesco Moderate Allocation Fund, is composed of the following indexes: S&P 500 Index, MSCI EAFE Index and Bloomberg |
Barclays U.S. Aggregate Bond Index. The composition of the index may change based on the Fund’s target asset allocation. Therefore, the current composition of the index does not reflect its historical composition and will likely be altered in the future to better reflect the Fund’s objective. |
| ∎ | The Lipper Mixed-Asset Target Allocation Moderate Funds Index is an unmanaged index considered representative of mixed-asset target allocation moderate funds tracked by Lipper. |
| ∎ | The MSCI EAFE® Index is an unmanaged index considered representative of stocks of Europe, Australasia and the Far East. The index is computed using the net return, which withholds applicable taxes for non-resident investors. |
| ∎ | The Bloomberg Barclays U.S. Aggregate Bond Index is an unmanaged index considered representative of the US investment-grade, fixed-rate bond market. |
| ∎ | The Fund is not managed to track the performance of any particular index, including the index(es) described here, and consequently, the performance of the Fund may deviate significantly from the performance of the index(es). |
| ∎ | A direct investment cannot be made in an index. Unless otherwise indicated, index results include reinvested dividends, and they do not reflect sales charges. Performance of the peer group, if applicable, reflects fund expenses; performance of a market index does not. |
Other information
| ∎ | The returns shown in management’s discussion of Fund performance are based on net asset values calculated for shareholder transactions. Generally accepted accounting principles require adjustments to be made to the net assets of the Fund at period end for financial reporting purposes, and as such, the net asset values for shareholder transactions and the returns based on those net asset values may differ from the net asset values and returns reported in the Financial Highlights. |
| 21 | Invesco Allocation Funds |
Schedule of Investments
December 31, 2017
Invesco Conservative Allocation Fund
Schedule of Investments in Affiliated Issuers–100.03%(a)
| % of Net Assets 12/31/17 | Value 12/31/16 | Purchases at Cost | Proceeds from Sales | Change in Unrealized Appreciation (Depreciation) | Realized Gain (Loss) | Dividend Income | Shares 12/31/17 | Value 12/31/17 | ||||||||||||||||||||||||||||
Alternative Funds–2.48% |
| |||||||||||||||||||||||||||||||||||
Invesco Global Targeted Returns Fund–Class R6(b) | 2.48 | % | $ | — | $ | 8,168,811 | $ | (127,503 | ) | $ | (40,070 | ) | $ | 736 | $ | — | 803,411 | $ | 8,001,974 | |||||||||||||||||
Asset Allocation Funds–2.52% |
| |||||||||||||||||||||||||||||||||||
Invesco Balanced-Risk Allocation Fund–Class R6(b) | 2.52 | % | 15,001,805 | 592,730 | (7,935,798 | ) | 534,214 | 451,758 | — | 740,899 | 8,157,296 | |||||||||||||||||||||||||
Domestic Equity Funds–25.88% |
| |||||||||||||||||||||||||||||||||||
Invesco All Cap Market Neutral | 1.99 | % | 8,224,865 | 1,359,471 | (1,752,010 | ) | (1,340,527 | ) | 691,765 | — | 759,377 | 6,416,736 | ||||||||||||||||||||||||
Invesco American Franchise | 2.47 | % | 8,282,796 | 595,954 | (2,529,170 | ) | 1,067,162 | 958,166 | — | 393,580 | 7,969,999 | |||||||||||||||||||||||||
Invesco Diversified Dividend | 7.47 | % | 23,053,184 | 2,747,411 | (2,935,040 | ) | 925,613 | 532,911 | 526,092 | 1,185,945 | 24,145,843 | |||||||||||||||||||||||||
Invesco Endeavor Fund–Class R6(b) | 0.00 | % | 6,663,596 | 413,865 | (6,944,349 | ) | (2,104,635 | ) | 2,385,388 | — | — | — | ||||||||||||||||||||||||
Invesco Equally-Weighted S&P 500 Fund–Class R6 | 5.73 | % | 19,617,100 | 974,189 | (4,777,221 | ) | 1,609,081 | 1,369,967 | 306,993 | 306,126 | 18,538,980 | |||||||||||||||||||||||||
Invesco Growth and Income | 4.76 | % | 13,080,947 | 5,013,058 | (3,100,167 | ) | (59,531 | ) | 1,790,501 | 326,812 | 569,887 | 15,392,638 | ||||||||||||||||||||||||
PowerShares Russell Top 200 Pure Growth Portfolio–ETF | 3.46 | % | 8,249,200 | 3,320,137 | (3,392,293 | ) | 2,122,770 | 884,482 | 81,303 | 246,201 | 11,184,296 | |||||||||||||||||||||||||
Total Domestic Equity Funds | 87,171,688 | 14,424,085 | (25,430,250 | ) | 2,219,933 | 8,613,180 | 1,241,200 | 83,648,492 | ||||||||||||||||||||||||||||
Fixed–Income Funds–59.77% |
| |||||||||||||||||||||||||||||||||||
Invesco Core Plus Bond Fund– | 17.94 | % | 60,417,386 | 2,009,330 | (5,650,602 | ) | 1,135,256 | 76,585 | 1,854,223 | 5,315,120 | 57,987,955 | |||||||||||||||||||||||||
Invesco Emerging Market Flexible Bond Fund–Class R6 | 4.96 | % | 16,517,772 | 757,754 | (1,595,961 | ) | 1,002,083 | (633,052 | ) | 757,753 | 2,413,323 | 16,048,596 | ||||||||||||||||||||||||
Invesco Floating Rate Fund– | 5.51 | % | 16,826,734 | 2,270,169 | (1,254,183 | ) | (2,342 | ) | (24,005 | ) | 759,695 | 2,356,663 | 17,816,373 | |||||||||||||||||||||||
Invesco High Yield Fund–Class R6 | 6.02 | % | 19,991,301 | 938,861 | (1,766,429 | ) | 259,986 | 369 | 986,003 | 4,658,190 | 19,471,234 | |||||||||||||||||||||||||
Invesco Quality Income Fund– | 9.21 | % | 26,753,437 | 5,288,060 | (1,889,203 | ) | (345,167 | ) | (26,199 | ) | 1,055,617 | 2,481,744 | 29,780,928 | |||||||||||||||||||||||
Invesco Short Duration Inflation Protected Fund–Class R6 | 4.72 | % | 16,795,126 | 337,048 | (1,643,752 | ) | (259,069 | ) | 18,428 | 337,048 | 1,471,794 | 15,247,781 | ||||||||||||||||||||||||
Invesco Short Term Bond Fund– | 3.48 | % | 13,429,268 | 248,859 | (2,424,622 | ) | (39,858 | ) | 38,053 | 248,859 | 1,311,387 | 11,251,700 | ||||||||||||||||||||||||
PowerShares 1-30 Laddered Treasury Portfolio–ETF | 5.45 | % | 20,048,513 | 522,767 | (3,495,610 | ) | 431,930 | 101,392 | 375,040 | 537,351 | 17,608,992 | |||||||||||||||||||||||||
PowerShares LadderRite 0-5 Year Corporate Bond Portfolio–ETF | 2.48 | % | 9,972,513 | 37,350 | (2,040,205 | ) | 39,361 | 11,926 | 160,375 | 321,997 | 8,020,945 | |||||||||||||||||||||||||
Total Fixed-Income Funds | 200,752,050 | 12,410,198 | (21,760,567 | ) | 2,222,180 | (436,503 | ) | 6,534,613 | 193,234,504 | |||||||||||||||||||||||||||
Foreign Equity Funds–6.03% |
| |||||||||||||||||||||||||||||||||||
Invesco International Growth | 3.01 | % | 10,106,201 | 280,541 | (2,436,039 | ) | 1,183,747 | 683,038 | 196,197 | 264,559 | 9,733,143 | |||||||||||||||||||||||||
PowerShares FTSE RAFI Developed Markets ex-U.S. Portfolio–ETF | 3.02 | % | 9,989,239 | — | (2,095,359 | ) | 1,713,136 | 164,154 | 285,047 | 215,224 | 9,771,170 | |||||||||||||||||||||||||
Total Foreign Equity Funds | 20,095,440 | 280,541 | (4,531,398 | ) | 2,896,883 | 847,192 | 481,244 | 19,504,313 | ||||||||||||||||||||||||||||
Real Estate Funds–2.99% |
| |||||||||||||||||||||||||||||||||||
Invesco Global Real Estate Income Fund–Class R6 | 2.99 | % | 10,157,821 | 376,099 | (1,357,836 | ) | 446,683 | 48,659 | 376,100 | 1,062,794 | 9,671,426 | |||||||||||||||||||||||||
Money Market Funds–0.36% |
| |||||||||||||||||||||||||||||||||||
Invesco Government & Agency Portfolio–Institutional Class, | 0.13 | % | 548,298 | 22,394,403 | (22,537,923 | ) | — | — | 5,157 | 404,778 | 404,778 | |||||||||||||||||||||||||
Invesco Liquid Assets Portfolio–Institutional Class, 1.40%(e) | 0.09 | % | — | 585,948 | (296,820 | ) | — | (9 | ) | 264 | 289,089 | 289,119 | ||||||||||||||||||||||||
Invesco Treasury Portfolio–Institutional Class, 1.17%(e) | 0.14 | % | 365,532 | 15,178,416 | (15,081,344 | ) | — | — | 3,441 | 462,604 | 462,604 | |||||||||||||||||||||||||
Total Money Market Funds | 913,830 | 38,158,767 | (37,916,087 | ) | — | (9 | ) | 8,862 | 1,156,501 | |||||||||||||||||||||||||||
TOTAL INVESTMENTS IN AFFILIATED ISSUERS | 100.03 | % | $ | 334,092,634 | $ | 74,411,231 | $ | (99,059,439 | ) | $ | 8,279,823 | (c) | $ | 9,525,013 | (d) | $ | 8,642,019 | $ | 323,374,506 | |||||||||||||||||
OTHER ASSETS LESS LIABILITIES | (0.03 | )% | (109,526 | ) | ||||||||||||||||||||||||||||||||
NET ASSETS | 100.00 | % | $ | 323,264,980 | ||||||||||||||||||||||||||||||||
Investment Abbreviations:
ETF – Exchange Traded Fund
See accompanying Notes to Financial Statements which are an integral part of the financial statements.
22 Invesco Allocation Funds
Notes to Schedule of Investments:
| (a) | Each underlying fund and the Fund are affiliated by either having the same investment adviser or an investment adviser under common control with the Fund’s investment adviser. |
| (b) | Non-income producing security. A security is determined to be non-income producing if the security has not declared a distribution in more than one year from the report date. |
| (c) | Includes $47,146 of return of capital received from Invesco High Yield Fund. |
| (d) | Includes capital gains distributions from affiliated underlying funds as follows: |
| Fund Name | Capital Gain | |||
Invesco Balanced-Risk Allocation Fund | $ | 487,413 | ||
Invesco All Cap Market Neutral Fund | 766,828 | |||
Invesco American Franchise Fund | 404,909 | |||
Invesco Diversified Dividend Fund | 178,236 | |||
Invesco Endeavor Fund | 413,865 | |||
Invesco Equally-Weighted S&P 500 Fund | 254,136 | |||
Invesco Growth and Income Fund | 1,332,170 | |||
Invesco International Growth Fund | 84,345 | |||
| (e) | The rate shown is the 7-day SEC standardized yield as of December 31, 2017. |
See accompanying Notes to Financial Statements which are an integral part of the financial statements.
23 Invesco Allocation Funds
Schedule of Investments—(continued)
December 31, 2017
Invesco Growth Allocation Fund
Schedule of Investments in Affiliated Issuers–99.71%(a)
| % of Net Assets 12/31/17 | Value 12/31/16 | Purchases at Cost | Proceeds from Sales | Change in Unrealized Appreciation (Depreciation) | Realized Gain (Loss) | Dividend Income | Shares 12/31/17 | Value 12/31/17 | ||||||||||||||||||||||||||||
Asset Allocation Funds–4.48% |
| |||||||||||||||||||||||||||||||||||
Invesco Balanced-Risk Allocation Fund–Class R6(b) | 4.48 | % | $ | 46,285,029 | $ | 4,028,450 | $ | (4,397,168 | ) | $ | 1,261,458 | $ | 3,287,454 | $ | — | 4,325,319 | $ | 47,621,767 | ||||||||||||||||||
Domestic Equity Funds–57.47% |
| |||||||||||||||||||||||||||||||||||
Invesco All Cap Market Neutral Fund–Class R6(b) | 3.96 | % | 40,669,361 | 14,146,346 | (3,961,720 | ) | (8,764,565 | ) | 5,048,593 | — | 4,989,467 | 42,160,997 | ||||||||||||||||||||||||
Invesco American Franchise Fund–Class R6(b) | 5.66 | % | 60,437,305 | 5,631,136 | (17,774,415 | ) | (274,916 | ) | 15,253,779 | — | 2,973,905 | 60,221,585 | ||||||||||||||||||||||||
Invesco Comstock Fund–Class R6 | 7.93 | % | 60,426,150 | 27,032,581 | (13,512,194 | ) | 2,695,309 | 9,568,663 | 1,521,359 | 3,143,220 | 84,364,014 | |||||||||||||||||||||||||
Invesco Diversified Dividend Fund–Class R6 | 11.44 | % | 116,888,431 | 7,280,576 | (8,967,841 | ) | 2,470,599 | 4,861,029 | 2,629,472 | 5,974,037 | 121,631,398 | |||||||||||||||||||||||||
Invesco Endeavor Fund–Class R6(b) | 0.00 | % | 25,508,878 | 1,644,789 | (26,586,390 | ) | (7,161,627 | ) | 8,239,139 | — | — | — | ||||||||||||||||||||||||
Invesco Equally-Weighted S&P 500 Fund–Class R6 | 9.92 | % | 101,078,445 | 3,207,135 | (13,514,555 | ) | 11,433,289 | 4,734,437 | 1,754,620 | 1,741,847 | 105,486,236 | |||||||||||||||||||||||||
Invesco Long/Short Equity Fund–Class R6 | 2.96 | % | 30,291,114 | 7,078,557 | (6,877,329 | ) | 29,801 | 3,219,781 | 2,266,173 | 2,627,923 | 31,535,069 | |||||||||||||||||||||||||
Invesco Small Cap Equity Fund–Class R6(b) | 2.23 | % | 30,304,804 | 1,680,276 | (10,631,944 | ) | (1,521,788 | ) | 4,992,988 | — | 1,395,264 | 23,705,536 | ||||||||||||||||||||||||
PowerShares Russell Top 200 Pure Growth Portfolio–ETF | 6.91 | % | 60,284,846 | 10,263,734 | (17,581,347 | ) | 13,359,401 | 7,159,707 | 524,927 | 1,617,662 | 73,486,341 | |||||||||||||||||||||||||
PowerShares S&P Midcap Low Volatility Portfolio–ETF | 3.98 | % | 30,642,357 | 11,032,617 | (3,501,681 | ) | 3,333,175 | 804,165 | 734,861 | 932,363 | 42,310,633 | |||||||||||||||||||||||||
PowerShares S&P Smallcap Low Volatility Portfolio–ETF | 2.48 | % | 30,592,603 | 2,203,887 | (8,173,628 | ) | (374,115 | ) | 2,109,683 | 501,499 | 569,912 | 26,358,430 | ||||||||||||||||||||||||
Total Domestic Equity Funds | 587,124,294 | 91,201,634 | (131,083,044 | ) | 15,224,563 | 65,991,964 | 9,932,911 | 611,260,239 | ||||||||||||||||||||||||||||
Fixed–Income Funds–12.98% |
| |||||||||||||||||||||||||||||||||||
Invesco Core Plus Bond Fund–Class R6 | 5.24 | % | 41,164,816 | 16,520,856 | (2,800,906 | ) | 825,764 | 99,384 | 1,581,346 | 5,115,483 | 55,809,914 | |||||||||||||||||||||||||
Invesco Emerging Markets Flexible Bond Fund–Class R6 | 1.00 | % | 20,053,776 | 748,188 | (10,747,019 | ) | (145,249 | ) | 708,889 | 508,219 | 1,596,780 | 10,618,585 | ||||||||||||||||||||||||
Invesco Quality Income Fund–Class R5 | 2.50 | % | 25,822,828 | 1,897,584 | (837,393 | ) | (326,062 | ) | 7,948 | 945,894 | 2,213,742 | 26,564,905 | ||||||||||||||||||||||||
Invesco Short Term Bond Fund–Class R6 | 1.75 | % | 20,000,088 | 1,087,344 | (2,470,204 | ) | (53,397 | ) | 43,524 | 393,168 | 2,168,689 | 18,607,355 | ||||||||||||||||||||||||
PowerShares 1-30 Laddered Treasury Portfolio–ETF | 2.49 | % | 25,716,552 | 1,696,615 | (1,631,170 | ) | 577,697 | 129,378 | 523,033 | 808,333 | 26,489,072 | |||||||||||||||||||||||||
Total Fixed–Income Funds | 132,758,060 | 21,950,587 | (18,486,692 | ) | 878,753 | 989,123 | 3,951,660 | 138,089,831 | ||||||||||||||||||||||||||||
Foreign Equity Funds–22.02% |
| |||||||||||||||||||||||||||||||||||
Invesco Developing Markets Fund–Class R6 | 2.26 | % | 25,765,439 | 660,977 | (8,795,306 | ) | 5,146,666 | 1,229,141 | 263,635 | 640,014 | 24,006,917 | |||||||||||||||||||||||||
Invesco International Companies Fund–Class R6 | 4.77 | % | 30,533,372 | 22,452,404 | (9,152,151 | ) | 4,946,199 | 5,648,564 | 464,628 | 4,143,709 | 50,677,563 | |||||||||||||||||||||||||
Invesco International Growth Fund–Class R6 | 6.76 | % | 82,200,510 | 2,072,982 | (26,230,351 | ) | 3,438,018 | 11,062,460 | 1,449,740 | 1,954,889 | 71,920,377 | |||||||||||||||||||||||||
Invesco Low Volatility Emerging Markets Fund–Class R6 | 2.01 | % | 25,635,894 | 3,615,450 | (11,305,951 | ) | 1,093,839 | 4,964,508 | 464,156 | 2,436,177 | 21,413,991 | |||||||||||||||||||||||||
PowerShares FTSE RAFI Developed Markets ex-U.S. Portfolio–ETF | 6.22 | % | 61,204,472 | 1,866,412 | (9,074,207 | ) | 11,249,239 | 893,576 | 1,903,386 | 1,456,817 | 66,139,492 | |||||||||||||||||||||||||
Total Foreign Equity Funds | 225,339,687 | 30,668,225 | (64,557,966 | ) | 25,873,961 | 23,798,249 | 4,545,545 | 234,158,340 | ||||||||||||||||||||||||||||
Real Estate Funds–2.49% |
| |||||||||||||||||||||||||||||||||||
Invesco Global Real Estate Income Fund–Class R6 | 2.49 | % | 25,829,609 | 1,334,793 | (1,974,968 | ) | 1,187,954 | 100,062 | 1,006,898 | 2,909,610 | 26,477,450 | |||||||||||||||||||||||||
Money Market Funds–0.27% |
| |||||||||||||||||||||||||||||||||||
Invesco Government & Agency Portfolio–Institutional Class, | 0.09 | % | 3,574,943 | 71,367,347 | (73,933,070 | ) | — | — | 16,232 | 1,009,220 | 1,009,220 | |||||||||||||||||||||||||
Invesco Liquid Assets Portfolio–Institutional Class, 1.40%(d) | 0.07 | % | — | 2,198,673 | (1,477,802 | ) | (48 | ) | (84 | ) | 835 | 720,667 | 720,739 | |||||||||||||||||||||||
Invesco Treasury Portfolio–Institutional Class, | 0.11 | % | 2,383,295 | 48,332,027 | (49,561,928 | ) | — | — | 10,801 | 1,153,394 | 1,153,394 | |||||||||||||||||||||||||
Total Money Market Funds | 5,958,238 | 121,898,047 | (124,972,800 | ) | (48 | ) | (84 | ) | 27,868 | 2,883,353 | ||||||||||||||||||||||||||
TOTAL INVESTMENTS IN AFFILIATED ISSUERS | 99.71 | % | $ | 1,023,294,917 | $ | 271,081,736 | $ | (345,472,638 | ) | $ | 44,426,641 | $ | 94,166,768 | (c) | $ | 19,464,882 | $ | 1,060,490,980 | ||||||||||||||||||
OTHER ASSETS LESS LIABILITIES | 0.29 | % | 3,121,856 | |||||||||||||||||||||||||||||||||
NET ASSETS | 100.00 | % | $ | 1,063,612,836 | ||||||||||||||||||||||||||||||||
See accompanying Notes to Financial Statements which are an integral part of the financial statements.
24 Invesco Allocation Funds
Investment Abbreviations:
ETF – Exchange Traded Fund
Notes to Schedule of Investments:
| (a) | Each underlying fund and the Fund are affiliated by either having the same investment adviser or an investment adviser under common control with the Fund’s investment adviser. |
| (b) | Non-income producing security. A security is determined to be non-income producing if the security has not declared a distribution in more than one year from the report date. |
| (c) | Includes capital gains distributions from affiliated underlying funds as follows: |
| Fund Name | Capital Gain | |||
Invesco Balanced-Risk Allocation Fund | $ | 2,843,456 | ||
Invesco All Cap Market Neutral Fund | 4,977,018 | |||
Invesco American Franchise Fund | 3,051,304 | |||
Invesco Comstock Fund | 1,846,495 | |||
Invesco Diversified Dividend Fund | 901,396 | |||
Invesco Endeavor Fund | 1,644,789 | |||
Invesco Equally-Weighted S&P 500 Fund | 1,452,515 | |||
Invesco Long/Short Equity Fund | 2,206,855 | |||
Invesco Small Cap Equity Fund | 1,118,800 | |||
Invesco International Companies Fund | 3,750,825 | |||
Invesco International Growth Fund | 623,242 | |||
Invesco Low Volatility Emerging Markets Fund | 2,589,749 | |||
| (d) | The rate shown is the 7-day SEC standardized yield as of December 31, 2017. |
See accompanying Notes to Financial Statements which are an integral part of the financial statements.
25 Invesco Allocation Funds
Schedule of Investments—(continued)
December 31, 2017
Invesco Moderate Allocation Fund
Schedule of Investments in Affiliated Issuers–100.00%(a)
| % of Net Assets 12/31/17 | Value 12/31/16 | Purchases at Cost | Proceeds from Sales | Change in Unrealized Appreciation (Depreciation) | Realized Gain (Loss) | Dividend Income | Shares 12/31/17 | Value 12/31/17 | ||||||||||||||||||||||||||||
Asset Allocation Funds–4.51% |
| |||||||||||||||||||||||||||||||||||
Invesco Balanced–Risk Allocation Fund–Class R6(b) | 4.51 | % | $ | 35,217,249 | $ | 2,083,485 | $ | (3,568,412 | ) | $ | 935,408 | $ | 2,445,157 | $ | — | 3,181,599 | $ | 35,029,402 | ||||||||||||||||||
Domestic Equity Funds–43.68% |
| |||||||||||||||||||||||||||||||||||
Invesco All Cap Market Neutral Fund–Class R6(b) | 2.97 | % | 23,282,312 | 6,335,686 | (1,705,501 | ) | (4,796,026 | ) | 2,708,917 | — | 2,728,785 | 23,058,231 | ||||||||||||||||||||||||
Invesco American Franchise Fund–Class R6(b) | 4.18 | % | 34,649,626 | 2,821,229 | (11,743,500 | ) | 3,930,006 | 4,451,014 | — | 1,602,884 | 32,458,395 | |||||||||||||||||||||||||
Invesco Comstock Fund–Class R6(b) | 6.51 | % | 34,643,233 | 18,703,242 | (9,003,143 | ) | 4,680,715 | 2,625,381 | 900,441 | 1,883,625 | 50,556,486 | |||||||||||||||||||||||||
Invesco Diversified Dividend Fund–Class R6 | 9.93 | % | 73,812,420 | 5,069,912 | (5,823,264 | ) | 3,201,444 | 1,435,281 | 1,670,820 | 3,788,121 | 77,126,143 | |||||||||||||||||||||||||
Invesco Endeavor Fund–Class R6(b) | 0.00 | % | 15,596,298 | 981,267 | (16,251,947 | ) | (4,475,496 | ) | 5,131,145 | — | — | — | ||||||||||||||||||||||||
Invesco Equally-Weighted S&P 500 Fund–Class R6 | 7.96 | % | 61,813,136 | 1,871,362 | (10,690,612 | ) | 6,377,477 | 3,267,427 | 1,023,820 | 1,020,331 | 61,791,248 | |||||||||||||||||||||||||
Invesco Long/Short Equity Fund–Class R6 | 2.01 | % | 15,493,345 | 2,705,325 | (3,155,467 | ) | 13,099 | 1,580,818 | 1,098,993 | 1,297,241 | 15,566,893 | |||||||||||||||||||||||||
Invesco Small Cap Equity Fund–Class R6 | 1.99 | % | 15,443,734 | 1,039,265 | (2,343,371 | ) | 599,782 | 1,469,812 | — | 911,204 | 15,481,355 | |||||||||||||||||||||||||
PowerShares Russell Top 200 Pure Growth Portfolio–ETF | 5.91 | % | 34,487,290 | 10,860,993 | (11,827,906 | ) | 9,363,067 | 3,048,347 | 330,603 | 1,011,101 | 45,931,791 | |||||||||||||||||||||||||
PowerShares S&P Midcap Low Volatility Portfolio–ETF | 2.22 | % | 15,599,641 | 2,070,542 | (2,293,554 | ) | 1,330,522 | 521,820 | 301,489 | 379,660 | 17,228,971 | |||||||||||||||||||||||||
PowerShares S&P Smallcap Low Volatility Portfolio–ETF | 0.00 | % | 15,590,385 | — | (15,660,840 | ) | (3,873,719 | ) | 3,944,174 | 14,398 | — | — | ||||||||||||||||||||||||
Total Domestic Equity Funds | 340,411,420 | 52,458,823 | (90,499,105 | ) | 16,350,871 | 30,184,136 | 5,340,564 | 339,199,513 | ||||||||||||||||||||||||||||
Fixed–Income Funds–33.92% |
| |||||||||||||||||||||||||||||||||||
Invesco Core Plus Bond Fund–Class R6 | 10.23 | % | 77,527,403 | 6,193,778 | (5,862,308 | ) | 1,594,557 | 3,412 | 2,477,185 | 7,282,937 | 79,456,842 | |||||||||||||||||||||||||
Invesco Emerging Market Flexible Bond Fund–Class R6 | 2.99 | % | 23,222,233 | 1,369,852 | (1,797,839 | ) | 1,117,914 | (682,563 | ) | 1,161,901 | 3,493,172 | 23,229,597 | ||||||||||||||||||||||||
Invesco Floating Rate Fund–Class R6 | 2.24 | % | 15,677,520 | 2,723,524 | (970,318 | ) | (18,526 | ) | (8,505 | ) | 731,129 | 2,302,076 | 17,403,695 | |||||||||||||||||||||||
Invesco High Yield Fund–Class R6 | 3.01 | % | 27,455,082 | 1,400,723 | (6,035,642 | ) | 263,221 | 113,109 | 1,221,385 | 5,587,064 | 23,353,929 | |||||||||||||||||||||||||
Invesco Quality Income Fund–Class R5 | 5.99 | % | 38,813,498 | 10,651,823 | (2,405,663 | ) | (545,498 | ) | (21,419 | ) | 1,601,116 | 3,874,395 | 46,492,741 | |||||||||||||||||||||||
Invesco Short Duration Inflation Protected Fund–Class R6 | 2.49 | % | 19,269,168 | 779,409 | (358,282 | ) | (308,884 | ) | 3,615 | 417,012 | 1,871,142 | 19,385,026 | ||||||||||||||||||||||||
Invesco Short Term Bond Fund–Class R6 | 2.00 | % | 23,124,642 | 633,619 | (8,279,165 | ) | (114,390 | ) | 142,748 | 366,977 | 1,807,395 | 15,507,454 | ||||||||||||||||||||||||
PowerShares 1-30 Laddered Treasury Portfolio–ETF | 4.97 | % | 37,966,350 | 3,296,752 | (3,738,004 | ) | 1,078,457 | (16,454 | ) | 779,455 | 1,177,513 | 38,587,101 | ||||||||||||||||||||||||
Total Fixed–Income Funds | 263,055,896 | 27,049,480 | (29,447,221 | ) | 3,066,851 | (466,057 | ) | 8,756,160 | 263,416,385 | |||||||||||||||||||||||||||
Foreign Equity Funds–15.09% |
| |||||||||||||||||||||||||||||||||||
Invesco Developing Markets Fund–Class R6 | 1.51 | % | 11,872,747 | 128,522 | (3,291,855 | ) | 2,731,470 | 299,314 | 128,522 | 312,989 | 11,740,198 | |||||||||||||||||||||||||
Invesco International Companies Fund–Class R6 | 3.04 | % | 15,446,921 | 9,767,010 | (4,977,209 | ) | 2,492,573 | 2,612,895 | 213,389 | 1,931,280 | 23,619,554 | |||||||||||||||||||||||||
Invesco International Growth Fund–Class R6 | 4.50 | % | 39,272,319 | 1,007,113 | (12,019,912 | ) | 3,699,357 | 3,284,859 | 704,325 | 949,740 | 34,940,947 | |||||||||||||||||||||||||
Invesco Low Volatility Emerging Markets Fund–Class R6 | 1.28 | % | 11,754,123 | 1,638,120 | (5,018,919 | ) | 716,546 | 2,064,109 | 214,170 | 1,132,995 | 9,959,025 | |||||||||||||||||||||||||
PowerShares FTSE RAFI Developed Markets ex- U.S. Portfolio–ETF | 4.76 | % | 38,564,864 | — | (8,753,195 | ) | 6,492,789 | 674,568 | 1,073,069 | 814,516 | 36,979,026 | |||||||||||||||||||||||||
Total Foreign Equity Funds | 116,910,974 | 12,540,765 | (34,061,090 | ) | 16,132,735 | 8,935,745 | 2,333,475 | 117,238,750 | ||||||||||||||||||||||||||||
Real Estate Funds–2.49% |
| |||||||||||||||||||||||||||||||||||
Invesco Global Real Estate Income Fund–Class R6 | 2.49 | % | 19,742,878 | 923,640 | (2,331,561 | ) | 876,995 | 95,725 | 743,502 | 2,121,723 | 19,307,677 | |||||||||||||||||||||||||
Money Market Funds–0.31% |
| |||||||||||||||||||||||||||||||||||
Invesco Government & Agency Portfolio–Institutional Class, 1.18(e) | 0.11 | % | 2,673,608 | 62,068,092 | (63,895,308 | ) | — | — | 11,902 | 846,392 | 846,392 | |||||||||||||||||||||||||
Invesco Liquid Assets Portfolio–Institutional Class, 1.40(e) | 0.08 | % | — | 1,348,207 | (743,640 | ) | — | (28 | ) | 599 | 604,478 | 604,539 | ||||||||||||||||||||||||
Invesco Treasury Portfolio–Institutional Class, 1.17(e) | 0.12 | % | 1,782,406 | 41,903,575 | (42,718,675 | ) | — | — | 7,942 | 967,306 | 967,306 | |||||||||||||||||||||||||
Total Money Market Funds | 4,456,014 | 105,319,874 | (107,357,623 | ) | — | (28 | ) | 20,443 | 2,418,237 | |||||||||||||||||||||||||||
TOTAL INVESTMENTS IN AFFILIATED ISSUERS | 100.00 | % | $ | 779,794,431 | $ | 200,376,067 | $ | (267,265,012 | ) | $ | 37,362,860 | (c) | $ | 41,194,678 | (d) | $ | 17,194,144 | $ | 776,609,964 | |||||||||||||||||
OTHER ASSETS LESS LIABILITIES | (0.00 | )% | (11,791 | ) | ||||||||||||||||||||||||||||||||
NET ASSETS | 100.00 | % | $ | 776,598,173 | ||||||||||||||||||||||||||||||||
See accompanying Notes to Financial Statements which are an integral part of the financial statements.
26 Invesco Allocation Funds
Investment Abbreviations:
ETF – Exchange Traded Fund
Notes to Schedule of Investments:
| (a) | Each underlying fund and the Fund are affiliated by either having the same investment adviser or an investment adviser under common control with the Fund’s investment adviser. |
| (b) | Non-income producing security. A security is determined to be non-income producing if the security has not declared a distribution in more than one year from the report date. |
| (c) | Includes $157,436 of return of capital received from Invesco High Yield Fund. |
| (d) | Includes capital gains distributions from affiliated underlying funds as follows: |
| Fund Name | Capital Gain | |||
Invesco Balanced-Risk Allocation Fund | $ | 2,083,485 | ||
Invesco All Cap Market Neutral Fund | 2,767,157 | |||
Invesco American Franchise Fund | 1,649,980 | |||
Invesco Comstock Fund | 1,092,942 | |||
Invesco Diversified Dividend Fund | 569,650 | |||
Invesco Endeavor Fund | 981,267 | |||
Invesco Equally-Weighted S&P 500 Fund | 847,542 | |||
Invesco Long/Short Equity Fund | 1,070,227 | |||
Invesco Small Cap Equity Fund | 727,867 | |||
Invesco International Companies Fund | 1,722,636 | |||
Invesco International Growth Fund | 302,789 | |||
Invesco Low Volatility Emerging Markets Fund | 1,194,954 | |||
| (e) | The rate shown is the 7-day SEC standardized yield as of December 31, 2017. |
See accompanying Notes to Financial Statements which are an integral part of the financial statements.
27 Invesco Allocation Funds
Statement of Assets and Liabilities
December 31, 2017
| Invesco Conservative Allocation Fund | Invesco Growth Allocation Fund | Invesco Moderate Allocation Fund | ||||||||||||||||||||||
Assets: | ||||||||||||||||||||||||
Investments in affiliated underlying funds, at value | $ | 323,374,506 | $ | 1,060,490,980 | $ | 776,609,964 | ||||||||||||||||||
Cash | — | 4,095,647 | — | |||||||||||||||||||||
Receivable for: | ||||||||||||||||||||||||
Investments sold | — | 713,584 | — | |||||||||||||||||||||
Fund shares sold | 414,718 | 1,170,443 | 781,057 | |||||||||||||||||||||
Dividends from affiliated underlying funds | 4,501 | 3,534 | 5,651 | |||||||||||||||||||||
Investment for trustee deferred compensation and retirement plans | 94,563 | 213,544 | 152,648 | |||||||||||||||||||||
Other assets | 26,978 | 22,256 | 31,275 | |||||||||||||||||||||
Total assets | 323,915,266 | 1,066,709,988 | 777,580,595 | |||||||||||||||||||||
Liabilities: | ||||||||||||||||||||||||
Payable for: | ||||||||||||||||||||||||
Investments purchased | — | 1,432,378 | — | |||||||||||||||||||||
Fund shares reacquired | 309,405 | 606,771 | 301,807 | |||||||||||||||||||||
Accrued fees to affiliates | 186,169 | 723,902 | 452,717 | |||||||||||||||||||||
Accrued trustees’ and officer’s fees and benefits | 715 | 1,028 | 1,046 | |||||||||||||||||||||
Accrued operating expenses | 49,978 | 98,787 | 58,070 | |||||||||||||||||||||
Trustee deferred compensation and retirement plans | 104,019 | 234,286 | 168,782 | |||||||||||||||||||||
Total liabilities | 650,286 | 3,097,152 | 982,422 | |||||||||||||||||||||
Net assets applicable to shares outstanding | $ | 323,264,980 | $ | 1,063,612,836 | $ | 776,598,173 | ||||||||||||||||||
Net assets consist of: | ||||||||||||||||||||||||
Shares of beneficial interest | $ | 292,694,898 | $ | 882,948,117 | $ | 636,015,786 | ||||||||||||||||||
Undistributed net investment income | 154,956 | 3,986,078 | 2,104,404 | |||||||||||||||||||||
Undistributed net realized gain (loss) | (2,848,548 | ) | (25,855,973 | ) | 4,258,071 | |||||||||||||||||||
Net unrealized appreciation | 33,263,674 | 202,534,614 | 134,219,912 | |||||||||||||||||||||
| $ | 323,264,980 | $ | 1,063,612,836 | $ | 776,598,173 | |||||||||||||||||||
See accompanying Notes to Financial Statements which are an integral part of the financial statements.
28 Invesco Allocation Funds
Statement of Assets and Liabilities—(continued)
December 31, 2017
| Invesco Conservative Allocation Fund | Invesco Growth Allocation Fund | Invesco Moderate Allocation Fund | ||||||||||||||||||||||
Net Assets: | ||||||||||||||||||||||||
Class A | $ | 233,998,333 | $ | 844,779,725 | $ | 584,747,277 | ||||||||||||||||||
Class B | $ | 2,749,815 | $ | 14,051,616 | $ | 6,818,512 | ||||||||||||||||||
Class C | $ | 69,799,587 | $ | 147,229,141 | $ | 132,378,525 | ||||||||||||||||||
Class R | $ | 8,358,546 | $ | 21,598,001 | $ | 15,613,859 | ||||||||||||||||||
Class S | $ | 2,105,797 | $ | 25,357,887 | $ | 29,134,087 | ||||||||||||||||||
Class Y | $ | 6,231,542 | $ | 10,560,500 | $ | 7,880,483 | ||||||||||||||||||
Class R5 | $ | 11,087 | $ | 25,092 | $ | 14,929 | ||||||||||||||||||
Class R6 | $ | 10,273 | $ | 10,874 | $ | 10,501 | ||||||||||||||||||
Shares outstanding, no par value, | ||||||||||||||||||||||||
Class A | 20,124,463 | 52,630,441 | 42,945,606 | |||||||||||||||||||||
Class B | 239,380 | 883,658 | 504,363 | |||||||||||||||||||||
Class C | 6,064,710 | 9,252,369 | 9,798,711 | |||||||||||||||||||||
Class R | 721,591 | 1,348,652 | 1,149,273 | |||||||||||||||||||||
Class S | 180,882 | 1,581,481 | 2,140,660 | |||||||||||||||||||||
Class Y | 536,463 | 659,391 | 578,027 | |||||||||||||||||||||
Class R5 | 949 | 1,557 | 1,091 | |||||||||||||||||||||
Class R6 | 880 | 675 | 768 | |||||||||||||||||||||
Class A: | ||||||||||||||||||||||||
Net asset value per share | $ | 11.63 | $ | 16.05 | $ | 13.62 | ||||||||||||||||||
Maximum offering price per share | $ | 12.31 | $ | 16.98 | $ | 14.41 | ||||||||||||||||||
Maximum offering price per share | ||||||||||||||||||||||||
Class B: | ||||||||||||||||||||||||
Net asset value and offering price per share | $ | 11.49 | $ | 15.90 | $ | 13.52 | ||||||||||||||||||
Class C: | ||||||||||||||||||||||||
Net asset value and offering price per share | $ | 11.51 | $ | 15.91 | $ | 13.51 | ||||||||||||||||||
Class R: | ||||||||||||||||||||||||
Net asset value and offering price per share | $ | 11.58 | $ | 16.01 | $ | 13.59 | ||||||||||||||||||
Class S: | ||||||||||||||||||||||||
Net asset value and offering price per share | $ | 11.64 | $ | 16.03 | $ | 13.61 | ||||||||||||||||||
Class Y: | ||||||||||||||||||||||||
Net asset value and offering price per share | $ | 11.62 | $ | 16.02 | $ | 13.63 | ||||||||||||||||||
Class R5: | ||||||||||||||||||||||||
Net asset value and offering price per share | $ | 11.68 | $ | 16.12 | $ | 13.68 | ||||||||||||||||||
Class R6: | ||||||||||||||||||||||||
Net asset value and offering price per share | $ | 11.67 | $ | 16.11 | $ | 13.67 | ||||||||||||||||||
Cost of Investments in affiliated underlying funds | $ | 290,110,832 | $ | 857,956,366 | $ | 642,390,052 | ||||||||||||||||||
See accompanying Notes to Financial Statements which are an integral part of the financial statements.
29 Invesco Allocation Funds
Statement of Operations
For the year ended December 31, 2017
| Invesco Conservative Allocation Fund | Invesco Growth Allocation Fund | Invesco Moderate Allocation Fund | ||||||||||||||||||||||
Investment income: | ||||||||||||||||||||||||
Dividends from affiliated underlying funds | $ | 8,642,019 | $ | 19,464,882 | $ | 17,194,144 | ||||||||||||||||||
Expenses: | ||||||||||||||||||||||||
Administrative services fees | 108,923 | 272,954 | 211,637 | |||||||||||||||||||||
Custodian fees | 8,105 | 10,865 | 9,544 | |||||||||||||||||||||
Distribution fees: | ||||||||||||||||||||||||
Class A | 590,684 | 2,043,962 | 1,449,131 | |||||||||||||||||||||
Class B | 48,001 | 226,634 | 121,722 | |||||||||||||||||||||
Class C | 695,376 | 1,442,706 | 1,304,086 | |||||||||||||||||||||
Class R | 43,114 | 111,166 | 78,697 | |||||||||||||||||||||
Class S | 3,227 | 36,903 | 42,898 | |||||||||||||||||||||
Transfer agent fees — A, B, C, R, S and Y | 462,915 | 2,186,778 | 1,205,888 | |||||||||||||||||||||
Transfer agent fees — R5 | 12 | 15 | 13 | |||||||||||||||||||||
Transfer agent fees — R6 | 8 | 8 | 7 | |||||||||||||||||||||
Trustees’ and officers’ fees and benefits | 25,411 | 35,054 | 31,246 | |||||||||||||||||||||
Registration and filing fees | 108,897 | 132,419 | 117,273 | |||||||||||||||||||||
Reports to shareholders | 129,460 | 375,008 | 226,993 | |||||||||||||||||||||
Professional services fees | 53,478 | 62,339 | 51,757 | |||||||||||||||||||||
Other | 18,216 | 27,699 | 22,845 | |||||||||||||||||||||
Total expenses | 2,295,827 | 6,964,510 | 4,873,737 | |||||||||||||||||||||
Less: Expense offset arrangement(s) | (5,529 | ) | (28,961 | ) | (15,698 | ) | ||||||||||||||||||
Net expenses | 2,290,298 | 6,935,549 | 4,858,039 | |||||||||||||||||||||
Net investment income | 6,351,721 | 12,529,333 | 12,336,105 | |||||||||||||||||||||
Realized and unrealized gain from: | ||||||||||||||||||||||||
Net realized gain from: | ||||||||||||||||||||||||
Net realized gain on sales of affiliated underlying fund shares | 5,603,111 | 67,160,324 | 26,184,182 | |||||||||||||||||||||
Net realized gain from distributions of affiliated underlying fund shares | 3,921,902 | 27,006,444 | 15,010,496 | |||||||||||||||||||||
| 9,525,013 | 94,166,768 | 41,194,678 | ||||||||||||||||||||||
Change in net unrealized appreciation of affiliated underlying fund shares | 8,279,823 | 44,426,641 | 37,362,860 | |||||||||||||||||||||
Net gain from affiliated underlying funds | 17,804,836 | 138,593,409 | 78,557,538 | |||||||||||||||||||||
Net increase in net assets resulting from operations | $ | 24,156,557 | $ | 151,122,742 | $ | 90,893,643 | ||||||||||||||||||
See accompanying Notes to Financial Statements which are an integral part of the financial statements.
30 Invesco Allocation Funds
Statement of Changes in Net Assets
For the years ended December 31, 2017 and 2016
| Invesco Conservative Allocation Fund | Invesco Growth Allocation Fund | Invesco Moderate Allocation Fund | ||||||||||||||||||||||||||||||||||||||
| 2017 | 2016 | 2017 | 2016 | 2017 | 2016 | |||||||||||||||||||||||||||||||||||
Operations: | ||||||||||||||||||||||||||||||||||||||||
Net investment income | $ | 6,351,721 | $ | 6,820,916 | $ | 12,529,333 | $ | 11,001,450 | $ | 12,336,105 | $ | 12,134,085 | ||||||||||||||||||||||||||||
Net realized gain (loss) | 9,525,013 | (1,699,271 | ) | 94,166,768 | (2,331,712 | ) | 41,194,678 | (5,322,188 | ) | |||||||||||||||||||||||||||||||
Change in net unrealized appreciation | 8,279,823 | 16,639,652 | 44,426,641 | 78,396,587 | 37,362,860 | 54,706,543 | ||||||||||||||||||||||||||||||||||
Net increase in net assets resulting from operations | 24,156,557 | 21,761,297 | 151,122,742 | 87,066,325 | 90,893,643 | 61,518,440 | ||||||||||||||||||||||||||||||||||
Distributions to shareholders from net investment income: |
| |||||||||||||||||||||||||||||||||||||||
Class A | (6,813,601 | ) | (4,985,465 | ) | (15,251,774 | ) | (8,850,706 | ) | (14,295,237 | ) | (10,829,903 | ) | ||||||||||||||||||||||||||||
Class B | (81,982 | ) | (107,981 | ) | (162,601 | ) | (111,549 | ) | (178,620 | ) | (231,080 | ) | ||||||||||||||||||||||||||||
Class C | (1,493,727 | ) | (927,697 | ) | (1,555,975 | ) | (483,592 | ) | (2,244,570 | ) | (1,464,238 | ) | ||||||||||||||||||||||||||||
Class R | (223,464 | ) | (185,141 | ) | (334,496 | ) | (191,262 | ) | (343,299 | ) | (268,686 | ) | ||||||||||||||||||||||||||||
Class S | (64,100 | ) | (46,163 | ) | (482,793 | ) | (284,212 | ) | (739,459 | ) | (528,350 | ) | ||||||||||||||||||||||||||||
Class Y | (184,838 | ) | (106,582 | ) | (214,627 | ) | (89,859 | ) | (198,793 | ) | (105,862 | ) | ||||||||||||||||||||||||||||
Class R5 | (378 | ) | (329 | ) | (542 | ) | (185 | ) | (411 | ) | (292 | ) | ||||||||||||||||||||||||||||
Class R6 | (271 | ) | — | (237 | ) | — | (232 | ) | — | |||||||||||||||||||||||||||||||
Total distributions from net investment income | (8,862,361 | ) | (6,359,358 | ) | (18,003,045 | ) | (10,011,365 | ) | (18,000,621 | ) | (13,428,411 | ) | ||||||||||||||||||||||||||||
Distributions to shareholders from net realized gains: |
| |||||||||||||||||||||||||||||||||||||||
Class A | (616,738 | ) | (1,084,344 | ) | — | — | (8,186,572 | ) | — | |||||||||||||||||||||||||||||||
Class B | (7,970 | ) | (31,471 | ) | — | — | (112,314 | ) | — | |||||||||||||||||||||||||||||||
Class C | (185,169 | ) | (322,347 | ) | — | — | (1,867,240 | ) | — | |||||||||||||||||||||||||||||||
Class R | (21,875 | ) | (42,835 | ) | — | — | (217,185 | ) | — | |||||||||||||||||||||||||||||||
Class S | (5,572 | ) | (9,687 | ) | — | — | (410,294 | ) | — | |||||||||||||||||||||||||||||||
Class Y | (16,377 | ) | (21,489 | ) | — | — | (110,330 | ) | — | |||||||||||||||||||||||||||||||
Class R5 | (30 | ) | (64 | ) | — | — | (213 | ) | — | |||||||||||||||||||||||||||||||
Class R6 | (27 | ) | — | — | — | (150 | ) | — | ||||||||||||||||||||||||||||||||
Total distributions from net realized gains | (853,758 | ) | (1,512,237 | ) | — | — | (10,904,298 | ) | — | |||||||||||||||||||||||||||||||
Share transactions–net: | ||||||||||||||||||||||||||||||||||||||||
Class A | (16,055,601 | ) | (16,779,366 | ) | (53,062,590 | ) | (53,511,520 | ) | (42,574,193 | ) | (62,092,336 | ) | ||||||||||||||||||||||||||||
Class B | (4,195,409 | ) | (4,601,745 | ) | (20,701,283 | ) | (25,865,182 | ) | (11,819,646 | ) | (14,325,982 | ) | ||||||||||||||||||||||||||||
Class C | (4,156,896 | ) | (5,662,676 | ) | (15,372,696 | ) | (16,060,403 | ) | (8,245,023 | ) | (19,947,206 | ) | ||||||||||||||||||||||||||||
Class R | (1,568,320 | ) | (1,353,553 | ) | (3,669,956 | ) | (3,663,622 | ) | (2,956,978 | ) | (1,561,838 | ) | ||||||||||||||||||||||||||||
Class S | (151,218 | ) | (151,042 | ) | (1,121,880 | ) | (1,616,593 | ) | (570,720 | ) | (1,311,199 | ) | ||||||||||||||||||||||||||||
Class Y | 1,244,809 | 93,102 | 2,688,313 | 763,803 | 1,748,662 | 540,723 | ||||||||||||||||||||||||||||||||||
Class R5 | (3,875 | ) | 595 | 10,970 | — | — | — | |||||||||||||||||||||||||||||||||
Class R6 | 10,033 | — | 10,000 | — | 10,000 | — | ||||||||||||||||||||||||||||||||||
Net increase (decrease) in net assets resulting from share transactions | (24,876,477 | ) | (28,454,685 | ) | (91,219,122 | ) | (99,953,517 | ) | (64,407,898 | ) | (98,697,838 | ) | ||||||||||||||||||||||||||||
Net increase (decrease) in net assets | (10,436,039 | ) | (14,564,983 | ) | 41,900,575 | (22,898,557 | ) | (2,419,174 | ) | (50,607,809 | ) | |||||||||||||||||||||||||||||
Net assets: | ||||||||||||||||||||||||||||||||||||||||
Beginning of year | 333,701,019 | 348,266,002 | 1,021,712,261 | 1,044,610,818 | 779,017,347 | 829,625,156 | ||||||||||||||||||||||||||||||||||
End of year* | $ | 323,264,980 | $ | 333,701,019 | $ | 1,063,612,836 | $ | 1,021,712,261 | $ | 776,598,173 | $ | 779,017,347 | ||||||||||||||||||||||||||||
* Includes accumulated undistributed net investment income | $ | 154,956 | $ | 2,147,510 | $ | 3,986,078 | $ | 4,215,970 | $ | 2,104,404 | $ | 4,755,977 | ||||||||||||||||||||||||||||
See accompanying Notes to Financial Statements which are an integral part of the financial statements.
31 Invesco Allocation Funds
Notes to Financial Statements
December 31, 2017
NOTE 1—Significant Accounting Policies
AIM Growth Series (Invesco Growth Series) (the “Trust”) is organized as a Delaware statutory trust and is registered under the Investment Company Act of 1940, as amended (the “1940 Act”), as an open-end series management investment company consisting of twenty-nine separate series portfolios (each constituting a “Fund”), each authorized to issue an unlimited number of shares of beneficial interest. The Funds covered in this report, each a series portfolio of the Trust, are Invesco Conservative Allocation Fund, Invesco Growth Allocation Fund and Invesco Moderate Allocation Fund (collectively, the “Funds”). The assets, liabilities and operations of each portfolio are accounted for separately. Information presented in these financial statements pertains only to the Fund. Matters affecting each portfolio or class will be voted on exclusively by the shareholders of such portfolio or class.
The investment objectives of the Funds are: total return consistent with a lower level of risk relative to the broad stock market for Invesco Conservative Allocation Fund, long-term growth of capital consistent with a higher level of risk relative to the broad stock market for Invesco Growth Allocation Fund, and total return consistent with a moderate level of risk relative to the broad stock market for Invesco Moderate Allocation Fund.
Each Fund is a “fund of funds,” in that it invests in other mutual funds (“underlying funds”) advised by Invesco Advisers, Inc. (“Invesco”) and exchange-traded funds advised by Invesco PowerShares Capital Management LLC (“PowerShares Capital”), an affiliate of Invesco. Invesco and PowerShares Capital are affiliates of each other as they are indirect, wholly-owned subsidiaries of Invesco Ltd. Invesco may change each Fund’s asset class allocations, the underlying funds or target weightings in the underlying funds without shareholder approval. The underlying funds may engage in a number of investment techniques and practices, which involve certain risks. Each underlying fund’s accounting policies are outlined in the underlying fund’s financial statements and are publicly available.
Each Fund currently consists of eight different classes of shares: Class A, Class B, Class C, Class R, Class S, Class Y, Class R5 and Class R6. On April 4, 2017, the Fund began offering Class R6 shares. Class Y shares are available only to certain investors. Class A shares are sold with a front-end sales charge unless certain waiver criteria are met and under certain circumstances load waived shares may be subject to contingent deferred sales charges (“CDSC”). Class C shares are sold with a CDSC. Class R, Class S, Class Y and Class R5 shares are sold at net asset value. Effective November 30, 2010, new or additional investments in Class B shares are no longer permitted. Existing shareholders of Class B shares may continue to reinvest dividends and capital gains distributions in Class B shares until they convert to Class A shares. Also, shareholders in Class B shares will be able to exchange those shares for Class B shares of other Invesco Funds offering such shares until they convert to Class A shares. Generally, Class B shares will automatically convert to Class A shares on or about the month-end, which is at least eight years after the date of purchase. Redemption of Class B shares prior to the conversion date will be subject to a CDSC. Effective January 26, 2018, all of the Fund’s outstanding Class B shares were converted to Class A shares, in advance of their normally scheduled conversion. No CDSC was paid in connection with this early conversion.
Each Fund is an investment company and accordingly follows the investment company accounting and reporting guidance in accordance with Financial Accounting Standards Board Accounting Standards Codification Topic 946, Financial Services — Investment Companies.
The following is a summary of the significant accounting policies followed by the Funds in the preparation of their financial statements.
| A. | Security Valuations — Securities of investment companies that trade on an exchange are valued at the last sales price or official closing price as of the close of the customary trading session on the exchange where the security is principally traded. Investments in shares of funds that are not traded on an exchange are valued at the end-of-day net asset value per share of such fund. Securities in the underlying funds, including restricted securities, are valued in accordance with the valuation policy of such fund. The policies of the underlying funds affiliated with the Funds as a result of having the same investment adviser are set forth below. |
A security listed or traded on an exchange (except convertible securities) is valued at its last sales price or official closing price as of the close of the customary trading session on the exchange where the security is principally traded, or lacking any sales or official closing price on a particular day, the security may be valued at the closing bid price on that day. Securities traded in the over-the-counter market are valued based on prices furnished by independent pricing services or market makers. When such securities are valued by an independent pricing service they may be considered fair valued. Futures contracts are valued at the final settlement price set by an exchange on which they are principally traded. Listed options are valued at the mean between the last bid and asked prices from the exchange on which they are principally traded. Options not listed on an exchange are valued by an independent source at the mean between the last bid and asked prices. For purposes of determining net asset value (“NAV”) per share, futures and option contracts generally are valued 15 minutes after the close of the customary trading session of the New York Stock Exchange (“NYSE”).
Variable rate senior loan interests are fair valued using quotes provided by an independent pricing service. Quotes provided by the pricing service may reflect appropriate factors such as ratings, tranche type, industry, company performance, spread, individual trading characteristics, institution-size trading in similar groups of securities and other market data.
Investments in open-end and closed-end registered investment companies that do not trade on an exchange are valued at the end-of-day net asset value per share. Investments in open-end and closed-end registered investment companies that trade on an exchange are valued at the last sales price or official closing price as of the close of the customary trading session on the exchange where the security is principally traded.
Debt obligations (including convertible securities) and unlisted equities are fair valued using an evaluated quote provided by an independent pricing service. Evaluated quotes provided by the pricing service may be determined without exclusive reliance on quoted prices, and may reflect appropriate factors such as institution-size trading in similar groups of securities, developments related to specific securities, dividend rate (for unlisted equities), yield (for debt obligations), quality, type of issue, coupon rate (for debt obligations), maturity (for debt obligations), individual trading characteristics and other market data. Pricing services generally value debt obligations assuming orderly transactions of institutional round lot size, but a fund may hold or transact in the same securities in smaller, odd lot sizes. Odd lots often trade at lower prices than institutional round lots. Debt obligations are subject to interest rate and credit risks. In addition, all debt obligations involve some risk of default with respect to interest and/or principal payments.
Swap agreements are fair valued using an evaluated quote, if available, provided by an independent pricing service. Evaluated quotes provided by the pricing service are valued based on a model which may include end-of-day net present values, spreads, ratings, industry, company
32 Invesco Allocation Funds
performance and returns of referenced assets. Centrally cleared swap agreements are valued at the daily settlement price determined by the relevant exchange or clearinghouse.
Foreign securities’ (including foreign exchange contracts) prices are converted into U.S. dollar amounts using the applicable exchange rates as of the close of the NYSE. If market quotations are available and reliable for foreign exchange-traded equity securities, the securities will be valued at the market quotations. Because trading hours for certain foreign securities end before the close of the NYSE, closing market quotations may become unreliable. If between the time trading ends on a particular security and the close of the customary trading session on the NYSE, events occur that the investment adviser determines are significant and make the closing price unreliable, the Fund may fair value the security. If the event is likely to have affected the closing price of the security, the security will be valued at fair value in good faith using procedures approved by the Board of Trustees. Adjustments to closing prices to reflect fair value may also be based on a screening process of an independent pricing service to indicate the degree of certainty, based on historical data, that the closing price in the principal market where a foreign security trades is not the current value as of the close of the NYSE. Foreign securities’ prices meeting the approved degree of certainty that the price is not reflective of current value will be priced at the indication of fair value from the independent pricing service. Multiple factors may be considered by the independent pricing service in determining adjustments to reflect fair value and may include information relating to sector indices, American Depositary Receipts and domestic and foreign index futures. Foreign securities may have additional risks including exchange rate changes, potential for sharply devalued currencies and high inflation, political and economic upheaval, the relative lack of issuer information, relatively low market liquidity and the potential lack of strict financial and accounting controls and standards.
Securities for which market prices are not provided by any of the above methods may be valued based upon quotes furnished by independent sources. The last bid price may be used to value equity securities. The mean between the last bid and asked prices is used to value debt obligations, including corporate loans.
Securities for which market quotations are not readily available or became unreliable are valued at fair value as determined in good faith by or under the supervision of the Trust’s officers following procedures approved by the Board of Trustees. Issuer specific events, market trends, bid/asked quotes of brokers and information providers and other market data may be reviewed in the course of making a good faith determination of a security’s fair value.
The Funds may invest in securities that are subject to interest rate risk, meaning the risk that the prices will generally fall as interest rates rise and, conversely, the prices will generally rise as interest rates fall. Specific securities differ in their sensitivity to changes in interest rates depending on their individual characteristics. Changes in interest rates may result in increased market volatility, which may affect the value and/or liquidity of certain of each Fund’s investments.
Valuations change in response to many factors including the historical and prospective earnings of the issuer, the value of the issuer’s assets, general economic conditions, interest rates, investor perceptions and market liquidity. Because of the inherent uncertainties of valuation, the values reflected in the financial statements may materially differ from the value received upon actual sale of those investments.
| B. | Securities Transactions and Investment Income — Securities transactions are accounted for on a trade date basis. Realized gains or losses on sales are computed on the basis of specific identification of the securities sold. Distributions from ordinary income from underlying funds, if any, are recorded as dividend income on ex-dividend date. Distributions from gains from underlying funds, if any, are recorded as realized gains on the ex-dividend date. The following policies are followed by the underlying funds: Interest income (net of withholding tax, if any) is recorded on the accrual basis from settlement date. Bond premiums and discounts are amortized and/or accreted over the lives of the respective securities. Pay-in-kind interest income and non-cash dividend income received in the form of securities in-lieu of cash are recorded at the fair value of the securities received. Paydown gains and losses on mortgage and asset-backed securities are recorded as adjustments to interest income. |
The Funds may periodically participate in litigation related to each Fund’s investments. As such, the Funds may receive proceeds from litigation settlements. Any proceeds received are included in the Statements of Operations as realized gain (loss) for investments no longer held and as unrealized gain (loss) for investments still held.
The Funds allocate income and realized and unrealized capital gains and losses to a class based on the relative net assets of each class.
| C. | Distributions — Invesco Conservative Allocation Fund and Invesco Moderate Allocation Fund generally declare and pay dividends from net investment income, if any, quarterly. Invesco Growth Allocation Fund generally declares and pays dividends from net investment income, if any, annually. Distributions from net realized capital gains, if any, are generally declared and paid annually and recorded on the ex-dividend date. The Funds may elect to treat a portion of the proceeds from redemptions as distributions for federal tax purposes. |
| D. | Federal Income Taxes — The Funds intend to comply with the requirements of Subchapter M of the Internal Revenue Code of 1986, as amended (the “Internal Revenue Code”), necessary to qualify as a regulated investment company and to distribute substantially all of the Funds’ taxable earnings to shareholders. As such, the Funds will not be subject to federal income taxes on otherwise taxable income (including net realized capital gain) that is distributed to shareholders. Therefore, no provision for federal income taxes is recorded in the financial statements. |
The Funds recognize the tax benefits of uncertain tax positions only when the position is more likely than not to be sustained. Management has analyzed each Fund’s uncertain tax positions and concluded that no liability for unrecognized tax benefits should be recorded related to uncertain tax positions. Management is not aware of any tax positions for which it is reasonably possible that the total amounts of unrecognized tax benefits will change materially in the next 12 months.
Each Fund files tax returns in the U.S. Federal jurisdiction and certain other jurisdictions. Generally, each Fund is subject to examinations by such taxing authorities for up to three years after the filing of the return for the tax period.
| E. | Expenses — Expenses included in the accompanying financial statements reflect the expenses of the Funds and do not include any expenses of the underlying funds. The effects of the underlying funds expenses are included in the realized and unrealized gain/loss on the investments in the underlying funds. Estimated expenses of the underlying funds are discussed further within Note 11. |
Fees provided for under the Rule 12b-1 plan of a particular class of each Fund and which are directly attributable to that class are charged to the operations of such class. Transfer agency fees and expenses and other shareholder recordkeeping fees and expenses attributable to Class R5 are charged to such class. Transfer agency fees and expenses and other shareholder recordkeeping fees and expenses relating to all other classes are allocated among those classes based on relative net assets. All other expenses are allocated among the classes based on relative net assets.
33 Invesco Allocation Funds
| F. | Accounting Estimates – The preparation of financial statements in conformity with accounting principles generally accepted in the United States of America (“GAAP”) requires management to make estimates and assumptions that affect the reported amounts of assets and liabilities at the date of the financial statements and the reported amounts of revenues and expenses during the reporting period including estimates and assumptions related to taxation. Actual results could differ from those estimates by a significant amount. In addition, each Fund monitors for material events or transactions that may occur or become known after the period-end date and before the date the financial statements are released to print. |
| G. | Indemnifications — Under the Trust’s organizational documents, each Trustee, officer, employee or other agent of the Trust is indemnified against certain liabilities that may arise out of the performance of their duties to the Funds. Additionally, in the normal course of business, the Funds enter into contracts, including each Fund’s servicing agreements, that contain a variety of indemnification clauses. Each Fund’s maximum exposure under these arrangements is unknown as this would involve future claims that may be made against such Fund that have not yet occurred. The risk of material loss as a result of such indemnification claims is considered remote. |
NOTE 2—Advisory Fees and Other Fees Paid to Affiliates
The Trust has entered into a master investment advisory agreement with Invesco. Under the terms of the investment advisory agreement, the Funds do not pay an advisory fee. However, each Fund pays advisory fees to Invesco indirectly as a shareholder of the underlying funds.
Under the terms of a master sub-advisory agreement between the Adviser and each of Invesco Asset Management Deutschland GmbH, Invesco Asset Management Limited, Invesco Asset Management (Japan) Limited, Invesco Hong Kong Limited, Invesco Senior Secured Management, Inc. and Invesco Canada Ltd. (collectively, the “Affiliated Sub-Advisers”) the Adviser, not the Funds, will pay 40% of the fees paid to the Adviser to any such Affiliated Sub-Adviser(s) that provide(s) discretionary investment management services to each Fund based on the percentage of assets allocated to such Sub-Adviser(s).
Invesco has contractually agreed, through June 30, 2018, to reimburse expenses to the extent necessary to limit total annual fund operating expenses after expense reimbursement (excluding certain items discussed below) of Class A, Class B, Class C, Class R, Class S, Class Y, Class R5 and Class R6 shares for each Fund as shown in the following table (the “expense limits”):
| Class A | Class B | Class C | Class R | Class S | Class Y | Class R5 | Class R6 | |||||||||
Invesco Conservative Allocation Fund | 1.50% | 2.25% | 2.25% | 1.75% | 1.40% | 1.25% | 1.25% | 1.25% | ||||||||
Invesco Growth Allocation Fund | 2.00% | 2.75% | 2.75% | 2.25% | 1.90% | 1.75% | 1.75% | 1.75% | ||||||||
Invesco Moderate Allocation Fund | 1.50% | 2.25% | 2.25% | 1.75% | 1.40% | 1.25% | 1.25% | 1.25% |
In determining Invesco’s obligation to reimburse expenses, the following expenses are not taken into account, and could cause the total annual fund operating expenses after expense reimbursement to exceed the numbers reflected above: (1) interest; (2) taxes; (3) dividend expense on short sales; (4) extraordinary or non-routine items, including litigation expenses; and (5) expenses that the Fund has incurred but did not actually pay because of an expense offset arrangement. Acquired Fund Fees and Expenses are not operating expenses of a Fund directly, but are fees and expenses, including management fees of the investment companies in which a Fund invests. As a result, the total annual fund operating expenses after expense reimbursement may exceed the expense limits above. Unless Invesco continues the fee waiver agreement, it will terminate on June 30, 2018. During its term, the fee waiver agreement cannot be terminated or amended to increase the expense limits without approval of the Board of Trustees. To the extent that the annualized expense ratio does not exceed the expense limits, the Adviser will retain its ability to be reimbursed for such fee waivers or reimbursements prior to the end of each fiscal year. The Adviser did not waive fees and/or reimburse expenses during the period under these expense limits.
The Trust has entered into a master administrative services agreement with Invesco pursuant to which each Fund has agreed to pay Invesco for certain administrative costs incurred in providing accounting services to such Fund. For the year ended December 31, 2017, expenses incurred under the agreement are shown in the Statements of Operations as Administrative services fees.
The Trust has entered into a transfer agency and service agreement with Invesco Investment Services, Inc. (“IIS”) pursuant to which each Fund has agreed to pay IIS a fee for providing transfer agency and shareholder services to the Fund and reimburse IIS for certain expenses incurred by IIS in the course of providing such services. IIS may make payments to intermediaries that provide omnibus account services, sub-accounting services and/or networking services. All fees payable by IIS to intermediaries that provide omnibus account services or sub-accounting services are charged back to each Fund, subject to certain limitations approved by the Trust’s Board of Trustees. For the year ended December 31, 2017, expenses incurred under the agreement are shown in the Statement of Operations as Transfer agent fees.
The Trust has entered into master distribution agreements with Invesco Distributors, Inc. (“IDI”) to serve as the distributor for the Class A, Class B, Class C, Class R, Class S, Class Y, Class R5 and Class R6 shares of each Fund. The Trust has adopted plans pursuant to Rule 12b-1 under the 1940 Act with respect to each Fund’s Class A, Class B, Class C, Class R and Class S shares (collectively, the “Plans”). Each Fund, pursuant to the Plans, pays IDI compensation at the annual rate of 0.25% of the average daily net assets of Class A shares, 1.00% of the average daily net assets of Class B and Class C shares and 0.50% of the average daily net assets of Class R shares and 0.15% of the average daily net assets of Class S shares. The fees are accrued daily and paid monthly. Of the Plan payments, up to 0.25% of the average daily net assets of Class A, Class B, Class C and Class R shares and 0.15% of the average daily net assets of Class S shares may be paid to furnish continuing personal shareholder services to customers who purchase and own shares of such classes. Any amounts not paid as a service fee under the Plans would constitute an asset-based sales charge. Rules of the Financial Industry Regulatory Authority (“FINRA”) impose a cap on the total sales charges, including asset-based sales charges, that may be paid by any class of shares of each Fund. For the year ended December 31, 2017, expenses incurred under the Plans are shown in the Statement of Operations as Distribution fees.
Front-end sales commissions and CDSC (collectively, the “sales charges”) are not recorded as expenses of the Funds. Front-end sales commissions are deducted from proceeds from the sales of each Fund’s shares prior to investment in Class A shares of the Funds. CDSC are deducted from
34 Invesco Allocation Funds
redemption proceeds prior to remittance to the shareholder. During the year ended December 31, 2017, IDI advised the Funds that IDI retained the following in front-end sales commissions from the sale of Class A shares and received the following in CDSC imposed on redemptions by shareholders:
| Front End Sales Charges | Contingent Deferred Sales Charges | |||||||||||||||
| Class A | Class A | Class B | Class C | |||||||||||||
Invesco Conservative Allocation Fund | $ | 46,396 | $ | 538 | $ | 40 | $ | 3,252 | ||||||||
Invesco Growth Allocation Fund | 188,596 | 1,784 | 1 | 7,704 | ||||||||||||
Invesco Moderate Allocation Fund | 106,191 | 3,579 | 0 | 5,858 | ||||||||||||
The underlying Invesco Funds pay no distribution fees for Class R6 shares and the Funds pay no sales loads or other similar compensation to IDI for acquiring underlying fund shares.
Certain officers and trustees of the Trust are officers and directors of the Adviser, IIS and/or IDI.
NOTE 3—Additional Valuation Information
GAAP defines fair value as the price that would be received to sell an asset or paid to transfer a liability in an orderly transaction between market participants at the measurement date, under current market conditions. GAAP establishes a hierarchy that prioritizes the inputs to valuation methods, giving the highest priority to readily available unadjusted quoted prices in an active market for identical assets (Level 1) and the lowest priority to significant unobservable inputs (Level 3), generally when market prices are not readily available or are unreliable. Based on the valuation inputs, the securities or other investments are tiered into one of three levels. Changes in valuation methods may result in transfers in or out of an investment’s assigned level:
| Level 1 — | Prices are determined using quoted prices in an active market for identical assets. |
| Level 2 — | Prices are determined using other significant observable inputs. Observable inputs are inputs that other market participants may use in pricing a security. These may include quoted prices for similar securities, interest rates, prepayment speeds, credit risk, yield curves, loss severities, default rates, discount rates, volatilities and others. |
| Level 3 — | Prices are determined using significant unobservable inputs. In situations where quoted prices or observable inputs are unavailable (for example, when there is little or no market activity for an investment at the end of the period), unobservable inputs may be used. Unobservable inputs reflect each Fund’s own assumptions about the factors market participants would use in determining fair value of the securities or instruments and would be based on the best available information. |
As of December 31, 2017, all of the securities in each Fund were valued based on Level 1 inputs (see the Schedule of Investments for security categories). The level assigned to the securities valuations may not be an indication of the risk or liquidity associated with investing in those securities. Because of the inherent uncertainties of valuation, the values reflected in the financial statements may materially differ from the value received upon actual sale of those investments.
Each Fund’s policy is to recognize transfers in and out of the valuation levels as of the end of the reporting period. During the year ended December 31, 2017, there were no material transfers between valuation levels.
NOTE 4—Expense Offset Arrangement(s)
The expense offset arrangements are comprised of transfer agency credits which result from balances in demand deposit accounts used by the transfer agent for clearing shareholder transactions. For the year ended December 31, 2017, the Funds received credits from these arrangements, which resulted in the reduction of the Funds’ total expenses of:
| Transfer Agent Credits | ||||
Invesco Conservative Allocation Fund | $ | 5,529 | ||
Invesco Growth Allocation Fund | 28,961 | |||
Invesco Moderate Allocation Fund | 15,698 | |||
NOTE 5—Trustees’ and Officers’ Fees and Benefits
Trustees’ and Officers’ Fees and Benefits include amounts accrued by each Fund to pay remuneration to certain Trustees and Officers of such Fund. Trustees have the option to defer compensation payable by the Funds, and Trustees’ and Officers’ Fees and Benefits also include amounts accrued by each Fund to fund such deferred compensation amounts. Those Trustees who defer compensation have the option to select various Invesco Funds in which their deferral accounts shall be deemed to be invested. Finally, certain current Trustees were eligible to participate in a retirement plan that provided for benefits to be paid upon retirement to Trustees over a period of time based on the number of years of service. The Funds may have certain former Trustees who also participate in a retirement plan and receive benefits under such plan. Trustees’ and Officers’ Fees and Benefits include amounts accrued by each Fund to fund such retirement benefits. Obligations under the deferred compensation and retirement plans represent unsecured claims against the general assets of the Funds.
NOTE 6—Cash Balances
The Funds are permitted to temporarily carry a negative or overdrawn balance in their account with State Street Bank and Trust Company, the custodian bank. Such balances, if any at period-end, are shown in the Statements of Assets and Liabilities under the payable caption Amount due custodian. To compensate the custodian bank for such overdrafts, the overdrawn Fund may either (1) leave funds as a compensating balance in the account so the custodian bank can be compensated by earning the additional interest; or (2) compensate by paying the custodian bank at a rate agreed upon by the custodian bank and Invesco, not to exceed the contractually agreed upon rate.
35 Invesco Allocation Funds
NOTE 7—Distributions to Shareholders and Tax Components of Net Assets
Tax Character of Distributions to Shareholders Paid During the Fiscal Years Ended December 31, 2017 and 2016:
| 2017 | 2016 | |||||||||||||||||||||||
Ordinary Income | Long-term Capital Gain | Total Distributions | Ordinary Income | Long-term Capital Gain | Total Distributions | |||||||||||||||||||
Invesco Conservative Allocation Fund | $ | 8,862,361 | $ | 853,758 | $ | 9,716,119 | $ | 6,379,122 | $ | 1,492,473 | $ | 7,871,595 | ||||||||||||
Invesco Growth Allocation Fund | 18,003,045 | — | 18,003,045 | 10,011,365 | — | 10,011,365 | ||||||||||||||||||
Invesco Moderate Allocation Fund | 18,000,621 | 10,904,298 | 28,904,919 | 13,428,411 | — | 13,428,411 | ||||||||||||||||||
Tax Components of Net Assets at Period-End:
| Undistributed Ordinary Income | Undistributed Long-Term Gain | Net Unrealized Appreciation Investments | Temporary Book/Tax Differences | Capital Loss Carryforward | Shares of Beneficial Interest | Total Net Assets | ||||||||||||||||||||||
Invesco Conservative Allocation Fund | $ | 242,880 | $ | 3,890,993 | $ | 26,524,134 | $ | (87,925 | ) | $ | — | $ | 292,694,898 | $ | 323,264,980 | |||||||||||||
Invesco Growth Allocation Fund | 4,188,803 | — | 198,520,891 | (202,724 | ) | (21,842,251 | ) | 882,948,117 | 1,063,612,836 | |||||||||||||||||||
Invesco Moderate Allocation Fund | 2,251,323 | 14,087,397 | 124,390,586 | (146,919 | ) | — | 636,015,786 | 776,598,173 | ||||||||||||||||||||
The difference between book-basis and tax-basis unrealized appreciation (depreciation) is due to differences in the timing of recognition of gains and losses on investments for tax and book purposes. The Funds net unrealized appreciation differences are attributable primarily to wash sales.
The temporary book/tax differences are a result of timing differences between book and tax recognition of income and/or expenses. The Funds temporary book/tax differences are the result of the trustee deferral of compensation and retirement plan benefits.
Capital loss carryforward is calculated and reported as of a specific date. Results of transactions and other activity after that date may affect the amount of capital loss carryforward actually available for the Funds to utilize. Capital losses generated in years beginning after December 22, 2010 can be carried forward for an unlimited period, whereas previous losses expire in eight tax years. Capital losses with an expiration period may not be used to offset capital gains until all net capital losses without an expiration date have been utilized. Capital loss carryforwards with no expiration date will retain their character as either short-term or long-term capital losses instead of as short-term capital losses as under prior law. The ability to utilize capital loss carryforward in the future may be limited under the Internal Revenue Code and related regulations based on the results of future transactions.
The Funds have a capital loss carryforward as of December 31, 2017 which expires as follows:
| Invesco Conservative Allocation Fund | Invesco Growth Allocation Fund | Invesco Moderate Allocation Fund | ||||||||||||||||||||||||||||||||||
| Expiration* | Short-Term | Long-Term | Total | Short-Term | Long-Term | Total | Short-Term | Long-Term | Total | |||||||||||||||||||||||||||
December 31, 2018 | $ | — | $ | — | $ | — | $ | 21,842,251 | $ | — | $ | 21,842,251 | $ | — | $ | — | $ | — | ||||||||||||||||||
| * | Capital loss carryforward as of the date listed above is reduced for limitations, if any, to the extent required by the Internal Revenue Code and may be further limited depending upon a variety of factors, including the realization of net unrealized gains or losses as of the date of any reorganization. |
NOTE 8—Investment Transactions
The aggregate amount of investment securities purchased and sold by each Fund and aggregate cost and the net unrealized appreciation (depreciation) of investments for tax purposes are as follows:
| For the year ended December 31, 2017* | At December 31, 2017 | |||||||||||||||||||||||
Federal Tax Cost** | Unrealized Appreciation | Unrealized (Depreciation) | Net Appreciation | |||||||||||||||||||||
| Purchases | Sales | |||||||||||||||||||||||
Invesco Conservative Allocation Fund | $ | 36,252,464 | $ | 61,143,352 | $ | 296,850,372 | $ | 30,258,035 | $ | (3,733,901 | ) | $ | 26,524,134 | |||||||||||
Invesco Growth Allocation Fund | 149,183,689 | 220,499,838 | 861,970,089 | 207,957,456 | (9,436,565 | ) | 198,520,891 | |||||||||||||||||
Invesco Moderate Allocation Fund | 95,056,193 | 159,907,389 | 652,219,378 | 134,764,643 | (10,374,057 | ) | 124,390,586 | |||||||||||||||||
| * | Excludes U.S. Treasury obligations and money market funds, if any. |
| ** | Cost of investments, including any derivatives, on a tax basis includes the adjustments for financial reporting purposes as of the most recently completed federal income tax reporting period-end. |
NOTE 9—Reclassification of Permanent Differences
Primarily as a result of differing book/tax treatment of distributions from underlying funds and expired capital loss carryforward, on December 31, 2017, the following amounts were reclassified between undistributed net investment income, undistributed net realized gain (loss) and shares of beneficial interest. These reclassifications had no effect on the net assets of each Fund.
| Undistributed Net Investment Income | Undistributed Net Realized Gain (Loss) | Shares of Beneficial Interest | ||||||||||
Invesco Conservative Allocation Fund | $ | 518,086 | $ | (518,086 | ) | $ | — | |||||
Invesco Growth Allocation Fund | 5,243,820 | 3,874,488 | (9,118,308 | ) | ||||||||
Invesco Moderate Allocation Fund | 3,012,943 | (3,012,943 | ) | — | ||||||||
36 Invesco Allocation Funds
NOTE 10—Share Information
Invesco Conservative Allocation Fund
| Summary of Share Activity | ||||||||||||||||
| 2017(a) | 2016 | |||||||||||||||
| Shares | Amount | Shares | Amount | |||||||||||||
Sold: | ||||||||||||||||
Class A | 2,179,778 | $ | 25,092,721 | 2,982,770 | $ | 32,646,884 | ||||||||||
Class B | 15,208 | 173,553 | 34,767 | 372,008 | ||||||||||||
Class C | 1,253,506 | 14,281,371 | 1,345,953 | 14,547,988 | ||||||||||||
Class R | 186,815 | 2,141,638 | 229,698 | 2,488,146 | ||||||||||||
Class S | 2,635 | 30,266 | 4,040 | 44,186 | ||||||||||||
Class Y | 291,419 | 3,353,162 | 169,667 | 1,870,979 | ||||||||||||
Class R5 | 22 | 250 | 48 | 515 | ||||||||||||
Class R6(b) | 880 | 10,033 | — | — | ||||||||||||
Issued as reinvestment of dividends: | ||||||||||||||||
Class A | 609,040 | 7,024,869 | 519,024 | 5,724,631 | ||||||||||||
Class B | 7,585 | 86,373 | 12,213 | 132,968 | ||||||||||||
Class C | 141,484 | 1,617,806 | 109,035 | 1,191,282 | ||||||||||||
Class R | 20,510 | 235,766 | 19,544 | 214,926 | ||||||||||||
Class S | 6,031 | 69,672 | 5,058 | 55,850 | ||||||||||||
Class Y | 15,496 | 178,615 | 9,707 | 106,969 | ||||||||||||
Class R5 | 2 | 23 | 9 | 100 | ||||||||||||
Automatic conversion of Class B shares to Class A shares: | ||||||||||||||||
Class A | 284,495 | 3,279,133 | 288,887 | 3,150,066 | ||||||||||||
Class B | (288,185 | ) | (3,279,133 | ) | (292,563 | ) | (3,150,066 | ) | ||||||||
Reacquired: | ||||||||||||||||
Class A | (4,476,262 | ) | (51,452,324 | ) | (5,308,660 | ) | (58,300,947 | ) | ||||||||
Class B | (103,798 | ) | (1,176,202 | ) | (181,524 | ) | (1,956,655 | ) | ||||||||
Class C | (1,765,953 | ) | (20,056,073 | ) | (1,971,949 | ) | (21,401,946 | ) | ||||||||
Class R | (345,437 | ) | (3,945,724 | ) | (369,845 | ) | (4,056,625 | ) | ||||||||
Class S | (21,792 | ) | (251,156 | ) | (22,953 | ) | (251,078 | ) | ||||||||
Class Y | (199,105 | ) | (2,286,968 | ) | (171,683 | ) | (1,884,846 | ) | ||||||||
Class R5 | (363 | ) | (4,148 | ) | (2 | ) | (20 | ) | ||||||||
Net increase (decrease) in share activity | (2,185,989 | ) | $ | (24,876,477 | ) | (2,588,759 | ) | $ | (28,454,685 | ) | ||||||
| (a) | There are entities that are record owners of more than 5% of the outstanding shares of the Fund and in the aggregate own 31% of the outstanding shares of the Fund. IDI has an agreement with these entities to sell Fund shares. The Fund, Invesco and/or Invesco affiliates may make payments to these entities, which are considered to be related to the Fund, for providing services to the Fund, Invesco and/or Invesco affiliates including but not limited to services such as securities brokerage, distribution, third party record keeping and account servicing. The Fund has no knowledge as to whether all or any portion of the shares owned of record by these entities are also owned beneficially. |
| (b) | Commencement date April 4, 2017. |
37 Invesco Allocation Funds
NOTE 10—Share Information—(continued)
Invesco Growth Allocation Fund
| Summary of Share Activity | ||||||||||||||||
| 2017(a) | 2016 | |||||||||||||||
| Shares | Amount | Shares | Amount | |||||||||||||
Sold: | ||||||||||||||||
Class A | 4,214,782 | $ | 64,040,057 | 4,899,029 | $ | 65,695,541 | ||||||||||
Class B | 23,847 | 355,086 | 45,474 | 604,129 | ||||||||||||
Class C | 1,226,581 | 18,431,307 | 1,431,219 | 18,972,651 | ||||||||||||
Class R | 272,557 | 4,160,187 | 318,704 | 4,249,338 | ||||||||||||
Class S | 49,660 | 751,344 | 62,833 | 838,636 | ||||||||||||
Class Y | 459,315 | 7,027,896 | 216,691 | 2,956,796 | ||||||||||||
Class R5 | 670 | 10,734 | — | — | ||||||||||||
Class R6(b) | 675 | 10,000 | — | — | ||||||||||||
Issued as reinvestment of dividends: | ||||||||||||||||
Class A | 930,917 | 14,866,743 | 610,183 | 8,627,989 | ||||||||||||
Class B | 10,094 | 159,790 | 7,871 | 110,273 | ||||||||||||
Class C | 96,099 | 1,522,208 | 33,693 | 472,383 | ||||||||||||
Class R | 20,973 | 334,305 | 13,564 | 191,258 | ||||||||||||
Class S | 30,250 | 482,793 | 20,128 | 284,212 | ||||||||||||
Class Y | 11,305 | 180,205 | 5,842 | 82,370 | ||||||||||||
Class R5 | 15 | 236 | — | — | ||||||||||||
Automatic conversion of Class B shares to Class A shares: | ||||||||||||||||
Class A | 1,154,352 | 17,559,742 | 1,430,461 | 19,238,490 | ||||||||||||
Class B | (1,168,876 | ) | (17,559,742 | ) | (1,449,150 | ) | (19,238,490 | ) | ||||||||
Reacquired: | ||||||||||||||||
Class A | (9,865,302 | ) | (149,529,132 | ) | (10,905,547 | ) | (147,073,540 | ) | ||||||||
Class B | (246,204 | ) | (3,656,417 | ) | (554,420 | ) | (7,341,094 | ) | ||||||||
Class C | (2,365,053 | ) | (35,326,211 | ) | (2,662,828 | ) | (35,505,437 | ) | ||||||||
Class R | (534,143 | ) | (8,164,448 | ) | (609,913 | ) | (8,104,218 | ) | ||||||||
Class S | (153,598 | ) | (2,356,017 | ) | (204,477 | ) | (2,739,441 | ) | ||||||||
Class Y | (295,067 | ) | (4,519,788 | ) | (171,785 | ) | (2,275,363 | ) | ||||||||
Net increase (decrease) in share activity | (6,126,151 | ) | $ | (91,219,122 | ) | (7,462,428 | ) | $ | (99,953,517 | ) | ||||||
| (a) | There are entities that are record owners of more than 5% of the outstanding shares of the Fund and in the aggregate own 26% of the outstanding shares of the Fund. IDI has an agreement with these entities to sell Fund shares. The Fund, Invesco and/or Invesco affiliates may make payments to these entities, which are considered to be related to the Fund, for providing services to the Fund, Invesco and/or Invesco affiliates including but not limited to services such as securities brokerage, distribution, third party record keeping and account servicing. The Fund has no knowledge as to whether all or any portion of the shares owned of record by these entities are also owned beneficially. |
| (b) | Commencement date April 4, 2017. |
38 Invesco Allocation Funds
NOTE 10—Share Information—(continued)
Invesco Moderate Allocation Fund
| Summary of Share Activity | ||||||||||||||||
| 2017(a) | 2016 | |||||||||||||||
| Shares | Amount | Shares | Amount | |||||||||||||
Sold: | ||||||||||||||||
Class A | 3,631,868 | $ | 48,078,342 | 4,344,787 | $ | 52,750,014 | ||||||||||
Class B | 29,659 | 388,458 | 67,072 | 814,413 | ||||||||||||
Class C | 1,498,393 | 19,664,675 | 1,627,026 | 19,515,581 | ||||||||||||
Class R | 259,588 | 3,452,345 | 359,119 | 4,360,614 | ||||||||||||
Class S | 70,027 | 927,197 | 74,183 | 896,533 | ||||||||||||
Class Y | 429,256 | 5,701,208 | 232,739 | 2,867,295 | ||||||||||||
Class R6(b) | 768 | 10,000 | — | — | ||||||||||||
Issued as reinvestment of dividends: | ||||||||||||||||
Class A | 1,620,023 | 21,747,928 | 838,550 | 10,372,697 | ||||||||||||
Class B | 21,278 | 283,179 | 18,323 | 225,042 | ||||||||||||
Class C | 298,107 | 3,979,995 | 113,415 | 1,396,047 | ||||||||||||
Class R | 41,534 | 556,777 | 21,501 | 265,618 | ||||||||||||
Class S | 85,655 | 1,149,123 | 42,697 | 527,910 | ||||||||||||
Class Y | 18,804 | 252,908 | 6,473 | 80,219 | ||||||||||||
Automatic conversion of Class B shares to Class A shares: | ||||||||||||||||
Class A | 725,301 | 9,633,260 | 803,388 | 9,754,811 | ||||||||||||
Class B | (730,914 | ) | (9,633,260 | ) | (809,589 | ) | (9,754,811 | ) | ||||||||
Reacquired: | ||||||||||||||||
Class A | (9,237,606 | ) | (122,033,723 | ) | (11,111,688 | ) | (134,969,858 | ) | ||||||||
Class B | (220,018 | ) | (2,858,023 | ) | (464,491 | ) | (5,610,626 | ) | ||||||||
Class C | (2,435,831 | ) | (31,889,693 | ) | (3,384,773 | ) | (40,858,834 | ) | ||||||||
Class R | (529,159 | ) | (6,966,100 | ) | (516,631 | ) | (6,188,070 | ) | ||||||||
Class S | (198,587 | ) | (2,647,040 | ) | (226,215 | ) | (2,735,642 | ) | ||||||||
Class Y | (315,755 | ) | (4,205,454 | ) | (197,545 | ) | (2,406,791 | ) | ||||||||
Net increase (decrease) in share activity | (4,937,609 | ) | $ | (64,407,898 | ) | (8,161,659 | ) | $ | (98,697,838 | ) | ||||||
| (a) | There is an entity that is a record owner of more than 5% of the outstanding shares of the Fund and owns 22% of the outstanding shares of the Fund. IDI has an agreement with this entity to sell Fund shares. The Fund, Invesco and/or Invesco affiliates may make payments to this entity, which is considered to be related to the Fund, for providing services to the Fund, Invesco and/or Invesco affiliates including but not limited to services such as, securities brokerage, distribution, third party record keeping and account servicing. The Fund has no knowledge as to whether all or any portion of the shares owned of record by this entity are also owned beneficially. |
| (b) | Commencement date April 4, 2017. |
39 Invesco Allocation Funds
NOTE 11—Financial Highlights
The following schedules present financial highlights for a share of each Fund outstanding throughout the periods indicated.
Invesco Conservative Allocation Fund
| Net asset value, beginning of period | Net investment income(a) | Net gains (losses) on securities (both realized and unrealized) | Total from investment operations | Dividends from net investment income | Distributions from net realized gains | Total distributions | Net asset value, end of period | Total return(b) | Net assets, end of period (000’s omitted) | Ratio of expenses to average net assets with fee waivers and/or expense reimbursements(c) | Ratio of expenses to average net assets without fee waivers and/or expense reimbursements | Ratio of net investment income to average net assets | Portfolio turnover(d) | |||||||||||||||||||||||||||||||||||||||||||
Class A |
| |||||||||||||||||||||||||||||||||||||||||||||||||||||||
Year ended 12/31/17 | $ | 11.13 | $ | 0.24 | $ | 0.63 | $ | 0.87 | $ | (0.34 | ) | $ | (0.03 | ) | $ | (0.37 | ) | $ | 11.63 | 7.87 | % | $ | 233,998 | 0.53 | %(e) | 0.53 | %(e) | 2.11 | %(e) | 11 | % | |||||||||||||||||||||||||
Year ended 12/31/16 | 10.70 | 0.23 | 0.47 | 0.70 | (0.22 | ) | (0.05 | ) | (0.27 | ) | 11.13 | 6.63 | 239,626 | 0.50 | 0.50 | 2.16 | 45 | |||||||||||||||||||||||||||||||||||||||
Year ended 12/31/15 | 11.34 | 0.26 | (0.60 | ) | (0.34 | ) | (0.30 | ) | — | (0.30 | ) | 10.70 | (3.07 | ) | 246,518 | 0.51 | 0.51 | 2.24 | 12 | |||||||||||||||||||||||||||||||||||||
Year ended 12/31/14 | 11.08 | 0.27 | 0.28 | 0.55 | (0.29 | ) | — | (0.29 | ) | 11.34 | 5.01 | 256,587 | 0.50 | 0.50 | 2.40 | 7 | ||||||||||||||||||||||||||||||||||||||||
Year ended 12/31/13 | 10.70 | 0.23 | 0.37 | 0.60 | (0.22 | ) | — | (0.22 | ) | 11.08 | 5.58 | 243,852 | 0.50 | 0.50 | 2.06 | 20 | ||||||||||||||||||||||||||||||||||||||||
Class B | ||||||||||||||||||||||||||||||||||||||||||||||||||||||||
Year ended 12/31/17 | 11.00 | 0.15 | 0.62 | 0.77 | (0.25 | ) | (0.03 | ) | (0.28 | ) | 11.49 | 7.02 | 2,750 | 1.28 | (e) | 1.28 | (e) | 1.36 | (e) | 11 | ||||||||||||||||||||||||||||||||||||
Year ended 12/31/16 | 10.57 | 0.15 | 0.47 | 0.62 | (0.14 | ) | (0.05 | ) | (0.19 | ) | 11.00 | 5.88 | 6,692 | 1.25 | 1.25 | 1.41 | 45 | |||||||||||||||||||||||||||||||||||||||
Year ended 12/31/15 | 11.21 | 0.17 | (0.60 | ) | (0.43 | ) | (0.21 | ) | — | (0.21 | ) | 10.57 | (3.87 | ) | 10,945 | 1.26 | 1.26 | 1.49 | 12 | |||||||||||||||||||||||||||||||||||||
Year ended 12/31/14 | 10.94 | 0.19 | 0.28 | 0.47 | (0.20 | ) | — | (0.20 | ) | 11.21 | 4.34 | 17,243 | 1.25 | 1.25 | 1.65 | 7 | ||||||||||||||||||||||||||||||||||||||||
Year ended 12/31/13 | 10.60 | 0.14 | 0.37 | 0.51 | (0.17 | ) | — | (0.17 | ) | 10.94 | 4.83 | 22,965 | 1.25 | 1.25 | 1.31 | 20 | ||||||||||||||||||||||||||||||||||||||||
Class C | ||||||||||||||||||||||||||||||||||||||||||||||||||||||||
Year ended 12/31/17 | 11.02 | 0.16 | 0.61 | 0.77 | (0.25 | ) | (0.03 | ) | (0.28 | ) | 11.51 | 7.02 | 69,800 | 1.28 | (e) | 1.28 | (e) | 1.36 | (e) | 11 | ||||||||||||||||||||||||||||||||||||
Year ended 12/31/16 | 10.59 | 0.15 | 0.47 | 0.62 | (0.14 | ) | (0.05 | ) | (0.19 | ) | 11.02 | 5.88 | 70,906 | 1.25 | 1.25 | 1.41 | 45 | |||||||||||||||||||||||||||||||||||||||
Year ended 12/31/15 | 11.23 | 0.17 | (0.60 | ) | (0.43 | ) | (0.21 | ) | — | (0.21 | ) | 10.59 | (3.86 | ) | 73,617 | 1.26 | 1.26 | 1.49 | 12 | |||||||||||||||||||||||||||||||||||||
Year ended 12/31/14 | 10.96 | 0.19 | 0.28 | 0.47 | (0.20 | ) | — | (0.20 | ) | 11.23 | 4.34 | 77,159 | 1.25 | 1.25 | 1.65 | 7 | ||||||||||||||||||||||||||||||||||||||||
Year ended 12/31/13 | 10.63 | 0.14 | 0.36 | 0.50 | (0.17 | ) | — | (0.17 | ) | 10.96 | 4.73 | 68,657 | 1.25 | 1.25 | 1.31 | 20 | ||||||||||||||||||||||||||||||||||||||||
Class R | ||||||||||||||||||||||||||||||||||||||||||||||||||||||||
Year ended 12/31/17 | 11.09 | 0.21 | 0.62 | 0.83 | (0.31 | ) | (0.03 | ) | (0.34 | ) | 11.58 | 7.52 | 8,359 | 0.78 | (e) | 0.78 | (e) | 1.86 | (e) | 11 | ||||||||||||||||||||||||||||||||||||
Year ended 12/31/16 | 10.66 | 0.21 | 0.47 | 0.68 | (0.20 | ) | (0.05 | ) | (0.25 | ) | 11.09 | 6.38 | 9,534 | 0.75 | 0.75 | 1.91 | 45 | |||||||||||||||||||||||||||||||||||||||
Year ended 12/31/15 | 11.30 | 0.23 | (0.60 | ) | (0.37 | ) | (0.27 | ) | — | (0.27 | ) | 10.66 | (3.34 | ) | 10,448 | 0.76 | 0.76 | 1.99 | 12 | |||||||||||||||||||||||||||||||||||||
Year ended 12/31/14 | 11.04 | 0.24 | 0.28 | 0.52 | (0.26 | ) | — | (0.26 | ) | 11.30 | 4.75 | 10,211 | 0.75 | 0.75 | 2.15 | 7 | ||||||||||||||||||||||||||||||||||||||||
Year ended 12/31/13 | 10.67 | 0.20 | 0.37 | 0.57 | (0.20 | ) | — | (0.20 | ) | 11.04 | 5.36 | 9,453 | 0.75 | 0.75 | 1.81 | 20 | ||||||||||||||||||||||||||||||||||||||||
Class S | ||||||||||||||||||||||||||||||||||||||||||||||||||||||||
Year ended 12/31/17 | 11.14 | 0.26 | 0.62 | 0.88 | (0.35 | ) | (0.03 | ) | (0.38 | ) | 11.64 | 7.97 | 2,106 | 0.43 | (e) | 0.43 | (e) | 2.21 | (e) | 11 | ||||||||||||||||||||||||||||||||||||
Year ended 12/31/16 | 10.71 | 0.25 | 0.46 | 0.71 | (0.23 | ) | (0.05 | ) | (0.28 | ) | 11.14 | 6.73 | 2,162 | 0.40 | 0.40 | 2.26 | 45 | |||||||||||||||||||||||||||||||||||||||
Year ended 12/31/15 | 11.36 | 0.26 | (0.60 | ) | (0.34 | ) | (0.31 | ) | — | (0.31 | ) | 10.71 | (3.05 | ) | 2,226 | 0.41 | 0.41 | 2.34 | 12 | |||||||||||||||||||||||||||||||||||||
Year ended 12/31/14 | 11.09 | 0.29 | 0.28 | 0.57 | (0.30 | ) | — | (0.30 | ) | 11.36 | 5.20 | 2,525 | 0.40 | 0.40 | 2.50 | 7 | ||||||||||||||||||||||||||||||||||||||||
Year ended 12/31/13 | 10.70 | 0.24 | 0.37 | 0.61 | (0.22 | ) | — | (0.22 | ) | 11.09 | 5.73 | 2,863 | 0.40 | 0.40 | 2.16 | 20 | ||||||||||||||||||||||||||||||||||||||||
Class Y | ||||||||||||||||||||||||||||||||||||||||||||||||||||||||
Year ended 12/31/17 | 11.12 | 0.27 | 0.63 | 0.90 | (0.37 | ) | (0.03 | ) | (0.40 | ) | 11.62 | 8.15 | 6,232 | 0.28 | (e) | 0.28 | (e) | 2.36 | (e) | 11 | ||||||||||||||||||||||||||||||||||||
Year ended 12/31/16 | 10.69 | 0.26 | 0.47 | 0.73 | (0.25 | ) | (0.05 | ) | (0.30 | ) | 11.12 | 6.90 | 4,767 | 0.25 | 0.25 | 2.41 | 45 | |||||||||||||||||||||||||||||||||||||||
Year ended 12/31/15 | 11.33 | 0.28 | (0.60 | ) | (0.32 | ) | (0.32 | ) | — | (0.32 | ) | 10.69 | (2.83 | ) | 4,498 | 0.26 | 0.26 | 2.49 | 12 | |||||||||||||||||||||||||||||||||||||
Year ended 12/31/14 | 11.07 | 0.30 | 0.28 | 0.58 | (0.32 | ) | — | (0.32 | ) | 11.33 | 5.28 | 3,871 | 0.25 | 0.25 | 2.65 | 7 | ||||||||||||||||||||||||||||||||||||||||
Year ended 12/31/13 | 10.67 | 0.25 | 0.38 | 0.63 | (0.23 | ) | — | (0.23 | ) | 11.07 | 5.91 | 3,751 | 0.25 | 0.25 | 2.31 | 20 | ||||||||||||||||||||||||||||||||||||||||
Class R5 | ||||||||||||||||||||||||||||||||||||||||||||||||||||||||
Year ended 12/31/17 | 11.18 | 0.28 | 0.62 | 0.90 | (0.37 | ) | (0.03 | ) | (0.40 | ) | 11.68 | 8.16 | 11 | 0.24 | (e) | 0.24 | (e) | 2.40 | (e) | 11 | ||||||||||||||||||||||||||||||||||||
Year ended 12/31/16 | 10.74 | 0.27 | 0.48 | 0.75 | (0.26 | ) | (0.05 | ) | (0.31 | ) | 11.18 | 7.03 | 14 | 0.20 | 0.20 | 2.46 | 45 | |||||||||||||||||||||||||||||||||||||||
Year ended 12/31/15 | 11.40 | 0.29 | (0.62 | ) | (0.33 | ) | (0.33 | ) | — | (0.33 | ) | 10.74 | (2.92 | ) | 13 | 0.20 | 0.20 | 2.55 | 12 | |||||||||||||||||||||||||||||||||||||
Year ended 12/31/14 | 11.13 | 0.31 | 0.29 | 0.60 | (0.33 | ) | — | (0.33 | ) | 11.40 | 5.41 | 27 | 0.21 | 0.21 | 2.69 | 7 | ||||||||||||||||||||||||||||||||||||||||
Year ended 12/31/13 | 10.73 | 0.26 | 0.37 | 0.63 | (0.23 | ) | — | (0.23 | ) | 11.13 | 5.92 | 47 | 0.20 | 0.20 | 2.36 | 20 | ||||||||||||||||||||||||||||||||||||||||
Class R6 | ||||||||||||||||||||||||||||||||||||||||||||||||||||||||
Year ended 12/31/17(f) | 11.40 | 0.21 | 0.40 | 0.61 | (0.31 | ) | (0.03 | ) | (0.34 | ) | 11.67 | 5.38 | 10 | 0.24 | (e)(g) | 0.24 | (e)(g) | 2.40 | (e)(g) | 11 | ||||||||||||||||||||||||||||||||||||
| (a) | Calculated using average shares outstanding. |
| (b) | Includes adjustments in accordance with accounting principles generally accepted in the United States of America and as such, the net asset value for financial reporting purposes and the returns based upon those net asset values may differ from the net asset value and returns for shareholder transactions. Does not include sales charges and is not annualized for periods less than one year, if applicable. |
| (c) | In addition to the fees and expenses which the Fund bears directly, the Fund indirectly bears a pro rata share of the fees and expenses of the underlying funds in which the Fund invests. Because the underlying funds have varied expenses and fee levels and the Fund may own different proportions at different times, the amount of fees and expenses incurred indirectly by the Fund will vary. Estimated underlying fund expenses are not expenses that are incurred directly by the Fund. They are expenses that are incurred directly by the underlying funds and are deducted from the value of the funds the Fund invests in. The effect of the estimated underlying fund expenses that the Fund bears indirectly is included in the Fund’s total return. Estimated acquired fund fees from underlying funds 0.53%, 0.55%, 0.63%, 0.63% and 0.60% for the years ended December 31, 2017, December 31, 2016, December 31, 2015, December 31, 2014 and December 31, 2013. |
| (d) | Portfolio turnover is calculated at the fund level and is not annualized for periods less than one year, if applicable. |
| (e) | Ratios are based on average daily net assets (000’s omitted) of $236,274, $4,800, $69,538, $8,623, $2,151, $5,536, $12 and $10 for Class A, Class B, Class C, Class R, Class S Class Y, Class R5 and Class R6 shares, respectively. |
| (f) | Commencement date April 4, 2017. |
| (g) | Annualized. |
40 Invesco Allocation Funds
NOTE 11—Financial Highlights—(continued)
Invesco Growth Allocation Fund
| Net asset value, beginning of period | Net investment income(a) | Net gains (losses) on securities (both realized and unrealized) | Total from investment operations | Dividends from net investment income | Net asset value, end of period | Total return(b) | Net assets, end of period (000’s omitted) | Ratio of expenses to average net assets with fee waivers and/or expense reimbursements(c) | Ratio of expenses to average net assets without fee waivers and/or expense reimbursements | Ratio of net investment income to average net assets | Portfolio turnover(d) | |||||||||||||||||||||||||||||||||||||
Class A | ||||||||||||||||||||||||||||||||||||||||||||||||
Year ended 12/31/17 | $ | 14.12 | $ | 0.20 | $ | 2.02 | $ | 2.22 | $ | (0.29 | ) | $ | 16.05 | 15.77 | % | $ | 844,780 | 0.55 | %(e) | 0.55 | %(e) | 1.32 | %(e) | 14 | % | |||||||||||||||||||||||
Year ended 12/31/16 | 13.09 | 0.16 | 1.03 | 1.19 | (0.16 | ) | 14.12 | 9.08 | 793,403 | 0.54 | 0.54 | 1.21 | 52 | |||||||||||||||||||||||||||||||||||
Year ended 12/31/15 | 13.95 | 0.16 | (0.81 | )�� | (0.65 | ) | (0.21 | ) | 13.09 | (4.68 | ) | 787,598 | 0.53 | 0.53 | 1.15 | 15 | ||||||||||||||||||||||||||||||||
Year ended 12/31/14 | 13.61 | 0.18 | 0.41 | 0.59 | (0.25 | ) | 13.95 | 4.35 | 850,812 | 0.54 | 0.54 | 1.27 | 18 | |||||||||||||||||||||||||||||||||||
Year ended 12/31/13 | 11.98 | 0.14 | 1.70 | 1.84 | (0.21 | ) | 13.61 | 15.37 | 827,241 | 0.51 | 0.51 | 1.03 | 39 | |||||||||||||||||||||||||||||||||||
Class B | ||||||||||||||||||||||||||||||||||||||||||||||||
Year ended 12/31/17 | 13.99 | 0.09 | 1.99 | 2.08 | (0.17 | ) | 15.90 | 14.87 | 14,052 | 1.30 | (e) | 1.30 | (e) | 0.57 | (e) | 14 | ||||||||||||||||||||||||||||||||
Year ended 12/31/16 | 12.96 | 0.06 | 1.02 | 1.08 | (0.05 | ) | 13.99 | 8.31 | 31,675 | 1.29 | 1.29 | 0.46 | 52 | |||||||||||||||||||||||||||||||||||
Year ended 12/31/15 | 13.80 | 0.06 | (0.80 | ) | (0.74 | ) | (0.10 | ) | 12.96 | (5.40 | ) | 54,641 | 1.28 | 1.28 | 0.40 | 15 | ||||||||||||||||||||||||||||||||
Year ended 12/31/14 | 13.46 | 0.07 | 0.41 | 0.48 | (0.14 | ) | 13.80 | 3.56 | 91,798 | 1.29 | 1.29 | 0.52 | 18 | |||||||||||||||||||||||||||||||||||
Year ended 12/31/13 | 11.87 | 0.04 | 1.67 | 1.71 | (0.12 | ) | 13.46 | 14.41 | 122,521 | 1.26 | 1.26 | 0.28 | 39 | |||||||||||||||||||||||||||||||||||
Class C | ||||||||||||||||||||||||||||||||||||||||||||||||
Year ended 12/31/17 | 14.00 | 0.09 | 1.99 | 2.08 | (0.17 | ) | 15.91 | 14.86 | 147,229 | 1.30 | (e) | 1.30 | (e) | 0.57 | (e) | 14 | ||||||||||||||||||||||||||||||||
Year ended 12/31/16 | 12.97 | 0.06 | 1.02 | 1.08 | (0.05 | ) | 14.00 | 8.30 | 144,077 | 1.29 | 1.29 | 0.46 | 52 | |||||||||||||||||||||||||||||||||||
Year ended 12/31/15 | 13.81 | 0.06 | (0.80 | ) | (0.74 | ) | (0.10 | ) | 12.97 | (5.40 | ) | 149,087 | 1.28 | 1.28 | 0.40 | 15 | ||||||||||||||||||||||||||||||||
Year ended 12/31/14 | 13.47 | 0.07 | 0.41 | 0.48 | (0.14 | ) | 13.81 | 3.56 | 168,737 | 1.29 | 1.29 | 0.52 | 18 | |||||||||||||||||||||||||||||||||||
Year ended 12/31/13 | 11.87 | 0.04 | 1.68 | 1.72 | (0.12 | ) | 13.47 | 14.50 | 165,853 | 1.26 | 1.26 | 0.28 | 39 | |||||||||||||||||||||||||||||||||||
Class R | ||||||||||||||||||||||||||||||||||||||||||||||||
Year ended 12/31/17 | 14.09 | 0.16 | 2.01 | 2.17 | (0.25 | ) | 16.01 | 15.43 | 21,598 | 0.80 | (e) | 0.80 | (e) | 1.07 | (e) | 14 | ||||||||||||||||||||||||||||||||
Year ended 12/31/16 | 13.06 | 0.13 | 1.02 | 1.15 | (0.12 | ) | 14.09 | 8.82 | 22,386 | 0.79 | 0.79 | 0.96 | 52 | |||||||||||||||||||||||||||||||||||
Year ended 12/31/15 | 13.91 | 0.12 | (0.80 | ) | (0.68 | ) | (0.17 | ) | 13.06 | (4.89 | ) | 24,382 | 0.78 | 0.78 | 0.90 | 15 | ||||||||||||||||||||||||||||||||
Year ended 12/31/14 | 13.57 | 0.14 | 0.41 | 0.55 | (0.21 | ) | 13.91 | 4.09 | 25,309 | 0.79 | 0.79 | 1.02 | 18 | |||||||||||||||||||||||||||||||||||
Year ended 12/31/13 | 11.95 | 0.10 | 1.70 | 1.80 | (0.18 | ) | 13.57 | 15.08 | 25,394 | 0.76 | 0.76 | 0.78 | 39 | |||||||||||||||||||||||||||||||||||
Class S | ||||||||||||||||||||||||||||||||||||||||||||||||
Year ended 12/31/17 | 14.10 | 0.22 | 2.02 | 2.24 | (0.31 | ) | 16.03 | 15.90 | 25,358 | 0.45 | (e) | 0.45 | (e) | 1.42 | (e) | 14 | ||||||||||||||||||||||||||||||||
Year ended 12/31/16 | 13.08 | 0.18 | 1.01 | 1.19 | (0.17 | ) | 14.10 | 9.12 | 23,344 | 0.44 | 0.44 | 1.31 | 52 | |||||||||||||||||||||||||||||||||||
Year ended 12/31/15 | 13.93 | 0.17 | (0.80 | ) | (0.63 | ) | (0.22 | ) | 13.08 | (4.51 | ) | 23,234 | 0.43 | 0.43 | 1.25 | 15 | ||||||||||||||||||||||||||||||||
Year ended 12/31/14 | 13.60 | 0.19 | 0.40 | 0.59 | (0.26 | ) | 13.93 | 4.38 | 28,380 | 0.44 | 0.44 | 1.37 | 18 | |||||||||||||||||||||||||||||||||||
Year ended 12/31/13 | 11.97 | 0.15 | 1.70 | 1.85 | (0.22 | ) | 13.60 | 15.49 | 31,974 | 0.41 | 0.41 | 1.13 | 39 | |||||||||||||||||||||||||||||||||||
Class Y | ||||||||||||||||||||||||||||||||||||||||||||||||
Year ended 12/31/17 | 14.09 | 0.24 | 2.02 | 2.26 | (0.33 | ) | 16.02 | 16.08 | 10,561 | 0.30 | (e) | 0.30 | (e) | 1.57 | (e) | 14 | ||||||||||||||||||||||||||||||||
Year ended 12/31/16 | 13.06 | 0.20 | 1.02 | 1.22 | (0.19 | ) | 14.09 | 9.38 | 6,816 | 0.29 | 0.29 | 1.46 | 52 | |||||||||||||||||||||||||||||||||||
Year ended 12/31/15 | 13.92 | 0.19 | (0.81 | ) | (0.62 | ) | (0.24 | ) | 13.06 | (4.43 | ) | 5,657 | 0.28 | 0.28 | 1.40 | 15 | ||||||||||||||||||||||||||||||||
Year ended 12/31/14 | 13.58 | 0.21 | 0.41 | 0.62 | (0.28 | ) | 13.92 | 4.63 | 6,090 | 0.29 | 0.29 | 1.52 | 18 | |||||||||||||||||||||||||||||||||||
Year ended 12/31/13 | 11.96 | 0.17 | 1.69 | 1.86 | (0.24 | ) | 13.58 | 15.56 | 4,584 | 0.26 | 0.26 | 1.28 | 39 | |||||||||||||||||||||||||||||||||||
Class R5 | ||||||||||||||||||||||||||||||||||||||||||||||||
Year ended 12/31/17 | 14.17 | 0.26 | 2.04 | 2.30 | (0.35 | ) | 16.12 | 16.26 | 25 | 0.19 | (e) | 0.19 | (e) | 1.68 | (e) | 14 | ||||||||||||||||||||||||||||||||
Year ended 12/31/16 | 13.14 | 0.21 | 1.03 | 1.24 | (0.21 | ) | 14.17 | 9.45 | 12 | 0.16 | 0.16 | 1.59 | 52 | |||||||||||||||||||||||||||||||||||
Year ended 12/31/15 | 14.00 | 0.22 | (0.82 | ) | (0.60 | ) | (0.26 | ) | 13.14 | (4.28 | ) | 11 | 0.16 | 0.16 | 1.52 | 15 | ||||||||||||||||||||||||||||||||
Year ended 12/31/14 | 13.66 | 0.23 | 0.41 | 0.64 | (0.30 | ) | 14.00 | 4.71 | 374 | 0.17 | 0.17 | 1.64 | 18 | |||||||||||||||||||||||||||||||||||
Year ended 12/31/13 | 12.02 | 0.18 | 1.71 | 1.89 | (0.25 | ) | 13.66 | 15.75 | 346 | 0.16 | 0.16 | 1.38 | 39 | |||||||||||||||||||||||||||||||||||
Class R6 | ||||||||||||||||||||||||||||||||||||||||||||||||
Year ended 12/31/17(f) | 14.84 | 0.19 | 1.43 | 1.62 | (0.35 | ) | 16.11 | 10.94 | 11 | 0.20 | (e)(g) | 0.20 | (e)(g) | 1.67 | (e)(g) | 14 | ||||||||||||||||||||||||||||||||
| (a) | Calculated using average shares outstanding. |
| (b) | Includes adjustments in accordance with accounting principles generally accepted in the United States of America and as such, the net asset value for financial reporting purposes and the returns based upon those net asset values may differ from the net asset value and returns for shareholder transactions. Does not include sales charges and is not annualized for periods less than one year, if applicable. |
| (c) | In addition to the fees and expenses which the Fund bears directly, the Fund indirectly bears a pro rata share of the fees and expenses of the underlying funds in which the Fund invests. Because the underlying funds have varied expenses and fee levels and the Fund may own different proportions at different times, the amount of fees and expenses incurred indirectly by the Fund will vary. Estimated underlying fund expenses are not expenses that are incurred directly by the Fund. They are expenses that are incurred directly by the underlying funds and are deducted from the value of the funds the Fund invests in. The effect of the estimated underlying fund expenses that the Fund bears indirectly is included in the Fund’s total return. Estimated acquired fund fees from underlying funds were 0.58%, 0.61%, 0.69%, 0.69% and 0.74% for the years ended December 31, 2017, December 31, 2016, December 31, 2015, December 31, 2014 and December 31, 2013, respectively. |
| (d) | Portfolio turnover is calculated at the fund level and is not annualized for periods less than one year, if applicable. |
| (e) | Ratios are based on average daily net assets (000’s omitted) of $817,585, $22,663, $144,271, $22,233, $24,602, $8,654, $15 and $11 for Class A, Class B, Class C, Class R, Class S, Class Y, Class R5 and Class R6 shares, respectively. |
| (f) | Commencement date April 4, 2017. |
| (g) | Annualized. |
41 Invesco Allocation Funds
NOTE 11—Financial Highlights—(continued)
Invesco Moderate Allocation Fund
| Net asset value, beginning of period | Net investment income(a) | Net gains (losses) on securities (both realized and unrealized) | Total from investment operations | Dividends from net investment income | Distributions from net realized gains | Total distributions | Net asset value, end of period | Total return(b) | Net assets, end of period (000’s omitted) | Ratio of expenses to average net assets with fee waivers and/or expense reimbursements(c) | Ratio of expenses to average net assets without fee waivers and/or expense reimbursements | Ratio of net investment income to average net assets | Portfolio turnover(d) | |||||||||||||||||||||||||||||||||||||||||||
Class A |
| |||||||||||||||||||||||||||||||||||||||||||||||||||||||
Year ended 12/31/17 | $ | 12.57 | $ | 0.23 | $ | 1.35 | $ | 1.58 | $ | (0.33 | ) | $ | (0.20 | ) | $ | (0.53 | ) | $ | 13.62 | 12.66 | % | $ | 584,747 | 0.49 | %(e) | 0.49 | %(e) | 1.73 | %(e) | 12 | % | |||||||||||||||||||||||||
Year ended 12/31/16 | 11.83 | 0.20 | 0.77 | 0.97 | (0.23 | ) | — | (0.23 | ) | 12.57 | 8.22 | 580,922 | 0.48 | 0.48 | 1.66 | 47 | ||||||||||||||||||||||||||||||||||||||||
Year ended 12/31/15 | 12.58 | 0.21 | (0.73 | ) | (0.52 | ) | (0.23 | ) | — | (0.23 | ) | 11.83 | (4.18 | ) | 607,469 | 0.47 | 0.47 | 1.68 | 14 | |||||||||||||||||||||||||||||||||||||
Year ended 12/31/14 | 12.30 | 0.23 | 0.31 | 0.54 | (0.26 | ) | — | (0.26 | ) | 12.58 | 4.39 | 659,139 | 0.47 | 0.47 | 1.83 | 15 | ||||||||||||||||||||||||||||||||||||||||
Year ended 12/31/13 | 11.32 | 0.19 | 1.01 | 1.20 | (0.22 | ) | — | (0.22 | ) | 12.30 | 10.61 | 628,036 | 0.46 | 0.46 | 1.61 | 23 | ||||||||||||||||||||||||||||||||||||||||
Class B | ||||||||||||||||||||||||||||||||||||||||||||||||||||||||
Year ended 12/31/17 | 12.48 | 0.13 | 1.34 | 1.47 | (0.23 | ) | (0.20 | ) | (0.43 | ) | 13.52 | 11.81 | 6,819 | 1.24 | (e) | 1.24 | (e) | 0.98 | (e) | 12 | ||||||||||||||||||||||||||||||||||||
Year ended 12/31/16 | 11.75 | 0.11 | 0.75 | 0.86 | (0.13 | ) | — | (0.13 | ) | 12.48 | 7.37 | 17,531 | 1.23 | 1.23 | 0.91 | 47 | ||||||||||||||||||||||||||||||||||||||||
Year ended 12/31/15 | 12.49 | 0.12 | (0.72 | ) | (0.60 | ) | (0.14 | ) | — | (0.14 | ) | 11.75 | (4.86 | ) | 30,471 | 1.22 | 1.22 | 0.93 | 14 | |||||||||||||||||||||||||||||||||||||
Year ended 12/31/14 | 12.21 | 0.13 | 0.31 | 0.44 | (0.16 | ) | — | (0.16 | ) | 12.49 | 3.62 | 48,796 | 1.22 | 1.22 | 1.08 | 15 | ||||||||||||||||||||||||||||||||||||||||
Year ended 12/31/13 | 11.28 | 0.10 | 1.00 | 1.10 | (0.17 | ) | — | (0.17 | ) | 12.21 | 9.78 | 64,268 | 1.21 | 1.21 | 0.86 | 23 | ||||||||||||||||||||||||||||||||||||||||
Class C | ||||||||||||||||||||||||||||||||||||||||||||||||||||||||
Year ended 12/31/17 | 12.48 | 0.13 | 1.33 | 1.46 | (0.23 | ) | (0.20 | ) | (0.43 | ) | 13.51 | 11.73 | 132,379 | 1.24 | (e) | 1.24 | (e) | 0.98 | (e) | 12 | ||||||||||||||||||||||||||||||||||||
Year ended 12/31/16 | 11.74 | 0.11 | 0.76 | 0.87 | (0.13 | ) | — | (0.13 | ) | 12.48 | 7.47 | 130,220 | 1.23 | 1.23 | 0.91 | 47 | ||||||||||||||||||||||||||||||||||||||||
Year ended 12/31/15 | 12.48 | 0.12 | (0.72 | ) | (0.60 | ) | (0.14 | ) | — | (0.14 | ) | 11.74 | (4.87 | ) | 141,890 | 1.22 | 1.22 | 0.93 | 14 | |||||||||||||||||||||||||||||||||||||
Year ended 12/31/14 | 12.20 | 0.13 | 0.31 | 0.44 | (0.16 | ) | — | (0.16 | ) | 12.48 | 3.62 | 154,724 | 1.22 | 1.22 | 1.08 | 15 | ||||||||||||||||||||||||||||||||||||||||
Year ended 12/31/13 | 11.27 | 0.10 | 1.00 | 1.10 | (0.17 | ) | — | (0.17 | ) | 12.20 | 9.79 | 147,372 | 1.21 | 1.21 | 0.86 | 23 | ||||||||||||||||||||||||||||||||||||||||
Class R | ||||||||||||||||||||||||||||||||||||||||||||||||||||||||
Year ended 12/31/17 | 12.55 | 0.20 | 1.34 | 1.54 | (0.30 | ) | (0.20 | ) | (0.50 | ) | 13.59 | 12.32 | 15,614 | 0.74 | (e) | 0.74 | (e) | 1.48 | (e) | 12 | ||||||||||||||||||||||||||||||||||||
Year ended 12/31/16 | 11.81 | 0.17 | 0.77 | 0.94 | (0.20 | ) | — | (0.20 | ) | 12.55 | 7.97 | 17,279 | 0.73 | 0.73 | 1.41 | 47 | ||||||||||||||||||||||||||||||||||||||||
Year ended 12/31/15 | 12.55 | 0.18 | (0.72 | ) | (0.54 | ) | (0.20 | ) | — | (0.20 | ) | 11.81 | (4.35 | ) | 17,870 | 0.72 | 0.72 | 1.43 | 14 | |||||||||||||||||||||||||||||||||||||
Year ended 12/31/14 | 12.27 | 0.20 | 0.30 | 0.50 | (0.22 | ) | — | (0.22 | ) | 12.55 | 4.13 | 21,117 | 0.72 | 0.72 | 1.58 | 15 | ||||||||||||||||||||||||||||||||||||||||
Year ended 12/31/13 | 11.31 | 0.16 | 1.00 | 1.16 | (0.20 | ) | — | (0.20 | ) | 12.27 | 10.30 | 23,099 | 0.71 | 0.71 | 1.36 | 23 | ||||||||||||||||||||||||||||||||||||||||
Class S | ||||||||||||||||||||||||||||||||||||||||||||||||||||||||
Year ended 12/31/17 | 12.57 | 0.24 | 1.35 | 1.59 | (0.35 | ) | (0.20 | ) | (0.55 | ) | 13.61 | 12.70 | 29,134 | 0.39 | (e) | 0.39 | (e) | 1.83 | (e) | 12 | ||||||||||||||||||||||||||||||||||||
Year ended 12/31/16 | 11.83 | 0.21 | 0.77 | 0.98 | (0.24 | ) | — | (0.24 | ) | 12.57 | 8.33 | 27,441 | 0.38 | 0.38 | 1.76 | 47 | ||||||||||||||||||||||||||||||||||||||||
Year ended 12/31/15 | 12.58 | 0.22 | (0.73 | ) | (0.51 | ) | (0.24 | ) | — | (0.24 | ) | 11.83 | (4.08 | ) | 27,124 | 0.37 | 0.37 | 1.78 | 14 | |||||||||||||||||||||||||||||||||||||
Year ended 12/31/14 | 12.29 | 0.24 | 0.32 | 0.56 | (0.27 | ) | — | (0.27 | ) | 12.58 | 4.58 | 31,854 | 0.37 | 0.37 | 1.93 | 15 | ||||||||||||||||||||||||||||||||||||||||
Year ended 12/31/13 | 11.31 | 0.20 | 1.00 | 1.20 | (0.22 | ) | — | (0.22 | ) | 12.29 | 10.68 | 35,661 | 0.36 | 0.36 | 1.71 | 23 | ||||||||||||||||||||||||||||||||||||||||
Class Y | ||||||||||||||||||||||||||||||||||||||||||||||||||||||||
Year ended 12/31/17 | 12.59 | 0.26 | 1.34 | 1.60 | (0.36 | ) | (0.20 | ) | (0.56 | ) | 13.63 | 12.85 | 7,880 | 0.24 | (e) | 0.24 | (e) | 1.98 | (e) | 12 | ||||||||||||||||||||||||||||||||||||
Year ended 12/31/16 | 11.85 | 0.23 | 0.77 | 1.00 | (0.26 | ) | — | (0.26 | ) | 12.59 | 8.48 | 5,611 | 0.23 | 0.23 | 1.91 | 47 | ||||||||||||||||||||||||||||||||||||||||
Year ended 12/31/15 | 12.60 | 0.24 | (0.73 | ) | (0.49 | ) | (0.26 | ) | — | (0.26 | ) | 11.85 | (3.92 | ) | 4,788 | 0.22 | 0.22 | 1.93 | 14 | |||||||||||||||||||||||||||||||||||||
Year ended 12/31/14 | 12.31 | 0.26 | 0.32 | 0.58 | (0.29 | ) | — | (0.29 | ) | 12.60 | 4.74 | 6,870 | 0.22 | 0.22 | 2.08 | 15 | ||||||||||||||||||||||||||||||||||||||||
Year ended 12/31/13 | 11.32 | 0.22 | 1.00 | 1.22 | (0.23 | ) | — | (0.23 | ) | 12.31 | 10.84 | 4,912 | 0.21 | 0.21 | 1.86 | 23 | ||||||||||||||||||||||||||||||||||||||||
Class R5 |
| |||||||||||||||||||||||||||||||||||||||||||||||||||||||
Year ended 12/31/17 | 12.63 | 0.27 | 1.35 | 1.62 | (0.37 | ) | (0.20 | ) | (0.57 | ) | 13.68 | 12.97 | 15 | 0.18 | (e) | 0.18 | (e) | 2.04 | (e) | 12 | ||||||||||||||||||||||||||||||||||||
Year ended 12/31/16 | 11.89 | 0.24 | 0.77 | 1.01 | (0.27 | ) | — | (0.27 | ) | 12.63 | 8.53 | 14 | 0.17 | 0.17 | 1.97 | 47 | ||||||||||||||||||||||||||||||||||||||||
Year ended 12/31/15 | 12.62 | 0.26 | (0.76 | ) | (0.50 | ) | (0.23 | ) | — | (0.23 | ) | 11.89 | (4.03 | ) | 13 | 0.16 | 0.16 | 1.99 | 14 | |||||||||||||||||||||||||||||||||||||
Year ended 12/31/14 | 12.34 | 0.27 | 0.31 | 0.58 | (0.30 | ) | — | (0.30 | ) | 12.62 | 4.71 | 159 | 0.16 | 0.16 | 2.14 | 15 | ||||||||||||||||||||||||||||||||||||||||
Year ended 12/31/13 | 11.35 | 0.23 | 1.00 | 1.23 | (0.24 | ) | — | (0.24 | ) | 12.34 | 10.84 | 232 | 0.17 | 0.17 | 1.90 | 23 | ||||||||||||||||||||||||||||||||||||||||
Class R6 |
| |||||||||||||||||||||||||||||||||||||||||||||||||||||||
Year ended 12/31/17(f) | 13.03 | 0.20 | 0.94 | 1.14 | (0.30 | ) | (0.20 | ) | (0.50 | ) | 13.67 | 8.80 | 11 | 0.18 | (e)(g) | 0.18 | (e)(g) | 2.04 | (e)(g) | 12 | ||||||||||||||||||||||||||||||||||||
| (a) | Calculated using average shares outstanding. |
| (b) | Includes adjustments in accordance with accounting principles generally accepted in the United States of America and as such, the net asset value for financial reporting purposes and the returns based upon those net asset values may differ from the net asset value and returns for shareholder transactions. Does not include sales charges and is not annualized for periods less than one year, if applicable. |
| (c) | In addition to the fees and expenses which the Fund bears directly, the Fund indirectly bears a pro rata share of the fees and expenses of the underlying funds in which the Fund invests. Because the underlying funds have varied expenses and fee levels and the Fund may own different proportions at different times, the amount of fees and expenses incurred indirectly by the Fund will vary. Estimated underlying fund expenses are not expenses that are incurred directly by the Fund. They are expenses that are incurred directly by the underlying funds and are deducted from the value of the funds the Fund invests in. The effect of the estimated underlying fund expenses that the Fund bears indirectly is included in the Fund’s total return. Estimated acquired fund fees from underlying funds were 0.56%, 0.58%, 0.62%, 0.67% and 0.69% for the years ended December 31, 2017, December 31, 2016, December 31, 2015, December 31, 2014 and December 31, 2013, respectively. |
| (d) | Portfolio turnover is calculated at the fund level and is not annualized for periods less than one year, if applicable. |
| (e) | Ratios are based on average daily net assets (000’s omitted) of $579,652, $12,172, $130,409, $15,739, $28,598, $6,931, $15 and $10 for Class A, Class B, Class C, Class R, Class S, Class Y, Class R5 and Class R6 shares, respectively. |
| (f) | Commencement date April 4, 2017. |
| (g) | Annualized. |
42 Invesco Allocation Funds
Report of Independent Registered Public Accounting Firm
To the Board of Trustees of AIM Growth Series (Invesco Growth Series)
and Shareholders of Invesco Conservative Allocation Fund, Invesco Growth Allocation Fund and Invesco Moderate Allocation Fund
Opinions on the Financial Statements
We have audited the accompanying statements of assets and liabilities, including the schedules of investments, of Invesco Conservative Allocation Fund, Invesco Growth Allocation Fund and Invesco Moderate Allocation Fund (three of the funds constituting AIM Growth Series (Invesco Growth Series), hereafter collectively referred to as the “Funds”) as of December 31, 2017, the related statements of operations for the year ended December 31, 2017, the statements of changes in net assets for each of the two years in the period ended December 31, 2017, including the related notes, and the financial highlights for each of the periods indicated therein (collectively referred to as the “financial statements”). In our opinion, the financial statements present fairly, in all material respects, the financial position of each of the Funds as of December 31, 2017, the results of each of their operations for the year then ended, the changes in each of their net assets for each of the two years in the period ended December 31, 2017 and each of the financial highlights for each of the periods indicated therein in conformity with accounting principles generally accepted in the United States of America.
Basis for Opinions
These financial statements are the responsibility of the Funds’ management. Our responsibility is to express an opinion on the Funds’ financial statements based on our audits. We are a public accounting firm registered with the Public Company Accounting Oversight Board (United States) (“PCAOB”) and are required to be independent with respect to the Funds in accordance with the U.S. federal securities laws and the applicable rules and regulations of the Securities and Exchange Commission and the PCAOB.
We conducted our audits of these financial statements in accordance with the standards of the PCAOB. Those standards require that we plan and perform the audit to obtain reasonable assurance about whether the financial statements are free of material misstatement, whether due to error or fraud.
Our audits included performing procedures to assess the risks of material misstatement of the financial statements, whether due to error or fraud, and performing procedures that respond to those risks. Such procedures included examining, on a test basis, evidence regarding the amounts and disclosures in the financial statements. Our audits also included evaluating the accounting principles used and significant estimates made by management, as well as evaluating the overall presentation of the financial statements. Our procedures included confirmation of securities owned as of December 31, 2017 by correspondence with the custodian, transfer agent and brokers; when replies were not received from brokers, we performed other auditing procedures. We believe that our audits provide a reasonable basis for our opinions.
PricewaterhouseCoopers LLP
Houston, TX
February 23, 2018
We have served as the auditor of one or more of the investment companies in the Invesco/PowerShares group of investment companies since at least 1995. We have not determined the specific year we began serving as auditor.
43 Invesco Allocation Funds
Calculating your ongoing Fund expenses
Example
As a shareholder of the Fund, you incur two types of costs: (1) transaction costs, which may include sales charges (loads) on purchase payments or contingent deferred sales charges on redemptions, if any; and (2) ongoing costs, including distribution and/or service (12b-1) fees, and other Fund expenses. This example is intended to help you understand your ongoing costs (in dollars) of investing in the Fund and to compare these costs with ongoing costs of investing in other mutual funds. The example is based on an investment of $1,000 invested at the beginning of the period and held for the entire period July 1, 2017, through December 31, 2017.
In addition to the fees and expenses which the Fund bears directly, the Fund indirectly bears a pro rata share of the fees and expenses of the underlying funds in which the Fund invests. The amount of fees and expenses incurred indirectly by the Fund will vary because the underlying funds have varied expenses and fee levels and the Fund may own different proportions of the underlying funds at different times. Estimated underlying fund expenses are not expenses that are incurred directly by the Fund. They are expenses that are incurred directly by the underlying funds and are deducted from the value of the underlying funds the Fund invests in. The effect of the estimated underlying fund expenses that the Fund bears indirectly are included in the Fund’s total return.
Actual expenses
The table below provides information about actual account values and actual expenses. You may use the information in this table, together with the amount you invested, to estimate the expenses that you paid over the period. Simply divide your account value by $1,000 (for example, an $8,600 account value divided by $1,000 = 8.6), then multiply the result by the number in the table under the heading entitled “Actual Expenses Paid During Period” to estimate the expenses you paid on your account during this period.
Hypothetical example for comparison purposes
The table below also provides information about hypothetical account values and hypothetical expenses based on the Fund’s actual expense ratio and an assumed rate of return of 5% per year before expenses, which is not the Fund’s actual return.
The hypothetical account values and expenses may not be used to estimate the actual ending account balance or expenses you paid for the period. You may use this information to compare the ongoing costs of investing in the Fund and other funds. To do so, compare this 5% hypothetical example with the 5% hypothetical examples that appear in the shareholder reports of the other funds.
Please note that the expenses shown in the table are meant to highlight your ongoing costs only and do not reflect any transaction costs, such as sales charges (loads) on purchase payments or contingent deferred sales charges on redemptions, if any. Therefore, the hypothetical information is useful in comparing ongoing costs only, and will not help you determine the relative total costs of owning different funds. In addition, expenses shown in the table do not include the expenses of the underlying funds, which are borne indirectly by the Fund. If transaction costs and indirect expenses were included, your costs would have been higher.
Invesco Conservative Allocation Fund
| Class | Beginning Account Value (07/01/17) | ACTUAL | HYPOTHETICAL (5% annual return before expenses) | Annualized Expense Ratio | ||||||||||||||||||||
| Ending Account Value (12/31/17)1 | Expenses Paid During Period2 | Ending Account Value (12/31/17) | Expenses Paid During Period2 | |||||||||||||||||||||
| A | $ | 1,000.00 | $ | 1,035.70 | $ | 2.46 | $ | 1,022.79 | $ | 2.45 | 0.48 | % | ||||||||||||
| B | 1,000.00 | 1,031.90 | 6.30 | 1,019.00 | 6.26 | 1.23 | ||||||||||||||||||
| C | 1,000.00 | 1,031.90 | 6.30 | 1,019.00 | 6.26 | 1.23 | ||||||||||||||||||
| R | 1,000.00 | 1,033.50 | 3.74 | 1,021.53 | 3.72 | 0.73 | ||||||||||||||||||
| S | 1,000.00 | 1,036.10 | 1.95 | 1,023.29 | 1.94 | 0.38 | ||||||||||||||||||
| Y | 1,000.00 | 1,036.90 | 1.18 | 1,024.05 | 1.17 | 0.23 | ||||||||||||||||||
| R5 | 1,000.00 | 1,037.00 | 1.03 | 1,024.20 | 1.02 | 0.20 | ||||||||||||||||||
| R6 | 1,000.00 | 1,036.10 | 1.03 | 1,024.20 | 1.02 | 0.20 | ||||||||||||||||||
44 Invesco Allocation Funds
Invesco Growth Allocation Fund
| Class | Beginning Account Value (07/01/17) | ACTUAL | HYPOTHETICAL (5% annual return before expenses) | Annualized Expense Ratio | ||||||||||||||||||||
| Ending Account Value (12/31/17)1 | Expenses Paid During Period2 | Ending Account Value (12/31/17) | Expenses Paid During Period2 | |||||||||||||||||||||
| A | $ | 1,000.00 | $ | 1,078.90 | $ | 2.88 | $ | 1,022.43 | $ | 2.80 | 0.55 | % | ||||||||||||
| B | 1,000.00 | 1,075.00 | 6.80 | 1,018.65 | 6.61 | 1.30 | ||||||||||||||||||
| C | 1,000.00 | 1,074.90 | 6.80 | 1,018.65 | 6.61 | 1.30 | ||||||||||||||||||
| R | 1,000.00 | 1,077.10 | 4.19 | 1,021.17 | 4.08 | 0.80 | ||||||||||||||||||
| S | 1,000.00 | 1,079.40 | 2.36 | 1,022.94 | 2.29 | 0.45 | ||||||||||||||||||
| Y | 1,000.00 | 1,081.00 | 1.57 | 1,023.69 | 1.53 | 0.30 | ||||||||||||||||||
| R5 | 1,000.00 | 1,081.70 | 1.05 | 1,024.20 | 1.02 | 0.20 | ||||||||||||||||||
| R6 | 1,000.00 | 1,081.00 | 1.05 | 1,024.20 | 1.02 | 0.20 | ||||||||||||||||||
Invesco Moderate Allocation Fund
| Class | Beginning Account Value (07/01/17) | ACTUAL | HYPOTHETICAL (5% annual return before expenses) | Annualized Expense Ratio | ||||||||||||||||||||
| Ending Account Value (12/31/17)1 | Expenses Paid During Period2 | Ending Account Value (12/31/17) | Expenses Paid During Period2 | |||||||||||||||||||||
| A | $ | 1,000.00 | $ | 1,063.20 | $ | 2.55 | $ | 1,022.74 | $ | 2.50 | 0.49 | % | ||||||||||||
| B | 1,000.00 | 1,058.70 | 6.43 | 1,018.95 | 6.31 | 1.24 | ||||||||||||||||||
| C | 1,000.00 | 1,058.80 | 6.43 | 1,018.95 | 6.31 | 1.24 | ||||||||||||||||||
| R | 1,000.00 | 1,061.90 | 3.85 | 1,021.48 | 3.77 | 0.74 | ||||||||||||||||||
| S | 1,000.00 | 1,063.70 | 2.03 | 1,023.24 | 1.99 | 0.39 | ||||||||||||||||||
| Y | 1,000.00 | 1,063.70 | 1.25 | 1,024.00 | 1.22 | 0.24 | ||||||||||||||||||
| R5 | 1,000.00 | 1,064.60 | 0.94 | 1,024.30 | 0.92 | 0.18 | ||||||||||||||||||
| R6 | 1,000.00 | 1,064.60 | 0.94 | 1,024.30 | 0.92 | 0.18 | ||||||||||||||||||
| 1 | The actual ending account value is based on the actual total return of the Funds for the period July 1, 2017, through December 31, 2017, after actual expenses and will differ from the hypothetical ending account value which is based on each Fund’s expense ratio and a hypothetical annual return of 5% before expenses. |
| 2 | Expenses are equal to each Fund’s annualized expense ratio as indicated above multiplied by the average account value over the period, multiplied by 184/365 to reflect the most recent fiscal half year. |
45 Invesco Allocation Funds
Tax Information
Form 1099-DIV, Form 1042-S and other year-end tax information provide shareholders with actual calendar year amounts that should be included in their tax returns. Shareholders should consult their tax advisors.
The following distribution information is being provided as required by the Internal Revenue Code or to meet a specific state’s requirement.
The Funds designate the following amounts or, if subsequently determined to be different, the maximum amount allowable for their fiscal year ended December 31, 2017:
Federal and State Income Tax | ||||||||||||||||
| Long Term Capital Gain Distributions | Qualified Dividend Income* | Corporate Dividends Received Deduction* | U.S. Treasury Obligations* | |||||||||||||
Invesco Conservative Allocation Fund | $ | 853,758 | 24.05 | % | 16.62 | % | 7.29 | % | ||||||||
Invesco Growth Allocation Fund | — | 75.54 | % | 46.55 | % | 1.93 | % | |||||||||
Invesco Moderate Allocation Fund | 10,904,298 | 47.03 | % | 29.82 | % | 0.00 | % | |||||||||
| * | The above percentages are based on ordinary income dividends paid to shareholders during each Fund’s fiscal year. |
46 Invesco Allocation Funds
Trustees and Officers
The address of each trustee and officer is AIM Growth Series (Invesco Growth Series) (the “Trust”), 11 Greenway Plaza, Suite 1000, Houston, Texas 77046-1173. The trustees serve for the life of the Trust, subject to their earlier death, incapacitation, resignation, retirement or removal as more specifically provided in the Trust’s organizational documents. Each officer serves for a one year term or until their successors are elected and qualified. Column two below includes length of time served with predecessor entities, if any.
Name, Year of Birth and Position(s) Held with the Trust | Trustee and/ or Officer Since | Principal Occupation(s) During Past 5 Years | Number of Funds in Fund Complex Overseen by Trustee | Other Directorship(s) Held by Trustee During Past 5 Years | ||||
| Interested Persons | ||||||||
| Martin L. Flanagan1 — 1960 Trustee | 2007 | Executive Director, Chief Executive Officer and President, Invesco Ltd. (ultimate parent of Invesco and a global investment management firm); Trustee, The Invesco Funds; Vice Chair, Investment Company Institute; and Member of Executive Board, SMU Cox School of Business
Formerly: Advisor to the Board, Invesco Advisers, Inc. (formerly known as Invesco Institutional (N.A.), Inc.); Chairman and Chief Executive Officer, Invesco Advisers, Inc. (registered investment adviser); Director, Chairman, Chief Executive Officer and President, Invesco Holding Company (US), Inc. (formerly IVZ Inc.) (holding company), Invesco Group Services, Inc. (service provider) and Invesco North American Holdings, Inc. (holding company); Director, Chief Executive Officer and President, Invesco Holding Company Limited (parent of Invesco and a global investment management firm); Director, Invesco Ltd.; Chairman, Investment Company Institute and President, Co-Chief Executive Officer, Co-President, Chief Operating Officer and Chief Financial Officer, Franklin Resources, Inc. (global investment management organization) | 158 | None | ||||
| Philip A. Taylor2 — 1954 Trustee and Senior Vice President | 2006 | Head of the Americas and Senior Managing Director, Invesco Ltd.; Director, Invesco Advisers, Inc. (formerly known as Invesco Institutional (N.A.), Inc.) (registered investment adviser); Director, Chairman, Chief Executive Officer and President, Invesco Management Group, Inc. (formerly known as Invesco Aim Management Group, Inc.) (financial services holding company); Director and Chairman, Invesco Investment Services, Inc. (formerly known as Invesco Aim Investment Services, Inc.) (registered transfer agent); Chief Executive Officer, Invesco Corporate Class Inc. (corporate mutual fund company); Director, Chairman and Chief Executive Officer, Invesco Canada Ltd. (formerly known as Invesco Trimark Ltd./Invesco Trimark Ltèe) (registered investment adviser and registered transfer agent); Trustee and Senior Vice President, The Invesco Funds; Director, Invesco Investment Advisers LLC (formerly known as Van Kampen Asset Management).
Formerly: Co-Chairman, Co-President and Co-Chief Executive Officer, Invesco Advisers, Inc. (formerly known as Invesco Institutional (N.A.), Inc.) (registered investment adviser); Director, Chief Executive Officer and President, Van Kampen Exchange Corp; President and Principal Executive Officer, The Invesco Funds (other than AIM Treasurer’s Series Trust (Invesco Treasurer’s Series Trust), Short-Term Investments Trust and Invesco Management Trust); Executive Vice President, The Invesco Funds (AIM Treasurer’s Series Trust (Invesco Treasurer’s Series Trust), Short-Term Investments Trust and Invesco Management Trust only); Director and President, INVESCO Funds Group, Inc. (registered investment adviser and registered transfer agent); Director and Chairman, IVZ Distributors, Inc. (formerly known as INVESCO Distributors, Inc.) (registered broker dealer); Director, President and Chairman, Invesco Inc. (holding company), Invesco Canada Holdings Inc. (holding company), Trimark Investments Ltd./Placements Trimark Ltèe and Invesco Financial Services Ltd/Services Financiers Invesco Ltèe; Chief Executive Officer, Invesco Canada Fund Inc. (corporate mutual fund company); Director and Chairman, Van Kampen Investor Services Inc.; Director, Chief Executive Officer and President, 1371 Preferred Inc. (holding company) and Van Kampen Investments Inc.; Director and President, AIM GP Canada Inc. (general partner for limited partnerships) and Van Kampen Advisors, Inc.; Director and Chief Executive Officer, Invesco Trimark Dealer Inc. (registered broker dealer); Director, Invesco Distributors, Inc. (formerly known as Invesco Aim Distributors, Inc.) (registered broker dealer); Manager, Invesco PowerShares Capital Management LLC; Director, Chief Executive Officer and President, Invesco Advisers, Inc.; Director, Chairman, Chief Executive Officer and President, Invesco Aim Capital Management, Inc.; President, Invesco Trimark Dealer Inc. and Invesco Trimark Ltd./Invesco Trimark Ltèe; Director and President, AIM Trimark Corporate Class Inc. and AIM Trimark Canada Fund Inc.; Senior Managing Director, Invesco Holding Company Limited; Director and Chairman, Fund Management Company (former registered broker dealer); President and Principal Executive Officer, The Invesco Funds (AIM Treasurer’s Series Trust (Invesco Treasurer’s Series Trust), and Short-Term Investments Trust only); President, AIM Trimark Global Fund Inc. and AIM Trimark Canada Fund Inc. | 158 | None |
| 1 | Mr. Flanagan is considered an interested person (within the meaning of Section 2(a)(19) of the 1940 Act) of the Trust because he is an officer of the Adviser to the Trust, and an officer and a director of Invesco Ltd., ultimate parent of the Adviser. |
| 2 | Mr. Taylor is considered an interested person (within the meaning of Section 2(a)(19) of the 1940 Act) of the Trust because he is an officer and a director of the Adviser. |
T-1 Invesco Allocation Funds
Trustees and Officers—(continued)
Name, Year of Birth and Position(s) Held with the Trust | Trustee and/ or Officer Since | Principal Occupation(s) During Past 5 Years | Number of Funds in Fund Complex Overseen by Trustee | Other Directorship(s) Past 5 Years | ||||
| Independent Trustees | ||||||||
Bruce L. Crockett — 1944 Trustee and Chair | 2001 | Chairman, Crockett Technologies Associates (technology consulting company)
Formerly: Director, Captaris (unified messaging provider); Director, President and Chief Executive Officer, COMSAT Corporation; Chairman, Board of Governors of INTELSAT (international communications company); ACE Limited (insurance company); Independent Directors Council and Investment Company Institute: Member of the Audit Committee, Investment Company Institute; Member of the Executive Committee and Chair of the Governance Committee, Independent Directors Council | 158 | Director and Chairman of the Audit Committee, ALPS (Attorneys Liability Protection Society) (insurance company); Director and Member of the Audit Committee and Compensation Committee, Ferroglobe PLC (metallurgical company) | ||||
David C. Arch — 1945 Trustee | 2010 | Chairman of Blistex Inc. (consumer health care products manufacturer); Member, World Presidents’ Organization | 158 | Board member of the Illinois Manufacturers’ Association | ||||
Jack M. Fields — 1952 Trustee | 2001 | Chief Executive Officer, Twenty First Century Group, Inc. (government affairs company); and Chairman, Discovery Learning Alliance (non-profit)
Formerly: Owner and Chief Executive Officer, Dos Angeles Ranch L.P. (cattle, hunting, corporate entertainment); Director, Insperity, Inc. (formerly known as Administaff) (human resources provider); Chief Executive Officer, Texana Timber LP (sustainable forestry company); Director of Cross Timbers Quail Research Ranch (non-profit); and member of the U.S. House of Representatives | 158 | None | ||||
Cynthia Hostetler — 1962 Trustee | 2017 | Non-Executive Director and Trustee of a number of public and private business corporations
Formerly: Head of Investment Funds and Private Equity, Overseas Private Investment Corporation; President, First Manhattan Bancorporation, Inc.; Attorney, Simpson Thacher & Bartlett LLP | 158 | Vulcan Materials Company (construction materials company); Trilinc Global Impact Fund; Aberdeen Investment Funds (4 portfolios); Artio Global Investment LLC (mutual fund complex); Edgen Group, Inc. (specialized energy and infrastructure products distributor) | ||||
Eli Jones — 1961 Trustee | 2016 | Professor and Dean, Mays Business School — Texas A&M University
Formerly: Professor and Dean, Walton College of Business, University of Arkansas and E.J. Ourso College of Business, Louisiana State University; Director, Arvest Bank | 158 | Insperity, Inc. (formerly known as Administaff) (human resources provider) | ||||
Prema Mathai-Davis — 1950 Trustee | 2001 | Retired. | 158 | None | ||||
Teresa M. Ressel — 1962 Trustee | 2017 | Non-executive director and trustee of a number of public and private business corporations
Formerly: Chief Financial Officer, Olayan America, The Olayan Group (international investor/commercial/industrial); Chief Executive Officer, UBS Securities LLC; Group Chief Operating Officer, Americas, UBS AG; Assistant Secretary for Management & Budget and CFO, US Department of the Treasury | 158 | Atlantic Power Corporation (power generation company); ON Semiconductor Corp. (semiconductor supplier) | ||||
Ann Barnett Stern — 1957 Trustee | 2017 | President and Chief Executive Officer, Houston Endowment Inc. (private philanthropic institution)
Formerly: Executive Vice President and General Counsel, Texas Children’s Hospital; Attorney, Beck, Redden and Secrest, LLP; Business Law Instructor, University of St. Thomas; Attorney, Andrews & Kurth LLP | 158 | Federal Reserve Bank of Dallas | ||||
Raymond Stickel, Jr. — 1944 Trustee | 2005 | Retired.
Formerly: Director, Mainstay VP Series Funds, Inc. (25 portfolios); Partner, Deloitte & Touche | 158 | None | ||||
Robert C. Troccoli — 1949 Trustee | 2016 | Adjunct Professor, University of Denver — Daniels College of Business
Formerly: Senior Partner, KPMG LLP | 158 | None | ||||
Christopher L. Wilson — 1957 Trustee | 2017 | Non-executive director and trustee of a number of public and private business corporations
Formerly: Managing Partner, CT2, LLC (investing and consulting firm); President/Chief Executive Officer, Columbia Funds, Bank of America Corporation; President/Chief Executive Officer, CDC IXIS Asset Management Services, Inc.; Principal & Director of Operations, Scudder Funds, Scudder, Stevens & Clark, Inc.; Assistant Vice President, Fidelity Investments | 158 | TD Asset Management USA Inc. (mutual fund complex) (22 portfolios); ISO New England, Inc. (non-profit organization managing regional electricity market) |
T-2 Invesco Allocation Funds
Trustees and Officers—(continued)
Name, Year of Birth and Position(s) Held with the Trust | Trustee and/ or Officer Since | Principal Occupation(s) During Past 5 Years | Number of Funds in Fund Complex Overseen by Trustee | Other Directorship(s) Past 5 Years | ||||
| Other Officers | ||||||||
Sheri Morris — 1964 President, Principal Executive Officer and Treasurer | 1999 | President, Principal Executive Officer and Treasurer, The Invesco Funds; Vice President, Invesco Advisers, Inc. (formerly known as Invesco Institutional (N.A.), Inc.) (registered investment adviser); and Vice President, PowerShares Exchange-Traded Fund Trust, PowerShares Exchange-Traded Fund Trust II, PowerShares India Exchange-Traded Fund Trust, PowerShares Actively Managed Exchange-Traded Fund Trust, PowerShares Actively Managed Exchange-Traded Commodity Fund Trust and PowerShares Exchange-Traded Self-Indexed Fund Trust
Formerly: Vice President and Principal Financial Officer, The Invesco Funds; Vice President, Invesco Aim Advisers, Inc., Invesco Aim Capital Management, Inc. and Invesco Aim Private Asset Management, Inc.; Assistant Vice President and Assistant Treasurer, The Invesco Funds and Assistant Vice President, Invesco Advisers, Inc., Invesco Aim Capital Management, Inc. and Invesco Aim Private Asset Management, Inc.; and Treasurer, PowerShares Exchange-Traded Fund Trust, PowerShares Exchange-Traded Fund Trust II, PowerShares India Exchange-Traded Fund Trust and PowerShares Actively Managed Exchange-Traded Fund Trust | N/A | N/A | ||||
Russell C. Burk — 1958 Senior Vice President and Senior Officer | 2005 | Senior Vice President and Senior Officer, The Invesco Funds | N/A | N/A | ||||
John M. Zerr — 1962 Senior Vice President, Chief Legal Officer and Secretary | 2006 | Director, Senior Vice President, Secretary and General Counsel, Invesco Management Group, Inc. (formerly known as Invesco AIM Management Group, Inc.); Senior Vice President, Invesco Advisers, Inc. (formerly known as Invesco Institutional (N.A.), Inc.) (registered investment adviser); Senior Vice President and Secretary, Invesco Distributors, Inc. (formerly known as Invesco AIM Distributors, Inc.); Director, Vice President and Secretary, Invesco Investment Services, Inc. (formerly known as Invesco AIM Investment Services, Inc.) Senior Vice President, Chief Legal Officer and Secretary, The Invesco Funds; Managing Director, Invesco PowerShares Capital Management LLC; Director, Secretary and General Counsel, Invesco Investment Advisers LLC (formerly known as Van Kampen Asset Management); Secretary and General Counsel, Invesco Capital Markets, Inc. (formerly known as Van Kampen Funds Inc.) and Chief Legal Officer, PowerShares Exchange-Traded Fund Trust, PowerShares Exchange-Traded Fund Trust II, PowerShares India Exchange-Traded Fund Trust, PowerShares Actively Managed Exchange-Traded Fund Trust, PowerShares Actively Managed Exchange-Traded Commodity Fund Trust and PowerShares Exchange-Traded Self-Indexed Fund Trust; Manager and Secretary, Invesco Indexing LLC
Formerly: Director, Secretary, General Counsel and Senior Vice President, Van Kampen Exchange Corp.; Director, Vice President and Secretary, IVZ Distributors, Inc. (formerly known as INVESCO Distributors, Inc.); Director and Vice President, INVESCO Funds Group, Inc.; Director and Vice President, Van Kampen Advisors Inc.; Director, Vice President, Secretary and General Counsel, Van Kampen Investor Services Inc.; Director, Invesco Distributors, Inc. (formerly known as Invesco AIM Distributors, Inc.); Director, Senior Vice President, General Counsel and Secretary, Invesco AIM Advisers, Inc. and Van Kampen Investments Inc.; Director, Vice President and Secretary, Fund Management Company; Director, Senior Vice President, Secretary, General Counsel and Vice President, Invesco AIM Capital Management, Inc.; Chief Operating Officer and General Counsel, Liberty Ridge Capital, Inc. (an investment adviser); Vice President and Secretary, PBHG Funds (an investment company) and PBHG Insurance Series Fund (an investment company); Chief Operating Officer, General Counsel and Secretary, Old Mutual Investment Partners (a broker-dealer); General Counsel and Secretary, Old Mutual Fund Services (an administrator) and Old Mutual Shareholder Services (a shareholder servicing center); Executive Vice President, General Counsel and Secretary, Old Mutual Capital, Inc. (an investment adviser); and Vice President and Secretary, Old Mutual Advisors Funds (an investment company) | N/A | N/A | ||||
Gregory G. McGreevey — 1962 Senior Vice President | 2012 | Senior Managing Director, Invesco Ltd.; Director, Chairman, President, and Chief Executive Officer, Invesco Advisers, Inc. (formerly known as Invesco Institutional (N.A.), Inc.) (registered investment adviser); Senior Vice President, Invesco Management Group, Inc.; Director, Invesco Mortgage Capital, Inc. and Invesco Senior Secured Management, Inc.; and Senior Vice President, The Invesco Funds
Formerly: Assistant Vice President, The Invesco Funds | N/A | N/A | ||||
Kelli Gallegos — 1970 Vice President, Principal Financial Officer and Assistant Treasurer | 2008 | Vice President, Principal Financial Officer and Assistant Treasurer, The Invesco Funds; Assistant Treasurer, Invesco PowerShares Capital Management LLC, PowerShares Exchange-Traded Fund Trust, PowerShares Exchange-Traded Fund Trust II, PowerShares India Exchange-Traded Fund Trust, PowerShares Actively Managed Exchange-Traded Fund Trust, PowerShares Actively Managed Exchange-Traded Commodity Fund Trust and PowerShares Exchange-Traded Self-Indexed Fund Trust
Formerly: Assistant Vice President, The Invesco Funds | N/A | N/A |
T-3 Invesco Allocation Funds
Trustees and Officers—(continued)
Name, Year of Birth and Position(s) Held with the Trust | Trustee and/ or Officer Since | Principal Occupation(s) During Past 5 Years | Number of Funds in Fund Complex Overseen by Trustee | Other Directorship(s) Past 5 Years | ||||
| Other Officers—(continued) | ||||||||
Tracy Sullivan — 1962 Vice President, Chief Tax Officer and Assistant Treasurer | 2008 | Vice President, Chief Tax Officer and Assistant Treasurer, The Invesco Funds; Assistant Treasurer, Invesco PowerShares Capital Management LLC, PowerShares Exchange-Traded Fund Trust, PowerShares Exchange-Traded Fund Trust II, PowerShares India Exchange-Traded Fund Trust, PowerShares Actively Managed Exchange-Traded Fund Trust,PowerShares Actively Managed Exchange-Traded Commodity Fund Trust and PowerShares Exchange-Traded Self-Indexed Fund Trust
Formerly: Assistant Vice President, The Invesco Funds | N/A | N/A | ||||
Crissie M. Wisdom — 1969 Anti-Money Laundering Compliance Officer | 2013 | Anti-Money Laundering Compliance Officer, Invesco Advisers, Inc. (formerly known as Invesco Institutional (N.A.), Inc.) (registered investment adviser), Invesco Capital Markets, Inc. (formerly known as Van Kampen Funds Inc.), Invesco Distributors, Inc., Invesco Investment Services, Inc., Invesco Management Group, Inc., The Invesco Funds, and PowerShares Exchange-Traded Fund Trust, PowerShares Exchange-Traded Fund Trust II, PowerShares India Exchange-Traded Fund Trust, PowerShares Actively Managed Exchange-Traded Fund Trust,PowerShares Actively Managed Exchange-Traded Commodity Fund Trust and PowerShares Exchange-Traded Self-Indexed Fund Trust; Anti-Money Laundering Compliance Officer and Bank Secrecy Act Officer, INVESCO National Trust Company and Invesco Trust Company; and Fraud Prevention Manager and Controls and Risk Analysis Manager for Invesco Investment Services, Inc.
Formerly: Anti-Money Laundering Compliance Officer, Van Kampen Exchange Corp. | N/A | N/A | ||||
Robert R. Leveille — 1969 Chief Compliance Officer | 2016 | Chief Compliance Officer, Invesco Advisers, Inc. (registered investment adviser); and Chief Compliance Officer, The Invesco Funds
Formerly: Chief Compliance Officer, Putnam Investments and the Putnam Funds | N/A | N/A |
The Statement of Additional Information of the Trust includes additional information about the Fund’s Trustees and is available upon request, without charge, by calling 1.800.959.4246. Please refer to the Fund’s Statement of Additional Information for information on the Fund’s sub-advisers.
Office of the Fund 11 Greenway Plaza, Suite 1000 Houston, TX 77046-1173 | Investment Adviser Invesco Advisers, Inc. 1555 Peachtree Street, N.E. Atlanta, GA 30309 | Distributor Invesco Distributors, Inc. 11 Greenway Plaza, Suite 1000 Houston, TX 77046-1173 | Auditors PricewaterhouseCoopers LLP 1000 Louisiana Street, Suite 5800 Houston, TX 77002-5678 | |||
Counsel to the Fund Stradley Ronon Stevens & Young, LLP 2005 Market Street, Suite 2600 Philadelphia, PA 19103-7018 | Counsel to the Independent Trustees Goodwin Procter LLP 901 New York Avenue, N.W. Washington, D.C. 20001 | Transfer Agent Invesco Investment Services, Inc. 11 Greenway Plaza, Suite 1000 Houston, TX 77046-1173 | Custodian State Street Bank and Trust Company 225 Franklin Street Boston, MA 02110-2801 | |||
T-4 Invesco Allocation Funds
Explore High-Conviction Investing with Invesco

Go paperless with eDelivery
Visit invesco.com/edelivery to enjoy the convenience and security of anytime electronic access to your investment documents.
With eDelivery, you can elect to have any or all of the following materials delivered straight to your inbox to download, save and print from your own computer:
| ∎ | Fund reports and prospectuses |
| ∎ | Quarterly statements |
| ∎ | Daily confirmations |
| ∎ | Tax forms |
Invesco mailing information
Send general correspondence to Invesco Investment Services, Inc., P.O. Box 219078, Kansas City, MO 64121-9078.
Important notice regarding delivery of security holder documents
To reduce Fund expenses, only one copy of most shareholder documents may be mailed to shareholders with multiple accounts at the same address (Householding). Mailing of your shareholder documents may be householded indefinitely unless you instruct us otherwise. If you do not want the mailing of these documents to be combined with those for other members of your household, please contact Invesco Investment Services, Inc. at 800 959 4246 or contact your financial institution. We will begin sending you individual copies for each account within 30 days after receiving your request.
Fund holdings and proxy voting information
The Fund provides a complete list of its holdings four times in each fiscal year, at the quarter ends. For the second and fourth quarters, the lists appear in the Fund’s semiannual and annual reports to shareholders. For the first and third quarters, the Fund files the lists with the Securities and Exchange Commission (SEC) on Form N-Q. The most recent list of portfolio holdings is available at invesco.com/completeqtrholdings. Shareholders can also look up the Fund’s Forms N-Q on the SEC website at sec.gov. Copies of the Fund’s Forms N-Q may be reviewed and copied at the SEC Public Reference Room in Washington, D.C. You can obtain information on the operation of the Public Reference Room, including information about duplicating fee charges, by calling 202 551 8090 or 800 732 0330, or by electronic request at the following email address: publicinfo@sec.gov. The SEC file numbers for the Fund are shown below.
A description of the policies and procedures that the Fund uses to determine how to vote proxies relating to portfolio securities is available without charge, upon request, from our Client Services department at 800 959 4246 or at invesco.com/proxyguidelines. The information is also available on the SEC website, sec.gov.
Information regarding how the Fund voted proxies related to its portfolio securities during the most recent 12-month period ended June 30 is available at invesco.com/proxysearch. The information is also available on the SEC website, sec.gov. Invesco Advisers, Inc. is an investment adviser; it provides investment advisory services to individual and institutional clients and does not sell securities. Invesco Distributors, Inc. is the US distributor for Invesco Ltd.’s retail mutual funds, exchange-traded funds and institutional money market funds. Both are wholly owned, indirect subsidiaries of Invesco Ltd. |  |
| SEC file numbers: 811-02699 and 002-57526 Invesco Distributors, Inc. AAS-AR-1 02212018 1002 | ||
| ||||
 |
Annual Report to Shareholders
|
December 31, 2017 | ||
| ||||
Invesco Convertible Securities Fund
| ||||
| Nasdaq: | ||||
| A: CNSAX ∎ B: CNSBX ∎ C: CNSCX ∎ Y: CNSDX ∎ R5: CNSIX ∎ R6: CNSFX | ||||

Letters to Shareholders
Philip Taylor | Dear Shareholders: This annual report includes information about your Fund, including performance data and a complete list of its investments as of the close of the reporting period. Inside is a discussion of how your Fund was managed and the factors that affected its performance during the reporting period. Major stock market indexes rose – and set record highs – throughout the reporting period. Generally positive economic data, strong corporate earnings and anticipated tax and regulatory reform contributed to the rally. The US economy expanded during the reporting period, with gross domestic product, the value of all goods and services produced, significantly increasing its growth rate from the first to the third quarter of the year. Tax reform legislation, enacted in December 2017, was a positive for the stock market, but its long-term economic impact was uncertain. Citing positive economic trends – specifically, realized and expected labor market conditions and inflation – the US Federal Reserve raised |

interest rates in March, June and December 2017. While US and global bond markets, as well as emerging market equities, sold off early in the reporting period, they recovered much of their losses during the reporting period. Overseas, economic data were mixed, prompting the European Central Bank and central banks in China and Japan, among other countries, to maintain extraordinarily accommodative monetary policies.
Short-term market volatility can prompt some investors to abandon their investment plans — and can cause others to settle for whatever returns the market has to offer. The investment professionals at Invesco, in contrast, invest with high conviction. This means that, no matter the asset class or the strategy, each investment team has a passion to exceed. We want to help investors achieve better outcomes, such as seeking higher returns, helping mitigate risk and generating income. Of course, investing with high conviction can’t guarantee a profit or ensure success; no investment strategy can. To learn more about how we invest with high conviction, visit invesco.com/HighConviction.
You, too, can invest with high conviction by maintaining a long-term investment perspective and by working with your financial adviser on a regular basis. During periods of short-term market volatility or uncertainty, your financial adviser can keep you focused on your long-term investment goals – a new home, a child’s college education or a secure retirement. He or she also can share research about the economy, the markets and individual investment options.
Visit our website for more information on your investments
Our website, invesco.com/us, offers a wide range of market insights and investment perspectives. On the website, you’ll find detailed information about our funds, including performance, holdings and portfolio manager commentaries. You can access information about your account by completing a simple, secure online registration. To do so, select “Log In” on the right side of the homepage, and then select “Register for Individual Account Access.”
In addition to the resources accessible on our website and through our mobile app, you can obtain timely updates to help you stay informed about the markets and the economy by connecting with Invesco on Twitter, LinkedIn or Facebook. You can access our blog at blog.invesco.us.com. Our goal is to provide you the information you want, when and where you want it.
Finally, I’m pleased to share with you Invesco’s commitment to both the Principles for Responsible Investment and to considering environmental, social and governance issues in our robust investment process. I invite you to learn more at invesco.com/esg.
Have questions?
For questions about your account, contact an Invesco client services representative at 800 959 4246. For Invesco-related questions or comments, please email me directly at phil@invesco.com.
All of us at Invesco look forward to serving your investment management needs. Thank you for investing with us.
Sincerely,

Philip Taylor
Senior Managing Director, Invesco Ltd.
| 2 | Invesco Convertible Securities Fund |
Bruce Crockett | Dear Fellow Shareholders: Among the many important lessons I’ve learned in more than 40 years in a variety of business endeavors is the value of a trusted advocate. As independent chair of the Invesco Funds Board, I can assure you that the members of the Board are strong advocates for the interests of investors in Invesco’s mutual funds. We work hard to represent your interests through oversight of the quality of the investment management services your funds receive and other matters important to your investment, including but not limited to: ∎ Ensuring that Invesco offers a diverse lineup of mutual funds that your financial adviser can use to strive to meet your financial needs as your investment goals change over time. ∎ Monitoring how the portfolio management teams of the Invesco funds are performing in light of changing economic and market conditions. |

| ∎ | Assessing each portfolio management team’s investment performance within the context of the investment strategy described in the fund’s prospectus. |
| ∎ | Monitoring for potential conflicts of interests that may impact the nature of the services that your funds receive. |
We believe one of the most important services we provide our fund shareholders is the annual review of the funds’ advisory and sub-advisory contracts with Invesco Advisers and its affiliates. This review is required by the Investment Company Act of 1940 and focuses on the nature and quality of the services Invesco provides as the adviser to the Invesco funds and the reasonableness of the fees that it charges for those services. Each year, we spend months carefully reviewing information received from Invesco and a variety of independent sources, such as performance and fee data prepared by Lipper, Inc. (a subsidiary of Broadridge Financial Solutions, Inc.), an independent, third-party firm widely recognized as a leader in its field. We also meet with our independent legal counsel and other independent advisers to review and help us assess the information that we have received. Our goal is to assure that you receive quality investment management services for a reasonable fee.
I trust the measures outlined above provide assurance that you have a worthy advocate when it comes to choosing the Invesco Funds.
As always, please contact me at bruce@brucecrockett.com with any questions or concerns you may have. On behalf of the Board, we look forward to continuing to represent your interests and serving your needs.
Sincerely,

Bruce L. Crockett
Independent Chair
Invesco Funds Board of Trustees
| 3 | Invesco Convertible Securities Fund |
Management’s Discussion of Fund Performance
Performance summary For the year ended December 31, 2017, Invesco Convertible Securities Fund (the Fund), at net asset value (NAV), underperformed the ICE BofAML US Convertible Index, the Fund’s broad market/style-specific index. Your Fund’s long-term performance appears later in this report.
|
| |||
Fund vs. Indexes |
| |||
Total returns, 12/31/16 to 12/31/17, at net asset value (NAV). Performance shown does not include applicable contingent deferred sales charges (CDSC) or front-end sales charges, which would have reduced performance.
|
| |||
Class A Shares | 10.42 | % | ||
Class B Shares | 9.60 | �� | ||
Class C Shares | 9.57 | |||
Class Y Shares | 10.68 | |||
Class R5 Shares | 10.73 | |||
Class R6 Shares | 10.82 | |||
ICE BofAML US Convertible Indexq(Broad Market/Style-Specific Index) | 13.70 | |||
Lipper Convertible Securities Funds Index∎ (Peer Group Index) | 12.12 | |||
Source(s): qFactSet Research Systems Inc.; ∎Lipper Inc.
| ||||
Market conditions and your Fund
Despite highly destructive hurricanes that threatened to derail a years-long economic recovery, the US economy continued to expand throughout the year ended December 31, 2017. Gross domestic product – the value of all goods and services produced in the US – expanded in the first three quarters of 2017. Inflation remained subdued even as unemployment continued its multiyear decline.
Given signs of an improving economy, the US Federal Reserve (the Fed) raised interest rates three times during the reporting period, most recently in December 2017; each rate hike was 25 basis points.1 (A basis point is 0.01%.) The Fed pledged that “realized and expected economic conditions relative to its objectives of maximum employment and 2 percent inflation” will guide its future actions. At the close of the reporting period, Fed policy remained accommodative, and the fed funds target rate stood at a range of 1.25% to 1.50% – 75 basis points higher than at the start of the reporting period.1
Higher inventories and a worsening outlook caused oil prices and many energy stocks to decline during the first half of 2017. However, oil prices rose significantly in the second half of the reporting period as expectations for lower supplies increased, partly due to continued OPEC production cuts, and demand began normalizing.
Major US stock market indexes repeatedly hit all-time highs throughout the reporting period. The stock market rally that began after the 2016 presidential election continued throughout the reporting period, fueled by generally positive economic data, strong corporate earnings and improved consumer confidence. Finally, after much debate in Congress, a tax reform bill was signed into law in December 2017. While its enactment further strengthened stocks, its effect on the US economy remained uncertain.
Convertible securities (as represented by the ICE BofAML US Convertibles Index) rallied along with the equity
markets during the year, and finished with strong gains, returning 13.70%. Convertible performance was driven by strong returns from equity sensitive convertibles, the information technology (IT) sector, as well as among large-cap issuers. Within the index, the industrials and IT sectors had the highest returns, while telecommunication services and energy posted losses for the period.
Given strong returns from the IT sector during the reporting period, it was the largest detractor from the Fund’s performance relative to the broad market/style-specific benchmark for the year. The Fund’s underperformance in the sector relative to the benchmark was due to our risk management process, which seeks to minimize concentration risk by underweighting certain issues relative to the index. Highly equity-sensitive issuers, such as Intel and Microchip Technology, made up a large percentage of the index and as a result the Fund’s underweight allocations in these issues detracted from relative returns. We also maintained a strong sell discipline, taking profits and selling when issues reached their price targets. Additionally, we chose to sell or trim a number of IT holdings as these higher-priced issues carry more equity sensitivity, which, in our opinion, results in a heightened risk profile.
However, within IT, the Fund’s position in the Mandatory Exchangeable Trust (China) of Chinese e-commerce conglomerate Alibaba was a key individual contributor to the Fund’s relative returns, as the issue is not held in the benchmark. Similarly, the Fund’s overweight exposure to Square, headquartered in San Francisco, was a key individual contributor to the Fund’s relative return as the company reported strong earnings during the year, and the company raised its outlook for the year.
| Portfolio Composition |
| By sector | % of total net assets |
Information Technology | 36.3 | % | ||
Health Care | 18.3 | |||
Industrials | 10.5 | |||
Consumer Discretionary | 10.3 | |||
Financials | 9.4 | |||
Real Estate | 4.4 | |||
Energy | 3.2 | |||
Utilities | 2.6 | |||
Materials | 0.7 | |||
Consumer Staples | 0.2 | |||
Money Market Funds Plus Other Assets Less Liabilities | 4.1 | |||
| Top Five Debt Issuers* | ||
| % of total net assets | ||
1. Salesforce.com, Inc. | 2.6 | % | ||
2. Micron Technology, Inc. | 2.0 | |||
3. Live Nation Entertainment, Inc. | 1.8 | |||
4. Tesla, Inc. | 1.6 | |||
5. Wright Medical Group, Inc. | 1.6 | |||
Total Net Assets | $ | 1.4 billion |
Total Number of Holdings*
|
| 130
|
| |
The Fund’s holdings are subject to change, and there is no assurance that the Fund will continue to hold any particular security.
*Excluding money market fund holdings.
Data presented here are as of December 31, 2017.
| 4 | Invesco Convertible Securities Fund |
Overweight exposure to and security selection in the health care sector was another key detractor from relative Fund performance. Much of the Fund’s underperformance in the sector was due to overweight allocations in Teva and Wright Medical. During the reporting period, Teva reported weaker-than-expected earnings and lowered its outlook for the year due to pricing pressure and increased competition within the generic pharmaceutical industry. We sold our position in Teva during the reporting period. Wright Medical underperformed due to weaker earnings in the first half of the year.
Security selection in the financials sector was the largest contributor to the Fund’s relative return, due in large part to Lending Tree and Bank of America. During the reporting period, Lending Tree reported higher revenues from both its mortgage business and non-mortgage segment, which includes personal loans and credit cards. Bank of America benefited from the Federal Reserve’s (the Fed’s) better-than-expected report of its Comprehensive Capital Analysis and Review, which gave a positive view of the financial strength of US banks. Banks also benefited from the Fed’s series of interest rate increases in 2017.
Underweight exposure to and security selection in the real estate sector also contributed to relative Fund performance. Within the sector, American Tower and Crown Castle were strong individual contributors.
During the year, we increased our exposure to the consumer discretionary and industrials sectors and decreased our exposure to the energy and telecommunication services sectors. At year end, the Fund’s largest absolute sector exposures remained in the IT and health care sectors. The Fund’s largest overweight positions relative to the benchmark were in the industrials and consumer discretionary sectors, while the largest underweight positions were in the financials and energy sectors.
Financial markets finished 2017 with very strong gains, and many indexes reached record highs. However, we expect that market volatility may return in 2018 given the potential for slowing economic growth, higher interest rates and gridlock in Washington leading up to the mid-term elections. Given this market uncertainty, we sought to avoid issue-specific underperformers, and we continued to focus on companies with healthy balance sheets and reasonable valuations that may benefit in the current economic environment.
Thank you for your continued investment in Invesco Convertible Securities Fund, and for sharing our commitment to a long-term investment horizon.
| 1 | Source: US Federal Reserve |
The views and opinions expressed in management’s discussion of Fund performance are those of Invesco Advisers, Inc. These views and opinions are subject to change at any time based on factors such as market and economic conditions. These views and opinions may not be relied upon as investment advice or recommendations, or as an offer for a particular security. The information is not a complete analysis of every aspect of any market, country, industry, security or the Fund. Statements of fact are from sources considered reliable, but Invesco Advisers, Inc. makes no representation or warranty as to their completeness or accuracy. Although historical performance is no guarantee of future results, these insights may help you understand our investment management philosophy.
See important Fund and, if applicable, index disclosures later in this report.
| Ellen Gold Portfolio Manager, is lead manager of Invesco Convertible Securities Fund. She joined Invesco in 2010. Ms. Gold | |
| earned a BBA from George Washington University and an MBA from New York University. | ||

| Ramez Nashed Portfolio Manager, is manager of Invesco Convertible Securities Fund. He joined Invesco in 2010. Mr. Nashed earned | |
| a BA in finance from New Jersey City University and an MBA from Seton Hall University. | ||

| 5 | Invesco Convertible Securities Fund |
Your Fund’s Long-Term Performance
Results of a $10,000 Investment – Oldest Share Class(es)
Fund and index data from 12/31/07
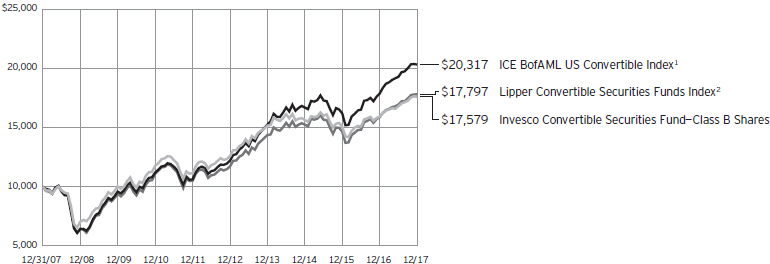
1 Source: FactSet Research Systems Inc.
2 Source: Lipper Inc.
Past performance cannot guarantee comparable future results.
The data shown in the chart include reinvested distributions, applicable sales charges and Fund expenses including management fees. Results for Class B shares are calculated as if a hypothetical shareholder had liquidated his entire investment in the Fund at the close of the reporting period and paid the contingent deferred sales charges, if applicable.
Index results include reinvested dividends, but they do not reflect sales charges. Performance of the peer group, if applicable, reflects fund expenses and management fees; performance of a market index does not. Performance shown in the chart and table(s) does not reflect deduction of taxes a shareholder would pay on Fund distributions or sale of Fund shares.
| 6 | Invesco Convertible Securities Fund |
Average Annual Total Returns |
| |||
As of 12/31/17, including maximum applicable sales charges |
| |||
Class A Shares | ||||
Inception (7/28/97) | 6.28% | |||
10 Years | 5.84 | |||
5 Years | 6.19 | |||
1 Year | 4.36 | |||
Class B Shares | ||||
Inception (10/31/85) | 7.54% | |||
10 Years | 5.80 | |||
5 Years | 6.29 | |||
1 Year | 4.61 | |||
Class C Shares | ||||
Inception (7/28/97) | 5.80% | |||
10 Years | 5.68 | |||
5 Years | 6.64 | |||
1 Year | 8.57 | |||
Class Y Shares | ||||
Inception (7/28/97) | 6.83% | |||
10 Years | 6.70 | |||
5 Years | 7.66 | |||
1 Year | 10.68 | |||
Class R5 Shares | ||||
10 Years | 6.66% | |||
5 Years | 7.72 | |||
1 Year | 10.73 | |||
Class R6 Shares | ||||
10 Years | 6.64% | |||
5 Years | 7.80 | |||
1 Year | 10.82 | |||
Effective June 1, 2010, Class A, Class B, Class C and Class I shares of the predecessor fund, Morgan Stanley Convertible Securities Trust, advised by Morgan Stanley Investment Advisors Inc. were reorganized into Class A, Class B, Class C and Class Y shares, respectively, of Invesco Convertible Securities Fund. Returns shown above, prior to June 1, 2010, for Class A, Class B, Class C and Class Y shares are blended returns of the predecessor fund and Invesco Convertible Securities Fund. Share class returns will differ from the predecessor fund because of different expenses.
Class R5 shares incepted on May 23, 2011. Performance shown prior to that date is that of the Fund’s and the predecessor fund’s Class A shares and includes the 12b-1 fees applicable to Class A shares.
Class R6 shares incepted on September 24, 2012. Performance shown prior to that date is that of the Fund’s and the predecessor fund’s Class A shares and includes the 12b-1 fees applicable to Class A shares.
The performance data quoted represent past performance and cannot guarantee comparable future results; current performance may be lower or higher. Please visit invesco.com/performance for the most recent month-end performance. Performance figures reflect reinvested distributions, changes in net asset value and the effect of the maximum sales charge unless otherwise stated. Investment return and principal value will fluctuate so that you may have a gain or loss when you sell shares.
The net annual Fund operating expense ratio set forth in the most recent Fund prospectus as of the date of this report for Class A, Class B, Class C, Class Y, Class R5 and Class R6 shares was 0.89%, 1.65%, 1.62%, 0.65%, 0.63% and 0.53%, respectively.1 The total annual Fund operating expense ratio set forth in the most recent Fund prospectus as of the date of this report for Class A, Class B, Class C, Class Y, Class R5 and Class R6 shares was 0.90%, 1.66%, 1.63%, 0.66%, 0.64% and 0.54%, respectively. The expense ratios presented above may vary from the expense ratios presented in other sections of this report that are based on expenses incurred during the period covered by this report.
Class A share performance reflects the maximum 5.50% sales charge, and Class B and Class C share performance reflects the applicable contingent deferred sales charge (CDSC) for the period involved. The CDSC on Class B shares declines from 5% beginning at the time of purchase to 0% at the beginning of the seventh year. The CDSC on Class C shares is 1% for the first year after purchase. Class Y, Class R5 and Class R6 shares do not have a front-end sales charge or a CDSC; therefore, performance is at net asset value.
The performance of the Fund’s share classes will differ primarily due to different sales charge structures and class expenses.
Fund performance reflects any applicable fee waivers and/or expense reimbursements. Had the adviser not waived fees and/or reimbursed expenses currently or in the past, returns would have been lower. See current prospectus for more information.
| 1 | Total annual Fund operating expenses after any contractual fee waivers and/or expense reimbursements by the adviser in effect through at least June 30, 2019. See current prospectus for more information. |
| 7 | Invesco Convertible Securities Fund |
Invesco Convertible Securities Fund’s investment objective is total return through growth of capital and current income.
| ∎ | Unless otherwise stated, information presented in this report is as of December 31, 2017, and is based on total net assets. |
| ∎ | Unless otherwise noted, all data provided by Invesco. |
| ∎ | To access your Fund’s reports/prospectus, visit invesco.com/fundreports. |
About share classes ∎ Effective January 26, 2018, after the close of the reporting period, all outstanding Class B shares were converted to Class A shares, in advance of their normally scheduled conversion. No CDSC was paid in connection with this early conversion. ∎ Class Y shares are available only to certain investors. Please see the prospectus for more information. ∎ Class R5 shares and Class R6 shares are available for use by retirement plans that meet certain standards and for institutional investors. Class R6 shares are also available through intermediaries that have established an agreement with Invesco Distributors, Inc. to make such shares available for use in retail omnibus accounts. Please see the prospectus for more information.
Principal risks of investing in the Fund ∎ Changing fixed income market conditions risk. The current low interest rate environment was created in part by the Federal Reserve Board (FRB) and certain foreign central banks keeping the federal funds and equivalent foreign rates near, at or below zero. Increases in the federal funds and equivalent foreign rates may expose fixed income markets to heightened volatility and reduced liquidity for certain fixed income investments, particularly those with longer maturities. In addition, decreases in fixed income dealer market-making capacity may also potentially lead to heightened volatility and reduced liquidity in the fixed income markets. As a result, the value of the Fund’s investments and share price may decline. Changes in central bank policies could also result in higher than normal shareholder redemptions, which could potentially increase portfolio turnover and the Fund’s transaction costs. ∎ Convertible securities risk. The market values of convertible securities are af- | fected by market interest rates, the risk of actual issuer default on interest or principal payments and the value of the underlying common stock into which the convertible security may be converted. Additionally, a convertible security is subject to the same types of market and issuer risks as apply to the underlying common stock. In addition, certain convertible securities are subject to involuntary conversions and may undergo principal write-downs upon the occurrence of certain triggering events, and, as a result, are subject to an increased risk of loss. Convertible securities may be rated below investment grade. ∎ Debt securities risk. The prices of debt securities held by the Fund will be affected by changes in interest rates, the creditworthiness of the issuer and other factors. An increase in prevailing interest rates typically causes the value of existing debt securities to fall and often has a greater impact on longer-duration debt securities and higher quality debt securities. Falling interest rates will cause the Fund to reinvest the proceeds of debt securities that have been repaid by the issuer at lower interest rates. Falling interest rates may also reduce the Fund’s distributable income because interest payments on floating rate debt instruments held by the Fund will decline. The Fund could lose money on investments in debt securities if the issuer or borrower fails to meet its obligations to make interest payments and/or to repay principal in a timely manner. Changes in an issuer’s financial strength, the market’s perception of such strength or in the credit rating of the issuer or the security may affect the value of debt securities. The Adviser’s credit analysis may fail to anticipate such changes, which could result in buying a debt security at an inopportune time or failing to sell a debt security in advance of a price decline or other credit event. | ∎ Depositary receipts risk. Investing in depositary receipts involves the same risks as direct investments in foreign securities. In addition, the underlying issuers of certain depositary receipts are under no obligation to distribute shareholder communications or pass through any voting rights with respect to the deposited securities to the holders of such receipts. The Fund may therefore receive less timely information or have less control than if it invested directly in the foreign issuer. ∎ Derivatives risk. The value of a derivative instrument depends largely on (and is derived from) the value of an underlying security, currency, commodity, interest rate, index or other asset (each referred to as an underlying asset). In addition to risks relating to the underlying assets, the use of derivatives may include other, possibly greater, risks, including counterparty, leverage and liquidity risks. Counterparty risk is the risk that the counterparty to the derivative contract will default on its obligation to pay the Fund the amount owed or otherwise perform under the derivative contract. Derivatives create leverage risk because they do not require payment up front equal to the economic exposure created by owning the derivative. As a result, an adverse change in the value of the underlying asset could result in the Fund sustaining a loss that is substantially greater than the amount invested in the derivative, which may make the Fund’s returns more volatile and increase the risk of loss. Derivative instruments may also be less liquid than more traditional investments and the Fund may be unable to sell or close out its derivative positions at a desirable time or price. This risk may be more acute under adverse market conditions, during which the Fund may be most in need of liquidating its derivative positions. Derivatives may also be harder to value, less tax efficient and subject to changing government regulation that could impact the Fund’s ability to use certain derivatives or their cost. Also, derivatives used for hedging or to gain or limit exposure to a particular market segment may not provide the expected benefits, particularly during adverse market conditions. | ||
This report must be accompanied or preceded by a currently effective Fund prospectus, which contains more complete information, including sales charges and expenses. Investors should read it carefully before investing.
| ||||
| NOT FDIC INSURED | MAY LOSE VALUE | NO BANK GUARANTEE | ||||
| 8 | Invesco Convertible Securities Fund |
∎ Emerging markets securities risk. Emerging markets (also referred to as developing markets) are generally subject to greater market volatility, political, social and economic instability, uncertain trading markets and more governmental limitations on foreign investment than more developed markets. In addition, companies operating in emerging markets may be subject to lower trading volume and greater price fluctuations than companies in more developed markets. Securities law and the enforcement of systems of taxation in many emerging market countries may change quickly and unpredictably. In addition, investments in emerging markets securities may also be subject to additional transaction costs, delays in settlement procedures, and lack of timely information. ∎ Foreign securities risk. The Fund’s foreign investments may be adversely affected by political and social instability, changes in economic or taxation policies, difficulty in enforcing obligations, decreased liquidity or increased volatility. Foreign investments also involve the risk of the possible seizure, nationalization or expropriation of the issuer or foreign deposits (in which the Fund could lose its entire investments in a certain market) and the possible adoption of foreign governmental restrictions such as exchange controls. Unless the Fund has hedged its foreign securities risk, foreign securities risk also involves the risk of negative foreign currency rate fluctuations, which may cause the value of securities denominated in such foreign currency (or other instruments through which the Fund has exposure to foreign currencies) to decline in value. Currency exchange rates may fluctuate significantly over short periods of time. Currency hedging strategies, if used, are not always successful. ∎ High yield debt securities (junk bond) risk. Investments in high yield debt securities (“junk bonds”) and other lower-rated securities will subject the Fund to substantial risk of loss. These securities are considered to be speculative with respect to the issuer’s ability to pay interest and principal when due, are more susceptible to default or decline in market value and are less liquid than | investment grade debt securities. Prices of high yield debt securities tend to be very volatile. ∎ Liquidity risk. The Fund may be unable to sell illiquid investments at the time or price it desires and, as a result, could lose its entire investment in such investments. Liquid securities can become illiquid during periods of market stress. If a significant amount of the Fund’s securities become illiquid, the Fund may not be able to timely pay redemption proceeds and may need to sell securities at significantly reduced prices. ∎ Management risk. The Fund is actively managed and depends heavily on the Adviser’s judgment about markets, interest rates or the attractiveness, relative values, liquidity, or potential appreciation of particular investments made for the Fund’s portfolio. The Fund could experience losses if these judgments prove to be incorrect. Additionally, legislative, regulatory, or tax developments may adversely affect management of the Fund and, therefore, the ability of the Fund to achieve its investment objective. ∎ Market risk. The market values of the Fund’s investments, and therefore the value of the Fund’s shares, will go up and down, sometimes rapidly or unpredictably. Market risk may affect a single issuer, industry or section of the economy, or it may affect the market as a whole. Individual stock prices tend to go up and down more dramatically than those of certain other types of investments, such as bonds. During a general downturn in the financial markets, multiple asset classes may decline in value. When markets perform well, there can be no assurance that specific investments held by the Fund will rise in value. ∎ Preferred securities risk. Preferred securities are subject to issuer-specific and market risks applicable generally to equity securities. Preferred securities also may be subordinated to bonds or other debt instruments, subjecting them to a greater risk of non-payment, may be less liquid than many other securities, such as common stocks, and generally offer no voting rights with respect to the issuer. ∎ Sector focus risk. The Fund may from time to time invest a significant amount of its assets (i.e. over 25%) in one mar- | ket sector or group of related industries. In this event, the Fund’s performance will depend to a greater extent on the overall condition of the sector or group of industries and there is increased risk that the Fund will lose significant value if conditions adversely affect that sector or group of industries.
About indexes used in this report ∎ The ICE BofAML US Convertible Index tracks the performance of US-dollar-denominated convertible securities that are not currently in bankruptcy and have total market values of more than $50 million at issuance. ∎ The Lipper Convertible Securities Funds Index is an unmanaged index considered representative of convertible securities funds tracked by Lipper. ∎ The Fund is not managed to track the performance of any particular index, including the index(es) described here, and consequently, the performance of the Fund may deviate significantly from the performance of the index(es). ∎ A direct investment cannot be made in an index. Unless otherwise indicated, index results include reinvested dividends, and they do not reflect sales charges. Performance of the peer group, if applicable, reflects fund expenses; performance of a market index does not.
Other information ∎ The returns shown in management’s discussion of Fund performance are based on net asset values (NAVs) calculated for shareholder transactions. Generally accepted accounting principles require adjustments to be made to the net assets of the Fund at period end for financial reporting purposes, and as such, the NAVs for shareholder transactions and the returns based on those NAVs may differ from the NAVs and returns reported in the Financial Highlights. ∎ Industry classifications used in this report are generally according to the Global Industry Classification Standard, which was developed by and is the exclusive property and a service mark of MSCI Inc. and Standard & Poor’s. |
| 9 | Invesco Convertible Securities Fund |
Schedule of Investments(a)
December 31, 2017
| Principal Amount | Value | |||||||
Bonds & Notes–78.97% |
| |||||||
| Aerospace & Defense–1.47% | ||||||||
Aerojet Rocketdyne Holdings, Inc., Sr. Unsec. Conv. Bonds, 2.25%, 12/15/2023 | $ | 12,000,000 | $ | 16,592,555 | ||||
RTI International Metals Inc., Sr. Unsec. Gtd. Conv. Notes, 1.63%, 10/15/2019 | 3,245,000 | 3,719,581 | ||||||
| 20,312,136 | ||||||||
| Air Freight & Logistics–2.06% | ||||||||
Air Transport Services Group, Inc., Sr. Unsec. Conv. Notes, 1.13%, 10/15/2024(b) | 11,000,000 | 11,385,000 | ||||||
Atlas Air Worldwide Holdings, Inc., Sr. Unsec. Conv. Bonds, 2.25%, 06/01/2022 | 8,500,000 | 9,790,937 | ||||||
Echo Global Logistics, Inc., Sr. Unsec. Conv. Notes, 2.50%, 05/01/2020 | 7,000,000 | 7,262,500 | ||||||
| 28,438,437 | ||||||||
| Application Software–8.17% | ||||||||
Citrix Systems, Inc., Sr. Unsec. Conv. Bonds, 0.50%, 04/15/2019 | 11,000,000 | 14,251,875 | ||||||
HubSpot, Inc., Sr. Unsec. Conv. Notes, 0.25%, 06/01/2022(b) | 10,500,000 | 12,107,813 | ||||||
NICE Systems Inc. (Israel), Sr. Unsec. Gtd. Conv. Notes, | 9,000,000 | 11,131,875 | ||||||
Nuance Communications, Inc., Sr. Unsec. Conv. Bonds, 1.00%, 12/15/2022(c) | 7,129,000 | 6,839,384 | ||||||
PROS Holdings, Inc., Sr. Unsec. Conv. Notes, 2.00%, 06/01/2022(b)(c) | 2,000,000 | 1,820,000 | ||||||
RealPage, Inc., Sr. Unsec. Conv. Notes, 1.50%, 11/15/2022(b) | 10,212,000 | 12,688,410 | ||||||
salesforce.com, inc., Sr. Unsec. Conv. Notes, 0.25%, 04/01/2018 | 23,330,000 | 35,782,387 | ||||||
Verint Systems Inc., Sr. Unsec. Conv. Notes, 1.50%, 06/01/2021 | 7,000,000 | 6,833,750 | ||||||
Workday, Inc., Sr. Unsec. Conv. Notes, 0.25%, 10/01/2022(b) | 11,500,000 | 11,399,375 | ||||||
| 112,854,869 | ||||||||
| Asset Management & Custody Banks–0.37% | ||||||||
Ares Capital Corp., Sr. Unsec. Conv. Notes, 3.75%, 02/01/2022(b) | 5,000,000 | 5,153,125 | ||||||
| Automobile Manufacturers–1.63% | ||||||||
Tesla, Inc., Sr. Unsec. Conv. Notes, | 10,000,000 | 10,837,500 | ||||||
2.38%, 03/15/2022 | 10,000,000 | 11,656,250 | ||||||
| 22,493,750 | ||||||||
| Biotechnology–4.05% | ||||||||
Aegerion Pharmaceuticals, Inc., Sr. Unsec. Conv. Bonds, 2.00%, 08/15/2019 | 4,500,000 | 3,622,500 | ||||||
| Principal Amount | Value | |||||||
| Biotechnology–(continued) | ||||||||
BioMarin Pharmaceutical Inc., Sr. Unsec. Sub. Conv. Notes, 0.75%, 10/15/2018 | $ | 8,517,000 | $ | 9,256,914 | ||||
1.50%, 10/15/2020 | 4,497,000 | 5,348,619 | ||||||
Clovis Oncology, Inc., Sr. Unsec. Conv. Notes, 2.50%, 09/15/2021 | 2,000,000 | 2,701,250 | ||||||
Ionis Pharmaceuticals, Inc., Sr. Unsec. Conv. Bonds, 1.00%, 11/15/2021 | 11,500,000 | 12,168,438 | ||||||
Neurocrine Biosciences, Inc., Sr. Unsec. Conv. Notes, 2.25%, 05/15/2024(b) | 12,000,000 | 15,352,500 | ||||||
Sarepta Therapeutics, Inc., Sr. Unsec. Conv. Notes, 1.50%, 11/15/2024(b) | 7,000,000 | 7,498,750 | ||||||
| 55,948,971 | ||||||||
| Broadcasting–2.37% | ||||||||
Liberty Interactive LLC, Sr. Unsec. Conv. Deb., 1.75%, 10/05/2023(b)(c) | 15,000,000 | 17,390,625 | ||||||
Liberty Media Corp., Sr. Unsec. Conv. Deb., 2.25%, 10/05/2021(c) | 9,400,000 | 9,834,750 | ||||||
Liberty Formua One, Sr. Unsec. Conv. Notes, 1.00%, 01/30/2023(b) | 4,900,000 | 5,494,125 | ||||||
| 32,719,500 | ||||||||
| Cable & Satellite–1.13% | ||||||||
DISH Network Corp., Sr. Unsec. Conv. Bonds, 3.38%, 08/15/2026 | 14,300,000 | 15,595,938 | ||||||
| Casinos & Gaming–0.14% | ||||||||
Caesars Entertainment Corp., Sr. Unsec. Conv. Global Notes, 5.00%, 10/01/2024 | 1,000,000 | 1,939,375 | ||||||
| Communications Equipment–1.84% | ||||||||
Ciena Corp., Sr. Unsec. Conv. Global Notes, 3.75%, 10/15/2018 | 2,000,000 | 2,330,000 | ||||||
Finisar Corp., Sr. Unsec. Conv. Bonds, 0.50%, 12/15/2021(c) | 6,000,000 | 5,595,000 | ||||||
Lumentum Holdings Inc., Sr. Unsec. Conv. Notes, 0.25%, 03/15/2024(b) | 5,000,000 | 5,568,750 | ||||||
Viavi Solutions Inc., Sr. Unsec. Conv. Notes, 1.00%, 03/01/2024(b) | 12,000,000 | 11,887,500 | ||||||
| 25,381,250 | ||||||||
| Construction & Engineering–1.82% | ||||||||
Dycom Industries, Inc., Sr. Unsec. Conv. Bonds, 0.75%, 09/15/2021 | 12,000,000 | 15,705,000 | ||||||
Tutor Perini Corp., Sr. Unsec. Conv. Bonds, 2.88%, 06/15/2021 | 8,500,000 | 9,413,750 | ||||||
| 25,118,750 | ||||||||
| Construction Machinery & Heavy Trucks–2.03% | ||||||||
Greenbrier Cos., Inc. (The), Sr. Unsec. Conv. Notes, 2.88%, 02/01/2024(b) | 13,000,000 | 15,551,250 | ||||||
See accompanying Notes to Financial Statements which are an integral part of the financial statements.
10 Invesco Convertible Securities Fund
| Principal Amount | Value | |||||||
| Construction Machinery & Heavy Trucks–(continued) | ||||||||
Meritor Inc., Sr. Unsec. Conv. Gtd. Notes, 3.25%, 10/15/2025(b)(c) | $ | 12,000,000 | $ | 12,517,500 | ||||
| 28,068,750 | ||||||||
| Construction Materials–0.38% | ||||||||
CEMEX, S.A.B. de C.V. (Mexico), Unsec. Sub. Conv. Bonds, 3.72%, 03/15/2020 | 5,000,000 | 5,225,000 | ||||||
| Consumer Finance–0.86% | ||||||||
PRA Group, Inc., | ||||||||
Sr. Unsec. Conv. Bonds, 3.00%, 08/01/2020 | 2,000,000 | 1,920,000 | ||||||
Sr. Unsec. Conv. Notes, 3.50%, 06/01/2023(b) | 10,000,000 | 10,031,250 | ||||||
| 11,951,250 | ||||||||
| Data Processing & Outsourced Services–2.54% | ||||||||
Blackhawk Network Holdings, Inc., Sr. Unsec. Conv. Bonds, 1.50%, 01/15/2022 | 13,000,000 | 13,268,125 | ||||||
Euronet Worldwide, Inc., Sr. Unsec. Conv. Bonds, 1.50%, 10/01/2020(c) | 4,400,000 | 5,434,000 | ||||||
Square, Inc., Sr. Unsec. Conv. Notes, 0.38%, 03/01/2022(b) | 10,000,000 | 16,356,250 | ||||||
| 35,058,375 | ||||||||
| Diversified REIT’s–0.62% | ||||||||
Colony NorthStar, Inc., Sr. Unsec. Conv. Notes, 3.88%, 01/15/2021 | 8,567,000 | 8,556,291 | ||||||
| Electric Utilities–1.15% | ||||||||
NextEra Energy, Inc., Conv. Investment Units, 6.12%, 09/01/2019 | 279,000 | 15,872,310 | ||||||
| Electronic Components–0.44% | ||||||||
II-VI Inc., Sr. Unsec. Conv. Notes, 0.25%, 09/01/2022(b) | 5,000,000 | 6,037,500 | ||||||
| Health Care Equipment–5.75% | ||||||||
DexCom, Inc., Sr. Unsec. Conv. Notes, 0.75%, 05/15/2022(b) | 9,333,000 | 8,813,852 | ||||||
Insulet Corp., | ||||||||
Sr. Unsec. Conv. Bonds, 1.25%, 09/15/2021 | 10,500,000 | 13,741,875 | ||||||
Sr. Unsec. Conv. Notes, 1.38%, 11/15/2024(b) | 4,000,000 | 4,062,500 | ||||||
Nevro Corp., Sr. Unsec. Conv. Notes, 1.75%, 06/01/2021 | 5,500,000 | 5,771,563 | ||||||
NuVasive, Inc., Sr. Unsec. Conv. Bonds, 2.25%, 03/15/2021 | 13,000,000 | 15,307,500 | ||||||
Wright Medical Group N.V., Sr. Unsec. Conv. Bonds, 2.25%, 11/15/2021 | 8,000,000 | 9,780,000 | ||||||
Wright Medical Group, Inc., Sr. Unsec. Gtd. Conv. Bonds, 2.00%, 02/15/2020 | 21,300,000 | 21,952,312 | ||||||
| 79,429,602 | ||||||||
| Principal Amount | Value | |||||||
| Health Care Technology–1.51% | ||||||||
Allscripts Healthcare Solutions, Inc., Sr. Unsec. Conv. Bonds, 1.25%, 07/01/2020 | $ | 9,000,000 | $ | 9,658,125 | ||||
Medidata Solutions, Inc., Sr. Unsec. Conv. Notes, 1.00%, 08/01/2018 | 4,837,000 | 5,610,920 | ||||||
Teladoc, Inc., Sr. Unsec. Conv. Notes, 3.00%, 12/15/2022(b) | 5,000,000 | 5,646,875 | ||||||
| 20,915,920 | ||||||||
| Infrastructure–0.90% | ||||||||
Macquarie Infrastructure Corp., Sr. Unsec. Conv. Notes, 2.88%, 07/15/2019 | 12,055,000 | 12,484,459 | ||||||
| Internet & Direct Marketing Retail–3.24% | ||||||||
Ctrip.com International, Ltd. (China), Sr. Unsec. Conv. Global Bonds, 1.00%, 07/01/2018(c) | 10,000,000 | 10,562,500 | ||||||
Liberty Expedia Holdings, Inc., Sr. Unsec. Conv. Deb., 1.00%, 07/05/2022(b)(c) | 6,000,000 | 6,015,000 | ||||||
Priceline Group Inc. (The), Sr. Unsec. | ||||||||
Conv. Bonds, | 10,000,000 | 13,812,500 | ||||||
0.90%, 09/15/2021 | 6,000,000 | 7,031,250 | ||||||
Wayfair, Inc., Sr. Unsec. Conv. Notes, 0.38%, 09/01/2022(b) | 7,000,000 | 7,323,750 | ||||||
| 44,745,000 | ||||||||
| Internet Software & Services–5.44% | ||||||||
Altaba Inc., Sr. Unsec. Conv. Bonds, 0.00%, 12/01/2018(d) | 6,000,000 | 8,103,750 | ||||||
Carbonite, Inc., Sr. Unsec. Conv. Notes, 2.50%, 04/01/2022(b) | 5,000,000 | 6,131,250 | ||||||
Cornerstone OnDemand, Inc., Sr. Unsec. Conv. Bonds, 1.50%, 07/01/2018 | 8,006,000 | 7,980,981 | ||||||
IAC FinanceCo, Inc., Sr. Unsec. Gtd. Conv. Bonds, 0.88%, 10/01/2022(b) | 12,000,000 | 12,705,000 | ||||||
Twitter, Inc., Sr. Unsec. Conv. Bonds, 1.00%, 09/15/2021 | 10,805,000 | 10,095,922 | ||||||
Web.com Group Inc., Sr. Unsec. Conv. Notes, 1.00%, 08/15/2018 | 6,595,000 | 6,545,538 | ||||||
Weibo Corp. (China), Sr. Unsec. Conv. Notes, 1.25%, 11/15/2022(b) | 8,000,000 | 8,805,000 | ||||||
Zillow Group, Inc., Sr. Unsec. Conv. Bonds, 2.00%, 12/01/2021 | 13,500,000 | 14,782,500 | ||||||
| 75,149,941 | ||||||||
| Life Sciences Tools & Services–0.43% | ||||||||
Fluidigm Corp., Sr. Unsec. Conv. Notes, 2.75%, 02/06/2021(c) | 7,064,000 | 5,894,025 | ||||||
| Managed Health Care–0.44% | ||||||||
Anthem Inc., Conv. Investment Units, 5.25%, 05/01/2018 | 109,500 | 6,132,000 | ||||||
11 Invesco Convertible Securities Fund
See accompanying Notes to Financial Statements which are an integral part of the financial statements.
| Principal Amount | Value | |||||||
| Mortgage REIT’s–0.93% | ||||||||
Blackstone Mortgage Trust, Inc., Sr. Unsec. Conv. Notes, 5.25%, 12/01/2018 | $ | 5,711,000 | $ | 6,717,564 | ||||
Starwood Property Trust, Inc., Sr. Unsec. Conv. Notes, 4.38%, 04/01/2023 | 6,000,000 | 6,127,500 | ||||||
| 12,845,064 | ||||||||
| Movies & Entertainment–1.79% | ||||||||
Live Nation Entertainment, Inc., Sr. Unsec. Conv. Bonds, 2.50%, 05/15/2019 | 19,081,000 | 24,721,821 | ||||||
| Multi-Utilities–1.42% | ||||||||
Dominion Energy, Inc., Series A, Jr. Unsec. Sub. Conv. Investment Units, 6.75%, 08/15/2019(e) | 120,000 | 6,230,400 | ||||||
DTE Energy Co., Series C, Sr. Unsec. Conv. Investment Units, 6.50%, 10/01/2019 | 245,000 | 13,428,450 | ||||||
| 19,658,850 | ||||||||
| Oil & Gas Drilling–0.34% | ||||||||
Ensco Jersey Finance Ltd., Sr. Unsec. Gtd. Conv. Bonds, 3.00%, 01/31/2024 | 5,250,000 | 4,685,625 | ||||||
| Oil & Gas Equipment & Services–0.68% | ||||||||
Weatherford International Ltd., Sr. Unsec. Gtd. Conv. Notes, 5.88%, 07/01/2021 | 8,700,000 | 9,450,375 | ||||||
| Oil & Gas Exploration & Production–1.52% | ||||||||
Chesapeake Energy Corp., Sr. Unsec. Gtd. Conv. Notes, 5.50%, 09/15/2026(b) | 3,200,000 | 2,930,000 | ||||||
Oasis Petroleum Inc., Sr. Unsec. Gtd. Conv. Notes, 2.63%, 09/15/2023 | 8,000,000 | 8,620,000 | ||||||
SM Energy Co., Sr. Unsec. Conv. Notes, 1.50%, 07/01/2021 | 3,500,000 | 3,440,937 | ||||||
Whiting Petroleum Corp., Sr. Unsec. Gtd. Conv. Notes, 1.25%, 04/01/2020 | 6,500,000 | 6,012,500 | ||||||
| 21,003,437 | ||||||||
| Oil & Gas Storage & Transportation–0.21% | ||||||||
Cheniere Energy, Inc., Sr. Unsec. Conv. Notes, 4.25%, 03/15/2045 | 4,000,000 | 2,857,500 | ||||||
| Pharmaceuticals–2.70% | ||||||||
Dermira, Inc., Sr. Unsec. Conv. Notes, 3.00%, 05/15/2022(b) | 9,000,000 | 9,950,625 | ||||||
Horizon Pharma Investment Ltd., Sr. Unsec. Gtd. Conv. Bonds, 2.50%, 03/15/2022(b) | 8,500,000 | 7,936,875 | ||||||
Jazz Investments I Ltd., Sr. Unsec. Gtd. Conv. Bonds, 1.88%, 08/15/2021 | 10,000,000 | 10,056,250 | ||||||
Pacira Pharmaceuticals, Inc., Sr. Unsec. Conv. Notes, 2.38%, 04/01/2022(b) | 9,000,000 | 9,450,000 | ||||||
| 37,393,750 | ||||||||
| Property & Casualty Insurance–0.47% | ||||||||
AmTrust Financial Services, Inc., Sr. Unsec. Conv. Notes, 2.75%, 12/15/2024(c) | 9,000,000 | 6,525,000 | ||||||
| Principal Amount | Value | |||||||
| Semiconductor Equipment–1.04% | ||||||||
Teradyne Inc., Sr. Unsec. Conv. Bonds, 1.25%, 12/15/2023 | $ | 7,000,000 | $ | 10,005,625 | ||||
Veeco Instruments Inc., Sr. Unsec. Conv. Notes, 2.70%, 01/15/2023 | 5,000,000 | 4,365,625 | ||||||
| 14,371,250 | ||||||||
| Semiconductors–10.84% | ||||||||
Cypress Semiconductor Corp., |
| |||||||
Sr. Unsec. Conv. Bonds, 4.50%, 01/15/2022 | 10,500,000 | 13,807,500 | ||||||
Sr. Unsec. Conv. Notes, 2.00%, 02/01/2023(b) | 1,500,000 | 1,559,063 | ||||||
Inphi Corp., Sr. Unsec. Conv. Bonds, 0.75%, 09/01/2021 | 10,500,000 | 10,454,063 | ||||||
Integrated Device Technology, Inc., Sr. Unsec. Conv. Bonds, 0.88%, 11/15/2022 | 18,500,000 | 20,685,312 | ||||||
Intel Corp., Jr. Unsec. Sub. Conv. Global Deb., 3.25%, 08/01/2039 | 5,440,000 | 12,093,827 | ||||||
Microchip Technology Inc., |
| |||||||
Sr. Unsec. Sub. Conv. Bonds, 1.63%, 02/15/2025 | 5,482,000 | 9,346,810 | ||||||
Sr. Unsec. Sub. Conv. Notes, 1.63%, 02/15/2027(b) | 9,375,000 | 11,033,203 | ||||||
Micron Technology, Inc., |
| |||||||
Series F, Sr. Unsec. Conv. Notes, 2.13%, 02/15/2020(c) | 3,000,000 | 11,270,625 | ||||||
Series G, Sr. Unsec. Conv. Global Bonds, 3.00%, 11/15/2028(c) | 11,700,000 | 16,928,437 | ||||||
NXP Semiconductors N.V. (Netherlands), Sr. Unsec. Conv. Bonds, 1.00%, 12/01/2019 | 6,700,000 | 8,295,438 | ||||||
ON Semiconductor Corp., Sr. Unsec. Gtd. Conv. Bonds, 1.00%, 12/01/2020 | 13,900,000 | 17,809,375 | ||||||
Silicon Laboratories Inc., Sr. Unsec. Conv. Notes, 1.38%, 03/01/2022(b) | 8,688,000 | 10,040,070 | ||||||
SunPower Corp., Sr. Unsec. Conv. Notes, 0.88%, 06/01/2021 | 2,300,000 | 1,791,125 | ||||||
Synaptics Inc., Sr. Unsec. Conv. Notes, 0.50%, 06/15/2022(b) | 5,000,000 | 4,625,000 | ||||||
| 149,739,848 | ||||||||
| Specialized REIT’s–0.65% | ||||||||
Extra Space Storage LP, Sr. Unsec. Gtd. Conv. Notes, 3.13%, 10/01/2020(b)(c) | 8,000,000 | 8,980,000 | ||||||
| Steel–0.33% | ||||||||
Allegheny Technologies Inc., Sr. Unsec. Conv. Notes, 4.75%, 07/01/2022 | 2,500,000 | 4,637,500 | ||||||
| Systems Software–3.34% | ||||||||
FireEye, Inc., |
| |||||||
Series A, Sr. Unsec. Conv. Bonds, 1.00%, 06/01/2020(c) | 13,100,000 | 12,297,625 | ||||||
Series B, Sr. Unsec. Conv. Bonds, 1.63%, 06/01/2022(c) | 5,900,000 | 5,420,625 | ||||||
Proofpoint, Inc., Sr. Unsec. Conv. Bonds, 0.75%, 06/15/2020 | 10,875,000 | 13,661,719 | ||||||
ServiceNow, Inc., Sr. Unsec. Conv. Notes, 0.00%, 06/01/2022(b)(d) | 12,900,000 | 14,826,937 | ||||||
| 46,206,906 | ||||||||
12 Invesco Convertible Securities Fund
See accompanying Notes to Financial Statements which are an integral part of the financial statements.
| Principal Amount | Value | |||||||
| Technology Hardware, Storage & Peripherals–0.56% | ||||||||
Electronics for Imaging, Inc., Sr. Unsec. Conv. Bonds, 0.75%, 09/01/2019 | $ | 8,000,000 | $ | 7,735,000 | ||||
| Thrifts & Mortgage Finance–1.19% | ||||||||
LendingTree, Inc., Sr. Unsec. Conv. Notes, 0.63%, 06/01/2022(b) | 9,500,000 | 16,399,375 | ||||||
| Tobacco–0.18% | ||||||||
Vector Group Ltd., Sr. Unsec. Conv. Variable Rate Notes, 1.75%, 04/15/2020(f) | 2,185,000 | 2,527,772 | ||||||
Total Bonds & Notes | 1,091,215,597 | |||||||
| Shares | ||||||||
Preferred Stocks–15.78% |
| |||||||
| Asset Management & Custody Banks–0.92% | ||||||||
AMG Capital Trust II, $2.58 Conv. Pfd. | 200,200 | 12,700,188 | ||||||
| Diversified Banks–4.24% | ||||||||
Bank of America Corp., Series L, $72.50 Conv. Pfd. | 22,300 | 29,413,700 | ||||||
Wells Fargo & Co., Class A, Series L, $75.00 Conv. Pfd. | 22,300 | 29,212,777 | ||||||
| 58,626,477 | ||||||||
| Electronic Components–0.67% | ||||||||
Belden Inc., Series B, $6.75 Conv. Pfd. | 90,000 | 9,257,400 | ||||||
| Health Care Equipment–1.55% | ||||||||
Becton, Dickinson and Co., Series A, $3.06 Conv. Pfd. | 370,000 | 21,423,000 | ||||||
| Industrial Machinery–2.25% | ||||||||
Rexnord Corp., Series A, $2.88 Conv. Pfd. | 226,600 | 13,206,248 | ||||||
Stanley Black & Decker Inc., Series C, Conv. Investment Units, 5.38%, 05/15/2020 | 145,000 | 17,798,750 | ||||||
| 31,004,998 | ||||||||
| Internet Software & Services–1.49% | ||||||||
Mandatory Exchangeable Trust (China), $5.75 Conv. Pfd.(b) | 105,400 | 20,540,879 | ||||||
| Shares | Value | |||||||
| Oil & Gas Exploration & Production–0.40% | ||||||||
WPX Energy Inc., Series A, $3.13 Conv. Pfd. | 90,400 | $ | 5,591,240 | |||||
| Other Diversified Financial Services–0.45% | ||||||||
2017 Mandatory Exchangeable Trust, $5.19 Conv. Pfd.(b) | 60,000 | 6,207,000 | ||||||
| Pharmaceuticals–0.71% | ||||||||
Allergan PLC, Series A, $55.00 Conv. Pfd. | 16,800 | 9,849,000 | ||||||
| Specialized REIT’s–3.10% | ||||||||
American Tower Corp., Series B, $5.50 Conv. Pfd. | 213,300 | 26,822,475 | ||||||
Crown Castle International Corp., Series A, $68.75 Conv. Pfd. | 14,204 | 16,033,475 | ||||||
| 42,855,950 | ||||||||
Total Preferred Stocks | 218,056,132 | |||||||
Common Stocks –1.16% |
| |||||||
| Biotechnology–0.38% | ||||||||
Exelixis, Inc.(g) | 171,065 | 5,200,376 | ||||||
| Managed Health Care–0.78% | ||||||||
Molina Healthcare Inc.(g) | 141,395 | 10,842,181 | ||||||
Total Common Stocks (Cost $12,327,797) | 16,042,557 | |||||||
Money Market Funds–3.71% |
| |||||||
Invesco Government & Agency Portfolio–Institutional | 17,936,706 | 17,936,706 | ||||||
Invesco Liquid Assets | 12,809,704 | 12,810,984 | ||||||
Invesco Treasury Portfolio–Institutional Class, 1.17%(h) | 20,499,092 | 20,499,092 | ||||||
Total Money Market Funds | 51,246,782 | |||||||
TOTAL INVESTMENTS IN SECURITIES–99.62% |
| 1,376,561,068 | ||||||
OTHER ASSETS LESS LIABILITIES–0.38% |
| 5,196,763 | ||||||
NET ASSETS–100.00% |
| $ | 1,381,757,831 | |||||
Investment Abbreviations:
| Conv. | – Convertible | |
| Deb. | – Debentures | |
| Gtd. | – Guaranteed |
| Jr. | – Junior | |
| Pfd. | – Preferred | |
| REIT | – Real Estate Investment Trust |
| Sr. | – Senior | |
| Sub. | – Subordinated | |
| Unsec. | – Unsecured |
Notes to Schedule of Investments:
| (a) | Industry and/or sector classifications used in this report are generally according to the Global Industry Classification Standard, which was developed by and is the exclusive property and a service mark of MSCI Inc. and Standard & Poor’s. |
| (b) | Security purchased or received in a transaction exempt from registration under the Securities Act of 1933, as amended (the “1933 Act”). The security may be resold pursuant to an exemption from registration under the 1933 Act, typically to qualified institutional buyers. The aggregate value of these securities at December 31, 2017 was $373,353,852, which represented 27.02% of the Fund’s Net Assets. |
| (c) | Security has an irrevocable call by the issuer or mandatory put by the holder. Maturity date reflects such call or put. |
| (d) | Zero coupon bond issued at a discount. The interest rate shown represents the yield to maturity at issue. |
| (e) | Each corporate unit consists of a purchase contract for the issuer’s common stock & 1/40th undivided beneficial ownership interest in the issuer’s Series A, 1.50% subordinated notes due 2020. |
| (f) | Interest or dividend rate is redetermined periodically. Rate shown is the rate in effect on December 31, 2017. |
| (g) | Non-income producing security. |
| (h) | The money market fund and the Fund are affiliated by having the same investment adviser. The rate shown is the 7-day SEC standardized yield as of December 31, 2017. |
13 Invesco Convertible Securities Fund
See accompanying Notes to Financial Statements which are an integral part of the financial statements.
Statement of Assets and Liabilities
December 31, 2017
Assets: | ||||
Investments in securities, at value (Cost $1,184,242,803) | $ | 1,325,314,286 | ||
Investments in affiliated money market funds, at value (Cost $51,247,382) | 51,246,782 | |||
Receivable for: |
| |||
Fund shares sold | 2,277,261 | |||
Dividends and interest | 5,301,290 | |||
Investment for trustee deferred compensation and retirement plans | 121,657 | |||
Other assets | 34,818 | |||
Total assets | 1,384,296,094 | |||
Liabilities: | ||||
Payable for: |
| |||
Fund shares reacquired | 1,581,285 | |||
Accrued fees to affiliates | 617,072 | |||
Accrued trustees’ and officers’ fees and benefits | 1,099 | |||
Accrued other operating expenses | 150,611 | |||
Trustee deferred compensation and retirement plans | 188,196 | |||
Total liabilities | 2,538,263 | |||
Net assets applicable to shares outstanding | $ | 1,381,757,831 | ||
Net assets consist of: |
| |||
Shares of beneficial interest | $ | 1,223,117,981 | ||
Undistributed net investment income | 3,009,633 | |||
Undistributed net realized gain | 14,559,334 | |||
Net unrealized appreciation | 141,070,883 | |||
| $ | 1,381,757,831 | |||
Net Assets: |
| |||
Class A | $ | 653,121,182 | ||
Class B | $ | 798,707 | ||
Class C | $ | 95,218,191 | ||
Class Y | $ | 594,284,137 | ||
Class R5 | $ | 1,584,553 | ||
Class R6 | $ | 36,751,061 | ||
Shares outstanding, no par value, |
| |||
Class A | 26,751,118 | |||
Class B | 32,619 | |||
Class C | 3,918,571 | |||
Class Y | 24,314,555 | |||
Class R5 | 64,874 | |||
Class R6 | 1,504,422 | |||
Class A: |
| |||
Net asset value per share | $ | 24.41 | ||
Maximum offering price per share |
| |||
(Net asset value of $24.41 ¸ 94.50%) | $ | 25.83 | ||
Class B: |
| |||
Net asset value and offering price per share | $ | 24.49 | ||
Class C: |
| |||
Net asset value and offering price per share | $ | 24.30 | ||
Class Y: |
| |||
Net asset value and offering price per share | $ | 24.44 | ||
Class R5: |
| |||
Net asset value and offering price per share | $ | 24.43 | ||
Class R6: |
| |||
Net asset value and offering price per share | $ | 24.43 | ||
See accompanying Notes to Financial Statements which are an integral part of the financial statements.
14 Invesco Convertible Securities Fund
Statement of Operations
For the year ended December 31, 2017
Investment income: |
| |||
Interest | $ | 20,081,366 | ||
Dividends (net of foreign withholding taxes of $95,288) | 12,670,171 | |||
Dividends from affiliated money market funds | 325,864 | |||
Total investment income | 33,077,401 | |||
Expenses: |
| |||
Advisory fees | 6,947,768 | |||
Administrative services fees | 357,556 | |||
Custodian fees | 43,538 | |||
Distribution fees: |
| |||
Class A | 1,699,290 | |||
Class B | 13,611 | |||
Class C | 1,076,285 | |||
Transfer agent fees — A, B, C and Y | 1,920,677 | |||
Transfer agent fees — R5 | 2,167 | |||
Transfer agent fees — R6 | 4,912 | |||
Trustees’ and officers’ fees and benefits | 41,290 | |||
Registration and filing fees | 122,608 | |||
Reports to shareholders | 306,155 | |||
Professional services fees | 88,482 | |||
Other | 53,831 | |||
Total expenses | 12,678,170 | |||
Less: Fees waived and expense offset arrangement(s) | (51,724 | ) | ||
Net expenses | 12,626,446 | |||
Net investment income | 20,450,955 | |||
Realized and unrealized gain from: |
| |||
Net realized gain from investment securities | 48,328,010 | |||
Change in net unrealized appreciation of investment securities | 75,907,005 | |||
Net realized and unrealized gain | 124,235,015 | |||
Net increase in net assets resulting from operations | $ | 144,685,970 | ||
See accompanying Notes to Financial Statements which are an integral part of the financial statements.
15 Invesco Convertible Securities Fund
Statement of Changes in Net Assets
For the years ended December 31, 2017 and 2016
| 2017 | 2016 | |||||||
Operations: |
| |||||||
Net investment income | $ | 20,450,955 | $ | 29,224,581 | ||||
Net realized gain | 48,328,010 | 19,994,818 | ||||||
Change in net unrealized appreciation | 75,907,005 | 23,932,534 | ||||||
Net increase in net assets resulting from operations | 144,685,970 | 73,151,933 | ||||||
Distributions to shareholders from net investment income: |
| |||||||
Class A | (28,718,565 | ) | (24,488,116 | ) | ||||
Class B | (44,164 | ) | (63,957 | ) | ||||
Class C | (3,589,070 | ) | (4,238,112 | ) | ||||
Class Y | (27,386,575 | ) | (27,776,127 | ) | ||||
Class R5 | (80,568 | ) | (144,468 | ) | ||||
Class R6 | (953,741 | ) | (586,719 | ) | ||||
Total distributions from net investment income | (60,772,683 | ) | (57,297,499 | ) | ||||
Distributions to shareholders from net realized gains: |
| |||||||
Class A | (1,263,763 | ) | — | |||||
Class B | (1,865 | ) | — | |||||
Class C | (184,718 | ) | — | |||||
Class Y | (1,141,284 | ) | — | |||||
Class R5 | (1,832 | ) | — | |||||
Class R6 | (71,482 | ) | — | |||||
Total distributions from net realized gains | (2,664,944 | ) | — | |||||
Share transactions–net: |
| |||||||
Class A | (173,846,718 | ) | 20,724,648 | |||||
Class B | (1,114,039 | ) | (1,376,778 | ) | ||||
Class C | (42,173,932 | ) | (59,195,684 | ) | ||||
Class Y | (7,125,223 | ) | (541,887,377 | ) | ||||
Class R5 | (3,828,590 | ) | 1,265,367 | |||||
Class R6 | 21,863,533 | (3,238,940 | ) | |||||
Net increase (decrease) in net assets resulting from share transactions | (206,224,969 | ) | (583,708,764 | ) | ||||
Net increase (decrease) in net assets | (124,976,626 | ) | (567,854,330 | ) | ||||
Net assets: |
| |||||||
Beginning of year | 1,506,734,457 | 2,074,588,787 | ||||||
End of year (includes undistributed net investment income of $3,009,633 and $21,737,781, respectively) | $ | 1,381,757,831 | $ | 1,506,734,457 | ||||
Notes to Financial Statements
December 31, 2017
NOTE 1—Significant Accounting Policies
Invesco Convertible Securities Fund (the “Fund”) is a series portfolio of AIM Growth Series (Invesco Growth Series) (the “Trust”). The Trust is organized as a Delaware statutory trust and is registered under the Investment Company Act of 1940, as amended (the “1940 Act”), as an open-end series management investment company consisting of twenty-nine separate series portfolios, each authorized to issue an unlimited number of shares of beneficial interest. The assets, liabilities and operations of each portfolio are accounted for separately. Information presented in these financial statements pertains only to the Fund. Matters affecting each portfolio or class will be voted on exclusively by the shareholders of such portfolio or class.
The Fund’s investment objective is total return through growth of capital and current income.
The Fund currently consists of six different classes of shares: Class A, Class B, Class C, Class Y, Class R5 and Class R6. Class Y shares are available only to certain investors. Class A shares are sold with a front-end sales charge unless certain waiver criteria are met and under certain circumstances load waived shares may be subject to contingent deferred sales charges (“CDSC”). Class C shares are sold with a CDSC. Class Y, Class R5 and Class R6 shares are sold at net asset value. Effective November 30, 2010, new or additional investments in Class B shares are no longer permitted. Existing shareholders of Class B shares may continue to reinvest dividends and capital gains distributions in Class B shares until they convert to Class A shares.
16 Invesco Convertible Securities Fund
Also, shareholders in Class B shares will be able to exchange those shares for Class B shares of other Invesco Funds offering such shares until they convert to Class A shares. Generally, Class B shares will automatically convert to Class A shares on or about the month-end, which is at least eight years after the date of purchase. Redemption of Class B shares prior to the conversion date will be subject to a CDSC. Effective January 26, 2018, all of the Fund’s outstanding Class B shares were converted to Class A shares, in advance of their normally scheduled conversion. No CDSC was paid in connection with this early conversion.
The Fund is an investment company and accordingly follows the investment company accounting and reporting guidance in accordance with Financial Accounting Standards Board Accounting Standards Codification Topic 946, Financial Services — Investment Companies.
The following is a summary of the significant accounting policies followed by the Fund in the preparation of its financial statements.
| A. | Security Valuations — Securities, including restricted securities, are valued according to the following policy. |
Debt obligations (including convertible securities) and unlisted equities are fair valued using an evaluated quote provided by an independent pricing service. Evaluated quotes provided by the pricing service may be determined without exclusive reliance on quoted prices, and may reflect appropriate factors such as institution-size trading in similar groups of securities, developments related to specific securities, dividend rate (for unlisted equities), yield (for debt obligations), quality, type of issue, coupon rate (for debt obligations), maturity (for debt obligations), individual trading characteristics and other market data. Pricing services generally value debt obligations assuming orderly transactions of institutional round lot size, but a fund may hold or transact in the same securities in smaller, odd lot sizes. Odd lots often trade at lower prices than institutional round lots. Debt obligations are subject to interest rate and credit risks. In addition, all debt obligations involve some risk of default with respect to interest and/or principal payments.
A security listed or traded on an exchange (except convertible securities) is valued at its last sales price or official closing price as of the close of the customary trading session on the exchange where the security is principally traded, or lacking any sales or official closing price on a particular day, the security may be valued at the closing bid price on that day. Securities traded in the over-the-counter market are valued based on prices furnished by independent pricing services or market makers. When such securities are valued by an independent pricing service they may be considered fair valued. Futures contracts are valued at the final settlement price set by an exchange on which they are principally traded. Listed options are valued at the mean between the last bid and asked prices from the exchange on which they are principally traded. Options not listed on an exchange are valued by an independent source at the mean between the last bid and asked prices. For purposes of determining net asset value (“NAV”) per share, futures and option contracts generally are valued 15 minutes after the close of the customary trading session of the New York Stock Exchange (“NYSE”).
Investments in open-end and closed-end registered investment companies that do not trade on an exchange are valued at the end-of-day net asset value per share. Investments in open-end and closed-end registered investment companies that trade on an exchange are valued at the last sales price or official closing price as of the close of the customary trading session on the exchange where the security is principally traded.
Foreign securities’ (including foreign exchange contracts) prices are converted into U.S. dollar amounts using the applicable exchange rates as of the close of the NYSE. If market quotations are available and reliable for foreign exchange-traded equity securities, the securities will be valued at the market quotations. Because trading hours for certain foreign securities end before the close of the NYSE, closing market quotations may become unreliable. If between the time trading ends on a particular security and the close of the customary trading session on the NYSE, events occur that the investment adviser determines are significant and make the closing price unreliable, the Fund may fair value the security. If the event is likely to have affected the closing price of the security, the security will be valued at fair value in good faith using procedures approved by the Board of Trustees. Adjustments to closing prices to reflect fair value may also be based on a screening process of an independent pricing service to indicate the degree of certainty, based on historical data, that the closing price in the principal market where a foreign security trades is not the current value as of the close of the NYSE. Foreign securities’ prices meeting the approved degree of certainty that the price is not reflective of current value will be priced at the indication of fair value from the independent pricing service. Multiple factors may be considered by the independent pricing service in determining adjustments to reflect fair value and may include information relating to sector indices, American Depositary Receipts and domestic and foreign index futures. Foreign securities may have additional risks including exchange rate changes, potential for sharply devalued currencies and high inflation, political and economic upheaval, the relative lack of issuer information, relatively low market liquidity and the potential lack of strict financial and accounting controls and standards.
Securities for which market prices are not provided by any of the above methods may be valued based upon quotes furnished by independent sources. The last bid price may be used to value equity securities. The mean between the last bid and asked prices is used to value debt obligations, including corporate loans.
Securities for which market quotations are not readily available or became unreliable are valued at fair value as determined in good faith by or under the supervision of the Trust’s officers following procedures approved by the Board of Trustees. Issuer specific events, market trends, bid/asked quotes of brokers and information providers and other market data may be reviewed in the course of making a good faith determination of a security’s fair value.
The Fund may invest in securities that are subject to interest rate risk, meaning the risk that the prices will generally fall as interest rates rise and, conversely, the prices will generally rise as interest rates fall. Specific securities differ in their sensitivity to changes in interest rates depending on their individual characteristics. Changes in interest rates may result in increased market volatility, which may affect the value and/or liquidity of certain Fund investments.
Valuations change in response to many factors including the historical and prospective earnings of the issuer, the value of the issuer’s assets, general economic conditions, interest rates, investor perceptions and market liquidity. Because of the inherent uncertainties of valuation, the values reflected in the financial statements may materially differ from the value received upon actual sale of those investments.
| B. | Securities Transactions and Investment Income — Securities transactions are accounted for on a trade date basis. Realized gains or losses on sales are computed on the basis of specific identification of the securities sold. Interest income (net of withholding tax, if any) is recorded on the accrual basis from settlement date. Bond premiums and discounts are amortized and/or accreted over the lives of the respective securities. Pay-in-kind interest income and non-cash dividend income received in the form of securities in-lieu of cash are recorded at the fair value of the securities received. Paydown gains and losses on mortgage and asset-backed securities are recorded as adjustments to interest income. Dividend income (net of withholding tax, if any) is recorded on the ex-dividend date. |
17 Invesco Convertible Securities Fund
The Fund may periodically participate in litigation related to Fund investments. As such, the Fund may receive proceeds from litigation settlements. Any proceeds received are included in the Statement of Operations as realized gain (loss) for investments no longer held and as unrealized gain (loss) for investments still held.
Brokerage commissions and mark ups are considered transaction costs and are recorded as an increase to the cost basis of securities purchased and/or a reduction of proceeds on a sale of securities. Such transaction costs are included in the determination of net realized and unrealized gain (loss) from investment securities reported in the Statement of Operations and the Statement of Changes in Net Assets and the net realized and unrealized gains (losses) on securities per share in the Financial Highlights. Transaction costs are included in the calculation of the Fund’s net asset value and, accordingly, they reduce the Fund’s total returns. These transaction costs are not considered operating expenses and are not reflected in net investment income reported in the Statement of Operations and the Statement of Changes in Net Assets, or the net investment income per share and the ratios of expenses and net investment income reported in the Financial Highlights, nor are they limited by any expense limitation arrangements between the Fund and the investment adviser.
The Fund allocates income and realized and unrealized capital gains and losses to a class based on the relative net assets of each class.
| C. | Country Determination — For the purposes of making investment selection decisions and presentation in the Schedule of Investments, the investment adviser may determine the country in which an issuer is located and/or credit risk exposure based on various factors. These factors include the laws of the country under which the issuer is organized, where the issuer maintains a principal office, the country in which the issuer derives 50% or more of its total revenues and the country that has the primary market for the issuer’s securities, as well as other criteria. Among the other criteria that may be evaluated for making this determination are the country in which the issuer maintains 50% or more of its assets, the type of security, financial guarantees and enhancements, the nature of the collateral and the sponsor organization. Country of issuer and/or credit risk exposure has been determined to be the United States of America, unless otherwise noted. |
| D. | Distributions — Distributions from net investment income, if any, are declared and paid quarterly and are recorded on the ex-dividend date. Distributions from net realized capital gain, if any, are generally declared and paid annually and recorded on the ex-dividend date. The Fund may elect to treat a portion of the proceeds from redemptions as distributions for federal income tax purposes. |
| E. | Federal Income Taxes — The Fund intends to comply with the requirements of Subchapter M of the Internal Revenue Code of 1986, as amended (the “Internal Revenue Code”), necessary to qualify as a regulated investment company and to distribute substantially all of the Fund’s taxable earnings to shareholders. As such, the Fund will not be subject to federal income taxes on otherwise taxable income (including net realized capital gain) that is distributed to shareholders. Therefore, no provision for federal income taxes is recorded in the financial statements. |
The Fund recognizes the tax benefits of uncertain tax positions only when the position is more likely than not to be sustained. Management has analyzed the Fund’s uncertain tax positions and concluded that no liability for unrecognized tax benefits should be recorded related to uncertain tax positions. Management is not aware of any tax positions for which it is reasonably possible that the total amounts of unrecognized tax benefits will change materially in the next 12 months.
The Fund files tax returns in the U.S. Federal jurisdiction and certain other jurisdictions. Generally, the Fund is subject to examinations by such taxing authorities for up to three years after the filing of the return for the tax period.
| F. | Expenses — Fees provided for under the Rule 12b-1 plan of a particular class of the Fund are charged to the operations of such class. Transfer agency fees and expenses and other shareholder recordkeeping fees and expenses attributable to Class R5 and Class R6 are allocated to each share class based on relative net assets. Sub-accounting fees attributable to Class R5 are charged to the operations of the class. Transfer agency fees and expenses and other shareholder recordkeeping fees and expenses relating to all other classes are allocated among those classes based on relative net assets. All other expenses are allocated among the classes based on relative net assets. |
| G. | Accounting Estimates — The preparation of financial statements in conformity with accounting principles generally accepted in the United States of America (“GAAP”) requires management to make estimates and assumptions that affect the reported amounts of assets and liabilities at the date of the financial statements and the reported amounts of revenues and expenses during the reporting period including estimates and assumptions related to taxation. Actual results could differ from those estimates by a significant amount. In addition, the Fund monitors for material events or transactions that may occur or become known after the period-end date and before the date the financial statements are released to print. |
| H. | Indemnifications — Under the Trust’s organizational documents, each Trustee, officer, employee or other agent of the Trust is indemnified against certain liabilities that may arise out of the performance of their duties to the Fund. Additionally, in the normal course of business, the Fund enters into contracts, including the Fund’s servicing agreements, that contain a variety of indemnification clauses. The Fund’s maximum exposure under these arrangements is unknown as this would involve future claims that may be made against the Fund that have not yet occurred. The risk of material loss as a result of such indemnification claims is considered remote. |
NOTE 2—Advisory Fees and Other Fees Paid to Affiliates
The Trust has entered into a master investment advisory agreement with Invesco Advisers, Inc. (the “Adviser” or “Invesco”). Under the terms of the investment advisory agreement, the Fund accrues daily and pays monthly an advisory fee to the Adviser based on the annual rate of the Fund’s average daily net assets as follows:
| Average Daily Net Assets | Rate | |||||||
First $750 million | 0 | .52% | ||||||
Next $250 million | 0 | .47% | ||||||
Next $500 million | 0 | .42% | ||||||
Next $500 million | 0 | .395% | ||||||
Next $1 billion | 0 | .37% | ||||||
Over $3 billion | 0 | .345% | ||||||
18 Invesco Convertible Securities Fund
For the year ended December 31, 2017, the effective advisory fees incurred by the Fund was 0.48%.
Under the terms of a master sub-advisory agreement between the Adviser and each of Invesco Asset Management Deutschland GmbH, Invesco Asset Management Limited, Invesco Asset Management (Japan) Limited, Invesco Hong Kong Limited, Invesco Senior Secured Management, Inc. and Invesco Canada Ltd. and separate sub-advisory agreements with Invesco PowerShares Capital Management LLC and Invesco Asset Management (India) Private Limited (collectively, the “Affiliated Sub-Advisers”) the Adviser, not the Fund, will pay 40% of the fees paid to the Adviser to any such Affiliated Sub-Adviser(s) that provide(s) discretionary investment management services to the Fund based on the percentage of assets allocated to such Affiliated Sub-Adviser(s).
The Adviser has contractually agreed, through at least June 30, 2018, to waive advisory fees and/or reimburse expenses of all shares to the extent necessary to limit total annual fund operating expenses after fee waiver and/or expense reimbursement (excluding certain items discussed below) of Class A, Class B, Class C, Class Y, Class R5 and Class R6 shares to 1.50%, 2.25%, 2.25%, 1.25%, 1.25% and 1.25%, respectively, of average daily net assets (the “expense limits”). In determining the Adviser’s obligation to waive advisory fees and/or reimburse expenses, the following expenses are not taken into account, and could cause the total annual fund operating expenses after fee waiver and/or expense reimbursement to exceed the numbers reflected above: (1) interest; (2) taxes; (3) dividend expense on short sales; (4) extraordinary or non-routine items, including litigation expenses; and (5) expenses that the Fund has incurred but did not actually pay because of an expense offset arrangement. Unless Invesco continues the fee waiver agreement, it will terminate on June 30, 2018. During its term, the fee waiver agreement cannot be terminated or amended to increase the expense limits without approval of the Board of Trustees. The Adviser did not waive fees and/or reimburse expenses during the period under these expense limits.
Further, the Adviser has contractually agreed, through at least June 30, 2019, to waive the advisory fee payable by the Fund in an amount equal to 100% of the net advisory fees the Adviser receives from the affiliated money market funds on investments by the Fund of uninvested cash in such affiliated money market funds.
For the year ended December 31, 2017, the Adviser waived advisory fees of $46,282.
The Trust has entered into a master administrative services agreement with Invesco pursuant to which the Fund has agreed to pay Invesco for certain administrative costs incurred in providing accounting services to the Fund. For the year ended December 31, 2017, expenses incurred under the agreement are shown in the Statement of Operations as Administrative services fees.
The Trust has entered into a transfer agency and service agreement with Invesco Investment Services, Inc. (“IIS”) pursuant to which the Fund has agreed to pay IIS a fee for providing transfer agency and shareholder services to the Fund and reimburse IIS for certain expenses incurred by IIS in the course of providing such services. IIS may make payments to intermediaries that provide omnibus account services, sub-accounting services and/or networking services. All fees payable by IIS to intermediaries that provide omnibus account services or sub-accounting services are charged back to the Fund, subject to certain limitations approved by the Trust’s Board of Trustees. For the year ended December 31, 2017, expenses incurred under the agreement are shown in the Statement of Operations as Transfer agent fees.
Shares of the Fund are distributed by Invesco Distributors, Inc. (“IDI”), an affiliate of the Adviser. The Fund has adopted a Plan of Distribution (the “Plan”) pursuant to Rule 12b-1 under the 1940 Act. The Plan provides that the Fund will reimburse IDI for distribution related expenses that IDI incurs up to a maximum of the following annual rates: (1) Class A — up to 0.25% of the average daily net assets of Class A shares; (2) Class B — up to 1.00% of the average daily net assets of Class B shares; and (3) Class C — up to 1.00% of the average daily net assets of Class C shares. The fees are accrued daily and paid monthly.
In the case of Class B shares, provided that the Plan continues in effect, any cumulative expenses incurred by IDI, but not yet reimbursed to IDI, may be recovered through the payment of future distribution fees from the Fund pursuant to the Plan and contingent deferred sales charges paid by investors upon redemption of Class B shares.
For the year ended December 31, 2017, expenses incurred under these agreements are shown in the Statement of Operations as Distribution fees.
Front-end sales commissions and CDSC (collectively, the “sales charges”) are not recorded as expenses of the Fund. Front-end sales commissions are deducted from proceeds from the sales of Fund shares prior to investment in Class A shares of the Fund. CDSC are deducted from redemption proceeds prior to remittance to the shareholder. During the year ended December 31, 2017, IDI advised the Fund that IDI retained $53,042 in front-end sales commissions from the sale of Class A shares and $892 and $3,926 from Class A and Class C shares, respectively, for CDSC imposed on redemptions by shareholders.
Certain officers and trustees of the Trust are officers and directors of the Adviser, IIS and/or IDI.
NOTE 3—Additional Valuation Information
GAAP defines fair value as the price that would be received to sell an asset or paid to transfer a liability in an orderly transaction between market participants at the measurement date, under current market conditions. GAAP establishes a hierarchy that prioritizes the inputs to valuation methods, giving the highest priority to readily available unadjusted quoted prices in an active market for identical assets (Level 1) and the lowest priority to significant unobservable inputs (Level 3), generally when market prices are not readily available or are unreliable. Based on the valuation inputs, the securities or other investments are tiered into one of three levels. Changes in valuation methods may result in transfers in or out of an investment’s assigned level:
| Level 1 — | Prices are determined using quoted prices in an active market for identical assets. |
| Level 2 — | Prices are determined using other significant observable inputs. Observable inputs are inputs that other market participants may use in pricing a security. These may include quoted prices for similar securities, interest rates, prepayment speeds, credit risk, yield curves, loss severities, default rates, discount rates, volatilities and others. |
| Level 3 — | Prices are determined using significant unobservable inputs. In situations where quoted prices or observable inputs are unavailable (for example, when there is little or no market activity for an investment at the end of the period), unobservable inputs may be used. Unobservable inputs reflect the Fund’s own assumptions about the factors market participants would use in determining fair value of the securities or instruments and would be based on the best available information. |
The following is a summary of the tiered valuation input levels, as of December 31, 2017. The level assigned to the securities valuations may not be an indication of the risk or liquidity associated with investing in those securities. Because of the inherent uncertainties of valuation, the values reflected in the financial statements may materially differ from the value received upon actual sale of those investments.
19 Invesco Convertible Securities Fund
The Fund’s policy is to recognize transfers in and out of the valuation levels as of the end of the reporting period. During the year ended December 31, 2017, there were no material transfers between valuation levels.
| Level 1 | Level 2 | Level 3 | Total | |||||||||||||
| Investments in Securities | ||||||||||||||||
Bonds & Notes | $ | — | $ | 1,091,215,597 | $ | — | $ | 1,091,215,597 | ||||||||
Preferred Stocks | 153,317,190 | 64,738,942 | — | 218,056,132 | ||||||||||||
Common Stocks | 16,042,557 | — | — | 16,042,557 | ||||||||||||
Money Market Funds | 51,246,782 | — | — | 51,246,782 | ||||||||||||
Total Investments | $ | 220,606,529 | $ | 1,155,954,539 | $ | — | $ | 1,376,561,068 | ||||||||
NOTE 4—Expense Offset Arrangement(s)
The expense offset arrangement is comprised of transfer agency credits which result from balances in demand deposit accounts used by the transfer agent for clearing shareholder transactions. For the year ended December 31, 2017, the Fund received credits from this arrangement, which resulted in the reduction of the Fund’s total expenses of $5,442.
NOTE 5—Trustees’ and Officers’ Fees and Benefits
Trustees’ and Officers’ Fees and Benefits include amounts accrued by the Fund to pay remuneration to certain Trustees and Officers of the Fund. Trustees have the option to defer compensation payable by the Fund, and Trustees’ and Officers’ Fees and Benefits also include amounts accrued by the Fund to fund such deferred compensation amounts. Those Trustees who defer compensation have the option to select various Invesco Funds in which their deferral accounts shall be deemed to be invested. Finally, certain current Trustees were eligible to participate in a retirement plan that provided for benefits to be paid upon retirement to Trustees over a period of time based on the number of years of service. The Fund may have certain former Trustees who also participate in a retirement plan and receive benefits under such plan. Trustees’ and Officers’ Fees and Benefits include amounts accrued by the Fund to fund such retirement benefits. Obligations under the deferred compensation and retirement plans represent unsecured claims against the general assets of the Fund.
NOTE 6—Cash Balances
The Fund is permitted to temporarily carry a negative or overdrawn balance in its account with State Street Bank and Trust Company, the custodian bank. Such balances, if any at period-end, are shown in the Statement of Assets and Liabilities under the payable caption Amount due custodian. To compensate the custodian bank for such overdrafts, the overdrawn Fund may either (1) leave funds as a compensating balance in the account so the custodian bank can be compensated by earning the additional interest; or (2) compensate by paying the custodian bank at a rate agreed upon by the custodian bank and Invesco, not to exceed the contractually agreed upon rate.
NOTE 7—Distributions to Shareholders and Tax Components of Net Assets
Tax Character of Distributions to Shareholders Paid During the Fiscal Years Ended December 31, 2017 and 2016:
| 2017 | 2016 | |||||||
Ordinary income | $ | 63,437,627 | $ | 57,297,499 | ||||
Tax Components of Net Assets at Period-End:
| 2017 | ||||
Undistributed ordinary income | $ | 20,450,940 | ||
Undistributed long-term gain | 10,664,742 | |||
Net unrealized appreciation — investments | 127,694,495 | |||
Temporary book/tax differences | (170,327 | ) | ||
Shares of beneficial interest | 1,223,117,981 | |||
Total net assets | $ | 1,381,757,831 | ||
The difference between book-basis and tax-basis unrealized appreciation (depreciation) is due to differences in the timing of recognition of gains and losses on investments for tax and book purposes. The Fund’s net unrealized appreciation difference is attributable primarily to wash sales, bond premium amortization, deemed dividends and convertible preferred debt instruments.
The temporary book/tax differences are a result of timing differences between book and tax recognition of income and/or expenses. The Fund’s temporary book/tax differences are the result of the trustee deferral of compensation and retirement plan benefits.
Capital loss carryforward is calculated and reported as of a specific date. Results of transactions and other activity after that date may affect the amount of capital loss carryforward actually available for the Fund to utilize. Capital losses generated in years beginning after December 22, 2010 can be carried forward for an unlimited period, whereas previous losses expire in eight tax years. Capital losses with an expiration period may not be used to offset capital gains until all net capital losses without an expiration date have been utilized. Capital loss carryforwards with no expiration date will retain their character as either short-term or long-term capital losses instead of as short-term capital losses as under prior law. The ability to utilize capital loss carryforwards in the future may be limited under the Internal Revenue Code and related regulations based on the results of future transactions.
The Fund does not have a capital loss carryforward as of December 31, 2017.
20 Invesco Convertible Securities Fund
NOTE 8—Investment Transactions
The aggregate amount of investment securities (other than short-term securities, U.S. Treasury obligations and money market funds, if any) purchased and sold by the Fund during the year ended December 31, 2017 was $551,048,465 and $820,868,042, respectively. Cost of investments, including any derivatives, on a tax basis includes the adjustments for financial reporting purposes as of the most recently completed federal income tax reporting period-end.
| Unrealized Appreciation (Depreciation) of Investments on a Tax Basis | ||||
Aggregate unrealized appreciation of investments | $ | 152,914,602 | ||
Aggregate unrealized (depreciation) of investments | (25,220,107 | ) | ||
Net unrealized appreciation of investments | $ | 127,694,495 | ||
Cost of investments for tax purposes is $1,248,866,573.
NOTE 9—Reclassification of Permanent Differences
Primarily as a result of differing book/tax treatment of convertible preferred debt instruments, deemed dividends and bond premium amortization, on December 31, 2017, undistributed net investment income was increased by $21,593,580 and undistributed net realized gain was decreased by $21,593,580. This reclassification had no effect on the net assets of the Fund.
21 Invesco Convertible Securities Fund
NOTE 10—Share Information
| Summary of Share Activity | ||||||||||||||||
| Years ended December 31, | ||||||||||||||||
| 2017(a) | 2016 | |||||||||||||||
| Shares | Amount | Shares | Amount | |||||||||||||
Sold: |
| |||||||||||||||
Class A | 2,179,700 | $ | 52,271,355 | 11,606,844 | $ | 266,227,183 | ||||||||||
Class B | 536 | 12,767 | 407 | 9,474 | ||||||||||||
Class C | 256,763 | 6,128,554 | 344,133 | 7,647,315 | ||||||||||||
Class Y | 9,351,883 | 224,461,048 | 17,263,111 | 377,851,687 | ||||||||||||
Class R5 | 27,109 | 661,583 | 112,023 | 2,556,000 | ||||||||||||
Class R6 | 991,990 | 24,007,472 | 100,037 | 2,248,726 | ||||||||||||
Issued as reinvestment of dividends: |
| |||||||||||||||
Class A | 1,129,411 | 27,038,270 | 934,311 | 21,185,871 | ||||||||||||
Class B | 1,687 | 40,444 | 2,458 | 55,694 | ||||||||||||
Class C | 132,898 | 3,165,614 | 151,791 | 3,415,971 | ||||||||||||
Class Y | 880,636 | 21,124,550 | 834,059 | 18,901,064 | ||||||||||||
Class R5 | 1,318 | 31,639 | 1,969 | 45,007 | ||||||||||||
Class R6 | 34,322 | 824,157 | 25,978 | 586,290 | ||||||||||||
Automatic conversion of Class B shares to Class A shares: |
| |||||||||||||||
Class A | 37,822 | 913,062 | 28,386 | 640,885 | ||||||||||||
Class B | (37,735 | ) | (913,062 | ) | (28,324 | ) | (640,885 | ) | ||||||||
Reacquired: |
| |||||||||||||||
Class A | (10,597,129 | ) | (254,069,405 | ) | (11,963,827 | ) | (267,329,291 | ) | ||||||||
Class B | (10,633 | ) | (254,188 | ) | (35,594 | ) | (801,061 | ) | ||||||||
Class C | (2,165,004 | ) | (51,468,100 | ) | (3,138,681 | ) | (70,258,970 | ) | ||||||||
Class Y | (10,534,371 | ) | (252,710,821 | ) | (42,379,180 | ) | (938,640,128 | ) | ||||||||
Class R5 | (189,591 | ) | (4,521,812 | ) | (60,796 | ) | (1,335,640 | ) | ||||||||
Class R6 | (122,298 | ) | (2,968,096 | ) | (264,646 | ) | (6,073,956 | ) | ||||||||
Net increase (decrease) in share activity | (8,630,686 | ) | $ | (206,224,969 | ) | (26,465,541 | ) | $ | (583,708,764 | ) | ||||||
| (a) | There are entities that are record owners of more than 5% of the outstanding shares of the Fund and in the aggregate own 53% of the outstanding shares of the Fund. IDI has an agreement with these entities to sell Fund shares. The Fund, Invesco and/or Invesco affiliates may make payments to these entities, which are considered to be related to the Fund, for providing services to the Fund, Invesco and/or Invesco affiliates including but not limited to services such as securities brokerage, distribution, third party record keeping and account servicing. The Fund has no knowledge as to whether all or any portion of the shares owned of record by these entities are also owned beneficially. |
22 Invesco Convertible Securities Fund
NOTE 11—Financial Highlights
The following schedule presents financial highlights for a share of the Fund outstanding throughout the periods indicated.
| Net asset value, beginning of period | Net investment income(a) | Net gains (losses) on securities (both realized and unrealized) | Total from investment operations | Dividends from net investment income | Distributions from net realized gains | Total distributions | Net asset value, end of period | Total return(b) | Net assets, end of period (000’s omitted) | Ratio of expenses to average net assets with fee waivers and/or expenses absorbed | Ratio of expenses to average net assets without fee waivers and/or expenses absorbed | Ratio of net investment income to average net assets | Portfolio turnover(c) | |||||||||||||||||||||||||||||||||||||||||||
Class A | ||||||||||||||||||||||||||||||||||||||||||||||||||||||||
Year ended 12/31/17 | $ | 23.10 | $ | 0.33 | $ | 2.04 | $ | 2.37 | $ | (1.01 | ) | $ | (0.05 | ) | $ | (1.06 | ) | $ | 24.41 | 10.42 | %(d) | $ | 653,121 | 0.93 | %(d)(e) | 0.93 | %(d)(e) | 1.36 | %(d)(e) | 39 | % | |||||||||||||||||||||||||
Year ended 12/31/16 | 22.62 | 0.39 | 0.90 | 1.29 | (0.81 | ) | — | (0.81 | ) | 23.10 | 5.82 | (f) | 785,526 | 0.88 | (f) | 0.89 | (f) | 1.74 | (f) | 42 | ||||||||||||||||||||||||||||||||||||
Year ended 12/31/15 | 23.88 | 0.30 | (1.00 | ) | (0.70 | ) | (0.56 | ) | — | (0.56 | ) | 22.62 | (3.02 | )(g) | 755,534 | 0.86 | (g) | 0.87 | (g) | 1.26 | (g) | 45 | ||||||||||||||||||||||||||||||||||
Year ended 12/31/14 | 24.17 | 0.32 | 0.63 | 0.95 | (0.52 | ) | (0.72 | ) | (1.24 | ) | 23.88 | 3.95 | (h) | 980,513 | 0.84 | (h) | 0.85 | (h) | 1.29 | (h) | 56 | |||||||||||||||||||||||||||||||||||
Year ended 12/31/13 | 20.88 | 0.55 | (i) | 3.84 | 4.39 | (0.53 | ) | (0.57 | ) | (1.10 | ) | 24.17 | 21.31 | (j) | 936,425 | 0.88 | (j) | 0.89 | (j) | 2.40 | (i)(j) | 45 | ||||||||||||||||||||||||||||||||||
Class B | ||||||||||||||||||||||||||||||||||||||||||||||||||||||||
Year ended 12/31/17 | 23.17 | 0.15 | 2.05 | 2.20 | (0.83 | ) | (0.05 | ) | (0.88 | ) | 24.49 | 9.60 | (d) | 799 | 1.69 | (d)(e) | 1.69 | (d)(e) | 0.60 | (d)(e) | 39 | |||||||||||||||||||||||||||||||||||
Year ended 12/31/16 | 22.69 | 0.22 | 0.90 | 1.12 | (0.64 | ) | — | (0.64 | ) | 23.17 | 5.00 | (f) | 1,825 | 1.64 | (f) | 1.65 | (f) | 0.98 | (f) | 42 | ||||||||||||||||||||||||||||||||||||
Year ended 12/31/15 | 23.95 | 0.12 | (1.00 | ) | (0.88 | ) | (0.38 | ) | — | (0.38 | ) | 22.69 | (3.74 | )(g) | 3,172 | 1.62 | (g) | 1.63 | (g) | 0.50 | (g) | 45 | ||||||||||||||||||||||||||||||||||
Year ended 12/31/14 | 24.24 | 0.13 | 0.63 | 0.76 | (0.33 | ) | (0.72 | ) | (1.05 | ) | 23.95 | 3.16 | (h) | 5,642 | 1.60 | (h) | 1.61 | (h) | 0.53 | (h) | 56 | |||||||||||||||||||||||||||||||||||
Year ended 12/31/13 | 20.93 | 0.38 | (i) | 3.86 | 4.24 | (0.36 | ) | (0.57 | ) | (0.93 | ) | 24.24 | 20.45 | (j) | 7,167 | 1.64 | (j) | 1.65 | (j) | 1.64 | (i)(j) | 45 | ||||||||||||||||||||||||||||||||||
Class C | ||||||||||||||||||||||||||||||||||||||||||||||||||||||||
Year ended 12/31/17 | 23.00 | 0.15 | 2.03 | 2.18 | (0.83 | ) | (0.05 | ) | (0.88 | ) | 24.30 | 9.57 | (d) | 95,218 | 1.69 | (d)(e) | 1.69 | (d)(e) | 0.60 | (d)(e) | 39 | |||||||||||||||||||||||||||||||||||
Year ended 12/31/16 | 22.52 | 0.22 | 0.90 | 1.12 | (0.64 | ) | — | (0.64 | ) | 23.00 | 5.07 | (f) | 130,934 | 1.61 | (f) | 1.62 | (f) | 1.01 | (f) | 42 | ||||||||||||||||||||||||||||||||||||
Year ended 12/31/15 | 23.77 | 0.14 | (0.99 | ) | (0.85 | ) | (0.40 | ) | — | (0.40 | ) | 22.52 | (3.67 | )(g) | 187,743 | 1.54 | (g) | 1.55 | (g) | 0.58 | (g) | 45 | ||||||||||||||||||||||||||||||||||
Year ended 12/31/14 | 24.04 | 0.16 | 0.62 | 0.78 | (0.33 | ) | (0.72 | ) | (1.05 | ) | 23.77 | 3.30 | (h) | 232,065 | 1.48 | (h) | 1.49 | (h) | 0.65 | (h) | 56 | |||||||||||||||||||||||||||||||||||
Year ended 12/31/13 | 20.78 | 0.38 | (i) | 3.81 | 4.19 | (0.36 | ) | (0.57 | ) | (0.93 | ) | 24.04 | 20.37 | (j) | 172,232 | 1.64 | (j) | 1.65 | (j) | 1.64 | (i)(j) | 45 | ||||||||||||||||||||||||||||||||||
Class Y | ||||||||||||||||||||||||||||||||||||||||||||||||||||||||
Year ended 12/31/17 | 23.13 | 0.39 | 2.04 | 2.43 | (1.07 | ) | (0.05 | ) | (1.12 | ) | 24.44 | 10.68 | 594,284 | 0.69 | (e) | 0.69 | (e) | 1.60 | (e) | 39 | ||||||||||||||||||||||||||||||||||||
Year ended 12/31/16 | 22.65 | 0.44 | 0.90 | 1.34 | (0.86 | ) | — | (0.86 | ) | 23.13 | 6.07 | 569,345 | 0.64 | 0.65 | 1.98 | 42 | ||||||||||||||||||||||||||||||||||||||||
Year ended 12/31/15 | 23.91 | 0.36 | (1.00 | ) | (0.64 | ) | (0.62 | ) | — | (0.62 | ) | 22.65 | (2.78 | ) | 1,107,497 | 0.62 | 0.63 | 1.50 | 45 | |||||||||||||||||||||||||||||||||||||
Year ended 12/31/14 | 24.20 | 0.38 | 0.63 | 1.01 | (0.58 | ) | (0.72 | ) | (1.30 | ) | 23.91 | 4.20 | 1,043,554 | 0.60 | 0.61 | 1.53 | 56 | |||||||||||||||||||||||||||||||||||||||
Year ended 12/31/13 | 20.90 | 0.61 | (i) | 3.84 | 4.45 | (0.58 | ) | (0.57 | ) | (1.15 | ) | 24.20 | 21.62 | 719,722 | 0.64 | 0.65 | 2.64 | (i) | 45 | |||||||||||||||||||||||||||||||||||||
Class R5 | ||||||||||||||||||||||||||||||||||||||||||||||||||||||||
Year ended 12/31/17 | 23.11 | 0.39 | 2.06 | 2.45 | (1.08 | ) | (0.05 | ) | (1.13 | ) | 24.43 | 10.78 | 1,585 | 0.64 | (e) | 0.64 | (e) | 1.65 | (e) | 39 | ||||||||||||||||||||||||||||||||||||
Year ended 12/31/16 | 22.63 | 0.45 | 0.90 | 1.35 | (0.87 | ) | — | (0.87 | ) | 23.11 | 6.10 | 5,225 | 0.62 | 0.63 | 2.00 | 42 | ||||||||||||||||||||||||||||||||||||||||
Year ended 12/31/15 | 23.89 | 0.37 | (1.00 | ) | (0.63 | ) | (0.63 | ) | — | (0.63 | ) | 22.63 | (2.75 | ) | 3,912 | 0.57 | 0.58 | 1.55 | 45 | |||||||||||||||||||||||||||||||||||||
Year ended 12/31/14 | 24.18 | 0.40 | 0.63 | 1.03 | (0.60 | ) | (0.72 | ) | (1.32 | ) | 23.89 | 4.28 | 6,615 | 0.53 | 0.54 | 1.60 | 56 | |||||||||||||||||||||||||||||||||||||||
Year ended 12/31/13 | 20.88 | 0.63 | (i) | 3.84 | 4.47 | (0.60 | ) | (0.57 | ) | (1.17 | ) | 24.18 | 21.72 | 4,781 | 0.57 | 0.58 | 2.71 | (i) | 45 | |||||||||||||||||||||||||||||||||||||
Class R6 | ||||||||||||||||||||||||||||||||||||||||||||||||||||||||
Year ended 12/31/17 | 23.12 | 0.42 | 2.04 | 2.46 | (1.10 | ) | (0.05 | ) | (1.15 | ) | 24.43 | 10.82 | 36,751 | 0.57 | (e) | 0.57 | (e) | 1.72 | (e) | 39 | ||||||||||||||||||||||||||||||||||||
Year ended 12/31/16 | 22.64 | 0.47 | 0.90 | 1.37 | (0.89 | ) | — | (0.89 | ) | 23.12 | 6.21 | 13,880 | 0.52 | 0.53 | 2.10 | 42 | ||||||||||||||||||||||||||||||||||||||||
Year ended 12/31/15 | 23.90 | 0.39 | (1.00 | ) | (0.61 | ) | (0.65 | ) | — | (0.65 | ) | 22.64 | (2.66 | ) | 16,731 | 0.49 | 0.50 | 1.63 | 45 | |||||||||||||||||||||||||||||||||||||
Year ended 12/31/14 | 24.18 | 0.41 | 0.64 | 1.05 | (0.61 | ) | (0.72 | ) | (1.33 | ) | 23.90 | 4.35 | 16,598 | 0.49 | 0.50 | 1.64 | 56 | |||||||||||||||||||||||||||||||||||||||
Year ended 12/31/13 | 20.89 | 0.64 | (i) | 3.83 | 4.47 | (0.61 | ) | (0.57 | ) | (1.18 | ) | 24.18 | 21.69 | 64 | 0.55 | 0.56 | 2.73 | (i) | 45 | |||||||||||||||||||||||||||||||||||||
| (a) | Calculated using average shares outstanding. |
| (b) | Includes adjustments in accordance with accounting principles generally accepted in the United States of America and as such, the net asset value for financial reporting purposes and the returns based upon those net asset values may differ from the net asset value and returns for shareholder transactions. Does not include sales charges and is not annualized for periods less than one year, if applicable. |
| (c) | Portfolio turnover is calculated at the fund level and is not annualized for periods less than one year, if applicable. |
| (d) | The total return, ratio of expenses to average net assets and ratio of net investment income to average net assets reflect actual 12b-1 fees of 0.24%, 1.00% and 1.00% for Class A, Class B and Class C shares, respectively. |
| (e) | Ratios are based on average daily net assets (000’s omitted) of $703,844, $1,361, $107,629, $609,378, $2,379 and $21,306 for Class A, Class B, Class C, Class Y, Class R5 and Class R6 shares, respectively. |
| (f) | The total return, ratio of expenses to average net assets and ratio of net investment income to average net assets reflect actual 12b-1 fees of 0.24%, 1.00% and 0.97% for Class A, Class B and Class C shares, respectively. |
| (g) | The total return, ratio of expenses to average net assets and ratio of net investment income to average net assets reflect actual 12b-1 fees of 0.24%, 1.00% and 0.92% for Class A, Class B and Class C shares, respectively. |
| (h) | The total return, ratio of expenses to average net assets and ratio of net investment income to average net assets reflect actual 12b-1 fees of 0.24%, 1.00% and 0.88% for Class A, Class B and Class C shares, respectively. |
| (i) | Net investment income per share and the ratio of net investment income to average net assets includes significant dividends received during the year ended December 31, 2013. Net investment income per share and the ratio of net investment income to average net assets excluding the significant dividends are $0.42 and 2.39%, $0.25 and 1.63%, $0.25 and 1.63%, $0.48 and 2.63%, $0.50 and 2.70%, $0.51 and 2.72% for Class A, Class B, Class C, Class Y, Class R5 and Class R6 shares, respectively. |
| (j) | The total return, ratio of expenses to average net assets and ratio of net investment income to average net assets reflect actual 12b-1 fees of 0.24%, 1.00% and 1.00% for Class A, Class B and Class C shares, respectively. |
23 Invesco Convertible Securities Fund
Report of Independent Registered Public Accounting Firm
To the Board of Trustees of AIM Growth Series (Invesco Growth Series)
and Shareholders of Invesco Convertible Securities Fund
Opinion on the Financial Statements
We have audited the accompanying statement of assets and liabilities, including the schedule of investments, of Invesco Convertible Securities Fund (one of the funds constituting AIM Growth Series (Invesco Growth Series), hereafter referred to as the “Fund”) as of December 31, 2017, the related statement of operations for the year ended December 31, 2017, the statement of changes in net assets for each of the two years in the period ended December 31, 2017, including the related notes, and the financial highlights for each of the five years in the period ended December 31, 2017 (collectively referred to as the “financial statements”). In our opinion, the financial statements present fairly, in all material respects, the financial position of the Fund as of December 31, 2017, the results of its operations for the year then ended, the changes in its net assets for each of the two years in the period ended December 31, 2017 and the financial highlights for each of the five years in the period ended December 31, 2017 in conformity with accounting principles generally accepted in the United States of America.
Basis for Opinion
These financial statements are the responsibility of the Fund’s management. Our responsibility is to express an opinion on the Fund’s financial statements based on our audits. We are a public accounting firm registered with the Public Company Accounting Oversight Board (United States) (“PCAOB”) and are required to be independent with respect to the Fund in accordance with the U.S. federal securities laws and the applicable rules and regulations of the Securities and Exchange Commission and the PCAOB.
We conducted our audits of these financial statements in accordance with the standards of the PCAOB. Those standards require that we plan and perform the audit to obtain reasonable assurance about whether the financial statements are free of material misstatement, whether due to error or fraud.
Our audits included performing procedures to assess the risks of material misstatement of the financial statements, whether due to error or fraud, and performing procedures that respond to those risks. Such procedures included examining, on a test basis, evidence regarding the amounts and disclosures in the financial statements. Our audits also included evaluating the accounting principles used and significant estimates made by management, as well as evaluating the overall presentation of the financial statements. Our procedures included confirmation of securities owned as of December 31, 2017 by correspondence with the custodian and transfer agent. We believe that our audits provide a reasonable basis for our opinion.
PricewaterhouseCoopers LLP
Houston, TX
February 23, 2018
We have served as the auditor of one or more of the investment companies in the Invesco/PowerShares group of investment companies since at least 1995. We have not determined the specific year we began serving as auditor.
24 Invesco Convertible Securities Fund
Calculating your ongoing Fund expenses
Example
As a shareholder of the Fund, you incur two types of costs: (1) transaction costs, which may include sales charges (loads) on purchase payments or contingent deferred sales charges on redemptions, if any; and (2) ongoing costs, including management fees, distribution and/or service (12b-1) fees, and other Fund expenses. This example is intended to help you understand your ongoing costs (in dollars) of investing in the Fund and to compare these costs with ongoing costs of investing in other mutual funds. The example is based on an investment of $1,000 invested at the beginning of the period and held for the entire period July 1, 2017 through December 31, 2017.
Actual expenses
The table below provides information about actual account values and actual expenses. You may use the information in this table, together with the amount you invested, to estimate the expenses that you paid over the period. Simply divide your account value by $1,000 (for example, an $8,600 account value divided by $1,000 = 8.6), then multiply the result by the number in the table under the heading entitled “Actual Expenses Paid During Period” to estimate the expenses you paid on your account during this period.
Hypothetical example for comparison purposes
The table below also provides information about hypothetical account values and hypothetical expenses based on the Fund’s actual expense ratio and an assumed rate of return of 5% per year before expenses, which is not the Fund’s actual return.
The hypothetical account values and expenses may not be used to estimate the actual ending account balance or expenses you paid for the period. You may use this information to compare the ongoing costs of investing in the Fund and other funds. To do so, compare this 5% hypothetical example with the 5% hypothetical examples that appear in the shareholder reports of the other funds.
Please note that the expenses shown in the table are meant to highlight your ongoing costs only and do not reflect any transaction costs, such as sales charges (loads) on purchase payments or contingent deferred sales charges on redemptions, if any. Therefore, the hypothetical information is useful in comparing ongoing costs only, and will not help you determine the relative total costs of owning different funds. In addition, if these transaction costs were included, your costs would have been higher.
| Class | Beginning Account Value (07/01/17) | ACTUAL | HYPOTHETICAL (5% annual return before | Annualized Expense Ratio | ||||||||||||||||||||
| Ending Account Value (12/31/17)1 | Expenses Paid During Period2 | Ending Account Value (12/31/17) | Expenses Paid During Period2 | |||||||||||||||||||||
A | $ | 1,000.00 | $ | 1,046.90 | $ | 4.85 | $ | 1,020.47 | $ | 4.79 | 0.94 | % | ||||||||||||
B | 1,000.00 | 1,043.20 | 8.75 | 1,016.64 | 8.64 | 1.70 | ||||||||||||||||||
C | 1,000.00 | 1,043.50 | 8.76 | 1,016.64 | 8.64 | 1.70 | ||||||||||||||||||
Y | 1,000.00 | 1,048.60 | 3.61 | 1,021.68 | 3.57 | 0.70 | ||||||||||||||||||
R5 | 1,000.00 | 1,048.40 | 3.25 | 1,022.03 | 3.21 | 0.63 | ||||||||||||||||||
R6 | 1,000.00 | 1,049.20 | 3.00 | 1,022.28 | 2.96 | 0.58 | ||||||||||||||||||
| 1 | The actual ending account value is based on the actual total return of the Fund for the period July 1, 2017 through December 31, 2017, after actual expenses and will differ from the hypothetical ending account value which is based on the Fund’s expense ratio and a hypothetical annual return of 5% before expenses. |
| 2 | Expenses are equal to the Fund’s annualized expense ratio as indicated above multiplied by the average account value over the period, multiplied by 184/365 to reflect the most recent fiscal half year. |
25 �� Invesco Convertible Securities Fund
Tax Information
Form 1099-DIV, Form 1042-S and other year-end tax information provide shareholders with actual calendar year amounts that should be included in their tax returns. Shareholders should consult their tax advisors.
The following distribution information is being provided as required by the Internal Revenue Code or to meet a specific state’s requirement.
The Fund designates the following amounts or, if subsequently determined to be different, the maximum amount allowable for its fiscal year ended December 31, 2017:
Federal and State Income Tax | ||||
Qualified Dividend Income* | 32.85 | % | ||
Corporate Dividends Received Deduction* | 27.29 | % | ||
U.S. Treasury Obligations* | 0.00 | % | ||
| * | The above percentages are based on ordinary income dividends paid to shareholders during the Fund’s fiscal year. |
Non-Resident Alien Shareholders | ||||
Qualified Short-Term Gains | $ | 2,664,944 | ||
26 Invesco Convertible Securities Fund
Trustees and Officers
The address of each trustee and officer is AIM Growth Series (Invesco Growth Series) (the “Trust”), 11 Greenway Plaza, Suite 1000, Houston, Texas 77046-1173. The trustees serve for the life of the Trust, subject to their earlier death, incapacitation, resignation, retirement or removal as more specifically provided in the Trust’s organizational documents. Each officer serves for a one year term or until their successors are elected and qualified. Column two below includes length of time served with predecessor entities, if any.
Name, Year of Birth and Position(s) Held with the Trust | Trustee and/ or Officer Since | Principal Occupation(s) During Past 5 Years | Number of Funds in Fund Complex Overseen by Trustee | Other Directorship(s) Held by Trustee During Past 5 Years | ||||
| Interested Persons | ||||||||
| Martin L. Flanagan1 — 1960 Trustee | 2007 | Executive Director, Chief Executive Officer and President, Invesco Ltd. (ultimate parent of Invesco and a global investment management firm); Trustee, The Invesco Funds; Vice Chair, Investment Company Institute; and Member of Executive Board, SMU Cox School of Business
Formerly: Advisor to the Board, Invesco Advisers, Inc. (formerly known as Invesco Institutional (N.A.), Inc.); Chairman and Chief Executive Officer, Invesco Advisers, Inc. (registered investment adviser); Director, Chairman, Chief Executive Officer and President, Invesco Holding Company (US), Inc. (formerly IVZ Inc.) (holding company), Invesco Group Services, Inc. (service provider) and Invesco North American Holdings, Inc. (holding company); Director, Chief Executive Officer and President, Invesco Holding Company Limited (parent of Invesco and a global investment management firm); Director, Invesco Ltd.; Chairman, Investment Company Institute and President, Co-Chief Executive Officer, Co-President, Chief Operating Officer and Chief Financial Officer, Franklin Resources, Inc. (global investment management organization) | 158 | None | ||||
| Philip A. Taylor2 — 1954 Trustee and Senior Vice President | 2006 | Head of the Americas and Senior Managing Director, Invesco Ltd.; Director, Invesco Advisers, Inc. (formerly known as Invesco Institutional (N.A.), Inc.) (registered investment adviser); Director, Chairman, Chief Executive Officer and President, Invesco Management Group, Inc. (formerly known as Invesco Aim Management Group, Inc.) (financial services holding company); Director and Chairman, Invesco Investment Services, Inc. (formerly known as Invesco Aim Investment Services, Inc.) (registered transfer agent); Chief Executive Officer, Invesco Corporate Class Inc. (corporate mutual fund company); Director, Chairman and Chief Executive Officer, Invesco Canada Ltd. (formerly known as Invesco Trimark Ltd./Invesco Trimark Ltèe) (registered investment adviser and registered transfer agent); Trustee and Senior Vice President, The Invesco Funds; Director, Invesco Investment Advisers LLC (formerly known as Van Kampen Asset Management).
Formerly: Co-Chairman, Co-President and Co-Chief Executive Officer, Invesco Advisers, Inc. (formerly known as Invesco Institutional (N.A.), Inc.) (registered investment adviser); Director, Chief Executive Officer and President, Van Kampen Exchange Corp; President and Principal Executive Officer, The Invesco Funds (other than AIM Treasurer’s Series Trust (Invesco Treasurer’s Series Trust), Short-Term Investments Trust and Invesco Management Trust); Executive Vice President, The Invesco Funds (AIM Treasurer’s Series Trust (Invesco Treasurer’s Series Trust), Short-Term Investments Trust and Invesco Management Trust only); Director and President, INVESCO Funds Group, Inc. (registered investment adviser and registered transfer agent); Director and Chairman, IVZ Distributors, Inc. (formerly known as INVESCO Distributors, Inc.) (registered broker dealer); Director, President and Chairman, Invesco Inc. (holding company), Invesco Canada Holdings Inc. (holding company), Trimark Investments Ltd./Placements Trimark Ltèe and Invesco Financial Services Ltd/Services Financiers Invesco Ltèe; Chief Executive Officer, Invesco Canada Fund Inc. (corporate mutual fund company); Director and Chairman, Van Kampen Investor Services Inc.; Director, Chief Executive Officer and President, 1371 Preferred Inc. (holding company) and Van Kampen Investments Inc.; Director and President, AIM GP Canada Inc. (general partner for limited partnerships) and Van Kampen Advisors, Inc.; Director and Chief Executive Officer, Invesco Trimark Dealer Inc. (registered broker dealer); Director, Invesco Distributors, Inc. (formerly known as Invesco Aim Distributors, Inc.) (registered broker dealer); Manager, Invesco PowerShares Capital Management LLC; Director, Chief Executive Officer and President, Invesco Advisers, Inc.; Director, Chairman, Chief Executive Officer and President, Invesco Aim Capital Management, Inc.; President, Invesco Trimark Dealer Inc. and Invesco Trimark Ltd./Invesco Trimark Ltèe; Director and President, AIM Trimark Corporate Class Inc. and AIM Trimark Canada Fund Inc.; Senior Managing Director, Invesco Holding Company Limited; Director and Chairman, Fund Management Company (former registered broker dealer); President and Principal Executive Officer, The Invesco Funds (AIM Treasurer’s Series Trust (Invesco Treasurer’s Series Trust), and Short-Term Investments Trust only); President, AIM Trimark Global Fund Inc. and AIM Trimark Canada Fund Inc. | 158 | None |
| 1 | Mr. Flanagan is considered an interested person (within the meaning of Section 2(a)(19) of the 1940 Act) of the Trust because he is an officer of the Adviser to the Trust, and an officer and a director of Invesco Ltd., ultimate parent of the Adviser. |
| 2 | Mr. Taylor is considered an interested person (within the meaning of Section 2(a)(19) of the 1940 Act) of the Trust because he is an officer and a director of the Adviser. |
T-1 Invesco Convertible Securities Fund
Trustees and Officers—(continued)
Name, Year of Birth and Position(s) Held with the Trust | Trustee and/ or Officer Since | Principal Occupation(s) During Past 5 Years | Number of Funds in Fund Complex Overseen by Trustee | Other Directorship(s) Past 5 Years | ||||
| Independent Trustees | ||||||||
Bruce L. Crockett — 1944 Trustee and Chair | 2001 | Chairman, Crockett Technologies Associates (technology consulting company)
Formerly: Director, Captaris (unified messaging provider); Director, President and Chief Executive Officer, COMSAT Corporation; Chairman, Board of Governors of INTELSAT (international communications company); ACE Limited (insurance company); Independent Directors Council and Investment Company Institute: Member of the Audit Committee, Investment Company Institute; Member of the Executive Committee and Chair of the Governance Committee, Independent Directors Council | 158 | Director and Chairman of the Audit Committee, ALPS (Attorneys Liability Protection Society) (insurance company); Director and Member of the Audit Committee and Compensation Committee, Ferroglobe PLC (metallurgical company) | ||||
David C. Arch — 1945 Trustee | 2010 | Chairman of Blistex Inc. (consumer health care products manufacturer); Member, World Presidents’ Organization | 158 | Board member of the Illinois Manufacturers’ Association | ||||
Jack M. Fields — 1952 Trustee | 2001 | Chief Executive Officer, Twenty First Century Group, Inc. (government affairs company); and Chairman, Discovery Learning Alliance (non-profit)
Formerly: Owner and Chief Executive Officer, Dos Angeles Ranch L.P. (cattle, hunting, corporate entertainment); Director, Insperity, Inc. (formerly known as Administaff) (human resources provider); Chief Executive Officer, Texana Timber LP (sustainable forestry company); Director of Cross Timbers Quail Research Ranch (non-profit); and member of the U.S. House of Representatives | 158 | None | ||||
Cynthia Hostetler — 1962 Trustee | 2017 | Non-Executive Director and Trustee of a number of public and private business corporations
Formerly: Head of Investment Funds and Private Equity, Overseas Private Investment Corporation; President, First Manhattan Bancorporation, Inc.; Attorney, Simpson Thacher & Bartlett LLP | 158 | Vulcan Materials Company (construction materials company); Trilinc Global Impact Fund; Aberdeen Investment Funds (4 portfolios); Artio Global Investment LLC (mutual fund complex); Edgen Group, Inc. (specialized energy and infrastructure products distributor) | ||||
Eli Jones — 1961 Trustee | 2016 | Professor and Dean, Mays Business School — Texas A&M University
Formerly: Professor and Dean, Walton College of Business, University of Arkansas and E.J. Ourso College of Business, Louisiana State University; Director, Arvest Bank | 158 | Insperity, Inc. (formerly known as Administaff) (human resources provider) | ||||
Prema Mathai-Davis — 1950 Trustee | 2001 | Retired. | 158 | None | ||||
Teresa M. Ressel — 1962 Trustee | 2017 | Non-executive director and trustee of a number of public and private business corporations
Formerly: Chief Financial Officer, Olayan America, The Olayan Group (international investor/commercial/industrial); Chief Executive Officer, UBS Securities LLC; Group Chief Operating Officer, Americas, UBS AG; Assistant Secretary for Management & Budget and CFO, US Department of the Treasury | 158 | Atlantic Power Corporation (power generation company); ON Semiconductor Corp. (semiconductor supplier) | ||||
Ann Barnett Stern — 1957 Trustee | 2017 | President and Chief Executive Officer, Houston Endowment Inc. (private philanthropic institution)
Formerly: Executive Vice President and General Counsel, Texas Children’s Hospital; Attorney, Beck, Redden and Secrest, LLP; Business Law Instructor, University of St. Thomas; Attorney, Andrews & Kurth LLP | 158 | Federal Reserve Bank of Dallas | ||||
Raymond Stickel, Jr. — 1944 Trustee | 2005 | Retired.
Formerly: Director, Mainstay VP Series Funds, Inc. (25 portfolios); Partner, Deloitte & Touche | 158 | None | ||||
Robert C. Troccoli — 1949 Trustee | 2016 | Adjunct Professor, University of Denver — Daniels College of Business
Formerly: Senior Partner, KPMG LLP | 158 | None | ||||
Christopher L. Wilson — 1957 Trustee | 2017 | Non-executive director and trustee of a number of public and private business corporations
Formerly: Managing Partner, CT2, LLC (investing and consulting firm); President/Chief Executive Officer, Columbia Funds, Bank of America Corporation; President/Chief Executive Officer, CDC IXIS Asset Management Services, Inc.; Principal & Director of Operations, Scudder Funds, Scudder, Stevens & Clark, Inc.; Assistant Vice President, Fidelity Investments | 158 | TD Asset Management USA Inc. (mutual fund complex) (22 portfolios); ISO New England, Inc. (non-profit organization managing regional electricity market) |
T-2 Invesco Convertible Securities Fund
Trustees and Officers—(continued)
Name, Year of Birth and Position(s) Held with the Trust | Trustee and/ or Officer Since | Principal Occupation(s) During Past 5 Years | Number of Funds in Fund Complex Overseen by Trustee | Other Directorship(s) Past 5 Years | ||||
| Other Officers | ||||||||
Sheri Morris — 1964 President, Principal Executive Officer and Treasurer | 1999 | President, Principal Executive Officer and Treasurer, The Invesco Funds; Vice President, Invesco Advisers, Inc. (formerly known as Invesco Institutional (N.A.), Inc.) (registered investment adviser); and Vice President, PowerShares Exchange-Traded Fund Trust, PowerShares Exchange-Traded Fund Trust II, PowerShares India Exchange-Traded Fund Trust, PowerShares Actively Managed Exchange-Traded Fund Trust, PowerShares Actively Managed Exchange-Traded Commodity Fund Trust and PowerShares Exchange-Traded Self-Indexed Fund Trust
Formerly: Vice President and Principal Financial Officer, The Invesco Funds; Vice President, Invesco Aim Advisers, Inc., Invesco Aim Capital Management, Inc. and Invesco Aim Private Asset Management, Inc.; Assistant Vice President and Assistant Treasurer, The Invesco Funds and Assistant Vice President, Invesco Advisers, Inc., Invesco Aim Capital Management, Inc. and Invesco Aim Private Asset Management, Inc.; and Treasurer, PowerShares Exchange-Traded Fund Trust, PowerShares Exchange-Traded Fund Trust II, PowerShares India Exchange-Traded Fund Trust and PowerShares Actively Managed Exchange-Traded Fund Trust | N/A | N/A | ||||
Russell C. Burk — 1958 Senior Vice President and Senior Officer | 2005 | Senior Vice President and Senior Officer, The Invesco Funds | N/A | N/A | ||||
John M. Zerr — 1962 Senior Vice President, Chief Legal Officer and Secretary | 2006 | Director, Senior Vice President, Secretary and General Counsel, Invesco Management Group, Inc. (formerly known as Invesco AIM Management Group, Inc.); Senior Vice President, Invesco Advisers, Inc. (formerly known as Invesco Institutional (N.A.), Inc.) (registered investment adviser); Senior Vice President and Secretary, Invesco Distributors, Inc. (formerly known as Invesco AIM Distributors, Inc.); Director, Vice President and Secretary, Invesco Investment Services, Inc. (formerly known as Invesco AIM Investment Services, Inc.) Senior Vice President, Chief Legal Officer and Secretary, The Invesco Funds; Managing Director, Invesco PowerShares Capital Management LLC; Director, Secretary and General Counsel, Invesco Investment Advisers LLC (formerly known as Van Kampen Asset Management); Secretary and General Counsel, Invesco Capital Markets, Inc. (formerly known as Van Kampen Funds Inc.) and Chief Legal Officer, PowerShares Exchange-Traded Fund Trust, PowerShares Exchange-Traded Fund Trust II, PowerShares India Exchange-Traded Fund Trust, PowerShares Actively Managed Exchange-Traded Fund Trust, PowerShares Actively Managed Exchange-Traded Commodity Fund Trust and PowerShares Exchange-Traded Self-Indexed Fund Trust; Manager and Secretary, Invesco Indexing LLC
Formerly: Director, Secretary, General Counsel and Senior Vice President, Van Kampen Exchange Corp.; Director, Vice President and Secretary, IVZ Distributors, Inc. (formerly known as INVESCO Distributors, Inc.); Director and Vice President, INVESCO Funds Group, Inc.; Director and Vice President, Van Kampen Advisors Inc.; Director, Vice President, Secretary and General Counsel, Van Kampen Investor Services Inc.; Director, Invesco Distributors, Inc. (formerly known as Invesco AIM Distributors, Inc.); Director, Senior Vice President, General Counsel and Secretary, Invesco AIM Advisers, Inc. and Van Kampen Investments Inc.; Director, Vice President and Secretary, Fund Management Company; Director, Senior Vice President, Secretary, General Counsel and Vice President, Invesco AIM Capital Management, Inc.; Chief Operating Officer and General Counsel, Liberty Ridge Capital, Inc. (an investment adviser); Vice President and Secretary, PBHG Funds (an investment company) and PBHG Insurance Series Fund (an investment company); Chief Operating Officer, General Counsel and Secretary, Old Mutual Investment Partners (a broker-dealer); General Counsel and Secretary, Old Mutual Fund Services (an administrator) and Old Mutual Shareholder Services (a shareholder servicing center); Executive Vice President, General Counsel and Secretary, Old Mutual Capital, Inc. (an investment adviser); and Vice President and Secretary, Old Mutual Advisors Funds (an investment company) | N/A | N/A | ||||
Gregory G. McGreevey — 1962 Senior Vice President | 2012 | Senior Managing Director, Invesco Ltd.; Director, Chairman, President, and Chief Executive Officer, Invesco Advisers, Inc. (formerly known as Invesco Institutional (N.A.), Inc.) (registered investment adviser); Senior Vice President, Invesco Management Group, Inc.; Director, Invesco Mortgage Capital, Inc. and Invesco Senior Secured Management, Inc.; and Senior Vice President, The Invesco Funds
Formerly: Assistant Vice President, The Invesco Funds | N/A | N/A | ||||
Kelli Gallegos — 1970 Vice President, Principal Financial Officer and Assistant Treasurer | 2008 | Vice President, Principal Financial Officer and Assistant Treasurer, The Invesco Funds; Assistant Treasurer, Invesco PowerShares Capital Management LLC, PowerShares Exchange-Traded Fund Trust, PowerShares Exchange-Traded Fund Trust II, PowerShares India Exchange-Traded Fund Trust, PowerShares Actively Managed Exchange-Traded Fund Trust, PowerShares Actively Managed Exchange-Traded Commodity Fund Trust and PowerShares Exchange-Traded Self-Indexed Fund Trust
Formerly: Assistant Vice President, The Invesco Funds | N/A | N/A |
T-3 Invesco Convertible Securities Fund
Trustees and Officers—(continued)
Name, Year of Birth and Position(s) Held with the Trust | Trustee and/ or Officer Since | Principal Occupation(s) During Past 5 Years | Number of Funds in Fund Complex Overseen by Trustee | Other Directorship(s) Past 5 Years | ||||
| Other Officers—(continued) | ||||||||
Tracy Sullivan — 1962 Vice President, Chief Tax Officer and Assistant Treasurer | 2008 | Vice President, Chief Tax Officer and Assistant Treasurer, The Invesco Funds; Assistant Treasurer, Invesco PowerShares Capital Management LLC, PowerShares Exchange-Traded Fund Trust, PowerShares Exchange-Traded Fund Trust II, PowerShares India Exchange-Traded Fund Trust, PowerShares Actively Managed Exchange-Traded Fund Trust,PowerShares Actively Managed Exchange-Traded Commodity Fund Trust and PowerShares Exchange-Traded Self-Indexed Fund Trust
Formerly: Assistant Vice President, The Invesco Funds | N/A | N/A | ||||
Crissie M. Wisdom — 1969 Anti-Money Laundering Compliance Officer | 2013 | Anti-Money Laundering Compliance Officer, Invesco Advisers, Inc. (formerly known as Invesco Institutional (N.A.), Inc.) (registered investment adviser), Invesco Capital Markets, Inc. (formerly known as Van Kampen Funds Inc.), Invesco Distributors, Inc., Invesco Investment Services, Inc., Invesco Management Group, Inc., The Invesco Funds, and PowerShares Exchange-Traded Fund Trust, PowerShares Exchange-Traded Fund Trust II, PowerShares India Exchange-Traded Fund Trust, PowerShares Actively Managed Exchange-Traded Fund Trust,PowerShares Actively Managed Exchange-Traded Commodity Fund Trust and PowerShares Exchange-Traded Self-Indexed Fund Trust; Anti-Money Laundering Compliance Officer and Bank Secrecy Act Officer, INVESCO National Trust Company and Invesco Trust Company; and Fraud Prevention Manager and Controls and Risk Analysis Manager for Invesco Investment Services, Inc.
Formerly: Anti-Money Laundering Compliance Officer, Van Kampen Exchange Corp. | N/A | N/A | ||||
Robert R. Leveille — 1969 Chief Compliance Officer | 2016 | Chief Compliance Officer, Invesco Advisers, Inc. (registered investment adviser); and Chief Compliance Officer, The Invesco Funds
Formerly: Chief Compliance Officer, Putnam Investments and the Putnam Funds | N/A | N/A |
The Statement of Additional Information of the Trust includes additional information about the Fund’s Trustees and is available upon request, without charge, by calling 1.800.959.4246. Please refer to the Fund’s Statement of Additional Information for information on the Fund’s sub-advisers.
Office of the Fund 11 Greenway Plaza, Suite 1000 Houston, TX 77046-1173 | Investment Adviser Invesco Advisers, Inc. 1555 Peachtree Street, N.E. Atlanta, GA 30309 | Distributor Invesco Distributors, Inc. 11 Greenway Plaza, Suite 1000 Houston, TX 77046-1173 | Auditors PricewaterhouseCoopers LLP 1000 Louisiana Street, Suite 5800 Houston, TX 77002-5678 | |||
Counsel to the Fund Stradley Ronon Stevens & Young, LLP 2005 Market Street, Suite 2600 Philadelphia, PA 19103-7018 | Counsel to the Independent Trustees Goodwin Procter LLP 901 New York Avenue, N.W. Washington, D.C. 20001 | Transfer Agent Invesco Investment Services, Inc. 11 Greenway Plaza, Suite 1000 Houston, TX 77046-1173 | Custodian State Street Bank and Trust Company 225 Franklin Street Boston, MA 02110-2801 | |||
T-4 Invesco Convertible Securities Fund
Explore High-Conviction Investing with Invesco

Go paperless with eDelivery
Visit invesco.com/edelivery to enjoy the convenience and security of anytime electronic access to your investment documents.
With eDelivery, you can elect to have any or all of the following materials delivered straight to your inbox to download, save and print from your own computer:
| ∎ | Fund reports and prospectuses |
| ∎ | Quarterly statements |
| ∎ | Daily confirmations |
| ∎ | Tax forms |
Invesco mailing information
Send general correspondence to Invesco Investment Services, Inc., P.O. Box 219078, Kansas City, MO 64121-9078.
Important notice regarding delivery of security holder documents
To reduce Fund expenses, only one copy of most shareholder documents may be mailed to shareholders with multiple accounts at the same address (Householding). Mailing of your shareholder documents may be householded indefinitely unless you instruct us otherwise. If you do not want the mailing of these documents to be combined with those for other members of your household, please contact Invesco Investment Services, Inc. at 800 959 4246 or contact your financial institution. We will begin sending you individual copies for each account within 30 days after receiving your request.
Fund holdings and proxy voting information
The Fund provides a complete list of its holdings four times in each fiscal year, at the quarter ends. For the second and fourth quarters, the lists appear in the Fund’s semiannual and annual reports to shareholders. For the first and third quarters, the Fund files the lists with the Securities and Exchange Commission (SEC) on Form N-Q. The most recent list of portfolio holdings is available at invesco.com/completeqtrholdings. Shareholders can also look up the Fund’s Forms N-Q on the SEC website at sec.gov. Copies of the Fund’s Forms N-Q may be reviewed and copied at the SEC Public Reference Room in Washington, D.C. You can obtain information on the operation of the Public Reference Room, including information about duplicating fee charges, by calling 202 551 8090 or 800 732 0330, or by electronic request at the following email address: publicinfo@sec.gov. The SEC file numbers for the Fund are shown below.
A description of the policies and procedures that the Fund uses to determine how to vote proxies relating to portfolio securities is available without charge, upon request, from our Client Services department at 800 959 4246 or at invesco.com/proxyguidelines. The information is also available on the SEC website, sec.gov.
Information regarding how the Fund voted proxies related to its portfolio securities during the most recent 12-month period ended June 30 is available at invesco.com/proxysearch. The information is also available on the SEC website, sec.gov. Invesco Advisers, Inc. is an investment adviser; it provides investment advisory services to individual and institutional clients and does not sell securities. Invesco Distributors, Inc. is the US distributor for Invesco Ltd.’s retail mutual funds, exchange-traded funds and institutional money market funds. Both are wholly owned, indirect subsidiaries of Invesco Ltd. |  |
| SEC file numbers: 811-02699 and 002-57526 Invesco Distributors, Inc. | MS-CSEC-AR-1 02232018 1000 |
| ||||
 | Annual Report to Shareholders
| December 31, 2017 | ||
| ||||
Invesco Global Low Volatility Equity Yield Fund
| ||||
| Nasdaq: | ||||
| A: GTNDX ◾ B: GNBDX ◾ C: GNDCX ◾ R: GTNRX ◾ Y: GTNYX ◾ R5: GNDIX ◾ R6:GNDSX | ||||

Letters to Shareholders
Philip Taylor | Dear Shareholders: This annual report includes information about your Fund, including performance data and a complete list of its investments as of the close of the reporting period. Inside is a discussion of how your Fund was managed and the factors that affected its performance during the reporting period. Major stock market indexes rose – and set record highs – throughout the reporting period. Generally positive economic data, strong corporate earnings and anticipated tax and regulatory reform contributed to the rally. The US economy expanded during the reporting period, with gross domestic product, the value of all goods and services produced, significantly increasing its growth rate from the first to the third quarter of the year. Tax reform legislation, enacted in December 2017, was a positive for the stock market, but its long-term economic impact was uncertain. Citing positive economic trends – specifically, realized and expected labor market conditions and inflation – the US Federal Reserve raised interest rates in March, June and |

December 2017. While US and global bond markets, as well as emerging market equities, sold off early in the reporting period, they recovered much of their losses during the reporting period. Overseas, economic data were mixed, prompting the European Central Bank and central banks in China and Japan, among other countries, to maintain extraordinarily accommodative monetary policies.
Short-term market volatility can prompt some investors to abandon their investment plans – and can cause others to settle for whatever returns the market has to offer. The investment professionals at Invesco, in contrast, invest with high conviction. This means that, no matter the asset class or the strategy, each investment team has a passion to exceed. We want to help investors achieve better outcomes, such as seeking higher returns, helping mitigate risk and generating income. Of course, investing with high conviction can’t guarantee a profit or ensure success; no investment strategy can. To learn more about how we invest with high conviction, visit invesco.com/HighConviction.
You, too, can invest with high conviction by maintaining a long-term investment perspective and by working with your financial adviser on a regular basis. During periods of short-term market volatility or uncertainty, your financial adviser can keep you focused on your long-term investment goals – a new home, a child’s college education or a secure retirement. He or she also can share research about the economy, the markets and individual investment options.
Visit our website for more information on your investments
Our website, invesco.com/us, offers a wide range of market insights and investment perspectives. On the website, you’ll find detailed information about our funds, including performance, holdings and portfolio manager commentaries. You can access information about your account by completing a simple, secure online registration. To do so, select “Log In” on the right side of the homepage, and then select “Register for Individual Account Access.”
In addition to the resources accessible on our website and through our mobile app, you can obtain timely updates to help you stay informed about the markets and the economy by connecting with Invesco on Twitter, LinkedIn or Facebook. You can access our blog at blog.invesco.us.com. Our goal is to provide you the information you want, when and where you want it.
Finally, I’m pleased to share with you Invesco’s commitment to both the Principles for Responsible Investment and to considering environmental, social and governance issues in our robust investment process. I invite you to learn more at invesco.com/esg.
Have questions?
For questions about your account, contact an Invesco client services representative at 800 959 4246. For Invesco-related questions or comments, please email me directly at phil@invesco.com.
All of us at Invesco look forward to serving your investment management needs. Thank you for investing with us.
Sincerely,

Philip Taylor
Senior Managing Director, Invesco Ltd.
| 2 | Invesco Global Low Volatility Equity Yield Fund |
Bruce Crockett | Dear Fellow Shareholders: Among the many important lessons I’ve learned in more than 40 years in a variety of business endeavors is the value of a trusted advocate. As independent chair of the Invesco Funds Board, I can assure you that the members of the Board are strong advocates for the interests of investors in Invesco’s mutual funds. We work hard to represent your interests through oversight of the quality of the investment management services your funds receive and other matters important to your investment, including but not limited to: | |||
∎ | Ensuring that Invesco offers a diverse lineup of mutual funds that your financial adviser can use to strive to meet your financial needs as your investment goals change over time. | |||
| ∎ | Monitoring how the portfolio management teams of the Invesco funds are performing in light of changing economic and market conditions. | |||

| ∎ | Assessing each portfolio management team’s investment performance within the context of the investment strategy described in the fund’s prospectus. |
| ∎ | Monitoring for potential conflicts of interests that may impact the nature of the services that your funds receive. |
We believe one of the most important services we provide our fund shareholders is the annual review of the funds’ advisory and sub-advisory contracts with Invesco Advisers and its affiliates. This review is required by the Investment Company Act of 1940 and focuses on the nature and quality of the services Invesco provides as the adviser to the Invesco funds and the reasonableness of the fees that it charges for those services. Each year, we spend months carefully reviewing information received from Invesco and a variety of independent sources, such as performance and fee data prepared by Lipper, Inc. (a subsidiary of Broadridge Financial Solutions, Inc.), an independent, third-party firm widely recognized as a leader in its field. We also meet with our independent legal counsel and other independent advisers to review and help us assess the information that we have received. Our goal is to assure that you receive quality investment management services for a reasonable fee.
I trust the measures outlined above provide assurance that you have a worthy advocate when it comes to choosing the Invesco Funds.
As always, please contact me at bruce@brucecrockett.com with any questions or concerns you may have. On behalf of the Board, we look forward to continuing to represent your interests and serving your needs.
Sincerely,

Bruce L. Crockett
Independent Chair
Invesco Funds Board of Trustees
| 3 | Invesco Global Low Volatility Equity Yield Fund |
Management’s Discussion of Fund Performance
Performance summary For the year ended December 31, 2017, Class A shares of Invesco Global Low Volatility Equity Yield Fund (the Fund), at net asset value (NAV), underperformed the Custom Invesco Global Low Volatility Equity Yield Index, the Fund’s style-specific benchmark. Your Fund’s long-term performance appears later in this report.
| Most emerging markets continued to perform well during 2017. In addition to the improving global economic outlook, other positive tailwinds included reduced expectations for a major shift in US trade policy as well as stronger oil prices. Oil moved higher on production restraint by OPEC and Russia, benefiting commodity-driven emerging markets countries. At the close of 2017, equity market valuations in developed and emerging markets appeared relatively full in absolute terms, but non-US equity markets were trading at a material discount to the US. In sum, while valuations were not cheap, earnings growth and upward earnings revisions improved in many non-US developed markets. Interestingly, while 2017 marked the eighth year of the global bull market, we saw a shift in leadership as international stocks outperformed US stocks for the year. Prior to 2017, international stocks had trailed US stocks for four consecutive years and in six of the last seven years. The Fund seeks to provide a higher level of income, before taxes, than the MSCI World 100% Hedged to USD Index, while still achieving the highest return available with less volatility. The Fund attempts to do this through its stock selection process, in which we systematically evaluate fundamental and behavioral factors to forecast individual security returns and rank those securities based on their attractiveness relative to industry peers. Given the pervasive low volatility environment throughout 2017, the Fund’s volatility was in line with the MSCI World 100% Hedged to USD Index. While all sectors of the Fund delivered positive absolute performance during the reporting period, stock selection in the consumer staples, industrials, materials and real estate sectors detracted from the Fund’s performance relative to the | |||||||||
| Fund vs. Indexes | ||||||||||
Total returns, 12/31/16 to 12/31/17, at net asset value (NAV). Performance shown does not include applicable contingent deferred sales charges (CDSC) or front-end sales charges, which would have reduced performance.
| ||||||||||
Class A Shares | 15.85% | |||||||||
Class B Shares | 15.00 | |||||||||
Class C Shares | 15.02 | |||||||||
Class R Shares | 15.63 | |||||||||
Class Y Shares | 16.20 | |||||||||
Class R5 Shares | 16.27 | |||||||||
Class R6 Shares* | 16.14 | |||||||||
MSCI World Indexq (Broad Market/Former Style-Specific Index)** | 22.40 | |||||||||
Custom Invesco Global Low Volatility Equity Yield Index∎ (Style-Specific Index)** | 20.01 | |||||||||
MSCI World 100% Hedged to USD Indexq (Former Style-Specific Index)** | 19.13 | |||||||||
Lipper Global Equity Income Funds Index◆ (Peer Group Index) | 17.85 | |||||||||
Source(s): qFactSet Research Systems Inc.; ∎Invesco, FTSE/FactSet Research Systems Inc.; ◆Lipper Inc.
*Class R6 shares incepted on April 4, 2017. See page 7 for more information. **During the reporting period, the Fund first changed its style-specific benchmark from the MSCI World Index to the MSCI World 100% Hedged to USD Index and then to the Custom Invesco Global Low Volatility Equity Yield Index. The Fund elected to use the Custom Invesco Global Low Volatility Equity Yield Index as its style-specific index as it more closely reflects the performance of the types of securities in the Fund as well as the Fund’s strategy to hedge foreign currency exposure compared to its previous style-specific benchmarks.
| ||||||||||
Market conditions and your Fund
Global equity markets delivered positive, and in many cases double-digit, returns over the year ended December 31, 2017. These gains were broadly driven by firming global economic growth, as well as stronger corporate fundamentals. After trailing international markets for the first three quarters of the year, the US equity market outperformed international markets in the fourth quarter. US equity markets received a boost from the prospect of sweeping individual and corporate tax cuts, with a final tax bill approved by Congress in December 2017. |
In developed markets, the US Federal Reserve (the Fed) met in December and increased the benchmark fed funds target rate by 0.25% to a target range of 1.25% to 1.50%.1 Combined with two other interest rate increases earlier in 2017, the Fed’s decision reflects a more constructive outlook for the US economy. In contrast, the European Central Bank held rates steady at 0% throughout 2017 and maintained its generous bond buying program through at least September 2018, or beyond, until it sees a sustained adjustment in the path of inflation. | |||||||||
| Portfolio Composition | ||||||
| By sector | % of total net assets | |||||
Consumer Discretionary | 20.2% | |||||
| Utilities | 12.4 | |||||
| Energy | 11.5 | |||||
| Industrials | 10.6 | |||||
| Real Estate | 9.1 | |||||
| Health Care | 7.9 | |||||
| Telecommunication Services | 6.4 | |||||
| Materials | 6.1 | |||||
| Information Technology | 5.5 | |||||
| Financials | 3.7 | |||||
| Consumer Staples | 3.5 | |||||
| Money Market Funds Plus Other Assets Less Liabilities | 3.1 | |||||
| Top 10 Holdings* | ||||
% of total net assets | ||||
1. Petrofac Ltd. | 2.3% | |||
2. Best Buy Co., Inc. | 2.2 | |||
3. Persimmon PLC | 2.1 | |||
4. Kindred Group PLC-SDR | 2.1 | |||
5. HP Inc. | 2.1 | |||
6. CSR Ltd. | 2.1 | |||
7. UPM-Kymmene Oyj | 2.1 | |||
8. Vodafone Group PLC | 2.0 | |||
9. Wal-Mart Stores, Inc. | 2.0 | |||
10. Regis Resources Ltd. | 2.0 | |||
Total Net Assets | $ | 105.5 million | ||
Total Number of Holdings* | 66 | |||
The Fund’s holdings are subject to change, and there is no assurance that the Fund will continue to hold any particular security.
*Excluding money market fund holdings.
Data presented here are as of December 31, 2017.
| 4 | Invesco Global Low Volatility Equity Yield Fund |
Custom Invesco Global Low Volatility Equity Yield Index, the Fund’s style-specific index. In addition, an underweight position in the information technology sector and an overweight position in the utilities sector hurt the Fund’s performance versus the style-specific benchmark. Stock selection in the energy, health care and financials sectors contributed to Fund performance.
From a geographic perspective, stock selection in Japan, the Netherlands, Singapore and the UK was beneficial to the Fund’s relative performance during the reporting period, while stock selection lagged in the US, Hong Kong, France and Australia.
The largest detractor from Fund performance during the year was Neopost. We sold our position in the company before the close of the reporting period. Office Depot, which is still working on its integration with OfficeMax (not a Fund holding), lagged during the year but hopes to see synergy benefits from the merger in the near future.
Venture, a global electronics services company, was the largest contributor to absolute and relative return during the reporting period. The company’s stock price rose on quarterly profit reports that outpaced analysts’ expectations. Another top contributor was Wal-Mart Stores. The company’s stock price benefited from increased earnings revenue and sales growth.
The Fund uses a quantitative method of investing and focuses on four investment concepts that make up its stock selection model – Earnings Expectations, Market Sentiment, Management and Quality, and Value. During the reporting period, our stock selection model for our global investment universe was mostly positive across the investable universe. The balance in our multi-factor process – combining momentum, valuation, and business management measures – has helped to generate these positive forecasts. Value and Quality tend to be negatively correlated with our momentum factors, acting as attractive complements.
Please note that the Fund’s strategy is principally implemented through equity investments, but may also use equity futures contracts, derivative instruments, to gain exposure to the equity market. In addition, the Fund may use forward foreign currency contracts to hedge against adverse movements in the foreign currencies in which portfolio securities are
denominated. During the year, the Fund invested in S&P500, Nikkei 225, FTSE 100 and EuroStoxx 50 futures contracts, which were positive for Fund performance on an absolute basis. The Fund also invested in forward foreign currency contracts that were negative for Fund performance on an absolute basis due to the depreciation of the US dollar against other major currencies.
Derivatives can be a cost-effective way to gain exposure to asset classes. However, derivatives may amplify traditional investment risks through the creation of leverage and may be less liquid than traditional securities.
As always, we thank you for your continued investment in Invesco Global Low Volatility Equity Yield Fund.
1 Source: US Federal Reserve
The views and opinions expressed in management’s discussion of Fund performance are those of Invesco Advisers, Inc. These views and opinions are subject to change at any time based on factors such as market and economic conditions. These views and opinions may not be relied upon as investment advice or recommendations, or as an offer for a particular security. The information is not a complete analysis of every aspect of any market, country, industry, security or the Fund. Statements of fact are from sources considered reliable, but Invesco Advisers, Inc. makes no representation or warranty as to their completeness or accuracy. Although historical performance is no guarantee of future results, these insights may help you understand our investment management philosophy.
See important Fund and, if applicable, index disclosures later in this report.
 | Michael Abata Chartered Financial Analyst, Portfolio Manager, is manager of Invesco Global Low Volatility Equity Yield | |
Fund. He joined Invesco in 2011. Mr. Abata earned a BA in economics from Binghamton University.
| ||
 | Uwe Draeger Portfolio Manager, is manager of Invesco Global Low Volatility Equity Yield Fund. He joined Invesco in 2005. | |
Mr. Draeger earned a Diplom-Ökonom degree from Hochschule für Ökonomie Berlin, an MA from City of London Polytechnic and an MBA from Anglia Business School (Cambridge).
| ||
 | Nils Huter Chartered Financial Analyst, Portfolio Manager, is manager of Invesco Global Low Volatility Equity Yield | |
Fund. He joined Invesco in 2007. Mr. Huter earned a business administration degree, Diplom Kaufmann (FH), the University of Applied Sciences and Arts in Hildesheim.
| ||
 | Donna Chapman Wilson Portfolio Manager and Director of Portfolio Management, is manager of Invesco Global Low Volatility | |
| Equity Yield Fund. She joined Invesco in 1997. Ms. Chapman Wilson earned a BA in economics from Hampton University and an MBA in finance from the Wharton School of the University of Pennsylvania. | ||
| 5 | Invesco Global Low Volatility Equity Yield Fund |
Your Fund’s Long-Term Performance
Results of a $10,000 Investment – Oldest Share Class(es)
Fund and index data from 12/31/07
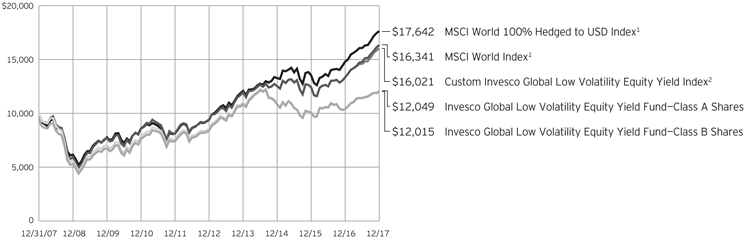
1 Source: FactSet Research Systems Inc.
2 Source(s): Invesco, FTSE/FactSet Research Systems Inc.
Past performance cannot guarantee comparable future results.
During the reporting period, the Fund first changed its style-specific benchmark from the MSCI World Index to the MSCI World 100% Hedged to USD Index and then to the Custom Invesco Global Low Volatility Equity Yield Index. The Fund elected to use the Custom Invesco Global Low Volatility Equity Yield Index as its style-specific index as it more closely reflects the the performance of the types of securities in the Fund as well as the
Fund’s strategy to hedge foreign currency exposure compared to its previous style-specific benchmarks. In addition, the Lipper Global Equity Income Funds Index is not shown on the chart as the index does not have 10 years of performance history.
The data shown in the chart include reinvested distributions, applicable sales charges and Fund expenses including management fees. Results for Class B shares are calculated as if a hypothetical shareholder had liquidated his entire
investment in the Fund at the close of the reporting period and paid the contingent deferred sales charges, if applicable. Index results include reinvested dividends, but they do not reflect sales charges. Performance of the peer group, if applicable, reflects fund expenses and management fees; performance of a market index does not. Performance shown in the chart and table(s) does not reflect deduction of taxes a shareholder would pay on Fund distributions or sale of Fund shares.
| 6 | Invesco Global Low Volatility Equity Yield Fund |
Average Annual Total Returns As of 12/31/17, including maximum applicable sales charges |
| |||
Class A Shares | ||||
Inception (9/15/97) | 5.70 | % | ||
10 Years | 1.88 | |||
5 Years | 6.28 | |||
1 Year | 9.48 | |||
Class B Shares | ||||
Inception (9/15/97) | 5.79 | % | ||
10 Years | 1.85 | |||
5 Years | 6.38 | |||
1 Year | 10.00 | |||
Class C Shares | ||||
Inception (1/2/98) | 5.55 | % | ||
10 Years | 1.70 | |||
5 Years | 6.70 | |||
1 Year | 14.02 | |||
Class R Shares | ||||
Inception (10/31/05) | 4.20 | % | ||
10 Years | 2.21 | |||
5 Years | 7.22 | |||
1 Year | 15.63 | |||
Class Y Shares | ||||
10 Years | 2.69 | % | ||
5 Years | 7.77 | |||
1 Year | 16.20 | |||
Class R5 Shares | ||||
Inception (4/30/04) | 5.95 | % | ||
10 Years | 2.99 | |||
5 Years | 7.95 | |||
1 Year | 16.27 | |||
Class R6 Shares | ||||
10 Years | 2.48 | % | ||
5 Years | 7.54 | |||
1 Year | 16.14 | |||
Class Y shares incepted on October 3, 2008. Performance shown prior to that date is that of Class A shares and includes the 12b-1 fees applicable to Class A shares.
Class R6 shares incepted on April 4, 2017. Performance shown prior to that date is that of Class A shares and includes the 12b-1 fees applicable to Class A shares.
The performance data quoted represent past performance and cannot guarantee comparable future results; current performance may be lower or higher. Please visit invesco.com/performance for the most recent month-end performance. Performance figures reflect reinvested distributions, changes in net asset value and the effect of
the maximum sales charge unless otherwise stated. Investment return and principal value will fluctuate so that you may have a gain or loss when you sell shares.
The total annual Fund operating expense ratio set forth in the most recent Fund prospectus as of the date of this report for Class A, Class B, Class C, Class R, Class Y, Class R5 and Class R6 shares was 1.52%, 2.27%, 2.27%, 1.77%, 1.27%, 1.10% and 1.05%, respectively. The expense ratios presented above may vary from the expense ratios presented in other sections of this report that are based on expenses incurred during the period covered by this report.
Class A share performance reflects the maximum 5.50% sales charge, and Class B and Class C share performance reflects the applicable contingent deferred sales charge (CDSC) for the period involved. The CDSC on Class B shares declines from 5% beginning at the time of purchase to 0% at the beginning of the seventh year. The CDSC on Class C shares is 1% for the first year after purchase. Class R, Class Y, Class R5 and Class R6 shares do not have a front-end sales charge or a CDSC; therefore, performance is at net asset value.
The performance of the Fund’s share classes will differ primarily due to different sales charge structures and class expenses.
Fund performance reflects any applicable fee waivers and/or expense reimbursements. Had the adviser not waived fees and/or reimbursed expenses currently or in the past, returns would have been lower. See current prospectus for more information.
| 7 | Invesco Global Low Volatility Equity Yield Fund |
Invesco Global Low Volatility Equity Yield Fund’s investment objective is income and long-term growth of capital.
| ∎ | Unless otherwise stated, information presented in this report is as of December 31, 2017, and is based on total net assets. |
| ∎ | Unless otherwise noted, all data provided by Invesco. |
| ∎ | To access your Fund’s reports/prospectus, visit invesco.com/fundreports. |
About share classes ∎ Effective January 26, 2018, after the close of the reporting period, all outstanding Class B shares were converted to Class A shares, in advance of their normally scheduled conversion. No CDSC was paid in connection with this early conversion. ∎ Class R shares are generally available only to employer sponsored retirement and benefit plans. Please see the prospectus for more information. ∎ Class Y shares are available only to certain investors. Please see the prospectus for more information. ∎ Class R5 shares and Class R6 shares are available for use by retirement plans that meet certain standards and for institutional investors. Class R6 shares are also available through intermediaries that have established an agreement with Invesco Distributors, Inc. to make such shares available for use in retail omnibus accounts. Please see the prospectus for more information.
Principal risks of investing in the Fund ∎ Depositary receipts risk. Investing in depositary receipts involves the same risks as direct investments in foreign securities. In addition, the underlying issuers of certain depositary receipts are under no obligation to distribute shareholder communications or pass through any voting rights with respect to the deposited securities to the holders of such receipts. The Fund may therefore receive less timely information or have less control than if it invested directly in the foreign issuer. ∎ Derivatives risk. The value of a derivative instrument depends largely on (and is derived from) the value of an underlying security, currency, commodity, interest rate, index or other asset (each referred to as an underlying asset). In addition to risks relating to the underlying assets, the use of derivatives may include other, possibly | greater, risks, including counterparty, leverage and liquidity risks. Counter-party risk is the risk that the counter-party to the derivative contract will default on its obligation to pay the Fund the amount owed or otherwise perform under the derivative contract. Derivatives create leverage risk because they do not require payment up front equal to the economic exposure created by owning the derivative. As a result, an adverse change in the value of the underlying asset could result in the Fund sustaining a loss that is substantially greater than the amount invested in the derivative, which may make the Fund’s returns more volatile and increase the risk of loss. Derivative instruments may also be less liquid than more traditional investments and the Fund may be unable to sell or close out its derivative positions at a desirable time or price. This risk may be more acute under adverse market conditions, during which the Fund may be most in need of liquidating its derivative positions. Derivatives may also be harder to value, less tax efficient and subject to changing government regulation that could impact the Fund’s ability to use certain derivatives or their cost. Also, derivatives used for hedging or to gain or limit exposure to a particular market segment may not provide the expected benefits, particularly during adverse market conditions. ∎ Emerging markets securities risk. Emerging markets (also referred to as developing markets) are generally subject to greater market volatility, political, social and economic instability, uncertain trading markets and more governmental limitations on foreign investment than more developed markets. In addition, companies operating in emerging markets may be subject to lower trading volume and greater price fluctuations than companies in more developed markets. Securities law and the enforcement of systems of taxation in many emerging market countries
| may change quickly and unpredictably. In addition, investments in emerging markets securities may also be subject to additional transaction costs, delays in settlement procedures, and lack of timely information. ∎ Foreign securities risk. The Fund’s foreign investments may be adversely affected by political and social instability, changes in economic or taxation policies, difficulty in enforcing obligations, decreased liquidity or increased volatility. Foreign investments also involve the risk of the possible seizure, nationalization or expropriation of the issuer or foreign deposits (in which the Fund could lose its entire investments in a certain market) and the possible adoption of foreign governmental restrictions such as exchange controls. Unless the Fund has hedged its foreign securities risk, foreign securities risk also involves the risk of negative foreign currency rate fluctuations, which may cause the value of securities denominated in such foreign currency (or other instruments through which the Fund has exposure to foreign currencies) to decline in value. Currency exchange rates may fluctuate significantly over short periods of time. Currency hedging strategies, if used, are not always successful. ∎ Geographic focus risk. The Fund may from time to time invest a substantial amount of its assets in securities of issuers located in a single country or a limited number of countries. Adverse economic, political or social conditions in those countries may therefore have a significant negative impact on the Fund’s investment performance. ∎ Investing in the European Union risk. Investments in certain countries in the European Union are susceptible to high economic risks associated with high levels of debt, such as investments in sovereign debt of Greece, Italy and Spain. Efforts of the member states to further unify their economic and monetary policies may increase the potential for the downward movement of one member state’s market to cause a similar effect on other member states’ markets. Separately, the European Union faces issues involving its membership, structure, procedures and policies. The exit of one or more member states | ||
This report must be accompanied or preceded by a currently effective Fund prospectus, which contains more complete information, including sales charges and expenses. Investors should read it carefully before investing. | ||||
| NOT FDIC INSURED | MAY LOSE VALUE | NO BANK GUARANTEE | ||||
| 8 | Invesco Global Low Volatility Equity Yield Fund |
from the European Union, such as the United Kingdom (UK) which has announced its intention to exit, would place its currency and banking system in jeopardy. The exit by the UK or other member states will likely result in increased volatility, illiquidity and potentially lower economic growth in the affected markets, which will adversely affect the Fund’s investments. |
| ∎ | Management risk. The Fund is actively managed and depends heavily on the Adviser’s judgment about markets, interest rates or the attractiveness, relative values, liquidity, or potential appreciation of particular investments made for the Fund’s portfolio. The Fund could experience losses if these judgments prove to be incorrect. There is no guarantee that the portfolio manager’s stock selection process will produce lower volatility than the broader markets in which the Fund invests. In addition, the Fund’s investment strategy to seek lower volatility may cause the Fund to underperform the broader markets in which the Fund invests during market rallies. Such underperformance could be significant during sudden or significant market rallies. Additionally, legislative, regulatory, or tax developments may adversely affect management of the Fund and, therefore, the ability of the Fund to achieve its investment objective. |
| ∎ | Market risk. The market values of the Fund’s investments, and therefore the value of the Fund’s shares, will go up and down, sometimes rapidly or unpredictably. Market risk may affect a single issuer, industry or section of the economy, or it may affect the market as a whole. Individual stock prices tend to go up and down more dramatically than those of certain other types of investments, such as bonds. During a general downturn in the financial markets, multiple asset classes may decline in value. When markets perform well, there can be no assurance that specific investments held by the Fund will rise in value. |
| ∎ | Preferred securities risk. Preferred securities are subject to issuer-specific and market risks applicable generally to equity securities. Preferred securities also may be subordinated to bonds or other debt instruments, subjecting |
them to a greater risk of non-payment, may be less liquid than many other securities, such as common stocks, and generally offer no voting rights with respect to the issuer. |
| ∎ | REIT risk/real estate risk. Investments in real estate related instruments may be affected by economic, legal, cultural, environmental or technological factors that affect property values, rents or occupancies of real estate related to the Fund’s holdings. Shares of real estate related companies, which tend to be small- and mid-cap companies, may be more volatile and less liquid. |
About indexes used in this report
| ∎ | The MSCI World IndexSM is an unmanaged index considered representative of stocks of developed countries. The index is computed using the net return, which withholds applicable taxes for non-resident investors. |
| ∎ | The MSCI World 100% Hedged to USD IndexSM is an unmanaged index considered representative of stocks of developed countries. The index is 100% hedged to the USD and is computed using the net return, which withholds applicable taxes for non-residents investors. |
| ∎ | The Custom Invesco Global Low Volatility Equity Yield Index is composed of the MSCI World Index (Net) through February 23, 2017 and the MSCI World 100% Hedged to USD Index thereafter. |
| ∎ | The Lipper Global Equity Income Funds Index is an unmanaged Index considered representative of global equity income funds tracked by Lipper. |
| ∎ | The Fund is not managed to track the performance of any particular index, including the index(es) described here, and consequently, the performance of the Fund may deviate significantly from the performance of the index(es). |
| ∎ | A direct investment cannot be made in an index. Unless otherwise indicated, index results include reinvested dividends, and they do not reflect sales charges. Performance of the peer group, if applicable, reflects fund expenses; performance of a market index does not. |
Other information
| ∎ | The returns shown in management’s discussion of Fund performance are based on net asset values (NAVs) calculated for shareholder transactions. Generally accepted accounting principles require adjustments to be made to the net assets of the Fund at period end for financial reporting purposes, and as such, the NAVs for shareholder transactions and the returns based on those NAVs may differ from the NAVs and returns reported in the Financial Highlights. |
| ∎ | Industry classifications used in this report are generally according to the Global Industry Classification Standard, which was developed by and is the exclusive property and a service mark of MSCI Inc. and Standard & Poor’s. |
| 9 | Invesco Global Low Volatility Equity Yield Fund |
Schedule of Investments
December 31, 2017
| Shares | Value | |||||||
Common Stocks & Other Equity Interests-96.86% |
| |||||||
| Australia–8.90% | ||||||||
Caltex Australia Ltd. | 50,474 | $ | 1,338,615 | |||||
Cochlear Ltd. | 14,210 | 1,898,366 | ||||||
CSR Ltd. | 586,131 | 2,172,052 | ||||||
Harvey Norman Holdings Ltd. | 67,723 | 219,901 | ||||||
Qantas Airways Ltd. | 421,549 | 1,654,741 | ||||||
Regis Resources Ltd. | 628,241 | 2,103,582 | ||||||
| 9,387,257 | ||||||||
| Canada–5.48% | ||||||||
Capital Power Corp. | 95,665 | 1,863,980 | ||||||
IGM Financial, Inc. | 58,121 | 2,041,564 | ||||||
Superior Plus Corp. | 198,633 | 1,875,864 | ||||||
| 5,781,408 | ||||||||
| China–1.74% | ||||||||
Yangzijiang Shipbuilding Holdings Ltd. | 1,674,800 | 1,840,715 | ||||||
| Finland–2.05% | ||||||||
UPM-Kymmene Oyj | 69,854 | 2,167,365 | ||||||
| France–1.89% | ||||||||
Faurecia | 25,528 | 1,990,631 | ||||||
| Hong Kong–4.54% | ||||||||
CLP Holdings Ltd. | 181,500 | 1,857,303 | ||||||
HK Electric Investments and HK Electric Investments Ltd.–REGS(a) | 2,144,000 | 1,962,088 | ||||||
NWS Holdings Ltd. | 539,000 | 971,119 | ||||||
| 4,790,510 | ||||||||
| Israel–1.68% | ||||||||
Bezeq The Israeli Telecommunication Corp. Ltd. | 908,636 | 1,373,319 | ||||||
Paz Oil Co. Ltd.(b) | 2,329 | 402,867 | ||||||
| 1,776,186 | ||||||||
| Japan–9.37% | ||||||||
Aoyama Trading Co., Ltd. | 36,900 | 1,378,796 | ||||||
Brother Industries, Ltd. | 11,600 | 286,216 | ||||||
Haseko Corp. | 135,000 | 2,089,585 | ||||||
K's Holdings Corp. | 68,900 | 1,766,682 | ||||||
Miraca Holdings Inc. | 43,300 | 1,854,287 | ||||||
mixi, Inc. | 32,900 | 1,477,536 | ||||||
Nishimatsu Construction Co., Ltd. | 36,600 | 1,026,502 | ||||||
| 9,879,604 | ||||||||
| Malta–2.09% | ||||||||
Kindred Group PLC–SDR | 153,996 | 2,204,208 | ||||||
| New Zealand–6.36% | ||||||||
Air New Zealand Ltd. | 696,221 | 1,568,129 | ||||||
Contact Energy Ltd. | 426,914 | 1,682,200 | ||||||
Mercury NZ Ltd. | 284,194 | 677,310 | ||||||
Meridian Energy Ltd. | 387,756 | 802,764 | ||||||
Spark New Zealand Ltd. | 767,650 | 1,974,842 | ||||||
| 6,705,245 | ||||||||
| Shares | Value | |||||||
| Norway–1.47% | ||||||||
Marine Harvest ASA | 91,718 | $ | 1,552,990 | |||||
| Singapore–1.96% | ||||||||
SATS Ltd. | 56,000 | 217,340 | ||||||
Venture Corp. Ltd. | 121,000 | 1,848,934 | ||||||
| 2,066,274 | ||||||||
| Sweden–1.95% | ||||||||
Intrum Justitia AB | 55,677 | 2,058,843 | ||||||
| Switzerland–1.91% | ||||||||
Novartis AG | 23,807 | 2,013,442 | ||||||
| United Kingdom–14.40% | ||||||||
Barratt Developments PLC | 238,950 | 2,088,876 | ||||||
BP PLC | 291,609 | 2,057,877 | ||||||
PageGroup PLC | 256,084 | 1,605,745 | ||||||
Persimmon PLC | 59,812 | 2,208,693 | ||||||
Petrofac Ltd. | 345,983 | 2,382,269 | ||||||
SSE PLC | 41,802 | 744,967 | ||||||
Subsea 7 S.A. | 129,880 | 1,946,017 | ||||||
Vodafone Group PLC | 681,045 | 2,151,389 | ||||||
| 15,185,833 | ||||||||
| United States–31.07% | ||||||||
Aaron's, Inc. | 7,828 | 311,946 | ||||||
AbbVie Inc. | 7,798 | 754,145 | ||||||
Best Buy Co., Inc. | 33,952 | 2,324,693 | ||||||
Boeing Co. (The) | 890 | 262,470 | ||||||
CenturyLink Inc. | 76,550 | 1,276,854 | ||||||
CoreCivic, Inc. | 76,148 | 1,713,330 | ||||||
EastGroup Properties, Inc. | 3,119 | 275,657 | ||||||
Entergy Corp. | 19,700 | 1,603,383 | ||||||
Four Corners Property Trust, Inc. | 58,976 | 1,515,683 | ||||||
GameStop Corp.–Class A | 95,251 | 1,709,755 | ||||||
Gaming and Leisure Properties, Inc. | 39,902 | 1,476,374 | ||||||
Gilead Sciences, Inc. | 24,417 | 1,749,234 | ||||||
HP Inc. | 103,417 | 2,172,791 | ||||||
Macy's, Inc. | 73,908 | 1,861,742 | ||||||
National Health Investors, Inc. | 25,491 | 1,921,512 | ||||||
Office Depot, Inc. | 317,778 | 1,124,934 | ||||||
Plains GP Holdings LP–Class A(b) | 90,122 | 1,978,178 | ||||||
Potlatch Corp. | 13,874 | 692,313 | ||||||
Uniti Group Inc. | 24,970 | 444,216 | ||||||
Waddell & Reed Financial, Inc.–Class A | 84,590 | 1,889,741 | ||||||
Wal-Mart Stores, Inc. | 21,493 | 2,122,434 | ||||||
Washington Prime Group Inc. | 222,115 | 1,581,459 | ||||||
Williams Cos., Inc. (The) | 66,067 | 2,014,383 | ||||||
| 32,777,227 | ||||||||
Total Common Stocks & Other Equity Interests |
| 102,177,738 | ||||||
Money Market Funds–3.00% |
| |||||||
Invesco Government & Agency Portfolio–Institutional | 1,186,527 | 1,186,527 | ||||||
See accompanying Notes to Financial Statements which are an integral part of the financial statements.
10 Invesco Global Low Volatility Equity Yield Fund
| Shares | Value | |||||||
Invesco Liquid Assets Portfolio–Institutional Class, 1.40%(c) | 619,774 | $ | 619,836 | |||||
Invesco Treasury Portfolio–Institutional Class, 1.17%(c) | 1,356,030 | 1,356,030 | ||||||
Total Money Market Funds |
| 3,162,393 | ||||||
TOTAL INVESTMENTS IN SECURITIES–99.86% (Cost $97,152,967) | 105,340,131 | |||||||
OTHER ASSETS LESS LIABILITIES–0.14% | 147,302 | |||||||
NET ASSETS–100.00% | $ | 105,487,433 | ||||||
Investment Abbreviations:
| REGS | – Regulation S | |
| SDR | – Swedish Depository Receipts |
Notes to Schedule of Investments:
| (a) | Security purchased or received in transaction exempt from registration under the Securities Act of 1933, as amended (the “1933 Act”). The security may be resold pursuant to an exemption from registration under the 1933 Act, typically to qualified institutional buyers. The value of this security at December 31, 2017 represented 1.86% of the Fund's Net Assets. |
| (b) | Non-income producing security. |
| (c) | The money market fund and the Fund are affiliated by having the same investment adviser. The rate shown is the 7-day SEC standardized yield as of December 31, 2017. |
| Open Futures Contracts(a) | ||||||||||||||||||||
| Long Futures Contracts | Number of Contracts | Expiration Month | Notional Value | Value | Unrealized Appreciation (Depreciation) | |||||||||||||||
Dow Jones EURO STOXX 50 Index | 11 | March-2018 | $ | 460,999 | $ | (10,434 | ) | $ | (10,434 | ) | ||||||||||
E-Mini S&P 500 Index | 13 | March-2018 | 1,739,400 | 14,366 | 14,366 | |||||||||||||||
FTSE 100 Index | 2 | March-2018 | 206,241 | 6,848 | 6,848 | |||||||||||||||
SGX NIKKEI 225 Index | 3 | March-2018 | 302,942 | 2,649 | 2,649 | |||||||||||||||
Total Futures Contracts-Equity Risk | $ | 13,429 | $ | 13,429 | ||||||||||||||||
| (a) | Futures contracts collateralized by $113,777 cash held with Bank of America Merrill Lynch, the futures commission merchant. |
| Open Forward Foreign Currency Contracts | ||||||||||||||||||||||
Settlement | Contract to | Unrealized Appreciation (Depreciation) | ||||||||||||||||||||
| Counterparty | Deliver | Receive | ||||||||||||||||||||
01/19/2018 | State Street Bank and Trust Co. | JPY | 1,092,000,000 | USD | 9,726,656 | $ | 28,752 | |||||||||||||||
01/19/2018 | State Street Bank and Trust Co. | USD | 1,241,447 | EUR | 1,050,000 | 20,020 | ||||||||||||||||
01/19/2018 | State Street Bank and Trust Co. | USD | 222,900 | SGD | 300,000 | 1,474 | ||||||||||||||||
Subtotal | 50,246 | |||||||||||||||||||||
01/19/2018 | State Street Bank and Trust Co. | AUD | 11,760,000 | USD | 8,985,910 | (189,777 | ) | |||||||||||||||
01/19/2018 | State Street Bank and Trust Co. | CAD | 6,860,000 | USD | 5,423,272 | (36,394 | ) | |||||||||||||||
01/19/2018 | State Street Bank and Trust Co. | CHF | 1,970,000 | USD | 2,006,492 | (18,646 | ) | |||||||||||||||
01/19/2018 | State Street Bank and Trust Co. | EUR | 4,490,000 | USD | 5,344,514 | (49,760 | ) | |||||||||||||||
01/19/2018 | State Street Bank and Trust Co. | GBP | 9,810,000 | USD | 13,186,146 | (68,189 | ) | |||||||||||||||
01/19/2018 | State Street Bank and Trust Co. | ILS | 5,950,000 | USD | 1,707,311 | (3,810 | ) | |||||||||||||||
01/19/2018 | State Street Bank and Trust Co. | JPY | 104,000,000 | USD | 919,940 | (4,057 | ) | |||||||||||||||
01/19/2018 | State Street Bank and Trust Co. | NOK | 27,500,000 | USD | 3,323,813 | (28,320 | ) | |||||||||||||||
01/19/2018 | State Street Bank and Trust Co. | NZD | 8,850,000 | USD | 6,097,358 | (172,828 | ) | |||||||||||||||
01/19/2018 | State Street Bank and Trust Co. | SEK | 33,800,000 | USD | 4,033,436 | (93,151 | ) | |||||||||||||||
01/19/2018 | State Street Bank and Trust Co. | SGD | 5,350,000 | USD | 3,976,714 | (24,620 | ) | |||||||||||||||
01/19/2018 | State Street Bank and Trust Co. | USD | 649,490 | GBP | 480,000 | (960 | ) | |||||||||||||||
Subtotal | (690,512 | ) | ||||||||||||||||||||
Total Forward Foreign Currency Contracts-Currency Risk |
| $ | (640,266 | ) | ||||||||||||||||||
Abbreviations:
| AUD | – Australian Dollar | |
| CAD | – Canadian Dollar | |
| CHF | – Swiss Franc |
| EUR | – Euro | |
| GBP | – British Pound Sterling | |
| ILS | – Israeli Sheqel |
| JPY | – Japanese Yen | |
| NOK | – Norwegian Krone | |
| NZD | – New Zealand Dollar |
| SEK | – Swedish Krona | |
| SGD | – Singapore Dollar | |
| USD | – U.S. Dollar |
See accompanying Notes to Financial Statements which are an integral part of the financial statements.
11 Invesco Global Low Volatility Equity Yield Fund
Statement of Assets and Liabilities
December 31, 2017
Assets: | ||||
Investments in securities, at value (Cost $93,990,513) | $ | 102,177,738 | ||
Investments in affiliated money market funds, at value (Cost $3,162,454) | 3,162,393 | |||
Other investments: | ||||
Unrealized appreciation on forward foreign currency contracts outstanding | 50,246 | |||
Foreign currencies, at value (Cost $561,784) | 568,359 | |||
Deposits with brokers: | ||||
Cash collateral — exchange-traded futures contracts | 113,777 | |||
Receivable for: | ||||
Fund shares sold | 54,316 | |||
Dividends | 269,370 | |||
Investment for trustee deferred compensation and retirement plans | 88,918 | |||
Other assets | 30,935 | |||
Total assets | 106,516,052 | |||
Liabilities: | ||||
Other investments: | ||||
Variation margin payable — futures contracts | 8,277 | |||
Unrealized depreciation on forward foreign currency contracts outstanding | 690,512 | |||
Payable for: | ||||
Fund shares reacquired | 94,616 | |||
Accrued fees to affiliates | 76,403 | |||
Accrued trustees’ and officers’ fees and benefits | 640 | |||
Accrued other operating expenses | 60,227 | |||
Trustee deferred compensation and retirement plans | 97,944 | |||
Total liabilities | 1,028,619 | |||
Net assets applicable to shares outstanding | $ | 105,487,433 | ||
Net assets consist of: | ||||
Shares of beneficial interest | $ | 107,113,604 | ||
Undistributed net investment income | 32,207 | |||
Undistributed net realized gain (loss) | (9,228,376 | ) | ||
Net unrealized appreciation | 7,569,998 | |||
| $ | 105,487,433 | |||
Net Assets: | ||||
Class A | $ | 88,550,281 | ||
Class B | $ | 511,588 | ||
Class C | $ | 9,163,076 | ||
Class R | $ | 1,495,828 | ||
Class Y | $ | 4,713,906 | ||
Class R5 | $ | 1,042,095 | ||
Class R6 | $ | 10,659 | ||
Shares outstanding, no par value, |
| |||
Class A | 6,373,008 | |||
Class B | 38,890 | |||
Class C | 697,647 | |||
Class R | 107,505 | |||
Class Y | 338,506 | |||
Class R5 | 74,110 | |||
Class R6 | 758 | |||
Class A: | ||||
Net asset value per share | $ | 13.89 | ||
Maximum offering price per share | ||||
(Net asset value of $13.89 ¸ 94.50%) | $ | 14.70 | ||
Class B: | ||||
Net asset value and offering price per share | $ | 13.15 | ||
Class C: | ||||
Net asset value and offering price per share | $ | 13.13 | ||
Class R: | ||||
Net asset value and offering price per share | $ | 13.91 | ||
Class Y: | ||||
Net asset value and offering price per share | $ | 13.93 | ||
Class R5: | ||||
Net asset value and offering price per share | $ | 14.06 | ||
Class R6: | ||||
Net asset value and offering price per share | $ | 14.06 | ||
See accompanying Notes to Financial Statements which are an integral part of the financial statements.
12 Invesco Global Low Volatility Equity Yield Fund
Statement of Operations
For the year ended December 31, 2017
Investment income: | ||||
Dividends (net of foreign withholding taxes of $225,281) | $ | 4,794,553 | ||
Dividends from affiliated money market funds (includes securities lending income of $27,659) | 49,561 | |||
Total investment income | 4,844,114 | |||
Expenses: | ||||
Advisory fees | 864,355 | |||
Administrative services fees | 50,000 | |||
Custodian fees | 27,383 | |||
Distribution fees: | ||||
Class A | 226,696 | |||
Class B | 7,809 | |||
Class C | 95,967 | |||
Class R | 7,613 | |||
Transfer agent fees — A, B, C, R and Y | 280,988 | |||
Transfer agent fees — R5 | 1,016 | |||
Transfer agent fees — R6 | 8 | |||
Trustees’ and officers’ fees and benefits | 22,451 | |||
Registration and filing fees | 90,942 | |||
Reports to shareholders | 85,616 | |||
Professional services fees | 74,925 | |||
Other | 18,423 | |||
Total expenses | 1,854,192 | |||
Less: Fees waived and expense offset arrangement(s) | (7,192 | ) | ||
Net expenses | 1,847,000 | |||
Net investment income | 2,997,114 | |||
Realized and unrealized gain (loss) from: | ||||
Net realized gain (loss) from: | ||||
Investment securities | 7,095,916 | |||
Foreign currencies | (6,983 | ) | ||
Forward foreign currency contracts | (1,564,284 | ) | ||
Futures contracts | 309,065 | |||
| 5,833,714 | ||||
Change in net unrealized appreciation (depreciation) of: | ||||
Investment securities | 7,697,053 | |||
Foreign currencies | 21,502 | |||
Forward foreign currency contracts | (640,266 | ) | ||
Futures contracts | 16,168 | |||
| 7,094,457 | ||||
Net realized and unrealized gain | 12,928,171 | |||
Net increase in net assets resulting from operations | $ | 15,925,285 | ||
See accompanying Notes to Financial Statements which are an integral part of the financial statements.
13 Invesco Global Low Volatility Equity Yield Fund
Statement of Changes in Net Assets
For the years ended December 31, 2017 and 2016
| 2017 | 2016 | |||||||
Operations: | ||||||||
Net investment income | $ | 2,997,114 | $ | 3,767,572 | ||||
Net realized gain (loss) | 5,833,714 | (2,033,775 | ) | |||||
Change in net unrealized appreciation | 7,094,457 | 2,468,505 | ||||||
Net increase in net assets resulting from operations | 15,925,285 | 4,202,302 | ||||||
Distributions to shareholders from net investment income: | ||||||||
Class A | (2,741,152 | ) | (3,600,966 | ) | ||||
Class B | (16,938 | ) | (41,779 | ) | ||||
Class C | (217,236 | ) | (325,800 | ) | ||||
Class R | (42,304 | ) | (46,674 | ) | ||||
Class Y | (150,904 | ) | (150,047 | ) | ||||
Class R5 | (35,713 | ) | (53,603 | ) | ||||
Class R6 | (269 | ) | — | |||||
Total distributions from net investment income | (3,204,516 | ) | (4,218,869 | ) | ||||
Share transactions–net: | ||||||||
Class A | (14,291,301 | ) | (16,316,528 | ) | ||||
Class B | (692,562 | ) | (864,046 | ) | ||||
Class C | (2,272,020 | ) | (2,608,033 | ) | ||||
Class R | (74,917 | ) | 12,401 | |||||
Class Y | 889,797 | (878,112 | ) | |||||
Class R5 | (80,257 | ) | (988,657 | ) | ||||
Class R6 | 10,014 | — | ||||||
Net increase (decrease) in net assets resulting from share transactions | (16,511,246 | ) | (21,642,975 | ) | ||||
Net increase (decrease) in net assets | (3,790,477 | ) | (21,659,542 | ) | ||||
Net assets: | ||||||||
Beginning of year | 109,277,910 | 130,937,452 | ||||||
End of year (includes undistributed net investment income of $32,207 and $380,316, respectively) | $ | 105,487,433 | $ | 109,277,910 | ||||
Notes to Financial Statements
December 31, 2017
NOTE 1—Significant Accounting Policies
Invesco Global Low Volatility Equity Yield Fund (the “Fund”) is a series portfolio of AIM Growth Series (Invesco Growth Series) (the “Trust”). The Trust is organized as a Delaware statutory trust and is registered under the Investment Company Act of 1940, as amended (the “1940 Act”), as an open-end series management investment company consisting of twenty-nine separate series portfolios, each authorized to issue an unlimited number of shares of beneficial interest. The assets, liabilities and operations of each portfolio are accounted for separately. Information presented in these financial statements pertains only to the Fund. Matters affecting each portfolio or class will be voted on exclusively by the shareholders of such portfolio or class.
The Fund’s investment objective is income and long-term growth of capital.
The Fund currently consists of seven different classes of shares: Class A, Class B, Class C, Class R, Class Y, Class R5 and Class R6. On April 4, 2017, the Fund began offering Class R6 shares. Class Y shares are available only to certain investors. Class A shares are sold with a front-end sales charge unless certain waiver criteria are met and under certain circumstances load waived shares may be subject to contingent deferred sales charges (“CDSC”). Class C shares are sold with a CDSC. Class R, Class Y, Class R5 and Class R6 shares are sold at net asset value. Effective November 30, 2010, new or additional investments in Class B shares are no longer permitted. Existing shareholders of Class B shares may continue to reinvest dividends and capital gains distributions in Class B shares until they convert to Class A shares. Also, shareholders in Class B shares will be able to exchange those shares for Class B shares of other Invesco Funds offering such shares until they convert to Class A shares. Generally, Class B shares will automatically convert to Class A shares on or about the month-end, which is at least eight years after the date of purchase. Redemption of Class B shares prior to the conversion date will be subject to a CDSC. Effective January 26, 2018, all of the Fund’s outstanding Class B shares were converted to Class A shares, in advance of their normally scheduled conversion. No CDSC was paid in connection with this early conversion.
The Fund is an investment company and accordingly follows the investment company accounting and reporting guidance in accordance with Financial Accounting Standards Board Accounting Standards Codification Topic 946, Financial Services — Investment Companies.
14 Invesco Global Low Volatility Equity Yield Fund
The following is a summary of the significant accounting policies followed by the Fund in the preparation of its financial statements.
| A. | Security Valuations — Securities, including restricted securities, are valued according to the following policy. |
A security listed or traded on an exchange (except convertible securities) is valued at its last sales price or official closing price as of the close of the customary trading session on the exchange where the security is principally traded, or lacking any sales or official closing price on a particular day, the security may be valued at the closing bid price on that day. Securities traded in the over-the-counter market are valued based on prices furnished by independent pricing services or market makers. When such securities are valued by an independent pricing service they may be considered fair valued. Futures contracts are valued at the final settlement price set by an exchange on which they are principally traded. Listed options are valued at the mean between the last bid and asked prices from the exchange on which they are principally traded. Options not listed on an exchange are valued by an independent source at the mean between the last bid and asked prices. For purposes of determining net asset value (“NAV”) per share, futures and option contracts generally are valued 15 minutes after the close of the customary trading session of the New York Stock Exchange (“NYSE”).
Investments in open-end and closed-end registered investment companies that do not trade on an exchange are valued at the end-of-day net asset value per share. Investments in open-end and closed-end registered investment companies that trade on an exchange are valued at the last sales price or official closing price as of the close of the customary trading session on the exchange where the security is principally traded.
Debt obligations (including convertible securities) and unlisted equities are fair valued using an evaluated quote provided by an independent pricing service. Evaluated quotes provided by the pricing service may be determined without exclusive reliance on quoted prices, and may reflect appropriate factors such as institution-size trading in similar groups of securities, developments related to specific securities, dividend rate (for unlisted equities), yield (for debt obligations), quality, type of issue, coupon rate (for debt obligations), maturity (for debt obligations), individual trading characteristics and other market data. Pricing services generally value debt obligations assuming orderly transactions of institutional round lot size, but a fund may hold or transact in the same securities in smaller, odd lot sizes. Odd lots often trade at lower prices than institutional round lots. Debt obligations are subject to interest rate and credit risks. In addition, all debt obligations involve some risk of default with respect to interest and/or principal payments.
Foreign securities’ (including foreign exchange contracts) prices are converted into U.S. dollar amounts using the applicable exchange rates as of the close of the NYSE. If market quotations are available and reliable for foreign exchange-traded equity securities, the securities will be valued at the market quotations. Because trading hours for certain foreign securities end before the close of the NYSE, closing market quotations may become unreliable. If between the time trading ends on a particular security and the close of the customary trading session on the NYSE, events occur that the investment adviser determines are significant and make the closing price unreliable, the Fund may fair value the security. If the event is likely to have affected the closing price of the security, the security will be valued at fair value in good faith using procedures approved by the Board of Trustees. Adjustments to closing prices to reflect fair value may also be based on a screening process of an independent pricing service to indicate the degree of certainty, based on historical data, that the closing price in the principal market where a foreign security trades is not the current value as of the close of the NYSE. Foreign securities’ prices meeting the approved degree of certainty that the price is not reflective of current value will be priced at the indication of fair value from the independent pricing service. Multiple factors may be considered by the independent pricing service in determining adjustments to reflect fair value and may include information relating to sector indices, American Depositary Receipts and domestic and foreign index futures. Foreign securities may have additional risks including exchange rate changes, potential for sharply devalued currencies and high inflation, political and economic upheaval, the relative lack of issuer information, relatively low market liquidity and the potential lack of strict financial and accounting controls and standards.
Securities for which market prices are not provided by any of the above methods may be valued based upon quotes furnished by independent sources. The last bid price may be used to value equity securities. The mean between the last bid and asked prices is used to value debt obligations, including corporate loans.
Securities for which market quotations are not readily available or became unreliable are valued at fair value as determined in good faith by or under the supervision of the Trust’s officers following procedures approved by the Board of Trustees. Issuer specific events, market trends, bid/asked quotes of brokers and information providers and other market data may be reviewed in the course of making a good faith determination of a security’s fair value.
The Fund may invest in securities that are subject to interest rate risk, meaning the risk that the prices will generally fall as interest rates rise and, conversely, the prices will generally rise as interest rates fall. Specific securities differ in their sensitivity to changes in interest rates depending on their individual characteristics. Changes in interest rates may result in increased market volatility, which may affect the value and/or liquidity of certain Fund investments.
Valuations change in response to many factors including the historical and prospective earnings of the issuer, the value of the issuer’s assets, general economic conditions, interest rates, investor perceptions and market liquidity. Because of the inherent uncertainties of valuation, the values reflected in the financial statements may materially differ from the value received upon actual sale of those investments.
| B. | Securities Transactions and Investment Income — Securities transactions are accounted for on a trade date basis. Realized gains or losses on sales are computed on the basis of specific identification of the securities sold. Interest income (net of withholding tax, if any) is recorded on the accrual basis from settlement date. Dividend income (net of withholding tax, if any) is recorded on the ex-dividend date. |
The Fund may periodically participate in litigation related to Fund investments. As such, the Fund may receive proceeds from litigation settlements. Any proceeds received are included in the Statement of Operations as realized gain (loss) for investments no longer held and as unrealized gain (loss) for investments still held.
Brokerage commissions and mark ups are considered transaction costs and are recorded as an increase to the cost basis of securities purchased and/or a reduction of proceeds on a sale of securities. Such transaction costs are included in the determination of net realized and unrealized gain (loss) from investment securities reported in the Statement of Operations and the Statement of Changes in Net Assets and the net realized and unrealized gains (losses) on securities per share in the Financial Highlights. Transaction costs are included in the calculation of the Fund’s net asset value and, accordingly, they reduce the Fund’s total returns. These transaction costs are not considered operating expenses and are not reflected in net investment income reported in the Statement of Operations and the Statement of Changes in Net Assets, or the net investment income per share and the ratios of expenses and net investment income reported in the Financial Highlights, nor are they limited by any expense limitation arrangements between the Fund and the investment adviser.
15 Invesco Global Low Volatility Equity Yield Fund
The Fund allocates income and realized and unrealized capital gains and losses to a class based on the relative net assets of each class.
| C. | Country Determination — For the purposes of making investment selection decisions and presentation in the Schedule of Investments, the investment adviser may determine the country in which an issuer is located and/or credit risk exposure based on various factors. These factors include the laws of the country under which the issuer is organized, where the issuer maintains a principal office, the country in which the issuer derives 50% or more of its total revenues and the country that has the primary market for the issuer’s securities, as well as other criteria. Among the other criteria that may be evaluated for making this determination are the country in which the issuer maintains 50% or more of its assets, the type of security, financial guarantees and enhancements, the nature of the collateral and the sponsor organization. Country of issuer and/or credit risk exposure has been determined to be the United States of America, unless otherwise noted. |
| D. | Distributions — Distributions from net investment income, if any, are declared and paid quarterly and are recorded on the ex-dividend date. Distributions from net realized capital gain, if any, are generally declared and paid annually and recorded on the ex-dividend date. The Fund may elect to treat a portion of the proceeds from redemptions as distributions for federal income tax purposes. |
| E. | Federal Income Taxes — The Fund intends to comply with the requirements of Subchapter M of the Internal Revenue Code of 1986, as amended (the “Internal Revenue Code”), necessary to qualify as a regulated investment company and to distribute substantially all of the Fund’s taxable earnings to shareholders. As such, the Fund will not be subject to federal income taxes on otherwise taxable income (including net realized capital gain) that is distributed to shareholders. Therefore, no provision for federal income taxes is recorded in the financial statements. |
The Fund recognizes the tax benefits of uncertain tax positions only when the position is more likely than not to be sustained. Management has analyzed the Fund’s uncertain tax positions and concluded that no liability for unrecognized tax benefits should be recorded related to uncertain tax positions. Management is not aware of any tax positions for which it is reasonably possible that the total amounts of unrecognized tax benefits will change materially in the next 12 months.
The Fund files tax returns in the U.S. Federal jurisdiction and certain other jurisdictions. Generally, the Fund is subject to examinations by such taxing authorities for up to three years after the filing of the return for the tax period.
| F. | Accounting Estimates — The preparation of financial statements in conformity with accounting principles generally accepted in the United States of America (“GAAP”) requires management to make estimates and assumptions that affect the reported amounts of assets and liabilities at the date of the financial statements and the reported amounts of revenues and expenses during the reporting period including estimates and assumptions related to taxation. Actual results could differ from those estimates by a significant amount. In addition, the Fund monitors for material events or transactions that may occur or become known after the period-end date and before the date the financial statements are released to print. |
| G. | Expenses — Fees provided for under the Rule 12b-1 plan of a particular class of the Fund are charged to the operations of such class. Transfer agency fees and expenses and other shareholder recordkeeping fees and expenses attributable to Class R5 and Class R6 are allocated to each share class based on relative net assets. Sub-accounting fees attributable to Class R5 are charged to the operations of the class. Transfer agency fees and expenses and other shareholder recordkeeping fees and expenses relating to all other classes are allocated among those classes based on relative net assets. All other expenses are allocated among the classes based on relative net assets. |
| H. | Indemnifications — Under the Trust’s organizational documents, each Trustee, officer, employee or other agent of the Trust is indemnified against certain liabilities that may arise out of the performance of their duties to the Fund. Additionally, in the normal course of business, the Fund enters into contracts, including the Fund’s servicing agreements, that contain a variety of indemnification clauses. The Fund’s maximum exposure under these arrangements is unknown as this would involve future claims that may be made against the Fund that have not yet occurred. The risk of material loss as a result of such indemnification claims is considered remote. |
| I. | Securities Lending — The Fund may lend portfolio securities having a market value up to one-third of the Fund’s total assets. Such loans are secured by collateral equal to no less than the market value of the loaned securities determined daily by the securities lending provider. Such collateral will be cash or debt securities issued or guaranteed by the U.S. Government or any of its sponsored agencies. Cash collateral received in connection with these loans is invested in short-term money market instruments or affiliated money market funds and is shown as such on the Schedule of Investments. The Fund bears the risk of loss with respect to the investment of collateral. It is the Fund’s policy to obtain additional collateral from or return excess collateral to the borrower by the end of the next business day, following the valuation date of the securities loaned. Therefore, the value of the collateral held may be temporarily less than the value of the securities on loan. When loaning securities, the Fund retains certain benefits of owning the securities, including the economic equivalent of dividends or interest generated by the security. Lending securities entails a risk of loss to the Fund if, and to the extent that, the market value of the securities loaned were to increase and the borrower did not increase the collateral accordingly, and the borrower failed to return the securities. The securities loaned are subject to termination at the option of the borrower or the Fund. Upon termination, the borrower will return to the Fund the securities loaned and the Fund will return the collateral. Upon the failure of the borrower to return the securities, collateral may be liquidated and the securities may be purchased on the open market to replace the loaned securities. The Fund could experience delays and costs in gaining access to the collateral and the securities may lose value during the delay which could result in potential losses to the Fund. Some of these losses may be indemnified by the lending agent. The Fund bears the risk of any deficiency in the amount of the collateral available for return to the borrower due to any loss on the collateral invested. Dividends received on cash collateral investments for securities lending transactions, which are net of compensation to counterparties, are included in Dividends from affiliated money market funds on the Statement of Operations. The aggregate value of securities out on loan, if any, is shown as a footnote on the Statement of Assets and Liabilities. |
| J. | Foreign Currency Translations — Foreign currency is valued at the close of the NYSE based on quotations posted by banks and major currency dealers. Portfolio securities and other assets and liabilities denominated in foreign currencies are translated into U.S. dollar amounts at date of valuation. Purchases and sales of portfolio securities (net of foreign taxes withheld on disposition) and income items denominated in foreign currencies are translated into U.S. dollar amounts on the respective dates of such transactions. The Fund does not separately account for the portion of the results of operations resulting from changes in foreign exchange rates on investments and the fluctuations arising from changes in market prices of securities held. The combined results of changes in foreign exchange rates and the fluctuation of market prices on investments (net of estimated foreign tax withholding) are included with the net realized and unrealized gain or loss from investments in the Statement of Operations. Reported net realized foreign currency gains or losses arise from (1) sales of foreign currencies, (2) currency gains or losses realized between the trade and settlement dates on securities transactions, and (3) the difference between the amounts of dividends, |
16 Invesco Global Low Volatility Equity Yield Fund
| interest, and foreign withholding taxes recorded on the Fund’s books and the U.S. dollar equivalent of the amounts actually received or paid. Net unrealized foreign currency gains and losses arise from changes in the fair values of assets and liabilities, other than investments in securities at fiscal period end, resulting from changes in exchange rates. |
The Fund may invest in foreign securities, which may be subject to foreign taxes on income, gains on investments or currency repatriation, a portion of which may be recoverable. Foreign taxes, if any, are recorded based on the tax regulations and rates that exist in the foreign markets in which the Fund invests and are shown in the Statement of Operations.
| K. | Forward Foreign Currency Contracts — The Fund may engage in foreign currency transactions either on a spot (i.e. for prompt delivery and settlement) basis, or through forward foreign currency contracts, to manage or minimize currency or exchange rate risk. |
The Fund may also enter into forward foreign currency contracts for the purchase or sale of a security denominated in a foreign currency in order to “lock in” the U.S. dollar price of that security, or the Fund may also enter into forward foreign currency contracts that do not provide for physical settlement of the two currencies, but instead are settled by a single cash payment calculated as the difference between the agreed upon exchange rate and the spot rate at settlement based upon an agreed upon notional amount (non-deliverable forwards). The Fund will set aside liquid assets in an amount equal to the daily mark-to-market obligation for forward foreign currency contracts.
A forward foreign currency contract is an obligation between two parties (“Counterparties”) to purchase or sell a specific currency for an agreed-upon price at a future date. The use of forward foreign currency contracts does not eliminate fluctuations in the price of the underlying securities the Fund owns or intends to acquire but establishes a rate of exchange in advance. Fluctuations in the value of these contracts are measured by the difference in the contract date and reporting date exchange rates and are recorded as unrealized appreciation (depreciation) until the contracts are closed. When the contracts are closed, realized gains (losses) are recorded. Realized and unrealized gains (losses) on the contracts are included in the Statement of Operations. The primary risks associated with forward foreign currency contracts include failure of the Counterparty to meet the terms of the contract and the value of the foreign currency changing unfavorably. These risks may be in excess of the amounts reflected in the Statement of Assets and Liabilities.
| L. | Futures Contracts — The Fund may enter into futures contracts to manage exposure to interest rate, equity and market price movements and/or currency risks. A futures contract is an agreement between two parties (“Counterparties”) to purchase or sell a specified underlying security, currency or commodity (or delivery of a cash settlement price, in the case of an index future) for a fixed price at a future date. The Fund currently invests only in exchange-traded futures and they are standardized as to maturity date and underlying financial instrument. Initial margin deposits required upon entering into futures contracts are satisfied by the segregation of specific securities or cash as collateral at the futures commission merchant (broker). During the period the futures contracts are open, changes in the value of the contracts are recognized as unrealized gains or losses by recalculating the value of the contracts on a daily basis. Subsequent or variation margin payments are received or made depending upon whether unrealized gains or losses are incurred. These amounts are reflected as receivables or payables on the Statement of Assets and Liabilities. When the contracts are closed or expire, the Fund recognizes a realized gain or loss equal to the difference between the proceeds from, or cost of, the closing transaction and the Fund’s basis in the contract. The net realized gain (loss) and the change in unrealized gain (loss) on futures contracts held during the period is included on the Statement of Operations. The primary risks associated with futures contracts are market risk and the absence of a liquid secondary market. If the Fund were unable to liquidate a futures contract and/or enter into an offsetting closing transaction, the Fund would continue to be subject to market risk with respect to the value of the contracts and continue to be required to maintain the margin deposits on the futures contracts. Futures contracts have minimal Counterparty risk since the exchange’s clearinghouse, as Counterparty to all exchange-traded futures, guarantees the futures against default. Risks may exceed amounts recognized in the Statement of Assets and Liabilities. |
| M. | Collateral — To the extent the Fund has pledged or segregated a security as collateral and that security is subsequently sold, it is the Fund’s practice to replace such collateral no later than the next business day. This practice does not apply to securities pledged as collateral for securities lending transactions. |
NOTE 2—Advisory Fees and Other Fees Paid to Affiliates
The Trust has entered into a master investment advisory agreement with Invesco Advisers, Inc. (the “Adviser” or “Invesco”). Under the terms of the investment advisory agreement, the Fund accrues daily and pays monthly an advisory fee to the Adviser based on the annual rate of the Fund’s average daily net assets as follows:
| Average Daily Net Assets | Rate | |||
First $250 million | 0.80% | |||
Next $250 million | 0.78% | |||
Next $500 million | 0.76% | |||
Next $1.5 billion | 0.74% | |||
Next $2.5 billion | 0.72% | |||
Next $2.5 billion | 0.70% | |||
Next $2.5 billion | 0.68% | |||
Over $10 billion | 0.66% | |||
For the year ended December 31, 2017, the effective advisory fees incurred by the Fund was 0.80%.
Under the terms of a master sub-advisory agreement between the Adviser and each of Invesco Asset Management Deutschland GmbH, Invesco Asset Management Limited, Invesco Asset Management (Japan) Limited, Invesco Hong Kong Limited, Invesco Senior Secured Management, Inc. and Invesco Canada Ltd. (collectively, the “Affiliated Sub-Advisers”) the Adviser, not the Fund, will pay 40% of the fees paid to the Adviser to any such Affiliated Sub-Adviser(s) that provide(s) discretionary investment management services to the Fund based on the percentage of assets allocated to such Affiliated Sub-Adviser(s).
17 Invesco Global Low Volatility Equity Yield Fund
The Adviser has contractually agreed, through at least June 30, 2018, to waive advisory fees and/or reimburse expenses of all shares to the extent necessary to limit total annual fund operating expenses after fee waiver and/or expense reimbursement (excluding certain items discussed below) of Class A, Class B, Class C, Class R, Class Y, Class R5 and Class R6 shares to 2.00%, 2.75%, 2.75%, 2.25%, 1.75%, 1.75% and 1.75%, respectively, of average daily net assets (the “expense limits”). In determining the Adviser’s obligation to waive advisory fees and/or reimburse expenses, the following expenses are not taken into account, and could cause the total annual fund operating expenses after fee waiver and/or expense reimbursement to exceed the numbers reflected above: (1) interest; (2) taxes; (3) dividend expense on short sales; (4) extraordinary or non-routine items, including litigation expenses; and (5) expenses that the Fund has incurred but did not actually pay because of an expense offset arrangement. Unless Invesco continues the fee waiver agreement, it will terminate on June 30, 2018. During its term, the fee waiver agreement cannot be terminated or amended to increase the expense limits or reduce the advisory fee waiver without approval of the Board of Trustees. The Adviser did not waive fees and/or reimburse expenses during the period under these expense limits.
Further, the Adviser has contractually agreed, through at least June 30, 2019, to waive the advisory fee payable by the Fund in an amount equal to 100% of the net advisory fees the Adviser receives from the affiliated money market funds on investments by the Fund of uninvested cash (excluding investments of cash collateral from securities lending) in such affiliated money market funds.
For the year ended December 31, 2017, the Adviser waived advisory fees of $2,926.
The Trust has entered into a master administrative services agreement with Invesco pursuant to which the Fund has agreed to pay Invesco for certain administrative costs incurred in providing accounting services to the Fund. For the year ended December 31, 2017, expenses incurred under the agreement are shown in the Statement of Operations as Administrative services fees.
The Trust has entered into a transfer agency and service agreement with Invesco Investment Services, Inc. (“IIS”) pursuant to which the Fund has agreed to pay IIS a fee for providing transfer agency and shareholder services to the Fund and reimburse IIS for certain expenses incurred by IIS in the course of providing such services. IIS may make payments to intermediaries that provide omnibus account services, sub-accounting services and/or networking services. All fees payable by IIS to intermediaries that provide omnibus account services or sub-accounting services are charged back to the Fund, subject to certain limitations approved by the Trust’s Board of Trustees. For the year ended December 31, 2017, expenses incurred under the agreement are shown in the Statement of Operations as Transfer agent fees.
The Trust has entered into master distribution agreements with Invesco Distributors, Inc. (“IDI”) to serve as the distributor for the Class A, Class B, Class C, Class R, Class Y, Class R5 and Class R6 shares of the Fund. The Trust has adopted plans pursuant to Rule 12b-1 under the 1940 Act with respect to the Fund’s Class A, Class B, Class C and Class R shares (collectively, the “Plans”). The Fund, pursuant to the Plans, pays IDI compensation at the annual rate of 0.25% of the Fund’s average daily net assets of Class A shares, 1.00% of the average daily net assets of Class B and Class C shares and 0.50% of the average daily net assets of Class R shares. The fees are accrued daily and paid monthly. Of the Plan payments, up to 0.25% of the average daily net assets of each class of shares may be paid to furnish continuing personal shareholder services to customers who purchase and own shares of such classes. Any amounts not paid as a service fee under the Plans would constitute an asset-based sales charge. Rules of the Financial Industry Regulatory Authority (“FINRA”) impose a cap on the total sales charges, including asset-based sales charges, that may be paid by any class of shares of the Fund. For the year ended December 31, 2017, expenses incurred under the Plans are shown in the Statement of Operations as Distribution fees.
Front-end sales commissions and CDSC (collectively, the “sales charges”) are not recorded as expenses of the Fund. Front-end sales commissions are deducted from proceeds from the sales of Fund shares prior to investment in Class A shares of the Fund. CDSC are deducted from redemption proceeds prior to remittance to the shareholder. During the year ended December 31, 2017, IDI advised the Fund that IDI retained $8,130 in front-end sales commissions from the sale of Class A shares and $17 and $188 from Class A and Class C shares, respectively, for CDSC imposed on redemptions by shareholders.
Certain officers and trustees of the Trust are officers and directors of the Adviser, IIS and/or IDI.
NOTE 3—Additional Valuation Information
GAAP defines fair value as the price that would be received to sell an asset or paid to transfer a liability in an orderly transaction between market participants at the measurement date, under current market conditions. GAAP establishes a hierarchy that prioritizes the inputs to valuation methods, giving the highest priority to readily available unadjusted quoted prices in an active market for identical assets (Level 1) and the lowest priority to significant unobservable inputs (Level 3), generally when market prices are not readily available or are unreliable. Based on the valuation inputs, the securities or other investments are tiered into one of three levels. Changes in valuation methods may result in transfers in or out of an investment’s assigned level:
| Level 1 — | Prices are determined using quoted prices in an active market for identical assets. |
| Level 2 — | Prices are determined using other significant observable inputs. Observable inputs are inputs that other market participants may use in pricing a security. These may include quoted prices for similar securities, interest rates, prepayment speeds, credit risk, yield curves, loss severities, default rates, discount rates, volatilities and others. |
| Level 3 — | Prices are determined using significant unobservable inputs. In situations where quoted prices or observable inputs are unavailable (for example, when there is little or no market activity for an investment at the end of the period), unobservable inputs may be used. Unobservable inputs reflect the Fund’s own assumptions about the factors market participants would use in determining fair value of the securities or instruments and would be based on the best available information. |
The following is a summary of the tiered valuation input levels, as of December 31, 2017. The level assigned to the securities valuations may not be an indication of the risk or liquidity associated with investing in those securities. Because of the inherent uncertainties of valuation, the values reflected in the financial statements may materially differ from the value received upon actual sale of those investments.
The Fund’s policy is to recognize transfers in and out of the valuation levels as of the end of the reporting period.
18 Invesco Global Low Volatility Equity Yield Fund
During the year ended December 31, 2017, there were transfers from Level 1 to Level 2 of $2,391,953 and from Level 2 to Level 1 of $14,816,813, due to foreign fair value adjustments.
| Level 1 | Level 2 | Level 3 | Total | |||||||||||||
| Investments in Securities | ||||||||||||||||
Australia | $ | 1,898,366 | $ | 7,488,891 | $ | — | $ | 9,387,257 | ||||||||
Canada | 5,781,408 | — | — | 5,781,408 | ||||||||||||
China | 1,840,715 | — | — | 1,840,715 | ||||||||||||
Finland | — | 2,167,365 | — | 2,167,365 | ||||||||||||
France | — | 1,990,631 | — | 1,990,631 | ||||||||||||
Hong Kong | 3,819,391 | 971,119 | — | 4,790,510 | ||||||||||||
Israel | 1,776,186 | — | — | 1,776,186 | ||||||||||||
Japan | 7,790,019 | 2,089,585 | — | 9,879,604 | ||||||||||||
Malta | 2,204,208 | — | — | 2,204,208 | ||||||||||||
New Zealand | 3,657,042 | 3,048,203 | — | 6,705,245 | ||||||||||||
Norway | 1,552,990 | — | — | 1,552,990 | ||||||||||||
Singapore | — | 2,066,274 | — | 2,066,274 | ||||||||||||
Sweden | 2,058,843 | — | — | 2,058,843 | ||||||||||||
Switzerland | 2,013,442 | — | — | 2,013,442 | ||||||||||||
United Kingdom | 9,220,006 | 5,965,827 | — | 15,185,833 | ||||||||||||
United States | 32,777,227 | — | — | 32,777,227 | ||||||||||||
Money Market Funds | 3,162,393 | — | — | 3,162,393 | ||||||||||||
Total Investments in Securities | 79,552,236 | 25,787,895 | — | 105,340,131 | ||||||||||||
| Other Investments - Assets* | ||||||||||||||||
Forward Foreign Currency Contracts | 50,246 | — | — | 50,246 | ||||||||||||
Futures Contracts | 23,863 | — | — | 23,863 | ||||||||||||
| 74,109 | — | — | 74,109 | |||||||||||||
| Other Investments - Liabilities* | ||||||||||||||||
Forward Foreign Currency Contracts | (690,512 | ) | — | — | (690,512 | ) | ||||||||||
Futures Contracts | (10,434 | ) | — | — | (10,434 | ) | ||||||||||
| (700,946 | ) | — | — | (700,946 | ) | |||||||||||
Total Other Investments | (626,837 | ) | — | — | (626,837 | ) | ||||||||||
Total Investments | $ | 78,925,399 | $ | 25,787,895 | $ | — | $ | 104,713,294 | ||||||||
| * | Unrealized appreciation (depreciation). |
NOTE 4—Derivative Investments
The Fund may enter into an International Swaps and Derivatives Association Master Agreement (“ISDA Master Agreement”) under which a fund may trade OTC derivatives. An OTC transaction entered into under an ISDA Master Agreement typically involves a collateral posting arrangement, payment netting provisions and close-out netting provisions. These netting provisions allow for reduction of credit risk through netting of contractual obligations. The enforceability of the netting provisions of the ISDA Master Agreement depends on the governing law of the ISDA Master Agreement, among other factors.
For financial reporting purposes, the Fund does not offset OTC derivative assets or liabilities that are subject to ISDA Master Agreements in the Statement of Assets and Liabilities.
Value of Derivative Investments at Period-End
The table below summarizes the value of the Fund’s derivative investments, detailed by primary risk exposure, held as of December 31, 2017:
| Value | ||||||||||||
| Derivative Assets | Currency Risk | Equity Risk | Total | |||||||||
Unrealized appreciation on futures contracts — Exchange-Traded(a) | $ | — | $ | 23,863 | $ | 23,863 | ||||||
Unrealized appreciation on forward foreign currency contracts | 50,246 | — | 50,246 | |||||||||
Total Derivative Assets | 50,246 | 23,863 | 74,109 | |||||||||
Derivatives not subject to master netting agreements | — | (23,863 | ) | (23,863 | ) | |||||||
Total Derivative Assets subject to master netting agreements | $ | 50,246 | $ | — | $ | 50,246 | ||||||
| (a) | The daily variation margin receivable (payable) at period-end is recorded in the Statement of Assets and Liabilities. |
19 Invesco Global Low Volatility Equity Yield Fund
| Value | ||||||||||||
| Derivative Liabilities | Currency Risk | Equity Risk | Total | |||||||||
Unrealized depreciation on futures contracts — Exchange-Traded(a) | $ | — | $ | (10,434 | ) | $ | (10,434 | ) | ||||
Unrealized depreciation on forward foreign currency contracts outstanding | (690,512 | ) | — | (690,512 | ) | |||||||
Total Derivative Liabilities | (690,512 | ) | (10,434 | ) | (700,946 | ) | ||||||
Derivatives not subject to master netting agreements | — | 10,434 | 10,434 | |||||||||
Total Derivative Liabilities subject to master netting agreements | $ | (690,512 | ) | $ | — | $ | (690,512 | ) | ||||
| (a) | The daily variation margin receivable (payable) at period-end is recorded in the Statement of Assets and Liabilities. |
Offsetting Assets and Liabilities
The table below reflects the Fund’s exposure to Counterparties subject to either an ISDA Master Agreement or other agreement for OTC derivative transactions as of December 31, 2017.
| Financial Derivative Assets | Financial Derivative Liabilities | Collateral (Received)/Pledged | ||||||||||||||||||||||
| Counterparty | Forward Foreign Currency Contracts | Forward Foreign Currency Contracts | Net Value of Derivatives | Non-Cash | Cash | Net Amount | ||||||||||||||||||
State Street Bank and Trust Co. | $ | 50,246 | $ | (690,512 | ) | $ | (640,266 | ) | $ | — | $ | — | $ | (640,266 | ) | |||||||||
Effect of Derivative Investments for the year ended December 31, 2017
The table below summarizes the gains (losses) on derivative investments, detailed by primary risk exposure, recognized in earnings during the period:
| Location of Gain (Loss) on Statement of Operations | ||||||||||||
Currency Risk | Equity Risk | Total | ||||||||||
Realized Gain (Loss): | ||||||||||||
Forward foreign currency contracts | $ | (1,564,284 | ) | $ | — | $ | (1,564,284 | ) | ||||
Futures contracts | — | 309,065 | 309,065 | |||||||||
Change in Net Unrealized Appreciation (Depreciation): | ||||||||||||
Forward foreign currency contracts | (640,266 | ) | — | (640,266 | ) | |||||||
Futures contracts | — | 16,168 | 16,168 | |||||||||
Total | $ | (2,204,550 | ) | $ | 325,233 | $ | (1,879,317 | ) | ||||
The table below summarizes the average notional value of forward foreign currency contracts and futures contracts outstanding during the period.
| Forward Foreign Currency Contracts | Futures Contracts | |||||||
Average notional value | $ | 58,812,740 | $ | 2,244,097 | ||||
NOTE 5—Expense Offset Arrangement(s)
The expense offset arrangement is comprised of transfer agency credits which result from balances in demand deposit accounts used by the transfer agent for clearing shareholder transactions. For the year ended December 31, 2017, the Fund received credits from this arrangement, which resulted in the reduction of the Fund’s total expenses of $4,266.
NOTE 6—Trustees’ and Officers’ Fees and Benefits
Trustees’ and Officers’ Fees and Benefits include amounts accrued by the Fund to pay remuneration to certain Trustees and Officers of the Fund. Trustees have the option to defer compensation payable by the Fund, and Trustees’ and Officers’ Fees and Benefits also include amounts accrued by the Fund to fund such deferred compensation amounts. Those Trustees who defer compensation have the option to select various Invesco Funds in which their deferral accounts shall be deemed to be invested. Finally, certain current Trustees were eligible to participate in a retirement plan that provided for benefits to be paid upon retirement to Trustees over a period of time based on the number of years of service. The Fund may have certain former Trustees who also participate in a retirement plan and receive benefits under such plan. Trustees’ and Officers’ Fees and Benefits include amounts accrued by the Fund to fund such retirement benefits. Obligations under the deferred compensation and retirement plans represent unsecured claims against the general assets of the Fund.
NOTE 7—Cash Balances
The Fund is permitted to temporarily carry a negative or overdrawn balance in its account with State Street Bank and Trust Company, the custodian bank. Such balances, if any at period-end, are shown in the Statement of Assets and Liabilities under the payable caption Amount due custodian. To compensate the custodian bank for such overdrafts, the overdrawn Fund may either (1) leave funds as a compensating balance in the account so the custodian bank can be compensated by earning the additional interest; or (2) compensate by paying the custodian bank at a rate agreed upon by the custodian bank and Invesco, not to exceed the contractually agreed upon rate.
20 Invesco Global Low Volatility Equity Yield Fund
NOTE 8—Distributions to Shareholders and Tax Components of Net Assets
Tax Character of Distributions to Shareholders Paid During the Fiscal Years Ended December 31, 2017 and 2016:
| 2017 | 2016 | |||||||
Ordinary income | $ | 3,204,516 | $ | 4,218,869 | ||||
Tax Components of Net Assets at Period-End:
| 2017 | ||||
Undistributed ordinary income | $ | 102,068 | ||
Net unrealized appreciation — investments | 8,163,969 | |||
Net unrealized appreciation (depreciation) — foreign currencies and forward foreign currency contracts | 26,328 | |||
Temporary book/tax differences | (83,744 | ) | ||
Capital loss carryforward | (9,834,792 | ) | ||
Shares of beneficial interest | 107,113,604 | |||
Total net assets | $ | 105,487,433 | ||
The difference between book-basis and tax-basis unrealized appreciation (depreciation) is due to differences in the timing of recognition of gains and losses on investments for tax and book purposes. The Fund’s net unrealized appreciation difference is attributable primarily to forward foreign currency contracts, wash sales and the tax treatment of passive foreign investment companies.
The temporary book/tax differences are a result of timing differences between book and tax recognition of income and/or expenses. The Fund’s temporary book/tax differences are the result of the trustee deferral of compensation and retirement plan benefits.
Capital loss carryforward is calculated and reported as of a specific date. Results of transactions and other activity after that date may affect the amount of capital loss carryforward actually available for the Fund to utilize. Capital losses generated in years beginning after December 22, 2010 can be carried forward for an unlimited period, whereas previous losses expire in eight tax years. Capital losses with an expiration period may not be used to offset capital gains until all net capital losses without an expiration date have been utilized. Capital loss carryforwards with no expiration date will retain their character as either short-term or long-term capital losses instead of as short-term capital losses as under prior law. The ability to utilize capital loss carryforwards in the future may be limited under the Internal Revenue Code and related regulations based on the results of future transactions.
The Fund has a capital loss carryforward as of December 31, 2017:
| Capital Loss Carryforward* | ||||||||||||
| Expiration | Short-Term | Long-Term | Total | |||||||||
Not subject to expiration | $ | 9,834,792 | $ | — | $ | 9,834,792 | ||||||
| * | Capital loss carryforward as of the date listed above is reduced for limitations, if any, to the extent required by the Internal Revenue Code and may be further limited depending upon a variety of factors, including the realization of net unrealized gains or losses as of the date of any reorganization. |
NOTE 9—Investment Transactions
The aggregate amount of investment securities (other than short-term securities, U.S. Treasury obligations and money market funds, if any) purchased and sold by the Fund during the year ended December 31, 2017 was $81,654,092 and $100,270,296, respectively. Cost of investments, including any derivatives, on a tax basis includes the adjustments for financial reporting purposes as of the most recently completed federal income tax reporting period-end.
| Unrealized Appreciation (Depreciation) of Investments on a Tax Basis | ||||
Aggregate unrealized appreciation of investments | $ | 12,971,496 | ||
Aggregate unrealized (depreciation) of investments | (4,807,527 | ) | ||
Net unrealized appreciation of investments | $ | 8,163,969 | ||
Cost of investments for tax purposes is $96,549,325.
NOTE 10—Reclassification of Permanent Differences
Primarily as a result of differing book/tax treatment of expired capital loss carryforward, on December 31, 2017, undistributed net investment income was decreased by $140,707, undistributed net realized gain (loss) was increased by $65,477,101 and shares of beneficial interest was decreased by $65,336,394. This reclassification had no effect on the net assets of the Fund.
21 Invesco Global Low Volatility Equity Yield Fund
NOTE 11—Share Information
Summary of Share Activity | ||||||||||||||||
| Years ended December 31, | ||||||||||||||||
| 2017(a) | 2016 | |||||||||||||||
| Shares | Amount | Shares | Amount | |||||||||||||
Sold: | ||||||||||||||||
Class A | 317,987 | $ | 4,269,034 | 353,426 | $ | 4,436,908 | ||||||||||
Class B | 583 | 7,491 | 1,728 | 20,734 | ||||||||||||
Class C | 46,711 | 591,026 | 57,591 | 682,337 | ||||||||||||
Class R | 15,107 | 201,447 | 12,784 | 160,376 | ||||||||||||
Class Y | 313,201 | 4,153,399 | 247,419 | 3,138,248 | ||||||||||||
Class R5 | 18,028 | 238,398 | 28,803 | 354,117 | ||||||||||||
Class R6(b) | 758 | 10,014 | — | — | ||||||||||||
Issued as reinvestment of dividends: | ||||||||||||||||
Class A | 192,594 | 2,581,160 | 270,902 | 3,433,001 | ||||||||||||
Class B | 1,304 | 16,468 | 3,422 | 41,094 | ||||||||||||
Class C | 15,874 | 201,092 | 24,872 | 298,020 | ||||||||||||
Class R | 3,148 | 42,276 | 3,670 | 46,574 | ||||||||||||
Class Y | 9,264 | 124,498 | 7,347 | 93,275 | ||||||||||||
Class R5 | 2,634 | 35,713 | 4,177 | 53,603 | ||||||||||||
Automatic conversion of Class B shares to Class A shares: | ||||||||||||||||
Class A | 41,829 | 556,920 | 52,890 | 662,318 | ||||||||||||
Class B | (44,222 | ) | (556,920 | ) | (55,914 | ) | (662,318 | ) | ||||||||
Reacquired: | ||||||||||||||||
Class A | (1,632,153 | ) | (21,698,415 | ) | (1,968,836 | ) | (24,848,755 | ) | ||||||||
Class B | (12,831 | ) | (159,601 | ) | (22,127 | ) | (263,556 | ) | ||||||||
Class C | (244,716 | ) | (3,064,138 | ) | (303,245 | ) | (3,588,390 | ) | ||||||||
Class R | (23,630 | ) | (318,640 | ) | (15,339 | ) | (194,549 | ) | ||||||||
Class Y | (253,397 | ) | (3,388,100 | ) | (328,003 | ) | (4,109,635 | ) | ||||||||
Class R5 | (26,747 | ) | (354,368 | ) | (112,298 | ) | (1,396,377 | ) | ||||||||
Net increase (decrease) in share activity | (1,258,674 | ) | $ | (16,511,246 | ) | (1,736,731 | ) | $ | (21,642,975 | ) | ||||||
| (a) | There are entities that are record owners of more than 5% of the outstanding shares of the Fund and in the aggregate own 21% of the outstanding shares of the Fund. IDI has an agreement with these entities to sell Fund shares. The Fund, Invesco and/or Invesco affiliates may make payments to these entities, which are considered to be related to the Fund, for providing services to the Fund, Invesco and/or Invesco affiliates including but not limited to services such as securities brokerage, distribution, third party record keeping and account servicing. The Fund has no knowledge as to whether all or any portion of the shares owned of record by these entities are also owned beneficially. |
| (b) | Commencement date of April 4, 2017. |
22 Invesco Global Low Volatility Equity Yield Fund
NOTE 12—Financial Highlights
The following schedule presents financial highlights for a share of the Fund outstanding throughout the periods indicated.
| Net asset value, beginning of period | Net investment income(a) | Net gains (losses) on securities (both realized and unrealized) | Total from investment operations | Dividends from net investment income | Net asset value, end of period | Total return(b) | Net assets, end of period (000’s omitted) | Ratio of expenses to average net assets with fee waivers and/or expenses absorbed | Ratio of expenses to average net assets without fee waivers and/or expenses absorbed | Ratio of net investment income to average net assets | Portfolio turnover(c) | |||||||||||||||||||||||||||||||||||||
Class A | ||||||||||||||||||||||||||||||||||||||||||||||||
Year ended 12/31/17 | $ | 12.37 | $ | 0.38 | $ | 1.55 | $ | 1.93 | $ | (0.41 | ) | $ | 13.89 | 15.77 | % | $ | 88,550 | 1.65 | %(d) | 1.65 | %(d) | 2.83 | %(d) | 78 | % | |||||||||||||||||||||||
Year ended 12/31/16 | 12.40 | 0.40 | 0.02 | 0.42 | (0.45 | ) | 12.37 | 3.34 | 92,154 | 1.49 | 1.52 | 3.14 | 83 | |||||||||||||||||||||||||||||||||||
Year ended 12/31/15 | 13.89 | 0.48 | (1.44 | ) | (0.96 | ) | (0.53 | ) | 12.40 | (7.02 | ) | 108,429 | 1.48 | 1.52 | 3.60 | 94 | ||||||||||||||||||||||||||||||||
Year ended 12/31/14 | 14.44 | 0.53 | (0.55 | ) | (0.02 | ) | (0.53 | ) | 13.89 | (0.33 | ) | 140,461 | 1.45 | 1.46 | 3.55 | 64 | ||||||||||||||||||||||||||||||||
Year ended 12/31/13 | 11.38 | 0.27 | 3.05 | 3.32 | (0.26 | ) | 14.44 | 29.32 | 117,234 | 1.54 | 1.54 | 2.10 | 103 | |||||||||||||||||||||||||||||||||||
Class B | ||||||||||||||||||||||||||||||||||||||||||||||||
Year ended 12/31/17 | 11.71 | 0.26 | 1.47 | 1.73 | (0.29 | ) | 13.15 | 14.91 | 512 | 2.40 | (d) | 2.40 | (d) | 2.08 | (d) | 78 | ||||||||||||||||||||||||||||||||
Year ended 12/31/16 | 11.74 | 0.29 | 0.02 | 0.31 | (0.34 | ) | 11.71 | 2.56 | 1,101 | 2.24 | 2.27 | 2.39 | 83 | |||||||||||||||||||||||||||||||||||
Year ended 12/31/15 | 13.14 | 0.36 | (1.36 | ) | (1.00 | ) | (0.40 | ) | 11.74 | (7.65 | ) | 1,959 | 2.23 | 2.27 | 2.85 | 94 | ||||||||||||||||||||||||||||||||
Year ended 12/31/14 | 13.66 | 0.39 | (0.52 | ) | (0.13 | ) | (0.39 | ) | 13.14 | (1.08 | ) | 3,580 | 2.20 | 2.21 | 2.80 | 64 | ||||||||||||||||||||||||||||||||
Year ended 12/31/13 | 10.81 | 0.16 | 2.89 | 3.05 | (0.20 | ) | 13.66 | 28.34 | 5,434 | 2.29 | 2.29 | 1.35 | 103 | |||||||||||||||||||||||||||||||||||
Class C | ||||||||||||||||||||||||||||||||||||||||||||||||
Year ended 12/31/17 | 11.69 | 0.26 | 1.47 | 1.73 | (0.29 | ) | 13.13 | 14.93 | 9,163 | 2.40 | (d) | 2.40 | (d) | 2.08 | (d) | 78 | ||||||||||||||||||||||||||||||||
Year ended 12/31/16 | 11.72 | 0.28 | 0.02 | 0.30 | (0.33 | ) | 11.69 | 2.56 | 10,283 | 2.24 | 2.27 | 2.39 | 83 | |||||||||||||||||||||||||||||||||||
Year ended 12/31/15 | 13.13 | 0.36 | (1.37 | ) | (1.01 | ) | (0.40 | ) | 11.72 | (7.74 | ) | 12,900 | 2.23 | 2.27 | 2.85 | 94 | ||||||||||||||||||||||||||||||||
Year ended 12/31/14 | 13.66 | 0.40 | (0.52 | ) | (0.12 | ) | (0.41 | ) | 13.13 | (1.06 | ) | 18,936 | 2.20 | 2.21 | 2.80 | 64 | ||||||||||||||||||||||||||||||||
Year ended 12/31/13 | 10.79 | 0.17 | 2.89 | 3.06 | (0.19 | ) | 13.66 | 28.42 | 14,099 | 2.29 | 2.29 | 1.35 | 103 | |||||||||||||||||||||||||||||||||||
Class R | ||||||||||||||||||||||||||||||||||||||||||||||||
Year ended 12/31/17 | 12.38 | 0.35 | 1.56 | 1.91 | (0.38 | ) | 13.91 | 15.55 | 1,496 | 1.90 | (d) | 1.90 | (d) | 2.58 | (d) | 78 | ||||||||||||||||||||||||||||||||
Year ended 12/31/16 | 12.42 | 0.37 | 0.01 | 0.38 | (0.42 | ) | 12.38 | 3.00 | 1,398 | 1.74 | 1.77 | 2.89 | 83 | |||||||||||||||||||||||||||||||||||
Year ended 12/31/15 | 13.91 | 0.44 | (1.44 | ) | (1.00 | ) | (0.49 | ) | 12.42 | (7.24 | ) | 1,388 | 1.73 | 1.77 | 3.35 | 94 | ||||||||||||||||||||||||||||||||
Year ended 12/31/14 | 14.46 | 0.49 | (0.55 | ) | (0.06 | ) | (0.49 | ) | 13.91 | (0.58 | ) | 1,627 | 1.70 | 1.71 | 3.30 | 64 | ||||||||||||||||||||||||||||||||
Year ended 12/31/13 | 11.41 | 0.25 | 3.05 | 3.30 | (0.25 | ) | 14.46 | 29.00 | 1,351 | 1.79 | 1.79 | 1.85 | 103 | |||||||||||||||||||||||||||||||||||
Class Y | ||||||||||||||||||||||||||||||||||||||||||||||||
Year ended 12/31/17 | 12.39 | 0.41 | 1.58 | 1.99 | (0.45 | ) | 13.93 | 16.20 | 4,714 | 1.40 | (d) | 1.40 | (d) | 3.08 | (d) | 78 | ||||||||||||||||||||||||||||||||
Year ended 12/31/16 | 12.42 | 0.43 | 0.02 | 0.45 | (0.48 | ) | 12.39 | 3.60 | 3,339 | 1.24 | 1.27 | 3.39 | 83 | |||||||||||||||||||||||||||||||||||
Year ended 12/31/15 | 13.92 | 0.52 | (1.46 | ) | (0.94 | ) | (0.56 | ) | 12.42 | (6.90 | ) | 4,257 | 1.23 | 1.27 | 3.85 | 94 | ||||||||||||||||||||||||||||||||
Year ended 12/31/14 | 14.49 | 0.57 | (0.55 | ) | 0.02 | (0.59 | ) | 13.92 | (0.04 | ) | 10,067 | 1.20 | 1.21 | 3.80 | 64 | |||||||||||||||||||||||||||||||||
Year ended 12/31/13 | 11.38 | 0.32 | 3.04 | 3.36 | (0.25 | ) | 14.49 | 29.63 | 3,176 | 1.29 | 1.29 | 2.35 | 103 | |||||||||||||||||||||||||||||||||||
Class R5 | ||||||||||||||||||||||||||||||||||||||||||||||||
Year ended 12/31/17 | 12.52 | 0.44 | 1.57 | 2.01 | (0.47 | ) | 14.06 | 16.27 | 1,042 | 1.24 | (d) | 1.24 | (d) | 3.24 | (d) | 78 | ||||||||||||||||||||||||||||||||
Year ended 12/31/16 | 12.56 | 0.45 | 0.02 | 0.47 | (0.51 | ) | 12.52 | 3.67 | 1,004 | 1.10 | 1.10 | 3.53 | 83 | |||||||||||||||||||||||||||||||||||
Year ended 12/31/15 | 14.08 | 0.56 | (1.49 | ) | (0.93 | ) | (0.59 | ) | 12.56 | (6.66 | ) | 2,004 | 1.05 | 1.05 | 4.03 | 94 | ||||||||||||||||||||||||||||||||
Year ended 12/31/14 | 14.63 | 0.61 | (0.55 | ) | 0.06 | (0.61 | ) | 14.08 | 0.21 | 13,373 | 0.97 | 0.98 | 4.03 | 64 | ||||||||||||||||||||||||||||||||||
Year ended 12/31/13 | 11.49 | 0.35 | 3.08 | 3.43 | (0.29 | ) | 14.63 | 29.99 | 25,230 | 1.02 | 1.02 | 2.62 | 103 | |||||||||||||||||||||||||||||||||||
Class R6 | ||||||||||||||||||||||||||||||||||||||||||||||||
Year ended 12/31/17(e) | 13.27 | 0.34 | 0.81 | 1.15 | (0.36 | ) | 14.06 | 8.72 | 11 | 1.20 | (d)(f) | 1.20 | (d)(f) | 3.28 | (d)(f) | 78 | ||||||||||||||||||||||||||||||||
| (a) | Calculated using average shares outstanding. |
| (b) | Includes adjustments in accordance with accounting principles generally accepted in the United States of America and as such, the net asset value for financial reporting purposes and the returns based upon those net asset values may differ from the net asset value and returns for shareholder transactions. Does not include sales charges and is not annualized for periods less than one year, if applicable. |
| (c) | Portfolio turnover is calculated at the fund level and is not annualized for periods less than one year, if applicable. |
| (d) | Ratios are based on average daily net assets (000’s omitted) of $90,678, $781, $9,597, $1,522, $4,440, $1,018 and $10 for Class A, Class B, Class C, Class R, Class Y, Class R5 and Class R6 shares, respectively. |
| (e) | Commencement date of April 4, 2017. |
| (f) | Annualized. |
23 Invesco Global Low Volatility Equity Yield Fund
Report of Independent Registered Public Accounting Firm
To the Board of Trustees of AIM Growth Series (Invesco Growth Series) and Shareholders of Invesco Global Low Volatility Equity Yield Fund
Opinion on the Financial Statements
We have audited the accompanying statement of assets and liabilities, including the schedule of investments, of Invesco Global Low Volatility Equity Yield Fund (one of the funds constituting AIM Growth Series (Invesco Growth Series), hereafter referred to as the “Fund”) as of December 31, 2017, the related statement of operations for the year ended December 31, 2017, the statement of changes in net assets for each of the two years in the period ended December 31, 2017, including the related notes, and the financial highlights for each of the periods indicated therein (collectively referred to as the “financial statements”). In our opinion, the financial statements present fairly, in all material respects, the financial position of the Fund as of December 31, 2017, the results of its operations for the year then ended, the changes in its net assets for each of the two years in the period ended December 31, 2017 and the financial highlights for each of the periods indicated therein in conformity with accounting principles generally accepted in the United States of America.
Basis for Opinion
These financial statements are the responsibility of the Fund’s management. Our responsibility is to express an opinion on the Fund’s financial statements based on our audits. We are a public accounting firm registered with the Public Company Accounting Oversight Board (United States) (“PCAOB”) and are required to be independent with respect to the Fund in accordance with the U.S. federal securities laws and the applicable rules and regulations of the Securities and Exchange Commission and the PCAOB.
We conducted our audits of these financial statements in accordance with the standards of the PCAOB. Those standards require that we plan and perform the audit to obtain reasonable assurance about whether the financial statements are free of material misstatement, whether due to error or fraud.
Our audits included performing procedures to assess the risks of material misstatement of the financial statements, whether due to error or fraud, and performing procedures that respond to those risks. Such procedures included examining, on a test basis, evidence regarding the amounts and disclosures in the financial statements. Our audits also included evaluating the accounting principles used and significant estimates made by management, as well as evaluating the overall presentation of the financial statements. Our procedures included confirmation of securities owned as of December 31, 2017 by correspondence with the custodian, transfer agent and brokers; when replies were not received from brokers, we performed other auditing procedures. We believe that our audits provide a reasonable basis for our opinion.
PricewaterhouseCoopers LLP
Houston, TX
February 23, 2018
We have served as the auditor of one or more of the investment companies in the Invesco/PowerShares group of investment companies since at least 1995. We have not determined the specific year we began serving as auditor.
24 Invesco Global Low Volatility Equity Yield Fund
Calculating your ongoing Fund expenses
Example
As a shareholder of the Fund, you incur two types of costs: (1) transaction costs, which may include sales charges (loads) on purchase payments or contingent deferred sales charges on redemptions, if any; and (2) ongoing costs, including management fees, distribution and/or service (12b-1) fees, and other Fund expenses. This example is intended to help you understand your ongoing costs (in dollars) of investing in the Fund and to compare these costs with ongoing costs of investing in other mutual funds. With the exception of the actual ending account value and expenses of the Class R6 shares, the example is based on an investment of $1,000 invested at the beginning of the period and held for the entire period July 1, 2017 through December 31, 2017.
Actual expenses
The table below provides information about actual account values and actual expenses. You may use the information in this table, together with the amount you invested, to estimate the expenses that you paid over the period. Simply divide your account value by $1,000 (for example, an $8,600 account value divided by $1,000 = 8.6), then multiply the result by the number in the table under the heading entitled “Actual Expenses Paid During Period” to estimate the expenses you paid on your account during this period.
Hypothetical example for comparison purposes
The table below also provides information about hypothetical account values and hypothetical expenses based on the Fund’s actual expense ratio and an assumed rate of return of 5% per year before expenses, which is not the Fund’s actual return.
The hypothetical account values and expenses may not be used to estimate the actual ending account balance or expenses you paid for the period. You may use this information to compare the ongoing costs of investing in the Fund and other funds. To do so, compare this 5% hypothetical example with the 5% hypothetical examples that appear in the shareholder reports of the other funds.
Please note that the expenses shown in the table are meant to highlight your ongoing costs only and do not reflect any transaction costs, such as sales charges (loads) on purchase payments or contingent deferred sales charges on redemptions, if any. Therefore, the hypothetical information is useful in comparing ongoing costs only, and will not help you determine the relative total costs of owning different funds. In addition, if these transaction costs were included, your costs would have been higher.
Class | Beginning | ACTUAL | HYPOTHETICAL (5% annual return before expenses) | Annualized | ||||||||||||||||||||
| Ending Account Value (12/31/17)1 | Expenses Paid During Period2 | Ending Account Value (12/31/17) | Expenses Paid During Period2 | |||||||||||||||||||||
Class A | $ | 1,000.00 | $ | 1,054.60 | $ | 8.54 | $ | 1,016.89 | $ | 8.39 | 1.65 | % | ||||||||||||
Class B | 1,000.00 | 1,050.40 | 12.40 | 1,013.11 | 12.18 | 2.40 | ||||||||||||||||||
Class C | 1,000.00 | 1,050.50 | 12.40 | 1,013.11 | 12.18 | 2.40 | ||||||||||||||||||
Class R | 1,000.00 | 1,053.20 | 9.83 | 1,015.63 | 9.65 | 1.90 | ||||||||||||||||||
Class Y | 1,000.00 | 1,055.80 | 7.25 | 1,018.15 | 7.12 | 1.40 | ||||||||||||||||||
Class R5 | 1,000.00 | 1,056.20 | 6.43 | 1,018.95 | 6.31 | 1.24 | ||||||||||||||||||
Class R6 | 1,000.00 | 1,056.20 | 6.43 | 1,018.95 | 6.31 | 1.24 | ||||||||||||||||||
| 1 | The actual ending account value is based on the actual total return of the Fund for the period July 1, 2017 through December 31, 2017, after actual expenses and will differ from the hypothetical ending account value which is based on the Fund’s expense ratio and a hypothetical annual return of 5% before expenses. |
| 2 | Expenses are equal to the Fund’s annualized expense ratio as indicated above multiplied by the average account value over the period, multiplied by 184/365 to reflect the most recent fiscal half year. |
25 Invesco Global Low Volatility Equity Yield Fund
Tax Information
Form 1099-DIV, Form 1042-S and other year-end tax information provide shareholders with actual calendar year amounts that should be included in their tax returns. Shareholders should consult their tax advisors.
The following distribution information is being provided as required by the Internal Revenue Code or to meet a specific state’s requirement.
The Fund designates the following amounts or, if subsequently determined to be different, the maximum amount allowable for its fiscal year ended December 31, 2017:
Federal and State Income Tax | ||||
Qualified Dividend Income* | 79.59 | % | ||
Corporate Dividends Received Deduction* | 23.60 | % | ||
U.S. Treasury Obligations* | 0.00 | % | ||
| * | The above percentages are based on ordinary income dividends paid to shareholders during the Fund’s fiscal year. |
26 Invesco Global Low Volatility Equity Yield Fund
Trustees and Officers
The address of each trustee and officer is AIM Growth Series (Invesco Growth Series) (the “Trust”), 11 Greenway Plaza, Suite 1000, Houston, Texas 77046-1173. The trustees serve for the life of the Trust, subject to their earlier death, incapacitation, resignation, retirement or removal as more specifically provided in the Trust’s organizational documents. Each officer serves for a one year term or until their successors are elected and qualified. Column two below includes length of time served with predecessor entities, if any.
Name, Year of Birth and Position(s) Held with the Trust | Trustee and/ or Officer Since | Principal Occupation(s) During Past 5 Years | Number of Funds in Fund Complex Overseen by Trustee | Other Directorship(s) Held by Trustee During Past 5 Years | ||||
| Interested Persons | ||||||||
| Martin L. Flanagan1 — 1960 Trustee | 2007 | Executive Director, Chief Executive Officer and President, Invesco Ltd. (ultimate parent of Invesco and a global investment management firm); Trustee, The Invesco Funds; Vice Chair, Investment Company Institute; and Member of Executive Board, SMU Cox School of Business
Formerly: Advisor to the Board, Invesco Advisers, Inc. (formerly known as Invesco Institutional (N.A.), Inc.); Chairman and Chief Executive Officer, Invesco Advisers, Inc. (registered investment adviser); Director, Chairman, Chief Executive Officer and President, Invesco Holding Company (US), Inc. (formerly IVZ Inc.) (holding company), Invesco Group Services, Inc. (service provider) and Invesco North American Holdings, Inc. (holding company); Director, Chief Executive Officer and President, Invesco Holding Company Limited (parent of Invesco and a global investment management firm); Director, Invesco Ltd.; Chairman, Investment Company Institute and President, Co-Chief Executive Officer, Co-President, Chief Operating Officer and Chief Financial Officer, Franklin Resources, Inc. (global investment management organization) | 158 | None | ||||
| Philip A. Taylor2 — 1954 Trustee and Senior Vice President | 2006 | Head of the Americas and Senior Managing Director, Invesco Ltd.; Director, Invesco Advisers, Inc. (formerly known as Invesco Institutional (N.A.), Inc.) (registered investment adviser); Director, Chairman, Chief Executive Officer and President, Invesco Management Group, Inc. (formerly known as Invesco Aim Management Group, Inc.) (financial services holding company); Director and Chairman, Invesco Investment Services, Inc. (formerly known as Invesco Aim Investment Services, Inc.) (registered transfer agent); Chief Executive Officer, Invesco Corporate Class Inc. (corporate mutual fund company); Director, Chairman and Chief Executive Officer, Invesco Canada Ltd. (formerly known as Invesco Trimark Ltd./Invesco Trimark Ltèe) (registered investment adviser and registered transfer agent); Trustee and Senior Vice President, The Invesco Funds; Director, Invesco Investment Advisers LLC (formerly known as Van Kampen Asset Management).
Formerly: Co-Chairman, Co-President and Co-Chief Executive Officer, Invesco Advisers, Inc. (formerly known as Invesco Institutional (N.A.), Inc.) (registered investment adviser); Director, Chief Executive Officer and President, Van Kampen Exchange Corp; President and Principal Executive Officer, The Invesco Funds (other than AIM Treasurer’s Series Trust (Invesco Treasurer’s Series Trust), Short-Term Investments Trust and Invesco Management Trust); Executive Vice President, The Invesco Funds (AIM Treasurer’s Series Trust (Invesco Treasurer’s Series Trust), Short-Term Investments Trust and Invesco Management Trust only); Director and President, INVESCO Funds Group, Inc. (registered investment adviser and registered transfer agent); Director and Chairman, IVZ Distributors, Inc. (formerly known as INVESCO Distributors, Inc.) (registered broker dealer); Director, President and Chairman, Invesco Inc. (holding company), Invesco Canada Holdings Inc. (holding company), Trimark Investments Ltd./Placements Trimark Ltèe and Invesco Financial Services Ltd/Services Financiers Invesco Ltèe; Chief Executive Officer, Invesco Canada Fund Inc. (corporate mutual fund company); Director and Chairman, Van Kampen Investor Services Inc.; Director, Chief Executive Officer and President, 1371 Preferred Inc. (holding company) and Van Kampen Investments Inc.; Director and President, AIM GP Canada Inc. (general partner for limited partnerships) and Van Kampen Advisors, Inc.; Director and Chief Executive Officer, Invesco Trimark Dealer Inc. (registered broker dealer); Director, Invesco Distributors, Inc. (formerly known as Invesco Aim Distributors, Inc.) (registered broker dealer); Manager, Invesco PowerShares Capital Management LLC; Director, Chief Executive Officer and President, Invesco Advisers, Inc.; Director, Chairman, Chief Executive Officer and President, Invesco Aim Capital Management, Inc.; President, Invesco Trimark Dealer Inc. and Invesco Trimark Ltd./Invesco Trimark Ltèe; Director and President, AIM Trimark Corporate Class Inc. and AIM Trimark Canada Fund Inc.; Senior Managing Director, Invesco Holding Company Limited; Director and Chairman, Fund Management Company (former registered broker dealer); President and Principal Executive Officer, The Invesco Funds (AIM Treasurer’s Series Trust (Invesco Treasurer’s Series Trust), and Short-Term Investments Trust only); President, AIM Trimark Global Fund Inc. and AIM Trimark Canada Fund Inc. | 158 | None |
| 1 | Mr. Flanagan is considered an interested person (within the meaning of Section 2(a)(19) of the 1940 Act) of the Trust because he is an officer of the Adviser to the Trust, and an officer and a director of Invesco Ltd., ultimate parent of the Adviser. |
| 2 | Mr. Taylor is considered an interested person (within the meaning of Section 2(a)(19) of the 1940 Act) of the Trust because he is an officer and a director of the Adviser. |
T-1 Invesco Global Low Volatility Equity Yield Fund
Trustees and Officers—(continued)
Name, Year of Birth and Position(s) Held with the Trust | Trustee and/ or Officer Since | Principal Occupation(s) During Past 5 Years | Number of Funds in Fund Complex Overseen by Trustee | Other Directorship(s) Past 5 Years | ||||
| Independent Trustees | ||||||||
Bruce L. Crockett — 1944 Trustee and Chair | 2001 | Chairman, Crockett Technologies Associates (technology consulting company)
Formerly: Director, Captaris (unified messaging provider); Director, President and Chief Executive Officer, COMSAT Corporation; Chairman, Board of Governors of INTELSAT (international communications company); ACE Limited (insurance company); Independent Directors Council and Investment Company Institute: Member of the Audit Committee, Investment Company Institute; Member of the Executive Committee and Chair of the Governance Committee, Independent Directors Council | 158 | Director and Chairman of the Audit Committee, ALPS (Attorneys Liability Protection Society) (insurance company); Director and Member of the Audit Committee and Compensation Committee, Ferroglobe PLC (metallurgical company) | ||||
David C. Arch — 1945 Trustee | 2010 | Chairman of Blistex Inc. (consumer health care products manufacturer); Member, World Presidents’ Organization | 158 | Board member of the Illinois Manufacturers’ Association | ||||
Jack M. Fields — 1952 Trustee | 2001 | Chief Executive Officer, Twenty First Century Group, Inc. (government affairs company); and Chairman, Discovery Learning Alliance (non-profit)
Formerly: Owner and Chief Executive Officer, Dos Angeles Ranch L.P. (cattle, hunting, corporate entertainment); Director, Insperity, Inc. (formerly known as Administaff) (human resources provider); Chief Executive Officer, Texana Timber LP (sustainable forestry company); Director of Cross Timbers Quail Research Ranch (non-profit); and member of the U.S. House of Representatives | 158 | None | ||||
Cynthia Hostetler — 1962 Trustee | 2017 | Non-Executive Director and Trustee of a number of public and private business corporations
Formerly: Head of Investment Funds and Private Equity, Overseas Private Investment Corporation; President, First Manhattan Bancorporation, Inc.; Attorney, Simpson Thacher & Bartlett LLP | 158 | Vulcan Materials Company (construction materials company); Trilinc Global Impact Fund; Aberdeen Investment Funds (4 portfolios); Artio Global Investment LLC (mutual fund complex); Edgen Group, Inc. (specialized energy and infrastructure products distributor) | ||||
Eli Jones — 1961 Trustee | 2016 | Professor and Dean, Mays Business School — Texas A&M University
Formerly: Professor and Dean, Walton College of Business, University of Arkansas and E.J. Ourso College of Business, Louisiana State University; Director, Arvest Bank | 158 | Insperity, Inc. (formerly known as Administaff) (human resources provider) | ||||
Prema Mathai-Davis — 1950 Trustee | 2001 | Retired. | 158 | None | ||||
Teresa M. Ressel — 1962 Trustee | 2017 | Non-executive director and trustee of a number of public and private business corporations
Formerly: Chief Financial Officer, Olayan America, The Olayan Group (international investor/commercial/industrial); Chief Executive Officer, UBS Securities LLC; Group Chief Operating Officer, Americas, UBS AG; Assistant Secretary for Management & Budget and CFO, US Department of the Treasury | 158 | Atlantic Power Corporation (power generation company); ON Semiconductor Corp. (semiconductor supplier) | ||||
Ann Barnett Stern — 1957 Trustee | 2017 | President and Chief Executive Officer, Houston Endowment Inc. (private philanthropic institution)
Formerly: Executive Vice President and General Counsel, Texas Children’s Hospital; Attorney, Beck, Redden and Secrest, LLP; Business Law Instructor, University of St. Thomas; Attorney, Andrews & Kurth LLP | 158 | Federal Reserve Bank of Dallas | ||||
Raymond Stickel, Jr. — 1944 Trustee | 2005 | Retired.
Formerly: Director, Mainstay VP Series Funds, Inc. (25 portfolios); Partner, Deloitte & Touche | 158 | None | ||||
Robert C. Troccoli — 1949 Trustee | 2016 | Adjunct Professor, University of Denver — Daniels College of Business
Formerly: Senior Partner, KPMG LLP | 158 | None | ||||
Christopher L. Wilson — 1957 Trustee | 2017 | Non-executive director and trustee of a number of public and private business corporations
Formerly: Managing Partner, CT2, LLC (investing and consulting firm); President/Chief Executive Officer, Columbia Funds, Bank of America Corporation; President/Chief Executive Officer, CDC IXIS Asset Management Services, Inc.; Principal & Director of Operations, Scudder Funds, Scudder, Stevens & Clark, Inc.; Assistant Vice President, Fidelity Investments | 158 | TD Asset Management USA Inc. (mutual fund complex) (22 portfolios); ISO New England, Inc. (non-profit organization managing regional electricity market) |
T-2 Invesco Global Low Volatility Equity Yield Fund
Trustees and Officers—(continued)
Name, Year of Birth and Position(s) Held with the Trust | Trustee and/ or Officer Since | Principal Occupation(s) During Past 5 Years | Number of Funds in Fund Complex Overseen by Trustee | Other Directorship(s) Past 5 Years | ||||
| Other Officers | ||||||||
Sheri Morris — 1964 President, Principal Executive Officer and Treasurer | 1999 | President, Principal Executive Officer and Treasurer, The Invesco Funds; Vice President, Invesco Advisers, Inc. (formerly known as Invesco Institutional (N.A.), Inc.) (registered investment adviser); and Vice President, PowerShares Exchange-Traded Fund Trust, PowerShares Exchange-Traded Fund Trust II, PowerShares India Exchange-Traded Fund Trust, PowerShares Actively Managed Exchange-Traded Fund Trust, PowerShares Actively Managed Exchange-Traded Commodity Fund Trust and PowerShares Exchange-Traded Self-Indexed Fund Trust
Formerly: Vice President and Principal Financial Officer, The Invesco Funds; Vice President, Invesco Aim Advisers, Inc., Invesco Aim Capital Management, Inc. and Invesco Aim Private Asset Management, Inc.; Assistant Vice President and Assistant Treasurer, The Invesco Funds and Assistant Vice President, Invesco Advisers, Inc., Invesco Aim Capital Management, Inc. and Invesco Aim Private Asset Management, Inc.; and Treasurer, PowerShares Exchange-Traded Fund Trust, PowerShares Exchange-Traded Fund Trust II, PowerShares India Exchange-Traded Fund Trust and PowerShares Actively Managed Exchange-Traded Fund Trust | N/A | N/A | ||||
Russell C. Burk — 1958 Senior Vice President and Senior Officer | 2005 | Senior Vice President and Senior Officer, The Invesco Funds | N/A | N/A | ||||
John M. Zerr — 1962 Senior Vice President, Chief Legal Officer and Secretary | 2006 | Director, Senior Vice President, Secretary and General Counsel, Invesco Management Group, Inc. (formerly known as Invesco AIM Management Group, Inc.); Senior Vice President, Invesco Advisers, Inc. (formerly known as Invesco Institutional (N.A.), Inc.) (registered investment adviser); Senior Vice President and Secretary, Invesco Distributors, Inc. (formerly known as Invesco AIM Distributors, Inc.); Director, Vice President and Secretary, Invesco Investment Services, Inc. (formerly known as Invesco AIM Investment Services, Inc.) Senior Vice President, Chief Legal Officer and Secretary, The Invesco Funds; Managing Director, Invesco PowerShares Capital Management LLC; Director, Secretary and General Counsel, Invesco Investment Advisers LLC (formerly known as Van Kampen Asset Management); Secretary and General Counsel, Invesco Capital Markets, Inc. (formerly known as Van Kampen Funds Inc.) and Chief Legal Officer, PowerShares Exchange-Traded Fund Trust, PowerShares Exchange-Traded Fund Trust II, PowerShares India Exchange-Traded Fund Trust, PowerShares Actively Managed Exchange-Traded Fund Trust, PowerShares Actively Managed Exchange-Traded Commodity Fund Trust and PowerShares Exchange-Traded Self-Indexed Fund Trust; Manager and Secretary, Invesco Indexing LLC
Formerly: Director, Secretary, General Counsel and Senior Vice President, Van Kampen Exchange Corp.; Director, Vice President and Secretary, IVZ Distributors, Inc. (formerly known as INVESCO Distributors, Inc.); Director and Vice President, INVESCO Funds Group, Inc.; Director and Vice President, Van Kampen Advisors Inc.; Director, Vice President, Secretary and General Counsel, Van Kampen Investor Services Inc.; Director, Invesco Distributors, Inc. (formerly known as Invesco AIM Distributors, Inc.); Director, Senior Vice President, General Counsel and Secretary, Invesco AIM Advisers, Inc. and Van Kampen Investments Inc.; Director, Vice President and Secretary, Fund Management Company; Director, Senior Vice President, Secretary, General Counsel and Vice President, Invesco AIM Capital Management, Inc.; Chief Operating Officer and General Counsel, Liberty Ridge Capital, Inc. (an investment adviser); Vice President and Secretary, PBHG Funds (an investment company) and PBHG Insurance Series Fund (an investment company); Chief Operating Officer, General Counsel and Secretary, Old Mutual Investment Partners (a broker-dealer); General Counsel and Secretary, Old Mutual Fund Services (an administrator) and Old Mutual Shareholder Services (a shareholder servicing center); Executive Vice President, General Counsel and Secretary, Old Mutual Capital, Inc. (an investment adviser); and Vice President and Secretary, Old Mutual Advisors Funds (an investment company) | N/A | N/A | ||||
Gregory G. McGreevey — 1962 Senior Vice President | 2012 | Senior Managing Director, Invesco Ltd.; Director, Chairman, President, and Chief Executive Officer, Invesco Advisers, Inc. (formerly known as Invesco Institutional (N.A.), Inc.) (registered investment adviser); Senior Vice President, Invesco Management Group, Inc.; Director, Invesco Mortgage Capital, Inc. and Invesco Senior Secured Management, Inc.; and Senior Vice President, The Invesco Funds
Formerly: Assistant Vice President, The Invesco Funds | N/A | N/A | ||||
Kelli Gallegos — 1970 Vice President, Principal Financial Officer and Assistant Treasurer | 2008 | Vice President, Principal Financial Officer and Assistant Treasurer, The Invesco Funds; Assistant Treasurer, Invesco PowerShares Capital Management LLC, PowerShares Exchange-Traded Fund Trust, PowerShares Exchange-Traded Fund Trust II, PowerShares India Exchange-Traded Fund Trust, PowerShares Actively Managed Exchange-Traded Fund Trust, PowerShares Actively Managed Exchange-Traded Commodity Fund Trust and PowerShares Exchange-Traded Self-Indexed Fund Trust
Formerly: Assistant Vice President, The Invesco Funds | N/A | N/A |
T-3 Invesco Global Low Volatility Equity Yield Fund
Trustees and Officers—(continued)
Name, Year of Birth and Position(s) Held with the Trust | Trustee and/ or Officer Since | Principal Occupation(s) During Past 5 Years | Number of Funds in Fund Complex Overseen by Trustee | Other Directorship(s) Past 5 Years | ||||
| Other Officers—(continued) | ||||||||
Tracy Sullivan — 1962 Vice President, Chief Tax Officer and Assistant Treasurer | 2008 | Vice President, Chief Tax Officer and Assistant Treasurer, The Invesco Funds; Assistant Treasurer, Invesco PowerShares Capital Management LLC, PowerShares Exchange-Traded Fund Trust, PowerShares Exchange-Traded Fund Trust II, PowerShares India Exchange-Traded Fund Trust, PowerShares Actively Managed Exchange-Traded Fund Trust,PowerShares Actively Managed Exchange-Traded Commodity Fund Trust and PowerShares Exchange-Traded Self-Indexed Fund Trust
Formerly: Assistant Vice President, The Invesco Funds | N/A | N/A | ||||
Crissie M. Wisdom — 1969 Anti-Money Laundering Compliance Officer | 2013 | Anti-Money Laundering Compliance Officer, Invesco Advisers, Inc. (formerly known as Invesco Institutional (N.A.), Inc.) (registered investment adviser), Invesco Capital Markets, Inc. (formerly known as Van Kampen Funds Inc.), Invesco Distributors, Inc., Invesco Investment Services, Inc., Invesco Management Group, Inc., The Invesco Funds, and PowerShares Exchange-Traded Fund Trust, PowerShares Exchange-Traded Fund Trust II, PowerShares India Exchange-Traded Fund Trust, PowerShares Actively Managed Exchange-Traded Fund Trust,PowerShares Actively Managed Exchange-Traded Commodity Fund Trust and PowerShares Exchange-Traded Self-Indexed Fund Trust; Anti-Money Laundering Compliance Officer and Bank Secrecy Act Officer, INVESCO National Trust Company and Invesco Trust Company; and Fraud Prevention Manager and Controls and Risk Analysis Manager for Invesco Investment Services, Inc.
Formerly: Anti-Money Laundering Compliance Officer, Van Kampen Exchange Corp. | N/A | N/A | ||||
Robert R. Leveille — 1969 Chief Compliance Officer | 2016 | Chief Compliance Officer, Invesco Advisers, Inc. (registered investment adviser); and Chief Compliance Officer, The Invesco Funds
Formerly: Chief Compliance Officer, Putnam Investments and the Putnam Funds | N/A | N/A |
The Statement of Additional Information of the Trust includes additional information about the Fund’s Trustees and is available upon request, without charge, by calling 1.800.959.4246. Please refer to the Fund’s Statement of Additional Information for information on the Fund’s sub-advisers.
Office of the Fund 11 Greenway Plaza, Suite 1000 Houston, TX 77046-1173 | Investment Adviser Invesco Advisers, Inc. 1555 Peachtree Street, N.E. Atlanta, GA 30309 | Distributor Invesco Distributors, Inc. 11 Greenway Plaza, Suite 1000 Houston, TX 77046-1173 | Auditors PricewaterhouseCoopers LLP 1000 Louisiana Street, Suite 5800 Houston, TX 77002-5678 | |||
Counsel to the Fund Stradley Ronon Stevens & Young, LLP 2005 Market Street, Suite 2600 Philadelphia, PA 19103-7018 | Counsel to the Independent Trustees Goodwin Procter LLP 901 New York Avenue, N.W. Washington, D.C. 20001 | Transfer Agent Invesco Investment Services, Inc. 11 Greenway Plaza, Suite 1000 Houston, TX 77046-1173 | Custodian State Street Bank and Trust Company 225 Franklin Street Boston, MA 02110-2801 | |||
T-4 Invesco Global Low Volatility Equity Yield Fund
Explore High-Conviction Investing with Invesco

Go paperless with eDelivery
Visit invesco.com/edelivery to enjoy the convenience and security of anytime electronic access to your investment documents.
With eDelivery, you can elect to have any or all of the following materials delivered straight to your inbox to download, save and print from your own computer:
∎ Fund reports and prospectuses
∎ Quarterly statements
∎ Daily confirmations
∎ Tax forms
Invesco mailing information
Send general correspondence to Invesco Investment Services, Inc., P.O. Box 219078, Kansas City, MO 64121-9078.
Important notice regarding delivery of security holder documents
To reduce Fund expenses, only one copy of most shareholder documents may be mailed to shareholders with multiple accounts at the same address (Householding). Mailing of your shareholder documents may be householded indefinitely unless you instruct us otherwise. If you do not want the mailing of these documents to be combined with those for other members of your household, please contact Invesco Investment Services, Inc. at 800 959 4246 or contact your financial institution. We will begin sending you individual copies for each account within 30 days after receiving your request.
Fund holdings and proxy voting information
The Fund provides a complete list of its holdings four times in each fiscal year, at the quarter ends. For the second and fourth quarters, the lists appear in the Fund’s semiannual and annual reports to shareholders. For the first and third quarters, the Fund files the lists with the Securities and Exchange Commission (SEC) on Form N-Q. The most recent list of portfolio holdings is available at invesco.com/completeqtrholdings. Shareholders can also look up the Fund’s Forms N-Q on the SEC website at sec.gov. Copies of the Fund’s Forms N-Q may be reviewed and copied at the SEC Public Reference Room in Washington, D.C. You can obtain information on the operation of the Public Reference Room, including information about duplicating fee charges, by calling 202 551 8090 or 800 732 0330, or by electronic request at the following email address: publicinfo@sec.gov. The SEC file numbers for the Fund are shown below.
A description of the policies and procedures that the Fund uses to determine how to vote proxies relating to portfolio securities is available without charge, upon request, from our Client Services department at 800 959 4246 or at invesco.com/proxyguidelines. The information is also available on the SEC website, sec.gov.
Information regarding how the Fund voted proxies related to its portfolio securities during the most recent 12-month period ended June 30 is available at invesco.com/proxysearch. The information is also available on the SEC website, sec.gov. Invesco Advisers, Inc. is an investment adviser; it provides investment advisory services to individual and institutional clients and does not sell securities. Invesco Distributors, Inc. is the US distributor for Invesco Ltd.’s retail mutual funds, exchange-traded funds and institutional money market funds. Both are wholly owned, indirect subsidiaries of Invesco Ltd. |  |
SEC file numbers: 811-02699 and 002-57526 | Invesco Distributors, Inc. | GLVEY-AR-1 | 02232018 | 1116 |
| ||||
 |
Annual Report to Shareholders
|
December 31, 2017 | ||
| ||||
Invesco Income Allocation Fund
| ||||
| Nasdaq: | ||||
| A: ALAAX ∎ B: BLIAX ∎ C: CLIAX ∎ R: RLIAX ∎ Y: ALAYX ∎ R5: ILAAX ∎ R6: IIASX | ||||

Letters to Shareholders
Philip Taylor | Dear Shareholders: This annual report includes information about your Fund, including performance data and a complete list of its investments as of the close of the reporting period. Inside is a discussion of how your Fund was managed and the factors that affected its performance during the reporting period. Major stock market indexes rose – and set record highs – throughout the reporting period. Generally positive economic data, strong corporate earnings and anticipated tax and regulatory reform contributed to the rally. The US economy expanded during the reporting period, with gross domestic product, the value of all goods and services produced, significantly increasing its growth rate from the first to the third quarter of the year. Tax reform legislation, enacted in December 2017, was a positive for the stock market, but its long-term economic impact was uncertain. Citing positive economic trends – specifically, realized and expected labor market conditions and inflation – the US |

Federal Reserve raised interest rates in March, June and December 2017. While US and global bond markets, as well as emerging market equities, sold off early in the reporting period, they recovered much of their losses during the reporting period. Overseas, economic data were mixed, prompting the European Central Bank and central banks in China and Japan, among other countries, to maintain extraordinarily accommodative monetary policies.
Short-term market volatility can prompt some investors to abandon their investment plans – and can cause others to settle for whatever returns the market has to offer. The investment professionals at Invesco, in contrast, invest with high conviction. This means that, no matter the asset class or the strategy, each investment team has a passion to exceed. We want to help investors achieve better outcomes, such as seeking higher returns, helping mitigate risk and generating income. Of course, investing with high conviction can’t guarantee a profit or ensure success; no investment strategy can. To learn more about how we invest with high conviction, visit invesco.com/HighConviction.
You, too, can invest with high conviction by maintaining a long-term investment perspective and by working with your financial adviser on a regular basis. During periods of short-term market volatility or uncertainty, your financial adviser can keep you focused on your long-term investment goals – a new home, a child’s college education or a secure retirement. He or she also can share research about the economy, the markets and individual investment options.
Visit our website for more information on your investments
Our website, invesco.com/us, offers a wide range of market insights and investment perspectives. On the website, you’ll find detailed information about our funds, including performance, holdings and portfolio manager commentaries. You can access information about your account by completing a simple, secure online registration. To do so, select “Log In” on the right side of the homepage, and then select “Register for Individual Account Access.”
In addition to the resources accessible on our website and through our mobile app, you can obtain timely updates to help you stay informed about the markets and the economy by connecting with Invesco on Twitter, LinkedIn or Facebook. You can access our blog at blog.invesco.us.com. Our goal is to provide you the information you want, when and where you want it.
Finally, I’m pleased to share with you Invesco’s commitment to both the Principles for Responsible Investment and to considering environmental, social and governance issues in our robust investment process. I invite you to learn more at invesco.com/esg.
Have questions?
For questions about your account, contact an Invesco client services representative at 800 959 4246. For Invesco-related questions or comments, please email me directly at phil@invesco.com.
All of us at Invesco look forward to serving your investment management needs. Thank you for investing with us.
Sincerely,

Philip Taylor
Senior Managing Director, Invesco Ltd.
| 2 | Invesco Income Allocation Fund |
Bruce Crockett | Dear Fellow Shareholders: Among the many important lessons I’ve learned in more than 40 years in a variety of business endeavors is the value of a trusted advocate. As independent chair of the Invesco Funds Board, I can assure you that the members of the Board are strong advocates for the interests of investors in Invesco’s mutual funds. We work hard to represent your interests through oversight of the quality of the investment management services your funds receive and other matters important to your investment, including but not limited to: ∎ Ensuring that Invesco offers a diverse lineup of mutual funds that your financial adviser can use to strive to meet your financial needs as your investment goals change over time. ∎ Monitoring how the portfolio management teams of the Invesco funds are performing in light of changing economic and market conditions. |

| ∎ | Assessing each portfolio management team’s investment performance within the context of the investment strategy described in the fund’s prospectus. |
| ∎ | Monitoring for potential conflicts of interests that may impact the nature of the services that your funds receive. |
We believe one of the most important services we provide our fund shareholders is the annual review of the funds’ advisory and sub-advisory contracts with Invesco Advisers and its affiliates. This review is required by the Investment Company Act of 1940 and focuses on the nature and quality of the services Invesco provides as the adviser to the Invesco funds and the reasonableness of the fees that it charges for those services. Each year, we spend months carefully reviewing information received from Invesco and a variety of independent sources, such as performance and fee data prepared by Lipper, Inc. (a subsidiary of Broadridge Financial Solutions, Inc.), an independent, third-party firm widely recognized as a leader in its field. We also meet with our independent legal counsel and other independent advisers to review and help us assess the information that we have received. Our goal is to assure that you receive quality investment management services for a reasonable fee.
I trust the measures outlined above provide assurance that you have a worthy advocate when it comes to choosing the Invesco Funds.
As always, please contact me at bruce@brucecrockett.com with any questions or concerns you may have. On behalf of the Board, we look forward to continuing to represent your interests and serving your needs.
Sincerely,

Bruce L. Crockett
Independent Chair
Invesco Funds Board of Trustees
| 3 | Invesco Income Allocation Fund |
Management’s Discussion of Fund Performance
Performance summary For the year ended December 31, 2017, Class A shares of Invesco Income Allocation Fund (the Fund), at net asset value (NAV), underperformed the Fund’s style-specific index, the Custom Invesco Income Allocation Index. Your Fund’s long-term performance appears later in this report.
|
| |||
Fund vs. Indexes | ||||
Total returns, 12/31/16 to 12/31/17, at net asset value (NAV). Performance shown does not include applicable contingent deferred sales charges (CDSC) or front-end sales charges, which would have reduced performance.
|
| |||
Class A Shares | 7.99 | % | ||
Class B Shares | 7.18 | |||
Class C Shares | 7.18 | |||
Class R Shares | 7.63 | |||
Class Y Shares | 8.26 | |||
Class R5 Shares | 8.26 | |||
Class R6 Shares* | 8.10 | |||
S&P 500 Indexq (Broad Market Index) | 21.83 | |||
Custom Invesco Income Allocation Index∎ (Style-Specific Index) | 9.21 | |||
Lipper Mixed-Asset Target Allocation Conservative Funds Index¨ (Peer Group Index) | 8.78 | |||
Source(s): qFactSet Research Systems Inc.; ∎Invesco, FactSet Research Systems Inc.; ¨Lipper Inc. *Class R6 shares incepted on April 4, 2017. See page 7 for more information. | ||||
Market conditions and your Fund
Despite highly destructive hurricanes that threatened to derail a years-long economic recovery, the US economy continued to expand throughout the year ended December 31, 2017. Gross domestic product — the value of all goods and services produced in the US — expanded in the first three quarters of 2017.
Given signs of an improving economy, the US Federal Reserve (the Fed) raised interest rates three times during the reporting period, most recently in December 2017; each rate hike was 25 basis points.1 (A basis point is 0.01%.) The Fed pledged that “realized and expected economic conditions relative to its objectives of maximum employment and 2 percent inflation” will guide its future actions. At the close of the reporting period, Fed policy remained accommodative, and the fed funds target rate stood at a range of 1.25% to 1.50% — 75 basis points higher than at the start of the reporting period.1
US bond returns were positive for the year, with all fixed income sectors (Treasuries, government-related, corporate and securitized) posting positive returns, primarily driven by strong macroeconomic conditions, muted market volatility and global investor demand for yield. A benign inflation outlook dampened long-term rates as the yield curve flattened, benefiting investors invested in longer maturity securities. In addition, the benign inflation environment allowed the Fed to remain less aggressive with rate hikes. The US corporate credit sector remained a key contributor to excess return for the year, with lower-rated investment grade securities outperforming higher-rated credits and comparable-maturity Treasuries. Tax cut legislation enacted in December included significant corporate tax reductions that were an additional catalyst for the positive tone in the credit market. The high yield sector also benefited from strong demand during the year, despite lofty valuations. Within structured securities, commercial
| Portfolio Composition* | ||||
| By fund type, based on total investments | ||||
Fixed Income Funds | 68.1 | % | ||
Equity Funds | 25.0 | |||
Alternative Funds | 6.3 | |||
Money Market Funds | 0.6 | |||
| * | Based on the Schedule of Investments, which classifies each underlying fund and other investments into broad asset classes based on their predominant investments. |
Total Net Assets | $ | 625.7 million |
The Fund’s holdings are subject to change, and there is no assurance that the Fund will continue to hold any particular security.
Data presented here are as of December 31, 2017.
mortgage-backed securities (MBS) were the primary outperformers, with asset-backed securities also performing well in midst of higher short-term rates. Agency MBS also outperformed on a relative basis, even as the Fed began to systematically de-lever its MBS and Treasury holdings.
Major US stock market indexes repeatedly hit all-time highs throughout the reporting period. The stock market rally that began after the 2016 presidential election continued throughout the reporting period, fueled by generally positive economic data, strong corporate earnings and improved consumer confidence. However, performance was highly concentrated, with more than two-thirds of the equity market’s gains linked to just three sectors: technology, financials and health care. Finally, after much debate in Congress, a tax reform bill was signed into law in December 2017, which further strengthened stocks.
Reflecting these trends, the largest contributors to Fund performance during the reporting period were US equities and diversified fixed income. The largest individual contributors to absolute Fund performance included Invesco Dividend Income Fund and PowerShares Top 200 Pure Value Portfolio. However, relative to the Fund’s style-specific benchmark, these funds detracted from results, as large-cap value stocks generally underperformed broader equity market. Invesco Multi-Asset Income Fund also contributed to Fund returns, led by gains in US large-cap preferred equities, US high yield securities, US mortgage real estate investment trusts, emerging market government bonds and master limited partnerships.
There were no detractors from absolute Fund returns in terms of asset classes or individual holdings. Relative to the style-specific benchmark, the Fund’s underweight exposure to US equity and overweight exposure to fixed income detracted from Fund performance. Invesco Quality Income Fund also detracted from relative Fund results, as mortgages underperformed broader fixed income.
As part of the Fund’s annual rebalance, PowerShares International Dividend Achievers Portfolio was removed as a Fund holding. Please note that some of the Fund’s underlying funds – including, but not limited to, Invesco Multi-Asset Income Fund – may use derivatives, including futures and total return swaps,
| 4 | Invesco Income Allocation Fund |
which may create economic leverage in the underlying funds. Therefore, performance of these underlying funds, both positive and negative, can be attributed to these instruments.
We welcome new investors who joined the Fund during the year, and we thank you for investing in Invesco Income Allocation Fund.
| 1 | Source: US Federal Reserve |
The views and opinions expressed in management’s discussion of Fund performance are those of Invesco Advisers, Inc. These views and opinions are subject to change at any time based on factors such as market and economic conditions. These views and opinions may not be relied upon as investment advice or recommendations, or as an offer for a particular security. The information is not a complete analysis of every aspect of any market, country, industry, security or the Fund. Statements of fact are from sources considered reliable, but Invesco Advisers, Inc. makes no representation or warranty as to their completeness or accuracy. Although historical performance is no guarantee of future results, these insights may help you understand our investment management philosophy.
See important Fund and, if applicable, index disclosures later in this report.
| Jacob Borbidge Chartered Financial Analyst, Portfolio Manager and Head of Research for Invesco’s Global Solutions Development and Implementation Team, is manager of Invesco Income Allocation Fund. He | |
| joined Invesco in 2004. Mr. Borbidge earned a BS in mechanical engineering from Lehigh University and an MS in finance from the University of Houston. | ||

| Duy Nguyen Chartered Financial Analyst, Portfolio Manager and Chief Investment Officer of Invesco’s Global Solutions Development and Implementation Team, is manager of Invesco Income Allocation Fund. He | |
joined Invesco in 2000. Mr. Nguyen earned a BBA from the University of Texas at Austin and an MS from University of Houston.
Assisted by Invesco’s Global Solutions Development & Implementation Team | ||

| 5 | Invesco Income Allocation Fund |
Your Fund’s Long-Term Performance
Results of a $10,000 Investment - Oldest Share Classes(es)
Fund and index data from 12/31/07
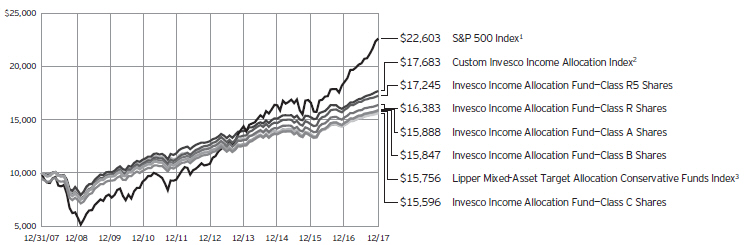
| 1 | Source: FactSet Research Systems Inc. |
| 2 | Source(s): Invesco, FactSet Research Systems Inc. |
| 3 | Source: Lipper Inc. |
Past performance cannot guarantee comparable future results.
The data shown in the chart re-invested distributions, applicable sales charges and Fund expenses including management fees. Results for Class B shares are calculated as if a hypothetical
shareholder had liquidated his entire investment in the Fund at the close of the reporting period and paid the contingent deferred sales charges, if applicable. Index results include reinvested dividends, but they do not reflect sales charges. Performance of the peer group,
if applicable, reflects fund expenses and management fees; performance of a market index does not. Performance shown in the chart and table(s) does not reflect deduction of taxes a shareholder would pay on Fund distributions or sale of Fund shares.
| 6 | Invesco Income Allocation Fund |
| Average Annual Total Returns | ||||
As of 12/31/17, including maximum applicable sales charges |
| |||
Class A Shares | ||||
Inception (10/31/05) | 5.30% | |||
10 Years | 4.74 | |||
5 Years | 4.95 | |||
1 Year | 2.08 | |||
Class B Shares | ||||
Inception (10/31/05) | 5.27% | |||
10 Years | 4.71 | |||
5 Years | 5.03 | |||
1 Year | 2.18 | |||
Class C Shares | ||||
Inception (10/31/05) | 5.00% | |||
10 Years | 4.54 | |||
5 Years | 5.34 | |||
1 Year | 6.18 | |||
Class R Shares | ||||
Inception (10/31/05) | 5.53% | |||
10 Years | 5.06 | |||
5 Years | 5.87 | |||
1 Year | 7.63 | |||
Class Y Shares | ||||
10 Years | 5.58% | |||
5 Years | 6.40 | |||
1 Year | 8.26 | |||
Class R5 Shares | ||||
Inception (10/31/05) | 6.06% | |||
10 Years | 5.60 | |||
5 Years | 6.40 | |||
1 Year | 8.26 | |||
Class R6 Shares | ||||
10 Years | 5.35% | |||
5 Years | 6.16 | |||
1 Year | 8.10 | |||
Class Y shares incepted on October 3, 2008. Performance shown prior to that date is that of Class A shares and includes the 12b-1 fees applicable to Class A shares.
Class R6 shares incepted on April 4, 2017. Performance shown prior to that date is that of Class A shares and includes the 12b-1 fees applicable to Class A shares.
The performance data quoted represent past performance and cannot guarantee comparable future results; current performance may be lower or higher. Please visit invesco.com/performance for the most recent month end performance. Performance figures reflect reinvested distributions, changes in net asset value and the effect of the maximum sales charge unless
otherwise stated. Investment return and principal value will fluctuate so that you may have a gain or loss when you sell shares.
The net annual Fund operating expense ratio set forth in the most recent Fund prospectus as of the date of this report for Class A, Class B, Class C, Class R, Class Y, Class R5 and Class R6 shares was 0.83%, 1.58%, 1.58%, 1.08%, 0.58%, 0.58% and 0.58%, respectively.1,2 The total annual Fund operating expense ratio set forth in the most recent Fund prospectus as of the date of this report for Class A, Class B, Class C, Class R, Class Y, Class R5 and Class R6 was 1.04%, 1.79%, 1.79%, 1.29%, 0.79%, 0.76% and 0.71%, respectively.1 The expense ratios presented above may vary from the expense ratios presented in other sections of this report that are based on expenses incurred during the period covered by this report.
Class A share performance reflects the maximum 5.50% sales charge, and Class B and Class C share performance reflects the applicable contingent deferred sales charge (CDSC) for the period involved. The CDSC on Class B shares declines from 5% beginning at the time of purchase to 0% at the beginning of the seventh year. The CDSC on Class C shares is 1% for the first year after purchase. Class R, Class Y, Class R5 and Class R6 shares do not have a front-end sales charge or a CDSC; therefore, performance is at net asset value.
The performance of the Fund’s share classes will differ primarily due to different sales charge structures and class expenses.
Fund performance reflects any applicable fee waivers and/or expense reimbursements. Had the adviser not waived fees and/or reimbursed expenses currently or in the past, returns would have been lower. See current prospectus for more information.
| 1 | The expense ratio includes acquired fund fees and expenses of the underlying funds in which the Fund invests of 0.58% for Invesco Income Allocation Fund. |
| 2 | Total annual Fund operating expenses after any contractual fee waivers and/or expense reimbursements by the adviser in effect through at least April 30, 2019. See current prospectus for more information. |
| 7 | Invesco Income Allocation Fund |
Invesco Income Allocation Fund’s investment objective is current income and, secondarily, growth of capital.
| ∎ | Unless otherwise stated, information presented in this report is as of December 31, 2017, and is based on total net assets. |
| ∎ | Unless otherwise noted, all data provided by Invesco. |
| ∎ | To access your Fund’s reports/prospectus, visit invesco.com/fundreports. |
About share classes ∎ Effective January 26, 2018, after the close of the reporting period, all outstanding Class B shares were converted to Class A shares, in advance of their normally scheduled conversion. No CDSC was paid in connection with this early conversion. ∎ Class R shares are generally available only to employer sponsored retirement and benefit plans. Please see the prospectus for more information. ∎ Class Y shares are available only to certain investors. Please see the prospectus for more information. ∎ Class R5 shares and Class R6 shares are available for use by retirement plans that meet certain standards and for institutional investors. Class R6 shares are also available through intermediaries that have established an agreement with Invesco Distributors, Inc. to make such shares available for use in retail omnibus accounts. Please see the prospectus for more information.
Principal risks of investing in the Fund ∎ Active trading risk. Active trading of portfolio securities may result in added expenses, a lower return and increased tax liability. ∎ Allocation risk. The Fund’s investment performance depends, in part, on how its assets are allocated among the underlying funds or asset classes. The Adviser’s evaluations and assumptions regarding the asset classes or the underlying funds in which the Fund invests may be incorrect, causing the Fund to be invested (or not invested) in one or more asset classes or underlying funds at an inopportune time, which could negatively affect the Fund’s performance. ∎ Bank loan risk. There are a number of risks associated with an investment in bank loans including, credit risk, interest rate risk, liquidity risk and prepayment risk. Lack of an active trading market, restrictions on resale, irregular | trading activity, wide bid/ask spreads and extended trade settlement periods may impair an underlying fund’s ability to sell bank loans within its desired time frame or at an acceptable price and its ability to accurately value existing and prospective investments. Extended trade settlement periods may result in cash not being immediately available to an underlying fund. As a result an underlying fund may have to sell other investments or engage in borrowing transactions to raise cash to meet its obligations. The risk of holding bank loans is also directly tied to the risk of insolvency or bankruptcy of the issuing banks. These risks could cause an underlying fund to lose income or principal on a particular investment, which in turn could affect the underlying fund’s returns. The value of bank loans can be affected by and sensitive to changes in government regulation and to economic downturns in the United States and abroad. Bank loans generally are floating rate loans, which are subject to interest rate risk as the interest paid on the floating rate loans adjusts periodically based on changes in widely accepted reference rates. ∎ Borrowing risk. Borrowing money to buy securities exposes an underlying fund to leverage and will cause an underlying fund’s share price to be more volatile because leverage will exaggerate the effect of any increase or decrease in the value of an underlying fund’s portfolio securities. Borrowing money may also require an underlying fund to liquidate positions when it may not be advantageous to do so. In addition, an underlying fund will incur interest expenses and other fees on borrowed money. There can be no assurance that an underlying fund’s borrowing strategy will enhance and not reduce the underlying fund’s returns. ∎ Changing fixed income market conditions risk. The current low interest rate environment was created in part by the Federal Reserve Board (FRB) and certain foreign central banks keeping the | federal funds and equivalent foreign rates near, at or below zero. Increases in the federal funds and equivalent foreign rates may expose fixed income markets to heightened volatility and reduced liquidity for certain fixed income investments, particularly those with longer maturities. In addition, decreases in fixed income dealer market-making capacity may also potentially lead to heightened volatility and reduced liquidity in the fixed income markets. As a result, the value of an underlying fund’s investments and share price may decline. Changes in central bank policies could also result in higher than normal shareholder redemptions, which could potentially increase portfolio turnover and an underlying fund’s transaction costs. ∎ Collateralized loan obligations risk. CLOs are subject to the risks of substantial losses due to actual defaults by underlying borrowers, which will be greater during periods of economic or financial stress. CLOs may also lose value due to collateral defaults and disappearance of subordinate tranches, market anticipation of defaults, and investor aversion to CLO securities as a class. The risks of CLOs will be greater if an underlying fund invests in CLOs that hold loans of uncreditworthy borrowers or if an underlying fund holds subordinate tranches of the CLO that absorbs losses from the defaults before senior tranches. In addition, CLOs are subject to interest rate risk and credit risk. ∎ Commodities tax risk. The tax treatment of commodity-linked derivative instruments may be adversely affected by changes in legislation, regulations or other legally binding authority. If, as a result of any such adverse action, the income of an underlying fund from certain commodity-linked derivatives was treated as non-qualifying income, an underlying fund might fail to qualify as a regulated investment company and be subject to federal income tax at the fund level. Should the Internal Revenue Service issue guidance, or Congress enact legislation, that adversely affects the tax treatment of an underlying fund’s use of commodity-linked notes or a wholly-owned subsidiary (which guidance might be applied to the underlying fund retroactively), it could, among other consequences, limit the |
This report must be accompanied or preceded by a currently effective Fund prospectus, which contains more complete information, including sales charges and expenses. Investors should read it carefully before investing.
| ||||
NOT FDIC INSURED | MAY LOSE VALUE | NO BANK GUARANTEE | ||||
| 8 | Invesco Income Allocation Fund |
underlying fund’s ability to pursue its investment strategy.
| ∎ | Commodity risk. An underlying fund may have investment exposure to the commodities markets and/or a particular sector of the commodities markets, which may subject an underlying fund to greater volatility than investments in traditional securities, such as stocks and bonds. Volatility in the commodities markets may be caused by changes in overall market movements, domestic and foreign political and economic events and policies, war, acts of terrorism, changes in domestic or foreign interest rates and/or investor expectations concerning interest rates, domestic and foreign inflation rates, investment and trading activities of mutual funds, hedge funds and commodities funds, and factors such as drought, floods, weather, livestock disease, embargoes, tariffs and other regulatory developments, or supply and demand disruptions. Because an underlying fund’s performance may be linked to the performance of volatile commodities, investors should be willing to assume the risks of potentially significant fluctuations in the value of an underlying fund’s shares. |
| ∎ | Convertible securities risk. The market values of convertible securities are affected by market interest rates, the risk of actual issuer default on interest or principal payments and the value of the underlying common stock into which the convertible security may be converted. Additionally, a convertible security is subject to the same types of market and issuer risks as apply to the underlying common stock. In addition, certain convertible securities are subject to involuntary conversions and may undergo principal writedowns upon the occurrence of certain triggering events, and, as a result, are subject to an increased risk of loss. Convertible securities may be rated below investment grade. |
| ∎ | Credit linked notes risk. Risks of credit linked notes include those risks associated with the underlying reference obligation including but not limited to market risk, interest rate risk, credit risk, default risk and, in some cases, foreign currency risk. An investor in a credit linked note bears counterparty risk or the risk that the issuer of the credit linked note will default or become bankrupt and not make timely payment of principal and interest of the structured security. Credit linked notes may be less liquid than other investments |
and therefore harder to dispose of at the desired time and price. In addition, credit linked notes may be leveraged and, as a result, small changes in the value of the underlying reference obligation may produce disproportionate losses to an underlying fund. |
| ∎ | Debt securities risk. The prices of debt securities held by an underlying fund will be affected by changes in interest rates, the creditworthiness of the issuer and other factors. An increase in prevailing interest rates typically causes the value of existing debt securities to fall and often has a greater impact on longer-duration debt securities and higher quality debt securities. Falling interest rates will cause an underlying fund to reinvest the proceeds of debt securities that have been repaid by the issuer at lower interest rates. Falling interest rates may also reduce an underlying fund’s distributable income because interest payments on floating rate debt instruments held by an underlying fund will decline. An underlying fund could lose money on investments in debt securities if the issuer or borrower fails to meet its obligations to make interest payments and/or to repay principal in a timely manner. Changes in an issuer’s financial strength, the market’s perception of such strength or in the credit rating of the issuer or the security may affect the value of debt securities. The Adviser’s credit analysis may fail to anticipate such changes, which could result in buying a debt security at an inopportune time or failing to sell a debt security in advance of a price decline or other credit event. |
| ∎ | Defaulted securities risk. Defaulted securities pose a greater risk that principal will not be repaid than non-defaulted securities. Defaulted securities and any securities received in an exchange for such securities may be subject to restrictions on resale. |
| ∎ | Derivatives risk. The value of a derivative instrument depends largely on (and is derived from) the value of an underlying security, currency, commodity, interest rate, index or other asset (each referred to as an underlying asset). In addition to risks relating to the underlying assets, the use of derivatives may include other, possibly greater, risks, including counterparty, leverage and liquidity risks. Counterparty risk is the risk that the counterparty to the derivative contract will default on its obligation to pay an underlying fund the amount owed or |
otherwise perform under the derivative contract. Derivatives create leverage risk because they do not require payment up front equal to the economic exposure created by owning the derivative. As a result, an adverse change in the value of the underlying asset could result in an underlying fund sustaining a loss that is substantially greater than the amount invested in the derivative, which may make an underlying fund’s returns more volatile and increase the risk of loss. Derivative instruments may also be less liquid than more traditional investments and an underlying fund may be unable to sell or close out its derivative positions at a desirable time or price. This risk may be more acute under adverse market conditions, during which an underlying fund may be most in need of liquidating its derivative positions. Derivatives may also be harder to value, less tax efficient and subject to changing government regulation that could impact an underlying fund’s ability to use certain derivatives or their cost. Also, derivatives used for hedging or to gain or limit exposure to a particular market segment may not provide the expected benefits, particularly during adverse market conditions. |
| ∎ | Dividend paying security risk. Securities that pay high dividends as a group can fall out of favor with the market, causing such companies to underperform companies that do not pay high dividends. Also, changes in the dividend policies of the companies in an underlying fund’s underlying index and the capital resources available for such companies’ dividend payments may affect an underlying fund. |
| ∎ | Dollar roll transactions risk. Dollar roll transactions occur in connection with TBA transactions and involve the risk that the market value of the securities an underlying fund is required to purchase may decline below the agreed upon purchase price of those securities Dollar roll transactions add a form of leverage to an underlying fund’s portfolio, which may make the Fund’s returns more volatile and increase the risk of loss. In addition, dollar roll transactions may increase an underlying fund’s portfolio turnover, which may result in increased brokerage costs and may lower an underlying fund’s actual return. |
| ∎ | Emerging markets securities risk. Emerging markets (also referred to as developing markets) are generally subject to greater market volatility, political, social and economic instability, uncertain trading markets and more |
| 9 | Invesco Income Allocation Fund |
governmental limitations on foreign investment than more developed markets. In addition, companies operating in emerging markets may be subject to lower trading volume and greater price fluctuations than companies in more developed markets. Securities law and the enforcement of systems of taxation in many emerging market countries may change quickly and unpredictably. In addition, investments in emerging markets securities may also be subject to additional transaction costs, delays in settlement procedures, and lack of timely information. |
| ∎ | Exchange-traded fund industry concentration risk. In following its methodology, an underlying exchange-traded fund’s underlying index from time to time may be concentrated to a significant degree in securities of issuers located in a single industry or sector. To the extent that an underlying fund’s underlying index concentrates in the securities of issuers in a particular industry or sector, an underlying fund will also concentrate its investments to approximately the same extent. By concentrating its investments in an industry or sector, an underlying fund faces more risks than if it were diversified broadly over numerous industries or sectors. Such industry-based risks, any of which may adversely affect the companies in which an underlying fund invests, may include, but are not limited to, the following: general economic conditions or cyclical market patterns that could negatively affect supply and demand in a particular industry; competition for resources, adverse labor relations, political or world events; obsolescence of technologies; and increased competition or new product introductions that may affect the profitability or viability of companies in an industry. In addition, at times, such industry or sector may be out of favor and underperform other industries or the market as a whole. |
| ∎ | Exchange-traded funds risk. In addition to the risks associated with the underlying assets held by the exchange-traded fund, investments in exchange-traded funds are subject to the following additional risks: (1) an exchange-traded fund’s shares may trade above or below its net asset value; (2) an active trading market for the exchange-traded fund’s shares may not develop or be maintained; (3) trading an exchange-traded fund’s shares may be halted by the listing exchange; (4) a passively-managed exchange-traded fund may |
not track the performance of the reference asset; and (5) a passively managed exchange-traded fund may hold troubled securities. Investment in exchange-traded funds may involve duplication of management fees and certain other expenses, as the Fund or an underlying fund indirectly bears its proportionate share of any expenses paid by the exchange-traded funds in which it invests. Further, certain exchange-traded funds in which the Fund or an underlying fund may invest are leveraged, which may result in economic leverage, permitting the Fund or an underlying fund to gain exposure that is greater than would be the case in an unlevered instrument, and potentially resulting in greater volatility. |
| ∎ | Financial services sector risk. An underlying fund may be susceptible to adverse economic or regulatory occurrences affecting the financial services sector. Financial services companies are subject to extensive government regulation and are disproportionately affected by unstable interest rates, each of which could adversely affect the profitability of such companies. Financial services companies may also have concentrated portfolios, which make them especially vulnerable to unstable economic conditions. |
| ∎ | Foreign credit exposure risk. US dollar-denominated securities carrying foreign credit exposure may be affected by unfavorable political, economic or governmental developments that could affect payments of principal and interest. |
| ∎ | Foreign currency tax risk. If the US Treasury Department were to exercise its authority to issue regulations that exclude from the definition of “qualifying income” foreign currency gains not directly related to an underlying fund’s business of investing in securities, the underlying fund may be unable to qualify as a regulated investment company for one or more years. In this event, the underlying fund’s Board of Trustees may authorize a significant change in investment strategy or other action. |
| ∎ | Foreign government debt risk. Investments in foreign government debt securities (sometimes referred to as sovereign debt securities) involve certain risks in addition to those relating to foreign securities or debt securities generally. The issuer of the debt or the governmental authorities that control the repayment of the debt may be unable or unwilling to repay principal or interest when due in accordance with the terms of such debt, and an underlying |
fund may have limited recourse in the event of a default against the defaulting government. Without the approval of debt holders, some governmental debtors have in the past been able to reschedule or restructure their debt payments or declare moratoria on payments. |
| ∎ | Foreign securities risk. An underlying fund’s foreign investments may be adversely affected by political and social instability, changes in economic or taxation policies, difficulty in enforcing obligations, decreased liquidity or increased volatility. Foreign investments also involve the risk of the possible seizure, nationalization or expropriation of the issuer or foreign deposits (in which an underlying fund could lose its entire investments in a certain market) and the possible adoption of foreign governmental restrictions such as exchange controls. Unless an underlying fund has hedged its foreign securities risk, foreign securities risk also involves the risk of negative foreign currency rate fluctuations, which may cause the value of securities denominated in such foreign currency (or other instruments through which an underlying fund has exposure to foreign currencies) to decline in value. Currency exchange rates may fluctuate significantly over short periods of time. Currency hedging strategies, if used, are not always successful. |
| ∎ | Fund of funds risk. The Fund’s performance depends on that of the underlying funds in which it invests. Accordingly, the risks associated with an investment in the Fund include the risks associated with investments in the underlying funds. The Fund will indirectly pay a proportional share of the fees and expenses of the underlying funds in which it invests. There are risks that the Fund will vary from its target weightings (if any) in the underlying funds, that the underlying funds will not achieve their investment objectives, that the underlying funds’ performance may be lower than their represented asset classes, and that the Fund may withdraw its investments in an underlying fund at a disadvantageous time. |
| ∎ | High yield debt securities (junk bond) risk. Investments in high yield debt securities (“junk bonds”) and other lower-rated securities will subject an underlying fund to substantial risk of loss. These securities are considered to be speculative with respect to the issuer’s ability to pay interest and principal when due, are more susceptible to |
| 10 | Invesco Income Allocation Fund |
default or decline in market value and are less liquid than investment grade debt securities. Prices of high yield debt securities tend to be very volatile. |
| ∎ | Indexing risk. An underlying fund is operated as a passively managed index fund and, therefore, the adverse performance of a particular security necessarily will not result in the elimination of the security from the underlying fund’s portfolio. Ordinarily, the underlying fund’s adviser will not sell the underlying fund’s portfolio securities except to reflect additions or deletions of the securities that comprise the underlying fund’s underlying index, or as may be necessary to raise cash to pay underlying fund shareholders who sell underlying fund shares. As such, the underlying fund will be negatively affected by declines in the securities represented by its underlying index. Also, there is no guarantee that the underlying fund’s adviser will be able to correlate the underlying fund’s performance with that of its underlying index. |
| ∎ | Investment companies risk. Investing in other investment companies could result in the duplication of certain fees, including management and administrative fees, and may expose an underlying fund to the risks of owning the underlying investments that the other investment company holds. |
| ∎ | Liquidity risk. An underlying fund may be unable to sell illiquid investments at the time or price it desires and, as a result, could lose its entire investment in such investments. Liquid securities can become illiquid during periods of market stress. If a significant amount of the an underlying fund’s securities become illiquid, an underlying fund may not be able to timely pay redemption proceeds and may need to sell securities at significantly reduced prices. |
| ∎ | Management risk. An underlying fund is actively managed and depends heavily on an underlying fund’s adviser’s judgment about markets, interest rates or the attractiveness, relative values, liquidity, or potential appreciation of particular investments made for an underlying fund’s portfolio. An underlying fund could experience losses if these judgments prove to be incorrect. Additionally, legislative, regulatory, or tax developments may adversely affect management of an underlying fund and, therefore, the ability of the underlying fund to achieve its investment objective. |
| ∎ | Market risk. The market values of an underlying fund’s investments, and |
therefore the value of an underlying fund’s shares, will go up and down, sometimes rapidly or unpredictably. Market risk may affect a single issuer, industry or section of the economy, or it may affect the market as a whole. Individual stock prices tend to go up and down more dramatically than those of certain other types of investments, such as bonds. During a general downturn in the financial markets, multiple asset classes may decline in value. When markets perform well, there can be no assurance that specific investments held by an underlying fund will rise in value. |
| ∎ | Market trading risk. An underlying exchange-traded fund faces numerous market trading risks, including the potential lack of an active market for its shares, losses from trading in secondary markets, and disruption in the creation/redemption process of an underlying fund. Any of these factors may lead to an underlying fund’s shares trading at a premium or discount to an underlying fund’s net asset value (NAV). |
| ∎ | MLP risk. An underlying fund invests in securities of MLPs, which are subject to the following risks: |
| – | Limited partner risk. An MLP is a public limited partnership or limited liability company taxed as a partnership under the Internal Revenue Code of 1986, as amended (the Code). Although the characteristics of MLPs closely resemble a traditional limited partnership, a major difference is that MLPs may trade on a public exchange or in the over-the-counter market. The risks of investing in an MLP are similar to those of investing in a partnership, including more flexible governance structures, which could result in less protection for investors than investments in a corporation. Investors in an MLP normally would not be liable for the debts of the MLP beyond the amount that the investor has contributed but investors may not be shielded to the same extent that a shareholder of a corporation would be. In certain circumstances, creditors of an MLP would have the right to seek return of capital distributed to a limited partner, which right would continue after an investor sold its investment in the MLP. |
| - | Liquidity risk. The ability to trade on a public exchange or in the over-the-counter market provides a certain amount of liquidity not found in many limited partnership |
| investments. However, MLP interests may be less liquid than conventional publicly traded securities and, therefore, more difficult to trade at desirable times and/or prices. |
| – | Interest rate risk. In addition, MLP distributions may be reduced by fees and other expenses incurred by the MLP. MLPs generally are considered interest-rate sensitive investments. During periods of interest rate volatility, these investments may not provide attractive returns. |
| – | General partner risk. The holder of the general partner or managing member interest can be liable in certain circumstances for amounts greater than the amount of the holder’s investment in the general partner or managing member. |
Additionally, if an underlying fund were to invest more than 25% of its total assets in MLPs that are taxed as partnerships this could cause an underlying fund to lose its status as regulated investment company under Subchapter M of the Code.
| ∎ | MLP tax risk. MLPs taxed as partnerships do not pay US federal income tax at the partnership level. A change in current tax law, or a change in the underlying business mix of a given MLP, however, could result in an MLP being classified as a corporation for US federal income tax purposes, which would have the effect of reducing the amount of cash available for distribution by the MLP and could cause a reduction of the value of an underlying fund’s investment, and consequently the Fund’s investment in an underlying fund and lower income. |
| ∎ | Mortgage- and asset-backed securities risk. Mortgage- and asset-backed securities are subject to prepayment or call risk, which is the risk that a borrower’s payments may be received earlier or later than expected due to changes in prepayment rates on underlying loans. This could result in an underlying fund reinvesting these early payments at lower interest rates, thereby reducing an underlying fund’s income. Mortgage- and asset-backed securities also are subject to extension risk, which is the risk that an unexpected rise in interest rates could reduce the rate of prepayments, causing the price of the mortgage- and asset-backed securities and an underlying fund’s share price to fall. An unexpectedly high rate of defaults on the mortgages held by a mortgage pool will adversely affect the value of mortgage-backed securities and will |
| 11 | Invesco Income Allocation Fund |
result in losses to an underlying fund. An underlying fund may invest in mortgage pools that include subprime mortgages, which are loans made to borrowers with weakened credit histories or with lower capacity to make timely payments on their mortgages. Privately issued mortgage-related securities are not subject to the same underwriting requirements as those with government or government-sponsored entity guarantees and, therefore, mortgage loans underlying privately issued mortgage-related securities may have less favorable collateral, credit risk or other underwriting characteristics, and wider variances in interest rate, term, size, purpose and borrower characteristics. |
| ∎ | Municipal securities risk. The risk of a municipal obligation generally depends on the financial and credit status of the issuer. Constitutional amendments, legislative enactments, executive orders, administrative regulations, voter initiatives, and the issuer’s regional economic conditions may affect the municipal security’s value, interest payments, repayment of principal and an underlying fund’s ability to sell the security. Failure of a municipal security issuer to comply with applicable tax requirements may make income paid thereon taxable, resulting in a decline in the security’s value. In addition, there could be changes in applicable tax laws or tax treatments that reduce or eliminate the current federal income tax exemption on municipal securities or otherwise adversely affect the current federal or state tax status of municipal securities. |
| ∎ | Non-correlation risk. The return of an underlying fund’s preferred equity segment may not match the return of the underlying index for a number of reasons. For example, an underlying fund incurs operating expenses not applicable to the underlying index, and incurs costs in buying and selling securities, especially when rebalancing securities holdings to reflect changes in the index. In addition, the performance of the preferred equity segment and the underlying index may vary due to asset valuation differences and differences between the preferred equity segment and the index resulting from legal restrictions, costs or liquidity constraints. |
| ∎ | Non-diversification risk. An underlying fund is non-diversified and can invest a greater portion of its assets in the obligations or securities of a small number of issuers or any single issuer than a diversified fund can. A change in the value |
of one or a few issuers’ securities will therefore affect the value of an underlying fund more than would occur in a diversified fund. |
| ∎ | Preferred securities risk. Preferred securities are subject to issuer specific and market risks applicable generally to equity securities. Preferred securities also may be subordinated to bonds or other debt instruments, subjecting them to a greater risk of nonpayment, may be less liquid than many other securities, such as common stocks, and generally offer no voting rights with respect to the issuer. |
| ∎ | Real estate investment trust (REIT) risk/real estate risk. An underlying fund concentrates its investments in the securities of real estate and real estate related companies. Investments in real estate related instruments may be affected by economic, legal, cultural, environmental or technological factors that affect property values, rents or occupancies of real estate related to an underlying fund’s holdings. Shares of real estate related companies, which tend to be small- and mid-cap companies, may be more volatile and less liquid than larger companies. The value of investments in real estate related companies may be affected by the quality of management, the ability to repay loans, the utilization of leverage and financial covenants related thereto, whether the company carries adequate insurance and environmental factors. If a real estate related company defaults on certain types of debt obligations, an underlying fund may own real estate directly, which involves additional risks such as environmental liabilities; difficulty in valuing and selling the real estate; and economic or regulatory changes. |
| ∎ | Risk of subordinated debt. Perpetual subordinated debt is a type of hybrid instrument that has no maturity date for the return of principal and does not need to be redeemed by the issuer. These investments typically have lower credit ratings and lower priority than other obligations of an issuer during bankruptcy, presenting a greater risk for nonpayment. This risk increases as the priority of the obligation becomes lower. Payments on these securities may be subordinated to all existing and future liabilities and obligations of subsidiaries and associated companies of an issuer. Additionally, some perpetual subordinated debt does not restrict the ability of an issuer’s subsidiaries to incur further unsecured indebtedness. |
| ∎ | Sampling risk. An underlying fund’s use of a representative sampling approach will result in its holding a smaller number of securities than are in its underlying index and in the underlying fund holding securities not included in its underlying index. As a result, an adverse development respecting an issuer of securities held by the underlying fund could result in a greater decline in the underlying fund’s NAV than would be the case if all of the securities in its underlying index were held. An underlying fund’s use of a representative sampling approach may also include the risk that it may not track the return of its underlying index as well as it would have if the underlying fund held all of the securities in its underlying index. |
| ∎ | Short position risk. Because an underlying fund’s potential loss on a short position arises from increases in the value of the asset sold short, the underlying fund will incur a loss on a short position, which is theoretically unlimited, if the price of the asset sold short increases from the short sale price. The counterparty to a short position or other market factors may prevent an underlying fund from closing out a short position at a desirable time or price and may reduce or eliminate any gain or result in a loss. In a rising market, an underlying fund’s short positions will cause the underlying fund to underperform the overall market and its peers that do not engage in shorting. If an underlying fund holds both long and short positions, and both positions decline simultaneously, the short positions will not provide any buffer (hedge) from declines in value of the underlying fund’s long positions. Certain types of short positions involve leverage, which may exaggerate any losses, potentially more than the actual cost of the investment, and will increase the volatility of an underlying fund’s returns. |
| ∎ | Small- and mid-capitalization companies risks. Small- and mid-capitalization companies tend to be more vulnerable to changing market conditions, may have little or no operating history or track record of success, and may have more limited product lines and markets, less experienced management and fewer financial resources than larger companies. These companies’ securities may be more volatile and less liquid than those of more established companies, and their returns may vary, sometimes significantly, from the overall securities market. |
| 12 | Invesco Income Allocation Fund |
| ∎ | Subsidiary risk. By investing in the Subsidiary, an underlying fund is indirectly exposed to risks associated with the Subsidiary’s investments. The Subsidiary is not registered under the Investment Company Act of 1940, as amended (1940 Act), and, except as otherwise noted in this prospectus, is not subject to the investor protections of the 1940 Act. Changes in the laws of the United States and/or the Cayman Islands, under which an underlying fund and the Subsidiary, respectively, are organized, could result in the inability of an underlying fund and/or the Subsidiary to operate as described in this prospectus and the SAI, and could negatively affect an underlying fund and its shareholders. |
| ∎ | TBA transactions risk. TBA transactions involve the risk of loss if the securities received are less favorable than what was anticipated by an underlying fund when entering into the TBA transaction, or if the counterparty fails to deliver the securities. When an underlying fund enters into a short sale of a TBA mortgage it does not own, an underlying fund may have to purchase deliverable mortgages to settle the short sale at a higher price than anticipated, thereby causing a loss. As there is no limit on how much the price of mortgage securities can increase, an underlying fund’s exposure is unlimited. An underlying fund may not always be able to purchase mortgage securities to close out the short position at a particular time or at an acceptable price. In addition, taking short positions results in a form of leverage, which could increase the volatility of an underlying fund’s share price. |
| ∎ | US government obligations risk. Obligations of US government agencies and authorities receive varying levels of support and may not be backed by the full faith and credit of the US government, which could affect an underlying fund’s ability to recover should they default. No assurance can be given that the US government will provide financial support to its agencies and authorities if it is not obligated by law to do so. |
| ∎ | Value investing style risk. A value investing style subjects an underlying fund to the risk that the valuations never improve or that the returns on value equity securities are less than returns on other styles of investing or the overall stock market. |
| ∎ | When-issued, delayed delivery and forward commitment risks. When-issued and delayed delivery transactions subject |
an underlying fund to market risk because the value or yield of a security at delivery may be more or less than the purchase price or yield generally available when delivery occurs, and counterparty risk because an underlying fund relies on the buyer or seller, as the case may be, to consummate the transaction. These transactions also have a leveraging effect on an underlying fund because an underlying fund commits to purchase securities that it does not have to pay for until a later date, which increases an underlying fund’s overall investment exposure and, as a result, its volatility. |
| ∎ | Zero coupon or pay-in-kind securities risk. The value, interest rates, and liquidity of noncash paying instruments, such as zero coupon and pay-in-kind securities, are subject to greater fluctuation than other types of securities. The higher yields and interest rates on pay-in-kind securities reflect the payment deferral and increased credit risk associated with such instruments and that such investments may represent a higher credit risk than loans that periodically pay interest. |
About indexes used in this report
| ∎ | The S&P 500® Index is an unmanaged index considered representative of the US stock market. |
| ∎ | The Custom Invesco Income Allocation Index, created by Invesco to serve as a benchmark for Invesco Income Allocation Fund, is composed of the following indexes: Russell 3000 Index, MSCI EAFE Index, FTSE NAREIT Equity REITs Index and Bloomberg Barclays U.S. Universal Index. The composition of the index may change based on the fund’s target asset allocation. Therefore, the current composition of the index does not reflect its historical composition and will likely be altered in the future to better reflect the fund’s objective. |
| ∎ | The Lipper Mixed-Asset Target Allocation Conservative Funds Index is an unmanaged index considered representative of mixed-asset target allocation conservative funds tracked by Lipper. |
| ∎ | The Russell 3000® Index is an unmanaged index considered representative of the US stock market. The Russell 3000 Index is a trademark/service mark of the Frank Russell Co. Russell® is a trademark of the Frank Russell Co. |
| ∎ | The MSCI EAFE® Index is an unmanaged index considered representative of stocks of Europe, Australasia and the Far East. The index is computed |
using the net return, which withholds applicable taxes for non-resident investors. |
| ∎ | The FTSE NAREIT Equity REITs Index is an unmanaged index considered representative of US REITs. The index is computed using the net return which withholds applicable taxes for non-resident investors. |
| ∎ | The Bloomberg Barclays U.S. Universal Index represents the union of the U.S. Aggregate Index, the U.S. HighYield Corporate Index, the 144A Index, the Eurodollar Index, the Emerging Markets Index and the non-ERISA portion of the CMBS Index. |
| ∎ | The Fund is not managed to track the performance of any particular index, including the index(es) described here, and consequently, the performance of the Fund may deviate significantly from the performance of the index(es). |
| ∎ | A direct investment cannot be made in an index. Unless otherwise indicated, index results include reinvested dividends, and they do not reflect sales charges. Performance of the peer group, if applicable, reflects fund expenses; performance of a market index does not. |
Other information
| ∎ | The returns shown in management’s discussion of Fund performance are based on net asset values (NAVs) calculated for shareholder transactions. Generally accepted accounting principles require adjustments to be made to the net assets of the Fund at period end for financial reporting purposes, and as such, the NAVs for shareholder transactions and the returns based on those NAVs may differ from the NAVs and returns reported in the Financial Highlights. |
| 13 | Invesco Income Allocation Fund |
Schedule of Investments
December 31, 2017
Invesco Income Allocation Fund
Schedule of Investments in Affiliated Issuers–99.95%(a)
| % of Net Assets 12/31/17 | Value 12/31/16 | Purchases at Cost | Proceeds from Sales | Change in Unrealized Appreciation (Depreciation) | Realized Gain (Loss) | Dividend Income | Shares 12/31/17 | Value 12/31/17 | ||||||||||||||||||||||||||||
Domestic Equity Funds–19.55% |
| |||||||||||||||||||||||||||||||||||
Invesco Dividend Income | 12.61 | % | $ | 74,474,425 | $ | 11,601,714 | $ | (10,573,958 | ) | $ | 2,411,685 | $ | 2,887,065 | $ | 1,701,674 | 3,220,750 | $ | 78,908,362 | ||||||||||||||||||
PowerShares Russell Top 200 Pure Value Portfolio–ETF | 6.94 | % | 42,453,635 | 5,383,558 | (9,599,983 | ) | 2,722,181 | 2,457,485 | 741,585 | 1,121,017 | 43,416,876 | |||||||||||||||||||||||||
Total Domestic Equity Funds | 116,928,060 | 16,985,272 | (20,173,941 | ) | 5,133,866 | 5,344,550 | 2,443,259 | 122,325,238 | ||||||||||||||||||||||||||||
Fixed-Income Funds–68.08% |
| |||||||||||||||||||||||||||||||||||
Invesco Core Plus Bond | 13.42 | % | 75,090,646 | 9,408,367 | (2,132,228 | ) | 1,624,881 | (42,332 | ) | 2,515,047 | 7,694,714 | 83,949,334 | ||||||||||||||||||||||||
Invesco Corporate Bond Fund–Class R6 | 4.73 | % | 21,390,278 | 7,518,068 | — | 715,006 | 163,344 | 1,053,431 | 3,992,366 | 29,623,352 | ||||||||||||||||||||||||||
Invesco Floating Rate | 7.20 | % | 37,549,311 | 7,665,850 | (91,823 | ) | (66,290 | ) | (851 | ) | 1,827,147 | 5,959,814 | 45,056,197 | |||||||||||||||||||||||
Invesco High Yield | 7.20 | % | 37,558,161 | 7,258,474 | (102,038 | ) | 481,863 | (1,764 | ) | 2,118,427 | 10,781,928 | 45,068,460 | ||||||||||||||||||||||||
Invesco Multi Asset Income | 9.95 | % | 50,848,603 | 9,216,938 | (210,531 | ) | 2,433,828 | 525,393 | 2,865,063 | 5,698,355 | 62,283,018 | |||||||||||||||||||||||||
Invesco Quality Income | 11.67 | % | 51,085,730 | 22,930,590 | (138,883 | ) | (865,899 | ) | (3,896 | ) | 2,358,297 | 6,083,970 | 73,007,642 | |||||||||||||||||||||||
PowerShares 1-30 Laddered Treasury Portfolio–ETF | 3.50 | % | 21,403,902 | 2,510,582 | (2,644,521 | ) | 780,756 | (175,630 | ) | 434,288 | 667,534 | 21,875,089 | ||||||||||||||||||||||||
PowerShares Emerging Markets Sovereign Debt Portfolio–ETF | 5.22 | % | 26,630,246 | 5,142,105 | (388,624 | ) | 1,266,202 | (16,855 | ) | 1,451,783 | 1,104,708 | 32,633,074 | ||||||||||||||||||||||||
PowerShares Variable Rate Preferred Portfolio–ETF | 5.19 | % | 26,798,272 | 5,101,317 | (564,613 | ) | 1,110,166 | 17,452 | 1,403,794 | 1,265,105 | 32,462,594 | |||||||||||||||||||||||||
Total Fixed-Income Funds | 348,355,149 | 76,752,291 | (6,273,261 | ) | 7,480,513 | 464,861 | 16,027,277 | 425,958,760 | ||||||||||||||||||||||||||||
Foreign Equity Funds–5.47% |
| |||||||||||||||||||||||||||||||||||
PowerShares International Dividend Achievers | 0.00 | % | 16,082,900 | 497,700 | (17,291,780 | ) | 1,865,987 | (1,154,807 | ) | 18,993 | — | — | ||||||||||||||||||||||||
Power Shares S&P International Developed Low Volatility Portfolio–ETF | 5.47 | % | 16,110,068 | 15,154,743 | (953,615 | ) | 3,912,816 | 26,620 | 1,012,148 | 1,017,547 | 34,250,632 | |||||||||||||||||||||||||
Total Foreign Equity Funds | 32,192,968 | 15,652,443 | (18,245,395 | ) | 5,778,803 | (1,128,187 | ) | 1,031,141 | 34,250,632 | |||||||||||||||||||||||||||
Real Estate Funds–6.24% |
| |||||||||||||||||||||||||||||||||||
Invesco Global Real Estate Income Fund–Class R6 | 6.24 | % | 37,612,781 | 3,976,320 | (4,422,835 | ) | 1,980,977 | (80,685 | ) | 1,478,041 | 4,293,029 | 39,066,558 | ||||||||||||||||||||||||
Money Market Funds–0.61% |
| |||||||||||||||||||||||||||||||||||
Invesco Government & Agency | 0.21 | % | 3,256,080 | 38,392,678 | (40,312,690 | ) | — | — | 15,568 | 1,336,068 | 1,336,068 | |||||||||||||||||||||||||
Invesco Liquid Assets | 0.15 | % | — | 2,445,769 | (1,491,435 | ) | (3 | ) | (105 | ) | 993 | 954,130 | 954,226 | |||||||||||||||||||||||
Invesco Treasury | 0.25 | % | 2,170,720 | 26,728,780 | (27,372,566 | ) | — | — | 10,492 | 1,526,934 | 1,526,934 | |||||||||||||||||||||||||
Total Money Market Funds | 5,426,800 | 67,567,227 | (69,176,691 | ) | (3 | ) | (105 | ) | 27,053 | 3,817,228 | ||||||||||||||||||||||||||
TOTAL INVESTMENTS IN AFFILIATED ISSUERS | 99.95 | % | $ | 540,515,758 | $ | 180,933,553 | $ | (118,292,123 | ) | $ | 20,374,156 | (b) | $ | 4,600,434 | (c) | $ | 21,006,771 | $ | 625,418,416 | |||||||||||||||||
OTHER ASSETS LESS LIABILITIES | 0.05 | % | 307,248 | |||||||||||||||||||||||||||||||||
NET ASSETS | 100.00 | % | $ | 625,725,664 | ||||||||||||||||||||||||||||||||
Investment Abbreviations:
ETF – Exchange Traded Fund
Notes to Schedule of Investments:
| (a) | Each underlying fund and the Fund are affiliated by either having the same investment adviser or an investment adviser under common control with the Fund’s investment adviser. |
| (b) | Includes $126,236 of return of capital from Invesco High Yield Fund. |
| (c) | Includes $1,892,569, $163,344 and $531,213 of capital gains distributions from affiliated underlying funds for Invesco Dividend Income Fund, Invesco Corporate Bond Fund, and Invesco Multi Asset Income Fund, respectively. |
| (d) | The rate shown is the 7-day SEC standardized yield as of December 31, 2017. |
See accompanying Notes to Financial Statements which are an integral part of the financial statements.
14 Invesco Income Allocation Fund
Statement of Assets and Liabilities
December 31, 2017
Assets: | ||||
Investments in affiliated underlying funds, at value (Cost $583,764,665) | $ | 625,418,416 | ||
Cash | 98,461 | |||
Receivable for: | ||||
Fund shares sold | 1,103,287 | |||
Dividends | 12,293 | |||
Fund expenses absorbed | 15,485 | |||
Investment for trustee deferred compensation and retirement plans | 50,540 | |||
Other assets | 49,766 | |||
Total assets | 626,748,248 | |||
Liabilities: | ||||
Payable for: | ||||
Fund shares reacquired | 587,520 | |||
Accrued fees to affiliates | 334,135 | |||
Accrued trustees’ and officers’ fees and benefits | 808 | |||
Accrued other operating expenses | 44,036 | |||
Trustee deferred compensation and retirement plans | 56,085 | |||
Total liabilities | 1,022,584 | |||
Net assets applicable to shares outstanding | $ | 625,725,664 | ||
Net assets consist of: | ||||
Shares of beneficial interest | $ | 589,765,544 | ||
Undistributed net investment income | 1,979,517 | |||
Undistributed net realized gain (loss) | (7,673,148 | ) | ||
Net unrealized appreciation | 41,653,751 | |||
| $ | 625,725,664 | |||
Net Assets: | ||||
Class A | $ | 391,849,665 | ||
Class B | $ | 862,621 | ||
Class C | $ | 147,051,478 | ||
Class R | $ | 6,948,586 | ||
Class Y | $ | 76,898,140 | ||
Class R5 | $ | 2,104,921 | ||
Class R6 | $ | 10,253 | ||
Shares outstanding, no par value, |
| |||
Class A | 33,501,804 | |||
Class B | 73,600 | |||
Class C | 12,558,745 | |||
Class R | 593,773 | |||
Class Y | 6,575,021 | |||
Class R5 | 179,940 | |||
Class R6 | 876 | |||
Class A: | ||||
Net asset value per share | $ | 11.70 | ||
Maximum offering price per share | ||||
(Net asset value of $11.70 ¸ 94.50%) | $ | 12.38 | ||
Class B: | ||||
Net asset value and offering price per share | $ | 11.72 | ||
Class C: | ||||
Net asset value and offering price per share | $ | 11.71 | ||
Class R: | ||||
Net asset value and offering price per share | $ | 11.70 | ||
Class Y: | ||||
Net asset value and offering price per share | $ | 11.70 | ||
Class R5: | ||||
Net asset value and offering price per share | $ | 11.70 | ||
Class R6: | ||||
Net asset value and offering price per share | $ | 11.70 | ||
See accompanying Notes to Financial Statements which are an integral part of the financial statements.
15 Invesco Income Allocation Fund
Statement of Operations
For the year ended December 31, 2017
Investment income: | ||||
Dividends from affiliated underlying funds | $ | 21,006,771 | ||
Expenses: | ||||
Administrative services fees | 164,035 | |||
Custodian fees | 19,745 | |||
Distribution fees: | ||||
Class A | 954,625 | |||
Class B | 13,778 | |||
Class C | 1,369,521 | |||
Class R | 28,769 | |||
Transfer agent fees — A, B, C, R and Y | 684,230 | |||
Transfer agent fees — R5 | 1,645 | |||
Transfer agent fees — R6 | 5 | |||
Trustees’ and officers’ fees and benefits | 28,802 | |||
Registration and filing fees | 135,717 | |||
Reports to shareholders | 148,861 | |||
Professional services fees | 46,836 | |||
Other | 17,396 | |||
Total expenses | 3,613,965 | |||
Less: Expenses reimbursed and expense offset arrangement(s) | (1,248,179 | ) | ||
Net expenses | 2,365,786 | |||
Net investment income | 18,640,985 | |||
Realized and unrealized gain from investments in affiliated underlying fund shares | ||||
Net realized gain on sales of affiliated underlying fund shares | 2,013,308 | |||
Net realized gain from distributions of affiliated underlying fund shares | 2,587,126 | |||
Net realized gain from affiliated underlying fund shares | 4,600,434 | |||
Change in net unrealized appreciation of affiliated underlying fund shares | 20,374,156 | |||
Net gain from affiliated underlying funds | 24,974,590 | |||
Net increase in net assets resulting from operations | $ | 43,615,575 | ||
See accompanying Notes to Financial Statements which are an integral part of the financial statements.
16 Invesco Income Allocation Fund
Statement of Changes in Net Assets
For the years ended December 31, 2017 and 2016
| 2017 | 2016 | |||||||
Operations: | ||||||||
Net investment income | $ | 18,640,985 | $ | 16,660,112 | ||||
Net realized gain (loss) | 4,600,434 | (5,077,184 | ) | |||||
Change in net unrealized appreciation | 20,374,156 | 28,540,317 | ||||||
Net increase in net assets resulting from operations | 43,615,575 | 40,123,245 | ||||||
Distributions to shareholders from net investment income: | ||||||||
Class A | (13,007,437 | ) | (10,786,287 | ) | ||||
Class B | (37,575 | ) | (60,603 | ) | ||||
Class C | (3,631,941 | ) | (2,823,247 | ) | ||||
Class R | (181,591 | ) | (117,720 | ) | ||||
Class Y | (2,204,811 | ) | (840,367 | ) | ||||
Class R5 | (60,821 | ) | (30,206 | ) | ||||
Class R6 | (273 | ) | — | |||||
Total distributions from net investment income | (19,124,449 | ) | (14,658,430 | ) | ||||
Distributions to shareholders from net realized gains: | ||||||||
Class A | — | (1,786,804 | ) | |||||
Class B | — | (10,472 | ) | |||||
Class C | — | (604,333 | ) | |||||
Class R | — | (24,654 | ) | |||||
Class Y | — | (163,653 | ) | |||||
Class R5 | — | (4,070 | ) | |||||
Total distributions from net realized gains | — | (2,593,986 | ) | |||||
Share transactions–net: | ||||||||
Class A | 3,551,272 | 73,336,171 | ||||||
Class B | (1,241,085 | ) | (986,779 | ) | ||||
Class C | 16,085,365 | 18,522,029 | ||||||
Class R | 1,690,792 | 1,783,350 | ||||||
Class Y | 39,613,011 | 19,395,146 | ||||||
Class R5 | 1,222,860 | (64,705 | ) | |||||
Class R6 | 10,000 | — | ||||||
Net increase in net assets resulting from share transactions | 60,932,215 | 111,985,212 | ||||||
Net increase in net assets | 85,423,341 | 134,856,041 | ||||||
Net assets: | ||||||||
Beginning of year | 540,302,323 | 405,446,282 | ||||||
End of year (includes undistributed net investment income of $1,979,517 and $2,017,094, respectively) | $ | 625,725,664 | $ | 540,302,323 | ||||
Notes to Financial Statements
December 31, 2017
NOTE 1—Significant Accounting Policies
Invesco Income Allocation Fund (the “Fund”) is a series portfolio of AIM Growth Series (Invesco Growth Series) (the “Trust”). The Trust is organized as a Delaware statutory trust and is registered under the Investment Company Act of 1940, as amended (the “1940 Act”), as an open-end series management investment company consisting of twenty-nine separate series portfolios, each authorized to issue an unlimited number of shares of beneficial interest. The assets, liabilities and operations of each portfolio are accounted for separately. Information presented in these financial statements pertains only to the Fund. Matters affecting each portfolio or class will be voted on exclusively by the shareholders of such portfolio or class.
The Fund’s investment objective is current income and, secondarily, growth of capital.
The Fund is a “fund of funds”, in that it invests in other mutual funds (“underlying funds”) advised by Invesco Advisers, Inc. (the “Adviser” or “Invesco”) and exchange-traded funds advised by Invesco PowerShares Capital Management LLC (“PowerShares Capital”), an affiliate of Invesco.
17 Invesco Income Allocation Fund
Invesco and PowerShares Capital are affiliates of each other as they are indirect, wholly-owned subsidiaries of Invesco Ltd. Invesco may change the Fund’s asset class allocations, the underlying funds or the target weightings in the underlying funds without shareholder approval. The underlying funds may engage in a number of investment techniques and practices, which involve certain risks. Each underlying fund’s accounting policies are outlined in the underlying fund’s financial statements and are publicly available.
The Fund currently consists of seven different classes of shares: Class A, Class B, Class C, Class R, Class Y, Class R5 and Class R6. On April 4, 2017, the Fund began offering Class R6 shares. Class Y shares are available only to certain investors. Class A shares are sold with a front-end sales charge unless certain waiver criteria are met and under certain circumstances load waived shares may be subject to contingent deferred sales charges (“CDSC”). Class C shares are sold with a CDSC. Class R, Class Y, Class R5 and Class R6 shares are sold at net asset value. Effective November 30, 2010, new or additional investments in Class B shares are no longer permitted. Existing shareholders of Class B shares may continue to reinvest dividends and capital gains distributions in Class B shares until they convert to Class A shares. Also, shareholders in Class B shares will be able to exchange those shares for Class B shares of other Invesco Funds offering such shares until they convert to Class A shares. Generally, Class B shares will automatically convert to Class A shares on or about the month-end, which is at least eight years after the date of purchase. Redemption of Class B shares prior to the conversion date will be subject to a CDSC. Effective January 26, 2018, all of the Fund’s outstanding Class B shares were converted to Class A shares, in advance of their normally scheduled conversion. No CDSC was paid in connection with this early conversion.
The Fund is an investment company and accordingly follows the investment company accounting and reporting guidance in accordance with Financial Accounting Standards Board Accounting Standards Codification Topic 946, Financial Services — Investment Companies.
The following is a summary of the significant accounting policies followed by the Fund in the preparation of its financial statements.
| A. | Security Valuations — Securities of investment companies that trade on an exchange are valued at the last sales price or official closing price as of the close of the customary trading session on the exchange where the security is principally traded. Investments in shares of funds that are not traded on an exchange are valued at the end-of-day net asset value per share of such fund. Securities in the underlying funds, including restricted securities, are valued in accordance with the valuation policy of such fund. The policies of the underlying funds affiliated with the Fund as a result of having the same investment adviser are set forth below. |
A security listed or traded on an exchange (except convertible securities) is valued at its last sales price or official closing price as of the close of the customary trading session on the exchange where the security is principally traded, or lacking any sales or official closing price on a particular day, the security may be valued at the closing bid price on that day. Securities traded in the over-the-counter market are valued based on prices furnished by independent pricing services or market makers. When such securities are valued by an independent pricing service they may be considered fair valued. Futures contracts are valued at the final settlement price set by an exchange on which they are principally traded. Listed options are valued at the mean between the last bid and asked prices from the exchange on which they are principally traded. Options not listed on an exchange are valued by an independent source at the mean between the last bid and asked prices. For purposes of determining net asset value (“NAV”) per share, futures and option contracts generally are valued 15 minutes after the close of the customary trading session of the New York Stock Exchange (“NYSE”).
Variable rate senior loan interests are fair valued using quotes provided by an independent pricing service. Quotes provided by the pricing service may reflect appropriate factors such as ratings, tranche type, industry, company performance, spread, individual trading characteristics, institution-size trading in similar groups of securities and other market data.
Investments in open-end and closed-end registered investment companies that do not trade on an exchange are valued at the end-of-day net asset value per share. Investments in open-end and closed-end registered investment companies that trade on an exchange are valued at the last sales price or official closing price as of the close of the customary trading session on the exchange where the security is principally traded.
Debt obligations (including convertible securities) and unlisted equities are fair valued using an evaluated quote provided by an independent pricing service. Evaluated quotes provided by the pricing service may be determined without exclusive reliance on quoted prices, and may reflect appropriate factors such as institution-size trading in similar groups of securities, developments related to specific securities, dividend rate (for unlisted equities), yield (for debt obligations), quality, type of issue, coupon rate (for debt obligations), maturity (for debt obligations), individual trading characteristics and other market data. Pricing services generally value debt obligations assuming orderly transactions of institutional round lot size, but a fund may hold or transact in the same securities in smaller, odd lot sizes. Odd lots often trade at lower prices than institutional round lots. Debt obligations are subject to interest rate and credit risks. In addition, all debt obligations involve some risk of default with respect to interest and/or principal payments.
Swap agreements are fair valued using an evaluated quote, if available, provided by an independent pricing service. Evaluated quotes provided by the pricing service are valued based on a model which may include end-of-day net present values, spreads, ratings, industry, company performance and returns of referenced assets. Centrally cleared swap agreements are valued at the daily settlement price determined by the relevant exchange or clearinghouse.
Foreign securities’ (including foreign exchange contracts) prices are converted into U.S. dollar amounts using the applicable exchange rates as of the close of the NYSE. If market quotations are available and reliable for foreign exchange-traded equity securities, the securities will be valued at the market quotations. Because trading hours for certain foreign securities end before the close of the NYSE, closing market quotations may become unreliable. If between the time trading ends on a particular security and the close of the customary trading session on the NYSE, events occur that the investment adviser determines are significant and make the closing price unreliable, the Fund may fair value the security. If the event is likely to have affected the closing price of the security, the security will be valued at fair value in good faith using procedures approved by the Board of Trustees. Adjustments to closing prices to reflect fair value may also be based on a screening process of an independent pricing service to indicate the degree of certainty, based on historical data, that the closing price in the principal market where a foreign security trades is not the current value as of the close of the NYSE. Foreign securities’ prices meeting the approved degree of certainty that the price is not reflective of current value will be priced at the indication of fair value from the independent pricing service. Multiple factors may be considered by the independent pricing service in determining adjustments to reflect fair value and may include information relating to sector indices, American Depositary Receipts and domestic and foreign index futures. Foreign securities may have additional risks including exchange rate changes, potential for sharply devalued currencies and high inflation, political and economic upheaval, the relative lack of issuer information, relatively low market liquidity and the potential lack of strict financial and accounting controls and standards.
18 Invesco Income Allocation Fund
Securities for which market prices are not provided by any of the above methods may be valued based upon quotes furnished by independent sources. The last bid price may be used to value equity securities. The mean between the last bid and asked prices is used to value debt obligations, including corporate loans.
Securities for which market quotations are not readily available or became unreliable are valued at fair value as determined in good faith by or under the supervision of the Trust’s officers following procedures approved by the Board of Trustees. Issuer specific events, market trends, bid/asked quotes of brokers and information providers and other market data may be reviewed in the course of making a good faith determination of a security’s fair value.
The Fund may invest in securities that are subject to interest rate risk, meaning the risk that the prices will generally fall as interest rates rise and, conversely, the prices will generally rise as interest rates fall. Specific securities differ in their sensitivity to changes in interest rates depending on their individual characteristics. Changes in interest rates may result in increased market volatility, which may affect the value and/or liquidity of certain Fund investments.
Valuations change in response to many factors including the historical and prospective earnings of the issuer, the value of the issuer’s assets, general economic conditions, interest rates, investor perceptions and market liquidity. Because of the inherent uncertainties of valuation, the values reflected in the financial statements may materially differ from the value received upon actual sale of those investments.
| B. | Securities Transactions and Investment Income — Securities transactions are accounted for on a trade date basis. Realized gains or losses on sales are computed on the basis of specific identification of the securities sold. Distributions from ordinary income from underlying funds, if any, are recorded as dividend income on ex-dividend date. Distributions from gains from underlying funds, if any, are recorded as realized gains on the ex-dividend date. The following policies are followed by the underlying funds: Interest income (net of withholding tax, if any) is recorded on the accrual basis from settlement date. Bond premiums and discounts are amortized and/or accreted over the lives of the respective securities. Pay-in-kind interest income and non-cash dividend income received in the form of securities in-lieu of cash are recorded at the fair value of the securities received. Paydown gains and losses on mortgage and asset-backed securities are recorded as adjustments to interest income. |
The Fund may periodically participate in litigation related to Fund investments. As such, the Fund may receive proceeds from litigation settlements. Any proceeds received are included in the Statement of Operations as realized gain (loss) for investments no longer held and as unrealized gain (loss) for investments still held.
The Fund allocates income and realized and unrealized capital gains and losses to a class based on the relative net assets of each class.
| C. | Distributions — Distributions from net investment income, if any, are declared and paid monthly. Distributions from net realized capital gain, if any, are generally declared and paid annually and recorded on the ex-dividend date. The Fund may elect to treat a portion of the proceeds from redemptions as distributions for federal income tax purposes. |
| D. | Federal Income Taxes — The Fund intends to comply with the requirements of Subchapter M of the Internal Revenue Code of 1986, as amended (the “Internal Revenue Code”), necessary to qualify as a regulated investment company and to distribute substantially all of the Fund’s taxable earnings to shareholders. As such, the Fund will not be subject to federal income taxes on otherwise taxable income (including net realized capital gain) that is distributed to shareholders. Therefore, no provision for federal income taxes is recorded in the financial statements. |
The Fund recognizes the tax benefits of uncertain tax positions only when the position is more likely than not to be sustained. Management has analyzed the Fund’s uncertain tax positions and concluded that no liability for unrecognized tax benefits should be recorded related to uncertain tax positions. Management is not aware of any tax positions for which it is reasonably possible that the total amounts of unrecognized tax benefits will change materially in the next 12 months.
The Fund files tax returns in the U.S. Federal jurisdiction and certain other jurisdictions. Generally, the Fund is subject to examinations by such taxing authorities for up to three years after the filing of the return for the tax period.
| E. | Expenses — Expenses included in the accompanying financial statements reflect the expenses of the Fund and do not include any expenses of the underlying funds. The effects of the underlying funds expenses are included in the realized and unrealized gain/loss on the investments in the underlying funds. Estimated expenses of the underlying funds are discussed further in Note 11. |
Fees provided for under the Rule 12b-1 plan of a particular class of the Fund and which are directly attributable to that class are charged to the operations of such class. Transfer agency fees and expenses and other shareholder recordkeeping fees and expenses attributable to Class R5 and Class R6 are allocated to each share class based on relative net assets. Transfer agency fees and expenses and other shareholder recordkeeping fees and expenses relating to all other classes are allocated among those classes based on relative net assets. All other expenses are allocated among the classes based on relative net assets.
| F. | Accounting Estimates — The preparation of financial statements in conformity with accounting principles generally accepted in the United States of America (“GAAP”) requires management to make estimates and assumptions that affect the reported amounts of assets and liabilities at the date of the financial statements and the reported amounts of revenues and expenses during the reporting period including estimates and assumptions related to taxation. Actual results could differ from those estimates by a significant amount. In addition, the Fund monitors for material events or transactions that may occur or become known after the period-end date and before the date the financial statements are released to print. |
| G. | Indemnifications — Under the Trust’s organizational documents, each Trustee, officer, employee or other agent of the Trust is indemnified against certain liabilities that may arise out of the performance of their duties to the Fund. Additionally, in the normal course of business, the Fund enters into contracts, including the Fund’s servicing agreements, that contain a variety of indemnification clauses. The Fund’s maximum exposure under these arrangements is unknown as this would involve future claims that may be made against the Fund that have not yet occurred. The risk of material loss as a result of such indemnification claims is considered remote. |
19 Invesco Income Allocation Fund
NOTE 2—Advisory Fees and Other Fees Paid to Affiliates
The Trust has entered into a master investment advisory agreement with Invesco. Under the terms of the investment advisory agreement, the Fund does not pay an advisory fee. However, the Fund pays advisory fees to Invesco indirectly as a shareholder of the underlying funds.
Under the terms of a master sub-advisory agreement between the Adviser and each of Invesco Asset Management Deutschland GmbH, Invesco Asset Management Limited, Invesco Asset Management (Japan) Limited, Invesco Hong Kong Limited, Invesco Senior Secured Management, Inc. and Invesco Canada Ltd. (collectively, the “Affiliated Sub-Advisers”) the Adviser, not the Fund, will pay 40% of the fees paid to the Adviser to any such Affiliated Sub-Adviser(s) that provide(s) discretionary investment management services to the Fund based on the percentage of assets allocated to such Affiliated Sub-Adviser(s).
The Adviser has contractually agreed, through at least April 30, 2019, to reimburse expenses to the extent necessary to limit total annual fund operating expenses after expense reimbursement (excluding certain items discussed below) of Class A, Class B, Class C, Class R, Class Y, Class R5 and Class R6 shares to 0.25%, 1.00%, 1.00%, 0.50%, 0.00%, 0.00% and 0.00%, respectively, of average daily net assets (the “expense limits”). In determining Adviser’s obligation to reimburse expenses, the following expenses are not taken into account, and could cause the total annual fund operating expenses after expense reimbursement to exceed the numbers reflected above: (1) interest; (2) taxes; (3) dividend expense on short sales; (4) extraordinary or non-routine items, including litigation expenses; and (5) expenses that the Fund has incurred but did not actually pay because of an expense offset arrangement. Acquired Fund Fees and Expenses are not operating expenses of a Fund directly, but are fees and expenses, including management fees of the investment companies in which a Fund invests. As a result, the total annual fund operating expenses after expense reimbursement may exceed the expense limits above. Unless Invesco continues the fee waiver agreement, it will terminate on April 30, 2019. During its term, the fee waiver agreement cannot be terminated or amended to increase the expense limits or reduce the advisory fee waiver without approval of the Board of Trustees.
For the year ended December 31, 2017, the Adviser waived advisory fees of $562,300 and reimbursed class level expenses of $443,508, $1,600, $159,066, $6,683, $70,518, $1,645 and $5 of Class A, Class B, Class C, Class R, Class Y, Class R5 and Class R6 shares, respectively.
The Trust has entered into a master administrative services agreement with Invesco pursuant to which the Fund has agreed to pay Invesco for certain administrative costs incurred in providing accounting services to the Fund. For the year ended December 31, 2017, expenses incurred under the agreement are shown in the Statement of Operations as Administrative services fees.
The Trust has entered into a transfer agency and service agreement with Invesco Investment Services, Inc. (“IIS”) pursuant to which the Fund has agreed to pay IIS a fee for providing transfer agency and shareholder services to the Fund and reimburse IIS for certain expenses incurred by IIS in the course of providing such services. IIS may make payments to intermediaries that provide omnibus account services, sub-accounting services and/or networking services. All fees payable by IIS to intermediaries that provide omnibus account services or sub-accounting services are charged back to the Fund, subject to certain limitations approved by the Trust’s Board of Trustees. For the year ended December 31, 2017, expenses incurred under the agreement are shown in the Statement of Operations as Transfer agent fees.
The Trust has entered into master distribution agreements with Invesco Distributors, Inc. (“IDI”) to serve as the distributor for the Class A, Class B, Class C, Class R, Class Y, Class R5 and Class R6 shares of the Fund. The Trust has adopted plans pursuant to Rule 12b-1 under the 1940 Act with respect to the Fund’s Class A, Class B, Class C and Class R shares (collectively, the “Plans”). The Fund, pursuant to the Plans, pays IDI compensation at the annual rate of 0.25% of the Fund’s average daily net assets of Class A shares, 1.00% of the average daily net assets of Class B and Class C shares and 0.50% of the average daily net assets of Class R shares. The fees are accrued daily and paid monthly. Of the Plan payments, up to 0.25% of the average daily net assets of each class of shares may be paid to furnish continuing personal shareholder services to customers who purchase and own shares of such classes. Any amounts not paid as a service fee under the Plans would constitute an asset-based sales charge. Rules of the Financial Industry Regulatory Authority (“FINRA”) impose a cap on the total sales charges, including asset-based sales charges, that may be paid by any class of shares of the Fund. For the year ended December 31, 2017, expenses incurred under the Plans are shown in the Statement of Operations as Distribution fees.
Front-end sales commissions and CDSC (collectively, the “sales charges”) are not recorded as expenses of the Fund. Front-end sales commissions are deducted from proceeds from the sales of Fund shares prior to investment in Class A shares of the Fund. CDSC are deducted from redemption proceeds prior to remittance to the shareholder. During the year ended December 31, 2017, IDI advised the Fund that IDI retained $172,146 in front-end sales commissions from the sale of Class A shares and $22,355 and $12,113 from Class A and Class C shares, respectively, for CDSC imposed on redemptions by shareholders.
The underlying Invesco funds pay no distribution fees for Class R6 and the Fund pays no sales loads or other similar compensation to IDI for acquiring underlying fund shares.
Certain officers and trustees of the Trust are officers and directors of the Adviser, IIS and/or IDI.
NOTE 3—Additional Valuation Information
GAAP defines fair value as the price that would be received to sell an asset or paid to transfer a liability in an orderly transaction between market participants at the measurement date, under current market conditions. GAAP establishes a hierarchy that prioritizes the inputs to valuation methods, giving the highest priority to readily available unadjusted quoted prices in an active market for identical assets (Level 1) and the lowest priority to significant unobservable inputs (Level 3), generally when market prices are not readily available or are unreliable. Based on the valuation inputs, the securities or other investments are tiered into one of three levels. Changes in valuation methods may result in transfers in or out of an investment’s assigned level:
| Level 1 — | Prices are determined using quoted prices in an active market for identical assets. |
| Level 2 — | Prices are determined using other significant observable inputs. Observable inputs are inputs that other market participants may use in pricing a security. These may include quoted prices for similar securities, interest rates, prepayment speeds, credit risk, yield curves, loss severities, default rates, discount rates, volatilities and others. |
| Level 3 — | Prices are determined using significant unobservable inputs. In situations where quoted prices or observable inputs are unavailable (for example, when there is little or no market activity for an investment at the end of the period), unobservable inputs may be used. Unobservable inputs reflect the Fund’s own assumptions about the factors market participants would use in determining fair value of the securities or instruments and would be based on the best available information. |
20 Invesco Income Allocation Fund
As of December 31, 2017, all of the securities in this Fund were valued based on Level 1 inputs (see the Schedule of Investments for security categories). The level assigned to the securities valuations may not be an indication of the risk or liquidity associated with investing in those securities.
The Fund’s policy is to recognize transfers in and out of the valuation levels as of the end of the reporting period. During the year ended December 31, 2017, there were no material transfers between valuation levels.
NOTE 4—Expense Offset Arrangement(s)
The expense offset arrangement is comprised of transfer agency credits which result from balances in demand deposit accounts used by the transfer agent for clearing shareholder transactions. For the year ended December 31, 2017, the Fund received credits from this arrangement, which resulted in the reduction of the Fund’s total expenses of $2,854.
NOTE 5—Trustees’ and Officers’ Fees and Benefits
Trustees’ and Officers’ Fees and Benefits include amounts accrued by the Fund to pay remuneration to certain Trustees and Officers of the Fund. Trustees have the option to defer compensation payable by the Fund, and Trustees’ and Officers’ Fees and Benefits also include amounts accrued by the Fund to fund such deferred compensation amounts. Those Trustees who defer compensation have the option to select various Invesco Funds in which their deferral accounts shall be deemed to be invested. Finally, certain current Trustees were eligible to participate in a retirement plan that provided for benefits to be paid upon retirement to Trustees over a period of time based on the number of years of service. The Fund may have certain former Trustees who also participate in a retirement plan and receive benefits under such plan. Trustees’ and Officers’ Fees and Benefits include amounts accrued by the Fund to fund such retirement benefits. Obligations under the deferred compensation and retirement plans represent unsecured claims against the general assets of the Fund.
NOTE 6—Cash Balances
The Fund is permitted to temporarily carry a negative or overdrawn balance in its account with State Street Bank and Trust Company, the custodian bank. Such balances, if any at period-end, are shown in the Statement of Assets and Liabilities under the payable caption Amount due custodian. To compensate the custodian bank for such overdrafts, the overdrawn Fund may either (1) leave funds as a compensating balance in the account so the custodian bank can be compensated by earning the additional interest; or (2) compensate by paying the custodian bank at a rate agreed upon by the custodian bank and Invesco, not to exceed the contractually agreed upon rate.
NOTE 7—Distributions to Shareholders and Tax Components of Net Assets
Tax Character of Distributions to Shareholders Paid During the Fiscal Years Ended December 31, 2017 and 2016:
| 2017 | 2016 | |||||||
Ordinary income | $ | 19,124,449 | $ | 14,670,798 | ||||
Long-term capital gain | — | 2,581,618 | ||||||
Total distributions | $ | 19,124,449 | $ | 17,252,416 | ||||
Tax Components of Net Assets at Period-End:
| 2017 | ||||
Undistributed ordinary income | $ | 2,026,147 | ||
Net unrealized appreciation — investments | 35,121,344 | |||
Temporary book/tax differences | (46,630 | ) | ||
Capital loss carryforward | (1,140,741 | ) | ||
Shares of beneficial interest | 589,765,544 | |||
Total net assets | $ | 625,725,664 | ||
The difference between book-basis and tax-basis unrealized appreciation (depreciation) is due to differences in the timing of recognition of gains and losses on investments for tax and book purposes. The Fund’s net unrealized appreciation difference is attributable primarily to wash sales.
The temporary book/tax differences are a result of timing differences between book and tax recognition of income and/or expenses. The Fund’s temporary book/tax differences are the result of the trustee deferral of compensation and retirement plan benefits.
Capital loss carryforward is calculated and reported as of a specific date. Results of transactions and other activity after that date may affect the amount of capital loss carryforward actually available for the Fund to utilize. Capital losses generated in years beginning after December 22, 2010 can be carried forward for an unlimited period, whereas previous losses expire in eight tax years. Capital losses with an expiration period may not be used to offset capital gains until all net capital losses without an expiration date have been utilized. Capital loss carryforwards with no expiration date will retain their character as either short-term or long-term capital losses instead of as short-term capital losses as under prior law. The ability to utilize capital loss carryforwards in the future may be limited under the Internal Revenue Code and related regulations based on the results of future transactions.
The Fund has a capital loss carryforward as of December 31, 2017, as follows:
| Capital Loss Carryforward* | ||||||||||||
| Expiration | Short-Term | Long-Term | Total | |||||||||
Not subject to expiration | $ | 1,140,741 | $ | — | $ | 1,140,741 | ||||||
| * | Capital loss carryforward as of the date listed above is reduced for limitations, if any, to the extent required by the Internal Revenue Code and may be further limited depending upon a variety of factors, including the realization of net unrealized gains or losses as of the date of any reorganization. |
21 Invesco Income Allocation Fund
NOTE 8—Investment Transactions
The aggregate amount of investment securities (other than short-term securities, U.S. Treasury obligations and money market funds, if any) purchased and sold by the Fund during the year ended December 31, 2017 was $113,366,326 and $49,115,432, respectively. Cost of investments, including any derivatives, on a tax basis includes the adjustments for financial reporting purposes as of the most recently completed federal income tax reporting period-end.
| Unrealized Appreciation (Depreciation) of Investments on a Tax Basis | ||||
Aggregate unrealized appreciation of investments | $ | 37,541,570 | ||
Aggregate unrealized (depreciation) of investments | (2,420,226 | ) | ||
Net unrealized appreciation of investments | $ | 35,121,344 | ||
Cost of investments for tax purposes is $590,297,072.
NOTE 9—Reclassification of Permanent Differences
Primarily as a result of differing book/tax treatment of real estate investment trust and distributions from underlying funds, on December 31, 2017, undistributed net investment income was increased by $445,887 and undistributed net realized gain (loss) was decreased by $445,887. This reclassification had no effect on the net assets of the Fund.
NOTE 10—Share Information
| Summary of Share Activity | ||||||||||||||||
| Years ended December 31, | ||||||||||||||||
| 2017(a) | 2016 | |||||||||||||||
| Shares | Amount | Shares | Amount | |||||||||||||
Sold: | ||||||||||||||||
Class A | 8,390,016 | $ | 96,473,649 | 13,487,878 | $ | 149,016,802 | ||||||||||
Class B | 7,104 | 82,694 | 34,495 | 382,647 | ||||||||||||
Class C | 4,718,408 | 54,441,894 | 5,003,251 | 55,440,617 | ||||||||||||
Class R | 420,538 | 4,868,670 | 223,894 | 2,487,511 | ||||||||||||
Class Y | 5,475,552 | 62,899,823 | 2,542,320 | 28,076,340 | ||||||||||||
Class R5 | 124,566 | 1,432,150 | 31,419 | 344,822 | ||||||||||||
Class R6(b) | 876 | 10,000 | — | — | ||||||||||||
Issued as reinvestment of dividends: | ||||||||||||||||
Class A | 995,848 | 11,454,241 | 989,399 | 10,913,727 | ||||||||||||
Class B | 2,916 | 33,511 | 5,729 | 63,046 | ||||||||||||
Class C | 269,302 | 3,102,196 | 265,346 | 2,930,437 | ||||||||||||
Class R | 15,779 | 181,591 | 12,882 | 142,374 | ||||||||||||
Class Y | 139,205 | 1,604,550 | 69,307 | 766,956 | ||||||||||||
Class R5 | 5,229 | 60,338 | 3,062 | 33,746 | ||||||||||||
Automatic conversion of Class B shares to Class A shares: | ||||||||||||||||
Class A | 99,233 | 1,141,784 | 89,076 | 973,564 | ||||||||||||
Class B | (99,044 | ) | (1,141,784 | ) | (88,886 | ) | (973,564 | ) | ||||||||
Reacquired: | ||||||||||||||||
Class A | (9,179,305 | ) | (105,518,402 | ) | (7,887,261 | ) | (87,567,922 | ) | ||||||||
Class B | (18,734 | ) | (215,506 | ) | (41,765 | ) | (458,908 | ) | ||||||||
Class C | (3,592,624 | ) | (41,458,725 | ) | (3,603,448 | ) | (39,849,025 | ) | ||||||||
Class R | (289,754 | ) | (3,359,469 | ) | (76,211 | ) | (846,535 | ) | ||||||||
Class Y | (2,162,362 | ) | (24,891,362 | ) | (856,588 | ) | (9,448,150 | ) | ||||||||
Class R5 | (23,401 | ) | (269,628 | ) | (40,638 | ) | (443,273 | ) | ||||||||
Net increase in share activity | 5,299,348 | $ | 60,932,215 | 10,163,261 | $ | 111,985,212 | ||||||||||
| (a) | There are entities that are record owners of more than 5% of the outstanding shares of the Fund and in the aggregate own 50% of the outstanding shares of the Fund. IDI has an agreement with these entities to sell Fund shares. The Fund, Invesco and/or Invesco affiliates may make payments to these entities, which are considered to be related to the Fund, for providing services to the Fund, Invesco and/or Invesco affiliates including but not limited to services such as securities brokerage, distribution, third party record keeping and account servicing. The Fund has no knowledge as to whether all or any portion of the shares owned of record by these entities are also owned beneficially. |
| (b) | Commencement date of April 4, 2017. |
22 Invesco Income Allocation Fund
NOTE 11—Financial Highlights
The following schedule presents financial highlights for a share of the Fund outstanding throughout the periods indicated.
| Net asset value, beginning of period | Net investment income(a) | Net gains (losses) on securities (both realized and unrealized) | Total from investment operations | Dividends from net investment income | Distributions from net realized gains | Total distributions | Net asset value, end of period | Total return(b) | Net assets, end of period (000’s omitted) | Ratio of expenses to average net assets with fee waivers and/or expenses absorbed(c) | Ratio of expenses to average net assets without fee waivers and/or expenses absorbed | Ratio of net investment income to average net assets | Portfolio turnover(d) | |||||||||||||||||||||||||||||||||||||||||||
Class A | ||||||||||||||||||||||||||||||||||||||||||||||||||||||||
Year ended 12/31/17 | $ | 11.21 | $ | 0.38 | $ | 0.50 | $ | 0.88 | $ | (0.39 | ) | $ | — | $ | (0.39 | ) | $ | 11.70 | 7.99 | % | $ | 391,850 | 0.25 | %(e) | 0.46 | %(e) | 3.32 | %(e) | 8 | % | ||||||||||||||||||||||||||
Year ended 12/31/16 | 10.66 | 0.40 | 0.56 | 0.96 | (0.36 | ) | (0.05 | ) | (0.41 | ) | 11.21 | 9.15 | 372,141 | 0.25 | 0.46 | 3.64 | 38 | |||||||||||||||||||||||||||||||||||||||
Year ended 12/31/15 | 11.18 | 0.37 | (0.48 | ) | (0.11 | ) | (0.40 | ) | (0.01 | ) | (0.41 | ) | 10.66 | (1.08 | ) | 282,690 | 0.25 | 0.48 | 3.37 | 1 | ||||||||||||||||||||||||||||||||||||
Year ended 12/31/14 | 10.69 | 0.38 | 0.51 | 0.89 | (0.40 | ) | — | (0.40 | ) | 11.18 | 8.44 | 199,834 | 0.25 | 0.52 | 3.42 | 4 | ||||||||||||||||||||||||||||||||||||||||
Year ended 12/31/13 | 10.38 | 0.36 | 0.31 | 0.67 | (0.36 | ) | — | (0.36 | ) | 10.69 | 6.53 | 131,485 | 0.25 | 0.56 | 3.39 | 24 | ||||||||||||||||||||||||||||||||||||||||
Class B | ||||||||||||||||||||||||||||||||||||||||||||||||||||||||
Year ended 12/31/17 | 11.23 | 0.30 | 0.50 | 0.80 | (0.31 | ) | — | (0.31 | ) | 11.72 | 7.18 | 863 | 1.00 | (e) | 1.21 | (e) | 2.57 | (e) | 8 | |||||||||||||||||||||||||||||||||||||
Year ended 12/31/16 | 10.68 | 0.32 | 0.56 | 0.88 | (0.28 | ) | (0.05 | ) | (0.33 | ) | 11.23 | 8.32 | 2,037 | 1.00 | 1.21 | 2.89 | 38 | |||||||||||||||||||||||||||||||||||||||
Year ended 12/31/15 | 11.19 | 0.29 | (0.48 | ) | (0.19 | ) | (0.31 | ) | (0.01 | ) | (0.32 | ) | 10.68 | (1.72 | ) | 2,903 | 1.00 | 1.23 | 2.62 | 1 | ||||||||||||||||||||||||||||||||||||
Year ended 12/31/14 | 10.70 | 0.30 | 0.51 | 0.81 | (0.32 | ) | — | (0.32 | ) | 11.19 | 7.63 | 4,357 | 1.00 | 1.27 | 2.67 | 4 | ||||||||||||||||||||||||||||||||||||||||
Year ended 12/31/13 | 10.39 | 0.28 | 0.31 | 0.59 | (0.28 | ) | — | (0.28 | ) | 10.70 | 5.73 | 5,157 | 1.00 | 1.31 | 2.64 | 24 | ||||||||||||||||||||||||||||||||||||||||
Class C | ||||||||||||||||||||||||||||||||||||||||||||||||||||||||
Year ended 12/31/17 | 11.22 | 0.30 | 0.50 | 0.80 | (0.31 | ) | — | (0.31 | ) | 11.71 | 7.18 | 147,051 | 1.00 | (e) | 1.21 | (e) | 2.57 | (e) | 8 | |||||||||||||||||||||||||||||||||||||
Year ended 12/31/16 | 10.67 | 0.32 | 0.56 | 0.88 | (0.28 | ) | (0.05 | ) | (0.33 | ) | 11.22 | 8.33 | 125,281 | 1.00 | 1.21 | 2.89 | 38 | |||||||||||||||||||||||||||||||||||||||
Year ended 12/31/15 | 11.19 | 0.29 | (0.49 | ) | (0.20 | ) | (0.31 | ) | (0.01 | ) | (0.32 | ) | 10.67 | (1.81 | ) | 101,367 | 1.00 | 1.23 | 2.62 | 1 | ||||||||||||||||||||||||||||||||||||
Year ended 12/31/14 | 10.70 | 0.30 | 0.51 | 0.81 | (0.32 | ) | — | (0.32 | ) | 11.19 | 7.63 | 68,771 | 1.00 | 1.27 | 2.67 | 4 | ||||||||||||||||||||||||||||||||||||||||
Year ended 12/31/13 | 10.39 | 0.28 | 0.31 | 0.59 | (0.28 | ) | — | (0.28 | ) | 10.70 | 5.73 | 38,400 | 1.00 | 1.31 | 2.64 | 24 | ||||||||||||||||||||||||||||||||||||||||
Class R | ||||||||||||||||||||||||||||||||||||||||||||||||||||||||
Year ended 12/31/17 | 11.22 | 0.35 | 0.49 | 0.84 | (0.36 | ) | — | (0.36 | ) | 11.70 | 7.63 | 6,949 | 0.50 | (e) | 0.71 | (e) | 3.07 | (e) | 8 | |||||||||||||||||||||||||||||||||||||
Year ended 12/31/16 | 10.67 | 0.37 | 0.56 | 0.93 | (0.33 | ) | (0.05 | ) | (0.38 | ) | 11.22 | 8.87 | 5,016 | 0.50 | 0.71 | 3.39 | 38 | |||||||||||||||||||||||||||||||||||||||
Year ended 12/31/15 | 11.19 | 0.35 | (0.49 | ) | (0.14 | ) | (0.37 | ) | (0.01 | ) | (0.38 | ) | 10.67 | (1.32 | ) | 3,058 | 0.50 | 0.73 | 3.12 | 1 | ||||||||||||||||||||||||||||||||||||
Year ended 12/31/14 | 10.69 | 0.35 | 0.52 | 0.87 | (0.37 | ) | — | (0.37 | ) | 11.19 | 8.26 | 3,073 | 0.50 | 0.77 | 3.17 | 4 | ||||||||||||||||||||||||||||||||||||||||
Year ended 12/31/13 | 10.38 | 0.33 | 0.31 | 0.64 | (0.33 | ) | — | (0.33 | ) | 10.69 | 6.27 | 2,046 | 0.50 | 0.81 | 3.14 | 24 | ||||||||||||||||||||||||||||||||||||||||
Class Y | ||||||||||||||||||||||||||||||||||||||||||||||||||||||||
Year ended 12/31/17 | 11.21 | 0.41 | 0.50 | 0.91 | (0.42 | ) | — | (0.42 | ) | 11.70 | 8.26 | 76,898 | 0.00 | (e) | 0.21 | (e) | 3.57 | (e) | 8 | |||||||||||||||||||||||||||||||||||||
Year ended 12/31/16 | 10.66 | 0.43 | 0.56 | 0.99 | (0.39 | ) | (0.05 | ) | (0.44 | ) | 11.21 | 9.42 | 35,002 | 0.00 | 0.21 | 3.89 | 38 | |||||||||||||||||||||||||||||||||||||||
Year ended 12/31/15 | 11.18 | 0.40 | (0.49 | ) | (0.09 | ) | (0.42 | ) | (0.01 | ) | (0.43 | ) | 10.66 | (0.83 | ) | 14,578 | 0.00 | 0.23 | 3.62 | 1 | ||||||||||||||||||||||||||||||||||||
Year ended 12/31/14 | 10.69 | 0.41 | 0.51 | 0.92 | (0.43 | ) | — | (0.43 | ) | 11.18 | 8.71 | 14,031 | 0.00 | 0.27 | 3.67 | 4 | ||||||||||||||||||||||||||||||||||||||||
Year ended 12/31/13 | 10.38 | 0.38 | 0.31 | 0.69 | (0.38 | ) | — | (0.38 | ) | 10.69 | 6.80 | 2,697 | 0.00 | 0.31 | 3.64 | 24 | ||||||||||||||||||||||||||||||||||||||||
Class R5 | ||||||||||||||||||||||||||||||||||||||||||||||||||||||||
Year ended 12/31/17 | 11.21 | 0.41 | 0.50 | 0.91 | (0.42 | ) | — | (0.42 | ) | 11.70 | 8.26 | 2,105 | 0.00 | (e) | 0.20 | (e) | 3.57 | (e) | 8 | |||||||||||||||||||||||||||||||||||||
Year ended 12/31/16 | 10.66 | 0.43 | 0.56 | 0.99 | (0.39 | ) | (0.05 | ) | (0.44 | ) | 11.21 | 9.42 | 825 | 0.00 | 0.18 | 3.89 | 38 | |||||||||||||||||||||||||||||||||||||||
Year ended 12/31/15 | 11.18 | 0.40 | (0.49 | ) | (0.09 | ) | (0.42 | ) | (0.01 | ) | (0.43 | ) | 10.66 | (0.83 | ) | 850 | 0.00 | 0.20 | 3.62 | 1 | ||||||||||||||||||||||||||||||||||||
Year ended 12/31/14 | 10.69 | 0.41 | 0.51 | 0.92 | (0.43 | ) | — | (0.43 | ) | 11.18 | 8.71 | 882 | 0.00 | 0.23 | 3.67 | 4 | ||||||||||||||||||||||||||||||||||||||||
Year ended 12/31/13 | 10.38 | 0.38 | 0.31 | 0.69 | (0.38 | ) | — | (0.38 | ) | 10.69 | 6.80 | 283 | 0.00 | 0.27 | 3.64 | 24 | ||||||||||||||||||||||||||||||||||||||||
Class R6 | ||||||||||||||||||||||||||||||||||||||||||||||||||||||||
Year ended 12/31/17(f) | 11.42 | 0.31 | 0.28 | 0.59 | (0.31 | ) | — | (0.31 | ) | 11.70 | 5.25 | 10 | 0.00 | (e)(g) | 0.17 | (e)(g) | 3.57 | (e)(g) | 8 | |||||||||||||||||||||||||||||||||||||
| (a) | Calculated using average shares outstanding. |
| (b) | Includes adjustments in accordance with accounting principles generally accepted in the United States of America and as such, the net asset value for financial reporting purposes and the returns based upon those net asset values may differ from the net asset value and returns for shareholder transactions. Does not include sales charges and is not annualized for periods less than one year, if applicable. |
| (c) | In addition to the fees and expenses which the Fund bears directly, the Fund indirectly bears a pro rata share of the fees and expenses of the underlying funds in which the Fund invests. Because the underlying funds have varied expenses and fee levels and the Fund may own different proportions at different times, the amount of fees and expenses incurred indirectly by the Fund will vary. Estimated underlying fund expenses are not expenses that are incurred directly by the Fund. They are expenses that are incurred directly by the underlying funds and are deducted from the value of the funds the Fund invests in. The effect of the estimated underlying fund expenses that the Fund bears indirectly is included in the Fund’s total return. Estimated acquired fund fees from underlying funds were 0.54%, 0.58%, 0.62%, 0.62% and 0.60% for the years ended December 31, 2017, 2016, 2015, 2014 and 2013, respectively. |
| (d) | Portfolio turnover is calculated at the fund level and is not annualized for periods less than one year, if applicable. |
| (e) | Ratios are based on average daily net assets (000’s omitted) of $381,850, $1,378, $136,952, $5,754, $60,714, $1,646 and $10 for Class A, Class B, Class C, Class R, Class Y, Class R5 and Class R6 shares, respectively. |
| (f) | Commencement date of April 4, 2017. |
| (g) | Annualized. |
23 Invesco Income Allocation Fund
Report of Independent Registered Public Accounting Firm
To the Board of Trustees of AIM Growth Series (Invesco Growth Series)
and Shareholders of Invesco Income Allocation Fund
Opinion on the Financial Statements
We have audited the accompanying statement of assets and liabilities, including the schedule of investments, of Invesco Income Allocation Fund (one of the funds constituting AIM Growth Series (Invesco Growth Series), hereafter referred to as the “Fund”) as of December 31, 2017, the related statement of operations for the year ended December 31, 2017, the statement of changes in net assets for each of the two years in the period ended December 31, 2017, including the related notes, and the financial highlights for each of the periods indicated therein (collectively referred to as the “financial statements”). In our opinion, the financial statements present fairly, in all material respects, the financial position of the Fund as of December 31, 2017, the results of its operations for the year then ended, the changes in its net assets for each of the two years in the period ended December 31, 2017 and the financial highlights for each of the periods indicated therein in conformity with accounting principles generally accepted in the United States of America.
Basis for Opinion
These financial statements are the responsibility of the Fund’s management. Our responsibility is to express an opinion on the Fund’s financial statements based on our audits. We are a public accounting firm registered with the Public Company Accounting Oversight Board (United States) (“PCAOB”) and are required to be independent with respect to the Fund in accordance with the U.S. federal securities laws and the applicable rules and regulations of the Securities and Exchange Commission and the PCAOB.
We conducted our audits of these financial statements in accordance with the standards of the PCAOB. Those standards require that we plan and perform the audit to obtain reasonable assurance about whether the financial statements are free of material misstatement, whether due to error or fraud.
Our audits included performing procedures to assess the risks of material misstatement of the financial statements, whether due to error or fraud, and performing procedures that respond to those risks. Such procedures included examining, on a test basis, evidence regarding the amounts and disclosures in the financial statements. Our audits also included evaluating the accounting principles used and significant estimates made by management, as well as evaluating the overall presentation of the financial statements. Our procedures included confirmation of securities owned as of December 31, 2017 by correspondence with the custodian and transfer agent. We believe that our audits provide a reasonable basis for our opinion.
PricewaterhouseCoopers LLP
Houston, TX
February 23, 2018
We have served as the auditor of one or more of the investment companies in the Invesco/PowerShares group of investment companies since at least 1995. We have not determined the specific year we began serving as auditor.
24 Invesco Income Allocation Fund
Calculating your ongoing Fund expenses
Example
As a shareholder of the Fund, you incur two types of costs: (1) transaction costs, which may include sales charges (loads) on purchase payments or contingent deferred sales charges on redemptions, if any; and (2) ongoing costs, including distribution and/or service (12b-1) fees, and other Fund expenses. This example is intended to help you understand your ongoing costs (in dollars) of investing in the Fund and to compare these costs with ongoing costs of investing in other mutual funds. The example is based on an investment of $1,000 invested at the beginning of the period and held for the entire period July 1, 2017, through December 31, 2017.
In addition to the fees and expenses which the Fund bears directly, the Fund indirectly bears a pro rata share of the fees and expenses of the underlying funds in which the Fund invests. The amount of fees and expenses incurred indirectly by the Fund will vary because the underlying funds have varied expenses and fee levels and the Fund may own different proportions of the underlying funds at different times. Estimated underlying fund expenses are not expenses that are incurred directly by the Fund. They are expenses that are incurred directly by the underlying funds and are deducted from the value of the underlying funds the Fund invests in. The effect of the estimated underlying fund expenses that the Fund bears indirectly are included in the Fund’s total return.
Actual expenses
The table below provides information about actual account values and actual expenses. You may use the information in this table, together with the amount you invested, to estimate the expenses that you paid over the period. Simply divide your account value by $1,000 (for example, an $8,600 account value divided by $1,000 = 8.6), then multiply the result by the number in the table under the heading entitled “Actual Expenses Paid During Period” to estimate the expenses you paid on your account during this period.
Hypothetical example for comparison purposes
The table below also provides information about hypothetical account values and hypothetical expenses based on the Fund’s actual expense ratio and an assumed rate of return of 5% per year before expenses, which is not the Fund’s actual return.
The hypothetical account values and expenses may not be used to estimate the actual ending account balance or expenses you paid for the period. You may use this information to compare the ongoing costs of investing in the Fund and other funds. To do so, compare this 5% hypothetical example with the 5% hypothetical examples that appear in the shareholder reports of the other funds.
Please note that the expenses shown in the table are meant to highlight your ongoing costs only and do not reflect any transaction costs, such as sales charges (loads) on purchase payments or contingent deferred sales charges on redemptions, if any. Therefore, the hypothetical information is useful in comparing ongoing costs only, and will not help you determine the relative total costs of owning different funds. In addition, expenses shown in the table do not include the expenses of the underlying funds, which are borne indirectly by the Fund. If transaction costs and indirect expenses were included, your costs would have been higher.
| Class | Beginning Account Value (07/01/17) | ACTUAL | HYPOTHETICAL (5% annual return before | Annualized Expense Ratio | ||||||||||||||||||||
| Ending Account Value (12/31/17)1 | Expenses Paid During Period2 | Ending Account Value (12/31/17) | Expenses Paid During Period2 | |||||||||||||||||||||
| A | $ | 1,000.00 | $ | 1,032.30 | $ | 1.28 | $ | 1,023.95 | $ | 1.28 | 0.25 | % | ||||||||||||
| B | 1,000.00 | 1,028.40 | 5.11 | 1,020.16 | 5.09 | 1.00 | ||||||||||||||||||
| C | 1,000.00 | 1,028.40 | 5.11 | 1,020.16 | 5.09 | 1.00 | ||||||||||||||||||
| R | 1,000.00 | 1,031.00 | 2.56 | 1,022.68 | 2.55 | 0.50 | ||||||||||||||||||
| Y | 1,000.00 | 1,033.60 | 0.00 | 1,025.21 | 0.00 | 0.00 | ||||||||||||||||||
| R5 | 1,000.00 | 1,033.60 | 0.00 | 1,025.21 | 0.00 | 0.00 | ||||||||||||||||||
| R6 | 1,000.00 | 1,033.60 | 0.00 | 1,025.21 | 0.00 | 0.00 | ||||||||||||||||||
| 1 | The actual ending account value is based on the actual total return of the Fund for the period July 1, 2017 through December 31, 2017, after actual expenses and will differ from the hypothetical ending account value which is based on the Fund’s expense ratio and a hypothetical annual return of 5% before expenses. |
| 2 | Expenses are equal to the Fund’s annualized expense ratio as indicated above multiplied by the average account value over the period, multiplied by 184/365 to reflect the most recent fiscal half year. |
25 Invesco Income Allocation Fund
Tax Information
Form 1099-DIV, Form 1042-S and other year-end tax information provide shareholders with actual calendar year amounts that should be included in their tax returns. Shareholders should consult their tax advisors.
The following distribution information is being provided as required by the Internal Revenue Code or to meet a specific state’s requirement.
The Fund designates the following amounts or, if subsequently determined to be different, the maximum amount allowable for its fiscal year ended December 31, 2017:
Federal and State Income Tax | ||||
Qualified Dividend Income* | 20.52 | % | ||
Corporate Dividends Received Deduction* | 16.20 | % | ||
U.S. Treasury Obligations* | 3.38 | % | ||
| * | The above percentages are based on ordinary income dividends paid to shareholders during the Fund’s fiscal year. |
26 Invesco Income Allocation Fund
Trustees and Officers
The address of each trustee and officer is AIM Growth Series (Invesco Growth Series) (the “Trust”), 11 Greenway Plaza, Suite 1000, Houston, Texas 77046-1173. The trustees serve for the life of the Trust, subject to their earlier death, incapacitation, resignation, retirement or removal as more specifically provided in the Trust’s organizational documents. Each officer serves for a one year term or until their successors are elected and qualified. Column two below includes length of time served with predecessor entities, if any.
Name, Year of Birth and Position(s) Held with the Trust | Trustee and/ or Officer Since | Principal Occupation(s) During Past 5 Years | Number of Funds in Fund Complex Overseen by Trustee | Other Directorship(s) Held by Trustee During Past 5 Years | ||||
| Interested Persons | ||||||||
| Martin L. Flanagan1 — 1960 Trustee | 2007 | Executive Director, Chief Executive Officer and President, Invesco Ltd. (ultimate parent of Invesco and a global investment management firm); Trustee, The Invesco Funds; Vice Chair, Investment Company Institute; and Member of Executive Board, SMU Cox School of Business
Formerly: Advisor to the Board, Invesco Advisers, Inc. (formerly known as Invesco Institutional (N.A.), Inc.); Chairman and Chief Executive Officer, Invesco Advisers, Inc. (registered investment adviser); Director, Chairman, Chief Executive Officer and President, Invesco Holding Company (US), Inc. (formerly IVZ Inc.) (holding company), Invesco Group Services, Inc. (service provider) and Invesco North American Holdings, Inc. (holding company); Director, Chief Executive Officer and President, Invesco Holding Company Limited (parent of Invesco and a global investment management firm); Director, Invesco Ltd.; Chairman, Investment Company Institute and President, Co-Chief Executive Officer, Co-President, Chief Operating Officer and Chief Financial Officer, Franklin Resources, Inc. (global investment management organization) | 158 | None | ||||
| Philip A. Taylor2 — 1954 Trustee and Senior Vice President | 2006 | Head of the Americas and Senior Managing Director, Invesco Ltd.; Director, Invesco Advisers, Inc. (formerly known as Invesco Institutional (N.A.), Inc.) (registered investment adviser); Director, Chairman, Chief Executive Officer and President, Invesco Management Group, Inc. (formerly known as Invesco Aim Management Group, Inc.) (financial services holding company); Director and Chairman, Invesco Investment Services, Inc. (formerly known as Invesco Aim Investment Services, Inc.) (registered transfer agent); Chief Executive Officer, Invesco Corporate Class Inc. (corporate mutual fund company); Director, Chairman and Chief Executive Officer, Invesco Canada Ltd. (formerly known as Invesco Trimark Ltd./Invesco Trimark Ltèe) (registered investment adviser and registered transfer agent); Trustee and Senior Vice President, The Invesco Funds; Director, Invesco Investment Advisers LLC (formerly known as Van Kampen Asset Management).
Formerly: Co-Chairman, Co-President and Co-Chief Executive Officer, Invesco Advisers, Inc. (formerly known as Invesco Institutional (N.A.), Inc.) (registered investment adviser); Director, Chief Executive Officer and President, Van Kampen Exchange Corp; President and Principal Executive Officer, The Invesco Funds (other than AIM Treasurer’s Series Trust (Invesco Treasurer’s Series Trust), Short-Term Investments Trust and Invesco Management Trust); Executive Vice President, The Invesco Funds (AIM Treasurer’s Series Trust (Invesco Treasurer’s Series Trust), Short-Term Investments Trust and Invesco Management Trust only); Director and President, INVESCO Funds Group, Inc. (registered investment adviser and registered transfer agent); Director and Chairman, IVZ Distributors, Inc. (formerly known as INVESCO Distributors, Inc.) (registered broker dealer); Director, President and Chairman, Invesco Inc. (holding company), Invesco Canada Holdings Inc. (holding company), Trimark Investments Ltd./Placements Trimark Ltèe and Invesco Financial Services Ltd/Services Financiers Invesco Ltèe; Chief Executive Officer, Invesco Canada Fund Inc. (corporate mutual fund company); Director and Chairman, Van Kampen Investor Services Inc.; Director, Chief Executive Officer and President, 1371 Preferred Inc. (holding company) and Van Kampen Investments Inc.; Director and President, AIM GP Canada Inc. (general partner for limited partnerships) and Van Kampen Advisors, Inc.; Director and Chief Executive Officer, Invesco Trimark Dealer Inc. (registered broker dealer); Director, Invesco Distributors, Inc. (formerly known as Invesco Aim Distributors, Inc.) (registered broker dealer); Manager, Invesco PowerShares Capital Management LLC; Director, Chief Executive Officer and President, Invesco Advisers, Inc.; Director, Chairman, Chief Executive Officer and President, Invesco Aim Capital Management, Inc.; President, Invesco Trimark Dealer Inc. and Invesco Trimark Ltd./Invesco Trimark Ltèe; Director and President, AIM Trimark Corporate Class Inc. and AIM Trimark Canada Fund Inc.; Senior Managing Director, Invesco Holding Company Limited; Director and Chairman, Fund Management Company (former registered broker dealer); President and Principal Executive Officer, The Invesco Funds (AIM Treasurer’s Series Trust (Invesco Treasurer’s Series Trust), and Short-Term Investments Trust only); President, AIM Trimark Global Fund Inc. and AIM Trimark Canada Fund Inc. | 158 | None |
| 1 | Mr. Flanagan is considered an interested person (within the meaning of Section 2(a)(19) of the 1940 Act) of the Trust because he is an officer of the Adviser to the Trust, and an officer and a director of Invesco Ltd., ultimate parent of the Adviser. |
| 2 | Mr. Taylor is considered an interested person (within the meaning of Section 2(a)(19) of the 1940 Act) of the Trust because he is an officer and a director of the Adviser. |
T-1 Invesco Income Allocation Fund
Trustees and Officers—(continued)
Name, Year of Birth and Position(s) Held with the Trust | Trustee and/ or Officer Since | Principal Occupation(s) During Past 5 Years | Number of Funds in Fund Complex Overseen by Trustee | Other Directorship(s) Past 5 Years | ||||
| Independent Trustees | ||||||||
Bruce L. Crockett — 1944 Trustee and Chair | 2001 | Chairman, Crockett Technologies Associates (technology consulting company)
Formerly: Director, Captaris (unified messaging provider); Director, President and Chief Executive Officer, COMSAT Corporation; Chairman, Board of Governors of INTELSAT (international communications company); ACE Limited (insurance company); Independent Directors Council and Investment Company Institute: Member of the Audit Committee, Investment Company Institute; Member of the Executive Committee and Chair of the Governance Committee, Independent Directors Council | 158 | Director and Chairman of the Audit Committee, ALPS (Attorneys Liability Protection Society) (insurance company); Director and Member of the Audit Committee and Compensation Committee, Ferroglobe PLC (metallurgical company) | ||||
David C. Arch — 1945 Trustee | 2010 | Chairman of Blistex Inc. (consumer health care products manufacturer); Member, World Presidents’ Organization | 158 | Board member of the Illinois Manufacturers’ Association | ||||
Jack M. Fields — 1952 Trustee | 2001 | Chief Executive Officer, Twenty First Century Group, Inc. (government affairs company); and Chairman, Discovery Learning Alliance (non-profit)
Formerly: Owner and Chief Executive Officer, Dos Angeles Ranch L.P. (cattle, hunting, corporate entertainment); Director, Insperity, Inc. (formerly known as Administaff) (human resources provider); Chief Executive Officer, Texana Timber LP (sustainable forestry company); Director of Cross Timbers Quail Research Ranch (non-profit); and member of the U.S. House of Representatives | 158 | None | ||||
Cynthia Hostetler — 1962 Trustee | 2017 | Non-Executive Director and Trustee of a number of public and private business corporations
Formerly: Head of Investment Funds and Private Equity, Overseas Private Investment Corporation; President, First Manhattan Bancorporation, Inc.; Attorney, Simpson Thacher & Bartlett LLP | 158 | Vulcan Materials Company (construction materials company); Trilinc Global Impact Fund; Aberdeen Investment Funds (4 portfolios); Artio Global Investment LLC (mutual fund complex); Edgen Group, Inc. (specialized energy and infrastructure products distributor) | ||||
Eli Jones — 1961 Trustee | 2016 | Professor and Dean, Mays Business School — Texas A&M University
Formerly: Professor and Dean, Walton College of Business, University of Arkansas and E.J. Ourso College of Business, Louisiana State University; Director, Arvest Bank | 158 | Insperity, Inc. (formerly known as Administaff) (human resources provider) | ||||
Prema Mathai-Davis — 1950 Trustee | 2001 | Retired. | 158 | None | ||||
Teresa M. Ressel — 1962 Trustee | 2017 | Non-executive director and trustee of a number of public and private business corporations
Formerly: Chief Financial Officer, Olayan America, The Olayan Group (international investor/commercial/industrial); Chief Executive Officer, UBS Securities LLC; Group Chief Operating Officer, Americas, UBS AG; Assistant Secretary for Management & Budget and CFO, US Department of the Treasury | 158 | Atlantic Power Corporation (power generation company); ON Semiconductor Corp. (semiconductor supplier) | ||||
Ann Barnett Stern — 1957 Trustee | 2017 | President and Chief Executive Officer, Houston Endowment Inc. (private philanthropic institution)
Formerly: Executive Vice President and General Counsel, Texas Children’s Hospital; Attorney, Beck, Redden and Secrest, LLP; Business Law Instructor, University of St. Thomas; Attorney, Andrews & Kurth LLP | 158 | Federal Reserve Bank of Dallas | ||||
Raymond Stickel, Jr. — 1944 Trustee | 2005 | Retired.
Formerly: Director, Mainstay VP Series Funds, Inc. (25 portfolios); Partner, Deloitte & Touche | 158 | None | ||||
Robert C. Troccoli — 1949 Trustee | 2016 | Adjunct Professor, University of Denver — Daniels College of Business
Formerly: Senior Partner, KPMG LLP | 158 | None | ||||
Christopher L. Wilson — 1957 Trustee | 2017 | Non-executive director and trustee of a number of public and private business corporations
Formerly: Managing Partner, CT2, LLC (investing and consulting firm); President/Chief Executive Officer, Columbia Funds, Bank of America Corporation; President/Chief Executive Officer, CDC IXIS Asset Management Services, Inc.; Principal & Director of Operations, Scudder Funds, Scudder, Stevens & Clark, Inc.; Assistant Vice President, Fidelity Investments | 158 | TD Asset Management USA Inc. (mutual fund complex) (22 portfolios); ISO New England, Inc. (non-profit organization managing regional electricity market) |
T-2 Invesco Income Allocation Fund
Trustees and Officers—(continued)
Name, Year of Birth and Position(s) Held with the Trust | Trustee and/ or Officer Since | Principal Occupation(s) During Past 5 Years | Number of Funds in Fund Complex Overseen by Trustee | Other Directorship(s) Past 5 Years | ||||
| Other Officers | ||||||||
Sheri Morris — 1964 President, Principal Executive Officer and Treasurer | 1999 | President, Principal Executive Officer and Treasurer, The Invesco Funds; Vice President, Invesco Advisers, Inc. (formerly known as Invesco Institutional (N.A.), Inc.) (registered investment adviser); and Vice President, PowerShares Exchange-Traded Fund Trust, PowerShares Exchange-Traded Fund Trust II, PowerShares India Exchange-Traded Fund Trust, PowerShares Actively Managed Exchange-Traded Fund Trust, PowerShares Actively Managed Exchange-Traded Commodity Fund Trust and PowerShares Exchange-Traded Self-Indexed Fund Trust
Formerly: Vice President and Principal Financial Officer, The Invesco Funds; Vice President, Invesco Aim Advisers, Inc., Invesco Aim Capital Management, Inc. and Invesco Aim Private Asset Management, Inc.; Assistant Vice President and Assistant Treasurer, The Invesco Funds and Assistant Vice President, Invesco Advisers, Inc., Invesco Aim Capital Management, Inc. and Invesco Aim Private Asset Management, Inc.; and Treasurer, PowerShares Exchange-Traded Fund Trust, PowerShares Exchange-Traded Fund Trust II, PowerShares India Exchange-Traded Fund Trust and PowerShares Actively Managed Exchange-Traded Fund Trust | N/A | N/A | ||||
Russell C. Burk — 1958 Senior Vice President and Senior Officer | 2005 | Senior Vice President and Senior Officer, The Invesco Funds | N/A | N/A | ||||
John M. Zerr — 1962 Senior Vice President, Chief Legal Officer and Secretary | 2006 | Director, Senior Vice President, Secretary and General Counsel, Invesco Management Group, Inc. (formerly known as Invesco AIM Management Group, Inc.); Senior Vice President, Invesco Advisers, Inc. (formerly known as Invesco Institutional (N.A.), Inc.) (registered investment adviser); Senior Vice President and Secretary, Invesco Distributors, Inc. (formerly known as Invesco AIM Distributors, Inc.); Director, Vice President and Secretary, Invesco Investment Services, Inc. (formerly known as Invesco AIM Investment Services, Inc.) Senior Vice President, Chief Legal Officer and Secretary, The Invesco Funds; Managing Director, Invesco PowerShares Capital Management LLC; Director, Secretary and General Counsel, Invesco Investment Advisers LLC (formerly known as Van Kampen Asset Management); Secretary and General Counsel, Invesco Capital Markets, Inc. (formerly known as Van Kampen Funds Inc.) and Chief Legal Officer, PowerShares Exchange-Traded Fund Trust, PowerShares Exchange-Traded Fund Trust II, PowerShares India Exchange-Traded Fund Trust, PowerShares Actively Managed Exchange-Traded Fund Trust, PowerShares Actively Managed Exchange-Traded Commodity Fund Trust and PowerShares Exchange-Traded Self-Indexed Fund Trust; Manager and Secretary, Invesco Indexing LLC
Formerly: Director, Secretary, General Counsel and Senior Vice President, Van Kampen Exchange Corp.; Director, Vice President and Secretary, IVZ Distributors, Inc. (formerly known as INVESCO Distributors, Inc.); Director and Vice President, INVESCO Funds Group, Inc.; Director and Vice President, Van Kampen Advisors Inc.; Director, Vice President, Secretary and General Counsel, Van Kampen Investor Services Inc.; Director, Invesco Distributors, Inc. (formerly known as Invesco AIM Distributors, Inc.); Director, Senior Vice President, General Counsel and Secretary, Invesco AIM Advisers, Inc. and Van Kampen Investments Inc.; Director, Vice President and Secretary, Fund Management Company; Director, Senior Vice President, Secretary, General Counsel and Vice President, Invesco AIM Capital Management, Inc.; Chief Operating Officer and General Counsel, Liberty Ridge Capital, Inc. (an investment adviser); Vice President and Secretary, PBHG Funds (an investment company) and PBHG Insurance Series Fund (an investment company); Chief Operating Officer, General Counsel and Secretary, Old Mutual Investment Partners (a broker-dealer); General Counsel and Secretary, Old Mutual Fund Services (an administrator) and Old Mutual Shareholder Services (a shareholder servicing center); Executive Vice President, General Counsel and Secretary, Old Mutual Capital, Inc. (an investment adviser); and Vice President and Secretary, Old Mutual Advisors Funds (an investment company) | N/A | N/A | ||||
Gregory G. McGreevey — 1962 Senior Vice President | 2012 | Senior Managing Director, Invesco Ltd.; Director, Chairman, President, and Chief Executive Officer, Invesco Advisers, Inc. (formerly known as Invesco Institutional (N.A.), Inc.) (registered investment adviser); Senior Vice President, Invesco Management Group, Inc.; Director, Invesco Mortgage Capital, Inc. and Invesco Senior Secured Management, Inc.; and Senior Vice President, The Invesco Funds
Formerly: Assistant Vice President, The Invesco Funds | N/A | N/A | ||||
Kelli Gallegos — 1970 Vice President, Principal Financial Officer and Assistant Treasurer | 2008 | Vice President, Principal Financial Officer and Assistant Treasurer, The Invesco Funds; Assistant Treasurer, Invesco PowerShares Capital Management LLC, PowerShares Exchange-Traded Fund Trust, PowerShares Exchange-Traded Fund Trust II, PowerShares India Exchange-Traded Fund Trust, PowerShares Actively Managed Exchange-Traded Fund Trust, PowerShares Actively Managed Exchange-Traded Commodity Fund Trust and PowerShares Exchange-Traded Self-Indexed Fund Trust
Formerly: Assistant Vice President, The Invesco Funds | N/A | N/A |
T-3 Invesco Income Allocation Fund
Trustees and Officers—(continued)
Name, Year of Birth and Position(s) Held with the Trust | Trustee and/ or Officer Since | Principal Occupation(s) During Past 5 Years | Number of Funds in Fund Complex Overseen by Trustee | Other Directorship(s) Past 5 Years | ||||
| Other Officers—(continued) | ||||||||
Tracy Sullivan — 1962 Vice President, Chief Tax Officer and Assistant Treasurer | 2008 | Vice President, Chief Tax Officer and Assistant Treasurer, The Invesco Funds; Assistant Treasurer, Invesco PowerShares Capital Management LLC, PowerShares Exchange-Traded Fund Trust, PowerShares Exchange-Traded Fund Trust II, PowerShares India Exchange-Traded Fund Trust, PowerShares Actively Managed Exchange-Traded Fund Trust,PowerShares Actively Managed Exchange-Traded Commodity Fund Trust and PowerShares Exchange-Traded Self-Indexed Fund Trust
Formerly: Assistant Vice President, The Invesco Funds | N/A | N/A | ||||
Crissie M. Wisdom — 1969 Anti-Money Laundering Compliance Officer | 2013 | Anti-Money Laundering Compliance Officer, Invesco Advisers, Inc. (formerly known as Invesco Institutional (N.A.), Inc.) (registered investment adviser), Invesco Capital Markets, Inc. (formerly known as Van Kampen Funds Inc.), Invesco Distributors, Inc., Invesco Investment Services, Inc., Invesco Management Group, Inc., The Invesco Funds, and PowerShares Exchange-Traded Fund Trust, PowerShares Exchange-Traded Fund Trust II, PowerShares India Exchange-Traded Fund Trust, PowerShares Actively Managed Exchange-Traded Fund Trust,PowerShares Actively Managed Exchange-Traded Commodity Fund Trust and PowerShares Exchange-Traded Self-Indexed Fund Trust; Anti-Money Laundering Compliance Officer and Bank Secrecy Act Officer, INVESCO National Trust Company and Invesco Trust Company; and Fraud Prevention Manager and Controls and Risk Analysis Manager for Invesco Investment Services, Inc.
Formerly: Anti-Money Laundering Compliance Officer, Van Kampen Exchange Corp. | N/A | N/A | ||||
Robert R. Leveille — 1969 Chief Compliance Officer | 2016 | Chief Compliance Officer, Invesco Advisers, Inc. (registered investment adviser); and Chief Compliance Officer, The Invesco Funds
Formerly: Chief Compliance Officer, Putnam Investments and the Putnam Funds | N/A | N/A |
The Statement of Additional Information of the Trust includes additional information about the Fund’s Trustees and is available upon request, without charge, by calling 1.800.959.4246. Please refer to the Fund’s Statement of Additional Information for information on the Fund’s sub-advisers.
Office of the Fund 11 Greenway Plaza, Suite 1000 Houston, TX 77046-1173 | Investment Adviser Invesco Advisers, Inc. 1555 Peachtree Street, N.E. Atlanta, GA 30309 | Distributor Invesco Distributors, Inc. 11 Greenway Plaza, Suite 1000 Houston, TX 77046-1173 | Auditors PricewaterhouseCoopers LLP 1000 Louisiana Street, Suite 5800 Houston, TX 77002-5678 | |||
Counsel to the Fund Stradley Ronon Stevens & Young, LLP 2005 Market Street, Suite 2600 Philadelphia, PA 19103-7018 | Counsel to the Independent Trustees Goodwin Procter LLP 901 New York Avenue, N.W. Washington, D.C. 20001 | Transfer Agent Invesco Investment Services, Inc. 11 Greenway Plaza, Suite 1000 Houston, TX 77046-1173 | Custodian State Street Bank and Trust Company 225 Franklin Street Boston, MA 02110-2801 | |||
T-4 Invesco Income Allocation Fund
Explore High-Conviction Investing with Invesco

Go paperless with eDelivery
Visit invesco.com/edelivery to enjoy the convenience and security of anytime electronic access to your investment documents.
With eDelivery, you can elect to have any or all of the following materials delivered straight to your inbox to download, save and print from your own computer:
| ∎ | Fund reports and prospectuses |
| ∎ | Quarterly statements |
| ∎ | Daily confirmations |
| ∎ | Tax forms |
Invesco mailing information
Send general correspondence to Invesco Investment Services, Inc., P.O. Box 219078, Kansas City, MO 64121-9078.
Important notice regarding delivery of security holder documents
To reduce Fund expenses, only one copy of most shareholder documents may be mailed to shareholders with multiple accounts at the same address (Householding). Mailing of your shareholder documents may be householded indefinitely unless you instruct us otherwise. If you do not want the mailing of these documents to be combined with those for other members of your household, please contact Invesco Investment Services, Inc. at 800 959 4246 or contact your financial institution. We will begin sending you individual copies for each account within 30 days after receiving your request.
Fund holdings and proxy voting information
The Fund provides a complete list of its holdings four times in each fiscal year, at the quarter ends. For the second and fourth quarters, the lists appear in the Fund’s semiannual and annual reports to shareholders. For the first and third quarters, the Fund files the lists with the Securities and Exchange Commission (SEC) on Form N-Q. The most recent list of portfolio holdings is available at invesco.com/completeqtrholdings. Shareholders can also look up the Fund’s Forms N-Q on the SEC website at sec.gov. Copies of the Fund’s Forms N-Q may be reviewed and copied at the SEC Public Reference Room in Washington, D.C. You can obtain information on the operation of the Public Reference Room, including information about duplicating fee charges, by calling 202 551 8090 or 800 732 0330, or by electronic request at the following email address: publicinfo@sec.gov. The SEC file numbers for the Fund are shown below.
A description of the policies and procedures that the Fund uses to determine how to vote proxies relating to portfolio securities is available without charge, upon request, from our Client Services department at 800 959 4246 or at invesco.com/proxyguidelines. The information is also available on the SEC website, sec.gov.
Information regarding how the Fund voted proxies related to its portfolio securities during the most recent 12-month period ended June 30 is available at invesco.com/proxysearch. The information is also available on the SEC website, sec.gov. Invesco Advisers, Inc. is an investment adviser; it provides investment advisory services to individual and institutional clients and does not sell securities. Invesco Distributors, Inc. is the US distributor for Invesco Ltd.’s retail mutual funds, exchange-traded funds and institutional money market funds. Both are wholly owned, indirect subsidiaries of Invesco Ltd. |  |
| SEC file numbers: 811-02699 and 002-57526 Invesco Distributors, Inc. | INCAL-AR-1 02162018 1233 |
| ||||
 | Annual Report to Shareholders
| December 31, 2017
| ||
| ||||
Invesco International Allocation Fund
Nasdaq: A: AINAX ∎ B: INABX ∎ C: INACX ∎ R: RINAX ∎ Y: AINYX ∎ R5: INAIX ∎ R6: INASX | ||||

Letters to Shareholders
Philip Taylor | Dear Shareholders: This annual report includes information about your Fund, including performance data and a complete list of its investments as of the close of the reporting period. Inside is a discussion of how your Fund was managed and the factors that affected its performance during the reporting period. Major stock market indexes rose – and set record highs – throughout the reporting period. Generally positive economic data, strong corporate earnings and anticipated tax and regulatory reform contributed to the rally. The US economy expanded during the reporting period, with gross domestic product, the value of all goods and services produced, significantly increasing its growth rate from the first to the third quarter of the year. Tax reform legislation, enacted in December 2017, was a positive for the stock market, but its long-term economic impact was uncertain. Citing positive economic trends – specifically, realized and expected labor market conditions and inflation – the US Federal |

Reserve raised interest rates in March, June and December 2017. While US and global bond markets, as well as emerging market equities, sold off early in the reporting period, they recovered much of their losses during the reporting period. Overseas, economic data were mixed, prompting the European Central Bank and central banks in China and Japan, among other countries, to maintain extraordinarily accommodative monetary policies.
Short-term market volatility can prompt some investors to abandon their investment plans – and can cause others to settle for whatever returns the market has to offer. The investment professionals at Invesco, in contrast, invest with high conviction. This means that, no matter the asset class or the strategy, each investment team has a passion to exceed. We want to help investors achieve better outcomes, such as seeking higher returns, helping mitigate risk and generating income. Of course, investing with high conviction can’t guarantee a profit or ensure success; no investment strategy can. To learn more about how we invest with high conviction, visit invesco.com/HighConviction.
You, too, can invest with high conviction by maintaining a long-term investment perspective and by working with your financial adviser on a regular basis. During periods of short-term market volatility or uncertainty, your financial adviser can keep you focused on your long-term investment goals – a new home, a child’s college education or a secure retirement. He or she also can share research about the economy, the markets and individual investment options.
Visit our website for more information on your investments
Our website, invesco.com/us, offers a wide range of market insights and investment perspectives. On the website, you’ll find detailed information about our funds, including performance, holdings and portfolio manager commentaries. You can access information about your account by completing a simple, secure online registration. To do so, select “Log In” on the right side of the homepage, and then select “Register for Individual Account Access.”
In addition to the resources accessible on our website and through our mobile app, you can obtain timely updates to help you stay informed about the markets and the economy by connecting with Invesco on Twitter, LinkedIn or Facebook. You can access our blog at blog.invesco.us.com. Our goal is to provide you the information you want, when and where you want it.
Finally, I’m pleased to share with you Invesco’s commitment to both the Principles for Responsible Investment and to considering environmental, social and governance issues in our robust investment process. I invite you to learn more at invesco.com/esg.
Have questions?
For questions about your account, contact an Invesco client services representative at 800 959 4246. For Invesco-related questions or comments, please email me directly at phil@invesco.com.
All of us at Invesco look forward to serving your investment management needs. Thank you for investing with us.
Sincerely,

Philip Taylor
Senior Managing Director, Invesco Ltd.
| 2 | Invesco International Allocation Fund |
Bruce Crockett | Dear Fellow Shareholders: Among the many important lessons I’ve learned in more than 40 years in a variety of business endeavors is the value of a trusted advocate. As independent chair of the Invesco Funds Board, I can assure you that the members of the Board are strong advocates for the interests of investors in Invesco’s mutual funds. We work hard to represent your interests through oversight of the quality of the investment management services your funds receive and other matters important to your investment, including but not limited to: ∎ Ensuring that Invesco offers a diverse lineup of mutual funds that your financial adviser can use to strive to meet your financial needs as your investment goals change over time. ∎ Monitoring how the portfolio management teams of the Invesco funds are performing in light of changing economic and market conditions. |

| ∎ | Assessing each portfolio management team’s investment performance within the context of the investment strategy described in the fund’s prospectus. |
| ∎ | Monitoring for potential conflicts of interests that may impact the nature of the services that your funds receive. |
We believe one of the most important services we provide our fund shareholders is the annual review of the funds’ advisory and sub-advisory contracts with Invesco Advisers and its affiliates. This review is required by the Investment Company Act of 1940 and focuses on the nature and quality of the services Invesco provides as the adviser to the Invesco funds and the reasonableness of the fees that it charges for those services. Each year, we spend months carefully reviewing information received from Invesco and a variety of independent sources, such as performance and fee data prepared by Lipper, Inc. (a subsidiary of Broadridge Financial Solutions, Inc.), an independent, third-party firm widely recognized as a leader in its field. We also meet with our independent legal counsel and other independent advisers to review and help us assess the information that we have received. Our goal is to assure that you receive quality investment management services for a reasonable fee.
I trust the measures outlined above provide assurance that you have a worthy advocate when it comes to choosing the Invesco Funds.
As always, please contact me at bruce@brucecrockett.com with any questions or concerns you may have. On behalf of the Board, we look forward to continuing to represent your interests and serving your needs.
Sincerely,

Bruce L. Crockett
Independent Chair
Invesco Funds Board of Trustees
| 3 | Invesco International Allocation Fund |
Management’s Discussion of Fund Performance
Performance summary For the year ended December 31, 2017, Class A shares of Invesco International Allocation Fund (the Fund), at net asset value (NAV), underperformed the Fund’s broad market/style-specific index, the MSCI All Country World ex-U.S. Index. Your Fund’s long-term performance appears later in this report.
|
| |||
Fund vs. Indexes Total returns, 12/31/16 to 12/31/17, at net asset value (NAV). Performance shown does not include applicable contingent deferred sales charges (CDSC) or front-end sales charges, which would have reduced performance.
|
| |||
Class A Shares | 24.94 | % | ||
Class B Shares | 23.98 | |||
Class C Shares | 23.98 | |||
Class R Shares | 24.61 | |||
Class Y Shares | 25.25 | |||
Class R5 Shares | 25.38 | |||
Class R6 Shares* | 25.48 | |||
MSCI All Country World ex-U.S. Indexq (Broad Market/Style-Specific Index) | 27.19 | |||
Lipper International Multi-Cap Core Funds Index∎ (Peer Group Index) | 24.95 | |||
Source(s): qFactSet Research Systems Inc.; ∎Lipper Inc. * Class R6 shares incepted on April 4, 2017. See page 7 for more information.
| ||||
Market conditions and your Fund
Global equity markets delivered positive, and in many cases double-digit, returns over the year ended December 31, 2017. These gains were broadly driven by firming global economic growth, as well as stronger corporate fundamentals. After trailing international markets for the first three quarters of the year, the US equity market outperformed international markets in the fourth quarter. US equity markets received a boost from the prospect of sweeping individual and corporate tax cuts, with a final tax bill approved by Congress in December 2017.
In developed markets, the US Federal Reserve (the Fed) met in December and increased the benchmark fed funds target rate by 0.25% to a target range of 1.25% to 1.50%.1 Combined with two other interest rate increases earlier in 2017, the Fed’s decision reflects a more constructive outlook for the US economy. In contrast, the European Central Bank held rates steady at 0% throughout 2017 and maintained its generous bond buying program through at least September 2018, or beyond, until it sees a sustained adjustment in the path of inflation.
Most emerging markets continued to perform well during 2017. In addition to the improving global economic outlook, other positive tailwinds included reduced expectations for a major shift in US trade policy as well as stronger oil prices. Oil moved higher on production restraint by OPEC and Russia, benefiting commodity-driven emerging markets.
At the close of 2017, equity market valuations in developed and emerging markets appeared relatively full in absolute terms, but non-US equity markets were trading at a material discount to the US. In sum, while valuations were not cheap, recent earnings growth and upward earnings revisions improved in many non-US developed markets. Interestingly, while 2017 marked the eighth year of the global bull market, we saw a shift in leadership as international stocks outperformed US stocks for the year. Prior to 2017, international stocks had trailed US stocks for four consecutive years and in six of the last seven years.
In terms of global asset class and investment style performance during the reporting period, all international indexes posted gains, with emerging markets
| Portfolio Composition** | ||||
Asset Class*
| % of Total Investments
| |||
Developed Markets | 85.0 % | |||
Emerging Markets | 15.0 | |||
| * | Excluding money market funds |
| ** | Based on Schedule of Investments, which classifies each underlying fund and other investments into broad asset classes based on their predominant investments. |
Total Net Assets | $ | 159.4 million |
The Fund’s holdings are subject to change, and there is no assurance that the Fund will continue to hold any particular security.
Data presented here are as of December 31, 2017.
leading and value stocks in developed markets trailing, but still posting a double-digit return. Macroeconomic conditions also helped explain the strength of the growth and momentum investment factors. A limited risk environment allowed momentum to thrive, while low volatility and quality investment factors trailed.
Reflecting these trends, allocations to emerging markets through underlying funds contributed to Fund returns relative to the Fund’s style-specific benchmark. All underlying funds posted positive returns for the reporting period, which added to absolute Fund performance. The largest individual contributors to absolute performance included Invesco International Growth Fund, PowerShares FTSE RAFI Developed Markets ex-US Portfolio and Invesco International Core Equity Fund.
Although there were no detractors from the Fund’s absolute returns, the Fund’s allocation to developed markets detracted from the Fund’s results versus the style-specific benchmark. Funds with a quality or low volatility factor focus trailed the style-specific benchmark, detracting from relative Fund returns. The largest individual detractors relative to the style-specific benchmark included Invesco International Growth Fund, PowerShares S&P International Developed Low Volatility Portfolio and PowerShares International Dividend Achievers Portfolio.
As part of the Fund’s strategic annual rebalance, PowerShares International Dividend Achievers Portfolio and Invesco Emerging Markets Equity Fund were removed as Fund holdings, and the weight of Invesco International Core Equity Fund was reduced. Proceeds were used to establish a position in Invesco Low Volatility Emerging Markets Fund and increase the weight in Invesco International Companies Fund.
We welcome new investors who joined the Fund during the year, and we thank you for your continued commitment to Invesco International Allocation Fund.
1 Source: US Federal Reserve
| 4 | Invesco International Allocation Fund |
The views and opinions expressed in management’s discussion of Fund performance are those of Invesco Advisers, Inc. These views and opinions are subject to change at any time based on factors such as market and economic conditions. These views and opinions may not be relied upon as investment advice or recommendations, or as an offer for a particular security. The information is not a complete analysis of every aspect of any market, country, industry, security or the Fund. Statements of fact are from sources considered reliable, but Invesco Advisers, Inc. makes no representation or warranty as to their completeness or accuracy. Although historical performance is no guarantee of future results, these insights may help you understand our investment management philosophy.
See important Fund and, if applicable, index disclosures later in this report.
| Jacob Borbidge Chartered Financial Analyst, Portfolio Manager and Head of Research for Invesco’s Global | |
Solutions Development and Implementation Team, is manager of Invesco International Allocation Fund. He joined Invesco in 2004. Mr. Borbidge earned a BS in mechanical engineering from Lehigh University and an MS in finance from the University of Houston.
| ||
| Duy Nguyen Chartered Financial Analyst, Portfolio Manager and Chief Investment Officer of Invesco’s Global Solutions | |
| Development and Implementation Team, is manager of Invesco International Allocation Fund. He joined Invesco in 2000. Mr. Nguyen earned a BBA from The University of Texas at Austin and an MS from the University of Houston. | ||


Assisted by Invesco’s Global Solutions Development & Implementation Team
| 5 | Invesco International Allocation Fund |
Your Fund’s Long-Term Performance
Results of a $10,000 Investment – Oldest Share Class(es)
Fund and index data from 12/31/07
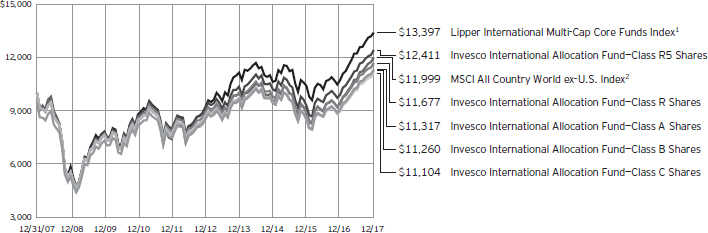
1 Source: Lipper Inc.
2 Source: FactSet Research Systems Inc.
Past performance cannot guarantee comparable future results.
The data shown in the chart include reinvested distributions, applicable sales charges and Fund expenses including management fees. Results for Class B shares are calculated as if a hypothetical
shareholder had liquidated his entire investment in the Fund at the close of the reporting period and paid the contingent deferred sales charges, if applicable. Index results include reinvested dividends, but they do not reflect sales charges. Performance of the peer group,
if applicable, reflects fund expenses and management fees; performance of a market index does not. Performance shown in the chart and table(s) does not reflect deduction of taxes a shareholder would pay on Fund distributions or sale of Fund shares.
| 6 | Invesco International Allocation Fund |
Average Annual Total Returns |
| |||
| As of 12/31/17, including maximum applicable sales charges | ||||
Class A Shares | ||||
Inception (10/31/05) | 4.46% | |||
10 Years | 1.24 | |||
5 Years | 4.69 | |||
1 Year | 18.07 | |||
Class B Shares | ||||
Inception (10/31/05) | 4.43% | |||
10 Years | 1.19 | |||
5 Years | 4.75 | |||
1 Year | 18.98 | |||
Class C Shares | ||||
Inception (10/31/05) | 4.17% | |||
10 Years | 1.05 | |||
5 Years | 5.08 | |||
1 Year | 22.98 | |||
Class R Shares | ||||
Inception (10/31/05) | 4.70% | |||
10 Years | 1.56 | |||
5 Years | 5.63 | |||
1 Year | 24.61 | |||
Class Y Shares | ||||
10 Years | 2.06% | |||
5 Years | 6.15 | |||
1 Year | 25.25 | |||
Class R5 Shares | ||||
Inception (10/31/05) | 5.31% | |||
10 Years | 2.18 | |||
5 Years | 6.35 | |||
1 Year | 25.38 | |||
Class R6 Shares | ||||
10 Years | 1.86% | |||
5 Years | 5.98 | |||
1 Year | 25.48 | |||
Class Y shares incepted on October 3, 2008. Performance shown prior to that date is that of Class A shares and includes the 12b-1 fees applicable to Class A shares.
Class R6 shares incepted on April 4, 2017. Performance shown prior to that date is that of Class A shares and includes the 12b-1 fees applicable to Class A shares.
The performance data quoted represent past performance and cannot guarantee comparable future results; current performance may be lower or higher. Please visit invesco.com/performance for the most recent month-end performance. Performance figures reflect reinvested distributions, changes in net asset value and the effect of the maximum sales charge unless otherwise
stated. Investment return and principal value will fluctuate so that you may have a gain or loss when you sell shares.
The total annual Fund operating expense ratio set forth in the most recent Fund prospectus as of the date of this report for Class A, Class B, Class C, Class R, Class Y, Class R5 and Class R6 shares was 1.47%, 2.22%, 2.22%, 1.72%, 1.22%, 1.03% and 0.98%, respectively.1 The expense ratios presented above may vary from the expense ratios presented in other sections of this report that are based on expenses incurred during the period covered by this report.
Class A share performance reflects the maximum 5.50% sales charge, and Class B and Class C share performance reflects the applicable contingent deferred sales charge (CDSC) for the period involved. The CDSC on Class B shares declines from 5% beginning at the time of purchase to 0% at the beginning of the seventh year. The CDSC on Class C shares is 1% for the first year after purchase. Class R, Class Y, Class R5 and Class R6 shares do not have a front-end sales charge or a CDSC; therefore, performance is at net asset value.
The performance of the Fund’s share classes will differ primarily due to different sales charge structures and class expenses.
Fund performance reflects any applicable fee waivers and/or expense reimbursements. Had the adviser not waived fees and/or reimbursed expenses currently or in the past, returns would have been lower. See current prospectus for more information.
| 1 | The expense ratio includes acquired fund fees and expenses of the underlying funds in which the Fund invests of 0.73% for Invesco International Allocation Fund. |
| 7 | Invesco International Allocation Fund |
Invesco International Allocation Fund’s investment objective is long-term growth of capital.
| ∎ | Unless otherwise stated, information presented in this report is as of December 31, 2017, and is based on total net assets. |
| ∎ | Unless otherwise noted, all data provided by Invesco. |
| ∎ | To access your Fund’s reports/prospectus, visit invesco.com/fundreports. |
About share classes
| ∎ | Effective January 26, 2018, after the close of the reporting period, all outstanding Class B shares were converted to Class A shares, in advance of their normally scheduled conversion. No CDSC was paid in connection with this early conversion. |
| ∎ | Class R shares are generally available only to employer sponsored retirement and benefit plans. Please see the prospectus for more information. |
| ∎ | Class Y shares are available only to certain investors. Please see the prospectus for more information. |
| ∎ | Class R5 shares and Class R6 shares are available for use by retirement plans that meet certain standards and for institutional investors. Class R6 shares are also available through intermediaries that have established an agreement with Invesco Distributors, Inc. to make such shares available for use in retail omnibus accounts. Please see the prospectus for more information. |
Principal risks of investing in the Fund
| ∎ | Allocation risk. The Fund’s investment performance depends, in part, on how its assets are allocated among the underlying funds or asset classes. The Adviser’s evaluations and assumptions regarding the asset classes or the underlying funds in which the Fund invests may be incorrect, causing the Fund to be invested (or not invested) in one or more asset classes or underlying funds at an inopportune time, which could negatively affect the Fund’s performance. |
| ∎ | Depositary receipts risk. Investing in depositary receipts involve the same risks as direct investments in foreign securities. In addition, the underlying issuers of certain depositary receipts are under no obligation to distribute shareholder communications or pass through any voting rights with respect to the deposited securities to the holders of such receipts. An underlying |
| fund may therefore receive less timely information or have less control than if it invested directly in the foreign issuer. |
| ∎ | Derivatives risk. The value of a derivative instrument depends largely on (and is derived from) the value of an underlying security, currency, commodity, interest rate, index or other asset (each referred to as an underlying asset). In addition to risks relating to the underlying assets, the use of derivatives may include other, possibly greater, risks, including counterparty, leverage and liquidity risks. Counter-party risk is the risk that the counter-party to the derivative contract will default on its obligation to pay an underlying fund the amount owed or otherwise perform under the derivative contract. Derivatives create leverage risk because they do not require payment up front equal to the economic exposure created by owning the derivative. As a result, an adverse change in the value of the underlying asset could result in an underlying fund sustaining a loss that is substantially greater than the amount invested in the derivative, which may make an underlying fund’s returns more volatile and increase the risk of loss. Derivative instruments may also be less liquid than more traditional investments and an underlying fund may be unable to sell or close out its derivative positions at a desirable time or price. This risk may be more acute under adverse market conditions, during which an underlying fund may be most in need of liquidating its derivative positions. Derivatives may also be harder to value, less tax efficient and subject to changing government regulation that could impact an underlying fund’s ability to use certain derivatives or their cost. Also, derivatives used for hedging or to gain or limit exposure to a particular market segment may not provide the expected benefits, particularly during adverse market conditions. |
| ∎ | Emerging markets securities risk. Emerging markets (also referred to as developing markets) are generally subject |
to greater market volatility, political, social and economic instability, uncertain trading markets and more governmental limitations on foreign investment than more developed markets. In addition, companies operating in emerging markets may be subject to lower trading volume and greater price fluctuations than companies in more developed markets. Securities law and the enforcement of systems of taxation in many emerging market countries may change quickly and unpredictably. In addition, investments in emerging markets securities may also be subject to additional transaction costs, delays in settlement procedures, and lack of timely information. |
| ∎ | Exchange-traded fund industry concentration risk. In following its methodology, an underlying exchange-traded fund’s underlying index from time to time may be concentrated to a significant degree in securities of issuers located in a single industry or sector. To the extent that an underlying fund’s underlying index concentrates in the securities of issuers in a particular industry or sector, an underlying fund will also concentrate its investments to approximately the same extent. By concentrating its investments in an industry or sector, an underlying fund faces more risks than if it were diversified broadly over numerous industries or sectors. Such industry-based risks, any of which may adversely affect the companies in which an underlying fund invests, may include, but are not limited to, the following: general economic conditions or cyclical market patterns that could negatively affect supply and demand in a particular industry; competition for resources, adverse labor relations, political or world events; obsolescence of technologies; and increased competition or new product introductions that may affect the profitability or viability of companies in an industry. In addition, at times, such industry or sector may be out of favor and underperform other industries or the market as a whole. |
| ∎ | Exchange-traded funds risk. In addition to the risks associated with the underlying assets held by the exchange-traded fund, investments in exchange-traded funds are subject to the following additional risks: (1) an exchange-traded |
This report must be accompanied or preceded by a currently effective Fund prospectus, which contains more complete information, including sales charges and expenses. Investors should read it carefully before investing.
|
| NOT FDIC INSURED | MAY LOSE VALUE | NO BANK GUARANTEE |
| 8 | Invesco International Allocation Fund |
fund’s shares may trade above or below its net asset value; (2) an active trading market for the exchange-traded fund’s shares may not develop or be maintained; (3) trading an exchange-traded fund’s shares may be halted by the listing exchange; (4) a passively-managed exchange-traded fund may not track the performance of the reference asset; and (5) a passively managed exchange-traded fund may hold troubled securities. Investment in exchange-traded funds may involve duplication of management fees and certain other expenses, as the Fund or an underlying fund indirectly bears its proportionate share of any expenses paid by the exchange-traded funds in which it invests. Further, certain exchange-traded funds in which the Fund or an underlying fund may invest are leveraged, which may result in economic leverage, permitting the Fund or an underlying fund to gain exposure that is greater than would be the case in an unlevered instrument, and potentially resulting in greater volatility. |
| ∎ | Financial services sector risk. An underlying fund may be susceptible to adverse economic or regulatory occurrences affecting the financial services sector. Financial services companies are subject to extensive government regulation and are disproportionately affected by unstable interest rates, each of which could adversely affect the profitability of such companies. Financial services companies may also have concentrated portfolios, which make them especially vulnerable to unstable economic conditions. |
| ∎ | Foreign securities risk. An underlying fund’s foreign investments may be adversely affected by political and social instability, changes in economic or taxation policies, difficulty in enforcing obligations, decreased liquidity or increased volatility. Foreign investments also involve the risk of the possible seizure, nationalization or expropriation of the issuer or foreign deposits (in which an underlying fund could lose its entire investments in a certain market) and the possible adoption of foreign governmental restrictions such as exchange controls. Unless an underlying fund has hedged its foreign securities risk, foreign securities risk also involves the risk of negative foreign currency rate fluctuations, which may cause the value of securities denominated in such foreign currency (or other instruments through which an underlying fund has exposure to foreign currencies) to |
decline in value. Currency exchange rates may fluctuate significantly over short periods of time. Currency hedging strategies, if used, are not always successful. |
| ∎ | Fund of funds risk. The Fund’s performance depends on that of the underlying funds in which it invests. Accordingly, the risks associated with an investment in the Fund include the risks associated with investments in the underlying funds. The Fund will indirectly pay a proportional share of the fees and expenses of the underlying funds in which it invests. There are risks that the Fund will vary from its target weightings (if any) in the underlying funds, that the underlying funds will not achieve their investment objectives, that the underlying funds’ performance may be lower than their represented asset classes, and that the Fund may withdraw its investments in an underlying fund at a disadvantageous time. |
| ∎ | Geographic focus risk. An underlying fund may from time to time invest a substantial amount of its assets in securities of issuers located in a single country or a limited number of countries. Adverse economic, political or social conditions in those countries may therefore have a significant negative impact on an underlying fund’s investment performance. |
| ∎ | Growth investing risk. Growth stocks tend to be more expensive relative to the issuing company’s earnings or assets compared with other types of stock. As a result, they tend to be more sensitive to changes in, or investors’ expectations of, the issuing company’s earnings and can be more volatile. |
| ∎ | Indexing risk. An underlying fund is operated as a passively managed index fund and, therefore, the adverse performance of a particular security necessarily will not result in the elimination of the security from the underlying fund’s portfolio. Ordinarily, the underlying fund’s adviser will not sell the underlying fund’s portfolio securities except to reflect additions or deletions of the securities that comprise the underlying fund’s underlying index, or as may be necessary to raise cash to pay underlying fund shareholders who sell underlying fund shares. As such, the underlying fund will be negatively affected by declines in the securities represented by its underlying index. Also, there is no guarantee that the underlying fund’s adviser will be able to correlate the underlying fund’s performance with that of its underlying index. |
| ∎ | Investing in the European Union risk. Investments in certain countries in the European Union are susceptible to high economic risks associated with high levels of debt, such as investments in sovereign debt of Greece, Italy and Spain. Separately, the European Union faces issues involving its membership, structure, procedures and policies. The exit of one or more member states from the European Union would place its currency and banking system in jeopardy. Efforts of the member states to further unify their economic and monetary policies may increase the potential for the downward movement of one member state’s market to cause a similar effect on other member states’ markets. |
| ∎ | Management risk. An underlying fund is actively managed and depends heavily on an underlying fund’s adviser’s judgment about markets, interest rates or the attractiveness, relative values, liquidity, or potential appreciation of particular investments made for an underlying fund’s portfolio. An underlying fund could experience losses if these judgments prove to be incorrect. Additionally, legislative, regulatory, or tax developments may adversely affect management of an underlying fund and, therefore, the ability of the underlying fund to achieve its investment objective. |
| ∎ | Market risk. The market values of an underlying fund’s investments, and therefore the value of an underlying fund’s shares, will go up and down, sometimes rapidly or unpredictably. Market risk may affect a single issuer, industry or section of the economy, or it may affect the market as a whole. Individual stock prices tend to go up and down more dramatically than those of certain other types of investments, such as bonds. During a general downturn in the financial markets, multiple asset classes may decline in value. When markets perform well, there can be no assurance that specific investments held by an underlying fund will rise in value. |
| ∎ | Market trading risk. An underlying exchange-traded fund faces numerous market trading risks, including the potential lack of an active market for its shares, losses from trading in secondary markets, and disruption in the creation/redemption process of an underlying fund. Any of these factors may lead to an underlying fund’s shares trading at a premium or discount to an underlying fund’s net asset value (NAV). |
| 9 | Invesco International Allocation Fund |
| ∎ | Non-diversification risk. An underlying fund is non-diversified and can invest a greater portion of its assets in the obligations or securities of a small number of issuers or any single issuer than a diversified fund can. A change in the value of one or a few issuers’ securities will therefore affect the value of an underlying fund more than would occur in a diversified fund. |
| ∎ | Preferred securities risk. Preferred securities are subject to issuer-specific and market risks applicable generally to equity securities. Preferred securities also may be subordinated to bonds or other debt instruments, subjecting them to a greater risk of non-payment, may be less liquid than many other securities, such as common stocks, and generally offer no voting rights with respect to the issuer. |
| ∎ | Sector focus risk. An underlying fund may from time to time invest a significant amount of its assets (i.e. over 25%) in one market sector or group of related industries. In this event, an underlying fund’s performance will depend to a greater extent on the overall condition of the sector or group of industries and there is increased risk that an underlying fund will lose significant value if conditions adversely affect that sector or group of industries. |
| ∎ | Small- and mid-capitalization companies risks. Small- and mid-capitalization companies tend to be more vulnerable to changing market conditions, may have little or no operating history or track record of success, and may have more limited product lines and markets, less experienced management and fewer financial resources than larger companies. These companies’ securities may be more volatile and less liquid than those of more established companies, and their returns may vary, sometimes significantly, from the overall securities market. |
| ∎ | Value investing style risk. A value investing style subjects an underlying fund to the risk that the valuations never improve or that the returns on value equity securities are less than returns on other styles of investing or the overall stock market. |
About indexes used in this report
| ∎ | The MSCI All Country World ex-U.S. Index is an index considered representative of developed and emerging stock markets, excluding the US. The index is computed using the net return, which withholds applicable taxes for non-resident investors. |
| ∎ | The Lipper International Multi-Cap Core Funds Index is an unmanaged index considered representative of international multicap core funds tracked by Lipper. |
| ∎ | The Fund is not managed to track the performance of any particular index, including the index(es) described here, and consequently, the performance of the Fund may deviate significantly from the performance of the index(es). |
| ∎ | A direct investment cannot be made in an index. Unless otherwise indicated, index results include reinvested dividends, and they do not reflect sales charges. Performance of the peer group, if applicable, reflects fund expenses; performance of a market index does not. |
Other information
| ∎ | The returns shown in management’s discussion of Fund performance are based on net asset values (NAVs) calculated for shareholder transactions. Generally accepted accounting principles require adjustments to be made to the net assets of the Fund at period end for financial reporting purposes, and as such, the NAVs for shareholder transactions and the returns based on those NAVs may differ from the NAVs and returns reported in the Financial Highlights. |
| 10 | Invesco International Allocation Fund |
Schedule of Investments
December 31, 2017
Invesco International Allocation Fund
Schedule of Investments in Affiliated Issuers–100.63%(a)
| % of Net Assets 12/31/17 | Value 12/31/16 | Purchases at Cost | Proceeds from Sales | Change in Unrealized Appreciation (Depreciation) | Realized Gain | Dividend Income | Shares 12/31/17 | Value 12/31/17 | ||||||||||||||||||||||||||||
Foreign Equity Funds–99.59% |
| |||||||||||||||||||||||||||||||||||
Invesco Developing Markets Fund–Class R6 | 4.99 | % | $ | 8,439,140 | $ | 502,747 | $ | (3,081,952 | ) | $ | 981,720 | $ | 1,112,841 | $ | 88,906 | 212,063 | $ | 7,954,496 | ||||||||||||||||||
Invesco Emerging Market Equity Fund–Class R6 | 0.00 | % | 6,428,043 | — | (7,452,497 | ) | 992,335 | 32,119 | — | — | — | |||||||||||||||||||||||||
Invesco International Companies Fund–Class R6 | 11.96 | % | 7,076,519 | 12,090,596 | (2,036,215 | ) | 1,505,827 | 1,822,037 | 172,807 | 1,558,769 | 19,063,742 | |||||||||||||||||||||||||
Invesco International Core Equity Fund–Class R6 | 9.96 | % | 25,302,263 | 777,003 | (14,217,981 | ) | 993,008 | 3,018,806 | 271,337 | 1,261,773 | 15,873,099 | |||||||||||||||||||||||||
Invesco International Growth Fund–Class R6 | 17.93 | % | 25,428,052 | 2,027,245 | (3,635,823 | ) | 3,131,340 | 1,869,226 | 576,521 | 776,629 | 28,572,194 | |||||||||||||||||||||||||
Invesco International Small Company Fund–Class R6 | 7.00 | % | 8,530,702 | 2,204,266 | (1,697,581 | ) | 1,269,799 | 1,240,575 | 331,012 | 582,165 | 11,160,107 | |||||||||||||||||||||||||
Invesco Low Volatility Emerging Markets | 4.01 | % | — | 7,130,044 | (619,313 | ) | (151,717 | ) | 811,069 | 139,328 | 727,270 | 6,392,705 | ||||||||||||||||||||||||
PowerShares FTSE RAFI Developed Markets ex- U.S. Portfolio–ETF | 17.89 | % | 20,993,679 | 5,747,790 | (2,986,447 | ) | 4,110,311 | 641,963 | 800,423 | 627,914 | 28,507,296 | |||||||||||||||||||||||||
PowerShares FTSE RAFI Developed Markets ex-US Small-Mid Portfolio–ETF | 8.90 | % | 9,903,303 | 3,148,052 | (1,821,807 | ) | 2,540,393 | 410,592 | 349,504 | 412,105 | 14,180,533 | |||||||||||||||||||||||||
PowerShares FTSE RAFI Emerging Markets | 6.03 | % | 8,381,017 | 1,222,155 | (1,862,699 | ) | 1,216,937 | 651,524 | 262,351 | 430,315 | 9,608,934 | |||||||||||||||||||||||||
PowerShares International Dividend Achievers Portfolio–ETF | 0.00 | % | 9,873,401 | 166,543 | (10,472,585 | ) | (1,253,875 | ) | 1,686,516 | 11,318 | — | — | ||||||||||||||||||||||||
PowerShares S&P International Developed Low Volatility Portfolio–ETF | 10.92 | % | 10,620,930 | 5,992,845 | (1,441,898 | ) | 2,059,615 | 163,356 | 515,160 | 516,781 | 17,394,848 | |||||||||||||||||||||||||
Total Foreign Equity Funds | 140,977,049 | 41,009,286 | (51,326,798 | ) | 17,395,693 | 13,460,624 | 3,518,667 | 158,707,954 | ||||||||||||||||||||||||||||
Money Market Funds–1.04% |
| |||||||||||||||||||||||||||||||||||
Invesco Government & Agency Portfolio–Institutional Class, 1.18%(c) | 0.36 | % | 137,443 | 11,530,681 | (11,091,279 | ) | — | — | 2,643 | 576,845 | 576,845 | |||||||||||||||||||||||||
Invesco Liquid Assets Portfolio–Institutional Class, 1.40%(c) | 0.26 | % | — | 506,303 | (94,273 | ) | — | — | 86 | 411,989 | 412,030 | |||||||||||||||||||||||||
Invesco Treasury Portfolio–Institutional Class, | 0.42 | % | 91,629 | 7,969,617 | (7,401,994 | ) | — | — | 1,762 | 659,252 | 659,252 | |||||||||||||||||||||||||
Total Money Market Funds | 229,072 | 20,006,601 | (18,587,546 | ) | — | — | 4,491 | 1,648,127 | ||||||||||||||||||||||||||||
TOTAL INVESTMENTS IN AFFILIATED ISSUERS | 100.63 | % | $ | 141,206,121 | $ | 61,015,887 | $ | (69,914,344 | ) | $ | 17,395,693 | $ | 13,460,624 | (b) | $ | 3,523,158 | $ | 160,356,081 | ||||||||||||||||||
OTHER ASSETS LESS LIABILITIES | (0.63 | )% | (997,194 | ) | ||||||||||||||||||||||||||||||||
NET ASSETS | 100.00 | % | $ | 159,358,887 | ||||||||||||||||||||||||||||||||
Investment Abbreviations:
ETF – Exchange Traded Fund
Notes to Schedule of Investments:
| (a) | Each underlying fund and the Fund are affiliated by either having the same investment adviser or an investment adviser under common control with the Fund’s investment adviser. |
| (b) | Includes $1,395,022, $247,846, $387,654 and $777,378 of capital gains distributions from affiliated underlying funds for Invesco International Companies Fund, Invesco International Growth Fund, Invesco International Small Company Fund and Invesco Low Volatility Emerging Market Equity fund, respectively. |
| (c) | The rate shown is the 7-day SEC standardized yield as of December 31, 2017. |
See accompanying Notes to Financial Statements which are an integral part of the financial statements.
11 Invesco International Allocation Fund
Statement of Assets and Liabilities
December 31, 2017
Assets: | ||||
Investments in affiliated underlying funds, at value (Cost $128,609,464) | $ | 160,356,081 | ||
Receivable for: | ||||
Fund shares sold | 100,818 | |||
Dividends from affiliated underlying funds | 605 | |||
Investment for trustee deferred compensation and retirement plans | 65,180 | |||
Other assets | 36,953 | |||
Total assets | 160,559,637 | |||
Liabilities: | ||||
Payable for: | ||||
Investments purchased — affiliated underlying funds | 896,177 | |||
Fund shares reacquired | 89,739 | |||
Accrued fees to affiliates | 119,236 | |||
Accrued trustees’ and officers’ fees and benefits | 667 | |||
Accrued other operating expenses | 22,187 | |||
Trustee deferred compensation and retirement plans | 72,744 | |||
Total liabilities | 1,200,750 | |||
Net assets applicable to shares outstanding | $ | 159,358,887 | ||
Net assets consist of: | ||||
Shares of beneficial interest | $ | 177,740,832 | ||
Undistributed net investment income | 444,647 | |||
Undistributed net realized gain (loss) | (50,573,209 | ) | ||
Net unrealized appreciation | 31,746,617 | |||
| $ | 159,358,887 | |||
Net Assets: | ||||
Class A | $ | 102,478,967 | ||
Class B | $ | 639,587 | ||
Class C | $ | 24,297,038 | ||
Class R | $ | 4,779,075 | ||
Class Y | $ | 19,039,678 | ||
Class R5 | $ | 8,112,318 | ||
Class R6 | $ | 12,224 | ||
Shares outstanding, no par value, |
| |||
Class A | 8,391,943 | |||
Class B | 52,275 | |||
Class C | 1,985,963 | |||
Class R | 391,025 | |||
Class Y | 1,565,859 | |||
Class R5 | 665,226 | |||
Class R6 | 1,003 | |||
Class A: | ||||
Net asset value per share | $ | 12.21 | ||
Maximum offering price per share | ||||
(Net asset value of $12.21 ¸ 94.50%) | $ | 12.92 | ||
Class B: | ||||
Net asset value and offering price per share | $ | 12.24 | ||
Class C: | ||||
Net asset value and offering price per share | $ | 12.23 | ||
Class R: | ||||
Net asset value and offering price per share | $ | 12.22 | ||
Class Y: | ||||
Net asset value and offering price per share | $ | 12.16 | ||
Class R5: | ||||
Net asset value and offering price per share | $ | 12.19 | ||
Class R6: | ||||
Net asset value and offering price per share | $ | 12.19 | ||
See accompanying Notes to Financial Statements which are an integral part of the financial statements.
12 Invesco International Allocation Fund
Statement of Operations
For the year ended December 31, 2017
Investment income: | ||||
Dividends from affiliated underlying funds | $ | 3,523,158 | ||
Expenses: | ||||
Administrative services fees | 50,000 | |||
Custodian fees | 7,577 | |||
Distribution fees: | ||||
Class A | 249,499 | |||
Class B | 9,168 | |||
Class C | 229,228 | |||
Class R | 21,787 | |||
Transfer agent fees —A, B, C, R and Y | 391,497 | |||
Transfer agent fees — R5 | 7,142 | |||
Trustees’ and officers’ fees and benefits | 22,588 | |||
Registration and filing fees | 96,576 | |||
Reports to shareholders | 83,941 | |||
Professional services fees | 36,261 | |||
Other | 11,889 | |||
Total expenses | 1,217,153 | |||
Less: Expense offset arrangement(s) | (4,663 | ) | ||
Net expenses | 1,212,490 | |||
Net investment income | 2,310,668 | |||
Realized and unrealized gain from investments in affiliated underlying fund shares | ||||
Net realized gain on sales of affiliated underlying fund shares | 10,652,723 | |||
Net realized gain from distributions of affiliated underlying fund shares | 2,807,900 | |||
| 13,460,623 | ||||
Change in net unrealized appreciation of affiliated underlying fund shares | 17,395,693 | |||
Net gain from affiliated underlying funds | 30,856,316 | |||
Net increase in net assets resulting from operations | $ | 33,166,984 | ||
See accompanying Notes to Financial Statements which are an integral part of the financial statements.
13 Invesco International Allocation Fund
Statement of Changes in Net Assets
For the years ended December 31, 2017 and 2016
| 2017 | 2016 | |||||||
Operations: | ||||||||
Net investment income | $ | 2,310,668 | $ | 2,157,090 | ||||
Net realized gain (loss) | 13,460,623 | (17,640,642 | ) | |||||
Change in net unrealized appreciation | 17,395,693 | 23,943,662 | ||||||
Net increase in net assets resulting from operations | 33,166,984 | 8,460,110 | ||||||
Distributions to shareholders from net investment income: | ||||||||
Class A | (1,999,235 | ) | (1,451,855 | ) | ||||
Class B | (8,413 | ) | (7,916 | ) | ||||
Class C | (298,596 | ) | (143,016 | ) | ||||
Class R | (82,330 | ) | (52,478 | ) | ||||
Class Y | (422,780 | ) | (117,859 | ) | ||||
Class R5 | (189,748 | ) | (116,009 | ) | ||||
Class R6 | (304 | ) | — | |||||
Total distributions from net investment income | (3,001,406 | ) | (1,889,133 | ) | ||||
Share transactions–net: | ||||||||
Class A | (18,404,467 | ) | (12,820,980 | ) | ||||
Class B | (721,069 | ) | (1,238,145 | ) | ||||
Class C | (2,200,367 | ) | (2,762,874 | ) | ||||
Class R | (451,327 | ) | (962,366 | ) | ||||
Class Y | 9,257,539 | (803,290 | ) | |||||
Class R5 | 488,397 | 38,039 | ||||||
Class R6 | 10,824 | — | ||||||
Net increase (decrease) in net assets resulting from share transactions | (12,020,470 | ) | (18,549,616 | ) | ||||
Net increase (decrease) in net assets | 18,145,108 | (11,978,639 | ) | |||||
Net assets: | ||||||||
Beginning of year | 141,213,779 | 153,192,418 | ||||||
End of year (includes undistributed net investment income of $444,647 and $629,411, respectively) | $ | 159,358,887 | $ | 141,213,779 | ||||
Notes to Financial Statements
December 31, 2017
NOTE 1—Significant Accounting Policies
Invesco International Allocation Fund (the “Fund”) is a series portfolio of AIM Growth Series (Invesco Growth Series) (the “Trust”). The Trust is organized as a Delaware statutory trust and is registered under the Investment Company Act of 1940, as amended (the “1940 Act”), as an open-end series management investment company consisting of twenty-nine separate series portfolios, each authorized to issue an unlimited number of shares of beneficial interest. The assets, liabilities and operations of each portfolio are accounted for separately. Information presented in these financial statements pertains only to the Fund. Matters affecting each portfolio or class will be voted on exclusively by the shareholders of such portfolio or class.
The Fund’s investment objective is long-term growth of capital.
The Fund is a “fund of funds,” in that it invests in other mutual funds (“underlying funds”) advised by Invesco Advisers, Inc. (the “Adviser” or “Invesco”) and exchange-traded funds advised by Invesco PowerShares Capital Management LLC (“PowerShares Capital”), an affiliate of Invesco. Invesco and PowerShares Capital are affiliates of each other as they are indirect, wholly-owned subsidiaries of Invesco Ltd. Invesco may change the Fund’s asset class allocations, the underlying funds or target weightings in the underlying funds without shareholder approval. The underlying funds may engage in a number of investment techniques and practices, which involve certain risks. Each underlying fund’s accounting policies are outlined in the underlying fund’s financial statements and are publicly available.
The Fund currently consists of seven different classes of shares: Class A, Class B, Class C, Class R, Class Y, Class R5 and Class R6. On April 4, 2017, the Fund began offering Class R6 shares. Class Y shares are available only to certain investors. Class A shares are sold with a front-end sales charge unless certain waiver criteria are met and under certain circumstances load waived shares may be subject to contingent deferred sales charges (“CDSC”). Class C shares are sold with a CDSC. Class R, Class Y, Class R5 and Class R6 shares are sold at net asset value. Effective November 30, 2010, new or additional investments in Class B shares are no longer permitted. Existing shareholders of Class B shares may continue to reinvest dividends and capital gains distributions in Class B shares until they convert to Class A shares. Also, shareholders in Class B shares will be
14 Invesco International Allocation Fund
able to exchange those shares for Class B shares of other Invesco Funds offering such shares until they convert to Class A shares. Generally, Class B shares will automatically convert to Class A shares on or about the month-end, which is at least eight years after the date of purchase. Redemption of Class B shares prior to the conversion date will be subject to a CDSC. Effective January 26, 2018, all of the Fund’s outstanding Class B shares were converted to Class A shares, in advance of their normally scheduled conversion. No CDSC was paid in connection with this early conversion.
The Fund is an investment company and accordingly follows the investment company accounting and reporting guidance in accordance with Financial Accounting Standards Board Accounting Standards Codification Topic 946, Financial Services — Investment Companies.
The following is a summary of the significant accounting policies followed by the Fund in the preparation of its financial statements.
| A. | Security Valuations — Securities of investment companies that trade on an exchange are valued at the last sales price or official closing price as of the close of the customary trading session on the exchange where the security is principally traded. Investments in shares of funds that are not traded on an exchange are valued at the end-of-day net asset value per share of such fund. Securities in the underlying funds, including restricted securities, are valued in accordance with the valuation policy of such fund. The policies of the underlying funds affiliated with the Fund as a result of having the same investment adviser are set forth below. |
A security listed or traded on an exchange (except convertible securities) is valued at its last sales price or official closing price as of the close of the customary trading session on the exchange where the security is principally traded, or lacking any sales or official closing price on a particular day, the security may be valued at the closing bid price on that day. Securities traded in the over-the-counter market are valued based on prices furnished by independent pricing services or market makers. When such securities are valued by an independent pricing service they may be considered fair valued. Futures contracts are valued at the final settlement price set by an exchange on which they are principally traded. Listed options are valued at the mean between the last bid and asked prices from the exchange on which they are principally traded. Options not listed on an exchange are valued by an independent source at the mean between the last bid and asked prices. For purposes of determining net asset value (“NAV”) per share, futures and option contracts generally are valued 15 minutes after the close of the customary trading session of the New York Stock Exchange (“NYSE”).
Investments in open-end and closed-end registered investment companies that do not trade on an exchange are valued at the end-of-day net asset value per share. Investments in open-end and closed-end registered investment companies that trade on an exchange are valued at the last sales price or official closing price as of the close of the customary trading session on the exchange where the security is principally traded.
Debt obligations (including convertible securities) and unlisted equities are fair valued using an evaluated quote provided by an independent pricing service. Evaluated quotes provided by the pricing service may be determined without exclusive reliance on quoted prices, and may reflect appropriate factors such as institution-size trading in similar groups of securities, developments related to specific securities, dividend rate (for unlisted equities), yield (for debt obligations), quality, type of issue, coupon rate (for debt obligations), maturity (for debt obligations), individual trading characteristics and other market data. Pricing services generally value debt obligations assuming orderly transactions of institutional round lot size, but a fund may hold or transact in the same securities in smaller, odd lot sizes. Odd lots often trade at lower prices than institutional round lots. Debt obligations are subject to interest rate and credit risks. In addition, all debt obligations involve some risk of default with respect to interest and/or principal payments.
Foreign securities’ (including foreign exchange contracts) prices are converted into U.S. dollar amounts using the applicable exchange rates as of the close of the NYSE. If market quotations are available and reliable for foreign exchange-traded equity securities, the securities will be valued at the market quotations. Because trading hours for certain foreign securities end before the close of the NYSE, closing market quotations may become unreliable. If between the time trading ends on a particular security and the close of the customary trading session on the NYSE, events occur that the investment adviser determines are significant and make the closing price unreliable, the Fund may fair value the security. If the event is likely to have affected the closing price of the security, the security will be valued at fair value in good faith using procedures approved by the Board of Trustees. Adjustments to closing prices to reflect fair value may also be based on a screening process of an independent pricing service to indicate the degree of certainty, based on historical data, that the closing price in the principal market where a foreign security trades is not the current value as of the close of the NYSE. Foreign securities’ prices meeting the approved degree of certainty that the price is not reflective of current value will be priced at the indication of fair value from the independent pricing service. Multiple factors may be considered by the independent pricing service in determining adjustments to reflect fair value and may include information relating to sector indices, American Depositary Receipts and domestic and foreign index futures. Foreign securities may have additional risks including exchange rate changes, potential for sharply devalued currencies and high inflation, political and economic upheaval, the relative lack of issuer information, relatively low market liquidity and the potential lack of strict financial and accounting controls and standards.
Securities for which market prices are not provided by any of the above methods may be valued based upon quotes furnished by independent sources. The last bid price may be used to value equity securities. The mean between the last bid and asked prices is used to value debt obligations, including corporate loans.
Securities for which market quotations are not readily available or became unreliable are valued at fair value as determined in good faith by or under the supervision of the Trust’s officers following procedures approved by the Board of Trustees. Issuer specific events, market trends, bid/asked quotes of brokers and information providers and other market data may be reviewed in the course of making a good faith determination of a security’s fair value.
The Funds may invest in securities that are subject to interest rate risk, meaning the risk that the prices will generally fall as interest rates rise and, conversely, the prices will generally rise as interest rates fall. Specific securities differ in their sensitivity to changes in interest rates depending on their individual characteristics. Changes in interest rates may result in increased market volatility, which may affect the value and/or liquidity of certain Fund investments.
Valuations change in response to many factors including the historical and prospective earnings of the issuer, the value of the issuer’s assets, general economic conditions, interest rates, investor perceptions and market liquidity. Because of the inherent uncertainties of valuation, the values reflected in the financial statements may materially differ from the value received upon actual sale of those investments.
| B. | Securities Transactions and Investment Income — Securities transactions are accounted for on a trade date basis. Realized gains or losses on sales are computed on the basis of specific identification of the securities sold. Distributions from ordinary income from underlying funds, if any, are recorded as dividend income on ex-dividend date. Distributions from gains from underlying funds, if any, are recorded as realized gains on the ex-dividend date. The following policies are followed by the underlying funds: Interest income (net of withholding tax, if any) |
15 Invesco International Allocation Fund
| is recorded on the accrual basis from settlement date. Bond premiums and discounts are amortized and/or accreted over the lives of the respective securities. Pay-in-kind interest income and non-cash dividend income received in the form of securities in-lieu of cash are recorded at the fair value of the securities received. Paydown gains and losses on mortgage and asset-backed securities are recorded as adjustments to interest income. |
The Fund allocates income and realized and unrealized capital gains and losses to a class based on the relative net assets of each class.
| C. | Distributions — Distributions from net investment income and net realized capital gain, if any, are generally declared and paid annually and recorded on the ex-dividend date. The Fund may elect to treat a portion of the proceeds from redemptions as distributions for federal income tax purposes. |
| D. | Federal Income Taxes — The Fund intends to comply with the requirements of Subchapter M of the Internal Revenue Code of 1986, as amended (the “Internal Revenue Code”), necessary to qualify as a regulated investment company and to distribute substantially all of the Fund’s taxable earnings to shareholders. As such, the Fund will not be subject to federal income taxes on otherwise taxable income (including net realized capital gain) that is distributed to shareholders. Therefore, no provision for federal income taxes is recorded in the financial statements. |
The Fund recognizes the tax benefits of uncertain tax positions only when the position is more likely than not to be sustained. Management has analyzed the Fund’s uncertain tax positions and concluded that no liability for unrecognized tax benefits should be recorded related to uncertain tax positions. Management is not aware of any tax positions for which it is reasonably possible that the total amounts of unrecognized tax benefits will change materially in the next 12 months.
The Fund files tax returns in the U.S. Federal jurisdiction and certain other jurisdictions. Generally, the Fund is subject to examinations by such taxing authorities for up to three years after the filing of the return for the tax period.
| E. | Expenses — Expenses included in the accompanying financial statements reflect the expenses of the Fund and do not include any expenses of the underlying funds. The effects of the underlying funds expenses are included in the realized and unrealized gain/loss on the investments in the underlying funds. Estimated expenses of the underlying funds are discussed further in Note 11. |
Fees provided for under the Rule 12b-1 plan of a particular class of the Fund and which are directly attributable to that class are charged to the operations of such class. Transfer agency fees and expenses and other shareholder recordkeeping fees and expenses attributable to Class R5 and Class R6 are allocated to each share class based on relative net assets. Transfer agency fees and expenses and other shareholder recordkeeping fees and expenses relating to all other classes are allocated among those classes based on relative net assets. All other expenses are allocated among the classes based on relative net assets.
| F. | Accounting Estimates — The preparation of financial statements in conformity with accounting principles generally accepted in the United States of America (“GAAP”) requires management to make estimates and assumptions that affect the reported amounts of assets and liabilities at the date of the financial statements and the reported amounts of revenues and expenses during the reporting period including estimates and assumptions related to taxation. Actual results could differ from those estimates by a significant amount. In addition, the Fund monitors for material events or transactions that may occur or become known after the period-end date and before the date the financial statements are released to print. |
| G. | Indemnifications — Under the Trust’s organizational documents, each Trustee, officer, employee or other agent of the Trust is indemnified against certain liabilities that may arise out of the performance of their duties to the Fund. Additionally, in the normal course of business, the Fund enters into contracts, including the Fund’s servicing agreements, that contain a variety of indemnification clauses. The Fund’s maximum exposure under these arrangements is unknown as this would involve future claims that may be made against the Fund that have not yet occurred. The risk of material loss as a result of such indemnification claims is considered remote. |
NOTE 2—Advisory Fees and Other Fees Paid to Affiliates
The Trust has entered into a master investment advisory agreement with Invesco. Under the terms of the investment advisory agreement, the Fund does not pay an advisory fee. However, the Fund pays advisory fees to Invesco indirectly as a shareholder of the underlying funds.
Under the terms of a master sub-advisory agreement between the Adviser and each of Invesco Asset Management Deutschland GmbH, Invesco Asset Management Limited, Invesco Asset Management (Japan) Limited, Invesco Hong Kong Limited, Invesco Senior Secured Management, Inc. and Invesco Canada Ltd. (collectively, the “Affiliated Sub-Advisers”) the Adviser, not the Fund, will pay 40% of the fees paid to the Adviser to any such Affiliated Sub-Adviser(s) that provide(s) discretionary investment management services to the Fund based on the percentage of assets allocated to such Sub-Adviser(s).
The Adviser has contractually agreed, through at least June 30, 2018, to reimburse expenses of all shares to the extent necessary to limit total annual fund operating expenses after expense reimbursement (excluding certain items discussed below) of Class A, Class B, Class C, Class R, Class Y, Class R5 and Class R6 shares to 2.25%, 3.00%, 3.00%, 2.50%, 2.00%, 2.00% and 2.00%, respectively, of average daily net assets (the “expense limits”). In determining the Adviser’s obligation to reimburse expenses, the following expenses are not taken into account, and could cause the total annual fund operating expenses after expense reimbursement to exceed the numbers reflected above: (1) interest; (2) taxes; (3) dividend expense on short sales; (4) extraordinary or non-routine items, including litigation expenses; and (5) expenses that the Fund has incurred but did not actually pay because of an expense offset arrangement. Acquired Fund Fees and Expenses are not operating expenses of a Fund directly, but are fees and expenses, including management fees of the investment companies in which a Fund invests. As a result, the total annual fund operating expenses after expense reimbursement may exceed the expense limits above. Unless Invesco continues the fee waiver agreement, it will terminate on June 30, 2018. During its term, the fee waiver agreement cannot be terminated or amended to increase the expense limits without approval of the Board of Trustees. The Adviser did not waive fees and/or reimburse expenses during the period under these expense limits.
The Trust has entered into a master administrative services agreement with Invesco pursuant to which the Fund has agreed to pay Invesco for certain administrative costs incurred in providing accounting services to the Fund. For the year ended December 31, 2017, expenses incurred under the agreement are shown in the Statement of Operations as Administrative services fees.
The Trust has entered into a transfer agency and service agreement with Invesco Investment Services, Inc. (“IIS”) pursuant to which the Fund has agreed to pay IIS a fee for providing transfer agency and shareholder services to the Fund and reimburse IIS for certain expenses incurred by IIS in the course of providing such services. IIS may make payments to intermediaries that provide omnibus account services, sub-accounting services and/or networking services. All fees payable by IIS to intermediaries that provide omnibus account services or sub-accounting services are charged back to
16 Invesco International Allocation Fund
the Fund, subject to certain limitations approved by the Trust’s Board of Trustees. For the year ended December 31, 2017, expenses incurred under the agreement are shown in the Statement of Operations as Transfer agent fees.
The Trust has entered into master distribution agreements with Invesco Distributors, Inc. (“IDI”) to serve as the distributor for the Class A, Class B, Class C, Class R, Class Y, Class R5 and Class R6 shares of the Fund. The Trust has adopted plans pursuant to Rule 12b-1 under the 1940 Act with respect to the Fund’s Class A, Class B, Class C and Class R shares (collectively, the “Plans”). The Fund, pursuant to the Plans, pays IDI compensation at the annual rate of 0.25% of the Fund’s average daily net assets of Class A shares, 1.00% of the average daily net assets of Class B and Class C shares and 0.50% of the average daily net assets of Class R shares. The fees are accrued daily and paid monthly. Of the Plan payments, up to 0.25% of the average daily net assets of each class of shares may be paid to furnish continuing personal shareholder services to customers who purchase and own shares of such classes. Any amounts not paid as a service fee under the Plans would constitute an asset-based sales charge. Rules of the Financial Industry Regulatory Authority (“FINRA”) impose a cap on the total sales charges, including asset-based sales charges, that may be paid by any class of shares of the Fund. For the year ended December 31, 2017, expenses incurred under the Plans are shown in the Statement of Operations as Distribution fees.
Front-end sales commissions and CDSC (collectively, the “sales charges”) are not recorded as expenses of the Fund. Front-end sales commissions are deducted from proceeds from the sales of Fund shares prior to investment in Class A shares of the Fund. CDSC are deducted from redemption proceeds prior to remittance to the shareholder. During the year ended December 31, 2017, IDI advised the Fund that IDI retained $17,866 in front-end sales commissions from the sale of Class A shares and $1,779, $94 and $1,001 from Class A, Class B and Class C shares, respectively, for CDSC imposed on redemptions by shareholders.
The underlying Invesco mutual funds pay no distribution fees for Class R6 and the Fund pays no sales loads or other similar compensation to IDI for acquiring underlying fund shares.
Certain officers and trustees of the Trust are officers and directors of the Adviser, IIS and/or IDI.
NOTE 3—Additional Valuation Information
GAAP defines fair value as the price that would be received to sell an asset or paid to transfer a liability in an orderly transaction between market participants at the measurement date, under current market conditions. GAAP establishes a hierarchy that prioritizes the inputs to valuation methods, giving the highest priority to readily available unadjusted quoted prices in an active market for identical assets (Level 1) and the lowest priority to significant unobservable inputs (Level 3), generally when market prices are not readily available or are unreliable. Based on the valuation inputs, the securities or other investments are tiered into one of three levels. Changes in valuation methods may result in transfers in or out of an investment’s assigned level:
| Level 1 — | Prices are determined using quoted prices in an active market for identical assets. |
| Level 2 — | Prices are determined using other significant observable inputs. Observable inputs are inputs that other market participants may use in pricing a security. These may include quoted prices for similar securities, interest rates, prepayment speeds, credit risk, yield curves, loss severities, default rates, discount rates, volatilities and others. |
| Level 3 — | Prices are determined using significant unobservable inputs. In situations where quoted prices or observable inputs are unavailable (for example, when there is little or no market activity for an investment at the end of the period), unobservable inputs may be used. Unobservable inputs reflect the Fund’s own assumptions about the factors market participants would use in determining fair value of the securities or instruments and would be based on the best available information. |
As of December 31, 2017, all of the securities in this Fund were valued based on Level 1 inputs (see the Schedule of Investments for security categories). The level assigned to the securities valuations may not be an indication of the risk or liquidity associated with investing in those securities.
The Fund’s policy is to recognize transfers in and out of the valuation levels as of the end of the reporting period. During the year ended December 31, 2017, there were no material transfers between valuation levels.
NOTE 4—Expense Offset Arrangement(s)
The expense offset arrangement is comprised of transfer agency credits which result from balances in demand deposit accounts used by the transfer agent for clearing shareholder transactions. For the year ended December 31, 2017, the Fund received credits from this arrangement, which resulted in the reduction of the Fund’s total expenses of $4,663.
NOTE 5—Trustees’ and Officers’ Fees and Benefits
Trustees’ and Officers’ Fees and Benefits include amounts accrued by the Fund to pay remuneration to certain Trustees and Officers of the Fund. Trustees have the option to defer compensation payable by the Fund, and Trustees’ and Officers’ Fees and Benefits also include amounts accrued by the Fund to fund such deferred compensation amounts. Those Trustees who defer compensation have the option to select various Invesco Funds in which their deferral accounts shall be deemed to be invested. Finally, certain current Trustees were eligible to participate in a retirement plan that provided for benefits to be paid upon retirement to Trustees over a period of time based on the number of years of service. The Fund may have certain former Trustees who also participate in a retirement plan and receive benefits under such plan. Trustees’ and Officers’ Fees and Benefits include amounts accrued by the Fund to fund such retirement benefits. Obligations under the deferred compensation and retirement plans represent unsecured claims against the general assets of the Fund.
NOTE 6—Cash Balances
The Fund is permitted to temporarily carry a negative or overdrawn balance in its account with State Street Bank and Trust Company, the custodian bank. Such balances, if any at period-end, are shown in the Statement of Assets and Liabilities under the payable caption Amount due custodian. To compensate the custodian bank for such overdrafts, the overdrawn Fund may either (1) leave funds as a compensating balance in the account so the custodian bank can be compensated by earning the additional interest; or (2) compensate by paying the custodian bank at a rate agreed upon by the custodian bank and Invesco, not to exceed the contractually agreed upon rate.
17 Invesco International Allocation Fund
NOTE 7—Distributions to Shareholders and Tax Components of Net Assets
Tax Character of Distributions to Shareholders Paid During the Fiscal Years Ended December 31, 2017 and 2016:
| 2017 | 2016 | |||||||
Ordinary income | $ | 3,001,406 | $ | 1,889,133 | ||||
Tax Components of Net Assets at Period-End:
| 2017 | ||||
Undistributed ordinary income | $ | 506,493 | ||
Net unrealized appreciation — investments | 21,658,504 | |||
Temporary book/tax differences | (61,846 | ) | ||
Capital loss carryforward | (40,485,096 | ) | ||
Shares of beneficial interest | 177,740,832 | |||
Total net assets | $ | 159,358,887 | ||
The difference between book-basis and tax-basis unrealized appreciation (depreciation) is due to differences in the timing of recognition of gains and losses on investments for tax and book purposes. The Fund’s net unrealized appreciation difference is attributable primarily to wash sales.
The temporary book/tax differences are a result of timing differences between book and tax recognition of income and/or expenses. The Fund’s temporary book/tax differences are the result of the trustee deferral of compensation and retirement plan benefits.
Capital loss carryforward is calculated and reported as of a specific date. Results of transactions and other activity after that date may affect the amount of capital loss carryforward actually available for the Fund to utilize. Capital losses generated in years beginning after December 22, 2010 can be carried forward for an unlimited period, whereas previous losses expire in eight tax years. Capital losses with an expiration period may not be used to offset capital gains until all net capital losses without an expiration date have been utilized. Capital loss carryforwards with no expiration date will retain their character as either short-term or long-term capital losses instead of as short-term capital losses as under prior law. The ability to utilize capital loss carryforwards in the future may be limited under the Internal Revenue Code and related regulations based on the results of future transactions.
The Fund has a capital loss carryforward as of December 31, 2017, which expires as follows:
| Capital Loss Carryforward* | ||||||||||||
| Expiration | Short-Term | Long-Term | Total | |||||||||
December 31, 2018 | $ | 9,317,140 | $ | — | $ | 9,317,140 | ||||||
Not subject to expiration | — | 31,167,956 | 31,167,956 | |||||||||
| $ | 9,317,140 | $ | 31,167,956 | $ | 40,485,096 | |||||||
| * | Capital loss carryforward as of the date listed above is reduced for limitations, if any, to the extent required by the Internal Revenue Code and may be further limited depending upon a variety of factors, including the realization of net unrealized gains or losses as of the date of any reorganization. |
NOTE 8—Investment Transactions
The aggregate amount of investment securities (other than short-term securities, U.S. Treasury obligations and money market funds, if any) purchased and sold by the Fund during the year ended December 31, 2017 was $41,009,286 and $51,326,798, respectively. Cost of investments, including any derivatives, on a tax basis includes the adjustments for financial reporting purposes as of the most recently completed federal income tax reporting period-end.
| Unrealized Appreciation (Depreciation) of Investments on a Tax Basis | ||||
Aggregate unrealized appreciation of investments | $ | 21,810,422 | ||
Aggregate unrealized (depreciation) of investments | (151,918 | ) | ||
Net unrealized appreciation of investments | $ | 21,658,504 | ||
Cost of investments for tax purposes is $138,697,577.
NOTE 9—Reclassification of Permanent Differences
Primarily as a result of differing book/tax treatment of capital loss carryforward and capital gain distributions, on December 31, 2017, undistributed net investment income was increased by $505,974, undistributed net realized gain (loss) was increased by $22,777,314 and shares of beneficial interest was decreased by $23,283,288. This reclassification had no effect on the net assets of the Fund.
18 Invesco International Allocation Fund
NOTE 10—Share Information
| Summary of Share Activity | ||||||||||||||||
| Years ended December 31, | ||||||||||||||||
| 2017(a) | 2016 | |||||||||||||||
| Shares | Amount | Shares | Amount | |||||||||||||
Sold: | ||||||||||||||||
Class A | 1,185,449 | $ | 13,458,629 | 1,381,909 | $ | 13,328,295 | ||||||||||
Class B | 6,219 | 72,137 | 8,550 | 81,414 | ||||||||||||
Class C | 353,728 | 4,044,085 | 285,095 | 2,770,800 | ||||||||||||
Class R | 144,930 | 1,694,381 | 92,667 | 907,099 | ||||||||||||
Class Y | 1,547,234 | 16,760,085 | 491,952 | 4,883,477 | ||||||||||||
Class R5 | 99,361 | 1,138,487 | 102,752 | 998,236 | ||||||||||||
Class R6(b) | 1,001 | 10,803 | — | — | ||||||||||||
Issued as reinvestment of dividends: | ||||||||||||||||
Class A | 165,634 | 1,989,251 | 138,116 | 1,367,350 | ||||||||||||
Class B | 698 | 8,403 | 758 | 7,531 | ||||||||||||
Class C | 24,530 | 295,346 | 12,320 | 122,342 | ||||||||||||
Class R | 6,849 | 82,330 | 5,295 | 52,478 | ||||||||||||
Class Y | 34,293 | 410,140 | 9,386 | 92,541 | ||||||||||||
Class R5 | 15,806 | 189,519 | 11,664 | 115,355 | ||||||||||||
Class R6 | 2 | 21 | — | — | ||||||||||||
Automatic conversion of Class B shares to Class A shares: | ||||||||||||||||
Class A | 55,286 | 626,761 | 99,610 | 964,895 | ||||||||||||
Class B | (55,359 | ) | (626,761 | ) | (99,742 | ) | (964,895 | ) | ||||||||
Reacquired: | ||||||||||||||||
Class A | (3,113,046 | ) | (34,479,108 | ) | (2,924,424 | ) | (28,481,520 | ) | ||||||||
Class B | (15,685 | ) | (174,848 | ) | (38,417 | ) | (362,195 | ) | ||||||||
Class C | (583,088 | ) | (6,539,798 | ) | (582,816 | ) | (5,656,016 | ) | ||||||||
Class R | (197,702 | ) | (2,228,038 | ) | (195,263 | ) | (1,921,943 | ) | ||||||||
Class Y | (709,464 | ) | (7,912,686 | ) | (585,036 | ) | (5,779,308 | ) | ||||||||
Class R5 | (73,793 | ) | (839,609 | ) | (111,389 | ) | (1,075,552 | ) | ||||||||
Net increase (decrease) in share activity | (1,107,117 | ) | $ | (12,020,470 | ) | (1,897,013 | ) | $ | (18,549,616 | ) | ||||||
| (a) | There are entities that are record owners of more than 5% of the outstanding shares of the Fund and in the aggregate own 38% of the outstanding shares of the Fund. IDI has an agreement with these entities to sell Fund shares. The Fund, Invesco and/or Invesco affiliates may make payments to these entities, which are considered to be related to the Fund, for providing services to the Fund, Invesco and/or Invesco affiliates including but not limited to services such as securities brokerage, distribution, third party record keeping and account servicing. The Fund has no knowledge as to whether all or any portion of the shares owned of record by these entities are also owned beneficially. |
| (b) | Commencement date of April 4, 2017. |
19 Invesco International Allocation Fund
NOTE 11—Financial Highlights
The following schedule presents financial highlights for a share of the Fund outstanding throughout the periods indicated.
| Net asset value, beginning of period | Net investment income(a) | Net gains (losses) on securities (both realized and unrealized) | Total from investment operations | Dividends from net investment income | Net asset value, end of period | Total return(b) | Net assets, end of period (000’s omitted) | Ratio of expenses to average net assets with fee waivers and/or expenses absorbed(c) | Ratio of expenses to average net assets without fee waivers and/or expenses absorbed | Ratio of net investment income to average net assets | Portfolio turnover(d) | |||||||||||||||||||||||||||||||||||||
Class A | ||||||||||||||||||||||||||||||||||||||||||||||||
Year ended 12/31/17 | $ | 9.97 | $ | 0.18 | $ | 2.30 | $ | 2.48 | $ | (0.24 | ) | $ | 12.21 | 24.94 | % | $ | 102,479 | 0.72 | %(e) | 0.72 | %(e) | 1.61 | %(e) | 27 | % | |||||||||||||||||||||||
Year ended 12/31/16 | 9.54 | 0.15 | 0.42 | 0.57 | (0.14 | ) | 9.97 | 6.03 | 100,698 | 0.70 | 0.70 | 1.56 | 47 | |||||||||||||||||||||||||||||||||||
Year ended 12/31/15 | 10.69 | 0.15 | (1.16 | ) | (1.01 | ) | (0.14 | ) | 9.54 | (9.48 | ) | 108,787 | 0.66 | 0.66 | 1.37 | 9 | ||||||||||||||||||||||||||||||||
Year ended 12/31/14 | 11.07 | 0.16 | (0.36 | ) | (0.20 | ) | (0.18 | ) | 10.69 | (1.78 | ) | 128,452 | 0.63 | 0.63 | 1.46 | 12 | ||||||||||||||||||||||||||||||||
Year ended 12/31/13 | 9.94 | 0.14 | 1.15 | 1.29 | (0.16 | ) | 11.07 | 13.02 | 136,055 | 0.64 | 0.64 | 1.36 | 8 | |||||||||||||||||||||||||||||||||||
Class B | ||||||||||||||||||||||||||||||||||||||||||||||||
Year ended 12/31/17 | 9.99 | 0.10 | 2.30 | 2.40 | (0.15 | ) | 12.24 | 24.08 | 640 | 1.47 | (e) | 1.47 | (e) | 0.86 | (e) | 27 | ||||||||||||||||||||||||||||||||
Year ended 12/31/16 | 9.56 | 0.08 | 0.42 | 0.50 | (0.07 | ) | 9.99 | 5.18 | 1,163 | 1.45 | 1.45 | 0.81 | 47 | |||||||||||||||||||||||||||||||||||
Year ended 12/31/15 | 10.69 | 0.07 | (1.15 | ) | (1.08 | ) | (0.05 | ) | 9.56 | (10.08 | ) | 2,343 | 1.41 | 1.41 | 0.62 | 9 | ||||||||||||||||||||||||||||||||
Year ended 12/31/14 | 11.06 | 0.08 | (0.36 | ) | (0.28 | ) | (0.09 | ) | 10.69 | (2.52 | ) | 5,276 | 1.38 | 1.38 | 0.71 | 12 | ||||||||||||||||||||||||||||||||
Year ended 12/31/13 | 9.94 | 0.06 | 1.14 | 1.20 | (0.08 | ) | 11.06 | 12.09 | 8,974 | 1.39 | 1.39 | 0.61 | 8 | |||||||||||||||||||||||||||||||||||
Class C | ||||||||||||||||||||||||||||||||||||||||||||||||
Year ended 12/31/17 | 9.99 | 0.10 | 2.29 | 2.39 | (0.15 | ) | 12.23 | 23.98 | 24,297 | 1.47 | (e) | 1.47 | (e) | 0.86 | (e) | 27 | ||||||||||||||||||||||||||||||||
Year ended 12/31/16 | 9.55 | 0.08 | 0.43 | 0.51 | (0.07 | ) | 9.99 | 5.29 | 21,890 | 1.45 | 1.45 | 0.81 | 47 | |||||||||||||||||||||||||||||||||||
Year ended 12/31/15 | 10.69 | 0.07 | (1.16 | ) | (1.09 | ) | (0.05 | ) | 9.55 | (10.18 | ) | 23,659 | 1.41 | 1.41 | 0.62 | 9 | ||||||||||||||||||||||||||||||||
Year ended 12/31/14 | 11.06 | 0.08 | (0.36 | ) | (0.28 | ) | (0.09 | ) | 10.69 | (2.52 | ) | 27,874 | 1.38 | 1.38 | 0.71 | 12 | ||||||||||||||||||||||||||||||||
Year ended 12/31/13 | 9.94 | 0.06 | 1.14 | 1.20 | (0.08 | ) | 11.06 | 12.09 | 30,241 | 1.39 | 1.39 | 0.61 | 8 | |||||||||||||||||||||||||||||||||||
Class R | ||||||||||||||||||||||||||||||||||||||||||||||||
Year ended 12/31/17 | 9.98 | 0.15 | 2.30 | 2.45 | (0.21 | ) | 12.22 | 24.61 | 4,779 | 0.97 | (e) | 0.97 | (e) | 1.36 | (e) | 27 | ||||||||||||||||||||||||||||||||
Year ended 12/31/16 | 9.55 | 0.13 | 0.42 | 0.55 | (0.12 | ) | 9.98 | 5.75 | 4,361 | 0.95 | 0.95 | 1.31 | 47 | |||||||||||||||||||||||||||||||||||
Year ended 12/31/15 | 10.69 | 0.12 | (1.15 | ) | (1.03 | ) | (0.11 | ) | 9.55 | (9.65 | ) | 5,100 | 0.91 | 0.91 | 1.12 | 9 | ||||||||||||||||||||||||||||||||
Year ended 12/31/14 | 11.07 | 0.14 | (0.37 | ) | (0.23 | ) | (0.15 | ) | 10.69 | (2.05 | ) | 6,260 | 0.88 | 0.88 | 1.21 | 12 | ||||||||||||||||||||||||||||||||
Year ended 12/31/13 | 9.94 | 0.12 | 1.14 | 1.26 | (0.13 | ) | 11.07 | 12.74 | 6,412 | 0.89 | 0.89 | 1.11 | 8 | |||||||||||||||||||||||||||||||||||
Class Y | ||||||||||||||||||||||||||||||||||||||||||||||||
Year ended 12/31/17 | 9.93 | 0.21 | 2.29 | 2.50 | (0.27 | ) | 12.16 | 25.25 | 19,040 | 0.47 | (e) | 0.47 | (e) | 1.86 | (e) | 27 | ||||||||||||||||||||||||||||||||
Year ended 12/31/16 | 9.50 | 0.18 | 0.42 | 0.60 | (0.17 | ) | 9.93 | 6.34 | 6,889 | 0.45 | 0.45 | 1.81 | 47 | |||||||||||||||||||||||||||||||||||
Year ended 12/31/15 | 10.65 | 0.17 | (1.15 | ) | (0.98 | ) | (0.17 | ) | 9.50 | (9.25 | ) | 7,388 | 0.41 | 0.41 | 1.62 | 9 | ||||||||||||||||||||||||||||||||
Year ended 12/31/14 | 11.03 | 0.19 | (0.36 | ) | (0.17 | ) | (0.21 | ) | 10.65 | (1.52 | ) | 7,345 | 0.38 | 0.38 | 1.71 | 12 | ||||||||||||||||||||||||||||||||
Year ended 12/31/13 | 9.91 | 0.17 | 1.13 | 1.30 | (0.18 | ) | 11.03 | 13.23 | 7,959 | 0.39 | 0.39 | 1.61 | 8 | |||||||||||||||||||||||||||||||||||
Class R5 | ||||||||||||||||||||||||||||||||||||||||||||||||
Year ended 12/31/17 | 9.96 | 0.23 | 2.29 | 2.52 | (0.29 | ) | 12.19 | 25.38 | 8,112 | 0.30 | (e) | 0.30 | (e) | 2.03 | (e) | 27 | ||||||||||||||||||||||||||||||||
Year ended 12/31/16 | 9.53 | 0.20 | 0.42 | 0.62 | (0.19 | ) | 9.96 | 6.52 | 6,212 | 0.26 | 0.26 | 2.00 | 47 | |||||||||||||||||||||||||||||||||||
Year ended 12/31/15 | 10.68 | 0.19 | (1.15 | ) | (0.96 | ) | (0.19 | ) | 9.53 | (9.04 | ) | 5,915 | 0.24 | 0.24 | 1.79 | 9 | ||||||||||||||||||||||||||||||||
Year ended 12/31/14 | 11.07 | 0.23 | (0.38 | ) | (0.15 | ) | (0.24 | ) | 10.68 | (1.35 | ) | 42 | 0.17 | 0.17 | 1.92 | 12 | ||||||||||||||||||||||||||||||||
Year ended 12/31/13 | 9.94 | 0.19 | 1.15 | 1.34 | (0.21 | ) | 11.07 | 13.52 | 1,188 | 0.18 | 0.18 | 1.82 | 8 | |||||||||||||||||||||||||||||||||||
Class R6 | ||||||||||||||||||||||||||||||||||||||||||||||||
Year ended 12/31/17(f) | 10.74 | 0.19 | 1.56 | 1.75 | (0.30 | ) | 12.19 | 16.38 | 12 | 0.21 | (e)(g) | 0.21 | (e)(g) | 2.12 | (e)(g) | 27 | ||||||||||||||||||||||||||||||||
| (a) | Calculated using average shares outstanding. |
| (b) | Includes adjustments in accordance with accounting principles generally accepted in the United States of America and as such, the net asset value for financial reporting purposes and the returns based upon those net asset values may differ from the net asset value and returns for shareholder transactions. Does not include sales charges and is not annualized for periods less than one year, if applicable. |
| (c) | In addition to the fees and expenses which the Fund bears directly, the Fund indirectly bears a pro rata share of the fees and expenses of the underlying funds in which the Fund invests. Because the underlying funds have varied expenses and fee levels and the Fund may own different proportions at different times, the amount of fees and expenses incurred indirectly by the Fund will vary. Estimated underlying fund expenses are not expenses that are incurred directly by the Fund. They are expenses that are incurred directly by the underlying funds and are deducted from the value of the funds the Fund invests in. The effect of the estimated underlying fund expenses that the Fund bears indirectly is included in the Fund’s total return. Estimated acquired fund fees from underlying funds were 0.73%, 0.77%, 0.81%, 0.88% and 0.88% for the years ended December 31, 2017, 2016, 2015, 2014 and 2013 respectively. |
| (d) | Portfolio turnover is calculated at the fund level and is not annualized for periods less than one year, if applicable. |
| (e) | Ratios are based on average daily net assets (000’s omitted) of $99,799, $917, $22,923, $4,357, $15,716, $7,207 and $11 for Class A, Class B, Class C, Class R, Class Y, Class R5 and Class R6 shares, respectively. |
| (f) | Commencement date of April 4, 2017. |
| (g) | Annualized. |
20 Invesco International Allocation Fund
Report of Independent Registered Public Accounting Firm
To the Board of Trustees of AIM Growth Series (Invesco Growth Series)
and Shareholders of Invesco International Allocation Fund
Opinion on the Financial Statements
We have audited the accompanying statement of assets and liabilities, including the schedule of investments, of Invesco International Allocation Fund (one of the funds constituting AIM Growth Series (Invesco Growth Series), hereafter referred to as the “Fund”) as of December 31, 2017, the related statement of operations for the year ended December 31, 2017, the statement of changes in net assets for each of the two years in the period ended December 31, 2017, including the related notes, and the financial highlights for each of the periods indicated therein (collectively referred to as the “financial statements”). In our opinion, the financial statements present fairly, in all material respects, the financial position of the Fund as of December 31, 2017, the results of its operations for the year then ended, the changes in its net assets for each of the two years in the period ended December 31, 2017 and the financial highlights for each of the periods indicated therein in conformity with accounting principles generally accepted in the United States of America.
Basis for Opinion
These financial statements are the responsibility of the Fund’s management. Our responsibility is to express an opinion on the Fund’s financial statements based on our audits. We are a public accounting firm registered with the Public Company Accounting Oversight Board (United States) (“PCAOB”) and are required to be independent with respect to the Fund in accordance with the U.S. federal securities laws and the applicable rules and regulations of the Securities and Exchange Commission and the PCAOB.
We conducted our audits of these financial statements in accordance with the standards of the PCAOB. Those standards require that we plan and perform the audit to obtain reasonable assurance about whether the financial statements are free of material misstatement, whether due to error or fraud.
Our audits included performing procedures to assess the risks of material misstatement of the financial statements, whether due to error or fraud, and performing procedures that respond to those risks. Such procedures included examining, on a test basis, evidence regarding the amounts and disclosures in the financial statements. Our audits also included evaluating the accounting principles used and significant estimates made by management, as well as evaluating the overall presentation of the financial statements. Our procedures included confirmation of securities owned as of December 31, 2017 by correspondence with the custodian, transfer agent and brokers; when replies were not received from brokers, we performed other auditing procedures. We believe that our audits provide a reasonable basis for our opinion.
PricewaterhouseCoopers LLP
Houston, TX
February 23, 2018
We have served as the auditor of one or more of the investment companies in the Invesco/PowerShares group of investment companies since at least 1995. We have not determined the specific year we began serving as auditor.
21 Invesco International Allocation Fund
Calculating your ongoing Fund expenses
Example
As a shareholder of the Fund, you incur two types of costs: (1) transaction costs, which may include sales charges (loads) on purchase payments or contingent deferred sales charges on redemptions, if any; and (2) ongoing costs, including distribution and/or service (12b-1) fees, and other Fund expenses. This example is intended to help you understand your ongoing costs (in dollars) of investing in the Fund and to compare these costs with ongoing costs of investing in other mutual funds. The example is based on an investment of $1,000 invested at the beginning of the period and held for the entire period July 1, 2017, through December 31, 2017.
In addition to the fees and expenses which the Fund bears directly, the Fund indirectly bears a pro rata share of the fees and expenses of the underlying funds in which the Fund invests. The amount of fees and expenses incurred indirectly by the Fund will vary because the underlying funds have varied expenses and fee levels and the Fund may own different proportions of the underlying funds at different times. Estimated underlying fund expenses are not expenses that are incurred directly by the Fund. They are expenses that are incurred directly by the underlying funds and are deducted from the value of the underlying funds the Fund invests in. The effect of the estimated underlying fund expenses that the Fund bears indirectly are included in the Fund’s total return.
Actual expenses
The table below provides information about actual account values and actual expenses. You may use the information in this table, together with the amount you invested, to estimate the expenses that you paid over the period. Simply divide your account value by $1,000 (for example, an $8,600 account value divided by $1,000 = 8.6), then multiply the result by the number in the table under the heading entitled “Actual Expenses Paid During Period” to estimate the expenses you paid on your account during this period.
Hypothetical example for comparison purposes
The table below also provides information about hypothetical account values and hypothetical expenses based on the Fund’s actual expense ratio and an assumed rate of return of 5% per year before expenses, which is not the Fund’s actual return.
The hypothetical account values and expenses may not be used to estimate the actual ending account balance or expenses you paid for the period. You may use this information to compare the ongoing costs of investing in the Fund and other funds. To do so, compare this 5% hypothetical example with the 5% hypothetical examples that appear in the shareholder reports of the other funds.
Please note that the expenses shown in the table are meant to highlight your ongoing costs only and do not reflect any transaction costs, such as sales charges (loads) on purchase payments or contingent deferred sales charges on redemptions, if any. Therefore, the hypothetical information is useful in comparing ongoing costs only, and will not help you determine the relative total costs of owning different funds. In addition, expenses shown in the table do not include the expenses of the underlying funds, which are borne indirectly by the Fund. If transaction costs and indirect expenses were included, your costs would have been higher.
Class | Beginning | ACTUAL | HYPOTHETICAL (5% annual return before expenses) | Annualized Ratio | ||||||||||||||||||||
| Ending Account Value (12/31/17)1 | Expenses Paid During Period2 | Ending Account Value (12/31/17) | Expenses Paid During Period2 | |||||||||||||||||||||
| A | $ | 1,000.00 | $ | 1,098.50 | $ | 3.65 | $ | 1,021.73 | $ | 3.52 | 0.69 | % | ||||||||||||
| B | 1,000.00 | 1,094.20 | 7.60 | 1,017.95 | 7.32 | 1.44 | ||||||||||||||||||
| C | 1,000.00 | 1,094.20 | 7.60 | 1,017.95 | 7.32 | 1.44 | ||||||||||||||||||
| R | 1,000.00 | 1,097.70 | 4.97 | 1,020.47 | 4.79 | 0.94 | ||||||||||||||||||
| Y | 1,000.00 | 1,100.70 | 2.33 | 1,022.99 | 2.24 | 0.44 | ||||||||||||||||||
| R5 | 1,000.00 | 1,101.20 | 1.48 | 1,023.79 | 1.43 | 0.28 | ||||||||||||||||||
| R6 | 1,000.00 | 1,101.30 | 1.01 | 1,024.25 | 0.97 | 0.19 | ||||||||||||||||||
| 1 | The actual ending account value is based on the actual total return of the Fund for the period July 1, 2017 through December 31, 2017, after actual expenses and will differ from the hypothetical ending account value which is based on the Fund’s expense ratio and a hypothetical annual return of 5% before expenses. |
| 2 | Expenses are equal to the Fund’s annualized expense ratio as indicated above multiplied by the average account value over the period, multiplied by 184/365 to reflect the most recent fiscal half year. |
22 Invesco International Allocation Fund
Tax Information
Form 1099-DIV, Form 1042-S and other year–end tax information provide shareholders with actual calendar year amounts that should be included in their tax returns. Shareholders should consult their tax advisors.
The following distribution information is being provided as required by the Internal Revenue Code or to meet a specific state’s requirement.
The Fund designates the following amounts or, if subsequently determined to be different, the maximum amount allowable for its fiscal year ended December 31, 2017:
Federal and State Income Tax | ||||
Qualified Dividend Income* | 100% | |||
Corporate Dividends Received Deduction* | 0% | |||
U.S. Treasury Obligations* | 0.02% | |||
| * | The above percentages are based on ordinary income dividends paid to shareholders during the Fund’s fiscal year. |
23 Invesco International Allocation Fund
Trustees and Officers
The address of each trustee and officer is AIM Growth Series (Invesco Growth Series) (the “Trust”), 11 Greenway Plaza, Suite 1000, Houston, Texas 77046-1173. The trustees serve for the life of the Trust, subject to their earlier death, incapacitation, resignation, retirement or removal as more specifically provided in the Trust’s organizational documents. Each officer serves for a one year term or until their successors are elected and qualified. Column two below includes length of time served with predecessor entities, if any.
Name, Year of Birth and Position(s) Held with the Trust | Trustee and/ or Officer Since | Principal Occupation(s) During Past 5 Years | Number of Funds in Fund Complex Overseen by Trustee | Other Directorship(s) Held by Trustee During Past 5 Years | ||||
| Interested Persons | ||||||||
| Martin L. Flanagan1 — 1960 Trustee | 2007 | Executive Director, Chief Executive Officer and President, Invesco Ltd. (ultimate parent of Invesco and a global investment management firm); Trustee, The Invesco Funds; Vice Chair, Investment Company Institute; and Member of Executive Board, SMU Cox School of Business
Formerly: Advisor to the Board, Invesco Advisers, Inc. (formerly known as Invesco Institutional (N.A.), Inc.); Chairman and Chief Executive Officer, Invesco Advisers, Inc. (registered investment adviser); Director, Chairman, Chief Executive Officer and President, Invesco Holding Company (US), Inc. (formerly IVZ Inc.) (holding company), Invesco Group Services, Inc. (service provider) and Invesco North American Holdings, Inc. (holding company); Director, Chief Executive Officer and President, Invesco Holding Company Limited (parent of Invesco and a global investment management firm); Director, Invesco Ltd.; Chairman, Investment Company Institute and President, Co-Chief Executive Officer, Co-President, Chief Operating Officer and Chief Financial Officer, Franklin Resources, Inc. (global investment management organization) | 158 | None | ||||
| Philip A. Taylor2 — 1954 Trustee and Senior Vice President | 2006 | Head of the Americas and Senior Managing Director, Invesco Ltd.; Director, Invesco Advisers, Inc. (formerly known as Invesco Institutional (N.A.), Inc.) (registered investment adviser); Director, Chairman, Chief Executive Officer and President, Invesco Management Group, Inc. (formerly known as Invesco Aim Management Group, Inc.) (financial services holding company); Director and Chairman, Invesco Investment Services, Inc. (formerly known as Invesco Aim Investment Services, Inc.) (registered transfer agent); Chief Executive Officer, Invesco Corporate Class Inc. (corporate mutual fund company); Director, Chairman and Chief Executive Officer, Invesco Canada Ltd. (formerly known as Invesco Trimark Ltd./Invesco Trimark Ltèe) (registered investment adviser and registered transfer agent); Trustee and Senior Vice President, The Invesco Funds; Director, Invesco Investment Advisers LLC (formerly known as Van Kampen Asset Management).
Formerly: Co-Chairman, Co-President and Co-Chief Executive Officer, Invesco Advisers, Inc. (formerly known as Invesco Institutional (N.A.), Inc.) (registered investment adviser); Director, Chief Executive Officer and President, Van Kampen Exchange Corp; President and Principal Executive Officer, The Invesco Funds (other than AIM Treasurer’s Series Trust (Invesco Treasurer’s Series Trust), Short-Term Investments Trust and Invesco Management Trust); Executive Vice President, The Invesco Funds (AIM Treasurer’s Series Trust (Invesco Treasurer’s Series Trust), Short-Term Investments Trust and Invesco Management Trust only); Director and President, INVESCO Funds Group, Inc. (registered investment adviser and registered transfer agent); Director and Chairman, IVZ Distributors, Inc. (formerly known as INVESCO Distributors, Inc.) (registered broker dealer); Director, President and Chairman, Invesco Inc. (holding company), Invesco Canada Holdings Inc. (holding company), Trimark Investments Ltd./Placements Trimark Ltèe and Invesco Financial Services Ltd/Services Financiers Invesco Ltèe; Chief Executive Officer, Invesco Canada Fund Inc. (corporate mutual fund company); Director and Chairman, Van Kampen Investor Services Inc.; Director, Chief Executive Officer and President, 1371 Preferred Inc. (holding company) and Van Kampen Investments Inc.; Director and President, AIM GP Canada Inc. (general partner for limited partnerships) and Van Kampen Advisors, Inc.; Director and Chief Executive Officer, Invesco Trimark Dealer Inc. (registered broker dealer); Director, Invesco Distributors, Inc. (formerly known as Invesco Aim Distributors, Inc.) (registered broker dealer); Manager, Invesco PowerShares Capital Management LLC; Director, Chief Executive Officer and President, Invesco Advisers, Inc.; Director, Chairman, Chief Executive Officer and President, Invesco Aim Capital Management, Inc.; President, Invesco Trimark Dealer Inc. and Invesco Trimark Ltd./Invesco Trimark Ltèe; Director and President, AIM Trimark Corporate Class Inc. and AIM Trimark Canada Fund Inc.; Senior Managing Director, Invesco Holding Company Limited; Director and Chairman, Fund Management Company (former registered broker dealer); President and Principal Executive Officer, The Invesco Funds (AIM Treasurer’s Series Trust (Invesco Treasurer’s Series Trust), and Short-Term Investments Trust only); President, AIM Trimark Global Fund Inc. and AIM Trimark Canada Fund Inc. | 158 | None |
| 1 | Mr. Flanagan is considered an interested person (within the meaning of Section 2(a)(19) of the 1940 Act) of the Trust because he is an officer of the Adviser to the Trust, and an officer and a director of Invesco Ltd., ultimate parent of the Adviser. |
| 2 | Mr. Taylor is considered an interested person (within the meaning of Section 2(a)(19) of the 1940 Act) of the Trust because he is an officer and a director of the Adviser. |
T-1 Invesco International Allocation Fund
Trustees and Officers—(continued)
Name, Year of Birth and Position(s) Held with the Trust | Trustee and/ or Officer Since | Principal Occupation(s) During Past 5 Years | Number of Funds in Fund Complex Overseen by Trustee | Other Directorship(s) Past 5 Years | ||||
| Independent Trustees | ||||||||
Bruce L. Crockett — 1944 Trustee and Chair | 2001 | Chairman, Crockett Technologies Associates (technology consulting company)
Formerly: Director, Captaris (unified messaging provider); Director, President and Chief Executive Officer, COMSAT Corporation; Chairman, Board of Governors of INTELSAT (international communications company); ACE Limited (insurance company); Independent Directors Council and Investment Company Institute: Member of the Audit Committee, Investment Company Institute; Member of the Executive Committee and Chair of the Governance Committee, Independent Directors Council | 158 | Director and Chairman of the Audit Committee, ALPS (Attorneys Liability Protection Society) (insurance company); Director and Member of the Audit Committee and Compensation Committee, Ferroglobe PLC (metallurgical company) | ||||
David C. Arch — 1945 Trustee | 2010 | Chairman of Blistex Inc. (consumer health care products manufacturer); Member, World Presidents’ Organization | 158 | Board member of the Illinois Manufacturers’ Association | ||||
Jack M. Fields — 1952 Trustee | 2001 | Chief Executive Officer, Twenty First Century Group, Inc. (government affairs company); and Chairman, Discovery Learning Alliance (non-profit)
Formerly: Owner and Chief Executive Officer, Dos Angeles Ranch L.P. (cattle, hunting, corporate entertainment); Director, Insperity, Inc. (formerly known as Administaff) (human resources provider); Chief Executive Officer, Texana Timber LP (sustainable forestry company); Director of Cross Timbers Quail Research Ranch (non-profit); and member of the U.S. House of Representatives | 158 | None | ||||
Cynthia Hostetler — 1962 Trustee | 2017 | Non-Executive Director and Trustee of a number of public and private business corporations
Formerly: Head of Investment Funds and Private Equity, Overseas Private Investment Corporation; President, First Manhattan Bancorporation, Inc.; Attorney, Simpson Thacher & Bartlett LLP | 158 | Vulcan Materials Company (construction materials company); Trilinc Global Impact Fund; Aberdeen Investment Funds (4 portfolios); Artio Global Investment LLC (mutual fund complex); Edgen Group, Inc. (specialized energy and infrastructure products distributor) | ||||
Eli Jones — 1961 Trustee | 2016 | Professor and Dean, Mays Business School — Texas A&M University
Formerly: Professor and Dean, Walton College of Business, University of Arkansas and E.J. Ourso College of Business, Louisiana State University; Director, Arvest Bank | 158 | Insperity, Inc. (formerly known as Administaff) (human resources provider) | ||||
Prema Mathai-Davis — 1950 Trustee | 2001 | Retired. | 158 | None | ||||
Teresa M. Ressel — 1962 Trustee | 2017 | Non-executive director and trustee of a number of public and private business corporations
Formerly: Chief Financial Officer, Olayan America, The Olayan Group (international investor/commercial/industrial); Chief Executive Officer, UBS Securities LLC; Group Chief Operating Officer, Americas, UBS AG; Assistant Secretary for Management & Budget and CFO, US Department of the Treasury | 158 | Atlantic Power Corporation (power generation company); ON Semiconductor Corp. (semiconductor supplier) | ||||
Ann Barnett Stern — 1957 Trustee | 2017 | President and Chief Executive Officer, Houston Endowment Inc. (private philanthropic institution)
Formerly: Executive Vice President and General Counsel, Texas Children’s Hospital; Attorney, Beck, Redden and Secrest, LLP; Business Law Instructor, University of St. Thomas; Attorney, Andrews & Kurth LLP | 158 | Federal Reserve Bank of Dallas | ||||
Raymond Stickel, Jr. — 1944 Trustee | 2005 | Retired.
Formerly: Director, Mainstay VP Series Funds, Inc. (25 portfolios); Partner, Deloitte & Touche | 158 | None | ||||
Robert C. Troccoli — 1949 Trustee | 2016 | Adjunct Professor, University of Denver — Daniels College of Business
Formerly: Senior Partner, KPMG LLP | 158 | None | ||||
Christopher L. Wilson — 1957 Trustee | 2017 | Non-executive director and trustee of a number of public and private business corporations
Formerly: Managing Partner, CT2, LLC (investing and consulting firm); President/Chief Executive Officer, Columbia Funds, Bank of America Corporation; President/Chief Executive Officer, CDC IXIS Asset Management Services, Inc.; Principal & Director of Operations, Scudder Funds, Scudder, Stevens & Clark, Inc.; Assistant Vice President, Fidelity Investments | 158 | TD Asset Management USA Inc. (mutual fund complex) (22 portfolios); ISO New England, Inc. (non-profit organization managing regional electricity market) |
T-2 Invesco International Allocation Fund
Trustees and Officers—(continued)
Name, Year of Birth and Position(s) Held with the Trust | Trustee and/ or Officer Since | Principal Occupation(s) During Past 5 Years | Number of Funds in Fund Complex Overseen by Trustee | Other Directorship(s) Past 5 Years | ||||
| Other Officers | ||||||||
Sheri Morris — 1964 President, Principal Executive Officer and Treasurer | 1999 | President, Principal Executive Officer and Treasurer, The Invesco Funds; Vice President, Invesco Advisers, Inc. (formerly known as Invesco Institutional (N.A.), Inc.) (registered investment adviser); and Vice President, PowerShares Exchange-Traded Fund Trust, PowerShares Exchange-Traded Fund Trust II, PowerShares India Exchange-Traded Fund Trust, PowerShares Actively Managed Exchange-Traded Fund Trust, PowerShares Actively Managed Exchange-Traded Commodity Fund Trust and PowerShares Exchange-Traded Self-Indexed Fund Trust
Formerly: Vice President and Principal Financial Officer, The Invesco Funds; Vice President, Invesco Aim Advisers, Inc., Invesco Aim Capital Management, Inc. and Invesco Aim Private Asset Management, Inc.; Assistant Vice President and Assistant Treasurer, The Invesco Funds and Assistant Vice President, Invesco Advisers, Inc., Invesco Aim Capital Management, Inc. and Invesco Aim Private Asset Management, Inc.; and Treasurer, PowerShares Exchange-Traded Fund Trust, PowerShares Exchange-Traded Fund Trust II, PowerShares India Exchange-Traded Fund Trust and PowerShares Actively Managed Exchange-Traded Fund Trust | N/A | N/A | ||||
Russell C. Burk — 1958 Senior Vice President and Senior Officer | 2005 | Senior Vice President and Senior Officer, The Invesco Funds | N/A | N/A | ||||
John M. Zerr — 1962 Senior Vice President, Chief Legal Officer and Secretary | 2006 | Director, Senior Vice President, Secretary and General Counsel, Invesco Management Group, Inc. (formerly known as Invesco AIM Management Group, Inc.); Senior Vice President, Invesco Advisers, Inc. (formerly known as Invesco Institutional (N.A.), Inc.) (registered investment adviser); Senior Vice President and Secretary, Invesco Distributors, Inc. (formerly known as Invesco AIM Distributors, Inc.); Director, Vice President and Secretary, Invesco Investment Services, Inc. (formerly known as Invesco AIM Investment Services, Inc.) Senior Vice President, Chief Legal Officer and Secretary, The Invesco Funds; Managing Director, Invesco PowerShares Capital Management LLC; Director, Secretary and General Counsel, Invesco Investment Advisers LLC (formerly known as Van Kampen Asset Management); Secretary and General Counsel, Invesco Capital Markets, Inc. (formerly known as Van Kampen Funds Inc.) and Chief Legal Officer, PowerShares Exchange-Traded Fund Trust, PowerShares Exchange-Traded Fund Trust II, PowerShares India Exchange-Traded Fund Trust, PowerShares Actively Managed Exchange-Traded Fund Trust, PowerShares Actively Managed Exchange-Traded Commodity Fund Trust and PowerShares Exchange-Traded Self-Indexed Fund Trust; Manager and Secretary, Invesco Indexing LLC
Formerly: Director, Secretary, General Counsel and Senior Vice President, Van Kampen Exchange Corp.; Director, Vice President and Secretary, IVZ Distributors, Inc. (formerly known as INVESCO Distributors, Inc.); Director and Vice President, INVESCO Funds Group, Inc.; Director and Vice President, Van Kampen Advisors Inc.; Director, Vice President, Secretary and General Counsel, Van Kampen Investor Services Inc.; Director, Invesco Distributors, Inc. (formerly known as Invesco AIM Distributors, Inc.); Director, Senior Vice President, General Counsel and Secretary, Invesco AIM Advisers, Inc. and Van Kampen Investments Inc.; Director, Vice President and Secretary, Fund Management Company; Director, Senior Vice President, Secretary, General Counsel and Vice President, Invesco AIM Capital Management, Inc.; Chief Operating Officer and General Counsel, Liberty Ridge Capital, Inc. (an investment adviser); Vice President and Secretary, PBHG Funds (an investment company) and PBHG Insurance Series Fund (an investment company); Chief Operating Officer, General Counsel and Secretary, Old Mutual Investment Partners (a broker-dealer); General Counsel and Secretary, Old Mutual Fund Services (an administrator) and Old Mutual Shareholder Services (a shareholder servicing center); Executive Vice President, General Counsel and Secretary, Old Mutual Capital, Inc. (an investment adviser); and Vice President and Secretary, Old Mutual Advisors Funds (an investment company) | N/A | N/A | ||||
Gregory G. McGreevey — 1962 Senior Vice President | 2012 | Senior Managing Director, Invesco Ltd.; Director, Chairman, President, and Chief Executive Officer, Invesco Advisers, Inc. (formerly known as Invesco Institutional (N.A.), Inc.) (registered investment adviser); Senior Vice President, Invesco Management Group, Inc.; Director, Invesco Mortgage Capital, Inc. and Invesco Senior Secured Management, Inc.; and Senior Vice President, The Invesco Funds
Formerly: Assistant Vice President, The Invesco Funds | N/A | N/A | ||||
Kelli Gallegos — 1970 Vice President, Principal Financial Officer and Assistant Treasurer | 2008 | Vice President, Principal Financial Officer and Assistant Treasurer, The Invesco Funds; Assistant Treasurer, Invesco PowerShares Capital Management LLC, PowerShares Exchange-Traded Fund Trust, PowerShares Exchange-Traded Fund Trust II, PowerShares India Exchange-Traded Fund Trust, PowerShares Actively Managed Exchange-Traded Fund Trust, PowerShares Actively Managed Exchange-Traded Commodity Fund Trust and PowerShares Exchange-Traded Self-Indexed Fund Trust
Formerly: Assistant Vice President, The Invesco Funds | N/A | N/A |
T-3 Invesco International Allocation Fund
Trustees and Officers—(continued)
Name, Year of Birth and Position(s) Held with the Trust | Trustee and/ or Officer Since | Principal Occupation(s) During Past 5 Years | Number of Funds in Fund Complex Overseen by Trustee | Other Directorship(s) Past 5 Years | ||||
| Other Officers—(continued) | ||||||||
Tracy Sullivan — 1962 Vice President, Chief Tax Officer and Assistant Treasurer | 2008 | Vice President, Chief Tax Officer and Assistant Treasurer, The Invesco Funds; Assistant Treasurer, Invesco PowerShares Capital Management LLC, PowerShares Exchange-Traded Fund Trust, PowerShares Exchange-Traded Fund Trust II, PowerShares India Exchange-Traded Fund Trust, PowerShares Actively Managed Exchange-Traded Fund Trust,PowerShares Actively Managed Exchange-Traded Commodity Fund Trust and PowerShares Exchange-Traded Self-Indexed Fund Trust
Formerly: Assistant Vice President, The Invesco Funds | N/A | N/A | ||||
Crissie M. Wisdom — 1969 Anti-Money Laundering Compliance Officer | 2013 | Anti-Money Laundering Compliance Officer, Invesco Advisers, Inc. (formerly known as Invesco Institutional (N.A.), Inc.) (registered investment adviser), Invesco Capital Markets, Inc. (formerly known as Van Kampen Funds Inc.), Invesco Distributors, Inc., Invesco Investment Services, Inc., Invesco Management Group, Inc., The Invesco Funds, and PowerShares Exchange-Traded Fund Trust, PowerShares Exchange-Traded Fund Trust II, PowerShares India Exchange-Traded Fund Trust, PowerShares Actively Managed Exchange-Traded Fund Trust,PowerShares Actively Managed Exchange-Traded Commodity Fund Trust and PowerShares Exchange-Traded Self-Indexed Fund Trust; Anti-Money Laundering Compliance Officer and Bank Secrecy Act Officer, INVESCO National Trust Company and Invesco Trust Company; and Fraud Prevention Manager and Controls and Risk Analysis Manager for Invesco Investment Services, Inc.
Formerly: Anti-Money Laundering Compliance Officer, Van Kampen Exchange Corp. | N/A | N/A | ||||
Robert R. Leveille — 1969 Chief Compliance Officer | 2016 | Chief Compliance Officer, Invesco Advisers, Inc. (registered investment adviser); and Chief Compliance Officer, The Invesco Funds
Formerly: Chief Compliance Officer, Putnam Investments and the Putnam Funds | N/A | N/A |
The Statement of Additional Information of the Trust includes additional information about the Fund’s Trustees and is available upon request, without charge, by calling 1.800.959.4246. Please refer to the Fund’s Statement of Additional Information for information on the Fund’s sub-advisers.
Office of the Fund 11 Greenway Plaza, Suite 1000 Houston, TX 77046-1173 | Investment Adviser Invesco Advisers, Inc. 1555 Peachtree Street, N.E. Atlanta, GA 30309 | Distributor Invesco Distributors, Inc. 11 Greenway Plaza, Suite 1000 Houston, TX 77046-1173 | Auditors PricewaterhouseCoopers LLP 1000 Louisiana Street, Suite 5800 Houston, TX 77002-5678 | |||
Counsel to the Fund Stradley Ronon Stevens & Young, LLP 2005 Market Street, Suite 2600 Philadelphia, PA 19103-7018 | Counsel to the Independent Trustees Goodwin Procter LLP 901 New York Avenue, N.W. Washington, D.C. 20001 | Transfer Agent Invesco Investment Services, Inc. 11 Greenway Plaza, Suite 1000 Houston, TX 77046-1173 | Custodian State Street Bank and Trust Company 225 Franklin Street Boston, MA 02110-2801 | |||
T-4 Invesco International Allocation Fund
Explore High-Conviction Investing with Invesco

Go paperless with eDelivery
Visit invesco.com/edelivery to enjoy the convenience and security of anytime electronic access to your investment documents.
With eDelivery, you can elect to have any or all of the following materials delivered straight to your inbox to download, save and print from your own computer:
∎ Fund reports and prospectuses
∎ Quarterly statements
∎ Daily confirmations
∎ Tax forms
Invesco mailing information
Send general correspondence to Invesco Investment Services, Inc., P.O. Box 219078, Kansas City, MO 64121-9078.
Important notice regarding delivery of security holder documents
To reduce Fund expenses, only one copy of most shareholder documents may be mailed to shareholders with multiple accounts at the same address (Householding). Mailing of your shareholder documents may be householded indefinitely unless you instruct us otherwise. If you do not want the mailing of these documents to be combined with those for other members of your household, please contact Invesco Investment Services, Inc. at 800 959 4246 or contact your financial institution. We will begin sending you individual copies for each account within 30 days after receiving your request.
Fund holdings and proxy voting information
The Fund provides a complete list of its holdings four times in each fiscal year, at the quarter ends. For the second and fourth quarters, the lists appear in the Fund’s semiannual and annual reports to shareholders. For the first and third quarters, the Fund files the lists with the Securities and Exchange Commission (SEC) on Form N-Q. The most recent list of portfolio holdings is available at invesco.com/completeqtrholdings. Shareholders can also look up the Fund’s Forms N-Q on the SEC website at sec.gov. Copies of the Fund’s Forms N-Q may be reviewed and copied at the SEC Public Reference Room in Washington, D.C. You can obtain information on the operation of the Public Reference Room, including information about duplicating fee charges, by calling 202 551 8090 or 800 732 0330, or by electronic request at the following email address: publicinfo@sec.gov.
The SEC file numbers for the Fund are shown below.
A description of the policies and procedures that the Fund uses to determine how to vote proxies relating to portfolio securities is available without charge, upon request, from our Client Services department at 800 959 4246 or at invesco.com/proxyguidelines. The information is also available on the SEC website, sec.gov.
Information regarding how the Fund voted proxies related to its portfolio securities during the most recent 12-month period ended June 30 is available at invesco.com/proxysearch. The information is also available on the SEC website, sec.gov. |
| |||
Invesco Advisers, Inc. is an investment adviser; it provides investment advisory services to individual and institutional clients and does not sell securities. Invesco Distributors, Inc. is the US distributor for Invesco Ltd.’s retail mutual funds, exchange-traded funds and institutional money market funds. Both are wholly owned, indirect subsidiaries of Invesco Ltd. |

SEC file numbers: 811-02699 and 002-57526 Invesco Distributors, Inc. INTAL-AR-1 02152018 1508
| ||||
 | Annual Report to Shareholders
| December 31, 2017 | ||
| ||||
Invesco Mid Cap Core Equity Fund
| ||||
| Nasdaq: | ||||
| A: GTAGX ◾ B: GTABX ◾ C: GTACX ◾ R: GTARX ◾ Y: GTAYX ◾ R5: GTAVX ◾ R6: GTAFX | ||||

Letters to Shareholders

Dear Shareholders:
This annual report includes information about your Fund, including performance data and a complete list of its investments as of the close of the reporting period. Inside is a discussion of how your Fund was managed and the factors that affected its performance during the reporting period.
Major stock market indexes rose – and set record highs – throughout the reporting period. Generally positive economic data, strong corporate earnings and anticipated tax and regulatory reform contributed to the rally. The US economy expanded during the reporting period, with gross domestic product, the value of all goods and services produced, significantly increasing its growth rate from the first to the third quarter of the year. Tax reform legislation, enacted in December 2017, was a positive for the stock market, but its long-term economic impact was uncertain. Citing positive economic trends – specifically, realized and expected labor market conditions and inflation – the US Federal Reserve raised interest rates in March, June and December 2017. While US and global bond markets, as well as emerging market equities, sold off early in the reporting period, they recovered much of their losses during the reporting period. Overseas, economic data were mixed, prompting the European Central Bank and central banks in China and Japan, among other countries, to maintain extraordinarily accommodative monetary policies.
Short-term market volatility can prompt some investors to abandon their investment plans – and can cause others to settle for whatever returns the market has to offer. The investment professionals at Invesco, in contrast, invest with high conviction. This means that, no matter the asset class or the strategy, each investment team has a passion to exceed. We want to help investors achieve better outcomes, such as seeking higher returns, helping mitigate risk and generating income. Of course, investing with high conviction can’t guarantee a profit or ensure success; no investment strategy can. To learn more about how we invest with high conviction, visit invesco.com/HighConviction.
You, too, can invest with high conviction by maintaining a long-term investment perspective and by working with your financial adviser on a regular basis. During periods of short-term market volatility or uncertainty, your financial adviser can keep you focused on your long-term investment goals – a new home, a child’s college education or a secure retirement. He or she also can share research about the economy, the markets and individual investment options.
Visit our website for more information on your investments
Our website, invesco.com/us, offers a wide range of market insights and investment perspectives. On the website, you’ll find detailed information about our funds, including performance, holdings and portfolio manager commentaries. You can access information about your account by completing a simple, secure online registration. To do so, select “Log In” on the right side of the homepage, and then select “Register for Individual Account Access.”
In addition to the resources accessible on our website and through our mobile app, you can obtain timely updates to help you stay informed about the markets and the economy by connecting with Invesco on Twitter, LinkedIn or Facebook. You can access our blog at blog.invesco.us.com. Our goal is to provide you the information you want, when and where you want it.
Finally, I’m pleased to share with you Invesco’s commitment to both the Principles for Responsible Investment and to considering environmental, social and governance issues in our robust investment process. I invite you to learn more at invesco.com/esg.
Have questions?
For questions about your account, contact an Invesco client services representative at 800 959 4246. For Invesco-related questions or comments, please email me directly at phil@invesco.com.
All of us at Invesco look forward to serving your investment management needs. Thank you for investing with us.
Sincerely,

Philip Taylor
Senior Managing Director, Invesco Ltd.
| 2 | Invesco Mid Cap Core Equity Fund |
 | Dear Fellow Shareholders: Among the many important lessons I’ve learned in more than 40 years in a variety of business endeavors is the value of a trusted advocate. As independent chair of the Invesco Funds Board, I can assure you that the members of the Board are strong advocates for the interests of investors in Invesco’s mutual funds. We work hard to represent your interests through oversight of the quality of the investment management services your funds receive and other matters important to your investment, including but not limited to: | |||
∎ | Ensuring that Invesco offers a diverse lineup of mutual funds that your financial adviser can use to strive to meet your financial needs as your investment goals change over time. | |||
| ∎ | Monitoring how the portfolio management teams of the Invesco funds are performing in light of changing economic and market conditions. | |||
| ∎ | Assessing each portfolio management team’s investment performance within the context of the investment strategy described in the fund’s prospectus. |
| ∎ | Monitoring for potential conflicts of interests that may impact the nature of the services that your funds receive. |
We believe one of the most important services we provide our fund shareholders is the annual review of the funds’ advisory and sub-advisory contracts with Invesco Advisers and its affiliates. This review is required by the Investment Company Act of 1940 and focuses on the nature and quality of the services Invesco provides as the adviser to the Invesco funds and the reasonableness of the fees that it charges for those services. Each year, we spend months carefully reviewing information received from Invesco and a variety of independent sources, such as performance and fee data prepared by Lipper, Inc. (a subsidiary of Broadridge Financial Solutions, Inc.), an independent, third-party firm widely recognized as a leader in its field. We also meet with our independent legal counsel and other independent advisers to review and help us assess the information that we have received. Our goal is to assure that you receive quality investment management services for a reasonable fee.
I trust the measures outlined above provide assurance that you have a worthy advocate when it comes to choosing the Invesco Funds.
As always, please contact me at bruce@brucecrockett.com with any questions or concerns you may have. On behalf of the Board, we look forward to continuing to represent your interests and serving your needs.
Sincerely,

Bruce L. Crockett
Independent Chair
Invesco Funds Board of Trustees
| 3 | Invesco Mid Cap Core Equity Fund |
Management’s Discussion of Fund Performance
Performance summary For the year ended December 31, 2017, Class A shares of Invesco Mid Cap Core Equity Fund (the Fund), at net asset value (NAV), underperformed the Russell Midcap Index, the Fund’s style-specific benchmark. Your Fund’s long-term performance appears later in this report.
| law in December 2017. While its enactment further strengthened stocks, its effect on the US economy remained uncertain. During the year, stock selection in the consumer discretionary and materials sectors benefited Fund performance relative to the style-specific benchmark. In addition, underweight exposure to the consumer staples, telecommunication services and utilities sectors contributed to the Fund’s performance. While stock selection in the information technology (IT) sector hindered the Fund’s relative performance, overweight exposure to the sector produced positive overall results. The largest detractors from Fund performance included stock selection in the health care and energy sectors, as well as underweight exposure to the former and overweight exposure to the latter. One of the most significant contributors to Fund performance was semiconductor company Teradyne. The company reported strong revenue and earnings growth and benefited from generally strong performance of the IT sector. The largest home construction company in the US, D.R. Horton, was another top performer for the year. The company’s stock price benefited from positive earnings data and increased activity in homebuilding and remodeling. IT consulting firm EPAM Systems was also a contributor to Fund performance. The company’s positive performance was attributed to better-than-expected earnings and rising demand for its IT services. The largest individual detractors from the Fund’s performance versus the style-specific benchmark were natural gas companies Range Resources and Seven Generations Energy. Range Resources underperformed due to disappointing earnings results and a reduction in its forward guidance. Seven Generations | |||||||||
| Fund vs. Indexes | ||||||||||
Total returns, 12/31/16 to 12/31/17, at net asset value (NAV). Performance shown does not include applicable contingent deferred sales charges (CDSC) or front-end sales charges, which would have reduced performance.
| ||||||||||
Class A Shares | 15.04% | |||||||||
Class B Shares | 14.21 | |||||||||
Class C Shares | 14.19 | |||||||||
Class R Shares | 14.75 | |||||||||
Class Y Shares | 15.33 | |||||||||
Class R5 Shares | 15.49 | |||||||||
Class R6 Shares | 15.52 | |||||||||
S&P 500 Indexq (Broad Market Index) | 21.83 | |||||||||
Russell Midcap Indexq (Style-Specific Index) | 18.52 | |||||||||
Lipper Mid-Cap Core Funds Index∎ (Peer Group Index) | 15.62 | |||||||||
Source(s): qFactSet Research Systems Inc.; ∎Lipper Inc.
| ||||||||||
Market conditions and your Fund
Despite highly destructive hurricanes that threatened to derail a years-long economic recovery, the US economy continued to expand throughout the year ended December 31, 2017. Gross domestic product – the value of all goods and services produced in the US – expanded in the first three quarters of 2017. Inflation remained subdued even as unemployment continued its multiyear decline. Given signs of an improving economy, the US Federal Reserve (the Fed) raised interest rates three times during the reporting period, most recently in December 2017; each rate hike was 25 basis points.1 (A basis point is 0.01%.) The Fed pledged that “realized and expected economic conditions relative to its objectives of maximum employment and 2 percent inflation” will guide its future actions. At the close of the reporting |
period, Fed policy remained accommodative, and the fed funds target rate stood at a range of 1.25% to 1.50% – 75 basis points higher than at the start of the reporting period.1 Higher inventories and a worsening outlook caused oil prices and many energy stocks to decline during the first half of 2017. However, oil prices rose significantly in the second half of the reporting period as expectations for lower supplies increased, partly due to continued OPEC production cuts, and demand began normalizing. Major US stock market indexes repeatedly hit all-time highs throughout the reporting period. The stock market rally that began after the 2016 presidential election continued throughout the reporting period, fueled by generally positive economic data, strong corporate earnings and improved consumer confi-dence. Finally, after much debate in Congress, a tax reform bill was signed into | |||||||||
| Portfolio Composition | ||||||
| By sector | % of total net assets | |||||
Information Technology | 20.7% | |||||
| Industrials | 15.8 | |||||
| Consumer Discretionary | 12.2 | |||||
| Health Care | 8.9 | |||||
| Financials | 8.8 | |||||
| Materials | 6.0 | |||||
| Energy | 5.0 | |||||
| Utilities | 1.2 | |||||
| Money Market Funds | ||||||
| Plus Other Assets Less Liabilities | 21.4 | |||||
| Top 10 Equity Holdings* | ||||
% of total net assets | ||||
1. Dover Corp. | 2.8% | |||
2. Teradyne, Inc. | 2.7 | |||
3. Stanley Black & Decker Inc. | 2.7 | |||
4. Agilent Technologies, Inc. | 2.6 | |||
5. EPAM Systems, Inc. | 2.2 | |||
6. St. James’s Place PLC | 2.1 | |||
7. D.R. Horton, Inc. | 2.0 | |||
8. Samsonite International S.A. | 2.0 | |||
9. Jack Henry & Associates, Inc. | 2.0 | |||
10. Amphenol Corp.-Class A | 1.9 | |||
Total Net Assets | $ | 1.2 billion | ||
Total Number of Holdings* | 58 | |||
The Fund’s holdings are subject to change, and there is no assurance that the Fund will continue to hold any particular security.
*Excluding money market fund holdings.
Data presented here are as of December 31, 2017.
| 4 | Invesco Mid Cap Core Equity Fund |
Energy received negative market reaction to a slight increase in its 2018 spending plan. Both companies were negatively affected by declining natural gas prices. We sold our position in Range Resources before the close of the reporting period.
Also detracting for the year was media conglomerate Viacom, which declined following disappointing earnings results and worse-than-expected guidance.
Finally, the Fund’s conservative positioning and allocation to cash hampered Fund performance during the year. We have been quite active in deploying cash during periods of market volatility, and we remain focused on putting these assets back to work.
At the close of the reporting period, our largest overweight position relative to the Russell Midcap Index was in the IT sector. The largest underweight positions were in the consumer staples, health care, real estate and utilities sectors. The Fund also had a slight underweight position in the financials sector.
As always, the Fund focuses on companies that provide an attractive return on invested capital, trade at attractive valuations and have high-quality management teams with a long-term perspective. In short, we seek to take advantage of the market’s volatile behavior and short-term focus. We believe our conservative approach should position the Fund to navigate the evolving economic backdrop.
We thank you for your continued investment in Invesco Mid Cap Core Equity Fund.
1 Source: US Federal Reserve
The views and opinions expressed in management’s discussion of Fund performance are those of Invesco Advisers, Inc. These views and opinions are subject to change at any time based on factors such as market and economic conditions. These views and opinions may not be relied upon as investment advice or recommendations, or as an offer for a particular security. The information is not a complete analysis of every aspect of any market, country, industry, security or the Fund. Statements of fact are from sources considered reliable, but Invesco Advisers, Inc. makes no representation or warranty as to their completeness or accuracy. Although historical performance is no guarantee of future results, these insights may help you understand our investment management philosophy.
See important Fund and, if applicable, index disclosures later in this report.
 | Ronald Sloan Chartered Financial Analyst, Portfolio Manager and Co-Chief Investment Officer of Invesco’s Global Core Equity Team, is lead | |
manager of Invesco Mid Cap Core Equity Fund. He joined Invesco in 1998. Mr. Sloan earned a BS in business administration and an MBA from the University of Missouri.
| ||
 | Brian Nelson Chartered Financial Analyst, Portfolio Manager, is manager of Invesco Mid Cap Core Equity Fund. He joined Invesco in 2004. Mr. Nelson earned | |
| a BA from the University of California, Santa Barbara | ||
Assisted by Invesco’s Global Core Equity Team
| 5 | Invesco Mid Cap Core Equity Fund |
Your Fund’s Long-Term Performance
Results of a $10,000 Investment – Oldest Share Class(es)
Fund and index data from 12/31/07
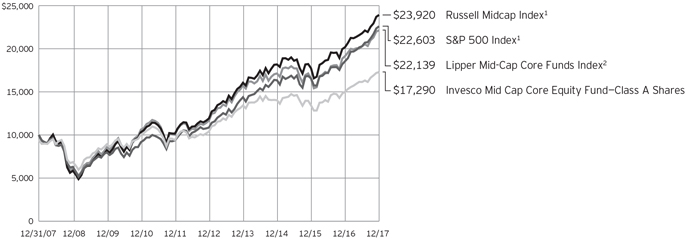
1 Source: FactSet Research Systems Inc.
2 Source: Lipper Inc.
Past performance cannot guarantee comparable future results.
The data shown in the chart include reinvested distributions, applicable sales charges and Fund expenses including
management fees. Index results include reinvested dividends, but they do not reflect sales charges. Performance of the peer group, if applicable, reflects fund expenses and management fees;
performance of a market index does not. Performance shown in the chart and table(s) does not reflect deduction of taxes a shareholder would pay on Fund distributions or sale of Fund shares.
continued from page 8
conditions and may have more limited product lines and markets, less experienced management and fewer financial resources than larger companies. These companies’ securities maybe more volatile and less liquid than those of more established companies, and their returns may vary, sometimes significantly, from the overall securities market.
About indexes used in this report
| ∎ | The S&P 500® Index is an unmanaged index considered representative of the US stock market. |
| ∎ | The Russell Midcap® Index is an unmanaged index considered representative of mid-cap stocks. The Russell Midcap Index is a trademark/service mark of the Frank Russell Co. Russell® is a trademark of the Frank Russell Co. |
| ∎ | The Lipper Mid-Cap Core Funds Index is an unmanaged index considered representative of mid-cap core funds tracked by Lipper. |
| ∎ | The Fund is not managed to track the performance of any particular index, including the index(es) described here, and consequently, the performance of the Fund may deviate significantly from the performance of the index(es). |
| ∎ | A direct investment cannot be made in an index. Unless otherwise indicated, index results include reinvested dividends, and they do not reflect sales charges. Performance of the peer group, if applicable, reflects fund expenses; performance of a market index does not. |
Other information
| ∎ | The returns shown in management’s discussion of Fund performance are based on net asset values (NAVs) calculated for shareholder transactions. Generally accepted accounting principles require adjustments to be made to the net assets of the Fund at period end for financial reporting purposes, and as such, the NAVs for shareholder transactions and the returns based on those NAVs may differ from the NAVs and returns reported in the Financial Highlights. |
| ∎ | Industry classifications used in this report are generally according to the Global Industry Classification Standard, which was developed by and is the exclusive property and a service mark of MSCI Inc. and Standard & Poor’s. |
| 6 | Invesco Mid Cap Core Equity Fund |
Average Annual Total Returns As of 12/31/17, including maximum applicable sales charges |
| |||
Class A Shares | ||||
Inception (6/9/87) | 10.28 | % | ||
10 Years | 5.63 | |||
5 Years | 9.48 | |||
1 Year | 8.72 | |||
Class B Shares | ||||
Inception (4/1/93) | 9.76 | % | ||
10 Years | 5.59 | |||
5 Years | 9.68 | |||
1 Year | 9.62 | |||
Class C Shares | ||||
Inception (5/3/99) | 8.00 | % | ||
10 Years | 5.44 | |||
5 Years | 9.90 | |||
1 Year | 13.27 | |||
Class R Shares | ||||
Inception (6/3/02) | 7.06 | % | ||
10 Years | 5.97 | |||
5 Years | 10.44 | |||
1 Year | 14.75 | |||
Class Y Shares | ||||
10 Years | 6.47 | % | ||
5 Years | 11.00 | |||
1 Year | 15.33 | |||
Class R5 Shares | ||||
Inception (3/15/02) | 7.54 | % | ||
10 Years | 6.65 | |||
5 Years | 11.15 | |||
1 Year | 15.49 | |||
Class R6 Shares | ||||
10 Years | 6.49 | % | ||
5 Years | 11.22 | |||
1 Year | 15.52 | |||
Class Y shares incepted on October 3, 2008. Performance shown prior to that date is that of Class A shares and includes the 12b-1 fees applicable to Class A shares.
Class R6 shares incepted on September 24, 2012. Performance shown prior to that date is that of Class A shares and includes the 12b-1 fees applicable to Class A shares.
The performance data quoted represent past performance and cannot guarantee comparable future results; current performance may be lower or higher. Please visit invesco.com/performance for the most recent month-end performance. Performance figures reflect reinvested distributions, changes in net asset value and the effect of the maximum sales charge unless otherwise stated.
Investment return and principal value will fluctuate so that you may have a gain or loss when you sell shares.
The net annual Fund operating expense ratio set forth in the most recent Fund prospectus as of the date of this report for Class A, Class B, Class C, Class R, Class Y, Class R5 and Class R6 shares was 1.24%, 1.99%, 1.99%, 1.49%, 0.99%, 0.86% and 0.78%, respectively.1 The total annual Fund operating expense ratio set forth in the most recent Fund prospectus as of the date of this report for Class A, Class B, Class C, Class R, Class Y, Class R5 and Class R6 shares was 1.26%, 2.01%, 2.01%, 1.51%, 1.01%, 0.88% and 0.80%, respectively. The expense ratios presented above may vary from the expense ratios presented in other sections of this report that are based on expenses incurred during the period covered by this report.
Class A share performance reflects the maximum 5.50% sales charge, and Class B and Class C share performance reflects the applicable contingent deferred sales charge (CDSC) for the period involved. The CDSC on Class B shares declines from 5% beginning at the time of purchase to 0% at the beginning of the seventh year. The CDSC on Class C shares is 1% for the first year after purchase. Class R, Class Y, Class R5 and Class R6 shares do not have a front-end sales charge or a CDSC; therefore, performance is at net asset value.
The performance of the Fund’s share classes will differ primarily due to different sales charge structures and class expenses.
Fund performance reflects any applicable fee waivers and/or expense reimbursements. Had the adviser not waived fees and/or reimbursed expenses currently or in the past, returns would have been lower. See current prospectus for more information.
| 1 | Total annual Fund operating expenses after any contractual fee waivers and/or expense reimbursements by the adviser in effect through at least June 30, 2019. See current prospectus for more information. |
| 7 | Invesco Mid Cap Core Equity Fund |
Invesco Mid Cap Core Equity Fund’s investment objective is long-term growth of capital.
| ∎ | Unless otherwise stated, information presented in this report is as of December 31, 2017, and is based on total net assets. |
| ∎ | Unless otherwise noted, all data provided by Invesco. |
| ∎ | To access your Fund’s reports/prospectus, visit invesco.com/fundreports. |
About share classes
| ∎ | Effective January 26, 2018, after the close of the reporting period, all outstanding Class B shares were converted to Class A shares, in advance of their normally scheduled conversion. No CDSC was paid in connection with this early conversion. |
| ∎ | Class R shares are generally available only to employer sponsored retirement and benefit plans. Please see the prospectus for more information. |
| ∎ | Class Y shares are available only to certain investors. Please see the prospectus for more information. |
| ∎ | Class R5 shares and Class R6 shares are available for use by retirement plans that meet certain standards and for institutional investors. Class R6 shares are also available through intermediaries that have established an agreement with Invesco Distributors, Inc. to make such shares available for use in retail omnibus accounts. Please see the prospectus for more information. |
Principal risks of investing in the Fund
| ∎ | Cash/cash equivalents risk. In rising markets, holding cash or cash equivalents will negatively affect the Fund’s performance relative to its benchmark. |
| ∎ | Derivatives risk. The value of a derivative instrument depends largely on (and is derived from) the value of an underlying security, currency, commodity, interest rate, index or other asset (each referred to as an underlying asset). In addition to risks relating to the underlying assets, the use of derivatives may include other, possibly greater, risks, including counterparty, leverage and liquidity risks. |
Counterparty risk is the risk that the counterparty to the derivative contract will default on its obligation to pay the Fund the amount owed or otherwise perform under the derivative contract. Derivatives create leverage risk because they do not require payment up
front equal to the economic exposure created by owning the derivative. As a result, an adverse change in the value of the underlying asset could result in the Fund sustaining a loss that is substantially greater than the amount invested in the derivative, which may make the Fund’s returns more volatile and increase the risk of loss. Derivative instruments may also be less liquid than more traditional investments and the Fund may be unable to sell or close out its derivative positions at a desirable time or price. This risk may be more acute under adverse market conditions, during which the Fund may be most in need of liquidating its derivative positions. Derivatives may also be harder to value, less tax efficient and subject to changing government regulation that could impact the Fund’s ability to use certain derivatives or their cost. Also, derivatives used for hedging or to gain or limit exposure to a particular market segment may not provide the expected benefits, particularly during adverse market conditions.
| ∎ | Emerging markets securities risk. Emerging markets (also referred to as developing markets) are generally subject to greater market volatility, political, social and economic instability, uncertain trading markets and more governmental limitations on foreign investment than more developed markets. In addition, companies operating in emerging markets may be subject to lower trading volume and greater price fluctuations than companies in more developed markets. Securities law and the enforcement of systems of taxation in many emerging market countries may change quickly and unpredictably. In addition, investments in emerging markets securities may also be subject to additional transaction costs, delays in settlement procedures, and lack of timely information. |
| ∎ | Foreign securities risk. The Fund’s foreign investments may be adversely affected by political and social instability, |
changes in economic or taxation policies, difficulty in enforcing obligations, decreased liquidity or increased volatility. Foreign investments also involve the risk of the possible seizure, nationalization or expropriation of the issuer or foreign deposits (in which the Fund could lose its entire investments in a certain market) and the possible adoption of foreign governmental restrictions such as exchange controls. Unless the Fund has hedged its foreign securities risk, foreign securities risk also involves the risk of negative foreign currency rate fluctuations, which may cause the value of securities denominated in such foreign currency (or other instruments through which the Fund has exposure to foreign currencies) to decline in value. Currency exchange rates may fluctuate significantly over short periods of time. Currency hedging strategies, if used, are not always successful. |
| ∎ | Management risk. The Fund is actively managed and depends heavily on the Adviser’s judgment about markets, interest rates or the attractiveness, relative values, liquidity, or potential appreciation of particular investments made for the Fund’s portfolio. The Fund could experience losses if these judgments prove to be incorrect. Additionally, legislative, regulatory, or tax developments may adversely affect management of the Fund and, therefore, the ability of the Fund to achieve its investment objective. |
| ∎ | Market risk. The market values of the Fund’s investments, and therefore the value of the Fund’s shares, will go up and down, sometimes rapidly or unpredictably. Market risk may affect a single issuer, industry or section of the economy, or it may affect the market as a whole. Individual stock prices tend to go up and down more dramatically than those of certain other types of investments, such as bonds. During a general downturn in the financial markets, multiple asset classes may decline in value. When markets perform well, there can be no assurance that specific investments held by the Fund will rise in value. |
| ∎ | Mid-capitalization companies risk. Mid-capitalization companies tend to be more vulnerable to changing market |
This report must be accompanied or preceded by a currently effective Fund prospectus, which contains more complete information, including sales charges and expenses. Investors should read it carefully before investing. |
| NOT FDIC INSURED | MAY LOSE VALUE | NO BANK GUARANTEE | continued on page 6 |
| 8 | Invesco Mid Cap Core Equity Fund |
Schedule of Investments(a)
December 31, 2017
| Shares | Value | |||||||
Common Stocks–78.61% |
| |||||||
| Apparel, Accessories & Luxury Goods–2.04% | ||||||||
Samsonite International S.A. | 5,311,800 | $ | 24,407,534 | |||||
| Application Software–0.96% | ||||||||
Synopsys, Inc.(b) | 134,569 | 11,470,662 | ||||||
| Asset Management & Custody Banks–2.11% | ||||||||
St. James’s Place PLC (United Kingdom) | 1,526,842 | 25,237,202 | ||||||
| Biotechnology–1.07% | ||||||||
BioMarin Pharmaceutical Inc.(b) | 143,644 | 12,808,735 | ||||||
| Casinos & Gaming–1.85% | ||||||||
Wynn Resorts Ltd. | 130,934 | 22,074,163 | ||||||
| Communications Equipment–1.23% | ||||||||
Motorola Solutions, Inc. | 162,365 | 14,668,054 | ||||||
| Data Processing & Outsourced Services–1.98% | ||||||||
Jack Henry & Associates, Inc. | 202,152 | 23,643,698 | ||||||
| Electronic Components–1.94% | ||||||||
Amphenol Corp.–Class A | 263,498 | 23,135,124 | ||||||
| Electronic Equipment & Instruments–0.50% | ||||||||
Keysight Technologies, Inc.(b) | 142,413 | 5,924,381 | ||||||
| Electronic Manufacturing Services–0.79% | ||||||||
IPG Photonics Corp.(b) | 43,853 | 9,390,243 | ||||||
| Environmental & Facilities Services–1.88% | ||||||||
Republic Services, Inc. | 221,725 | 14,990,827 | ||||||
Tetra Tech, Inc. | 154,858 | 7,456,413 | ||||||
| 22,447,240 | ||||||||
| Financial Exchanges & Data–1.60% | ||||||||
Moody’s Corp. | 129,153 | 19,064,274 | ||||||
| General Merchandise Stores–1.83% | ||||||||
Dollar General Corp. | 234,843 | 21,842,747 | ||||||
| Health Care Equipment–4.04% | ||||||||
Becton, Dickinson and Co. | 12,719 | 2,722,608 | ||||||
ResMed Inc. | 173,950 | 14,731,825 | ||||||
Wright Medical Group N.V.(b) | 547,213 | 12,148,129 | ||||||
Zimmer Biomet Holdings, Inc. | 155,279 | 18,737,517 | ||||||
| 48,340,079 | ||||||||
| Health Care Supplies–1.11% | ||||||||
DENTSPLY SIRONA Inc. | 201,028 | 13,233,673 | ||||||
| Home Furnishings–1.70% | ||||||||
Mohawk Industries, Inc.(b) | 73,464 | 20,268,718 | ||||||
| Homebuilding–2.04% | ||||||||
D.R. Horton, Inc. | 478,521 | 24,438,067 | ||||||
| Household Appliances–1.16% | ||||||||
Whirlpool Corp. | 82,356 | 13,888,516 | ||||||
| Shares | Value | |||||||
| Industrial Machinery–12.70% | ||||||||
Colfax Corp.(b) | 493,770 | $ | 19,563,167 | |||||
Crane Co. | 69,425 | 6,194,099 | ||||||
Dover Corp. | 326,114 | 32,934,253 | ||||||
Fortive Corp. | 245,298 | 17,747,310 | ||||||
ITT Inc. | 301,177 | 16,073,817 | ||||||
Nordson Corp. | 102,818 | 15,052,555 | ||||||
Parker-Hannifin Corp. | 32,162 | 6,418,892 | ||||||
Stanley Black & Decker Inc. | 187,422 | 31,803,639 | ||||||
Timken Co. (The) | 122,802 | 6,035,718 | ||||||
| 151,823,450 | ||||||||
| Internet Software & Services–1.40% | ||||||||
Just Eat PLC (United Kingdom)(b) | 1,598,402 | 16,767,185 | ||||||
| IT Consulting & Other Services–2.20% | ||||||||
EPAM Systems, Inc.(b) | 245,302 | 26,352,794 | ||||||
| Life & Health Insurance–1.28% | ||||||||
Torchmark Corp. | 169,256 | 15,353,212 | ||||||
| Life Sciences Tools & Services–2.62% | ||||||||
Agilent Technologies, Inc. | 468,397 | 31,368,547 | ||||||
| Movies & Entertainment–1.61% | ||||||||
Viacom Inc.–Class B | 626,429 | 19,300,277 | ||||||
| Multi-Utilities–1.22% | ||||||||
CMS Energy Corp. | 307,430 | 14,541,439 | ||||||
| Office Services & Supplies–0.73% | ||||||||
Société BIC S.A. (France) | 79,044 | 8,692,759 | ||||||
| Oil & Gas Equipment & Services–1.34% | ||||||||
Core Laboratories N.V. | 145,678 | 15,959,025 | ||||||
| Oil & Gas Exploration & Production–3.70% | ||||||||
Concho Resources Inc.(b) | 140,951 | 21,173,659 | ||||||
Seven Generations Energy | 755,423 | 10,686,149 | ||||||
Vermilion Energy, Inc. (Canada) | 339,820 | 12,350,209 | ||||||
| 44,210,017 | ||||||||
| Paper Packaging–1.41% | ||||||||
Packaging Corp. of America | 139,768 | 16,849,032 | ||||||
| Property & Casualty Insurance–2.86% | ||||||||
Arch Capital Group Ltd.(b) | 184,475 | 16,744,796 | ||||||
Progressive Corp. (The) | 309,067 | 17,406,653 | ||||||
| 34,151,449 | ||||||||
| Railroads–0.51% | ||||||||
Genesee & Wyoming Inc.–Class A(b) | 77,455 | 6,098,032 | ||||||
| Regional Banks–0.94% | ||||||||
First Republic Bank | 129,001 | 11,176,647 | ||||||
See accompanying Notes to Financial Statements which are an integral part of the financial statements.
9 Invesco Mid Cap Core Equity Fund
| Shares | Value | |||||||
| Semiconductor Equipment–4.58% | ||||||||
KLA-Tencor Corp. | 157,177 | $ | 16,514,587 | |||||
MKS Instruments, Inc. | 64,577 | 6,102,527 | ||||||
Teradyne, Inc. | 767,563 | 32,137,863 | ||||||
| 54,754,977 | ||||||||
| Semiconductors–5.13% | ||||||||
Cypress Semiconductor Corp. | 402,737 | 6,137,712 | ||||||
MACOM Technology Solutions Holdings, Inc.(b) | 345,391 | 11,239,023 | ||||||
Microchip Technology Inc. | 256,840 | 22,571,099 | ||||||
Xilinx, Inc. | 317,721 | 21,420,750 | ||||||
| 61,368,584 | ||||||||
| Specialty Chemicals–4.02% | ||||||||
Albemarle Corp. | 118,456 | 15,149,338 | ||||||
International Flavors & Fragrances Inc. | 108,253 | 16,520,490 | ||||||
PPG Industries, Inc. | 140,264 | 16,385,641 | ||||||
| 48,055,469 | ||||||||
| Shares | Value | |||||||
| Steel–0.53% | ||||||||
Reliance Steel & Aluminum Co. | 73,802 | $ | 6,331,474 | |||||
Total Common Stocks (Cost $614,630,445) | 939,437,479 | |||||||
Money Market Funds–21.08% |
| |||||||
Invesco Government & Agency Portfolio–Institutional | 88,195,832 | 88,195,832 | ||||||
Invesco Liquid Assets | 62,984,615 | 62,990,913 | ||||||
Invesco Treasury | 100,795,236 | 100,795,236 | ||||||
Total Money Market Funds |
| 251,981,981 | ||||||
TOTAL INVESTMENTS IN SECURITIES–99.69% |
| 1,191,419,460 | ||||||
OTHER ASSETS LESS LIABILITIES–0.31% |
| 3,673,104 | ||||||
NET ASSETS–100.00% |
| $ | 1,195,092,564 | |||||
Notes to Schedule of Investments:
| (a) | Industry and/or sector classifications used in this report are generally according to the Global Industry Classification Standard, which was developed by and is the exclusive property and a service mark of MSCI Inc. and Standard & Poor’s. |
| (b) | Non-income producing security. |
| (c) | The money market fund and the Fund are affiliated by having the same investment adviser. The rate shown is the 7-day SEC standardized yield as of December 31, 2017. |
See accompanying Notes to Financial Statements which are an integral part of the financial statements.
10 Invesco Mid Cap Core Equity Fund
Statement of Assets and Liabilities
December 31, 2017
Assets: | ||||
Investments in securities, at value (Cost $614,630,445) | $ | 939,437,479 | ||
Investments in affiliated money market funds, at value (Cost $251,987,571) | 251,981,981 | |||
Receivable for: | ||||
Investments sold | 8,310,757 | |||
Fund shares sold | 674,711 | |||
Dividends | 1,061,687 | |||
Investment for trustee deferred compensation and retirement plans | 482,557 | |||
Other assets | 37,201 | |||
Total assets | 1,201,986,373 | |||
Liabilities: | ||||
Payable for: | ||||
Investments purchased | 2,725,915 | |||
Fund shares reacquired | 2,646,735 | |||
Accrued fees to affiliates | 806,716 | |||
Accrued trustees’ and officers’ fees and benefits | 1,228 | |||
Accrued other operating expenses | 175,050 | |||
Trustee deferred compensation and retirement plans | 538,165 | |||
Total liabilities | 6,893,809 | |||
Net assets applicable to shares outstanding | $ | 1,195,092,564 | ||
Net assets consist of: | ||||
Shares of beneficial interest | $ | 863,695,108 | ||
Undistributed net investment income | (364,787 | ) | ||
Undistributed net realized gain | 6,960,696 | |||
Net unrealized appreciation | 324,801,547 | |||
| $ | 1,195,092,564 | |||
Net Assets: | ||||
Class A | $ | 893,885,690 | ||
Class B | $ | 4,380,377 | ||
Class C | $ | 91,794,336 | ||
Class R | $ | 57,532,406 | ||
Class Y | $ | 85,402,103 | ||
Class R5 | $ | 27,351,435 | ||
Class R6 | $ | 34,746,217 | ||
Shares outstanding, no par value, |
| |||
Class A | 41,515,255 | |||
Class B | 341,475 | |||
Class C | 7,191,826 | |||
Class R | 2,788,665 | |||
Class Y | 3,889,174 | |||
Class R5 | 1,155,337 | |||
Class R6 | 1,466,676 | |||
Class A: | ||||
Net asset value per share | $ | 21.53 | ||
Maximum offering price per share | ||||
(Net asset value of $21.53 ¸ 94.50%) | $ | 22.78 | ||
Class B: | ||||
Net asset value and offering price per share | $ | 12.83 | ||
Class C: | ||||
Net asset value and offering price per share | $ | 12.76 | ||
Class R: | ||||
Net asset value and offering price per share | $ | 20.63 | ||
Class Y: | ||||
Net asset value and offering price per share | $ | 21.96 | ||
Class R5: | ||||
Net asset value and offering price per share | $ | 23.67 | ||
Class R6: | ||||
Net asset value and offering price per share | $ | 23.69 | ||
See accompanying Notes to Financial Statements which are an integral part of the financial statements.
11 Invesco Mid Cap Core Equity Fund
Statement of Operations
For the year ended December 31, 2017
Investment income: | ||||
Dividends (net of foreign withholding taxes of $291,479) | $ | 14,078,728 | ||
Dividends from affiliated money market funds | 1,815,184 | |||
Total investment income | 15,893,912 | |||
Expenses: | ||||
Advisory fees | 8,710,080 | |||
Administrative services fees | 314,010 | |||
Custodian fees | 57,366 | |||
Distribution fees: | ||||
Class A | 2,250,836 | |||
Class B | 71,847 | |||
Class C | 1,008,943 | |||
Class R | 301,029 | |||
Transfer agent fees — A, B, C, R and Y | 2,465,204 | |||
Transfer agent fees — R5 | 37,752 | |||
Transfer agent fees — R6 | 3,837 | |||
Trustees’ and officers’ fees and benefits | 37,897 | |||
Registration and filing fees | 133,178 | |||
Reports to shareholders | 419,228 | |||
Professional services fees | 68,701 | |||
Other | 29,658 | |||
Total expenses | 15,909,566 | |||
Less: Fees waived and expense offset arrangement(s) | (269,440 | ) | ||
Net expenses | 15,640,126 | |||
Net investment income | 253,786 | |||
Realized and unrealized gain (loss) from: | ||||
Net realized gain (loss) from: | ||||
Investment securities (includes net gains (losses) from securities sold to affiliates of $(1,104,028)) | 162,091,233 | |||
Foreign currencies | (83,027 | ) | ||
| 162,008,206 | ||||
Change in net unrealized appreciation of: | ||||
Investment securities | 10,119,738 | |||
Foreign currencies | 14,723 | |||
| 10,134,461 | ||||
Net realized and unrealized gain | 172,142,667 | |||
Net increase in net assets resulting from operations | $ | 172,396,453 | ||
See accompanying Notes to Financial Statements which are an integral part of the financial statements.
12 Invesco Mid Cap Core Equity Fund
Statement of Changes in Net Assets
For the years ended December 31, 2017 and 2016
| 2017 | 2016 | |||||||
Operations: | ||||||||
Net investment income | $ | 253,786 | $ | 4,877,256 | ||||
Net realized gain | 162,008,206 | 79,427,357 | ||||||
Change in net unrealized appreciation | 10,134,461 | 61,513,733 | ||||||
Net increase in net assets resulting from operations | 172,396,453 | 145,818,346 | ||||||
Distributions to shareholders from net investment income: | ||||||||
Class A | (1,223,553 | ) | (2,595,461 | ) | ||||
Class R | (81,786 | ) | (12,025 | ) | ||||
Class Y | (119,748 | ) | (502,044 | ) | ||||
Class R5 | (34,298 | ) | (348,580 | ) | ||||
Class R6 | (42,442 | ) | (44,451 | ) | ||||
Total distributions from net investment income | (1,501,827 | ) | (3,502,561 | ) | ||||
Distributions to shareholders from net realized gains: | ||||||||
Class A | (114,032,966 | ) | (84,531,272 | ) | ||||
Class B | (926,738 | ) | (1,445,547 | ) | ||||
Class C | (18,410,425 | ) | (14,988,712 | ) | ||||
Class R | (7,622,380 | ) | (6,163,627 | ) | ||||
Class Y | (11,160,305 | ) | (8,632,585 | ) | ||||
Class R5 | (3,196,595 | ) | (3,846,347 | ) | ||||
Class R6 | (3,955,496 | ) | (349,120 | ) | ||||
Total distributions from net realized gains | (159,304,905 | ) | (119,957,210 | ) | ||||
Share transactions–net: | ||||||||
Class A | (35,154,112 | ) | (36,092,471 | ) | ||||
Class B | (5,885,416 | ) | (5,685,669 | ) | ||||
Class C | (11,744,459 | ) | (13,271,939 | ) | ||||
Class R | (7,670,663 | ) | (13,048,614 | ) | ||||
Class Y | (14,292,428 | ) | (654,126,853 | ) | ||||
Class R5 | (20,196,934 | ) | (1,888,601 | ) | ||||
Class R6 | 32,512,972 | 838,845 | ||||||
Net increase (decrease) in net assets resulting from share transactions | (62,431,040 | ) | (723,275,302 | ) | ||||
Net increase (decrease) in net assets | (50,841,319 | ) | (700,916,727 | ) | ||||
Net assets: | ||||||||
Beginning of year | 1,245,933,883 | 1,946,850,610 | ||||||
End of year (includes undistributed net investment income of $(364,787) and $966,282, respectively) | $ | 1,195,092,564 | $ | 1,245,933,883 | ||||
Notes to Financial Statements
December 31, 2017
NOTE 1—Significant Accounting Policies
Invesco Mid Cap Core Equity Fund (the “Fund”) is a series portfolio of AIM Growth Series (Invesco Growth Series) (the “Trust”). The Trust is organized as a Delaware statutory trust and is registered under the Investment Company Act of 1940, as amended (the “1940 Act”), as an open-end series management investment company consisting of twenty-nine separate series portfolios, each authorized to issue an unlimited number of shares of beneficial interest. The assets, liabilities and operations of each portfolio are accounted for separately. Information presented in these financial statements pertains only to the Fund. Matters affecting each portfolio or class will be voted on exclusively by the shareholders of such portfolio or class.
The Fund’s investment objective is long-term growth of capital.
The Fund currently consists of seven different classes of shares: Class A, Class B, Class C, Class R, Class Y, Class R5 and Class R6. Class Y shares are available only to certain investors. Class A shares are sold with a front-end sales charge unless certain waiver criteria are met and under certain circumstances load waived shares may be subject to contingent deferred sales charges (“CDSC”). Class C shares are sold with a CDSC. Class R, Class Y, Class R5 and Class R6 shares are sold at net asset value. Effective November 30, 2010, new or additional investments in Class B shares are no longer
13 Invesco Mid Cap Core Equity Fund
permitted. Existing shareholders of Class B shares may continue to reinvest dividends and capital gains distributions in Class B shares until they convert to Class A shares. Also, shareholders in Class B shares will be able to exchange those shares for Class B shares of other Invesco Funds offering such shares until they convert to Class A shares. Generally, Class B shares will automatically convert to Class A shares on or about the month-end, which is at least eight years after the date of purchase. Redemption of Class B shares prior to the conversion date will be subject to a CDSC. Effective January 26, 2018, all of the Fund’s outstanding Class B shares were converted to Class A shares, in advance of their normally scheduled conversion. No CDSC was paid in connection with this early conversion.
The Fund is an investment company and accordingly follows the investment company accounting and reporting guidance in accordance with Financial Accounting Standards Board Accounting Standards Codification Topic 946, Financial Services — Investment Companies.
The following is a summary of the significant accounting policies followed by the Fund in the preparation of its financial statements.
| A. | Security Valuations — Securities, including restricted securities, are valued according to the following policy. |
A security listed or traded on an exchange (except convertible securities) is valued at its last sales price or official closing price as of the close of the customary trading session on the exchange where the security is principally traded, or lacking any sales or official closing price on a particular day, the security may be valued at the closing bid price on that day. Securities traded in the over-the-counter market are valued based on prices furnished by independent pricing services or market makers. When such securities are valued by an independent pricing service they may be considered fair valued. Futures contracts are valued at the final settlement price set by an exchange on which they are principally traded. Listed options are valued at the mean between the last bid and asked prices from the exchange on which they are principally traded. Options not listed on an exchange are valued by an independent source at the mean between the last bid and asked prices. For purposes of determining net asset value (“NAV”) per share, futures and option contracts generally are valued 15 minutes after the close of the customary trading session of the New York Stock Exchange (“NYSE”).
Investments in open-end and closed-end registered investment companies that do not trade on an exchange are valued at the end-of-day net asset value per share. Investments in open-end and closed-end registered investment companies that trade on an exchange are valued at the last sales price or official closing price as of the close of the customary trading session on the exchange where the security is principally traded.
Debt obligations (including convertible securities) and unlisted equities are fair valued using an evaluated quote provided by an independent pricing service. Evaluated quotes provided by the pricing service may be determined without exclusive reliance on quoted prices, and may reflect appropriate factors such as institution-size trading in similar groups of securities, developments related to specific securities, dividend rate (for unlisted equities), yield (for debt obligations), quality, type of issue, coupon rate (for debt obligations), maturity (for debt obligations), individual trading characteristics and other market data. Pricing services generally value debt obligations assuming orderly transactions of institutional round lot size, but a fund may hold or transact in the same securities in smaller, odd lot sizes. Odd lots often trade at lower prices than institutional round lots. Debt obligations are subject to interest rate and credit risks. In addition, all debt obligations involve some risk of default with respect to interest and/or principal payments.
Foreign securities’ (including foreign exchange contracts) prices are converted into U.S. dollar amounts using the applicable exchange rates as of the close of the NYSE. If market quotations are available and reliable for foreign exchange-traded equity securities, the securities will be valued at the market quotations. Because trading hours for certain foreign securities end before the close of the NYSE, closing market quotations may become unreliable. If between the time trading ends on a particular security and the close of the customary trading session on the NYSE, events occur that the investment adviser determines are significant and make the closing price unreliable, the Fund may fair value the security. If the event is likely to have affected the closing price of the security, the security will be valued at fair value in good faith using procedures approved by the Board of Trustees. Adjustments to closing prices to reflect fair value may also be based on a screening process of an independent pricing service to indicate the degree of certainty, based on historical data, that the closing price in the principal market where a foreign security trades is not the current value as of the close of the NYSE. Foreign securities’ prices meeting the approved degree of certainty that the price is not reflective of current value will be priced at the indication of fair value from the independent pricing service. Multiple factors may be considered by the independent pricing service in determining adjustments to reflect fair value and may include information relating to sector indices, American Depositary Receipts and domestic and foreign index futures. Foreign securities may have additional risks including exchange rate changes, potential for sharply devalued currencies and high inflation, political and economic upheaval, the relative lack of issuer information, relatively low market liquidity and the potential lack of strict financial and accounting controls and standards.
Securities for which market prices are not provided by any of the above methods may be valued based upon quotes furnished by independent sources. The last bid price may be used to value equity securities. The mean between the last bid and asked prices is used to value debt obligations, including corporate loans.
Securities for which market quotations are not readily available or became unreliable are valued at fair value as determined in good faith by or under the supervision of the Trust’s officers following procedures approved by the Board of Trustees. Issuer specific events, market trends, bid/asked quotes of brokers and information providers and other market data may be reviewed in the course of making a good faith determination of a security’s fair value.
The Fund may invest in securities that are subject to interest rate risk, meaning the risk that the prices will generally fall as interest rates rise and, conversely, the prices will generally rise as interest rates fall. Specific securities differ in their sensitivity to changes in interest rates depending on their individual characteristics. Changes in interest rates may result in increased market volatility, which may affect the value and/or liquidity of certain Fund investments.
Valuations change in response to many factors including the historical and prospective earnings of the issuer, the value of the issuer’s assets, general economic conditions, interest rates, investor perceptions and market liquidity. Because of the inherent uncertainties of valuation, the values reflected in the financial statements may materially differ from the value received upon actual sale of those investments.
| B. | Securities Transactions and Investment Income — Securities transactions are accounted for on a trade date basis. Realized gains or losses on sales are computed on the basis of specific identification of the securities sold. Interest income (net of withholding tax, if any) is recorded on the accrual basis from settlement date. Dividend income (net of withholding tax, if any) is recorded on the ex-dividend date. |
The Fund may periodically participate in litigation related to Fund investments. As such, the Fund may receive proceeds from litigation settlements. Any proceeds received are included in the Statement of Operations as realized gain (loss) for investments no longer held and as unrealized gain (loss) for investments still held.
14 Invesco Mid Cap Core Equity Fund
Brokerage commissions and mark ups are considered transaction costs and are recorded as an increase to the cost basis of securities purchased and/or a reduction of proceeds on a sale of securities. Such transaction costs are included in the determination of net realized and unrealized gain (loss) from investment securities reported in the Statement of Operations and the Statement of Changes in Net Assets and the net realized and unrealized gains (losses) on securities per share in the Financial Highlights. Transaction costs are included in the calculation of the Fund’s net asset value and, accordingly, they reduce the Fund’s total returns. These transaction costs are not considered operating expenses and are not reflected in net investment income reported in the Statement of Operations and the Statement of Changes in Net Assets, or the net investment income per share and the ratios of expenses and net investment income reported in the Financial Highlights, nor are they limited by any expense limitation arrangements between the Fund and the investment adviser.
The Fund allocates income and realized and unrealized capital gains and losses to a class based on the relative net assets of each class.
| C. | Country Determination — For the purposes of making investment selection decisions and presentation in the Schedule of Investments, the investment adviser may determine the country in which an issuer is located and/or credit risk exposure based on various factors. These factors include the laws of the country under which the issuer is organized, where the issuer maintains a principal office, the country in which the issuer derives 50% or more of its total revenues and the country that has the primary market for the issuer’s securities, as well as other criteria. Among the other criteria that may be evaluated for making this determination are the country in which the issuer maintains 50% or more of its assets, the type of security, financial guarantees and enhancements, the nature of the collateral and the sponsor organization. Country of issuer and/or credit risk exposure has been determined to be the United States of America, unless otherwise noted. |
| D. | Distributions — Distributions from net investment income and net realized capital gain, if any, are generally declared and paid annually and recorded on the ex-dividend date. The Fund may elect to treat a portion of the proceeds from redemptions as distributions for federal income tax purposes. |
| E. | Federal Income Taxes — The Fund intends to comply with the requirements of Subchapter M of the Internal Revenue Code of 1986, as amended (the “Internal Revenue Code”), necessary to qualify as a regulated investment company and to distribute substantially all of the Fund’s taxable earnings to shareholders. As such, the Fund will not be subject to federal income taxes on otherwise taxable income (including net realized capital gain) that is distributed to shareholders. Therefore, no provision for federal income taxes is recorded in the financial statements. |
The Fund recognizes the tax benefits of uncertain tax positions only when the position is more likely than not to be sustained. Management has analyzed the Fund’s uncertain tax positions and concluded that no liability for unrecognized tax benefits should be recorded related to uncertain tax positions. Management is not aware of any tax positions for which it is reasonably possible that the total amounts of unrecognized tax benefits will change materially in the next 12 months.
The Fund files tax returns in the U.S. Federal jurisdiction and certain other jurisdictions. Generally, the Fund is subject to examinations by such taxing authorities for up to three years after the filing of the return for the tax period.
| F. | Expenses — Fees provided for under the Rule 12b-1 plan of a particular class of the Fund are charged to the operations of such class. Transfer agency fees and expenses and other shareholder recordkeeping fees and expenses attributable to Class R5 and Class R6 are allocated to each share class based on relative net assets. Sub-accounting fees attributable to Class R5 are charged to the operations of the class. Transfer agency fees and expenses and other shareholder recordkeeping fees and expenses relating to all other classes are allocated among those classes based on relative net assets. All other expenses are allocated among the classes based on relative net assets. |
| G. | Accounting Estimates — The preparation of financial statements in conformity with accounting principles generally accepted in the United States of America (“GAAP”) requires management to make estimates and assumptions that affect the reported amounts of assets and liabilities at the date of the financial statements and the reported amounts of revenues and expenses during the reporting period including estimates and assumptions related to taxation. Actual results could differ from those estimates by a significant amount. In addition, the Fund monitors for material events or transactions that may occur or become known after the period-end date and before the date the financial statements are released to print. |
| H. | Indemnifications — Under the Trust’s organizational documents, each Trustee, officer, employee or other agent of the Trust is indemnified against certain liabilities that may arise out of the performance of their duties to the Fund. Additionally, in the normal course of business, the Fund enters into contracts, including the Fund’s servicing agreements, that contain a variety of indemnification clauses. The Fund’s maximum exposure under these arrangements is unknown as this would involve future claims that may be made against the Fund that have not yet occurred. The risk of material loss as a result of such indemnification claims is considered remote. |
| I. | Foreign Currency Translations — Foreign currency is valued at the close of the NYSE based on quotations posted by banks and major currency dealers. Portfolio securities and other assets and liabilities denominated in foreign currencies are translated into U.S. dollar amounts at date of valuation. Purchases and sales of portfolio securities (net of foreign taxes withheld on disposition) and income items denominated in foreign currencies are translated into U.S. dollar amounts on the respective dates of such transactions. The Fund does not separately account for the portion of the results of operations resulting from changes in foreign exchange rates on investments and the fluctuations arising from changes in market prices of securities held. The combined results of changes in foreign exchange rates and the fluctuation of market prices on investments (net of estimated foreign tax withholding) are included with the net realized and unrealized gain or loss from investments in the Statement of Operations. Reported net realized foreign currency gains or losses arise from (1) sales of foreign currencies, (2) currency gains or losses realized between the trade and settlement dates on securities transactions, and (3) the difference between the amounts of dividends, interest, and foreign withholding taxes recorded on the Fund’s books and the U.S. dollar equivalent of the amounts actually received or paid. Net unrealized foreign currency gains and losses arise from changes in the fair values of assets and liabilities, other than investments in securities at fiscal period end, resulting from changes in exchange rates. |
The Fund may invest in foreign securities, which may be subject to foreign taxes on income, gains on investments or currency repatriation, a portion of which may be recoverable. Foreign taxes, if any, are recorded based on the tax regulations and rates that exist in the foreign markets in which the Fund invests and are shown in the Statement of Operations.
| J. | Forward Foreign Currency Contracts — The Fund may engage in foreign currency transactions either on a spot (i.e. for prompt delivery and settlement) basis, or through forward foreign currency contracts, to manage or minimize currency or exchange rate risk. |
The Fund may also enter into forward foreign currency contracts for the purchase or sale of a security denominated in a foreign currency in order to “lock in” the U.S. dollar price of that security, or the Fund may also enter into forward foreign currency contracts that do not provide for
15 Invesco Mid Cap Core Equity Fund
physical settlement of the two currencies, but instead are settled by a single cash payment calculated as the difference between the agreed upon exchange rate and the spot rate at settlement based upon an agreed upon notional amount (non-deliverable forwards). The Fund will set aside liquid assets in an amount equal to the daily mark-to-market obligation for forward foreign currency contracts.
A forward foreign currency contract is an obligation between two parties (“Counterparties”) to purchase or sell a specific currency for an agreed-upon price at a future date. The use of forward foreign currency contracts does not eliminate fluctuations in the price of the underlying securities the Fund owns or intends to acquire but establishes a rate of exchange in advance. Fluctuations in the value of these contracts are measured by the difference in the contract date and reporting date exchange rates and are recorded as unrealized appreciation (depreciation) until the contracts are closed. When the contracts are closed, realized gains (losses) are recorded. Realized and unrealized gains (losses) on the contracts are included in the Statement of Operations. The primary risks associated with forward foreign currency contracts include failure of the Counterparty to meet the terms of the contract and the value of the foreign currency changing unfavorably. These risks may be in excess of the amounts reflected in the Statement of Assets and Liabilities.
NOTE 2—Advisory Fees and Other Fees Paid to Affiliates
The Trust has entered into a master investment advisory agreement with Invesco Advisers, Inc. (the “Adviser” or “Invesco”). Under the terms of the investment advisory agreement, the Fund accrues daily and pays monthly an advisory fee to the Adviser based on the annual rate of the Fund’s average daily net assets as follows:
| Average Daily Net Assets | Rate | |||||||
First $500 million | 0 | .725% | ||||||
Next $500 million | 0 | .70% | ||||||
Next $500 million | 0 | .675% | ||||||
Over $1.5 billion | 0 | .65% | ||||||
For the year ended December 31, 2017, the effective advisory fees incurred by the Fund was 0.71%.
Under the terms of a master sub-advisory agreement between the Adviser and each of Invesco Asset Management Deutschland GmbH, Invesco Asset Management Limited, Invesco Asset Management (Japan) Limited, Invesco Hong Kong Limited, Invesco Senior Secured Management, Inc. and Invesco Canada Ltd. (collectively, the “Affiliated Sub-Advisers”) the Adviser, not the Fund, will pay 40% of the fees paid to the Adviser to any such Affiliated Sub-Adviser(s) that provide(s) discretionary investment management services to the Fund based on the percentage of assets allocated to such Affiliated Sub-Adviser(s).
The Adviser has contractually agreed, through at least June 30, 2018, to waive advisory fees and/or reimburse expenses of all shares to the extent necessary to limit total annual fund operating expenses after fee waiver and/or expense reimbursement (excluding certain items discussed below) of Class A, Class B, Class C, Class R, Class Y, Class R5 and Class R6 shares to 2.00%, 2.75%, 2.75%, 2.25%, 1.75%, 1.75% and 1.75%, respectively, of average daily net assets (the “expense limits”). In determining the Adviser’s obligation to waive advisory fees and/or reimburse expenses, the following expenses are not taken into account, and could cause the total annual fund operating expenses after fee waiver and/or expense reimbursement to exceed the numbers reflected above: (1) interest; (2) taxes; (3) dividend expense on short sales; (4) extraordinary or non-routine items, including litigation expenses; and (5) expenses that the Fund has incurred but did not actually pay because of an expense offset arrangement. Unless Invesco continues the fee waiver agreement, it will terminate on June 30, 2018. During its term, the fee waiver agreement cannot be terminated or amended to increase the expense limits or reduce the advisory fee waiver without approval of the Board of Trustees. The Adviser did not waive fees and/or reimburse expenses during the period under these expense limits.
Further, the Adviser has contractually agreed, through at least June 30, 2019, to waive the advisory fee payable by the Fund in an amount equal to 100% of the net advisory fees the Adviser receives from the affiliated money market funds on investments by the Fund of uninvested cash in such affiliated money market funds.
For the year ended December 31, 2017, the Adviser waived advisory fees of $251,322.
The Trust has entered into a master administrative services agreement with Invesco pursuant to which the Fund has agreed to pay Invesco for certain administrative costs incurred in providing accounting services to the Fund. For the year ended December 31, 2017, expenses incurred under the agreement are shown in the Statement of Operations as Administrative services fees.
The Trust has entered into a transfer agency and service agreement with Invesco Investment Services, Inc. (“IIS”) pursuant to which the Fund has agreed to pay IIS a fee for providing transfer agency and shareholder services to the Fund and reimburse IIS for certain expenses incurred by IIS in the course of providing such services. IIS may make payments to intermediaries that provide omnibus account services, sub-accounting services and/or networking services. All fees payable by IIS to intermediaries that provide omnibus account services or sub-accounting services are charged back to the Fund, subject to certain limitations approved by the Trust’s Board of Trustees. For the year ended December 31, 2017, expenses incurred under the agreement are shown in the Statement of Operations as Transfer agent fees.
The Trust has entered into master distribution agreements with Invesco Distributors, Inc. (“IDI”) to serve as the distributor for the Class A, Class B, Class C, Class R, Class Y, Class R5 and Class R6 shares of the Fund. The Trust has adopted plans pursuant to Rule 12b-1 under the 1940 Act with respect to the Fund’s Class A, Class B, Class C and Class R shares (collectively, the “Plans”). The Fund, pursuant to the Plans, pays IDI compensation at the annual rate of 0.25% of the Fund’s average daily net assets of Class A shares, 1.00% of the average daily net assets of Class B and Class C shares and 0.50% of the average daily net assets of Class R shares. The fees are accrued daily and paid monthly. Of the Plan payments, up to 0.25% of the average daily net assets of each class of shares may be paid to furnish continuing personal shareholder services to customers who purchase and own shares of such classes. Any amounts not paid as a service fee under the Plans would constitute an asset-based sales charge. Rules of the Financial Industry Regulatory Authority (“FINRA”) impose a cap on the total sales charges, including asset-based sales charges, that may be paid by any class of shares of the Fund. For the year ended December 31, 2017, expenses incurred under the Plans are shown in the Statement of Operations as Distribution fees.
Front-end sales commissions and CDSC (collectively, the “sales charges”) are not recorded as expenses of the Fund. Front-end sales commissions are deducted from proceeds from the sales of Fund shares prior to investment in Class A shares of the Fund. CDSC are deducted from redemption
16 Invesco Mid Cap Core Equity Fund
proceeds prior to remittance to the shareholder. During the year ended December 31, 2017, IDI advised the Fund that IDI retained $155,138 in front-end sales commissions from the sale of Class A shares and $15,841 and $1,592 from Class A and Class C shares, respectively, for CDSC imposed on redemptions by shareholders.
Certain officers and trustees of the Trust are officers and directors of the Adviser, IIS and/or IDI.
NOTE 3—Additional Valuation Information
GAAP defines fair value as the price that would be received to sell an asset or paid to transfer a liability in an orderly transaction between market participants at the measurement date, under current market conditions. GAAP establishes a hierarchy that prioritizes the inputs to valuation methods, giving the highest priority to readily available unadjusted quoted prices in an active market for identical assets (Level 1) and the lowest priority to significant unobservable inputs (Level 3), generally when market prices are not readily available or are unreliable. Based on the valuation inputs, the securities or other investments are tiered into one of three levels. Changes in valuation methods may result in transfers in or out of an investment’s assigned level:
| Level 1 — | Prices are determined using quoted prices in an active market for identical assets. |
| Level 2 — | Prices are determined using other significant observable inputs. Observable inputs are inputs that other market participants may use in pricing a security. These may include quoted prices for similar securities, interest rates, prepayment speeds, credit risk, yield curves, loss severities, default rates, discount rates, volatilities and others. |
| Level 3 — | Prices are determined using significant unobservable inputs. In situations where quoted prices or observable inputs are unavailable (for example, when there is little or no market activity for an investment at the end of the period), unobservable inputs may be used. Unobservable inputs reflect the Fund’s own assumptions about the factors market participants would use in determining fair value of the securities or instruments and would be based on the best available information. |
The following is a summary of the tiered valuation input levels, as of December 31, 2017. The level assigned to the securities valuations may not be an indication of the risk or liquidity associated with investing in those securities. Because of the inherent uncertainties of valuation, the values reflected in the financial statements may materially differ from the value received upon actual sale of those investments.
The Fund’s policy is to recognize transfers in and out of the valuation levels as of the end of the reporting period. During the year ended December 31, 2017, there were no material transfers between valuation levels.
| Level 1 | Level 2 | Level 3 | Total | |||||||||||||
| Investments in Securities | ||||||||||||||||
Common Stocks | $ | 897,433,092 | $ | 42,004,387 | $ | — | $ | 939,437,479 | ||||||||
Money Market Funds | 251,981,981 | — | — | 251,981,981 | ||||||||||||
Total Investments | $ | 1,149,415,073 | $ | 42,004,387 | $ | — | $ | 1,191,419,460 | ||||||||
NOTE 4—Security Transactions with Affiliated Funds
The Fund is permitted to purchase or sell securities from or to certain other Invesco Funds under specified conditions outlined in procedures adopted by the Board of Trustees of the Trust. The procedures have been designed to ensure that any purchase or sale of securities by the Fund from or to another fund or portfolio that is or could be considered an affiliate by virtue of having a common investment adviser (or affiliated investment advisers), common Trustees and/or common officers complies with Rule 17a-7 of the 1940 Act. Further, as defined under the procedures, each transaction is effected at the current market price. Pursuant to these procedures, for the year ended December 31, 2017, the Fund engaged in securities sales of $11,513,360, which resulted in net realized gains (losses) of $(1,104,028).
NOTE 5—Expense Offset Arrangement(s)
The expense offset arrangement is comprised of transfer agency credits which result from balances in demand deposit accounts used by the transfer agent for clearing shareholder transactions. For the year ended December 31, 2017, the Fund received credits from this arrangement, which resulted in the reduction of the Fund’s total expenses of $18,118.
NOTE 6—Trustees’ and Officers’ Fees and Benefits
Trustees’ and Officers’ Fees and Benefits include amounts accrued by the Fund to pay remuneration to certain Trustees and Officers of the Fund. Trustees have the option to defer compensation payable by the Fund, and Trustees’ and Officers’ Fees and Benefits also include amounts accrued by the Fund to fund such deferred compensation amounts. Those Trustees who defer compensation have the option to select various Invesco Funds in which their deferral accounts shall be deemed to be invested. Finally, certain current Trustees were eligible to participate in a retirement plan that provided for benefits to be paid upon retirement to Trustees over a period of time based on the number of years of service. The Fund may have certain former Trustees who also participate in a retirement plan and receive benefits under such plan. Trustees’ and Officers’ Fees and Benefits include amounts accrued by the Fund to fund such retirement benefits. Obligations under the deferred compensation and retirement plans represent unsecured claims against the general assets of the Fund.
NOTE 7—Cash Balances
The Fund is permitted to temporarily carry a negative or overdrawn balance in its account with State Street Bank and Trust Company, the custodian bank. Such balances, if any at period-end, are shown in the Statement of Assets and Liabilities under the payable caption Amount due custodian. To compensate the custodian bank for such overdrafts, the overdrawn Fund may either (1) leave funds as a compensating balance in the account so the custodian bank can be compensated by earning the additional interest; or (2) compensate by paying the custodian bank at a rate agreed upon by the custodian bank and Invesco, not to exceed the contractually agreed upon rate.
17 Invesco Mid Cap Core Equity Fund
NOTE 8—Distributions to Shareholders and Tax Components of Net Assets
Tax Character of Distributions to Shareholders Paid During the Fiscal Years Ended December 31, 2017 and 2016:
| 2017 | 2016 | |||||||
Ordinary income | $ | 1,501,827 | $ | 3,502,561 | ||||
Long-term capital gain | 159,304,905 | 119,957,210 | ||||||
Total distributions | $ | 160,806,732 | $ | 123,459,771 | ||||
Tax Components of Net Assets at Period-End:
| 2017 | ||||
Undistributed ordinary income | $ | 298,578 | ||
Undistributed long-term gain | 9,099,060 | |||
Net unrealized appreciation — investments | 322,663,080 | |||
Net unrealized appreciation (depreciation) — foreign currencies | (185,722 | ) | ||
Temporary book/tax differences | (477,540 | ) | ||
Shares of beneficial interest | 863,695,108 | |||
Total net assets | $ | 1,195,092,564 | ||
The difference between book-basis and tax-basis unrealized appreciation (depreciation) is due to differences in the timing of recognition of gains and losses on investments for tax and book purposes. The Fund’s net unrealized appreciation difference is attributable primarily to wash sales.
The temporary book/tax differences are a result of timing differences between book and tax recognition of income and/or expenses. The Fund’s temporary book/tax differences are the result of the trustee deferral of compensation and retirement plan benefits.
Capital loss carryforward is calculated and reported as of a specific date. Results of transactions and other activity after that date may affect the amount of capital loss carryforward actually available for the Fund to utilize. Capital losses generated in years beginning after December 22, 2010 can be carried forward for an unlimited period, whereas previous losses expire in eight tax years. Capital losses with an expiration period may not be used to offset capital gains until all net capital losses without an expiration date have been utilized. Capital loss carryforwards with no expiration date will retain their character as either short-term or long-term capital losses instead of as short-term capital losses as under prior law. The ability to utilize capital loss carryforwards in the future may be limited under the Internal Revenue Code and related regulations based on the results of future transactions.
The Fund does not have a capital loss carryforward as of December 31, 2017.
NOTE 9—Investment Transactions
The aggregate amount of investment securities (other than short-term securities, U.S. Treasury obligations and money market funds, if any) purchased and sold by the Fund during the year ended December 31, 2017 was $452,612,075 and $758,848,294, respectively. Cost of investments, including any derivatives, on a tax basis includes the adjustments for financial reporting purposes as of the most recently completed federal income tax reporting period-end.
| Unrealized Appreciation (Depreciation) of Investments on a Tax Basis | ||||
Aggregate unrealized appreciation of investments | $ | 340,794,270 | ||
Aggregate unrealized (depreciation) of investments | (18,131,190 | ) | ||
Net unrealized appreciation of investments | $ | 322,663,080 | ||
Cost of investments for tax purposes is $868,756,380.
NOTE 10—Reclassification of Permanent Differences
Primarily as a result of differing book/tax treatment of foreign currency transactions, on December 31, 2017, undistributed net investment income was decreased by $83,028 and undistributed net realized gain was increased by $83,028. This reclassification had no effect on the net assets of the Fund.
18 Invesco Mid Cap Core Equity Fund
NOTE 11—Share Information
| Summary of Share Activity | ||||||||||||||||
| Years ended December 31, | ||||||||||||||||
| 2017(a) | 2016 | |||||||||||||||
| Shares | Amount | Shares | Amount | |||||||||||||
Sold: | ||||||||||||||||
Class A | 3,891,991 | $ | 88,828,526 | 5,016,706 | $ | 109,629,555 | ||||||||||
Class B | 11,628 | 168,564 | 15,642 | 234,231 | ||||||||||||
Class C | 536,171 | 7,821,457 | 673,918 | 9,987,483 | ||||||||||||
Class R | 513,244 | 11,237,144 | 576,556 | 12,165,402 | ||||||||||||
Class Y | 3,388,163 | 77,555,215 | 4,134,893 | 90,888,838 | ||||||||||||
Class R5 | 169,341 | 4,163,257 | 460,419 | 11,059,695 | ||||||||||||
Class R6 | 1,310,605 | 33,411,207 | 59,658 | 1,425,795 | ||||||||||||
Issued as reinvestment of dividends: | ||||||||||||||||
Class A | 5,261,271 | 111,696,789 | 3,857,642 | 83,672,240 | ||||||||||||
Class B | 71,240 | 901,191 | 99,396 | 1,404,461 | ||||||||||||
Class C | 1,421,159 | 17,892,430 | 1,023,944 | 14,406,890 | ||||||||||||
Class R | 378,191 | 7,696,196 | 294,427 | 6,168,256 | ||||||||||||
Class Y | 461,178 | 9,984,512 | 370,680 | 8,158,662 | ||||||||||||
Class R5 | 138,269 | 3,227,205 | 177,398 | 4,165,303 | ||||||||||||
Class R6 | 167,493 | 3,912,634 | 16,719 | 392,559 | ||||||||||||
Automatic conversion of Class B shares to Class A shares: | ||||||||||||||||
Class A | 231,673 | 5,297,873 | 200,849 | 4,389,313 | ||||||||||||
Class B | (359,105 | ) | (5,297,873 | ) | (295,256 | ) | (4,389,313 | ) | ||||||||
Reacquired: | ||||||||||||||||
Class A | (10,595,929 | ) | (240,977,300 | ) | (10,618,265 | ) | (233,783,579 | ) | ||||||||
Class B | (112,507 | ) | (1,657,298 | ) | (197,914 | ) | (2,935,048 | ) | ||||||||
Class C | (2,552,604 | ) | (37,458,346 | ) | (2,542,461 | ) | (37,666,312 | ) | ||||||||
Class R | (1,214,987 | ) | (26,604,003 | ) | (1,480,962 | ) | (31,382,272 | ) | ||||||||
Class Y | (4,331,339 | ) | (101,832,155 | ) | (34,859,778 | ) | (753,174,353 | ) | ||||||||
Class R5 | (1,100,188 | ) | (27,587,396 | ) | (736,720 | ) | (17,113,599 | ) | ||||||||
Class R6 | (190,626 | ) | (4,810,869 | ) | (40,100 | ) | (979,509 | ) | ||||||||
Net increase (decrease) in share activity | (2,505,668 | ) | $ | (62,431,040 | ) | (33,792,609 | ) | $ | (723,275,302 | ) | ||||||
| (a) | There are entities that are record owners of more than 5% of the outstanding shares of the Fund and in the aggregate own 23% of the outstanding shares of the Fund. IDI has an agreement with these entities to sell Fund shares. The Fund, Invesco and/or Invesco affiliates may make payments to these entities, which are considered to be related to the Fund, for providing services to the Fund, Invesco and/or Invesco affiliates including but not limited to services such as, securities brokerage, distribution, third party record keeping and account servicing. The Fund has no knowledge as to whether all or any portion of the shares owned of record by these entities are also owned beneficially. |
19 Invesco Mid Cap Core Equity Fund
NOTE 12—Financial Highlights
The following schedule presents financial highlights for a share of the Fund outstanding throughout the periods indicated.
| Net asset value, beginning of period | Net investment income (loss)(a) | Net gains on securities | Total from investment operations | Dividends from net investment income | Distributions from net realized gains | Total distributions | Net asset value, end of period | Total return(b) | Net assets, end of period (000’s omitted) | Ratio of net assets | Ratio of expenses to average net assets without fee waivers and/or expenses absorbed | Ratio of net investment income (loss) to average net assets | Portfolio turnover(c) | |||||||||||||||||||||||||||||||||||||||||||
Class A |
| |||||||||||||||||||||||||||||||||||||||||||||||||||||||
Year ended 12/31/17 | $ | 21.48 | $ | 0.01 | $ | 3.17 | $ | 3.18 | $ | (0.03 | ) | $ | (3.10 | ) | $ | (3.13 | ) | $ | 21.53 | 15.04 | % | $ | 893,886 | 1.23 | %(d) | 1.25 | %(d) | 0.06 | %(d) | 45 | % | |||||||||||||||||||||||||
Year ended 12/31/16 | 21.14 | 0.08 | 2.48 | 2.56 | (0.07 | ) | (2.15 | ) | (2.22 | ) | 21.48 | 12.00 | 917,863 | 1.22 | 1.24 | 0.35 | 20 | |||||||||||||||||||||||||||||||||||||||
Year ended 12/31/15 | 23.52 | (0.01 | ) | (1.01 | ) | (1.02 | ) | (0.01 | ) | (1.35 | ) | (1.36 | ) | 21.14 | (4.33 | ) | 935,951 | 1.19 | 1.21 | (0.02 | ) | 54 | ||||||||||||||||||||||||||||||||||
Year ended 12/31/14 | 25.20 | 0.04 | 1.01 | 1.05 | (0.00 | ) | (2.73 | ) | (2.73 | ) | 23.52 | 4.51 | 1,155,635 | 1.17 | 1.19 | 0.17 | 35 | |||||||||||||||||||||||||||||||||||||||
Year ended 12/31/13 | 21.37 | (0.01 | ) | 6.15 | 6.14 | — | (2.31 | ) | (2.31 | ) | 25.20 | 29.19 | 1,378,888 | 1.16 | 1.19 | (0.04 | ) | 33 | ||||||||||||||||||||||||||||||||||||||
Class B |
| |||||||||||||||||||||||||||||||||||||||||||||||||||||||
Year ended 12/31/17 | 13.99 | (0.10 | ) | 2.04 | 1.94 | — | (3.10 | ) | (3.10 | ) | 12.83 | 14.21 | 4,380 | 1.98 | (d) | 2.00 | (d) | (0.69 | )(d) | 45 | ||||||||||||||||||||||||||||||||||||
Year ended 12/31/16 | 14.50 | (0.06 | ) | 1.70 | 1.64 | — | (2.15 | ) | (2.15 | ) | 13.99 | 11.18 | 10,216 | 1.97 | 1.99 | (0.40 | ) | 20 | ||||||||||||||||||||||||||||||||||||||
Year ended 12/31/15 | 16.70 | (0.13 | ) | (0.72 | ) | (0.85 | ) | — | (1.35 | ) | (1.35 | ) | 14.50 | (5.08 | ) | 16,074 | 1.94 | 1.96 | (0.77 | ) | 54 | |||||||||||||||||||||||||||||||||||
Year ended 12/31/14 | 18.81 | (0.11 | ) | 0.73 | 0.62 | — | (2.73 | ) | (2.73 | ) | 16.70 | 3.74 | 25,115 | 1.92 | 1.94 | (0.58 | ) | 35 | ||||||||||||||||||||||||||||||||||||||
Year ended 12/31/13 | 16.55 | (0.15 | ) | 4.72 | 4.57 | — | (2.31 | ) | (2.31 | ) | 18.81 | 28.20 | 33,795 | 1.91 | 1.94 | (0.79 | ) | 33 | ||||||||||||||||||||||||||||||||||||||
Class C |
| |||||||||||||||||||||||||||||||||||||||||||||||||||||||
Year ended 12/31/17 | 13.93 | (0.10 | ) | 2.03 | 1.93 | — | (3.10 | ) | (3.10 | ) | 12.76 | 14.18 | 91,794 | 1.98 | (d) | 2.00 | (d) | (0.69 | )(d) | 45 | ||||||||||||||||||||||||||||||||||||
Year ended 12/31/16 | 14.45 | (0.06 | ) | 1.69 | 1.63 | — | (2.15 | ) | (2.15 | ) | 13.93 | 11.15 | 108,508 | 1.97 | 1.99 | (0.40 | ) | 20 | ||||||||||||||||||||||||||||||||||||||
Year ended 12/31/15 | 16.64 | (0.13 | ) | (0.71 | ) | (0.84 | ) | — | (1.35 | ) | (1.35 | ) | 14.45 | (5.04 | ) | 124,748 | 1.94 | 1.96 | (0.77 | ) | 54 | |||||||||||||||||||||||||||||||||||
Year ended 12/31/14 | 18.76 | (0.11 | ) | 0.72 | 0.61 | — | (2.73 | ) | (2.73 | ) | 16.64 | 3.69 | 180,461 | 1.92 | 1.94 | (0.58 | ) | 35 | ||||||||||||||||||||||||||||||||||||||
Year ended 12/31/13 | 16.51 | (0.15 | ) | 4.71 | 4.56 | — | (2.31 | ) | (2.31 | ) | 18.76 | 28.21 | 202,919 | 1.91 | 1.94 | (0.79 | ) | 33 | ||||||||||||||||||||||||||||||||||||||
Class R |
| |||||||||||||||||||||||||||||||||||||||||||||||||||||||
Year ended 12/31/17 | 20.75 | (0.04 | ) | 3.05 | 3.01 | (0.03 | ) | (3.10 | ) | (3.13 | ) | 20.63 | 14.75 | 57,532 | 1.48 | (d) | 1.50 | (d) | (0.19 | )(d) | 45 | |||||||||||||||||||||||||||||||||||
Year ended 12/31/16 | 20.48 | 0.02 | 2.41 | 2.43 | (0.01 | ) | (2.15 | ) | (2.16 | ) | 20.75 | 11.75 | 64,577 | 1.47 | 1.49 | 0.10 | 20 | |||||||||||||||||||||||||||||||||||||||
Year ended 12/31/15 | 22.88 | (0.06 | ) | (0.99 | ) | (1.05 | ) | — | (1.35 | ) | (1.35 | ) | 20.48 | (4.58 | ) | 76,246 | 1.44 | 1.46 | (0.27 | ) | 54 | |||||||||||||||||||||||||||||||||||
Year ended 12/31/14 | 24.65 | (0.02 | ) | 0.98 | 0.96 | — | (2.73 | ) | (2.73 | ) | 22.88 | 4.24 | 99,552 | 1.42 | 1.44 | (0.08 | ) | 35 | ||||||||||||||||||||||||||||||||||||||
Year ended 12/31/13 | 21.00 | (0.07 | ) | 6.03 | 5.96 | — | (2.31 | ) | (2.31 | ) | 24.65 | 28.85 | 124,622 | 1.41 | 1.44 | (0.29 | ) | 33 | ||||||||||||||||||||||||||||||||||||||
Class Y |
| |||||||||||||||||||||||||||||||||||||||||||||||||||||||
Year ended 12/31/17 | 21.80 | 0.07 | 3.22 | 3.29 | (0.03 | ) | (3.10 | ) | (3.13 | ) | 21.96 | 15.33 | 85,402 | 0.98 | (d) | 1.00 | (d) | 0.31 | (d) | 45 | ||||||||||||||||||||||||||||||||||||
Year ended 12/31/16 | 21.42 | 0.13 | 2.53 | 2.66 | (0.13 | ) | (2.15 | ) | (2.28 | ) | 21.80 | 12.31 | 95,292 | 0.97 | 0.99 | 0.60 | 20 | |||||||||||||||||||||||||||||||||||||||
Year ended 12/31/15 | 23.76 | 0.05 | (1.03 | ) | (0.98 | ) | (0.01 | ) | (1.35 | ) | (1.36 | ) | 21.42 | (4.12 | ) | 743,988 | 0.94 | 0.96 | 0.23 | 54 | ||||||||||||||||||||||||||||||||||||
Year ended 12/31/14 | 25.44 | 0.11 | 1.01 | 1.12 | (0.07 | ) | (2.73 | ) | (2.80 | ) | 23.76 | 4.76 | 808,895 | 0.92 | 0.94 | 0.42 | 35 | |||||||||||||||||||||||||||||||||||||||
Year ended 12/31/13 | 21.50 | 0.05 | 6.20 | 6.25 | — | (2.31 | ) | (2.31 | ) | 25.44 | 29.53 | 653,577 | 0.91 | 0.94 | 0.21 | 33 | ||||||||||||||||||||||||||||||||||||||||
Class R5 |
| |||||||||||||||||||||||||||||||||||||||||||||||||||||||
Year ended 12/31/17 | 23.26 | 0.10 | 3.44 | 3.54 | (0.03 | ) | (3.10 | ) | (3.13 | ) | 23.67 | 15.44 | 27,351 | 0.87 | (d) | 0.89 | (d) | 0.42 | (d) | 45 | ||||||||||||||||||||||||||||||||||||
Year ended 12/31/16 | 22.76 | 0.17 | 2.68 | 2.85 | (0.20 | ) | (2.15 | ) | (2.35 | ) | 23.26 | 12.42 | 45,310 | 0.84 | 0.86 | 0.73 | 20 | |||||||||||||||||||||||||||||||||||||||
Year ended 12/31/15 | 25.11 | 0.09 | (1.08 | ) | (0.99 | ) | (0.01 | ) | (1.35 | ) | (1.36 | ) | 22.76 | (3.94 | ) | 46,584 | 0.81 | 0.83 | 0.36 | 54 | ||||||||||||||||||||||||||||||||||||
Year ended 12/31/14 | 26.73 | 0.15 | 1.07 | 1.22 | (0.11 | ) | (2.73 | ) | (2.84 | ) | 25.11 | 4.88 | 146,211 | 0.81 | 0.83 | 0.53 | 35 | |||||||||||||||||||||||||||||||||||||||
Year ended 12/31/13 | 22.47 | 0.08 | 6.49 | 6.57 | — | (2.31 | ) | (2.31 | ) | 26.73 | 29.68 | 220,321 | 0.81 | 0.83 | 0.31 | 33 | ||||||||||||||||||||||||||||||||||||||||
Class R6 |
| |||||||||||||||||||||||||||||||||||||||||||||||||||||||
Year ended 12/31/17 | 23.26 | 0.12 | 3.44 | 3.56 | (0.03 | ) | (3.10 | ) | (3.13 | ) | 23.69 | 15.52 | 34,746 | 0.79 | (d) | 0.81 | (d) | 0.50 | (d) | 45 | ||||||||||||||||||||||||||||||||||||
Year ended 12/31/16 | 22.81 | 0.19 | 2.69 | 2.88 | (0.28 | ) | (2.15 | ) | (2.43 | ) | 23.26 | 12.51 | 4,168 | 0.76 | 0.78 | 0.81 | 20 | |||||||||||||||||||||||||||||||||||||||
Year ended 12/31/15 | 25.14 | 0.11 | (1.08 | ) | (0.97 | ) | (0.01 | ) | (1.35 | ) | (1.36 | ) | 22.81 | (3.85 | ) | 3,260 | 0.72 | 0.74 | 0.45 | 54 | ||||||||||||||||||||||||||||||||||||
Year ended 12/31/14 | 26.76 | 0.17 | 1.07 | 1.24 | (0.13 | ) | (2.73 | ) | (2.86 | ) | 25.14 | 4.97 | 3,650 | 0.72 | 0.74 | 0.62 | 35 | |||||||||||||||||||||||||||||||||||||||
Year ended 12/31/13 | 22.48 | 0.11 | 6.48 | 6.59 | — | (2.31 | ) | (2.31 | ) | 26.76 | 29.75 | 4,243 | 0.72 | 0.74 | 0.40 | 33 | ||||||||||||||||||||||||||||||||||||||||
| (a) | Calculated using average shares outstanding. |
| (b) | Includes adjustments in accordance with accounting principles generally accepted in the United States of America and as such, the net asset value for financial reporting purposes and the returns based upon those net asset values may differ from the net asset value and returns for shareholder transactions. Does not include sales charges and is not annualized for periods less than one year, if applicable. |
| (c) | Portfolio turnover is calculated at the fund level and is not annualized for periods less than one year, if applicable. |
| (d) | Ratios are based on average daily net assets (000’s omitted) of $900,335, $7,185, $100,894, $60,206, $113,140, $36,836 and $16,231 for Class A, Class B, Class C, Class R, Class Y, Class R5 and Class R6 shares, respectively. |
20 Invesco Mid Cap Core Equity Fund
Report of Independent Registered Public Accounting Firm
To the Board of Trustees of AIM Growth Series (Invesco Growth Series)
and Shareholders of Invesco Mid Cap Core Equity Fund
Opinion on the Financial Statements
We have audited the accompanying statement of assets and liabilities, including the schedule of investments, of Invesco Mid Cap Core Equity Fund (one of the funds constituting AIM Growth Series (Invesco Growth Series), hereafter referred to as the “Fund”) as of December 31, 2017, the related statement of operations for the year ended December 31, 2017, the statement of changes in net assets for each of the two years in the period ended December 31, 2017, including the related notes, and the financial highlights for each of the five years in the period ended December 31, 2017 (collectively referred to as the “financial statements”). In our opinion, the financial statements present fairly, in all material respects, the financial position of the Fund as of December 31, 2017, the results of its operations for the year then ended, the changes in its net assets for each of the two years in the period ended December 31, 2017 and the financial highlights for each of the five years in the period ended December 31, 2017 in conformity with accounting principles generally accepted in the United States of America.
Basis for Opinion
These financial statements are the responsibility of the Fund’s management. Our responsibility is to express an opinion on the Fund’s financial statements based on our audits. We are a public accounting firm registered with the Public Company Accounting Oversight Board (United States) (“PCAOB”) and are required to be independent with respect to the Fund in accordance with the U.S. federal securities laws and the applicable rules and regulations of the Securities and Exchange Commission and the PCAOB.
We conducted our audits of these financial statements in accordance with the standards of the PCAOB. Those standards require that we plan and perform the audit to obtain reasonable assurance about whether the financial statements are free of material misstatement, whether due to error or fraud.
Our audits included performing procedures to assess the risks of material misstatement of the financial statements, whether due to error or fraud, and performing procedures that respond to those risks. Such procedures included examining, on a test basis, evidence regarding the amounts and disclosures in the financial statements. Our audits also included evaluating the accounting principles used and significant estimates made by management, as well as evaluating the overall presentation of the financial statements. Our procedures included confirmation of securities owned as of December 31, 2017 by correspondence with the custodian, transfer agent and brokers; when replies were not received from brokers, we performed other auditing procedures. We believe that our audits provide a reasonable basis for our opinion.
PricewaterhouseCoopers LLP
Houston, TX
February 23, 2018
We have served as the auditor of one or more of the investment companies in the Invesco/PowerShares group of investment companies since at least 1995. We have not determined the specific year we began serving as auditor.
21 Invesco Mid Cap Core Equity Fund
Calculating your ongoing Fund expenses
Example
As a shareholder of the Fund, you incur two types of costs: (1) transaction costs, which may include sales charges (loads) on purchase payments or contingent deferred sales charges on redemptions, if any; and (2) ongoing costs, including management fees, distribution and/or service (12b-1) fees, and other Fund expenses. This example is intended to help you understand your ongoing costs (in dollars) of investing in the Fund and to compare these costs with ongoing costs of investing in other mutual funds. The example is based on an investment of $1,000 invested at the beginning of the period and held for the entire period July 1, 2017 through December 31, 2017.
Actual expenses
The table below provides information about actual account values and actual expenses. You may use the information in this table, together with the amount you invested, to estimate the expenses that you paid over the period. Simply divide your account value by $1,000 (for example, an $8,600 account value divided by $1,000 = 8.6), then multiply the result by the number in the table under the heading entitled “Actual Expenses Paid During Period” to estimate the expenses you paid on your account during this period.
Hypothetical example for comparison purposes
The table below also provides information about hypothetical account values and hypothetical expenses based on the Fund’s actual expense ratio and an assumed rate of return of 5% per year before expenses, which is not the Fund’s actual return.
The hypothetical account values and expenses may not be used to estimate the actual ending account balance or expenses you paid for the period. You may use this information to compare the ongoing costs of investing in the Fund and other funds. To do so, compare this 5% hypothetical example with the 5% hypothetical examples that appear in the shareholder reports of the other funds.
Please note that the expenses shown in the table are meant to highlight your ongoing costs only and do not reflect any transaction costs, such as sales charges (loads) on purchase payments or contingent deferred sales charges on redemptions, if any. Therefore, the hypothetical information is useful in comparing ongoing costs only, and will not help you determine the relative total costs of owning different funds. In addition, if these transaction costs were included, your costs would have been higher.
Class | Beginning | ACTUAL | HYPOTHETICAL (5% annual return before | Annualized | ||||||||||||||||||||
| Ending Account Value (12/31/17)1 | Expenses Paid During Period2 | Ending Account Value (12/31/17) | Expenses Paid During Period2 | |||||||||||||||||||||
| A | $ | 1,000.00 | $ | 1,071.10 | $ | 6.37 | $ | 1,019.06 | $ | 6.21 | 1.22 | % | ||||||||||||
| B | 1,000.00 | 1,067.30 | 10.27 | 1,015.27 | 10.01 | 1.97 | ||||||||||||||||||
| C | 1,000.00 | 1,067.60 | 10.27 | 1,015.27 | 10.01 | 1.97 | ||||||||||||||||||
| R | 1,000.00 | 1,070.10 | 7.67 | 1,017.80 | 7.48 | 1.47 | ||||||||||||||||||
| Y | 1,000.00 | 1,072.60 | 5.07 | 1,020.32 | 4.94 | 0.97 | ||||||||||||||||||
| R5 | 1,000.00 | 1,073.70 | 4.55 | 1,020.82 | 4.43 | 0.87 | ||||||||||||||||||
R6 | 1,000.00 | 1,073.60 | 4.18 | 1,021.17 | 4.08 | 0.80 | ||||||||||||||||||
| 1 | The actual ending account value is based on the actual total return of the Fund for the period July 1, 2017 through December 31, 2017, after actual expenses and will differ from the hypothetical ending account value which is based on the Fund’s expense ratio and a hypothetical annual return of 5% before expenses. |
| 2 | Expenses are equal to the Fund’s annualized expense ratio as indicated above multiplied by the average account value over the period, multiplied by 184/365 to reflect the most recent fiscal half year. |
22 Invesco Mid Cap Core Equity Fund
Tax Information
Form 1099-DIV, Form 1042-S and other year-end tax information provide shareholders with actual calendar year amounts that should be included in their tax returns. Shareholders should consult their tax advisors.
The following distribution information is being provided as required by the Internal Revenue Code or to meet a specific state’s requirement.
The Fund designates the following amounts or, if subsequently determined to be different, the maximum amount allowable for its fiscal year ended December 31, 2017:
Federal and State Income Tax | ||||
Long-Term Capital Gain Distributions | $ | 159,304,905 | ||
Qualified Dividend Income* | 100.00 | % | ||
Corporate Dividends Received Deduction* | 100.00 | % | ||
U.S. Treasury Obligations* | 0.00 | % | ||
| * | The above percentages are based on ordinary income dividends paid to shareholders during the Fund’s fiscal year. |
23 Invesco Mid Cap Core Equity Fund
Trustees and Officers
The address of each trustee and officer is AIM Growth Series (Invesco Growth Series) (the “Trust”), 11 Greenway Plaza, Suite 1000, Houston, Texas 77046-1173. The trustees serve for the life of the Trust, subject to their earlier death, incapacitation, resignation, retirement or removal as more specifically provided in the Trust’s organizational documents. Each officer serves for a one year term or until their successors are elected and qualified. Column two below includes length of time served with predecessor entities, if any.
Name, Year of Birth and Position(s) Held with the Trust | Trustee and/ or Officer Since | Principal Occupation(s) During Past 5 Years | Number of Funds in Fund Complex Overseen by Trustee | Other Directorship(s) Held by Trustee During Past 5 Years | ||||
| Interested Persons | ||||||||
| Martin L. Flanagan1 — 1960 Trustee | 2007 | Executive Director, Chief Executive Officer and President, Invesco Ltd. (ultimate parent of Invesco and a global investment management firm); Trustee, The Invesco Funds; Vice Chair, Investment Company Institute; and Member of Executive Board, SMU Cox School of Business
Formerly: Advisor to the Board, Invesco Advisers, Inc. (formerly known as Invesco Institutional (N.A.), Inc.); Chairman and Chief Executive Officer, Invesco Advisers, Inc. (registered investment adviser); Director, Chairman, Chief Executive Officer and President, Invesco Holding Company (US), Inc. (formerly IVZ Inc.) (holding company), Invesco Group Services, Inc. (service provider) and Invesco North American Holdings, Inc. (holding company); Director, Chief Executive Officer and President, Invesco Holding Company Limited (parent of Invesco and a global investment management firm); Director, Invesco Ltd.; Chairman, Investment Company Institute and President, Co-Chief Executive Officer, Co-President, Chief Operating Officer and Chief Financial Officer, Franklin Resources, Inc. (global investment management organization) | 158 | None | ||||
| Philip A. Taylor2 — 1954 Trustee and Senior Vice President | 2006 | Head of the Americas and Senior Managing Director, Invesco Ltd.; Director, Invesco Advisers, Inc. (formerly known as Invesco Institutional (N.A.), Inc.) (registered investment adviser); Director, Chairman, Chief Executive Officer and President, Invesco Management Group, Inc. (formerly known as Invesco Aim Management Group, Inc.) (financial services holding company); Director and Chairman, Invesco Investment Services, Inc. (formerly known as Invesco Aim Investment Services, Inc.) (registered transfer agent); Chief Executive Officer, Invesco Corporate Class Inc. (corporate mutual fund company); Director, Chairman and Chief Executive Officer, Invesco Canada Ltd. (formerly known as Invesco Trimark Ltd./Invesco Trimark Ltèe) (registered investment adviser and registered transfer agent); Trustee and Senior Vice President, The Invesco Funds; Director, Invesco Investment Advisers LLC (formerly known as Van Kampen Asset Management).
Formerly: Co-Chairman, Co-President and Co-Chief Executive Officer, Invesco Advisers, Inc. (formerly known as Invesco Institutional (N.A.), Inc.) (registered investment adviser); Director, Chief Executive Officer and President, Van Kampen Exchange Corp; President and Principal Executive Officer, The Invesco Funds (other than AIM Treasurer’s Series Trust (Invesco Treasurer’s Series Trust), Short-Term Investments Trust and Invesco Management Trust); Executive Vice President, The Invesco Funds (AIM Treasurer’s Series Trust (Invesco Treasurer’s Series Trust), Short-Term Investments Trust and Invesco Management Trust only); Director and President, INVESCO Funds Group, Inc. (registered investment adviser and registered transfer agent); Director and Chairman, IVZ Distributors, Inc. (formerly known as INVESCO Distributors, Inc.) (registered broker dealer); Director, President and Chairman, Invesco Inc. (holding company), Invesco Canada Holdings Inc. (holding company), Trimark Investments Ltd./Placements Trimark Ltèe and Invesco Financial Services Ltd/Services Financiers Invesco Ltèe; Chief Executive Officer, Invesco Canada Fund Inc. (corporate mutual fund company); Director and Chairman, Van Kampen Investor Services Inc.; Director, Chief Executive Officer and President, 1371 Preferred Inc. (holding company) and Van Kampen Investments Inc.; Director and President, AIM GP Canada Inc. (general partner for limited partnerships) and Van Kampen Advisors, Inc.; Director and Chief Executive Officer, Invesco Trimark Dealer Inc. (registered broker dealer); Director, Invesco Distributors, Inc. (formerly known as Invesco Aim Distributors, Inc.) (registered broker dealer); Manager, Invesco PowerShares Capital Management LLC; Director, Chief Executive Officer and President, Invesco Advisers, Inc.; Director, Chairman, Chief Executive Officer and President, Invesco Aim Capital Management, Inc.; President, Invesco Trimark Dealer Inc. and Invesco Trimark Ltd./Invesco Trimark Ltèe; Director and President, AIM Trimark Corporate Class Inc. and AIM Trimark Canada Fund Inc.; Senior Managing Director, Invesco Holding Company Limited; Director and Chairman, Fund Management Company (former registered broker dealer); President and Principal Executive Officer, The Invesco Funds (AIM Treasurer’s Series Trust (Invesco Treasurer’s Series Trust), and Short-Term Investments Trust only); President, AIM Trimark Global Fund Inc. and AIM Trimark Canada Fund Inc. | 158 | None |
| 1 | Mr. Flanagan is considered an interested person (within the meaning of Section 2(a)(19) of the 1940 Act) of the Trust because he is an officer of the Adviser to the Trust, and an officer and a director of Invesco Ltd., ultimate parent of the Adviser. |
| 2 | Mr. Taylor is considered an interested person (within the meaning of Section 2(a)(19) of the 1940 Act) of the Trust because he is an officer and a director of the Adviser. |
T-1 Invesco Mid Cap Core Equity Fund
Trustees and Officers—(continued)
Name, Year of Birth and Position(s) Held with the Trust | Trustee and/ or Officer Since | Principal Occupation(s) During Past 5 Years | Number of Funds in Fund Complex Overseen by Trustee | Other Directorship(s) Past 5 Years | ||||
| Independent Trustees | ||||||||
Bruce L. Crockett — 1944 Trustee and Chair | 2001 | Chairman, Crockett Technologies Associates (technology consulting company)
Formerly: Director, Captaris (unified messaging provider); Director, President and Chief Executive Officer, COMSAT Corporation; Chairman, Board of Governors of INTELSAT (international communications company); ACE Limited (insurance company); Independent Directors Council and Investment Company Institute: Member of the Audit Committee, Investment Company Institute; Member of the Executive Committee and Chair of the Governance Committee, Independent Directors Council | 158 | Director and Chairman of the Audit Committee, ALPS (Attorneys Liability Protection Society) (insurance company); Director and Member of the Audit Committee and Compensation Committee, Ferroglobe PLC (metallurgical company) | ||||
David C. Arch — 1945 Trustee | 2010 | Chairman of Blistex Inc. (consumer health care products manufacturer); Member, World Presidents’ Organization | 158 | Board member of the Illinois Manufacturers’ Association | ||||
Jack M. Fields — 1952 Trustee | 2001 | Chief Executive Officer, Twenty First Century Group, Inc. (government affairs company); and Chairman, Discovery Learning Alliance (non-profit)
Formerly: Owner and Chief Executive Officer, Dos Angeles Ranch L.P. (cattle, hunting, corporate entertainment); Director, Insperity, Inc. (formerly known as Administaff) (human resources provider); Chief Executive Officer, Texana Timber LP (sustainable forestry company); Director of Cross Timbers Quail Research Ranch (non-profit); and member of the U.S. House of Representatives | 158 | None | ||||
Cynthia Hostetler — 1962 Trustee | 2017 | Non-Executive Director and Trustee of a number of public and private business corporations
Formerly: Head of Investment Funds and Private Equity, Overseas Private Investment Corporation; President, First Manhattan Bancorporation, Inc.; Attorney, Simpson Thacher & Bartlett LLP | 158 | Vulcan Materials Company (construction materials company); Trilinc Global Impact Fund; Aberdeen Investment Funds (4 portfolios); Artio Global Investment LLC (mutual fund complex); Edgen Group, Inc. (specialized energy and infrastructure products distributor) | ||||
Eli Jones — 1961 Trustee | 2016 | Professor and Dean, Mays Business School — Texas A&M University
Formerly: Professor and Dean, Walton College of Business, University of Arkansas and E.J. Ourso College of Business, Louisiana State University; Director, Arvest Bank | 158 | Insperity, Inc. (formerly known as Administaff) (human resources provider) | ||||
Prema Mathai-Davis — 1950 Trustee | 2001 | Retired. | 158 | None | ||||
Teresa M. Ressel — 1962 Trustee | 2017 | Non-executive director and trustee of a number of public and private business corporations
Formerly: Chief Financial Officer, Olayan America, The Olayan Group (international investor/commercial/industrial); Chief Executive Officer, UBS Securities LLC; Group Chief Operating Officer, Americas, UBS AG; Assistant Secretary for Management & Budget and CFO, US Department of the Treasury | 158 | Atlantic Power Corporation (power generation company); ON Semiconductor Corp. (semiconductor supplier) | ||||
Ann Barnett Stern — 1957 Trustee | 2017 | President and Chief Executive Officer, Houston Endowment Inc. (private philanthropic institution)
Formerly: Executive Vice President and General Counsel, Texas Children’s Hospital; Attorney, Beck, Redden and Secrest, LLP; Business Law Instructor, University of St. Thomas; Attorney, Andrews & Kurth LLP | 158 | Federal Reserve Bank of Dallas | ||||
Raymond Stickel, Jr. — 1944 Trustee | 2005 | Retired.
Formerly: Director, Mainstay VP Series Funds, Inc. (25 portfolios); Partner, Deloitte & Touche | 158 | None | ||||
Robert C. Troccoli — 1949 Trustee | 2016 | Adjunct Professor, University of Denver — Daniels College of Business
Formerly: Senior Partner, KPMG LLP | 158 | None | ||||
Christopher L. Wilson — 1957 Trustee | 2017 | Non-executive director and trustee of a number of public and private business corporations
Formerly: Managing Partner, CT2, LLC (investing and consulting firm); President/Chief Executive Officer, Columbia Funds, Bank of America Corporation; President/Chief Executive Officer, CDC IXIS Asset Management Services, Inc.; Principal & Director of Operations, Scudder Funds, Scudder, Stevens & Clark, Inc.; Assistant Vice President, Fidelity Investments | 158 | TD Asset Management USA Inc. (mutual fund complex) (22 portfolios); ISO New England, Inc. (non-profit organization managing regional electricity market) |
T-2 Invesco Mid Cap Core Equity Fund
Trustees and Officers—(continued)
Name, Year of Birth and Position(s) Held with the Trust | Trustee and/ or Officer Since | Principal Occupation(s) During Past 5 Years | Number of Funds in Fund Complex Overseen by Trustee | Other Directorship(s) Past 5 Years | ||||
| Other Officers | ||||||||
Sheri Morris — 1964 President, Principal Executive Officer and Treasurer | 1999 | President, Principal Executive Officer and Treasurer, The Invesco Funds; Vice President, Invesco Advisers, Inc. (formerly known as Invesco Institutional (N.A.), Inc.) (registered investment adviser); and Vice President, PowerShares Exchange-Traded Fund Trust, PowerShares Exchange-Traded Fund Trust II, PowerShares India Exchange-Traded Fund Trust, PowerShares Actively Managed Exchange-Traded Fund Trust, PowerShares Actively Managed Exchange-Traded Commodity Fund Trust and PowerShares Exchange-Traded Self-Indexed Fund Trust
Formerly: Vice President and Principal Financial Officer, The Invesco Funds; Vice President, Invesco Aim Advisers, Inc., Invesco Aim Capital Management, Inc. and Invesco Aim Private Asset Management, Inc.; Assistant Vice President and Assistant Treasurer, The Invesco Funds and Assistant Vice President, Invesco Advisers, Inc., Invesco Aim Capital Management, Inc. and Invesco Aim Private Asset Management, Inc.; and Treasurer, PowerShares Exchange-Traded Fund Trust, PowerShares Exchange-Traded Fund Trust II, PowerShares India Exchange-Traded Fund Trust and PowerShares Actively Managed Exchange-Traded Fund Trust | N/A | N/A | ||||
Russell C. Burk — 1958 Senior Vice President and Senior Officer | 2005 | Senior Vice President and Senior Officer, The Invesco Funds | N/A | N/A | ||||
John M. Zerr — 1962 Senior Vice President, Chief Legal Officer and Secretary | 2006 | Director, Senior Vice President, Secretary and General Counsel, Invesco Management Group, Inc. (formerly known as Invesco AIM Management Group, Inc.); Senior Vice President, Invesco Advisers, Inc. (formerly known as Invesco Institutional (N.A.), Inc.) (registered investment adviser); Senior Vice President and Secretary, Invesco Distributors, Inc. (formerly known as Invesco AIM Distributors, Inc.); Director, Vice President and Secretary, Invesco Investment Services, Inc. (formerly known as Invesco AIM Investment Services, Inc.) Senior Vice President, Chief Legal Officer and Secretary, The Invesco Funds; Managing Director, Invesco PowerShares Capital Management LLC; Director, Secretary and General Counsel, Invesco Investment Advisers LLC (formerly known as Van Kampen Asset Management); Secretary and General Counsel, Invesco Capital Markets, Inc. (formerly known as Van Kampen Funds Inc.) and Chief Legal Officer, PowerShares Exchange-Traded Fund Trust, PowerShares Exchange-Traded Fund Trust II, PowerShares India Exchange-Traded Fund Trust, PowerShares Actively Managed Exchange-Traded Fund Trust, PowerShares Actively Managed Exchange-Traded Commodity Fund Trust and PowerShares Exchange-Traded Self-Indexed Fund Trust; Manager and Secretary, Invesco Indexing LLC
Formerly: Director, Secretary, General Counsel and Senior Vice President, Van Kampen Exchange Corp.; Director, Vice President and Secretary, IVZ Distributors, Inc. (formerly known as INVESCO Distributors, Inc.); Director and Vice President, INVESCO Funds Group, Inc.; Director and Vice President, Van Kampen Advisors Inc.; Director, Vice President, Secretary and General Counsel, Van Kampen Investor Services Inc.; Director, Invesco Distributors, Inc. (formerly known as Invesco AIM Distributors, Inc.); Director, Senior Vice President, General Counsel and Secretary, Invesco AIM Advisers, Inc. and Van Kampen Investments Inc.; Director, Vice President and Secretary, Fund Management Company; Director, Senior Vice President, Secretary, General Counsel and Vice President, Invesco AIM Capital Management, Inc.; Chief Operating Officer and General Counsel, Liberty Ridge Capital, Inc. (an investment adviser); Vice President and Secretary, PBHG Funds (an investment company) and PBHG Insurance Series Fund (an investment company); Chief Operating Officer, General Counsel and Secretary, Old Mutual Investment Partners (a broker-dealer); General Counsel and Secretary, Old Mutual Fund Services (an administrator) and Old Mutual Shareholder Services (a shareholder servicing center); Executive Vice President, General Counsel and Secretary, Old Mutual Capital, Inc. (an investment adviser); and Vice President and Secretary, Old Mutual Advisors Funds (an investment company) | N/A | N/A | ||||
Gregory G. McGreevey — 1962 Senior Vice President | 2012 | Senior Managing Director, Invesco Ltd.; Director, Chairman, President, and Chief Executive Officer, Invesco Advisers, Inc. (formerly known as Invesco Institutional (N.A.), Inc.) (registered investment adviser); Senior Vice President, Invesco Management Group, Inc.; Director, Invesco Mortgage Capital, Inc. and Invesco Senior Secured Management, Inc.; and Senior Vice President, The Invesco Funds
Formerly: Assistant Vice President, The Invesco Funds | N/A | N/A | ||||
Kelli Gallegos — 1970 Vice President, Principal Financial Officer and Assistant Treasurer | 2008 | Vice President, Principal Financial Officer and Assistant Treasurer, The Invesco Funds; Assistant Treasurer, Invesco PowerShares Capital Management LLC, PowerShares Exchange-Traded Fund Trust, PowerShares Exchange-Traded Fund Trust II, PowerShares India Exchange-Traded Fund Trust, PowerShares Actively Managed Exchange-Traded Fund Trust, PowerShares Actively Managed Exchange-Traded Commodity Fund Trust and PowerShares Exchange-Traded Self-Indexed Fund Trust
Formerly: Assistant Vice President, The Invesco Funds | N/A | N/A |
T-3 Invesco Mid Cap Core Equity Fund
Trustees and Officers—(continued)
Name, Year of Birth and Position(s) Held with the Trust | Trustee and/ or Officer Since | Principal Occupation(s) During Past 5 Years | Number of Funds in Fund Complex Overseen by Trustee | Other Directorship(s) Past 5 Years | ||||
| Other Officers—(continued) | ||||||||
Tracy Sullivan — 1962 Vice President, Chief Tax Officer and Assistant Treasurer | 2008 | Vice President, Chief Tax Officer and Assistant Treasurer, The Invesco Funds; Assistant Treasurer, Invesco PowerShares Capital Management LLC, PowerShares Exchange-Traded Fund Trust, PowerShares Exchange-Traded Fund Trust II, PowerShares India Exchange-Traded Fund Trust, PowerShares Actively Managed Exchange-Traded Fund Trust,PowerShares Actively Managed Exchange-Traded Commodity Fund Trust and PowerShares Exchange-Traded Self-Indexed Fund Trust
Formerly: Assistant Vice President, The Invesco Funds | N/A | N/A | ||||
Crissie M. Wisdom — 1969 Anti-Money Laundering Compliance Officer | 2013 | Anti-Money Laundering Compliance Officer, Invesco Advisers, Inc. (formerly known as Invesco Institutional (N.A.), Inc.) (registered investment adviser), Invesco Capital Markets, Inc. (formerly known as Van Kampen Funds Inc.), Invesco Distributors, Inc., Invesco Investment Services, Inc., Invesco Management Group, Inc., The Invesco Funds, and PowerShares Exchange-Traded Fund Trust, PowerShares Exchange-Traded Fund Trust II, PowerShares India Exchange-Traded Fund Trust, PowerShares Actively Managed Exchange-Traded Fund Trust,PowerShares Actively Managed Exchange-Traded Commodity Fund Trust and PowerShares Exchange-Traded Self-Indexed Fund Trust; Anti-Money Laundering Compliance Officer and Bank Secrecy Act Officer, INVESCO National Trust Company and Invesco Trust Company; and Fraud Prevention Manager and Controls and Risk Analysis Manager for Invesco Investment Services, Inc.
Formerly: Anti-Money Laundering Compliance Officer, Van Kampen Exchange Corp. | N/A | N/A | ||||
Robert R. Leveille — 1969 Chief Compliance Officer | 2016 | Chief Compliance Officer, Invesco Advisers, Inc. (registered investment adviser); and Chief Compliance Officer, The Invesco Funds
Formerly: Chief Compliance Officer, Putnam Investments and the Putnam Funds | N/A | N/A |
The Statement of Additional Information of the Trust includes additional information about the Fund’s Trustees and is available upon request, without charge, by calling 1.800.959.4246. Please refer to the Fund’s Statement of Additional Information for information on the Fund’s sub-advisers.
Office of the Fund 11 Greenway Plaza, Suite 1000 Houston, TX 77046-1173 | Investment Adviser Invesco Advisers, Inc. 1555 Peachtree Street, N.E. Atlanta, GA 30309 | Distributor Invesco Distributors, Inc. 11 Greenway Plaza, Suite 1000 Houston, TX 77046-1173 | Auditors PricewaterhouseCoopers LLP 1000 Louisiana Street, Suite 5800 Houston, TX 77002-5678 | |||
Counsel to the Fund Stradley Ronon Stevens & Young, LLP 2005 Market Street, Suite 2600 Philadelphia, PA 19103-7018 | Counsel to the Independent Trustees Goodwin Procter LLP 901 New York Avenue, N.W. Washington, D.C. 20001 | Transfer Agent Invesco Investment Services, Inc. 11 Greenway Plaza, Suite 1000 Houston, TX 77046-1173 | Custodian State Street Bank and Trust Company 225 Franklin Street Boston, MA 02110-2801 | |||
T-4 Invesco Mid Cap Core Equity Fund
Explore High-Conviction Investing with Invesco

Go paperless with eDelivery
Visit invesco.com/edelivery to enjoy the convenience and security of anytime electronic access to your investment documents.
With eDelivery, you can elect to have any or all of the following materials delivered straight to your inbox to download, save and print from your own computer:
| ∎ | Fund reports and prospectuses |
| ∎ | Quarterly statements |
| ∎ | Daily confirmations |
| ∎ | Tax forms |
Invesco mailing information
Send general correspondence to Invesco Investment Services, Inc., P.O. Box 219078, Kansas City, MO 64121-9078.
Important notice regarding delivery of security holder documents
To reduce Fund expenses, only one copy of most shareholder documents may be mailed to shareholders with multiple accounts at the same address (Householding). Mailing of your shareholder documents may be householded indefinitely unless you instruct us otherwise. If you do not want the mailing of these documents to be combined with those for other members of your household, please contact Invesco Investment Services, Inc. at 800 959 4246 or contact your financial institution. We will begin sending you individual copies for each account within 30 days after receiving your request.
Fund holdings and proxy voting information
The Fund provides a complete list of its holdings four times in each fiscal year, at the quarter ends. For the second and fourth quarters, the lists appear in the Fund’s semiannual and annual reports to shareholders. For the first and third quarters, the Fund files the lists with the Securities and Exchange Commission (SEC) on Form N-Q. The most recent list of portfolio holdings is available at invesco.com/completeqtrholdings. Shareholders can also look up the Fund’s Forms N-Q on the SEC website at sec.gov. Copies of the Fund’s Forms N-Q may be reviewed and copied at the SEC Public Reference Room in Washington, D.C. You can obtain information on the operation of the Public Reference Room, including information about duplicating fee charges, by calling 202 551 8090 or 800 732 0330, or by electronic request at the following email address: publicinfo@sec.gov. The SEC file numbers for the Fund are shown below.
A description of the policies and procedures that the Fund uses to determine how to vote proxies relating to portfolio securities is available without charge, upon request, from our Client Services department at 800 959 4246 or at invesco.com/proxyguidelines. The information is also available on the SEC website, sec.gov.
Information regarding how the Fund voted proxies related to its portfolio securities during the most recent 12-month period ended June 30 is available at invesco.com/proxysearch. The information is also available on the SEC website, sec.gov. Invesco Advisers, Inc. is an investment adviser; it provides investment advisory services to individual and institutional clients and does not sell securities. Invesco Distributors, Inc. is the US distributor for Invesco Ltd.’s retail mutual funds, exchange-traded funds and institutional money market funds. Both are wholly owned, indirect subsidiaries of Invesco Ltd. |  |
SEC file numbers: 811-02699 and 002-57526 | Invesco Distributors, Inc. | MCCE-AR-1 | 02092018 | 0854 |
| ||||
 |
Annual Report to Shareholders
|
December 31, 2017 | ||
| ||||
Invesco Multi-Asset Inflation Fund
| ||||
| Nasdaq: | ||||
| A: MIZAX ∎ C: MIZCX ∎ R: MIZRX ∎ Y: MIZYX ∎ R5: MIZFX ∎ R6: MIZSX | ||||

Letters to Shareholders
Philip Taylor | Dear Shareholders: This annual report includes information about your Fund, including performance data and a complete list of its investments as of the close of the reporting period. Inside is a discussion of how your Fund was managed and the factors that affected its performance during the reporting period. Major stock market indexes rose – and set record highs – throughout the reporting period. Generally positive economic data, strong corporate earnings and anticipated tax and regulatory reform contributed to the rally. The US economy expanded during the reporting period, with gross domestic product, the value of all goods and services produced, significantly increasing its growth rate from the first to the third quarter of the year. Tax reform legislation, enacted in December 2017, was a positive for the stock market, but its long-term economic impact was uncertain. Citing positive economic trends – specifically, realized and expected labor market conditions and inflation – the US Federal Reserve raised |

interest rates in March, June and December 2017. While US and global bond markets, as well as emerging market equities, sold off early in the reporting period, they recovered much of their losses during the reporting period. Overseas, economic data were mixed, prompting the European Central Bank and central banks in China and Japan, among other countries, to maintain extraordinarily accommodative monetary policies.
Short-term market volatility can prompt some investors to abandon their investment plans – and can cause others to settle for whatever returns the market has to offer. The investment professionals at Invesco, in contrast, invest with high conviction. This means that, no matter the asset class or the strategy, each investment team has a passion to exceed. We want to help investors achieve better outcomes, such as seeking higher returns, helping mitigate risk and generating income. Of course, investing with high conviction can’t guarantee a profit or ensure success; no investment strategy can. To learn more about how we invest with high conviction, visit invesco.com/HighConviction.
You, too, can invest with high conviction by maintaining a long-term investment perspective and by working with your financial adviser on a regular basis. During periods of short-term market volatility or uncertainty, your financial adviser can keep you focused on your long-term investment goals – a new home, a child’s college education or a secure retirement. He or she also can share research about the economy, the markets and individual investment options.
Visit our website for more information on your investments
Our website, invesco.com/us, offers a wide range of market insights and investment perspectives. On the website, you’ll find detailed information about our funds, including performance, holdings and portfolio manager commentaries. You can access information about your account by completing a simple, secure online registration. To do so, select “Log In” on the right side of the homepage, and then select “Register for Individual Account Access.”
In addition to the resources accessible on our website and through our mobile app, you can obtain timely updates to help you stay informed about the markets and the economy by connecting with Invesco on Twitter, LinkedIn or Facebook. You can access our blog at blog.invesco.us.com. Our goal is to provide you the information you want, when and where you want it.
Finally, I’m pleased to share with you Invesco’s commitment to both the Principles for Responsible Investment and to considering environmental, social and governance issues in our robust investment process. I invite you to learn more at invesco.com/esg.
Have questions?
For questions about your account, contact an Invesco client services representative at 800 959 4246. For Invesco-related questions or comments, please email me directly at phil@invesco.com.
All of us at Invesco look forward to serving your investment management needs. Thank you for investing with us.
Sincerely,

Philip Taylor
Senior Managing Director, Invesco Ltd.
| 2 | Invesco Multi-Asset Inflation Fund |
Bruce Crockett | Dear Fellow Shareholders: Among the many important lessons I’ve learned in more than 40 years in a variety of business endeavors is the value of a trusted advocate. As independent chair of the Invesco Funds Board, I can assure you that the members of the Board are strong advocates for the interests of investors in Invesco’s mutual funds. We work hard to represent your interests through oversight of the quality of the investment management services your funds receive and other matters important to your investment, including but not limited to: ∎ Ensuring that Invesco offers a diverse lineup of mutual funds that your financial adviser can use to strive to meet your financial needs as your investment goals change over time. ∎ Monitoring how the portfolio management teams of the Invesco funds are performing in light of changing economic and market conditions. |

| ∎ | Assessing each portfolio management team’s investment performance within the context of the investment strategy described in the fund’s prospectus. |
| ∎ | Monitoring for potential conflicts of interests that may impact the nature of the services that your funds receive. |
We believe one of the most important services we provide our fund shareholders is the annual review of the funds’ advisory and sub-advisory contracts with Invesco Advisers and its affiliates. This review is required by the Investment Company Act of 1940 and focuses on the nature and quality of the services Invesco provides as the adviser to the Invesco funds and the reasonableness of the fees that it charges for those services. Each year, we spend months carefully reviewing information received from Invesco and a variety of independent sources, such as performance and fee data prepared by Lipper, Inc. (a subsidiary of Broadridge Financial Solutions, Inc.), an independent, third-party firm widely recognized as a leader in its field. We also meet with our independent legal counsel and other independent advisers to review and help us assess the information that we have received. Our goal is to assure that you receive quality investment management services for a reasonable fee.
I trust the measures outlined above provide assurance that you have a worthy advocate when it comes to choosing the Invesco Funds.
As always, please contact me at bruce@brucecrockett.com with any questions or concerns you may have. On behalf of the Board, we look forward to continuing to represent your interests and serving your needs.
Sincerely,

Bruce L. Crockett
Independent Chair
Invesco Funds Board of Trustees
| 3 | Invesco Multi-Asset Inflation Fund |
Management’s Discussion of Fund Performance
Performance summary For the year ended December 31, 2017, Class A shares of Invesco Multi-Asset Inflation Fund (the Fund), at net asset value (NAV), outperformed the Bloomberg Barclays 1-3 Month Treasury Bill Index, the Fund’s broad market index. Your Fund’s long-term performance appears later in this report.
|
| |||
Fund vs. Indexes | ||||
Total returns, 12/31/16 to 12/31/17, at net asset value (NAV). Performance shown does not include applicable contingent deferred sales charges (CDSC) or front-end sales charges, which would have reduced performance.
|
| |||
Class A Shares | 6.27 | % | ||
Class C Shares | 5.48 | |||
Class R Shares | 6.05 | |||
Class Y Shares | 6.62 | |||
Class R5 Shares | 6.63 | |||
Class R6 Shares | 6.63 | |||
Bloomberg Barclays 1-3 Month Treasury Bill Indexq (Broad Market Index) | 0.82 | |||
U.S. Consumer Price Index∎ (Style-Specific Index) | 2.11 | |||
Lipper Flexible Portfolio Funds Index¨ (Peer Group Index) | 15.47 | |||
Source(s): qFactSet Research Systems Inc.; ∎Bloomberg L.P.; ¨Lipper Inc. | ||||
Market conditions and your Fund
Despite highly destructive hurricanes that threatened to derail a years-long economic recovery, the US economy continued to expand throughout the year ended December 31, 2017. Gross domestic product – the value of all goods and services produced in the US – expanded in the first three quarters of 2017.
Given signs of an improving economy, the US Federal Reserve (the Fed) raised interest rates three times during the reporting period, most recently in December 2017; each rate hike was 25 basis points.1 (A basis point is 0.01%.) The Fed pledged that “realized and expected economic conditions relative to its objectives of maximum employment and 2 percent inflation” will guide its future actions. At the close of the reporting period, Fed policy remained accommodative, and the fed funds target rate stood at a range of 1.25% to 1.50% - 75 basis points higher than at the start of the reporting period.1
Higher inventories and a worsening outlook caused oil prices and many energy stocks to decline during the first half of 2017. However, oil prices rose
significantly in the second half of the reporting period as expectations for lower supplies increased, partly due to continued OPEC production cuts, and demand began normalizing.
Major US stock market indexes repeatedly hit all-time highs throughout the reporting period. The stock market rally that began after the 2016 presidential election continued throughout the reporting period, fueled by generally positive economic data, strong corporate earnings and improved consumer confidence. Finally, after much debate in Congress, a tax reform bill was signed into law in December 2017, which further strengthened stocks.
The Fund seeks to protect the purchasing power of investors from inflation through exposure to a broad spectrum of asset classes by investing in underlying mutual funds, exchange-traded funds and other pooled investment vehicles. During the reporting period, US inflation remained subdued even as unemployment continued its multiyear decline and the economy continued to expand. In the 12 months through December 2017, the U.S. Consumer Price Index increased 2.11%.2
From an asset class perspective, the
| Portfolio Composition* | ||||
By fund type, based on total investments
| ||||
Equity Funds | 41.0 | % | ||
Fixed Income Funds | 34.4 | |||
Alternative Funds | 24.1 | |||
Money Market Funds | 0.5 | |||
Total Net Assets | $ | 1.4 million |
The Fund’s holdings are subject to change, and there is no assurance that the Fund will continue to hold any particular security.
Data presented here are as of December 31, 2017.
| * | Based on the Schedule of Investments, which classifies each underlying fund and other investments into broad asset classes based on their predominant investments. |
top contributors to absolute Fund performance during the reporting period were health care, infrastructure and US equities. Health care was the largest contributor due to the Fund’s investments in iShares U.S. Healthcare ETF and Invesco Global Health Care Fund, which benefited from its allocations to companies in bio-tech, pharmaceuticals and managed care. Other strong individual contributors included Invesco Global Infrastructure Fund and iShares U.S. Consumer Goods ETF, which both benefited from the continued expansion of the US economy.
The only detractor from absolute Fund performance was Invesco Energy Fund, which posted negative returns due to a sharp drop in oil prices early in the reporting period. While fixed income did not detract from absolute performance, underlying funds representing the asset class posted tepid returns, in the low to high single digits, which weighed on Fund results.
More broadly, it is important to emphasize that the Fund is designed to invest in inflation-sensitive asset classes. Under normal market conditions, price pressures are expected to manifest in such inflation-sensitive asset classes, particularly during periods of economic growth and low unemployment. But as of the close of the reporting period, the Fed also recognized that inflationary pressure had yet to fully manifest, and the returns of inflation-sensitive asset classes trailed the broader equity market.
Please note that some of the Fund’s underlying funds - which include, but are not limited to, Invesco Balanced-Risk Commodity Strategy Fund, Invesco Emerging Markets Flexible Bond Fund and Invesco Global Health Care Fund - may use derivatives, including futures and total return swaps, which may amplify traditional investment risks through the creation of leverage in the underlying funds. Therefore, performance of these underlying funds, both positive and negative, can be attributed to these instruments.
During the reporting period, we swapped some of the underlying holdings in order to adjust exposures to certain asset classes. Specifically, we replaced Invesco Global Healthcare Fund with iShares U.S. Healthcare Portfolio. We also replaced Invesco Global Real Estate Fund with Invesco Global Real Estate Income Fund. Additionally, we replaced iShares TIPS Bond ETF with Invesco Short Duration Inflation Protection Fund.
| 4 | Invesco Multi-Asset Inflation Fund |
We also trimmed our position in Invesco Energy Fund and used the proceeds to create a position in Energy Select Sector SPDR Fund.
Thank you for investing in Invesco Multi-Asset Inflation Fund.
| 1 | Source: US Federal Reserve |
| 2 | Source: Bloomberg L.P. |
The views and opinions expressed in management’s discussion of Fund performance are those of Invesco Advisers, Inc. These views and opinions are subject to change at any time based on factors such as market and economic conditions. These views and opinions may not be relied upon as investment advice or recommendations, or as an offer for a particular security. The information is not a complete analysis of every aspect of any market, country, industry, security or the Fund. Statements of fact are from sources considered reliable, but Invesco Advisers, Inc. makes no representation or warranty as to their completeness or accuracy. Although historical performance is no guarantee of future results, these insights may help you understand our investment management philosophy.
See important Fund and, if applicable, index disclosures later in this report.
| Duy Nguyen Chartered Financial Analyst, Portfolio Manager and Chief Investment Officer of Invesco’s Global Solutions Development and Implementation Team, is manager of Invesco | |
| Multi-Asset Inflation Fund. He joined Invesco in 2000. Mr. Nguyen earned a BBA from The University of Texas at Austin and an MS from the University of Houston. | ||

| Jacob Borbidge Chartered Financial Analyst, Portfolio Manager and Head of Research for Invesco’s Global Solutions Development and Implementation Team, is manager of Invesco Multi-Asset | |
Inflation Fund. He joined Invesco in 2004. Mr. Borbidge earned a BS in mechanical engineering from Lehigh University and an MS in finance from the University of Houston.
Assisted by Invesco’s Global Solutions Development & Implementation Team | ||

| 5 | Invesco Multi-Asset Inflation Fund |
Your Fund’s Long-Term Performance
Results of a $10,000 Investment – Oldest Share Class(es) since Inception
Fund and index data from 10/14/14*
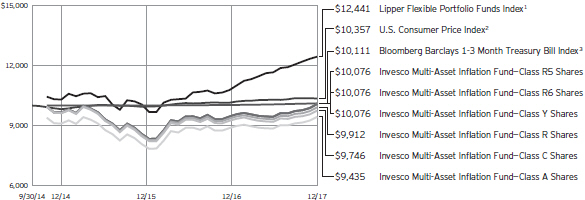
| 1 | Source: Lipper Inc. |
| 2 | Source: Bloomberg L.P. |
| 3 | Source: FactSet Research Systems Inc. |
| *U.S. | Consumer Price Index data are monthly. Performance is from Sept. 30, 2014, the month-end closest to Fund inception. |
Past performance cannot guarantee comparable future results.
The data shown in the chart include reinvested distributions, applicable sales charges and Fund expenses including
management fees. Index results include reinvested dividends, but they do not reflect sales charges. Performance of the peer group, if applicable, reflects fund expenses and management fees; performance
of a market index does not. Performance shown in the chart and table(s) does not reflect deduction of taxes a shareholder would pay on Fund distributions or sale of Fund shares.
| 6 | Invesco Multi-Asset Inflation Fund |
Average Annual Total Returns | ||
As of 12/31/17, including maximum applicable sales charges | ||
Class A Shares | ||||
Inception (10/14/14) | -1.79% | |||
1 Year | 0.44 | |||
Class C Shares | ||||
Inception (10/14/14) | -0.80% | |||
1 Year | 4.48 | |||
Class R Shares | ||||
Inception (10/14/14) | -0.28% | |||
1 Year | 6.05 | |||
Class Y Shares | ||||
Inception (10/14/14) | 0.24% | |||
1 Year | 6.62 | |||
Class R5 Shares | ||||
Inception (10/14/14) | 0.24% | |||
1 Year | 6.63 | |||
Class R6 Shares | ||||
Inception (10/14/14) | 0.24% | |||
1 Year | 6.63 | |||
The performance data quoted represent past performance and cannot guarantee comparable future results; current performance may be lower or higher. Please visit invesco.com/performance for the most recent month-end performance. Performance figures reflect reinvested distributions, changes in net asset value and the effect of the maximum sales charge unless otherwise stated. Investment return and principal value will fluctuate so that you may have a gain or loss when you sell shares.
The net annual Fund operating expense ratio set forth in the most recent Fund prospectus as of the date of this report for Class A, Class C, Class R, Class Y, Class R5 and Class R6 shares was 1.02%, 1.77%, 1.27%, 0.77%, 0.77% and 0.77%, respectively.1,2 The total annual Fund operating expense ratio set forth in the most recent Fund prospectus as of the date of this report for Class A, Class C, Class R, Class Y, Class R5 and Class R6 shares was 36.33%, 37.08%, 36.58%, 36.08%, 35.91% and 35.91%, respectively.1 The expense ratios presented above may vary from the expense ratios presented in other sections of this report that are based on expenses incurred during the period covered by this report.
Class A share performance reflects the maximum 5.50% sales charge, and Class C share performance reflects the applicable contingent deferred sales
charge (CDSC) for the period involved. The CDSC on Class C shares is 1% for the first year after purchase. Class R, Class Y, Class R5 and Class R6 class shares do not have a front-end sales charge or a CDSC; therefore, performance is at net asset value.
The performance of the Fund’s share classes will differ primarily due to different sales charge structures and class expenses.
Fund performance reflects any applicable fee waivers and/or expense reimbursements. Had the adviser not waived fees and/or reimbursed expenses currently or in the past, returns would have been lower. See current prospectus for more information.
| 1 | The expense ratio includes acquired fund fees and expenses of the underlying funds in which the Fund invests of 0.74% for Invesco Multi-Asset Inflation Fund. |
| 2 | Total annual Fund operating expenses after any contractual fee waivers and/or expense reimbursements by the adviser in effect through at least April 30, 2019. See current prospectus for more information. |
| 7 | Invesco Multi-Asset Inflation Fund |
Invesco Multi-Asset Inflation Fund’s investment objective is total return, comprised of current income and capital appreciation.
| ∎ | Unless otherwise stated, information presented in this report is as of December 31, 2017, and is based on total net assets. |
| ∎ | Unless otherwise noted, all data provided by Invesco. |
| ∎ | To access your Fund’s reports/prospectus, visit invesco.com/fundreports. |
About share classes ∎ ClassR shares are generally available only to employer sponsored retirement and benefit plans. Please see the prospectus for more information. ∎ ClassY shares are available only to certain investors. Please see the prospectus for more information. ∎ ClassR5 shares and Class R6 shares are available for use by retirement plans that meet certain standards and for institutional investors. Class R6 shares are also available through intermediaries that have established an agreement with Invesco Distributors, Inc. to make such shares available for use in retail omnibus accounts. Please see the prospectus for more information.
Principal risks of investing in the Fund ∎ Fund of funds risk. The Fund’s performance depends on that of the underlying funds in which it invests. Accordingly, the risks associated with an investment in the Fund include the risks associated with investments in the underlying funds. The Fund will indirectly pay a proportional share of the fees and expenses of the underlying funds in which it invests. There are risks that the Fund will vary from its target weightings (if any) in the underlying funds, that the underlying funds will not achieve their investment objectives, that the underlying funds’ performance may be lower than their represented asset classes, and that the Fund may withdraw its investments in an underlying fund at a disadvantageous time. ∎ Allocation risk. The Fund’s investment performance depends, in part, on how its assets are allocated among the underlying funds or asset classes. The Adviser’s evaluations and assumptions regarding the asset classes or the underlying funds in which the Fund invests may be incorrect, causing the Fund to be invested (or not invested) in one or more asset classes or underlying | funds at an inopportune time, which could negatively affect the Fund’s performance.
The principal risks of investing in the Fund also include the risks of each underlying fund. The risks of the Fund and underlying funds include the following: ∎ Active trading risk. Active trading of portfolio securities may result in added expenses, a lower return and increased tax liability. ∎ Bank loan risk. There are a number of risks associated with an investment in bank loans including, credit risk, interest rate risk, liquidity risk and prepayment risk. Lack of an active trading market, restrictions on resale, irregular trading activity, wide bid/ask spreads and extended trade settlement periods may impair an underlying fund’s ability to sell bank loans within its desired time frame or at an acceptable price and its ability to accurately value existing and prospective investments. Extended trade settlement periods may result in cash not being immediately available to an underlying fund. As a result, an underlying fund may have to sell other investments or engage in borrowing transactions to raise cash to meet its obligations. The risk of holding bank loans is also directly tied to the risk of insolvency or bankruptcy of the issuing banks. These risks could cause an underlying fund to lose income or principal on a particular investment, which in turn could affect the underlying fund’s returns. The value of bank loans can be affected by and sensitive to changes in government regulation and to economic downturns in the United States and abroad. Bank loans generally are floating rate loans, which are subject to interest rate risk as the interest paid on the floating rate loans adjusts periodically based on changes in widely accepted reference rates. ∎ Changing fixed income market conditions risk. The current low interest rate | environment was created in part by the Federal Reserve Board (FRB) and certain foreign central banks keeping the federal funds and equivalent foreign rates near, at or below zero. Increases in the federal funds and equivalent foreign rates may expose fixed income markets to heightened volatility and reduced liquidity for certain fixed income investments, particularly those with longer maturities. In addition, decreases in fixed income dealer market-making capacity may also potentially lead to heightened volatility and reduced liquidity in the fixed income markets. As a result, the value of an underlying fund’s investments and share price may decline. Changes in central bank policies could also result in higher than normal shareholder redemptions, which could potentially increase portfolio turnover and an underlying fund’s transaction costs. ∎ Commodities tax risk. The tax treatment of commodity-linked derivative instruments may be adversely affected by changes in legislation, regulations or other legally binding authority. If, as a result of any such adverse action, the income of an underlying fund from certain commodity-linked derivatives was treated as non-qualifying income, an underlying fund might fail to qualify as a regulated investment company and be subject to federal income tax at the fund level. As a result of a recent announcement by the Internal Revenue Service, an underlying fund intends to invest in commodity-linked notes: (a) directly, generally only to the extent that it obtains an opinion of counsel confirming that income from such investments should be qualifying income because such commodity-linked notes constitute securities under section 2(a)(36) of the 1940 Act or (b) indirectly through the Subsidiary. Should the Internal Revenue Service issue further guidance, or Congress enact legislation, that adversely affects the tax treatment of an underlying fund’s use of commodity-linked notes or a wholly-owned subsidiary (which guidance might be applied to the underlying fund retroactively), it could, among other consequences, limit the underlying fund’s ability to pursue its investment strategy. ∎ Commodity-linked notes risk. In addition to risks associated with the underlying | ||
This report must be accompanied or preceded by a currently effective Fund prospectus, which contains more complete information, including sales charges and expenses. Investors should read it carefully before investing.
| ||||
| NOT FDIC INSURED | MAY LOSE VALUE | NO BANK GUARANTEE | ||||
| 8 | Invesco Multi-Asset Inflation Fund |
commodities, investments in commodity-linked notes may be subject to additional risks, such as non-payment of interest and loss of principal, counterparty risk, lack of a secondary market and risk of greater volatility than traditional equity and debt securities. The value of the commodity-linked notes an underlying fund buys may fluctuate significantly because the values of the underlying investments to which they are linked are themselves volatile. Additionally, certain commodity-linked notes employ “economic” leverage by requiring payment by the issuer of an amount that is a multiple of the price increase or decrease of the underlying commodity, commodity index, or other economic variable. Such economic leverage will increase the volatility of the value of these commodity-linked notes and an underlying fund to the extent it invests in such notes. ∎Commodity risk. An underlying fund will concentrate its investments in commodities markets and will therefore have investment exposure to the commodities markets and one or more sectors of the commodities markets, which may subject an underlying fund to greater volatility than investments in traditional securities, such as stocks and bonds. Volatility in the commodities markets may be caused by changes in overall market movements, domestic and foreign political and economic events and policies, war, acts of terrorism, changes in domestic or foreign interest rates and/or investor expectations concerning interest rates, domestic and foreign inflation rates, investment and trading activities of mutual funds, hedge funds and commodities funds, and factors such as drought, floods, weather, livestock disease, embargoes, tariffs and other regulatory developments, or supply and demand disruptions. Because an underlying fund’s performance may be linked to the performance of volatile commodities, investors should be willing to assume the risks of potentially significant fluctuations in the value of an underlying fund’s shares. • Consumer discretionary sector risk. An underlying fund may concentrate its investments in securities of issuers in the consumer discretionary sector. Companies engaged in the consumer discretionary sector are affected by fluctuations in supply and demand, changes in consumer preferences and spending, political and economic conditions, | commodity price volatility, changes in exchange rates, imposition of import controls, increased competition, depletion of resources and labor relations. ∎ Correlation risk. Because an underlying fund’s investment strategy seeks to balance risk across three asset classes and, within each asset class, across different countries and investments, to the extent either the asset classes or the selected countries and investments become correlated in a way not anticipated an underlying fund’s adviser, an underlying fund’s risk allocation process may result in magnified risks and loss instead of balancing (reducing) the risk of loss. ∎ Debt securities risk. The prices of debt securities held by an underlying fund will be affected by changes in interest rates, the creditworthiness of the issuer and other factors. An increase in prevailing interest rates typically causes the value of existing debt securities to fall and often has a greater impact on longer-duration debt securities and higher quality debt securities. Falling interest rates will cause an underlying fund to reinvest the proceeds of debt securities that have been repaid by the issuer at lower interest rates. Falling interest rates may also reduce an underlying fund’s distributable income because interest payments on floating rate debt instruments held by an underlying fund will decline. An underlying fund could lose money on investments in debt securities if the issuer or borrower fails to meet its obligations to make interest payments and/or to repay principal in a timely manner. Changes in an issuer’s financial strength, the market’s perception of such strength or in the credit rating of the issuer or the security may affect the value of debt securities. An underlying fund’s adviser’s credit analysis may fail to anticipate such changes, which could result in buying a debt security at an inopportune time or failing to sell a debt security in advance of a price decline or other credit event. ∎ Derivatives risk. The value of a derivative instrument depends largely on (and is derived from) the value of an underlying security, currency, commodity, interest rate, index or other asset (each referred to as an underlying asset). In addition to risks relating to the underlying assets, the use of derivatives may include other, possibly greater, risks, including counterparty, leverage and liquidity risks. Counterparty | risk is the risk that the counterparty to the derivative contract will default on its obligation to pay the underlying fund the amount owed or otherwise perform under the derivative contract. Derivatives create leverage risk because they do not require payment up front equal to the economic exposure created by owning the derivative. As a result, an adverse change in the value of the underlying asset could result in the underlying fund sustaining a loss that is substantially greater than the amount invested in the derivative, which may make the underlying fund’s returns more volatile and increase the risk of loss. Derivative instruments may also be less liquid than more traditional investments and the underlying fund may be unable to sell or close out its derivative positions at a desirable time or price. This risk may be more acute under adverse market conditions, during which the underlying fund may be most in need of liquidating its derivative positions. Derivatives may also be harder to value, less tax efficient and subject to changing government regulation that could impact the underlying fund’s ability to use certain derivatives or their cost. The SEC has proposed new regulations related to the use of derivatives and related instruments by registered investment companies. If adopted as proposed, these regulations would limit an underlying fund’s ability to engage in derivatives transactions and may result in increased costs or require an underlying fund to modify its investment strategies or to liquidate. Also, derivatives used for hedging or to gain or limit exposure to a particular market segment may not provide the expected benefits, particularly during adverse market conditions. These risks are greater for certain underlying funds than most other mutual funds because certain underlying funds will implement their investment strategy primarily through derivative instruments rather than direct investments in stocks/bonds. ∎ Emerging markets securities risk. Emerging markets (also referred to as developing markets) are generally subject to greater market volatility, political, social and economic instability, uncertain trading markets and more governmental limitations on foreign investment than more developed markets. In addition, companies operating in emerging markets may be subject to lower trading volume and greater price fluctuations than companies in more |
| 9 | Invesco Multi-Asset Inflation Fund |
developed markets. Securities law and the enforcement of systems of taxation in many emerging market countries may change quickly and unpredictably. In addition, investments in emerging markets securities may also be subject to additional transaction costs, delays in settlement procedures, and lack of timely information. ∎ Energy sector risk. An underlying fund will concentrate its investments in the securities of issuers engaged primarily in energy-related industries. Changes in worldwide energy prices, exploration and production spending, government regulation, world events, economic conditions, exchange rate, transportation and storage costs and labor relations can affect companies in the energy sector. In addition, these companies are at an increased risk of civil liability and environmental damage claims, and are also subject to the risk of loss from terrorism and natural disasters. ∎ Exchange-traded funds risk. In addition to the risks associated with the underlying assets held by the exchange-traded fund, investments in exchange-traded funds are subject to the following additional risks: (1) an exchange-traded fund’s shares may trade above or below its net asset value; (2) an active trading market for the exchange-traded fund’s shares may not develop or be maintained; (3) trading an exchange-traded fund’s shares may be halted by the listing exchange; (4) a passively-managed exchange-traded fund may not track the performance of the reference asset; and (5) a passively managed exchange-traded fund may hold troubled securities. Investment in exchange-traded funds may involve duplication of management fees and certain other expenses, as the Fund or an underlying fund indirectly bears its proportionate share of any expenses paid by the exchange-traded funds in which it invests. Further, certain exchange-traded funds in which the Fund or an underlying fund may invest are leveraged, which may result in economic leverage, permitting the Fund or an underlying fund to gain exposure that is greater than would be the case in an unlevered instrument, and potentially resulting in greater volatility. ∎ Exchange-traded fund industry concentration risk. In following its methodology, an underlying exchange-traded fund’s underlying index from time to time may be concentrated to a significant degree in securities of issuers located in a single industry or sector. To | the extent that an underlying fund’s underlying index concentrates in the securities of issuers in a particular industry or sector, an underlying fund will also concentrate its investments to approximately the same extent. By concentrating its investments in an industry or sector, an underlying fund faces more risks than if it were diversified broadly over numerous industries or sectors. Such industry-based risks, any of which may adversely affect the companies in which an underlying fund invests, may include, but are not limited to, the following: general economic conditions or cyclical market patterns that could negatively affect supply and demand in a particular industry; competition for resources, adverse labor relations, political or world events; obsolescence of technologies; and increased competition or new product introductions that may affect the profitability or viability of companies in an industry. In addition, at times, such industry or sector may be out of favor and underperform other industries or the market as a whole. ∎ Exchange-traded notesrisk. Exchange-traded notes are subject to credit risk, counterparty risk, and the risk that the value of the exchange-traded note may drop due to a downgrade in the issuer’s credit rating. The value of an exchange-traded note may also be influenced by time to maturity, level of supply and demand for the exchange-traded note, volatility and lack of liquidity in the underlying market, changes in the applicable interest rates, and economic, legal, political, or geographic events that affect the referenced underlying market or assets. An underlying fund will bear its proportionate share of any fees and expenses borne by an exchange-traded note in which it invests. For certain exchange-traded notes, there may be restrictions on an underlying fund’s right to redeem its investment in an exchange-traded note, which is meant to be held until maturity. ∎ Foreign currency tax risk. If the US Treasury Department were to exercise its authority to issue regulations that exclude from the definition of “qualifying income” foreign currency gains not directly related to an underlying fund’s business of investing in securities, the underlying fund may be unable to qualify as a regulated investment company for one or more years. In this event, the underlying fund’s Board of Trustees may authorize a significant change in investment strategy or other action. | ∎ Foreign government debt risk. Investments in foreign government debt securities (sometimes referred to as sovereign debt securities) involve certain risks in addition to those relating to foreign securities or debt securities generally. The issuer of the debt or the governmental authorities that control the repayment of the debt may be unable or unwilling to repay principal or interest when due in accordance with the terms of such debt, and an underlying fund may have limited recourse in the event of a default against the defaulting government. Without the approval of debt holders, some governmental debtors have in the past been able to reschedule or restructure their debt payments or declare moratoria on payments. ∎ Foreign securities risk. An underlying fund’s foreign investments may be adversely affected by political and social instability, changes in economic or taxation policies, difficulty in enforcing obligations, decreased liquidity or increased volatility. Foreign investments also involve the risk of the possible seizure, nationalization or expropriation of the issuer or foreign deposits (in which an underlying fund could lose its entire investments in a certain market) and the possible adoption of foreign governmental restrictions such as exchange controls. Unless an underlying fund has hedged its foreign securities risk, foreign securities risk also involves the risk of negative foreign currency rate fluctuations, which may cause the value of securities denominated in such foreign currency (or other instruments through which an underlying fund has exposure to foreign currencies) to decline in value. Currency exchange rates may fluctuate significantly over short periods of time. Currency hedging strategies, if used, are not always successful. ∎ Geographic focus risk. An underlying fund may from time to time invest a substantial amount of its assets in securities of issuers located in a single country or a limited number of countries. Adverse economic, political or social conditions in those countries may therefore have a significant negative impact on an underlying fund’s investment performance. ∎ Gold and precious metals sector risk. An underlying fund will concentrate its investments in the securities of issuers primarily engaged in gold and precious metals-related industries. Fluctuations in the price of gold and precious metals |
| 10 | Invesco Multi-Asset Inflation Fund |
resulting from supply and demand imbalances, increased mining, transportation or storage costs or other market forces will have a significant impact on the profitability of companies in the gold and precious metals sector. The price of gold and precious metals may also be affected by changes in political or economic conditions of countries where gold and precious metals companies are located. ∎ Gold bullion risk. To the extent an underlying fund invests in gold bullion, it will earn no income from such investment. Appreciation in the market price of gold is the sole manner in which an underlying fund can realize gains on gold bullion, and such investments may incur higher storage and custody costs as compared to purchasing, holding and selling more traditional investments. ∎ Health care sector risk. An underlying fund will concentrate its investments in the securities of domestic and foreign issuers in the health care sector. The health care sector is subject to significant government regulations, increases or decreases in the cost of medical products and services, and competitive forces that could negatively impact a health care company’s profitability. The health care sector may also be affected by government health care programs. ∎ High yield debt securities (junk bond) risk. Investments in high yield debt securities (“junk bonds”) and other lower-rated securities will subject an underlying fund to substantial risk of loss. These securities are considered to be speculative with respect to the issuer’s ability to pay interest and principal when due, are more susceptible to default or decline in market value and are less liquid than investment grade debt securities. Prices of high yield debt securities tend to be very volatile. ∎ Indexing risk. An underlying fund is operated as a passively managed index fund and, therefore, the adverse performance of a particular security necessarily will not result in the elimination of the security from the underlying fund’s portfolio. Ordinarily, the underlying fund’s adviser will not sell the underlying fund’s portfolio securities except to reflect additions or deletions of the securities that comprise the underlying fund’s underlying index, or as may be necessary to raise cash to pay underlying fund shareholders who sell underlying fund shares. As such, the underlying fund will be negatively affected by declines in the securities | represented by its underlying index. Also, there is no guarantee that the underlying fund’s adviser will be able to correlate the underlying fund’s performance with that of its underlying index. ∎ Inflation-indexed securities risk. The values of inflation-indexed securities generally fluctuate in response to changes in real interest rates, and an underlying fund’s or the Fund’s income from its investments in these securities is likely to fluctuate considerably more than the income distributions of its investments in more traditional fixed income securities. ∎ Inflation-indexed securities tax risk. Any increase in the principal amount of an inflation-indexed security may be included for tax purposes in an underlying fund’s or the Fund’s gross income, even though no cash attributable to such gross income has been received by the underlying fund or the Fund. In such event, the underlying fund or the Fund may be required to make annual distributions to shareholders that exceed the cash it has otherwise received. In order to pay such distributions, the underlying fund or the Fund may be required to raise cash by selling portfolio investments. The sale of such investments could result in capital gains to the underlying fund or the Fund and additional capital gain distributions to the Fund. In addition, adjustments during the taxable year for deflation to an inflation-indexed bond held by an underlying fund or the Fund may cause amounts previously distributed to the Fund in the taxable year as income to be characterized as a return of capital, which could increase or decrease the Fund’s ordinary income distributions to you, and may cause some of the Fund’s distributed income to be classified as a return of capital. ∎ Infrastructure-related companies risk. An underlying fund will concentrate its investments in the infrastructure industry. Infrastructure-related companies are subject to a variety of risk factors, including costs associated with environmental, governmental and other regulations, high interest costs for capital construction programs, high leverage, the effects of economic slowdowns, surplus capacity, increased competition, fluctuations of fuel prices, the effects of energy conservation policies, unfavorable tax laws or accounting policies, environmental damage, difficulty in raising capital, increased susceptibility to terrorist acts or political actions, and general changes in | market sentiment towards infrastructure assets. ∎ Liquidity risk. An underlying fund may be unable to sell illiquid investments at the time or price it desires and, as a result, could lose its entire investment in such investments. Liquid securities can become illiquid during periods of market stress. If a significant amount of the an underlying fund’s securities become illiquid, an underlying fund may not be able to timely pay redemption proceeds and may need to sell securities at significantly reduced prices. ∎ Management risk. An underlying fund is actively managed and depends heavily on an underlying fund’s adviser’s judgment about markets, interest rates or the attractiveness, relative values, liquidity, or potential appreciation of particular investments made for an underlying fund’s portfolio. An underlying fund could experience losses if these judgments prove to be incorrect. Additionally, legislative, regulatory, or tax developments may adversely affect management of an underlying fund and, therefore, the ability of the underlying fund to achieve its investment objective. ∎ Market risk. The market values of the Fund’s or an underlying fund’s investments, and therefore the value of the Fund’s shares, will go up and down, sometimes rapidly or unpredictably. Market risk may affect a single issuer, industry or section of the economy, or it may affect the market as a whole. Individual stock prices tend to go up and down more dramatically than those of certain other types of investments, such as bonds. During a general downturn in the financial markets, multiple asset classes may decline in value. When markets perform well, there can be no assurance that specific investments held by the Fund or an underlying fund will rise in value. ∎ Market trading risk. An underlying exchange-traded fund faces numerous market trading risks, including the potential lack of an active market for its shares, losses from trading in secondary markets, and disruption in the creation/redemption process of an underlying fund. Any of these factors may lead to an underlying fund’s shares trading at a premium or discount to an underlying fund’s net asset value (NAV). |
| 11 | Invesco Multi-Asset Inflation Fund |
∎ MLP risk. An underlying fund invests in securities of MLPs, which are subject to the following risks: – Limited partner risk. An MLP is a public limited partnership or limited liability company taxed as a partnership under the Internal Revenue Code of 1986, as amended (the Code). Although the characteristics of MLPs closely resemble a traditional limited partnership, a major difference is that MLPs may trade on a public exchange or in the over-the-counter market. The risks of investing in an MLP are similar to those of investing in a partnership, including more flexible governance structures, which could result in less protection for investors than investments in a corporation. Investors in an MLP normally would not be liable for the debts of the MLP beyond the amount that the investor has contributed but investors may not be shielded to the same extent that a shareholder of a corporation would be. In certain circumstances, creditors of an MLP would have the right to seek return of capital distributed to a limited partner, which right would continue after an investor sold its investment in the MLP. – Liquidity risk. The ability to trade on a public exchange or in the over-the-counter market provides a certain amount of liquidity not found in many limited partnership investments. However, MLP interests may be less liquid than conventional publicly traded securities and, therefore, more difficult to trade at desirable times and/or prices. – Interest rate risk. In addition, MLP distributions may be reduced by fees and other expenses incurred by the MLP. MLPs generally are considered interest-rate sensitive investments. During periods of interest rate volatility, these investments may not provide attractive returns. – General partner risk. The holder of the general partner or managing member interest can be liable in certain circumstances for amounts greater than the amount of the holder’s investment in the general partner or managing member. Additionally, if an underlying fund were to invest more than 25% of its total assets in MLPs that are taxed as partnerships this could cause an underlying fund to lose its status as regulated investment company under Subchapter M of the Code. | ∎ MLP tax risk. MLPs taxed as partnerships do not pay US federal income tax at the partnership level. A change in current tax law, or a change in the underlying business mix of a given MLP, however, could result in an MLP being classified as a corporation for US federal income tax purposes, which would have the effect of reducing the amount of cash available for distribution by the MLP and, as a result, could result in a reduction of the value of an underlying fund’s investment, and consequently the Fund’s investment in an underlying fund and lower income. ∎ Non-diversification risk. An underlying fund is non-diversified and can invest a greater portion of its assets in the obligations or securities of a small number of issuers or any single issuer than a diversified fund can. A change in the value of one or a few issuers’ securities will therefore affect the value of an underlying fund more than would occur in a diversified fund. ∎ Real estate investment trust (REIT) risk/real estate risk. An underlying fund concentrates its investments in the securities of real estate and real estate related companies. Investments in real estate related instruments may be affected by economic, legal, cultural, environmental or technological factors that affect property values, rents or occupancies of real estate related to an underlying fund’s holdings. Shares of real estate related companies, which tend to be small- and mid-cap companies, may be more volatile and less liquid than larger companies. If a real estate related company defaults on certain types of debt obligations, an underlying fund may own real estate directly, which involves additional risks such as environmental liabilities; difficulty in valuing and selling the real estate; and economic or regulatory changes. ∎ Sampling risk. An underlying fund’s use of a representative sampling approach will result in its holding a smaller number of securities than are in its underlying index and in the underlying fund holding securities not included in its underlying index. As a result, an adverse development respecting an issuer of securities held by the underlying fund could result in a greater decline in the underlying fund’s NAV than would be the case if all of the securities in its underlying index were held. An underlying fund’s use of a representative sampling approach may also include the risk that it may not track the return of | itsunderlying index as well as it would have if the underlying fund held all of the securities in its underlying index. ∎ Securities lending risk. Securities lending involves a risk of loss because the borrower may fail to return the securities in a timely manner or at all, which may force an underlying fund to sell the collateral and purchase a replacement security in the market at a disadvantageous time. Any cash received as collateral will be invested in an affiliated money market fund and an underlying fund will bear any loss on the investment of cash collateral. ∎ Short position risk. Because an underlying fund’s potential loss on a short position arises from increases in the value of the asset sold short, the underlying fund will incur a loss on a short position, which is theoretically unlimited, if the price of the asset sold short increases from the short sale price. The counterparty to a short position or other market factors may prevent an underlying fund from closing out a short position at a desirable time or price and may reduce or eliminate any gain or result in a loss. In a rising market, an underlying fund’s short positions will cause the underlying fund to underperform the overall market and its peers that do not engage in shorting. If an underlying fund holds both long and short positions, and both positions decline simultaneously, the short positions will not provide any buffer (hedge) from declines in value of the underlying fund’s long positions. Certain types of short positions involve leverage, which may exaggerate any losses, potentially more than the actual cost of the investment, and will increase the volatility of an underlying fund’s returns. ∎ Small-and mid-capitalization companies risks. Small- and mid-capitalization companies tend to be more vulnerable to changing market conditions, may have little or no operating history or track record of success, and may have more limited product lines and markets, less experienced management and fewer financial resources than larger companies. These companies’ securities may be more volatile and less liquid than those of more established companies, and their returns may vary, sometimes significantly, from the overall securities market. ∎ Subsidiary risk. By investing in the Subsidiary, an underlying fund is indirectly exposed to risks associated with the Subsidiary’s investments. The Subsidiary |
| 12 | Invesco Multi-Asset Inflation Fund |
is not registered under the Investment Company Act of 1940, as amended (1940 Act), and, except as otherwise noted in this prospectus, is not subject to the investor protections of the 1940 Act. Changes in the laws of the United States and/or the Cayman Islands, under which an underlying fund and the Subsidiary, respectively, are organized, could result in the inability of an underlying fund and/or the Subsidiary to operate as described in this prospectus and the SAI, and could negatively affect an underlying fund and its shareholders. ∎ Unregistered funds risk. Certain of the underlying funds in which the Fund invests are not registered as investment companies under the 1940 Act. Therefore, the Fund’s investments in an unregistered fund will not have the regulatory protections afforded by the 1940 Act to investors in registered investment companies. ∎ US government obligations risk. Obligations of US government agencies and authorities receive varying levels of support and may not be backed by the full faith and credit of the US government, which could affect an underlying fund’s ability to recover should they default. No assurance can be given that the US government will provide financial support to its agencies and authorities if it is not obligated by law to do so. ∎ When-issued, delayed delivery and forward commitment risks. When-issued and delayed delivery transactions subject an underlying fund to market risk because the value or yield of a security at delivery may be more or less than the purchase price or yield generally available when delivery occurs, and counterparty risk because an underlying fund relies on the buyer or seller, as the case may be, to consummate the transaction. These transactions also have a leveraging effect on an underlying fund because an underlying fund commits to purchase securities that it does not have to pay for until a later date, which increases an underlying fund’s overall investment exposure and, as a result, its volatility. |
About indexes used in this report ∎ The Bloomberg Barclays 1-3 Month Treasury Bill Index is an unmanaged index considered representative of short-term US government debt instruments. ∎ The U.S. Consumer Price Index is a measure of change in consumer prices as determined by the US Bureau of Labor Statistics. ∎ The Lipper Flexible Portfolio Funds Index is an unmanaged index considered representative of flexible portfolio funds tracked by Lipper. ∎ The Fund is not managed to track the performance of any particular index, including the index(es) described here, and consequently, the performance of the Fund may deviate significantly from the performance of the index(es). ∎ A direct investment cannot be made in an index. Unless otherwise indicated, index results include reinvested dividends, and they do not reflect sales charges. Performance of the peer group, if applicable, reflects fund expenses; performance of a market index does not.
Other information ∎ The returns shown in management’s discussion of Fund performance are based on net asset values (NAVs) calculated for shareholder transactions. Generally accepted accounting principles require adjustments to be made to the net assets of the Fund at period end for financial reporting purposes, and as such, the NAVs for shareholder transactions and the returns based on those NAVs may differ from the NAVs and returns reported in the Financial Highlights. |
| 13 | Invesco Multi-Asset Inflation Fund |
Schedule of Investments
December 31, 2017
Invesco Multi-Asset Inflation Fund
Schedule of Investments in Affiliated and Unaffiliated Issuers–100.08%(a)
| % of Net Assets 12/31/17 | Value 12/31/16 | Purchases at Cost | Proceeds from Sales | Change in Unrealized Appreciation (Depreciation) | Realized Gain (Loss) | Dividend Income | Shares 12/31/17 | Value 12/31/17 | ||||||||||||||||||||||||||||
Alternative Funds–7.83% |
| |||||||||||||||||||||||||||||||||||
PowerShares DB Oil Fund–ETF(b) | 7.83 | % | $ | 75,252 | $ | 80,284 | $ | (55,680 | ) | $ | 9,263 | $ | 369 | $ | — | 10,787 | $ | 109,488 | ||||||||||||||||||
Asset Allocation Funds–9.54% |
| |||||||||||||||||||||||||||||||||||
Invesco Balanced-Risk Commodity Strategy | 9.54 | % | 74,275 | 85,584 | (32,908 | ) | 8,188 | (1,737 | ) | 59 | 18,658 | 133,402 | ||||||||||||||||||||||||
Domestic Equity Funds–26.37% |
| |||||||||||||||||||||||||||||||||||
Energy Select Sector SPDR Fund (The)–ETF(c) | 5.81 | % | — | 84,397 | (8,517 | ) | 5,336 | 77 | 2,061 | 1,125 | 81,293 | |||||||||||||||||||||||||
Invesco Energy Fund–Class R5 | 5.82 | % | 90,803 | 111,237 | (107,348 | ) | (5,524 | ) | (7,814 | ) | 2,460 | 3,162 | 81,354 | |||||||||||||||||||||||
iShares U.S. Consumer Goods–ETF(c) | 7.06 | % | 57,242 | 59,366 | (28,506 | ) | 8,925 | 1,696 | 1,642 | 779 | 98,723 | |||||||||||||||||||||||||
iShares U.S. Health Care–ETF(c) | 7.68 | % | — | 123,273 | (25,798 | ) | 9,309 | 716 | 879 | 617 | 107,500 | |||||||||||||||||||||||||
Total Domestic Equity Funds | 148,045 | 378,273 | (170,169 | ) | 18,046 | (5,325 | ) | 7,042 | 368,870 | |||||||||||||||||||||||||||
Fixed-Income Funds–34.40% |
| |||||||||||||||||||||||||||||||||||
Invesco Emerging Market Flexible Bond | 1.96 | % | 17,245 | 13,113 | (3,372 | ) | 528 | (9 | ) | 1,106 | 4,136 | 27,505 | ||||||||||||||||||||||||
Invesco Floating Rate Fund–Class R6 | 4.90 | % | 42,664 | 40,022 | (14,003 | ) | (105 | ) | (61 | ) | 2,665 | 9,063 | 68,517 | |||||||||||||||||||||||
Invesco High Yield Fund–Class R6 | 4.47 | % | 37,232 | 35,269 | (10,421 | ) | 669 | (189 | ) | 2,846 | 14,966 | 62,560 | ||||||||||||||||||||||||
Invesco Quality Income Fund–Class R5 | 1.96 | % | 22,470 | 13,420 | (8,221 | ) | (81 | ) | (207 | ) | 899 | 2,282 | 27,381 | |||||||||||||||||||||||
Invesco Short Duration Inflation Protected | 14.84 | % | 132,485 | 129,572 | (51,094 | ) | (3,008 | ) | (406 | ) | 4,265 | 20,034 | 207,549 | |||||||||||||||||||||||
Invesco U.S. Government Fund–Class R5 | 6.27 | % | 58,344 | 54,026 | (24,485 | ) | 316 | (541 | ) | 1,734 | 9,950 | 87,660 | ||||||||||||||||||||||||
PowerShares Fundamental Investment Grade Corporate Bond Portfolio–ETF | 0.00 | % | 17,024 | — | (17,104 | ) | 501 | (421 | ) | — | — | — | ||||||||||||||||||||||||
Total Fixed–Income Funds | 327,464 | 285,422 | (128,700 | ) | (1,180 | ) | (1,834 | ) | 13,515 | 481,172 | ||||||||||||||||||||||||||
Foreign Equity Funds–14.70% |
| |||||||||||||||||||||||||||||||||||
Invesco Global Health Care Fund–Class Y | 0.00 | % | 67,604 | 36,961 | (112,486 | ) | 8,934 | (1,013 | ) | — | — | — | ||||||||||||||||||||||||
Invesco Global Infrastructure Fund–Class R6 | 6.65 | % | 51,590 | 53,504 | (20,772 | ) | 7,957 | 2,825 | 2,226 | 8,835 | 93,033 | |||||||||||||||||||||||||
Invesco Gold & Precious Metals Fund–Class Y | 6.06 | % | 54,782 | 69,815 | (41,415 | ) | 2,810 | (1,283 | ) | 1,539 | 19,978 | 84,709 | ||||||||||||||||||||||||
Invesco International Growth Fund–Class R6 | 1.99 | % | 22,503 | 12,326 | (11,121 | ) | 3,766 | 671 | 562 | 758 | 27,904 | |||||||||||||||||||||||||
Total Foreign Equity Funds | 196,479 | 172,606 | (185,794 | ) | 23,467 | 1,200 | 4,327 | 205,646 | ||||||||||||||||||||||||||||
Real Estate Funds–6.74% |
| |||||||||||||||||||||||||||||||||||
Invesco Global Real Estate Fund–Class R6 | 0.00 | % | 51,780 | 38,765 | (92,951 | ) | 925 | 1,481 | 274 | — | — | |||||||||||||||||||||||||
Invesco Global Real Estate Income Fund–Class R6 | 6.74 | % | — | 105,819 | (12,981 | ) | 1,530 | (29 | ) | 2,970 | 10,367 | 94,339 | ||||||||||||||||||||||||
Total Real Estate Funds | 51,780 | 144,584 | (105,932 | ) | 2,455 | 1,452 | 3,244 | 94,339 | ||||||||||||||||||||||||||||
Money Market Funds–0.50% |
| |||||||||||||||||||||||||||||||||||
Invesco Government & Agency Portfolio–Institutional Class, 1.18%(e) | 0.18 | % | 15,911 | 523,867 | (537,312 | ) | — | — | 56 | 2,466 | 2,466 | |||||||||||||||||||||||||
Invesco Liquid Assets Portfolio–Institutional Class, 1.40%(e) | 0.12 | % | — | 4,977 | (3,216 | ) | — | — | 1 | 1,761 | 1,761 | |||||||||||||||||||||||||
Invesco Treasury Portfolio–Institutional Class, | 0.20 | % | 10,607 | 350,419 | (358,208 | ) | — | — | 36 | 2,818 | 2,818 | |||||||||||||||||||||||||
Total Money Market Funds | 26,518 | 879,263 | (898,736 | ) | — | — | 93 | 7,045 | ||||||||||||||||||||||||||||
TOTAL INVESTMENTS IN AFFILIATED AND UNAFFILIATED ISSUERS | 100.08 | % | $ | 899,813 | $ | 2,026,016 | $ | (1,577,919 | ) | $ | 60,239 | $ | (5,875 | )(d) | $ | 28,280 | $ | 1,399,962 | ||||||||||||||||||
OTHER ASSETS LESS LIABILITIES | (0.08 | )% | (1,085 | ) | ||||||||||||||||||||||||||||||||
NET ASSETS | 100.00 | % | $ | 1,398,877 | ||||||||||||||||||||||||||||||||
Investment Abbreviations:
| ETF | – Exchange Traded Fund | |
| SPDR | – Standard & Poor’s Depositary Receipts |
Notes to Schedule of Investments:
| (a) | Each underlying fund and the Fund are affiliated by either having the same investment adviser or an investment adviser under common control with the Fund’s investment adviser, unless otherwise noted. |
| (b) | Non-income producing security. A security is determined to be non-income producing if the security has not declared a distribution in more than one year from the report date. |
| (c) | Not affiliated with Invesco Advisers, Inc. |
| (d) | Includes $2,071 and $241 of capital gains distributions from affiliated underlying funds for Invesco Global Infrastructure Fund and Invesco International Growth Fund, respectively. |
| (e) | The rate shown is the 7-day SEC standardized yield as of December 31, 2017. |
See accompanying Notes to Financial Statements which are an integral part of the financial statements.
14 Invesco Multi-Asset Inflation Fund
Statement of Assets and Liabilities
December 31, 2017
Assets: |
| |||
Investments in affiliated and unaffiliated underlying funds, at value (Cost $1,335,536) | $ | 1,399,962 | ||
Receivable for: | ||||
Dividends — affiliated underlying funds | 804 | |||
Investment for trustee deferred compensation and retirement plans | 8,149 | |||
Other assets | 30,288 | |||
Total assets | 1,439,203 | |||
Liabilities: |
| |||
Payable for: | ||||
Investments purchased — affiliated underlying funds | 782 | |||
Accrued fees to affiliates | 1,577 | |||
Accrued trustees’ and officers’ fees and benefits | 640 | |||
Accrued other operating expenses | 29,178 | |||
Trustee deferred compensation and retirement plans | 8,149 | |||
Total liabilities | 40,326 | |||
Net assets applicable to shares outstanding | $ | 1,398,877 | ||
Net assets consist of: |
| |||
Shares of beneficial interest | $ | 1,394,878 | ||
Undistributed net investment income | (8,723 | ) | ||
Undistributed net realized gain (loss) | (51,704 | ) | ||
Net unrealized appreciation | 64,426 | |||
| $ | 1,398,877 | |||
Net Assets: |
| |||
Class A | $ | 540,645 | ||
Class C | $ | 211,653 | ||
Class R | $ | 25,274 | ||
Class Y | $ | 602,715 | ||
Class R5 | $ | 9,295 | ||
Class R6 | $ | 9,295 | ||
Shares outstanding, no par value, |
| |||
Class A | 58,376 | |||
Class C | 22,998 | |||
Class R | 2,732 | |||
Class Y | 64,885 | |||
Class R5 | 1,001 | |||
Class R6 | 1,001 | |||
Class A: | ||||
Net asset value per share | $ | 9.26 | ||
Maximum offering price per share | ||||
(Net asset value of $9.26 ¸ 94.50%) | $ | 9.80 | ||
Class C: | ||||
Net asset value and offering price per share | $ | 9.20 | ||
Class R: | ||||
Net asset value and offering price per share | $ | 9.25 | ||
Class Y: | ||||
Net asset value and offering price per share | $ | 9.29 | ||
Class R5: | ||||
Net asset value and offering price per share | $ | 9.29 | ||
Class R6: | ||||
Net asset value and offering price per share | $ | 9.29 | ||
See accompanying Notes to Financial Statements which are an integral part of the financial statements.
15 Invesco Multi-Asset Inflation Fund
Statement of Operations
For the year ended December 31, 2017
Investment income: |
| |||
Dividends from affiliated and unaffiliated underlying funds | $ | 28,280 | ||
Expenses: | ||||
Advisory fees | 1,865 | |||
Administrative services fees | 50,000 | |||
Custodian fees | 8,380 | |||
Distribution fees: | ||||
Class A | 1,336 | |||
Class C | 1,933 | |||
Class R | 82 | |||
Transfer agent fees — A, C, R and Y | 2,532 | |||
Transfer agent fees — R5 | 9 | |||
Transfer agent fees — R6 | 9 | |||
Trustees’ and officers’ fees and benefits | 21,033 | |||
Registration and filing fees | 78,033 | |||
Reports to shareholders | 18,554 | |||
Professional services fees | 42,637 | |||
Taxes | 156 | |||
Other | 12,055 | |||
Total expenses | 238,614 | |||
Less: Fees waived and expenses reimbursed | (234,435 | ) | ||
Net expenses | 4,179 | |||
Net investment income | 24,101 | |||
Realized and unrealized gain (loss) from: | ||||
Net realized gain (loss) on sales of affiliated and unaffiliated underlying fund shares | (8,187 | ) | ||
Net realized gain from distributions of affiliated underlying shares | 2,312 | |||
| (5,875 | ) | |||
Change in net unrealized appreciation of affiliated underlying fund shares | 60,239 | |||
Net gain from affiliated and unaffiliated underlying funds | 54,364 | |||
Net increase in net assets resulting from operations | $ | 78,465 | ||
See accompanying Notes to Financial Statements which are an integral part of the financial statements.
16 Invesco Multi-Asset Inflation Fund
Statement of Changes in Net Assets
For the years ended December 31, 2017 and 2016
| 2017 | 2016 | |||||||
Operations: |
| |||||||
Net investment income | $ | 24,101 | $ | 14,785 | ||||
Net realized gain (loss) | (5,875 | ) | (30,538 | ) | ||||
Change in net unrealized appreciation | 60,239 | 65,288 | ||||||
Net increase in net assets resulting from operations | 78,465 | 49,535 | ||||||
Distributions to shareholders from net investment income: | ||||||||
Class A | (11,568 | ) | (9,483 | ) | ||||
Class C | (3,148 | ) | (2,759 | ) | ||||
Class R | (483 | ) | (173 | ) | ||||
Class Y | (14,099 | ) | (4,679 | ) | ||||
Class R5 | (222 | ) | (194 | ) | ||||
Class R6 | (222 | ) | (194 | ) | ||||
Total distributions from net investment income | (29,742 | ) | (17,482 | ) | ||||
Distributions to shareholders from net realized gains: | ||||||||
Class A | (2,746 | ) | (2,281 | ) | ||||
Class C | (1,084 | ) | (775 | ) | ||||
Class R | (128 | ) | (44 | ) | ||||
Class Y | (3,012 | ) | (1,055 | ) | ||||
Class R5 | (47 | ) | (44 | ) | ||||
Class R6 | (47 | ) | (44 | ) | ||||
Total distributions from net realized gains | (7,064 | ) | (4,243 | ) | ||||
Share transactions–net: | ||||||||
Class A | 47,977 | 290,036 | ||||||
Class C | 28,263 | 162,999 | ||||||
Class R | 15,383 | — | ||||||
Class Y | 366,762 | (20,537 | ) | |||||
Net increase in net assets resulting from share transactions | 458,385 | 432,498 | ||||||
Net increase in net assets | 500,044 | 460,308 | ||||||
Net assets: | ||||||||
Beginning of year | 898,833 | 438,525 | ||||||
End of year (includes undistributed net investment income of $(8,723) and $(3,218), respectively) | $ | 1,398,877 | $ | 898,833 | ||||
Notes to Financial Statements
December 31, 2017
NOTE 1—Significant Accounting Policies
Invesco Multi-Asset Inflation Fund (the “Fund”) is a series portfolio of AIM Growth Series (Invesco Growth Series) (the “Trust”). The Trust is organized as a Delaware statutory trust and is registered under the Investment Company Act of 1940, as amended (the “1940 Act”), as an open-end series management investment company consisting of twenty-nine separate series portfolios, each authorized to issue an unlimited number of shares of beneficial interest. The assets, liabilities and operations of each portfolio are accounted for separately. Information presented in these financial statements pertains only to the Fund. Matters affecting each portfolio or class will be voted on exclusively by the shareholders of such portfolio or class.
The Fund’s investment objective is total return, comprised of current income and capital appreciation.
The Fund is a “fund of funds”, in that it invests in other mutual funds (“underlying funds”) advised by Invesco Advisers, Inc. (the “Adviser” or “Invesco”), exchange-traded funds advised by Invesco PowerShares Capital Management LLC (“PowerShares Capital”), an affiliate of Invesco, or other unaffiliated advisers. Invesco and PowerShares Capital are affiliates of each other as they are indirect, wholly-owned subsidiaries of Invesco Ltd. Invesco may change the Fund’s asset class allocations or the underlying funds without shareholder approval. The underlying funds may engage in a number of investment techniques and practices, which involve certain risks. Each underlying fund’s accounting policies are outlined in the underlying fund’s financial statements and are publicly available.
17 Invesco Multi-Asset Inflation Fund
The Fund currently consists of six different classes of shares: Class A, Class C, Class R, Class Y, Class R5 and Class R6. Class Y shares are available only to certain investors. Class A shares are sold with a front-end sales charge unless certain waiver criteria are met and under certain circumstances load waived shares may be subject to contingent deferred sales charges (“CDSC”). Class C shares are sold with a CDSC. Class R, Class Y, Class R5 and Class R6 shares are sold at net asset value.
The Fund is an investment company and accordingly follows the investment company accounting and reporting guidance in accordance with Financial Accounting Standards Board Accounting Standards Codification Topic 946, Financial Services – Investment Companies.
The following is a summary of the significant accounting policies followed by the Fund in the preparation of its financial statements.
| A. | Security Valuations — Securities of investment companies that trade on an exchange are valued at the last sales price or official closing price as of the close of the customary trading session on the exchange where the security is principally traded. Investments in shares of funds that are not traded on an exchange are valued at the end-of-day net asset value per share of such fund. Securities in the underlying funds, including restricted securities, are valued in accordance with the valuation policy of such fund. The policies of the underlying funds affiliated with the Fund as a result of having the same investment adviser are set forth below. |
A security listed or traded on an exchange (except convertible securities) is valued at its last sales price or official closing price as of the close of the customary trading session on the exchange where the security is principally traded, or lacking any sales or official closing price on a particular day, the security may be valued at the closing bid price on that day. Securities traded in the over-the-counter market are valued based on prices furnished by independent pricing services or market makers. When such securities are valued by an independent pricing service they may be considered fair valued. Futures contracts are valued at the final settlement price set by an exchange on which they are principally traded. Listed options are valued at the mean between the last bid and asked prices from the exchange on which they are principally traded. Options not listed on an exchange are valued by an independent source at the mean between the last bid and asked prices. For purposes of determining net asset value (“NAV”) per share, futures and option contracts generally are valued 15 minutes after the close of the customary trading session of the New York Stock Exchange (“NYSE”).
Variable rate senior loan interests are fair valued using quotes provided by an independent pricing service. Quotes provided by the pricing service may reflect appropriate factors such as ratings, tranche type, industry, company performance, spread, individual trading characteristics, institution-size trading in similar groups of securities and other market data.
Investments in open-end and closed-end registered investment companies that do not trade on an exchange are valued at the end-of-day net asset value per share. Investments in open-end and closed-end registered investment companies that trade on an exchange are valued at the last sales price or official closing price as of the close of the customary trading session on the exchange where the security is principally traded.
Debt obligations (including convertible securities) and unlisted equities are fair valued using an evaluated quote provided by an independent pricing service. Evaluated quotes provided by the pricing service may be determined without exclusive reliance on quoted prices, and may reflect appropriate factors such as institution-size trading in similar groups of securities, developments related to specific securities, dividend rate (for unlisted equities), yield (for debt obligations), quality, type of issue, coupon rate (for debt obligations), maturity (for debt obligations), individual trading characteristics and other market data. Pricing services generally value debt obligations assuming orderly transactions of institutional round lot size, but a fund may hold or transact in the same securities in smaller, odd lot sizes. Odd lots often trade at lower prices than institutional round lots. Debt obligations are subject to interest rate and credit risks. In addition, all debt obligations involve some risk of default with respect to interest and/or principal payments.
Foreign securities’ (including foreign exchange contracts) prices are converted into U.S. dollar amounts using the applicable exchange rates as of the close of the NYSE. If market quotations are available and reliable for foreign exchange-traded equity securities, the securities will be valued at the market quotations. Because trading hours for certain foreign securities end before the close of the NYSE, closing market quotations may become unreliable. If between the time trading ends on a particular security and the close of the customary trading session on the NYSE, events occur that the investment adviser determines are significant and make the closing price unreliable, the Fund may fair value the security. If the event is likely to have affected the closing price of the security, the security will be valued at fair value in good faith using procedures approved by the Board of Trustees. Adjustments to closing prices to reflect fair value may also be based on a screening process of an independent pricing service to indicate the degree of certainty, based on historical data, that the closing price in the principal market where a foreign security trades is not the current value as of the close of the NYSE. Foreign securities’ prices meeting the approved degree of certainty that the price is not reflective of current value will be priced at the indication of fair value from the independent pricing service. Multiple factors may be considered by the independent pricing service in determining adjustments to reflect fair value and may include information relating to sector indices, American Depositary Receipts and domestic and foreign index futures. Foreign securities may have additional risks including exchange rate changes, potential for sharply devalued currencies and high inflation, political and economic upheaval, the relative lack of issuer information, relatively low market liquidity and the potential lack of strict financial and accounting controls and standards.
Securities for which market prices are not provided by any of the above methods may be valued based upon quotes furnished by independent sources. The last bid price may be used to value equity securities. The mean between the last bid and asked prices is used to value debt obligations, including corporate loans.
Securities for which market quotations are not readily available or became unreliable are valued at fair value as determined in good faith by or under the supervision of the Trust’s officers following procedures approved by the Board of Trustees. Issuer specific events, market trends, bid/asked quotes of brokers and information providers and other market data may be reviewed in the course of making a good faith determination of a security’s fair value.
The Fund may invest in securities that are subject to interest rate risk, meaning the risk that the prices will generally fall as interest rates rise and, conversely, the prices will generally rise as interest rates fall. Specific securities differ in their sensitivity to changes in interest rates depending on their individual characteristics. Changes in interest rates may result in increased market volatility, which may affect the value and/or liquidity of certain Fund investments.
Valuations change in response to many factors including the historical and prospective earnings of the issuer, the value of the issuer’s assets, general economic conditions, interest rates, investor perceptions and market liquidity. Because of the inherent uncertainties of valuation, the values reflected in the financial statements may materially differ from the value received upon actual sale of those investments.
18 Invesco Multi-Asset Inflation Fund
| B. | Securities Transactions and Investment Income — Securities transactions are accounted for on a trade date basis. Realized gains or losses on sales are computed on the basis of specific identification of the securities sold. Distributions from ordinary income from underlying funds, if any, are recorded as dividend income on ex-dividend date. Distributions from gains from underlying funds, if any, are recorded as realized gains on the ex-dividend date. The following policies are followed by the underlying funds: Interest income (net of withholding tax, if any) is recorded on the accrual basis from settlement date. Bond premiums and discounts are amortized and/or accreted over the lives of the respective securities. Pay-in-kind interest income and non-cash dividend income received in the form of securities in-lieu of cash are recorded at the fair value of the securities received. Paydown gains and losses on mortgage and asset-backed securities are recorded as adjustments to interest income. |
The Fund may periodically participate in litigation related to Fund investments. As such, the Fund may receive proceeds from litigation settlements. Any proceeds received are included in the Statement of Operations as realized gain (loss) for investments no longer held and as unrealized gain (loss) for investments still held.
The Fund allocates income and realized and unrealized capital gains and losses to a class based on the relative net assets of each class.
| C. | Distributions — Distributions from net investment income and net realized capital gain, if any, are generally declared and paid annually and recorded on the ex-dividend date. The Fund may elect to treat a portion of the proceeds from redemptions as distributions for federal income tax purposes. |
| D. | Federal Income Taxes — The Fund intends to comply with the requirements of Subchapter M of the Internal Revenue Code of 1986, as amended (the “Internal Revenue Code”), necessary to qualify as a regulated investment company and to distribute substantially all of the Fund’s taxable earnings to shareholders. As such, the Fund will not be subject to federal income taxes on otherwise taxable income (including net realized capital gain) that is distributed to shareholders. Therefore, no provision for federal income taxes is recorded in the financial statements. |
The Fund recognizes the tax benefits of uncertain tax positions only when the position is more likely than not to be sustained. Management has analyzed the Fund’s uncertain tax positions and concluded that no liability for unrecognized tax benefits should be recorded related to uncertain tax positions. Management is not aware of any tax positions for which it is reasonably possible that the total amounts of unrecognized tax benefits will change materially in the next 12 months.
The Fund files tax returns in the U.S. Federal jurisdiction and certain other jurisdictions. Generally, the Fund is subject to examinations by such taxing authorities for up to three years after the filing of the return for the tax period.
| E. | Expenses — Expenses included in the accompanying financial statements reflect the expenses of the Fund and do not include any expenses of the underlying funds. The effects of the underlying funds expenses are included in the realized and unrealized gain/loss on the investments in the underlying funds. Estimated expenses of the underlying funds are discussed further in Note 10. |
Fees provided for under the Rule 12b-1 plan of a particular class of the Fund and which are directly attributable to that class are charged to the operations of such class. Transfer agency fees and expenses and other shareholder recordkeeping fees and expenses attributable to Class R5 and Class R6 are allocated to each share class based on relative net assets. Transfer agency fees and expenses and other shareholder recordkeeping fees and expenses relating to all other classes are allocated among those classes based on relative net assets. All other expenses are allocated among the classes based on relative net assets.
| F. | Accounting Estimates — The preparation of financial statements in conformity with accounting principles generally accepted in the United States of America (“GAAP”) requires management to make estimates and assumptions that affect the reported amounts of assets and liabilities at the date of the financial statements and the reported amounts of revenues and expenses during the reporting period including estimates and assumptions related to taxation. Actual results could differ from those estimates by a significant amount. In addition, the Fund monitors for material events or transactions that may occur or become known after the period-end date and before the date the financial statements are released to print. |
| G. | Indemnifications — Under the Trust’s organizational documents, each Trustee, officer, employee or other agent of the Trust is indemnified against certain liabilities that may arise out of the performance of their duties to the Fund. Additionally, in the normal course of business, the Fund enters into contracts, including the Fund’s servicing agreements, that contain a variety of indemnification clauses. The Fund’s maximum exposure under these arrangements is unknown as this would involve future claims that may be made against the Fund that have not yet occurred. The risk of material loss as a result of such indemnification claims is considered remote. |
NOTE 2—Advisory Fees and Other Fees Paid to Affiliates
The Trust has entered into a master investment advisory agreement with Invesco Advisers, Inc. (the “Adviser” or “Invesco”). Under the terms of the investment advisory agreement, the Fund accrues daily and pays monthly an advisory fee to the Adviser based on the annual rate of 0.15% of the Fund’s average daily net assets.
Under the terms of a master sub-advisory agreement between the Adviser and each of Invesco Asset Management Deutschland GmbH, Invesco Asset Management Limited, Invesco Asset Management (Japan) Limited, Invesco Hong Kong Limited, Invesco Senior Secured Management, Inc. and Invesco Canada Ltd. and separate sub-advisory agreements with Invesco PowerShares Capital Management LLC and Invesco Asset Management (India) Private Limited (collectively, the “Affiliated Sub-Advisers”) the Adviser, not the Fund, will pay 40% of the fees paid to the Adviser to any such Affiliated Sub-Adviser(s) that provide(s) discretionary investment management services to the Fund based on the percentage of assets allocated to such Affiliated Sub-Adviser(s).
The Adviser has contractually agreed, through at least April 30, 2019, to waive advisory fees and/or reimburse expenses to the extent necessary to limit total annual fund operating expenses after fee waiver and/or expense reimbursement (including prior fiscal year-end Acquired Fund Fees and Expenses of 0.74% and excluding certain items discussed below) of Class A, Class C, Class R, Class Y, Class R5 and Class R6 shares to 1.02%, 1.77%, 1.27%, 0.77%, 0.77% and 0.77%, respectively, of average daily net assets (the “expense limits”). In determining the Adviser’s obligation to waive advisory fees and/or reimburse expenses, the following expenses are not taken into account, and could cause the total annual fund operating expenses after fee waiver and/or expense reimbursement to exceed the numbers reflected above: (1) interest; (2) taxes; (3) dividend expense on short sales; (4) extraordinary or non-routine items, including litigation expenses; and (5) expenses that the Fund has incurred but did not actually pay because of an expense offset arrangement. Acquired Fund Fees and Expenses are not operating expenses of the Fund directly, but are fees and expenses, including management fees of the investment companies in which the Fund invests. Unless Invesco continues the fee waiver agreement, it
19 Invesco Multi-Asset Inflation Fund
will terminate on April 30, 2019. During its term, the fee waiver agreement cannot be terminated or amended to increase the expense limits without approval of the Board of Trustees. The Adviser did not waive fees and/or reimburse expenses during the period under these expense limits.
Further, the Adviser has contractually agreed, through at least June 30, 2019, to waive the advisory fee payable by the Fund in an amount equal to 100% of the net advisory fees the Adviser receives from the affiliated money market funds on investments by the Fund of uninvested cash in such affiliated money market funds.
For the year ended December 31, 2017, the Adviser waived advisory fees and reimbursed fund level expenses of $231,885 and reimbursed class level expenses of $1,105, $399, $34, $994, $9 and $9 of Class A, Class C, Class R, Class Y, Class R5 and Class R6 shares, respectively.
The Trust has entered into a master administrative services agreement with Invesco pursuant to which the Fund has agreed to pay Invesco for certain administrative costs incurred in providing accounting services to the Fund. For the year ended December 31, 2017, expenses incurred under the agreement are shown in the Statement of Operations as Administrative services fees.
The Trust has entered into a transfer agency and service agreement with Invesco Investment Services, Inc. (“IIS”) pursuant to which the Fund has agreed to pay IIS a fee for providing transfer agency and shareholder services to the Fund and reimburse IIS for certain expenses incurred by IIS in the course of providing such services. IIS may make payments to intermediaries that provide omnibus account services, sub-accounting services and/or networking services. All fees payable by IIS to intermediaries that provide omnibus account services or sub-accounting services are charged back to the Fund, subject to certain limitations approved by the Trust’s Board of Trustees. For the year ended December 31, 2017, expenses incurred under the agreement are shown in the Statement of Operations as Transfer agent fees.
The Trust has entered into master distribution agreements with Invesco Distributors, Inc. (“IDI”) to serve as the distributor for the Class A, Class C, Class R, Class Y, Class R5 and Class R6 shares of the Fund. The Trust has adopted plans pursuant to Rule 12b-1 under the 1940 Act with respect to the Fund’s Class A, Class C and Class R shares (collectively, the “Plans”). The Fund, pursuant to the Plans, pays IDI compensation at the annual rate of 0.25% of the Fund’s average daily net assets of Class A shares, 1.00% of the average daily net assets of Class C shares and 0.50% of the average daily net assets of Class R shares. The fees are accrued daily and paid monthly. Of the Plan payments, up to 0.25% of the average daily net assets of each class of shares may be paid to furnish continuing personal shareholder services to customers who purchase and own shares of such classes. Any amounts not paid as a service fee under the Plans would constitute an asset-based sales charge. Rules of the Financial Industry Regulatory Authority (“FINRA”) impose a cap on the total sales charges, including asset-based sales charges, that may be paid by any class of shares of the Fund. For the year ended December 31, 2017, expenses incurred under the Plans are shown in the Statement of Operations as Distribution fees.
Front-end sales commissions and CDSC (collectively, the “sales charges”) are not recorded as expenses of the Fund. Front-end sales commissions are deducted from proceeds from the sales of Fund shares prior to investment in Class A shares of the Fund. CDSC are deducted from redemption proceeds prior to remittance to the shareholder. During the year ended December 31, 2017, IDI advised the Fund that IDI retained $440 in front-end sales commissions from the sale of Class A shares and $64 from Class C shares, for CDSC imposed upon redemptions by shareholders.
The underlying Invesco funds pay no distribution fees for Class Y and Class R6, and the Fund pays no sales loads or other similar compensation to IDI for acquiring underlying fund shares.
Certain officers and trustees of the Trust are officers and directors of the Adviser, IIS and/or IDI.
NOTE 3—Additional Valuation Information
GAAP defines fair value as the price that would be received to sell an asset or paid to transfer a liability in an orderly transaction between market participants at the measurement date, under current market conditions. GAAP establishes a hierarchy that prioritizes the inputs to valuation methods, giving the highest priority to readily available unadjusted quoted prices in an active market for identical assets (Level 1) and the lowest priority to significant unobservable inputs (Level 3), generally when market prices are not readily available or are unreliable. Based on the valuation inputs, the securities or other investments are tiered into one of three levels. Changes in valuation methods may result in transfers in or out of an investment’s assigned level:
| Level 1 — | Prices are determined using quoted prices in an active market for identical assets. |
| Level 2 — | Prices are determined using other significant observable inputs. Observable inputs are inputs that other market participants may use in pricing a security. These may include quoted prices for similar securities, interest rates, prepayment speeds, credit risk, yield curves, loss severities, default rates, discount rates, volatilities and others. |
| Level 3 — | Prices are determined using significant unobservable inputs. In situations where quoted prices or observable inputs are unavailable (for example, when there is little or no market activity for an investment at the end of the period), unobservable inputs may be used. Unobservable inputs reflect the Fund’s own assumptions about the factors market participants would use in determining fair value of the securities or instruments and would be based on the best available information. |
As of December 31, 2017, all of the securities in this Fund were valued based on Level 1 inputs (see the Schedule of Investments for security categories). The level assigned to the securities valuations may not be an indication of the risk or liquidity associated with investing in those securities.
The Fund’s policy is to recognize transfers in and out of the valuation levels as of the end of the reporting period. During the year ended December 31, 2017, there were no material transfers between valuation levels.
NOTE 4—Trustees’ and Officers’ Fees and Benefits
Trustees’ and Officers’ Fees and Benefits include amounts accrued by the Fund to pay remuneration to certain Trustees and Officers of the Fund. Trustees have the option to defer compensation payable by the Fund, and Trustees’ and Officers’ Fees and Benefits also include amounts accrued by the Fund to fund such deferred compensation amounts. Those Trustees who defer compensation have the option to select various Invesco Funds in which their deferral accounts shall be deemed to be invested. Obligations under the deferred compensation plan represent unsecured claims against the general assets of the Fund.
20 Invesco Multi-Asset Inflation Fund
NOTE 5—Cash Balances
The Fund is permitted to temporarily carry a negative or overdrawn balance in its account with State Street Bank and Trust Company, the custodian bank. Such balances, if any at period-end, are shown in the Statement of Assets and Liabilities under the payable caption Amount due custodian. To compensate the custodian bank for such overdrafts, the overdrawn Fund may either (1) leave funds as a compensating balance in the account so the custodian bank can be compensated by earning the additional interest; or (2) compensate by paying the custodian bank at a rate agreed upon by the custodian bank and Invesco, not to exceed the contractually agreed upon rate.
NOTE 6—Distributions to Shareholders and Tax Components of Net Assets
Tax Character of Distributions to Shareholders Paid During the Fiscal Years Ended December 31, 2017 and 2016:
| 2017 | 2016 | |||||||
Ordinary income | $ | 29,742 | $ | 17,482 | ||||
Long-term capital gain | 7,064 | 4,243 | ||||||
Total distributions | $ | 36,806 | $ | 21,725 | ||||
Tax Components of Net Assets at Period-End:
| 2017 | ||||
Net unrealized appreciation — investments | $ | 19,568 | ||
Temporary book/tax differences | (6,402 | ) | ||
Capital loss carryforward | (9,167 | ) | ||
Shares of beneficial interest | 1,394,878 | |||
Total net assets | $ | 1,398,877 | ||
The difference between book-basis and tax-basis unrealized appreciation (depreciation) is due to differences in the timing of recognition of gains and losses on investments for tax and book purposes. The Fund’s net unrealized appreciation difference is attributable primarily to wash sales.
The temporary book/tax differences are a result of timing differences between book and tax recognition of income and/or expenses. The Fund’s temporary book/tax differences are the result of the trustee deferral of compensation and retirement plan benefits.
Capital loss carryforward is calculated and reported as of a specific date. Results of transactions and other activity after that date may affect the amount of capital loss carryforward actually available for the Fund to utilize. Capital losses generated in years beginning after December 22, 2010 can be carried forward for an unlimited period, whereas previous losses expire in eight tax years. Capital losses with an expiration period may not be used to offset capital gains until all net capital losses without an expiration date have been utilized. Capital loss carryforwards with no expiration date will retain their character as either short-term or long-term capital losses instead of as short-term capital losses as under prior law. The ability to utilize capital loss carryforwards in the future may be limited under the Internal Revenue Code and related regulations based on the results of future transactions.
The Fund has a capital loss carryforward as of December 31, 2017, as follows:
| Capital Loss Carryforward* | ||||||||||||
| Expiration | Short-Term | Long-Term | Total | |||||||||
Not subject to expiration | $ | 3,847 | $ | 5,320 | $ | 9,167 | ||||||
| * | Capital loss carryforward as of the date listed above is reduced for limitations, if any, to the extent required by the Internal Revenue Code and may be further limited depending upon a variety of factors, including the realization of net unrealized gains or losses as of the date of any reorganization. |
NOTE 7—Investment Transactions
The aggregate amount of investment securities (other than short-term securities, U.S. Treasury obligations and money market funds, if any) purchased and sold by the Fund during the year ended December 31, 2017 was $1,146,753 and $679,183, respectively. Cost of investments, including any derivatives, on a tax basis includes the adjustments for financial reporting purposes as of the most recently completed federal income tax reporting period-end.
| Unrealized Appreciation (Depreciation) of Investments on a Tax Basis | ||||
Aggregate unrealized appreciation of investments | $ | 23,439 | ||
Aggregate unrealized (depreciation) of investments | (3,871 | ) | ||
Net unrealized appreciation of investments | $ | 19,568 | ||
Cost of investments for tax purposes is $1,380,394.
NOTE 8—Reclassification of Permanent Differences
Primarily as a result of differing book/tax treatment of partnerships and distributions from underlying funds, on December 31, 2017, undistributed net investment income was increased by $136, undistributed net realized gain (loss) was increased by $2,548 and shares of beneficial interest was decreased by $2,684. This reclassification had no effect on the net assets of the Fund.
21 Invesco Multi-Asset Inflation Fund
NOTE 9—Share Information
| Summary of Share Activity | ||||||||||||||||
| Years ended December 31, | ||||||||||||||||
| 2017(a) | 2016 | |||||||||||||||
| Shares | Amount | Shares | Amount | |||||||||||||
Sold: | ||||||||||||||||
Class A | 14,453 | $ | 130,743 | 39,591 | $ | 353,698 | ||||||||||
Class C | 7,163 | 64,387 | 19,088 | 172,682 | ||||||||||||
Class R | 1,689 | 15,000 | — | — | ||||||||||||
Class Y | 49,208 | 445,594 | — | — | ||||||||||||
Issued as reinvestment of dividends: | ||||||||||||||||
Class A | 1,149 | 10,454 | 828 | 7,367 | ||||||||||||
Class C | 446 | 4,047 | 334 | 2,945 | ||||||||||||
Class R | 42 | 383 | — | — | ||||||||||||
Class Y | 1,564 | 14,283 | 365 | 3,242 | ||||||||||||
Reacquired: | ||||||||||||||||
Class A | (10,262 | ) | (93,220 | ) | (8,028 | ) | (71,029 | ) | ||||||||
Class C | (4,518 | ) | (40,171 | ) | (1,409 | ) | (12,628 | ) | ||||||||
Class Y | (10,408 | ) | (93,115 | ) | (2,797 | ) | (23,779 | ) | ||||||||
Net increase in share activity | 50,526 | $ | 458,385 | 47,972 | $ | 432,498 | ||||||||||
| (a) | There are entities that are record owners of more than 5% of the outstanding shares of the Fund and in the aggregate own 27% of the outstanding shares of the Fund. IDI has an agreement with these entities to sell Fund shares. The Fund, Invesco and/or Invesco affiliates may make payments to these entities, which are considered to be related to the Fund, for providing services to the Fund, Invesco and/or Invesco affiliates including but not limited to services such as, securities brokerage, distribution, third party record keeping and account servicing. The Fund has no knowledge as to whether all or any portion of the shares owned of record by these entities are also owned beneficially. |
| In addition, 46% of the outstanding shares of the Fund are owned by the Adviser or an affiliate of the Adviser. |
22 Invesco Multi-Asset Inflation Fund
NOTE 10—Financial Highlights
The following schedule presents financial highlights for a share of the Fund outstanding throughout the periods indicated.
| Net asset value, beginning of period | Net investment income (loss)(a) | Net gains (losses) on securities (both realized and unrealized) | Total from investment operations | Dividends from net investment income | Distributions from net realized gains | Total distributions | Net asset value, end of period | Total return(b) | Net assets, end of period (000’s omitted) | Ratio of expenses to average net assets with fee waivers and/or expenses absorbed(c) | Ratio of expenses to average net assets without fee waivers and/or expenses absorbed | Ratio of net investment income (loss) to average net assets | Portfolio turnover(d) | |||||||||||||||||||||||||||||||||||||||||||
Class A | ||||||||||||||||||||||||||||||||||||||||||||||||||||||||
Year ended 12/31/17 | $ | 8.95 | $ | 0.18 | $ | 0.38 | $ | 0.56 | $ | (0.20 | ) | $ | (0.05 | ) | $ | (0.25 | ) | $ | 9.26 | 6.27 | % | $ | 541 | 0.31 | %(e) | 19.17 | %(e) | 1.96 | %(e) | 56 | % | |||||||||||||||||||||||||
Year ended 12/31/16 | 8.35 | 0.22 | 0.60 | 0.82 | (0.18 | ) | (0.04 | ) | (0.22 | ) | 8.95 | 9.91 | 475 | 0.70 | 35.59 | 2.44 | 72 | |||||||||||||||||||||||||||||||||||||||
Year ended 12/31/15 | 9.54 | 0.06 | (1.15 | ) | (1.09 | ) | (0.10 | ) | — | (0.10 | ) | 8.35 | (11.39 | ) | 172 | 0.73 | 69.65 | 0.68 | 34 | |||||||||||||||||||||||||||||||||||||
Year ended 12/31/14(f) | 10.00 | 0.04 | (0.40 | ) | (0.36 | ) | (0.10 | ) | — | (0.10 | ) | 9.54 | (3.55 | ) | 107 | 0.73 | (g) | 124.07 | (g) | 1.81 | (g) | 3 | ||||||||||||||||||||||||||||||||||
Class C | ||||||||||||||||||||||||||||||||||||||||||||||||||||||||
Year ended 12/31/17 | 8.90 | 0.11 | 0.38 | 0.49 | (0.14 | ) | (0.05 | ) | (0.19 | ) | 9.20 | 5.48 | 212 | 1.06 | (e) | 19.92 | (e) | 1.21 | (e) | 56 | ||||||||||||||||||||||||||||||||||||
Year ended 12/31/16 | 8.34 | 0.15 | 0.61 | 0.76 | (0.16 | ) | (0.04 | ) | (0.20 | ) | 8.90 | 9.12 | 177 | 1.45 | 36.34 | 1.69 | 72 | |||||||||||||||||||||||||||||||||||||||
Year ended 12/31/15 | 9.55 | (0.01 | ) | (1.15 | ) | (1.16 | ) | (0.05 | ) | — | (0.05 | ) | 8.34 | (12.15 | ) | 16 | 1.48 | 70.40 | (0.07 | ) | 34 | |||||||||||||||||||||||||||||||||||
Year ended 12/31/14(f) | 10.00 | 0.02 | (0.38 | ) | (0.36 | ) | (0.09 | ) | — | (0.09 | ) | 9.55 | (3.61 | ) | 10 | 1.48 | (g) | 124.82 | (g) | 1.06 | (g) | 3 | ||||||||||||||||||||||||||||||||||
Class R | ||||||||||||||||||||||||||||||||||||||||||||||||||||||||
Year ended 12/31/17 | 8.94 | 0.16 | 0.38 | 0.54 | (0.18 | ) | (0.05 | ) | (0.23 | ) | 9.25 | 6.05 | 25 | 0.56 | (e) | 19.42 | (e) | 1.71 | (e) | 56 | ||||||||||||||||||||||||||||||||||||
Year ended 12/31/16 | 8.35 | 0.19 | 0.62 | 0.81 | (0.18 | ) | (0.04 | ) | (0.22 | ) | 8.94 | 9.68 | 9 | 0.95 | 35.84 | 2.19 | 72 | |||||||||||||||||||||||||||||||||||||||
Year ended 12/31/15 | 9.54 | 0.04 | (1.15 | ) | (1.11 | ) | (0.08 | ) | — | (0.08 | ) | 8.35 | (11.60 | ) | 8 | 0.98 | 69.90 | 0.43 | 34 | |||||||||||||||||||||||||||||||||||||
Year ended 12/31/14(f) | 10.00 | 0.03 | (0.39 | ) | (0.36 | ) | (0.10 | ) | — | (0.10 | ) | 9.54 | (3.60 | ) | 10 | 0.98 | (g) | 124.32 | (g) | 1.56 | (g) | 3 | ||||||||||||||||||||||||||||||||||
Class Y | ||||||||||||||||||||||||||||||||||||||||||||||||||||||||
Year ended 12/31/17 | 8.97 | 0.20 | 0.39 | 0.59 | (0.22 | ) | (0.05 | ) | (0.27 | ) | 9.29 | 6.62 | 603 | 0.06 | (e) | 18.92 | (e) | 2.21 | (e) | 56 | ||||||||||||||||||||||||||||||||||||
Year ended 12/31/16 | 8.36 | 0.24 | 0.60 | 0.84 | (0.19 | ) | (0.04 | ) | (0.23 | ) | 8.97 | 10.16 | 220 | 0.45 | 35.34 | 2.69 | 72 | |||||||||||||||||||||||||||||||||||||||
Year ended 12/31/15 | 9.55 | 0.09 | (1.16 | ) | (1.07 | ) | (0.12 | ) | — | (0.12 | ) | 8.36 | (11.20 | ) | 225 | 0.48 | 69.40 | 0.93 | 34 | |||||||||||||||||||||||||||||||||||||
Year ended 12/31/14(f) | 10.00 | 0.04 | (0.38 | ) | (0.34 | ) | (0.11 | ) | — | (0.11 | ) | 9.55 | (3.39 | ) | 140 | 0.48 | (g) | 123.82 | (g) | 2.06 | (g) | 3 | ||||||||||||||||||||||||||||||||||
Class R5 | ||||||||||||||||||||||||||||||||||||||||||||||||||||||||
Year ended 12/31/17 | 8.97 | 0.20 | 0.39 | 0.59 | (0.22 | ) | (0.05 | ) | (0.27 | ) | 9.29 | 6.63 | 9 | 0.06 | (e) | 18.81 | (e) | 2.21 | (e) | 56 | ||||||||||||||||||||||||||||||||||||
Year ended 12/31/16 | 8.36 | 0.24 | 0.60 | 0.84 | (0.19 | ) | (0.04 | ) | (0.23 | ) | 8.97 | 10.16 | 9 | 0.45 | 35.17 | 2.69 | 72 | |||||||||||||||||||||||||||||||||||||||
Year ended 12/31/15 | 9.54 | 0.09 | (1.15 | ) | (1.06 | ) | (0.12 | ) | — | (0.12 | ) | 8.36 | (11.11 | ) | 8 | 0.48 | 69.37 | 0.93 | 34 | |||||||||||||||||||||||||||||||||||||
Year ended 12/31/14(f) | 10.00 | 0.04 | (0.39 | ) | (0.35 | ) | (0.11 | ) | — | (0.11 | ) | 9.54 | (3.49 | ) | 10 | 0.48 | (g) | 122.66 | (g) | 2.06 | (g) | 3 | ||||||||||||||||||||||||||||||||||
Class R6 | ||||||||||||||||||||||||||||||||||||||||||||||||||||||||
Year ended 12/31/17 | 8.97 | 0.20 | 0.39 | 0.59 | (0.22 | ) | (0.05 | ) | (0.27 | ) | 9.29 | 6.63 | 9 | 0.06 | (e) | 18.81 | (e) | 2.21 | (e) | 56 | ||||||||||||||||||||||||||||||||||||
Year ended 12/31/16 | 8.36 | 0.24 | 0.60 | 0.84 | (0.19 | ) | (0.04 | ) | (0.23 | ) | 8.97 | 10.16 | 9 | 0.45 | 35.17 | 2.69 | 72 | |||||||||||||||||||||||||||||||||||||||
Year ended 12/31/15 | 9.54 | 0.09 | (1.15 | ) | (1.06 | ) | (0.12 | ) | — | (0.12 | ) | 8.36 | (11.11 | ) | 8 | 0.48 | 69.37 | 0.93 | 34 | |||||||||||||||||||||||||||||||||||||
Year ended 12/31/14(f) | 10.00 | 0.04 | (0.39 | ) | (0.35 | ) | (0.11 | ) | — | (0.11 | ) | 9.54 | (3.49 | ) | 10 | 0.48 | (g) | 122.66 | (g) | 2.06 | (g) | 3 | ||||||||||||||||||||||||||||||||||
| (a) | Calculated using average shares outstanding. |
| (b) | Includes adjustments in accordance with accounting principles generally accepted in the United States of America and as such, the net asset value for financial reporting purposes and the returns based upon those net asset values may differ from the net asset value and returns for shareholder transactions. Does not include sales charges and is not annualized for periods less than one year, if applicable. |
| (c) | In addition to the fees and expenses which the Fund bears directly, the Fund indirectly bears a pro rata share of the fees and expenses of the underlying funds in which the Fund invests. Because the underlying funds have varied expenses and fee levels and the Fund may own different proportions at different times, the amount of fees and expenses incurred indirectly by the Fund will vary. Estimated underlying fund expenses are not expenses that are incurred directly by the Fund. They are expenses that are incurred directly by the underlying funds and are deducted from the value of the funds the Fund invests in. The effect of the estimated underlying fund expenses that the Fund bears indirectly is included in the Fund’s total return. Estimated acquired fund fees from underlying funds were 0.70%, 0.74%, 0.66% and 0.62% for the years ended December 31, 2017, December 31, 2016, December 31, 2015 and the period October 31, 2014 (commencement date) through December 31, 2014, respectively. |
| (d) | Portfolio turnover is calculated at the fund level and is not annualized for periods less than one year, if applicable. |
| (e) | Ratios are based on average daily net assets (000’s omitted) of $535, $193, $16, $481, $9 and $9 for Class A, Class C, Class R, Class Y, Class R5 and Class R6 shares, respectively. |
| (f) | Commencement date of October 14, 2014. |
| (g) | Annualized. |
23 Invesco Multi-Asset Inflation Fund
Report of Independent Registered Public Accounting Firm
To the Board of Trustees of AIM Growth Series (Invesco Growth Series) and Shareholders of Invesco Multi-Asset Inflation Fund
Opinion on the Financial Statements
We have audited the accompanying statement of assets and liabilities, including the schedule of investments, of Invesco Multi-Asset Inflation Fund (one of the funds constituting AIM Growth Series (Invesco Growth Series), hereafter referred to as the “Fund”) as of December 31, 2017, the related statement of operations for the year ended December 31, 2017, the statement of changes in net assets for each of the two years in the period ended December 31, 2017, including the related notes, and the financial highlights for each of the three years in the period ended December 31, 2017 and for the period October 14, 2014 (commencement of investment operation) through December 31, 2014 (collectively referred to as the “financial statements”). In our opinion, the financial statements present fairly, in all material respects, the financial position of the Fund as of December 31, 2017, the results of its operations for the year then ended, the changes in its net assets for each of the two years in the period ended December 31, 2017 and the financial highlights for each of the three years in the period ended December 31, 2017 and for the period October 14, 2014 (commencement of investment operation) through December 31, 2014 in conformity with accounting principles generally accepted in the United States of America.
Basis for Opinion
These financial statements are the responsibility of the Fund’s management. Our responsibility is to express an opinion on the Fund’s financial statements based on our audits. We are a public accounting firm registered with the Public Company Accounting Oversight Board (United States) (“PCAOB”) and are required to be independent with respect to the Fund in accordance with the U.S. federal securities laws and the applicable rules and regulations of the Securities and Exchange Commission and the PCAOB.
We conducted our audits of these financial statements in accordance with the standards of the PCAOB. Those standards require that we plan and perform the audit to obtain reasonable assurance about whether the financial statements are free of material misstatement, whether due to error or fraud.
Our audits included performing procedures to assess the risks of material misstatement of the financial statements, whether due to error or fraud, and performing procedures that respond to those risks. Such procedures included examining, on a test basis, evidence regarding the amounts and disclosures in the financial statements. Our audits also included evaluating the accounting principles used and significant estimates made by management, as well as evaluating the overall presentation of the financial statements. Our procedures included confirmation of securities owned as of December 31, 2017 by correspondence with the custodian and transfer agent. We believe that our audits provide a reasonable basis for our opinion.
PricewaterhouseCoopers LLP
Houston, TX
February 23, 2018
We have served as the auditor of one or more of the investment companies in the Invesco/PowerShares group of investment companies since at least 1995. We have not determined the specific year we began serving as auditor.
24 Invesco Multi-Asset Inflation Fund
Calculating your ongoing Fund expenses
Example
As a shareholder of the Fund, you incur two types of costs: (1) transaction costs, which may include sales charges (loads) on purchase payments or contingent deferred sales charges on redemptions, if any; and (2) ongoing costs, including distribution and/or service (12b-1) fees, and other Fund expenses. This example is intended to help you understand your ongoing costs (in dollars) of investing in the Fund and to compare these costs with ongoing costs of investing in other mutual funds. The example is based on an investment of $1,000 invested at the beginning of the period and held for the entire period July 1, 2017, through December 31, 2017.
In addition to the fees and expenses which the Fund bears directly, the Fund indirectly bears a pro rata share of the fees and expenses of the underlying funds in which the Fund invests. The amount of fees and expenses incurred indirectly by the Fund will vary because the underlying funds have varied expenses and fee levels and the Fund may own different proportions of the underlying funds at different times. Estimated underlying fund expenses are not expenses that are incurred directly by the Fund. They are expenses that are incurred directly by the underlying funds and are deducted from the value of the underlying funds the Fund invests in. The effect of the estimated underlying fund expenses that the Fund bears indirectly are included in the Fund’s total return.
Actual expenses
The table below provides information about actual account values and actual expenses. You may use the information in this table, together with the amount you invested, to estimate the expenses that you paid over the period. Simply divide your account value by $1,000 (for example, an $8,600 account value divided by $1,000 = 8.6), then multiply the result by the number in the table under the heading entitled “Actual Expenses Paid During Period” to estimate the expenses you paid on your account during this period.
Hypothetical example for comparison purposes
The table below also provides information about hypothetical account values and hypothetical expenses based on the Fund’s actual expense ratio and an assumed rate of return of 5% per year before expenses, which is not the Fund’s actual return.
The hypothetical account values and expenses may not be used to estimate the actual ending account balance or expenses you paid for the period. You may use this information to compare the ongoing costs of investing in the Fund and other funds. To do so, compare this 5% hypothetical example with the 5% hypothetical examples that appear in the shareholder reports of the other funds.
Please note that the expenses shown in the table are meant to highlight your ongoing costs only and do not reflect any transaction costs, such as sales charges (loads) on purchase payments or contingent deferred sales charges on redemptions, if any. Therefore, the hypothetical information is useful in comparing ongoing costs only, and will not help you determine the relative total costs of owning different funds. In addition, expenses shown in the table do not include the expenses of the underlying funds, which are borne indirectly by the Fund. If transaction costs and indirect expenses were included, your costs would have been higher.
Class | Beginning | ACTUAL | HYPOTHETICAL (5% annual return before expenses) | Annualized | ||||||||||||||||||||
| Ending Account Value (12/31/17)1 | Expenses Paid During Period2 | Ending Account Value (12/31/17) | Expenses Paid During Period2 | |||||||||||||||||||||
| A | $ | 1,000.00 | $ | 1,065.10 | $ | 1.56 | $ | 1,023.69 | $ | 1.53 | 0.30 | % | ||||||||||||
| C | 1,000.00 | 1,060.80 | 5.45 | 1,019.91 | 5.35 | 1.05 | ||||||||||||||||||
| R | 1,000.00 | 1,064.10 | 2.86 | 1,022.43 | 2.80 | 0.55 | ||||||||||||||||||
| Y | 1,000.00 | 1,067.40 | 0.26 | 1,024.95 | 0.26 | 0.05 | ||||||||||||||||||
| R5 | 1,000.00 | 1,067.40 | 0.26 | 1,024.95 | 0.26 | 0.05 | ||||||||||||||||||
| R6 | 1,000.00 | 1,067.40 | 0.26 | 1,024.95 | 0.26 | 0.05 | ||||||||||||||||||
| 1 | The actual ending account value is based on the actual total return of the Fund for the period July 1, 2017 through December 31, 2017, after actual expenses and will differ from the hypothetical ending account value which is based on the Fund’s expense ratio and a hypothetical annual return of 5% before expenses. |
| 2 | Expenses are equal to the Fund’s annualized expense ratio as indicated above multiplied by the average account value over the period, multiplied by 184/365 to reflect the most recent fiscal half year. |
25 Invesco Multi-Asset Inflation Fund
Tax Information
Form 1099-DIV, Form 1042-S and other year-end tax information provide shareholders with actual calendar year amounts that should be included in their tax returns. Shareholders should consult their tax advisors.
The following distribution information is being provided as required by the Internal Revenue Code or to meet a specific state’s requirement.
The Fund designates the following amounts or, if subsequently determined to be different, the maximum amount allowable for its fiscal year ended December 31, 2017:
Federal and State Income Tax | ||||
Long-Term Capital Gain Distributions | $ | 7,064 | ||
Qualified Dividend Income* | 21.03 | % | ||
Corporate Dividends Received Deduction* | 11.94 | % | ||
U.S. Treasury Obligations* | 15.97 | % | ||
| * | The above percentages are based on ordinary income dividends paid to shareholders during the Fund’s fiscal year. |
26 Invesco Multi-Asset Inflation Fund
Trustees and Officers
The address of each trustee and officer is AIM Growth Series (Invesco Growth Series) (the “Trust”), 11 Greenway Plaza, Suite 1000, Houston, Texas 77046-1173. The trustees serve for the life of the Trust, subject to their earlier death, incapacitation, resignation, retirement or removal as more specifically provided in the Trust’s organizational documents. Each officer serves for a one year term or until their successors are elected and qualified. Column two below includes length of time served with predecessor entities, if any.
Name, Year of Birth and Position(s) Held with the Trust | Trustee and/ or Officer Since | Principal Occupation(s) During Past 5 Years | Number of Funds in Fund Complex Overseen by Trustee | Other Directorship(s) Held by Trustee During Past 5 Years | ||||
| Interested Persons | ||||||||
| Martin L. Flanagan1 — 1960 Trustee | 2007 | Executive Director, Chief Executive Officer and President, Invesco Ltd. (ultimate parent of Invesco and a global investment management firm); Trustee, The Invesco Funds; Vice Chair, Investment Company Institute; and Member of Executive Board, SMU Cox School of Business
Formerly: Advisor to the Board, Invesco Advisers, Inc. (formerly known as Invesco Institutional (N.A.), Inc.); Chairman and Chief Executive Officer, Invesco Advisers, Inc. (registered investment adviser); Director, Chairman, Chief Executive Officer and President, Invesco Holding Company (US), Inc. (formerly IVZ Inc.) (holding company), Invesco Group Services, Inc. (service provider) and Invesco North American Holdings, Inc. (holding company); Director, Chief Executive Officer and President, Invesco Holding Company Limited (parent of Invesco and a global investment management firm); Director, Invesco Ltd.; Chairman, Investment Company Institute and President, Co-Chief Executive Officer, Co-President, Chief Operating Officer and Chief Financial Officer, Franklin Resources, Inc. (global investment management organization) | 158 | None | ||||
| Philip A. Taylor2 — 1954 Trustee and Senior Vice President | 2006 | Head of the Americas and Senior Managing Director, Invesco Ltd.; Director, Invesco Advisers, Inc. (formerly known as Invesco Institutional (N.A.), Inc.) (registered investment adviser); Director, Chairman, Chief Executive Officer and President, Invesco Management Group, Inc. (formerly known as Invesco Aim Management Group, Inc.) (financial services holding company); Director and Chairman, Invesco Investment Services, Inc. (formerly known as Invesco Aim Investment Services, Inc.) (registered transfer agent); Chief Executive Officer, Invesco Corporate Class Inc. (corporate mutual fund company); Director, Chairman and Chief Executive Officer, Invesco Canada Ltd. (formerly known as Invesco Trimark Ltd./Invesco Trimark Ltèe) (registered investment adviser and registered transfer agent); Trustee and Senior Vice President, The Invesco Funds; Director, Invesco Investment Advisers LLC (formerly known as Van Kampen Asset Management).
Formerly: Co-Chairman, Co-President and Co-Chief Executive Officer, Invesco Advisers, Inc. (formerly known as Invesco Institutional (N.A.), Inc.) (registered investment adviser); Director, Chief Executive Officer and President, Van Kampen Exchange Corp; President and Principal Executive Officer, The Invesco Funds (other than AIM Treasurer’s Series Trust (Invesco Treasurer’s Series Trust), Short-Term Investments Trust and Invesco Management Trust); Executive Vice President, The Invesco Funds (AIM Treasurer’s Series Trust (Invesco Treasurer’s Series Trust), Short-Term Investments Trust and Invesco Management Trust only); Director and President, INVESCO Funds Group, Inc. (registered investment adviser and registered transfer agent); Director and Chairman, IVZ Distributors, Inc. (formerly known as INVESCO Distributors, Inc.) (registered broker dealer); Director, President and Chairman, Invesco Inc. (holding company), Invesco Canada Holdings Inc. (holding company), Trimark Investments Ltd./Placements Trimark Ltèe and Invesco Financial Services Ltd/Services Financiers Invesco Ltèe; Chief Executive Officer, Invesco Canada Fund Inc. (corporate mutual fund company); Director and Chairman, Van Kampen Investor Services Inc.; Director, Chief Executive Officer and President, 1371 Preferred Inc. (holding company) and Van Kampen Investments Inc.; Director and President, AIM GP Canada Inc. (general partner for limited partnerships) and Van Kampen Advisors, Inc.; Director and Chief Executive Officer, Invesco Trimark Dealer Inc. (registered broker dealer); Director, Invesco Distributors, Inc. (formerly known as Invesco Aim Distributors, Inc.) (registered broker dealer); Manager, Invesco PowerShares Capital Management LLC; Director, Chief Executive Officer and President, Invesco Advisers, Inc.; Director, Chairman, Chief Executive Officer and President, Invesco Aim Capital Management, Inc.; President, Invesco Trimark Dealer Inc. and Invesco Trimark Ltd./Invesco Trimark Ltèe; Director and President, AIM Trimark Corporate Class Inc. and AIM Trimark Canada Fund Inc.; Senior Managing Director, Invesco Holding Company Limited; Director and Chairman, Fund Management Company (former registered broker dealer); President and Principal Executive Officer, The Invesco Funds (AIM Treasurer’s Series Trust (Invesco Treasurer’s Series Trust), and Short-Term Investments Trust only); President, AIM Trimark Global Fund Inc. and AIM Trimark Canada Fund Inc. | 158 | None |
| 1 | Mr. Flanagan is considered an interested person (within the meaning of Section 2(a)(19) of the 1940 Act) of the Trust because he is an officer of the Adviser to the Trust, and an officer and a director of Invesco Ltd., ultimate parent of the Adviser. |
| 2 | Mr. Taylor is considered an interested person (within the meaning of Section 2(a)(19) of the 1940 Act) of the Trust because he is an officer and a director of the Adviser. |
T-1 Invesco Multi-Asset Inflation Fund
Trustees and Officers—(continued)
Name, Year of Birth and Position(s) Held with the Trust | Trustee and/ or Officer Since | Principal Occupation(s) During Past 5 Years | Number of Funds in Fund Complex Overseen by Trustee | Other Directorship(s) Past 5 Years | ||||
| Independent Trustees | ||||||||
Bruce L. Crockett — 1944 Trustee and Chair | 2001 | Chairman, Crockett Technologies Associates (technology consulting company)
Formerly: Director, Captaris (unified messaging provider); Director, President and Chief Executive Officer, COMSAT Corporation; Chairman, Board of Governors of INTELSAT (international communications company); ACE Limited (insurance company); Independent Directors Council and Investment Company Institute: Member of the Audit Committee, Investment Company Institute; Member of the Executive Committee and Chair of the Governance Committee, Independent Directors Council | 158 | Director and Chairman of the Audit Committee, ALPS (Attorneys Liability Protection Society) (insurance company); Director and Member of the Audit Committee and Compensation Committee, Ferroglobe PLC (metallurgical company) | ||||
David C. Arch — 1945 Trustee | 2010 | Chairman of Blistex Inc. (consumer health care products manufacturer); Member, World Presidents’ Organization | 158 | Board member of the Illinois Manufacturers’ Association | ||||
Jack M. Fields — 1952 Trustee | 2001 | Chief Executive Officer, Twenty First Century Group, Inc. (government affairs company); and Chairman, Discovery Learning Alliance (non-profit)
Formerly: Owner and Chief Executive Officer, Dos Angeles Ranch L.P. (cattle, hunting, corporate entertainment); Director, Insperity, Inc. (formerly known as Administaff) (human resources provider); Chief Executive Officer, Texana Timber LP (sustainable forestry company); Director of Cross Timbers Quail Research Ranch (non-profit); and member of the U.S. House of Representatives | 158 | None | ||||
Cynthia Hostetler — 1962 Trustee | 2017 | Non-Executive Director and Trustee of a number of public and private business corporations
Formerly: Head of Investment Funds and Private Equity, Overseas Private Investment Corporation; President, First Manhattan Bancorporation, Inc.; Attorney, Simpson Thacher & Bartlett LLP | 158 | Vulcan Materials Company (construction materials company); Trilinc Global Impact Fund; Aberdeen Investment Funds (4 portfolios); Artio Global Investment LLC (mutual fund complex); Edgen Group, Inc. (specialized energy and infrastructure products distributor) | ||||
Eli Jones — 1961 Trustee | 2016 | Professor and Dean, Mays Business School — Texas A&M University
Formerly: Professor and Dean, Walton College of Business, University of Arkansas and E.J. Ourso College of Business, Louisiana State University; Director, Arvest Bank | 158 | Insperity, Inc. (formerly known as Administaff) (human resources provider) | ||||
Prema Mathai-Davis — 1950 Trustee | 2001 | Retired. | 158 | None | ||||
Teresa M. Ressel — 1962 Trustee | 2017 | Non-executive director and trustee of a number of public and private business corporations
Formerly: Chief Financial Officer, Olayan America, The Olayan Group (international investor/commercial/industrial); Chief Executive Officer, UBS Securities LLC; Group Chief Operating Officer, Americas, UBS AG; Assistant Secretary for Management & Budget and CFO, US Department of the Treasury | 158 | Atlantic Power Corporation (power generation company); ON Semiconductor Corp. (semiconductor supplier) | ||||
Ann Barnett Stern — 1957 Trustee | 2017 | President and Chief Executive Officer, Houston Endowment Inc. (private philanthropic institution)
Formerly: Executive Vice President and General Counsel, Texas Children’s Hospital; Attorney, Beck, Redden and Secrest, LLP; Business Law Instructor, University of St. Thomas; Attorney, Andrews & Kurth LLP | 158 | Federal Reserve Bank of Dallas | ||||
Raymond Stickel, Jr. — 1944 Trustee | 2005 | Retired.
Formerly: Director, Mainstay VP Series Funds, Inc. (25 portfolios); Partner, Deloitte & Touche | 158 | None | ||||
Robert C. Troccoli — 1949 Trustee | 2016 | Adjunct Professor, University of Denver — Daniels College of Business
Formerly: Senior Partner, KPMG LLP | 158 | None | ||||
Christopher L. Wilson — 1957 Trustee | 2017 | Non-executive director and trustee of a number of public and private business corporations
Formerly: Managing Partner, CT2, LLC (investing and consulting firm); President/Chief Executive Officer, Columbia Funds, Bank of America Corporation; President/Chief Executive Officer, CDC IXIS Asset Management Services, Inc.; Principal & Director of Operations, Scudder Funds, Scudder, Stevens & Clark, Inc.; Assistant Vice President, Fidelity Investments | 158 | TD Asset Management USA Inc. (mutual fund complex) (22 portfolios); ISO New England, Inc. (non-profit organization managing regional electricity market) |
T-2 Invesco Multi-Asset Inflation Fund
Trustees and Officers—(continued)
Name, Year of Birth and Position(s) Held with the Trust | Trustee and/ or Officer Since | Principal Occupation(s) During Past 5 Years | Number of Funds in Fund Complex Overseen by Trustee | Other Directorship(s) Past 5 Years | ||||
| Other Officers | ||||||||
Sheri Morris — 1964 President, Principal Executive Officer and Treasurer | 1999 | President, Principal Executive Officer and Treasurer, The Invesco Funds; Vice President, Invesco Advisers, Inc. (formerly known as Invesco Institutional (N.A.), Inc.) (registered investment adviser); and Vice President, PowerShares Exchange-Traded Fund Trust, PowerShares Exchange-Traded Fund Trust II, PowerShares India Exchange-Traded Fund Trust, PowerShares Actively Managed Exchange-Traded Fund Trust, PowerShares Actively Managed Exchange-Traded Commodity Fund Trust and PowerShares Exchange-Traded Self-Indexed Fund Trust
Formerly: Vice President and Principal Financial Officer, The Invesco Funds; Vice President, Invesco Aim Advisers, Inc., Invesco Aim Capital Management, Inc. and Invesco Aim Private Asset Management, Inc.; Assistant Vice President and Assistant Treasurer, The Invesco Funds and Assistant Vice President, Invesco Advisers, Inc., Invesco Aim Capital Management, Inc. and Invesco Aim Private Asset Management, Inc.; and Treasurer, PowerShares Exchange-Traded Fund Trust, PowerShares Exchange-Traded Fund Trust II, PowerShares India Exchange-Traded Fund Trust and PowerShares Actively Managed Exchange-Traded Fund Trust | N/A | N/A | ||||
Russell C. Burk — 1958 Senior Vice President and Senior Officer | 2005 | Senior Vice President and Senior Officer, The Invesco Funds | N/A | N/A | ||||
John M. Zerr — 1962 Senior Vice President, Chief Legal Officer and Secretary | 2006 | Director, Senior Vice President, Secretary and General Counsel, Invesco Management Group, Inc. (formerly known as Invesco AIM Management Group, Inc.); Senior Vice President, Invesco Advisers, Inc. (formerly known as Invesco Institutional (N.A.), Inc.) (registered investment adviser); Senior Vice President and Secretary, Invesco Distributors, Inc. (formerly known as Invesco AIM Distributors, Inc.); Director, Vice President and Secretary, Invesco Investment Services, Inc. (formerly known as Invesco AIM Investment Services, Inc.) Senior Vice President, Chief Legal Officer and Secretary, The Invesco Funds; Managing Director, Invesco PowerShares Capital Management LLC; Director, Secretary and General Counsel, Invesco Investment Advisers LLC (formerly known as Van Kampen Asset Management); Secretary and General Counsel, Invesco Capital Markets, Inc. (formerly known as Van Kampen Funds Inc.) and Chief Legal Officer, PowerShares Exchange-Traded Fund Trust, PowerShares Exchange-Traded Fund Trust II, PowerShares India Exchange-Traded Fund Trust, PowerShares Actively Managed Exchange-Traded Fund Trust, PowerShares Actively Managed Exchange-Traded Commodity Fund Trust and PowerShares Exchange-Traded Self-Indexed Fund Trust; Manager and Secretary, Invesco Indexing LLC
Formerly: Director, Secretary, General Counsel and Senior Vice President, Van Kampen Exchange Corp.; Director, Vice President and Secretary, IVZ Distributors, Inc. (formerly known as INVESCO Distributors, Inc.); Director and Vice President, INVESCO Funds Group, Inc.; Director and Vice President, Van Kampen Advisors Inc.; Director, Vice President, Secretary and General Counsel, Van Kampen Investor Services Inc.; Director, Invesco Distributors, Inc. (formerly known as Invesco AIM Distributors, Inc.); Director, Senior Vice President, General Counsel and Secretary, Invesco AIM Advisers, Inc. and Van Kampen Investments Inc.; Director, Vice President and Secretary, Fund Management Company; Director, Senior Vice President, Secretary, General Counsel and Vice President, Invesco AIM Capital Management, Inc.; Chief Operating Officer and General Counsel, Liberty Ridge Capital, Inc. (an investment adviser); Vice President and Secretary, PBHG Funds (an investment company) and PBHG Insurance Series Fund (an investment company); Chief Operating Officer, General Counsel and Secretary, Old Mutual Investment Partners (a broker-dealer); General Counsel and Secretary, Old Mutual Fund Services (an administrator) and Old Mutual Shareholder Services (a shareholder servicing center); Executive Vice President, General Counsel and Secretary, Old Mutual Capital, Inc. (an investment adviser); and Vice President and Secretary, Old Mutual Advisors Funds (an investment company) | N/A | N/A | ||||
Gregory G. McGreevey — 1962 Senior Vice President | 2012 | Senior Managing Director, Invesco Ltd.; Director, Chairman, President, and Chief Executive Officer, Invesco Advisers, Inc. (formerly known as Invesco Institutional (N.A.), Inc.) (registered investment adviser); Senior Vice President, Invesco Management Group, Inc.; Director, Invesco Mortgage Capital, Inc. and Invesco Senior Secured Management, Inc.; and Senior Vice President, The Invesco Funds
Formerly: Assistant Vice President, The Invesco Funds | N/A | N/A | ||||
Kelli Gallegos — 1970 Vice President, Principal Financial Officer and Assistant Treasurer | 2008 | Vice President, Principal Financial Officer and Assistant Treasurer, The Invesco Funds; Assistant Treasurer, Invesco PowerShares Capital Management LLC, PowerShares Exchange-Traded Fund Trust, PowerShares Exchange-Traded Fund Trust II, PowerShares India Exchange-Traded Fund Trust, PowerShares Actively Managed Exchange-Traded Fund Trust, PowerShares Actively Managed Exchange-Traded Commodity Fund Trust and PowerShares Exchange-Traded Self-Indexed Fund Trust
Formerly: Assistant Vice President, The Invesco Funds | N/A | N/A |
T-3 Invesco Multi-Asset Inflation Fund
Trustees and Officers—(continued)
Name, Year of Birth and Position(s) Held with the Trust | Trustee and/ or Officer Since | Principal Occupation(s) During Past 5 Years | Number of Funds in Fund Complex Overseen by Trustee | Other Directorship(s) Past 5 Years | ||||
| Other Officers—(continued) | ||||||||
Tracy Sullivan — 1962 Vice President, Chief Tax Officer and Assistant Treasurer | 2008 | Vice President, Chief Tax Officer and Assistant Treasurer, The Invesco Funds; Assistant Treasurer, Invesco PowerShares Capital Management LLC, PowerShares Exchange-Traded Fund Trust, PowerShares Exchange-Traded Fund Trust II, PowerShares India Exchange-Traded Fund Trust, PowerShares Actively Managed Exchange-Traded Fund Trust,PowerShares Actively Managed Exchange-Traded Commodity Fund Trust and PowerShares Exchange-Traded Self-Indexed Fund Trust
Formerly: Assistant Vice President, The Invesco Funds | N/A | N/A | ||||
Crissie M. Wisdom — 1969 Anti-Money Laundering Compliance Officer | 2013 | Anti-Money Laundering Compliance Officer, Invesco Advisers, Inc. (formerly known as Invesco Institutional (N.A.), Inc.) (registered investment adviser), Invesco Capital Markets, Inc. (formerly known as Van Kampen Funds Inc.), Invesco Distributors, Inc., Invesco Investment Services, Inc., Invesco Management Group, Inc., The Invesco Funds, and PowerShares Exchange-Traded Fund Trust, PowerShares Exchange-Traded Fund Trust II, PowerShares India Exchange-Traded Fund Trust, PowerShares Actively Managed Exchange-Traded Fund Trust,PowerShares Actively Managed Exchange-Traded Commodity Fund Trust and PowerShares Exchange-Traded Self-Indexed Fund Trust; Anti-Money Laundering Compliance Officer and Bank Secrecy Act Officer, INVESCO National Trust Company and Invesco Trust Company; and Fraud Prevention Manager and Controls and Risk Analysis Manager for Invesco Investment Services, Inc.
Formerly: Anti-Money Laundering Compliance Officer, Van Kampen Exchange Corp. | N/A | N/A | ||||
Robert R. Leveille — 1969 Chief Compliance Officer | 2016 | Chief Compliance Officer, Invesco Advisers, Inc. (registered investment adviser); and Chief Compliance Officer, The Invesco Funds
Formerly: Chief Compliance Officer, Putnam Investments and the Putnam Funds | N/A | N/A |
The Statement of Additional Information of the Trust includes additional information about the Fund’s Trustees and is available upon request, without charge, by calling 1.800.959.4246. Please refer to the Fund’s Statement of Additional Information for information on the Fund’s sub-advisers.
Office of the Fund 11 Greenway Plaza, Suite 1000 Houston, TX 77046-1173 | Investment Adviser Invesco Advisers, Inc. 1555 Peachtree Street, N.E. Atlanta, GA 30309 | Distributor Invesco Distributors, Inc. 11 Greenway Plaza, Suite 1000 Houston, TX 77046-1173 | Auditors PricewaterhouseCoopers LLP 1000 Louisiana Street, Suite 5800 Houston, TX 77002-5678 | |||
Counsel to the Fund Stradley Ronon Stevens & Young, LLP 2005 Market Street, Suite 2600 Philadelphia, PA 19103-7018 | Counsel to the Independent Trustees Goodwin Procter LLP 901 New York Avenue, N.W. Washington, D.C. 20001 | Transfer Agent Invesco Investment Services, Inc. 11 Greenway Plaza, Suite 1000 Houston, TX 77046-1173 | Custodian State Street Bank and Trust Company 225 Franklin Street Boston, MA 02110-2801 | |||
T-4 Invesco Multi-Asset Inflation Fund
Explore HighConviction Investing with Invesco

Go paperless with eDelivery
Visit invesco.com/edelivery to enjoy the convenience and security of anytime electronic access to your investment documents. With eDelivery, you can elect to have any or all of the following materials delivered straight to your inbox to download, save and print from your own computer:
| ∎ | Fund reports and prospectuses |
| ∎ | Quarterly statements |
| ∎ | Daily confirmations |
| ∎ | Tax forms |
Invesco mailing information
Send general correspondence to Invesco Investment Services, Inc., P.O. Box 219078, Kansas City, MO 641219078.
Important notice regarding delivery of security holder documents
To reduce Fund expenses, only one copy of most shareholder documents may be mailed to shareholders with multiple accounts at the same address (Householding). Mailing of your shareholder documents may be householded indefinitely unless you instruct us otherwise. If you do not want the mailing of these documents to be combined with those for other members of your household, please contact Invesco Investment Services, Inc. at 800 959 4246 or contact your financial institution. We will begin sending you individual copies for each account within 30 days after receiving your request.
Fund holdings and proxy voting information
The Fund provides a complete list of its holdings four times in each fiscal year, at the quarter ends. For the second and fourth quarters, the lists appear in the Fund’s semiannual and annual reports to shareholders. For the first and third quarters, the Fund files the lists with the Securities and Exchange Commission (SEC) on Form N-Q. The most recent list of portfolio holdings is available at invesco.com/completeqtrholdings. Shareholders can also look up the Fund’s Forms N-Q on the SEC website at sec.gov. Copies of the Fund’s Forms N-Q may be reviewed and copied at the SEC Public Reference Room in Washington, D.C. You can obtain information on the operation of the Public Reference Room, including information about duplicating fee charges, by calling 202 551 8090 or 800 732 0330, or by electronic request at the following email address: publicinfo@sec.gov. The SEC file numbers for the Fund are shown below.
A description of the policies and procedures that the Fund uses to determine how to vote proxies relating to portfolio securities is available without charge, upon request, from our Client Services department at 800 959 4246 or at invesco.com/proxyguidelines. The information is also available on the SEC website, sec.gov.
Information regarding how the Fund voted proxies related to its portfolio securities during the most recent 12month period ended June 30 is available at invesco.com/proxysearch. The information is also available on the SEC website, sec.gov. Invesco Advisers, Inc. is an investment adviser; it provides investment advisory services to individual and institutional clients and does not sell securities. Invesco Distributors, Inc. is the US distributor for Invesco Ltd.’s retail mutual funds, exchangetraded funds and institutional money market funds. Both are wholly owned, indirect subsidiaries of Invesco Ltd. |  |
| SEC file numbers: 811-02699 and 002-57526 Invesco Distributors, Inc. | MAI-AR-1 02162018 1248 |
 |
| |||
Annual Report to Shareholders |
December 31, 2017 | |||
| ||||
Invesco Quality Income Fund
| ||||
| Nasdaq: | ||||
| A: VKMGX ∎ B: VUSBX ∎ C: VUSCX ∎ Y: VUSIX ∎ R5: VUSJX | ||||

Letters to Shareholders
Philip Taylor | Dear Shareholders: This annual report includes information about your Fund, including performance data and a complete list of its investments as of the close of the reporting period. Inside is a discussion of how your Fund was managed and the factors that affected its performance during the reporting period. Major stock market indexes rose – and set record highs – throughout the reporting period. Generally positive economic data, strong corporate earnings and anticipated tax and regulatory reform contributed to the rally. The US economy expanded during the reporting period, with gross domestic product, the value of all goods and services produced, significantly increasing its growth rate from the first to the third quarter of the year. Tax reform legislation, enacted in December 2017, was a positive for the stock market, but its long-term economic impact was uncertain. Citing positive economic trends – specifically, realized and expected labor market conditions and inflation – the US Federal Reserve |

raised interest rates in March, June and December 2017. While US and global bond markets, as well as emerging market equities, sold off early in the reporting period, they recovered much of their losses during the reporting period. Overseas, economic data were mixed, prompting the European Central Bank and central banks in China and Japan, among other countries, to maintain extraordinarily accommodative monetary policies.
Short-term market volatility can prompt some investors to abandon their investment plans – and can cause others to settle for whatever returns the market has to offer. The investment professionals at Invesco, in contrast, invest with high conviction. This means that, no matter the asset class or the strategy, each investment team has a passion to exceed. We want to help investors achieve better outcomes, such as seeking higher returns, helping mitigate risk and generating income. Of course, investing with high conviction can’t guarantee a profit or ensure success; no investment strategy can. To learn more about how we invest with high conviction, visit invesco.com/HighConviction.
You, too, can invest with high conviction by maintaining a long-term investment perspective and by working with your financial adviser on a regular basis. During periods of short-term market volatility or uncertainty, your financial adviser can keep you focused on your long-term investment goals – a new home, a child’s college education or a secure retirement. He or she also can share research about the economy, the markets and individual investment options.
Visit our website for more information on your investments
Our website, invesco.com/us, offers a wide range of market insights and investment perspectives. On the website, you’ll find detailed information about our funds, including performance, holdings and portfolio manager commentaries. You can access information about your account by completing a simple, secure online registration. To do so, select “Log In” on the right side of the homepage, and then select “Register for Individual Account Access.”
In addition to the resources accessible on our website and through our mobile app, you can obtain timely updates to help you stay informed about the markets and the economy by connecting with Invesco on Twitter, LinkedIn or Facebook. You can access our blog at blog.invesco.us.com. Our goal is to provide you the information you want, when and where you want it.
Finally, I’m pleased to share with you Invesco’s commitment to both the Principles for Responsible Investment and to considering environmental, social and governance issues in our robust investment process. I invite you to learn more at invesco.com/esg.
Have questions?
For questions about your account, contact an Invesco client services representative at 800 959 4246. For Invesco-related questions or comments, please email me directly at phil@invesco.com.
All of us at Invesco look forward to serving your investment management needs. Thank you for investing with us.
Sincerely, |
|
Philip Taylor |
Senior Managing Director, Invesco Ltd. |

| 2 | Invesco Quality Income Fund |
Bruce Crockett | Dear Fellow Shareholders: | |||||
| Among the many important lessons I’ve learned in more than 40 years in a variety of business endeavors is the value of a trusted advocate. | ||||||
As independent chair of the Invesco Funds Board, I can assure you that the members of the Board are strong advocates for the interests of investors in Invesco’s mutual funds. We work hard to represent your interests through oversight of the quality of the investment management services your funds receive and other matters important to your investment, including but not limited to: | ||||||
| ∎ | Ensuring that Invesco offers a diverse lineup of mutual funds that your financial adviser can use to strive to meet your financial needs as your investment goals change over time. | |||||
| ∎ | Monitoring how the portfolio management teams of the Invesco funds are performing in light of changing economic and market conditions. | |||||

| ∎ | Assessing each portfolio management team’s investment performance within the context of the investment strategy described in the fund’s prospectus. |
| ∎ | Monitoring for potential conflicts of interests that may impact the nature of the services that your funds receive. |
We believe one of the most important services we provide our fund shareholders is the annual review of the funds’ advisory and sub-advisory contracts with Invesco Advisers and its affiliates. This review is required by the Investment Company Act of 1940 and focuses on the nature and quality of the services Invesco provides as the adviser to the Invesco funds and the reasonableness of the fees that it charges for those services. Each year, we spend months carefully reviewing information received from Invesco and a variety of independent sources, such as performance and fee data prepared by Lipper, Inc. (a subsidiary of Broadridge Financial Solutions, Inc.), an independent, third-party firm widely recognized as a leader in its field. We also meet with our independent legal counsel and other independent advisers to review and help us assess the information that we have received. Our goal is to assure that you receive quality investment management services for a reasonable fee.
I trust the measures outlined above provide assurance that you have a worthy advocate when it comes to choosing the Invesco Funds.
As always, please contact me at bruce@brucecrockett.com with any questions or concerns you may have. On behalf of the Board, we look forward to continuing to represent your interests and serving your needs.
Sincerely,
|
|
Bruce L. Crockett |
Independent Chair |
Invesco Funds Board of Trustees |

| 3 | Invesco Quality Income Fund |
Management’s Discussion of Fund Performance
Performance summary | ||||
For the year ended December 31, 2017, Class A shares of Invesco Quality Income Fund (the Fund), at net asset value (NAV), underperformed the Fund’s style-specific index, the Bloomberg Barclays U.S. Mortgage-Backed Securities Index. |
| |||
Your Fund’s long-term performance appears later in this report.
| ||||
Fund vs. Indexes | ||||
Total returns, 12/31/16 to 12/31/17, at net asset value (NAV). Performance shown does not include applicable contingent deferred sales charges (CDSC) or front-end sales charges, which would have reduced performance.
|
| |||
Class A Shares | 1.98 | % | ||
Class B Shares | 1.45 | |||
Class C Shares | 1.28 | |||
Class Y Shares | 2.32 | |||
Class R5 Shares | 2.46 | |||
Class R6 Shares* | 2.39 | |||
ICE BofAML 1-10 Year U.S. Treasury Indexq (Broad Market Index) | 1.08 | �� | ||
Bloomberg Barclays U.S. Mortgage-Backed Securities Indexq (Style-Specific Index) | 2.47 | |||
Source(s): qFactSet Research Systems Inc. | ||||
*Class R6 shares incepted on April 4, 2017. See page 7 for more information. | ||||
Market conditions and your Fund
A volatile political environment kept things exciting in 2017. The economic agenda of President Donald Trump largely stalled until Congress passed the Tax Cut and Jobs Act just before the end of the year. The Act cut both corporate and individual tax rates. However, the promise to repeal and replace the Affordable Care Act earlier in 2017 proved to be too big a hurdle for the slim Republican majority in the Senate to overcome. Cuts in regulation combined with growing business optimism helped the unemployment rate to decline to 4.1% by the end of the year.1 The housing market remained stable, and consumer confidence hit record levels. Despite robust economic growth in the second half of 2017, inflation and wage growth remained muted.
The US Federal Reserve (the Fed) hiked the fed funds rate range by 0.25% at each of three different meetings in 2017, leaving the range at 1.25% to 1.50% at year end.2 The Fed also was able to initiate a gradual reduction in the size of its balance sheet by imposing a cap on the amount of Treasuries and mortgages it was buying. Beginning in October, the
Fed reduced its monthly Treasury purchases by $6 billion and its mortgage purchases by $4 billion.2 The rate hikes and balance sheet reductions were accomplished without disrupting the financial markets.
The yield curve flattened significantly during the year as the two-year Treasury yield rose 70 basis points, while the 30-year Treasury yield fell 32 basis points.3 (A basis point is 0.01%.) We believe that low inflation and a reasonably aggressive Fed were largely responsible for the change in the shape of the yield curve. The 10-year Treasury yield ended the year at 2.41%, almost exactly where it began the year.3
Given this market backdrop, Class A shares of Invesco Quality Income Fund, at NAV, generated a positive return but underperformed the Fund’s style-specific index, the Bloomberg Barclays U.S. Mortgage-Backed Securities Index.
The Fund’s allocation to non-agency mortgage-backed securities (MBS), commercial MBS and asset-backed securities were the primary contributors to Fund performance, as credit spreads tightened during the year. During the year,
| Portfolio Composition | ||||
| By security type, based on total investments | ||||
U.S. Government Sponsored Mortgage-Backed Securities | 70.9 | % | ||
Asset-Backed Securities | 24.1 | |||
Agency Credit Risk Transfer Notes | 3.4 | |||
Security Types Each Less than 1% of Portfolio | 0.2 | |||
Money Market Funds | 1.4 | |||
| Top Five Debt Issuers* | ||||||
| % of total net assets | ||||||
1. | Federal National Mortgage Association | 51.1 | % | |||
2. | Federal Home Loan Mortgage Corp. | 26.6 | ||||
3. | Government National Mortgage Association | 10.3 | ||||
4. | Freddie Mac REMICs | 6.3 | ||||
5. | Ginnie Mae REMICs | 4.3 | ||||
investments in agency MBS provided an additional boost to Fund performance, while exposure to interest-only agency collateralized mortgage obligations (CMO) detracted from Fund performance modestly.
During the reporting period, the Fund also benefited from incremental income earned by engaging in dollar (mortgage) roll activity, a type of repurchase transaction in the highly liquid to-be-announced market for agency MBS. A dollar roll involves the Fund selling an MBS to a financial institution, with an agreement to repurchase a substantially similar security at an agreed upon price and date. Excess portfolio cash resulting from the use of this strategy is subsequently invested to generate additional return for the Fund. The Fund’s exposure to interest-only agency CMO and its underweight exposure to current coupon 30-year agency MBS relative to the style-specific benchmark were the key detractors from the Fund’s relative performance.
During the reporting period, the Fund used active duration and yield curve positioning for risk management and for generating returns. Duration measures a portfolio’s price sensitivity to interest rate changes, with a shorter-duration portfolio tending to be less sensitive to these changes. During the year, we maintained the portfolio’s overall duration slightly longer than that of the style-specific benchmark, on average, which produced favorable results as rates fell. However, yield curve positioning within the portfolio emphasized short-term (six months to two years) interest rates, missing much of the performance benefit of falling longer-term rates, and more than offsetting the positive relative return generated by duration positioning alone. Buying and selling US Treasury futures contracts was an important tool we used for the management of interest rate risk and to maintain our targeted portfolio duration.
Please note that our strategy is implemented using derivative instruments, including futures, swaps and options.
Total Net Assets | $ | 609.9 million | ||
Total Number of Holdings* | 747 | |||
The Fund’s holdings are subject to change, and there is no assurance that the Fund will continue to hold any particular security.
*Excluding money market fund holdings.
Data presented here are as of December 31, 2017.
| 4 | Invesco Quality Income Fund |
Therefore, a portion of the performance of the Fund, both positive and negative, can be attributed to these instruments. Derivatives can be a cost-effective way to gain or hedge exposure to certain risks. However, derivatives may amplify traditional investment risks through the creation of leverage and may be less liquid than traditional securities.
We wish to remind you that the Fund is subject to interest rate risk, meaning when interest rates rise, the value of fixed income securities tends to fall. This risk may be greater in the current market environment because interest rates are at or near historic lows. The degree to which the value of fixed income securities may decline due to rising interest rates may vary depending on the speed and magnitude of the increase in interest rates, as well as individual security characteristics such as price, maturity, duration and coupon and market forces such as supply and demand for similar securities. We are monitoring interest rates, and the market, economic and geopolitical factors that may impact the direction, speed and magnitude of changes to interest rates across the maturity spectrum, including the potential impact of monetary policy changes by the Fed and certain foreign central banks. If interest rates rise, markets may experience increased volatility, which may affect the value and/ or liquidity of certain of the Fund’s investments.
We welcome new investors who joined the Fund during the year and thank you for your investment in Invesco Quality Income Fund.
1 Source: Bureau of Labor Statistics
2 Source: US Federal Reserve
3 Source: Bloomberg L.P.
The views and opinions expressed in management’s discussion of Fund performance are those of Invesco Advisers, Inc. These views and opinions are subject to change at any time based on factors such as market and economic conditions. These views and opinions may not be relied upon as investment advice or recommendations, or as an offer for a particular security. The information is not a complete analysis of every aspect of any market, country, industry, security or the Fund. Statements of fact are from sources considered reliable, but Invesco Advisers, Inc. makes no representation or warranty as to their completeness or accuracy. Although historical performance is no guarantee of future results, these insights may help you understand our investment management philosophy.
See important Fund and, if applicable, index disclosures later in this report.
 | Mario Clemente | |
| Portfolio Manager, Head of Structured Investments and Stable Value for Invesco Fixed | ||
Income, is manager of Invesco Quality Income Fund. He joined Invesco in 2014. Mr. Clemente earned an undergraduate degree in finance and international business from Hofstra University and an MBA from the Stern School of Business at New York University.
 | Clint Dudley | |
| Chartered Financial Analyst, Portfolio Manager, is manager of Invesco Quality Income Fund. He | ||
joined Invesco in 1998. Mr. Dudley earned a BBA and an MBA from Baylor University.
| ||
 | Jason Marshall | |
| Portfolio Manager, is manager of Invesco Quality Income Fund. He joined Invesco in 2007. Mr. Marshall | ||
earned a BS in finance from Indiana University of Penn-sylvania and an MBA from Duquesne University.
| ||
 | Brian Norris | |
| Chartered Financial Analyst, Portfolio Manager, is manager of Invesco Quality Income Fund. He | ||
| joined Invesco in 2001. Mr. Norris earned a BS in business administration with a concentration in finance from the University of Louisville. | ||
| 5 | Invesco Quality Income Fund |
Your Fund’s Long-Term Performance
Results of a $10,000 Investment – Oldest Share Class(es)
Fund and index data from 12/31/07
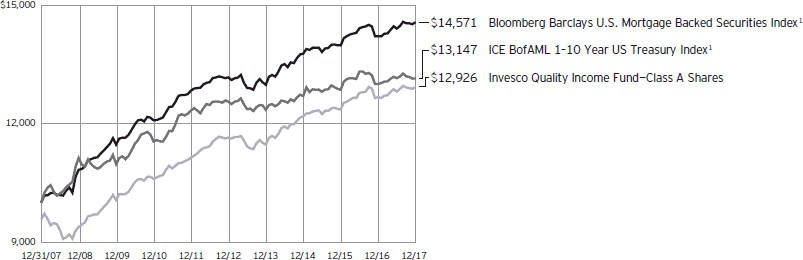
1 Source: FactSet Research Systems Inc.
Past performance cannot guarantee comparable future results.
The data shown in the chart include reinvested distributions, applicable sales charges and Fund expenses including
management fees. Index results include reinvested dividends, but they do not reflect sales charges. Performance of the peer group, if applicable, reflects fund expenses and management fees;
performance of a market index does not. Performance shown in the chart and table(s) does not reflect deduction of taxes a shareholder would pay on Fund distributions or sale of Fund shares.
| 6 | Invesco Quality Income Fund |
Average Annual Total Returns |
| |||
As of 12/31/17, including maximum applicable sales charges |
| |||
Class A Shares | ||||
Inception (5/31/84) | 6.18 | % | ||
10 Years | 2.60 | |||
5 Years | 1.21 | |||
1 Year | -2.37 | |||
Class B Shares | ||||
Inception (8/24/92) | 4.20 | % | ||
10 Years | 2.43 | |||
5 Years | 1.02 | |||
1 Year | -3.49 | |||
Class C Shares | ||||
Inception (8/13/93) | 3.47 | % | ||
10 Years | 2.27 | |||
5 Years | 1.33 | |||
1 Year | 0.30 | |||
Class Y Shares | ||||
Inception (9/25/06) | 3.62 | % | ||
10 Years | 3.34 | |||
5 Years | 2.36 | |||
1 Year | 2.32 | |||
Class R5 Shares | ||||
10 Years | 3.29 | % | ||
5 Years | 2.44 | |||
1 Year | 2.46 | |||
Class R6 Shares | ||||
10 Years | 3.09 | % | ||
5 Years | 2.18 | |||
1 Year | 2.39 | |||
Effective June 1, 2010, Class A, Class B, Class C and Class I shares of the predecessor fund, Van Kampen U.S. Mortgage Fund, advised by Van Kampen Asset Management were reorganized into Class A, Class B, Class C and Class Y shares, respectively, of Invesco Van Kampen U.S. Mortgage Fund (renamed Invesco U.S. Mortgage Fund). Returns shown above, prior to June 1, 2010, for Class A, Class B, Class C and Class Y shares are blended returns of the predecessor fund and Invesco U.S. Mortgage Fund. Share class returns will differ from the predecessor fund because of different expenses.
Class R5 shares incepted on June 1, 2010. Performance shown prior to that date is that of the predecessor fund’s Class A shares and includes the 12b-1 fees applicable to Class A shares.
Class R6 shares incepted on April 4, 2017. Performance shown prior to that date is that of the Fund’s and the predecessor fund’s Class A shares and
includes the 12b-1 fees applicable to Class A shares.
The performance data quoted represent past performance and cannot guarantee comparable future results; current performance may be lower or higher. Please visit invesco.com/performance for the most recent month-end performance. Performance figures reflect reinvested distributions, changes in net asset value and the effect of the maximum sales charge unless otherwise stated. Investment return and principal value will fluctuate so that you may have a gain or loss when you sell shares.
The net annual Fund operating expense ratio set forth in the most recent Fund prospectus as of the date of this report for Class A, Class B, Class C, Class Y, Class R5 and Class R6 shares was 0.93%, 1.69%, 1.69%, 0.69%, 0.56% and 0.56%, respectively.1 The total annual Fund operating expense ratio set forth in the most recent Fund prospectus as of the date of this report for Class A, Class B, Class C, Class Y, Class R5 and Class R6 shares was 0.94%, 1.70%, 1.70%, 0.70%, 0.57% and 0.57%, respectively. The expense ratios presented above may vary from the expense ratios presented in other sections of this report that are based on expenses incurred during the period covered by this report.
Class A share performance reflects the maximum 4.25% sales charge, and Class B and Class C share performance reflects the applicable contingent deferred sales charge (CDSC) for the period involved. For shares purchased prior to June 1, 2010, the CDSC on Class B shares declines from 4% at the time of purchase to 0% at the beginning of the seventh year. For shares purchased on or after June 1, 2010, the CDSC on Class B shares declines from 5% at the time of purchase to 0% at the beginning of the seventh year. The CDSC on Class C shares is 1% for the first year after purchase. Class Y, Class R5 and Class R6 shares do not have a front-end sales charge or a CDSC; therefore, performance is at net asset value.
The performance of the Fund’s share classes will differ primarily due to different sales charge structures and class expenses.
Fund performance reflects any applicable fee waivers and/or expense reimbursements. Had the adviser not waived fees and/or reimbursed expenses currently or in the past, returns would have been lower. See current prospectus for more information.
| 1 | Total annual Fund operating expenses after any contractual fee waivers and/or expense reimbursements by the adviser in effect through at least June 30, 2019. See current prospectus for more information. |
| 7 | Invesco Quality Income Fund |
Invesco Quality Income Fund’s investment objective is to provide a high level of current income, with liquidity and safety of principal.
| ∎ | Unless otherwise stated, information presented in this report is as of December 31, 2017, and is based on total net assets. |
| ∎ | Unless otherwise noted, all data provided by Invesco. |
| ∎ | To access your Fund’s reports/prospectus, visit invesco.com/fundreports. |
About share classes
| ∎ | Effective January 26, 2018, after the close of the reporting period, all outstanding Class B shares were converted to Class A shares, in advance of their normally scheduled conversion. No CDSC was paid in connection with this early conversion. |
| ∎ | Class Y shares are available only to certain investors. Please see the prospectus for more information. |
| ∎ | Class R5 shares and Class R6 shares are available for use by retirement plans that meet certain standards and for institutional investors. Class R6 shares are also available through intermediaries that have established an agreement with Invesco Distributors, Inc. to make such shares available for use in retail omnibus accounts. Please see the prospectus for more information. |
Principal risks of investing in the Fund
| ∎ | Active trading risk. Active trading of portfolio securities may result in added expenses, a lower return and increased tax liability. |
| ∎ | Borrowing risk. Borrowing money to buy securities exposes the Fund to leverage and will cause the Fund’s share price to be more volatile because leverage will exaggerate the effect of any increase or decrease in the value of the Fund’s portfolio securities. Borrowing money may also require the Fund to liquidate positions when it may not be advantageous to do so. In addition, the Fund will incur interest expenses and other fees on borrowed money. There can be no assurance that the Fund’s borrowing strategy will enhance and not reduce the Fund’s returns. |
| ∎ | Changing fixed income market conditions risk. The current low interest rate environment was created in part by the Federal Reserve Board (FRB) and certain foreign central banks keeping the federal funds and equivalent foreign rates near, at or below zero. Increases in the federal funds and equivalent foreign |
rates may expose fixed income markets to heightened volatility and reduced liquidity for certain fixed income investments, particularly those with longer maturities. In addition, decreases in fixed income dealer market-making capacity may also potentially lead to heightened volatility and reduced liquidity in the fixed income markets. As a result, the value of the Fund’s investments and share price may decline. Changes in central bank policies could also result in higher than normal shareholder redemptions, which could potentially increase portfolio turnover and the Fund’s transaction costs. |
| ∎ | Debt securities risk. The prices of debt securities held by the Fund will be affected by changes in interest rates, the creditworthiness of the issuer and other factors. An increase in prevailing interest rates typically causes the value of existing debt securities to fall and often has a greater impact on longer-duration debt securities and higher quality debt securities. Falling interest rates will cause the Fund to reinvest the proceeds of debt securities that have been repaid by the issuer at lower interest rates. Falling interest rates may also reduce the Fund’s distributable income because interest payments on floating rate debt instruments held by the Fund will decline. The Fund could lose money on investments in debt securities if the issuer or borrower fails to meet its obligations to make interest payments and/or to repay principal in a timely manner. Changes in an issuer’s financial strength, the market’s perception of such strength or in the credit rating of the issuer or the security may affect the value of debt securities. The Adviser’s credit analysis may fail to anticipate such changes, which could result in buying a debt security at an inopportune time or failing to sell a debt security in advance of a price decline or other credit event. |
| ∎ | Derivatives risk. The value of a derivative instrument depends largely on (and is derived from) the value of an underlying security, currency, commodity, |
interest rate, index or other asset (each referred to as an underlying asset). In addition to risks relating to the underlying assets, the use of derivatives may include other, possibly greater, risks, including counterparty, leverage and liquidity risks. Counterparty risk is the risk that the counterparty to the derivative contract will default on its obligation to pay the Fund the amount owed or otherwise perform under the derivative contract. Derivatives create leverage risk because they do not require payment up front equal to the economic exposure created by owning the derivative. As a result, an adverse change in the value of the underlying asset could result in the Fund sustaining a loss that is substantially greater than the amount invested in the derivative, which may make the Fund’s returns more volatile and increase the risk of loss. Derivative instruments may also be less liquid than more traditional investments and the Fund may be unable to sell or close out its derivative positions at a desirable time or price. This risk may be more acute under adverse market conditions, during which the Fund may be most in need of liquidating its derivative positions. Derivatives may also be harder to value, less tax efficient and subject to changing government regulation that could impact the Fund’s ability to use certain derivatives or their cost. Also, derivatives used for hedging or to gain or limit exposure to a particular market segment may not provide the expected benefits, particularly during adverse market conditions. |
| ∎ | Dollar roll transactions risk. Dollar roll transactions occur in connection with TBA transactions and involve the risk that the market value of the securities the Fund is required to purchase may decline below the agreed upon purchase price of those securities. Dollar roll transactions add a form of leverage to the Fund’s portfolio, which may make the Fund’s returns more volatile and increase the risk of loss. In addition, dollar roll transactions may increase the Fund’s portfolio turnover, which may result in increased brokerage costs and may lower the Fund’s actual return. |
| ∎ | Liquidity risk. The Fund may be unable to sell illiquid investments at the time or price it desires and, as a result, could lose its entire investment in such investments. |
This report must be accompanied or preceded by a currently effective Fund prospectus, which contains more complete information, including sales charges and expenses. Investors should read it carefully before investing.
| ||||
NOT FDIC INSURED | MAY LOSE VALUE | NO BANK GUARANTEE
| 8 | Invesco Quality Income Fund |
Liquid securities can become illiquid during periods of market stress. If a significant amount of the Fund’s securities become illiquid, the Fund may not be able to timely pay redemption proceeds and may need to sell securities at significantly reduced prices. |
| ∎ | Management risk. The Fund is actively managed and depends heavily on the Adviser’s judgment about markets, interest rates or the attractiveness, relative values, liquidity, or potential appreciation of particular investments made for the Fund’s portfolio. The Fund could experience losses if these judgments prove to be incorrect. Additionally, legislative, regulatory, or tax developments may adversely affect management of the Fund and, therefore, the ability of the Fund to achieve its investment objective. |
| ∎ | Market risk. The market values of the Fund’s investments, and therefore the value of the Fund’s shares, will go up and down, sometimes rapidly or unpredictably. Market risk may affect a single issuer, industry or section of the economy, or it may affect the market as a whole. Individual stock prices tend to go up and down more dramatically than those of certain other types of investments, such as bonds. During a general downturn in the financial markets, multiple asset classes may decline in value. When markets perform well, there can be no assurance that specific investments held by the Fund will rise in value. |
| ∎ | Mortgage- and asset-backed securities risk. Mortgage- and asset-backed securities, including collateralized debt obligations and collateralized mortgage obligations, are subject to prepayment or call risk, which is the risk that a borrower’s payments may be received earlier or later than expected due to changes in prepayment rates on underlying loans. This could result in the Fund reinvesting these early payments at lower interest rates, thereby reducing the Fund’s income. Mortgage- and asset-backed securities also are subject to extension risk, which is the risk that an unexpected rise in interest rates could reduce the rate of prepayments, causing the price of the mortgage- and asset-backed securities and the Fund’s share price to fall. An unexpectedly high rate of defaults on the mortgages held by a mortgage pool may adversely affect the value of mortgage-backed securities and could result in losses to |
the Fund. The Fund may invest in mortgage pools that include subprime mortgages, which are loans made to borrowers with weakened credit histories or with lower capacity to make timely payments on their mortgages. Privately issued mortgage-related securities are not subject to the same underwriting requirements as those with government or government-sponsored entity guarantees and, therefore, mortgage loans underlying privately issued mortgage-related securities may have less favorable collateral, credit risk or other underwriting characteristics, and wider variances in interest rate, term, size, purpose and borrower characteristics. |
| ∎ | TBA transactions risk. TBA transactions involve the risk of loss if the securities received are less favorable than what was anticipated by the Fund when entering into the TBA transaction, or if the counterparty fails to deliver the securities. When the Fund enters into a short sale of a TBA mortgage it does not own, the Fund may have to purchase deliverable mortgages to settle the short sale at a higher price than anticipated, thereby causing a loss. As there is no limit on how much the price of mortgage securities can increase, the Fund’s exposure is unlimited. The Fund may not always be able to purchase mortgage securities to close out the short position at a particular time or at an acceptable price. In addition, taking short positions results in a form of leverage, which could increase the volatility of the Fund’s share price. |
| ∎ | US government obligations risk. Obligations of US government agencies and authorities receive varying levels of support and may not be backed by the full faith and credit of the US government, which could affect the Fund’s ability to recover should they default. No assurance can be given that the US government will provide financial support to its agencies and authorities if it is not obligated by law to do so. |
| ∎ | When-issued, delayed delivery and forward commitment risks. When-issued and delayed delivery transactions subject the Fund to market risk because the value or yield of a security at delivery may be more or less than the purchase price or yield generally available when delivery occurs, and counterparty risk because the Fund relies on the buyer or seller, as the case may be, to consummate the transaction. These |
transactions also have a leveraging effect on the Fund because the Fund commits to purchase securities that it does not have to pay for until a later date, which increases the Fund’s overall investment exposure and, as a result, its volatility. |
| ∎ | Zero coupon or pay-in-kind securities risk. The value, interest rates, and liquidity of non-cash paying instruments, such as zero coupon and pay-in-kind securities, are subject to greater fluctuation than other types of securities. The higher yields and interest rates on pay-in-kind securities reflect the payment deferral and increased credit risk associated with such instruments and that such investments may represent a higher credit risk than loans that periodically pay interest. |
About indexes used in this report
| ∎ | The ICE BofAML 1-10 Year U.S. Treasury Index tracks the performance of US Treasury securities with maturities between one and 10 years. |
| ∎ | The Bloomberg Barclays U.S. Mortgage Backed Securities Index represents mortgage-backed pass-through securities of Ginnie Mae, Fannie Mae and Freddie Mac. |
| ∎ | The Fund is not managed to track the performance of any particular index, including the index(es) described here, and consequently, the performance of the Fund may deviate significantly from the performance of the index(es). |
| ∎ | A direct investment cannot be made in an index. Unless otherwise indicated, index results include reinvested dividends, and they do not reflect sales charges. Performance of the peer group, if applicable, reflects fund expenses; performance of a market index does not. |
Other information
| ∎ | The returns shown in management’s discussion of Fund performance are based on net asset values (NAVs) calculated for shareholder transactions. Generally accepted accounting principles require adjustments to be made to the net assets of the Fund at period end for financial reporting purposes, and as such, the NAVs for shareholder transactions and the returns based on those NAVs may differ from the NAVs and returns reported in the Financial Highlights. |
| 9 | Invesco Quality Income Fund |
Schedule of Investments
December 31, 2017
| Principal Amount | Value | |||||||
U.S. Government Sponsored Agency Mortgage-Backed Securities–106.23% |
| |||||||
| Collateralized Mortgage Obligations–18.12% | ||||||||
Fannie Mae ACES, | $ | 6,177,361 | $ | 6,206,487 | ||||
Fannie Mae Grantor Trust, 7.50%, 01/19/2039(b) | 305,758 | 336,777 | ||||||
Fannie Mae, Interest STRIPS, IO, 6.50%, 10/25/2024 | 143,623 | 18,036 | ||||||
8.00%, 05/25/2030 | 688,307 | 190,709 | ||||||
7.50%, 01/25/2032 | 226,144 | 37,073 | ||||||
Fannie Mae REMICs, | 40,638 | 40,521 | ||||||
7.00%, 09/25/2032 | 251,259 | 289,683 | ||||||
6.58%, 06/25/2039(b) | 919,789 | 1,061,362 | ||||||
1.56% (1 mo. USD LIBOR + 0.32%), 01/25/2045(a) | 1,299,957 | 1,297,613 | ||||||
3.00%, 05/25/2045 | 2,196,174 | 2,158,382 | ||||||
2.05% (1 mo. USD LIBOR + 0.50%), 05/25/2046 to 06/25/2046(a) | 5,550,178 | 5,601,255 | ||||||
1.95% (1 mo. USD LIBOR + 0.40%), 09/25/2046(a) | 4,109,191 | 4,132,563 | ||||||
Fannie Mae REMICs, IO, | 315,251 | 561 | ||||||
3.00%, 10/25/2026 to 02/25/2028 | 18,773,610 | 1,672,501 | ||||||
8.00%, 08/18/2027 to 09/18/2027 | 769,084 | 168,511 | ||||||
6.00%, 05/25/2033 | 38,014 | 9,036 | ||||||
7.00%, 05/25/2033 | 743,692 | 182,789 | ||||||
3.50%, 08/25/2042 | 1,447,071 | 193,893 | ||||||
1.85%, 03/25/2043(b) | 12,536,158 | 775,613 | ||||||
1.81%, 04/25/2045(b) | 14,400,825 | 779,864 | ||||||
1.57%, 02/25/2056(b) | 20,331,733 | 852,542 | ||||||
Freddie Mac Multifamily Structured Pass Through Securities, | 1,898,549 | 1,900,694 | ||||||
Freddie Mac REMICs, | 11,766 | 11,807 | ||||||
3.00%, 10/15/2018 to 03/15/2035 | 2,612,248 | 2,612,057 | ||||||
1.50%, 01/15/2027 | 5,096,594 | 4,970,619 | ||||||
1.93% (1 mo. USD LIBOR + 0.45%), 10/15/2036(a) | 1,446,168 | 1,453,500 | ||||||
2.03% (1 mo. USD LIBOR + 0.55%), 10/15/2036(a) | 1,136,201 | 1,140,139 | ||||||
1.59% (1 mo. USD LIBOR + 0.35%), 12/15/2036(a) | 7,032,925 | 7,032,690 | ||||||
1.61% (1 mo. USD LIBOR + 0.37%), 08/15/2038(a) | 1,585,508 | 1,582,858 | ||||||
1.69% (1 mo. USD LIBOR + 0.45%), 09/15/2040(a) | 1,318,075 | 1,320,458 | ||||||
1.74% (1 mo. USD LIBOR + 0.50%), 11/15/2041 to 03/15/2042(a) | 3,541,749 | 3,538,024 | ||||||
1.64% (1 mo. USD LIBOR + 0.40%), 12/15/2042(a) | 5,885,157 | 5,876,004 | ||||||
1.78% (1 mo. USD LIBOR + 0.30%), 10/15/2043 to 09/15/2044(a) | 9,027,699 | 9,022,412 | ||||||
| Principal Amount | Value | |||||||
| Collateralized Mortgage Obligations–(continued) | ||||||||
Freddie Mac REMICs, IO, 3.00%, 09/15/2025 | $ | 3,092,281 | $ | 128,872 | ||||
2.50%, 09/15/2027 | 2,741,853 | 182,717 | ||||||
1.78%, 04/15/2038(b) | 8,257,133 | 359,222 | ||||||
1.76%, 08/15/2038(b) | 15,445,652 | 679,530 | ||||||
1.55%, 11/15/2038(b) | 12,984,219 | 651,756 | ||||||
1.86%, 11/15/2038(b) | 13,958,713 | 771,724 | ||||||
1.75%, 02/15/2039(b) | 6,937,816 | 337,447 | ||||||
1.90%, 12/15/2039(b) | 14,915,046 | 716,171 | ||||||
1.91%, 12/15/2039(b) | 21,127,422 | 847,119 | ||||||
2.00%, 10/15/2040(b) | 17,258,221 | 833,425 | ||||||
4.00%, 12/15/2041 | 1,690,482 | 189,391 | ||||||
Freddie Mac STRIPS, | 7,453,259 | 7,446,883 | ||||||
Freddie Mac STRIPS, IO, 8.00%, 06/15/2031 | 1,077,281 | 288,915 | ||||||
Freddie Mac Structured Pass Through Securities, 6.50%, 02/25/2043 | 1,921,502 | 2,233,172 | ||||||
Freddie Mac Whole Loan Securities Trust, 3.00%, 09/25/2045 | 1,860,952 | 1,832,546 | ||||||
Ginnie Mae REMICs, 5.89%, 01/20/2039(b) | 1,865,564 | 2,059,009 | ||||||
1.94% (1 mo. USD LIBOR + 0.45%), 12/16/2039(a) | 2,584,750 | 2,607,766 | ||||||
4.49%, 07/20/2041(b) | 2,643,257 | 2,769,995 | ||||||
2.51%, 09/20/2041(b) | 2,161,029 | 2,262,578 | ||||||
2.50%, 10/20/2043 | 1,109,665 | 959,876 | ||||||
1.75% (1 mo. USD LIBOR + 0.25%), 09/20/2045(a) | 6,802,456 | 6,803,755 | ||||||
3.00%, 10/20/2045 to 01/20/2046 | 8,852,740 | 8,542,702 | ||||||
Ginnie Mae REMICs, IO, 1.59%, | 6,030,035 | 545,998 | ||||||
| 110,517,602 | ||||||||
| Federal Home Loan Mortgage Corp. (FHLMC)–26.59% | ||||||||
Pass Through Ctfs., | 6,373,977 | 6,930,294 | ||||||
8.50%, 08/01/2019 to 08/01/2031 | 252,366 | 301,118 | ||||||
3.50%, 08/01/2026 to 09/01/2045 | 8,720,806 | 9,004,664 | ||||||
6.50%, 05/01/2028 to 08/01/2033 | 354,086 | 392,435 | ||||||
6.00%, 03/01/2029 | 3,789 | 4,291 | ||||||
2.50%, 02/01/2031 | 4,015,179 | 4,012,940 | ||||||
3.00%, 02/01/2032 to 02/01/2032 | 12,641,653 | 12,901,610 | ||||||
8.00%, 08/01/2032 | 217,351 | 253,872 | ||||||
7.50%, 05/01/2035 | 345,708 | 400,342 | ||||||
5.50%, 12/01/2036 | 237,728 | 263,330 | ||||||
4.50%, 05/01/2038 to 02/01/2042 | 17,708,418 | 18,907,798 | ||||||
5.35%, 07/01/2038 to 10/17/2038 | 2,262,633 | 2,471,668 | ||||||
5.80%, 10/01/2038 to 01/20/2039 | 926,309 | 1,004,668 | ||||||
5.45%, 11/25/2038 | 2,457,591 | 2,685,810 | ||||||
4.00%, 06/01/2042 | 5,106,158 | 5,414,232 | ||||||
See accompanying Notes to Financial Statements which are an integral part of the financial statements.
10 Invesco Quality Income Fund
| Principal Amount | Value | |||||||
| Federal Home Loan Mortgage Corp. (FHLMC)–(continued) | ||||||||
Pass Through Ctfs., ARM, | $ | 1,726,311 | $ | 1,829,429 | ||||
3.72% (1 yr. USD LIBOR + 2.05%), 02/01/2037(a) | 143,885 | 153,268 | ||||||
3.88% (1 yr. USD LIBOR + 2.17%), 03/01/2037(a) | 555,487 | 592,529 | ||||||
3.70% (1 yr. USD LIBOR + 1.88%), 05/01/2037(a) | 595,257 | 625,288 | ||||||
3.75% (1 yr. USD LIBOR + 2.00%), 11/01/2037(a) | 1,909,284 | 2,020,235 | ||||||
3.68% (1 yr. USD LIBOR + 2.06%), 01/01/2038(a) | 412,414 | 438,926 | ||||||
3.60% (1 yr. USD LIBOR + 1.85%), 03/01/2041(a) | 127,973 | 134,240 | ||||||
Pass Through Ctfs., TBA, 3.00%, 02/01/2033 to 02/01/2048(c) | 42,200,000 | 42,368,200 | ||||||
3.50%, 02/01/2048(c) | 30,000,000 | 30,775,125 | ||||||
4.00%, 02/01/2048(c) | 17,500,000 | 18,283,508 | ||||||
| 162,169,820 | ||||||||
| Federal National Mortgage Association (FNMA)–51.14% | ||||||||
Pass Through Ctfs., | 297,804 | 311,847 | ||||||
4.50%, 05/01/2019 to 07/01/2044 | 14,551,931 | 15,541,074 | ||||||
8.00%, 07/01/2020 to 04/01/2033 | 516,667 | 619,312 | ||||||
6.50%, 06/01/2022 to 11/01/2038 | 2,691,942 | 3,003,888 | ||||||
5.50%, 11/01/2022 to 04/01/2038 | 8,090,449 | 8,923,211 | ||||||
5.00%, 06/01/2027 to 01/01/2041 | 5,914,265 | 6,403,363 | ||||||
3.00%, 02/01/2028 to 11/01/2045 | 18,815,165 | 19,105,156 | ||||||
9.50%, 04/01/2030 | 50,472 | 58,264 | ||||||
3.50%, 11/01/2030 to 04/01/2046 | 44,591,704 | 45,957,123 | ||||||
2.00%, 02/01/2032 | 7,356,183 | 7,353,991 | ||||||
5.63%, 08/01/2032 | 367,822 | 391,325 | ||||||
8.50%, 10/01/2032 | 445,200 | 544,029 | ||||||
6.00%, 12/01/2035 to 05/01/2040 | 2,721,979 | 3,061,915 | ||||||
7.50%, 08/01/2037 | 544,600 | 648,318 | ||||||
5.45%, 01/01/2038 | 381,310 | 404,364 | ||||||
4.00%, 06/01/2024 to 05/01/2045 | 28,024,250 | 29,613,052 | ||||||
Pass Through Ctfs., ARM, | 244,797 | 256,866 | ||||||
3.04% (1 yr. USD LIBOR + 1.30%), 02/01/2039(a) | 2,099,261 | 2,176,131 | ||||||
3.09% (1 yr. USD LIBOR + 1.67%), 08/01/2042(a) | 921,446 | 938,581 | ||||||
2.76% (1 yr. USD LIBOR + 1.61%), 03/01/2046(a) | 3,901,621 | 3,950,273 | ||||||
Pass Through Ctfs., TBA, 2.50%, 02/01/2033(c) | 22,500,000 | 22,458,550 | ||||||
3.00%, 02/01/2033 to 02/01/2048(c) | 47,500,000 | 47,742,624 | ||||||
3.50%, 02/01/2048 | 69,200,000 | 70,981,035 | ||||||
4.00%, 02/01/2048 | 20,500,000 | 21,421,924 | ||||||
| 311,866,216 | ||||||||
| Principal Amount | Value | |||||||
| Government National Mortgage Association (GNMA)–10.38% | ||||||||
Pass Through Ctfs., | $ | 134,021 | $ | 135,098 | ||||
9.50%, 04/15/2018 to 06/15/2022 | 68,708 | 69,353 | ||||||
8.00%, 02/15/2020 to 12/15/2021 | 63,519 | 63,792 | ||||||
7.00%, 11/15/2022 to 01/15/2029 | 270,115 | 283,991 | ||||||
6.50%, 04/15/2026 to 11/15/2028 | 132,483 | 147,049 | ||||||
6.00%, 01/15/2028 to 04/20/2029 | 311,470 | 350,262 | ||||||
5.50%, 05/15/2033 to 10/15/2034 | 808,546 | 897,543 | ||||||
5.00%, 11/20/2037 | 987,935 | 1,047,380 | ||||||
3.50%, 07/20/2046 | 8,056,150 | 8,386,431 | ||||||
Pass Through Ctfs., ARM, | 4,971,054 | 4,988,191 | ||||||
Pass Through Ctfs., TBA, 3.50%, 02/01/2048(c) | 15,400,000 | 15,913,855 | ||||||
3.00%, 02/01/2048(c) | 26,100,000 | 26,302,152 | ||||||
4.00%, 02/01/2048(c) | 4,500,000 | 4,692,270 | ||||||
| 63,277,367 | ||||||||
Total U.S. Government Sponsored Agency Mortgage-Backed Securities |
| 647,831,005 | ||||||
Asset-Backed Securities–36.06% |
| |||||||
Adjustable Rate Mortgage Trust, Series 2005-7, Class 2A21, Variable Rate Pass Through Ctfs., 3.40%, 10/25/2035(b) | 672,703 | 628,105 | ||||||
Agate Bay Mortgage Trust, Series 2015-2, Class B1, Variable Rate Pass Through Ctfs., 3.74%, 03/25/2045(b)(d) | 3,579,920 | 3,627,074 | ||||||
American Home Mortgage Investment Trust, Series 2005-1, Class 7A1, Floating Rate Pass Through Ctfs., 3.56% (6 mo. USD LIBOR + 2.00%), 06/25/2045(a) | 506,194 | 507,210 | ||||||
Angel Oak Mortgage Trust LLC, Series 2017-1, Class A1, Variable Rate Pass Through Ctfs., 2.81%, 01/25/2047(b)(d) | 892,675 | 888,595 | ||||||
Banc of America Funding Trust, | 94,327 | 90,444 | ||||||
Series 2006-A, Class 1A1, Variable Rate Pass Through Ctfs., 3.63%, 02/20/2036(b) | 1,002,579 | 995,013 | ||||||
Bear Stearns Adjustable Rate Mortgage Trust, | 1,822,507 | 1,789,092 | ||||||
Series 2005-2, Class A1, Floating Rate Pass Through Ctfs., 3.26% (1 yr. U.S. Treasury Yield Curve Rate + 2.45%), 03/25/2035(a) | 785,098 | 795,446 | ||||||
Bear Stearns Commercial Mortgage Securities Trust, Series 2006-T22, Class B, Variable Rate Pass Through Ctfs., 5.72%, 04/12/2038(b)(d) | 400,450 | 401,293 | ||||||
See accompanying Notes to Financial Statements which are an integral part of the financial statements.
11 Invesco Quality Income Fund
| Principal Amount | Value | |||||||
CGDB Commercial Mortgage Trust, Series 2017-BIO, Class B, Floating Rate Pass Through Ctfs., 2.43% (1 mo. USD LIBOR + 0.95%), 05/15/2030(a)(d) | $ | 5,100,000 | $ | 5,103,307 | ||||
CGDBB Commercial Mortgage Trust, Series 2017-BIOC, Class B, Floating Rate Pass Through Ctfs., 2.45% (1 mo. USD LIBOR + 0.97%), 07/15/2028(a)(d) | 3,000,000 | 3,008,919 | ||||||
Series 2017-BIOC, Class C, Floating Rate Pass Through Ctfs., 2.53% (1 mo. USD LIBOR + 1.05%), 07/15/2028(a)(d) | 2,954,000 | 2,957,251 | ||||||
Chase Issuance Trust, Series 2016-A3, Class A3, Floating Rate Pass Through Ctfs., 1.80% (1 mo. USD LIBOR + 0.55%), 06/15/2023(a) | 5,000,000 | 5,060,465 | ||||||
Chase Mortgage Finance Trust, Series 2005-A1, Class 3A1, Variable Rate Pass Through Ctfs., 3.36%, 12/25/2035(b) | 45,246 | 44,268 | ||||||
Series 2007-A2, Class 2A1, Variable Rate Pass Through Ctfs., 3.60%, 07/25/2037(b) | 897,555 | 914,191 | ||||||
Series 2007-A2, Class 2A4, Variable Rate Pass Through Ctfs., 3.60%, 07/25/2037(b) | 829,150 | 835,002 | ||||||
Chase Mortgage Trust, | 3,301,098 | 3,306,910 | ||||||
Series 2016-2, Class M4, Variable Rate Pass Through Ctfs., 3.75%, 12/25/2045(b)(d) | 3,213,817 | 3,101,139 | ||||||
CHL Mortgage Pass Through Trust, Series 2004-29, Class 1A1, Floating Rate Pass Through Ctfs., 2.09% (1 mo. USD LIBOR + 0.54%), 02/25/2035(a) | 470,159 | 450,443 | ||||||
Citigroup Mortgage Loan Trust, Inc., Series 2004-HYB3, Class 2A, Variable Rate Pass Through Ctfs., 3.14%, 09/25/2034(b) | 1,987,922 | 1,939,799 | ||||||
Series 2004-UST1, Class A4, Variable Rate Pass Through Ctfs., 3.37%, 08/25/2034(b) | 297,717 | 290,441 | ||||||
Series 2005-11, Class A2A, Floating Rate Pass Through Ctfs., 3.63% (1 yr. U.S. Treasury Yield Curve Rate + 2.40%), 10/25/2035(a) | 2,352,821 | 2,380,030 | ||||||
Series 2006-AR2, Class 1A2, Variable Rate Pass Through Ctfs., 3.60%, 03/25/2036(b) | 86,353 | 85,415 | ||||||
Series 2012-6, Class 2A1, Variable Rate Pass Through Ctfs., 3.31%, 08/25/2036(b)(d) | 469,295 | 471,310 | ||||||
COLT Mortgage Loan Trust, | 1,995,849 | 2,002,121 | ||||||
Series 2017-1, Class A3, Variable Rate Pass Through Ctfs., 3.07%, 05/27/2047(b)(d) | 2,328,490 | 2,334,744 | ||||||
Series 2017-2, Class A2A, Variable Rate Pass Through Ctfs., 2.57%, 10/25/2047(b)(d) | 3,902,097 | 3,916,708 | ||||||
| Principal Amount | Value | |||||||
Commercial Mortgage Trust, Series 2013-LC13, Class XA, IO, Variable Rate Pass Through Ctfs., 1.31%, 08/10/2046(b) | $ | 44,941,643 | $ | 1,692,902 | ||||
Series 2014-FL5, Class B, Floating Rate Pass Through Ctfs., 3.58% (1 mo. USD LIBOR + 2.15%), 10/15/2031(a)(d) | 1,400,000 | 1,390,742 | ||||||
Series 2015-CR24, Class XA, IO, Variable Rate Pass Through Ctfs., 0.81%, | 43,578,375 | 2,112,810 | ||||||
Credit Suisse First Boston Mortgage Securities Corp., Series 2004-AR5, Class 5A1, Variable Rate Pass Through Ctfs., 3.55%, | 1,548,883 | 1,547,071 | ||||||
Credit Suisse Mortgage Capital Trust, Series 2013-6, Class 2A1, Variable Rate Pass Through Ctfs., 3.50%, 08/25/2043(b)(d) | 1,591,657 | 1,626,871 | ||||||
Series 2013-7, Class B1, Variable Rate Pass Through Ctfs., 3.58%, 08/25/2043(b)(d) | 5,013,458 | 4,982,039 | ||||||
Series 2015-TOWN, Class B, Floating Rate Pass Through Ctfs., 3.38% (1 mo. USD LIBOR + 1.90%), 03/15/2028(a)(d) | 2,500,000 | 2,502,217 | ||||||
Credit Suisse Mortgage Loan Trust, Series 2015-1, Class A9, Variable Rate Pass Through Ctfs., 3.50%, 05/25/2045(b)(d) | 2,967,011 | 3,023,265 | ||||||
DBUBS Mortgage Trust, Series 2011-LC3A, Class C, Variable Rate Pass Through Ctfs., 5.34%, 08/10/2044(b)(d) | 5,000,000 | 5,346,772 | ||||||
Deutsche Mortgage Securities Inc Re-REMIC Trust Certificates, Series 2007-WM1, Class A1, Variable Rate Pass Through Ctfs., 3.24%, 06/27/2037(b)(d) | 3,783,538 | 3,848,868 | ||||||
Ford Credit Auto Owner Trust, Series 2016-1, Class A, Pass Through Ctfs., 2.31%, 08/15/2027(d) | 6,109,000 | 6,092,341 | ||||||
FREMF Mortgage Trust, Series 2017-KF41, Class B, Floating Rate Pass Through Ctfs., 3.87% (1 mo. USD LIBOR + 2.50%), 11/25/2024(a)(d) | 1,282,000 | 1,282,000 | ||||||
GMACM Mortgage Loan Trust, Series 2005-AR3, Class 2A1, Variable Rate Pass Through Ctfs., 3.76%, 06/19/2035(b) | 2,024,340 | 1,996,875 | ||||||
GSAA Home Equity Trust, Series 2007-7, Class A4, Floating Rate Pass Through Ctfs., 1.82% (1 mo. USD LIBOR + 0.27%), 07/25/2037(a) | 148,614 | 142,492 | ||||||
GSR Mortgage Loan Trust, Series 2004-11, Class 2A2, Variable Rate Pass Through Ctfs., 3.72%, 09/25/2034(b) | 244,350 | 246,381 | ||||||
Series 2004-12, Class 3A6, Variable Rate Pass Through Ctfs., 3.56%, 12/25/2034(b) | 1,068,701 | 1,078,119 | ||||||
Hertz Vehicle Financing II LP, Series 2015-1A, Class A, Pass Through Ctfs., 2.73%, 03/25/2021(d) | 6,000,000 | 6,019,818 | ||||||
Home Partners of America Trust, Series 2017-1, Class C, Floating Rate Pass Through Ctfs., 3.08% (1 mo. USD LIBOR + 1.55%), 07/17/2034(a)(d) | 3,000,000 | 3,022,612 | ||||||
Series 2017-1, Class D, Floating Rate Pass Through Ctfs., 3.43% (1 mo. USD LIBOR + 1.90%), 07/17/2034(a)(d) | 2,920,000 | 2,935,865 | ||||||
See accompanying Notes to Financial Statements which are an integral part of the financial statements.
12 Invesco Quality Income Fund
| Principal Amount | Value | |||||||
Hyatt Hotel Portfolio Trust, Series 2017-HYT2, Class E, Floating Rate Pass Through Ctfs., 3.83% (1 mo. USD LIBOR + 2.35%), 08/09/2032(a)(d) | $ | 2,000,000 | $ | 2,002,474 | ||||
Invitation Homes Trust, Series 2017-SFR2, Class C, Floating Rate Pass Through Ctfs., 2.94% (1 mo. USD LIBOR + 1.45%), 12/17/2036(a)(d) | 3,208,000 | 3,234,709 | ||||||
Series 2017-SFR2, Class D, Floating Rate Pass Through Ctfs., 3.05% (1 mo. USD LIBOR + 1.80%), 12/17/2036(a)(d) | 2,916,000 | 2,946,481 | ||||||
JP Morgan Mortgage Trust, Series 2005-A1, Class 3A1, Variable Rate Pass Through Ctfs., 3.69%, 02/25/2035(b) | 2,157,155 | 2,208,804 | ||||||
Series 2005-A3, Class 6A5, Variable Rate Pass Through Ctfs., 3.54%, 06/25/2035(b) | 1,239,899 | 1,221,426 | ||||||
Series 2005-A6, Class 7A1, Variable Rate Pass Through Ctfs., 3.64%, 08/25/2035(b) | 800,182 | 782,571 | ||||||
Series 2014-1, Class 1A17, Variable Rate Pass Through Ctfs., 3.90%, 01/25/2044(b)(d) | 3,199,659 | 3,299,548 | ||||||
Series 2015-3, Class A3, Variable Rate Pass Through Ctfs., 3.50%, 05/25/2045(b)(d) | 4,769,157 | 4,861,001 | ||||||
Series 2015-5, Class A2, Variable Rate Pass Through Ctfs., 2.86%, 05/25/2045(b)(d) | 2,588,368 | 2,598,312 | ||||||
Series 2016-5, Class A1, Variable Rate Pass Through Ctfs., 2.60%, 12/25/2046(b)(d) | 2,960,051 | 2,955,364 | ||||||
Series 2017-5, Class A1, Variable Rate Pass Through Ctfs., 3.19%, 10/26/2048(b)(d) | 4,975,714 | 5,029,213 | ||||||
JP Morgan Resecuritization Trust, Series 2009-7, Class 5A1, Variable Rate Pass Through Ctfs., 6.00%, 02/27/2037(b)(d) | 6,523 | 6,520 | ||||||
La Hipotecaria El Salvadorian Mortgage Trust (El Salvador), Series 2013-1A, Class A, Pass Through Ctfs., 3.50%, 10/25/2041 (Acquired 04/22/2013; Cost $4,124,559)(d) | 3,985,081 | 4,115,219 | ||||||
La Hipotecaria Panamanian Mortgage Trust (El Salvador), Series 2010-1GA, Class A, Floating Rate Pass Through Ctfs., 2.25% (PNMR–3.00%), 09/08/2039 (Acquired 11/05/2010-06/25/2012; Cost | 5,707,755 | 5,870,069 | ||||||
LSTAR Commercial Mortgage Trust, Series 2014-2, Class A2, Pass Through Ctfs., 2.77%, 01/20/2041(d) | 420,986 | 420,037 | ||||||
Luminent Mortgage Trust, | 2,194,755 | 2,134,966 | ||||||
Series 2006-1, Class A1, Floating Rate Pass Through Ctfs., 1.79% (1 mo. USD LIBOR + 0.24%), 04/25/2036(a) | 76,226 | 64,514 | ||||||
| Principal Amount | Value | |||||||
Merrill Lynch Mortgage Investors Trust, Series 2004-A, Class A2, Floating Rate Pass Through Ctfs., 1.99% (6 mo. USD LIBOR + 0.50%), 04/25/2029(a) | $ | 465,600 | $ | 462,296 | ||||
Series 2005-3, Class 3A, Variable Rate Pass Through Ctfs., 3.30%, 11/25/2035(b) | 809,706 | 816,433 | ||||||
Series 2005-A, Class A1, Floating Rate Pass Through Ctfs., 2.01% (1 mo. USD LIBOR + 0.46%), 03/25/2030(a) | 1,009,366 | 982,166 | ||||||
Mill City Mortgage Loan Trust, Series 2017-1, Class A1, Variable Rate Pass Through Ctfs., 2.75%, 11/25/2058(b)(d) | 3,472,407 | 3,479,298 | ||||||
Morgan Stanley Capital I Trust, Series 2006-HQ10, Class AJ, Variable Rate Pass Through Ctfs., 5.39%, 11/12/2041(b) | 2,562,783 | 2,567,948 | ||||||
Series 2015-XLF2, Class AFSD, Floating Rate Pass Through Ctfs., 5.14% (1 mo. USD LIBOR + 3.66%), 08/15/2026(a)(d) | 2,150,000 | 2,181,321 | ||||||
NextGear Floorplan Master Owner Trust, Series 2017-2A, Class A1, Floating Rate Pass Through Ctfs. 2.16% (1 mo. USD LIBOR + 0.68%), 10/17/2022(a)(d) | 3,800,000 | 3,809,461 | ||||||
PFP Ltd. (Cayman Islands), Series 2015-2, Class B, Floating Rate Pass Through Ctfs., 4.18% (1 mo. USD LIBOR + 2.70%), 07/14/2034(a)(d) | 3,345,000 | 3,349,334 | ||||||
RALI Trust, Series 2006-QO2, Class A2, Floating Rate Pass Through Ctfs., 1.60% (1 mo. USD LIBOR + 0.27%), 02/25/2046(a) | 55,966 | 25,840 | ||||||
RBSSP Resecuritization Trust, Series 2010-1, Class 2A1, Variable Rate Pass Through Ctfs., 3.45%, 07/26/2045 (Acquired 01/31/2011-02/23/2016; | 1,357,522 | 1,390,926 | ||||||
Sequoia Mortgage Trust, Series 2013-4, Class A3, Variable Rate Pass Through Ctfs., 1.55%, 04/25/2043(b) | 1,407,766 | 1,374,781 | ||||||
Shellpoint Asset Funding Trust, Series 2013-1, Class A3, Variable Rate Pass Through Ctfs., 3.75%, 07/25/2043(b)(d) | 2,401,612 | 2,428,424 | ||||||
Starwood Waypoint Homes Trust, Series 2017-1, Class D, Floating Rate Pass Through Ctfs., 3.44% (1 mo. USD LIBOR + 1.95%), 01/17/2035(a)(d) | 5,750,000 | 5,797,978 | ||||||
Structured Adjustable Rate Mortgage Loan Trust, | 2,326,545 | 2,431,716 | ||||||
Series 2004-13, Class A2, Floating Rate Pass Through Ctfs., 0.49% (1 mo. USD LIBOR + 0.30%), 09/25/2034(a) | 486,194 | 456,439 | ||||||
Series 2004-20, Class 3A1, Variable Rate Pass Through Ctfs., 3.29%, 01/25/2035(b) | 303,327 | 299,100 | ||||||
See accompanying Notes to Financial Statements which are an integral part of the financial statements.
13 Invesco Quality Income Fund
| Principal Amount | Value | |||||||
Structured Asset Mortgage Investments, II Trust, Series 2005-AR2, Class 2A1, Floating Rate Pass Through Ctfs., 2.01% (1 mo. USD LIBOR + 0.46%), 05/25/2045(a) | $ | 1,333,165 | $ | 1,249,616 | ||||
Structured Asset Securities Corp., Series 2002-21A, Class B1II, Variable Rate Pass Through Ctfs., 3.50%, 11/25/2032(b) | 195,124 | 186,218 | ||||||
Synchrony Credit Card Master Note Trust, Series 2015-3, Class A, Pass Through Ctfs., 1.74%, 09/15/2021 | 5,000,000 | 4,994,369 | ||||||
Thornburg Mortgage Securities Trust, Series 2005-2, Class A1, Variable Rate Pass Through Ctfs., 3.17%, 07/25/2045(b) | 3,261,762 | 3,188,352 | ||||||
Towd Point Mortgage Trust, Series 2015-4, Class A1, Variable Rate Pass Through Ctfs., 3.50%, 04/25/2055(b)(d) | 1,116,054 | 1,134,831 | ||||||
Series 2017-2, Class A1, Variable Rate Pass Through Ctfs., 2.75%, 04/25/2057(b)(d) | 5,863,364 | 5,865,427 | ||||||
Verus Securitization Trust, Series 2017-2A, Class A2, Pass Through Ctfs., 2.64%, 07/25/2047(d) | 4,311,880 | 4,324,443 | ||||||
Series 2017-2A, Class A3, Pass Through Ctfs., 2.85%, 07/25/2047(d) | 4,311,880 | 4,322,536 | ||||||
Wachovia Bank Commercial Mortgage Trust, Series 2006-C27, Class AJ, Variable Rate Pass Through Ctfs., 5.83%, 07/15/2045(b) | 1,573,356 | 1,580,440 | ||||||
WaMu Mortgage Pass-Through Trust, Series 2005-AR12, Class 1A8, Variable Rate Pass Through Ctfs., 3.21%, 10/25/2035(b) | 3,544,920 | 3,572,866 | ||||||
Series 2007-HY2, Class 2A1, Variable Rate Pass Through Ctfs., 3.44%, 11/25/2036(b) | 196,922 | 186,370 | ||||||
Wells Fargo Mortgage Backed Securities Trust, | 1,172,732 | 1,182,211 | ||||||
Series 2004-O, Class A1, Variable Rate Pass Through Ctfs., 3.55%, 08/25/2034(b) | 3,849,352 | 3,961,461 | ||||||
Series 2005-AR2, Class 2A2, Variable Rate Pass Through Ctfs., 3.28%, 03/25/2035(b) | 182,617 | 185,106 | ||||||
Series 2006-AR6, Class 3A1, Variable Rate Pass Through Ctfs., 3.63%, 03/25/2036(b) | 2,601,254 | 2,517,637 | ||||||
Series 2006-AR6, Class 7A2, Variable Rate Pass Through Ctfs., 3.63%, 03/25/2036(b) | 1,433,518 | 1,446,342 | ||||||
Series 2006-AR7, Class 2A5, Variable Rate Pass Through Ctfs., 3.34%, 05/25/2036(b) | 1,494,933 | 1,484,207 | ||||||
Series 2006-AR8, Class 2A3, Variable Rate Pass Through Ctfs., 3.57%, 04/25/2036(b) | 886,613 | 898,531 | ||||||
Series 2005-AR12, Class 1A1, Variable Rate Pass Through Ctfs., 3.47%, 05/25/2035(b) | 671,265 | 684,977 | ||||||
| Principal Amount | Value | |||||||
WFRBS Commercial Mortgage Trust, Series 2013-C17, Class D, Variable Rate Pass Through Ctfs., 5.12%, 12/15/2046(b)(d) | $ | 2,600,000 | $ | 2,513,124 | ||||
Total Asset-Backed Securities |
| 219,898,548 | ||||||
Agency Credit Risk Transfer Notes–5.13% |
| |||||||
Fannie Mae Connecticut Avenue Securities, 3.65% (1 mo. USD LIBOR + 2.10%), 08/25/2028(a) | 192,140 | 193,276 | ||||||
Freddie Mac, Series 2015-DNA1, Class M2, Floating Rate STACR® Debt Notes, 3.40% (1 mo. USD LIBOR + 1.85%), 10/25/2027(a) | 6,325,000 | 6,481,194 | ||||||
Series 2015-HQ1, Class M3, Floating Rate STACR® Debt Notes, 5.35% (1 mo. USD LIBOR + 3.80%), 03/25/2025(a) | 5,000,000 | 5,438,232 | ||||||
Series 2016-DNA1, Class M2, Floating Rate STACR® Debt Notes, 4.45% (1 mo. USD LIBOR + 2.90%), 07/25/2028(a) | 3,635,575 | 3,747,204 | ||||||
Series 2016-HQA1, Class M2, Floating Rate STACR® Debt Notes, 4.30% (1 mo. USD LIBOR + 2.75%), 09/25/2028(a) | 3,872,000 | 3,981,227 | ||||||
Series 2016-HQA2, Class M2, Floating Rate STACR® Debt Notes, 3.80% (1 mo. USD LIBOR + 2.25%), 11/25/2028(a) | 2,684,000 | 2,753,899 | ||||||
Series 2016-HQA2, Class M3AF, Floating Rate STACR® Debt Notes, 5.45% (1 mo. USD LIBOR + 3.90%), 11/25/2028(a) | 3,000,000 | 3,292,500 | ||||||
Series 2016-HQA4, Class M2, Floating Rate STACR® Debt Notes, 2.85% (1 mo. USD LIBOR + 1.30%), 04/25/2029(a) | 500,000 | 506,722 | ||||||
Series 2017-DNA2, Class M1, Floating Rate STACR® Debt Notes, 2.75% (1 mo. USD LIBOR + 1.20%), 10/25/2029(a) | 4,822,649 | 4,899,561 | ||||||
Total Agency Credit Risk Transfer Notes |
| 31,293,815 | ||||||
| Shares | ||||||||
Exchange-Traded Fund–0.25% |
| |||||||
PowerShares Variable Rate Investment Grade Portfolio | 60,000 | 1,511,400 | ||||||
| Principal Amount | ||||||||
U.S. Treasury Bills–0.07%(f) | ||||||||
1.03%, 02/01/2018(g) | $ | 125,000 | 124,869 | |||||
1.05%, 02/01/2018 | 210,000 | 209,779 | ||||||
1.09%, 02/01/2018(g) | 30,000 | 29,969 | ||||||
1.10%, 02/01/2018(g) | 60,000 | 59,937 | ||||||
Total U.S. Treasury Bills |
| 424,554 | ||||||
See accompanying Notes to Financial Statements which are an integral part of the financial statements.
14 Invesco Quality Income Fund
| Shares | Value | |||||||
Money Market Funds–2.08% |
| |||||||
Invesco Government & Agency Portfolio– Institutional | 4,444,087 | $ | 4,444,087 | |||||
Invesco Liquid Assets Portfolio–Institutional Class, 1.40%(h) | 3,173,933 | 3,174,251 | ||||||
Invesco Treasury Portfolio–Institutional Class, 1.17%(h) | 5,078,957 | 5,078,957 | ||||||
Total Money Market Funds |
| 12,697,295 | ||||||
TOTAL INVESTMENTS IN SECURITIES–149.82% (Cost $920,329,316) |
| 913,656,617 | ||||||
OTHER ASSETS LESS LIABILITIES–(49.82)% |
| (303,804,662 | ) | |||||
NET ASSETS–100.00% |
| $ | 609,851,955 | |||||
Investment Abbreviations:
| ACES | – Automatically Convertible Extendable Security | |
| ARM | – Adjustable Rate Mortgage | |
| Ctfs. | – Certificates | |
| IO | – Interest Only | |
| LIBOR | – London Interbank Offered Rate | |
| MTA | – Moving Treasury Average | |
| PNMR | – Panamanian Mortgage Reference Rate | |
| REMICs | – Real Estate Mortgage Investment Conduits | |
| STACR® | – Structured Agency Credit Risk | |
| STRIPS | – Separately Traded Registered Interest and Principal Security | |
| TBA | – To Be Announced | |
| USD | – U.S. Dollar |
Notes to Schedule of Investments:
| (a) | Interest or dividend rate is redetermined periodically. Rate shown is the rate in effect on December 31, 2017. |
| (b) | Interest rate is redetermined periodically based on the cash flows generated by the pool of assets backing the security, less any applicable fees. The rate shown is the rate in effect December 31, 2017. |
| (c) | Security purchased on a forward commitment basis. This security is subject to dollar roll transactions. See Note 1I. |
| (d) | Security purchased or received in a transaction exempt from registration under the Securities Act of 1933, as amended (the “1933 Act”). The security may be resold pursuant to an exemption from registration under the 1933 Act, typically to qualified institutional buyers. The aggregate value of these securities at December 31, 2017 was $151,128,831, which represented 24.78% of the Fund’s Net Assets. |
| (e) | PowerShares Variable Rate Investment Grade Portfolio and the Fund are affiliated by either having the same investment adviser or an investment adviser under common control with the Fund’s investment adviser. The value of this security as of December 31, 2017 represented less than 1% of the Fund’s Net Assets. See Note 5. |
| (f) | Security traded on a discount basis. The interest rate shown represents the discount rate at the time of purchase by the Fund. |
| (g) | All or a portion of the value was pledged as collateral to cover margin requirements for open futures contracts. See Note 1H. |
| (h) | The money market fund and the Fund are affiliated by having the same investment adviser. The rate shown is the 7-day SEC standardized yield as of December 31, 2017. |
| Open Futures Contracts | ||||||||||||||||||||
| Short Futures Contracts | Number of Contracts | Expiration Month | Notional Value | Value | Unrealized Appreciation (Depreciation) | |||||||||||||||
U.S. Treasury 2 Year Notes | 131 | March-2018 | $ | (28,048,329 | ) | $ | 54,985 | $ | 54,985 | |||||||||||
U.S. Treasury Ultra 10 Year Notes | 36 | March-2018 | (4,465,687 | ) | 30,009 | 30,009 | ||||||||||||||
U.S. Treasury Long Bonds | 7 | March-2018 | (1,071,000 | ) | 1,788 | 1,788 | ||||||||||||||
U.S. Treasury Ultra Bonds | 4 | March-2018 | (670,625 | ) | (2,980 | ) | (2,980 | ) | ||||||||||||
Total Futures Contracts — Interest Rate Risk | $ | 83,802 | $ | 83,802 | ||||||||||||||||
See accompanying Notes to Financial Statements which are an integral part of the financial statements.
15 Invesco Quality Income Fund
Statement of Assets and Liabilities
December 31, 2017
Assets: | ||||
Investments in securities, at value (Cost $906,117,545) | $ | 899,447,922 | ||
Investments in affiliates, at value (Cost $14,211,771) | 14,208,695 | |||
Receivable for: | ||||
Investments sold | 305,123,512 | |||
Fund shares sold | 315,425 | |||
Dividends and interest | 2,400,488 | |||
Principal paydowns | 913,346 | |||
Investment for trustee deferred compensation and retirement plans | 81,283 | |||
Other assets | 29,714 | |||
Total assets | 1,222,520,385 | |||
Liabilities: | ||||
Other investments: | ||||
Variation margin payable — futures contracts | 19,219 | |||
Payable for: | ||||
Investments purchased | 611,341,748 | |||
Dividends | 285,444 | |||
Fund shares reacquired | 493,892 | |||
Accrued fees to affiliates | 190,904 | |||
Accrued trustees’ and officers’ fees and benefits | 804 | |||
Accrued other operating expenses | 244,554 | |||
Trustee deferred compensation and retirement plans | 91,865 | |||
Total liabilities | 612,668,430 | |||
Net assets applicable to shares outstanding | $ | 609,851,955 | ||
Net assets consist of: | ||||
Shares of beneficial interest | $ | 642,048,153 | ||
Undistributed net investment income | 843,582 | |||
Undistributed net realized gain (loss) | (26,450,883 | ) | ||
Net unrealized appreciation (depreciation) | (6,588,897 | ) | ||
| $ | 609,851,955 | |||
Net Assets: |
| |||
Class A | $ | 353,255,770 | ||
Class B | $ | 370,514 | ||
Class C | $ | 13,178,287 | ||
Class Y | $ | 67,027,341 | ||
Class R5 | $ | 176,010,158 | ||
Class R6 | $ | 9,885 | ||
Shares outstanding, no par value, |
| |||
Class A | 29,551,612 | |||
Class B | 31,099 | |||
Class C | 1,110,300 | |||
Class Y | 5,586,198 | |||
Class R5 | 14,672,737 | |||
Class R6 | 824 | |||
Class A: | ||||
Net asset value per share | $ | 11.95 | ||
Maximum offering price per share | ||||
(Net asset value of $11.95 ¸ 95.75%) | $ | 12.48 | ||
Class B: | ||||
Net asset value and offering price per share | $ | 11.91 | ||
Class C: | ||||
Net asset value and offering price per share | $ | 11.87 | ||
Class Y: | ||||
Net asset value and offering price per share | $ | 12.00 | ||
Class R5: | ||||
Net asset value and offering price per share | $ | 12.00 | ||
Class R6: | ||||
Net asset value and offering price per share | $ | 12.00 | ||
See accompanying Notes to Financial Statements which are an integral part of the financial statements.
16 Invesco Quality Income Fund
Statement of Operations
For the year ended December 31, 2017
Investment income: | ||||
Interest | $ | 19,301,878 | ||
Dividends from affiliates | 96,721 | |||
Total investment income | 19,398,599 | |||
Expenses: | ||||
Advisory fees | 2,933,436 | |||
Administrative services fees | 167,277 | |||
Custodian fees | 47,642 | |||
Distribution fees: | ||||
Class A | 902,248 | |||
Class B | 5,111 | |||
Class C | 144,970 | |||
Transfer agent fees — A, B, C and Y | 644,770 | |||
Transfer agent fees — R5 | 760 | |||
Trustees’ and officers’ fees and benefits | 28,831 | |||
Registration and filing fees | 115,872 | |||
Reports to shareholders | 134,688 | |||
Professional services fees | 84,076 | |||
Other | 101,409 | |||
Total expenses | 5,311,090 | |||
Less: Fees waived and expense offset arrangement(s) | (21,026 | ) | ||
Net expenses | 5,290,064 | |||
Net investment income | 14,108,535 | |||
Realized and unrealized gain (loss) from: | ||||
Net realized gain from: | ||||
Investment securities | 4,628,012 | |||
Futures contracts | 1,044,515 | |||
| 5,672,527 | ||||
Change in net unrealized appreciation (depreciation) of: | ||||
Investment securities | (6,329,169 | ) | ||
Futures contracts | (156,338 | ) | ||
| (6,485,507 | ) | |||
Net realized and unrealized gain (loss) | (812,980 | ) | ||
Net increase in net assets resulting from operations | $ | 13,295,555 | ||
See accompanying Notes to Financial Statements which are an integral part of the financial statements.
17 Invesco Quality Income Fund
Statement of Changes in Net Assets
For the years ended December 31, 2017 and 2016
| 2017 | 2016 | |||||||
Operations: | ||||||||
Net investment income | $ | 14,108,535 | $ | 13,177,104 | ||||
Net realized gain | 5,672,527 | 1,798,723 | ||||||
Change in net unrealized appreciation (depreciation) | (6,485,507 | ) | (3,036,325 | ) | ||||
Net increase in net assets resulting from operations | 13,295,555 | 11,939,502 | ||||||
Distributions to shareholders from net investment income: | ||||||||
Class A | (12,305,522 | ) | (13,585,264 | ) | ||||
Class B | (12,970 | ) | (26,508 | ) | ||||
Class C | (366,966 | ) | (368,661 | ) | ||||
Class Y | (2,562,606 | ) | (1,569,262 | ) | ||||
Class R5 | (5,968,579 | ) | (4,406,269 | ) | ||||
Class R6 | (284 | ) | — | |||||
Total distributions from net investment income | (21,216,927 | ) | (19,955,964 | ) | ||||
Share transactions–net: | ||||||||
Class A | (32,119,143 | ) | (1,986,107 | ) | ||||
Class B | (339,468 | ) | (418,846 | ) | ||||
Class C | (2,313,095 | ) | 6,523,937 | |||||
Class Y | 387,569 | 47,048,651 | ||||||
Class R5 | 35,534,489 | 145,428,575 | ||||||
Class R6 | 10,013 | — | ||||||
Net increase in net assets resulting from share transactions | 1,160,365 | 196,596,210 | ||||||
Net increase (decrease) in net assets | (6,761,007 | ) | 188,579,748 | |||||
Net assets: | ||||||||
Beginning of year | 616,612,962 | 428,033,214 | ||||||
End of year (includes undistributed net investment income of $843,582 and $342,743, respectively) | $ | 609,851,955 | $ | 616,612,962 | ||||
Notes to Financial Statements
December 31, 2017
NOTE 1—Significant Accounting Policies
Invesco Quality Income Fund (the “Fund”) is a series portfolio of AIM Growth Series (Invesco Growth Series) (the “Trust”). The Trust is organized as a Delaware statutory trust and is registered under the Investment Company Act of 1940, as amended (the “1940 Act”), as an open-end series management investment company consisting of twenty-nine separate series portfolios, each authorized to issue an unlimited number of shares of beneficial interest. The assets, liabilities and operations of each portfolio are accounted for separately. Information presented in these financial statements pertains only to the Fund. Matters affecting each portfolio or class will be voted on exclusively by the shareholders of such portfolio or class.
The Fund’s investment objective is to provide a high level of current income, with liquidity and safety of principal.
The Fund currently consists of six different classes of shares: Class A, Class B, Class C, Class Y, Class R5 and Class R6. On April 4, 2017, the Fund began offering Class R6 shares. Class Y shares are available only to certain investors. Class A shares are sold with a front-end sales charge unless certain waiver criteria are met and under certain circumstances load waived shares may be subject to contingent deferred sales charges (“CDSC”). Class C shares are sold with a CDSC. Class Y, Class R5 and Class R6 shares are sold at net asset value. Effective November 30, 2010, new or additional investments in Class B shares are no longer permitted. Existing shareholders of Class B shares may continue to reinvest dividends and capital gains distributions in Class B shares until they convert to Class A shares. Also, shareholders in Class B shares will be able to exchange those shares for Class B shares of other Invesco Funds offering such shares until they convert to Class A shares. Generally, Class B shares will automatically convert to Class A shares on or about the month-end, which is at least eight years after the date of purchase. Redemption of Class B shares prior to the conversion date will be subject to a CDSC.
Effective January 26, 2018, all of the Fund’s outstanding Class B shares were converted to Class A shares, in advance of their normally scheduled conversion. No CDSC was paid with this early conversion.
The Fund is an investment company and accordingly follows the investment company accounting and reporting guidance in accordance with Financial Accounting Standards Board Accounting Standards Codification Topic 946, Financial Services — Investment Companies.
18 Invesco Quality Income Fund
The following is a summary of the significant accounting policies followed by the Fund in the preparation of its financial statements.
| A. | Security Valuations — Securities, including restricted securities, are valued according to the following policy. |
Debt obligations (including convertible securities) and unlisted equities are fair valued using an evaluated quote provided by an independent pricing service. Evaluated quotes provided by the pricing service may be determined without exclusive reliance on quoted prices, and may reflect appropriate factors such as institution-size trading in similar groups of securities, developments related to specific securities, dividend rate (for unlisted equities), yield (for debt obligations), quality, type of issue, coupon rate (for debt obligations), maturity (for debt obligations), individual trading characteristics and other market data. Pricing services generally value debt obligations assuming orderly transactions of institutional round lot size, but a fund may hold or transact in the same securities in smaller, odd lot sizes. Odd lots often trade at lower prices than institutional round lots. Debt obligations are subject to interest rate and credit risks. In addition, all debt obligations involve some risk of default with respect to interest and/or principal payments.
A security listed or traded on an exchange (except convertible securities) is valued at its last sales price or official closing price as of the close of the customary trading session on the exchange where the security is principally traded, or lacking any sales or official closing price on a particular day, the security may be valued at the closing bid price on that day. Securities traded in the over-the-counter market are valued based on prices furnished by independent pricing services or market makers. When such securities are valued by an independent pricing service they may be considered fair valued. Futures contracts are valued at the final settlement price set by an exchange on which they are principally traded. Listed options are valued at the mean between the last bid and asked prices from the exchange on which they are principally traded. Options not listed on an exchange are valued by an independent source at the mean between the last bid and asked prices. For purposes of determining net asset value (“NAV”) per share, futures and option contracts generally are valued 15 minutes after the close of the customary trading session of the New York Stock Exchange (“NYSE”).
Investments in open-end and closed-end registered investment companies that do not trade on an exchange are valued at the end-of-day net asset value per share. Investments in open-end and closed-end registered investment companies that trade on an exchange are valued at the last sales price or official closing price as of the close of the customary trading session on the exchange where the security is principally traded.
Foreign securities’ (including foreign exchange contracts) prices are converted into U.S. dollar amounts using the applicable exchange rates as of the close of the NYSE. If market quotations are available and reliable for foreign exchange-traded equity securities, the securities will be valued at the market quotations. Because trading hours for certain foreign securities end before the close of the NYSE, closing market quotations may become unreliable. If between the time trading ends on a particular security and the close of the customary trading session on the NYSE, events occur that the investment adviser determines are significant and make the closing price unreliable, the Fund may fair value the security. If the event is likely to have affected the closing price of the security, the security will be valued at fair value in good faith using procedures approved by the Board of Trustees. Adjustments to closing prices to reflect fair value may also be based on a screening process of an independent pricing service to indicate the degree of certainty, based on historical data, that the closing price in the principal market where a foreign security trades is not the current value as of the close of the NYSE. Foreign securities’ prices meeting the approved degree of certainty that the price is not reflective of current value will be priced at the indication of fair value from the independent pricing service. Multiple factors may be considered by the independent pricing service in determining adjustments to reflect fair value and may include information relating to sector indices, American Depositary Receipts and domestic and foreign index futures. Foreign securities may have additional risks including exchange rate changes, potential for sharply devalued currencies and high inflation, political and economic upheaval, the relative lack of issuer information, relatively low market liquidity and the potential lack of strict financial and accounting controls and standards.
Securities for which market prices are not provided by any of the above methods may be valued based upon quotes furnished by independent sources. The last bid price may be used to value equity securities. The mean between the last bid and asked prices is used to value debt obligations, including corporate loans.
Securities for which market quotations are not readily available or became unreliable are valued at fair value as determined in good faith by or under the supervision of the Trust’s officers following procedures approved by the Board of Trustees. Issuer specific events, market trends, bid/asked quotes of brokers and information providers and other market data may be reviewed in the course of making a good faith determination of a security’s fair value.
The Fund may invest in securities that are subject to interest rate risk, meaning the risk that the prices will generally fall as interest rates rise and, conversely, the prices will generally rise as interest rates fall. Specific securities differ in their sensitivity to changes in interest rates depending on their individual characteristics. Changes in interest rates may result in increased market volatility, which may affect the value and/or liquidity of certain Fund investments.
Valuations change in response to many factors including the historical and prospective earnings of the issuer, the value of the issuer’s assets, general economic conditions, interest rates, investor perceptions and market liquidity. Because of the inherent uncertainties of valuation, the values reflected in the financial statements may materially differ from the value received upon actual sale of those investments.
| B. | Securities Transactions and Investment Income — Securities transactions are accounted for on a trade date basis. Realized gains or losses on sales are computed on the basis of specific identification of the securities sold. Interest income (net of withholding tax, if any) is recorded on the accrual basis from settlement date. Bond premiums and discounts are amortized and/or accreted over the lives of the respective securities. Pay-in-kind interest income and non-cash dividend income received in the form of securities in-lieu of cash are recorded at the fair value of the securities received. Paydown gains and losses on mortgage and asset-backed securities are recorded as adjustments to interest income. Dividend income (net of withholding tax, if any) is recorded on the ex-dividend date. |
The Fund may periodically participate in litigation related to Fund investments. As such, the Fund may receive proceeds from litigation settlements. Any proceeds received are included in the Statement of Operations as realized gain (loss) for investments no longer held and as unrealized gain (loss) for investments still held.
Brokerage commissions and mark ups are considered transaction costs and are recorded as an increase to the cost basis of securities purchased and/or a reduction of proceeds on a sale of securities. Such transaction costs are included in the determination of net realized and unrealized gain (loss) from investment securities reported in the Statement of Operations and the Statement of Changes in Net Assets and the net realized and unrealized gains (losses) on securities per share in the Financial Highlights. Transaction costs are included in the calculation of the Fund’s net asset value and, accordingly, they reduce the Fund’s total returns. These transaction costs are not considered operating expenses and
19 Invesco Quality Income Fund
are not reflected in net investment income reported in the Statement of Operations and the Statement of Changes in Net Assets, or the net investment income per share and the ratios of expenses and net investment income reported in the Financial Highlights, nor are they limited by any expense limitation arrangements between the Fund and the investment adviser.
The Fund allocates income and realized and unrealized capital gains and losses to a class based on the relative net assets of each class.
| C. | Distributions — Distributions from net investment income are declared daily and paid monthly. Distributions from net realized capital gain, if any, are generally declared and paid annually and recorded on the ex-dividend date. |
| D. | Federal Income Taxes — The Fund intends to comply with the requirements of Subchapter M of the Internal Revenue Code of 1986, as amended (the “Internal Revenue Code”), necessary to qualify as a regulated investment company and to distribute substantially all of the Fund’s taxable earnings to shareholders. As such, the Fund will not be subject to federal income taxes on otherwise taxable income (including net realized capital gain) that is distributed to shareholders. Therefore, no provision for federal income taxes is recorded in the financial statements. |
The Fund recognizes the tax benefits of uncertain tax positions only when the position is more likely than not to be sustained. Management has analyzed the Fund’s uncertain tax positions and concluded that no liability for unrecognized tax benefits should be recorded related to uncertain tax positions. Management is not aware of any tax positions for which it is reasonably possible that the total amounts of unrecognized tax benefits will change materially in the next 12 months.
Each Fund files tax returns in the U.S. Federal jurisdiction and certain other jurisdictions. Generally, each Fund is subject to examinations by such taxing authorities for up to three years after the filing of the return for the tax period.
| E. | Expenses — Fees provided for under the Rule 12b-1 plan of a particular class of the Fund are charged to the operations of such class. Transfer agency fees and expenses and other shareholder recordkeeping fees and expenses attributable to Class R5 and Class R6 are allocated to each share class based on relative net assets. Sub-accounting fees attributable to Class R5 are charged to the operations of the class. Transfer agency fees and expenses and other shareholder recordkeeping fees and expenses relating to all other classes are allocated among those classes based on relative net assets. All other expenses are allocated among the classes based on relative net assets. |
| F. | Accounting Estimates — The preparation of financial statements in conformity with accounting principles generally accepted in the United States of America (“GAAP”) requires management to make estimates and assumptions that affect the reported amounts of assets and liabilities at the date of the financial statements and the reported amounts of revenues and expenses during the reporting period including estimates and assumptions related to taxation. Actual results could differ from those estimates by a significant amount. In addition, the Fund monitors for material events or transactions that may occur or become known after the period-end date and before the date the financial statements are released to print. |
| G. | Indemnifications — Under the Trust’s organizational documents, each Trustee, officer, employee or other agent of the Trust is indemnified against certain liabilities that may arise out of the performance of their duties to the Fund. Additionally, in the normal course of business, the Fund enters into contracts, including the Fund’s servicing agreements, that contain a variety of indemnification clauses. The Fund’s maximum exposure under these arrangements is unknown as this would involve future claims that may be made against the Fund that have not yet occurred. The risk of material loss as a result of such indemnification claims is considered remote. |
| H. | Futures Contracts — The Fund may enter into futures contracts to manage exposure to interest rate, equity and market price movements and/or currency risks. A futures contract is an agreement between two parties (“Counterparties”) to purchase or sell a specified underlying security, currency or commodity (or delivery of a cash settlement price, in the case of an index future) for a fixed price at a future date. The Fund currently invests only in exchange-traded futures and they are standardized as to maturity date and underlying financial instrument. Initial margin deposits required upon entering into futures contracts are satisfied by the segregation of specific securities or cash as collateral at the futures commission merchant (broker). During the period the futures contracts are open, changes in the value of the contracts are recognized as unrealized gains or losses by recalculating the value of the contracts on a daily basis. Subsequent or variation margin payments are received or made depending upon whether unrealized gains or losses are incurred. These amounts are reflected as receivables or payables on the Statement of Assets and Liabilities. When the contracts are closed or expire, the Fund recognizes a realized gain or loss equal to the difference between the proceeds from, or cost of, the closing transaction and the Fund’s basis in the contract. The net realized gain (loss) and the change in unrealized gain (loss) on futures contracts held during the period is included on the Statement of Operations. The primary risks associated with futures contracts are market risk and the absence of a liquid secondary market. If the Fund were unable to liquidate a futures contract and/or enter into an offsetting closing transaction, the Fund would continue to be subject to market risk with respect to the value of the contracts and continue to be required to maintain the margin deposits on the futures contracts. Futures contracts have minimal Counterparty risk since the exchange’s clearinghouse, as Counterparty to all exchange-traded futures, guarantees the futures against default. Risks may exceed amounts recognized in the Statement of Assets and Liabilities. |
| I. | Dollar Rolls and Forward Commitment Transactions — The Fund may enter into dollar roll transactions to enhance the Fund’s performance. The Fund executes its dollar roll transactions in the to be announced (“TBA”) market whereby the Fund makes a forward commitment to purchase a security and, instead of accepting delivery, the position is offset by the sale of the security with a simultaneous agreement to repurchase at a future date. |
The Fund accounts for dollar roll transactions as purchases and sales and realizes gains and losses on these transactions. These transactions increase the Fund’s portfolio turnover rate. The Fund will segregate liquid assets in an amount equal to its dollar roll commitments. Dollar roll transactions may be considered borrowings under the 1940 Act.
Dollar roll transactions involve the risk that a Counterparty to the transaction may fail to complete the transaction. If this occurs, the Fund may lose the opportunity to purchase or sell the security at the agreed upon price. Dollar roll transactions also involve the risk that the value of the securities retained by the Fund may decline below the price of the securities that the Fund has sold but is obligated to purchase under the agreement.
| J. | Other Risks — The Fund may invest in obligations issued by agencies and instrumentalities of the U.S. Government that may vary in the level of support they receive from the government. The government may choose not to provide financial support to government sponsored agencies or instrumentalities if it is not legally obligated to do so. In this case, if the issuer defaulted, the Fund may not be able to recover its investment in such issuer from the U.S. Government. Many securities purchased by the Fund are not guaranteed by the U.S. Government. |
20 Invesco Quality Income Fund
| K. | Collateral — To the extent the Fund has designated or segregated a security as collateral and that security is subsequently sold, it is the Fund’s practice to replace such collateral no later than the next business day. |
NOTE 2—Advisory Fees and Other Fees Paid to Affiliates
The Trust has entered into a master investment advisory agreement with Invesco Advisers, Inc. (the “Adviser” or “Invesco”). Under the terms of the investment advisory agreement, the Fund accrues daily and pays monthly an advisory fee to the Adviser based on the annual rate of the Fund’s average daily net assets as follows:
| Average Daily Net Assets | Rate | |||||||
First $1 billion | 0 | .47% | ||||||
Next $500 million | 0 | .445% | ||||||
Next $500 million | 0 | .42% | ||||||
Next $500 million | 0 | .395% | ||||||
Next $2.5 billion | 0 | .37% | ||||||
Next $2.5 billion | 0 | .345% | ||||||
Next $2.5 billion | 0 | .32% | ||||||
Next $2.5 billion | 0 | .295% | ||||||
Over $12.5 billion | 0 | .27% | ||||||
For the year ended December 31, 2017, the effective advisory fees incurred by the Fund was 0.47%.
Under the terms of a master sub-advisory agreement between the Adviser and each of Invesco Asset Management Deutschland GmbH, Invesco Asset Management Limited, Invesco Asset Management (Japan) Limited, Invesco Hong Kong Limited, Invesco Senior Secured Management, Inc. and Invesco Canada Ltd. and separate sub-advisory agreements with Invesco PowerShares Capital Management LLC and Invesco Asset Management (India) Private Limited (collectively, the “Affiliated Sub-Advisers”) the Adviser, not the Fund, will pay 40% of the fees paid to the Adviser to any such Affiliated Sub-Adviser(s) that provide(s) discretionary investment management services to the Fund based on the percentage of assets allocated to such Affiliated Sub-Adviser(s).
The Adviser has contractually agreed, through at least June 30, 2018, to waive advisory fees and/or reimburse expenses of all shares to the extent necessary to limit total annual fund operating expenses after fee waiver and/or expense reimbursement (excluding certain items discussed below) of Class A, Class B, Class C, Class Y, Class R5 and Class R6 shares to 1.50%, 2.25%, 2.25%, 1.25%, 1.25% and 1.25%, respectively, of average daily net assets (the “expense limits”). In determining the Adviser’s obligation to waive advisory fees and/or reimburse expenses, the following expenses are not taken into account, and could cause the total annual fund operating expenses after fee waiver and/or expense reimbursement to exceed the numbers reflected above: (1) interest; (2) taxes; (3) dividend expense on short sales; (4) extraordinary or non-routine items, including litigation expenses; and (5) expenses that the Fund has incurred but did not actually pay because of an expense offset arrangement. Unless Invesco continues the fee waiver agreement, it will terminate on June 30, 2018. During its term, the fee waiver agreement cannot be terminated or amended to increase the expense limits without approval of the Board of Trustees. The Adviser did not waive fees and/or reimburse expenses during the period under these expense limits.
Further, the Adviser has contractually agreed, through at least June 30, 2019, to waive the advisory fee payable by the Fund in an amount equal to 100% of the net advisory fees the Adviser receives from the affiliated money market funds on investments by the Fund of uninvested cash in such affiliated money market funds.
For the year ended December 31, 2017, the Adviser waived advisory fees of $14,736.
The Trust has entered into a master administrative services agreement with Invesco pursuant to which the Fund has agreed to pay Invesco for certain administrative costs incurred in providing accounting services to the Fund. For the year ended December 31, 2017, expenses incurred under the agreement are shown in the Statement of Operations as Administrative services fees.
The Trust has entered into a transfer agency and service agreement with Invesco Investment Services, Inc. (“IIS”) pursuant to which the Fund has agreed to pay IIS a fee for providing transfer agency and shareholder services to the Fund and reimburse IIS for certain expenses incurred by IIS in the course of providing such services. IIS may make payments to intermediaries that provide omnibus account services, sub-accounting services and/or networking services. All fees payable by IIS to intermediaries that provide omnibus account services or sub-accounting services are charged back to the Fund, subject to certain limitations approved by the Trust’s Board of Trustees. For the year ended December 31, 2017, expenses incurred under the agreement are shown in the Statement of Operations as Transfer agent fees.
Shares of the Fund are distributed by Invesco Distributors, Inc. (“IDI”). The Fund has adopted a distribution plan pursuant to Rule 12b-1 under the 1940 Act, and a service plan (collectively, the “Plans”) for Class A shares, Class B shares and Class C shares to compensate IDI for the sale, distribution, shareholder servicing and maintenance of shareholder accounts for these shares. Under the Plans, the Fund will incur annual fees of up to 0.25% of Class A average daily net assets and up to 1.00% each of Class B and Class C average daily net assets. The fees are accrued daily and paid monthly.
With respect to Class B and Class C shares, the Fund is authorized to reimburse in future years any distribution related expenses that exceed the maximum annual reimbursement rate for such class, so long as such reimbursement does not cause the Fund to exceed the Class B and Class C maximum annual reimbursement rate, respectively. With respect to Class A shares, distribution related expenses that exceed the maximum annual reimbursement rate for such class are not carried forward to future years and the Fund will not reimburse IDI for any such expenses.
For the year ended December 31, 2017, expenses incurred under these agreements are shown in the Statement of Operations as Distribution fees.
Front-end sales commissions and CDSC (collectively, the “sales charges”) are not recorded as expenses of the Fund. Front-end sales commissions are deducted from proceeds from the sales of Fund shares prior to investment in Class A shares of the Fund. CDSC are deducted from redemption proceeds prior to remittance to the shareholder. During the year ended December 31, 2017, IDI advised the Fund that IDI retained $25,657 in front-end sales commissions from the sale of Class A shares and $15,144 and $1,517 from Class A and Class C shares, respectively, for CDSC imposed on redemptions by shareholders.
21 Invesco Quality Income Fund
Certain officers and trustees of the Trust are officers and directors of the Adviser, IIS and/or IDI.
NOTE 3—Additional Valuation Information
GAAP defines fair value as the price that would be received to sell an asset or paid to transfer a liability in an orderly transaction between market participants at the measurement date, under current market conditions. GAAP establishes a hierarchy that prioritizes the inputs to valuation methods, giving the highest priority to readily available unadjusted quoted prices in an active market for identical assets (Level 1) and the lowest priority to significant unobservable inputs (Level 3), generally when market prices are not readily available or are unreliable. Based on the valuation inputs, the securities or other investments are tiered into one of three levels. Changes in valuation methods may result in transfers in or out of an investment’s assigned level:
| Level 1 — | Prices are determined using quoted prices in an active market for identical assets. |
| Level 2 — | Prices are determined using other significant observable inputs. Observable inputs are inputs that other market participants may use in pricing a security. These may include quoted prices for similar securities, interest rates, prepayment speeds, credit risk, yield curves, loss severities, default rates, discount rates, volatilities and others. |
| Level 3 — | Prices are determined using significant unobservable inputs. In situations where quoted prices or observable inputs are unavailable (for example, when there is little or no market activity for an investment at the end of the period), unobservable inputs may be used. Unobservable inputs reflect the Fund’s own assumptions about the factors market participants would use in determining fair value of the securities or instruments and would be based on the best available information. |
The following is a summary of the tiered valuation input levels, as of December 31, 2017. The level assigned to the securities valuations may not be an indication of the risk or liquidity associated with investing in those securities. Because of the inherent uncertainties of valuation, the values reflected in the financial statements may materially differ from the value received upon actual sale of those investments.
The Fund’s policy is to recognize transfers in and out of the valuation levels as of the end of the reporting period. During the year ended December 31, 2017, there were no material transfers between valuation levels.
| Level 1 | Level 2 | Level 3 | Total | |||||||||||||
| Investments in Securities | ||||||||||||||||
U.S. Government Sponsored Agency Mortgage-Backed Securities | $ | — | $ | 647,831,005 | $ | — | $ | 647,831,005 | ||||||||
Asset-Backed Securities | — | 219,898,548 | — | 219,898,548 | ||||||||||||
Agency Credit Risk Transfer Notes | — | 31,293,815 | — | 31,293,815 | ||||||||||||
Exchange Traded Fund | — | 1,511,400 | — | 1,511,400 | ||||||||||||
U.S. Treasury Bills | — | 424,554 | — | 424,554 | ||||||||||||
Money Market Funds | 12,697,295 | — | — | 12,697,295 | ||||||||||||
Total Investments in Securities | 12,697,295 | 900,959,322 | — | 913,656,617 | ||||||||||||
| Other Investments — Assets* | ||||||||||||||||
Futures Contracts | 86,782 | — | — | 86,782 | ||||||||||||
| Other Investments — Liabilities* | ||||||||||||||||
Futures Contracts | (2,980 | ) | — | — | (2,980 | ) | ||||||||||
Total Other Investments | 83,802 | — | — | 83,802 | ||||||||||||
Total Investments | $ | 12,781,097 | $ | 900,959,322 | $ | — | $ | 913,740,419 | ||||||||
| * | Unrealized appreciation (depreciation). |
NOTE 4—Derivative Investments
The Fund may enter into an International Swaps and Derivatives Association Master Agreement (“ISDA Master Agreement”) under which a fund may trade OTC derivatives. An OTC transaction entered into under an ISDA Master Agreement typically involves a collateral posting arrangement, payment netting provisions and close-out netting provisions. These netting provisions allow for reduction of credit risk through netting of contractual obligations. The enforceability of the netting provisions of the ISDA Master Agreement depends on the governing law of the ISDA Master Agreement, among other factors.
For financial reporting purposes, the Fund does not offset OTC derivative assets or liabilities that are subject to ISDA Master Agreements in the Statement of Assets and Liabilities.
Value of Derivative Investments at Period-End
The table below summarizes the value of the Fund’s derivative investments, detailed by primary risk exposure, held as of December 31, 2017:
| Value | ||||
| Derivative Assets | Interest Rate Risk | |||
Unrealized appreciation on futures contracts — Exchange-Traded(a) | $ | 86,782 | ||
Derivatives not subject to master netting agreements | (86,782 | ) | ||
Total Derivative Assets subject to master netting agreements | $ | — | ||
22 Invesco Quality Income Fund
| Value | ||||
| Derivative Liabilities | Interest Rate Risk | |||
Unrealized depreciation on futures contracts — Exchange-Traded(a) | $ | (2,980 | ) | |
Derivatives not subject to master netting agreements | 2,980 | |||
Total Derivative Liabilities subject to master netting agreements | $ | — | ||
| (a) | The daily variation margin receivable (payable) at period-end is recorded in the Statement of Assets and Liabilities. |
Effect of Derivative Investments for the year ended December 31, 2017
The table below summarizes the gains (losses) on derivative investments, detailed by primary risk exposure, recognized in earnings during the period:
| Location of Gain (Loss) on Statement of Operations | ||||
| Interest Rate Risk | ||||
Realized Gain: | ||||
Futures contracts | $ | 1,044,515 | ||
Change in Net Unrealized Appreciation (Depreciation): | ||||
Futures contracts | (156,338 | ) | ||
Total | $ | 888,177 | ||
The table below summarizes the average notional value of futures contracts, outstanding during the period.
| Futures Contracts | ||||
Average notional value | $ | 40,026,563 | ||
NOTE 5—Investments in Affiliates
The Fund’s Adviser and the adviser for PowerShares Variable Rate Investment Grade Portfolio are subsidiaries of Invesco Ltd. and therefore, PowerShares Variable Rate Investment Grade Portfolio is considered to be affiliated with the Fund. The following is a summary of the transactions in, and earnings from, investments in PowerShares Variable Rate Investment Grade Portfolio for the year ended December 31, 2017.
| Value 12/31/2016 | Purchases at Cost | Proceeds from Sales | Change in Unrealized Appreciation (Depreciation) | Realized Gain (Loss) | Value 12/31/2017 | Dividend Income | ||||||||||||||||||||||
PowerShares Variable Rate Investment Grade Portfolio | $ | — | $ | 1,514,406 | $ | — | $ | (3,006 | ) | $ | — | $ | 1,511,400 | $ | 23,219 | |||||||||||||
NOTE 6—Expense Offset Arrangement(s)
The expense offset arrangement is comprised of transfer agency credits which result from balances in demand deposit accounts used by the transfer agent for clearing shareholder transactions. For the year ended December 31, 2017, the Fund received credits from this arrangement, which resulted in the reduction of the Fund’s total expenses of $6,290.
NOTE 7—Trustees’ and Officers’ Fees and Benefits
Trustees’ and Officers’ Fees and Benefits include amounts accrued by the Fund to pay remuneration to certain Trustees and Officers of the Fund. Trustees have the option to defer compensation payable by the Fund, and Trustees’ and Officers’ Fees and Benefits also include amounts accrued by the Fund to fund such deferred compensation amounts. Those Trustees who defer compensation have the option to select various Invesco Funds in which their deferral accounts shall be deemed to be invested. Finally, certain current Trustees were eligible to participate in a retirement plan that provided for benefits to be paid upon retirement to Trustees over a period of time based on the number of years of service. The Fund may have certain former Trustees who also participate in a retirement plan and receive benefits under such plan. Trustees’ and Officers’ Fees and Benefits include amounts accrued by the Fund to fund such retirement benefits. Obligations under the deferred compensation and retirement plans represent unsecured claims against the general assets of the Fund.
NOTE 8—Cash Balances
The Fund may borrow for leveraging in an amount up to 5% of the Fund’s total assets (excluding the amount borrowed) at the time the borrowing is made. In doing so, the Fund is permitted to temporarily carry a negative or overdrawn balance in its account with State Street Bank and Trust Company, the custodian bank. Such balances, if any at period end, are shown in the Statement of Assets and Liabilities under the payable caption Amount due custodian. To compensate the custodian bank for such overdrafts, the overdrawn Fund may either (1) leave funds as a compensating balance in the account so the custodian bank can be compensated by earning the additional interest; or (2) compensate by paying the custodian bank at a rate agreed upon by the custodian bank and Invesco, not to exceed the contractually agreed upon rate. The Fund may not purchase additional securities when any borrowings from banks exceed 5% of the Fund’s total assets.
23 Invesco Quality Income Fund
NOTE 9—Distributions to Shareholders and Tax Components of Net Assets
Tax Character of Distributions to Shareholders Paid During the Fiscal Years Ended December 31, 2017 and 2016:
| 2017 | 2016 | |||||||
Ordinary income | $ | 21,216,927 | $ | 19,955,964 | ||||
Tax Components of Net Assets at Period-End:
| 2017 | ||||
Undistributed ordinary income | $ | 923,212 | ||
Net unrealized appreciation (depreciation) — investments | (6,694,621 | ) | ||
Temporary book/tax differences | (79,630 | ) | ||
Capital loss carryforward | (26,345,159 | ) | ||
Shares of beneficial interest | 642,048,153 | |||
Total net assets | $ | 609,851,955 | ||
The difference between book-basis and tax-basis unrealized appreciation (depreciation) is due to differences in the timing of recognition of gains and losses on investments for tax and book purposes. The Fund’s net unrealized appreciation (depreciation) difference is attributable primarily to futures contracts and wash sales.
The temporary book/tax differences are a result of timing differences between book and tax recognition of income and/or expenses. The Fund’s temporary book/tax differences are the result of the trustee deferral of compensation and retirement plan benefits.
Capital loss carryforward is calculated and reported as of a specific date. Results of transactions and other activity after that date may affect the amount of capital loss carryforward actually available for the Fund to utilize. Capital losses generated in years beginning after December 22, 2010 can be carried forward for an unlimited period, whereas previous losses expire in eight tax years. Capital losses with an expiration period may not be used to offset capital gains until all net capital losses without an expiration date have been utilized. Capital loss carryforwards with no expiration date will retain their character as either short-term or long-term capital losses instead of as short-term capital losses as under prior law. The ability to utilize capital loss carryforwards in the future may be limited under the Internal Revenue Code and related regulations based on the results of future transactions.
The Fund has a capital loss carryforward as of December 31, 2017 as follows:
| Capital Loss Carryforward* | ||||||||||||
| Expiration | Short-Term | Long-Term | Total | |||||||||
Not subject to expiration | $ | 12,776,778 | $ | 13,568,381 | $ | 26,345,159 | ||||||
| * | Capital loss carryforward as of the date listed above is reduced for limitations, if any, to the extent required by the Internal Revenue Code and may be further limited depending upon a variety of factors, including the realization of net unrealized gains or losses as of the date of any reorganization. |
NOTE 10—Investment Transactions
The aggregate amount of investment securities (other than short-term securities, U.S. Treasury obligations and money market funds, if any) purchased and sold by the Fund during the year ended December 31, 2017 was $4,581,701,616 and $4,543,934,364, respectively. Cost of investments, including any derivatives, on a tax basis includes the adjustments for financial reporting purposes as of the most recently completed federal income tax reporting period-end.
| Unrealized Appreciation (Depreciation) of Investments on a Tax Basis | ||||
Aggregate unrealized appreciation of investments | $ | 6,670,607 | ||
Aggregate unrealized (depreciation) of investments | (13,365,228 | ) | ||
Net unrealized appreciation (depreciation) of investments | $ | (6,694,621 | ) | |
Cost of investments for tax purposes is $920,435,040.
NOTE 11—Reclassification of Permanent Differences
Primarily as a result of differing book/tax treatment of paydowns and dollar rolls, on December 31, 2017, undistributed net investment income was increased by $7,609,231 and undistributed net realized gain (loss) was decreased by $7,609,231. This reclassification had no effect on the net assets of the Fund.
24 Invesco Quality Income Fund
NOTE 12—Share Information
| Summary of Share Activity | ||||||||||||||||
| Years ended December 31, | ||||||||||||||||
| 2017(a) | 2016 | |||||||||||||||
| Shares | Amount | Shares | Amount | |||||||||||||
Sold:(b)(c) | ||||||||||||||||
Class A | 2,315,811 | $ | 27,942,373 | 4,798,240 | $ | 59,190,772 | ||||||||||
Class B | 2,193 | 27,450 | 22,421 | 275,217 | ||||||||||||
Class C | 327,493 | 3,928,916 | 1,102,136 | 13,512,659 | ||||||||||||
Class Y | 2,500,537 | 30,301,496 | 5,298,509 | 65,657,810 | ||||||||||||
Class R5(b) | 2,872,747 | 34,847,199 | 12,017,871 | 148,911,189 | ||||||||||||
Class R6(c) | 1,012 | 12,300 | — | — | ||||||||||||
Issued as reinvestment of dividends: | ||||||||||||||||
Class A | 805,578 | 9,711,034 | 837,029 | 10,321,307 | ||||||||||||
Class B | 1,013 | 12,158 | 1,961 | 24,074 | ||||||||||||
Class C | 24,989 | 299,127 | 24,893 | 304,721 | ||||||||||||
Class Y | 133,398 | 1,614,382 | 69,462 | 858,107 | ||||||||||||
Class R5 | 493,462 | 5,968,234 | 356,152 | 4,405,911 | ||||||||||||
Automatic conversion of Class B shares to Class A shares: | ||||||||||||||||
Class A | 24,322 | 293,620 | 32,316 | 398,087 | ||||||||||||
Class B | (24,461 | ) | (293,620 | ) | (32,480 | ) | (398,087 | ) | ||||||||
Reacquired: | ||||||||||||||||
Class A | (5,809,800 | ) | (70,066,170 | ) | (5,834,640 | ) | (71,896,273 | ) | ||||||||
Class B | (7,061 | ) | (85,456 | ) | (26,054 | ) | (320,050 | ) | ||||||||
Class C | (545,831 | ) | (6,541,138 | ) | (597,411 | ) | (7,293,443 | ) | ||||||||
Class Y | (2,604,704 | ) | (31,528,309 | ) | (1,577,082 | ) | (19,467,266 | ) | ||||||||
Class R5 | (435,272 | ) | (5,280,944 | ) | (634,434 | ) | (7,888,525 | ) | ||||||||
Class R6 | (188 | ) | (2,287 | ) | — | — | ||||||||||
Net increase in share activity | 75,238 | $ | 1,160,365 | 15,858,889 | $ | 196,596,210 | ||||||||||
| (a) | There are entities that are record owners of more than 5% of the outstanding shares of the Fund and in the aggregate own 15% of the outstanding shares of the Fund. IDI has an agreement with these entities to sell Fund shares. The Fund, Invesco and/or Invesco affiliates may make payments to these entities, which are considered to be related to the Fund, for providing services to the Fund, Invesco and/or Invesco affiliates including but not limited to services such as securities brokerage, distribution, third party record keeping and account servicing. The Fund has no knowledge as to whether all or any portion of the shares owned of record by these entities are also owned beneficially. |
| In addition, 29% of the outstanding shares of the Fund are owned by the Adviser or an affiliate of the Adviser. |
| (b) | On February 18, 2016, 9,843,785 Class R5 shares valued at $122,062,934 were sold to affiliated mutual funds. |
| (c) | Commencement date April 4, 2017 for Class R6 shares. |
25 Invesco Quality Income Fund
NOTE 13—Financial Highlights
The following schedule presents financial highlights for a share of the Fund outstanding throughout the periods indicated.
| Net asset value, beginning of period | Net investment income(a) | Net gains (losses) on securities (both realized and unrealized) | Total from investment operations | Dividends from net investment income | Net asset value, end of period | Total return(b) | Net assets, end of period (000’s omitted) | Ratio of expenses to average net assets with fee waivers and/or expenses absorbed | Ratio of expenses to average net assets without fee waivers and/or expenses absorbed | Ratio of net investment income to average net assets | Portfolio turnover(c) | |||||||||||||||||||||||||||||||||||||
Class A | ||||||||||||||||||||||||||||||||||||||||||||||||
Year ended 12/31/17 | $ | 12.11 | $ | 0.26 | $ | (0.02 | ) | $ | 0.24 | $ | (0.40 | ) | $ | 11.95 | 1.98 | %(d) | $ | 353,256 | 0.96 | %(d)(e) | 0.96 | %(d)(e) | 2.15 | %(d)(e) | 516 | % | ||||||||||||||||||||||
Year ended 12/31/16 | 12.22 | 0.27 | 0.04 | 0.31 | (0.42 | ) | 12.11 | 2.50 | (d) | 390,037 | 0.92 | (d) | 0.93 | (d) | 2.19 | (d)(f) | 472 | |||||||||||||||||||||||||||||||
Year ended 12/31/15 | 12.55 | 0.24 | (0.06 | ) | 0.18 | (0.51 | ) | 12.22 | 1.41 | (d) | 395,806 | 0.96 | (d) | 0.96 | (d) | 1.88 | (d) | 500 | ||||||||||||||||||||||||||||||
Year ended 12/31/14 | 12.35 | 0.28 | 0.48 | 0.76 | (0.56 | ) | 12.55 | 6.27 | (d) | 424,259 | 0.96 | (d) | 0.96 | (d) | 2.28 | (d) | 450 | |||||||||||||||||||||||||||||||
Year ended 12/31/13 | 13.02 | 0.21 | (0.40 | ) | (0.19 | ) | (0.48 | ) | 12.35 | (1.51 | )(d) | 441,028 | 0.94 | (d) | 0.94 | (d) | 1.63 | (d) | 475 | |||||||||||||||||||||||||||||
Class B | ||||||||||||||||||||||||||||||||||||||||||||||||
Year ended 12/31/17 | 12.04 | 0.16 | 0.01 | 0.17 | (0.30 | ) | 11.91 | 1.45 | 371 | 1.72 | (e) | 1.72 | (e) | 1.39 | (e) | 516 | ||||||||||||||||||||||||||||||||
Year ended 12/31/16 | 12.16 | 0.17 | 0.03 | 0.20 | (0.32 | ) | 12.04 | 1.64 | 716 | 1.68 | 1.69 | 1.43 | (f) | 472 | ||||||||||||||||||||||||||||||||||
Year ended 12/31/15 | 12.48 | 0.14 | (0.05 | ) | 0.09 | (0.41 | ) | 12.16 | 0.71 | 1,138 | 1.72 | 1.72 | 1.12 | 500 | ||||||||||||||||||||||||||||||||||
Year ended 12/31/14 | 12.28 | 0.18 | 0.48 | 0.66 | (0.46 | ) | 12.48 | 5.48 | 2,135 | 1.72 | 1.72 | 1.52 | 450 | |||||||||||||||||||||||||||||||||||
Year ended 12/31/13 | 12.95 | 0.11 | (0.40 | ) | (0.29 | ) | (0.38 | ) | 12.28 | (2.28 | ) | 3,197 | 1.70 | 1.70 | 0.87 | 475 | ||||||||||||||||||||||||||||||||
Class C | ||||||||||||||||||||||||||||||||||||||||||||||||
Year ended 12/31/17 | 12.02 | 0.16 | (0.01 | ) | 0.15 | (0.30 | ) | 11.87 | 1.28 | 13,178 | 1.72 | (e) | 1.72 | (e) | 1.39 | (e) | 516 | |||||||||||||||||||||||||||||||
Year ended 12/31/16 | 12.14 | 0.17 | 0.03 | 0.20 | (0.32 | ) | 12.02 | 1.63 | 15,672 | 1.68 | 1.69 | 1.43 | (f) | 472 | ||||||||||||||||||||||||||||||||||
Year ended 12/31/15 | 12.46 | 0.14 | (0.05 | ) | 0.09 | (0.41 | ) | 12.14 | 0.71 | 9,394 | 1.72 | 1.72 | 1.12 | 500 | ||||||||||||||||||||||||||||||||||
Year ended 12/31/14 | 12.26 | 0.19 | 0.47 | 0.66 | (0.46 | ) | 12.46 | 5.48 | 8,100 | 1.72 | 1.72 | 1.52 | 450 | |||||||||||||||||||||||||||||||||||
Year ended 12/31/13 | 12.93 | 0.11 | (0.40 | ) | (0.29 | ) | (0.38 | ) | 12.26 | (2.29 | ) | 7,788 | 1.70 | 1.70 | 0.87 | 475 | ||||||||||||||||||||||||||||||||
Class Y | ||||||||||||||||||||||||||||||||||||||||||||||||
Year ended 12/31/17 | 12.15 | 0.29 | (0.01 | ) | 0.28 | (0.43 | ) | 12.00 | 2.32 | 67,027 | 0.72 | (e) | 0.72 | (e) | 2.39 | (e) | 516 | |||||||||||||||||||||||||||||||
Year ended 12/31/16 | 12.27 | 0.30 | 0.03 | 0.33 | (0.45 | ) | 12.15 | 2.67 | 67,532 | 0.68 | 0.69 | 2.43 | (f) | 472 | ||||||||||||||||||||||||||||||||||
Year ended 12/31/15 | 12.59 | 0.26 | (0.04 | ) | 0.22 | (0.54 | ) | 12.27 | 1.75 | 21,668 | 0.72 | 0.72 | 2.12 | 500 | ||||||||||||||||||||||||||||||||||
Year ended 12/31/14 | 12.39 | 0.32 | 0.47 | 0.79 | (0.59 | ) | 12.59 | 6.52 | 19,306 | 0.72 | 0.72 | 2.52 | 450 | |||||||||||||||||||||||||||||||||||
Year ended 12/31/13 | 13.07 | 0.24 | (0.41 | ) | (0.17 | ) | (0.51 | ) | 12.39 | (1.32 | ) | 2,254 | 0.70 | 0.70 | 1.87 | 475 | ||||||||||||||||||||||||||||||||
Class R5 | ||||||||||||||||||||||||||||||||||||||||||||||||
Year ended 12/31/17 | 12.15 | 0.30 | (0.01 | ) | 0.29 | (0.44 | ) | 12.00 | 2.46 | 176,010 | 0.58 | (e) | 0.58 | (e) | 2.53 | (e) | 516 | |||||||||||||||||||||||||||||||
Year ended 12/31/16 | 12.26 | 0.32 | 0.03 | 0.35 | (0.46 | ) | 12.15 | 2.86 | 142,657 | 0.55 | 0.56 | 2.56 | (f) | 472 | ||||||||||||||||||||||||||||||||||
Year ended 12/31/15 | 12.59 | 0.27 | (0.06 | ) | 0.21 | (0.54 | ) | 12.26 | 1.71 | 27 | 0.68 | 0.68 | 2.16 | 500 | ||||||||||||||||||||||||||||||||||
Year ended 12/31/14 | 12.39 | 0.33 | 0.47 | 0.80 | (0.60 | ) | 12.59 | 6.56 | 15 | 0.67 | 0.67 | 2.57 | 450 | |||||||||||||||||||||||||||||||||||
Year ended 12/31/13 | 13.06 | 0.25 | (0.41 | ) | (0.16 | ) | (0.51 | ) | 12.39 | (1.23 | ) | 10 | 0.66 | 0.66 | 1.91 | 475 | ||||||||||||||||||||||||||||||||
Class R6 | ||||||||||||||||||||||||||||||||||||||||||||||||
Year ended 12/31/17(g) | 12.14 | 0.23 | (0.04 | ) | 0.19 | (0.33 | ) | 12.00 | 1.61 | 10 | 0.58 | (e)(h) | 0.58 | (e)(h) | 2.53 | (e)(h) | 516 | |||||||||||||||||||||||||||||||
| (a) | Calculated using average shares outstanding. |
| (b) | Includes adjustments in accordance with accounting principles generally accepted in the United States of America and as such, the net asset value for financial reporting purposes and the returns based upon those net asset values may differ from the net asset value and returns for shareholder transactions. Does not include sales charges and is not annualized for periods less than one year, if applicable. |
| (c) | Portfolio turnover is calculated at the fund level and is not annualized for periods less than one year, if applicable. |
| (d) | The total return, ratio of expenses to average net assets and ratio of net investment income to average net assets reflect actual 12b-1 fees of 0.24% for the years ended December 31, 2017, 2016, 2015, 2014 and 2013. |
| (e) | Ratios are based on average daily net assets (000’s omitted) of $373,756, $511, $14,497, $72,656, $162,707and $10 for Class A, Class B, Class C, Class Y, Class R5 and Class R6 shares, respectively. |
| (f) | Amount includes the effect of a one-time reimbursement of custody expenses. The ratio of net investment income excluding these payments would have been 2.02%, 1.26%, 1.26%, 2.26% and 2.39% for Class A, Class B, Class C, Class Y and Class R5 shares, respectively. |
| (g) | Commencement date of April 4, 2017. |
| (h) | Annualized. |
26 Invesco Quality Income Fund
Report of Independent Registered Public Accounting Firm
To the Board of Trustees of AIM Growth Series (Invesco Growth Series)
and Shareholders of Invesco Quality Income Fund
Opinion on the Financial Statements
We have audited the accompanying statement of assets and liabilities, including the schedule of investments, of Invesco Quality Income Fund (one of the funds constituting AIM Growth Series (Invesco Growth Series), hereafter referred to as the “Fund”) as of December 31, 2017, the related statement of operations for the year ended December 31, 2017, the statement of changes in net assets for each of the two years in the period ended December 31, 2017, including the related notes, and the financial highlights for each of the periods indicated therein (collectively referred to as the “financial statements”). In our opinion, the financial statements present fairly, in all material respects, the financial position of the Fund as of December 31, 2017, the results of its operations for the year then ended, the changes in its net assets for each of the two years in the period ended December 31, 2017 and the financial highlights for each of the periods indicated therein in conformity with accounting principles generally accepted in the United States of America.
Basis for Opinion
These financial statements are the responsibility of the Fund’s management. Our responsibility is to express an opinion on the Fund’s financial statements based on our audits. We are a public accounting firm registered with the Public Company Accounting Oversight Board (United States) (“PCAOB”) and are required to be independent with respect to the Fund in accordance with the U.S. federal securities laws and the applicable rules and regulations of the Securities and Exchange Commission and the PCAOB.
We conducted our audits of these financial statements in accordance with the standards of the PCAOB. Those standards require that we plan and perform the audit to obtain reasonable assurance about whether the financial statements are free of material misstatement, whether due to error or fraud.
Our audits included performing procedures to assess the risks of material misstatement of the financial statements, whether due to error or fraud, and performing procedures that respond to those risks. Such procedures included examining, on a test basis, evidence regarding the amounts and disclosures in the financial statements. Our audits also included evaluating the accounting principles used and significant estimates made by management, as well as evaluating the overall presentation of the financial statements. Our procedures included confirmation of securities owned as of December 31, 2017 by correspondence with the custodian, transfer agent and brokers; when replies were not received from brokers, we performed other auditing procedures. We believe that our audits provide a reasonable basis for our opinion.
PricewaterhouseCoopers LLP
Houston, TX
February 23, 2018
We have served as the auditor of one or more of the investment companies in the Invesco/PowerShares group of investment companies since at least 1995. We have not determined the specific year we began serving as auditor.
27 Invesco Quality Income Fund
Calculating your ongoing Fund expenses
Example
As a shareholder of the Fund, you incur two types of costs: (1) transaction costs, which may include sales charges (loads) on purchase payments or contingent deferred sales charges on redemptions, if any; and (2) ongoing costs, including management fees, distribution and/or service (12b-1) fees, and other Fund expenses. This example is intended to help you understand your ongoing costs (in dollars) of investing in the Fund and to compare these costs with ongoing costs of investing in other mutual funds. The example is based on an investment of $1,000 invested at the beginning of the period and held for the entire period July 1, 2017 through December 31, 2017.
Actual expenses
The table below provides information about actual account values and actual expenses. You may use the information in this table, together with the amount you invested, to estimate the expenses that you paid over the period. Simply divide your account value by $1,000 (for example, an $8,600 account value divided by $1,000 = 8.6), then multiply the result by the number in the table under the heading entitled “Actual Expenses Paid During Period” to estimate the expenses you paid on your account during this period.
Hypothetical example for comparison purposes
The table below also provides information about hypothetical account values and hypothetical expenses based on the Fund’s actual expense ratio and an assumed rate of return of 5% per year before expenses, which is not the Fund’s actual return.
The hypothetical account values and expenses may not be used to estimate the actual ending account balance or expenses you paid for the period. You may use this information to compare the ongoing costs of investing in the Fund and other funds. To do so, compare this 5% hypothetical example with the 5% hypothetical examples that appear in the shareholder reports of the other funds.
Please note that the expenses shown in the table are meant to highlight your ongoing costs only and do not reflect any transaction costs, such as sales charges (loads) on purchase payments or contingent deferred sales charges on redemptions, if any. Therefore, the hypothetical information is useful in comparing ongoing costs only, and will not help you determine the relative total costs of owning different funds. In addition, if these transaction costs were included, your costs would have been higher.
Class | Beginning | ACTUAL | HYPOTHETICAL (5% annual return before expenses) | Annualized Ratio | ||||||||||||||||||||
| Ending Account Value (12/31/17)1 | Expenses Paid During Period2 | Ending Account Value (12/31/17) | Expenses Paid During Period2 | |||||||||||||||||||||
| A | $ | 1,000.00 | $ | 1,008.20 | $ | 4.81 | $ | 1,020.42 | $ | 4.84 | 0.95 | % | ||||||||||||
| B | 1,000.00 | 1,004.30 | 8.64 | 1,016.59 | 8.69 | 1.71 | ||||||||||||||||||
| C | 1,000.00 | 1,004.30 | 8.64 | 1,016.59 | 8.69 | 1.71 | ||||||||||||||||||
| Y | 1,000.00 | 1,009.50 | 3.60 | 1,021.63 | 3.62 | 0.71 | ||||||||||||||||||
| R5 | 1,000.00 | 1,011.00 | 2.89 | 1,022.33 | 2.91 | 0.57 | ||||||||||||||||||
| R6 | 1,000.00 | 1,011.00 | 2.89 | 1,022.33 | 2.91 | 0.57 | ||||||||||||||||||
| 1 | The actual ending account value is based on the actual total return of the Fund for the period July 1, 2017 through December 31, 2017, after actual expenses and will differ from the hypothetical ending account value which is based on the fund’s expense ratio and a hypothetical annual return of 5% before expenses. |
| 2 | Expenses are equal to the Fund’s annualized expense ratio as indicated above multiplied by the average account value over the period, multiplied by 184/365 to reflect the most recent fiscal half year. |
28 Invesco Quality Income Fund
Tax Information
Form 1099-DIV, Form 1042-S and other year-end tax information provide shareholders with actual calendar year amounts that should be included in their tax returns. Shareholders should consult their tax advisors.
The following distribution information is being provided as required by the Internal Revenue Code or to meet a specific state’s requirement.
The Fund designates the following amounts or, if subsequently determined to be different, the maximum amount allowable for its fiscal year ended December 31, 2017:
Federal and State Income Tax | ||||
Qualified Dividend Income* | 0.00 | % | ||
Corporate Dividends Received Deduction* | 0.00 | % | ||
U.S. Treasury Obligations* | 0.02 | % | ||
| * | The above percentages are based on ordinary income dividends paid to shareholders during the Fund’s fiscal year. |
29 Invesco Quality Income Fund
Trustees and Officers
The address of each trustee and officer is AIM Growth Series (Invesco Growth Series) (the “Trust”), 11 Greenway Plaza, Suite 1000, Houston, Texas 77046-1173. The trustees serve for the life of the Trust, subject to their earlier death, incapacitation, resignation, retirement or removal as more specifically provided in the Trust’s organizational documents. Each officer serves for a one year term or until their successors are elected and qualified. Column two below includes length of time served with predecessor entities, if any.
Name, Year of Birth and Position(s) Held with the Trust | Trustee and/ or Officer Since | Principal Occupation(s) During Past 5 Years | Number of Funds in Fund Complex Overseen by Trustee | Other Directorship(s) Held by Trustee During Past 5 Years | ||||
| Interested Persons | ||||||||
| Martin L. Flanagan1 — 1960 Trustee | 2007 | Executive Director, Chief Executive Officer and President, Invesco Ltd. (ultimate parent of Invesco and a global investment management firm); Trustee, The Invesco Funds; Vice Chair, Investment Company Institute; and Member of Executive Board, SMU Cox School of Business
Formerly: Advisor to the Board, Invesco Advisers, Inc. (formerly known as Invesco Institutional (N.A.), Inc.); Chairman and Chief Executive Officer, Invesco Advisers, Inc. (registered investment adviser); Director, Chairman, Chief Executive Officer and President, Invesco Holding Company (US), Inc. (formerly IVZ Inc.) (holding company), Invesco Group Services, Inc. (service provider) and Invesco North American Holdings, Inc. (holding company); Director, Chief Executive Officer and President, Invesco Holding Company Limited (parent of Invesco and a global investment management firm); Director, Invesco Ltd.; Chairman, Investment Company Institute and President, Co-Chief Executive Officer, Co-President, Chief Operating Officer and Chief Financial Officer, Franklin Resources, Inc. (global investment management organization) | 158 | None | ||||
| Philip A. Taylor2 — 1954 Trustee and Senior Vice President | 2006 | Head of the Americas and Senior Managing Director, Invesco Ltd.; Director, Invesco Advisers, Inc. (formerly known as Invesco Institutional (N.A.), Inc.) (registered investment adviser); Director, Chairman, Chief Executive Officer and President, Invesco Management Group, Inc. (formerly known as Invesco Aim Management Group, Inc.) (financial services holding company); Director and Chairman, Invesco Investment Services, Inc. (formerly known as Invesco Aim Investment Services, Inc.) (registered transfer agent); Chief Executive Officer, Invesco Corporate Class Inc. (corporate mutual fund company); Director, Chairman and Chief Executive Officer, Invesco Canada Ltd. (formerly known as Invesco Trimark Ltd./Invesco Trimark Ltèe) (registered investment adviser and registered transfer agent); Trustee and Senior Vice President, The Invesco Funds; Director, Invesco Investment Advisers LLC (formerly known as Van Kampen Asset Management).
Formerly: Co-Chairman, Co-President and Co-Chief Executive Officer, Invesco Advisers, Inc. (formerly known as Invesco Institutional (N.A.), Inc.) (registered investment adviser); Director, Chief Executive Officer and President, Van Kampen Exchange Corp; President and Principal Executive Officer, The Invesco Funds (other than AIM Treasurer’s Series Trust (Invesco Treasurer’s Series Trust), Short-Term Investments Trust and Invesco Management Trust); Executive Vice President, The Invesco Funds (AIM Treasurer’s Series Trust (Invesco Treasurer’s Series Trust), Short-Term Investments Trust and Invesco Management Trust only); Director and President, INVESCO Funds Group, Inc. (registered investment adviser and registered transfer agent); Director and Chairman, IVZ Distributors, Inc. (formerly known as INVESCO Distributors, Inc.) (registered broker dealer); Director, President and Chairman, Invesco Inc. (holding company), Invesco Canada Holdings Inc. (holding company), Trimark Investments Ltd./Placements Trimark Ltèe and Invesco Financial Services Ltd/Services Financiers Invesco Ltèe; Chief Executive Officer, Invesco Canada Fund Inc. (corporate mutual fund company); Director and Chairman, Van Kampen Investor Services Inc.; Director, Chief Executive Officer and President, 1371 Preferred Inc. (holding company) and Van Kampen Investments Inc.; Director and President, AIM GP Canada Inc. (general partner for limited partnerships) and Van Kampen Advisors, Inc.; Director and Chief Executive Officer, Invesco Trimark Dealer Inc. (registered broker dealer); Director, Invesco Distributors, Inc. (formerly known as Invesco Aim Distributors, Inc.) (registered broker dealer); Manager, Invesco PowerShares Capital Management LLC; Director, Chief Executive Officer and President, Invesco Advisers, Inc.; Director, Chairman, Chief Executive Officer and President, Invesco Aim Capital Management, Inc.; President, Invesco Trimark Dealer Inc. and Invesco Trimark Ltd./Invesco Trimark Ltèe; Director and President, AIM Trimark Corporate Class Inc. and AIM Trimark Canada Fund Inc.; Senior Managing Director, Invesco Holding Company Limited; Director and Chairman, Fund Management Company (former registered broker dealer); President and Principal Executive Officer, The Invesco Funds (AIM Treasurer’s Series Trust (Invesco Treasurer’s Series Trust), and Short-Term Investments Trust only); President, AIM Trimark Global Fund Inc. and AIM Trimark Canada Fund Inc. | 158 | None |
| 1 | Mr. Flanagan is considered an interested person (within the meaning of Section 2(a)(19) of the 1940 Act) of the Trust because he is an officer of the Adviser to the Trust, and an officer and a director of Invesco Ltd., ultimate parent of the Adviser. |
| 2 | Mr. Taylor is considered an interested person (within the meaning of Section 2(a)(19) of the 1940 Act) of the Trust because he is an officer and a director of the Adviser. |
T-1 Invesco Quality Income Fund
Trustees and Officers—(continued)
Name, Year of Birth and Position(s) Held with the Trust | Trustee and/ or Officer Since | Principal Occupation(s) During Past 5 Years | Number of Funds in Fund Complex Overseen by Trustee | Other Directorship(s) Past 5 Years | ||||
| Independent Trustees | ||||||||
Bruce L. Crockett — 1944 Trustee and Chair | 2001 | Chairman, Crockett Technologies Associates (technology consulting company)
Formerly: Director, Captaris (unified messaging provider); Director, President and Chief Executive Officer, COMSAT Corporation; Chairman, Board of Governors of INTELSAT (international communications company); ACE Limited (insurance company); Independent Directors Council and Investment Company Institute: Member of the Audit Committee, Investment Company Institute; Member of the Executive Committee and Chair of the Governance Committee, Independent Directors Council | 158 | Director and Chairman of the Audit Committee, ALPS (Attorneys Liability Protection Society) (insurance company); Director and Member of the Audit Committee and Compensation Committee, Ferroglobe PLC (metallurgical company) | ||||
David C. Arch — 1945 Trustee | 2010 | Chairman of Blistex Inc. (consumer health care products manufacturer); Member, World Presidents’ Organization | 158 | Board member of the Illinois Manufacturers’ Association | ||||
Jack M. Fields — 1952 Trustee | 2001 | Chief Executive Officer, Twenty First Century Group, Inc. (government affairs company); and Chairman, Discovery Learning Alliance (non-profit)
Formerly: Owner and Chief Executive Officer, Dos Angeles Ranch L.P. (cattle, hunting, corporate entertainment); Director, Insperity, Inc. (formerly known as Administaff) (human resources provider); Chief Executive Officer, Texana Timber LP (sustainable forestry company); Director of Cross Timbers Quail Research Ranch (non-profit); and member of the U.S. House of Representatives | 158 | None | ||||
Cynthia Hostetler — 1962 Trustee | 2017 | Non-Executive Director and Trustee of a number of public and private business corporations
Formerly: Head of Investment Funds and Private Equity, Overseas Private Investment Corporation; President, First Manhattan Bancorporation, Inc.; Attorney, Simpson Thacher & Bartlett LLP | 158 | Vulcan Materials Company (construction materials company); Trilinc Global Impact Fund; Aberdeen Investment Funds (4 portfolios); Artio Global Investment LLC (mutual fund complex); Edgen Group, Inc. (specialized energy and infrastructure products distributor) | ||||
Eli Jones — 1961 Trustee | 2016 | Professor and Dean, Mays Business School — Texas A&M University
Formerly: Professor and Dean, Walton College of Business, University of Arkansas and E.J. Ourso College of Business, Louisiana State University; Director, Arvest Bank | 158 | Insperity, Inc. (formerly known as Administaff) (human resources provider) | ||||
Prema Mathai-Davis — 1950 Trustee | 2001 | Retired. | 158 | None | ||||
Teresa M. Ressel — 1962 Trustee | 2017 | Non-executive director and trustee of a number of public and private business corporations
Formerly: Chief Financial Officer, Olayan America, The Olayan Group (international investor/commercial/industrial); Chief Executive Officer, UBS Securities LLC; Group Chief Operating Officer, Americas, UBS AG; Assistant Secretary for Management & Budget and CFO, US Department of the Treasury | 158 | Atlantic Power Corporation (power generation company); ON Semiconductor Corp. (semiconductor supplier) | ||||
Ann Barnett Stern — 1957 Trustee | 2017 | President and Chief Executive Officer, Houston Endowment Inc. (private philanthropic institution)
Formerly: Executive Vice President and General Counsel, Texas Children’s Hospital; Attorney, Beck, Redden and Secrest, LLP; Business Law Instructor, University of St. Thomas; Attorney, Andrews & Kurth LLP | 158 | Federal Reserve Bank of Dallas | ||||
Raymond Stickel, Jr. — 1944 Trustee | 2005 | Retired.
Formerly: Director, Mainstay VP Series Funds, Inc. (25 portfolios); Partner, Deloitte & Touche | 158 | None | ||||
Robert C. Troccoli — 1949 Trustee | 2016 | Adjunct Professor, University of Denver — Daniels College of Business
Formerly: Senior Partner, KPMG LLP | 158 | None | ||||
Christopher L. Wilson — 1957 Trustee | 2017 | Non-executive director and trustee of a number of public and private business corporations
Formerly: Managing Partner, CT2, LLC (investing and consulting firm); President/Chief Executive Officer, Columbia Funds, Bank of America Corporation; President/Chief Executive Officer, CDC IXIS Asset Management Services, Inc.; Principal & Director of Operations, Scudder Funds, Scudder, Stevens & Clark, Inc.; Assistant Vice President, Fidelity Investments | 158 | TD Asset Management USA Inc. (mutual fund complex) (22 portfolios); ISO New England, Inc. (non-profit organization managing regional electricity market) |
T-2 Invesco Quality Income Fund
Trustees and Officers—(continued)
Name, Year of Birth and Position(s) Held with the Trust | Trustee and/ or Officer Since | Principal Occupation(s) During Past 5 Years | Number of Funds in Fund Complex Overseen by Trustee | Other Directorship(s) Past 5 Years | ||||
| Other Officers | ||||||||
Sheri Morris — 1964 President, Principal Executive Officer and Treasurer | 1999 | President, Principal Executive Officer and Treasurer, The Invesco Funds; Vice President, Invesco Advisers, Inc. (formerly known as Invesco Institutional (N.A.), Inc.) (registered investment adviser); and Vice President, PowerShares Exchange-Traded Fund Trust, PowerShares Exchange-Traded Fund Trust II, PowerShares India Exchange-Traded Fund Trust, PowerShares Actively Managed Exchange-Traded Fund Trust, PowerShares Actively Managed Exchange-Traded Commodity Fund Trust and PowerShares Exchange-Traded Self-Indexed Fund Trust
Formerly: Vice President and Principal Financial Officer, The Invesco Funds; Vice President, Invesco Aim Advisers, Inc., Invesco Aim Capital Management, Inc. and Invesco Aim Private Asset Management, Inc.; Assistant Vice President and Assistant Treasurer, The Invesco Funds and Assistant Vice President, Invesco Advisers, Inc., Invesco Aim Capital Management, Inc. and Invesco Aim Private Asset Management, Inc.; and Treasurer, PowerShares Exchange-Traded Fund Trust, PowerShares Exchange-Traded Fund Trust II, PowerShares India Exchange-Traded Fund Trust and PowerShares Actively Managed Exchange-Traded Fund Trust | N/A | N/A | ||||
Russell C. Burk — 1958 Senior Vice President and Senior Officer | 2005 | Senior Vice President and Senior Officer, The Invesco Funds | N/A | N/A | ||||
John M. Zerr — 1962 Senior Vice President, Chief Legal Officer and Secretary | 2006 | Director, Senior Vice President, Secretary and General Counsel, Invesco Management Group, Inc. (formerly known as Invesco AIM Management Group, Inc.); Senior Vice President, Invesco Advisers, Inc. (formerly known as Invesco Institutional (N.A.), Inc.) (registered investment adviser); Senior Vice President and Secretary, Invesco Distributors, Inc. (formerly known as Invesco AIM Distributors, Inc.); Director, Vice President and Secretary, Invesco Investment Services, Inc. (formerly known as Invesco AIM Investment Services, Inc.) Senior Vice President, Chief Legal Officer and Secretary, The Invesco Funds; Managing Director, Invesco PowerShares Capital Management LLC; Director, Secretary and General Counsel, Invesco Investment Advisers LLC (formerly known as Van Kampen Asset Management); Secretary and General Counsel, Invesco Capital Markets, Inc. (formerly known as Van Kampen Funds Inc.) and Chief Legal Officer, PowerShares Exchange-Traded Fund Trust, PowerShares Exchange-Traded Fund Trust II, PowerShares India Exchange-Traded Fund Trust, PowerShares Actively Managed Exchange-Traded Fund Trust, PowerShares Actively Managed Exchange-Traded Commodity Fund Trust and PowerShares Exchange-Traded Self-Indexed Fund Trust; Manager and Secretary, Invesco Indexing LLC
Formerly: Director, Secretary, General Counsel and Senior Vice President, Van Kampen Exchange Corp.; Director, Vice President and Secretary, IVZ Distributors, Inc. (formerly known as INVESCO Distributors, Inc.); Director and Vice President, INVESCO Funds Group, Inc.; Director and Vice President, Van Kampen Advisors Inc.; Director, Vice President, Secretary and General Counsel, Van Kampen Investor Services Inc.; Director, Invesco Distributors, Inc. (formerly known as Invesco AIM Distributors, Inc.); Director, Senior Vice President, General Counsel and Secretary, Invesco AIM Advisers, Inc. and Van Kampen Investments Inc.; Director, Vice President and Secretary, Fund Management Company; Director, Senior Vice President, Secretary, General Counsel and Vice President, Invesco AIM Capital Management, Inc.; Chief Operating Officer and General Counsel, Liberty Ridge Capital, Inc. (an investment adviser); Vice President and Secretary, PBHG Funds (an investment company) and PBHG Insurance Series Fund (an investment company); Chief Operating Officer, General Counsel and Secretary, Old Mutual Investment Partners (a broker-dealer); General Counsel and Secretary, Old Mutual Fund Services (an administrator) and Old Mutual Shareholder Services (a shareholder servicing center); Executive Vice President, General Counsel and Secretary, Old Mutual Capital, Inc. (an investment adviser); and Vice President and Secretary, Old Mutual Advisors Funds (an investment company) | N/A | N/A | ||||
Gregory G. McGreevey — 1962 Senior Vice President | 2012 | Senior Managing Director, Invesco Ltd.; Director, Chairman, President, and Chief Executive Officer, Invesco Advisers, Inc. (formerly known as Invesco Institutional (N.A.), Inc.) (registered investment adviser); Senior Vice President, Invesco Management Group, Inc.; Director, Invesco Mortgage Capital, Inc. and Invesco Senior Secured Management, Inc.; and Senior Vice President, The Invesco Funds
Formerly: Assistant Vice President, The Invesco Funds | N/A | N/A | ||||
Kelli Gallegos — 1970 Vice President, Principal Financial Officer and Assistant Treasurer | 2008 | Vice President, Principal Financial Officer and Assistant Treasurer, The Invesco Funds; Assistant Treasurer, Invesco PowerShares Capital Management LLC, PowerShares Exchange-Traded Fund Trust, PowerShares Exchange-Traded Fund Trust II, PowerShares India Exchange-Traded Fund Trust, PowerShares Actively Managed Exchange-Traded Fund Trust, PowerShares Actively Managed Exchange-Traded Commodity Fund Trust and PowerShares Exchange-Traded Self-Indexed Fund Trust
Formerly: Assistant Vice President, The Invesco Funds | N/A | N/A |
T-3 Invesco Quality Income Fund
Trustees and Officers—(continued)
Name, Year of Birth and Position(s) Held with the Trust | Trustee and/ or Officer Since | Principal Occupation(s) During Past 5 Years | Number of Funds in Fund Complex Overseen by Trustee | Other Directorship(s) Past 5 Years | ||||
| Other Officers—(continued) | ||||||||
Tracy Sullivan — 1962 Vice President, Chief Tax Officer and Assistant Treasurer | 2008 | Vice President, Chief Tax Officer and Assistant Treasurer, The Invesco Funds; Assistant Treasurer, Invesco PowerShares Capital Management LLC, PowerShares Exchange-Traded Fund Trust, PowerShares Exchange-Traded Fund Trust II, PowerShares India Exchange-Traded Fund Trust, PowerShares Actively Managed Exchange-Traded Fund Trust,PowerShares Actively Managed Exchange-Traded Commodity Fund Trust and PowerShares Exchange-Traded Self-Indexed Fund Trust
Formerly: Assistant Vice President, The Invesco Funds | N/A | N/A | ||||
Crissie M. Wisdom — 1969 Anti-Money Laundering Compliance Officer | 2013 | Anti-Money Laundering Compliance Officer, Invesco Advisers, Inc. (formerly known as Invesco Institutional (N.A.), Inc.) (registered investment adviser), Invesco Capital Markets, Inc. (formerly known as Van Kampen Funds Inc.), Invesco Distributors, Inc., Invesco Investment Services, Inc., Invesco Management Group, Inc., The Invesco Funds, and PowerShares Exchange-Traded Fund Trust, PowerShares Exchange-Traded Fund Trust II, PowerShares India Exchange-Traded Fund Trust, PowerShares Actively Managed Exchange-Traded Fund Trust,PowerShares Actively Managed Exchange-Traded Commodity Fund Trust and PowerShares Exchange-Traded Self-Indexed Fund Trust; Anti-Money Laundering Compliance Officer and Bank Secrecy Act Officer, INVESCO National Trust Company and Invesco Trust Company; and Fraud Prevention Manager and Controls and Risk Analysis Manager for Invesco Investment Services, Inc.
Formerly: Anti-Money Laundering Compliance Officer, Van Kampen Exchange Corp. | N/A | N/A | ||||
Robert R. Leveille — 1969 Chief Compliance Officer | 2016 | Chief Compliance Officer, Invesco Advisers, Inc. (registered investment adviser); and Chief Compliance Officer, The Invesco Funds
Formerly: Chief Compliance Officer, Putnam Investments and the Putnam Funds | N/A | N/A |
The Statement of Additional Information of the Trust includes additional information about the Fund’s Trustees and is available upon request, without charge, by calling 1.800.959.4246. Please refer to the Fund’s Statement of Additional Information for information on the Fund’s sub-advisers.
Office of the Fund 11 Greenway Plaza, Suite 1000 Houston, TX 77046-1173 | Investment Adviser Invesco Advisers, Inc. 1555 Peachtree Street, N.E. Atlanta, GA 30309 | Distributor Invesco Distributors, Inc. 11 Greenway Plaza, Suite 1000 Houston, TX 77046-1173 | Auditors PricewaterhouseCoopers LLP 1000 Louisiana Street, Suite 5800 Houston, TX 77002-5678 | |||
Counsel to the Fund Stradley Ronon Stevens & Young, LLP 2005 Market Street, Suite 2600 Philadelphia, PA 19103-7018 | Counsel to the Independent Trustees Goodwin Procter LLP 901 New York Avenue, N.W. Washington, D.C. 20001 | Transfer Agent Invesco Investment Services, Inc. 11 Greenway Plaza, Suite 1000 Houston, TX 77046-1173 | Custodian State Street Bank and Trust Company 225 Franklin Street Boston, MA 02110-2801 | |||
T-4 Invesco Quality Income Fund
Explore High-Conviction Investing with Invesco

Go paperless with eDelivery
Visit invesco.com/edelivery to enjoy the convenience and security of anytime electronic access to your investment documents.
With eDelivery, you can elect to have any or all of the following materials delivered straight to your inbox to download, save and print from your own computer:
| ∎ | Fund reports and prospectuses |
| ∎ | Quarterly statements |
| ∎ | Daily confirmations |
| ∎ | Tax forms |
Invesco mailing information
Send general correspondence to Invesco Investment Services, Inc., P.O. Box 219078, Kansas City, MO 64121-9078.
Important notice regarding delivery of security holder documents
To reduce Fund expenses, only one copy of most shareholder documents may be mailed to shareholders with multiple accounts at the same address (Householding). Mailing of your shareholder documents may be householded indefinitely unless you instruct us otherwise. If you do not want the mailing of these documents to be combined with those for other members of your household, please contact Invesco Investment Services, Inc. at 800 959 4246 or contact your financial institution. We will begin sending you individual copies for each account within 30 days after receiving your request.
Fund holdings and proxy voting information
The Fund provides a complete list of its holdings four times in each fiscal year, at the quarter ends. For the second and fourth quarters, the lists appear in the Fund’s semiannual and annual reports to shareholders. For the first and third quarters, the Fund files the lists with the Securities and Exchange Commission (SEC) on Form N-Q. The most recent list of portfolio holdings is available at invesco.com/completeqtrholdings. Shareholders can also look up the Fund’s Forms N-Q on the SEC website at sec.gov. Copies of the Fund’s Forms N-Q may be reviewed and copied at the SEC Public Reference Room in Washington, D.C. You can obtain information on the operation of the Public Reference Room, including information about duplicating fee charges, by calling 202 551 8090 or 800 732 0330, or by electronic request at the following email address: publicinfo@sec.gov.
The SEC file numbers for the Fund are shown below.
A description of the policies and procedures that the Fund uses to determine how to vote proxies relating to portfolio securities is available without charge, upon request, from our Client Services department at 800 959 4246 or at invesco.com/proxyguidelines. The information is also available on the SEC website, sec.gov.
Information regarding how the Fund voted proxies related to its portfolio securities during the most recent 12-month period ended June 30 is available at invesco.com/proxysearch. The information is also available on the SEC website, sec.gov. Invesco Advisers, Inc. is an investment adviser; it provides investment advisory services to individual and institutional clients and does not sell securities. Invesco Distributors, Inc. is the US distributor for Invesco Ltd.’s retail mutual funds, exchange-traded funds and institutional money market funds. Both are wholly owned, indirect subsidiaries of Invesco Ltd. |  | |
| SEC file numbers: 811-02699 and 002-57526 Invesco Distributors, Inc. VK-QINC-AR-1 02152018 1118 | ||||
| ||||
 | Annual Report to Shareholders
| December 31, 2017 | ||
| ||||
Invesco Small Cap Growth Fund
| ||||
| Nasdaq: | ||||
A: GTSAX ◾ B: GTSBX ◾ C: GTSDX ◾ R: GTSRX ◾ Y: GTSYX ◾ Investor: GTSIX ◾ R5: GTSVX R6: GTSFX | ||||

Letters to Shareholders
Philip Taylor | Dear Shareholders: This annual report includes information about your Fund, including performance data and a complete list of its investments as of the close of the reporting period. Inside is a discussion of how your Fund was managed and the factors that affected its performance during the reporting period. Major stock market indexes rose – and set record highs – throughout the reporting period. Generally positive economic data, strong corporate earnings and anticipated tax and regulatory reform contributed to the rally. The US economy expanded during the reporting period, with gross domestic product, the value of all goods and services produced, significantly increasing its growth rate from the first to the third quarter of the year. Tax reform legislation, enacted in December 2017, was a positive for the stock market, but its long-term economic impact was uncertain. Citing positive economic trends – specifically, realized and expected labor market conditions and inflation – the US Federal Reserve raised interest rates in March, June and |

December 2017. While US and global bond markets, as well as emerging market equities, sold off early in the reporting period, they recovered much of their losses during the reporting period. Overseas, economic data were mixed, prompting the European Central Bank and central banks in China and Japan, among other countries, to maintain extraordinarily accommodative monetary policies.
Short-term market volatility can prompt some investors to abandon their investment plans – and can cause others to settle for whatever returns the market has to offer. The investment professionals at Invesco, in contrast, invest with high conviction. This means that, no matter the asset class or the strategy, each investment team has a passion to exceed. We want to help investors achieve better outcomes, such as seeking higher returns, helping mitigate risk and generating income. Of course, investing with high conviction can’t guarantee a profit or ensure success; no investment strategy can. To learn more about how we invest with high conviction, visit invesco.com/HighConviction.
You, too, can invest with high conviction by maintaining a long-term investment perspective and by working with your financial adviser on a regular basis. During periods of short-term market volatility or uncertainty, your financial adviser can keep you focused on your long-term investment goals – a new home, a child’s college education or a secure retirement. He or she also can share research about the economy, the markets and individual investment options.
Visit our website for more information on your investments
Our website, invesco.com/us, offers a wide range of market insights and investment perspectives. On the website, you’ll find detailed information about our funds, including performance, holdings and portfolio manager commentaries. You can access information about your account by completing a simple, secure online registration. To do so, select “Log In” on the right side of the homepage, and then select “Register for Individual Account Access.”
In addition to the resources accessible on our website and through our mobile app, you can obtain timely updates to help you stay informed about the markets and the economy by connecting with Invesco on Twitter, LinkedIn or Facebook. You can access our blog at blog.invesco.us.com. Our goal is to provide you the information you want, when and where you want it.
Finally, I’m pleased to share with you Invesco’s commitment to both the Principles for Responsible Investment and to considering environmental, social and governance issues in our robust investment process. I invite you to learn more at invesco.com/esg.
Have questions?
For questions about your account, contact an Invesco client services representative at 800 959 4246. For Invesco-related questions or comments, please email me directly at phil@invesco.com.
All of us at Invesco look forward to serving your investment management needs. Thank you for investing with us.
Sincerely,

Philip Taylor
Senior Managing Director, Invesco Ltd.
| 2 | Invesco Small Cap Growth Fund |
Bruce Crockett | Dear Fellow Shareholders: Among the many important lessons I’ve learned in more than 40 years in a variety of business endeavors is the value of a trusted advocate. As independent chair of the Invesco Funds Board, I can assure you that the members of the Board are strong advocates for the interests of investors in Invesco’s mutual funds. We work hard to represent your interests through oversight of the quality of the investment management services your funds receive and other matters important to your investment, including but not limited to: | |||
∎ | Ensuring that Invesco offers a diverse lineup of mutual funds that your financial adviser can use to strive to meet your financial needs as your investment goals change over time. | |||
| ∎ | Monitoring how the portfolio management teams of the Invesco funds are performing in light of changing economic and market conditions. | |||

| ∎ | Assessing each portfolio management team’s investment performance within the context of the investment strategy described in the fund’s prospectus. |
| ∎ | Monitoring for potential conflicts of interests that may impact the nature of the services that your funds receive. |
We believe one of the most important services we provide our fund shareholders is the annual review of the funds’ advisory and sub-advisory contracts with Invesco Advisers and its affiliates. This review is required by the Investment Company Act of 1940 and focuses on the nature and quality of the services Invesco provides as the adviser to the Invesco funds and the reasonableness of the fees that it charges for those services. Each year, we spend months carefully reviewing information received from Invesco and a variety of independent sources, such as performance and fee data prepared by Lipper, Inc. (a subsidiary of Broadridge Financial Solutions, Inc.), an independent, third-party firm widely recognized as a leader in its field. We also meet with our independent legal counsel and other independent advisers to review and help us assess the information that we have received. Our goal is to assure that you receive quality investment management services for a reasonable fee.
I trust the measures outlined above provide assurance that you have a worthy advocate when it comes to choosing the Invesco Funds.
As always, please contact me at bruce@brucecrockett.com with any questions or concerns you may have. On behalf of the Board, we look forward to continuing to represent your interests and serving your needs.
Sincerely,

Bruce L. Crockett
Independent Chair
Invesco Funds Board of Trustees
| 3 | Invesco Small Cap Growth Fund |
Management’s Discussion of Fund Performance
Performance summary For the year ended December 31, 2017, Class A shares of Invesco Small Cap Growth Fund (the Fund), at net asset value (NAV), outperformed the Fund’s style-specific index, the Russell 2000 Growth Index. Your Fund’s long-term performance appears later in this report.
| Congress, a tax reform bill was signed into law in December. While its enactment further strengthened stocks, its effect on the US economy remained uncertain. Within this environment, Class A shares of the Fund, at NAV, turned in a double-digit return and outperformed the benchmark Russell 2000 Growth Index. The Fund outperformed the index in the information technology (IT), consumer discretionary, health care, industrials and real estate sectors. Conversely, the Fund underperformed the index in the energy, consumer staples, financials, telecommunication services and materials sectors. The Fund’s modest cash position in the rising market was also a detractor from relative results. On the positive side, the Fund outperformed its style-specific benchmark by the widest margin in the IT sector due to positive stock selection. Take–Two Interactive Software, an entertainment software developer, was a notable contributor to performance. The company was boosted by solid quarterly results as well as better-than-expected sales from its Grand Theft Auto game franchise. Cognex, an IT company that provides machine vision products for manufacturers, was also a contributor to Fund performance. The company benefited from broadening strength domestically and internationally in the machine vision space. Stock selection in the consumer discretionary sector also contributed to relative Fund performance. Penn National Gaming, which operates or has ownership interests in gaming and racing facilities, was a contributor to performance. The company’s stock rose on better-than-expected earnings driven by more favorable-than-expected visitation and spending patterns. Panera Bread was acquired during the reporting period for | |||||||||
| Fund vs. Indexes | ||||||||||
Total returns, 12/31/16 to 12/31/17, at net asset value (NAV). Performance shown does not include applicable contingent deferred sales charges (CDSC) or front-end sales charges, which would have reduced performance.
| ||||||||||
Class A Shares | 24.91% | |||||||||
Class B Shares | 24.02 | |||||||||
Class C Shares | 23.99 | |||||||||
Class R Shares | 24.60 | |||||||||
Class Y Shares | 25.25 | |||||||||
Investor Class Shares | 24.94 | |||||||||
Class R5 Shares | 25.41 | |||||||||
Class R6 Shares | 25.49 | |||||||||
S&P 500 Indexq (Broad Market Index) | 21.83 | |||||||||
Russell 2000 Growth Indexq (Style-Specific Index) | 22.17 | |||||||||
Lipper Small-Cap Growth Funds Index∎ (Peer Group Index) | 24.77 | |||||||||
Source(s): qFactSet Research Systems Inc.; ∎Lipper Inc.
| ||||||||||
Market conditions and your Fund Despite highly destructive hurricanes that threatened to derail a years-long economic recovery, the US economy continued to expand throughout the year ended December 31, 2017. Gross domestic product – the value of all goods and services produced in the US – expanded in the first three quarters of 2017. Inflation remained subdued even as unemployment continued its multiyear decline. Given signs of an improving economy, the US Federal Reserve (the Fed) raised interest rates three times during the reporting period, most recently in December 2017; each rate hike was 25 basis points.1 (A basis point is 0.01%.) The Fed pledged that “realized and expected economic conditions relative to its objectives of maximum employment and 2 percent inflation” will guide its future actions. At the close of the |
reporting period, Fed policy remained accommodative, and the fed funds target rate stood at a range of 1.25% to 1.50% – 75 basis points higher than at the start of the reporting period.1 Higher inventories and a worsening outlook caused oil prices and many energy stocks to decline during the first half of 2017. However, oil prices rose significantly in the second half of the reporting period as expectations for lower supplies increased, partly due to continued OPEC production cuts, and demand began normalizing. Major US stock market indexes repeatedly hit all-time highs throughout the reporting period. The stock market rally that began after the 2016 presidential election continued throughout the reporting period, fueled by generally positive economic data, strong corporate earnings and improved consumer confidence. Finally, after much debate in | |||||||||
| Portfolio Composition | ||||
| By sector | % of total net assets | |||
Information Technology | 28.0% | |||
| Health Care | 23.0 | |||
| Industrials | 15.9 | |||
| Consumer Discretionary | 12.6 | |||
| Financials | 9.5 | |||
| Materials | 3.9 | |||
| Energy | 3.7 | |||
| Consumer Staples | 1.2 | |||
| Real Estate | 1.1 | |||
| Telecommunication Services | 0.7 | |||
| Money Market Funds | ||||
| Plus Other Assets Less Liabilities | 0.4 | |||
Top 10 Equity Holdings* | ||||||
| % of total net assets | ||||||
1. | Take-Two Interactive Software, Inc. | 1.9% | ||||
2. | Cognex Corp. | 1.3 | ||||
3. | Exelixis, Inc. | 1.3 | ||||
4. | Knight-Swift Transportation Holdings Inc. | 1.3 | ||||
5. | Halozyme Therapeutics, Inc. | 1.2 | ||||
6. | Penn National Gaming, Inc. | 1.2 | ||||
7. | CoStar Group Inc. | 1.2 | ||||
8. | Aspen Technology, Inc. | 1.1 | ||||
9. | Martin Marietta Materials, Inc. | 1.1 | ||||
10. | Fair Isaac Corp. | 1.1 | ||||
Total Net Assets | $ | 2.8 billion | ||||
Total Number of Holdings | 122 | |||||
The Fund’s holdings are subject to change, and there is no assurance that the Fund will continue to hold any particular security.
*Excluding money market fund holdings.
Data presented here are as of December 31, 2017.
| 4 | Invesco Small Cap Growth Fund |
a premium and contributed to performance as well.
Stock selection in the health care sector benefited relative Fund performance as well. Nektar Therapeutics, a biopharmaceutical company based in San Fran-cisco, was a leading contributor to Fund performance. During the first quarter of the year, the stock was boosted by better-than-expected phase 3 clinical trial results for a new opioid painkiller designed to relieve pain without leading to abuse and addiction. The stock rallied again in the fourth quarter after receiving favorable feedback from the Food and Drug Administration regarding the drug. Another notable contributor in the sector was Align Technology, a leading designer and manufacturer of 3-D scanners and clear aligners for orthodontics. The company benefited from strong revenue growth and pricing power among competitors during the year.
In contrast, overweight exposure to the energy sector was a detractor from relative Fund performance. The energy sector was the worst-performing sector in the style-specific index during the reporting period, as crude prices declined due to concerns over increasing US energy supplies and fears that the OPEC cuts enacted in November 2016 would not be continued after June 2017. Despite OPEC members eventually agreeing to extend the cuts in May and a sharp rally in the fourth quarter, the sector still has yet to fully recover. The Fund’s holdings were not immune to the decline; Laredo Petroleum, Parsley Energy and Patterson-UTI Energy were the leading detractors within the sector.
Fund holdings in the consumer staples sector also detracted from relative performance. The consumer staples sector was the second-worst performing sector in the index during the year due to extended valuations and an intense competitive dynamic between food manufacturers and retailers. Lancaster Colony, a specialty food manufacturer, was a notable detractor from Fund performance within the sector. The stock pulled back early in the year after posting a strong gain in the second half of 2016. The company’s core business continued to perform in-line with expectations and at the close of the reporting period we still owned the stock. B&G Foods, a food distributor primarily for pickles and condiments, also detracted from Fund performance for the reporting period. The company’s organic growth declined
during the year due to weak traffic at traditional grocery stores and competitive pressures. We sold the stock in the third quarter.
Overweight exposure to and stock selection in the financials sector also dampened relative Fund results. Although the Fund had an overweight allocation to the sector, underweight exposure to the mortgage finance and consumer finance industries detracted from relative performance. Financial Engines, an asset manager, was a leading detractor from performance in the sector due to disappointing inflows after the loss of a key client and investor concerns around pricing.
All changes to positioning are based on our bottom-up stock selection process. Our portfolio construction process acts as a risk control to help ensure the portfolio is aligned with small-cap market sector exposure within modest over- and underweight allocations. Our long-term investment horizon leads to relatively low turnover. We believe the traditional business cycle recovery has not fully materialized, as evidenced by several years of mixed results, depending on which sector we evaluate. However, it is possible this is just a very slow normalization, and there is some evidence we may yet see a more classic recovery and a reacceleration in growth. Due to the uncertain economic outlook, we continue to balance the portfolio with a mix of long-term secular growth opportunities and cyclical growth opportunities that have strong valuation support.
Thank you for your commitment to Invesco Small Cap Growth Fund and for sharing our long-term investment horizon.
1 Source: US Federal Reserve
The views and opinions expressed in management’s discussion of Fund performance are those of Invesco Advisers, Inc. These views and opinions are subject to change at any time based on factors such as market and economic conditions. These views and opinions may not be relied upon as investment advice or recommendations, or as an offer for a particular security. The information is not a complete analysis of every aspect of any market, country, industry, security or the Fund. Statements of fact are from sources considered reliable, but Invesco Advisers, Inc. makes no representation or warranty as to their completeness or accuracy. Although historical performance is no guarantee of future results, these insights may help you understand our investment management philosophy.
See important Fund and, if applicable, index disclosures later in this report.
| Juan Hartsfield Chartered Financial Analyst, Portfolio Manager, is lead manager of Invesco Small Cap Growth |

Fund. He joined Invesco in 2004. Mr. Hartsfield earned a BS in petroleum engineering from The University of Texas at Austin and an MBA from the University of Michigan.
| Clay Manley Chartered Financial Analyst, Portfolio Manager, is manager of Invesco Small Cap Growth Fund. He |

joined Invesco in 2001. Mr. Manley earned a BA with cum laude honors in history and geology from Vanderbilt University and an MBA with concentrations in finance and accounting from the Goizueta Business School at Emory University.
| 5 | Invesco Small Cap Growth Fund |
Your Fund’s Long-Term Performance
Results of a $10,000 Investment – Oldest Share Class(es)
Fund and index data from 12/31/07
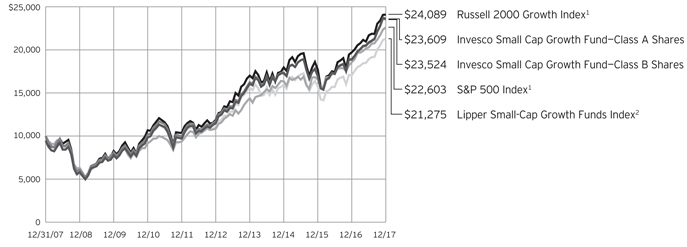
1 Source: FactSet Research Systems Inc.
2 Source: Lipper Inc.
Past performance cannot guarantee comparable future results.
The data shown in the chart include reinvested distributions, applicable sales charges and Fund expenses including management fees. Results for Class B shares are calculated as if a hypothetical
shareholder had liquidated his entire investment in the Fund at the close of the reporting period and paid the contingent deferred sales charges, if applicable. Index results include reinvested dividends, but they do not reflect sales charges. Performance of the peer group,
if applicable, reflects fund expenses and management fees; performance of a market index does not. Performance shown in the chart and table(s) does not reflect deduction of taxes a shareholder would pay on Fund distributions or sale of Fund shares.
| 6 | Invesco Small Cap Growth Fund |
Average Annual Total Returns As of 12/31/17, including maximum applicable sales charges |
| |||
Class A Shares | ||||
Inception (10/18/95) | 10.70 | % | ||
10 Years | 8.97 | |||
5 Years | 14.20 | |||
1 Year | 18.04 | |||
Class B Shares | ||||
Inception (10/18/95) | 10.70 | % | ||
10 Years | 8.93 | |||
5 Years | 14.42 | |||
1 Year | 19.02 | |||
Class C Shares | ||||
Inception (5/3/99) | 8.47 | % | ||
10 Years | 8.77 | |||
5 Years | 14.65 | |||
1 Year | 22.99 | |||
Class R Shares | ||||
Inception (6/3/02) | 9.34 | % | ||
10 Years | 9.31 | |||
5 Years | 15.21 | |||
1 Year | 24.60 | |||
Class Y Shares | ||||
10 Years | 9.84 | % | ||
5 Years | 15.79 | |||
1 Year | 25.25 | |||
Investor Class Shares | ||||
Inception (4/7/06) | 9.39 | % | ||
10 Years | 9.59 | |||
5 Years | 15.51 | |||
1 Year | 24.94 | |||
Class R5 Shares | ||||
Inception (3/15/02) | 9.37 | % | ||
10 Years | 10.04 | |||
5 Years | 15.96 | |||
1 Year | 25.41 | |||
Class R6 Shares | ||||
10 Years | 9.86 | % | ||
5 Years | 16.05 | |||
1 Year | 25.49 | |||
Class Y shares incepted on October 3, 2008. Performance shown prior to that date is that of Class A shares and includes the 12b-1 fees applicable to Class A shares.
Class R6 shares incepted on September 24, 2012. Performance shown prior to that date is that of Class A shares and includes the 12b-1 fees applicable to Class A shares.
The performance data quoted represent past performance and cannot guarantee comparable future results; current performance may be lower or higher. Please visit invesco.com/performance for the most recent month-end performance. Performance figures reflect reinvested distributions, changes in net asset value and the effect of the maximum sales charge unless otherwise stated. Investment return and principal value will fluctuate so that you may have a gain or loss when you sell shares.
The total annual Fund operating expense ratio set forth in the most recent Fund prospectus as of the date of this report for Class A, Class B, Class C, Class R, Class Y, Investor Class, Class R5 and Class R6 shares was 1.23%, 1.98%, 1.98%, 1.48%, 0.98%, 1.23%, 0.84% and 0.74%, respectively. The expense ratios presented above may vary from the expense ratios presented in other sections of this report that are based on expenses incurred during the period covered by this report.
Class A share performance reflects the maximum 5.50% sales charge, and Class B and Class C share performance reflects the applicable contingent deferred sales charge (CDSC) for the period involved. The CDSC on Class B shares declines from 5% beginning at the time of purchase to 0% at the beginning of the seventh year. The CDSC on Class C shares is 1% for the first year after purchase. Class R, Class Y, Investor Class, Class R5 and Class R6 shares do not have a front-end sales charge or a CDSC; therefore, performance is at net asset value.
The performance of the Fund’s share classes will differ primarily due to different sales charge structures and class expenses.
Fund performance reflects any applicable fee waivers and/or expense reimbursements. Had the adviser not waived fees and/or reimbursed expenses currently or in the past, returns would have been lower. See current prospectus for more information.
| 7 | Invesco Small Cap Growth Fund |
Invesco Small Cap Growth Fund’s investment objective is long-term growth of capital.
| ∎ | Unless otherwise stated, information presented in this report is as of December 31, 2017, and is based on total net assets. |
| ∎ | Unless otherwise noted, all data provided by Invesco. |
| ∎ | To access your Fund’s reports/prospectus, visit invesco.com/fundreports. |
About share classes
| ∎ | Effective January 26, 2018, after the close of the reporting period, all outstanding Class B shares were converted to Class A shares, in advance of their normally scheduled conversion. No CDSC was paid in connection with this early conversion. |
| ∎ | Class R shares are generally available only to employer sponsored retirement and benefit plans. Please see the prospectus for more information. |
| ∎ | Class Y shares and Investor Class shares are available only to certain investors. Please see the prospectus for more information. |
| ∎ | Class R5 shares and Class R6 shares are available for use by retirement plans that meet certain standards and for institutional investors. Class R6 shares are also available through intermediaries that have established an agreement with Invesco Distributors, Inc. to make such shares available for use in retail omnibus accounts. Please see the prospectus for more information. |
Principal risks of investing in the Fund
| ∎ | Foreign securities risk. The Fund’s foreign investments may be adversely affected by political and social instability, changes in economic or taxation policies, difficulty in enforcing obligations, decreased liquidity or increased volatility. Foreign investments also involve the risk of the possible seizure, nationalization or expropriation of the issuer or foreign deposits (in which the Fund could lose its entire investments in a certain market) and the possible adoption of foreign governmental restrictions such as exchange controls. Unless the Fund has hedged its foreign securities risk, foreign securities risk also involves the risk of negative foreign currency rate fluctuations, which may cause the value of securities denominated in such foreign currency (or other instruments through which the Fund has exposure to foreign currencies) to decline in value. Currency exchange rates may fluctuate significantly over short periods of time. Currency |
hedging strategies, if used, are not always successful. |
| ∎ | Growth investing risk. Growth stocks tend to be more expensive relative to the issuing company’s earnings or assets compared with other types of stock. As a result, they tend to be more sensitive to changes in, or investors’ expectations of, the issuing company’s earnings and can be more volatile. |
| ∎ | Management risk. The Fund is actively managed and depends heavily on the Adviser’s judgment about markets, interest rates or the attractiveness, relative values, liquidity, or potential appreciation of particular investments made for the Fund’s portfolio. The Fund could experience losses if these judgments prove to be incorrect. Additionally, legislative, regulatory, or tax developments may adversely affect management of the Fund and, therefore, the ability of the Fund to achieve its investment objective. |
| ∎ | Market risk. The market values of the Fund’s investments, and therefore the value of the Fund’s shares, will go up and down, sometimes rapidly or unpredictably. Market risk may affect a single issuer, industry or section of the economy, or it may affect the market as a whole. Individual stock prices tend to go up and down more dramatically than those of certain other types of investments, such as bonds. During a general downturn in the financial markets, multiple asset classes may decline in value. When markets perform well, there can be no assurance that specific investments held by the Fund will rise in value. |
| ∎ | Sector focus risk. The Fund may from time to time invest a significant amount of its assets (i.e. over 25%) in one market sector or group of related industries. In this event, the Fund’s performance will depend to a greater extent on the overall condition of the sector or group of industries and there is increased risk that the Fund will lose significant value if conditions adversely affect that sector or group of industries. |
| ∎ | Small- and mid-capitalization companies risks. Small- and mid-capitalization companies tend to be more vulnerable to changing market conditions, may |
This report must be accompanied or preceded by a currently effective Fund prospectus, which contains more complete information, including sales charges and expenses. Investors should read it carefully before investing. |
| NOT FDIC INSURED | MAY LOSE VALUE | NO BANK GUARANTEE |
| have little or no operating history or track record of success, and may have more limited product lines and markets, less experienced management and fewer financial resources than larger companies. These companies’ securities may be more volatile and less liquid than those of more established companies, and their returns may vary, sometimes significantly, from the overall securities market. |
About indexes used in this report
| ∎ | The S&P 500® Index is an unmanaged index considered representative of the US stock market. |
| ∎ | The Russell 2000® Growth Index is an unmanaged index considered representative of small-cap growth stocks. The Russell 2000 Growth Index is a trademark/service mark of the Frank Russell Co. Russell® is a trademark of the Frank Russell Co. |
| ∎ | The Lipper Small-Cap Growth Funds Index is an unmanaged index considered representative of small-cap growth funds tracked by Lipper. |
| ∎ | The Fund is not managed to track the performance of any particular index, including the index(es) described here, and consequently, the performance of the Fund may deviate significantly from the performance of the index(es). |
| ∎ | A direct investment cannot be made in an index. Unless otherwise indicated, index results include reinvested dividends, and they do not reflect sales charges. Performance of the peer group, if applicable, reflects fund expenses; performance of a market index does not. |
Other information
| ∎ | The returns shown in management’s discussion of Fund performance are based on net asset values (NAVs) calculated for shareholder transactions. Generally accepted accounting principles require adjustments to be made to the net assets of the Fund at period end for financial reporting purposes, and as such, the NAVs for shareholder transactions and the returns based on those NAVs may differ from the NAVs and returns reported in the Financial Highlights. |
| ∎ | Industry classifications used in this report are generally according to the Global Industry Classification Standard, which was developed by and is the exclusive property and a service mark of MSCI Inc. and Standard & Poor’s. |
| 8 | Invesco Small Cap Growth Fund |
Schedule of Investments(a)
December 31, 2017
| Shares | Value | |||||||
Common Stocks & Other Equity Interests–99.61% |
| |||||||
| Aerospace & Defense–1.74% | ||||||||
BWX Technologies, Inc. | 449,130 | $ | 27,167,874 | |||||
TransDigm Group, Inc. | 79,558 | 21,848,218 | ||||||
| 49,016,092 | ||||||||
| Alternative Carriers–0.75% | ||||||||
Cogent Communications Holdings, Inc. | 463,938 | 21,016,391 | ||||||
| Apparel Retail–0.61% | ||||||||
Urban Outfitters, Inc.(b) | 487,028 | 17,075,202 | ||||||
| Apparel, Accessories & Luxury Goods–1.41% | ||||||||
Carter’s, Inc. | 185,142 | 21,752,333 | ||||||
G-III Apparel Group, Ltd.(b) | 483,175 | 17,824,326 | ||||||
| 39,576,659 | ||||||||
| Application Software–5.76% | ||||||||
Aspen Technology, Inc.(b) | 481,348 | 31,865,238 | ||||||
Fair Isaac Corp. | 205,360 | 31,461,152 | ||||||
Guidewire Software Inc.(b) | 388,598 | 28,857,287 | ||||||
Pegasystems Inc. | 336,411 | 15,861,779 | ||||||
RealPage, Inc.(b) | 587,260 | 26,015,618 | ||||||
Ultimate Software Group, Inc. (The)(b) | 129,076 | 28,168,255 | ||||||
| 162,229,329 | ||||||||
| Asset Management & Custody Banks–0.93% | ||||||||
Financial Engines, Inc. | 447,870 | 13,570,461 | ||||||
WisdomTree Investments, Inc. | 1,013,304 | 12,716,965 | ||||||
| 26,287,426 | ||||||||
| Auto Parts & Equipment–0.78% | ||||||||
Visteon Corp.(b) | 175,930 | 22,015,880 | ||||||
| Biotechnology–7.16% | ||||||||
ACADIA Pharmaceuticals Inc.(b) | 661,118 | 19,906,263 | ||||||
Adamas Pharmaceuticals, Inc.(b)(c) | 760,429 | 25,770,939 | ||||||
Agios Pharmaceuticals, Inc.(b) | �� | 375,557 | 21,470,594 | |||||
Exelixis, Inc.(b) | 1,182,037 | 35,933,925 | ||||||
Halozyme Therapeutics, Inc.(b) | 1,691,781 | 34,275,483 | ||||||
Momenta Pharmaceuticals, Inc.(b) | 1,121,681 | 15,647,450 | ||||||
Neurocrine Biosciences, Inc.(b) | 405,390 | 31,454,210 | ||||||
Repligen Corp.(b) | 468,477 | 16,996,345 | ||||||
| 201,455,209 | ||||||||
| Brewers–0.54% | ||||||||
Boston Beer Co., Inc. (The)–Class A(b) | 78,812 | 15,060,973 | ||||||
| Building Products–1.69% | ||||||||
A.O. Smith Corp. | 445,460 | 27,297,789 | ||||||
Masonite International Corp.(b) | 274,955 | 20,387,913 | ||||||
| 47,685,702 | ||||||||
| Casinos & Gaming–1.21% | ||||||||
Penn National Gaming, Inc.(b) | 1,090,965 | 34,179,933 | ||||||
| Shares | Value | |||||||
| Construction Machinery & Heavy Trucks–1.51% | ||||||||
WABCO Holdings Inc.(b) | 153,782 | $ | 22,067,717 | |||||
Wabtec Corp.(c) | 249,208 | 20,293,007 | ||||||
| 42,360,724 | ||||||||
| Construction Materials–1.12% | ||||||||
Martin Marietta Materials, Inc. | 142,990 | 31,606,510 | ||||||
| Data Processing & Outsourced Services–1.63% | ||||||||
Euronet Worldwide, Inc.(b) | 295,551 | 24,906,083 | ||||||
ExlService Holdings, Inc.(b) | 349,533 | 21,094,316 | ||||||
| 46,000,399 | ||||||||
| Distributors–0.96% | ||||||||
Pool Corp. | 208,888 | 27,082,329 | ||||||
| Electrical Components & Equipment–0.74% | ||||||||
Acuity Brands, Inc. | 118,110 | 20,787,360 | ||||||
| Electronic Components–1.80% | ||||||||
II-VI Inc.(b) | 486,280 | 22,830,846 | ||||||
Littelfuse, Inc. | 140,044 | 27,703,504 | ||||||
| 50,534,350 | ||||||||
| Electronic Equipment & Instruments–3.85% | ||||||||
Cognex Corp. | 591,042 | 36,148,129 | ||||||
National Instruments Corp. | 488,544 | 20,338,087 | ||||||
Trimble Inc.(b) | 610,042 | 24,792,107 | ||||||
Zebra Technologies Corp.–Class A(b) | 260,298 | 27,018,932 | ||||||
| 108,297,255 | ||||||||
| Financial Exchanges & Data–0.88% | ||||||||
MarketAxess Holdings, Inc. | 123,113 | 24,838,048 | ||||||
| Footwear–0.88% | ||||||||
Steven Madden, Ltd.(b) | 529,854 | 24,744,182 | ||||||
| Health Care Equipment–4.09% | ||||||||
Cantel Medical Corp. | 245,987 | 25,304,683 | ||||||
DexCom Inc.(b) | 253,789 | 14,564,951 | ||||||
Hill-Rom Holdings, Inc. | 262,418 | 22,119,213 | ||||||
Integra LifeSciences Holdings Corp.(b) | 416,019 | 19,910,669 | ||||||
Nevro Corp.(b) | 210,931 | 14,562,676 | ||||||
NxStage Medical, Inc.(b) | 768,276 | 18,615,328 | ||||||
| 115,077,520 | ||||||||
| Health Care Facilities–1.53% | ||||||||
HealthSouth Corp. | 425,500 | 21,023,955 | ||||||
Select Medical Holdings Corp.(b) | 1,240,690 | 21,898,179 | ||||||
| 42,922,134 | ||||||||
| Health Care Services–0.87% | ||||||||
Chemed Corp. | 100,401 | 24,399,451 | ||||||
| Health Care Supplies–2.34% | ||||||||
Align Technology, Inc.(b) | 83,204 | 18,487,097 | ||||||
See accompanying Notes to Financial Statements which are an integral part of the financial statements.
9 Invesco Small Cap Growth Fund
| Shares | Value | |||||||
| Health Care Supplies–(continued) | ||||||||
Halyard Health, Inc.(b) | 518,075 | $ | 23,924,703 | |||||
ICU Medical, Inc.(b) | 108,254 | 23,382,864 | ||||||
| 65,794,664 | ||||||||
| Health Care Technology–0.59% | ||||||||
Medidata Solutions, Inc.(b) | 263,606 | 16,704,712 | ||||||
| Home Entertainment Software–1.94% | ||||||||
Take-Two Interactive Software, Inc.(b) | 496,454 | 54,500,720 | ||||||
| Homebuilding–0.83% | ||||||||
CalAtlantic Group, Inc. | 412,025 | 23,234,090 | ||||||
| Industrial Machinery–4.21% | ||||||||
ITT Inc. | 488,639 | 26,078,663 | ||||||
John Bean Technologies Corp. | 250,092 | 27,710,194 | ||||||
Kennametal Inc. | 479,749 | 23,224,649 | ||||||
Lincoln Electric Holdings, Inc. | 225,335 | 20,636,179 | ||||||
Timken Co. (The) | 423,800 | 20,829,770 | ||||||
| 118,479,455 | ||||||||
| Internet Software & Services–3.52% | ||||||||
2U, Inc.(b) | 339,684 | 21,913,015 | ||||||
CoStar Group Inc.(b) | 114,353 | 33,957,124 | ||||||
LogMeIn, Inc. | 181,072 | 20,732,744 | ||||||
Q2 Holdings, Inc.(b) | 607,671 | 22,392,676 | ||||||
| 98,995,559 | ||||||||
| Investment Banking & Brokerage–0.75% | ||||||||
Evercore Inc.–Class A | 235,100 | 21,159,000 | ||||||
| IT Consulting & Other Services–1.74% | ||||||||
Booz Allen Hamilton Holding Corp. | 629,201 | 23,991,434 | ||||||
EPAM Systems, Inc.(b) | 231,178 | 24,835,453 | ||||||
| 48,826,887 | ||||||||
| Leisure Facilities–0.82% | ||||||||
Six Flags Entertainment Corp. | 346,784 | 23,085,411 | ||||||
| Leisure Products–0.73% | ||||||||
Brunswick Corp. | 370,158 | 20,440,125 | ||||||
| Life & Health Insurance–0.82% | ||||||||
American Equity Investment Life Holding Co. | 750,940 | 23,076,386 | ||||||
| Life Sciences Tools & Services–2.05% | ||||||||
Bio-Techne Corp. | 192,570 | 24,947,444 | ||||||
Pacific Biosciences of California Inc.(b)(c) | 1,879,430 | 4,961,695 | ||||||
PerkinElmer, Inc. | 379,823 | 27,772,658 | ||||||
| 57,681,797 | ||||||||
| Managed Health Care–1.08% | ||||||||
HealthEquity, Inc.(b) | 651,282 | 30,388,818 | ||||||
| Metal & Glass Containers–1.08% | ||||||||
Berry Global Group, Inc.(b) | 517,790 | 30,378,739 | ||||||
| Shares | Value | |||||||
| Movies & Entertainment–0.40% | ||||||||
IMAX Corp.(b) | 492,223 | $ | 11,394,962 | |||||
| Multi-Line Insurance–0.85% | ||||||||
American Financial Group, Inc. | 219,808 | 23,857,960 | ||||||
| Office REIT’s–0.55% | ||||||||
Highwoods Properties, Inc. | 303,091 | 15,430,363 | ||||||
| Office Services & Supplies–0.36% | ||||||||
Pitney Bowes Inc. | 901,704 | 10,081,051 | ||||||
| Oil & Gas Drilling–0.73% | ||||||||
Patterson-UTI Energy, Inc. | 897,504 | 20,651,567 | ||||||
| Oil & Gas Exploration & Production–2.92% | ||||||||
Centennial Resource Development, Inc.–Class A(b)(c) | 1,187,595 | 23,514,381 | ||||||
Energen Corp.(b) | 417,858 | 24,056,085 | ||||||
Laredo Petroleum, Inc.(b) | 1,264,270 | 13,413,905 | ||||||
Parsley Energy, Inc.–Class A(b) | 719,614 | 21,185,436 | ||||||
| 82,169,807 | ||||||||
| Packaged Foods & Meats–0.71% | ||||||||
Lancaster Colony Corp. | 153,734 | 19,863,970 | ||||||
| Pharmaceuticals–3.29% | ||||||||
Aerie Pharmaceuticals, Inc.(b) | 118,641 | 7,088,800 | ||||||
Catalent, Inc.(b) | 506,969 | 20,826,286 | ||||||
GW Pharmaceuticals PLC–ADR (United Kingdom)(b)(c) | 160,371 | 21,170,576 | ||||||
Nektar Therapeutics(b) | 496,763 | 29,666,686 | ||||||
Prestige Brands Holdings, Inc.(b) | 309,709 | 13,754,177 | ||||||
| 92,506,525 | ||||||||
| Property & Casualty Insurance–1.32% | ||||||||
Hanover Insurance Group Inc. (The) | 205,892 | 22,252,807 | ||||||
RLI Corp. | 247,834 | 15,033,611 | ||||||
| 37,286,418 | ||||||||
| Regional Banks–3.89% | ||||||||
BankUnited, Inc. | 475,801 | 19,374,617 | ||||||
Cathay General Bancorp | 587,697 | 24,783,182 | ||||||
Cullen/Frost Bankers, Inc. | 249,948 | 23,657,578 | ||||||
MB Financial, Inc. | 495,055 | 22,039,849 | ||||||
Sterling Bancorp | 801,667 | 19,721,008 | ||||||
| 109,576,234 | ||||||||
| Restaurants–3.08% | ||||||||
Dunkin’ Brands Group, Inc. | 365,391 | 23,556,758 | ||||||
Jack in the Box Inc. | 188,015 | 18,446,152 | ||||||
Texas Roadhouse, Inc. | 446,923 | 23,543,904 | ||||||
Wendy’s Co. (The) | 1,294,044 | 21,248,202 | ||||||
| 86,795,016 | ||||||||
| Security & Alarm Services–1.01% | ||||||||
Brink’s Co. (The) | 360,576 | 28,377,331 | ||||||
See accompanying Notes to Financial Statements which are an integral part of the financial statements.
10 Invesco Small Cap Growth Fund
| Shares | Value | |||||||
| Semiconductor Equipment–0.92% | ||||||||
MKS Instruments, Inc. | 274,982 | $ | 25,985,799 | |||||
| Semiconductors–4.26% | ||||||||
Cavium Inc.(b) | 302,758 | 25,380,203 | ||||||
Integrated Device Technology, Inc.(b) | 750,914 | 22,324,673 | ||||||
Monolithic Power Systems, Inc. | 194,888 | 21,897,616 | ||||||
Power Integrations, Inc. | 255,431 | 18,786,950 | ||||||
Silicon Laboratories Inc.(b) | 355,254 | 31,368,928 | ||||||
| 119,758,370 | ||||||||
| Specialized REIT’s–0.59% | ||||||||
CubeSmart | 575,024 | 16,629,694 | ||||||
| Specialty Chemicals–1.73% | ||||||||
Ingevity Corp.(b) | 333,451 | 23,498,292 | ||||||
PolyOne Corp. | 576,259 | 25,067,267 | ||||||
| 48,565,559 | ||||||||
| Specialty Stores–0.91% | ||||||||
Five Below, Inc.(b) | 387,743 | 25,715,116 | ||||||
| Systems Software–2.54% | ||||||||
CommVault Systems, Inc.(b) | 433,012 | 22,733,130 | ||||||
Proofpoint, Inc.(b) | 236,212 | 20,977,988 | ||||||
Qualys, Inc.(b) | 469,567 | 27,868,801 | ||||||
| 71,579,919 | ||||||||
| Trading Companies & Distributors–1.48% | ||||||||
Univar Inc.(b) | 690,217 | 21,369,118 | ||||||
Watsco, Inc. | 119,364 | 20,296,655 | ||||||
| 41,665,773 | ||||||||
| Shares | Value | |||||||
| Trucking–3.13% | ||||||||
Knight-Swift Transportation Holdings Inc. | 805,921 | $ | 35,234,866 | |||||
Landstar System, Inc. | 207,677 | 21,619,176 | ||||||
Old Dominion Freight Line, Inc. | 238,393 | 31,360,599 | ||||||
| 88,214,641 | ||||||||
Total Common Stocks & Other Equity Interests |
| 2,803,101,496 | ||||||
Money Market Funds–1.59% |
| |||||||
Invesco Government & Agency Portfolio– Institutional Class, | 13,775,898 | 13,775,898 | ||||||
Invesco Liquid Assets | 12,818,325 | 12,819,607 | ||||||
Invesco Treasury Portfolio–Institutional Class, 1.17%(d) | 18,001,042 | 18,001,042 | ||||||
Total Money Market Funds |
| 44,596,547 | ||||||
TOTAL INVESTMENTS IN SECURITIES (excluding investments purchased with cash collateral from securities on loan)–101.20% |
| 2,847,698,043 | ||||||
Investments Purchased with Cash Collateral from Securities on Loan |
| |||||||
Money Market Funds–1.52% |
| |||||||
Invesco Government & Agency Portfolio–Institutional Class, 1.18% | 42,849,449 | 42,849,449 | ||||||
TOTAL INVESTMENTS IN SECURITIES–102.72% |
| 2,890,547,492 | ||||||
OTHER ASSETS LESS LIABILITIES–(2.72)% |
| (76,528,287 | ) | |||||
NET ASSETS–100.00% |
| $ | 2,814,019,205 | |||||
Investment Abbreviations:
| ADR | – American Depositary Receipt | |
| REIT | – Real Estate Investment Trust |
Notes to Schedule of Investments:
| (a) | Industry and/or sector classifications used in this report are generally according to the Global Industry Classification Standard, which was developed by and is the exclusive property and a service mark of MSCI Inc. and Standard & Poor’s. |
| (b) | Non-income producing security. |
| (c) | All or a portion of this security was out on loan at December 31, 2017. |
| (d) | The money market fund and the Fund are affiliated by having the same investment adviser. The rate shown is the 7-day SEC standardized yield as of December 31, 2017. |
| (e) | The security has been segregated to satisfy the commitment to return the cash collateral received in securities lending transactions upon the borrower’s return of the securities loaned. See Note 1I. |
See accompanying Notes to Financial Statements which are an integral part of the financial statements.
11 Invesco Small Cap Growth Fund
Statement of Assets and Liabilities
December 31, 2017
Assets: | ||||
Investments in securities, at value | $ | 2,803,101,496 | ||
Investments in affiliated money market funds, at value (Cost $87,446,148) | 87,445,996 | |||
Receivable for: | ||||
Fund shares sold | 5,317,463 | |||
Dividends | 602,439 | |||
Investment for trustee deferred compensation and retirement plans | 360,371 | |||
Other assets | 40,768 | |||
Total assets | 2,896,868,533 | |||
Liabilities: | ||||
Payable for: | ||||
Investments purchased | 3,039,648 | |||
Collateral upon return of securities loaned | 42,849,449 | |||
Fund shares reacquired | 35,122,186 | |||
Accrued fees to affiliates | 1,277,800 | |||
Accrued trustees’ and officers’ fees and benefits | 1,495 | |||
Accrued other operating expenses | 150,188 | |||
Trustee deferred compensation and retirement plans | 408,562 | |||
Total liabilities | 82,849,328 | |||
Net assets applicable to shares outstanding | $ | 2,814,019,205 | ||
Net assets consist of: | ||||
Shares of beneficial interest | $ | 1,819,687,569 | ||
Undistributed net investment income (loss) | (360,807 | ) | ||
Undistributed net realized gain | 25,063,823 | |||
Net unrealized appreciation | 969,628,620 | |||
| $ | 2,814,019,205 | |||
Net Assets: | ||||
Class A | $ | 617,955,184 | ||
Class B | $ | 701,692 | ||
Class C | $ | 14,501,890 | ||
Class R | $ | 135,750,620 | ||
Class Y | $ | 208,232,803 | ||
Investor Class | $ | 241,103,515 | ||
Class R5 | $ | 1,292,036,230 | ||
Class R6 | $ | 303,737,271 | ||
Shares outstanding, no par value, |
| |||
Class A | 16,563,556 | |||
Class B | 27,632 | |||
Class C | 572,618 | |||
Class R | 3,925,800 | |||
Class Y | 5,417,955 | |||
Investor Class | 6,148,383 | |||
Class R5 | 30,749,279 | |||
Class R6 | 7,197,278 | |||
Class A: | ||||
Net asset value per share | $ | 37.31 | ||
Maximum offering price per share | ||||
(Net asset value of $37.31 ¸ 94.50%) | $ | 39.48 | ||
Class B: | ||||
Net asset value and offering price per share | $ | 25.39 | ||
Class C: | ||||
Net asset value and offering price per share | $ | 25.33 | ||
Class R: | ||||
Net asset value and offering price per share | $ | 34.58 | ||
Class Y: | ||||
Net asset value and offering price per share | $ | 38.43 | ||
Investor Class: | ||||
Net asset value and offering price per share | $ | 39.21 | ||
Class R5: | ||||
Net asset value and offering price per share | $ | 42.02 | ||
Class R6: | ||||
Net asset value and offering price per share | $ | 42.20 | ||
| * | At December 31, 2017, securities with an aggregate value of $40,799,722 were on loan to brokers. |
See accompanying Notes to Financial Statements which are an integral part of the financial statements.
12 Invesco Small Cap Growth Fund
Statement of Operations
For the year ended December 31, 2017
Investment income: | ||||
Dividends | $ | 18,006,410 | ||
Dividends from affiliated money market funds (includes securities lending income of $183,596) | 655,538 | |||
Total investment income | 18,661,948 | |||
Expenses: | ||||
Advisory fees | 17,510,783 | |||
Administrative services fees | 520,216 | |||
Custodian fees | 84,204 | |||
Distribution fees: | ||||
Class A | 1,491,071 | |||
Class B | 10,930 | |||
Class C | 148,052 | |||
Class R | 605,558 | |||
Investor Class | 553,232 | |||
Transfer agent fees — A, B, C, R, Y and Investor | 2,612,014 | |||
Transfer agent fees —R5 | 1,053,371 | |||
Transfer agent fees —R6 | 9,065 | |||
Trustees’ and officers’ fees and benefits | 56,299 | |||
Registration and filing fees | 132,311 | |||
Reports to shareholders | 297,670 | |||
Professional services fees | 104,629 | |||
Other | 68,759 | |||
Total expenses | 25,258,164 | |||
Less: Fees waived and expense offset arrangement(s) | (80,141 | ) | ||
Net expenses | 25,178,023 | |||
Net investment income (loss) | (6,516,075 | ) | ||
Realized and unrealized gain from: | ||||
Net realized gain from investment securities (includes net gains from securities sold to affiliates of $3,919,158) | 216,281,116 | |||
Change in net unrealized appreciation of investment securities | 370,876,964 | |||
Net realized and unrealized gain | 587,158,080 | |||
Net increase in net assets resulting from operations | $ | 580,642,005 | ||
See accompanying Notes to Financial Statements which are an integral part of the financial statements.
13 Invesco Small Cap Growth Fund
Statement of Changes in Net Assets
For the years ended December 31, 2017 and 2016
| 2017 | 2016 | |||||||
Operations: | ||||||||
Net investment income (loss) | $ | (6,516,075 | ) | $ | 4,744,881 | |||
Net realized gain | 216,281,116 | 199,083,030 | ||||||
Change in net unrealized appreciation | 370,876,964 | 44,257,947 | ||||||
Net increase in net assets resulting from operations | 580,642,005 | 248,085,858 | ||||||
Distributions to shareholders from net investment income: | ||||||||
Class Y | (22,939 | ) | (360,191 | ) | ||||
Class R5 | (133,349 | ) | (3,477,362 | ) | ||||
Class R6 | (30,133 | ) | (815,646 | ) | ||||
Total distributions from net investment income | (186,421 | ) | (4,653,199 | ) | ||||
Distributions to shareholders from net realized gains: | ||||||||
Class A | (52,883,039 | ) | (51,968,425 | ) | ||||
Class B | (90,427 | ) | (177,899 | ) | ||||
Class C | (1,767,644 | ) | (1,754,430 | ) | ||||
Class R | (12,397,245 | ) | (10,252,112 | ) | ||||
Class Y | (17,172,885 | ) | (13,822,557 | ) | ||||
Investor Class | (19,506,114 | ) | (18,881,493 | ) | ||||
Class R5 | (99,829,389 | ) | (82,025,446 | ) | ||||
Class R6 | (22,558,296 | ) | (15,201,678 | ) | ||||
Total distributions from net realized gains | (226,205,039 | ) | (194,084,040 | ) | ||||
Share transactions–net: | ||||||||
Class A | (59,527,834 | ) | (59,407,480 | ) | ||||
Class B | (890,080 | ) | (917,234 | ) | ||||
Class C | (1,789,549 | ) | (1,624,835 | ) | ||||
Class R | 9,275,758 | 8,509,336 | ||||||
Class Y | 18,797,817 | 10,560,971 | ||||||
Investor Class | (18,602,316 | ) | (9,556,593 | ) | ||||
Class R5 | 88,314,083 | 22,451,211 | ||||||
Class R6 | 72,066,527 | 22,425,588 | ||||||
Net increase (decrease) in net assets resulting from share transactions | 107,644,406 | (7,559,036 | ) | |||||
Net increase in net assets | 461,894,951 | 41,789,583 | ||||||
Net assets: | ||||||||
Beginning of year | 2,352,124,254 | 2,310,334,671 | ||||||
End of year (includes undistributed net investment income (loss) of $(360,807) and $(204,013), respectively) | $ | 2,814,019,205 | $ | 2,352,124,254 | ||||
Notes to Financial Statements
December 31, 2017
NOTE 1—Significant Accounting Policies
Invesco Small Cap Growth Fund (the “Fund”) is a series portfolio of AIM Growth Series (Invesco Growth Series) (the “Trust”). The Trust is organized as a Delaware statutory trust and is registered under the Investment Company Act of 1940, as amended (the “1940 Act”), as an open-end series management investment company consisting of twenty-nine separate series portfolios, each authorized to issue an unlimited number of shares of beneficial interest. The assets, liabilities and operations of each portfolio are accounted for separately. Information presented in these financial statements pertains only to the Fund. Matters affecting each portfolio or class will be voted on exclusively by the shareholders of such portfolio or class.
The Fund’s investment objective is long-term growth of capital.
The Fund currently consists of eight different classes of shares: Class A, Class B, Class C, Class R, Class Y, Investor Class, Class R5 and Class R6. Class Y and Investor Class shares are available only to certain investors. Class A shares are sold with a front-end sales charge unless certain waiver criteria are met and under certain circumstances load waived shares may be subject to contingent deferred sales charges (“CDSC”). Class C shares are
14 Invesco Small Cap Growth Fund
sold with a CDSC. Class R, Class Y, Investor Class, Class R5 and Class R6 shares are sold at net asset value. Effective November 30, 2010, new or additional investments in Class B shares are no longer permitted. Existing shareholders of Class B shares may continue to reinvest dividends and capital gains distributions in Class B shares until they convert to Class A shares. Also, shareholders in Class B shares will be able to exchange those shares for Class B shares of other Invesco Funds offering such shares until they convert to Class A shares. Generally, Class B shares will automatically convert to Class A shares on or about the month-end, which is at least eight years after the date of purchase. Redemption of Class B shares prior to the conversion date will be subject to a CDSC. Effective January 26, 2018, all of the Fund’s outstanding Class B shares were converted to Class A shares, in advance of their normally scheduled conversion. No CDSC was paid in connection with this early conversion.
Effective as of the close of business on March 18, 2002, the Fund’s shares were offered on a limited basis to certain investors.
The Fund is an investment company and accordingly follows the investment company accounting and reporting guidance in accordance with Financial Accounting Standards Board Accounting Standards Codification Topic 946, Financial Services — Investment Companies.
The following is a summary of the significant accounting policies followed by the Fund in the preparation of its financial statements.
| A. | Security Valuations — Securities, including restricted securities, are valued according to the following policy. |
A security listed or traded on an exchange (except convertible securities) is valued at its last sales price or official closing price as of the close of the customary trading session on the exchange where the security is principally traded, or lacking any sales or official closing price on a particular day, the security may be valued at the closing bid price on that day. Securities traded in the over-the-counter market are valued based on prices furnished by independent pricing services or market makers. When such securities are valued by an independent pricing service they may be considered fair valued. Futures contracts are valued at the final settlement price set by an exchange on which they are principally traded. Listed options are valued at the mean between the last bid and asked prices from the exchange on which they are principally traded. Options not listed on an exchange are valued by an independent source at the mean between the last bid and asked prices. For purposes of determining net asset value (“NAV”) per share, futures and option contracts generally are valued 15 minutes after the close of the customary trading session of the New York Stock Exchange (“NYSE”).
Investments in open-end and closed-end registered investment companies that do not trade on an exchange are valued at the end-of-day net asset value per share. Investments in open-end and closed-end registered investment companies that trade on an exchange are valued at the last sales price or official closing price as of the close of the customary trading session on the exchange where the security is principally traded.
Debt obligations (including convertible securities) and unlisted equities are fair valued using an evaluated quote provided by an independent pricing service. Evaluated quotes provided by the pricing service may be determined without exclusive reliance on quoted prices, and may reflect appropriate factors such as institution-size trading in similar groups of securities, developments related to specific securities, dividend rate (for unlisted equities), yield (for debt obligations), quality, type of issue, coupon rate (for debt obligations), maturity (for debt obligations), individual trading characteristics and other market data. Pricing services generally value debt obligations assuming orderly transactions of institutional round lot size, but a fund may hold or transact in the same securities in smaller, odd lot sizes. Odd lots often trade at lower prices than institutional round lots. Debt obligations are subject to interest rate and credit risks. In addition, all debt obligations involve some risk of default with respect to interest and/or principal payments.
Foreign securities’ (including foreign exchange contracts) prices are converted into U.S. dollar amounts using the applicable exchange rates as of the close of the NYSE. If market quotations are available and reliable for foreign exchange-traded equity securities, the securities will be valued at the market quotations. Because trading hours for certain foreign securities end before the close of the NYSE, closing market quotations may become unreliable. If between the time trading ends on a particular security and the close of the customary trading session on the NYSE, events occur that the investment adviser determines are significant and make the closing price unreliable, the Fund may fair value the security. If the event is likely to have affected the closing price of the security, the security will be valued at fair value in good faith using procedures approved by the Board of Trustees. Adjustments to closing prices to reflect fair value may also be based on a screening process of an independent pricing service to indicate the degree of certainty, based on historical data, that the closing price in the principal market where a foreign security trades is not the current value as of the close of the NYSE. Foreign securities’ prices meeting the approved degree of certainty that the price is not reflective of current value will be priced at the indication of fair value from the independent pricing service. Multiple factors may be considered by the independent pricing service in determining adjustments to reflect fair value and may include information relating to sector indices, American Depositary Receipts and domestic and foreign index futures. Foreign securities may have additional risks including exchange rate changes, potential for sharply devalued currencies and high inflation, political and economic upheaval, the relative lack of issuer information, relatively low market liquidity and the potential lack of strict financial and accounting controls and standards.
Securities for which market prices are not provided by any of the above methods may be valued based upon quotes furnished by independent sources. The last bid price may be used to value equity securities. The mean between the last bid and asked prices is used to value debt obligations, including corporate loans.
Securities for which market quotations are not readily available or became unreliable are valued at fair value as determined in good faith by or under the supervision of the Trust’s officers following procedures approved by the Board of Trustees. Issuer specific events, market trends, bid/asked quotes of brokers and information providers and other market data may be reviewed in the course of making a good faith determination of a security’s fair value.
The Fund may invest in securities that are subject to interest rate risk, meaning the risk that the prices will generally fall as interest rates rise and, conversely, the prices will generally rise as interest rates fall. Specific securities differ in their sensitivity to changes in interest rates depending on their individual characteristics. Changes in interest rates may result in increased market volatility, which may affect the value and/or liquidity of certain Fund investments.
Valuations change in response to many factors including the historical and prospective earnings of the issuer, the value of the issuer’s assets, general economic conditions, interest rates, investor perceptions and market liquidity. Because of the inherent uncertainties of valuation, the values reflected in the financial statements may materially differ from the value received upon actual sale of those investments.
| B. | Securities Transactions and Investment Income — Securities transactions are accounted for on a trade date basis. Realized gains or losses on sales are computed on the basis of specific identification of the securities sold. Interest income (net of withholding tax, if any) is recorded on the accrual basis from settlement date. Dividend income (net of withholding tax, if any) is recorded on the ex-dividend date. |
15 Invesco Small Cap Growth Fund
The Fund may periodically participate in litigation related to Fund investments. As such, the Fund may receive proceeds from litigation settlements. Any proceeds received are included in the Statement of Operations as realized gain (loss) for investments no longer held and as unrealized gain (loss) for investments still held.
Brokerage commissions and mark ups are considered transaction costs and are recorded as an increase to the cost basis of securities purchased and/or a reduction of proceeds on a sale of securities. Such transaction costs are included in the determination of net realized and unrealized gain (loss) from investment securities reported in the Statement of Operations and the Statement of Changes in Net Assets and the net realized and unrealized gains (losses) on securities per share in the Financial Highlights. Transaction costs are included in the calculation of the Fund’s net asset value and, accordingly, they reduce the Fund’s total returns. These transaction costs are not considered operating expenses and are not reflected in net investment income reported in the Statement of Operations and the Statement of Changes in Net Assets, or the net investment income per share and the ratios of expenses and net investment income reported in the Financial Highlights, nor are they limited by any expense limitation arrangements between the Fund and the investment adviser.
The Fund allocates income and realized and unrealized capital gains and losses to a class based on the relative net assets of each class.
| C. | Country Determination — For the purposes of making investment selection decisions and presentation in the Schedule of Investments, the investment adviser may determine the country in which an issuer is located and/or credit risk exposure based on various factors. These factors include the laws of the country under which the issuer is organized, where the issuer maintains a principal office, the country in which the issuer derives 50% or more of its total revenues and the country that has the primary market for the issuer’s securities, as well as other criteria. Among the other criteria that may be evaluated for making this determination are the country in which the issuer maintains 50% or more of its assets, the type of security, financial guarantees and enhancements, the nature of the collateral and the sponsor organization. Country of issuer and/or credit risk exposure has been determined to be the United States of America, unless otherwise noted. |
| D. | Distributions — Distributions from net investment income and net realized capital gain, if any, are generally declared and paid annually and recorded on the ex-dividend date. The Fund may elect to treat a portion of the proceeds from redemptions as distributions for federal income tax purposes. |
| E. | Federal Income Taxes — The Fund intends to comply with the requirements of Subchapter M of the Internal Revenue Code of 1986, as amended (the “Internal Revenue Code”), necessary to qualify as a regulated investment company and to distribute substantially all of the Fund’s taxable earnings to shareholders. As such, the Fund will not be subject to federal income taxes on otherwise taxable income (including net realized capital gain) that is distributed to shareholders. Therefore, no provision for federal income taxes is recorded in the financial statements. |
The Fund recognizes the tax benefits of uncertain tax positions only when the position is more likely than not to be sustained. Management has analyzed the Fund’s uncertain tax positions and concluded that no liability for unrecognized tax benefits should be recorded related to uncertain tax positions. Management is not aware of any tax positions for which it is reasonably possible that the total amounts of unrecognized tax benefits will change materially in the next 12 months.
The Fund files tax returns in the U.S. Federal jurisdiction and certain other jurisdictions. Generally, the Fund is subject to examinations by such taxing authorities for up to three years after the filing of the return for the tax period.
| F. | Expenses — Fees provided for under the Rule 12b-1 plan of a particular class of the Fund are charged to the operations of such class. Transfer agency fees and expenses and other shareholder recordkeeping fees and expenses attributable to Class R5 and Class R6 are allocated to each share class based on relative net assets. Sub-accounting fees attributable to Class R5 are charged to the operations of the class. Transfer agency fees and expenses and other shareholder recordkeeping fees and expenses relating to all other classes are allocated among those classes based on relative net assets. All other expenses are allocated among the classes based on relative net assets. |
| G. | Accounting Estimates — The preparation of financial statements in conformity with accounting principles generally accepted in the United States of America (“GAAP”) requires management to make estimates and assumptions that affect the reported amounts of assets and liabilities at the date of the financial statements and the reported amounts of revenues and expenses during the reporting period including estimates and assumptions related to taxation. Actual results could differ from those estimates by a significant amount. In addition, the Fund monitors for material events or transactions that may occur or become known after the period-end date and before the date the financial statements are released to print. |
| H. | Indemnifications — Under the Trust’s organizational documents, each Trustee, officer, employee or other agent of the Trust is indemnified against certain liabilities that may arise out of the performance of their duties to the Fund. Additionally, in the normal course of business, the Fund enters into contracts, including the Fund’s servicing agreements, that contain a variety of indemnification clauses. The Fund’s maximum exposure under these arrangements is unknown as this would involve future claims that may be made against the Fund that have not yet occurred. The risk of material loss as a result of such indemnification claims is considered remote. |
| I. | Securities Lending — The Fund may lend portfolio securities having a market value up to one-third of the Fund’s total assets. Such loans are secured by collateral equal to no less than the market value of the loaned securities determined daily by the securities lending provider. Such collateral will be cash or debt securities issued or guaranteed by the U.S. Government or any of its sponsored agencies. Cash collateral received in connection with these loans is invested in short-term money market instruments or affiliated money market funds and is shown as such on the Schedule of Investments. The Fund bears the risk of loss with respect to the investment of collateral. It is the Fund’s policy to obtain additional collateral from or return excess collateral to the borrower by the end of the next business day, following the valuation date of the securities loaned. Therefore, the value of the collateral held may be temporarily less than the value of the securities on loan. When loaning securities, the Fund retains certain benefits of owning the securities, including the economic equivalent of dividends or interest generated by the security. Lending securities entails a risk of loss to the Fund if, and to the extent that, the market value of the securities loaned were to increase and the borrower did not increase the collateral accordingly, and the borrower failed to return the securities. The securities loaned are subject to termination at the option of the borrower or the Fund. Upon termination, the borrower will return to the Fund the securities loaned and the Fund will return the collateral. Upon the failure of the borrower to return the securities, collateral may be liquidated and the securities may be purchased on the open market to replace the loaned securities. The Fund could experience delays and costs in gaining access to the collateral and the securities may lose value during the delay which could result in potential losses to the Fund. Some of these losses may be indemnified by the lending agent. The Fund bears the risk of any deficiency in the amount of the collateral available for return to the borrower due to any loss on the collateral invested. Dividends received on cash collateral investments for securities lending transactions, which are net of compensation to |
16 Invesco Small Cap Growth Fund
| counterparties, are included in Dividends from affiliated money market funds on the Statement of Operations. The aggregate value of securities out on loan, if any, is shown as a footnote on the Statement of Assets and Liabilities. |
NOTE 2—Advisory Fees and Other Fees Paid to Affiliates
The Trust has entered into a master investment advisory agreement with Invesco Advisers, Inc. (the “Adviser” or “Invesco”). Under the terms of the investment advisory agreement, the Fund accrues daily and pays monthly an advisory fee to the Adviser based on the annual rate of the Fund’s average daily net assets as follows:
| Average Daily Net Assets | Rate | |||||||
First $500 million | 0 | .725% | ||||||
Next $500 million | 0 | .70% | ||||||
Next $500 million | 0 | .675% | ||||||
Over $1.5 billion | 0 | .65% | ||||||
For the year ended December 31, 2017, the effective advisory fees incurred by the Fund was 0.68%.
Under the terms of a master sub-advisory agreement between the Adviser and each of Invesco Asset Management Deutschland GmbH, Invesco Asset Management Limited, Invesco Asset Management (Japan) Limited, Invesco Hong Kong Limited, Invesco Senior Secured Management, Inc. and Invesco Canada Ltd. and separate sub-advisory agreements with Invesco PowerShares Capital Management LLC and Invesco Asset Management (India) Private Limited (collectively, the “Affiliated Sub-Advisers”) the Adviser, not the Fund, will pay 40% of the fees paid to the Adviser to any such Affiliated Sub-Adviser(s) that provide(s) discretionary investment management services to the Fund based on the percentage of assets allocated to such Affiliated Sub-Adviser(s).
The Adviser has contractually agreed, through at least June 30, 2018, to waive advisory fees and/or reimburse expenses of all shares to the extent necessary to limit total annual fund operating expenses after fee waiver and/or expense reimbursement (excluding certain items discussed below) of Class A, Class B, Class C, Class R, Class Y, Investor Class, Class R5 and Class R6 shares to 2.00%, 2.75%, 2.75%, 2.25%, 1.75%, 2.00%, 1.75% and 1.75%, respectively, of average daily net assets (the “expense limits”). In determining the Adviser’s obligation to waive advisory fees and/or reimburse expenses, the following expenses are not taken into account, and could cause the total annual fund operating expenses after fee waiver and/or expense reimbursement to exceed the numbers reflected above: (1) interest; (2) taxes; (3) dividend expense on short sales; (4) extraordinary or non-routine items, including litigation expenses; and (5) expenses that the Fund has incurred but did not actually pay because of an expense offset arrangement. Unless Invesco continues the fee waiver agreement, it will terminate on June 30, 2018. During its term, the fee waiver agreement cannot be terminated or amended to increase the expense limits or reduce the advisory fee waiver without approval of the Board of Trustees. The Adviser did not waive fees and/or reimburse expenses during the period under these expense limits.
Further, the Adviser has contractually agreed, through at least June 30, 2019, to waive the advisory fee payable by the Fund in an amount equal to 100% of the net advisory fees the Adviser receives from the affiliated money market funds on investments by the Fund of uninvested cash (excluding investments of cash collateral from securities lending) in such affiliated money market funds.
For the year ended December 31, 2017, the Adviser waived advisory fees of $71,270.
The Trust has entered into a master administrative services agreement with Invesco pursuant to which the Fund has agreed to pay Invesco for certain administrative costs incurred in providing accounting services to the Fund. For the year ended December 31, 2017, expenses incurred under the agreement are shown in the Statement of Operations as Administrative services fees.
The Trust has entered into a transfer agency and service agreement with Invesco Investment Services, Inc. (“IIS”) pursuant to which the Fund has agreed to pay IIS a fee for providing transfer agency and shareholder services to the Fund and reimburse IIS for certain expenses incurred by IIS in the course of providing such services. IIS may make payments to intermediaries that provide omnibus account services, sub-accounting services and/or networking services. All fees payable by IIS to intermediaries that provide omnibus account services or sub-accounting services are charged back to the Fund, subject to certain limitations approved by the Trust’s Board of Trustees. For the year ended December 31, 2017, expenses incurred under the agreement are shown in the Statement of Operations as Transfer agent fees.
The Trust has entered into master distribution agreements with Invesco Distributors, Inc. (“IDI”) to serve as the distributor for the Class A, Class B, Class C, Class R, Class Y, Investor Class, Class R5 and Class R6 shares of the Fund. The Trust has adopted plans pursuant to Rule 12b-1 under the 1940 Act with respect to the Fund’s Class A, Class B, Class C, Class R and Investor Class shares (collectively, the “Plans”). The Fund, pursuant to the Plans, pays IDI compensation at the annual rate of 0.25% of the Fund’s average daily net assets of Class A shares, 1.00% of the average daily net assets of Class B and Class C shares and 0.50% of the average daily net assets of Class R shares. The Fund, pursuant to the Investor Class Plan, reimburses IDI for its allocated share of expenses incurred pursuant to the Investor Class Plan for the period, up to a maximum annual rate of 0.25% of the average daily net assets of Investor Class shares. The fees are accrued daily and paid monthly. Of the Plan payments, up to 0.25% of the average daily net assets of each class of shares may be paid to furnish continuing personal shareholder services to customers who purchase and own shares of such classes. Any amounts not paid as a service fee under the Plans would constitute an asset-based sales charge. Rules of the Financial Industry Regulatory Authority (“FINRA”) impose a cap on the total sales charges, including asset-based sales charges, that may be paid by any class of shares of the Fund. For the year ended December 31, 2017, expenses incurred under the Plans are shown in the Statement of Operations as Distribution fees.
Front-end sales commissions and CDSC (collectively, the “sales charges”) are not recorded as expenses of the Fund. Front-end sales commissions are deducted from proceeds from the sales of Fund shares prior to investment in Class A shares of the Fund. CDSC are deducted from redemption proceeds prior to remittance to the shareholder. During the year ended December 31, 2017, IDI advised the Fund that IDI retained $6,145 in front-end sales commissions from the sale of Class A shares and $87 and $117 from Class A and Class C shares, respectively, for CDSC imposed on redemptions by shareholders.
For the year ended December 31, 2017, the Fund incurred $34,542 in brokerage commissions with Invesco Capital Markets, Inc., an affiliate of the Adviser and IDI, for portfolio transactions executed on behalf of the Fund.
Certain officers and trustees of the Trust are officers and directors of the Adviser, IIS and/or IDI.
17 Invesco Small Cap Growth Fund
NOTE 3—Additional Valuation Information
GAAP defines fair value as the price that would be received to sell an asset or paid to transfer a liability in an orderly transaction between market participants at the measurement date, under current market conditions. GAAP establishes a hierarchy that prioritizes the inputs to valuation methods, giving the highest priority to readily available unadjusted quoted prices in an active market for identical assets (Level 1) and the lowest priority to significant unobservable inputs (Level 3), generally when market prices are not readily available or are unreliable. Based on the valuation inputs, the securities or other investments are tiered into one of three levels. Changes in valuation methods may result in transfers in or out of an investment’s assigned level:
| Level 1 — | Prices are determined using quoted prices in an active market for identical assets. |
| Level 2 — | Prices are determined using other significant observable inputs. Observable inputs are inputs that other market participants may use in pricing a security. These may include quoted prices for similar securities, interest rates, prepayment speeds, credit risk, yield curves, loss severities, default rates, discount rates, volatilities and others. |
| Level 3 — | Prices are determined using significant unobservable inputs. In situations where quoted prices or observable inputs are unavailable (for example, when there is little or no market activity for an investment at the end of the period), unobservable inputs may be used. Unobservable inputs reflect the Fund’s own assumptions about the factors market participants would use in determining fair value of the securities or instruments and would be based on the best available information. |
As of December 31, 2017, all of the securities in this Fund were valued based on Level 1 inputs (see the Schedule of Investments for security categories). The level assigned to the securities valuations may not be an indication of the risk or liquidity associated with investing in those securities. Because of the inherent uncertainties of valuation, the values reflected in the financial statements may materially differ from the value received upon actual sale of those investments.
The Fund’s policy is to recognize transfers in and out of the valuation levels as of the end of the reporting period. During the year ended December 31, 2017, there were no material transfers between valuation levels.
NOTE 4—Security Transactions with Affiliated Funds
The Fund is permitted to purchase or sell securities from or to certain other Invesco Funds under specified conditions outlined in procedures adopted by the Board of Trustees of the Trust. The procedures have been designed to ensure that any purchase or sale of securities by the Fund from or to another fund or portfolio that is or could be considered an affiliate by virtue of having a common investment adviser (or affiliated investment advisers), common Trustees and/or common officers complies with Rule 17a-7 of the 1940 Act. Further, as defined under the procedures, each transaction is effected at the current market price. Pursuant to these procedures, for the year ended December 31, 2017, the Fund engaged in securities purchases of $14,301,171 and securities sales of $27,856,352, which resulted in net realized gains of $3,919,158.
NOTE 5—Expense Offset Arrangement(s)
The expense offset arrangement is comprised of transfer agency credits which result from balances in demand deposit accounts used by the transfer agent for clearing shareholder transactions. For the year ended December 31, 2017, the Fund received credits from this arrangement, which resulted in the reduction of the Fund’s total expenses of $8,871.
NOTE 6—Trustees’ and Officers’ Fees and Benefits
Trustees’ and Officers’ Fees and Benefits include amounts accrued by the Fund to pay remuneration to certain Trustees and Officers of the Fund. Trustees have the option to defer compensation payable by the Fund, and Trustees’ and Officers’ Fees and Benefits also include amounts accrued by the Fund to fund such deferred compensation amounts. Those Trustees who defer compensation have the option to select various Invesco Funds in which their deferral accounts shall be deemed to be invested. Finally, certain current Trustees were eligible to participate in a retirement plan that provided for benefits to be paid upon retirement to Trustees over a period of time based on the number of years of service. The Fund may have certain former Trustees who also participate in a retirement plan and receive benefits under such plan. Trustees’ and Officers’ Fees and Benefits include amounts accrued by the Fund to fund such retirement benefits. Obligations under the deferred compensation and retirement plans represent unsecured claims against the general assets of the Fund.
NOTE 7—Cash Balances
The Fund is permitted to temporarily carry a negative or overdrawn balance in its account with State Street Bank and Trust Company, the custodian bank. Such balances, if any at period-end, are shown in the Statement of Assets and Liabilities under the payable caption Amount due custodian. To compensate the custodian bank for such overdrafts, the overdrawn Fund may either (1) leave funds as a compensating balance in the account so the custodian bank can be compensated by earning the additional interest; or (2) compensate by paying the custodian bank at a rate agreed upon by the custodian bank and Invesco, not to exceed the contractually agreed upon rate.
18 Invesco Small Cap Growth Fund
NOTE 8—Distributions to Shareholders and Tax Components of Net Assets
Tax Character of Distributions to Shareholders Paid During the Fiscal Years Ended December 31, 2017 and 2016:
| 2017 | 2016 | |||||||
Ordinary income | $ | 1,142,673 | $ | 4,976,706 | ||||
Long-term capital gain | 225,248,787 | 193,760,533 | ||||||
Total distributions | $ | 226,391,460 | $ | 198,737,239 | ||||
Tax Components of Net Assets at Period-End:
| 2017 | ||||
Undistributed long-term gain | $ | 25,882,076 | ||
Net unrealized appreciation — investments | 968,810,367 | |||
Temporary book/tax differences | (360,807 | ) | ||
Shares of beneficial interest | 1,819,687,569 | |||
Total net assets | $ | 2,814,019,205 | ||
The difference between book-basis and tax-basis unrealized appreciation (depreciation) is due to differences in the timing of recognition of gains and losses on investments for tax and book purposes. The Fund’s net unrealized appreciation difference is attributable primarily to wash sales.
The temporary book/tax differences are a result of timing differences between book and tax recognition of income and/or expenses. The Fund’s temporary book/tax differences are the result of the trustee deferral of compensation and retirement plan benefits.
Capital loss carryforward is calculated and reported as of a specific date. Results of transactions and other activity after that date may affect the amount of capital loss carryforward actually available for the Fund to utilize. Capital losses generated in years beginning after December 22, 2010 can be carried forward for an unlimited period, whereas previous losses expire in eight tax years. Capital losses with an expiration period may not be used to offset capital gains until all net capital losses without an expiration date have been utilized. Capital loss carryforwards with no expiration date will retain their character as either short-term or long-term capital losses instead of as short-term capital losses as under prior law. The ability to utilize capital loss carryforwards in the future may be limited under the Internal Revenue Code and related regulations based on the results of future transactions.
The Fund does not have a capital loss carryforward as of December 31, 2017.
NOTE 9—Investment Transactions
The aggregate amount of investment securities (other than short-term securities, U.S. Treasury obligations and money market funds, if any) purchased and sold by the Fund during the year ended December 31, 2017 was $522,006,290 and $600,153,120, respectively. Cost of investments, including any derivatives, on a tax basis includes the adjustments for financial reporting purposes as of the most recently completed federal income tax reporting period-end.
| Unrealized Appreciation (Depreciation) of Investments on a Tax Basis | ||||
Aggregate unrealized appreciation of investments | $ | 1,024,951,323 | ||
Aggregate unrealized (depreciation) of investments | (56,140,956 | ) | ||
Net unrealized appreciation of investments | $ | 968,810,367 | ||
Cost of investments for tax purposes is $1,921,737,125.
NOTE 10—Reclassification of Permanent Differences
Primarily as a result of differing book/tax treatment of net operating losses on December 31, 2017, undistributed net investment income (loss) was increased by $6,545,702, undistributed net realized gain was decreased by $6,537,173 and shares of beneficial interest was decreased by $8,529. This reclassification had no effect on the net assets of the Fund.
19 Invesco Small Cap Growth Fund
NOTE 11—Share Information
| Summary of Share Activity | ||||||||||||||||
| Years ended December 31, | ||||||||||||||||
| 2017(a) | 2016 | |||||||||||||||
| Shares | Amount | Shares | Amount | |||||||||||||
Sold: | ||||||||||||||||
Class A | 2,373,114 | $ | 85,526,625 | 3,307,313 | $ | 106,585,690 | ||||||||||
Class B | 2,730 | 67,474 | 1,849 | 43,617 | ||||||||||||
Class C | 30,997 | 794,127 | 45,301 | 1,075,935 | ||||||||||||
Class R | 1,071,759 | 36,444,630 | 994,584 | 30,485,882 | ||||||||||||
Class Y | 2,512,373 | 91,728,881 | 1,703,726 | 55,758,585 | ||||||||||||
Investor Class | 306,754 | 11,653,378 | 523,397 | 17,783,519 | ||||||||||||
Class R5 | 5,728,267 | 230,593,464 | 4,750,428 | 168,983,504 | ||||||||||||
Class R6 | 3,016,797 | 122,787,405 | 1,237,919 | 45,197,275 | ||||||||||||
Issued as reinvestment of dividends: | ||||||||||||||||
Class A | 1,416,738 | 52,220,953 | 1,532,456 | 51,138,010 | ||||||||||||
Class B | 3,588 | 90,067 | 7,471 | 177,899 | ||||||||||||
Class C | 69,393 | 1,736,917 | 71,934 | 1,708,424 | ||||||||||||
Class R | 362,800 | 12,396,878 | 328,372 | 10,251,768 | ||||||||||||
Class Y | 419,700 | 15,935,998 | 392,787 | 13,433,340 | ||||||||||||
Investor Class | 487,733 | 18,899,636 | 526,167 | 18,373,732 | ||||||||||||
Class R5 | 2,344,791 | 97,332,286 | 2,238,949 | 82,997,848 | ||||||||||||
Class R6 | 541,778 | 22,586,721 | 430,664 | 16,016,380 | ||||||||||||
Automatic conversion of Class B shares to Class A shares: | ||||||||||||||||
Class A | 25,817 | 936,084 | 27,888 | 903,335 | ||||||||||||
Class B | (36,411 | ) | (936,084 | ) | (37,809 | ) | (903,335 | ) | ||||||||
Reacquired: | ||||||||||||||||
Class A | (5,533,288 | ) | (198,211,496 | ) | (6,752,912 | ) | (218,034,515 | ) | ||||||||
Class B | (4,418 | ) | (111,537 | ) | (10,021 | ) | (235,415 | ) | ||||||||
Class C | (168,096 | ) | (4,320,593 | ) | (186,919 | ) | (4,409,194 | ) | ||||||||
Class R | (1,185,719 | ) | (39,565,750 | ) | (1,063,480 | ) | (32,228,314 | ) | ||||||||
Class Y | (2,403,106 | ) | (88,867,062 | ) | (1,778,770 | ) | (58,630,954 | ) | ||||||||
Investor Class | (1,288,130 | ) | (49,155,330 | ) | (1,349,581 | ) | (45,713,844 | ) | ||||||||
Class R5 | (5,901,704 | ) | (239,611,667 | ) | (6,412,270 | ) | (229,530,141 | ) | ||||||||
Class R6 | (1,820,738 | ) | (73,307,599 | ) | (1,084,913 | ) | (38,788,067 | ) | ||||||||
Net increase (decrease) in share activity | 2,373,519 | $ | 107,644,406 | (555,470 | ) | $ | (7,559,036 | ) | ||||||||
| (a) | There are entities that are record owners of more than 5% of the outstanding shares of the Fund and in the aggregate own 35% of the outstanding shares of the Fund. IDI has an agreement with these entities to sell Fund shares. The Fund, Invesco and/or Invesco affiliates may make payments to these entities, which are considered to be related to the Fund, for providing services to the Fund, Invesco and/or Invesco affiliates including but not limited to services such as securities brokerage, distribution, third party record keeping and account servicing. The Fund has no knowledge as to whether all or any portion of the shares owned of record by these entities are also owned beneficially. |
20 Invesco Small Cap Growth Fund
NOTE 12—Financial Highlights
The following schedule presents financial highlights for a share of the Fund outstanding throughout the periods indicated.
| Net asset value, beginning of period | Net investment income (loss)(a) | Net gains (losses) on securities (both realized and unrealized) | Total from investment operations | Dividends from net investment income | Distributions from net realized gains | Total distributions | Net asset value, end of period | Total return(b) | Net assets, end of period (000’s omitted) | Ratio of expenses to average net assets with fee waivers and/or expenses absorbed | Ratio of expenses to average net assets without fee waivers and/or expenses absorbed | Ratio of net investment income (loss) to average net assets | Portfolio turnover(c) | |||||||||||||||||||||||||||||||||||||||||||
Class A | ||||||||||||||||||||||||||||||||||||||||||||||||||||||||
Year ended 12/31/17 | $ | 32.66 | $ | (0.17 | ) | $ | 8.26 | $ | 8.09 | $ | — | $ | (3.44 | ) | $ | (3.44 | ) | $ | 37.31 | 24.91 | % | $ | 617,955 | 1.20 | %(d) | 1.20 | %(d) | (0.48 | )%(d) | 21 | % | |||||||||||||||||||||||||
Year ended 12/31/16 | 32.03 | 0.00 | 3.68 | 3.68 | — | (3.05 | ) | (3.05 | ) | 32.66 | 11.30 | 596,972 | 1.22 | 1.22 | (0.01 | ) | 26 | |||||||||||||||||||||||||||||||||||||||
Year ended 12/31/15 | 35.95 | (0.16 | ) | (0.52 | ) | (0.68 | ) | — | (3.24 | ) | (3.24 | ) | 32.03 | (1.84 | ) | 645,968 | 1.20 | 1.20 | (0.43 | ) | 30 | |||||||||||||||||||||||||||||||||||
Year ended 12/31/14 | 39.68 | (0.10 | ) | 2.93 | 2.83 | — | (6.56 | ) | (6.56 | ) | 35.95 | 7.67 | 710,426 | 1.22 | 1.22 | (0.25 | ) | 28 | ||||||||||||||||||||||||||||||||||||||
Year ended 12/31/13 | 30.00 | (0.15 | ) | 12.02 | 11.87 | (0.02 | ) | (2.17 | ) | (2.19 | ) | 39.68 | 39.90 | 957,432 | 1.21 | 1.21 | (0.41 | ) | 19 | |||||||||||||||||||||||||||||||||||||
Class B | ||||||||||||||||||||||||||||||||||||||||||||||||||||||||
Year ended 12/31/17 | 23.29 | (0.31 | ) | 5.85 | 5.54 | — | (3.44 | ) | (3.44 | ) | 25.39 | 23.97 | 702 | 1.95 | (d) | 1.95 | (d) | (1.23 | )(d) | 21 | ||||||||||||||||||||||||||||||||||||
Year ended 12/31/16 | 23.79 | (0.18 | ) | 2.73 | 2.55 | — | (3.05 | ) | (3.05 | ) | 23.29 | 10.46 | 1,447 | 1.97 | 1.97 | (0.76 | ) | 26 | ||||||||||||||||||||||||||||||||||||||
Year ended 12/31/15 | 27.76 | (0.34 | ) | (0.39 | ) | (0.73 | ) | — | (3.24 | ) | (3.24 | ) | 23.79 | (2.57 | ) | 2,395 | 1.95 | 1.95 | (1.18 | ) | 30 | |||||||||||||||||||||||||||||||||||
Year ended 12/31/14 | 32.31 | (0.32 | ) | 2.33 | 2.01 | — | (6.56 | ) | (6.56 | ) | 27.76 | 6.87 | 3,876 | 1.97 | 1.97 | (1.00 | ) | 28 | ||||||||||||||||||||||||||||||||||||||
Year ended 12/31/13 | 24.90 | (0.34 | ) | 9.92 | 9.58 | — | (2.17 | ) | (2.17 | ) | 32.31 | 38.87 | 5,360 | 1.96 | 1.96 | (1.16 | ) | 19 | ||||||||||||||||||||||||||||||||||||||
Class C | ||||||||||||||||||||||||||||||||||||||||||||||||||||||||
Year ended 12/31/17 | 23.24 | (0.31 | ) | 5.84 | 5.53 | — | (3.44 | ) | (3.44 | ) | 25.33 | 23.99 | 14,502 | 1.95 | (d) | 1.95 | (d) | (1.23 | )(d) | 21 | ||||||||||||||||||||||||||||||||||||
Year ended 12/31/16 | 23.74 | (0.18 | ) | 2.73 | 2.55 | — | (3.05 | ) | (3.05 | ) | 23.24 | 10.49 | 14,878 | 1.97 | 1.97 | (0.76 | ) | 26 | ||||||||||||||||||||||||||||||||||||||
Year ended 12/31/15 | 27.71 | (0.34 | ) | (0.39 | ) | (0.73 | ) | — | (3.24 | ) | (3.24 | ) | 23.74 | (2.57 | ) | 16,858 | 1.95 | 1.95 | (1.18 | ) | 30 | |||||||||||||||||||||||||||||||||||
Year ended 12/31/14 | 32.27 | (0.32 | ) | 2.32 | 2.00 | — | (6.56 | ) | (6.56 | ) | 27.71 | 6.85 | 20,957 | 1.97 | 1.97 | (1.00 | ) | 28 | ||||||||||||||||||||||||||||||||||||||
Year ended 12/31/13 | 24.87 | (0.34 | ) | 9.91 | 9.57 | — | (2.17 | ) | (2.17 | ) | 32.27 | 38.88 | 21,794 | 1.96 | 1.96 | (1.16 | ) | 19 | ||||||||||||||||||||||||||||||||||||||
Class R | ||||||||||||||||||||||||||||||||||||||||||||||||||||||||
Year ended 12/31/17 | 30.55 | (0.25 | ) | 7.72 | 7.47 | — | (3.44 | ) | (3.44 | ) | 34.58 | 24.60 | 135,751 | 1.45 | (d) | 1.45 | (d) | (0.73 | )(d) | 21 | ||||||||||||||||||||||||||||||||||||
Year ended 12/31/16 | 30.21 | (0.08 | ) | 3.47 | 3.39 | — | (3.05 | ) | (3.05 | ) | 30.55 | 11.02 | 112,318 | 1.47 | 1.47 | (0.26 | ) | 26 | ||||||||||||||||||||||||||||||||||||||
Year ended 12/31/15 | 34.18 | (0.24 | ) | (0.49 | ) | (0.73 | ) | — | (3.24 | ) | (3.24 | ) | 30.21 | (2.08 | ) | 103,249 | 1.45 | 1.45 | (0.68 | ) | 30 | |||||||||||||||||||||||||||||||||||
Year ended 12/31/14 | 38.13 | (0.19 | ) | 2.80 | 2.61 | — | (6.56 | ) | (6.56 | ) | 34.18 | 7.40 | 108,855 | 1.47 | 1.47 | (0.50 | ) | 28 | ||||||||||||||||||||||||||||||||||||||
Year ended 12/31/13 | 28.95 | (0.23 | ) | 11.58 | 11.35 | — | (2.17 | ) | (2.17 | ) | 38.13 | 39.55 | 106,983 | 1.46 | 1.46 | (0.66 | ) | 19 | ||||||||||||||||||||||||||||||||||||||
Class Y | ||||||||||||||||||||||||||||||||||||||||||||||||||||||||
Year ended 12/31/17 | 33.48 | (0.08 | ) | 8.47 | 8.39 | 0.00 | (3.44 | ) | (3.44 | ) | 38.43 | 25.22 | 208,233 | 0.95 | (d) | 0.95 | (d) | (0.23 | )(d) | 21 | ||||||||||||||||||||||||||||||||||||
Year ended 12/31/16 | 32.76 | 0.08 | 3.77 | 3.85 | (0.08 | ) | (3.05 | ) | (3.13 | ) | 33.48 | 11.56 | 163,662 | 0.97 | 0.97 | 0.24 | 26 | |||||||||||||||||||||||||||||||||||||||
Year ended 12/31/15 | 36.60 | (0.07 | ) | (0.53 | ) | (0.60 | ) | — | (3.24 | ) | (3.24 | ) | 32.76 | (1.59 | ) | 149,745 | 0.95 | 0.95 | (0.18 | ) | 30 | |||||||||||||||||||||||||||||||||||
Year ended 12/31/14 | 40.18 | 0.00 | 2.98 | 2.98 | — | (6.56 | ) | (6.56 | ) | 36.60 | 7.95 | 105,194 | 0.97 | 0.97 | 0.00 | 28 | ||||||||||||||||||||||||||||||||||||||||
Year ended 12/31/13 | 30.33 | (0.06 | ) | 12.16 | 12.10 | (0.08 | ) | (2.17 | ) | (2.25 | ) | 40.18 | 40.24 | 73,035 | 0.96 | 0.96 | (0.16 | ) | 19 | |||||||||||||||||||||||||||||||||||||
Investor Class | ||||||||||||||||||||||||||||||||||||||||||||||||||||||||
Year ended 12/31/17 | 34.18 | (0.17 | ) | 8.64 | 8.47 | — | (3.44 | ) | (3.44 | ) | 39.21 | 24.91 | 241,104 | 1.19 | (d) | 1.19 | (d) | (0.47 | )(d) | 21 | ||||||||||||||||||||||||||||||||||||
Year ended 12/31/16 | 33.40 | 0.00 | 3.83 | 3.83 | — | (3.05 | ) | (3.05 | ) | 34.18 | 11.29 | 226,995 | 1.22 | 1.22 | (0.01 | ) | 26 | |||||||||||||||||||||||||||||||||||||||
Year ended 12/31/15 | 37.34 | (0.16 | ) | (0.54 | ) | (0.70 | ) | — | (3.24 | ) | (3.24 | ) | 33.40 | (1.82 | ) | 231,853 | 1.20 | 1.20 | (0.43 | ) | 30 | |||||||||||||||||||||||||||||||||||
Year ended 12/31/14 | 40.97 | (0.10 | ) | 3.03 | 2.93 | — | (6.56 | ) | (6.56 | ) | 37.34 | 7.67 | 279,828 | 1.22 | 1.22 | (0.25 | ) | 28 | ||||||||||||||||||||||||||||||||||||||
Year ended 12/31/13 | 30.92 | (0.15 | ) | 12.39 | 12.24 | (0.02 | ) | (2.17 | ) | (2.19 | ) | 40.97 | 39.92 | 281,811 | 1.21 | 1.21 | (0.41 | ) | 19 | |||||||||||||||||||||||||||||||||||||
Class R5 | ||||||||||||||||||||||||||||||||||||||||||||||||||||||||
Year ended 12/31/17 | 36.29 | (0.04 | ) | 9.22 | 9.18 | 0.00 | (3.44 | ) | (3.44 | ) | 42.02 | 25.41 | 1,292,036 | 0.82 | (d) | 0.82 | (d) | (0.10 | )(d) | 21 | ||||||||||||||||||||||||||||||||||||
Year ended 12/31/16 | 35.28 | 0.14 | 4.05 | 4.19 | (0.13 | ) | (3.05 | ) | (3.18 | ) | 36.29 | 11.70 | 1,037,098 | 0.83 | 0.83 | 0.38 | 26 | |||||||||||||||||||||||||||||||||||||||
Year ended 12/31/15 | 39.10 | (0.02 | ) | (0.56 | ) | (0.58 | ) | — | (3.24 | ) | (3.24 | ) | 35.28 | (1.43 | ) | 987,791 | 0.82 | 0.82 | (0.05 | ) | 30 | |||||||||||||||||||||||||||||||||||
Year ended 12/31/14 | 42.44 | 0.07 | 3.15 | 3.22 | — | (6.56 | ) | (6.56 | ) | 39.10 | 8.09 | 970,303 | 0.82 | 0.82 | 0.15 | 28 | ||||||||||||||||||||||||||||||||||||||||
Year ended 12/31/13 | 31.92 | (0.01 | ) | 12.82 | 12.81 | (0.12 | ) | (2.17 | ) | (2.29 | ) | 42.44 | 40.46 | 780,094 | 0.83 | 0.83 | (0.03 | ) | 19 | |||||||||||||||||||||||||||||||||||||
Class R6 | ||||||||||||||||||||||||||||||||||||||||||||||||||||||||
Year ended 12/31/17 | 36.41 | 0.00 | 9.23 | 9.23 | 0.00 | (3.44 | ) | (3.44 | ) | 42.20 | 25.49 | 303,737 | 0.73 | (d) | 0.73 | (d) | (0.01 | )(d) | 21 | |||||||||||||||||||||||||||||||||||||
Year ended 12/31/16 | 35.37 | 0.17 | 4.08 | 4.25 | (0.16 | ) | (3.05 | ) | (3.21 | ) | 36.41 | 11.85 | 198,752 | 0.73 | 0.73 | 0.48 | 26 | |||||||||||||||||||||||||||||||||||||||
Year ended 12/31/15 | 39.17 | 0.02 | (0.58 | ) | (0.56 | ) | — | (3.24 | ) | (3.24 | ) | 35.37 | (1.38 | ) | 172,477 | 0.73 | 0.73 | 0.04 | 30 | |||||||||||||||||||||||||||||||||||||
Year ended 12/31/14 | 42.46 | 0.10 | 3.17 | 3.27 | — | (6.56 | ) | (6.56 | ) | 39.17 | 8.21 | 138,937 | 0.73 | 0.73 | 0.24 | 28 | ||||||||||||||||||||||||||||||||||||||||
Year ended 12/31/13 | 31.92 | 0.02 | 12.81 | 12.83 | (0.12 | ) | (2.17 | ) | (2.29 | ) | 42.46 | 40.53 | 116,657 | 0.74 | 0.74 | 0.06 | 19 | |||||||||||||||||||||||||||||||||||||||
| (a) | Calculated using average shares outstanding. |
| (b) | Includes adjustments in accordance with accounting principles generally accepted in the United States of America and as such, the net asset value for financial reporting purposes and the returns based upon those net asset values may differ from the net asset value and returns for shareholder transactions. Does not include sales charges and is not annualized for periods less than one year, if applicable. |
| (c) | Portfolio turnover is calculated at the fund level and is not annualized for periods less than one year, if applicable. |
| (d) | Ratios are based on average daily net assets (000’s omitted) of $596,428, $1,093, $14,805, $121,112, $195,279, $234,623, $1,173,391 and $241,851 for Class A, Class B, Class C, Class R, Class Y, Investor Class, Class R5 and Class R6 shares, respectively. |
21 Invesco Small Cap Growth Fund
Report of Independent Registered Public Accounting Firm
To the Board of Trustees of AIM Growth Series (Invesco Growth Series) and Shareholders of Invesco Small Cap Growth Fund
Opinion on the Financial Statements
We have audited the accompanying statement of assets and liabilities, including the schedule of investments, of Invesco Small Cap Growth Fund (one of the funds constituting AIM Growth Series (Invesco Growth Series), hereafter referred to as the “Fund”) as of December 31, 2017, the related statement of operations for the year ended December 31, 2017, the statement of changes in net assets for each of the two years in the period ended December 31, 2017, including the related notes, and the financial highlights for each of the five years in the period ended December 31, 2017 (collectively referred to as the “financial statements”). In our opinion, the financial statements present fairly, in all material respects, the financial position of the Fund as of December 31, 2017, the results of its operations for the year then ended, the changes in its net assets for each of the two years in the period ended December 31, 2017 and the financial highlights for each of the five years in the period ended December 31, 2017 in conformity with accounting principles generally accepted in the United States of America.
Basis for Opinion
These financial statements are the responsibility of the Fund’s management. Our responsibility is to express an opinion on the Fund’s financial statements based on our audits. We are a public accounting firm registered with the Public Company Accounting Oversight Board (United States) (“PCAOB”) and are required to be independent with respect to the Fund in accordance with the U.S. federal securities laws and the applicable rules and regulations of the Securities and Exchange Commission and the PCAOB.
We conducted our audits of these financial statements in accordance with the standards of the PCAOB. Those standards require that we plan and perform the audit to obtain reasonable assurance about whether the financial statements are free of material misstatement, whether due to error or fraud.
Our audits included performing procedures to assess the risks of material misstatement of the financial statements, whether due to error or fraud, and performing procedures that respond to those risks. Such procedures included examining, on a test basis, evidence regarding the amounts and disclosures in the financial statements. Our audits also included evaluating the accounting principles used and significant estimates made by management, as well as evaluating the overall presentation of the financial statements. Our procedures included confirmation of securities owned as of December 31, 2017 by correspondence with the custodian, transfer agent and brokers; when replies were not received from brokers, we performed other auditing procedures. We believe that our audits provide a reasonable basis for our opinion.
PricewaterhouseCoopers LLP
Houston, TX
February 23, 2018
We have served as the auditor of one or more of the investment companies in the Invesco/PowerShares group of investment companies since at least 1995. We have not determined the specific year we began serving as auditor.
22 Invesco Small Cap Growth Fund
Calculating your ongoing Fund expenses
Example
As a shareholder of the Fund, you incur two types of costs: (1) transaction costs, which may include sales charges (loads) on purchase payments or contingent deferred sales charges on redemptions, if any; and (2) ongoing costs, including management fees, distribution and/or service (12b-1) fees, and other Fund expenses. This example is intended to help you understand your ongoing costs (in dollars) of investing in the Fund and to compare these costs with ongoing costs of investing in other mutual funds. The example is based on an investment of $1,000 invested at the beginning of the period and held for the entire period July 1, 2017 through December 31, 2017.
Actual expenses
The table below provides information about actual account values and actual expenses. You may use the information in this table, together with the amount you invested, to estimate the expenses that you paid over the period. Simply divide your account value by $1,000 (for example, an $8,600 account value divided by $1,000 = 8.6), then multiply the result by the number in the table under the heading entitled “Actual Expenses Paid During Period” to estimate the expenses you paid on your account during this period.
Hypothetical example for comparison purposes
The table below also provides information about hypothetical account values and hypothetical expenses based on the Fund’s actual expense ratio and an assumed rate of return of 5% per year before expenses, which is not the Fund’s actual return.
The hypothetical account values and expenses may not be used to estimate the actual ending account balance or expenses you paid for the period. You may use this information to compare the ongoing costs of investing in the Fund and other funds. To do so, compare this 5% hypothetical example with the 5% hypothetical examples that appear in the shareholder reports of the other funds.
Please note that the expenses shown in the table are meant to highlight your ongoing costs only and do not reflect any transaction costs, such as sales charges (loads) on purchase payments or contingent deferred sales charges on redemptions, if any. Therefore, the hypothetical information is useful in comparing ongoing costs only, and will not help you determine the relative total costs of owning different funds. In addition, if these transaction costs were included, your costs would have been higher.
| Class | Beginning Account Value (07/01/17) | ACTUAL | HYPOTHETICAL (5% annual return before expenses) | Annualized Expense Ratio | ||||||||||||||||||||
| Ending Account Value (12/31/17)1 | Expenses Paid During Period2 | Ending Account Value (12/31/17) | Expenses Paid During Period2 | |||||||||||||||||||||
Class A | $ | 1,000.00 | $ | 1,131.00 | $ | 6.45 | $ | 1,019.16 | $ | 6.11 | 1.20 | % | ||||||||||||
Class B | 1,000.00 | 1,127.00 | 10.45 | 1,015.38 | 9.91 | 1.95 | ||||||||||||||||||
Class C | 1,000.00 | 1,126.90 | 10.45 | 1,015.38 | 9.91 | 1.95 | ||||||||||||||||||
Class R | 1,000.00 | 1,129.60 | 7.78 | 1,017.90 | 7.38 | 1.45 | ||||||||||||||||||
Class Y | 1,000.00 | 1,132.60 | 5.11 | 1,020.42 | 4.84 | 0.95 | ||||||||||||||||||
Investor Class | 1,000.00 | 1,131.30 | 6.34 | 1,019.26 | 6.01 | 1.18 | ||||||||||||||||||
Class R5 | 1,000.00 | 1,133.20 | 4.41 | 1,021.07 | 4.18 | 0.82 | ||||||||||||||||||
Class R6 | 1,000.00 | 1,133.80 | 3.93 | 1,021.53 | 3.72 | 0.73 | ||||||||||||||||||
| 1 | The actual ending account value is based on the actual total return of the Fund for the period July 1, 2017 through December 31, 2017, after actual expenses and will differ from the hypothetical ending account value which is based on the Fund’s expense ratio and a hypothetical annual return of 5% before expenses. |
| 2 | Expenses are equal to the Fund’s annualized expense ratio as indicated above multiplied by the average account value over the period, multiplied by 184/365 to reflect the most recent fiscal half year. |
23 Invesco Small Cap Growth Fund
Tax Information
Form 1099-DIV, Form 1042-S and other year-end tax information provide shareholders with actual calendar year amounts that should be included in their tax returns. Shareholders should consult their tax advisors.
The following distribution information is being provided as required by the Internal Revenue Code or to meet a specific state’s requirement.
The Fund designates the following amounts or, if subsequently determined to be different, the maximum amount allowable for its fiscal year ended December 31, 2017:
Federal and State Income Tax | ||||
Long-Term Capital Gain Distributions | $ | 225,248,787 | ||
Qualified Dividend Income* | 100.00 | % | ||
Corporate Dividends Received Deduction* | 100.00 | % | ||
U.S. Treasury Obligations* | 0.00 | % | ||
| * | The above percentages are based on ordinary income dividends paid to shareholders during the Fund’s fiscal year. |
Non-Resident Alien Shareholders | ||||
Qualified Short-Term Gains | $ | 965,031 | ||
24 Invesco Small Cap Growth Fund
Trustees and Officers
The address of each trustee and officer is AIM Growth Series (Invesco Growth Series) (the “Trust”), 11 Greenway Plaza, Suite 1000, Houston, Texas 77046-1173. The trustees serve for the life of the Trust, subject to their earlier death, incapacitation, resignation, retirement or removal as more specifically provided in the Trust’s organizational documents. Each officer serves for a one year term or until their successors are elected and qualified. Column two below includes length of time served with predecessor entities, if any.
Name, Year of Birth and Position(s) Held with the Trust | Trustee and/ or Officer Since | Principal Occupation(s) During Past 5 Years | Number of Funds in Fund Complex Overseen by Trustee | Other Directorship(s) Held by Trustee During Past 5 Years | ||||
| Interested Persons | ||||||||
| Martin L. Flanagan1 — 1960 Trustee | 2007 | Executive Director, Chief Executive Officer and President, Invesco Ltd. (ultimate parent of Invesco and a global investment management firm); Trustee, The Invesco Funds; Vice Chair, Investment Company Institute; and Member of Executive Board, SMU Cox School of Business
Formerly: Advisor to the Board, Invesco Advisers, Inc. (formerly known as Invesco Institutional (N.A.), Inc.); Chairman and Chief Executive Officer, Invesco Advisers, Inc. (registered investment adviser); Director, Chairman, Chief Executive Officer and President, Invesco Holding Company (US), Inc. (formerly IVZ Inc.) (holding company), Invesco Group Services, Inc. (service provider) and Invesco North American Holdings, Inc. (holding company); Director, Chief Executive Officer and President, Invesco Holding Company Limited (parent of Invesco and a global investment management firm); Director, Invesco Ltd.; Chairman, Investment Company Institute and President, Co-Chief Executive Officer, Co-President, Chief Operating Officer and Chief Financial Officer, Franklin Resources, Inc. (global investment management organization) | 158 | None | ||||
| Philip A. Taylor2 — 1954 Trustee and Senior Vice President | 2006 | Head of the Americas and Senior Managing Director, Invesco Ltd.; Director, Invesco Advisers, Inc. (formerly known as Invesco Institutional (N.A.), Inc.) (registered investment adviser); Director, Chairman, Chief Executive Officer and President, Invesco Management Group, Inc. (formerly known as Invesco Aim Management Group, Inc.) (financial services holding company); Director and Chairman, Invesco Investment Services, Inc. (formerly known as Invesco Aim Investment Services, Inc.) (registered transfer agent); Chief Executive Officer, Invesco Corporate Class Inc. (corporate mutual fund company); Director, Chairman and Chief Executive Officer, Invesco Canada Ltd. (formerly known as Invesco Trimark Ltd./Invesco Trimark Ltèe) (registered investment adviser and registered transfer agent); Trustee and Senior Vice President, The Invesco Funds; Director, Invesco Investment Advisers LLC (formerly known as Van Kampen Asset Management).
Formerly: Co-Chairman, Co-President and Co-Chief Executive Officer, Invesco Advisers, Inc. (formerly known as Invesco Institutional (N.A.), Inc.) (registered investment adviser); Director, Chief Executive Officer and President, Van Kampen Exchange Corp; President and Principal Executive Officer, The Invesco Funds (other than AIM Treasurer’s Series Trust (Invesco Treasurer’s Series Trust), Short-Term Investments Trust and Invesco Management Trust); Executive Vice President, The Invesco Funds (AIM Treasurer’s Series Trust (Invesco Treasurer’s Series Trust), Short-Term Investments Trust and Invesco Management Trust only); Director and President, INVESCO Funds Group, Inc. (registered investment adviser and registered transfer agent); Director and Chairman, IVZ Distributors, Inc. (formerly known as INVESCO Distributors, Inc.) (registered broker dealer); Director, President and Chairman, Invesco Inc. (holding company), Invesco Canada Holdings Inc. (holding company), Trimark Investments Ltd./Placements Trimark Ltèe and Invesco Financial Services Ltd/Services Financiers Invesco Ltèe; Chief Executive Officer, Invesco Canada Fund Inc. (corporate mutual fund company); Director and Chairman, Van Kampen Investor Services Inc.; Director, Chief Executive Officer and President, 1371 Preferred Inc. (holding company) and Van Kampen Investments Inc.; Director and President, AIM GP Canada Inc. (general partner for limited partnerships) and Van Kampen Advisors, Inc.; Director and Chief Executive Officer, Invesco Trimark Dealer Inc. (registered broker dealer); Director, Invesco Distributors, Inc. (formerly known as Invesco Aim Distributors, Inc.) (registered broker dealer); Manager, Invesco PowerShares Capital Management LLC; Director, Chief Executive Officer and President, Invesco Advisers, Inc.; Director, Chairman, Chief Executive Officer and President, Invesco Aim Capital Management, Inc.; President, Invesco Trimark Dealer Inc. and Invesco Trimark Ltd./Invesco Trimark Ltèe; Director and President, AIM Trimark Corporate Class Inc. and AIM Trimark Canada Fund Inc.; Senior Managing Director, Invesco Holding Company Limited; Director and Chairman, Fund Management Company (former registered broker dealer); President and Principal Executive Officer, The Invesco Funds (AIM Treasurer’s Series Trust (Invesco Treasurer’s Series Trust), and Short-Term Investments Trust only); President, AIM Trimark Global Fund Inc. and AIM Trimark Canada Fund Inc. | 158 | None |
| 1 | Mr. Flanagan is considered an interested person (within the meaning of Section 2(a)(19) of the 1940 Act) of the Trust because he is an officer of the Adviser to the Trust, and an officer and a director of Invesco Ltd., ultimate parent of the Adviser. |
| 2 | Mr. Taylor is considered an interested person (within the meaning of Section 2(a)(19) of the 1940 Act) of the Trust because he is an officer and a director of the Adviser. |
T-1 Invesco Small Cap Growth Fund
Trustees and Officers—(continued)
Name, Year of Birth and Position(s) Held with the Trust | Trustee and/ or Officer Since | Principal Occupation(s) During Past 5 Years | Number of Funds in Fund Complex Overseen by Trustee | Other Directorship(s) Past 5 Years | ||||
| Independent Trustees | ||||||||
Bruce L. Crockett — 1944 Trustee and Chair | 2001 | Chairman, Crockett Technologies Associates (technology consulting company)
Formerly: Director, Captaris (unified messaging provider); Director, President and Chief Executive Officer, COMSAT Corporation; Chairman, Board of Governors of INTELSAT (international communications company); ACE Limited (insurance company); Independent Directors Council and Investment Company Institute: Member of the Audit Committee, Investment Company Institute; Member of the Executive Committee and Chair of the Governance Committee, Independent Directors Council | 158 | Director and Chairman of the Audit Committee, ALPS (Attorneys Liability Protection Society) (insurance company); Director and Member of the Audit Committee and Compensation Committee, Ferroglobe PLC (metallurgical company) | ||||
David C. Arch — 1945 Trustee | 2010 | Chairman of Blistex Inc. (consumer health care products manufacturer); Member, World Presidents’ Organization | 158 | Board member of the Illinois Manufacturers’ Association | ||||
Jack M. Fields — 1952 Trustee | 2001 | Chief Executive Officer, Twenty First Century Group, Inc. (government affairs company); and Chairman, Discovery Learning Alliance (non-profit)
Formerly: Owner and Chief Executive Officer, Dos Angeles Ranch L.P. (cattle, hunting, corporate entertainment); Director, Insperity, Inc. (formerly known as Administaff) (human resources provider); Chief Executive Officer, Texana Timber LP (sustainable forestry company); Director of Cross Timbers Quail Research Ranch (non-profit); and member of the U.S. House of Representatives | 158 | None | ||||
Cynthia Hostetler — 1962 Trustee | 2017 | Non-Executive Director and Trustee of a number of public and private business corporations
Formerly: Head of Investment Funds and Private Equity, Overseas Private Investment Corporation; President, First Manhattan Bancorporation, Inc.; Attorney, Simpson Thacher & Bartlett LLP | 158 | Vulcan Materials Company (construction materials company); Trilinc Global Impact Fund; Aberdeen Investment Funds (4 portfolios); Artio Global Investment LLC (mutual fund complex); Edgen Group, Inc. (specialized energy and infrastructure products distributor) | ||||
Eli Jones — 1961 Trustee | 2016 | Professor and Dean, Mays Business School — Texas A&M University
Formerly: Professor and Dean, Walton College of Business, University of Arkansas and E.J. Ourso College of Business, Louisiana State University; Director, Arvest Bank | 158 | Insperity, Inc. (formerly known as Administaff) (human resources provider) | ||||
Prema Mathai-Davis — 1950 Trustee | 2001 | Retired. | 158 | None | ||||
Teresa M. Ressel — 1962 Trustee | 2017 | Non-executive director and trustee of a number of public and private business corporations
Formerly: Chief Financial Officer, Olayan America, The Olayan Group (international investor/commercial/industrial); Chief Executive Officer, UBS Securities LLC; Group Chief Operating Officer, Americas, UBS AG; Assistant Secretary for Management & Budget and CFO, US Department of the Treasury | 158 | Atlantic Power Corporation (power generation company); ON Semiconductor Corp. (semiconductor supplier) | ||||
Ann Barnett Stern — 1957 Trustee | 2017 | President and Chief Executive Officer, Houston Endowment Inc. (private philanthropic institution)
Formerly: Executive Vice President and General Counsel, Texas Children’s Hospital; Attorney, Beck, Redden and Secrest, LLP; Business Law Instructor, University of St. Thomas; Attorney, Andrews & Kurth LLP | 158 | Federal Reserve Bank of Dallas | ||||
Raymond Stickel, Jr. — 1944 Trustee | 2005 | Retired.
Formerly: Director, Mainstay VP Series Funds, Inc. (25 portfolios); Partner, Deloitte & Touche | 158 | None | ||||
Robert C. Troccoli — 1949 Trustee | 2016 | Adjunct Professor, University of Denver — Daniels College of Business
Formerly: Senior Partner, KPMG LLP | 158 | None | ||||
Christopher L. Wilson — 1957 Trustee | 2017 | Non-executive director and trustee of a number of public and private business corporations
Formerly: Managing Partner, CT2, LLC (investing and consulting firm); President/Chief Executive Officer, Columbia Funds, Bank of America Corporation; President/Chief Executive Officer, CDC IXIS Asset Management Services, Inc.; Principal & Director of Operations, Scudder Funds, Scudder, Stevens & Clark, Inc.; Assistant Vice President, Fidelity Investments | 158 | TD Asset Management USA Inc. (mutual fund complex) (22 portfolios); ISO New England, Inc. (non-profit organization managing regional electricity market) |
T-2 Invesco Small Cap Growth Fund
Trustees and Officers—(continued)
Name, Year of Birth and Position(s) Held with the Trust | Trustee and/ or Officer Since | Principal Occupation(s) During Past 5 Years | Number of Funds in Fund Complex Overseen by Trustee | Other Directorship(s) Past 5 Years | ||||
| Other Officers | ||||||||
Sheri Morris — 1964 President, Principal Executive Officer and Treasurer | 1999 | President, Principal Executive Officer and Treasurer, The Invesco Funds; Vice President, Invesco Advisers, Inc. (formerly known as Invesco Institutional (N.A.), Inc.) (registered investment adviser); and Vice President, PowerShares Exchange-Traded Fund Trust, PowerShares Exchange-Traded Fund Trust II, PowerShares India Exchange-Traded Fund Trust, PowerShares Actively Managed Exchange-Traded Fund Trust, PowerShares Actively Managed Exchange-Traded Commodity Fund Trust and PowerShares Exchange-Traded Self-Indexed Fund Trust
Formerly: Vice President and Principal Financial Officer, The Invesco Funds; Vice President, Invesco Aim Advisers, Inc., Invesco Aim Capital Management, Inc. and Invesco Aim Private Asset Management, Inc.; Assistant Vice President and Assistant Treasurer, The Invesco Funds and Assistant Vice President, Invesco Advisers, Inc., Invesco Aim Capital Management, Inc. and Invesco Aim Private Asset Management, Inc.; and Treasurer, PowerShares Exchange-Traded Fund Trust, PowerShares Exchange-Traded Fund Trust II, PowerShares India Exchange-Traded Fund Trust and PowerShares Actively Managed Exchange-Traded Fund Trust | N/A | N/A | ||||
Russell C. Burk — 1958 Senior Vice President and Senior Officer | 2005 | Senior Vice President and Senior Officer, The Invesco Funds | N/A | N/A | ||||
John M. Zerr — 1962 Senior Vice President, Chief Legal Officer and Secretary | 2006 | Director, Senior Vice President, Secretary and General Counsel, Invesco Management Group, Inc. (formerly known as Invesco AIM Management Group, Inc.); Senior Vice President, Invesco Advisers, Inc. (formerly known as Invesco Institutional (N.A.), Inc.) (registered investment adviser); Senior Vice President and Secretary, Invesco Distributors, Inc. (formerly known as Invesco AIM Distributors, Inc.); Director, Vice President and Secretary, Invesco Investment Services, Inc. (formerly known as Invesco AIM Investment Services, Inc.) Senior Vice President, Chief Legal Officer and Secretary, The Invesco Funds; Managing Director, Invesco PowerShares Capital Management LLC; Director, Secretary and General Counsel, Invesco Investment Advisers LLC (formerly known as Van Kampen Asset Management); Secretary and General Counsel, Invesco Capital Markets, Inc. (formerly known as Van Kampen Funds Inc.) and Chief Legal Officer, PowerShares Exchange-Traded Fund Trust, PowerShares Exchange-Traded Fund Trust II, PowerShares India Exchange-Traded Fund Trust, PowerShares Actively Managed Exchange-Traded Fund Trust, PowerShares Actively Managed Exchange-Traded Commodity Fund Trust and PowerShares Exchange-Traded Self-Indexed Fund Trust; Manager and Secretary, Invesco Indexing LLC
Formerly: Director, Secretary, General Counsel and Senior Vice President, Van Kampen Exchange Corp.; Director, Vice President and Secretary, IVZ Distributors, Inc. (formerly known as INVESCO Distributors, Inc.); Director and Vice President, INVESCO Funds Group, Inc.; Director and Vice President, Van Kampen Advisors Inc.; Director, Vice President, Secretary and General Counsel, Van Kampen Investor Services Inc.; Director, Invesco Distributors, Inc. (formerly known as Invesco AIM Distributors, Inc.); Director, Senior Vice President, General Counsel and Secretary, Invesco AIM Advisers, Inc. and Van Kampen Investments Inc.; Director, Vice President and Secretary, Fund Management Company; Director, Senior Vice President, Secretary, General Counsel and Vice President, Invesco AIM Capital Management, Inc.; Chief Operating Officer and General Counsel, Liberty Ridge Capital, Inc. (an investment adviser); Vice President and Secretary, PBHG Funds (an investment company) and PBHG Insurance Series Fund (an investment company); Chief Operating Officer, General Counsel and Secretary, Old Mutual Investment Partners (a broker-dealer); General Counsel and Secretary, Old Mutual Fund Services (an administrator) and Old Mutual Shareholder Services (a shareholder servicing center); Executive Vice President, General Counsel and Secretary, Old Mutual Capital, Inc. (an investment adviser); and Vice President and Secretary, Old Mutual Advisors Funds (an investment company) | N/A | N/A | ||||
Gregory G. McGreevey — 1962 Senior Vice President | 2012 | Senior Managing Director, Invesco Ltd.; Director, Chairman, President, and Chief Executive Officer, Invesco Advisers, Inc. (formerly known as Invesco Institutional (N.A.), Inc.) (registered investment adviser); Senior Vice President, Invesco Management Group, Inc.; Director, Invesco Mortgage Capital, Inc. and Invesco Senior Secured Management, Inc.; and Senior Vice President, The Invesco Funds
Formerly: Assistant Vice President, The Invesco Funds | N/A | N/A | ||||
Kelli Gallegos — 1970 Vice President, Principal Financial Officer and Assistant Treasurer | 2008 | Vice President, Principal Financial Officer and Assistant Treasurer, The Invesco Funds; Assistant Treasurer, Invesco PowerShares Capital Management LLC, PowerShares Exchange-Traded Fund Trust, PowerShares Exchange-Traded Fund Trust II, PowerShares India Exchange-Traded Fund Trust, PowerShares Actively Managed Exchange-Traded Fund Trust, PowerShares Actively Managed Exchange-Traded Commodity Fund Trust and PowerShares Exchange-Traded Self-Indexed Fund Trust
Formerly: Assistant Vice President, The Invesco Funds | N/A | N/A |
T-3 Invesco Small Cap Growth Fund
Trustees and Officers—(continued)
Name, Year of Birth and Position(s) Held with the Trust | Trustee and/ or Officer Since | Principal Occupation(s) During Past 5 Years | Number of Funds in Fund Complex Overseen by Trustee | Other Directorship(s) Past 5 Years | ||||
| Other Officers—(continued) | ||||||||
Tracy Sullivan — 1962 Vice President, Chief Tax Officer and Assistant Treasurer | 2008 | Vice President, Chief Tax Officer and Assistant Treasurer, The Invesco Funds; Assistant Treasurer, Invesco PowerShares Capital Management LLC, PowerShares Exchange-Traded Fund Trust, PowerShares Exchange-Traded Fund Trust II, PowerShares India Exchange-Traded Fund Trust, PowerShares Actively Managed Exchange-Traded Fund Trust,PowerShares Actively Managed Exchange-Traded Commodity Fund Trust and PowerShares Exchange-Traded Self-Indexed Fund Trust
Formerly: Assistant Vice President, The Invesco Funds | N/A | N/A | ||||
Crissie M. Wisdom — 1969 Anti-Money Laundering Compliance Officer | 2013 | Anti-Money Laundering Compliance Officer, Invesco Advisers, Inc. (formerly known as Invesco Institutional (N.A.), Inc.) (registered investment adviser), Invesco Capital Markets, Inc. (formerly known as Van Kampen Funds Inc.), Invesco Distributors, Inc., Invesco Investment Services, Inc., Invesco Management Group, Inc., The Invesco Funds, and PowerShares Exchange-Traded Fund Trust, PowerShares Exchange-Traded Fund Trust II, PowerShares India Exchange-Traded Fund Trust, PowerShares Actively Managed Exchange-Traded Fund Trust,PowerShares Actively Managed Exchange-Traded Commodity Fund Trust and PowerShares Exchange-Traded Self-Indexed Fund Trust; Anti-Money Laundering Compliance Officer and Bank Secrecy Act Officer, INVESCO National Trust Company and Invesco Trust Company; and Fraud Prevention Manager and Controls and Risk Analysis Manager for Invesco Investment Services, Inc.
Formerly: Anti-Money Laundering Compliance Officer, Van Kampen Exchange Corp. | N/A | N/A | ||||
Robert R. Leveille — 1969 Chief Compliance Officer | 2016 | Chief Compliance Officer, Invesco Advisers, Inc. (registered investment adviser); and Chief Compliance Officer, The Invesco Funds
Formerly: Chief Compliance Officer, Putnam Investments and the Putnam Funds | N/A | N/A |
The Statement of Additional Information of the Trust includes additional information about the Fund’s Trustees and is available upon request, without charge, by calling 1.800.959.4246. Please refer to the Fund’s Statement of Additional Information for information on the Fund’s sub-advisers.
Office of the Fund 11 Greenway Plaza, Suite 1000 Houston, TX 77046-1173 | Investment Adviser Invesco Advisers, Inc. 1555 Peachtree Street, N.E. Atlanta, GA 30309 | Distributor Invesco Distributors, Inc. 11 Greenway Plaza, Suite 1000 Houston, TX 77046-1173 | Auditors PricewaterhouseCoopers LLP 1000 Louisiana Street, Suite 5800 Houston, TX 77002-5678 | |||
Counsel to the Fund Stradley Ronon Stevens & Young, LLP 2005 Market Street, Suite 2600 Philadelphia, PA 19103-7018 | Counsel to the Independent Trustees Goodwin Procter LLP 901 New York Avenue, N.W. Washington, D.C. 20001 | Transfer Agent Invesco Investment Services, Inc. 11 Greenway Plaza, Suite 1000 Houston, TX 77046-1173 | Custodian State Street Bank and Trust Company 225 Franklin Street Boston, MA 02110-2801 | |||
T-4 Invesco Small Cap Growth Fund
Explore High-Conviction Investing with Invesco

Go paperless with eDelivery
Visit invesco.com/edelivery to enjoy the convenience and security of anytime electronic access to your investment documents.
With eDelivery, you can elect to have any or all of the following materials delivered straight to your inbox to download, save and print from your own computer:
| ∎ | Fund reports and prospectuses |
| ∎ | Quarterly statements |
| ∎ | Daily confirmations |
| ∎ | Tax forms |
Invesco mailing information
Send general correspondence to Invesco Investment Services, Inc., P.O. Box 219078, Kansas City, MO 64121-9078.
Important notice regarding delivery of security holder documents
To reduce Fund expenses, only one copy of most shareholder documents may be mailed to shareholders with multiple accounts at the same address (Householding). Mailing of your shareholder documents may be householded indefinitely unless you instruct us otherwise. If you do not want the mailing of these documents to be combined with those for other members of your household, please contact Invesco Investment Services, Inc. at 800 959 4246 or contact your financial institution. We will begin sending you individual copies for each account within 30 days after receiving your request.
Fund holdings and proxy voting information
The Fund provides a complete list of its holdings four times in each fiscal year, at the quarter ends. For the second and fourth quarters, the lists appear in the Fund’s semiannual and annual reports to shareholders. For the first and third quarters, the Fund files the lists with the Securities and Exchange Commission (SEC) on Form N-Q. The most recent list of portfolio holdings is available at invesco.com/completeqtrholdings. Shareholders can also look up the Fund’s Forms N-Q on the SEC website at sec.gov. Copies of the Fund’s Forms N-Q may be reviewed and copied at the SEC Public Reference Room in Washington, D.C. You can obtain information on the operation of the Public Reference Room, including information about duplicating fee charges, by calling 202 551 8090 or 800 732 0330, or by electronic request at the following email address: publicinfo@sec.gov. The SEC file numbers for the Fund are shown below.
A description of the policies and procedures that the Fund uses to determine how to vote proxies relating to portfolio securities is available without charge, upon request, from our Client Services department at 800 959 4246 or at invesco.com/proxyguidelines. The information is also available on the SEC website, sec.gov.
Information regarding how the Fund voted proxies related to its portfolio securities during the most recent 12-month period ended June 30 is available at invesco.com/proxysearch. The information is also available on the SEC website, sec.gov. Invesco Advisers, Inc. is an investment adviser; it provides investment advisory services to individual and institutional clients and does not sell securities. Invesco Distributors, Inc. is the US distributor for Invesco Ltd.’s retail mutual funds, exchange-traded funds and institutional money market funds. Both are wholly owned, indirect subsidiaries of Invesco Ltd. |  |
SEC file numbers: 811-02699 and 002-57526 | Invesco Distributors, Inc. | SCG-AR-1 | 02232018 | 1113 |
ITEM 2. CODE OF ETHICS.
There were no amendments to the Code of Ethics (the “Code”) that applies to the Registrant’s Principal Executive Officer (“PEO”) and Principal Financial Officer (“PFO”) during the period covered by the report. The Registrant did not grant any waivers, including implicit waivers, from any provisions of the Code to the PEO or PFO during the period covered by this report.
ITEM 3. AUDIT COMMITTEE FINANCIAL EXPERT.
The Board of Trustees has determined that the Registrant has at least one audit committee financial expert serving on its Audit Committee. The Audit Committee financial expert is Raymond Stickel, Jr. Mr. Stickel is “independent” within the meaning of that term as used in Form N-CSR.
ITEM 4. PRINCIPAL ACCOUNTANT FEES AND SERVICES.
PricewaterhouseCoopers LLP informed the Trust that it has identified an issue related to its independence under Rule 2-01(c)(1)(ii)(A) of Regulation S-X (referred to as the Loan Rule). The Loan Rule prohibits accounting firms, such as PricewaterhouseCoopers LLP, from being deemed independent if they have certain financial relationships with their audit clients or certain affiliates of those clients. The Trust is required under various securities laws to have its financial statements audited by an independent accounting firm.
The Loan Rule specifically provides that an accounting firm would not be independent if it or certain affiliates and covered persons receives a loan from a lender that is a record or beneficial owner of more than ten percent of an audit client’s equity securities (referred to as a “more than ten percent owner”). For purposes of the Loan Rule, audit clients include the Funds as well as all registered investment companies advised by the Adviser and its affiliates, including other subsidiaries of the Adviser’s parent company, Invesco Ltd. (collectively, the Invesco Fund Complex). PricewaterhouseCoopers LLP informed the Trust it and certain affiliates and covered persons have relationships with lenders who hold, as record owner, more than ten percent of the shares of certain funds within the Invesco Fund Complex, which may implicate the Loan Rule.
On June 20, 2016, the SEC Staff issued a “no-action” letter to another mutual fund complex (see Fidelity Management & Research Company et al., No-Action Letter) related to the audit independence issue described above. In that letter, the SEC confirmed that it would not recommend enforcement action against a fund that relied on audit services performed by an audit firm that was not in compliance with the Loan Rule in certain specified circumstances. In connection with prior independence determinations, PricewaterhouseCoopers LLP communicated, as contemplated by the no-action letter, that it believes that it remains objective and impartial and that a reasonable investor possessing all the facts would conclude that PricewaterhouseCoopers LLP is able to exhibit the requisite objectivity and impartiality to report on the Funds’ financial statements as the independent registered public accounting firm. PricewaterhouseCoopers LLP also represented that it has complied with PCAOB Rule 3526(b)(1) and (2), which are conditions to the Funds relying on the no action letter, and affirmed that it is an independent accountant within the meaning of PCAOB Rule 3520. Therefore, the Adviser, the Funds and PricewaterhouseCoopers LLP concluded that PricewaterhouseCoopers LLP could continue as the Funds’ independent registered public accounting firm. The Invesco Fund Complex relied upon the no-action letter in reaching this conclusion.
If in the future the independence of PricewaterhouseCoopers LLP is called into question under the Loan Rule by circumstances that are not addressed in the SEC’s no-action letter, the Funds will need to take other action in order for the Funds’ filings with the SEC containing financial statements to be deemed compliant with applicable securities laws. Such additional actions could result in additional costs, impair the ability of the Funds to issue new shares or have other material adverse effects on the Funds. The SEC no-action relief was initially set to expire 18 months from issuance but has been extended by the SEC without an expiration date, except that the no-action letter will be withdrawn upon the effectiveness of any amendments to the Loan Rule designed to address the concerns expressed in the letter.
(a) to (d)
Fees Billed by PWC Related to the Registrant
PWC billed the Registrant aggregate fees for services rendered to the Registrant for the last two fiscal years as follows:
| Fees Billed for Services Rendered to the Registrant for fiscal year end 2017 | Fees Billed for Services Rendered to the Registrant for fiscal year end 2016 | |||||||
Audit Fees | $ | 361,800 | $ | 347,725 | ||||
| Audit-Related Fees(1) | $ | 10,500 | $ | 0 | ||||
Tax Fees(2) | $ | 108,950 | $ | 134,850 | ||||
All Other Fees | $ | 0 | $ | 0 | ||||
|
|
|
| |||||
Total Fees | $ | 481,250 | $ | 482,575 | ||||
(g) PWC billed the Registrant aggregate non-audit fees of $119,450 for the fiscal year ended 2017, and $134,850 for the fiscal year ended 2016, for non-audit services rendered to the Registrant.
| (1) | Audit-Related fees for the fiscal year end December 31, 2017 includes fees billed for reviewing regulatory filings. |
| (2) | Tax fees for the fiscal year end December 31, 2017 includes fees billed for reviewing tax returns and/or services related to tax compliance. Tax fees for fiscal year end December 31, 2016 includes fees billed for reviewing tax returns and/or services related to tax compliance. |
Fees Billed by PWC Related to Invesco and Invesco Affiliates
PWC billed Invesco Advisers, Inc. (“Invesco”), the Registrant’s adviser, and any entity controlling, controlled by or under common control with Invesco that provides ongoing services to the Registrant (“Invesco Affiliates”) aggregate fees for pre-approved non-audit services rendered to Invesco and Invesco Affiliates for the last two fiscal years as follows:
Fees Billed for to be Pre- Approved by the Registrant’s Audit Committee | Fees Billed for to be Pre- Approved by the Registrant’s Audit Committee | |||||||
Audit-Related Fees | $ | 662,000 | $ | 635,000 | ||||
Tax Fees | $ | 0 | $ | 0 | ||||
All Other Fees | $ | 1,006,000 | $ | 2,432,000 | ||||
|
|
|
| |||||
Total Fees(1) | $ | 1,668,000 | $ | 3,067,000 | ||||
| (1) | Audit-Related fees for the year end 2017 include fees billed related to reviewing controls at a service organization. Audit-Related fees for the year end 2016 include fees billed related to reviewing controls at a service organization. |
All other fees for the year end 2017 include fees billed related to the assessments for certain of the company’s risk management tools, current state analysis against regulatory requirements and identification of structural and organizational alternatives, informed by industry practices, for certain of the company’s administrative activities and functions. All other fees for the year end 2016 include fees billed related to the identification of structural and organizational alternatives, informed by industry practices, for certain of the company’s administrative activities and functions.
(e)(2) There were no amounts that were pre-approved by the Audit Committee pursuant to the de minimus exception under Rule 2-01 of Regulation S-X.
(f) Not applicable.
(g) Including the fees for services not required to be pre-approved by the registrant’s audit committee, PWC billed Invesco and Invesco Affiliates aggregate non-audit fees of $4,496,000 for the fiscal year ended December 31, 2017, and $5,763,000 for the fiscal year ended December 31, 2016, for non-audit services rendered to Invesco and Invesco Affiliates.
PWC provided audit services to the Investment Company complex of approximately $23 million.
(h) The Audit Committee also has considered whether the provision of non-audit services that were rendered to Invesco and Invesco Affiliates that were not required to be pre-approved pursuant to SEC regulations, if any, is compatible with maintaining PWC’s independence.
(e)(1)
PRE-APPROVAL OF AUDIT AND NON-AUDIT SERVICES
POLICIES AND PROCEDURES
As adopted by the Audit Committees
of the Invesco Funds (the “Funds”)
Last Amended May 4, 2016
| I. | Statement of Principles |
The Audit Committees (the “Audit Committee”) of the Boards of Trustees of the Funds (the “Board”) have adopted these policies and procedures (the “Procedures”) with respect to the pre-approval of audit and non-audit services to be provided by the Funds’ independent auditor (the “Auditor”) to the Funds, and to the Funds’ investment adviser(s) and any entity controlling, controlled by, or under common control with the investment adviser(s) that provides ongoing services to the Funds (collectively, “Service Affiliates”).
Under Section 202 of the Sarbanes-Oxley Act of 2002, all audit and non-audit services provided to the Funds by the Auditor must be preapproved by the Audit Committee. Rule 2-01 of Regulation S-X requires that the Audit Committee also pre-approve a Service Affiliate’s engagement of the Auditor for non-audit services if the engagement relates directly to the operations and financial reporting of the Funds (a “Service Affiliate’s Covered Engagement”).
These Procedures set forth the procedures and the conditions pursuant to which the Audit Committee may pre-approve audit and non-audit services for the Funds and a Service Affiliate’s Covered Engagement pursuant to rules and regulations of the Securities and Exchange Commission (“SEC”) and other organizations and regulatory bodies applicable to the Funds (“Applicable Rules”).1 They address both general pre-approvals without consideration of specific case-by-case services (“general pre-approvals”) and pre-approvals on a case-by-case basis (“specific pre-approvals”). Any services requiring pre-approval that are not within the scope of general pre-approvals hereunder are subject to specific pre-approval. These Procedures also address the delegation by the Audit Committee of pre-approval authority to the Audit Committee Chair or Vice Chair.
| II. | Pre-Approval of Fund Audit Services |
The annual Fund audit services engagement, including terms and fees, is subject to specific pre-approval by the Audit Committee. Audit services include the annual financial statement audit and other procedures required to be performed by an independent auditor to be able to form an opinion on the Funds’ financial statements. The Audit Committee will receive, review and consider sufficient information concerning a proposed Fund audit engagement to make a reasonable evaluation of the Auditor’s qualifications and independence. The Audit Committee will oversee the Fund audit services engagement as necessary, including approving any changes in terms, audit scope, conditions and fees.
In addition to approving the Fund audit services engagement at least annually and specifically approving any changes, the Audit Committee may generally or specifically pre-approve engagements for other audit services, which are those services that only an independent auditor
1 Applicable Rules include, for example, New York Stock Exchange (“NYSE”) rules applicable to closed-end funds managed by Invesco and listed on NYSE.
reasonably can provide. Other audit services may include services associated with SEC registration statements, periodic reports and other documents filed with the SEC.
| III. | General and Specific Pre-Approval of Non-Audit Fund Services |
The Audit Committee will consider, at least annually, the list of General Pre-Approved Non-Audit Services which list may be terminated or modified at any time by the Audit Committee. To inform the Audit Committee’s review and approval of General Pre-Approved Non-Audit Services, the Funds’ Treasurer (or his or her designee) and Auditor shall provide such information regarding independence or other matters as the Audit Committee may request.
Any services or fee ranges that are not within the scope of General Pre-Approved Non-Audit Services have not received general pre-approval and require specific pre-approval. Each request for specific pre-approval by the Audit Committee for services to be provided by the Auditor to the Funds must be submitted to the Audit Committee by the Funds’ Treasurer (or his or her designee) and must include detailed information about the services to be provided, the fees or fee ranges to be charged, and other relevant information sufficient to allow the Audit Committee to consider whether to pre-approve such engagement, including evaluating whether the provision of such services will impair the independence of the Auditor and is otherwise consistent with Applicable Rules.
| IV. | Non-Audit Service Types |
The Audit Committee may provide either general or specific pre-approval of audit-related, tax or other services, each as described in more detail below.
| a. | Audit-Related Services |
“Audit-related services” are assurance and related services that are reasonably related to the performance of the audit or review of the Fund’s financial statements or that are traditionally performed by an independent auditor. Audit-related services include, among others, accounting consultations related to accounting, financial reporting or disclosure matters not classified as “Audit services”; assistance with understanding and implementing new accounting and financial reporting guidance from rulemaking authorities; services related to mergers, acquisitions or dispositions; compliance with ratings agency requirements and interfund lending activities; and assistance with internal control reporting requirements.
| b. | Tax Services |
“Tax services” include, but are not limited to, the review and signing of the Funds’ federal tax returns, the review of required distributions by the Funds and consultations regarding tax matters such as the tax treatment of new investments or the impact of new regulations. The Audit Committee will not approve proposed services of the Auditor which the Audit Committee believes are to be provided in connection with a service or transaction initially recommended by the Auditor, the sole business purpose of which may be tax avoidance and the tax treatment of which may not be supported in the Internal Revenue Code and related regulations. The Audit Committee will consult with the Funds’ Treasurer (or his or her designee) and may consult with outside counsel or advisers as necessary to ensure the consistency of tax services rendered by the Auditor with the foregoing policy. The Auditor shall not represent any Fund or any Service Affiliate before a tax court, district court or federal court of claims.
Each request to provide tax services under either the general or specific pre-approval of the Audit Committee will include a description from the Auditor in writing of (i) the scope of the
service, the fee structure for the engagement, and any side letter or other amendment to the engagement letter, or any other agreement (whether oral, written, or otherwise) between the Auditor and the Funds, relating to the service; and (ii) any compensation arrangement or other agreement, such as a referral agreement, a referral fee or fee-sharing arrangement, between the Auditor (or an affiliate of the Auditor) and any person (other than the Funds or Service Affiliates receiving the services) with respect to the promoting, marketing, or recommending of a transaction covered by the service. The Auditor will also discuss with the Audit Committee the potential effects of the services on the independence of the Auditor, and document the substance of its discussion with the Audit Committee.
| c. | Other Services |
The Audit Committee may pre-approve other non-audit services so long as the Audit Committee believes that the service will not impair the independence of the Auditor. Appendix I includes a list of services that the Auditor is prohibited from performing by the SEC rules. Appendix I also includes a list of services that would impair the Auditor’s independence unless the Audit Committee reasonably concludes that the results of the services will not be subject to audit procedures during an audit of the Funds’ financial statements.
| V. | Pre-Approval of Service Affiliate’s Covered Engagements |
Rule 2-01 of Regulation S-X requires that the Audit Committee pre-approve a Service Affiliate’s engagement of the Auditor for non-audit services if the engagement relates directly to the operations and financial reporting of the Funds, defined above as a “Service Affiliate’s Covered Engagement”.
The Audit Committee may provide either general or specific pre-approval of any Service Affiliate’s Covered Engagement, including for audit-related, tax or other services, as described above, if the Audit Committee believes that the provision of the services to a Service Affiliate will not impair the independence of the Auditor with respect to the Funds. Any Service Affiliate’s Covered Engagements that are not within the scope of General Pre-Approved Non-Audit Services have not received general pre-approval and require specific pre-approval.
Each request for specific pre-approval by the Audit Committee of a Service Affiliate’s Covered Engagement must be submitted to the Audit Committee by the Funds’ Treasurer (or his or her designee) and must include detailed information about the services to be provided, the fees or fee ranges to be charged, a description of the current status of the pre-approval process involving other audit committees in the Invesco investment company complex (as defined in Rule 2-201 of Regulation S-X) with respect to the proposed engagement, and other relevant information sufficient to allow the Audit Committee to consider whether the provision of such services will impair the independence of the Auditor from the Funds. Additionally, the Funds’ Treasurer (or his or her designee) and the Auditor will provide the Audit Committee with a statement that the proposed engagement requires pre-approval by the Audit Committee, the proposed engagement, in their view, will not impair the independence of the Auditor and is consistent with Applicable Rules, and the description of the proposed engagement provided to the Audit Committee is consistent with that presented to or approved by the Invesco audit committee.
Information about all Service Affiliate engagements of the Auditor for non-audit services, whether or not subject to pre-approval by the Audit Committee, shall be provided to the Audit
Committee at least quarterly, to allow the Audit Committee to consider whether the provision of such services is compatible with maintaining the Auditor’s independence from the Funds. The Funds’ Treasurer and Auditor shall provide the Audit Committee with sufficiently detailed information about the scope of services provided and the fees for such services, to ensure that the Audit Committee can adequately consider whether the provision of such services is compatible with maintaining the Auditor’s independence from the Funds.
| VI. | Pre-Approved Fee Levels or Established Amounts |
Pre-approved fee levels or ranges for audit and non-audit services to be provided by the Auditor to the Funds, and for a Service Affiliate’s Covered Engagement, under general pre-approval or specific pre-approval will be set periodically by the Audit Committee. Any proposed fees exceeding 110% of the maximum pre-approved fee levels or ranges for such services or engagements will be promptly presented to the Audit Committee and will require specific pre-approval by the Audit Committee before payment of any additional fees is made.
| VII. | Delegation |
The Audit Committee may from time to time delegate specific pre-approval authority to its Chair and/or Vice Chair, so that the Chair or, in his or her absence, Vice Chair may grant specific pre-approval for audit and non-audit services by the Auditor to the Funds and/or a Service Affiliate’s Covered Engagement between Audit Committee meetings. Any such delegation shall be reflected in resolutions adopted by the Audit Committee and may include such limitations as to dollar amount(s) and/or scope of service(s) as the Audit Committee may choose to impose. Any such delegation shall not preclude the Chair or Vice Chair from declining, on a case by case basis, to exercise his or her delegated authority and instead convening the Audit Committee to consider and pre-approve any proposed services or engagements.
Notwithstanding the foregoing, any non-audit services to be provided to the Funds for which the fees are estimated to exceed $500,000 and any Service Affiliate’s Covered Engagement for which the fees are estimated to exceed $500,000 must be pre-approved by the Audit Committee and may not be delegated to the Chair or Vice Chair.
| VIII. | Compliance with Procedures |
Notwithstanding anything herein to the contrary, failure to pre-approve any services or engagements that are not required to be pre-approved pursuant to the de minimis exception provided for in Rule 2-01(c)(7)(i)(C) of Regulation S-X shall not constitute a violation of these Procedures. The Audit Committee has designated the Funds’ Treasurer to ensure services and engagements are pre-approved in compliance with these Procedures. The Funds’ Treasurer will immediately report to the Chair of the Audit Committee, or the Vice Chair in his or her absence, any breach of these Procedures that comes to the attention of the Funds’ Treasurer or any services or engagements that are not required to be pre-approved pursuant to the de minimis exception provided for in Rule 2-01(c)(7)(i)(C) of Regulation S-X.
On at least an annual basis, the Auditor will provide the Audit Committee with a summary of all non-audit services provided to any entity in the investment company complex (as defined in section 2-01(f)(14) of Regulation S-X, including the Funds and Service Affiliates) that were not pre-approved, including the nature of services provided and the associated fees.
| IX. | Amendments to Procedures |
All material amendments to these Procedures must be approved in advance by the Audit Committee. Non-material amendments to these Procedures may be made by the Legal and Compliance Departments and will be reported to the Audit Committee at the next regularly scheduled meeting of the Audit Committee.
Appendix I
Non-Audit Services That May Impair the Auditor’s Independence
The Auditor is not independent if, at any point during the audit and professional engagement, the Auditor provides the following non-audit services:
| • | Management functions; |
| • | Human resources; |
| • | Broker-dealer, investment adviser, or investment banking services; |
| • | Legal services; |
| • | Expert services unrelated to the audit; |
| • | Any service or product provided for a contingent fee or a commission; |
| • | Services related to marketing, planning, or opining in favor of the tax treatment of confidential transactions or aggressive tax position transactions, a significant purpose of which is tax avoidance; |
| • | Tax services for persons in financial reporting oversight roles at the Fund; and |
| • | Any other service that the Public Company Oversight Board determines by regulation is impermissible. |
An Auditor is not independent if, at any point during the audit and professional engagement, the Auditor provides the following non-audit services unless it is reasonable to conclude that the results of the services will not be subject to audit procedures during an audit of the Funds’ financial statements:
| • | Bookkeeping or other services related to the accounting records or financial statements of the audit client; |
| • | Financial information systems design and implementation; |
| • | Appraisal or valuation services, fairness opinions, or contribution-in-kind reports; |
| • | Actuarial services; and |
| • | Internal audit outsourcing services. |
| ITEM 5. | AUDIT COMMITTEE OF LISTED REGISTRANTS. |
Not applicable.
| ITEM 6. | SCHEDULE OF INVESTMENTS. |
Investments in securities of unaffiliated issuers is included as part of the reports to stockholders filed under Item 1 of this Form.
| ITEM 7. | DISCLOSURE OF PROXY VOTING POLICIES AND PROCEDURES FOR CLOSED-END MANAGEMENT INVESTMENT COMPANIES. |
Not applicable.
| ITEM 8. | PORTFOLIO MANAGERS OF CLOSED-END MANAGEMENT COMPANIES. |
Not applicable.
| ITEM 9. | PURCHASES OF EQUITY SECURITIES BY CLOSED-END MANAGEMENT INVESTMENT COMPANY AND AFFILIATED PURCHASERS. |
Not applicable.
| ITEM 10. | SUBMISSION OF MATTERS TO A VOTE OF SECURITY HOLDERS. |
None
| ITEM 11. | CONTROLS AND PROCEDURES. |
| (a) | As of February 14, 2018, an evaluation was performed under the supervision and with the participation of the officers of the Registrant, including the PEO and PFO, to assess the effectiveness of the Registrant’s disclosure controls and procedures, as that term is defined in Rule 30a-3(c) under the Investment Company Act of 1940 (the “Act”), as amended. Based on that evaluation, the Registrant’s officers, including the PEO and PFO, concluded that, as of February 14, 2018, the Registrant’s disclosure controls and procedures were reasonably designed to ensure: (1) that information required to be disclosed by the Registrant on Form N-CSR is recorded, processed, summarized and reported within the time periods specified by the rules and forms of the Securities and Exchange Commission; and (2) that material information relating to the Registrant is made known to the PEO and PFO as appropriate to allow timely decisions regarding required disclosure. |
| (b) | There have been no changes in the Registrant’s internal control over financial reporting (as defined in Rule 30a-3(d) under the Act) that occurred during the second fiscal quarter of the period covered by this report that have materially affected, or are reasonably likely to materially affect, the Registrant’s internal control over financial reporting. |
| ITEM 12. | DISCLOSURE OF SECURITIES LENDING ACTIVITIES FOR CLOSED-END MANAGEMENT INVESTMENT COMPANIES. |
Not applicable.
| ITEM 13. | EXHIBITS. |
| 13(a) (1) | Code of Ethics. |
| 13(a) (2) | Certifications of principal executive officer and principal financial officer as required by Rule 30a-2(a) under the Investment Company Act of 1940. |
| 13(a) (3) | Not applicable. |
| 13(a) (4) | Not applicable. |
SIGNATURES
Pursuant to the requirements of the Securities Exchange Act of 1934 and the Investment Company Act of 1940, the Registrant has duly caused this report to be signed on its behalf by the undersigned, thereunto duly authorized.
Registrant: AIM Growth Series (Invesco Growth Series)
| By: | /s/ Sheri Morris | |
| Sheri Morris | ||
| Principal Executive Officer | ||
| Date: | March 9, 2018 | |
Pursuant to the requirements of the Securities and Exchange Act of 1934 and the Investment Company Act of 1940, this report has been signed below by the following persons on behalf of the Registrant and in the capacities and on the dates indicated.
| By: | /s/ Sheri Morris | |
| Sheri Morris | ||
| Principal Executive Officer | ||
| Date: | March 9, 2018 | |
| By: | /s/ Kelli Gallegos | |
| Kelli Gallegos | ||
| Principal Financial Officer | ||
| Date: | March 9, 2018 | |
EXHIBIT INDEX
| 13(a) (1) | Code of Ethics. | |
| 13(a) (2) | Certifications of principal executive officer and principal financial officer as required by Rule 30a-2(a) under the Investment Company Act of 1940. | |
| 13(a) (3) | Not applicable. | |
| 13(a) (4) | Not applicable. | |