OMB APPROVAL | ||||
| OMB Number: | 3235-0570 | |||
| Expires: | January 31, 2017 | |||
| Estimated average burden | ||||
| hours per response: | 20.6 | |||
UNITED STATES
SECURITIES AND EXCHANGE COMMISSION
Washington, D.C. 20549
FORM N-CSR
CERTIFIED SHAREHOLDER REPORT OF REGISTERED
MANAGEMENT INVESTMENT COMPANIES
Investment Company Act file number 811-02699
AIM Growth Series (Invesco Growth Series)
(Exact name of registrant as specified in charter)
11 Greenway Plaza, Suite 1000 Houston, Texas 77046
(Address of principal executive offices) (Zip code)
Philip A. Taylor
11 Greenway Plaza,
Suite 1000 Houston, Texas 77046
(Name and address of agent for service)
Registrant’s telephone number, including area code: (713) 626-1919
Date of fiscal year end: 12/31
Date of reporting period: 12/31/14
Item 1. Report to Stockholders.

Letters to Shareholders
Philip Taylor | Dear Shareholders: This annual report includes information about your Fund, including performance data and a complete list of its investments as of the close of the reporting period. Inside, your Fund’s portfolio managers discuss how they managed your Fund and the factors that affected its performance during the reporting period. I hope you find this report of interest. During the reporting period, the US economy showed unmistakable signs of improvement. After contracting in the first quarter of 2014, the economy expanded strongly in the second and third quarters as employment data improved markedly. Given continuing positive economic trends, the US Federal Reserve (the Fed) ended its extraordinary asset purchase program in October – but it pledged in December to be “patient” before raising interest rates. Overseas, the story was much different. Concerns about economic stagnation and the potential for deflation depressed European markets, while the Chinese economy | |
was hurt by a slowdown in manufacturing. Political change in Washington, DC; changes to monetary policy by the Fed and other central banks; the future direction of oil prices; and unexpected geopolitical events are likely to affect markets in the US and overseas in 2015. This may make some investors hesitant to begin to save for their long-term financial goals. That’s why Invesco has always encouraged investors to work with a professional financial adviser who can stress the importance of starting to save and invest early and the importance of adhering to a disciplined investment plan – when times are good and when they’re uncertain. A financial adviser who knows your unique financial situation, investment goals and risk tolerance can be an invaluable partner as you seek to achieve your financial goals. He or she can offer a long-term perspective when markets are volatile and time-tested advice and guidance when your financial situation or investment goals change. | ||

Timely information when and where you want it
Invesco’s efforts to help investors achieve their financial objectives include providing individual investors and financial professionals with timely information about the markets, the economy and investing – whenever and wherever they want it.
Our website, invesco.com/us, offers a wide range of market insights and investment perspectives. On the website, you’ll find detailed information about our funds, including prices, performance, holdings and portfolio manager commentaries. You can access information about your individual Invesco account whenever it’s convenient for you; just complete a simple, secure online registration. Use the “Log In” box on our home page to get started.
Invesco’s mobile apps for iPhone® and iPad® (both available free from the App StoreSM) allow you to obtain the same detailed information, monitor your account and create customizable watch lists. Also, they allow you to access investment insights from our investment leaders, market strategists, economists and retirement experts. You can sign up to be alerted when new commentary is added, and you can watch portfolio manager videos and have instant access to Invesco news and updates wherever you may be.
In addition to the resources accessible on our website and through our mobile app, you can obtain timely updates to help you stay informed about the markets, the economy and investing by connecting with Invesco on Twitter, LinkedIn or Facebook. You can access our blog at blog.invesco.us.com. Our goal is to provide you the information you want, when and where you want it.
Have questions?
For questions about your account, feel free to contact an Invesco client services representative at 800 959 4246. For Invesco-related questions or comments, please email me directly at phil@invesco.com.
All of us at Invesco look forward to serving your investment management needs for many years to come. Thank you for investing with us.
Sincerely,

Philip Taylor
Senior Managing Director, Invesco Ltd.
iPhone and iPad are trademarks of Apple Inc., registered in the US and other countries. App Store is a service mark of Apple Inc. Invesco Distributors, Inc. is not affiliated with Apple Inc.
| 2 | Invesco Alternative Strategies Fund |
Bruce Crockett | Dear Fellow Shareholders: Among the many important lessons I’ve learned in more than 40 years in a variety of business endeavors is the value of a trusted advocate. As independent chair of the Invesco Funds Board, I can assure you that the members of the Board are strong advocates for the interests of investors in Invesco’s mutual funds. We work hard to represent your interests through oversight of the quality of the investment management services your funds receive and other matters important to your investment, including but not limited to: n Ensuring that Invesco offers a diverse lineup of mutual funds that your financial adviser can use to strive to meet your financial needs as your investment goals change over time. n Monitoring how the portfolio management teams of the Invesco funds are performing in light of changing economic and market conditions. |

| n | Assessing each portfolio management team’s investment performance within the context of the investment strategy described in the fund’s prospectus. |
| n | Monitoring for potential conflicts of interests that may impact the nature of the services that your funds receive. |
We believe one of the most important services we provide our fund shareholders is the annual review of the funds’ advisory and sub-advisory contracts with Invesco Advisers and its affiliates. This review is required by the Investment Company Act of 1940 and focuses on the nature and quality of the services Invesco provides as the adviser to the Invesco funds and the reasonableness of the fees that it charges for those services. Each year, we spend months carefully reviewing information received from Invesco and a variety of independent sources, such as performance and fee data prepared by Lipper Inc., an independent, third-party firm widely recognized as a leader in its field. We also meet with our independent legal counsel and other independent advisers to review and help us assess the information that we have received. Our goal is to assure that you receive quality investment management services for a reasonable fee.
I trust the measures outlined above provide assurance that you have a worthy advocate when it comes to choosing the Invesco Funds.
As always, please contact me at bruce@brucecrockett.com with any questions or concerns you may have. On behalf of the Board, we look forward to continuing to represent your interests and serving your needs.
Sincerely,

Bruce L. Crockett
Independent Chair
Invesco Funds Board of Trustees
| 3 | Invesco Alternative Strategies Fund |
Management’s Discussion of Fund Performance
Performance summary Invesco Alternative Strategies Fund incepted on October 14, 2014. For the two-and-a-half-month reporting period ended December 31, 2014, the Fund, at net asset value (NAV), produced positive returns and outperformed the Citigroup 90-Day Treasury Bill Index. Additional Fund performance appears later in this report.
|
| |||
Fund vs. Indexes Cumulative total returns, 10/14/14 to 12/31/14, at net asset value (NAV). Performance shown does not include applicable contingent deferred sales charges (CDSC) or front-end sales charges, which would have reduced performance. |
| |||
Class A Shares | 1.39 | % | ||
Class C Shares | 1.23 | |||
Class R Shares | 1.34 | |||
Class Y Shares | 1.54 | |||
Class R5 Shares | 1.44 | |||
Class R6 Shares | 1.44 | |||
Citigroup 90-Day Treasury Bill Indexq (Broad Market/Style-Specific Index) | 0.00 | |||
Lipper Alternative Multi-Strategy Funds Classification Average¿ (Peer Group) | 2.63 | |||
Source(s): qFactSet Research Systems Inc.; nLipper Inc.
| ||||
Market conditions and your Fund
The Fund incepted on October 14, 2014. For the two-and-a-half-month reporting period, the Fund, at NAV, generated positive returns and outperformed its broad market/style-specific benchmark, the Citigroup 90-Day Treasury Bill Index. Upon the Fund’s inception, we fully invested the Fund’s assets in a broad spectrum of alternative strategies and asset classes through affiliated underlying mutual funds and exchange-traded funds.
During the reporting period, the US economy continued to expand, albeit slowly, even as other regions – particularly Europe and Asia – struggled. The US Federal Reserve (the Fed), which had been reducing its asset purchases throughout 2014, finally ended all purchases in October. Concerns that the Fed’s policies would result in higher interest rates proved unfounded as long-term interest rates largely fell throughout the reporting period. This macroeconomic environment was broadly supportive of US equity markets, which rose during the reporting period. Oil prices began falling
Portfolio Composition* | ||||
By security type, based on total investments | ||||
Equity Funds | 58.0 | % | ||
Alternative Funds | 29.5 | |||
Exchange-Traded Funds | 4.0 | |||
Fixed Income Funds | 1.7 | |||
Money Market Funds | 6.8 | |||
| * | Based on the Schedule of Investments, which classifies each underlying fund and other investments into broad asset classes based on their predominant investments. |
sharply in mid-September, leading a broad decline in commodity prices during the reporting period.
The Fund’s core allocation comprises affiliated alternative strategies that historically have exhibited low-to-medium correlation to financial indexes that track broad asset classes; this seeks to limit their market exposure and provide lower volatility. Underlying funds selected for the core allocation, which included Invesco All Cap Market Neutral Fund, Invesco Global Market Neutral Fund and Invesco Global Markets Strategy Fund, broadly contributed to Fund performance during the reporting period.
The Fund’s satellite allocation comprises underlying funds that seek to perform well in specific economic environments, reflecting our near-term outlook for the market. Given the headwinds across commodities during the reporting period, PowerShares DB Silver Fund, Invesco Balanced-Risk Commodities Strategy Fund and PowerShares DB Base Metals Fund, each part of the Fund’s satellite allocation, detracted from Fund performance.
Total Net Assets
|
$
|
520.0 thousand
|
|
The Fund’s holdings are subject to change, and there is no assurance that the Fund will continue to hold any particular security.
Please note that some of the Fund’s underlying funds – which include, but are not limited to, Invesco All Cap Market Neutral Fund, Invesco Global Market Neutral Fund, Invesco Global Markets Strategy Fund, Invesco Balanced-Risk Allocation Fund, Invesco Macro Long/Short Fund, Invesco Long/Short Equity Fund and Invesco Balanced-Risk Commodity Strategy Fund – may use derivatives, which may create economic leverage in the underlying funds. Additionally, please note that some of the underlying funds listed above have strategies that may be principally implemented with derivative instruments that include futures and total return swaps. Therefore, all or most of the performance of these underlying funds, both positive and negative, can be attributed to these instruments. Derivatives may amplify traditional investment risks through the creation of leverage and may be less liquid than traditional securities.
Thank you for investing in Invesco Alternative Strategies Fund.
The views and opinions expressed in management’s discussion of Fund performance are those of Invesco Advisers, Inc. These views and opinions are subject to change at any time based on factors such as market and economic conditions. These views and opinions may not be relied upon as investment advice or recommendations, or as an offer for a particular security. The information is not a complete analysis of every aspect of any market, country, industry, security or the Fund. Statements of fact are from sources considered reliable, but Invesco Advisers, Inc. makes no representation or warranty as to their completeness or accuracy. Although historical performance is no guarantee of future results, these insights may help you understand our investment management philosophy.
See important Fund and, if applicable, index disclosures later in this report.
 | Duy Nguyen | |
| Chartered Financial Analyst, Portfolio Manager and Chief Investment Officer of Invesco | ||
| Solutions, is manager of Invesco Alternative Strategies Fund. He joined Invesco in 2000. Mr. Nguyen earned a BBA from The University of Texas at Austin and an MS from the University of Houston. | ||
Assisted by Invesco’s Solutions Team
| 4 | Invesco Alternative Strategies Fund |
Your Fund’s Performance
| Cumulative Total Returns | ||||
As of 12/31/14, including maximum applicable sales charges |
| |||
Class A Shares | ||||
Inception (10/14/14) | –4.17 | % | ||
Class C Shares | ||||
Inception (10/14/14) | 0.24 | % | ||
Class R Shares | ||||
Inception (10/14/14) | 1.34 | % | ||
Class Y Shares | ||||
Inception (10/14/14) | 1.54 | % | ||
Class R5 Shares | ||||
Inception (10/14/14) | 1.44 | % | ||
Class R6 Shares | ||||
Inception (10/14/14) | 1.44 | % | ||
The performance data quoted represent past performance and cannot guarantee comparable future results; current performance may be lower or higher. Please visit invesco.com/performance for the most recent month-end performance. Performance figures reflect reinvested distributions, changes in net asset value and the effect of the maximum sales charge unless otherwise
stated. Performance figures do not reflect deduction of taxes a shareholder would pay on Fund distributions or sale of Fund shares. Investment return and principal value will fluctuate so that you may have a gain or loss when you sell shares.
The net annual Fund operating expense ratio set forth in the most recent Fund prospectus as of the date of this report for Class A, Class C, Class R, Class Y, Class R5 and Class R6 shares was 1.75%, 2.50%, 2.00%, 1.50%, 1.50% and 1.50%, respectively.1,2 The total annual Fund operating expense ratio set forth in the most recent Fund prospectus as of the date of this report for Class A, Class C, Class R, Class Y, Class R5 and Class R6 shares was 4.46%, 5.21%, 4.71%, 4.21%, 4.10% and 4.05%, respectively.2 The expense ratios presented above may vary from the expense ratios presented in other sections of this report that are based on expenses incurred during the period covered by this report.
Class A share performance reflects the maximum 5.50% sales charge, and Class C share performance reflects the applicable contingent deferred sales charge (CDSC) for the period involved. The CDSC on Class C shares is 1% for the first year after purchase. Class R, Class Y, Class R5 and Class R6 class shares do not have a front-end sales charge or a CDSC; therefore, performance is at net asset value.
The performance of the Fund’s share classes will differ primarily due to different sales charge structures and class expenses.
Had the adviser not waived fees and/ or reimbursed expenses, performance would have been lower.
| 1 | Total annual Fund operating expenses after any contractual fee waivers and/or expense reimbursements by the adviser in effect through at least October 31, 2016. See current prospectus for more information. |
| 2 | The expense ratio includes acquired fund fees and expenses of the underlying funds in which the Fund invests of 1.23% for Invesco Alternative Strategies Fund. |
Invesco Alternative Strategies Fund’s investment objective is long-term capital appreciation.
| n | Unless otherwise stated, information presented in this report is as of December 31, 2014, and is based on total net assets. |
| n | Unless otherwise noted, all data provided by Invesco. |
| n | To access your Fund’s reports/prospectus, visit invesco.com/fundreports. |
About share classes n Class R shares are generally available only to employer sponsored retirement and benefit plans. Please see the prospectus for more information. n Class Y shares are available only to certain investors. Please see the prospectus for more information. n Class R5 shares and Class R6 shares are primarily intended for employer sponsored retirement and benefit plans that meet certain standards and for institutional investors. Please see the prospectus for more information. | Principal risks of investing in the Fund The principal risks of investing in the Fund are: n Allocation risk. The Fund’s investment performance depends, in part, on how its assets are allocated among the underlying funds. It is possible that due to unexpected market movements or other factors, the Adviser’s allocation of the Fund’s assets among underlying funds may not produce the desired results and could cause the Fund to perform poorly or underperform other available funds. | n Exchange-traded funds risk. An investment by the Fund or an underlying fund in exchange-traded funds generally presents the same primary risks as an investment in a mutual fund. In addition, an exchange-traded fund may be subject to the following: (1) a discount of the exchange-traded fund’s shares to its net asset value; (2) failure to develop an active trading market for the exchange-traded fund’s shares; (3) the listing exchange halting trading of the exchange-traded fund’s shares; (4) failure of the exchange-traded fund’s shares to track the referenced asset; and (5) holding troubled securities in the referenced index or basket of investments. Investments in exchange-traded funds may involve duplication of management fees and certain other expenses, as the Fund or an underlying fund indirectly bears its proportionate |
This report must be accompanied or preceded by a currently effective Fund prospectus, which contains more complete information, including sales charges and expenses. Investors should read it carefully before investing.
| ||||||
| NOT FDIC INSURED | MAY LOSE VALUE | NO BANK GUARANTEE | ||||||
| continued on page 6 |
| 5 | Invesco Alternative Strategies Fund |
continued from page 5
share of any expenses paid by the exchange-traded funds in which it invests. Further, certain of the exchange-traded funds in which the Fund or underlying fund may invest are leveraged. The more the Fund or an underlying fund invests in such leveraged exchange-traded funds, the more this leverage will magnify any losses on those investments. |
| n | Fund of funds risk. The Fund’s performance depends on the underlying funds in which it invests, and it is subject to the risks of the underlying funds. The Fund will indirectly pay a proportional share of the fees and expenses of the underlying funds in which it invests. Market fluctuations may change the target weightings in the underlying funds. The underlying funds may change their investment objectives, policies or practices and may not achieve their investment objectives, all of which may cause the Fund to withdraw its investments therein at a disadvantageous time. |
The principal risks of investing in the Fund also include the risks of each underlying fund. These risks include:
| n | Active trading risk. Certain underlying funds engage in frequent trading of portfolio securities. Active trading results in added expenses and may result in a lower return and increased tax liability. |
| n | Cash/cash equivalents risk. Holding cash or cash equivalents may negatively affect performance. |
| n | Changing fixed income market conditions risk. The current low interest rate environment was created in part by the Federal Reserve Board (FRB) and certain foreign central banks keeping the federal funds and equivalent foreign rates at or near zero. There is a risk that interest rates will rise when the FRB and central banks raise these rates. This risk is heightened due to the potential “tapering” of the FRB’s quantitative easing program and other similar foreign central bank actions. This tapering and eventual increase in the federal funds and equivalent foreign rates may expose fixed income markets to heightened volatility and reduced liquidity for certain fixed income investments, particularly those with longer maturities. In addition, decreases in fixed income dealer market-making capacity may also potentially lead to heightened volatility and reduced liquidity in the fixed income markets. As |
a result, the value of the underlying fund’s investments and share price may decline. Changes in central bank policies could also result in higher than normal shareholder redemptions, which could potentially increase portfolio turnover and the underlying fund’s transaction costs. |
| n | Collateralized loan obligations risk. In addition to the normal interest rate, default and other risks of fixed income securities, collateralized loan obligations carry additional risks, including the possibility that distributions from collateral securities will not be adequate to make interest or other payments, the quality of the collateral may decline in value or default, an underlying fund may invest in collateralized loan obligations that are subordinate to other classes, values may be volatile, and disputes with the issuer may produce unexpected investment results. |
| n | Commodities tax risk. The tax treatment of commodity-linked derivative instruments may be adversely affected by changes in legislation, regulations or other legally binding authority. If, as a result of any such adverse action, the income of an underlying fund from certain commodity-linked derivatives was treated as non-qualifying income, an underlying fund that invests in commodity-linked derivatives to a significant degree might fail to qualify as a regulated investment company and be subject to federal income tax at the fund level. The Internal Revenue Service has issued a number of private letter rulings to other mutual funds, including to another Invesco fund (upon which only the fund that received the private letter ruling can rely), which indicate that income from a fund’s investment in certain commodity linked notes and a wholly owned foreign subsidiary that invests in commodity-linked derivatives constitutes qualifying income. However, the Internal Revenue Service suspended issuance of any further private letter rulings in July 2011 pending a review of its position. Should the Internal Revenue Service issue guidance, or Congress enact legislation, that adversely affects the tax treatment of an underlying fund’s use of commodity-linked notes or a wholly-owned subsidiary (which guidance might be applied to the underlying fund retroactively), it could limit the underlying fund’s ability to pursue its investment strategy and the underlying fund might not qualify as a regulated investment company for |
one or more years. In this event, the underlying fund’s Board of Trustees may authorize a significant change in investment strategy or fund liquidation. The underlying fund also may incur transaction and other costs to comply with any new or additional guidance from the Internal Revenue Service. |
| n | Commodity risk. Certain of the underlying fund’s significant investment exposure to the commodities markets and/ or a particular sector of the commodities markets, may subject the underlying fund to greater volatility than investments in traditional securities, such as stocks and bonds. The commodities markets may fluctuate widely based on a variety of factors, including changes in overall market movements, domestic and foreign political and economic events and policies, war, acts of terrorism, changes in domestic or foreign interest rates and/or investor expectations concerning interest rates, domestic and foreign inflation rates and investment and trading activities of mutual funds, hedge funds and commodities funds. Prices of various commodities may also be affected by factors such as drought, floods, weather, livestock disease, embargoes, tariffs and other regulatory developments. The prices of commodities can also fluctuate widely due to supply and demand disruptions in major producing or consuming regions. Because certain of the underlying fund’s performance is linked to the performance of potentially volatile commodities, investors should be willing to assume the risks of potentially significant fluctuations in the value of the underlying fund’s shares. |
| n | Commodity-linked notes risk. An underlying fund’s investments in commodity-linked notes may involve substantial risks, including risk of loss of a significant portion of their principal value. In addition to risks associated with the underlying commodities, they may be subject to additional special risks, such as the lack of a secondary trading market and temporary price distortions due to speculators and/or the continuous rolling over of futures contracts underlying the notes. Commodity-linked notes are also subject to counterparty risk, which is the risk that the other party to the contract will not fulfill its contractual obligation to complete the transaction with an underlying fund. |
| n | Concentration risk. To the extent, an underlying fund invests a greater amount in any one sector or industry, |
| 6 | Invesco Alternative Strategies Fund |
an underlying fund’s performance will depend to a greater extent on the overall condition of the sector or industry, and there is increased risk to an underlying fund if conditions adversely affect that sector or industry. |
| n | Convertible securities risk. The value of an underlying fund that owns convertible securities may be affected by market interest rates, the risk that the issuer will default, the value of the underlying stock or the right of the issuer to buy back the convertible securities. |
| n | Correlation risk. Changes in the value of two investments or asset classes may not track or offset each other in the manner anticipated by the portfolio managers. Because an underlying fund’s investment strategy seeks to balance risk across three asset classes and, within each asset class, to balance risk across different countries and commodities, to the extent either the three asset classes or the selected countries and commodities are correlated in a way not anticipated by the portfolio managers an underlying fund’s risk allocation process may not succeed in achieving its investment objective. |
| n | Credit risk. The issuer of instruments in which the underlying fund invests may be unable to meet interest and/or principal payments, thereby causing its instruments to decrease in value and lowering the issuer’s credit rating. |
| n | Credit linked notes risk. Risks of credit linked notes include those risks associated with the underlying reference obligation including but not limited to market risk, interest rate risk, credit risk, default risk and foreign currency risk. In the case of a credit linked note created with credit default swaps, the structure will be “funded” such that the par amount of the security will represent the maximum loss that could be incurred on the investment and no leverage is introduced. An investor, such as an underlying fund, in a credit linked note bears counterparty risk or the risk that the issuer of the credit linked note will default or become bankrupt and not make timely payment of principal and interest of the structured security. |
| n | Currency/exchange rate risk. The dollar value of an underlying fund’s foreign investments will be affected by changes in the exchange rates between the dollar and the currencies in which those investments are traded. |
| n | Defaulted securities risk. Defaulted |
securities involve the substantial risk that principal will not be repaid. Defaulted securities and any securities received in an exchange for such securities may be subject to restrictions on resale. |
| n | Depositary receipts risk. The use of depositary receipts by an underlying fund involves many of the same risks as those associated with an underlying fund’s direct investment in foreign securities. In addition, the underlying issuers of certain depositary receipts, particularly unsponsored or unregistered depositary receipts, are under no obligation to distribute shareholder communications to the holders of such receipts or to pass through to them any voting rights with respect to the deposited securities. |
| n | Derivatives risk. The value of a derivative instrument depends largely on (and is derived from) the value of an underlying security, currency, commodity, interest rate, index or other asset (each referred to as an underlying asset). In addition to risks relating to the underlying assets, the use of derivatives may include other, possibly greater, risks, including counterparty, leverage and liquidity risks. Counterparty risk is the risk that the counterparty to the derivative contract will default on its obligation to pay an underlying fund the amount owed or otherwise perform under the derivative contract. Derivatives create leverage risk because they do not require payment up front equal to the economic exposure created by owning the derivative. As a result, an adverse change in the value of the underlying asset could result in the underlying fund sustaining a loss that is substantially greater than the amount invested in the derivative, which may make an underlying fund’s returns more volatile and increase the risk of loss. Derivative instruments may also be less liquid than more traditional investments and the underlying fund may be unable to sell or close out its derivative positions at a desirable time or price. This risk may be more acute under adverse market conditions, during which the underlying fund may be most in need of liquidating its derivative positions. Derivatives may also be harder to value, less tax efficient and subject to changing government regulation that could impact the underlying fund’s ability to use certain derivatives or their cost. Also, derivatives used for hedging or to gain or limit exposure to |
a particular market segment may not provide the expected benefits, particularly during adverse market conditions. These risks are greater for certain underlying funds than mutual funds that do not use derivative instruments or that use derivative instruments to a lesser extent than certain underlying funds to implement their investment strategy. |
| n | Developing/emerging markets securities risk. The prices of securities issued by foreign companies and governments located in developing/emerging market countries held by an underlying fund may be affected more negatively by inflation, devaluation of their currencies, higher transaction costs, delays in settlement, adverse political developments, the introduction of capital controls, withholding taxes, nationalization of private assets, expropriation, social unrest, war or lack of timely information than those in developed countries. |
| n | Exchange-traded notes risk. Exchange-traded notes are subject to credit risk, including the credit risk of the issuer, and the value of the exchange-traded note may drop due to a downgrade in the issuer’s credit rating, despite the underlying market benchmark or strategy remaining unchanged. The value of an exchange-traded note may also be influenced by time to maturity, level of supply and demand for the exchange-traded note, volatility and lack of liquidity in the underlying market, changes in the applicable interest rates, changes in the issuer’s credit rating, and economic, legal, political, or geographic events that affect the referenced underlying market or strategy. Exchange-traded notes are also subject to counterparty risk. Exchange-traded notes are also subject to the risk that the other party to the contract will not fulfill its contractual obligations, which may cause losses or additional costs to an underlying fund. |
| n | Foreign currency tax risk. If the US Treasury Department were to exercise its authority to issue regulations that exclude from the definition of “qualifying income” foreign currency gains not directly related to an underlying fund’s business of investing in securities, the underlying fund may be unable to qualify as a regulated investment company for one or more years. In this event, the underlying fund’s Board of Trustees may authorize a significant change in |
continued on page 8
| 7 | Invesco Alternative Strategies Fund |
continued from page 7
investment strategy or fund liquidation. |
| n | Foreign government debt risk. Investments in foreign government debt obligations involve certain risks in addition to those relating to foreign securities or debt securities generally. The issuer of the debt or the governmental authorities that control the repayment of the debt may be unable or unwilling to repay principal or interest when due in accordance with the terms of such debt, and an underlying fund may have limited recourse in the event of a default against the defaulting government. Without the approval of debt holders, some governmental debtors have in the past been able to reschedule or restructure their debt payments or declare moratoria on payments. |
| n | Foreign securities risk. An underlying fund’s foreign investments may be affected by changes in a foreign country’s exchange rates, political and social instability; changes in economic or taxation policies, difficulties when enforcing obligations, decreased liquidity, and increased volatility. Foreign companies may be subject to less regulation resulting in less publicly available information about the companies. |
| n | Geographic focus risk. From time to time an underlying fund may invest a substantial amount of its assets in securities of issuers located in a single country or a limited number of countries. If an underlying fund focuses its investments in this manner, it assumes the risk that economic, political and social conditions in those countries will have a significant impact on its investment performance. An underlying fund’s investment performance may also be more volatile if it focuses its investments in certain countries, especially emerging market countries. |
| n | High yield bond (junk bond) risk. An underlying fund’s investment in junk bonds involves a greater risk of default or price changes due to changes in the credit quality of the issuer. The values of junk bonds fluctuate more than those of high-quality bonds in response to company, political, regulatory or economic developments. Values of junk bonds can decline significantly over short periods of time. |
| n | Indexing risk. Unlike many investment companies, an underlying fund that is an “index” fund does not utilize an investing strategy that seeks returns in excess of the underlying index that the underlying fund is designed to track. |
Therefore, it would not necessarily sell a security unless that security is removed from the underlying index. An underlying index fund’s return may not match the return of the underlying index. An underlying index fund’s use of a representative sampling approach will result in its holding a smaller number of securities than are in the underlying index. As a result, an adverse development respecting an issuer of securities held by an underlying index fund could result in a greater decline in NAV than would be the case if an underlying fund held all of the securities in the underlying index. To the extent the assets in an underlying fund are smaller, these risks will be greater. |
| n | Interest rate risk. Interest rate risk refers to the risk that bond prices generally fall as interest rates rise; conversely, bond prices generally rise as interest rates fall. Specific bonds differ in their sensitivity to changes in interest rates depending on their individual characteristics, including duration. This risk may be magnified due to an underlying fund’s use of derivatives that provide leveraged exposure to government bonds. |
| n | Investing in the European Union risk. To the extent an underlying fund invests in countries in the European Union, the underlying fund may face increased susceptibility to high economic risks associated with high levels of debt, notably due to investments in sovereign debts of European countries such as Greece, Italy and Spain. One or more member states might exit the European Union, placing its currency and banking system in jeopardy. The European Union faces major issues involving its membership, structure, procedures and policies, including the adoption, abandonment or adjustment of the new constitutional treaty, the European Union’s enlargement to the south and east, and resolution of the European Union’s problematic fiscal and democratic accountability. Efforts of the member states to further unify their economic and monetary policies may increase the potential for the downward movement of one member state’s market to cause a similar effect on other member states’ markets. European countries that are part of the European Economic and Monetary Union may be significantly affected by the tight fiscal and monetary controls that the union seeks to impose on its members. |
| n | Leverage risk. Leverage exists when an underlying fund purchases or sells an instrument or enters into a transaction without investing cash in an amount equal to the full economic exposure of the instrument or transaction and the underlying fund could lose more than it invested. Leverage created from borrowing or certain types of transactions or instruments may impair an underlying fund’s liquidity, cause it to liquidate positions at an unfavorable time, increase volatility or otherwise not achieve its intended objective. |
| n | Liquidity risk. An underlying fund may hold illiquid securities that it is unable to sell at the preferred time or price and could lose its entire investment in such securities. An underlying fund’s significant use of derivative instruments may cause liquidity risk to be greater than other mutual funds that invest in more traditional assets such as stocks and bonds, which trade on markets with more participants. |
| n | Management risk. The investment techniques and risk analysis used by the underlying funds’ portfolio managers may not produce the desired results. In particular, there is no guarantee that the underlying funds’ portfolio manager’s investment selection process will produce a portfolio effective at achieving the underlying fund’s respective investment objective. In addition, certain underlying funds’ investment strategies will likely cause the underlying fund to underperform the broader equity markets in which the underlying fund invests during market rallies. Further, the portfolio managers’ use of short derivative positions and instruments that provide economic leverage increases the volatility of an underlying fund’s net asset value, which increases the potential of greater losses that may cause an underlying fund to liquidate positions when it may not be advantageous to do so. |
| n | Market risk. The prices of and the income generated by an underlying fund’s securities may decline in response to, among other things, investor sentiment, general economic and market conditions, regional or global instability, and currency and interest rate fluctuations in the various markets in which the underlying funds invest. |
| n | Mortgage- and asset-backed securities risk. Certain of the underlying funds may invest in mortgage and asset-backed securities that are subject to |
| 8 | Invesco Alternative Strategies Fund |
prepayment or call risk, which is the risk that the borrower’s payments may be received earlier or later than expected due to changes in prepayment rates on underlying loans. Faster prepayments often happen when interest rates are falling. As a result, an underlying fund may reinvest these early payments at lower interest rates, thereby reducing the underlying fund’s income. Conversely, when interest rates rise, prepayments may happen more slowly, causing the security to lengthen in duration. Longer duration securities tend to be more volatile. |
| n | Non-diversification risk. Certain of the underlying funds are non-diversified and can invest a greater portion of their assets in a small number of issuers or a single issuer. A change in the value of the issuer could affect the value of an underlying fund more than if it was a diversified fund. |
| n | Participation notes risk. An underlying fund’s investments in participation notes involve the same risks associated with a direct investment in the underlying security, currency or market they seek to replicate. In addition, the underlying fund has no rights under participation notes against the issuer of the underlying security and is subject to the creditworthiness of the issuing bank or broker-dealer. |
| n | Preferred securities risk. Preferred securities may include provisions that permit the issuer, in its discretion, to defer or omit distributions for a certain period of time. If an underlying fund owns a security that is deferring or omitting its distributions, an underlying fund may be required to report the distribution on its tax returns, even though it may not have received this income. Further, preferred securities may lose substantial value due to the omission or deferment of dividend payments. |
| n | Prepayment risk. An issuer’s ability to prepay principal on a loan or debt security prior to maturity can limit an underlying fund’s potential gains. Prepayments may require the underlying fund to replace the loan or debt security with a lower yielding security, adversely affecting an underlying fund’s yield. |
| n | REIT risk/real estate risk. Investments in real estate related instruments may be affected by economic, legal, cultural, environmental or technological factors that affect property values, rents or occupancies of real estate related to |
and underlying fund’s holdings. Real estate companies, including REITs or similar structures, tend to be small and mid-cap companies, and their shares may be more volatile and less liquid. The value of investments in real estate related companies may be affected by the quality of management, the ability to repay loans, the utilization of leverage and financial covenants related thereto, whether the company carries adequate insurance and environmental factors. If a real estate related company defaults, an underlying fund may own real estate directly, which involves the following additional risks: environmental liabilities; difficulty in valuing and selling the real estate; and economic or regulatory changes. |
| n | Short sales risk. Short sales may cause an underlying fund to repurchase a security at a higher price, thereby causing the underlying fund to incur a loss. A short position in a security poses more risk than holding the same security long. As there is no limit on how much the price of the security can increase, an underlying fund’s exposure is unlimited. In order to establish a short position in a security, an underlying fund must borrow the security from a broker. The underlying fund may not always be able to borrow a security the underlying fund seeks to sell short at a particular time or at an acceptable price. An underlying fund also may not always be able to close out the short position by replacing the borrowed securities at a particular time or at an acceptable price. An underlying fund will incur increased transaction costs associated with selling securities short. In addition, taking short positions in securities results in a form of leverage which may cause an underlying fund to be volatile. |
| n | Small- and mid-capitalization risks. Stocks of small- and mid-sized companies tend to be more vulnerable to adverse developments and may have little or no operating history or track record of success, and limited product lines, markets, management and financial resources. The securities of small- and mid-sized companies held by an underlying fund may be more volatile due to less market interest and less publicly available information about the issuer. They also may be illiquid or restricted as to resale, or may trade less frequently and in smaller volumes, all of which may cause difficulty when |
establishing or closing a position at a desirable price. |
| n | Subsidiary risk. Certain underlying funds invest in wholly owned subsidiaries to gain exposure to commodities and other non-securities in amounts greater than could be held directly by the underlying funds. By investing in the subsidiary, an underlying fund is indirectly exposed to risks associated with the subsidiary’s investments. The subsidiary is not registered under the Investment Company Act of 1940, as amended (1940 Act), and except as otherwise noted in the underlying fund’s prospectus, is not subject to the investor protections of the 1940 Act. Changes in the laws of the United States and/or the Cayman Islands, under which the underlying fund and the subsidiary, respectively, are organized, could result in the inability of the underlying fund and/or the subsidiary to operate as described in the underlying fund prospectus and SAI and could negatively affect the underlying fund and, therefore, the Fund. |
| n | US government obligations risk. Underlying funds that invest in derivatives may hold significant positions in obligations issued by US government agencies and instrumentalities. These obligations may receive varying levels of support from the government, which could affect an underlying fund’s ability to recover should they default. |
| n | Volatility risk. An underlying fund may have investments that appreciate or decrease significantly in value over short periods of time. This may cause an underlying fund’s net asset value per share to experience significant increases or declines in value over short periods of time. |
About indexes used in this report
| n | The Citigroup 90-Day Treasury Bill Index is an unmanaged index representative of three-month Treasury bills. |
| n | The Lipper Alternative Multi-Strategy Funds Classification Average represents an average of all funds in the Lipper Alternative Multi-Strategy Funds classification. |
| n | The Fund is not managed to track the performance of any particular index, including the index(es) described here, and consequently, the performance of the Fund may deviate significantly from the performance of the index(es). |
continued on page 10
| 9 | Invesco Alternative Strategies Fund |
continued from page 9
| n | A direct investment cannot be made in an index. Unless otherwise indicated, index results include reinvested dividends, and they do not reflect sales charges. Performance of the peer group, if applicable, reflects fund expenses; performance of a market index does not. |
Other information
| n | The returns shown in management’s discussion of Fund performance are based on net asset values (NAVs) calculated for shareholder transactions. Generally accepted accounting principles require adjustments to be made to the net assets of the Fund at period end for financial reporting purposes, and as such, the NAVs for shareholder transactions and the returns based on those NAVs may differ from the NAVs and returns reported in the Financial Highlights. |
| 10 | Invesco Alternative Strategies Fund |
Schedule of Investments
December 31, 2014
Invesco Alternative Strategies Fund
Schedule of Investments in Affiliated Issuers–105.28%(a)
| % of Net Assets 12/31/14 | Value 10/14/14 (Commencement Date) | Purchases at Cost | Proceeds from Sales | Change in Unrealized Appreciation (Depreciation) | Realized Gain (Loss) | Dividend Income | Shares 12/31/14 | Value 12/31/14 | ||||||||||||||||||||||||||||
Alternative Funds-4.23% | ||||||||||||||||||||||||||||||||||||
Powershares DB Base Metals Fund-ETF(b) | 2.43 | % | $ | — | $ | 13,374 | $ | — | $ | (726 | ) | $ | — | $ | — | 795 | $ | 12,648 | ||||||||||||||||||
Powershares DB Silver Fund-ETF(b) | 1.80 | % | — | 10,180 | — | (805 | ) | — | — | 371 | 9,375 | |||||||||||||||||||||||||
Total Alternative Funds | — | 23,554 | — | (1,531 | ) | — | — | 1,166 | 22,023 | |||||||||||||||||||||||||||
Asset Allocation Funds–31.04% |
| |||||||||||||||||||||||||||||||||||
Invesco Balanced–Risk Allocation Fund | 13.91 | % | — | 81,344 | (4,753 | ) | (3,775 | ) | 3,044 | 1,580 | 6,210 | 72,352 | ||||||||||||||||||||||||
Invesco Balanced–Risk Commodity Strategy Fund(b) | 2.34 | % | — | 12,903 | — | (728 | ) | — | — | 1,628 | 12,175 | |||||||||||||||||||||||||
Invesco Global Markets Strategy Fund | 14.79 | % | — | 78,906 | (2,500 | ) | 581 | 1,188 | 1,269 | 7,538 | 76,889 | |||||||||||||||||||||||||
Total Asset Allocation Funds | — | 173,153 | (7,253 | ) | (3,922 | ) | 4,232 | 2,849 | 15,376 | 161,416 | ||||||||||||||||||||||||||
Domestic Equity Funds–22.12% |
| |||||||||||||||||||||||||||||||||||
Invesco All Cap Market Neutral Fund(b) | 18.18 | % | — | 96,389 | (1,385 | ) | (435 | ) | (9 | ) | — | 8,772 | 94,560 | |||||||||||||||||||||||
Invesco Long/Short Equity Fund | 3.94 | % | — | 19,544 | — | 921 | 5 | — | 1,808 | 20,465 | ||||||||||||||||||||||||||
Total Domestic Equity Funds | — | 115,933 | (1,385 | ) | 486 | (4 | ) | — | 10,580 | 115,025 | ||||||||||||||||||||||||||
Fixed-Income Funds–1.81% |
| |||||||||||||||||||||||||||||||||||
Invesco Floating Rate Fund | 1.81 | % | — | 9,499 | — | (106 | ) | — | 73 | 1,217 | 9,393 | |||||||||||||||||||||||||
Foreign Equity Funds–35.04% |
| |||||||||||||||||||||||||||||||||||
Invesco Global Infrastructure Fund | 3.56 | % | — | 18,140 | — | 363 | 19 | 189 | 1,776 | 18,503 | ||||||||||||||||||||||||||
Invesco Global Market Neutral Fund | 17.15 | % | — | 93,587 | (2,117 | ) | (2,204 | ) | 13 | 1,620 | 8,735 | 89,189 | ||||||||||||||||||||||||
Invesco Macro Long/Short Fund | 14.33 | % | — | 75,138 | — | (596 | ) | — | 866 | 7,560 | 74,542 | |||||||||||||||||||||||||
Total Foreign Equity Funds | — | 186,865 | (2,117 | ) | (2,437 | ) | 32 | 2,675 | 18,071 | 182,234 | ||||||||||||||||||||||||||
Real Estate Funds–3.84% |
| |||||||||||||||||||||||||||||||||||
Invesco Global Real Estate Fund | 3.84 | % | — | 19,756 | — | 213 | — | 338 | 1,538 | 19,969 | ||||||||||||||||||||||||||
Money Market Funds–7.20% |
| |||||||||||||||||||||||||||||||||||
Liquid Assets Portfolio–Institutional Class | 3.60 | % | — | 254,639 | (235,930 | ) | — | — | 1 | 18,709 | 18,709 | |||||||||||||||||||||||||
Premier Portfolio–Institutional Class | 3.60 | % | — | 254,639 | (235,930 | ) | — | — | 1 | 18,709 | 18,709 | |||||||||||||||||||||||||
Total Money Market Funds | — | 509,278 | (471,860 | ) | — | — | 2 | 37,418 | 37,418 | |||||||||||||||||||||||||||
TOTAL INVESTMENTS IN AFFILIATED ISSUERS (Cost $554,775) | 105.28 | % | $ | — | $ | 1,038,038 | $ | (482,615 | ) | $ | (7,297 | ) | $ | 4,260 | (c) | $ | 5,937 | $ | 547,478 | |||||||||||||||||
OTHER ASSETS LESS LIABILITIES | (5.28 | )% | (27,456 | ) | ||||||||||||||||||||||||||||||||
NET ASSETS | 100.00 | % | $ | 520,022 | ||||||||||||||||||||||||||||||||
Investment Abbreviations:
ETF — Exchange Traded Fund
Notes to Schedule of Investments:
| (a) | Each underlying fund and the Fund are affiliated by either having the same investment adviser or an investment adviser under common control with the Fund’s investment adviser. The Fund invests in Class R6 shares of the mutual funds listed and the Fund shares of the exchange-traded funds. |
| (b) | Non-income producing security. A security is determined to be non-income producing if the security has not declared a distribution in more than one year from the report date. |
| (c) | Includes $3,508, $1,286, $5, $19 and $90 of capital gains distributions from affiliated underlying funds for Invesco Balanced-Risk Allocation Fund, Invesco Global Markets Strategy Fund, Invesco Long/Short Equity Fund, Invesco Global Infrastructure Fund and Invesco Global Market Neutral Fund, respectively. |
See accompanying Notes to Financial Statements which are an integral part of the financial statements.
11 Invesco Alternative Strategies Fund
Statement of Assets and Liabilities
December 31, 2014
Assets: |
| |||
Investments in affiliated underlying funds, at value (Cost $554,775) | $ | 547,478 | ||
Receivable for: | ||||
Dividends — affiliated underlying funds | 38 | |||
Investment for trustee deferred compensation and retirement plans | 722 | |||
Other assets | 85,946 | |||
Total assets | 634,184 | |||
Liabilities: |
| |||
Payable for: | ||||
Investments purchased — affiliated underlying funds | 27,173 | |||
Accrued fees to affiliates | 59,384 | |||
Accrued trustees’ and officers’ fees and benefits | 149 | |||
Accrued other operating expenses | 26,734 | |||
Trustee deferred compensation and retirement plans | 722 | |||
Total liabilities | 114,162 | |||
Net assets applicable to shares outstanding | $ | 520,022 | ||
Net assets consist of: |
| |||
Shares of beneficial interest | $ | 526,136 | ||
Undistributed net investment income | (625 | ) | ||
Undistributed net realized gain | 1,808 | |||
Net unrealized appreciation (depreciation) | (7,297 | ) | ||
| $ | 520,022 | |||
Net Assets: |
| |||
Class A | $ | 152,309 | ||
Class C | $ | 20,670 | ||
Class R | $ | 18,004 | ||
Class Y | $ | 309,117 | ||
Class R5 | $ | 9,961 | ||
Class R6 | $ | 9,961 | ||
Shares outstanding, $0.01 par value per share, |
| |||
Class A | 15,306 | |||
Class C | 2,078 | |||
Class R | 1,809 | |||
Class Y | 31,028 | |||
Class R5 | 1,001 | |||
Class R6 | 1,001 | |||
Class A: | ||||
Net asset value per share | $ | 9.95 | ||
Maximum offering price per share | ||||
(Net asset value of $9.95 ¸ 94.50%) | $ | 10.53 | ||
Class C: | ||||
Net asset value and offering price per share | $ | 9.95 | ||
Class R: | ||||
Net asset value and offering price per share | $ | 9.95 | ||
Class Y: | ||||
Net asset value and offering price per share | $ | 9.96 | ||
Class R5: | ||||
Net asset value and offering price per share | $ | 9.95 | ||
Class R6: | ||||
Net asset value and offering price per share | $ | 9.95 | ||
See accompanying Notes to Financial Statements which are an integral part of the financial statements.
12 Invesco Alternative Strategies Fund
Statement of Operations
For the period October 14, 2014 (commencement date) through December 31, 2014
Investment income: |
| |||
Dividends from affiliated underlying funds | $ | 5,937 | ||
Other Income | 24 | |||
Total investment income | 5,961 | |||
Expenses: | ||||
Advisory fees | 120 | |||
Administrative services fees | 10,822 | |||
Custodian fees | 1,089 | |||
Distribution fees: | ||||
Class A | 74 | |||
Class C | 43 | |||
Class R | 12 | |||
Transfer agent fees — A, C, R and Y | 752 | |||
Transfer agent fees — R5 | 2 | |||
Transfer agent fees — R6 | 2 | |||
Trustees’ and officers’ fees and benefits | 4,040 | |||
Registration and filing fees | 22,912 | |||
Reports to shareholders | 5,997 | |||
Professional services fees | 27,988 | |||
Other | 4,046 | |||
Total expenses | 77,899 | |||
Less: Fees waived and expenses reimbursed | (77,555 | ) | ||
Net expenses | 344 | |||
Net investment income | 5,617 | |||
Realized and unrealized gain (loss) from investments in affiliated underlying fund shares | ||||
Net realized gain (loss) on sales of affiliated underlying fund shares | (648 | ) | ||
Net realized gain from distributions of affiliated underlying fund shares | 4,908 | |||
| 4,260 | ||||
Change in net unrealized appreciation (depreciation) of affiliated underlying fund shares | (7,297 | ) | ||
Net gain (loss) from affiliated underlying funds | (3,037 | ) | ||
Net increase in net assets resulting from operations | $ | 2,580 | ||
See accompanying Notes to Financial Statements which are an integral part of the financial statements.
13 Invesco Alternative Strategies Fund
Statement of Changes in Net Assets
For the period October 14, 2014 (commencement date) through December 31, 2014
| October 14, 2014 (commencement date) through December 31, 2014 | ||||
Operations: |
| |||
Net investment income | $ | 5,617 | ||
Net realized gain | 4,260 | |||
Change in net unrealized appreciation (depreciation) | (7,297 | ) | ||
Net increase in net assets resulting from operations | 2,580 | |||
Distributions to shareholders from net investment income: | ||||
Class A | (2,664 | ) | ||
Class C | (356 | ) | ||
Class R | (183 | ) | ||
Class Y | (5,449 | ) | ||
Class R5 | (193 | ) | ||
Class R6 | (193 | ) | ||
Total distributions from net investment income | (9,038 | ) | ||
Share transactions–net: | ||||
Class A | 153,374 | |||
Class C | 20,746 | |||
Class R | 18,066 | |||
Class Y | 314,262 | |||
Class R5 | 10,016 | |||
Class R6 | 10,016 | |||
Net increase in net assets resulting from share transactions | 526,480 | |||
Net increase in net assets | 520,022 | |||
Net assets: | ||||
Beginning of period | — | |||
End of period (includes undistributed net investment income of $(625)) | $ | 520,022 | ||
Notes to Financial Statements
December 31, 2014
NOTE 1—Significant Accounting Policies
Invesco Alternative Strategies Fund (the “Fund”) is a series portfolio of AIM Growth Series (Invesco Growth Series) (the “Trust”). The Trust is organized as a Delaware statutory trust and is registered under the Investment Company Act of 1940, as amended (the “1940 Act”), as an open-end series management investment company consisting of seventeen separate series portfolios, each authorized to issue an unlimited number of shares of beneficial interest. The assets, liabilities and operations of each portfolio are accounted for separately. Information presented in these financial statements pertains only to the Fund. Matters affecting each portfolio or class will be voted on exclusively by the shareholders of such portfolio or class. The Fund commenced operations on October 14, 2014.
The Fund’s primary investment objective is long-term capital appreciation. The Fund is a “fund of funds,” in that it invests in other mutual funds advised by Invesco Advisers, Inc. (the “Adviser” or “Invesco”) and exchange-traded funds advised by Invesco PowerShares Capital Management LLC (“PowerShares Capital”), an affiliate of Invesco (“underlying funds”). Invesco and PowerShares Capital are affiliates of each other as they are indirect, wholly-owned subsidiaries of Invesco Ltd. Invesco may change the Fund’s asset class allocations, the underlying funds or the target weightings in the underlying funds without shareholder approval. The underlying funds may engage in a number of investment techniques and practices, which involve certain risks. Each underlying fund’s accounting policies are outlined in the underlying fund’s financial statements and are publically available.
The Fund currently consists of six different classes of shares: Class A, Class C, Class R, Class Y, Class R5 and Class R6. Class A shares are sold with a front-end sales charge unless certain waiver criteria are met and under certain circumstances load waived shares may be subject to contingent deferred sales charges (“CDSC”). Class C shares are sold with a CDSC. Class R, Class Y, Class R5 and Class R6 shares are sold at net asset value.
The following is a summary of the significant accounting policies followed by the Fund in the preparation of its financial statements.
| A. | Security Valuations — Securities of investment companies that trade on an exchange are valued at the last sales price or official closing price as of the close of the customary trading session on the exchange where the security is principally traded. Investments in shares of funds that are not traded on an exchange are valued at the end of day net asset value per share of such fund. Securities in the underlying funds, including restricted securities, are valued in accordance with the valuation policy of such fund. The policies of the underlying funds affiliated with the Fund as a result of having the same investment adviser are set forth below. |
14 Invesco Alternative Strategies Fund
A security listed or traded on an exchange (except convertible securities) is valued at its last sales price or official closing price as of the close of the customary trading session on the exchange where the security is principally traded, or lacking any sales or official closing price on a particular day, the security may be valued at the closing bid price on that day. Securities traded in the over-the-counter market are valued based on prices furnished by independent pricing services or market makers. When such securities are valued by an independent pricing service they may be considered fair valued. Futures contracts are valued at the final settlement price set by an exchange on which they are principally traded. Listed options are valued at the mean between the last bid and ask prices from the exchange on which they are principally traded. Options not listed on an exchange are valued by an independent source at the mean between the last bid and ask prices. For purposes of determining net asset value per share, futures and option contracts generally are valued 15 minutes after the close of the customary trading session of the New York Stock Exchange (“NYSE”).
Senior secured floating rate loans and senior secured floating rate debt securities are fair valued using an evaluated quote provided by an independent pricing service. Evaluated quotes provided by the pricing service may reflect appropriate factors such as ratings, tranche type, industry, company performance, spread, individual trading characteristics, institution-size trading in similar groups of securities and other market data.
Investments in open-end and closed-end registered investment companies that do not trade on an exchange are valued at the end of day net asset value per share. Investments in open-end and closed-end registered investment companies that trade on an exchange are valued at the last sales price or official closing price as of the close of the customary trading session on the exchange where the security is principally traded.
Debt obligations (including convertible securities) and unlisted equities are fair valued using an evaluated quote provided by an independent pricing service. Evaluated quotes provided by the pricing service may be determined without exclusive reliance on quoted prices, and may reflect appropriate factors such as institution-size trading in similar groups of securities, developments related to specific securities, dividend rate (for unlisted equities), yield (for debt obligations), quality, type of issue, coupon rate (for debt obligations), maturity (for debt obligations), individual trading characteristics and other market data. Debt obligations are subject to interest rate and credit risks. In addition, all debt obligations involve some risk of default with respect to interest and/or principal payments.
Foreign securities’ (including foreign exchange contracts) prices are converted into U.S. dollar amounts using the applicable exchange rates as of the close of the NYSE. If market quotations are available and reliable for foreign exchange-traded equity securities, the securities will be valued at the market quotations. Because trading hours for certain foreign securities end before the close of the NYSE, closing market quotations may become unreliable. If between the time trading ends on a particular security and the close of the customary trading session on the NYSE, events occur that the Adviser determines are significant and make the closing price unreliable, the Fund may fair value the security. If the event is likely to have affected the closing price of the security, the security will be valued at fair value in good faith using procedures approved by the Board of Trustees. Adjustments to closing prices to reflect fair value may also be based on a screening process of an independent pricing service to indicate the degree of certainty, based on historical data, that the closing price in the principal market where a foreign security trades is not the current value as of the close of the NYSE. Foreign securities’ prices meeting the approved degree of certainty that the price is not reflective of current value will be priced at the indication of fair value from the independent pricing service. Multiple factors may be considered by the independent pricing service in determining adjustments to reflect fair value and may include information relating to sector indices, American Depositary Receipts and domestic and foreign index futures. Foreign securities may have additional risks including exchange rate changes, potential for sharply devalued currencies and high inflation, political and economic upheaval, the relative lack of issuer information, relatively low market liquidity and the potential lack of strict financial and accounting controls and standards.
Securities for which market prices are not provided by any of the above methods may be valued based upon quotes furnished by independent sources. The last bid price may be used to value equity securities. The mean between the last bid and ask prices is used to value debt obligations, including corporate loans.
Securities for which market quotations are not readily available or became unreliable are valued at fair value as determined in good faith by or under the supervision of the Trust’s officers following procedures approved by the Board of Trustees. Issuer specific events, market trends, bid/ask quotes of brokers and information providers and other market data may be reviewed in the course of making a good faith determination of a security’s fair value.
The Fund may invest in securities that are subject to interest rate risk, meaning the risk that the prices will generally fall as interest rates rise and, conversely, the prices will generally rise as interest rates fall. Specific securities differ in their sensitivity to changes in interest rates depending on their individual characteristics. Changes in interest rates may result in increased market volatility, which may affect the value and/or liquidity of certain of the Fund’s investments.
Valuations change in response to many factors including the historical and prospective earnings of the issuer, the value of the issuer’s assets, general economic conditions, interest rates, investor perceptions and market liquidity. Because of the inherent uncertainties of valuation, the values reflected in the financial statements may materially differ from the value received upon actual sale of those investments.
| B. | Securities Transactions and Investment Income — Securities transactions are accounted for on a trade date basis. Realized gains or losses on sales are computed on the basis of specific identification of the securities sold. Distributions from ordinary income from underlying funds, if any, are recorded as dividend income on ex-dividend date. Distributions from gains from underlying funds, if any, are recorded as realized gains on the ex-dividend date. The following policies are followed by the underlying funds: Interest income (net of withholding tax, if any) is recorded on the accrual basis from settlement date. Bond premiums and discounts are amortized and/or accreted for financial reporting purposes. Paydown gains and losses on mortgage and asset-backed securities are recorded as adjustments to interest income. |
The Fund may periodically participate in litigation related to Fund investments. As such, the Fund may receive proceeds from litigation settlements. Any proceeds received are included in the Statement of Operations as realized gain (loss) for investments no longer held and as unrealized gain (loss) for investments still held.
The Fund allocates income and realized and unrealized capital gains and losses to a class based on the relative net assets of each class.
| C. | Distributions — Distributions from net investment income and net realized capital gain, if any, are generally declared and paid annually and recorded on the ex-dividend date. The Fund may elect to treat a portion of the proceeds from redemptions as distributions for federal income tax purposes. |
15 Invesco Alternative Strategies Fund
| D. | Federal Income Taxes — The Fund intends to comply with the requirements of Subchapter M of the Internal Revenue Code of 1986, as amended (the “Internal Revenue Code”), necessary to qualify as a regulated investment company and to distribute substantially all of the Fund’s taxable earnings to shareholders. As such, the Fund will not be subject to federal income taxes on otherwise taxable income (including net realized capital gain) that is distributed to shareholders. Therefore, no provision for federal income taxes is recorded in the financial statements. |
The Fund recognizes the tax benefits of uncertain tax positions only when the position is more likely than not to be sustained. Management has analyzed the Fund’s uncertain tax positions and concluded that no liability for unrecognized tax benefits should be recorded related to uncertain tax positions. Management is not aware of any tax positions for which it is reasonably possible that the total amounts of unrecognized tax benefits will change materially in the next 12 months.
The Fund files tax returns in the U.S. Federal jurisdiction and certain other jurisdictions. Generally, the Fund is subject to examinations by such taxing authorities for up to three years after the filing of the return for the tax period.
| E. | Expenses — Expenses included in the accompanying financial statements reflect the expenses of the Fund and do not include any expenses of the underlying funds. The effects of the underlying funds expenses are included in the realized and unrealized gain/loss on the investments in the underlying funds. Estimated expenses of the underlying funds are discussed further in Note 10. |
Fees provided for under the Rule 12b-1 plan of a particular class of the Fund and which are directly attributable to that class are charged to the operations of such class. Transfer agency fees and expenses and other shareholder recordkeeping fees and expenses attributable to Class R5 and Class R6 are allocated to each share class based on relative net assets. Transfer agency fees and expenses and other shareholder recordkeeping fees and expenses relating to all other classes are allocated among those classes based on relative net assets. All other expenses are allocated among the classes based on relative net assets.
| F. | Accounting Estimates — The preparation of financial statements in conformity with accounting principles generally accepted in the United States of America (“GAAP”) requires management to make estimates and assumptions that affect the reported amounts of assets and liabilities at the date of the financial statements and the reported amounts of revenues and expenses during the reporting period including estimates and assumptions related to taxation. Actual results could differ from those estimates by a significant amount. In addition, the Fund monitors for material events or transactions that may occur or become known after the period-end date and before the date the financial statements are released to print. |
| G. | Indemnifications — Under the Trust’s organizational documents, each Trustee, officer, employee or other agent of the Trust is indemnified against certain liabilities that may arise out of the performance of their duties to the Fund. Additionally, in the normal course of business, the Fund enters into contracts, including the Fund’s servicing agreements, that contain a variety of indemnification clauses. The Fund’s maximum exposure under these arrangements is unknown as this would involve future claims that may be made against the Fund that have not yet occurred. The risk of material loss as a result of such indemnification claims is considered remote. |
NOTE 2—Advisory Fees and Other Fees Paid to Affiliates
The Trust has entered into a master investment advisory agreement with Invesco Advisers, Inc. (the “Adviser” or “Invesco”). Under the terms of the investment advisory agreement, the Fund pays an advisory fee to the Adviser based on the annual rate of 0.15% of the Fund’s average daily net assets.
Under the terms of a master sub-advisory agreement between the Adviser and each of Invesco Asset Management Deutschland GmbH, Invesco Asset Management Limited, Invesco Asset Management (Japan) Limited, Invesco Australia Limited, Invesco Hong Kong Limited, Invesco Senior Secured Management, Inc., Invesco Canada Ltd. and PowerShares Capital (collectively, the “Affiliated Sub-Advisers”) the Adviser, not the Fund, may pay 40% of the fees paid to the Adviser to any such Affiliated Sub-Adviser(s) that provide(s) discretionary investment management services to the Fund based on the percentage of assets allocated to such Sub-Adviser(s).
The Adviser has contractually agreed, through at least October 31, 2016, to waive advisory fees and/or reimburse expenses to the extent necessary to limit total annual fund operating expenses after fee waiver and/or expense reimbursement (excluding Acquired Fund Fees and Expenses and certain items discussed below) of Class A, Class C, Class R, Class Y, Class R5 and Class R6 shares to 0.52%, 1.27%, 0.77%, 0.27%, 0.27% and 0.27% of average daily net assets, respectively. In determining the Adviser’s obligation to waive advisory fees and/or reimburse expenses, the following expenses are not taken into account, and could cause the total annual fund operating expenses after fee waiver and/or expense reimbursement to exceed the numbers reflected above: (1) interest; (2) taxes; (3) dividend expense on short sales; (4) extraordinary or non-routine items, including litigation expenses; and (5) expenses that the Fund has incurred but did not actually pay because of an expense offset arrangement. Acquired Fund Fees and Expenses are not operating expenses of the Fund directly, but are fees and expenses, including management fees of the investment companies in which the Fund invests. As a result, the total annual fund operating expenses after fee waiver and/or expense reimbursement may exceed the expense limits above. Unless Invesco continues the fee waiver agreement, it will terminate on October 31, 2016. The fee waiver agreement cannot be terminated during its term.
For the period October 14, 2014 (commencement date) through December 31, 2014, the Adviser waived advisory fees and reimbursed fund level expenses of $76,799 and reimbursed class level expenses of $295, $43, $25, $389, $2 and $2 of Class A, Class C, Class R, Class Y, Class R5 and Class R6 shares, respectively.
The Trust has entered into a master administrative services agreement with Invesco pursuant to which the Fund has agreed to pay Invesco for certain administrative costs incurred in providing accounting services to the Fund. For the period October 14, 2014 (commencement date) through December 31, 2014, expenses incurred under the agreement are shown in the Statement of Operations as Administrative services fees.
The Trust has entered into a transfer agency and service agreement with Invesco Investment Services, Inc. (“IIS”) pursuant to which the Fund has agreed to pay IIS a fee for providing transfer agency and shareholder services to the Fund and reimburse IIS for certain expenses incurred by IIS in the course of providing such services. IIS may make payments to intermediaries that provide omnibus account services, sub-accounting services and/or networking services. All fees payable by IIS to intermediaries that provide omnibus account services or sub-accounting are charged back to the Fund, subject to certain limitations approved by the Trust’s Board of Trustees. For the period October 14, 2014 (commencement date) through December 31, 2014, expenses incurred under the agreement are shown in the Statement of Operations as Transfer agent fees.
16 Invesco Alternative Strategies Fund
The Trust has entered into master distribution agreements with Invesco Distributors, Inc. (“IDI”) to serve as the distributor for the Class A, Class C, Class R, Class Y, Class R5 and Class R6 shares of the Fund. The Trust has adopted plans pursuant to Rule 12b-1 under the 1940 Act with respect to the Fund’s Class A, Class C and Class R shares (collectively, the “Plans”). The Fund, pursuant to the Plans, pays IDI compensation at the annual rate of 0.25% of the Fund’s average daily net assets of Class A shares, 1.00% of the average daily net assets of Class C shares and 0.50% of the average daily net assets of Class R shares. Of the Plan payments, up to 0.25% of the average daily net assets of each class of shares may be paid to furnish continuing personal shareholder services to customers who purchase and own shares of such classes. Any amounts not paid as a service fee under the Plans would constitute an asset-based sales charge. Rules of the Financial Industry Regulatory Authority (“FINRA”) impose a cap on the total sales charges, including asset-based sales charges, that may be paid by any class of shares of the Fund. For the period October 14, 2014 (commencement date) through December 31, 2014, expenses incurred under the Plans are shown in the Statement of Operations as Distribution fees.
Front-end sales commissions and CDSC (collectively, the “sales charges”) are not recorded as expenses of the Fund. Front-end sales commissions are deducted from proceeds from the sales of Fund shares prior to investment in Class A shares of the Fund. CDSC are deducted from redemption proceeds prior to remittance to the shareholder. During the period October 14, 2014 (commencement date) through December 31, 2014, IDI advised the Fund that IDI retained $183 in front-end sales commissions from the sale of Class A shares.
The underlying Invesco funds pay no distribution fees for Class Y and Class R6, and the Fund pays no sales loads or other similar compensation to IDI for acquiring underlying fund shares.
For the period October 14, 2014 (commencement date) through December 31, 2014, the Fund incurred $12 in brokerage commissions with Invesco Capital Markets, Inc., an affiliate of the Adviser and IDI, for portfolio transactions executed on behalf of the Fund.
Certain officers and trustees of the Trust are officers and directors of the Adviser, IIS and/or IDI.
NOTE 3—Additional Valuation Information
GAAP defines fair value as the price that would be received to sell an asset or paid to transfer a liability in an orderly transaction between market participants at the measurement date, under current market conditions. GAAP establishes a hierarchy that prioritizes the inputs to valuation methods, giving the highest priority to readily available unadjusted quoted prices in an active market for identical assets (Level 1) and the lowest priority to significant unobservable inputs (Level 3), generally when market prices are not readily available or are unreliable. Based on the valuation inputs, the securities or other investments are tiered into one of three levels. Changes in valuation methods may result in transfers in or out of an investment’s assigned level:
| Level 1 — | Prices are determined using quoted prices in an active market for identical assets. |
| Level 2 — | Prices are determined using other significant observable inputs. Observable inputs are inputs that other market participants may use in pricing a security. These may include quoted prices for similar securities, interest rates, prepayment speeds, credit risk, yield curves, loss severities, default rates, discount rates, volatilities and others. |
| Level 3 — | Prices are determined using significant unobservable inputs. In situations where quoted prices or observable inputs are unavailable (for example, when there is little or no market activity for an investment at the end of the period), unobservable inputs may be used. Unobservable inputs reflect the Fund’s own assumptions about the factors market participants would use in determining fair value of the securities or instruments and would be based on the best available information. |
As of December 31, 2014, all of the securities in this Fund were valued based on Level 1 inputs (see the Schedule of Investments for security categories). The level assigned to the securities valuations may not be an indication of the risk or liquidity associated with investing in those securities.
NOTE 4—Trustees’ and Officers’ Fees and Benefits
Trustees’ and Officers’ Fees and Benefits include amounts accrued by the Fund to pay remuneration to certain Trustees and Officers of the Fund. Trustees have the option to defer compensation payable by the Fund, and Trustees’ and Officers’ Fees and Benefits also include amounts accrued by the Fund to fund such deferred compensation amounts. Those Trustees who defer compensation have the option to select various Invesco Funds in which their deferral accounts shall be deemed to be invested. Obligations under the deferred compensation plan represents unsecured claims against the general assets of the Fund.
NOTE 5—Cash Balances
The Fund is permitted to temporarily carry a negative or overdrawn balance in its account with State Street Bank and Trust Company, the custodian bank. Such balances, if any at period end, are shown in the Statement of Assets and Liabilities under the payable caption Amount due custodian. To compensate the custodian bank for such overdrafts, the overdrawn Fund may either (1) leave funds as a compensating balance in the account so the custodian bank can be compensated by earning the additional interest; or (2) compensate by paying the custodian bank at a rate agreed upon by the custodian bank and Invesco, not to exceed the contractually agreed upon rate.
17 Invesco Alternative Strategies Fund
NOTE 6—Distributions to Shareholders and Tax Components of Net Assets
Tax Character of Distributions to Shareholders Paid During the Period October 14, 2014 (commencement date) through December 31, 2014:
| 2014 | ||||
Ordinary income | $ | 9,038 | ||
Tax Components of Net Assets at Period-End:
| 2014 | ||||
Undistributed ordinary income | $ | 2 | ||
Undistributed long-term gain | 2,454 | |||
Net unrealized appreciation (depreciation) — investments | (7,945 | ) | ||
Temporary book/tax differences | (625 | ) | ||
Shares of beneficial interest | 526,136 | |||
Total net assets | $ | 520,022 | ||
The difference between book-basis and tax-basis unrealized appreciation (depreciation) is due to differences in the timing of recognition of gains and losses on investments for tax and book purposes. The Fund’s net unrealized appreciation (depreciation) difference is attributable primarily to wash sales.
The temporary book/tax differences are a result of timing differences between book and tax recognition of income and/or expenses. The Fund’s temporary book/tax differences are the result of the trustee deferral of compensation and retirement plan benefits.
Capital loss carryforward is calculated and reported as of a specific date. Results of transactions and other activity after that date may affect the amount of capital loss carryforward actually available for the Fund to utilize. The ability to utilize capital loss carryforward in the future may be limited under the Internal Revenue Code and related regulations based on the results of future transactions.
The Fund did not have capital loss carryforward as of December 31, 2014.
NOTE 7—Investment Securities
The aggregate amount of investment securities (other than short-term securities, U.S. Treasury obligations and money market funds, if any) purchased and sold by the Fund during the period October 14, 2014 (commencement date) through December 31, 2014 was $528,760 and $10,755, respectively. Cost of investments on a tax basis includes the adjustments for financial reporting purposes as of the most recently completed federal income tax reporting period-end.
| Unrealized Appreciation (Depreciation) of Investment Securities on a Tax Basis | ||||
Aggregate unrealized appreciation of investment securities | $ | 2,077 | ||
Aggregate unrealized (depreciation) of investment securities | (10,022 | ) | ||
Net unrealized appreciation (depreciation) of investment securities | $ | (7,945 | ) | |
Cost of investments for tax purposes is $555,423.
NOTE 8—Reclassification of Permanent Differences
Primarily as a result of differing book/tax treatment of distributions from underlying funds, stock issuance costs and immaterial over-distributions, on December 31, 2014, undistributed net investment income was increased by $2,796, undistributed net realized gain was decreased by $2,452 and shares of beneficial interest was decreased by $344. This reclassification had no effect on the net assets of the Fund.
18 Invesco Alternative Strategies Fund
NOTE 9—Share Information
| Summary of Share Activity | ||||||||
| October 14, 2014 (commencement date) through December 31, 2014(a) | ||||||||
| Shares | Amount | |||||||
Sold: | ||||||||
Class A | 15,237 | $ | 152,686 | |||||
Class C | 2,059 | 20,563 | ||||||
Class R | 1,809 | 18,066 | ||||||
Class Y | 30,683 | 310,841 | ||||||
Class R5 | 1,001 | 10,016 | ||||||
Class R6 | 1,001 | 10,016 | ||||||
Issued as reinvestment of dividends: | ||||||||
Class A | 69 | 688 | ||||||
Class C | 19 | 183 | ||||||
Class Y | 345 | 3,421 | ||||||
Net increase in share activity | 52,223 | $ | 526,480 | |||||
| (a) | There are entities that are record owners of more than 5% of the outstanding shares of the Fund and in the aggregate own 37% of the outstanding shares of the Fund. IDI has an agreement with these entities to sell Fund shares. The Fund, Invesco and/or Invesco affiliates may make payments to these entities, which is considered to be related to the Fund, for providing services to the Fund, Invesco and/or Invesco affiliates including but not limited to services such as securities brokerage, distribution, third party record keeping and account servicing. The Fund has no knowledge as to whether all or any portion of the shares owned of record by these entities are also owned beneficially. |
| Also, 48% of the outstanding shares of the Fund are owned by the Adviser. |
NOTE 10—Financial Highlights
The following schedule presents financial highlights for a share of the Fund outstanding throughout the periods indicated.
| Net asset value, beginning of period | Net investment income(a) | Net gains (losses) on securities (both realized and unrealized) | Total from investment operations | Dividends from net investment income | Net asset value, end of period | Total return(b) | Net assets, end of period (000’s omitted) | Ratio of expenses to average net assets with fee waivers and/or expenses absorbed(c) | Ratio of expenses to average net assets without fee waivers and/or expenses absorbed | Ratio of net investment income to average net assets | Portfolio turnover(d) | |||||||||||||||||||||||||||||||||||||
Class A | ||||||||||||||||||||||||||||||||||||||||||||||||
Year ended 12/31/14(e) | $ | 10.00 | $ | 0.15 | $ | (0.01 | ) | $ | 0.14 | $ | (0.19 | ) | $ | 9.95 | 1.39 | % | $ | 152 | 0.52 | %(f) | 97.85 | %(f) | 6.96 | %(f) | 3 | % | ||||||||||||||||||||||
Class C | ||||||||||||||||||||||||||||||||||||||||||||||||
Year ended 12/31/14(e) | 10.00 | 0.14 | (0.02 | ) | 0.12 | (0.17 | ) | 9.95 | 1.23 | 21 | 1.27 | (f) | 98.60 | (f) | 6.21 | (f) | 3 | |||||||||||||||||||||||||||||||
Class R | ||||||||||||||||||||||||||||||||||||||||||||||||
Year ended 12/31/14(e) | 10.00 | 0.15 | (0.02 | ) | 0.13 | (0.18 | ) | 9.95 | 1.34 | 18 | 0.77 | (f) | 98.10 | (f) | 6.71 | (f) | 3 | |||||||||||||||||||||||||||||||
Class Y | ||||||||||||||||||||||||||||||||||||||||||||||||
Year ended 12/31/14(e) | 10.00 | 0.16 | (0.01 | ) | 0.15 | (0.19 | ) | 9.96 | 1.54 | 309 | 0.27 | (f) | 97.60 | (f) | 7.21 | (f) | 3 | |||||||||||||||||||||||||||||||
Class R5 | ||||||||||||||||||||||||||||||||||||||||||||||||
Year ended 12/31/14(e) | 10.00 | 0.16 | (0.02 | ) | 0.14 | (0.19 | ) | 9.95 | 1.44 | 10 | 0.27 | (f) | 96.70 | (f) | 7.21 | (f) | 3 | |||||||||||||||||||||||||||||||
Class R6 | ||||||||||||||||||||||||||||||||||||||||||||||||
Year ended 12/31/14(e) | 10.00 | 0.16 | (0.02 | ) | 0.14 | (0.19 | ) | 9.95 | 1.44 | 10 | 0.27 | (f) | 96.70 | (f) | 7.21 | (f) | 3 | |||||||||||||||||||||||||||||||
| (a) | Calculated using average shares outstanding. |
| (b) | Includes adjustments in accordance with accounting principles generally accepted in the United States of America and as such, the net asset value for financial reporting purposes and the returns based upon those net asset values may differ from the net asset value and returns for shareholder transactions. Does not include sales charges and is not annualized for periods less than one year, if applicable. |
| (c) | In addition to the fees and expenses which the Fund bears directly; the Fund indirectly bears a pro rata share of the fees and expenses of the underlying funds in which the Fund invests. Because the underlying funds have varied expenses and fee levels and the Fund may own different proportions at different times, the amount of fees and expenses incurred indirectly by the Fund will vary. Estimated underlying fund expenses are not expenses that are incurred directly by your Fund. They are expenses that are incurred directly by the underlying funds and are deducted from the value of the funds your Fund invests in. The effect of the estimated underlying fund expenses that you bear indirectly is included in your Fund’s total return. Estimated acquired fund fees from underlying funds were 1.73% for the period October 14, 2014 (commencement date) through December 31, 2014. |
| (d) | Portfolio turnover is calculated at the fund level and is not annualized for periods less than one year, if applicable. |
| (e) | Commencement date of October 14, 2014. |
| (f) | Ratios are annualized and based on average daily net assets (000’s omitted) of $137, $20, $11, $180, $10 and $10 for Class A, Class C, Class R, Class Y, Class R5 and Class R6 shares, respectively. |
19 Invesco Alternative Strategies Fund
Report of Independent Registered Public Accounting Firm
To the Board of Trustees of AIM Growth Series (Invesco Growth Series)
and Shareholders of Invesco Alternative Strategies Fund:
In our opinion, the accompanying statement of assets and liabilities, including the schedule of investments, and the related statements of operations and of changes in net assets and the financial highlights present fairly, in all material respects, the financial position of Invesco Alternative Strategies Fund (one of the funds constituting AIM Growth Series (Invesco Growth Series), hereafter referred to as the “Fund”) at December 31, 2014, and the results of its operations, the changes in its net assets and the financial highlights for the period October 14, 2014 (commencement of operations) through December 31, 2014, in conformity with accounting principles generally accepted in the United States of America. These financial statements and financial highlights (hereafter referred to as “financial statements”) are the responsibility of the Fund’s management. Our responsibility is to express an opinion on these financial statements based on our audit. We conducted our audit of these financial statements in accordance with the standards of the Public Company Accounting Oversight Board (United States). Those standards require that we plan and perform the audit to obtain reasonable assurance about whether the financial statements are free of material misstatement. An audit includes examining, on a test basis, evidence supporting the amounts and disclosures in the financial statements, assessing the accounting principles used and significant estimates made by management, and evaluating the overall financial statement presentation. We believe that our audit, which included confirmation of securities at December 31, 2014 by correspondence with the custodian and transfer agent, provides a reasonable basis for our opinion.
PRICEWATERHOUSECOOPERS LLP
Houston, Texas
February 25, 2015
20 Invesco Alternative Strategies Fund
Calculating your ongoing Fund expenses
Example
As a shareholder of the Fund, you incur two types of costs: (1) transaction costs, which may include sales charges (loads) on purchase payments or contingent deferred sales charges on redemptions, if any; and (2) ongoing costs, including distribution and/or service (12b-1) fees, and other Fund expenses. This example is intended to help you understand your ongoing costs (in dollars) of investing in the Fund and to compare these costs with ongoing costs of investing in other mutual funds. The example is based on an investment of $1,000 invested at the beginning of the period and held for the entire period October 14, 2014 (commencement date) through December 31, 2014.
In addition to the fees and expenses which the Fund bears directly, the Fund indirectly bears a pro rata share of the fees and expenses of the underlying funds in which your Fund invests. The amount of fees and expenses incurred indirectly by your Fund will vary because the underlying funds have varied expenses and fee levels and the Fund may own different proportions of the underlying funds at different times. Estimated underlying fund expenses are not expenses that are incurred directly by your Fund. They are expenses that are incurred directly by the underlying funds and are deducted from the value of the underlying funds your Fund invests in. The effect of the estimated underlying fund expenses that you bear indirectly are included in your Fund’s total return.
Actual expenses
The table below provides information about actual account values and actual expenses. You may use the information in this table, together with the amount you invested, to estimate the expenses that you paid over the period. Simply divide your account value by $1,000 (for example, an $8,600 account value divided by $1,000 = 8.6), then multiply the result by the number in the table under the heading entitled “Actual Expenses Paid During Period” to estimate the expenses you paid on your account during this period (as of close of business October 14, 2014 (commencement date through December 31, 2014).
Hypothetical example for comparison purposes
The table below also provides information about hypothetical account values and hypothetical expenses based on the Fund’s actual expense ratio and an assumed rate of return of 5% per year before expenses, which is not the Fund’s actual return.
The hypothetical account values and expenses may not be used to estimate the actual ending account balance or expenses you paid for the period. You may use this information to compare the ongoing costs of investing in the Fund and other funds. To do so, compare this 5% hypothetical example with the 5% hypothetical examples that appear in the shareholder reports of the other funds.
Please note that the expenses shown in the table are meant to highlight your ongoing costs only and do not reflect any transaction costs, such as sales charges (loads) on purchase payments or contingent deferred sales charges on redemptions, if any. Therefore, the hypothetical information is useful in comparing ongoing costs only, and will not help you determine the relative total costs of owning different funds. In addition, expenses shown in the table do not include the expenses of the underlying funds, which are borne indirectly by the Fund. If transaction costs and indirect expenses were included, your costs would have been higher.
| Class | Beginning Account Value (10/14/14) | ACTUAL | HYPOTHETICAL (5% annual return before | Annualized Expense Ratio | ||||||||||||||||||||
| Ending Account Value (12/31/14)1 | Expenses Paid During Period2 | Ending Account Value (12/31/14) | Expenses Paid During Period3 | |||||||||||||||||||||
| A | $ | 1,000.00 | $ | 1,032.70 | $ | 1.14 | $ | 1,022.58 | $ | 2.65 | 0.52 | % | ||||||||||||
| C | 1,000.00 | 1,029.60 | 2.79 | 1,018.80 | 6.46 | 1.27 | ||||||||||||||||||
| R | 1,000.00 | 1,031.70 | 1.69 | 1,021.32 | 3.92 | 0.77 | ||||||||||||||||||
| Y | 1,000.00 | 1,034.70 | 0.59 | 1,023.84 | 1.38 | 0.27 | ||||||||||||||||||
| R5 | 1,000.00 | 1,033.70 | 0.59 | 1,023.84 | 1.38 | 0.27 | ||||||||||||||||||
| R6 | 1,000.00 | 1,033.70 | 0.59 | 1,023.84 | 1.38 | 0.27 | ||||||||||||||||||
| 1 | The actual ending account value is based on the actual total return of the Fund for the period October 14, 2014 (commencement date) through December 31, 2014, after actual expenses and will differ from the hypothetical ending account value which is based on the Fund’s expense ratio and a hypothetical annual return of 5% before expenses. |
| 2 | Actual expenses are equal to the Fund’s annualized expense ratio as indicated above multiplied by the average account value over the period, multiplied by 79 (as of close of business October 14, 2014 (commencement date) through December 31, 2014)/365. Because the Fund has not been in existence for a full six-month period, the actual ending account value and expense information shown may not provide a meaningful comparison to fund expense information of classes that show such data for a full six-month period and, because the actual ending account value and expense information in the expense example covers a short time period, return and expense data may not be indicative of return and expense data for longer time periods. |
| 3 | Hypothetical expenses are equal to the annualized expense ratio indicated above multiplied by the average account value over the period, multiplied by 184/365 to reflect a one-half year period. The hypothetical ending account value and expenses may be used to compare ongoing costs of investing in the Fund and other funds because such data is based on a full six-month period. |
21 Invesco Alternative Strategies Fund
Initial Approval of Investment Advisory and Sub-Advisory Agreements
The Board of Trustees (the Board) of AIM Growth Series (Invesco Growth Series) (the Company) is required under the Investment Company Act of 1940, as amended, to approve the Invesco Alternative Strategies Fund (the Fund) investment advisory agreements before the Fund can commence operations. During meetings held on October 29-30, 2013, the Board as a whole and the disinterested or “independent” Trustees voting separately approved (i) an amendment to the Company’s Master Investment Advisory Agreement with Invesco Advisers, Inc. (Invesco Advisers and the investment advisory agreement) to add the Fund, and (ii) (a) an amendment to the Master Intergroup Sub-Advisory Contract for Mutual Funds with Invesco Asset Management Deutschland GmbH, Invesco Asset Management Limited, Invesco Asset Management (Japan) Limited, Invesco Australia Limited, Invesco Hong Kong Limited, Invesco Senior Secured Management, Inc. and Invesco Canada Ltd. to add the Fund, and (b) an amendment to the Sub-Advisory Contract with Invesco PowerShares Capital Management LLC to add the Fund (the sub-advisers, the Affiliated Sub-Advisers; and the contracts, the sub-advisory contracts). In doing so, the Board followed a process similar to the process that it follows in annually reviewing and approving investment advisory agreements and sub-advisory contracts for the series portfolios of funds advised by Invesco Advisers and considered the information provided in the most recent annual review process as well as the information provided with respect to the Fund. Prior to the October 2013 meeting, the Board and its Investments Committee met on several occasions to receive, review and discuss among themselves and with Invesco Advisers the information provided with respect to the Fund. The Board (i) determined that the investment advisory agreement and sub-advisory contracts are in the best interest of the Fund and its shareholders and that the compensation payable to Invesco Advisers and the Affiliated Sub-Advisers under the Fund’s agreements is fair and reasonable and (ii) approved submission of the agreements to the initial shareholder of the Fund.
The Board’s Fund Evaluation Process
The Board’s Investments Committee has established three Sub-Committees that are responsible for overseeing the management of a number of the funds advised by Invesco Advisers (the Invesco Funds). The Fund will be assigned to one of the Sub-Committees. The Sub-Committees meet throughout the year to review the performance, fees, expenses and other matters related to their assigned Invesco Funds. Over the course of each year, the Sub-Committees meet with portfolio managers for their assigned Invesco Funds and other members of management and review with these individuals the performance, investment objective(s), policies, strategies, limitations and investment risks of these funds.
In evaluating the fairness and reasonableness of compensation under the Fund’s investment advisory agreement and sub-advisory contracts, the Board considered, among other things, the factors
discussed below. The Board was assisted in its review by the Senior Officer, an independent officer of the Invesco Funds, and by independent legal counsel. The discussion below serves as a summary of the material factors and related conclusions that formed the basis for the Board’s approval of the Fund’s investment advisory agreement and sub-advisory contracts. The Trustees’ review and conclusions are based on the comprehensive consideration of all information presented to them and are not the result of any single determinative factor. Moreover, one Trustee may have weighed a particular piece of information or factor differently than another Trustee.
Factors and Conclusions and Summary of Evaluation of Investment Advisory and Sub-Advisory Agreements
| A. | Nature, Extent and Quality of Services Provided by Invesco Advisers and the Affiliated Sub-Advisers |
The Board reviewed the advisory services to be provided to the Fund by Invesco Advisers under the Fund’s investment advisory agreement and the credentials and experience of the officers and employees of Invesco Advisers who will provide these services. The Board’s review of the qualifications of Invesco Advisers to provide these services included the Board’s consideration of Invesco Advisers’ investment process oversight, independent credit analysis and investment risk management. The Board also considered non-advisory services that Invesco Advisers and its affiliates provide to the Invesco Funds and will provide to the Fund, such as various back office support functions, equity and fixed income trading operations, internal audit, distribution and legal and compliance. In determining whether to approve the Fund’s investment advisory agreement, the Board considered the existing relationship between Invesco Advisers and the Invesco Funds, as well as the Board’s knowledge of Invesco Advisers’ operations. The Board concluded that the nature, extent and quality of the advisory services to be provided to the Fund by Invesco Advisers are appropriate.
The Board reviewed the services that may be provided by the Affiliated Sub-Advisers under the sub-advisory contracts and the credentials and experience of the officers and employees of the Affiliated Sub-Advisers who may provide these services. The Board noted that the Affiliated Sub-Advisers have offices and personnel that are located in financial centers around the world. As a result, the Affiliated Sub-Advisers can provide research and investment analysis on the markets and economies of various countries in which the Fund may invest, make recommendations regarding securities and assist with security trades. The Board concluded that the sub-advisory contracts will benefit the Fund and its shareholders by permitting Invesco Advisers to use the resources and talents of the Affiliated Sub-Advisers in managing the Fund. The Board concluded that the nature, extent and quality of the services that may be provided by the Affiliated Sub-Advisers are appropriate.
| B. | Fund Performance |
The Board did not consider the performance of the Fund because the Fund is new and has no performance history. The Board did review performance expectations for the Fund in different market environments.
| C. | Advisory and Sub-Advisory Fees and Fee Waivers |
The Board considered the proposed advisory fee schedule of the Fund and the proposed fee waivers and expense limitations that will be in place for the Fund through December 31, 2015. The Board also considered the services to be provided by the Affiliated Sub-Advisers pursuant to the sub-advisory contracts and the services to be provided by Invesco Advisers pursuant to the Fund’s investment advisory agreement, as well as the allocation of fees between Invesco Advisers and the Affiliated Sub-Advisers pursuant to the sub-advisory contracts. The Board noted that the sub-advisory fees will have no direct effect on the Fund or its shareholders, as they are paid by Invesco Advisers to the Affiliated Sub-Advisers.
The Board also considered comparative advisory fee data provided by Invesco Advisers with respect to comparable registered funds managed by third-party advisers. The Board noted that the advisory fee is below the Lipper Global Flexible Portfolio classification median fee and that the advisory fee is below the fee of four key competitors identified by Invesco Advisers.
Based upon the information provided and considerations described above, the Board concluded that the compensation payable to Invesco Advisers and the Affiliated Sub-Advisers is fair and reasonable.
| D. | Economies of Scale and Breakpoints |
The Board considered the extent to which there may be economies of scale in the provision of advisory services to the Fund. The Board also considered whether the Fund would benefit from such economies of scale through contractual breakpoints in the Fund’s advisory fee schedule. The Board also noted that the Fund will share directly in economies of scale through lower fees charged by third party service providers based on the combined size of all of the Invesco Funds and other clients advised by Invesco Advisers.
| E. | Profitability and Financial Resources |
The Board considered information from Invesco Advisers concerning the costs of the advisory and other services that Invesco Advisers and its affiliates provide to the Invesco Funds and the profitability of Invesco Advisers and its affiliates in providing these services. The Board received information from Invesco Advisers demonstrating that Invesco Advisers and each Affiliated Sub-Adviser are financially sound and have the resources necessary to perform their obligations under the Fund’s investment advisory agreement and sub-advisory contracts.
| F. | Collateral Benefits to Invesco Advisers and its Affiliates |
The Board considered various other benefits to be received by Invesco Advisers and its affiliates
22 Invesco Alternative Strategies Fund
resulting from Invesco Advisers’ relationship with the Fund, including the fees to be received by Invesco Advisers and its affiliates for their provision of transfer agency and distribution services to the Fund. The Board considered the performance of Invesco Advisers and its affiliates in providing these services to other Invesco Funds and the organizational structure employed by Invesco Advisers and its affiliates to provide these services. The Board also considered that these services will be provided to the Fund pursuant to written contracts that are reviewed and approved on an annual basis by the Board; that the services are required for the operation of the Fund; that Invesco Advisers and its affiliates can provide services, the nature and quality of which are at least equal to those provided by others offering the same or similar services; and that the fees for such services are fair and reasonable in light of the usual and customary charges by others for services of the same nature and quality.
23 Invesco Alternative Strategies Fund
Tax Information
Form 1099-DIV, Form 1042-S and other year–end tax information provide shareholders with actual calendar year amounts that should be included in their tax returns. Shareholders should consult their tax advisors.
The following distribution information is being provided as required by the Internal Revenue Code or to meet a specific state’s requirement.
The Fund designates the following amounts or, if subsequently determined to be different, the maximum amount allowable for its fiscal year ended December 31, 2014:
Federal and State Income Tax | ||||
Qualified Dividend Income* | 14.99 | % | ||
Corporate Dividends Received Deduction* | 5.89 | % | ||
U.S. Treasury Obligations* | 8.02 | % | ||
| * | The above percentages are based on ordinary income dividends paid to shareholders during the period October 14, 2014 (commencement date) through December 31, 2014. |
Non-Resident Alien Shareholders | ||||
Qualified Short-Term Gains | $ | 164 | ||
24 Invesco Alternative Strategies Fund
Trustees and Officers
The address of each trustee and officer is AIM Growth Series (Invesco Growth Series) (the “Trust”), 11 Greenway Plaza, Suite 1000, Houston, Texas 77046-1173. The trustees serve for the life of the Trust, subject to their earlier death, incapacitation, resignation, retirement or removal as more specifically provided in the Trust’s organizational documents. Each officer serves for a one year term or until their successors are elected and qualified. Column two below includes length of time served with predecessor entities, if any.
Name, Year of Birth and Position(s) Held with the Trust | Trustee and/ or Officer Since | Principal Occupation(s) During Past 5 Years | Number of Funds in Fund Complex Overseen by Trustee | Other Directorship(s) Held by Trustee During | ||||
| Interested Persons | ||||||||
| Martin L. Flanagan1 — 1960 Trustee | 2007 | Executive Director, Chief Executive Officer and President, Invesco Ltd. (ultimate parent of Invesco and a global investment management firm); Advisor to the Board, Invesco Advisers, Inc. (formerly known as Invesco Institutional (N.A.), Inc.); Trustee, The Invesco Funds; Vice Chair, Investment Company Institute; and Member of Executive Board, SMU Cox School of Business
Formerly: Chairman and Chief Executive Officer, Invesco Advisers, Inc. (registered investment adviser); Director, Chairman, Chief Executive Officer and President, IVZ Inc. (holding company), INVESCO Group Services, Inc. (service provider) and Invesco North American Holdings, Inc. (holding company); Director, Chief Executive Officer and President, Invesco Holding Company Limited (parent of Invesco and a global investment management firm); Director, Invesco Ltd.; Chairman, Investment Company Institute and President, Co-Chief Executive Officer, Co-President, Chief Operating Officer and Chief Financial Officer, Franklin Resources, Inc. (global investment management organization). | 144 | None | ||||
Philip A. Taylor2 — 1954 Trustee, President and Principal Executive Officer | 2006 | Head of North American Retail and Senior Managing Director, Invesco Ltd.; Director, Co-Chairman, Co-President and Co-Chief Executive Officer, Invesco Advisers, Inc. (formerly known as Invesco Institutional (N.A.), Inc.) (registered investment adviser); Director, Chairman, Chief Executive Officer and President, Invesco Management Group, Inc. (formerly known as Invesco Aim Management Group, Inc.) (financial services holding company); Director and President, INVESCO Funds Group, Inc. (registered investment adviser and registered transfer agent); Director and Chairman, Invesco Investment Services, Inc. (formerly known as Invesco Aim Investment Services, Inc.) (registered transfer agent) and IVZ Distributors, Inc. (formerly known as INVESCO Distributors, Inc.) (registered broker dealer); Director, President and Chairman, Invesco Inc. (holding company) and Invesco Canada Holdings Inc. (holding company); Chief Executive Officer, Invesco Corporate Class Inc. (corporate mutual fund company) and Invesco Canada Fund Inc. (corporate mutual fund company); Director, Chairman and Chief Executive Officer, Invesco Canada Ltd. (formerly known as Invesco Trimark Ltd./Invesco Trimark Ltèe) (registered investment adviser and registered transfer agent); Trustee, President and Principal Executive Officer, The Invesco Funds (other than AIM Treasurer’s Series Trust (Invesco Treasurer’s Series Trust) and Short-Term Investments Trust); Trustee and Executive Vice President, The Invesco Funds (AIM Treasurer’s Series Trust (Invesco Treasurer’s Series Trust) and Short-Term Investments Trust only); Director, Invesco Investment Advisers LLC (formerly known as Van Kampen Asset Management); Director, Chief Executive Officer and President, Van Kampen Exchange Corp.
Formerly: Director and Chairman, Van Kampen Investor Services Inc.; Director, Chief Executive Officer and President, 1371 Preferred Inc. (holding company) and Van Kampen Investments Inc.; Director and President, AIM GP Canada Inc. (general partner for limited partnerships) and Van Kampen Advisors, Inc.; Director and Chief Executive Officer, Invesco Trimark Dealer Inc. (registered broker dealer); Director, Invesco Distributors, Inc. (formerly known as Invesco Aim Distributors, Inc.) (registered broker dealer); Manager, Invesco PowerShares Capital Management LLC; Director, Chief Executive Officer and President, Invesco Advisers, Inc.; Director, Chairman, Chief Executive Officer and President, Invesco Aim Capital Management, Inc.; President, Invesco Trimark Dealer Inc. and Invesco Trimark Ltd./Invesco Trimark Ltèe; Director and President, AIM Trimark Corporate Class Inc. and AIM Trimark Canada Fund Inc.; Senior Managing Director, Invesco Holding Company Limited; Director and Chairman, Fund Management Company (former registered broker dealer); President and Principal Executive Officer, The Invesco Funds (AIM Treasurer’s Series Trust (Invesco Treasurer’s Series Trust), and Short-Term Investments Trust only); President, AIM Trimark Global Fund Inc. and AIM Trimark Canada Fund Inc. | 144 | None | ||||
| Independent Trustees | ||||||||
Bruce L. Crockett — 1944 Trustee and Chair | 2001 | Chairman, Crockett Technologies Associates (technology consulting company)
Formerly: Director, Captaris (unified messaging provider); Director, President and Chief Executive Officer, COMSAT Corporation; Chairman, Board of Governors of INTELSAT (international communications company); ACE Limited (insurance company); and Investment Company Institute | 144 | ALPS (Attorneys Liability Protection Society) (insurance company) |
| 1 | Mr. Flanagan is considered an interested person (within the meaning of Section 2(a)(19) of the 1940 Act) of the Trust because he is an officer of the Adviser to the Trust, and an officer and a director of Invesco Ltd., ultimate parent of the Adviser. |
| 2 | Mr. Taylor is considered an interested person (within the meaning of Section 2(a)(19) of the 1940 Act) of the Trust because he is an officer and a director of the Adviser. |
T-1 Invesco Alternative Strategies Fund
Trustees and Officers—(continued)
Name, Year of Birth and Position(s) Held with the Trust | Trustee and/ or Officer Since | Principal Occupation(s) During Past 5 Years | Number of Funds in Fund Complex Overseen by Trustee | Other Directorship(s) Held by Trustee During | ||||
| Independent Trustees —(continued) | ||||||||
David C. Arch — 1945 Trustee | 2010 | Chairman of Blistex Inc., a consumer health care products manufacturer | 144 | Board member of the Illinois Manufacturers’ Association; Member of the Board of Visitors, Institute for the Humanities, University of Michigan; Member of the Audit Committee of the Edward-Elmhurst Hospital | ||||
James T. Bunch — 1942 Trustee | 2003 | Managing Member, Grumman Hill Group LLC (family office private equity investments)
Formerly: Founder, Green Manning & Bunch Ltd. (investment banking firm) (1988-2010); Executive Committee, United States Golf Association; and Director, Policy Studies, Inc. and Van Gilder Insurance Corporation | 144 | Chairman, Board of Governors, Western Golf Association; Chairman, Evans Scholars Foundation; and Director, Denver Film Society | ||||
Rodney F. Dammeyer — 1940 Trustee | 2010 | Chairman of CAC, LLC, (private company offering capital investment and management advisory services)
Formerly: Prior to 2001, Managing Partner at Equity Group Corporate Investments; Prior to 1995, Chief Executive Officer of Itel Corporation (formerly Anixter International); Prior to 1985, experience includes Senior Vice President and Chief Financial Officer of Household International, Inc., Executive Vice President and Chief Financial Officer of Northwest Industries, Inc. and Partner of Arthur Andersen & Co.; From 1987 to 2010, Director/Trustee of investment companies in the Van Kampen Funds complex | 144 | Director of Quidel Corporation and Stericycle, Inc. | ||||
Albert R. Dowden — 1941 Trustee | 2001 | Director of a number of public and private business corporations, including the Boss Group, Ltd. (private investment and management); Nature’s Sunshine Products, Inc. and Reich & Tang Funds (5 portfolios) (registered investment company)
Formerly: Director, Homeowners of America Holding Corporation/Homeowners of America Insurance Company (property casualty company); Director, Continental Energy Services, LLC (oil and gas pipeline service); Director, CompuDyne Corporation (provider of product and services to the public security market) and Director, Annuity and Life Re (Holdings), Ltd. (reinsurance company); Director, President and Chief Executive Officer, Volvo Group North America, Inc.; Senior Vice President, AB Volvo; Director of various public and private corporations; Chairman, DHJ Media, Inc.; Director, Magellan Insurance Company; and Director, The Hertz Corporation, Genmar Corporation (boat manufacturer), National Media Corporation; Advisory Board of Rotary Power International (designer, manufacturer, and seller of rotary power engines); and Chairman, Cortland Trust, Inc. (registered investment company) | 144 | Director of: Nature’s Sunshine Products, Inc., Reich & Tang Funds, Homeowners of America Holding Corporation/ Homeowners of America Insurance Company, the Boss Group | ||||
Jack M. Fields — 1952 Trustee | 2001 | Chief Executive Officer, Twenty First Century Group, Inc. (government affairs company); Owner and Chief Executive Officer, Dos Angeles Ranch, L.P. (cattle, hunting, corporate entertainment); and Discovery Global Education Fund (non-profit)
Formerly: Chief Executive Officer, Texana Timber LP (sustainable forestry company); Director of Cross Timbers Quail Research Ranch (non-profit); and member of the U.S. House of Representatives | 144 | Insperity, Inc. (formerly known as Administaff) | ||||
Prema Mathai-Davis — 1950 Trustee | 2001 | Retired. Formerly: Chief Executive Officer, YWCA of the U.S.A. | 144 | None | ||||
Larry Soll — 1942 Trustee | 2003 | Retired. Formerly: Chairman, Chief Executive Officer and President, Synergen Corp. (a biotechnology company) | 144 | None | ||||
Hugo F. Sonnenschein — 1940 Trustee | 2010 | President Emeritus and Honorary Trustee of the University of Chicago and the Adam Smith Distinguished Service Professor in the Department of Economics at the University of Chicago. Prior to 2000, President of the University of Chicago | 144 | Trustee of the University of Rochester and a member of its investment committee; Member of the National Academy of Sciences and the American Philosophical Society; Fellow of the American Academy of Arts and Sciences | ||||
Raymond Stickel, Jr. — 1944 Trustee | 2005 | Retired. Formerly: Director, Mainstay VP Series Funds, Inc. (25 portfolios) and Partner, Deloitte & Touche | 144 | None | ||||
T-2 Invesco Alternative Strategies Fund
Trustees and Officers—(continued)
Name, Year of Birth and Position(s) Held with the Trust | Trustee and/ or Officer Since | Principal Occupation(s) During Past 5 Years | Number of Funds in Fund Complex Overseen by Trustee | Other Directorship(s) Held by Trustee During | ||||
| Independent Trustees—(continued) | ||||||||
Suzanne H. Woolsey — 1941 Trustee | 2014 | Chief Executive Officer of Woolsey Partners LLC | 144 | Emeritus Chair of the Board of Trustees of the Institute for Defense Analyses; Trustee of Colorado College; Trustee of California Institute of Technology; Prior to 2014, Director of Fluor Corp.; Prior to 2010, Trustee of the German Marshall Fund of the United States; Prior to 2010 Trustee of the Rocky Mountain Institute | ||||
| Other Officers | ||||||||
Russell C. Burk — 1958 Senior Vice President and Senior Officer | 2005 | Senior Vice President and Senior Officer, The Invesco Funds | N/A | N/A | ||||
John M. Zerr — 1962 Senior Vice President, Chief Legal Officer and Secretary | 2006 | Director, Senior Vice President, Secretary and General Counsel, Invesco Management Group, Inc. (formerly known as Invesco Aim Management Group, Inc.) and Van Kampen Exchange Corp.; Senior Vice President, Invesco Advisers, Inc. (formerly known as Invesco Institutional (N.A.), Inc.) (registered investment adviser); Senior Vice President and Secretary, Invesco Distributors, Inc. (formerly known as Invesco Aim Distributors, Inc.); Director, Vice President and Secretary, Invesco Investment Services, Inc. (formerly known as Invesco Aim Investment Services, Inc.) and IVZ Distributors, Inc. (formerly known as INVESCO Distributors, Inc.); Director and Vice President, INVESCO Funds Group, Inc.; Senior Vice President, Chief Legal Officer and Secretary, The Invesco Funds; Manager, Invesco PowerShares Capital Management LLC; Director, Secretary and General Counsel, Invesco Investment Advisers LLC (formerly known as Van Kampen Asset Management); Secretary and General Counsel, Invesco Capital Markets, Inc. (formerly known as Van Kampen Funds Inc.) and Chief Legal Officer, PowerShares Exchange-Traded Fund Trust, PowerShares Exchange-Traded Fund Trust II, PowerShares India Exchange-Traded Fund Trust , PowerShares Actively Managed Exchange-Traded Fund Trust; and PowerShares Actively Managed Exchange-Traded Commodity Fund Trust
Formerly: Director and Vice President, Van Kampen Advisors Inc.; Director, Vice President, Secretary and General Counsel, Van Kampen Investor Services Inc.; Director, Invesco Distributors, Inc. (formerly known as Invesco Aim Distributors, Inc.); Director, Senior Vice President, General Counsel and Secretary, Invesco Aim Advisers, Inc. and Van Kampen Investments Inc.; Director, Vice President and Secretary, Fund Management Company; Director, Senior Vice President, Secretary, General Counsel and Vice President, Invesco Aim Capital Management, Inc.; Chief Operating Officer and General Counsel, Liberty Ridge Capital, Inc. (an investment adviser); Vice President and Secretary, PBHG Funds (an investment company) and PBHG Insurance Series Fund (an investment company); Chief Operating Officer, General Counsel and Secretary, Old Mutual Investment Partners (a broker-dealer); General Counsel and Secretary, Old Mutual Fund Services (an administrator) and Old Mutual Shareholder Services (a shareholder servicing center); Executive Vice President, General Counsel and Secretary, Old Mutual Capital, Inc. (an investment adviser); and Vice President and Secretary, Old Mutual Advisors Funds (an investment company) | N/A | N/A | ||||
Sheri Morris — 1964 Vice President, Treasurer and Principal Financial Officer | 1999 | Vice President, Treasurer and Principal Financial Officer, The Invesco Funds; Vice President, Invesco Advisers, Inc. (formerly known as Invesco Institutional (N.A.), Inc.) (registered investment adviser); and Vice President, PowerShares Exchange-Traded Fund Trust, PowerShares Exchange-Traded Fund Trust II, PowerShares India Exchange-Traded Fund Trust, PowerShares Actively Managed Exchange-Traded Fund Trust, and PowerShares Actively Managed Exchange-Traded Commodity Fund Trust
Formerly: Vice President, Invesco Aim Advisers, Inc., Invesco Aim Capital Management, Inc. and Invesco Aim Private Asset Management, Inc.; Assistant Vice President and Assistant Treasurer, The Invesco Funds and Assistant Vice President, Invesco Advisers, Inc., Invesco Aim Capital Management, Inc. and Invesco Aim Private Asset Management, Inc.; and Treasurer, PowerShares Exchange-Traded Fund Trust, PowerShares Exchange-Traded Fund Trust II, PowerShares India Exchange-Traded Fund Trust and PowerShares Actively Managed Exchange-Traded Fund Trust | N/A | N/A | ||||
T-3 Invesco Alternative Strategies Fund
Trustees and Officers—(continued)
Name, Year of Birth and Position(s) Held with the Trust | Trustee and/ or Officer Since | Principal Occupation(s) During Past 5 Years | Number of Funds in Fund Complex Overseen by Trustee | Other Directorship(s) Held by Trustee During | ||||
| Other Officers—(continued) | ||||||||
Karen Dunn Kelley — 1960 Vice President | 2004 | Senior Managing Director, Investments; Director, Co-President, Co-Chief Executive Officer, and Co-Chairman, Invesco Advisers, Inc. (formerly known as Invesco Institutional (N.A.), Inc.) (registered investment adviser); Chairman, Invesco Senior Secured Management, Inc.; Senior Vice President, Invesco Management Group, Inc. (formerly known as Invesco Aim Management Group, Inc.); Executive Vice President, Invesco Distributors, Inc. (formerly known as Invesco Aim Distributors, Inc.); Director, Invesco Mortgage Capital Inc. and Invesco Management Company Limited; Director and President, INVESCO Asset Management (Bermuda) Ltd., Vice President, The Invesco Funds (other than AIM Treasurer’s Series Trust (Invesco Treasurer’s Series Trust) and Short-Term Investments Trust); and President and Principal Executive Officer, The Invesco Funds (AIM Treasurer’s Series Trust (Invesco Treasurer’s Series Trust) and Short-Term Investments Trust only)
Formerly: Director, INVESCO Global Asset Management Limited and INVESCO Management S.A.; Senior Vice President, Van Kampen Investments Inc. and Invesco Advisers, Inc. (formerly known as Invesco Institutional (N.A.), Inc.) (registered investment adviser); Vice President, Invesco Advisers, Inc. (formerly known as Invesco Institutional (N.A.), Inc.); Director of Cash Management and Senior Vice President, Invesco Advisers, Inc. and Invesco Aim Capital Management, Inc.; Director and President, Fund Management Company; Chief Cash Management Officer, Director of Cash Management, Senior Vice President, and Managing Director, Invesco Aim Capital Management, Inc.; Director of Cash Management, Senior Vice President, and Vice President, Invesco Advisers, Inc. and The Invesco Funds (AIM Treasurer’s Series Trust (Invesco Treasurer’s Series Trust), and Short-Term Investments Trust only) | N/A | N/A | ||||
Crissie M. Wisdom — 1969 Anti-Money Laundering Compliance Officer | 2013 | Anti-Money Laundering Compliance Officer, Invesco Advisers, Inc. (formerly known as Invesco Institutional (N.A.), Inc.) (registered investment adviser), Invesco Capital Markets, Inc. (formerly known as Van Kampen Funds Inc.), Invesco Distributors, Inc., Invesco Investment Services, Inc., Invesco Management Group, Inc., Van Kampen Exchange Corp., The Invesco Funds, and PowerShares Exchange-Traded Fund Trust, PowerShares Exchange-Traded Fund Trust II, PowerShares India Exchange-Traded Fund Trust, PowerShares Actively Managed Exchange-Traded Fund Trust and PowerShares Actively Managed Exchange-Traded Commodity Fund Trust; and Fraud Prevention Manager and Controls and Risk Analysis Manager for Invesco Investment Services, Inc. | N/A | N/A | ||||
Todd L. Spillane — 1958 Chief Compliance Officer | 2006 | Senior Vice President, Invesco Management Group, Inc. (formerly known as Invesco Aim Management Group, Inc.) and Van Kampen Exchange Corp.; Senior Vice President and Chief Compliance Officer, Invesco Advisers, Inc. (registered investment adviser) (formerly known as Invesco Institutional (N.A.), Inc.); Chief Compliance Officer, The Invesco Funds; Vice President, Invesco Distributors, Inc. (formerly known as Invesco Aim Distributors, Inc.) and Invesco Investment Services, Inc. (formerly known as Invesco Aim Investment Services, Inc.)
Formerly: Chief Compliance Officer, Invesco Funds (Chicago); Senior Vice President, Van Kampen Investments Inc.; Senior Vice President and Chief Compliance Officer, Invesco Aim Advisers, Inc. and Invesco Aim Capital Management, Inc.; Chief Compliance Officer, INVESCO Private Capital Investments, Inc. (holding company), Invesco Private Capital, Inc. (registered investment adviser), Invesco Global Asset Management (N.A.), Inc., Invesco Senior Secured Management, Inc. (registered investment adviser), Van Kampen Investor Services Inc., PowerShares Exchange-Traded Fund Trust, PowerShares Exchange-Traded Fund Trust II, PowerShares India Exchange-Traded Fund Trust and PowerShares Actively Managed Exchange-Traded Fund Trust; and Vice President, Invesco Aim Capital Management, Inc. and Fund Management Company | N/A | N/A |
The Statement of Additional Information of the Trust includes additional information about the Fund’s Trustees and is available upon request, without charge, by calling 1.800.959.4246. Please refer to the Fund’s prospectus for information on the Fund’s sub-advisers.
Office of the Fund 11 Greenway Plaza, Suite 1000 Houston, TX 77046-1173 | Investment Adviser Invesco Advisers, Inc. 1555 Peachtree Street, N.E. Atlanta, GA 30309 | Distributor Invesco Distributors, Inc. 11 Greenway Plaza, Suite 1000 Houston, TX 77046-1173 | Auditors PricewaterhouseCoopers LLP 1000 Louisiana Street, Suite 5800 Houston, TX 77002-5678 | |||
Counsel to the Fund Stradley Ronon Stevens & Young, LLP 2005 Market Street, Suite 2600 Philadelphia, PA 19103-7018 | Counsel to the Independent Trustees Goodwin Procter LLP 901 New York Avenue, N.W. Washington, D.C. 20001 | Transfer Agent Invesco Investment Services, Inc. 11 Greenway Plaza, Suite 1000 Houston, TX 77046-1173 | Custodian State Street Bank and Trust Company 225 Franklin Street Boston, MA 02110-2801 | |||
T-4 Invesco Alternative Strategies Fund

Invesco mailing information
Send general correspondence to Invesco Investment Services, Inc., P.O. Box 219078, Kansas City, MO 64121-9078.
Important notice regarding delivery of security holder documents
To reduce Fund expenses, only one copy of most shareholder documents may be mailed to shareholders with multiple accounts at the same address (Householding). Mailing of your shareholder documents may be householded indefinitely unless you instruct us otherwise. If you do not want the mailing of these documents to be combined with those for other members of your household, please contact Invesco Investment Services, Inc. at 800 959 4246 or contact your financial institution. We will begin sending you individual copies for each account within 30 days after receiving your request.
Fund holdings and proxy voting information
The Fund provides a complete list of its holdings four times in each fiscal year, at the quarter ends. For the second and fourth quarters, the lists appear in the Fund’s semiannual and annual reports to shareholders. For the first and third quarters, the Fund files the lists with the Securities and Exchange Commission (SEC) on Form N-Q. The most recent list of portfolio holdings is available at invesco.com/completeqtrholdings. Shareholders can also look up the Fund’s Forms N-Q on the SEC website at sec.gov. Copies of the Fund’s Forms N-Q may be reviewed and copied at the SEC Public Reference Room in Washington, D.C. You can obtain information on the operation of the Public Reference Room, including information about duplicating fee charges, by calling 202 551 8090 or 800 732 0330, or by electronic request at the following email address: publicinfo@sec.gov. The SEC file numbers for the Fund are shown below.
A description of the policies and procedures that the Fund uses to determine how to vote proxies relating to portfolio securities is available without charge, upon request, from our Client Services department at 800 959 4246 or at invesco.com/proxyguidelines. The information is also available on the SEC website, sec.gov. | ||
When available, information regarding how the Fund voted proxies related to its portfolio securities during the most recent 12-month period ended June 30 will be available at invesco.com/proxysearch. The information also will be available on the SEC website, sec.gov. Invesco Advisers, Inc. is an investment adviser; it provides investment advisory services to individual and institutional clients and does not sell securities. Invesco Distributors, Inc. is the US distributor for Invesco Ltd.’s retail mutual funds, exchange-traded funds and institutional money market funds. Both are wholly owned, indirect subsidiaries of Invesco Ltd. |  | |
| SEC file numbers: 811-02699 and 002-57526 | ALST-AR-1 | Invesco Distributors, Inc. |
Letters to Shareholders
Philip Taylor | Dear Shareholders: | |
| This annual report includes information about your Fund, including performance data and a complete list of its investments as of the close of the reporting period. Inside, your Fund’s portfolio managers discuss how they managed your Fund and the factors that affected its performance during the reporting period. I hope you find this report of interest. | ||
During the reporting period, the US economy showed unmistakable signs of improvement. After contracting in the first quarter of 2014, the economy expanded strongly in the second and third quarters as employment data improved markedly. Given continuing positive economic trends, the US Federal Reserve (the Fed) ended its extraordinary asset purchase program in October – but it pledged in December to be “patient” before raising interest rates. Overseas, the story was much different. Concerns about economic stagnation and the potential for deflation depressed European |

markets, while the Chinese economy was hurt by a slowdown in manufacturing.
Political change in Washington, DC; changes to monetary policy by the Fed and other central banks; the future direction of oil prices; and unexpected geopolitical events are likely to affect markets in the US and overseas in 2015. This may make some investors hesitant to begin to save for their long-term financial goals. That’s why Invesco has always encouraged investors to work with a professional financial adviser who can stress the importance of starting to save and invest early and the importance of adhering to a disciplined investment plan – when times are good and when they’re uncertain. A financial adviser who knows your unique financial situation, investment goals and risk tolerance can be an invaluable partner as you seek to achieve your financial goals. He or she can offer a long-term perspective when markets are volatile and time-tested advice and guidance when your financial situation or investment goals change.
Timely information when and where you want it
Invesco’s efforts to help investors achieve their financial objectives include providing individual investors and financial professionals with timely information about the markets, the economy and investing – whenever and wherever they want it.
Our website, invesco.com/us, offers a wide range of market insights and investment perspectives. On the website, you’ll find detailed information about our funds, including prices, performance, holdings and portfolio manager commentaries. You can access information about your individual Invesco account whenever it’s convenient for you; just complete a simple, secure online registration. Use the “Log In” box on our home page to get started.
Invesco’s mobile apps for iPhone® and iPad® (both available free from the App StoreSM) allow you to obtain the same detailed information, monitor your account and create customizable watch lists. Also, they allow you to access investment insights from our investment leaders, market strategists, economists and retirement experts. You can sign up to be alerted when new commentary is added, and you can watch portfolio manager videos and have instant access to Invesco news and updates wherever you may be.
In addition to the resources accessible on our website and through our mobile app, you can obtain timely updates to help you stay informed about the markets, the economy and investing by connecting with Invesco on Twitter, LinkedIn or Facebook. You can access our blog at blog.invesco.us.com. Our goal is to provide you the information you want, when and where you want it.
Have questions?
For questions about your account, feel free to contact an Invesco client services representative at 800 959 4246. For Invesco-related questions or comments, please email me directly at phil@invesco.com.
All of us at Invesco look forward to serving your investment management needs for many years to come. Thank you for investing with us.
Sincerely,

Philip Taylor
Senior Managing Director, Invesco Ltd.
iPhone and iPad are trademarks of Apple Inc., registered in the US and other countries. App Store is a service mark of Apple Inc. Invesco Distributors, Inc. is not affiliated with Apple Inc.
| 2 | Invesco Balanced-Risk Retirement Funds |
Bruce Crockett | Dear Fellow Shareholders: | |||
| Among the many important lessons I’ve learned in more than 40 years in a variety of business endeavors is the value of a trusted advocate. | ||||
As independent chair of the Invesco Funds Board, I can assure you that the members of the Board are strong advocates for the interests of investors in Invesco’s mutual funds. We work hard to represent your interests through oversight of the quality of the investment management services your funds receive and other matters important to your investment, including but not limited to: | ||||
n | Ensuring that Invesco offers a diverse lineup of mutual funds that your financial adviser can use to strive to meet your financial needs as your investment goals change over time. | |||
n | Monitoring how the portfolio management teams of the Invesco funds are performing in light of changing economic and market conditions. | |||

| n | Assessing each portfolio management team’s investment performance within the context of the investment strategy described in the fund’s prospectus. |
| n | Monitoring for potential conflicts of interests that may impact the nature of the services that your funds receive. |
We believe one of the most important services we provide our fund shareholders is the annual review of the funds’ advisory and sub-advisory contracts with Invesco Advisers and its affiliates. This review is required by the Investment Company Act of 1940 and focuses on the nature and quality of the services Invesco provides as the adviser to the Invesco funds and the reasonableness of the fees that it charges for those services. Each year, we spend months carefully reviewing information received from Invesco and a variety of independent sources, such as performance and fee data prepared by Lipper Inc., an independent, third-party firm widely recognized as a leader in its field. We also meet with our independent legal counsel and other independent advisers to review and help us assess the information that we have received. Our goal is to assure that you receive quality investment management services for a reasonable fee.
I trust the measures outlined above provide assurance that you have a worthy advocate when it comes to choosing the Invesco Funds.
As always, please contact me at bruce@brucecrockett.com with any questions or concerns you may have. On behalf of the Board, we look forward to continuing to represent your interests and serving your needs.
Sincerely,

Bruce L. Crockett
Independent Chair
Invesco Funds Board of Trustees
| 3 | Invesco Balanced-Risk Retirement Funds |
Management’s Discussion of Fund Performance
Performance summary – Invesco Balanced-Risk Retirement Now Fund For the year ended December 31, 2014, Class A shares of Invesco Balanced-Risk Retirement Now Fund, at net asset value (NAV), outperformed the Custom Balanced-Risk Retirement Now Index. While commodity prices declined during the reporting period, creating headwinds for the Fund, the Fund posted positive absolute returns at NAV with strategic and active positioning within fixed income driving results for the year. Your Fund’s long-term performance appears later in this report.
| Developed-market equity markets began the reporting period on a negative note, with only select markets such as Europe and the US breaking into positive territory by the end of the first quarter of 2014. Government bonds generated attractive returns as investors tried to avoid the volatility in equity and commodity markets and geopolitical uncertainty. Commodities started 2014 with mixed results; precious metals and the agricultural complexes were up strongly, while industrial metals prices languished. The Fund finished the first half of 2014 strongly as equities, fixed-income securities and commodities posted positive results for the second quarter. IBRA, in which the Fund invests, gains exposure to these three asset classes through the use of swaps, futures and commodity-linked notes. During the second quarter, bond yields declined as geopolitical concerns related to Russia and the Middle East created greater demand for perceived “safe-haven” assets.1 Contraction in the US economy and generally weak European economic data also benefited bonds. Equities posted strong results as investors overlooked weaker-than-expected fundamental data and downplayed the potential for geopolitical issues to erupt into wider conflicts. Across the commodity complexes, energy led results as uncertainty in the Middle East drove crude oil prices higher. Precious metals prices also advanced, benefiting from safe-haven demand. In the third quarter of 2014, investments in government bond futures led results as all six markets in which the Fund, through its underlying funds, was invested (Australia, Canada, Germany, Japan, the UK and the US) ended in positive territory for the quarter. Factors driving bond yields lower included ongoing | |||||||||||
Fund vs. Indexes Total returns, 12/31/13 to 12/31/14, at net asset value (NAV). Performance shown does not include applicable contingent deferred sales charges (CDSC) or front-end sales charges, which would have reduced performance. | ||||||||||||
Class A Shares | 3.32% | |||||||||||
Class AX Shares | 3.32 | |||||||||||
Class B Shares | 2.55 | |||||||||||
Class C Shares | 2.66 | |||||||||||
Class CX Shares | 2.55 | |||||||||||
Class R Shares | 3.02 | |||||||||||
Class RX Shares | 3.14 | |||||||||||
Class Y Shares | 3.61 | |||||||||||
Class R5 Shares | 3.61 | |||||||||||
Class R6 Shares | 3.61 | |||||||||||
S&P 500 Indexq(Broad Market Index) | 13.69 | |||||||||||
Custom Balanced-Risk Allocation Broad Indexn (Style-Specific Index) | 10.75 | |||||||||||
Custom Balanced-Risk Retirement Now Indexn (Style-Specific Index) | 3.30 | |||||||||||
Lipper Mixed-Asset Target Today Funds Index¿ (Peer Group Index) | 4.44 | |||||||||||
Source(s): qFactSet Research Systems Inc.; nInvesco, FactSet Research Systems Inc.; ¿Lipper Inc.
| ||||||||||||
Market conditions and your Fund Invesco Balanced-Risk Retirement Now Fund (the Fund) invests in a combination of Invesco Balanced-Risk Allocation Fund (IBRA) and affiliated money market funds to provide broad market diversification and execute the Fund’s glide path strategy with the goal of achieving real return and capital preservation for investors in retirement. As a result of the Fund’s strategy to invest in IBRA and affiliated money market funds, the Fund’s performance can be attributed to the performance of these underlying funds and the allocation of the Fund’s assets among the underlying funds. |
During the year ended December 31, 2014, global markets produced mixed results due to volatility resulting from a variety of geopolitical developments. At NAV, the Fund ended the year in positive territory. IBRA’s tactical positioning within commodities and fixed-income derivatives, obtained through the use of swaps and futures, boosted Fund results. IBRA’s active positioning within equities, obtained through the use of swaps and futures, slightly hurt results. The net effect was a positive contribution to Fund results from IBRA’s tactical allocations. | |||||||||||
Target Risk Allocation and |
| Total Net Assets | $46.9 million | Fund Nasdaq Symbols | ||||||||||||||||||
Notional Asset Weights as of 12/31/14 |
|
The Fund’s holdings are subject to change, and there is no assurance that the Fund will continue to hold any particular security. |
|
Class A Shares Class AX Shares Class B Shares Class C Shares Class CX Shares Class R Shares Class RX Shares Class Y Shares Class R5 Shares Class R6 Shares |
IANAX VIRAX IANBX IANCX VIRCX IANRX VIRRX IANYX IANIX IANFX | |||||||||||||||||
By asset class | ||||||||||||||||||||||
| Target Risk | Notional | |||||||||||||||||||||
Asset Class | Allocation* | Asset Weights** | ||||||||||||||||||||
Equity |
|
45.10% |
|
|
23.54% |
| ||||||||||||||||
Fixed Income | 35.24 | 50.75 | ||||||||||||||||||||
Commodities | 16.05 | 13.04 | ||||||||||||||||||||
Cash | 3.61 | 40.08 | ||||||||||||||||||||
Total | 100.00 | 127.41 | ||||||||||||||||||||
*Reflects the risk that each asset class is expected to contribute to the overall risk of the Fund as measured by standard deviation and estimates of risk based on historical data. Standard deviation measures the annualized fluctuations (volatility) of monthly returns. **Proprietary models determine the Notional Asset Weights necessary to achieve the Target Risk Allocations. Total Notional Asset Weight greater than 100% is achieved through derivatives and other instruments that create leverage. |
| |||||||||||||||||||||
| 4 | Invesco Balanced-Risk Retirement Funds |
geopolitical concerns resulting from the conflict between Russia and Ukraine, as well as heightened terrorist activity in Iraq. Our investments in developed-market equity futures delivered mixed results for the quarter as Japanese, European and US large-cap equities generally rose while US small-cap, UK and Hong Kong stocks generally declined. IBRA’s investments in commodities, obtained through swaps and futures, weighed heavily on Fund results for the quarter, with the asset class underperforming bonds and equities. Agricultural commodities were particularly weak, driven by substantial price declines in soybeans, soymeal and soybean oil, the result of expected increases in global production.
Bonds were the leading asset class in the fourth quarter of 2014 as yields contracted. Investors sought refuge in high-quality government bonds as volatility returned to equities and cyclical commodity prices softened substantially, reducing inflation expectations along the way. IBRA’s strategic and tactical overweight positioning within fixed income contributed to the bulk of Fund performance. The ending of the US Federal Reserve’s asset purchase program reintroduced volatility to equity markets, resulting in price weakness early in the fourth quarter. However, solid economic data in the US, expectations for broader central market stimulus measures in Japan and the beginning of asset purchases by the European Central Bank lifted equity markets into the end of November. IBRA’s strategic and tactical neutral positioning within equities contributed slightly to the Fund’s positive performance over the quarter. Commodities saw mixed performance over the fourth quarter. The decision by OPEC not to curtail production of crude oil led to renewed equity market weakness in December, particularly within the energy sector. Agricultural commodities posted gains overall, largely on the strong performance of soybeans and soymeal. Industrial metals prices were soft due to weak global economic data, with the slowdown in China having the greatest effect. Gold and silver also saw modest price declines for the quarter. The clear loser for the quarter was energy, which saw double-digit losses for crude oil and distillates resulting from increased supply, weak demand and OPEC’s decision to maintain production levels. IBRA’s tactical underweight positioning within the commodity sleeve aided results over the quarter.
Please note that IBRA’s strategy is principally implemented with derivative instruments that include futures, commodity-linked notes and total return swaps. Therefore, all or most of the performance of IBRA’s strategy, both positive and negative, can be attributed to these instruments. Derivatives can be a cost-effective way to gain exposure to asset classes. However, derivatives may amplify traditional investment risks through the creation of leverage and may be less liquid than traditional securities.
Thank you for your continued commitment to Invesco Balanced-Risk Retirement Now Fund.
| 1 | So-called “safe haven” assets do not imply risk-free investing. |
The views and opinions expressed in management’s discussion of Fund performance are those of Invesco Advisers, Inc. These views and opinions are subject to change at any time based on factors such as market and economic conditions. These views and opinions may not be relied upon as investment advice or recommendations, or as an offer for a particular security. The information is not a complete analysis of every aspect of any market, country, industry, security or the Fund. Statements of fact are from sources considered reliable, but Invesco Advisers, Inc. makes no representation or warranty as to their completeness or accuracy. Although historical performance is no guarantee of future results, these insights may help you understand our investment management philosophy.
See important Fund and, if applicable, index disclosures later in this report.
| Mark Ahnrud | |
| Chartered Financial Analyst, Portfolio Manager, is manager of Invesco Balanced-Risk Retirement Now | ||
Fund. He joined Invesco in 2000. Mr. Ahnrud earned a BS in finance and investments from Babson College and an MBA from Duke University Fuqua School of Business.
| ||
| Chris Devine | |
| Chartered Financial Analyst, Portfolio Manager, is manager of Invesco Balanced-Risk Retirement Now | ||
Fund. He joined Invesco in 1998. Mr. Devine earned a BA in economics from Wake Forest University and an MBA from the University of Georgia.
| ||
| Scott Hixon | |
| Chartered Financial Analyst, Portfolio Manager, is manager of Invesco Balanced-Risk Retirement | ||
Now Fund. He joined Invesco in 1994. Mr. Hixon earned a BBA in finance from Georgia Southern University and an MBA in finance from Georgia State University.
| ||
| Christian Ulrich | |
| Chartered Financial Analyst, Portfolio Manager, is manager of Invesco Balanced-Risk Retirement Now | ||
Fund. He joined Invesco in 2000. Mr. Ulrich earned the equivalent of a BBA from the KV Zurich Business School in Zurich, Switzerland.
| ||
| Scott Wolle | |
| Chartered Financial Analyst, Portfolio Manager, is manager of Invesco Balanced-Risk Retirement Now | ||
| Fund. He joined Invesco in 1999. Mr. Wolle earned a BS in finance from Virginia Polytechnic Institute and State University and an MBA from Duke University Fuqua School of Business. | ||
| Assisted by Invesco’s Global Asset Allocation Team | ||
| 5 | Invesco Balanced-Risk Retirement Funds |
Management’s Discussion of Fund Performance
Performance summary – Invesco Balanced-Risk Retirement 2020 Fund For the year ended December 31, 2014, Class A shares of Invesco Balanced-Risk Retirement 2020 Fund, at net asset value (NAV), outperformed the Custom Balanced-Risk Retirement 2020 Index. While commodity prices declined during the reporting period, creating headwinds for the Fund, the Fund posted positive absolute returns at NAV with strategic and active positioning within fixed income driving results for the year. Your Fund’s long-term performance appears later in this report.
| note, with only select markets such as Europe and the US breaking into positive territory by the end of the first quarter of 2014. Government bonds generated attractive returns as investors tried to avoid the volatility in equity and commodity markets and geopolitical uncertainty. Commodities started 2014 with mixed results; precious metals and the agricultural complexes were up strongly, while industrial metals prices languished. The Fund finished the first half of 2014 strongly as equities, fixed-income securities and commodities posted positive results for the second quarter. IBRA, in which the Fund invests, gains exposure to these three asset classes through the use of swaps, futures and commodity-linked notes. During the second quarter, bond yields declined as geopolitical concerns related to Russia and the Middle East created greater demand for perceived “safe-haven” assets.1 Contraction in the US economy and generally weak European economic data also benefited bonds. Equities posted strong results as investors overlooked weaker-than-expected fundamental data and downplayed the potential for geopolitical issues to erupt into wider conflicts. Across the commodity complexes, energy led results as uncertainty in the Middle East drove crude oil prices higher. Precious metals prices also advanced, benefiting from safe-haven demand. In the third quarter of 2014, investments in government bond futures led results as all six markets in which the Fund, through its underlying funds, was invested (Australia, Canada, Germany, Japan, the UK and the US) ended in positive territory for the quarter. Factors driving bond yields lower included ongoing geopolitical concerns resulting from the conflict between Russia and Ukraine, as well as heightened terrorist activity in | |||||||||||
Fund vs. Indexes Total returns, 12/31/13 to 12/31/14, at net asset value (NAV). Performance shown does not include applicable contingent deferred sales charges (CDSC) or front-end sales charges, which would have reduced performance. | ||||||||||||
Class A Shares | 4.81% | |||||||||||
Class AX Shares | 4.81 | |||||||||||
Class B Shares | 4.03 | |||||||||||
Class C Shares | 3.93 | |||||||||||
Class CX Shares | 4.04 | |||||||||||
Class R Shares | 4.55 | |||||||||||
Class RX Shares | 4.55 | |||||||||||
Class Y Shares | 5.09 | |||||||||||
Class R5 Shares | 5.07 | |||||||||||
Class R6 Shares | 5.06 | |||||||||||
S&P 500 Indexq (Broad Market Index) | 13.69 | |||||||||||
Custom Balanced-Risk Allocation Broad Index¢ (Style-Specific Index) | 10.75 | |||||||||||
Custom Balanced-Risk Retirement 2020 Index¢ (Style-Specific Index) | 4.58 | |||||||||||
Lipper Mixed-Asset Target 2020 Funds Index¿ (Peer Group Index) | 4.97 | |||||||||||
Source(s): qFactSet Research Systems Inc.; ¢Invesco, FactSet Research Systems Inc.; ¿Lipper Inc.
| ||||||||||||
Market conditions and your Fund Invesco Balanced-Risk Retirement 2020 Fund (the Fund) invests in a combination of Invesco Balanced-Risk Allocation Fund (IBRA) and affiliated money market funds to provide broad market diversification and execute the Fund’s glide path strategy which transitions from an accumulation strategy to a real return strategy at the target retirement date. As a result of the Fund’s strategy to invest in IBRA and affiliated money market funds, the Fund’s performance can be attributed to the performance of these underlying funds and the allocation of the Fund’s assets among the underlying funds. |
During the year ended December 31, 2014, global markets produced mixed results due to volatility resulting from a variety of geopolitical developments. At NAV, the Fund ended the year in positive territory. IBRA’s tactical positioning within commodities and fixed-income derivatives, obtained through the use of swaps and futures, boosted Fund results. IBRA’s active positioning within equities, obtained through the use of swaps and futures, slightly hurt results. The net effect was a positive contribution to Fund results from IBRA’s tactical allocations. Developed-market equity markets began the reporting period on a negative | |||||||||||
Target Risk Allocation and |
| Total Net Assets | $124.1 million | Fund Nasdaq Symbols | ||||||||||||||||||
Notional Asset Weights as of 12/31/14 |
|
The Fund’s holdings are subject to change, and there is no assurance that the Fund will continue to hold any particular security. |
|
Class A Shares Class AX Shares Class B Shares Class C Shares Class CX Shares Class R Shares Class RX Shares Class Y Shares Class R5 Shares Class R6 Shares |
AFTAX VRCAX AFTBX AFTCX VRCCX ATFRX VRCRX AFTYX AFTSX VRCFX | |||||||||||||||||
By asset class | ||||||||||||||||||||||
| Target Risk | Notional | |||||||||||||||||||||
Asset Class | Allocation* | Asset Weights** | ||||||||||||||||||||
Equity |
|
46.23% |
|
|
32.15% |
| ||||||||||||||||
Fixed Income | 36.11 | 69.32 | ||||||||||||||||||||
Commodities | 16.45 | 17.81 | ||||||||||||||||||||
Cash | 1.21 | 17.92 | ||||||||||||||||||||
Total | 100.00 | 137.20 | ||||||||||||||||||||
*Reflects the risk that each asset class is expected to contribute to the overall risk of the Fund as measured by standard deviation and estimates of risk based on historical data. Standard deviation measures the annualized fluctuations (volatility) of monthly returns. **Proprietary models determine the Notional Asset Weights necessary to achieve the Target Risk Allocations. Total Notional Asset Weight greater than 100% is achieved through derivatives and other instruments that create leverage. |
| |||||||||||||||||||||
| 6 | Invesco Balanced-Risk Retirement Funds |
Iraq. Our investments in developed-market equity futures delivered mixed results for the quarter as Japanese, European and US large-cap equities generally rose while US small-cap, UK and Hong Kong stocks generally declined. IBRA’s investments in commodities, obtained through swaps and futures, weighed heavily on Fund results for the quarter, with the asset class underperforming bonds and equities. Agricultural commodities were particularly weak, driven by substantial price declines in soybeans, soymeal and soybean oil, the result of expected increases in global production.
Bonds were the leading asset class in the fourth quarter of 2014 as yields contracted. Investors sought refuge in high-quality government bonds as volatility returned to equities and cyclical commodity prices softened substantially, reducing inflation expectations along the way. IBRA’s strategic and tactical overweight positioning within fixed income contributed to the bulk of Fund performance. The ending of the US Federal Reserve’s asset purchase program reintroduced volatility to equity markets, resulting in price weakness early in the fourth quarter. However, solid economic data in the US, expectations for broader central market stimulus measures in Japan and the beginning of asset purchases by the European Central Bank lifted equity markets into the end of November. IBRA’s strategic and tactical neutral positioning within equities contributed slightly to the Fund’s positive performance over the quarter. Commodities saw mixed performance over the fourth quarter. The decision by OPEC not to curtail production of crude oil led to renewed equity market weakness in December, particularly within the energy sector. Agricultural commodities posted gains overall, largely on the strong performance of soybeans and soymeal. Industrial metals prices were soft due to weak global economic data, with the slowdown in China having the greatest effect. Gold and silver also saw modest price declines for the quarter. The clear loser for the quarter was energy, which saw double-digit losses for crude oil and distillates resulting from increased supply, weak demand and OPEC’s decision to maintain production levels. IBRA’s tactical underweight positioning within the commodity sleeve aided results over the quarter.
Please note that IBRA’s strategy is principally implemented with derivative instruments that include futures, commodity-linked notes and total return swaps. Therefore, all or most of the performance of IBRA’s strategy, both positive and negative, can be attributed to these instruments. Derivatives can be a cost-effective way to gain exposure to asset classes. However, derivatives may amplify traditional investment risks through the creation of leverage and may be less liquid than traditional securities.
Thank you for your continued commitment to Invesco Balanced-Risk Retirement 2020 Fund.
| 1 | So-called “safe haven” assets do not imply risk-free investing. |
The views and opinions expressed in management’s discussion of Fund performance are those of Invesco Advisers, Inc. These views and opinions are subject to change at any time based on factors such as market and economic conditions. These views and opinions may not be relied upon as investment advice or recommendations, or as an offer for a particular security. The information is not a complete analysis of every aspect of any market, country, industry, security or the Fund. Statements of fact are from sources considered reliable, but Invesco Advisers, Inc. makes no representation or warranty as to their completeness or accuracy. Although historical performance is no guarantee of future results, these insights may help you understand our investment management philosophy.
See important Fund and, if applicable, index disclosures later in this report.
 | Mark Ahnrud | |
| Chartered Financial Analyst, Portfolio Manager, is manager of Invesco Balanced-Risk Retirement | ||
2020 Fund. He joined Invesco in 2000. Mr. Ahnrud earned a BS in finance and investments from Babson College and an MBA from Duke University Fuqua School of Business.
| ||
 | Chris Devine | |
| Chartered Financial Analyst, Portfolio Manager, is manager of Invesco Balanced-Risk Retirement | ||
2020 Fund. He joined Invesco in 1998. Mr. Devine earned a BA in economics from Wake Forest University and an MBA from the University of Georgia.
| ||
 | Scott Hixon | |
| Chartered Financial Analyst, Portfolio Manager, is manager of Invesco Balanced-Risk Retirement | ||
2020 Fund. He joined Invesco in 1994. Mr. Hixon earned a BBA in finance from Georgia Southern University and an MBA in finance from Georgia State University.
| ||
 | Christian Ulrich | |
| Chartered Financial Analyst, Portfolio Manager, is manager of Invesco Balanced-Risk Retirement | ||
2020 Fund. He joined Invesco in 2000. Mr. Ulrich earned the equivalent of a BBA from the KV Zurich Business School in Zurich, Switzerland.
| ||
 | Scott Wolle | |
| Chartered Financial Analyst, Portfolio Manager, is manager of Invesco Balanced-Risk Retirement | ||
| 2020 Fund. He joined Invesco in 1999. Mr. Wolle earned a BS in finance from Virginia Polytechnic Institute and State University and an MBA from Duke University Fuqua School of Business. | ||
| Assisted by Invesco’s Global Asset Allocation Team | ||
| 7 | Invesco Balanced-Risk Retirement Funds |
Management’s Discussion of Fund Performance
Performance summary – Invesco Balanced-Risk Retirement 2030 Fund For the year ended December 31, 2014, Class A shares of Invesco Balanced-Risk Retirement 2030 Fund, at net asset value (NAV), outperformed the Custom Balanced-Risk Retirement 2030 Index. While commodity prices declined during the reporting period, creating headwinds for the Fund, the Fund posted positive absolute returns at NAV with strategic and active positioning within fixed income driving results for the year. Your Fund’s long-term performance appears later in this report.
| swaps and futures, boosted Fund results. IBRAA’s and IBRA’s active positioning within equities, obtained through the use of swaps and futures, slightly hurt results. The net effect was a positive contribution to Fund results from IBRAA’s and IBRA’s tactical allocations. Developed-market equity markets began the reporting period on a negative note, with only select markets such as Europe and the US breaking into positive territory by the end of the first quarter of 2014. Government bonds generated attractive returns as investors tried to avoid the volatility in equity and commodity markets and geopolitical uncertainty. Commodities started 2014 with mixed results; precious metals and the agricultural complexes were up strongly, while industrial metals prices languished. The Fund finished the first half of 2014 strongly as equities, fixed-income securities and commodities posted positive results for the second quarter. IBRAA and IBRA, in which the Fund invests, gain exposure to these three asset classes through the use of swaps, futures and commodity-linked notes. During the second quarter, bond yields declined as geopolitical concerns related to Russia and the Middle East created greater demand for perceived “safe-haven” assets.1 Contraction in the US economy and generally weak European economic data also benefited bonds. Equities posted strong results as investors overlooked weaker-than-expected fundamental data and downplayed the potential for geopolitical issues to erupt into wider conflicts. Across the commodity complexes, energy led results as uncertainty in the Middle East drove crude oil prices higher. Precious metals prices also advanced, benefiting from safe-haven demand. In the third quarter of 2014, investments in government bond futures led | |||||||
| ||||||||
Fund vs. Indexes Total returns, 12/31/13 to 12/31/14, at net asset value (NAV). Performance shown does not include applicable contingent deferred sales charges (CDSC) or front-end sales charges, which would have reduced performance. | ||||||||
Class A Shares | 6.25% | |||||||
Class AX Shares | 6.36 | |||||||
Class B Shares | 5.51 | |||||||
Class C Shares | 5.51 | |||||||
Class CX Shares | 5.39 | |||||||
Class R Shares | 6.02 | |||||||
Class RX Shares | 5.89 | |||||||
Class Y Shares | 6.51 | |||||||
Class R5 Shares | 6.50 | |||||||
Class R6 Shares | 6.50 | |||||||
S&P 500 Indexq (Broad Market Index) | 13.69 | |||||||
Custom Balanced-Risk Allocation Broad Index¢ (Style-Specific Index) | 10.75 | |||||||
Custom Balanced-Risk Retirement 2030 Index¢ (Style-Specific Index) | 5.45 | |||||||
Lipper Mixed-Asset Target 2030 Funds Index¿ (Peer Group Index) | 5.31 | |||||||
Source(s): qFactSet Research Systems Inc.; ¢Invesco, FactSet Research Systems Inc.; ¿Lipper Inc.
| ||||||||
Market conditions and your Fund Invesco Balanced-Risk Retirement 2030 Fund (the Fund) invests in a combination of Invesco Balanced-Risk Allocation Fund (IBRA), Invesco Balanced-Risk Aggressive Allocation Fund (IBRAA) and affiliated money market funds to provide broad market diversification and execute the Fund’s glide path strategy which transitions from an accumulation strategy to a real return strategy at the target retirement date. As a result of the Fund’s strategy to invest in IBRA, IBRAA and affiliated money market funds, the Fund’s performance can be attributed to the |
performance of these underlying funds and the allocation of the Fund’s assets among the underlying funds. During the year ended December 31, 2014, global markets produced mixed results due to volatility resulting from a variety of geopolitical developments. At NAV, the Fund ended the year in positive territory. Tactical shifts between asset classes made within IBRAA and IBRA, both underlying funds, throughout the year helped us navigate through this volatility and benefited overall Fund returns. IBRAA’s and IBRA’s tractical positioning within commodities and fixed-income derivatives, obtained through the use of | |||||||
Target Risk Allocation and |
| Total Net Assets | $135.1 million | Fund Nasdaq Symbols | ||||||||||||||||||
Notional Asset Weights as of 12/31/14 |
|
The Fund’s holdings are subject to change, and there is no assurance that the Fund will continue to hold any particular security. |
|
Class A Shares Class AX Shares Class B Shares Class C Shares Class CX Shares Class R Shares Class RX Shares Class Y Shares Class R5 Shares Class R6 Shares |
TNAAX VREAX TNABX TNACX VRECX TNARX VRERX TNAYX TNAIX TNAFX | |||||||||||||||||
By asset class | ||||||||||||||||||||||
| Target Risk | Notional | |||||||||||||||||||||
Asset Class | Allocation* | Asset Weights** | ||||||||||||||||||||
Equity |
|
46.78% |
|
|
42.30% |
| ||||||||||||||||
Fixed Income | 36.54 | 91.19 | ||||||||||||||||||||
Commodities | 16.64 | 23.42 | ||||||||||||||||||||
Cash | 0.04 | 0.72 | ||||||||||||||||||||
Total | 100.00 | 157.63 | ||||||||||||||||||||
*Reflects the risk that each asset class is expected to contribute to the overall risk of the Fund as measured by standard deviation and estimates of risk based on historical data. Standard deviation measures the annualized fluctuations (volatility) of monthly returns. **Proprietary models determine the Notional Asset Weights necessary to achieve the Target Risk Allocations. Total Notional Asset Weight greater than 100% is achieved through derivatives and other instruments that create leverage. |
| |||||||||||||||||||||
| 8 | Invesco Balanced-Risk Retirement Funds |
results as all six markets in which the Fund, through its underlying funds, was invested (Australia, Canada, Germany, Japan, the UK and the US) ended in positive territory for the quarter. Factors driving bond yields lower included ongoing geopolitical concerns resulting from the conflict between Russia and Ukraine, as well as heightened terrorist activity in Iraq. Our investments in developed-market equity futures delivered mixed results for the quarter as Japanese, European and US large-cap equities generally rose while US small-cap, UK and Hong Kong stocks generally declined. IBRAA’s and IBRA’s investments in commodities, obtained through swaps and futures, weighed heavily on Fund results for the quarter, with the asset class underperforming bonds and equities. Agricultural commodities were particularly weak, driven by substantial price declines in soybeans, soymeal and soybean oil, the result of expected increases in global production.
Bonds were the leading asset class in the fourth quarter of 2014 as yields contracted. Investors sought refuge in high-quality government bonds as volatility returned to equities and cyclical commodity prices softened substantially, reducing inflation expectations along the way. IBRAA’s and IBRA’s strategic and tactical overweight positioning within fixed income contributed to the bulk of Fund performance. The ending of the US Federal Reserve’s asset purchase program reintroduced volatility to equity markets, resulting in price weakness early in the fourth quarter. However, solid economic data in the US, expectations for broader central market stimulus measures in Japan and the beginning of asset purchases by the European Central Bank lifted equity markets into the end of November. IBRAA’s and IBRA’s strategic and tactical neutral positioning within equities contributed slightly to the Fund’s positive performance over the quarter. Commodities saw mixed performance over the fourth quarter. The decision by OPEC not to curtail production of crude oil led to renewed equity market weakness in December, particularly within the energy sector. Agricultural commodities posted gains overall, largely on the strong performance of soybeans and soy-meal. Industrial metals prices were soft due to weak global economic data, with the slowdown in China having the greatest effect. Gold and silver also saw modest price declines for the quarter. The clear loser for the quarter was energy,
which saw double-digit losses for crude oil and distillates resulting from increased supply, weak demand and OPEC’s decision to maintain production levels. IBRAA’s and IBRA’s tactical underweight positioning within the commodity sleeve aided results over the quarter.
Please note that IBRAA’s and IBRA’s strategy is principally implemented with derivative instruments that include futures, total return swaps and commodity-linked notes. Therefore, all or most of the performance of IBRAA’s and IBRA’s strategy, both positive and negative, can be attributed to these instruments. Derivatives can be a cost-effective way to gain exposure to asset classes. However, derivatives may amplify traditional investment risks through the creation of leverage and may be less liquid than traditional securities.
Thank you for your continued commitment to Invesco Balanced-Risk Retirement 2030 Fund.
| 1 | So-called “safe haven” assets do not imply risk-free investing. |
The views and opinions expressed in management’s discussion of Fund performance are those of Invesco Advisers, Inc. These views and opinions are subject to change at any time based on factors such as market and economic conditions. These views and opinions may not be relied upon as investment advice or recommendations, or as an offer for a particular security. The information is not a complete analysis of every aspect of any market, country, industry, security or the Fund. Statements of fact are from sources considered reliable, but Invesco Advisers, Inc. makes no representation or warranty as to their completeness or accuracy. Although historical performance is no guarantee of future results, these insights may help you understand our investment management philosophy.
See important Fund and, if applicable, index disclosures later in this report.
| Mark Ahnrud | |
| Chartered Financial Analyst, Portfolio Manager, is manager of Invesco Balanced-Risk Retirement | ||
2030 Fund. He joined Invesco in 2000. Mr. Ahnrud earned a BS in finance and investments from Babson College and an MBA from Duke University Fuqua School of Business.
| ||
| Chris Devine | |
| Chartered Financial Analyst, Portfolio Manager, is manager of Invesco Balanced-Risk Retirement | ||
2030 Fund. He joined Invesco in 1998. Mr. Devine earned a BA in economics from Wake Forest University and an MBA from the University of Georgia.
| ||
| Scott Hixon | |
| Chartered Financial Analyst, Portfolio Manager, is manager of Invesco Balanced-Risk Retirement | ||
2030 Fund. He joined Invesco in 1994. Mr. Hixon earned a BBA in finance from Georgia Southern University and an MBA in finance from Georgia State University.
| ||
| Christian Ulrich | |
| Chartered Financial Analyst, Portfolio Manager, is manager of Invesco Balanced-Risk Retirement | ||
2030 Fund. He joined Invesco in 2000. Mr. Ulrich earned the equivalent of a BBA from the KV Zurich Business School in Zurich, Switzerland.
| ||
| Scott Wolle | |
| Chartered Financial Analyst, Portfolio Manager, is manager of Invesco Balanced-Risk Retirement | ||
| 2030 Fund. He joined Invesco in 1999. Mr. Wolle earned a BS in finance from Virginia Polytechnic Institute and State University and an MBA from Duke University Fuqua School of Business. | ||
| Assisted by Invesco’s Global Asset Allocation Team | ||
| 9 | Invesco Balanced-Risk Retirement Funds |
Management’s Discussion of Fund Performance
Performance summary – Invesco Balanced-Risk Retirement 2040 Fund For the year ended December 31, 2014, Invesco Balanced-Risk Retirement 2040 Fund, at net asset value (NAV), outperformed the Custom Balanced-Risk Retirement 2040 Index. While commodity prices declined during the reporting period, creating headwinds for the Fund, the Fund posted positive absolute returns at NAV with strategic and active positioning within fixed income driving results for the year. Your Fund’s long-term performance appears later in this report.
| swaps and futures, boosted Fund results. IBRAA’s and IBRA’s active positioning within equities, obtained through the use of swaps and futures, slightly hurt results. The net effect was a positive contribution to Fund results from IBRAA’s and IBRA’s tactical allocations. Developed-market equity markets began the reporting period on a negative note, with only select markets such as Europe and the US breaking into positive territory by the end of the first quarter of 2014. Government bonds generated attractive returns as investors tried to avoid the volatility in equity and commodity markets and geopolitical uncertainty. Commodities started 2014 with mixed results; precious metals and the agricultural complexes were up strongly, while industrial metals prices languished. The Fund finished the first half of 2014 strongly as equities, fixed-income securities and commodities posted positive results for the second quarter. IBRAA and IBRA, in which the Fund invests, gain exposure to these three asset classes through the use of swaps, futures and commodity-linked notes. During the second quarter, bond yields declined as geopolitical concerns related to Russia and the Middle East created greater demand for perceived “safe-haven” assets.1 Contraction in the US economy and generally weak European economic data also benefited bonds. Equities posted strong results as investors overlooked weaker-than-expected fundamental data and downplayed the potential for geopolitical issues to erupt into wider conflicts. Across the commodity complexes, energy led results as uncertainty in the Middle East drove crude oil prices higher. Precious metals prices also advanced, benefiting from safe-haven demand. In the third quarter of 2014, investments in government bond futures led | |||||||||||
Fund vs. Indexes Total returns, 12/31/13 to 12/31/14, at net asset value (NAV). Performance shown does not include applicable contingent deferred sales charges (CDSC) or front-end sales charges, which would have reduced performance. | ||||||||||||
Class A Shares | 7.35% | |||||||||||
Class AX Shares | 7.23 | |||||||||||
Class B Shares | 6.38 | |||||||||||
Class C Shares | 6.39 | |||||||||||
Class CX Shares | 6.39 | |||||||||||
Class R Shares | 7.00 | |||||||||||
Class RX Shares | 6.99 | |||||||||||
Class Y Shares | 7.61 | |||||||||||
Class R5 Shares | 7.59 | |||||||||||
Class R6 Shares | 7.59 | |||||||||||
S&P 500 Indexq (Broad Market Index) | 13.69 | |||||||||||
Custom Balanced-Risk Allocation Broad Indexn (Style-Specific Index) | 10.75 | |||||||||||
Custom Balanced-Risk Retirement 2040 Indexn (Style-Specific Index) | 5.39 | |||||||||||
Lipper Mixed-Asset Target 2040 Funds Index¿ (Peer Group Index) | 5.48 | |||||||||||
Source(s): qFactSet Research Systems Inc.; nInvesco, FactSet Research Systems Inc.; ¿Lipper Inc.
| ||||||||||||
Market conditions and your Fund Invesco Balanced-Risk Retirement 2040 Fund (the Fund) invests in a combination of Invesco Balanced-Risk Allocation Fund (IBRA), Invesco Balanced-Risk Aggressive Allocation Fund (IBRAA) and affiliated money market funds to provide broad market diversification and execute the Fund’s glide path strategy which transitions from an accumulation strategy to a real return strategy at the target retirement date. As a result of the Fund’s strategy to invest in IBRA, IBRAA and affiliated money market funds, the Fund’s performance can be attributed to the performance |
of these underlying funds and the allocation of the Fund’s assets among the underlying funds. During the year ended December 31, 2014, global markets produced mixed results due to volatility resulting from a variety of geopolitical developments. At NAV, the Fund ended the year in positive territory. Tactical shifts between asset classes made within IBRAA and IBRA, both underlying funds, throughout the year helped us navigate through this volatility and benefited overall Fund returns. IBRAA’s and IBRA’s tactical positioning within commodities and fixed-income derivatives, obtained through the use of | |||||||||||
Target Risk Allocation and |
| Total Net Assets | $85.3 million | Fund Nasdaq Symbols | ||||||||||||||||||
Notional Asset Weights as of 12/31/14 |
|
The Fund’s holdings are subject to change, and there is no assurance that the Fund will continue to hold any particular security. |
|
Class A Shares Class AX Shares Class B Shares Class C Shares Class CX Shares Class R Shares Class RX Shares Class Y Shares Class R5 Shares Class R6 Shares |
TNDAX VRGAX TNDBX TNDCX VRGCX TNDRX VRGRX TNDYX TNDIX TNDFX | |||||||||||||||||
By asset class | ||||||||||||||||||||||
| Target Risk | Notional | |||||||||||||||||||||
Asset Class | Allocation* | Asset Weights** | ||||||||||||||||||||
Equity |
|
46.78% |
|
|
49.12% |
| ||||||||||||||||
Fixed Income | 36.55 | 105.91 | ||||||||||||||||||||
Commodities | 16.64 | 27.21 | ||||||||||||||||||||
Cash | 0.03 | 0.64 | ||||||||||||||||||||
Total | 100.00 | 182.88 | ||||||||||||||||||||
*Reflects the risk that each asset class is expected to contribute to the overall risk of the Fund as measured by standard deviation and estimates of risk based on historical data. Standard deviation measures the annualized fluctuations (volatility) of monthly returns. **Proprietarymodels determine the Notional Asset Weights necessary to achieve the Target Risk Allocations. Total Notional Asset Weight greater than 100% is achieved through derivatives and other instruments that create leverage. |
| |||||||||||||||||||||
| 10 | Invesco Balanced-Risk Retirement Funds |
results as all six markets in which the Fund, through its underlying funds, was invested (Australia, Canada, Germany, Japan, the UK and the US) ended in positive territory for the quarter. Factors driving bond yields lower included ongoing geopolitical concerns resulting from the conflict between Russia and Ukraine, as well as heightened terrorist activity in Iraq. Our investments in developed-market equity futures delivered mixed results for the quarter as Japanese, European and US large-cap equities generally rose while US small-cap, UK and Hong Kong stocks generally declined. IBRAA’s and IBRA’s investments in commodities, obtained through swaps and futures, weighed heavily on Fund results for the quarter, with the asset class underperforming bonds and equities. Agricultural commodities were particularly weak, driven by substantial price declines in soybeans, soymeal and soybean oil, the result of expected increases in global production.
Bonds were the leading asset class in the fourth quarter of 2014 as yields contracted. Investors sought refuge in high-quality government bonds as volatility returned to equities and cyclical commodity prices softened substantially, reducing inflation expectations along the way. IBRAA’s and IBRA’s strategic and tactical overweight positioning within fixed income contributed to the bulk of Fund performance. The ending of the US Federal Reserve’s asset purchase program reintroduced volatility to equity markets, resulting in price weakness early in the fourth quarter. However, solid economic data in the US, expectations for broader central market stimulus measures in Japan and the beginning of asset purchases by the European Central Bank lifted equity markets into the end of November. IBRAA’s and IBRA’s strategic and tactical neutral positioning within equities contributed slightly to the Fund’s positive performance over the quarter. Commodities saw mixed performance over the fourth quarter. The decision by OPEC not to curtail production of crude oil led to renewed equity market weakness in December, particularly within the energy sector. Agricultural commodities posted gains overall, largely on the strong performance of soybeans and soymeal. Industrial metals prices were soft due to weak global economic data, with the slowdown in China having the greatest effect. Gold and silver also saw modest price declines for the quarter. The clear loser for the quarter was energy, which saw double-digit losses for crude oil and distillates resulting from increased supply, weak demand and
OPEC’s decision to maintain production levels. IBRAA’s and IBRA’s tactical underweight positioning within the commodity sleeve aided results over the quarter.
Please note that IBRAA’s and IBRA’s strategy is principally implemented with derivative instruments that include futures, total return swaps and commodity-linked notes. Therefore, all or most of the performance of IBRAA’s and IBRA’s strategy, both positive and negative, can be attributed to these instruments. Derivatives can be a cost-effective way to gain exposure to asset classes. However, derivatives may amplify traditional investment risks through the creation of leverage and may be less liquid than traditional securities.
Thank you for your continued commitment to Invesco Balanced-Risk Retirement 2040 Fund.
| 1 | So-called “safe haven” assets do not imply risk-free investing. |
The views and opinions expressed in management’s discussion of Fund performance are those of Invesco Advisers, Inc. These views and opinions are subject to change at any time based on factors such as market and economic conditions. These views and opinions may not be relied upon as investment advice or recommendations, or as an offer for a particular security. The information is not a complete analysis of every aspect of any market, country, industry, security or the Fund. Statements of fact are from sources considered reliable, but Invesco Advisers, Inc. makes no representation or warranty as to their completeness or accuracy. Although historical performance is no guarantee of future results, these insights may help you understand our investment management philosophy.
See important Fund and, if applicable, index disclosures later in this report.
| Mark Ahnrud Chartered Financial Analyst, Portfolio Manager, is manager of Invesco Balanced-Risk Retirement | |
| 2040 Fund. He joined Invesco in 2000. Mr. Ahnrud earned a BS in finance and investments from Babson College and an MBA from Duke University Fuqua School of Business. | ||
| Chris Devine Chartered Financial Analyst, Portfolio Manager, is manager of Invesco Balanced-Risk Retirement | |
| 2040 Fund. He joined Invesco in 1998. Mr. Devine earned a BA in economics from Wake Forest University and an MBA from the University of Georgia. | ||
| Scott Hixon Chartered Financial Analyst, Portfolio Manager, is manager of Invesco Balanced-Risk Retirement | |
| 2040 Fund. He joined Invesco in 1994. Mr. Hixon earned a BBA in finance from Georgia Southern University and an MBA in finance from Georgia State University. | ||
| Christian Ulrich Chartered Financial Analyst, Portfolio Manager, is manager of Invesco Balanced-Risk Retirement | |
| 2040 Fund. He joined Invesco in 2000. Mr. Ulrich earned the equivalent of a BBA from the KV Zurich Business School in Zurich, Switzerland. | ||
| Scott Wolle Chartered Financial Analyst, Portfolio Manager, is manager of Invesco Balanced-Risk Retirement | |
| 2040 Fund. He joined Invesco in 1999. Mr. Wolle earned a BS in finance from Virginia Polytechnic Institute and State University and an MBA from Duke University Fuqua School of Business. | ||
| Assisted by Invesco’s Global Asset Allocation Team | ||
| 11 | Invesco Balanced-Risk Retirement Funds |
Management’s Discussion of Fund Performance
Performance summary – Invesco Balanced-Risk Retirement 2050 Fund For the year ended December 31, 2014, Invesco Balanced-Risk Retirement 2050 Fund, at net asset value (NAV), outperformed the Custom Balanced-Risk Retirement 2050 Index. While commodity prices declined during the reporting period, creating headwinds for the Fund, the Fund posted positive absolute returns at NAV with strategic and active positioning within fixed income driving results for the year. Your Fund’s long-term performance appears later in this report.
| results due to volatility resulting from a variety of geopolitical developments. At NAV, the Fund ended the year in positive territory. Tactical shifts between asset classes made within IBRAA and IBRA, both underlying funds, throughout the year helped us navigate through this volatility and benefited overall Fund returns. IBRAA’s and IBRA’s tractical positioning within commodities and fixed-income derivatives, obtained through the use of swaps and futures, boosted Fund results. IBRAA’s and IBRA’s active positioning within equities, obtained through the use of swaps and futures, slightly hurt results. The net effect was a positive contribution to Fund results from IBRAA’s and IBRA’s tactical allocations. Developed-market equity markets began the reporting period on a negative note, with only select markets such as Europe and the US breaking into positive territory by the end of the first quarter of 2014. Government bonds generated attractive returns as investors tried to avoid the volatility in equity and commodity markets and geopolitical uncertainty. Commodities started 2014 with mixed results; precious metals and the agricultural complexes were up strongly, while industrial metals prices languished. The Fund finished the first half of 2014 strongly as equities, fixed-income securities and commodities posted positive results for the second quarter. IBRAA and IBRA, in which the Fund invests, gain exposure to these three asset classes through the use of swaps, futures and commodity-linked notes. During the second quarter, bond yields declined as geopolitical concerns related to Russia and the Middle East created greater demand for perceived “safe-haven” assets.1 Contraction in the US economy and generally weak European economic data also benefited bonds. Equities posted strong | |||||||||||
Fund vs. Indexes Total returns, 12/31/13 to 12/31/14, at net asset value (NAV). Performance shown does not include applicable contingent deferred sales charges (CDSC) or front-end sales charges, which would have reduced performance. | ||||||||||||
Class A Shares | 8.30% | |||||||||||
Class AX Shares | 8.30 | |||||||||||
Class B Shares | 7.55 | |||||||||||
Class C Shares | 7.41 | |||||||||||
Class CX Shares | 7.54 | |||||||||||
Class R Shares | 7.96 | |||||||||||
Class RX Shares | 8.09 | |||||||||||
Class Y Shares | 8.81 | |||||||||||
Class R5 Shares | 8.53 | |||||||||||
Class R6 Shares | 8.52 | |||||||||||
S&P 500 Indexq (Broad Market Index) | 13.69 | |||||||||||
Custom Balanced-Risk Allocation Broad Index¢ (Style-Specific Index) | 10.75 | |||||||||||
Custom Balanced-Risk Retirement 2050 Index¢ (Style-Specific Index) | 5.32 | |||||||||||
Lipper Mixed-Asset Target 2050 Funds Index¿ (Peer Group Index)* | 4.32 | |||||||||||
Lipper Mixed-Asset Target 2050 Funds Classification Average¿ (Former Peer Group)* | 5.53 | |||||||||||
Source(s): qFactSet Research Systems Inc.; ¢Invesco, FactSet Research Systems Inc.; ¿Lipper Inc. *During the reporting period, the Fund elected to use the Lipper Mixed-Asset Target 2050 Funds Index, rather than the Lipper Mixed-Asset Target 2050 Funds Classification Average, as its peer group index because the Lipper Mixed-Asset Target 2050 Funds Index more closely reflects the performance of the types of securities in which the Fund invests.
| ||||||||||||
Market conditions and your Fund Invesco Balanced-Risk Retirement 2050 Fund (the Fund) invests in a combination of Invesco Balanced-Risk Allocation Fund (IBRA), Invesco Balanced-Risk Aggressive Allocation Fund (IBRAA) and affiliated money market funds to provide broad market diversification and execute the Fund’s glide path strategy which transitions from an accumulation strategy to a |
real return strategy at the target retirement date. As a result of the Fund’s strategy to invest in IBRA, IBRAA and affiliated money market funds, the Fund’s performance can be attributed to the performance of these underlying funds and the allocation of the Fund’s assets among the underlying funds. During the year ended December 31, 2014, global markets produced mixed | |||||||||||
Target Risk Allocation and |
|
Total Net Assets |
|
$49.0 million |
|
Fund Nasdaq Symbols | ||||||||||||||||
Notional Asset Weights as of 12/31/14 |
|
The Fund’s holdings are subject to change, and there is no assurance that the Fund will continue to hold any particular security. |
|
Class A Shares Class AX Shares Class B Shares Class C Shares Class CX Shares Class R Shares Class RX Shares Class Y Shares Class R5 Shares Class R6 Shares | TNEAX VRIAX TNEBX TNECX VRICX TNERX VRIRX TNEYX TNEIX TNEFX | |||||||||||||||||
By asset class | ||||||||||||||||||||||
| Target Risk | Notional | |||||||||||||||||||||
Asset Class |
| Allocation*
|
| Asset Weights** | ||||||||||||||||||
Equity | 46.78% | 54.44% | ||||||||||||||||||||
Fixed Income | | 36.54 | | 117.37 | ||||||||||||||||||
Commodities | 16.64 | 30.15 | ||||||||||||||||||||
Cash | 0.04 | 1.04 | ||||||||||||||||||||
Total | 100.00 | 203.00 | ||||||||||||||||||||
*Reflects the risk that each asset class is expected to contribute to the overall risk of the Fund as measured by standard deviation and estimates of risk based on historical data. Standard deviation measures the annualized fluctuations (volatility) of monthly returns.
**Proprietary models determine the Notional Asset Weights necessary to achieve the Target Risk Allocations. Total Notional Asset Weight greater than 100% is achieved through derivatives and other instruments that create leverage.
| 12 | Invesco Balanced-Risk Retirement Funds |
results as investors overlooked weaker-than-expected fundamental data and downplayed the potential for geopolitical issues to erupt into wider conflicts. Across the commodity complexes, energy led results as uncertainty in the Middle East drove crude oil prices higher. Precious metals prices also advanced, benefiting from safe-haven demand.
In the third quarter of 2014, investments in government bond futures led results as all six markets in which the Fund, through its underlying funds, was invested (Australia, Canada, Germany, Japan, the UK and the US) ended in positive territory for the quarter. Factors driving bond yields lower included ongoing geopolitical concerns resulting from the conflict between Russia and Ukraine, as well as heightened terrorist activity in Iraq. Our investments in developed-market equity futures delivered mixed results for the quarter as Japanese, European and US large-cap equities generally rose while US small-cap, UK and Hong Kong stocks generally declined. IBRAA’s and IBRA’s investments in commodities, obtained through swaps and futures, weighed heavily on Fund results for the quarter, with the asset class underperforming bonds and equities. Agricultural commodities were particularly weak, driven by substantial price declines in soybeans, soymeal and soybean oil, the result of expected increases in global production.
Bonds were the leading asset class in the fourth quarter of 2014 as yields contracted. Investors sought refuge in high-quality government bonds as volatility returned to equities and cyclical commodity prices softened substantially, reducing inflation expectations along the way. IBRAA’s and IBRA’s strategic and tactical overweight positioning within fixed income contributed to the bulk of Fund performance. The ending of the US Federal Reserve’s asset purchase program reintroduced volatility to equity markets, resulting in price weakness early in the fourth quarter. However, solid economic data in the US, expectations for broader central market stimulus measures in Japan and the beginning of asset purchases by the European Central Bank lifted equity markets into the end of November. IBRAA’s and IBRA’s strategic and tactical neutral positioning within equities contributed slightly to the Fund’s positive performance over the quarter. Commodities saw mixed performance over the fourth quarter. The decision by OPEC not to curtail production of crude
oil led to renewed equity market weakness in December, particularly within the energy sector. Agricultural commodities posted gains overall, largely on the strong performance of soybeans and soymeal. Industrial metals prices were soft due to weak global economic data, with the slowdown in China having the greatest effect. Gold and silver also saw modest price declines for the quarter. The clear loser for the quarter was energy, which saw double-digit losses for crude oil and distillates resulting from increased supply, weak demand and OPEC’s decision to maintain production levels. IBRAA’s and IBRA’s tactical underweight positioning within the commodity sleeve aided results over the quarter.
Please note that IBRAA’s and IBRA’s strategy is principally implemented with derivative instruments that include futures, total return swaps and commodity-linked notes. Therefore, all or most of the performance of IBRAA’s and IBRA’s strategy, both positive and negative, can be attributed to these instruments. Derivatives can be a cost-effective way to gain exposure to asset classes. However, derivatives may amplify traditional investment risks through the creation of leverage and may be less liquid than traditional securities.
Thank you for your continued commitment to Invesco Balanced-Risk Retirement 2050 Fund.
| 1 | So-called “safe haven” assets do not imply risk-free investing. |
The views and opinions expressed in management’s discussion of Fund performance are those of Invesco Advisers, Inc. These views and opinions are subject to change at any time based on factors such as market and economic conditions. These views and opinions may not be relied upon as investment advice or recommendations, or as an offer for a particular security. The information is not a complete analysis of every aspect of any market, country, industry, security or the Fund. Statements of fact are from sources considered reliable, but Invesco Advisers, Inc. makes no representation or warranty as to their completeness or accuracy. Although historical performance is no guarantee of future results, these insights may help you understand our investment management philosophy.
See important Fund and, if applicable, index disclosures later in this report.
| Mark Ahnrud Chartered Financial Analyst, Portfolio Manager, is manager of Invesco Balanced-Risk Retirement | |
| 2050 Fund. He joined Invesco in 2000. Mr. Ahnrud earned a BS in finance and investments from Babson College and an MBA from Duke University Fuqua School of Business. | ||
| Chris Devine Chartered Financial Analyst, Portfolio Manager, is manager of Invesco Balanced-Risk Retirement | |
| 2050 Fund. He joined Invesco in 1998. Mr. Devine earned a BA in economics from Wake Forest University and an MBA from the University of Georgia. | ||
| Scott Hixon Chartered Financial Analyst, Portfolio Manager, is manager of Invesco Balanced-Risk Retirement | |
| 2050 Fund. He joined Invesco in 1994. Mr. Hixon earned a BBA in finance from Georgia Southern University and an MBA in finance from Georgia State University. | ||
| Christian Ulrich Chartered Financial Analyst, Portfolio Manager, is manager of Invesco Balanced-Risk Retirement | |
| 2050 Fund. He joined Invesco in 2000. Mr. Ulrich earned the equivalent of a BBA from the KV Zurich Business School in Zurich, Switzerland. | ||
| Scott Wolle Chartered Financial Analyst, Portfolio Manager, is manager of Invesco Balanced-Risk Retirement | |
| 2050 Fund. He joined Invesco in 1999. Mr. Wolle earned a BS in finance from Virginia Polytechnic Institute and State University and an MBA from Duke University Fuqua School of Business. | ||
| Assisted by Invesco’s Global Asset Allocation Team | ||
| 13 | Invesco Balanced-Risk Retirement Funds |
Invesco Balanced-Risk Retirement Now Fund’s Long-Term Performance
Results of a $10,000 Investment – Oldest Share Class(es) since Inception
Fund and index data from 1/31/07

| 1 | Source: FactSet Research Systems Inc. |
| 2 | Source: Invesco, FactSet Research Systems Inc. |
| 3 | Source: Lipper Inc. |
Past performance cannot guarantee comparable future results.
The data shown in the chart include reinvested distributions, applicable sales charges and Fund expenses including management fees. Results for Class B shares are calculated as if a hypothetical shareholder had liquidated his entire
investment in the Fund at the close of the reporting period and paid the contingent deferred sales charges, if applicable. Index results include reinvested dividends, but they do not reflect sales charges. Performance of the peer group, if applicable, reflects fund expenses and management fees; performance of a
market index does not. Performance shown in the chart and table(s) does not reflect deduction of taxes a shareholder would pay on Fund distributions or sale of Fund shares.
| 14 | Invesco Balanced-Risk Retirement Funds |
Average Annual Total Returns |
| |||
As of 12/31/14, including maximum applicable sales charges |
| |||
Class A Shares | ||||
Inception (1/31/07) | 2.07 | % | ||
5 Years | 3.75 | |||
1 Year | –2.38 | |||
Class AX Shares | ||||
Inception | 2.06 | % | ||
5 Years | 3.73 | |||
1 Year | –2.38 | |||
Class B Shares | ||||
Inception (1/31/07) | 2.02 | % | ||
5 Years | 3.78 | |||
1 Year | –2.34 | |||
Class C Shares | ||||
Inception (1/31/07) | 2.04 | % | ||
5 Years | 4.17 | |||
1 Year | 1.68 | |||
Class CX Shares | ||||
Inception | 2.02 | % | ||
5 Years | 4.12 | |||
1 Year | 1.57 | |||
Class R Shares | ||||
Inception (1/31/07) | 2.55 | % | ||
5 Years | 4.66 | |||
1 Year | 3.02 | |||
Class RX Shares | ||||
Inception | 2.54 | % | ||
5 Years | 4.65 | |||
1 Year | 3.14 | |||
Class Y Shares | ||||
Inception | 3.01 | % | ||
5 Years | 5.20 | |||
1 Year | 3.61 | |||
Class R5 Shares | ||||
Inception (1/31/07) | 3.07 | % | ||
5 Years | 5.20 | |||
1 Year | 3.61 | |||
Class R6 Shares | ||||
Inception | 2.89 | % | ||
5 Years | 5.07 | |||
1 Year | 3.61 | |||
Class AX shares incepted on June 1, 2010. Performance shown prior to that date is that of Class A shares and includes the 12b-1 fees applicable to Class A shares. Class A share performance reflects any applicable fee waivers or expense reimbursements.
Class CX and Class RX shares incepted on June 1, 2010. Performance shown prior to that date is that of Class A shares, restated to reflect the higher 12b-1 fees applicable to Class CX and Class RX shares. Class A share performance
reflects any applicable fee waivers or expense reimbursements.
Class Y shares incepted on October 3, 2008. Performance shown prior to that date is that of Class A shares and includes the 12b-1 fees applicable to Class A shares. Class A share performance reflects any applicable fee waivers or expense reimbursements.
Class R6 shares incepted on September 24, 2012. Performance shown prior to that date is that of Class A shares and includes the 12b-1 fees applicable to Class A shares. Class A share performance reflects any applicable fee waivers or expense reimbursements.
The performance data quoted represent past performance and cannot guarantee comparable future results; current performance may be lower or higher. Please visit invesco.com/performance for the most recent month-end performance. Performance figures reflect reinvested distributions, changes in net asset value and the effect of the maximum sales charge unless otherwise stated. Investment return and principal value will fluctuate so that you may have a gain or loss when you sell shares.
The net annual Fund operating expense ratio set forth in the most recent Fund prospectus as of the date of this report for Class A, Class AX, Class B, Class C, Class CX, Class R, Class RX, Class Y, Class R5 and Class R6 shares was 0.79%, 0.79%, 1.54%, 1.54%, 1.54%, 1.04%, 1.04%, 0.54%, 0.54% and 0.54%, respectively.1,2 The total annual Fund operating expense ratio set forth in the most recent Fund prospectus as of the date of this report for Class A, Class AX, Class B, Class C, Class CX, Class R, Class RX, Class Y, Class R5 and Class R6 shares was 1.39%, 1.39%, 2.14%, 2.14%, 2.14%, 1.64%, 1.64%, 1.14%, 1.08% and 0.99%, respectively.1 The expense ratios presented above may vary from the expense ratios presented in other sections of this report that are based on expenses incurred during the period covered by this report.
Class A and Class AX share performance reflects the maximum 5.50% sales charge, and Class B, Class C and Class CX share performance reflects the applicable contingent deferred sales charge (CDSC) for the period involved.
The CDSC on Class B shares declines from 5% beginning at the time of purchase to 0% at the beginning of the seventh year. The CDSC on Class C and Class CX shares is 1% for the first year after purchase. Class R, Class RX, Class Y, Class R5 and Class R6 shares do not have a front-end sales charge or a CDSC; therefore, performance is at net asset value.
The performance of the Fund’s share classes will differ primarily due to different sales charge structures and class expenses.
Had the adviser not waived fees and/or reimbursed expenses, performance would have been lower.
| 1 | The expense ratio includes acquired fund fees and expenses of the underlying funds in which the Fund invests of 0.54% for Invesco Balanced-Risk Retirement Now Fund. |
| 2 | Total annual Fund operating expenses after any contractual fee waivers and/or expense reimbursements by the adviser in effect through at least April 30, 2016. See current prospectus for more information. |
| 15 | Invesco Balanced-Risk Retirement Funds |
Invesco Balanced-Risk Retirement 2020 Fund’s Long-Term Performance
Results of a $10,000 Investment – Oldest Share Class(es) since Inception
Fund and index data from 1/31/07

| 1 | Source: FactSet Research Systems Inc. |
| 2 | Source: Invesco, FactSet Research Systems Inc. |
| 3 | Source: Lipper Inc. |
Past performance cannot guarantee comparable future results.
The data shown in the chart include reinvested distributions, applicable sales charges and Fund expenses including management fees. Results for Class B shares are calculated as if a hypothetical shareholder had liquidated his entire
investment in the Fund at the close of the reporting period and paid the contingent deferred sales charges, if applicable. Index results include reinvested dividends, but they do not reflect sales charges. Performance of the peer group, if applicable, reflects fund expenses and management fees; performance of a
market index does not. Performance shown in the chart and table(s) does not reflect deduction of taxes a shareholder would pay on Fund distributions or sale of Fund shares.
| 16 | Invesco Balanced-Risk Retirement Funds |
Average Annual Total Returns |
| |||
As of 12/31/14, including maximum applicable sales charges |
| |||
Class A Shares | ||||
Inception (1/31/07) | 2.90 | % | ||
5 Years | 6.65 | |||
1 Year | –0.93 | |||
Class AX Shares | ||||
Inception | 2.89 | % | ||
5 Years | 6.63 | |||
1 Year | –0.94 | |||
Class B Shares | ||||
Inception (1/31/07) | 2.84 | % | ||
5 Years | 6.72 | |||
1 Year | –0.85 | |||
Class C Shares | ||||
Inception (1/31/07) | 2.82 | % | ||
5 Years | 7.02 | |||
1 Year | 2.95 | |||
Class CX Shares | ||||
Inception | 2.86 | % | ||
5 Years | 7.05 | |||
1 Year | 3.07 | |||
Class R Shares | ||||
Inception (1/31/07) | 3.37 | % | ||
5 Years | 7.58 | |||
1 Year | 4.55 | |||
Class RX Shares | ||||
Inception | 3.37 | % | ||
5 Years | 7.58 | |||
1 Year | 4.55 | |||
Class Y Shares | ||||
Inception | 3.81 | % | ||
5 Years | 8.10 | |||
1 Year | 5.09 | |||
Class R5 Shares | ||||
Inception (1/31/07) | 3.90 | % | ||
5 Years | 8.11 | |||
1 Year | 5.07 | |||
Class R6 Shares | ||||
Inception | 3.71 | % | ||
5 Years | 7.99 | |||
1 Year | 5.06 | |||
Class AX shares incepted on June 1, 2010. Performance shown prior to that date is that of Class A shares and includes the 12b-1 fees applicable to Class A shares. Class A share performance reflects any applicable fee waivers or expense reimbursements.
Class CX and Class RX shares incepted on June 1, 2010. Performance shown prior to that date is that of Class A shares, restated to reflect the higher 12b-1 fees applicable to Class CX and Class RX shares. Class A share performance
reflects any applicable fee waivers or expense reimbursements.
Class Y shares incepted on October 3, 2008. Performance shown prior to that date is that of Class A shares and includes the 12b-1 fees applicable to Class A shares. Class A share performance reflects any applicable fee waivers or expense reimbursements.
Class R6 shares incepted on September 24, 2012. Performance shown prior to that date is that of Class A shares and includes the 12b-1 fees applicable to Class A shares. Class A share performance reflects any applicable fee waivers or expense reimbursements.
The performance data quoted represent past performance and cannot guarantee comparable future results; current performance may be lower or higher. Please visit invesco.com/performance for the most recent month-end performance. Performance figures reflect reinvested distributions, changes in net asset value and the effect of the maximum sales charge unless otherwise stated. Investment return and principal value will fluctuate so that you may have a gain or loss when you sell shares.
The net annual Fund operating expense ratio set forth in the most recent Fund prospectus as of the date of this report for Class A, Class AX, Class B, Class C, Class CX, Class R, Class RX, Class Y, Class R5 and Class R6 shares was 0.96%, 0.96%, 1.71%, 1.71%, 1.71%, 1.21%, 1.21%, 0.71%, 0.71% and 0.71%, respectively.1,2 The total annual Fund operating expense ratio set forth in the most recent Fund prospectus as of the date of this report for Class A, Class AX, Class B, Class C, Class CX, Class R, Class RX, Class Y, Class R5 and Class R6 shares was 1.37%, 1.37%, 2.12%, 2.12%, 2.12%, 1.62%, 1.62%, 1.12%, 1.03% and 0.94%, respectively.1 The expense ratios presented above may vary from the expense ratios presented in other sections of this report that are based on expenses incurred during the period covered by this report.
Class A and Class AX share performance reflects the maximum 5.50% sales charge, and Class B, Class C and Class CX share performance reflects the applicable contingent deferred sales charge (CDSC) for the period
involved. The CDSC on Class B shares declines from 5% beginning at the time of purchase to 0% at the beginning of the seventh year. The CDSC on Class C and Class CX shares is 1% for the first year after purchase. Class R, Class RX, Class Y, Class R5 and Class R6 shares do not have a front-end sales charge or a CDSC; therefore, performance is at net asset value.
The performance of the Fund’s share classes will differ primarily due to different sales charge structures and class expenses.
Had the adviser not waived fees and/or reimbursed expenses, performance would have been lower.
| 1 | The expense ratio includes acquired fund fees and expenses of the underlying funds in which the Fund invests of 0.71% for Invesco Balanced-Risk Retirement 2020 Fund. |
| 2 | Total annual Fund operating expenses after any contractual fee waivers and/or expense reimbursements by the adviser in effect through at least April 30, 2016. See current prospectus for more information. |
| 17 | Invesco Balanced-Risk Retirement Funds |
Invesco Balanced-Risk Retirement 2030 Fund’s Long-Term Performance
Results of a $10,000 Investment – Oldest Share Class(es) since Inception
Fund and index data from 1/31/07
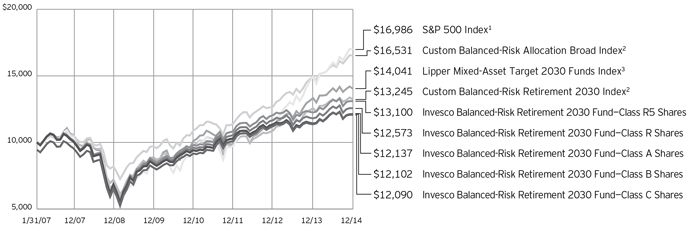
| 1 | Source: FactSet Research Systems Inc. |
| 2 | Source: Invesco, FactSet Research Systems Inc. |
| 3 | Source: Lipper Inc. |
Past performance cannot guarantee comparable future results.
The data shown in the chart include reinvested distributions, applicable sales charges and Fund expenses including management fees. Results for Class B shares are calculated as if a hypothetical shareholder had liquidated his entire
investment in the Fund at the close of the reporting period and paid the contingent deferred sales charges, if applicable. Index results include reinvested dividends, but they do not reflect sales charges. Performance of the peer group, if applicable, reflects fund expenses and management fees; performance of a
market index does not. Performance shown in the chart and table(s) does not reflect deduction of taxes a shareholder would pay on Fund distributions or sale of Fund shares.
| 18 | Invesco Balanced-Risk Retirement Funds |
Average Annual Total Returns |
| |||
As of 12/31/14, including maximum applicable sales charges |
| |||
Class A Shares | ||||
Inception (1/31/07) | 2.48 | % | ||
5 Years | 7.18 | |||
1 Year | 0.37 | |||
Class AX Shares | ||||
Inception | 2.49 | % | ||
5 Years | 7.20 | |||
1 Year | 0.47 | |||
Class B Shares | ||||
Inception (1/31/07) | 2.44 | % | ||
5 Years | 7.27 | |||
1 Year | 0.65 | |||
Class C Shares | ||||
Inception (1/31/07) | 2.43 | % | ||
5 Years | 7.55 | |||
1 Year | 4.54 | |||
Class CX Shares | ||||
Inception | 2.44 | % | ||
5 Years | 7.59 | |||
1 Year | 4.42 | |||
Class R Shares | ||||
Inception (1/31/07) | 2.94 | % | ||
5 Years | 8.10 | |||
1 Year | 6.02 | |||
Class RX Shares | ||||
Inception | 2.94 | % | ||
5 Years | 8.11 | |||
1 Year | 5.89 | |||
Class Y Shares | ||||
Inception | 3.41 | % | ||
5 Years | 8.66 | |||
1 Year | 6.51 | |||
Class R5 Shares | ||||
Inception (1/31/07) | 3.47 | % | ||
5 Years | 8.67 | |||
1 Year | 6.50 | |||
Class R6 Shares | ||||
Inception | 3.28 | % | ||
5 Years | 8.52 | |||
1 Year | 6.50 | |||
Class AX shares incepted on June 1, 2010. Performance shown prior to that date is that of Class A shares and includes the 12b-1 fees applicable to Class A shares. Class A share performance reflects any applicable fee waivers or expense reimbursements.
Class CX and Class RX shares incepted on June 1, 2010. Performance shown prior to that date is that of Class A shares, restated to reflect the higher 12b-1 fees applicable to Class CX and Class RX shares. Class A share performance
reflects any applicable fee waivers or expense reimbursements.
Class Y shares incepted on October 3, 2008. Performance shown prior to that date is that of Class A shares and includes the 12b-1 fees applicable to Class A shares. Class A share performance reflects any applicable fee waivers or expense reimbursements.
Class R6 shares incepted on September 24, 2012. Performance shown prior to that date is that of Class A shares and includes the 12b-1 fees applicable to Class A shares. Class A share performance reflects any applicable fee waivers or expense reimbursements.
The performance data quoted represent past performance and cannot guarantee comparable future results; current performance may be lower or higher. Please visit invesco.com/performance for the most recent month-end performance. Performance figures reflect reinvested distributions, changes in net asset value and the effect of the maximum sales charge unless otherwise stated. Investment return and principal value will fluctuate so that you may have a gain or loss when you sell shares.
The net annual Fund operating expense ratio set forth in the most recent Fund prospectus as of the date of this report for Class A, Class AX, Class B, Class C, Class CX, Class R, Class RX, Class Y, Class R5 and Class R6 shares was 1.12%, 1.12%, 1.87%, 1.87%, 1.87%, 1.37%, 1.37%, 0.87%, 0.87% and 0.87%, respectively.1,2 The total annual Fund operating expense ratio set forth in the most recent Fund prospectus as of the date of this report for Class A, Class AX, Class B, Class C, Class CX, Class R, Class RX, Class Y, Class R5 and Class R6 shares was 1.55%, 1.55%, 2.30%, 2.30%, 2.30%, 1.80%, 1.80%, 1.30%, 1.20% and 1.11%, respectively.1 The expense ratios presented above may vary from the expense ratios presented in other sections of this report that are based on expenses incurred during the period covered by this report.
Class A and Class AX share performance reflects the maximum 5.50% sales charge, and Class B, Class C and Class CX share performance reflects the applicable contingent deferred sales charge (CDSC) for the period involved.
The CDSC on Class B shares declines from 5% beginning at the time of purchase to 0% at the beginning of the seventh year. The CDSC on Class C and Class CX shares is 1% for the first year after purchase. Class R, Class RX, Class Y, Class R5 and Class R6 shares do not have a front-end sales charge or a CDSC; therefore, performance is at net asset value.
The performance of the Fund’s share classes will differ primarily due to different sales charge structures and class expenses.
Had the adviser not waived fees and/or reimbursed expenses, performance would have been lower.
| 1 | The expense ratio includes acquired fund fees and expenses of the underlying funds in which the Fund invests of 0.87% for Invesco Balanced-Risk Retirement 2030 Fund. |
| 2 | Total annual Fund operating expenses after any contractual fee waivers and/or expense reimbursements by the adviser in effect through at least April 30, 2016. See current prospectus for more information. |
| 19 | Invesco Balanced-Risk Retirement Funds |
Invesco Balanced-Risk Retirement 2040 Fund’s Long-Term Performance
Results of a $10,000 Investment – Oldest Share Class(es) since Inception
Fund and index data from 1/31/07
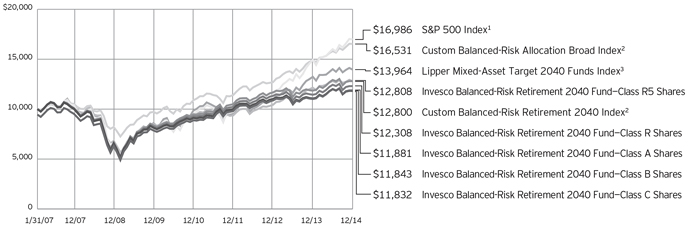
| 1 | Source: FactSet Research Systems Inc. |
| 2 | Source: Invesco, FactSet Research Systems Inc. |
| 3 | Source: Lipper Inc. |
Past performance cannot guarantee comparable future results.
The data shown in the chart include reinvested distributions, applicable sales charges and Fund expenses including management fees. Results for Class B shares are calculated as if a hypothetical shareholder had liquidated his entire
investment in the Fund at the close of the reporting period and paid the contingent deferred sales charges, if applicable. Index results include reinvested dividends, but they do not reflect sales charges. Performance of the peer group, if applicable, reflects fund expenses and management fees; performance of a
market index does not. Performance shown in the chart and table(s) does not reflect deduction of taxes a shareholder would pay on Fund distributions or sale of Fund shares.
| 20 | Invesco Balanced-Risk Retirement Funds |
Average Annual Total Returns | ||||
As of 12/31/14, including maximum applicable sales charges | ||||
Class A Shares | ||||
Inception (1/31/07) | 2.20 | % | ||
5 Years | 7.39 | |||
1 Year | 1.39 | |||
Class AX Shares | ||||
Inception | 2.19 | % | ||
5 Years | 7.37 | |||
1 Year | 1.28 | |||
Class B Shares | ||||
Inception (1/31/07) | 2.16 | % | ||
5 Years | 7.47 | |||
1 Year | 1.55 | |||
Class C Shares | ||||
Inception (1/31/07) | 2.15 | % | ||
5 Years | 7.78 | |||
1 Year | 5.42 | |||
Class CX Shares | ||||
Inception | 2.14 | % | ||
5 Years | 7.78 | |||
1 Year | 5.43 | |||
Class R Shares | ||||
Inception (1/31/07) | 2.66 | % | ||
5 Years | 8.32 | |||
1 Year | 7.00 | |||
Class RX Shares | ||||
Inception | 2.68 | % | ||
5 Years | 8.35 | |||
1 Year | 6.99 | |||
Class Y Shares | ||||
Inception | 3.13 | % | ||
5 Years | 8.88 | |||
1 Year | 7.61 | |||
Class R5 Shares | ||||
Inception (1/31/07) | 3.18 | % | ||
5 Years | 8.87 | |||
1 Year | 7.59 | |||
Class R6 Shares | ||||
Inception | 3.02 | % | ||
5 Years | 8.76 | |||
1 Year | 7.59 | |||
Class AX shares incepted on June 1, 2010. Performance shown prior to that date is that of Class A shares and includes the 12b-1 fees applicable to Class A shares. Class A share performance reflects any applicable fee waivers or expense reimbursements.
Class CX and Class RX shares incepted on June 1, 2010. Performance shown prior to that date is that of Class A shares, restated to reflect the higher 12b-1 fees applicable to Class CX and Class RX shares. Class A share performance
reflects any applicable fee waivers or expense reimbursements.
Class Y shares incepted on October 3, 2008. Performance shown prior to that date is that of Class A shares and includes the 12b-1 fees applicable to Class A shares. Class A share performance reflects any applicable fee waivers or expense reimbursements.
Class R6 shares incepted on September 24, 2012. Performance shown prior to that date is that of Class A shares and includes the 12b-1 fees applicable to Class A shares. Class A share performance reflects any applicable fee waivers or expense reimbursements.
The performance data quoted represent past performance and cannot guarantee comparable future results; current performance may be lower or higher. Please visit invesco.com/performance for the most recent month-end performance. Performance figures reflect reinvested distributions, changes in net asset value and the effect of the maximum sales charge unless otherwise stated. Investment return and principal value will fluctuate so that you may have a gain or loss when you sell shares.
The net annual Fund operating expense ratio set forth in the most recent Fund prospectus as of the date of this report for Class A, Class AX, Class B, Class C, Class CX, Class R, Class RX, Class Y, Class R5 and Class R6 shares was 1.24%, 1.24%, 1.99%, 1.99%, 1.99%, 1.49%, 1.49%, 0.99%, 0.99% and 0.99%, respectively.1,2 The total annual Fund operating expense ratio set forth in the most recent Fund prospectus as of the date of this report for Class A, Class AX, Class B, Class C, Class CX, Class R, Class RX, Class Y, Class R5 and Class R6 shares was 1.86%, 1.86%, 2.61%, 2.61%, 2.61%, 2.11%, 2.11%, 1.61%, 1.46% and 1.36%, respectively.1 The expense ratios presented above may vary from the expense ratios presented in other sections of this report that are based on expenses incurred during the period covered by this report.
Class A and Class AX share performance reflects the maximum 5.50% sales charge, and Class B, Class C and Class CX share performance reflects the applicable contingent deferred sales charge (CDSC) for the period
involved. The CDSC on Class B shares declines from 5% beginning at the time of purchase to 0% at the beginning of the seventh year. The CDSC on Class C and Class CX shares is 1% for the first year after purchase. Class R, Class RX, Class Y, Class R5 and Class R6 shares do not have a front-end sales charge or a CDSC; therefore, performance is at net asset value.
The performance of the Fund’s share classes will differ primarily due to different sales charge structures and class expenses.
Had the adviser not waived fees and/ or reimbursed expenses, performance would have been lower.
| 1 | The expense ratio includes acquired fund fees and expenses of the underlying funds in which the Fund invests of 0.99% for Invesco Balanced-Risk Retirement 2040 Fund. |
| 2 | Total annual Fund operating expenses after any contractual fee waivers and/or expense reimbursements by the adviser in effect through at least April 30, 2016. See current prospectus for more information. |
| 21 | Invesco Balanced-Risk Retirement Funds |
Invesco Balanced-Risk Retirement 2050 Fund’s Long-Term Performance
Results of a $10,000 Investment – Oldest Share Class(es) since Inception
Fund and index data from 1/31/07
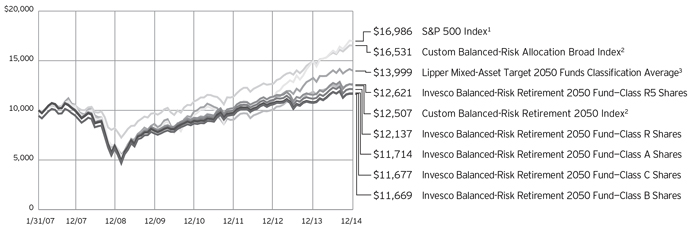
| 1 | Source: FactSet Research Systems Inc. |
| 2 | Source: Invesco, FactSet Research Systems Inc. |
| 3 | Source: Lipper Inc. |
Past performance cannot guarantee comparable future results.
During the reporting period, the Fund elected to use the Lipper Mixed-Asset Target 2050 Funds Index, rather than the Lipper Mixed-Asset Target 2050 Funds Classification Average, as its peer group index because the Lipper Mixed-Asset Target 2050 Funds Index more closely reflects the performance of the types of securities in which the Fund invests. Because this is the first reporting period since we adopted the new index, SEC
guidelines require that we compare performance to both the old and new indexes. However, because the Lipper Mixed-Asset Target 2050 Funds Index does not have sufficient history, it cannot be included on the chart above.
The data shown in the chart include reinvested distributions, applicable sales charges and Fund expenses including management fees. Results for Class B shares are calculated as if a hypothetical shareholder had liquidated his entire investment in the Fund at the close of the
reporting period and paid the contingent deferred sales charges, if applicable. Index results include reinvested dividends, but they do not reflect sales charges. Performance of the peer group, if applicable, reflects fund expenses and management fees; performance of a market index does not. Performance shown in the chart and table(s) does not reflect deduction of taxes a shareholder would pay on Fund distributions or sale of Fund shares.
| 22 | Invesco Balanced-Risk Retirement Funds |
Average Annual Total Returns | ||||
As of 12/31/14, including maximum applicable sales charges | ||||
Class A Shares | ||||
Inception (1/31/07) | 2.02 | % | ||
5 Years | 7.62 | |||
1 Year | 2.31 | |||
Class AX Shares | ||||
Inception | 2.00 | % | ||
5 Years | 7.59 | |||
1 Year | 2.31 | |||
Class B Shares | ||||
Inception (1/31/07) | 1.97 | % | ||
5 Years | 7.72 | |||
1 Year | 2.70 | |||
Class C Shares | ||||
Inception (1/31/07) | 1.98 | % | ||
5 Years | 8.01 | |||
1 Year | 6.44 | |||
Class CX Shares | ||||
Inception | 1.97 | % | ||
5 Years | 8.00 | |||
1 Year | 6.57 | |||
Class R Shares | ||||
Inception (1/31/07) | 2.48 | % | ||
5 Years | 8.55 | |||
1 Year | 7.96 | |||
Class RX Shares | ||||
Inception | 2.49 | % | ||
5 Years | 8.55 | |||
1 Year | 8.09 | |||
Class Y Shares | ||||
Inception | 2.97 | % | ||
5 Years | 9.11 | |||
1 Year | 8.81 | |||
Class R5 Shares | ||||
Inception (1/31/07) | 2.98 | % | ||
5 Years | 9.08 | |||
1 Year | 8.53 | |||
Class R6 Shares | ||||
Inception | 2.82 | % | ||
5 Years | 8.95 | |||
1 Year | 8.52 | |||
Class AX shares incepted on June 1, 2010. Performance shown prior to that date is that of Class A shares and includes the 12b-1 fees applicable to Class A shares. Class A share performance reflects any applicable fee waivers or expense reimbursements.
Class CX and Class RX shares incepted on June 1, 2010. Performance shown prior to that date is that of Class A shares, restated to reflect the higher 12b-1 fees applicable to Class CX and Class RX shares. Class A share performance
reflects any applicable fee waivers or expense reimbursements.
Class Y shares incepted on October 3, 2008. Performance shown prior to that date is that of Class A shares and includes the 12b-1 fees applicable to Class A shares. Class A share performance reflects any applicable fee waivers or expense reimbursements.
Class R6 shares incepted on September 24, 2012. Performance shown prior to that date is that of Class A shares and includes the 12b-1 fees applicable to Class A shares. Class A share performance reflects any applicable fee waivers or expense reimbursements.
The performance data quoted represent past performance and cannot guarantee comparable future results; current performance may be lower or higher. Please visit invesco.com/performance for the most recent month-end performance. Performance figures reflect reinvested distributions, changes in net asset value and the effect of the maximum sales charge unless otherwise stated. Investment return and principal value will fluctuate so that you may have a gain or loss when you sell shares.
The net annual Fund operating expense ratio set forth in the most recent Fund prospectus as of the date of this report for Class A, Class AX, Class B, Class C, Class CX, Class R, Class RX, Class Y, Class R5 and Class R6 shares was 1.36%, 1.36%, 2.11%, 2.11%, 2.11%, 1.61%, 1.61%, 1.11%, 1.11% and 1.11%, respectively.1,2 The total annual Fund operating expense ratio set forth in the most recent Fund prospectus as of the date of this report for Class A, Class AX, Class B, Class C, Class CX, Class R, Class RX, Class Y, Class R5 and Class R6 shares was 2.42%, 2.42%, 3.17%, 3.17%, 3.17%, 2.67%, 2.67%, 2.17%, 1.92% and 1.83%, respectively.1 The expense ratios presented above may vary from the expense ratios presented in other sections of this report that are based on expenses incurred during the period covered by this report.
Class A and Class AX share performance reflects the maximum 5.50% sales charge, and Class B, Class C and Class CX share performance reflects the applicable contingent deferred sales charge (CDSC) for the period
involved. The CDSC on Class B shares declines from 5% beginning at the time of purchase to 0% at the beginning of the seventh year. The CDSC on Class C and Class CX shares is 1% for the first year after purchase. Class R, Class RX, Class Y, Class R5 and Class R6 shares do not have a front-end sales charge or a CDSC; therefore, performance is at net asset value.
The performance of the Fund’s share classes will differ primarily due to different sales charge structures and class expenses.
Had the adviser not waived fees and/ or reimbursed expenses, performance would have been lower.
| 1 | The expense ratio includes acquired fund fees and expenses of the underlying funds in which the Fund invests of 1.11% for Invesco Balanced-Risk Retirement 2050 Fund. |
| 2 | Total annual Fund operating expenses after any contractual fee waivers and/or expense reimbursements by the adviser in effect through at least April 30, 2016. See current prospectus for more information. |
| 23 | Invesco Balanced-Risk Retirement Funds |
Invesco Balanced-Risk Retirement Now Fund’s investment objective is to provide real return and, as a secondary objective, capital preservation.
Invesco Balanced-Risk Retirement 2020 Fund’s, Invesco Balanced-Risk Retirement 2030 Fund’s, Invesco Balanced-Risk Retirement 2040 Fund’s and Invesco Balanced-Risk Retirement 2050 Fund’s investment objective is to provide total return with a low to moderate correlation to traditional financial market indices, and as a secondary objective, capital preservation.
| n | Unless otherwise stated, information presented in this report is as of December 31, 2014, and is based on total net assets. |
| n | Unless otherwise noted, all data provided by Invesco. |
| n | To access your Fund’s reports/prospectus, visit invesco.com/fundreports. |
About share classes
| n | Class AX shares, Class CX shares, Class RX shares and Class Y shares are available only to certain investors. Please see the prospectus for more information. |
| n | Class B shares may not be purchased for new or additional investments. Please see the prospectus for more information. |
| n | Class R shares are generally available only to employee benefit plans. Please see the prospectus for more information. |
| n | Class R5 shares and Class R6 shares are primarily intended for retirement plans that meet certain standards and for institutional investors. Please see the prospectus for more information. |
Principal risks of investing in Invesco Balanced-Risk Retirement Funds and the underlying funds
| n | Commodity-linked notes risk. An underlying fund’s investments in commodity-linked notes may involve substantial risks, including risk of loss of a significant portion of their principal value. In addition to risks associated with the underlying commodities, they may be subject to additional special risks, such as the lack of a secondary trading market and temporary price distortions due to speculators and/or the continuous rolling over of futures contracts underlying the notes. Commodity-linked notes are also subject to counterparty risk, which is the risk that the other party to the contract will not fulfill its contractual obligation to complete the transaction with an underlying fund. |
| n | Commodity risk. An underlying fund’s significant investment exposure to the commodities markets and/or a particular sector of the commodities markets |
may subject the underlying fund to greater volatility than investments in traditional securities, such as stocks and bonds. The commodities markets may fluctuate widely based on a variety of factors, including changes in overall market movements, domestic and foreign political and economic events and policies, war, acts of terrorism, changes in domestic or foreign interest rates and/or investor expectations concerning interest rates, domestic and foreign inflation rates and investment and trading activities of mutual funds, hedge funds and commodities funds. Prices of various commodities may also be affected by factors such as drought, floods, weather, livestock disease, embargoes, tariffs and other regulatory developments. The prices of commodities can also fluctuate widely due to supply and demand disruptions in major producing or consuming regions. Because an underlying fund’s performance is linked to the performance of potentially volatile commodities, investors should be willing to assume the risks of potentially significant fluctuations in the value of the underlying fund’s shares. |
| n | Correlation risk. Changes in the value of two investments or asset classes may not track or offset each other in the manner anticipated by the portfolio managers. Because an underlying fund’s investment strategy seeks to balance risk across three asset classes and, within each asset class, to balance risk across different countries and commodities, to the extent either the three asset classes or the selected countries and commodities are correlated in a way not anticipated by the portfolio managers an underlying fund’s risk allocation process may not succeed in achieving its investment objective. |
| n | Credit risk. The issuer of instruments in which an underlying fund invests may be unable to meet interest and/or principal payments, thereby causing its instruments to decrease in value and lowering the issuer’s credit rating. |
| n | Currency/exchange rate risk. The dollar value of the underlying fund’s foreign investments will be affected by changes in the exchange rates between the dollar and the currencies in which those investments are traded. |
| n | Derivatives risk. The value of a derivative instrument depends largely on (and is derived from) the value of an underlying security, currency, commodity, interest rate, index or other asset (each referred to as an underlying asset). In addition to risks relating to the underlying assets, the use of derivatives may include other, possibly greater, risks, including counterparty, leverage and liquidity risks. Counter-party risk is the risk that the counter-party to the derivative contract will default on its obligation to pay an underlying fund the amount owed or otherwise perform under the derivative contract. Derivatives create leverage risk because they do not require payment up front equal to the economic exposure created by owning the derivative. As a result, an adverse change in the value of the underlying asset could result in an underlying fund sustaining a loss that is substantially greater than the amount invested in the derivative, which may make an underlying fund’s returns more volatile and increase the risk of loss. Derivative instruments may also be less liquid than more traditional investments and an underlying fund may be unable to sell or close out its derivative positions at a desirable time or price. This risk may be more acute under adverse market conditions, during which an underlying fund may be most in need of liquidating its derivative positions. Derivatives may also be harder to value, less tax efficient and |
This report must be accompanied or preceded by a currently effective Fund prospectus, which contains more complete information, including sales charges and expenses. Investors should read it carefully before investing.
| ||
| ||
| NOT FDIC INSURED | MAY LOSE VALUE | NO BANK GUARANTEE |
| 24 | Invesco Balanced-Risk Retirement Funds |
subject to changing government regulation that could impact an underlying fund’s ability to use certain derivatives or their cost. Also, derivatives used for hedging or to gain or limit exposure to a particular market segment may not provide the expected benefits, particularly during adverse market conditions. These risks are greater for certain underlying funds than most other mutual funds because certain underlying funds will implement their investment strategy primarily through derivative instruments rather than direct investments in stocks and bonds.
| n | Developing/emerging markets securities risk. The prices of securities issued by foreign companies and governments located in developing/emerging market countries may be affected more negatively by inflation, devaluation of their currencies, higher transaction costs, delays in settlement, adverse political developments, the introduction of capital controls, withholding taxes, nationalization of private assets, expropriation, social unrest, war or lack of timely information than those in developed countries. |
| n | Exchange-traded funds risk. An investment by an underlying fund in exchange-traded funds generally presents the same primary risks as an investment in a mutual fund. In addition, an exchange-traded fund may be subject to the following: (1) a discount of the exchange-traded fund’s shares to its net asset value; (2) failure to develop an active trading market for the exchange-traded fund’s shares; (3) the listing exchange halting trading of the exchange-traded fund’s shares; (4) failure of the exchange-traded fund’s shares to track the referenced asset; and (5) holding troubled securities in the referenced index or basket of investments. Investments in exchange-traded funds may involve duplication of management fees and certain other expenses, as an underlying fund indirectly bears its proportionate share of any expenses paid by the exchange-traded funds in which it invests. Further, certain of the exchange-traded funds in which an underlying fund may invest are leveraged. The more an underlying fund invests in such leveraged exchange-traded funds, the more this leverage will magnify any losses on those investments. |
| n | Exchange-traded notes risk. Exchange-traded notes are subject to credit risk, including the credit risk of the issuer, and the value of the exchange-traded |
note may drop due to a downgrade in the issuer’s credit rating, despite the underlying market benchmark or strategy remaining unchanged. The value of an exchange-traded note may also be influenced by time to maturity, level of supply and demand for the exchange-traded note, volatility and lack of liquidity in the underlying market, changes in the applicable interest rates, changes in the issuer’s credit rating, and economic, legal, political, or geographic events that affect the referenced underlying market or strategy. Exchange-traded notes are also subject to the risk that the other party to the contract will not fulfill its contractual obligations, which may cause losses or additional costs to the Fund. |
| n | Foreign government debt risk. Investments in foreign government debt obligations involve certain risks in addition to those relating to foreign securities or debt securities generally. The issuer of the debt or the governmental authorities that control the repayment of the debt may be unable or unwilling to repay principal or interest when due in accordance with the terms of such debt, and an underlying fund may have limited recourse in the event of a default against the defaulting government. Without the approval of debt holders, some governmental debtors have in the past been able to reschedule or restructure their debt payments or declare moratoria on payments. |
| n | Foreign securities risk. An underlying fund’s foreign investments may be affected by changes in a foreign country’s exchange rates, political and social instability, changes in economic or taxation policies, difficulties when enforcing obligations, decreased liquidity, and increased volatility. Foreign companies may be subject to less regulation resulting in less publicly available information about the companies. |
| n | Fund of funds risk. The Fund’s performance depends on the underlying funds in which it invests, and it is subject to the risks of the underlying funds. Market fluctuations may change the target weightings in the underlying funds. The underlying funds may change their investment objectives, policies or practices and may not achieve their investment objectives, all of which may cause the Fund to withdraw its investments therein at a disadvantageous time. |
| n | Interest rate risk. Interest rate risk refers to the risk that bond prices generally fall as interest rates rise; conversely, |
bond prices generally rise as interest rates fall. Specific bonds differ in their sensitivity to changes in interest rates depending on their individual characteristics, including duration. This risk may be magnified due to an underlying fund’s use of derivatives that provide leveraged exposure to government bonds. |
| n | Liquidity risk. An underlying fund may hold illiquid securities that it may be unable to sell at the preferred time or price and could lose its entire investment in such securities. An underlying fund’s significant use of derivative instruments may cause liquidity risk to be greater than other mutual funds that invest in more traditional assets such as stocks and bonds, which trade on markets with more market participants. |
| n | Management risk. The investment techniques and risk analysis used by the Fund’s and the underlying fund’s portfolio managers may not produce the desired results. Because an underlying fund’s investment process relies heavily on its asset allocation process, market movements that are counter to the portfolio managers’ expectations may have a significant adverse effect on an underlying fund’s net asset value. Further, the portfolio managers’ use of short derivative positions and instruments that provide economic leverage increases the volatility of an underlying fund’s net asset value, which increases the potential of greater losses that may cause an underlying fund to liquidate positions when it may not be advantageous to do so. |
| n | Market risk. The prices of and the income generated by the underlying funds’ securities may decline in response to, among other things, investor sentiment, general economic and market conditions, regional or global instability, and currency and interest rate fluctuations. |
| n | Subsidiary risk. By investing in the Subsidiary, an underlying fund is indirectly exposed to risks associated with the Subsidiary’s investments. The Subsidiary is not registered under the Investment Company Act of 1940, as amended (1940 Act), and, except as otherwise noted in this prospectus, is not subject to the investor protections of the 1940 Act. Changes in the laws of the United States and/or the Cayman Islands, under which the underlying fund and the Subsidiary, respectively, are organized, could result in the inability of the underlying fund and/or the |
continued on page 26
25 Invesco Balanced-Risk Retirement Funds
continued from page 25
Subsidiary to operate as described in this prospectus and the statement of additional information (SAI), and could negatively affect the underlying fund and its shareholders. |
| n | US government obligations risk. An underlying fund may invest in obligations issued by US government agencies and instrumentalities that may receive varying levels of support from the government, which could affect an underlying fund’s ability to recover should they default. |
| n | Volatility risk. An underling fund may have investments that appreciate or decrease significantly in value over short periods of time. This may cause an underlying fund’s net asset value per share to experience significant increases or declines in value over short periods of time. |
Additional risks of investing in Balanced-Risk Retirement Now Fund, Invesco Balanced-Risk Retirement 2020 Fund and the underlying funds
| n | Banking and financial services industry focus risk. From time to time, an underlying fund may invest more than 25% of its assets in unsecured bank instruments, including but not limited to certificates of deposit and time deposits. To the extent underlying fund focuses its investments in these instruments or invests in securities issued or guaranteed by companies in the banking and financial services industries, the underlying fund performance will depend on the overall condition of those industries and the individual banks and financial institutions in which an underlying fund invests. Financial services companies may be dependent on the supply of short-term financing. The value of bank instruments and securities of issuers in the banking and financial services industry can be affected by and sensitive to changes in government regulation and interest rates and to economic downturns in the United States and abroad. The risk of holding bank instruments is also directly tied to the risk of insolvency or bankruptcy of the issuing banks, which risk may be higher for larger or more complex financial institutions that combine traditional, commercial and investment banking. |
| n | Cash/cash equivalents risk. Holding cash or cash equivalents may negatively affect performance. |
| n | Commodities tax risk. The tax treatment of commodity-linked derivative instruments may be adversely affected by changes in legislation, regulations or other legally binding authority. If, as a result of any such adverse action, the income of Invesco Balanced-Risk Allocation Fund, an underlying fund, from certain commodity-linked derivatives was treated as non-qualifying income, Invesco Balanced-Risk Allocation Fund might fail to qualify as a regulated investment company and be subject to federal income tax at the fund level. Invesco Balanced-Risk Allocation Fund has received private letter rulings from the Internal Revenue Service confirming that income derived from its investments in the Subsidiary and a form of commodity-linked note constitutes qualifying income to Invesco Balanced-Risk Allocation Fund. However, the Internal Revenue Service suspended issuance of any further private letter rulings in July 2011 pending a review of its position. Should the Internal Revenue Service issue guidance, or Congress enact legislation, that adversely affects the tax treatment of Invesco Balanced-Risk Allocation Fund’s use of commodity-linked notes or the Subsidiary, it could limit Invesco Balanced-Risk Allocation Fund’s ability to pursue its investment strategy. In this event, Invesco Balanced-Risk Allocation Fund’s Board of Trustees may authorize a significant change in investment strategy or fund liquidation. Invesco Balanced-Risk Allocation Fund also may incur transaction and other costs to comply with any new or additional guidance from the Internal Revenue Service. |
| n | Foreign credit exposure risk. US-dollar-denominated securities carrying foreign credit exposure may be affected by unfavorable political, economic or governmental developments that could affect payments of principal and interest. |
| n | Money market fund risk. Although the underlying fund seeks to preserve the value of your investment at $1.00 per share, you may lose money by investing in the underlying fund. The share price of money market funds can fall below the $1.00 share price. You should not rely on or expect the underlying fund’s adviser or its affiliates to enter into support agreements or take other actions to maintain the underlying fund’s $1.00 share price. The credit quality of the underlying fund’s holdings can change rapidly in certain markets, and the default of a single holding could have an adverse impact on the |
underlying fund’s share price. An underlying fund’s share price can also be negatively affected during periods of high redemption pressures and/or illiquid markets. Furthermore, the SEC recently adopted amendments to money market fund regulations that, when implemented, could impact an underlying fund’s operations and possibly negatively impact its return. |
| n | Municipal securities risk. An underlying fund may invest in municipal securities. Constitutional amendments, legislative enactments, executive orders, administrative regulations, voter initiatives, and the issuer’s regional economic conditions may affect the municipal security’s value, interest payments, repayment of principal and the underlying fund’s ability to sell it. Failure of a municipal security issuer to comply with applicable tax requirements may make income paid thereon taxable, resulting in a decline in the security’s value. In addition, there could be changes in applicable tax laws or tax treatments that reduce or eliminate the current federal income tax exemption on municipal securities or otherwise adversely affect the current federal or state tax status of municipal securities. |
| n | Reinvestment risk. Reinvestment risk is the risk that a bond’s cash flows (coupon income and principal repayment) will be reinvested at an interest rate below that on the original bond. |
| n | Repurchase agreement risk. If the seller of a repurchase agreement defaults or otherwise does not fulfill its obligations, an underlying fund may incur delays and losses arising from selling the underlying securities, enforcing its rights, or declining collateral value. These risks are magnified to the extent that a repurchase agreement is secured by securities other than cash or US government securities. |
| n | Variable-rate demand notes risk. The absence of an active secondary market for certain variable and floating rate notes could make it difficult to dispose of the instruments, and the underlying fund could suffer a loss if the issuer defaults during periods in which the underlying fund is not entitled to exercise its demand rights. |
| n | Yield risk. An underlying fund’s yield will vary as the short-term securities in its portfolio mature or are sold and the proceeds are reinvested in other securities. Additionally, inflation may outpace and diminish investment returns over time. |
| 26 | Invesco Balanced-Risk Retirement Funds |
Additional risks of investing in Invesco Balanced-Risk Retirement 2030 Fund, Invesco Balanced-Risk Retirement 2040 Fund, Invesco Balanced-Risk Retirement 2050 Fund and the underlying funds
| n | Commodities tax risk. The tax treatment of commodity-linked derivative instruments may be adversely affected by changes in legislation, regulations or other legally binding authority. If, as a result of any such adverse action, the income of Invesco Balanced-Risk Allocation Fund or Invesco Balanced-Risk Aggressive Allocation Fund, each an underlying fund, from certain commodity-linked derivatives was treated as non-qualifying income, Invesco Balanced-Risk Allocation Fund or Invesco Balanced-Risk Aggressive Allocation Fund might fail to qualify as a regulated investment company and be subject to federal income tax at the fund level. Invesco Balanced-Risk Allocation Fund has received private letter rulings from the Internal Revenue Service confirming that income derived from its investments in the Subsidiary and a form of commodity-linked note constitutes qualifying income to Invesco Balanced-Risk Allocation Fund. The IRS has also issued a number of similar letter rulings to other funds (upon which only the fund that received the private letter ruling can rely), which indicate that income from a fund’s investment in certain commodity-linked notes and a wholly owned foreign subsidiary that invests in commodity-linked derivatives, such as the Subsidiary, constitutes qualifying income. However, the Internal Revenue Service suspended issuance of any further private letter rulings in July 2011 pending a review of its position. Should the Internal Revenue Service issue guidance, or Congress enact legislation, that adversely affects the tax treatment of Invesco Balanced-Risk Allocation Fund’s or Invesco Balanced-Risk Aggressive Allocation Fund’s use of commodity-linked notes or the Subsidiary (which guidance might be applied retroactively to Invesco Balanced-Risk Aggressive Allocation Fund) it could limit such underlying fund’s ability to pursue its investment strategy and such underlying fund might not qualify as a regulated investment company for one or more years. In this event, such underlying fund’s Board of Trustees may authorize a significant change in investment strategy or fund liquidation. |
Invesco Balanced-Risk Allocation Fund and Invesco Balanced-Risk Aggressive Allocation Fund also may incur transaction and other costs to comply with any new or additional guidance from the Internal Revenue Service. |
| n | Non-diversification risk. Certain of the underlying funds are non-diversified and can invest a greater portion of their assets in a small number of issuers or a single issuer. A change in the value of the issuer could affect the value of an underlying fund more than if it was a diversified fund. |
About indexes used in this report
| n | The Barclays U.S. Aggregate Index is an unmanaged index considered representative of the US investment-grade, fixed-rate bond market. |
| n | The Barclays U.S. Universal Index represents the union of the U.S. Aggregate Index, the U.S. High-Yield Corporate Index, the 144A Index, the Eurodollar Index, the Emerging Markets Index and the non-ERISA portion of the CMBS Index. |
| n | The Custom Balanced-Risk Allocation Broad Index consists of 60% S&P 500 Index and 40% Barclays U.S. Aggregate Index. |
| n | The Custom Balanced-Risk Retirement Now Index was created by Invesco to serve as a style-specific benchmark for the Fund. From the inception of the Fund to November 4, 2009, the index comprised the Custom Independence Now Index, which included the following indexes: Russell 3000, MSCI EAFE, FTSE NAREIT Equity REITs, Barclays U.S. Universal and the three-month US Treasury bill. From November 4, 2009, through November 30, 2009, the index comprised the MSCI World Index, the JP Morgan Global Government Bond Index and the three-month US Treasury bill. Since December 1, 2009, the index has comprised the MSCI World Index, the Barclays U.S. Aggregate Index and the three-month US Treasury bill. The composition of the index may change based on the Fund’s target asset allocation. Therefore, the current composition of the index does not reflect its historical composition and will likely be altered in the future to better reflect the Fund’s objective. |
| n | The Custom Balanced-Risk Retirement 2020 Index was created by Invesco to serve as a style-specific benchmark for the Fund. From the inception of the Fund to November 4, |
2009, the index comprised the Custom Independence 2020 Index, which included the following indexes: Russell 3000, MSCI EAFE, FTSE NAREIT Equity REITs and Barclays U.S. Universal. From November 4, 2009, through November 30, 2009, the index comprised the MSCI World Index and the JP Morgan Global Government Bond Index. Since December 1, 2009, the index has comprised the MSCI World Index and the Barclays U.S. Aggregate Index. The composition of the index may change based on the Fund’s target asset allocation. Therefore, the current composition of the index does not reflect its historical composition and will likely be altered in the future to better reflect the Fund’s objective. |
| n | The Custom Balanced-Risk Retirement 2030 Index was created by Invesco to serve as a style-specific benchmark for the Fund. From the inception of the Fund to November 4, 2009, the index comprised the Custom Independence 2030 Index, which included the following indexes: Russell 3000, MSCI EAFE, FTSE NAREIT Equity REITs and Barclays U.S. Universal. From November 4, 2009, through November 30, 2009, the index comprised the MSCI World Index and the JP Morgan Global Government Bond Index. Since December 1, 2009, the index has comprised the MSCI World Index and the Barclays U.S. Aggregate Index. The composition of the index may change based on the Fund’s target asset allocation. Therefore, the current composition of the index does not reflect its historical composition and will likely be altered in the future to better reflect the Fund’s objective. |
| n | The Custom Balanced-Risk Retirement 2040 Index was created by Invesco to serve as a style-specific benchmark for the Fund. From the inception of the Fund to November 4, 2009, the index comprised the Custom Independence 2040 Index, which included the following indexes: Russell 3000, MSCI EAFE, FTSE NAREIT Equity REITs and Barclays U.S. Universal. From November 4, 2009, through November 30, 2009, the index comprised the MSCI World Index and the JP Morgan Global Government Bond Index. Since December 1, 2009, the index has comprised the MSCI World Index and the Barclays U.S. Aggregate Index. The composition of the index may change based on the Fund’s target asset allocation |
continued on page 28
27 Invesco Balanced-Risk Retirement Funds
continued from page 27
Therefore, the current composition of the index does not reflect its historical composition and will likely be altered in the future to better reflect the Fund’s objective. |
| n | The Custom Balanced-Risk Retirement 2050 Index was created by Invesco to serve as a style-specific benchmark for the Fund. From the inception of the Fund to November 4, 2009, the index comprised the Custom Independence 2050 Index, which included the following indexes: Russell 3000, MSCI EAFE, FTSE NAREIT Equity REITs and Barclays U.S. Universal. From November 4, 2009, through November 30, 2009, the index comprised the MSCI World Index and the JP Morgan Global Government Bond Index. Since December 1, 2009, the index has comprised the MSCI World Index and the Barclays U.S. Aggregate Index. The composition of the index may change based on the Fund’s target asset allocation. Therefore, the current composition of the index does not reflect its historical composition and will likely be altered in the future to better reflect the Fund’s objective. |
| n | The FTSE NAREIT Equity REITs Index is an unmanaged index considered representative of US REITs. The index is computed using the net return which withholds applicable taxes for non-resident investors. |
| n | The JP Morgan Global Government Bond Index is a total return, market capitalization weighted index that is re-balanced monthly and includes the following countries: Australia, Belgium, Canada, Denmark, Germany, Italy, Japan, the Netherlands, Spain, Sweden, the United Kingdom and the United States. |
| n | The Lipper Mixed-Asset Target Today Funds Index is an unmanaged index considered representative of mixed-asset target today funds tracked by Lipper. |
| n | The Lipper Mixed-Asset Target 2020 Funds Index is an unmanaged index considered representative of mixed-asset target 2020 funds tracked by Lipper. |
| n | The Lipper Mixed-Asset Target 2030 Funds Index is an unmanaged index considered representative of mixed-asset target 2030 funds tracked by Lipper. |
| n | The Lipper Mixed-Asset Target 2040 Funds Index is an unmanaged index considered representative of mixed-asset target 2040 funds tracked by Lipper. |
| n | The Lipper Mixed-Asset Target 2050 Funds Classification Average represents an average of all funds in the Lipper Mixed-Asset Target 2050 Funds classification. |
| n | The Lipper Mixed-Asset Target 2050 Funds Index is an unmanaged index considered representative of mixed-asset target 2050 funds tracked by Lipper. |
| n | The MSCI EAFE® Index is an unmanaged index considered representative of stocks of Europe, Australasia and the Far East. The index is computed using the net return, which withholds applicable taxes for non-resident investors. |
| n | The MSCI WorldSM Index is an unmanaged index considered representative of stocks of developed countries. The index is computed using the net return, which withholds applicable taxes for non-resident investors. |
| n | The Russell 3000® Index is an unmanaged index considered representative of the US stock market. The Russell 3000 Index is a trademark/service mark of the Frank Russell Co. Russell® is a trademark of the Frank Russell Co. |
| n | The S&P 500® Index is an unmanaged index considered representative of the US stock market. |
| n | The Fund is not managed to track the performance of any particular index, including the index(es) described here, and consequently, the performance of the Fund may deviate significantly from the performance of the index(es). |
| n | A direct investment cannot be made in an index. Unless otherwise indicated, index results include reinvested dividends, and they do not reflect sales charges. Performance of the peer group, if applicable, reflects fund expenses; performance of a market index does not. |
Other information
| n | The returns shown in management’s discussion of Fund performance are based on net asset values (NAVs) calculated for shareholder transactions. Generally accepted accounting principles require adjustments to be made to the net assets of the Fund at period end for financial reporting purposes, and as such, the NAVs for shareholder transactions and the returns based on those NAVs may differ from the NAVs and returns reported in the Financial Highlights. |
| 28 | Invesco Balanced-Risk Retirement Funds |
Schedule of Investments
December 31, 2014
Invesco Balanced-Risk Retirement Now Fund
Schedule of Investments in Affiliated Issuers–100.30%(a)
| % of Net Assets 12/31/14 | Value 12/31/13 | Purchases at Cost | Proceeds from Sales | Change in Unrealized Appreciation (Depreciation) | Realized Gain | Dividend Income | Shares 12/31/14 | Value 12/31/14 | ||||||||||||||||||||||||||||
Asset Allocation Funds–60.22% |
| |||||||||||||||||||||||||||||||||||
Invesco Balanced-Risk Allocation Fund–Class R6 | 60.22 | % | $ | 31,613,424 | $ | 2,714,506 | $ | (5,666,508 | ) | $ | (269,640 | ) | $ | 1,355,637 | $ | 664,773 | 2,426,754 | $ | 28,271,689 | |||||||||||||||||
Money Market Funds–40.08% |
| |||||||||||||||||||||||||||||||||||
Liquid Assets Portfolio–Institutional Class | 20.04 | % | 10,512,131 | 4,645,637 | (5,752,452 | ) | — | — | 6,103 | 9,405,316 | 9,405,316 | |||||||||||||||||||||||||
Premier Portfolio–Institutional Class | 20.04 | % | 10,512,132 | 4,645,637 | (5,752,452 | ) | — | — | 1,948 | 9,405,317 | 9,405,317 | |||||||||||||||||||||||||
Total Money Market Funds | 21,024,263 | 9,291,274 | (11,504,904 | ) | — | — | 8,051 | 18,810,633 | 18,810,633 | |||||||||||||||||||||||||||
TOTAL INVESTMENTS IN AFFILIATED ISSUERS | 100.30 | % | $ | 52,637,687 | $ | 12,005,780 | $ | (17,171,412 | ) | $ | (269,640 | ) | $ | 1,355,637 | (b) | $ | 672,824 | $ | 47,082,322 | |||||||||||||||||
OTHER ASSETS LESS LIABILITIES | (0.30 | )% | (141,671 | ) | ||||||||||||||||||||||||||||||||
NET ASSETS | 100.00 | % | $ | 46,940,651 | ||||||||||||||||||||||||||||||||
Invesco Balanced-Risk Retirement 2020 Fund
Schedule of Investments in Affiliated Issuers–100.17%(a)
| % of Net Assets 12/31/14 | Value 12/31/13 | Purchases at Cost | Proceeds from Sales | Change in Unrealized Appreciation (Depreciation) | Realized Gain | Dividend Income | Shares 12/31/14 | Value 12/31/14 | ||||||||||||||||||||||||||||
Asset Allocation Funds–82.25% |
| |||||||||||||||||||||||||||||||||||
Invesco Balanced-Risk Allocation Fund–Class R6 | 82.25 | % | $ | 115,737,869 | $ | 7,729,025 | $ | (19,961,769 | ) | $ | (864,783 | ) | $ | 4,772,968 | $ | 2,400,394 | 8,762,633 | $ | 102,084,679 | |||||||||||||||||
Money Market Funds–17.92% |
| |||||||||||||||||||||||||||||||||||
Liquid Assets Portfolio–Institutional Class | 8.96 | % | 8,894,379 | 12,750,620 | (10,526,835 | ) | — | — | 6,172 | 11,118,164 | 11,118,164 | |||||||||||||||||||||||||
Premier Portfolio–Institutional Class | 8.96 | % | 8,894,379 | 12,750,620 | (10,526,836 | ) | — | — | 1,957 | 11,118,163 | 11,118,163 | |||||||||||||||||||||||||
Total Money Market Funds | 17,788,758 | 25,501,240 | (21,053,671 | ) | — | — | 8,129 | 22,236,327 | 22,236,327 | |||||||||||||||||||||||||||
TOTAL INVESTMENTS IN AFFILIATED ISSUERS | 100.17 | % | $ | 133,526,627 | $ | 33,230,265 | $ | (41,015,440 | ) | $ | (864,783 | ) | $ | 4,772,968 | (b) | $ | 2,408,523 | $ | 124,321,006 | |||||||||||||||||
OTHER ASSETS LESS LIABILITIES | (0.17 | )% | (208,507 | ) | ||||||||||||||||||||||||||||||||
NET ASSETS | 100.00 | % | $ | 124,112,499 | ||||||||||||||||||||||||||||||||
Invesco Balanced-Risk Retirement 2030 Fund
Schedule of Investments in Affiliated Issuers–100.21%(a)
% of Net Assets | Value 12/31/13 | Purchases at Cost | Proceeds from Sales | Change in Unrealized Appreciation (Depreciation) | Realized Gain | Dividend Income | Shares 12/31/14 | Value 12/31/14 | ||||||||||||||||||||||||||||
Asset Allocation Funds–99.49% |
| |||||||||||||||||||||||||||||||||||
Invesco Balanced-Risk Allocation Fund–Class R6 | 82.07 | % | $ | 104,369,953 | $ | 14,531,089 | $ | (5,769,776 | ) | $ | (2,011,311 | ) | $ | 5,499,290 | $ | 2,596,926 | 9,515,393 | $ | 110,854,332 | |||||||||||||||||
Invesco Balanced-Risk Aggressive Allocation Fund | 17.42 | % | 27,326,360 | 2,911,402 | (6,444,082 | ) | (315,935 | ) | 1,412,220 | 1,146,466 | 2,530,093 | 23,529,861 | ||||||||||||||||||||||||
Total Asset Allocation Funds | 131,696,313 | 17,442,491 | (12,213,858 | ) | (2,327,246 | ) | 6,911,510 | 3,743,392 | 12,045,486 | 134,384,193 | ||||||||||||||||||||||||||
Money Market Funds–0.72% |
| |||||||||||||||||||||||||||||||||||
Liquid Assets Portfolio–Institutional Class | 0.36 | % | 500,553 | 8,952,706 | (8,960,574 | ) | — | — | 190 | 492,685 | 492,685 | |||||||||||||||||||||||||
Premier Portfolio–Institutional Class | 0.36 | % | 500,553 | 8,952,705 | (8,960,574 | ) | — | — | 60 | 492,684 | 492,684 | |||||||||||||||||||||||||
Total Money Market Funds | 1,001,106 | 17,905,411 | (17,921,148 | ) | — | — | 250 | 985,369 | 985,369 | |||||||||||||||||||||||||||
TOTAL INVESTMENTS IN AFFILIATED ISSUERS | 100.21 | % | $ | 132,697,419 | $ | 35,347,902 | $ | (30,135,006 | ) | $ | (2,327,246 | ) | $ | 6,911,510 | (b) | $ | 3,743,642 | $ | 135,369,562 | |||||||||||||||||
OTHER ASSETS LESS LIABILITIES | (0.21 | )% | (279,936 | ) | ||||||||||||||||||||||||||||||||
NET ASSETS | 100.00 | % | $ | 135,089,626 | ||||||||||||||||||||||||||||||||
Notes to Schedule of Investments:
| (a) | Each underlying fund and the Fund are affiliated by either having the same investment adviser or an investment adviser under common control with the Fund’s investment adviser. |
| (b) | Includes $1,475,730, $5,328,631 and $7,125,017 of capital gains distributions from affiliated underlying funds for Invesco Balanced-Risk Retirement Now Fund, Invesco Balanced-Risk Retirement 2020 Fund and Invesco Balanced-Risk Retirement 2030 Fund, respectively. |
See accompanying Notes to Financial Statements which are an integral part of the financial statements.
29 Invesco Balanced-Risk Retirement Funds
Schedule of Investments—(continued)
December 31, 2014
Invesco Balanced-Risk Retirement 2040 Fund
Schedule of Investments in Affiliated Issuers–100.65%(a)
% of Net | Value 12/31/13 | Purchases at Cost | Proceeds from Sales | Change in Unrealized Appreciation (Depreciation) | Realized Gain | Dividend Income | Shares 12/31/14 | Value 12/31/14 | ||||||||||||||||||||||||||||
Asset Allocation Funds–100.01% |
| |||||||||||||||||||||||||||||||||||
Invesco Balanced-Risk Allocation Fund–Class R6 | 48.70 | % | $ | 35,432,090 | $ | 8,352,304 | $ | (1,300,314 | ) | $ | (892,880 | ) | $ | 2,097,766 | $ | 2,114,618 | 3,566,328 | $ | 41,547,718 | |||||||||||||||||
Invesco Balanced-Risk Aggressive Allocation Fund | 51.31 | % | 42,448,840 | 7,444,586 | (5,199,722 | ) | (946,485 | ) | 2,534,814 | 964,570 | 4,706,813 | 43,773,366 | ||||||||||||||||||||||||
Total Asset Allocation Funds | 77,880,930 | 15,796,890 | (6,500,036 | ) | (1,839,365 | ) | 4,632,580 | 3,079,188 | 8,273,141 | 85,321,084 | ||||||||||||||||||||||||||
Money Market Funds–0.64% |
| |||||||||||||||||||||||||||||||||||
Liquid Assets Portfolio–Institutional Class | 0.32 | % | 303,107 | 6,848,550 | (6,877,703 | ) | — | — | 134 | 273,954 | 273,954 | |||||||||||||||||||||||||
Premier Portfolio–Institutional Class | 0.32 | % | 303,107 | 6,848,550 | (6,877,703 | ) | — | — | 44 | 273,954 | 273,954 | |||||||||||||||||||||||||
Total Money Market Funds | 606,214 | 13,697,100 | (13,755,406 | ) | — | — | 178 | 547,908 | 547,908 | |||||||||||||||||||||||||||
TOTAL INVESTMENTS IN AFFILIATED ISSUERS | 100.65 | % | $ | 78,487,144 | $ | 29,493,990 | $ | (20,255,442 | ) | $ | (1,839,365 | ) | $ | 4,632,580 | (b) | $ | 3,079,366 | $ | 85,868,992 | |||||||||||||||||
OTHER ASSETS LESS LIABILITIES | (0.65 | )% | (555,164 | ) | ||||||||||||||||||||||||||||||||
NET ASSETS | 100.00 | % | $ | 85,313,828 | ||||||||||||||||||||||||||||||||
Invesco Balanced-Risk Retirement 2050 Fund
Schedule of Investments in Affiliated Issuers–98.97%(a)
| % of Net Assets 12/31/14 | Value 12/31/13 | Purchases at Cost | Proceeds from Sales | Change in Unrealized Appreciation (Depreciation) | Realized Gain | Dividend Income | Shares 12/31/14 | Value 12/31/14 | ||||||||||||||||||||||||||||
Asset Allocation Funds–97.93% |
| |||||||||||||||||||||||||||||||||||
Invesco Balanced-Risk Allocation Fund–Class R6 | 15.26 | % | $ | 4,938,551 | $ | 3,015,152 | $ | (263,205 | ) | $ | (206,533 | ) | $ | 359,169 | $ | 169,844 | 640,866 | $ | 7,466,097 | |||||||||||||||||
Invesco Balanced-Risk Aggressive Allocation Fund | 82.67 | % | 35,480,587 | 9,012,466 | (2,960,423 | ) | (995,387 | ) | 2,210,301 | 1,915,919 | 4,352,108 | 40,474,603 | ||||||||||||||||||||||||
Total Asset Allocation Funds | 40,419,138 | 12,027,618 | (3,223,628 | ) | (1,201,920 | ) | 2,569,470 | 2,085,763 | 4,992,974 | 47,940,700 | ||||||||||||||||||||||||||
Money Market Funds–1.04% |
| |||||||||||||||||||||||||||||||||||
Liquid Assets Portfolio–Institutional Class | 0.52 | % | 155,355 | 5,088,802 | (4,988,145 | ) | — | — | 82 | 256,012 | 256,012 | |||||||||||||||||||||||||
Premier Portfolio–Institutional Class | 0.52 | % | 155,355 | 5,088,802 | (4,988,145 | ) | — | — | 26 | 256,012 | 256,012 | |||||||||||||||||||||||||
Total Money Market Funds | 310,710 | 10,177,604 | (9,976,290 | ) | — | — | 108 | 512,024 | 512,024 | |||||||||||||||||||||||||||
TOTAL INVESTMENTS IN AFFILIATED ISSUERS | 98.97 | % | $ | 40,729,848 | $ | 22,205,222 | $ | (13,199,918 | ) | $ | (1,201,920 | ) | $ | 2,569,470 | (b) | $ | 2,085,871 | $ | 48,452,724 | |||||||||||||||||
OTHER ASSETS LESS LIABILITIES | 1.03 | % | 506,053 | |||||||||||||||||||||||||||||||||
NET ASSETS | 100.00 | % | $ | 48,958,777 | ||||||||||||||||||||||||||||||||
Notes to Schedule of Investments:
| (a) | Each underlying fund and the Fund are affiliated by either having the same investment adviser or an investment adviser under common control with the Fund’s investment adviser. |
| (b) | Includes $4,649,915 and $2,649,978 of capital gains distributions from affiliated underlying funds for Invesco Balanced-Risk Retirement 2040 Fund and Invesco Balanced-Risk Retirement 2050 Fund, respectively. |
See accompanying Notes to Financial Statements which are an integral part of the financial statements.
30 Invesco Balanced-Risk Retirement Funds
Statement of Assets and Liabilities
December 31, 2014
| Invesco Balanced-Risk Retirement Now Fund | Invesco Balanced-Risk Retirement 2020 Fund | Invesco Balanced-Risk Retirement 2030 Fund | Invesco Balanced-Risk Retirement 2040 Fund | Invesco Balanced-Risk Retirement 2050 Fund | ||||||||||||||||||||||||||
Assets: | ||||||||||||||||||||||||||||||
Investments in affiliated underlying funds, at value | $ | 47,082,322 | $ | 124,321,006 | $ | 135,369,562 | $ | 85,868,992 | $ | 48,452,724 | ||||||||||||||||||||
Receivable for: | ||||||||||||||||||||||||||||||
Fund shares sold | 10,876 | 130,222 | 430,159 | 84,682 | 1,019,423 | |||||||||||||||||||||||||
Dividends from affiliated underlying funds | 773 | 902 | 27 | 28 | 18 | |||||||||||||||||||||||||
Fund expenses absorbed | 6,267 | — | — | 1,760 | 57 | |||||||||||||||||||||||||
Investment for trustee deferred compensation and retirement plans | 41,273 | 34,385 | 34,115 | 31,257 | 27,999 | |||||||||||||||||||||||||
Other assets | 44,169 | 45,640 | 46,515 | 44,362 | 43,661 | |||||||||||||||||||||||||
Total assets | 47,185,680 | 124,532,155 | 135,880,378 | 86,031,081 | 49,543,882 | |||||||||||||||||||||||||
Liabilities: | ||||||||||||||||||||||||||||||
Payable for: | ||||||||||||||||||||||||||||||
Investments purchased | — | — | — | — | 273,127 | |||||||||||||||||||||||||
Fund shares reacquired | 145,114 | 270,276 | 631,726 | 600,902 | 219,060 | |||||||||||||||||||||||||
Accrued fees to affiliates | 31,159 | 82,961 | 93,112 | 54,622 | 38,310 | |||||||||||||||||||||||||
Accrued trustees’ and officer’s fees and benefits | 461 | 341 | 343 | 456 | 460 | |||||||||||||||||||||||||
Accrued operating expenses | 26,185 | 30,002 | 29,879 | 29,149 | 25,425 | |||||||||||||||||||||||||
Trustee deferred compensation and retirement plans | 42,110 | 36,076 | 35,692 | 32,124 | 28,723 | |||||||||||||||||||||||||
Total liabilities | 245,029 | 419,656 | 790,752 | 717,253 | 585,105 | |||||||||||||||||||||||||
Net assets applicable to shares outstanding | $ | 46,940,651 | $ | 124,112,499 | $ | 135,089,626 | $ | 85,313,828 | $ | 48,958,777 | ||||||||||||||||||||
Net assets consist of: | ||||||||||||||||||||||||||||||
Shares of beneficial interest | $ | 44,783,040 | $ | 120,620,920 | $ | 132,978,131 | $ | 87,428,220 | $ | 50,647,165 | ||||||||||||||||||||
Undistributed net investment income | 31,067 | 46,234 | 4,405 | (6,940 | ) | 24,860 | ||||||||||||||||||||||||
Undistributed net realized gain | 581,994 | 1,824,218 | 3,082,974 | 2,074,937 | 1,118,052 | |||||||||||||||||||||||||
Net unrealized appreciation (depreciation) | 1,544,550 | 1,621,127 | (975,884 | ) | (4,182,389 | ) | (2,831,300 | ) | ||||||||||||||||||||||
| $ | 46,940,651 | $ | 124,112,499 | $ | 135,089,626 | $ | 85,313,828 | $ | 48,958,777 | |||||||||||||||||||||
See accompanying Notes to Financial Statements which are an integral part of the financial statements.
31 Invesco Balanced-Risk Retirement Funds
Statement of Assets and Liabilities—(continued)
December 31, 2014
| Invesco Balanced-Risk Retirement Now Fund | Invesco Balanced-Risk Retirement 2020 Fund | Invesco Balanced-Risk Retirement 2030 Fund | Invesco Balanced-Risk Retirement 2040 Fund | Invesco Balanced-Risk Retirement 2050 Fund | ||||||||||||||||||||||||||
Net Assets: | ||||||||||||||||||||||||||||||
Class A | $ | 14,273,060 | $ | 47,303,034 | $ | 49,929,424 | $ | 35,495,175 | $ | 14,644,866 | ||||||||||||||||||||
Class AX | $ | 11,272,980 | $ | 9,609,337 | $ | 6,697,039 | $ | 3,283,819 | $ | 1,192,496 | ||||||||||||||||||||
Class B | $ | 340,895 | $ | 1,715,149 | $ | 2,156,897 | $ | 924,869 | $ | 348,461 | ||||||||||||||||||||
Class C | $ | 4,534,706 | $ | 9,613,156 | $ | 13,329,625 | $ | 6,249,202 | $ | 4,876,298 | ||||||||||||||||||||
Class CX | $ | 3,087,519 | $ | 2,676,953 | $ | 1,732,146 | $ | 571,889 | $ | 151,844 | ||||||||||||||||||||
Class R | $ | 1,655,516 | $ | 7,564,388 | $ | 11,530,832 | $ | 8,649,757 | $ | 5,548,243 | ||||||||||||||||||||
Class RX | $ | 180,507 | $ | 848,011 | $ | 1,138,964 | $ | 683,126 | $ | 214,287 | ||||||||||||||||||||
Class Y | $ | 1,694,744 | $ | 7,416,056 | $ | 5,729,962 | $ | 2,338,085 | $ | 3,381,352 | ||||||||||||||||||||
Class R5 | $ | 9,572,940 | $ | 36,230,180 | $ | 41,595,021 | $ | 25,847,863 | $ | 18,170,583 | ||||||||||||||||||||
Class R6 | $ | 327,784 | $ | 1,136,235 | $ | 1,249,716 | $ | 1,270,043 | $ | 430,347 | ||||||||||||||||||||
Shares outstanding, $0.01 par value per share, |
| |||||||||||||||||||||||||||||
Class A | 1,626,739 | 5,194,838 | 5,682,122 | 4,399,817 | 1,835,601 | |||||||||||||||||||||||||
Class AX | 1,286,377 | 1,055,408 | 761,087 | 407,396 | 149,342 | |||||||||||||||||||||||||
Class B | 39,771 | 190,562 | 248,050 | 115,991 | 44,342 | |||||||||||||||||||||||||
Class C | 528,743 | 1,070,071 | 1,534,085 | 784,833 | 619,360 | |||||||||||||||||||||||||
Class CX | 360,162 | 297,898 | 199,345 | 71,903 | 19,297 | |||||||||||||||||||||||||
Class R | 189,794 | 834,198 | 1,319,512 | 1,078,171 | 699,350 | |||||||||||||||||||||||||
Class RX | 20,732 | 93,532 | 130,411 | 85,055 | 26,995 | |||||||||||||||||||||||||
Class Y | 191,764 | 814,635 | 650,404 | 289,155 | 422,280 | |||||||||||||||||||||||||
Class R5 | 1,083,258 | 3,960,084 | 4,709,728 | 3,191,675 | 2,270,383 | |||||||||||||||||||||||||
Class R6 | 37,098 | 124,025 | 141,503 | 156,844 | 53,700 | |||||||||||||||||||||||||
Class A: | ||||||||||||||||||||||||||||||
Net asset value per share | $ | 8.77 | $ | 9.11 | $ | 8.79 | $ | 8.07 | $ | 7.98 | ||||||||||||||||||||
Maximum offering price per share | $ | 9.28 | $ | 9.64 | $ | 9.30 | $ | 8.54 | $ | 8.44 | ||||||||||||||||||||
Class AX: | ||||||||||||||||||||||||||||||
Net asset value per share | $ | 8.76 | $ | 9.10 | $ | 8.80 | $ | 8.06 | $ | 7.99 | ||||||||||||||||||||
Maximum offering price per share | $ | 9.27 | $ | 9.63 | $ | 9.31 | $ | 8.53 | $ | 8.46 | ||||||||||||||||||||
Class B: | ||||||||||||||||||||||||||||||
Net asset value and offering price per share | $ | 8.57 | $ | 9.00 | $ | 8.70 | $ | 7.97 | $ | 7.86 | ||||||||||||||||||||
Class C: | ||||||||||||||||||||||||||||||
Net asset value and offering price per share | $ | 8.58 | $ | 8.98 | $ | 8.69 | $ | 7.96 | $ | 7.87 | ||||||||||||||||||||
Class CX: | ||||||||||||||||||||||||||||||
Net asset value and offering price per share | $ | 8.57 | $ | 8.99 | $ | 8.69 | $ | 7.95 | $ | 7.87 | ||||||||||||||||||||
Class R: | ||||||||||||||||||||||||||||||
Net asset value and offering price per share | $ | 8.72 | $ | 9.07 | $ | 8.74 | $ | 8.02 | $ | 7.93 | ||||||||||||||||||||
Class RX: | ||||||||||||||||||||||||||||||
Net asset value and offering price per share | $ | 8.71 | $ | 9.07 | $ | 8.73 | $ | 8.03 | $ | 7.94 | ||||||||||||||||||||
Class Y: | ||||||||||||||||||||||||||||||
Net asset value and offering price per share | $ | 8.84 | $ | 9.10 | $ | 8.81 | $ | 8.09 | $ | 8.01 | ||||||||||||||||||||
Class R5: | ||||||||||||||||||||||||||||||
Net asset value and offering price per share | $ | 8.84 | $ | 9.15 | $ | 8.83 | $ | 8.10 | $ | 8.00 | ||||||||||||||||||||
Class R6: | ||||||||||||||||||||||||||||||
Net asset value and offering price per share | $ | 8.84 | $ | 9.16 | $ | 8.83 | $ | 8.10 | $ | 8.01 | ||||||||||||||||||||
Cost of Investments in affiliated underlying funds | $ | 45,537,772 | $ | 122,699,879 | $ | 136,345,446 | $ | 90,051,381 | $ | 51,284,024 | ||||||||||||||||||||
See accompanying Notes to Financial Statements which are an integral part of the financial statements.
32 Invesco Balanced-Risk Retirement Funds
Statement of Operations
For the year ended December 31, 2014
| Invesco Balanced-Risk Retirement Now Fund | Invesco Balanced-Risk Retirement 2020 Fund | Invesco Balanced-Risk Retirement 2030 Fund | Invesco Balanced-Risk Retirement 2040 Fund | Invesco Balanced-Risk Retirement 2050 Fund | ||||||||||||||||||||||||||
Investment income: | ||||||||||||||||||||||||||||||
Dividends from affiliated underlying funds | $ | 672,824 | $ | 2,408,523 | $ | 3,743,642 | $ | 3,079,366 | $ | 2,085,871 | ||||||||||||||||||||
Other income | 4,524 | 3,303 | 3,256 | 3,072 | 2,313 | |||||||||||||||||||||||||
Total investment income | 677,348 | 2,411,826 | 3,746,898 | 3,082,438 | 2,088,184 | |||||||||||||||||||||||||
Expenses: | ||||||||||||||||||||||||||||||
Administrative services fees | 50,000 | 50,000 | 50,000 | 50,000 | 50,000 | |||||||||||||||||||||||||
Custodian fees | 6,992 | 7,374 | 7,690 | 7,366 | 7,114 | |||||||||||||||||||||||||
Distribution fees: | ||||||||||||||||||||||||||||||
Class A | 37,033 | 124,749 | 128,527 | 86,347 | 33,364 | |||||||||||||||||||||||||
Class AX | 31,773 | 26,869 | 18,191 | 8,500 | 2,939 | |||||||||||||||||||||||||
Class B | 4,301 | 20,651 | 24,558 | 10,009 | 3,900 | |||||||||||||||||||||||||
Class C | 45,516 | 94,922 | 125,594 | 57,851 | 38,038 | |||||||||||||||||||||||||
Class CX | 34,188 | 28,453 | 18,394 | 5,844 | 1,420 | |||||||||||||||||||||||||
Class R | 9,032 | 44,082 | 60,621 | 44,050 | 26,455 | |||||||||||||||||||||||||
Class RX | 1,050 | 5,110 | 5,533 | 3,250 | 1,160 | |||||||||||||||||||||||||
Transfer agent fees — A, AX, B, C, CX, R, RX and Y | 72,832 | 190,640 | 207,092 | 153,693 | 103,873 | |||||||||||||||||||||||||
Transfer agent fees — R5 | 9,071 | 29,920 | 35,292 | 23,162 | 16,152 | |||||||||||||||||||||||||
Transfer agent fees — R6 | 27 | 38 | 41 | 67 | 35 | |||||||||||||||||||||||||
Trustees’ and officers’ fees and benefits | 22,996 | 24,153 | 24,167 | 23,345 | 22,642 | |||||||||||||||||||||||||
Registration and filing fees | 108,934 | 115,180 | 112,795 | 108,579 | 107,012 | |||||||||||||||||||||||||
Professional services fees | 35,889 | 36,565 | 36,675 | 36,890 | 35,746 | |||||||||||||||||||||||||
Other | 36,375 | 43,649 | 44,989 | 50,381 | 36,984 | |||||||||||||||||||||||||
Total expenses | 506,009 | 842,355 | 900,159 | 669,334 | 486,834 | |||||||||||||||||||||||||
Less: Expenses reimbursed and expense offset arrangement(s) | (343,149 | ) | (497,624 | ) | (518,891 | ) | (443,891 | ) | (379,615 | ) | ||||||||||||||||||||
Net expenses | 162,860 | 344,731 | 381,268 | 225,443 | 107,219 | |||||||||||||||||||||||||
Net investment income | 514,488 | 2,067,095 | 3,365,630 | 2,856,995 | 1,980,965 | |||||||||||||||||||||||||
Realized and unrealized gain (loss) from: | ||||||||||||||||||||||||||||||
Net realized gain (loss) from affiliated underlying funds | (120,093 | ) | (555,663 | ) | (213,507 | ) | (17,335 | ) | (80,508 | ) | ||||||||||||||||||||
Net realized gain from distributions of affiliated underlying fund shares | 1,475,730 | 5,328,631 | 7,125,017 | 4,649,915 | 2,649,978 | |||||||||||||||||||||||||
Net realized gain from affiliated underlying fund shares | 1,355,637 | 4,772,968 | 6,911,510 | 4,632,580 | 2,569,470 | |||||||||||||||||||||||||
Change in net unrealized appreciation (depreciation) of affiliated underlying fund shares | (269,640 | ) | (864,783 | ) | (2,327,246 | ) | (1,839,365 | ) | (1,201,920 | ) | ||||||||||||||||||||
Net increase in net assets resulting from operations | $ | 1,600,485 | $ | 5,975,280 | $ | 7,949,894 | $ | 5,650,210 | $ | 3,348,515 | ||||||||||||||||||||
See accompanying Notes to Financial Statements which are an integral part of the financial statements.
33 Invesco Balanced-Risk Retirement Funds
Statement of Changes in Net Assets
For the years ended December 31, 2014 and 2013
| Invesco Balanced-Risk Retirement Now Fund | Invesco Balanced-Risk Retirement 2020 Fund | |||||||||||||||||||
| 2014 | 2013 | 2014 | 2013 | |||||||||||||||||
Operations: | ||||||||||||||||||||
Net investment income (loss) | $ | 514,488 | $ | (174,004 | ) | $ | 2,067,095 | $ | (388,518 | ) | ||||||||||
Net realized gain | 1,355,637 | 2,438,723 | 4,772,968 | 7,992,484 | ||||||||||||||||
Change in net unrealized appreciation (depreciation) | (269,640 | ) | (1,651,018 | ) | (864,783 | ) | (5,353,570 | ) | ||||||||||||
Net increase in net assets resulting from operations | 1,600,485 | 613,701 | 5,975,280 | 2,250,396 | ||||||||||||||||
Distributions to shareholders from net investment income: | ||||||||||||||||||||
Class A | (364,400 | ) | (336,825 | ) | (1,812,630 | ) | (1,673,963 | ) | ||||||||||||
Class AX | (294,723 | ) | (318,764 | ) | (369,802 | ) | (388,401 | ) | ||||||||||||
Class B | (8,317 | ) | (9,503 | ) | (56,171 | ) | (61,482 | ) | ||||||||||||
Class C | (109,009 | ) | (99,103 | ) | (294,938 | ) | (255,127 | ) | ||||||||||||
Class CX | (74,269 | ) | (75,699 | ) | (83,463 | ) | (73,858 | ) | ||||||||||||
Class R | (41,609 | ) | (38,802 | ) | (270,578 | ) | (328,045 | ) | ||||||||||||
Class RX | (4,555 | ) | (10,870 | ) | (33,126 | ) | (54,697 | ) | ||||||||||||
Class Y | (44,687 | ) | (48,000 | ) | (296,821 | ) | (304,498 | ) | ||||||||||||
Class R5 | (251,618 | ) | (169,304 | ) | (1,454,726 | ) | (1,110,635 | ) | ||||||||||||
Class R6 | (8,685 | ) | (6,415 | ) | (46,138 | ) | (31,156 | ) | ||||||||||||
Total distributions from net investment income | (1,201,872 | ) | (1,113,285 | ) | (4,718,393 | ) | (4,281,862 | ) | ||||||||||||
Distributions to shareholders from net realized gains: | ||||||||||||||||||||
Class A | (299,152 | ) | (142,268 | ) | (1,358,673 | ) | (349,656 | ) | ||||||||||||
Class AX | (242,254 | ) | (134,575 | ) | (277,178 | ) | (81,129 | ) | ||||||||||||
Class B | (7,541 | ) | (4,471 | ) | (52,790 | ) | (17,154 | ) | ||||||||||||
Class C | (98,791 | ) | (46,524 | ) | (277,190 | ) | (71,183 | ) | ||||||||||||
Class CX | (67,339 | ) | (35,578 | ) | (78,439 | ) | (20,607 | ) | ||||||||||||
Class R | (35,225 | ) | (18,063 | ) | (218,075 | ) | (74,753 | ) | ||||||||||||
Class RX | (3,863 | ) | (4,779 | ) | (26,698 | ) | (12,464 | ) | ||||||||||||
Class Y | (35,549 | ) | (19,568 | ) | (207,924 | ) | (58,953 | ) | ||||||||||||
Class R5 | (200,167 | ) | (68,917 | ) | (1,019,038 | ) | (215,026 | ) | ||||||||||||
Class R6 | (6,909 | ) | (2,615 | ) | (32,320 | ) | (6,032 | ) | ||||||||||||
Total distributions from net realized gains | (996,790 | ) | (477,358 | ) | (3,548,325 | ) | (906,957 | ) | ||||||||||||
Share transactions–net: | ||||||||||||||||||||
Class A | (1,420,882 | ) | 2,179,234 | (3,284,778 | ) | 10,569,458 | ||||||||||||||
Class AX | (3,438,156 | ) | (3,287,455 | ) | (2,264,245 | ) | (1,931,048 | ) | ||||||||||||
Class B | (135,934 | ) | (193,521 | ) | (688,783 | ) | (1,033,827 | ) | ||||||||||||
Class C | (456,656 | ) | 429,199 | (295,605 | ) | (251,506 | ) | |||||||||||||
Class CX | (721,654 | ) | (720,053 | ) | (227,525 | ) | (766,656 | ) | ||||||||||||
Class R | (280,618 | ) | (13,283 | ) | (2,745,399 | ) | (253,483 | ) | ||||||||||||
Class RX | (113,283 | ) | (190,797 | ) | (421,521 | ) | (640,372 | ) | ||||||||||||
Class Y | (409,157 | ) | 1,513,267 | (934,782 | ) | 2,288,090 | ||||||||||||||
Class R5 | 1,908,589 | 4,990,704 | 5,034,068 | 26,966,208 | ||||||||||||||||
Class R6 | 51,688 | 277,506 | 265,549 | 917,292 | ||||||||||||||||
Net increase (decrease) in net assets resulting from share transactions | (5,016,063 | ) | 4,984,801 | (5,563,021 | ) | 35,864,156 | ||||||||||||||
Net increase (decrease) in net assets | (5,614,240 | ) | 4,007,859 | (7,854,459 | ) | 32,925,733 | ||||||||||||||
Net assets: | ||||||||||||||||||||
Beginning of year | 52,554,891 | 48,547,032 | 131,966,958 | 99,041,225 | ||||||||||||||||
End of year* | $ | 46,940,651 | $ | 52,554,891 | $ | 124,112,499 | $ | 131,966,958 | ||||||||||||
* Includes accumulated undistributed net investment income (loss) | $ | 31,067 | $ | (32,418 | ) | $ | 46,234 | $ | (13,739 | ) | ||||||||||
See accompanying Notes to Financial Statements which are an integral part of the financial statements.
34 Invesco Balanced-Risk Retirement Funds
Statement of Changes in Net Assets—(continued)
For the years ended December 31, 2014 and 2013
| Invesco Balanced-Risk Retirement 2030 Fund | Invesco Balanced-Risk Retirement 2040 Fund | |||||||||||||||||||
| 2014 | 2013 | 2014 | 2013 | |||||||||||||||||
Operations: | ||||||||||||||||||||
Net investment income (loss) | $ | 3,365,630 | $ | (383,949 | ) | $ | 2,856,995 | $ | (225,195 | ) | ||||||||||
Net realized gain | 6,911,510 | 9,011,306 | 4,632,580 | 7,946,611 | ||||||||||||||||
Change in net unrealized appreciation (depreciation) | (2,327,246 | ) | (6,135,964 | ) | (1,839,365 | ) | (6,128,749 | ) | ||||||||||||
Net increase in net assets resulting from operations | 7,949,894 | 2,491,393 | 5,650,210 | 1,592,667 | ||||||||||||||||
Distributions to shareholders from net investment income: | ||||||||||||||||||||
Class A | (2,643,932 | ) | (1,770,989 | ) | (2,346,944 | ) | (832,307 | ) | ||||||||||||
Class AX | (344,412 | ) | (285,729 | ) | (217,920 | ) | (86,582 | ) | ||||||||||||
Class B | (100,522 | ) | (75,363 | ) | (55,986 | ) | (19,149 | ) | ||||||||||||
Class C | (594,112 | ) | (322,239 | ) | (367,039 | ) | (100,957 | ) | ||||||||||||
Class CX | (79,309 | ) | (49,562 | ) | (34,315 | ) | (9,590 | ) | ||||||||||||
Class R | (570,533 | ) | (421,569 | ) | (551,253 | ) | (191,683 | ) | ||||||||||||
Class RX | (57,190 | ) | (46,627 | ) | (43,775 | ) | (19,982 | ) | ||||||||||||
Class Y | (321,183 | ) | (176,378 | ) | (150,614 | ) | (52,006 | ) | ||||||||||||
Class R5 | (2,204,621 | ) | (1,258,426 | ) | (1,738,631 | ) | (566,940 | ) | ||||||||||||
Class R6 | (68,353 | ) | (32,778 | ) | (86,758 | ) | (26,288 | ) | ||||||||||||
Total distributions from net investment income | (6,984,167 | ) | (4,439,660 | ) | (5,593,235 | ) | (1,905,484 | ) | ||||||||||||
Distributions to shareholders from net realized gains: | ||||||||||||||||||||
Class A | (1,589,382 | ) | (419,510 | ) | (1,110,494 | ) | (1,466,444 | ) | ||||||||||||
Class AX | (211,387 | ) | (67,675 | ) | (103,124 | ) | (152,647 | ) | ||||||||||||
Class B | (70,577 | ) | (22,885 | ) | (29,728 | ) | (49,704 | ) | ||||||||||||
Class C | (417,139 | ) | (97,855 | ) | (194,885 | ) | (262,058 | ) | ||||||||||||
Class CX | (55,684 | ) | (15,050 | ) | (18,221 | ) | (24,894 | ) | ||||||||||||
Class R | (361,250 | ) | (107,692 | ) | (270,926 | ) | (377,448 | ) | ||||||||||||
Class RX | (36,211 | ) | (11,911 | ) | (21,515 | ) | (39,347 | ) | ||||||||||||
Class Y | (184,515 | ) | (39,007 | ) | (68,731 | ) | (82,933 | ) | ||||||||||||
Class R5 | (1,266,529 | ) | (278,309 | ) | (793,403 | ) | (904,083 | ) | ||||||||||||
Class R6 | (39,268 | ) | (7,249 | ) | (39,591 | ) | (41,921 | ) | ||||||||||||
Total distributions from net realized gains | (4,231,942 | ) | (1,067,143 | ) | (2,650,618 | ) | (3,401,479 | ) | ||||||||||||
Share transactions–net: | ||||||||||||||||||||
Class A | (687,184 | ) | 14,783,452 | 2,740,509 | 6,998,097 | |||||||||||||||
Class AX | (1,557,282 | ) | (1,790,237 | ) | (130,970 | ) | (350,698 | ) | ||||||||||||
Class B | (572,735 | ) | (699,034 | ) | (162,732 | ) | (103,230 | ) | ||||||||||||
Class C | 1,621,386 | 1,322,576 | 453,698 | (97,938 | ) | |||||||||||||||
Class CX | (51,452 | ) | (157,794 | ) | 24,138 | (1,993 | ) | |||||||||||||
Class R | (1,259,277 | ) | 1,009,664 | 187,122 | 860,535 | |||||||||||||||
Class RX | 48,783 | (25,494 | ) | 91,900 | (126,247 | ) | ||||||||||||||
Class Y | 481,334 | 1,461,179 | (328,971 | ) | 831,549 | |||||||||||||||
Class R5 | 7,672,220 | 17,510,481 | 5,612,550 | 16,074,157 | ||||||||||||||||
Class R6 | 386,334 | 923,801 | 345,740 | 1,015,873 | ||||||||||||||||
Net increase in net assets resulting from share transactions | 6,082,127 | 34,338,594 | 8,832,984 | 25,100,105 | ||||||||||||||||
Net increase in net assets | 2,815,912 | 31,323,184 | 6,239,341 | 21,385,809 | ||||||||||||||||
Net assets: | ||||||||||||||||||||
Beginning of year | 132,273,714 | 100,950,530 | 79,074,487 | 57,688,678 | ||||||||||||||||
End of year* | $ | 135,089,626 | $ | 132,273,714 | $ | 85,313,828 | $ | 79,074,487 | ||||||||||||
* Includes accumulated undistributed net investment income (loss) | $ | 4,405 | $ | (12,555 | ) | $ | (6,940 | ) | $ | 334,856 | ||||||||||
See accompanying Notes to Financial Statements which are an integral part of the financial statements.
35 Invesco Balanced-Risk Retirement Funds
Statement of Changes in Net Assets—(continued)
For the years ended December 31, 2014 and 2013
| Invesco Balanced-Risk Retirement 2050 Fund | ||||||||||
| 2014 | 2013 | |||||||||
Operations: | ||||||||||
Net investment income (loss) | $ | 1,980,965 | $ | (109,161 | ) | |||||
Net realized gain | 2,569,470 | 4,278,611 | ||||||||
Change in net unrealized appreciation (depreciation) | (1,201,920 | ) | (3,321,729 | ) | ||||||
Net increase in net assets resulting from operations | 3,348,515 | 847,721 | ||||||||
Distributions to shareholders from net investment income: | ||||||||||
Class A | (1,016,748 | ) | (312,499 | ) | ||||||
Class AX | (84,710 | ) | (27,423 | ) | ||||||
Class B | (23,142 | ) | (5,946 | ) | ||||||
Class C | (284,533 | ) | (58,672 | ) | ||||||
Class CX | (9,889 | ) | (2,012 | ) | ||||||
Class R | (383,441 | ) | (97,937 | ) | ||||||
Class RX | (14,890 | ) | (5,114 | ) | ||||||
Class Y | (150,482 | ) | (48,501 | ) | ||||||
Class R5 | (1,302,262 | ) | (347,830 | ) | ||||||
Class R6 | (31,429 | ) | (7,190 | ) | ||||||
Total distributions from net investment income | (3,301,526 | ) | (913,124 | ) | ||||||
Distributions to shareholders from net realized gains: | ||||||||||
Class A | (430,390 | ) | (747,878 | ) | ||||||
Class AX | (35,867 | ) | (65,627 | ) | ||||||
Class B | (10,807 | ) | (21,599 | ) | ||||||
Class C | (132,866 | ) | (213,141 | ) | ||||||
Class CX | (4,618 | ) | (7,311 | ) | ||||||
Class R | (167,740 | ) | (262,863 | ) | ||||||
Class RX | (6,514 | ) | (13,726 | ) | ||||||
Class Y | (61,712 | ) | (104,105 | ) | ||||||
Class R5 | (534,051 | ) | (746,608 | ) | ||||||
Class R6 | (12,889 | ) | (15,434 | ) | ||||||
Total distributions from net realized gains | (1,397,454 | ) | (2,198,292 | ) | ||||||
Share transactions–net: | ||||||||||
Class A | 1,469,740 | 1,416,113 | ||||||||
Class AX | (9,296 | ) | 39,079 | |||||||
Class B | (39,177 | ) | (60,070 | ) | ||||||
Class C | 1,105,732 | 159,158 | ||||||||
Class CX | 22,277 | 13,121 | ||||||||
Class R | 796,896 | 1,320,328 | ||||||||
Class RX | (38,052 | ) | 64,126 | |||||||
Class Y | 1,483,469 | 742,230 | ||||||||
Class R5 | 4,671,437 | 9,047,611 | ||||||||
Class R6 | 157,657 | 299,854 | ||||||||
Net increase in net assets resulting from share transactions | 9,620,683 | 13,041,550 | ||||||||
Net increase in net assets | 8,270,218 | 10,777,855 | ||||||||
Net assets: | ||||||||||
Beginning of year | 40,688,559 | 29,910,704 | ||||||||
End of year* | $ | 48,958,777 | $ | 40,688,559 | ||||||
* Includes accumulated undistributed net investment income (loss) | $ | 24,860 | $ | (20,073 | ) | |||||
See accompanying Notes to Financial Statements which are an integral part of the financial statements.
36 Invesco Balanced-Risk Retirement Funds
Notes to Financial Statements
December 31, 2014
NOTE 1—Significant Accounting Policies
AIM Growth Series (Invesco Growth Series) (the “Trust”) is organized as a Delaware statutory trust and is registered under the Investment Company Act of 1940, as amended (the “1940 Act”), as an open-end series management investment company consisting of seventeen separate series portfolios (each constituting a “Fund”), each authorized to issue an unlimited number of shares of beneficial interest. The Funds covered in this report, each a series portfolio of the Trust, are Invesco Balanced-Risk Retirement Now Fund, Invesco Balanced-Risk Retirement 2020 Fund, Invesco Balanced-Risk Retirement 2030 Fund, Invesco Balanced-Risk Retirement 2040 Fund and Invesco Balanced-Risk Retirement 2050 Fund (collectively, the “Funds”). The assets, liabilities and operations of each Fund are accounted for separately. Information presented in these financial statements pertains only to the Funds. Matters affecting each Fund or class will be voted on exclusively by the shareholders of such Fund or class.
The investment objectives of the Funds are: to provide real return and, as a secondary objective, capital preservation for Invesco Balanced-Risk Retirement Now Fund; and to provide total return with a low to moderate correlation to traditional financial market indices and, as a secondary objective, capital preservation for Invesco Balanced-Risk Retirement 2020 Fund, Invesco Balanced-Risk Retirement 2030 Fund, Invesco Balanced-Risk Retirement 2040 Fund and Invesco Balanced-Risk Retirement 2050 Fund.
Each Fund currently consists of ten different classes of shares: Class A, Class AX, Class B, Class C, Class CX, Class R, Class RX, Class Y, Class R5 and Class R6. Class AX, Class CX and Class RX shares are closed to new investors. Class A shares and Class AX shares are sold with a front-end sales charge unless certain waiver criteria are met and under certain circumstances load waived shares may be subject to contingent deferred sales charges (“CDSC”). Class C and Class CX shares are sold with a CDSC. Class R, Class RX, Class Y, Class R5 and Class R6 shares are sold at net asset value.
Effective November 30, 2010, new or additional investments in Class B shares are no longer permitted. Existing shareholders of Class B shares may continue to reinvest dividends and capital gains distributions in Class B shares until they convert to Class A shares. Also, shareholders in Class B shares will be able to exchange those shares for Class B shares of other Invesco Funds offering such shares until they convert to Class A shares. Generally, Class B shares will automatically convert to Class A shares on or about the month-end, which is at least eight years after the date of purchase. Redemption of Class B shares prior to the conversion date will be subject to a CDSC.
Each Fund is a “fund of funds,” in that it invests in other mutual funds (“underlying funds”) advised by Invesco Advisers, Inc. (the “Adviser” or “Invesco”). The Adviser may change each Fund’s asset class allocations, the underlying funds or the target weightings in an underlying fund without shareholder approval. The underlying funds may engage in a number of investment techniques and practices, which involve certain risks. Each underlying fund’s accounting policies are outlined in the underlying fund’s financial statements and are publicly available.
The following is a summary of the significant accounting policies followed by the Funds in the preparation of their financial statements.
| A. | Security Valuations — Securities of investment companies that trade on an exchange are valued at the last sales price or official closing price as of the close of the customary trading session on the exchange where the security is principally traded. Investments in shares of funds that are not traded on an exchange are valued at the end of day net asset value per share of such fund. Securities in the underlying funds, including restricted securities, are valued in accordance with the valuation policy of such fund. The policies of the underlying funds affiliated with the Funds as a result of having the same investment adviser are set forth below. |
A security listed or traded on an exchange (except convertible securities) is valued at its last sales price or official closing price as of the close of the customary trading session on the exchange where the security is principally traded, or lacking any sales or official closing price on a particular day, the security may be valued at the closing bid price on that day. Securities traded in the over-the-counter market are valued based on prices furnished by independent pricing services or market makers. When such securities are valued by an independent pricing service they may be considered fair valued. Futures contracts are valued at the final settlement price set by an exchange on which they are principally traded. Listed options are valued at the mean between the last bid and ask prices from the exchange on which they are principally traded. Options not listed on an exchange are valued by an independent source at the mean between the last bid and ask prices. For purposes of determining net asset value per share, futures and option contracts generally are valued 15 minutes after the close of the customary trading session of the New York Stock Exchange (“NYSE”).
Senior secured floating rate loans and senior secured floating rate debt securities are fair valued using an evaluated quote provided by an independent pricing service. Evaluated quotes provided by the pricing service may reflect appropriate factors such as ratings, tranche type, industry, company performance, spread, individual trading characteristics, institution-size trading in similar groups of securities and other market data.
Investments in open-end and closed-end registered investment companies that do not trade on an exchange are valued at the end of day net asset value per share. Investments in open-end and closed-end registered investment companies that trade on an exchange are valued at the last sales price or official closing price as of the close of the customary trading session on the exchange where the security is principally traded.
Debt obligations (including convertible securities) and unlisted equities are fair valued using an evaluated quote provided by an independent pricing service. Evaluated quotes provided by the pricing service may be determined without exclusive reliance on quoted prices, and may reflect appropriate factors such as institution-size trading in similar groups of securities, developments related to specific securities, dividend rate (for unlisted equities), yield (for debt obligations), quality, type of issue, coupon rate (for debt obligations), maturity (for debt obligations), individual trading characteristics and other market data. Debt obligations are subject to interest rate and credit risks. In addition, all debt obligations involve some risk of default with respect to interest and/or principal payments.
Swap agreements are fair valued using an evaluated quote, if available, provided by an independent pricing service. Evaluated quotes provided by the pricing service are valued based on a model which may include end of day net present values, spreads, ratings, industry, company performance and return of referenced assets.
Foreign securities’ (including foreign exchange contracts) prices are converted into U.S. dollar amounts using the applicable exchange rates as of the close of the NYSE. If market quotations are available and reliable for foreign exchange-traded equity securities, the securities will be valued at the market quotations. Because trading hours for certain foreign securities end before the close of the NYSE, closing market quotations may become unreliable. If between the time trading ends on a particular security and the close of the customary trading session on the NYSE, events occur that the Adviser determines are significant and make the closing price unreliable, the Fund may fair value the security. If the event is likely
37 Invesco Balanced-Risk Retirement Funds
to have affected the closing price of the security, the security will be valued at fair value in good faith using procedures approved by the Board of Trustees. Adjustments to closing prices to reflect fair value may also be based on a screening process of an independent pricing service to indicate the degree of certainty, based on historical data, that the closing price in the principal market where a foreign security trades is not the current value as of the close of the NYSE. Foreign securities’ prices meeting the approved degree of certainty that the price is not reflective of current value will be priced at the indication of fair value from the independent pricing service. Multiple factors may be considered by the independent pricing service in determining adjustments to reflect fair value and may include information relating to sector indices, American Depositary Receipts and domestic and foreign index futures. Foreign securities may have additional risks including exchange rate changes, potential for sharply devalued currencies and high inflation, political and economic upheaval, the relative lack of issuer information, relatively low market liquidity and the potential lack of strict financial and accounting controls and standards.
Securities for which market prices are not provided by any of the above methods may be valued based upon quotes furnished by independent sources. The last bid price may be used to value equity securities. The mean between the last bid and ask prices is used to value debt obligations, including corporate loans.
Securities for which market quotations are not readily available or became unreliable are valued at fair value as determined in good faith by or under the supervision of the Trust’s officers following procedures approved by the Board of Trustees. Issuer specific events, market trends, bid/ask quotes of brokers and information providers and other market data may be reviewed in the course of making a good faith determination of a security’s fair value.
The Fund may invest in securities that are subject to interest rate risk, meaning the risk that the prices will generally fall as interest rates rise and, conversely, the prices will generally rise as interest rates fall. Specific securities differ in their sensitivity to changes in interest rates depending on their individual characteristics. Changes in interest rates may result in increased market volatility, which may affect the value and/or liquidity of certain of the Fund’s investments.
Valuations change in response to many factors including the historical and prospective earnings of the issuer, the value of the issuer’s assets, general economic conditions, interest rates, investor perceptions and market liquidity. Because of the inherent uncertainties of valuation, the values reflected in the financial statements may materially differ from the value received upon actual sale of those investments.
| B. | Securities Transactions and Investment Income — Securities transactions are accounted for on a trade date basis. Realized gains or losses on sales are computed on the basis of specific identification of the securities sold. Distributions from ordinary income from underlying funds, if any, are recorded as dividend income on ex-dividend date. Distributions from gains from underlying funds, if any, are recorded as realized gains on the ex-dividend date. The following policies are followed by the underlying funds: Interest income (net of withholding tax, if any) is recorded on the accrual basis from settlement date. Bond premiums and discounts are amortized and/or accreted for financial reporting purposes. Paydown gains and losses on mortgage and asset-backed securities are recorded as adjustments to interest income. |
The Fund may periodically participate in litigation related to Fund investments. As such, the Fund may receive proceeds from litigation settlements. Any proceeds received are included in the Statement of Operations as realized gain (loss) for investments no longer held and as unrealized gain (loss) for investments still held.
Each Fund allocates income and realized and unrealized capital gains and losses to a class based on the relative net assets of each class.
| C. | Distributions — Invesco Balanced-Risk Retirement Now Fund generally declares and pays dividends from net investment income, if any, quarterly. Invesco Balanced-Risk Retirement 2020 Fund, Invesco Balanced-Risk Retirement 2030 Fund, Invesco Balanced-Risk Retirement 2040 Fund and Invesco Balanced-Risk Retirement 2050 Fund generally declare and pay dividends from net investment income, if any, annually. Distributions from net realized capital gains, if any, are generally paid annually and recorded on the ex-dividend date. The Funds may elect to treat a portion of the proceeds from redemptions as distributions for federal income tax purposes. |
| D. | Federal Income Taxes — The Funds intend to comply with the requirements of Subchapter M of the Internal Revenue Code of 1986, as amended (the “Internal Revenue Code”), necessary to qualify as a regulated investment company and to distribute substantially all of the Funds’ taxable earnings to shareholders. As such, the Funds will not be subject to federal income taxes on otherwise taxable income (including net realized capital gain) that is distributed to shareholders. Therefore, no provision for federal income taxes is recorded in the financial statements. |
The Fund recognizes the tax benefits of uncertain tax positions only when the position is more likely than not to be sustained. Management has analyzed the Fund’s uncertain tax positions and concluded that no liability for unrecognized tax benefits should be recorded related to uncertain tax positions. Management is not aware of any tax positions for which it is reasonably possible that the total amounts of unrecognized tax benefits will change materially in the next 12 months.
Each Fund files tax returns in the U.S. Federal jurisdiction and certain other jurisdictions. Generally, each Fund is subject to examinations by such taxing authorities for up to three years after the filing of the return for the tax period.
| E. | Expenses — Expenses included in the accompanying financial statements reflect the expenses of the Funds and do not include any expenses of the underlying funds. The effects of the underlying funds expenses are included in the realized and unrealized gain/loss on the investments in the underlying funds. Estimated expenses of the underlying funds are discussed further within Note 11. |
Fees provided for under the Rule 12b-1 plan of a particular class of each Fund and which are directly attributable to that class are charged to the operations of such class. Transfer agency fees and expenses and other shareholder recordkeeping fees and expenses attributable to Class R5 and Class R6 are allocated to each share class based on relative net assets. Sub-accounting fees attributable to Class R5 are charged to the operations of the class. Transfer agency fees and expenses and other shareholder recordkeeping fees and expenses relating to all other classes are allocated among those classes based on relative net assets. All other expenses are allocated among the classes based on relative net assets.
| F. | Accounting Estimates — The preparation of financial statements in conformity with accounting principles generally accepted in the United States of America (“GAAP”) requires management to make estimates and assumptions that affect the reported amounts of assets and liabilities at the date of the financial statements and the reported amounts of revenues and expenses during the reporting period including estimates and assumptions related to taxation. Actual results could differ from those estimates by a significant amount. In addition, each Fund monitors for material events or transactions that may occur or become known after the period-end date and before the date the financial statements are released to print. |
38 Invesco Balanced-Risk Retirement Funds
| G. | Indemnifications — Under the Trust’s organizational documents, each Trustee, officer, employee or other agent of the Trust is indemnified against certain liabilities that may arise out of the performance of their duties to the Funds. Additionally, in the normal course of business, the Funds enter into contracts, including each Funds’ servicing agreements, that contain a variety of indemnification clauses. Each Fund’s maximum exposure under these arrangements is unknown as this would involve future claims that may be made against such Fund that have not yet occurred. The risk of material loss as a result of such indemnification claims is considered remote. |
NOTE 2—Advisory Fees and Other Fees Paid to Affiliates
The Trust has entered into a master investment advisory agreement with Invesco. Under the terms of the investment advisory agreement, the Funds do not pay an advisory fee. However, each Fund pays advisory fees to Invesco indirectly as a shareholder of the underlying funds.
Under the terms of a master sub-advisory agreement between the Adviser and each of Invesco Asset Management Deutschland GmbH, Invesco Asset Management Limited, Invesco Asset Management (Japan) Limited, Invesco Australia Limited, Invesco Hong Kong Limited, Invesco Senior Secured Management, Inc. and Invesco Canada Ltd. (collectively, the “Affiliated Sub-Advisers”) the Adviser, not the Funds, may pay 40% of the fees paid to the Adviser to any such Affiliated Sub-Adviser(s) that provide(s) discretionary investment management services to each Fund based on the percentage of assets allocated to such Sub-Adviser(s).
Invesco has contractually agreed, through at least April 30, 2016, to reimburse expenses to the extent necessary to limit total annual fund operating expenses after expense reimbursement (excluding certain items discussed below) of Class A, Class AX, Class B, Class C, Class CX, Class R, Class RX, Class Y, Class R5 and Class R6 shares for each Fund as shown in the following table:
| Class A/AX | Class B | Class C/CX | Class R/RX | Class Y | Class R5 | Class R6 | ||||||||
Invesco Balanced-Risk Retirement Now Fund | 0.25% | 1.00% | 1.00% | 0.50% | 0.00% | 0.00% | 0.00% | |||||||
Invesco Balanced-Risk Retirement 2020 Fund | 0.25% | 1.00% | 1.00% | 0.50% | 0.00% | 0.00% | 0.00% | |||||||
Invesco Balanced-Risk Retirement 2030 Fund | 0.25% | 1.00% | 1.00% | 0.50% | 0.00% | 0.00% | 0.00% | |||||||
Invesco Balanced-Risk Retirement 2040 Fund | 0.25% | 1.00% | 1.00% | 0.50% | 0.00% | 0.00% | 0.00% | |||||||
Invesco Balanced-Risk Retirement 2050 Fund | 0.25% | 1.00% | 1.00% | 0.50% | 0.00% | 0.00% | 0.00% |
In determining Invesco’s obligation to reimburse expenses, the following expenses are not taken into account, and could cause the total annual fund operating expenses after expense reimbursement to exceed the numbers reflected above: (1) interest; (2) taxes; (3) dividend expense on short sales; (4) extraordinary or non-routine items, including litigation expenses; and (5) expenses that the Funds have incurred but did not actually pay because of an expense offset arrangement. Acquired Fund Fees and Expenses are not operating expenses of a Fund directly, but are fees and expenses, including management fees of the investment companies in which a Fund invests. As a result, the total annual fund operating expenses after expense reimbursement may exceed the expense limits above. Unless Invesco continues each Fund’s fee waiver agreement, it will terminate on April 30, 2016. The fee waiver agreement cannot be terminated during its term.
For the year ended December 31, 2014, Invesco reimbursed the following expenses:
| Fund Level | Class A | Class AX | Class B | Class C | Class CX | Class R | Class RX | Class Y | Class R5 | Class R6 | ||||||||||||||||||||||||||||||||||
Invesco Balanced-Risk Retirement Now Fund | $ | 261,219 | $ | 27,070 | $ | 23,225 | $ | 786 | $ | 8,318 | $ | 6,247 | $ | 3,301 | $ | 384 | $ | 3,366 | $ | 9,071 | $ | 27 | ||||||||||||||||||||||
Invesco Balanced-Risk Retirement 2020 Fund | 277,025 | 102,781 | 22,138 | 4,253 | 19,552 | 5,860 | 18,160 | 2,105 | 15,440 | 29,920 | 38 | |||||||||||||||||||||||||||||||||
Invesco Balanced-Risk Retirement 2030 Fund | 276,466 | 112,437 | 15,913 | 5,371 | 27,468 | 4,023 | 26,516 | 2,420 | 12,501 | 35,292 | 41 | |||||||||||||||||||||||||||||||||
Invesco Balanced-Risk Retirement 2040 Fund | 266,969 | 92,752 | 9,130 | 2,688 | 15,535 | 1,570 | 23,659 | 1,746 | 6,263 | 23,162 | 67 | |||||||||||||||||||||||||||||||||
Invesco Balanced-Risk Retirement 2050 Fund | 259,556 | 52,193 | 4,598 | 1,525 | 14,876 | 555 | 20,692 | 907 | 8,250 | 16,152 | 35 | |||||||||||||||||||||||||||||||||
The Trust has entered into a master administrative services agreement with Invesco pursuant to which each Fund has agreed to pay Invesco for certain administrative costs incurred in providing accounting services to such Fund. For the year ended December 31, 2014, expenses incurred under the agreement are shown in the Statement of Operations as Administrative services fees.
The Trust has entered into a transfer agency and service agreement with Invesco Investment Services, Inc. (“IIS”) pursuant to which each Fund has agreed to pay IIS a fee for providing transfer agency and shareholder services to such Fund. For the year ended December 31, 2014, expenses incurred under the agreement are shown in the Statement of Operations as Transfer agent fees.
The Trust has entered into master distribution agreements with Invesco Distributors, Inc. (“IDI”) to serve as the distributor for the Class A, Class AX, Class B, Class C, Class CX, Class R, Class RX, Class Y, Class R5 and Class R6 shares of each Fund. The Trust has adopted plans pursuant to Rule 12b-1 under the 1940 Act with respect to each Fund’s Class A, Class AX, Class B, Class C, Class CX, Class R and Class RX shares (collectively, the “Plans”). Each Fund, pursuant to the Plans, pays IDI compensation at the annual rate of 0.25% of the average daily net assets of Class A shares, 1.00% of the average daily net assets of Class B and Class C shares and 0.50% of the average daily net assets of Class R shares. Also, each Fund, pursuant to the Plans, reimburses IDI up to a maximum annual rate of 0.25% of each Fund’s average daily net assets of Class AX shares, 1.00% of the average daily net assets of each Fund’s Class CX shares and 0.50% of each Fund’s average daily net assets of Class RX shares. Of the Plan payments, up to 0.25% of the average daily net assets of each class of shares may be paid to furnish continuing personal shareholder services to customers who purchase and own shares of such classes. Any amounts not paid as a service fee under the Plans would constitute an asset-based sales charge. Rules of the Financial Industry Regulatory Authority (“FINRA”) impose a cap on the total sales charges, including asset-based sales charges, that may be paid by any class of shares of each Fund. For the year ended December 31, 2014, expenses incurred under the Plans are shown in the Statement of Operations as Distribution fees.
Front-end sales commissions and CDSC are not recorded as expenses of the Funds. Front-end sales commissions are deducted from proceeds from the sales of Fund shares prior to investment in Class A and Class A5 shares of the Funds. CDSC are deducted from redemption proceeds prior to
39 Invesco Balanced-Risk Retirement Funds
remittance to the shareholder. During the year ended December 31, 2014, IDI advised the Funds that IDI retained the following in front-end sales commissions from the sale of Class A and Class AX shares and received the following in CDSC imposed on redemptions by shareholders:
| Front End Sales Charges | Contingent Deferred Sales Charges | |||||||||||||||||||||||||||
| Class A | Class AX | Class A | Class AX | Class B | Class C | Class CX | ||||||||||||||||||||||
Invesco Balanced-Risk Retirement Now Fund | $ | 5,395 | $ | 280 | $ | 0 | $ | 0 | $ | 217 | $ | 225 | $ | 135 | ||||||||||||||
Invesco Balanced-Risk Retirement 2020 Fund | 12,172 | 747 | 24 | 0 | 2,011 | 811 | 8 | |||||||||||||||||||||
Invesco Balanced-Risk Retirement 2030 Fund | 18,198 | 696 | 157 | 0 | 3,286 | 1,552 | 0 | |||||||||||||||||||||
Invesco Balanced-Risk Retirement 2040 Fund | 16,638 | 513 | 55 | 14 | 801 | 882 | 36 | |||||||||||||||||||||
Invesco Balanced-Risk Retirement 2050 Fund | 10,733 | 136 | 67 | 9 | 665 | 412 | 0 | |||||||||||||||||||||
The underlying Invesco Funds pay no distribution fees for Class R6 shares, Institutional Class shares or shares of Invesco Balanced-Risk Aggressive Allocation Fund, and the Funds pay no sales loads or other similar compensation to IDI for acquiring underlying fund shares.
Certain officers and trustees of the Trust are officers and directors of the Adviser, IIS and/or IDI.
NOTE 3—Additional Valuation Information
GAAP defines fair value as the price that would be received to sell an asset or paid to transfer a liability in an orderly transaction between market participants at the measurement date, under current market conditions. GAAP establishes a hierarchy that prioritizes the inputs to valuation methods, giving the highest priority to readily available unadjusted quoted prices in an active market for identical assets (Level 1) and the lowest priority to significant unobservable inputs (Level 3), generally when market prices are not readily available or are unreliable. Based on the valuation inputs, the securities or other investments are tiered into one of three levels. Changes in valuation methods may result in transfers in or out of an investment’s assigned level:
| Level 1 — | Prices are determined using quoted prices in an active market for identical assets. |
| Level 2 — | Prices are determined using other significant observable inputs. Observable inputs are inputs that other market participants may use in pricing a security. These may include quoted prices for similar securities, interest rates, prepayment speeds, credit risk, yield curves, loss severities, default rates, discount rates, volatilities and others. |
| Level 3 — | Prices are determined using significant unobservable inputs. In situations where quoted prices or observable inputs are unavailable (for example, when there is little or no market activity for an investment at the end of the period), unobservable inputs may be used. Unobservable inputs reflect each Fund’s own assumptions about the factors market participants would use in determining fair value of the securities or instruments and would be based on the best available information. |
As of December 31, 2014, all of the securities in each Fund were valued based on Level 1 inputs (see the Schedule of Investments for security categories). The level assigned to the securities valuations may not be an indication of the risk or liquidity associated with investing in those securities. Because of the inherent uncertainties of valuation, the values reflected in the financial statements may materially differ from the value received upon actual sale of those investments.
During the year ended December 31, 2014, there were transfers from Level 2 to Level 1, due to the availability of the open-end fund NAV, for the following funds, as follows:
| Level 2 to Level 1 | ||||
Invesco Balanced-Risk Retirement Now Fund | $ | — | ||
Invesco Balanced-Risk Retirement 2020 Fund | — | |||
Invesco Balanced-Risk Retirement 2030 Fund | 23,529,861 | |||
Invesco Balanced-Risk Retirement 2040 Fund | 43,773,366 | |||
Invesco Balanced-Risk Retirement 2050 Fund | 40,474,603 | |||
NOTE 4—Expense Offset Arrangement(s)
The expense offset arrangement is comprised of transfer agency credits which result from balances in demand deposit accounts used by the transfer agent for clearing shareholder transactions. For the year ended December 31, 2014, the Funds received credits from this arrangement, which resulted in the reduction of the Funds’ total expenses of:
| Transfer Agent Credits | ||||
Invesco Balanced-Risk Retirement Now Fund | $ | 135 | ||
Invesco Balanced-Risk Retirement 2020 Fund | 352 | |||
Invesco Balanced-Risk Retirement 2030 Fund | 443 | |||
Invesco Balanced-Risk Retirement 2040 Fund | 350 | |||
Invesco Balanced-Risk Retirement 2050 Fund | 276 | |||
40 Invesco Balanced-Risk Retirement Funds
NOTE 5—Trustees’ and Officers’ Fees and Benefits
Trustees’ and Officers’ Fees and Benefits include amounts accrued by each Fund to pay remuneration to certain Trustees and Officers of such Fund. Trustees have the option to defer compensation payable by the Funds, and Trustees’ and Officers’ Fees and Benefits also include amounts accrued by each Fund to fund such deferred compensation amounts. Those Trustees who defer compensation have the option to select various Invesco Funds in which their deferral accounts shall be deemed to be invested. Finally, certain current Trustees were eligible to participate in a retirement plan that provided for benefits to be paid upon retirement to Trustees over a period of time based on the number of years of service. The Funds may have certain former Trustees who also participate in a retirement plan and receive benefits under such plan. Trustees’ and Officers’ Fees and Benefits include amounts accrued by each Fund to fund such retirement benefits. Obligations under the deferred compensation and retirement plans represent unsecured claims against the general assets of the Funds.
NOTE 6—Cash Balances
The Funds are permitted to temporarily carry a negative or overdrawn balance in their account with State Street Bank and Trust Company, the custodian bank. Such balances, if any at period end, are shown in the Statement of Assets and Liabilities under the payable caption Amount due custodian. To compensate the custodian bank for such overdrafts, the overdrawn Fund may either (1) leave funds as a compensating balance in the account so the custodian bank can be compensated by earning the additional interest; or (2) compensate by paying the custodian bank at a rate agreed upon by the custodian bank and Invesco, not to exceed the contractually agreed upon rate.
NOTE 7—Distributions to Shareholders and Tax Components of Net Assets
Tax Character of Distributions to Shareholders Paid During the Fiscal Years Ended December 31, 2014 and 2013:
| 2014 | 2013 | |||||||||||||||||||||||
| Ordinary Income | Long-term Capital Gain | Total Distributions | Ordinary Income | Long-term Capital Gain | Total Distributions | |||||||||||||||||||
Invesco Balanced-Risk Retirement Now Fund | $ | 1,201,872 | $ | 996,790 | $ | 2,198,662 | $ | 1,101,352 | $ | 489,291 | $ | 1,590,643 | ||||||||||||
Invesco Balanced-Risk Retirement 2020 Fund | 4,718,393 | 3,548,325 | 8,266,718 | 4,281,862 | 906,957 | 5,188,819 | ||||||||||||||||||
Invesco Balanced-Risk Retirement 2030 Fund | 6,984,167 | 4,231,942 | 11,216,109 | 4,452,281 | 1,054,522 | 5,506,803 | ||||||||||||||||||
Invesco Balanced-Risk Retirement 2040 Fund | 5,593,235 | 2,650,618 | 8,243,853 | 1,905,484 | 3,401,479 | 5,306,963 | ||||||||||||||||||
Invesco Balanced-Risk Retirement 2050 Fund | 3,301,526 | 1,397,454 | 4,698,980 | 913,124 | 2,198,292 | 3,111,416 | ||||||||||||||||||
Tax Components of Net Assets at Period-End:
| Undistributed Ordinary Income | Undistributed Long-term Gain | Net Unrealized Appreciation (Depreciation)— Investments | Temporary Book/Tax Differences | Shares of Beneficial Interest | Total Net Assets | |||||||||||||||||||
Invesco Balanced-Risk Retirement Now Fund | $ | 68,080 | $ | 623,613 | $ | 1,502,931 | $ | (37,013 | ) | $ | 44,783,040 | $ | 46,940,651 | |||||||||||
Invesco Balanced-Risk Retirement 2020 Fund | 78,574 | 2,253,552 | 1,191,793 | (32,340 | ) | 120,620,920 | 124,112,499 | |||||||||||||||||
Invesco Balanced-Risk Retirement 2030 Fund | 36,339 | 3,441,088 | (1,333,998 | ) | (31,934 | ) | 132,978,131 | 135,089,626 | ||||||||||||||||
Invesco Balanced-Risk Retirement 2040 Fund | 21,443 | 2,273,903 | (4,381,355 | ) | (28,383 | ) | 87,428,220 | 85,313,828 | ||||||||||||||||
Invesco Balanced-Risk Retirement 2050 Fund | 49,992 | 1,264,566 | (2,977,814 | ) | (25,132 | ) | 50,647,165 | 48,958,777 | ||||||||||||||||
The difference between book-basis and tax-basis unrealized appreciation (depreciation) is due to differences in the timing of recognition of gains and losses on investments for tax and book purposes. The Funds net unrealized appreciation (depreciation) differences are attributable primarily to wash sales.
The temporary book/tax differences are a result of timing differences between book and tax recognition of income and/or expenses. The Funds temporary book/tax differences are the result of the trustee deferral of compensation and retirement plan benefits.
The Funds do not have a capital loss carryforward as of December 31, 2014.
41 Invesco Balanced-Risk Retirement Funds
NOTE 8—Investment Securities
The aggregate amount of investment securities purchased and sold by each Fund and aggregate cost and the net unrealized appreciation (depreciation) of investments for tax purposes are as follows:
| For the year ended December 31, 2014* | At December 31, 2014 | |||||||||||||||||||||||
| Federal Tax Cost** | Unrealized Appreciation | Unrealized (Depreciation) | Net Unrealized (Depreciation) | |||||||||||||||||||||
| Purchases | Sales | |||||||||||||||||||||||
Invesco Balanced-Risk Retirement Now Fund | $ | 2,714,506 | $ | 5,666,508 | $ | 45,579,391 | $ | 1,502,931 | $ | — | $ | 1,502,931 | ||||||||||||
Invesco Balanced-Risk Retirement 2020 Fund | 7,729,025 | 19,961,769 | 123,129,213 | 1,191,793 | — | 1,191,793 | ||||||||||||||||||
Invesco Balanced-Risk Retirement 2030 Fund | 17,442,491 | 12,213,858 | 136,703,560 | 400,565 | (1,734,563 | ) | (1,333,998 | ) | ||||||||||||||||
Invesco Balanced-Risk Retirement 2040 Fund | 15,796,890 | 6,500,036 | 90,250,347 | — | (4,381,355 | ) | (4,381,355 | ) | ||||||||||||||||
Invesco Balanced-Risk Retirement 2050 Fund | 12,027,618 | 3,223,628 | 51,430,538 | — | (2,977,814 | ) | (2,977,814 | ) | ||||||||||||||||
| * | Excludes money market funds, if any. |
| ** | Cost of investments on a tax basis includes the adjustments for financial reporting purposes as of the most recently completed federal income tax reporting period end. |
NOTE 9—Reclassification of Permanent Differences
Primarily as a result of differing book/tax treatment of capital gain distributions from the underlying funds, on December 31, 2014. These reclassifications had no effect on the net assets of each Fund.
| Undistributed Net Investment Income | Undistributed Net Realized Gain (Loss) | Shares of Beneficial Interest | ||||||||||
Invesco Balanced-Risk Retirement Now Fund | $ | 750,869 | $ | (750,869 | ) | $ | — | |||||
Invesco Balanced-Risk Retirement 2020 Fund | 2,711,271 | (2,711,271 | ) | — | ||||||||
Invesco Balanced-Risk Retirement 2030 Fund | 3,635,497 | (3,635,497 | ) | — | ||||||||
Invesco Balanced-Risk Retirement 2040 Fund | 2,394,444 | (2,384,754 | ) | (9,690 | ) | |||||||
Invesco Balanced-Risk Retirement 2050 Fund | 1,365,494 | (1,365,494 | ) | — | ||||||||
42 Invesco Balanced-Risk Retirement Funds
NOTE 10—Share Information
Invesco Balanced-Risk Retirement Now Fund
| Summary of Share Activity | ||||||||||||||||
| Years ended December 31, | ||||||||||||||||
| 2014(a) | 2013 | |||||||||||||||
| Shares | Amount | Shares | Amount | |||||||||||||
Sold: | ||||||||||||||||
Class A | 375,413 | $ | 3,390,563 | 844,684 | $ | 7,707,125 | ||||||||||
Class AX | 8,821 | 80,081 | 11,496 | 104,867 | ||||||||||||
Class B | 2,067 | 18,335 | 4,770 | 43,135 | ||||||||||||
Class C | 101,963 | 904,695 | 173,448 | 1,562,763 | ||||||||||||
Class CX | 8,045 | 71,416 | 12,775 | 115,129 | ||||||||||||
Class R | 69,218 | 625,816 | 87,648 | 796,717 | ||||||||||||
Class RX | 3,659 | 32,882 | 10,127 | 92,024 | ||||||||||||
Class Y | 63,165 | 580,283 | 253,891 | 2,348,808 | ||||||||||||
Class R5 | 431,578 | 3,935,017 | 912,942 | 8,342,951 | ||||||||||||
Class R6 | 7,887 | 72,520 | 39,848 | 365,202 | ||||||||||||
Issued as reinvestment of dividends: | ||||||||||||||||
Class A | 71,036 | 619,438 | 49,246 | 437,299 | ||||||||||||
Class AX | 61,603 | 536,562 | 48,541 | 430,074 | ||||||||||||
Class B | 1,808 | 15,405 | 1,449 | 12,651 | ||||||||||||
Class C | 22,834 | 194,778 | 14,451 | 126,162 | ||||||||||||
Class CX | 16,123 | 137,367 | 12,169 | 106,236 | ||||||||||||
Class R | 7,594 | 65,842 | 6,400 | 56,577 | ||||||||||||
Class RX | 880 | 7,617 | 1,738 | 15,349 | ||||||||||||
Class Y | 9,084 | 79,755 | 7,505 | 66,950 | ||||||||||||
Class R5 | 51,401 | 451,302 | 26,671 | 237,907 | ||||||||||||
Class R6 | 1,723 | 15,123 | 978 | 8,725 | ||||||||||||
Automatic conversion of Class B shares to Class A shares: | ||||||||||||||||
Class A | 5,669 | 51,674 | 7,328 | 67,078 | ||||||||||||
Class B | (5,790 | ) | (51,674 | ) | (7,434 | ) | (67,078 | ) | ||||||||
Reacquired: | ||||||||||||||||
Class A | (605,120 | ) | (5,482,557 | ) | (660,014 | ) | (6,032,268 | ) | ||||||||
Class AX | (448,838 | ) | (4,054,799 | ) | (419,392 | ) | (3,822,396 | ) | ||||||||
Class B | (13,147 | ) | (118,000 | ) | (20,161 | ) | (182,229 | ) | ||||||||
Class C | (176,218 | ) | (1,556,129 | ) | (139,540 | ) | (1,259,726 | ) | ||||||||
Class CX | (104,803 | ) | (930,437 | ) | (104,313 | ) | (941,418 | ) | ||||||||
Class R | (107,661 | ) | (972,276 | ) | (95,169 | ) | (866,577 | ) | ||||||||
Class RX | (17,142 | ) | (153,782 | ) | (33,495 | ) | (298,170 | ) | ||||||||
Class Y | (116,928 | ) | (1,069,195 | ) | (98,826 | ) | (902,491 | ) | ||||||||
Class R5 | (270,803 | ) | (2,477,730 | ) | (390,916 | ) | (3,590,154 | ) | ||||||||
Class R6 | (3,885 | ) | (35,955 | ) | (10,519 | ) | (96,421 | ) | ||||||||
Net increase (decrease) in share activity | (548,764 | ) | $ | (5,016,063 | ) | 548,326 | $ | 4,984,801 | ||||||||
| (a) | There are entities that are record owners of more than 5% of the outstanding shares of the Fund and in the aggregate own 32% of the outstanding shares of the Fund. IDI has an agreement with these entities to sell Fund shares. The Fund, Invesco and/or Invesco affiliates may make payments to these entities, which are considered to be related to the Fund, for providing services to the Fund, Invesco and/or Invesco affiliates including but not limited to services such as securities brokerage, distribution, third party record keeping and account servicing. The Trust has no knowledge as to whether all or any portion of the shares owned of record by these entities are also owned beneficially. |
43 Invesco Balanced-Risk Retirement Funds
NOTE 10—Share Information—(continued)
Invesco Balanced-Risk Retirement 2020 Fund
| Summary of Share Activity | ||||||||||||||||
| Years ended December 31, | ||||||||||||||||
| 2014(a) | 2013 | |||||||||||||||
| Shares | Amount | Shares | Amount | |||||||||||||
Sold: | ||||||||||||||||
Class A | 1,093,068 | $ | 10,462,047 | 2,705,827 | $ | 25,993,942 | ||||||||||
Class AX | 20,270 | 193,990 | 41,242 | 396,254 | ||||||||||||
Class B | 10,837 | 102,184 | 20,575 | 195,137 | ||||||||||||
Class C | 226,299 | 2,116,900 | 493,579 | 4,675,156 | ||||||||||||
Class CX | 17,976 | 167,140 | 17,959 | 170,062 | ||||||||||||
Class R | 227,423 | 2,155,946 | 609,724 | 5,865,913 | ||||||||||||
Class RX | 13,724 | 129,619 | 33,690 | 321,858 | ||||||||||||
Class Y | 189,637 | 1,823,083 | 845,319 | 8,217,859 | ||||||||||||
Class R5 | 906,082 | 8,734,464 | 3,803,461 | 36,493,238 | ||||||||||||
Class R6 | 36,884 | 357,959 | 99,895 | 964,828 | ||||||||||||
Issued as reinvestment of dividends: | ||||||||||||||||
Class A | 324,142 | 2,926,998 | 212,036 | 1,963,456 | ||||||||||||
Class AX | 71,648 | 646,979 | 50,220 | 465,041 | ||||||||||||
Class B | 12,160 | 108,588 | 8,228 | 75,371 | ||||||||||||
Class C | 60,605 | 539,992 | 34,544 | 316,080 | ||||||||||||
Class CX | 14,614 | 130,211 | 10,219 | 93,501 | ||||||||||||
Class R | 45,260 | 406,890 | 43,512 | 401,616 | ||||||||||||
Class RX | 4,924 | 44,265 | 7,237 | 66,789 | ||||||||||||
Class Y | 55,593 | 501,999 | 35,976 | 333,141 | ||||||||||||
Class R5 | 272,641 | 2,472,851 | 142,486 | 1,325,118 | ||||||||||||
Class R6 | 8,566 | 77,777 | 3,947 | 36,783 | ||||||||||||
Automatic conversion of Class B shares to Class A shares: | ||||||||||||||||
Class A | 40,028 | 379,297 | 40,261 | 387,346 | ||||||||||||
Class B | (40,585 | ) | (379,297 | ) | (40,851 | ) | (387,346 | ) | ||||||||
Reacquired: | ||||||||||||||||
Class A | (1,774,786 | ) | (17,053,120 | ) | (1,850,279 | ) | (17,775,286 | ) | ||||||||
Class AX | (323,286 | ) | (3,105,214 | ) | (290,484 | ) | (2,792,343 | ) | ||||||||
Class B | (55,127 | ) | (520,258 | ) | (97,110 | ) | (916,989 | ) | ||||||||
Class C | (316,039 | ) | (2,952,497 | ) | (553,542 | ) | (5,242,742 | ) | ||||||||
Class CX | (55,485 | ) | (524,876 | ) | (107,964 | ) | (1,030,219 | ) | ||||||||
Class R | (556,692 | ) | (5,308,235 | ) | (690,702 | ) | (6,521,012 | ) | ||||||||
Class RX | (63,351 | ) | (595,405 | ) | (109,410 | ) | (1,029,019 | ) | ||||||||
Class Y | (342,866 | ) | (3,259,864 | ) | (651,099 | ) | (6,262,910 | ) | ||||||||
Class R5 | (647,717 | ) | (6,173,247 | ) | (1,128,021 | ) | (10,852,148 | ) | ||||||||
Class R6 | (17,604 | ) | (170,187 | ) | (8,667 | ) | (84,319 | ) | ||||||||
Net increase (decrease) in share activity | (541,157 | ) | $ | (5,563,021 | ) | 3,731,808 | $ | 35,864,156 | ||||||||
| (a) | There are entities that are record owners of more than 5% of the outstanding shares of the Fund and in the aggregate own 26% of the outstanding shares of the Fund. IDI has an agreement with these entities to sell Fund shares. The Fund, Invesco and/or Invesco affiliates may make payments to these entities, which are considered to be related to the Fund, for providing services to the Fund, Invesco and/or Invesco affiliates including but not limited to services such as securities brokerage, distribution, third party record keeping and account servicing. The Trust has no knowledge as to whether all or any portion of the shares owned of record by these entities are also owned beneficially. |
44 Invesco Balanced-Risk Retirement Funds
NOTE 10—Share Information—(continued)
Invesco Balanced-Risk Retirement 2030 Fund
| Summary of Share Activity | ||||||||||||||||
| Years ended December 31, | ||||||||||||||||
| 2014(a) | 2013 | |||||||||||||||
| Shares | Amount | Shares | Amount | |||||||||||||
Sold: | ||||||||||||||||
Class A | 1,290,653 | $ | 12,044,775 | 2,699,963 | $ | 25,226,385 | ||||||||||
Class AX | 26,875 | 251,510 | 50,655 | 472,452 | ||||||||||||
Class B | 27,139 | 246,943 | 13,122 | 121,957 | ||||||||||||
Class C | 377,037 | 3,441,140 | 569,070 | 5,230,367 | ||||||||||||
Class CX | 19,185 | 171,605 | 12,477 | 115,515 | ||||||||||||
Class R | 411,723 | 3,802,369 | 603,429 | 5,594,366 | ||||||||||||
Class RX | 23,551 | 218,590 | 45,556 | 422,496 | ||||||||||||
Class Y | 157,192 | 1,481,004 | 302,771 | 2,833,877 | ||||||||||||
Class R5 | 1,107,279 | 10,365,009 | 3,289,074 | 30,603,780 | ||||||||||||
Class R6 | 40,931 | 386,423 | 101,709 | 954,532 | ||||||||||||
Issued as reinvestment of dividends: | ||||||||||||||||
Class A | 419,161 | 3,642,513 | 239,495 | 2,147,827 | ||||||||||||
Class AX | 64,389 | 560,181 | 38,603 | 346,651 | ||||||||||||
Class B | 19,895 | 171,100 | 11,002 | 97,812 | ||||||||||||
Class C | 100,805 | 866,919 | 46,345 | 411,546 | ||||||||||||
Class CX | 8,111 | 69,755 | 7,258 | 64,449 | ||||||||||||
Class R | 79,953 | 690,793 | 58,531 | 522,685 | ||||||||||||
Class RX | 10,235 | 88,425 | 6,482 | 57,821 | ||||||||||||
Class Y | 57,925 | 504,522 | 23,469 | 210,985 | ||||||||||||
Class R5 | 397,481 | 3,470,008 | 170,495 | 1,536,158 | ||||||||||||
Class R6 | 12,229 | 106,761 | 4,394 | 39,591 | ||||||||||||
Automatic conversion of Class B shares to Class A shares: | ||||||||||||||||
Class A | 39,003 | 364,217 | 41,917 | 391,701 | ||||||||||||
Class B | (39,505 | ) | (364,217 | ) | (42,445 | ) | (391,701 | ) | ||||||||
Reacquired: | ||||||||||||||||
Class A | (1,790,864 | ) | (16,738,689 | ) | (1,391,009 | ) | (12,982,461 | ) | ||||||||
Class AX | (253,936 | ) | (2,368,973 | ) | (278,586 | ) | (2,609,340 | ) | ||||||||
Class B | (67,717 | ) | (626,561 | ) | (57,019 | ) | (527,102 | ) | ||||||||
Class C | (290,887 | ) | (2,686,673 | ) | (470,124 | ) | (4,319,337 | ) | ||||||||
Class CX | (31,568 | ) | (292,812 | ) | (36,996 | ) | (337,758 | ) | ||||||||
Class R | (618,428 | ) | (5,752,439 | ) | (555,120 | ) | (5,107,387 | ) | ||||||||
Class RX | (27,855 | ) | (258,232 | ) | (55,792 | ) | (505,811 | ) | ||||||||
Class Y | (161,330 | ) | (1,504,192 | ) | (170,480 | ) | (1,583,683 | ) | ||||||||
Class R5 | (660,116 | ) | (6,162,797 | ) | (1,587,825 | ) | (14,629,457 | ) | ||||||||
Class R6 | (11,308 | ) | (106,850 | ) | (7,488 | ) | (70,322 | ) | ||||||||
Net increase in share activity | 737,238 | $ | 6,082,127 | 3,682,933 | $ | 34,338,594 | ||||||||||
| (a) | There are entities that are record owners of more than 5% of the outstanding shares of the Fund and in the aggregate own 36% of the outstanding shares of the Fund. IDI has an agreement with these entities to sell Fund shares. The Fund, Invesco and/or Invesco affiliates may make payments to these entities, which are considered to be related to the Fund, for providing services to the Fund, Invesco and/or Invesco affiliates including but not limited to services such as securities brokerage, distribution, third party record keeping and account servicing. The Trust has no knowledge as to whether all or any portion of the shares owned of record by these entities are also owned beneficially. |
45 Invesco Balanced-Risk Retirement Funds
NOTE 10—Share Information—(continued)
Invesco Balanced-Risk Retirement 2040 Fund
| Summary of Share Activity | ||||||||||||||||
| Years ended December 31, | ||||||||||||||||
| 2014(a) | 2013 | |||||||||||||||
| Shares | Amount | Shares | Amount | |||||||||||||
Sold: | ||||||||||||||||
Class A | 1,277,088 | $ | 11,059,547 | 1,929,074 | $ | 17,048,742 | ||||||||||
Class AX | 23,826 | 206,191 | 49,230 | 435,592 | ||||||||||||
Class B | 972 | 8,561 | 8,044 | 70,081 | ||||||||||||
Class C | 272,232 | 2,320,246 | 308,308 | 2,687,825 | ||||||||||||
Class CX | 16,264 | 136,860 | 13,806 | 119,805 | ||||||||||||
Class R | 374,739 | 3,210,408 | 409,427 | 3,599,219 | ||||||||||||
Class RX | 10,233 | 88,432 | 27,655 | 243,367 | ||||||||||||
Class Y | 139,410 | 1,212,454 | 197,956 | 1,703,429 | ||||||||||||
Class R5 | 788,116 | 6,893,157 | 2,122,568 | 18,767,052 | ||||||||||||
Class R6 | 43,556 | 383,075 | 119,477 | 1,063,908 | ||||||||||||
Issued as reinvestment of dividends: | ||||||||||||||||
Class A | 354,292 | 2,823,740 | 276,109 | 2,280,422 | ||||||||||||
Class AX | 40,332 | 321,044 | 28,927 | 239,230 | ||||||||||||
Class B | 10,878 | 85,715 | 8,407 | 68,853 | ||||||||||||
Class C | 61,093 | 480,800 | 43,443 | 355,364 | ||||||||||||
Class CX | 3,793 | 29,816 | 4,030 | 32,929 | ||||||||||||
Class R | 69,158 | 547,729 | 68,516 | 563,891 | ||||||||||||
Class RX | 7,768 | 61,601 | 7,118 | 58,652 | ||||||||||||
Class Y | 27,321 | 218,021 | 16,162 | 133,982 | ||||||||||||
Class R5 | 316,334 | 2,530,674 | 177,115 | 1,470,060 | ||||||||||||
Class R6 | 15,671 | 125,366 | 8,134 | 67,512 | ||||||||||||
Automatic conversion of Class B shares to Class A shares: | ||||||||||||||||
Class A | 10,574 | 91,779 | 12,941 | 114,455 | ||||||||||||
Class B | (10,717 | ) | (91,779 | ) | (13,109 | ) | (114,455 | ) | ||||||||
Reacquired: | ||||||||||||||||
Class A | (1,294,898 | ) | (11,234,557 | ) | (1,410,795 | ) | (12,445,522 | ) | ||||||||
Class AX | (75,728 | ) | (658,205 | ) | (116,064 | ) | (1,025,520 | ) | ||||||||
Class B | (19,476 | ) | (165,229 | ) | (14,740 | ) | (127,709 | ) | ||||||||
Class C | (275,980 | ) | (2,347,348 | ) | (360,839 | ) | (3,141,127 | ) | ||||||||
Class CX | (16,548 | ) | (142,538 | ) | (17,647 | ) | (154,727 | ) | ||||||||
Class R | (406,770 | ) | (3,571,015 | ) | (377,191 | ) | (3,302,575 | ) | ||||||||
Class RX | (6,864 | ) | (58,133 | ) | (50,409 | ) | (428,266 | ) | ||||||||
Class Y | (202,419 | ) | (1,759,446 | ) | (113,423 | ) | (1,005,862 | ) | ||||||||
Class R5 | (438,642 | ) | (3,811,281 | ) | (465,850 | ) | (4,162,955 | ) | ||||||||
Class R6 | (18,201 | ) | (162,701 | ) | (12,893 | ) | (115,547 | ) | ||||||||
Net increase in share activity | 1,097,407 | $ | 8,832,984 | 2,883,487 | $ | 25,100,105 | ||||||||||
| (a) | There are entities that are record owners of more than 5% of the outstanding shares of the Fund and in the aggregate own 47% of the outstanding shares of the Fund. IDI has an agreement with these entities to sell Fund shares. The Fund, Invesco and/or Invesco affiliates may make payments to these entities, which are considered to be related to the Fund, for providing services to the Fund, Invesco and/or Invesco affiliates including but not limited to services such as securities brokerage, distribution, third party record keeping and account servicing. The Trust has no knowledge as to whether all or any portion of the shares owned of record by these entities are also owned beneficially. |
46 Invesco Balanced-Risk Retirement Funds
NOTE 10—Share Information—(continued)
Invesco Balanced-Risk Retirement 2050 Fund
| Summary of Share Activity | ||||||||||||||||
| Years ended December 31, | ||||||||||||||||
| 2014(a) | 2013 | |||||||||||||||
| Shares | Amount | Shares | Amount | |||||||||||||
Sold: | ||||||||||||||||
Class A | 677,144 | $ | 5,829,854 | 785,663 | $ | 6,894,227 | ||||||||||
Class AX | 12,409 | 107,349 | 17,513 | 154,882 | ||||||||||||
Class B | 372 | 3,104 | 389 | 3,378 | ||||||||||||
Class C | 280,698 | 2,346,780 | 211,572 | 1,823,324 | ||||||||||||
Class CX | 3,316 | 27,666 | 3,429 | 29,277 | ||||||||||||
Class R | 343,603 | 2,886,244 | 252,112 | 2,200,068 | ||||||||||||
Class RX | 8,446 | 71,624 | 7,549 | 65,627 | ||||||||||||
Class Y | 270,272 | 2,237,022 | 168,657 | 1,493,511 | ||||||||||||
Class R5 | 663,388 | 5,722,148 | 1,226,099 | 10,688,543 | ||||||||||||
Class R6 | 13,908 | 121,613 | 33,384 | 295,331 | ||||||||||||
Issued as reinvestment of dividends: | ||||||||||||||||
Class A | 172,187 | 1,355,108 | 121,928 | 991,277 | ||||||||||||
Class AX | 15,313 | 120,513 | 11,404 | 92,712 | ||||||||||||
Class B | 4,380 | 33,949 | 3,075 | 24,660 | ||||||||||||
Class C | 46,208 | 358,568 | 31,544 | 253,617 | ||||||||||||
Class CX | 1,498 | 11,621 | 1,149 | 9,228 | ||||||||||||
Class R | 49,942 | 390,543 | 44,571 | 360,579 | ||||||||||||
Class RX | 2,504 | 19,604 | 2,164 | 17,505 | ||||||||||||
Class Y | 26,755 | 210,833 | 18,621 | 151,575 | ||||||||||||
Class R5 | 232,581 | 1,835,067 | 134,171 | 1,093,494 | ||||||||||||
Class R6 | 5,481 | 43,303 | 2,678 | 21,856 | ||||||||||||
Automatic conversion of Class B shares to Class A shares: | ||||||||||||||||
Class A | 3,194 | 28,257 | 860 | 7,467 | ||||||||||||
Class B | (3,246 | ) | (28,257 | ) | (873 | ) | (7,467 | ) | ||||||||
Reacquired: | ||||||||||||||||
Class A | (670,278 | ) | (5,743,479 | ) | (745,399 | ) | (6,476,858 | ) | ||||||||
Class AX | (28,111 | ) | (237,158 | ) | (23,995 | ) | (208,515 | ) | ||||||||
Class B | (5,653 | ) | (47,973 | ) | (9,267 | ) | (80,641 | ) | ||||||||
Class C | (190,924 | ) | (1,599,616 | ) | (222,703 | ) | (1,917,783 | ) | ||||||||
Class CX | (2,032 | ) | (17,010 | ) | (2,947 | ) | (25,384 | ) | ||||||||
Class R | (292,408 | ) | (2,479,891 | ) | (143,565 | ) | (1,240,319 | ) | ||||||||
Class RX | (15,192 | ) | (129,280 | ) | (2,130 | ) | (19,006 | ) | ||||||||
Class Y | (110,813 | ) | (964,386 | ) | (104,916 | ) | (902,856 | ) | ||||||||
Class R5 | (334,568 | ) | (2,885,778 | ) | (311,582 | ) | (2,734,426 | ) | ||||||||
Class R6 | (874 | ) | (7,259 | ) | (1,981 | ) | (17,333 | ) | ||||||||
Net increase in share activity | 1,179,500 | $ | 9,620,683 | 1,509,174 | $ | 13,041,550 | ||||||||||
| (a) | There are entities that are record owners of more than 5% of the outstanding shares of the Fund and in the aggregate own 46% of the outstanding shares of the Fund. IDI has an agreement with these entities to sell Fund shares. The Fund, Invesco and/or Invesco affiliates may make payments to these entities, which are considered to be related to the Fund, for providing services to the Fund, Invesco and/or Invesco affiliates including but not limited to services such as securities brokerage, distribution, third party record keeping and account servicing. The Trust has no knowledge as to whether all or any portion of the shares owned of record by these entities are also owned beneficially. |
47 Invesco Balanced-Risk Retirement Funds
NOTE 11—Financial Highlights
The following schedule presents financial highlights for a share of each Fund outstanding throughout the periods indicated.
Invesco Balanced-Risk Retirement Now Fund
| Net asset value, beginning of period | Net investment income (loss)(a) | Net gains on securities (both realized and unrealized) | Total from investment operations | Dividends from net investment income | Distributions from net realized gains | Total distributions | Net asset value, end of period | Total return(b) | Net assets, end of period (000’s omitted) | Ratio of expenses to average net assets with fee waivers and/or expense reimbursements(c) | Ratio of expenses to average net assets without fee waivers and/or expense reimbursements | Ratio of net investment income (loss) to average net assets | Portfolio turnover(d) | |||||||||||||||||||||||||||||||||||||||||||
Class A |
| |||||||||||||||||||||||||||||||||||||||||||||||||||||||
Year ended 12/31/14 | $ | 8.91 | $ | 0.10 | $ | 0.19 | $ | 0.29 | $ | (0.23 | ) | $ | (0.20 | ) | $ | (0.43 | ) | $ | 8.77 | 3.32 | % | $ | 14,273 | 0.25 | %(e) | 0.96 | %(e) | 1.13 | %(e) | 9 | % | |||||||||||||||||||||||||
Year ended 12/31/13 | 9.07 | (0.02 | ) | 0.14 | 0.12 | (0.20 | ) | (0.08 | ) | (0.28 | ) | 8.91 | 1.33 | 15,858 | 0.25 | 0.85 | (0.22 | ) | 16 | |||||||||||||||||||||||||||||||||||||
Year ended 12/31/12 | 8.84 | 0.12 | 0.42 | 0.54 | (0.20 | ) | (0.11 | ) | (0.31 | ) | 9.07 | 6.22 | 13,959 | 0.25 | 0.96 | 1.30 | 7 | |||||||||||||||||||||||||||||||||||||||
Year ended 12/31/11 | 8.58 | 0.17 | 0.35 | 0.52 | (0.14 | ) | (0.12 | ) | (0.26 | ) | 8.84 | 6.18 | 10,150 | 0.25 | 1.09 | 1.95 | 15 | |||||||||||||||||||||||||||||||||||||||
Year ended 12/31/10 | 8.23 | 0.37 | 0.26 | 0.63 | (0.28 | ) | — | (0.28 | ) | 8.58 | 7.74 | 2,488 | 0.25 | 3.45 | 4.35 | 67 | ||||||||||||||||||||||||||||||||||||||||
Class AX |
| |||||||||||||||||||||||||||||||||||||||||||||||||||||||
Year ended 12/31/14 | 8.90 | 0.10 | 0.20 | 0.30 | (0.24 | ) | (0.20 | ) | (0.44 | ) | 8.76 | 3.32 | 11,273 | 0.25 | (e) | 0.96 | (e) | 1.13 | (e) | 9 | ||||||||||||||||||||||||||||||||||||
Year ended 12/31/13 | 9.06 | (0.02 | ) | 0.14 | 0.12 | (0.20 | ) | (0.08 | ) | (0.28 | ) | 8.90 | 1.33 | 14,817 | 0.25 | 0.85 | (0.22 | ) | 16 | |||||||||||||||||||||||||||||||||||||
Year ended 12/31/12 | 8.83 | 0.12 | 0.42 | 0.54 | (0.20 | ) | (0.11 | ) | (0.31 | ) | 9.06 | 6.22 | 18,345 | 0.25 | 0.96 | 1.30 | 7 | |||||||||||||||||||||||||||||||||||||||
Year ended 12/31/11 | 8.58 | 0.17 | 0.34 | 0.51 | (0.14 | ) | (0.12 | ) | (0.26 | ) | 8.83 | 6.06 | 20,371 | 0.25 | 1.09 | 1.95 | 15 | |||||||||||||||||||||||||||||||||||||||
Year ended 12/31/10(f) | 8.30 | 0.22 | 0.32 | 0.54 | (0.26 | ) | — | (0.26 | ) | 8.58 | 6.53 | 12,929 | 0.25 | (g) | 1.24 | (g) | 4.35 | (g) | 67 | |||||||||||||||||||||||||||||||||||||
Class B |
| |||||||||||||||||||||||||||||||||||||||||||||||||||||||
Year ended 12/31/14 | 8.76 | 0.03 | 0.19 | 0.22 | (0.21 | ) | (0.20 | ) | (0.41 | ) | 8.57 | 2.55 | 341 | 1.00 | (e) | 1.71 | (e) | 0.38 | (e) | 9 | ||||||||||||||||||||||||||||||||||||
Year ended 12/31/13 | 8.97 | (0.09 | ) | 0.14 | 0.05 | (0.18 | ) | (0.08 | ) | (0.26 | ) | 8.76 | 0.56 | 480 | 1.00 | 1.60 | (0.97 | ) | 16 | |||||||||||||||||||||||||||||||||||||
Year ended 12/31/12 | 8.77 | 0.05 | 0.43 | 0.48 | (0.17 | ) | (0.11 | ) | (0.28 | ) | 8.97 | 5.50 | 684 | 1.00 | 1.71 | 0.55 | 7 | |||||||||||||||||||||||||||||||||||||||
Year ended 12/31/11 | 8.56 | 0.11 | 0.33 | 0.44 | (0.11 | ) | (0.12 | ) | (0.23 | ) | 8.77 | 5.19 | 812 | 1.00 | 1.84 | 1.20 | 15 | |||||||||||||||||||||||||||||||||||||||
Year ended 12/31/10 | 8.24 | 0.30 | 0.27 | 0.57 | (0.25 | ) | — | (0.25 | ) | 8.56 | 6.95 | 301 | 1.00 | 4.20 | 3.60 | 67 | ||||||||||||||||||||||||||||||||||||||||
Class C |
| |||||||||||||||||||||||||||||||||||||||||||||||||||||||
Year ended 12/31/14 | 8.76 | 0.03 | 0.20 | 0.23 | (0.21 | ) | (0.20 | ) | (0.41 | ) | 8.58 | 2.66 | 4,535 | 1.00 | (e) | 1.71 | (e) | 0.38 | (e) | 9 | ||||||||||||||||||||||||||||||||||||
Year ended 12/31/13 | 8.98 | (0.09 | ) | 0.13 | 0.04 | (0.18 | ) | (0.08 | ) | (0.26 | ) | 8.76 | 0.45 | 5,084 | 1.00 | 1.60 | (0.97 | ) | 16 | |||||||||||||||||||||||||||||||||||||
Year ended 12/31/12 | 8.78 | 0.05 | 0.43 | 0.48 | (0.17 | ) | (0.11 | ) | (0.28 | ) | 8.98 | 5.49 | 4,773 | 1.00 | 1.71 | 0.55 | 7 | |||||||||||||||||||||||||||||||||||||||
Year ended 12/31/11 | 8.56 | 0.11 | 0.34 | 0.45 | (0.11 | ) | (0.12 | ) | (0.23 | ) | 8.78 | 5.31 | 2,416 | 1.00 | 1.84 | 1.20 | 15 | |||||||||||||||||||||||||||||||||||||||
Year ended 12/31/10 | 8.23 | 0.31 | 0.27 | 0.58 | (0.25 | ) | — | (0.25 | ) | 8.56 | 7.08 | 874 | 1.00 | 4.20 | 3.60 | 67 | ||||||||||||||||||||||||||||||||||||||||
Class CX |
| |||||||||||||||||||||||||||||||||||||||||||||||||||||||
Year ended 12/31/14 | 8.76 | 0.03 | 0.20 | 0.23 | (0.22 | ) | (0.20 | ) | (0.42 | ) | 8.57 | 2.55 | 3,088 | 1.00 | (e) | 1.71 | (e) | 0.38 | (e) | 9 | ||||||||||||||||||||||||||||||||||||
Year ended 12/31/13 | 8.97 | (0.09 | ) | 0.14 | 0.05 | (0.18 | ) | (0.08 | ) | (0.26 | ) | 8.76 | 0.56 | 3,861 | 1.00 | 1.60 | (0.97 | ) | 16 | |||||||||||||||||||||||||||||||||||||
Year ended 12/31/12 | 8.78 | 0.05 | 0.42 | 0.47 | (0.17 | ) | (0.11 | ) | (0.28 | ) | 8.97 | 5.38 | 4,667 | 1.00 | 1.71 | 0.55 | 7 | |||||||||||||||||||||||||||||||||||||||
Year ended 12/31/11 | 8.56 | 0.11 | 0.34 | 0.45 | (0.11 | ) | (0.12 | ) | (0.23 | ) | 8.78 | 5.31 | 4,891 | 1.00 | 1.84 | 1.20 | 15 | |||||||||||||||||||||||||||||||||||||||
Year ended 12/31/10(f) | 8.30 | 0.18 | 0.32 | 0.50 | (0.24 | ) | — | (0.24 | ) | 8.56 | 6.08 | 2,905 | 1.00 | (g) | 1.99 | (g) | 3.60 | (g) | 67 | |||||||||||||||||||||||||||||||||||||
Class R |
| |||||||||||||||||||||||||||||||||||||||||||||||||||||||
Year ended 12/31/14 | 8.88 | 0.08 | 0.19 | 0.27 | (0.23 | ) | (0.20 | ) | (0.43 | ) | 8.72 | 3.02 | 1,656 | 0.50 | (e) | 1.21 | (e) | 0.88 | (e) | 9 | ||||||||||||||||||||||||||||||||||||
Year ended 12/31/13 | 9.04 | (0.04 | ) | 0.14 | 0.10 | (0.18 | ) | (0.08 | ) | (0.26 | ) | 8.88 | 1.13 | 1,959 | 0.50 | 1.10 | (0.47 | ) | 16 | |||||||||||||||||||||||||||||||||||||
Year ended 12/31/12 | 8.82 | 0.10 | 0.42 | 0.52 | (0.19 | ) | (0.11 | ) | (0.30 | ) | 9.04 | 5.98 | 2,006 | 0.50 | 1.21 | 1.05 | 7 | |||||||||||||||||||||||||||||||||||||||
Year ended 12/31/11 | 8.58 | 0.15 | 0.34 | 0.49 | (0.13 | ) | (0.12 | ) | (0.25 | ) | 8.82 | 5.81 | 1,774 | 0.50 | 1.34 | 1.70 | 15 | |||||||||||||||||||||||||||||||||||||||
Year ended 12/31/10 | 8.24 | 0.35 | 0.26 | 0.61 | (0.27 | ) | — | (0.27 | ) | 8.58 | 7.47 | 750 | 0.50 | 3.70 | 4.10 | 67 | ||||||||||||||||||||||||||||||||||||||||
Class RX |
| |||||||||||||||||||||||||||||||||||||||||||||||||||||||
Year ended 12/31/14 | 8.86 | 0.08 | 0.20 | 0.28 | (0.23 | ) | (0.20 | ) | (0.43 | ) | 8.71 | 3.14 | 181 | 0.50 | (e) | 1.21 | (e) | 0.88 | (e) | 9 | ||||||||||||||||||||||||||||||||||||
Year ended 12/31/13 | 9.04 | (0.04 | ) | 0.13 | 0.09 | (0.19 | ) | (0.08 | ) | (0.27 | ) | 8.86 | 1.03 | 295 | 0.50 | 1.10 | (0.47 | ) | 16 | |||||||||||||||||||||||||||||||||||||
Year ended 12/31/12 | 8.82 | 0.10 | 0.42 | 0.52 | (0.19 | ) | (0.11 | ) | (0.30 | ) | 9.04 | 5.98 | 497 | 0.50 | 1.21 | 1.05 | 7 | |||||||||||||||||||||||||||||||||||||||
Year ended 12/31/11 | 8.58 | 0.15 | 0.34 | 0.49 | (0.13 | ) | (0.12 | ) | (0.25 | ) | 8.82 | 5.82 | 467 | 0.50 | 1.34 | 1.70 | 15 | |||||||||||||||||||||||||||||||||||||||
Year ended 12/31/10(f) | 8.31 | 0.20 | 0.32 | 0.52 | (0.25 | ) | — | (0.25 | ) | 8.58 | 6.34 | 17 | 0.50 | (g) | 1.49 | (g) | 4.10 | (g) | 67 | |||||||||||||||||||||||||||||||||||||
Class Y |
| |||||||||||||||||||||||||||||||||||||||||||||||||||||||
Year ended 12/31/14 | 8.96 | 0.13 | 0.19 | 0.32 | (0.24 | ) | (0.20 | ) | (0.44 | ) | 8.84 | 3.61 | 1,695 | 0.00 | (e) | 0.71 | (e) | 1.38 | (e) | 9 | ||||||||||||||||||||||||||||||||||||
Year ended 12/31/13 | 9.11 | 0.00 | 0.13 | 0.13 | (0.20 | ) | (0.08 | ) | (0.28 | ) | 8.96 | 1.51 | 2,118 | 0.00 | 0.60 | 0.03 | 16 | |||||||||||||||||||||||||||||||||||||||
Year ended 12/31/12 | 8.86 | 0.14 | 0.44 | 0.58 | (0.22 | ) | (0.11 | ) | (0.33 | ) | 9.11 | 6.58 | 673 | 0.00 | 0.71 | 1.55 | 7 | |||||||||||||||||||||||||||||||||||||||
Year ended 12/31/11 | 8.60 | 0.20 | 0.34 | 0.54 | (0.16 | ) | (0.12 | ) | (0.28 | ) | 8.86 | 6.30 | 305 | 0.00 | 0.84 | 2.20 | 15 | |||||||||||||||||||||||||||||||||||||||
Year ended 12/31/10 | 8.23 | 0.39 | 0.27 | 0.66 | (0.29 | ) | — | (0.29 | ) | 8.60 | 8.13 | 136 | 0.00 | 3.20 | 4.60 | 67 | ||||||||||||||||||||||||||||||||||||||||
Class R5 |
| |||||||||||||||||||||||||||||||||||||||||||||||||||||||
Year ended 12/31/14 | 8.96 | 0.13 | 0.19 | 0.32 | (0.24 | ) | (0.20 | ) | (0.44 | ) | 8.84 | 3.61 | 9,573 | 0.00 | (e) | 0.63 | (e) | 1.38 | (e) | 9 | ||||||||||||||||||||||||||||||||||||
Year ended 12/31/13 | 9.10 | 0.00 | 0.14 | 0.14 | (0.20 | ) | (0.08 | ) | (0.28 | ) | 8.96 | 1.63 | 7,802 | 0.00 | 0.54 | 0.03 | 16 | |||||||||||||||||||||||||||||||||||||||
Year ended 12/31/12 | 8.86 | 0.14 | 0.43 | 0.57 | (0.22 | ) | (0.11 | ) | (0.33 | ) | 9.10 | 6.46 | 2,935 | 0.00 | 0.66 | 1.55 | 7 | |||||||||||||||||||||||||||||||||||||||
Year ended 12/31/11 | 8.59 | 0.20 | 0.35 | 0.55 | (0.16 | ) | (0.12 | ) | (0.28 | ) | 8.86 | 6.42 | 26 | 0.00 | 0.75 | 2.20 | 15 | |||||||||||||||||||||||||||||||||||||||
Year ended 12/31/10 | 8.23 | 0.39 | 0.26 | 0.65 | (0.29 | ) | — | (0.29 | ) | 8.59 | 8.00 | 13 | 0.00 | 2.93 | 4.60 | 67 | ||||||||||||||||||||||||||||||||||||||||
Class R6 |
| |||||||||||||||||||||||||||||||||||||||||||||||||||||||
Year ended 12/31/14 | 8.96 | 0.13 | 0.20 | 0.33 | (0.25 | ) | (0.20 | ) | (0.45 | ) | 8.84 | 3.61 | 328 | 0.00 | (e) | 0.54 | (e) | 1.38 | (e) | 9 | ||||||||||||||||||||||||||||||||||||
Year ended 12/31/13 | 9.10 | 0.00 | 0.14 | 0.14 | (0.20 | ) | (0.08 | ) | (0.28 | ) | 8.96 | 1.63 | 281 | 0.00 | 0.45 | 0.03 | 16 | |||||||||||||||||||||||||||||||||||||||
Year ended 12/31/12(f) | 9.38 | 0.04 | (0.02 | ) | 0.02 | (0.19 | ) | (0.11 | ) | (0.30 | ) | 9.10 | 0.30 | 10 | 0.00 | (g) | 0.62 | (g) | 1.55 | (g) | 7 | |||||||||||||||||||||||||||||||||||
| (a) | Calculated using average shares outstanding. |
| (b) | Includes adjustments in accordance with accounting principles generally accepted in the United States of America and as such, the net asset value for financial reporting purposes and the returns based upon those net asset values may differ from the net asset value and returns for shareholder transactions. Does not include sales charges and is not annualized for periods less than one year, if applicable. |
| (c) | In addition to the fees and expenses which the Fund bears directly; the Fund indirectly bears a pro rata share of the fees and expenses of the underlying funds in which the Fund invests. Because the underlying funds have varied expenses and fee levels and the Fund may own different proportions at different times, the amount of fees and expenses incurred indirectly by the Fund will vary. Estimated underlying fund expenses are not expenses that are incurred directly by your Fund. They are expenses that are incurred directly by the underlying funds and are deducted from the value of the funds your Fund invests in. The effect of the estimated underlying fund expenses that you bear indirectly is included in your Fund’s total return. Estimated acquired fund fees from underlying funds were 0.56%, 0.54%, 0.52%, 0.59%, and 0.55% for the years ended December 31, 2014, 2013, 2012, 2011 and 2010, respectively. |
| (d) | Portfolio turnover is calculated at the fund level and is not annualized for periods less than one year, if applicable. |
| (e) | Ratios are based on average daily net assets (000’s omitted) of $14,813, $12,709, $430, $4,552, $3,419, $1,807, $210, $1,842, $9,071 and $303 for Class A, Class AX, Class B, Class C, Class CX, Class R, Class RX, Class Y, Class R5 and Class R6 shares, respectively. |
| (f) | Commencement date of June 1, 2010 for Class AX, Class CX and Class RX shares and September 24, 2012 for Class R6 shares, respectively. |
| (g) | Annualized. |
48 Invesco Balanced-Risk Retirement Funds
NOTE 11—Financial Highlights—(continued)
Invesco Balanced-Risk Retirement 2020 Fund
| Net asset value, beginning of period | Net investment income (loss)(a) | Net gains on securities (both realized and unrealized) | Total from investment operations | Dividends from net investment income | Distributions from net realized gains | Total distributions | Net asset value, end of period | Total return(b) | Net assets, end of period (000’s omitted) | Ratio of expenses to average net assets with fee waivers and/or expense reimbursements(c) | Ratio of expenses to average net assets without fee waivers and/or expense reimbursements | Ratio of net investment income (loss) to average net assets | Portfolio turnover(d) | |||||||||||||||||||||||||||||||||||||||||||
Class A |
| |||||||||||||||||||||||||||||||||||||||||||||||||||||||
Year ended 12/31/14 | $ | 9.32 | $ | 0.16 | $ | 0.28 | $ | 0.44 | $ | (0.37 | ) | $ | (0.28 | ) | $ | (0.65 | ) | $ | 9.11 | 4.81 | % | $ | 47,303 | 0.25 | %(e) | 0.67 | %(e) | 1.65 | %(e) | 7 | % | |||||||||||||||||||||||||
Year ended 12/31/13 | 9.51 | (0.02 | ) | 0.21 | 0.19 | (0.31 | ) | (0.07 | ) | (0.38 | ) | 9.32 | 2.01 | 51,352 | 0.25 | 0.66 | (0.24 | ) | 16 | |||||||||||||||||||||||||||||||||||||
Year ended 12/31/12 | 9.05 | 0.22 | 0.67 | 0.89 | (0.33 | ) | (0.10 | ) | (0.43 | ) | 9.51 | 9.89 | 41,873 | 0.25 | 0.75 | 2.24 | 6 | |||||||||||||||||||||||||||||||||||||||
Year ended 12/31/11 | 8.56 | 0.23 | 0.61 | 0.84 | (0.23 | ) | (0.12 | ) | (0.35 | ) | 9.05 | 9.84 | 26,420 | 0.25 | 0.80 | 2.59 | 15 | |||||||||||||||||||||||||||||||||||||||
Year ended 12/31/10 | 7.97 | 0.55 | 0.49 | 1.04 | (0.44 | ) | (0.01 | ) | (0.45 | ) | 8.56 | 13.11 | 17,933 | 0.25 | 1.13 | 6.61 | 57 | |||||||||||||||||||||||||||||||||||||||
Class AX |
| |||||||||||||||||||||||||||||||||||||||||||||||||||||||
Year ended 12/31/14 | 9.31 | 0.16 | 0.28 | 0.44 | (0.37 | ) | (0.28 | ) | (0.65 | ) | 9.10 | 4.81 | 9,609 | 0.25 | (e) | 0.67 | (e) | 1.65 | (e) | 7 | ||||||||||||||||||||||||||||||||||||
Year ended 12/31/13 | 9.51 | (0.02 | ) | 0.20 | 0.18 | (0.31 | ) | (0.07 | ) | (0.38 | ) | 9.31 | 1.90 | 11,986 | 0.25 | 0.66 | (0.24 | ) | 16 | |||||||||||||||||||||||||||||||||||||
Year ended 12/31/12 | 9.05 | 0.21 | 0.68 | 0.89 | (0.33 | ) | (0.10 | ) | (0.43 | ) | 9.51 | 9.89 | 14,125 | 0.25 | 0.75 | 2.24 | 6 | |||||||||||||||||||||||||||||||||||||||
Year ended 12/31/11 | 8.56 | 0.23 | 0.61 | 0.84 | (0.23 | ) | (0.12 | ) | (0.35 | ) | 9.05 | 9.84 | 15,291 | 0.25 | 0.80 | 2.59 | 15 | |||||||||||||||||||||||||||||||||||||||
Year ended 12/31/10(f) | 8.14 | 0.33 | 0.54 | 0.87 | (0.44 | ) | (0.01 | ) | (0.45 | ) | 8.56 | 10.75 | 21,136 | 0.25 | (g) | 0.73 | (g) | 6.61 | (g) | 57 | ||||||||||||||||||||||||||||||||||||
Class B |
| |||||||||||||||||||||||||||||||||||||||||||||||||||||||
Year ended 12/31/14 | 9.21 | 0.09 | 0.28 | 0.37 | (0.30 | ) | (0.28 | ) | (0.58 | ) | 9.00 | 4.03 | 1,715 | 1.00 | (e) | 1.42 | (e) | 0.90 | (e) | 7 | ||||||||||||||||||||||||||||||||||||
Year ended 12/31/13 | 9.40 | (0.09 | ) | 0.20 | 0.11 | (0.23 | ) | (0.07 | ) | (0.30 | ) | 9.21 | 1.19 | 2,425 | 1.00 | 1.41 | (0.99 | ) | 16 | |||||||||||||||||||||||||||||||||||||
Year ended 12/31/12 | 8.97 | 0.14 | 0.66 | 0.80 | (0.27 | ) | (0.10 | ) | (0.37 | ) | 9.40 | 8.95 | 3,501 | 1.00 | 1.50 | 1.49 | 6 | |||||||||||||||||||||||||||||||||||||||
Year ended 12/31/11 | 8.49 | 0.16 | 0.60 | 0.76 | (0.16 | ) | (0.12 | ) | (0.28 | ) | 8.97 | 9.04 | 3,163 | 1.00 | 1.55 | 1.84 | 15 | |||||||||||||||||||||||||||||||||||||||
Year ended 12/31/10 | 7.91 | 0.49 | 0.48 | 0.97 | (0.38 | ) | (0.01 | ) | (0.39 | ) | 8.49 | 12.30 | 2,899 | 1.00 | 1.88 | 5.86 | 57 | |||||||||||||||||||||||||||||||||||||||
Class C |
| |||||||||||||||||||||||||||||||||||||||||||||||||||||||
Year ended 12/31/14 | 9.20 | 0.09 | 0.27 | 0.36 | (0.30 | ) | (0.28 | ) | (0.58 | ) | 8.98 | 3.93 | 9,613 | 1.00 | (e) | 1.42 | (e) | 0.90 | (e) | 7 | ||||||||||||||||||||||||||||||||||||
Year ended 12/31/13 | 9.38 | (0.09 | ) | 0.21 | 0.12 | (0.23 | ) | (0.07 | ) | (0.30 | ) | 9.20 | 1.29 | 10,108 | 1.00 | 1.41 | (0.99 | ) | 16 | |||||||||||||||||||||||||||||||||||||
Year ended 12/31/12 | 8.95 | 0.14 | 0.66 | 0.80 | (0.27 | ) | (0.10 | ) | (0.37 | ) | 9.38 | 8.97 | 10,550 | 1.00 | 1.50 | 1.49 | 6 | |||||||||||||||||||||||||||||||||||||||
Year ended 12/31/11 | 8.47 | 0.16 | 0.60 | 0.76 | (0.16 | ) | (0.12 | ) | (0.28 | ) | 8.95 | 9.06 | 5,322 | 1.00 | 1.55 | 1.84 | 15 | |||||||||||||||||||||||||||||||||||||||
Year ended 12/31/10 | 7.90 | 0.49 | 0.47 | 0.96 | (0.38 | ) | (0.01 | ) | (0.39 | ) | 8.47 | 12.19 | 3,966 | 1.00 | 1.88 | 5.86 | 57 | |||||||||||||||||||||||||||||||||||||||
Class CX |
| |||||||||||||||||||||||||||||||||||||||||||||||||||||||
Year ended 12/31/14 | 9.20 | 0.09 | 0.28 | 0.37 | (0.30 | ) | (0.28 | ) | (0.58 | ) | 8.99 | 4.04 | 2,677 | 1.00 | (e) | 1.42 | (e) | 0.90 | (e) | 7 | ||||||||||||||||||||||||||||||||||||
Year ended 12/31/13 | 9.38 | (0.09 | ) | 0.21 | 0.12 | (0.23 | ) | (0.07 | ) | (0.30 | ) | 9.20 | 1.29 | 2,951 | 1.00 | 1.41 | (0.99 | ) | 16 | |||||||||||||||||||||||||||||||||||||
Year ended 12/31/12 | 8.95 | 0.14 | 0.66 | 0.80 | (0.27 | ) | (0.10 | ) | (0.37 | ) | 9.38 | 8.97 | 3,759 | 1.00 | 1.50 | 1.49 | 6 | |||||||||||||||||||||||||||||||||||||||
Year ended 12/31/11 | 8.48 | 0.16 | 0.60 | 0.76 | (0.17 | ) | (0.12 | ) | (0.29 | ) | 8.95 | 8.93 | 3,862 | 1.00 | 1.55 | 1.84 | 15 | |||||||||||||||||||||||||||||||||||||||
Year ended 12/31/10(f) | 8.04 | 0.29 | 0.54 | 0.83 | (0.38 | ) | (0.01 | ) | (0.39 | ) | 8.48 | 10.37 | 4,543 | 1.00 | (g) | 1.48 | (g) | 5.86 | (g) | 57 | ||||||||||||||||||||||||||||||||||||
Class R |
| |||||||||||||||||||||||||||||||||||||||||||||||||||||||
Year ended 12/31/14 | 9.28 | 0.13 | 0.29 | 0.42 | (0.35 | ) | (0.28 | ) | (0.63 | ) | 9.07 | 4.55 | 7,564 | 0.50 | (e) | 0.92 | (e) | 1.40 | (e) | 7 | ||||||||||||||||||||||||||||||||||||
Year ended 12/31/13 | 9.47 | (0.05 | ) | 0.22 | 0.17 | (0.29 | ) | (0.07 | ) | (0.36 | ) | 9.28 | 1.73 | 10,375 | 0.50 | 0.91 | (0.49 | ) | 16 | |||||||||||||||||||||||||||||||||||||
Year ended 12/31/12 | 9.02 | 0.19 | 0.67 | 0.86 | (0.31 | ) | (0.10 | ) | (0.41 | ) | 9.47 | 9.58 | 10,942 | 0.50 | 1.00 | 1.99 | 6 | |||||||||||||||||||||||||||||||||||||||
Year ended 12/31/11 | 8.54 | 0.21 | 0.60 | 0.81 | (0.21 | ) | (0.12 | ) | (0.33 | ) | 9.02 | 9.49 | 5,930 | 0.50 | 1.05 | 2.34 | 15 | |||||||||||||||||||||||||||||||||||||||
Year ended 12/31/10 | 7.95 | 0.53 | 0.49 | 1.02 | (0.42 | ) | (0.01 | ) | (0.43 | ) | 8.54 | 12.90 | 5,214 | 0.50 | 1.38 | 6.36 | 57 | |||||||||||||||||||||||||||||||||||||||
Class RX |
| |||||||||||||||||||||||||||||||||||||||||||||||||||||||
Year ended 12/31/14 | 9.28 | 0.13 | 0.29 | 0.42 | (0.35 | ) | (0.28 | ) | (0.63 | ) | 9.07 | 4.55 | 848 | 0.50 | (e) | 0.92 | (e) | 1.40 | (e) | 7 | ||||||||||||||||||||||||||||||||||||
Year ended 12/31/13 | 9.47 | (0.05 | ) | 0.22 | 0.17 | (0.29 | ) | (0.07 | ) | (0.36 | ) | 9.28 | 1.73 | 1,282 | 0.50 | 0.91 | (0.49 | ) | 16 | |||||||||||||||||||||||||||||||||||||
Year ended 12/31/12 | 9.02 | 0.19 | 0.67 | 0.86 | (0.31 | ) | (0.10 | ) | (0.41 | ) | 9.47 | 9.58 | 1,957 | 0.50 | 1.00 | 1.99 | 6 | |||||||||||||||||||||||||||||||||||||||
Year ended 12/31/11 | 8.54 | 0.21 | 0.60 | 0.81 | (0.21 | ) | (0.12 | ) | (0.33 | ) | 9.02 | 9.49 | 1,443 | 0.50 | 1.05 | 2.34 | 15 | |||||||||||||||||||||||||||||||||||||||
Year ended 12/31/10(f) | 8.11 | 0.32 | 0.54 | 0.86 | (0.42 | ) | (0.01 | ) | (0.43 | ) | 8.54 | 10.67 | 1,328 | 0.50 | (g) | 0.98 | (g) | 6.36 | (g) | 57 | ||||||||||||||||||||||||||||||||||||
Class Y |
| |||||||||||||||||||||||||||||||||||||||||||||||||||||||
Year ended 12/31/14 | 9.31 | 0.18 | 0.29 | 0.47 | (0.40 | ) | (0.28 | ) | (0.68 | ) | 9.10 | 5.09 | 7,416 | 0.00 | (e) | 0.42 | (e) | 1.90 | (e) | 7 | ||||||||||||||||||||||||||||||||||||
Year ended 12/31/13 | 9.51 | 0.00 | 0.21 | 0.21 | (0.34 | ) | (0.07 | ) | (0.41 | ) | 9.31 | 2.16 | 8,497 | 0.00 | 0.41 | 0.01 | 16 | |||||||||||||||||||||||||||||||||||||||
Year ended 12/31/12 | 9.06 | 0.24 | 0.66 | 0.90 | (0.35 | ) | (0.10 | ) | (0.45 | ) | 9.51 | 10.00 | 6,486 | 0.00 | 0.50 | 2.49 | 6 | |||||||||||||||||||||||||||||||||||||||
Year ended 12/31/11 | 8.57 | 0.25 | 0.61 | 0.86 | (0.25 | ) | (0.12 | ) | (0.37 | ) | 9.06 | 10.08 | 395 | 0.00 | 0.55 | 2.84 | 15 | |||||||||||||||||||||||||||||||||||||||
Year ended 12/31/10 | 7.97 | 0.58 | 0.49 | 1.07 | (0.46 | ) | (0.01 | ) | (0.47 | ) | 8.57 | 13.52 | 133 | 0.00 | 0.88 | 6.86 | 57 | |||||||||||||||||||||||||||||||||||||||
Class R5 |
| |||||||||||||||||||||||||||||||||||||||||||||||||||||||
Year ended 12/31/14 | 9.36 | 0.18 | 0.29 | 0.47 | (0.40 | ) | (0.28 | ) | (0.68 | ) | 9.15 | 5.07 | 36,230 | 0.00 | (e) | 0.31 | (e) | 1.90 | (e) | 7 | ||||||||||||||||||||||||||||||||||||
Year ended 12/31/13 | 9.55 | 0.00 | 0.22 | 0.22 | (0.34 | ) | (0.07 | ) | (0.41 | ) | 9.36 | 2.26 | 32,091 | 0.00 | 0.32 | 0.01 | 16 | |||||||||||||||||||||||||||||||||||||||
Year ended 12/31/12 | 9.09 | 0.24 | 0.67 | 0.91 | (0.35 | ) | (0.10 | ) | (0.45 | ) | 9.55 | 10.08 | 5,839 | 0.00 | 0.42 | 2.49 | 6 | |||||||||||||||||||||||||||||||||||||||
Year ended 12/31/11 | 8.60 | 0.25 | 0.61 | 0.86 | (0.25 | ) | (0.12 | ) | (0.37 | ) | 9.09 | 10.04 | 12 | 0.00 | 0.47 | 2.84 | 15 | |||||||||||||||||||||||||||||||||||||||
Year ended 12/31/10 | 8.00 | 0.58 | 0.49 | 1.07 | (0.46 | ) | (0.01 | ) | (0.47 | ) | 8.60 | 13.47 | 12 | 0.00 | 0.72 | 6.86 | 57 | |||||||||||||||||||||||||||||||||||||||
Class R6 |
| |||||||||||||||||||||||||||||||||||||||||||||||||||||||
Year ended 12/31/14 | 9.37 | 0.18 | 0.29 | 0.47 | (0.40 | ) | (0.28 | ) | (0.68 | ) | 9.16 | 5.06 | 1,136 | 0.00 | (e) | 0.22 | (e) | 1.90 | (e) | 7 | ||||||||||||||||||||||||||||||||||||
Year ended 12/31/13 | 9.56 | 0.00 | 0.22 | 0.22 | (0.34 | ) | (0.07 | ) | (0.41 | ) | 9.37 | 2.25 | 901 | 0.00 | 0.23 | 0.01 | 16 | |||||||||||||||||||||||||||||||||||||||
Year ended 12/31/12(f) | 9.96 | 0.07 | (0.02 | ) | 0.05 | (0.35 | ) | (0.10 | ) | (0.45 | ) | 9.56 | 0.57 | 10 | 0.00 | (g) | 0.30 | (g) | 2.49 | (g) | 6 | |||||||||||||||||||||||||||||||||||
| (a) | Calculated using average shares outstanding. |
| (b) | Includes adjustments in accordance with accounting principles generally accepted in the United States of America and as such, the net asset value for financial reporting purposes and the returns based upon those net asset values may differ from the net asset value and returns for shareholder transactions. Does not include sales charges and is not annualized for periods less than one year, if applicable. |
| (c) | In addition to the fees and expenses which the Fund bears directly; the Fund indirectly bears a pro rata share of the fees and expenses of the underlying funds in which the Fund invests. Because the underlying funds have varied expenses and fee levels and the Fund may own different proportions at different times, the amount of fees and expenses incurred indirectly by the Fund will vary. Estimated underlying fund expenses are not expenses that are incurred directly by your Fund. They are expenses that are incurred directly by the underlying funds and are deducted from the value of the funds your Fund invests in. The effect of the estimated underlying fund expenses that you bear indirectly is included in your Fund’s total return. Estimated acquired fund fees from underlying funds were 0.73%, 0.71%, 0.71%, 0.85% and 0.79% for the years ended December 31, 2014, 2013, 2012, 2011 and 2010, respectively. |
| (d) | Portfolio turnover is calculated at the fund level and is not annualized for periods less than one year, if applicable. |
| (e) | Ratios are based on average daily net assets (000’s omitted) of $49,900, $10,748, $2,065, $9,492, $2,845, $8,816, $1,022, $7,496, $33,322 and $1,004 for Class A, Class AX, Class B, Class C, Class CX, Class R, Class RX, Class Y, Class R5 and Class R6 shares, respectively. |
| (f) | Commencement date of June 1, 2010 for Class AX, Class CX and Class RX shares and September 24, 2012 for Class R6 shares, respectively. |
| (g) | Annualized. |
49 Invesco Balanced-Risk Retirement Funds
NOTE 11—Financial Highlights—(continued)
Invesco Balanced-Risk Retirement 2030 Fund
| Net asset value, beginning of period | Net investment income (loss)(a) | Net gains on securities (both realized and unrealized) | Total from investment operations | Dividends from net investment income | Distributions from net realized gains | Total distributions | Net asset value, end of period | Total return(b) | Net assets, end of period (000’s omitted) | Ratio of expenses to average net assets with fee waivers and/or expense reimbursements(c) | Ratio of expenses to average net assets without fee waivers and/or expense reimbursements | Ratio of net income (loss) | Portfolio turnover(d) | |||||||||||||||||||||||||||||||||||||||||||
Class A |
| |||||||||||||||||||||||||||||||||||||||||||||||||||||||
Year ended 12/31/14 | $ | 9.04 | $ | 0.24 | $ | 0.31 | $ | 0.55 | $ | (0.50 | ) | $ | (0.30 | ) | $ | (0.80 | ) | $ | 8.79 | 6.25 | % | $ | 49,929 | 0.25 | %(e) | 0.68 | %(e) | 2.57 | %(e) | 9 | % | |||||||||||||||||||||||||
Year ended 12/31/13 | 9.23 | (0.02 | ) | 0.23 | 0.21 | (0.32 | ) | (0.08 | ) | (0.40 | ) | 9.04 | 2.28 | 51,749 | 0.25 | 0.68 | (0.25 | ) | 34 | |||||||||||||||||||||||||||||||||||||
Year ended 12/31/12 | 8.72 | 0.25 | 0.67 | 0.92 | (0.36 | ) | (0.05 | ) | (0.41 | ) | 9.23 | 10.55 | 38,142 | 0.25 | 0.76 | 2.66 | 3 | |||||||||||||||||||||||||||||||||||||||
Year ended 12/31/11 | 8.14 | 0.25 | 0.57 | 0.82 | (0.23 | ) | (0.01 | ) | (0.24 | ) | 8.72 | 10.16 | 22,508 | 0.25 | 0.95 | 2.89 | 9 | |||||||||||||||||||||||||||||||||||||||
Year ended 12/31/10 | 7.58 | 0.53 | 0.45 | 0.98 | (0.42 | ) | — | (0.42 | ) | 8.14 | 13.06 | 13,983 | 0.25 | 1.32 | 6.63 | 32 | ||||||||||||||||||||||||||||||||||||||||
Class AX |
| |||||||||||||||||||||||||||||||||||||||||||||||||||||||
Year ended 12/31/14 | 9.04 | 0.24 | 0.32 | 0.56 | (0.50 | ) | (0.30 | ) | (0.80 | ) | 8.80 | 6.36 | 6,697 | 0.25 | (e) | 0.68 | (e) | 2.57 | (e) | 9 | ||||||||||||||||||||||||||||||||||||
Year ended 12/31/13 | 9.23 | (0.02 | ) | 0.23 | 0.21 | (0.32 | ) | (0.08 | ) | (0.40 | ) | 9.04 | 2.27 | 8,353 | 0.25 | 0.68 | (0.25 | ) | 34 | |||||||||||||||||||||||||||||||||||||
Year ended 12/31/12 | 8.72 | 0.25 | 0.67 | 0.92 | (0.36 | ) | (0.05 | ) | (0.41 | ) | 9.23 | 10.55 | 10,273 | 0.25 | 0.76 | 2.66 | 3 | |||||||||||||||||||||||||||||||||||||||
Year ended 12/31/11 | 8.14 | 0.25 | 0.57 | 0.82 | (0.23 | ) | (0.01 | ) | (0.24 | ) | 8.72 | 10.16 | 10,834 | 0.25 | 0.95 | 2.89 | 9 | |||||||||||||||||||||||||||||||||||||||
Year ended 12/31/10(f) | 7.73 | 0.32 | 0.51 | 0.83 | (0.42 | ) | — | (0.42 | ) | 8.14 | 10.86 | 13,388 | 0.25 | (g) | 0.92 | (g) | 6.63 | (g) | 32 | |||||||||||||||||||||||||||||||||||||
Class B |
| |||||||||||||||||||||||||||||||||||||||||||||||||||||||
Year ended 12/31/14 | 8.95 | 0.17 | 0.31 | 0.48 | (0.43 | ) | (0.30 | ) | (0.73 | ) | 8.70 | 5.51 | 2,157 | 1.00 | (e) | 1.43 | (e) | 1.82 | (e) | 9 | ||||||||||||||||||||||||||||||||||||
Year ended 12/31/13 | 9.14 | (0.09 | ) | 0.23 | 0.14 | (0.25 | ) | (0.08 | ) | (0.33 | ) | 8.95 | 1.52 | 2,759 | 1.00 | 1.43 | (1.00 | ) | 34 | |||||||||||||||||||||||||||||||||||||
Year ended 12/31/12 | 8.65 | 0.18 | 0.66 | 0.84 | (0.30 | ) | (0.05 | ) | (0.35 | ) | 9.14 | 9.70 | 3,507 | 1.00 | 1.51 | 1.91 | 3 | |||||||||||||||||||||||||||||||||||||||
Year ended 12/31/11 | 8.08 | 0.18 | 0.57 | 0.75 | (0.17 | ) | (0.01 | ) | (0.18 | ) | 8.65 | 9.36 | 3,068 | 1.00 | 1.70 | 2.14 | 9 | |||||||||||||||||||||||||||||||||||||||
Year ended 12/31/10 | 7.54 | 0.46 | 0.44 | 0.90 | (0.36 | ) | — | (0.36 | ) | 8.08 | 12.08 | 3,223 | 1.00 | 2.07 | 5.88 | 32 | ||||||||||||||||||||||||||||||||||||||||
Class C |
| |||||||||||||||||||||||||||||||||||||||||||||||||||||||
Year ended 12/31/14 | 8.95 | 0.17 | 0.30 | 0.47 | (0.43 | ) | (0.30 | ) | (0.73 | ) | 8.69 | 5.39 | 13,330 | 1.00 | (e) | 1.43 | (e) | 1.82 | (e) | 9 | ||||||||||||||||||||||||||||||||||||
Year ended 12/31/13 | 9.13 | (0.09 | ) | 0.24 | 0.15 | (0.25 | ) | (0.08 | ) | (0.33 | ) | 8.95 | 1.64 | 12,050 | 1.00 | 1.43 | (1.00 | ) | 34 | |||||||||||||||||||||||||||||||||||||
Year ended 12/31/12 | 8.64 | 0.18 | 0.66 | 0.84 | (0.30 | ) | (0.05 | ) | (0.35 | ) | 9.13 | 9.71 | 10,976 | 1.00 | 1.51 | 1.91 | 3 | |||||||||||||||||||||||||||||||||||||||
Year ended 12/31/11 | 8.07 | 0.18 | 0.57 | 0.75 | (0.17 | ) | (0.01 | ) | (0.18 | ) | 8.64 | 9.37 | 6,107 | 1.00 | 1.70 | 2.14 | 9 | |||||||||||||||||||||||||||||||||||||||
Year ended 12/31/10 | 7.54 | 0.46 | 0.43 | 0.89 | (0.36 | ) | — | (0.36 | ) | 8.07 | 11.95 | 3,550 | 1.00 | 2.07 | 5.88 | 32 | ||||||||||||||||||||||||||||||||||||||||
Class CX |
| |||||||||||||||||||||||||||||||||||||||||||||||||||||||
Year ended 12/31/14 | 8.95 | 0.17 | 0.30 | 0.47 | (0.43 | ) | (0.30 | ) | (0.73 | ) | 8.69 | 5.39 | 1,732 | 1.00 | (e) | 1.43 | (e) | 1.82 | (e) | 9 | ||||||||||||||||||||||||||||||||||||
Year ended 12/31/13 | 9.13 | (0.09 | ) | 0.24 | 0.15 | (0.25 | ) | (0.08 | ) | (0.33 | ) | 8.95 | 1.64 | 1,821 | 1.00 | 1.43 | (1.00 | ) | 34 | |||||||||||||||||||||||||||||||||||||
Year ended 12/31/12 | 8.64 | 0.17 | 0.67 | 0.84 | (0.30 | ) | (0.05 | ) | (0.35 | ) | 9.13 | 9.71 | 2,017 | 1.00 | 1.51 | 1.91 | 3 | |||||||||||||||||||||||||||||||||||||||
Year ended 12/31/11 | 8.07 | 0.18 | 0.57 | 0.75 | (0.17 | ) | (0.01 | ) | (0.18 | ) | 8.64 | 9.37 | 1,883 | 1.00 | 1.70 | 2.14 | 9 | |||||||||||||||||||||||||||||||||||||||
Year ended 12/31/10(f) | 7.65 | 0.28 | 0.50 | 0.78 | (0.36 | ) | — | (0.36 | ) | 8.07 | 10.34 | 2,989 | 1.00 | (g) | 1.67 | (g) | 5.88 | (g) | 32 | |||||||||||||||||||||||||||||||||||||
Class R |
| |||||||||||||||||||||||||||||||||||||||||||||||||||||||
Year ended 12/31/14 | 8.99 | 0.22 | 0.31 | 0.53 | (0.48 | ) | (0.30 | ) | (0.78 | ) | 8.74 | 6.02 | 11,531 | 0.50 | (e) | 0.93 | (e) | 2.32 | (e) | 9 | ||||||||||||||||||||||||||||||||||||
Year ended 12/31/13 | 9.18 | (0.05 | ) | 0.24 | 0.19 | (0.30 | ) | (0.08 | ) | (0.38 | ) | 8.99 | 2.03 | 13,007 | 0.50 | 0.93 | (0.50 | ) | 34 | |||||||||||||||||||||||||||||||||||||
Year ended 12/31/12 | 8.68 | 0.22 | 0.67 | 0.89 | (0.34 | ) | (0.05 | ) | (0.39 | ) | 9.18 | 10.25 | 12,296 | 0.50 | 1.01 | 2.41 | 3 | |||||||||||||||||||||||||||||||||||||||
Year ended 12/31/11 | 8.11 | 0.22 | 0.57 | 0.79 | (0.21 | ) | (0.01 | ) | (0.22 | ) | 8.68 | 9.83 | 7,636 | 0.50 | 1.20 | 2.64 | 9 | |||||||||||||||||||||||||||||||||||||||
Year ended 12/31/10 | 7.56 | 0.51 | 0.44 | 0.95 | (0.40 | ) | — | (0.40 | ) | 8.11 | 12.71 | 6,707 | 0.50 | 1.57 | 6.38 | 32 | ||||||||||||||||||||||||||||||||||||||||
Class RX |
| |||||||||||||||||||||||||||||||||||||||||||||||||||||||
Year ended 12/31/14 | 8.99 | 0.22 | 0.30 | 0.52 | (0.48 | ) | (0.30 | ) | (0.78 | ) | 8.73 | 5.89 | 1,139 | 0.50 | (e) | 0.93 | (e) | 2.32 | (e) | 9 | ||||||||||||||||||||||||||||||||||||
Year ended 12/31/13 | 9.18 | (0.05 | ) | 0.24 | 0.19 | (0.30 | ) | (0.08 | ) | (0.38 | ) | 8.99 | 2.04 | 1,119 | 0.50 | 0.93 | (0.50 | ) | 34 | |||||||||||||||||||||||||||||||||||||
Year ended 12/31/12 | 8.68 | 0.22 | 0.67 | 0.89 | (0.34 | ) | (0.05 | ) | (0.39 | ) | 9.18 | 10.26 | 1,177 | 0.50 | 1.01 | 2.41 | 3 | |||||||||||||||||||||||||||||||||||||||
Year ended 12/31/11 | 8.10 | 0.22 | 0.58 | 0.80 | (0.21 | ) | (0.01 | ) | (0.22 | ) | 8.68 | 9.97 | 848 | 0.50 | 1.20 | 2.64 | 9 | |||||||||||||||||||||||||||||||||||||||
Year ended 12/31/10(f) | 7.69 | 0.30 | 0.51 | 0.81 | (0.40 | ) | — | (0.40 | ) | 8.10 | 10.68 | 696 | 0.50 | (g) | 1.17 | (g) | 6.38 | (g) | 32 | |||||||||||||||||||||||||||||||||||||
Class Y |
| |||||||||||||||||||||||||||||||||||||||||||||||||||||||
Year ended 12/31/14 | 9.06 | 0.27 | 0.31 | 0.58 | (0.53 | ) | (0.30 | ) | (0.83 | ) | 8.81 | 6.51 | 5,730 | 0.00 | (e) | 0.43 | (e) | 2.82 | (e) | 9 | ||||||||||||||||||||||||||||||||||||
Year ended 12/31/13 | 9.25 | 0.00 | 0.23 | 0.23 | (0.34 | ) | (0.08 | ) | (0.42 | ) | 9.06 | 2.52 | 5,406 | 0.00 | 0.43 | 0.00 | 34 | |||||||||||||||||||||||||||||||||||||||
Year ended 12/31/12 | 8.73 | 0.27 | 0.68 | 0.95 | (0.38 | ) | (0.05 | ) | (0.43 | ) | 9.25 | 10.88 | 4,077 | 0.00 | 0.51 | 2.91 | 3 | |||||||||||||||||||||||||||||||||||||||
Year ended 12/31/11 | 8.15 | 0.27 | 0.57 | 0.84 | (0.25 | ) | (0.01 | ) | (0.26 | ) | 8.73 | 10.40 | 2,403 | 0.00 | 0.70 | 3.14 | 9 | |||||||||||||||||||||||||||||||||||||||
Year ended 12/31/10 | 7.59 | 0.55 | 0.45 | 1.00 | (0.44 | ) | — | (0.44 | ) | 8.15 | 13.30 | 1,112 | 0.00 | 1.07 | 6.88 | 32 | ||||||||||||||||||||||||||||||||||||||||
Class R5 |
| |||||||||||||||||||||||||||||||||||||||||||||||||||||||
Year ended 12/31/14 | 9.08 | 0.27 | 0.31 | 0.58 | (0.53 | ) | (0.30 | ) | (0.83 | ) | 8.83 | 6.50 | 41,595 | 0.00 | (e) | 0.30 | (e) | 2.82 | (e) | 9 | ||||||||||||||||||||||||||||||||||||
Year ended 12/31/13 | 9.27 | 0.00 | 0.23 | 0.23 | (0.34 | ) | (0.08 | ) | (0.42 | ) | 9.08 | 2.52 | 35,104 | 0.00 | 0.33 | 0.00 | 34 | |||||||||||||||||||||||||||||||||||||||
Year ended 12/31/12 | 8.75 | 0.27 | 0.68 | 0.95 | (0.38 | ) | (0.05 | ) | (0.43 | ) | 9.27 | 10.86 | 18,476 | 0.00 | 0.40 | 2.91 | 3 | |||||||||||||||||||||||||||||||||||||||
Year ended 12/31/11 | 8.17 | 0.27 | 0.57 | 0.84 | (0.25 | ) | (0.01 | ) | (0.26 | ) | 8.75 | 10.37 | 12 | 0.00 | 0.51 | 3.14 | 9 | |||||||||||||||||||||||||||||||||||||||
Year ended 12/31/10 | 7.60 | 0.55 | 0.46 | 1.01 | (0.44 | ) | — | (0.44 | ) | 8.17 | 13.43 | 18 | 0.00 | 0.91 | 6.88 | 32 | ||||||||||||||||||||||||||||||||||||||||
Class R6 |
| |||||||||||||||||||||||||||||||||||||||||||||||||||||||
Year ended 12/31/14 | 9.08 | 0.27 | 0.31 | 0.58 | (0.53 | ) | (0.30 | ) | (0.83 | ) | 8.83 | 6.50 | 1,250 | 0.00 | (e) | 0.21 | (e) | 2.82 | (e) | 9 | ||||||||||||||||||||||||||||||||||||
Year ended 12/31/13 | 9.27 | 0.00 | 0.23 | 0.23 | (0.34 | ) | (0.08 | ) | (0.42 | ) | 9.08 | 2.52 | 905 | 0.00 | 0.24 | 0.00 | 34 | |||||||||||||||||||||||||||||||||||||||
Year ended 12/31/12(f) | 9.65 | 0.07 | (0.02 | ) | 0.05 | (0.38 | ) | (0.05 | ) | (0.43 | ) | 9.27 | 0.52 | 10 | 0.00 | (g) | 0.32 | (g) | 2.91 | (g) | 3 | |||||||||||||||||||||||||||||||||||
| (a) | Calculated using average shares outstanding. |
| (b) | Includes adjustments in accordance with accounting principles generally accepted in the United States of America and as such, the net asset value for financial reporting purposes and the returns based upon those net asset values may differ from the net asset value and returns for shareholder transactions. Does not include sales charges and is not annualized for periods less than one year, if applicable. |
| (c) | In addition to the fees and expenses which the Fund bears directly; the Fund indirectly bears a pro rata share of the fees and expenses of the underlying funds in which the Fund invests. Because the underlying funds have varied expenses and fee levels and the Fund may own different proportions at different times, the amount of fees and expenses incurred indirectly by the Fund will vary. Estimated underlying fund expenses are not expenses that are incurred directly by your Fund. They are expenses that are incurred directly by the underlying funds and are deducted from the value of the funds your Fund invests in. The effect of the estimated underlying fund expenses that you bear indirectly is included in your Fund’s total return. Estimated acquired fund fees from underlying funds were 0.89%, 0.87%, 0.85%, 0.87% and 0.79% for the years ended December 31, 2014, 2013, 2012, 2011 and 2010, respectively. |
| (d) | Portfolio turnover is calculated at the fund level and is not annualized for periods less than one year, if applicable. |
| (e) | Ratios are based on average daily net assets (000’s omitted) of $51,411, $7,276, $2,456, $12,559, $1,839, $12,124, $1,107, $5,716, $37,405 and $1,094 for Class A, Class AX, Class B, Class C, Class CX, Class R, Class RX, Class Y, Class R5 and Class R6 shares, respectively. |
| (f) | Commencement date of June 1, 2010 for Class AX, Class CX and Class RX shares and September 24, 2012 for Class R6 shares, respectively. |
| (g) | Annualized. |
50 Invesco Balanced-Risk Retirement Funds
NOTE 11—Financial Highlights—(continued)
Invesco Balanced-Risk Retirement 2040 Fund
| Net asset value, beginning of period | Net investment income (loss)(a) | Net gains on securities (both realized and unrealized) | Total from investment operations | Dividends from net investment income | Distributions from net realized gains | Total distributions | Net asset value, end of period | Total return(b) | Net assets, end of period (000’s omitted) | Ratio of expenses to average net assets with fee waivers and/or expense reimbursements(c) | Ratio of expenses to average net assets without fee waivers and/or expense reimbursements | Ratio of net investment income (loss) to average net assets | Portfolio turnover(d) | |||||||||||||||||||||||||||||||||||||||||||
Class A |
| |||||||||||||||||||||||||||||||||||||||||||||||||||||||
Year ended 12/31/14 | $ | 8.34 | $ | 0.31 | $ | 0.29 | $ | 0.60 | $ | (0.59 | ) | $ | (0.28 | ) | $ | (0.87 | ) | $ | 8.07 | 7.35 | % | $ | 35,495 | 0.26 | %(e) | 0.86 | %(e) | 3.53 | %(e) | 8 | % | |||||||||||||||||||||||||
Year ended 12/31/13 | 8.76 | (0.02 | ) | 0.21 | 0.19 | (0.22 | ) | (0.39 | ) | (0.61 | ) | 8.34 | 2.23 | 33,816 | 0.25 | 0.87 | (0.25 | ) | 68 | |||||||||||||||||||||||||||||||||||||
Year ended 12/31/12 | 8.23 | 0.24 | 0.62 | 0.86 | (0.33 | ) | — | (0.33 | ) | 8.76 | 10.38 | 28,426 | 0.25 | 1.07 | 2.69 | 4 | ||||||||||||||||||||||||||||||||||||||||
Year ended 12/31/11 | 7.79 | 0.23 | 0.57 | 0.80 | (0.36 | ) | — | (0.36 | ) | 8.23 | 10.30 | 13,484 | 0.25 | 1.52 | 2.88 | 14 | ||||||||||||||||||||||||||||||||||||||||
Year ended 12/31/10 | 7.36 | 0.53 | 0.42 | 0.95 | (0.25 | ) | (0.27 | ) | (0.52 | ) | 7.79 | 13.03 | 8,727 | 0.25 | 1.94 | 6.79 | 26 | |||||||||||||||||||||||||||||||||||||||
Class AX |
| |||||||||||||||||||||||||||||||||||||||||||||||||||||||
Year ended 12/31/14 | 8.34 | 0.31 | 0.28 | 0.59 | (0.59 | ) | (0.28 | ) | (0.87 | ) | 8.06 | 7.23 | 3,284 | 0.26 | (e) | 0.86 | (e) | 3.53 | (e) | 8 | ||||||||||||||||||||||||||||||||||||
Year ended 12/31/13 | 8.75 | (0.02 | ) | 0.22 | 0.20 | (0.22 | ) | (0.39 | ) | (0.61 | ) | 8.34 | 2.34 | 3,493 | 0.25 | 0.87 | (0.25 | ) | 68 | |||||||||||||||||||||||||||||||||||||
Year ended 12/31/12 | 8.22 | 0.23 | 0.63 | 0.86 | (0.33 | ) | — | (0.33 | ) | 8.75 | 10.51 | 3,999 | 0.25 | 1.07 | 2.69 | 4 | ||||||||||||||||||||||||||||||||||||||||
Year ended 12/31/11 | 7.79 | 0.23 | 0.56 | 0.79 | (0.36 | ) | — | (0.36 | ) | 8.22 | 10.17 | 4,087 | 0.25 | 1.52 | 2.88 | 14 | ||||||||||||||||||||||||||||||||||||||||
Year ended 12/31/10(f) | 7.50 | 0.31 | 0.50 | 0.81 | (0.25 | ) | (0.27 | ) | (0.52 | ) | 7.79 | 10.92 | 6,212 | 0.25 | (g) | 1.42 | (g) | 6.79 | (g) | 26 | ||||||||||||||||||||||||||||||||||||
Class B |
| |||||||||||||||||||||||||||||||||||||||||||||||||||||||
Year ended 12/31/14 | 8.26 | 0.24 | 0.28 | 0.52 | (0.53 | ) | (0.28 | ) | (0.81 | ) | 7.97 | 6.38 | 925 | 1.01 | (e) | 1.61 | (e) | 2.78 | (e) | 8 | ||||||||||||||||||||||||||||||||||||
Year ended 12/31/13 | 8.67 | (0.09 | ) | 0.22 | 0.13 | (0.15 | ) | (0.39 | ) | (0.54 | ) | 8.26 | 1.54 | 1,109 | 1.00 | 1.62 | (1.00 | ) | 68 | |||||||||||||||||||||||||||||||||||||
Year ended 12/31/12 | 8.15 | 0.17 | 0.63 | 0.80 | (0.28 | ) | — | (0.28 | ) | 8.67 | 9.79 | 1,263 | 1.00 | 1.82 | 1.94 | 4 | ||||||||||||||||||||||||||||||||||||||||
Year ended 12/31/11 | 7.73 | 0.17 | 0.55 | 0.72 | (0.30 | ) | — | (0.30 | ) | 8.15 | 9.37 | 1,289 | 1.00 | 2.27 | 2.13 | 14 | ||||||||||||||||||||||||||||||||||||||||
Year ended 12/31/10 | 7.32 | 0.46 | 0.41 | 0.87 | (0.19 | ) | (0.27 | ) | (0.46 | ) | 7.73 | 12.08 | 1,115 | 1.00 | 2.69 | 6.04 | 26 | |||||||||||||||||||||||||||||||||||||||
Class C |
| |||||||||||||||||||||||||||||||||||||||||||||||||||||||
Year ended 12/31/14 | 8.25 | 0.24 | 0.28 | 0.52 | (0.53 | ) | (0.28 | ) | (0.81 | ) | 7.96 | 6.39 | 6,249 | 1.01 | (e) | 1.61 | (e) | 2.78 | (e) | 8 | ||||||||||||||||||||||||||||||||||||
Year ended 12/31/13 | 8.66 | (0.09 | ) | 0.22 | 0.13 | (0.15 | ) | (0.39 | ) | (0.54 | ) | 8.25 | 1.54 | 5,999 | 1.00 | 1.62 | (1.00 | ) | 68 | |||||||||||||||||||||||||||||||||||||
Year ended 12/31/12 | 8.14 | 0.17 | 0.63 | 0.80 | (0.28 | ) | — | (0.28 | ) | 8.66 | 9.81 | 6,377 | 1.00 | 1.82 | 1.94 | 4 | ||||||||||||||||||||||||||||||||||||||||
Year ended 12/31/11 | 7.73 | 0.17 | 0.54 | 0.71 | (0.30 | ) | — | (0.30 | ) | 8.14 | 9.24 | 3,468 | 1.00 | 2.27 | 2.13 | 14 | ||||||||||||||||||||||||||||||||||||||||
Year ended 12/31/10 | 7.31 | 0.46 | 0.42 | 0.88 | (0.19 | ) | (0.27 | ) | (0.46 | ) | 7.73 | 12.24 | 2,136 | 1.00 | 2.69 | 6.04 | 26 | |||||||||||||||||||||||||||||||||||||||
Class CX |
| |||||||||||||||||||||||||||||||||||||||||||||||||||||||
Year ended 12/31/14 | 8.24 | 0.24 | 0.28 | 0.52 | (0.53 | ) | (0.28 | ) | (0.81 | ) | 7.95 | 6.39 | 572 | 1.01 | (e) | 1.61 | (e) | 2.78 | (e) | 8 | ||||||||||||||||||||||||||||||||||||
Year ended 12/31/13 | 8.65 | (0.09 | ) | 0.22 | 0.13 | (0.15 | ) | (0.39 | ) | (0.54 | ) | 8.24 | 1.54 | 563 | 1.00 | 1.62 | (1.00 | ) | 68 | |||||||||||||||||||||||||||||||||||||
Year ended 12/31/12 | 8.14 | 0.17 | 0.62 | 0.79 | (0.28 | ) | — | (0.28 | ) | 8.65 | 9.68 | 590 | 1.00 | 1.82 | 1.94 | 4 | ||||||||||||||||||||||||||||||||||||||||
Year ended 12/31/11 | 7.72 | 0.17 | 0.55 | 0.72 | (0.30 | ) | — | (0.30 | ) | 8.14 | 9.38 | 595 | 1.00 | 2.27 | 2.13 | 14 | ||||||||||||||||||||||||||||||||||||||||
Year ended 12/31/10(f) | 7.42 | 0.28 | 0.48 | 0.76 | (0.19 | ) | (0.27 | ) | (0.46 | ) | 7.72 | 10.44 | 747 | 1.00 | (g) | 2.17 | (g) | 6.04 | (g) | 26 | ||||||||||||||||||||||||||||||||||||
Class R |
| |||||||||||||||||||||||||||||||||||||||||||||||||||||||
Year ended 12/31/14 | 8.30 | 0.28 | 0.29 | 0.57 | (0.57 | ) | (0.28 | ) | (0.85 | ) | 8.02 | 7.00 | 8,650 | 0.51 | (e) | 1.11 | (e) | 3.28 | (e) | 8 | ||||||||||||||||||||||||||||||||||||
Year ended 12/31/13 | 8.72 | (0.04 | ) | 0.21 | 0.17 | (0.20 | ) | (0.39 | ) | (0.59 | ) | 8.30 | 1.97 | 8,644 | 0.50 | 1.12 | (0.50 | ) | 68 | |||||||||||||||||||||||||||||||||||||
Year ended 12/31/12 | 8.19 | 0.21 | 0.63 | 0.84 | (0.31 | ) | — | (0.31 | ) | 8.72 | 10.33 | 8,197 | 0.50 | 1.32 | 2.44 | 4 | ||||||||||||||||||||||||||||||||||||||||
Year ended 12/31/11 | 7.77 | 0.21 | 0.55 | 0.76 | (0.34 | ) | — | (0.34 | ) | 8.19 | 9.81 | 3,692 | 0.50 | 1.77 | 2.63 | 14 | ||||||||||||||||||||||||||||||||||||||||
Year ended 12/31/10 | 7.34 | 0.51 | 0.42 | 0.93 | (0.23 | ) | (0.27 | ) | (0.50 | ) | 7.77 | 12.83 | 3,536 | 0.50 | 2.19 | 6.54 | 26 | |||||||||||||||||||||||||||||||||||||||
Class RX |
| |||||||||||||||||||||||||||||||||||||||||||||||||||||||
Year ended 12/31/14 | 8.31 | 0.28 | 0.29 | 0.57 | (0.57 | ) | (0.28 | ) | (0.85 | ) | 8.03 | 6.99 | 683 | 0.51 | (e) | 1.11 | (e) | 3.28 | (e) | 8 | ||||||||||||||||||||||||||||||||||||
Year ended 12/31/13 | 8.72 | (0.04 | ) | 0.22 | 0.18 | (0.20 | ) | (0.39 | ) | (0.59 | ) | 8.31 | 2.08 | 614 | 0.50 | 1.12 | (0.50 | ) | 68 | |||||||||||||||||||||||||||||||||||||
Year ended 12/31/12 | 8.20 | 0.21 | 0.62 | 0.83 | (0.31 | ) | — | (0.31 | ) | 8.72 | 10.19 | 781 | 0.50 | 1.32 | 2.44 | 4 | ||||||||||||||||||||||||||||||||||||||||
Year ended 12/31/11 | 7.76 | 0.21 | 0.57 | 0.78 | (0.34 | ) | — | (0.34 | ) | 8.20 | 10.08 | 631 | 0.50 | 1.77 | 2.63 | 14 | ||||||||||||||||||||||||||||||||||||||||
Year ended 12/31/10(f) | 7.47 | 0.30 | 0.49 | 0.79 | (0.23 | ) | (0.27 | ) | (0.50 | ) | 7.76 | 10.73 | 570 | 0.50 | (g) | 1.67 | (g) | 6.54 | (g) | 26 | ||||||||||||||||||||||||||||||||||||
Class Y |
| |||||||||||||||||||||||||||||||||||||||||||||||||||||||
Year ended 12/31/14 | 8.36 | 0.33 | 0.29 | 0.62 | (0.61 | ) | (0.28 | ) | (0.89 | ) | 8.09 | 7.61 | 2,338 | 0.01 | (e) | 0.61 | (e) | 3.78 | (e) | 8 | ||||||||||||||||||||||||||||||||||||
Year ended 12/31/13 | 8.78 | 0.00 | 0.21 | 0.21 | (0.24 | ) | (0.39 | ) | (0.63 | ) | 8.36 | 2.49 | 2,716 | 0.00 | 0.62 | 0.00 | 68 | |||||||||||||||||||||||||||||||||||||||
Year ended 12/31/12 | 8.24 | 0.26 | 0.63 | 0.89 | (0.35 | ) | — | (0.35 | ) | 8.78 | 10.83 | 1,967 | 0.00 | 0.82 | 2.94 | 4 | ||||||||||||||||||||||||||||||||||||||||
Year ended 12/31/11 | 7.81 | 0.25 | 0.56 | 0.81 | (0.38 | ) | — | (0.38 | ) | 8.24 | 10.39 | 190 | 0.00 | 1.27 | 3.13 | 14 | ||||||||||||||||||||||||||||||||||||||||
Year ended 12/31/10 | 7.37 | 0.55 | 0.43 | 0.98 | (0.27 | ) | (0.27 | ) | (0.54 | ) | 7.81 | 13.42 | 398 | 0.00 | 1.69 | 7.04 | 26 | |||||||||||||||||||||||||||||||||||||||
Class R5 |
| |||||||||||||||||||||||||||||||||||||||||||||||||||||||
Year ended 12/31/14 | 8.37 | 0.33 | 0.29 | 0.62 | (0.61 | ) | (0.28 | ) | (0.89 | ) | 8.10 | 7.59 | 25,848 | 0.01 | (e) | 0.44 | (e) | 3.78 | (e) | 8 | ||||||||||||||||||||||||||||||||||||
Year ended 12/31/13 | 8.78 | 0.00 | 0.22 | 0.22 | (0.24 | ) | (0.39 | ) | (0.63 | ) | 8.37 | 2.60 | 21,149 | 0.00 | 0.47 | 0.00 | 68 | |||||||||||||||||||||||||||||||||||||||
Year ended 12/31/12 | 8.25 | 0.26 | 0.62 | 0.88 | (0.35 | ) | — | (0.35 | ) | 8.78 | 10.69 | 6,079 | 0.00 | 0.65 | 2.94 | 4 | ||||||||||||||||||||||||||||||||||||||||
Year ended 12/31/11 | 7.81 | 0.25 | 0.57 | 0.82 | (0.38 | ) | — | (0.38 | ) | 8.25 | 10.52 | 13 | 0.00 | 1.02 | 3.13 | 14 | ||||||||||||||||||||||||||||||||||||||||
Year ended 12/31/10 | 7.38 | 0.55 | 0.42 | 0.97 | (0.27 | ) | (0.27 | ) | (0.54 | ) | 7.81 | 13.25 | 12 | 0.00 | 1.38 | 7.04 | 26 | |||||||||||||||||||||||||||||||||||||||
Class R6 |
| |||||||||||||||||||||||||||||||||||||||||||||||||||||||
Year ended 12/31/14 | 8.37 | 0.33 | 0.29 | 0.62 | (0.61 | ) | (0.28 | ) | (0.89 | ) | 8.10 | 7.59 | 1,270 | 0.01 | (e) | 0.35 | (e) | 3.78 | (e) | 8 | ||||||||||||||||||||||||||||||||||||
Year ended 12/31/13 | 8.78 | 0.00 | 0.22 | 0.22 | (0.24 | ) | (0.39 | ) | (0.63 | ) | 8.37 | 2.60 | 970 | 0.00 | 0.37 | 0.00 | 68 | |||||||||||||||||||||||||||||||||||||||
Year ended 12/31/12(f) | 9.09 | 0.07 | (0.03 | ) | 0.04 | (0.35 | ) | — | (0.35 | ) | 8.78 | 0.46 | 10 | 0.00 | (g) | 0.53 | (g) | 2.94 | (g) | 4 | ||||||||||||||||||||||||||||||||||||
| (a) | Calculated using average shares outstanding. |
| (b) | Includes adjustments in accordance with accounting principles generally accepted in the United States of America and as such, the net asset value for financial reporting purposes and the returns based upon those net asset values may differ from the net asset value and returns for shareholder transactions. Does not include sales charges and is not annualized for periods less than one year, if applicable. |
| (c) | In addition to the fees and expenses which the Fund bears directly; the Fund indirectly bears a pro rata share of the fees and expenses of the underlying funds in which the Fund invests. Because the underlying funds have varied expenses and fee levels and the Fund may own different proportions at different times, the amount of fees and expenses incurred indirectly by the Fund will vary. Estimated underlying fund expenses are not expenses that are incurred directly by your Fund. They are expenses that are incurred directly by the underlying funds and are deducted from the value of the funds your Fund invests in. The effect of the estimated underlying fund expenses that you bear indirectly is included in your Fund’s total return. Estimated acquired fund fees from underlying funds were 0.99%, 0.99%, 0.98%, 0.87% and 0.79% for the years ended December 31, 2014, 2013, 2012, 2011 and 2010, respectively. |
| (d) | Portfolio turnover is calculated at the fund level and is not annualized for periods less than one year, if applicable. |
| (e) | Ratios are based on average daily net assets (000’s omitted) of $34,539, $3,400, $1,001, $5,785, $584, $8,810, $650, $2,332, $23,168 and $1,119 for Class A, Class AX, Class B, Class C, Class CX, Class R, Class RX, Class Y, Class R5 and Class R6 shares, respectively. |
| (f) | Commencement date of June 1, 2010 for Class AX, Class CX and Class RX shares and September 24, 2012 for Class R6 shares, respectively. |
| (g) | Annualized. |
51 Invesco Balanced-Risk Retirement Funds
NOTE 11—Financial Highlights—(continued)
Invesco Balanced-Risk Retirement 2050 Fund
| Net asset value, beginning of period | Net investment income (loss)(a) | Net gains on securities (both realized and unrealized) | Total from investment operations | Dividends from net investment income | Distributions from net realized gains | Total distributions | Net asset value, end of period | Total return(b) | Net assets, end of period (000’s omitted) | Ratio of expenses to average net assets with fee waivers and/or expense reimbursements(c) | Ratio of expenses to average net assets without fee waivers and/or expense reimbursements | Ratio of net investment income (loss) to average net assets | Portfolio turnover(d) | |||||||||||||||||||||||||||||||||||||||||||
Class A |
| |||||||||||||||||||||||||||||||||||||||||||||||||||||||
Year ended 12/31/14 | $ | 8.21 | $ | 0.40 | $ | 0.27 | $ | 0.67 | $ | (0.63 | ) | $ | (0.27 | ) | $ | (0.90 | ) | $ | 7.98 | 8.30 | % | $ | 14,645 | 0.25 | %(e) | 1.24 | %(e) | 4.61 | %(e) | 8 | % | |||||||||||||||||||||||||
Year ended 12/31/13 | 8.68 | (0.02 | ) | 0.22 | 0.20 | (0.20 | ) | (0.47 | ) | (0.67 | ) | 8.21 | 2.42 | 13,570 | 0.25 | 1.31 | (0.25 | ) | 93 | |||||||||||||||||||||||||||||||||||||
Year ended 12/31/12 | 8.20 | 0.23 | 0.63 | 0.86 | (0.35 | ) | (0.03 | ) | (0.38 | ) | 8.68 | 10.47 | 12,933 | 0.25 | 1.57 | 2.62 | 4 | |||||||||||||||||||||||||||||||||||||||
Year ended 12/31/11 | 7.62 | 0.27 | 0.50 | 0.77 | (0.19 | ) | — | (0.19 | ) | 8.20 | 10.16 | 7,586 | 0.25 | 3.01 | 3.34 | 22 | ||||||||||||||||||||||||||||||||||||||||
Year ended 12/31/10 | 7.13 | 0.48 | 0.44 | 0.92 | (0.43 | ) | — | (0.43 | ) | 7.62 | 13.08 | 3,693 | 0.25 | 3.63 | 6.42 | 27 | ||||||||||||||||||||||||||||||||||||||||
Class AX |
| |||||||||||||||||||||||||||||||||||||||||||||||||||||||
Year ended 12/31/14 | 8.21 | 0.40 | 0.28 | 0.68 | (0.63 | ) | (0.27 | ) | (0.90 | ) | 7.99 | 8.43 | 1,192 | 0.25 | (e) | 1.24 | (e) | 4.61 | (e) | 8 | ||||||||||||||||||||||||||||||||||||
Year ended 12/31/13 | 8.69 | (0.02 | ) | 0.21 | 0.19 | (0.20 | ) | (0.47 | ) | (0.67 | ) | 8.21 | 2.30 | 1,230 | 0.25 | 1.31 | (0.25 | ) | 93 | |||||||||||||||||||||||||||||||||||||
Year ended 12/31/12 | 8.20 | 0.23 | 0.64 | 0.87 | (0.35 | ) | (0.03 | ) | (0.38 | ) | 8.69 | �� | 10.59 | 1,258 | 0.25 | 1.57 | 2.62 | 4 | ||||||||||||||||||||||||||||||||||||||
Year ended 12/31/11 | 7.62 | 0.27 | 0.50 | 0.77 | (0.19 | ) | — | (0.19 | ) | 8.20 | 10.16 | 1,430 | 0.25 | 3.01 | 3.34 | 22 | ||||||||||||||||||||||||||||||||||||||||
Year ended 12/31/10(f) | 7.27 | 0.29 | 0.49 | 0.78 | (0.43 | ) | — | (0.43 | ) | 7.62 | 10.91 | 1,793 | 0.25 | (g) | 2.97 | (g) | 6.42 | (g) | 27 | |||||||||||||||||||||||||||||||||||||
Class B |
| |||||||||||||||||||||||||||||||||||||||||||||||||||||||
Year ended 12/31/14 | 8.10 | 0.33 | 0.27 | 0.60 | (0.57 | ) | (0.27 | ) | (0.84 | ) | 7.86 | 7.55 | 348 | 1.00 | (e) | 1.99 | (e) | 3.86 | (e) | 8 | ||||||||||||||||||||||||||||||||||||
Year ended 12/31/13 | 8.57 | (0.09 | ) | 0.22 | 0.13 | (0.13 | ) | (0.47 | ) | (0.60 | ) | 8.10 | 1.65 | 393 | 1.00 | 2.06 | (1.00 | ) | 93 | |||||||||||||||||||||||||||||||||||||
Year ended 12/31/12 | 8.11 | 0.16 | 0.63 | 0.79 | (0.30 | ) | (0.03 | ) | (0.33 | ) | 8.57 | 9.68 | 473 | 1.00 | 2.32 | 1.86 | 4 | |||||||||||||||||||||||||||||||||||||||
Year ended 12/31/11 | 7.55 | 0.20 | 0.51 | 0.71 | (0.15 | ) | — | (0.15 | ) | 8.11 | 9.39 | 478 | 1.00 | 3.76 | 2.59 | 22 | ||||||||||||||||||||||||||||||||||||||||
Year ended 12/31/10 | 7.08 | 0.42 | 0.43 | 0.85 | (0.38 | ) | — | (0.38 | ) | 7.55 | 12.13 | 489 | 1.00 | 4.38 | 5.67 | 27 | ||||||||||||||||||||||||||||||||||||||||
Class C |
| |||||||||||||||||||||||||||||||||||||||||||||||||||||||
Year ended 12/31/14 | 8.12 | 0.33 | 0.26 | 0.59 | (0.57 | ) | (0.27 | ) | (0.84 | ) | 7.87 | 7.41 | 4,876 | 1.00 | (e) | 1.99 | (e) | 3.86 | (e) | 8 | ||||||||||||||||||||||||||||||||||||
Year ended 12/31/13 | 8.59 | (0.09 | ) | 0.22 | 0.13 | (0.13 | ) | (0.47 | ) | (0.60 | ) | 8.12 | 1.65 | 3,924 | 1.00 | 2.06 | (1.00 | ) | 93 | |||||||||||||||||||||||||||||||||||||
Year ended 12/31/12 | 8.13 | 0.16 | 0.63 | 0.79 | (0.30 | ) | (0.03 | ) | (0.33 | ) | 8.59 | 9.66 | 3,975 | 1.00 | 2.32 | 1.87 | 4 | |||||||||||||||||||||||||||||||||||||||
Year ended 12/31/11 | 7.57 | 0.20 | 0.51 | 0.71 | (0.15 | ) | — | (0.15 | ) | 8.13 | 9.36 | 1,872 | 1.00 | 3.76 | 2.59 | 22 | ||||||||||||||||||||||||||||||||||||||||
Year ended 12/31/10 | 7.09 | 0.42 | 0.44 | 0.86 | (0.38 | ) | — | (0.38 | ) | 7.57 | 12.26 | 709 | 1.00 | 4.38 | 5.67 | 27 | ||||||||||||||||||||||||||||||||||||||||
Class CX |
| |||||||||||||||||||||||||||||||||||||||||||||||||||||||
Year ended 12/31/14 | 8.11 | 0.33 | 0.27 | 0.60 | (0.57 | ) | (0.27 | ) | (0.84 | ) | 7.87 | 7.54 | 152 | 1.00 | (e) | 1.99 | (e) | 3.86 | (e) | 8 | ||||||||||||||||||||||||||||||||||||
Year ended 12/31/13 | 8.58 | (0.09 | ) | 0.22 | 0.13 | (0.13 | ) | (0.47 | ) | (0.60 | ) | 8.11 | 1.65 | 134 | 1.00 | 2.06 | (1.00 | ) | 93 | |||||||||||||||||||||||||||||||||||||
Year ended 12/31/12 | 8.12 | 0.16 | 0.63 | 0.79 | (0.30 | ) | (0.03 | ) | (0.33 | ) | 8.58 | 9.67 | 128 | 1.00 | 2.32 | 1.87 | 4 | |||||||||||||||||||||||||||||||||||||||
Year ended 12/31/11 | 7.56 | 0.20 | 0.51 | 0.71 | (0.15 | ) | — | (0.15 | ) | 8.12 | 9.37 | 99 | 1.00 | 3.76 | 2.59 | 22 | ||||||||||||||||||||||||||||||||||||||||
Year ended 12/31/10(f) | 7.20 | 0.25 | 0.49 | 0.74 | (0.38 | ) | — | (0.38 | ) | 7.56 | 10.40 | 335 | 1.00 | (g) | 3.72 | (g) | 5.67 | (g) | 27 | |||||||||||||||||||||||||||||||||||||
Class R |
| |||||||||||||||||||||||||||||||||||||||||||||||||||||||
Year ended 12/31/14 | 8.17 | 0.37 | 0.27 | 0.64 | (0.61 | ) | (0.27 | ) | (0.88 | ) | 7.93 | 7.96 | 5,548 | 0.50 | (e) | 1.49 | (e) | 4.36 | (e) | 8 | ||||||||||||||||||||||||||||||||||||
Year ended 12/31/13 | 8.64 | (0.04 | ) | 0.22 | 0.18 | (0.18 | ) | (0.47 | ) | (0.65 | ) | 8.17 | 2.18 | 4,887 | 0.50 | 1.56 | (0.50 | ) | 93 | |||||||||||||||||||||||||||||||||||||
Year ended 12/31/12 | 8.17 | 0.21 | 0.62 | 0.83 | (0.33 | ) | (0.03 | ) | (0.36 | ) | 8.64 | 10.17 | 3,846 | 0.50 | 1.82 | 2.37 | 4 | |||||||||||||||||||||||||||||||||||||||
Year ended 12/31/11 | 7.59 | 0.24 | 0.51 | 0.75 | (0.17 | ) | — | (0.17 | ) | 8.17 | 9.98 | 1,930 | 0.50 | 3.26 | 3.09 | 22 | ||||||||||||||||||||||||||||||||||||||||
Year ended 12/31/10 | 7.11 | 0.46 | 0.43 | 0.89 | (0.41 | ) | — | (0.41 | ) | 7.59 | 12.74 | 1,708 | 0.50 | 3.88 | 6.17 | 27 | ||||||||||||||||||||||||||||||||||||||||
Class RX |
| |||||||||||||||||||||||||||||||||||||||||||||||||||||||
Year ended 12/31/14 | 8.17 | 0.37 | 0.28 | 0.65 | (0.61 | ) | (0.27 | ) | (0.88 | ) | 7.94 | 8.09 | 214 | 0.50 | (e) | 1.49 | (e) | 4.36 | (e) | 8 | ||||||||||||||||||||||||||||||||||||
Year ended 12/31/13 | 8.65 | (0.04 | ) | 0.21 | 0.17 | (0.18 | ) | (0.47 | ) | (0.65 | ) | 8.17 | 2.06 | 255 | 0.50 | 1.56 | (0.50 | ) | 93 | |||||||||||||||||||||||||||||||||||||
Year ended 12/31/12 | 8.17 | 0.21 | 0.63 | 0.84 | (0.33 | ) | (0.03 | ) | (0.36 | ) | 8.65 | 10.30 | 205 | 0.50 | 1.82 | 2.37 | 4 | |||||||||||||||||||||||||||||||||||||||
Year ended 12/31/11 | 7.60 | 0.24 | 0.50 | 0.74 | (0.17 | ) | — | (0.17 | ) | 8.17 | 9.84 | 146 | 0.50 | 3.26 | 3.09 | 22 | ||||||||||||||||||||||||||||||||||||||||
Year ended 12/31/10(f) | 7.24 | 0.27 | 0.51 | 0.78 | (0.42 | ) | — | (0.42 | ) | 7.60 | 10.85 | 135 | 0.50 | (g) | 3.22 | (g) | 6.17 | (g) | 27 | |||||||||||||||||||||||||||||||||||||
Class Y |
| |||||||||||||||||||||||||||||||||||||||||||||||||||||||
Year ended 12/31/14 | 8.22 | 0.42 | 0.29 | 0.71 | (0.65 | ) | (0.27 | ) | (0.92 | ) | 8.01 | 8.81 | 3,381 | 0.00 | (e) | 0.99 | (e) | 4.86 | (e) | 8 | ||||||||||||||||||||||||||||||||||||
Year ended 12/31/13 | 8.69 | 0.00 | 0.22 | 0.22 | (0.22 | ) | (0.47 | ) | (0.69 | ) | 8.22 | 2.68 | 1,941 | 0.00 | 1.06 | 0.00 | 93 | |||||||||||||||||||||||||||||||||||||||
Year ended 12/31/12 | 8.21 | 0.25 | 0.63 | 0.88 | (0.37 | ) | (0.03 | ) | (0.40 | ) | 8.69 | 10.68 | 1,336 | 0.00 | 1.32 | 2.87 | 4 | |||||||||||||||||||||||||||||||||||||||
Year ended 12/31/11 | 7.63 | 0.29 | 0.50 | 0.79 | (0.21 | ) | — | (0.21 | ) | 8.21 | 10.36 | 482 | 0.00 | 2.76 | 3.59 | 22 | ||||||||||||||||||||||||||||||||||||||||
Year ended 12/31/10 | 7.14 | 0.51 | 0.43 | 0.94 | (0.45 | ) | — | (0.45 | ) | 7.63 | 13.33 | 196 | 0.00 | 3.38 | 6.67 | 27 | ||||||||||||||||||||||||||||||||||||||||
Class R5 |
| |||||||||||||||||||||||||||||||||||||||||||||||||||||||
Year ended 12/31/14 | 8.23 | 0.42 | 0.27 | 0.69 | (0.65 | ) | (0.27 | ) | (0.92 | ) | 8.00 | 8.53 | 18,171 | 0.00 | (e) | 0.70 | (e) | 4.86 | (e) | 8 | ||||||||||||||||||||||||||||||||||||
Year ended 12/31/13 | 8.70 | 0.00 | 0.22 | 0.22 | (0.22 | ) | (0.47 | ) | (0.69 | ) | 8.23 | 2.68 | 14,065 | 0.00 | 0.81 | 0.00 | 93 | |||||||||||||||||||||||||||||||||||||||
Year ended 12/31/12 | 8.21 | 0.25 | 0.64 | 0.89 | (0.37 | ) | (0.03 | ) | (0.40 | ) | 8.70 | 10.80 | 5,747 | 0.00 | 1.08 | 2.87 | 4 | |||||||||||||||||||||||||||||||||||||||
Year ended 12/31/11 | 7.62 | 0.29 | 0.51 | 0.80 | (0.21 | ) | — | (0.21 | ) | 8.21 | 10.50 | 11 | 0.00 | 2.36 | 3.59 | 22 | ||||||||||||||||||||||||||||||||||||||||
Year ended 12/31/10 | 7.14 | 0.50 | 0.43 | 0.93 | (0.45 | ) | — | (0.45 | ) | 7.62 | 13.18 | 10 | 0.00 | 3.03 | 6.67 | 27 | ||||||||||||||||||||||||||||||||||||||||
Class R6 |
| |||||||||||||||||||||||||||||||||||||||||||||||||||||||
Year ended 12/31/14 | 8.24 | 0.42 | 0.27 | 0.69 | (0.65 | ) | (0.27 | ) | (0.92 | ) | 8.01 | 8.52 | 430 | 0.00 | (e) | 0.61 | (e) | 4.86 | (e) | 8 | ||||||||||||||||||||||||||||||||||||
Year ended 12/31/13 | 8.71 | 0.00 | 0.22 | 0.22 | (0.22 | ) | (0.47 | ) | (0.69 | ) | 8.24 | 2.67 | 290 | 0.00 | 0.72 | 0.00 | 93 | |||||||||||||||||||||||||||||||||||||||
Year ended 12/31/12(f) | 9.06 | 0.07 | (0.02 | ) | 0.05 | (0.37 | ) | (0.03 | ) | (0.40 | ) | 8.71 | 0.52 | 10 | 0.00 | (g) | 0.99 | (g) | 2.87 | (g) | 4 | |||||||||||||||||||||||||||||||||||
| (a) | Calculated using average shares outstanding. |
| (b) | Includes adjustments in accordance with accounting principles generally accepted in the United States of America and as such, the net asset value for financial reporting purposes and the returns based upon those net asset values may differ from the net asset value and returns for shareholder transactions. Does not include sales charges and is not annualized for periods less than one year, if applicable. |
| (c) | In addition to the fees and expenses which the Fund bears directly; the Fund indirectly bears a pro rata share of the fees and expenses of the underlying funds in which the Fund invests. Because the underlying funds have varied expenses and fee levels and the Fund may own different proportions at different times, the amount of fees and expenses incurred indirectly by the Fund will vary. Estimated underlying fund expenses are not expenses that are incurred directly by your Fund. They are expenses that are incurred directly by the underlying funds and are deducted from the value of the funds your Fund invests in. The effect of the estimated underlying fund expenses that you bear indirectly is included in your Fund’s total return. Estimated acquired fund fees from underlying funds were 1.10%, 1.11%, 1.11%, 0.87% and 0.79% for the years ended December 31, 2014, 2013, 2012, 2011 and 2010, respectively. |
| (d) | Portfolio turnover is calculated at the fund level and is not annualized for periods less than one year, if applicable. |
| (e) | Ratios are based on average daily net assets (000’s omitted) of $13,346, $1,176, $390, $3,804, $142, $5,291, $232, $2,109, $16,149 and $360 for Class A, Class AX, Class B, Class C, Class CX, Class R, Class RX, Class Y, Class R5 and Class R6 shares, respectively. |
| (f) | Commencement date of June 1, 2010 for Class AX, Class CX and Class RX shares and September 24, 2012 for Class R6 shares, respectively. |
| (g) | Annualized. |
52 Invesco Balanced-Risk Retirement Funds
Report of Independent Registered Public Accounting Firm
To the Board of Trustees of AIM Growth Series (Invesco Growth Series) and Shareholders of Invesco Balanced-Risk Retirement Now Fund, Invesco Balanced-Risk Retirement 2020 Fund, Invesco Balanced-Risk Retirement 2030 Fund, Invesco Balanced-Risk Retirement 2040 Fund and Invesco Balanced-Risk Retirement 2050 Fund:
In our opinion, the accompanying statements of assets and liabilities, including the schedules of investments, and the related statements of operations and of changes in net assets and the financial highlights present fairly, in all material respects, the financial position of Invesco Balanced-Risk Retirement Now Fund, Invesco Balanced-Risk Retirement 2020 Fund, Invesco Balanced-Risk Retirement 2030 Fund, Invesco Balanced-Risk Retirement 2040 Fund and Invesco Balanced-Risk Retirement 2050 Fund (five of the funds constituting AIM Growth Series (Invesco Growth Series), hereafter referred to as the “Funds”) at December 31, 2014, the results of each of their operations for the year then ended, the changes in each of their net assets for each of the two years in the period then ended and the financial highlights for each of the five years in the period then ended, in conformity with accounting principles generally accepted in the United States of America. These financial statements and financial highlights (hereafter referred to as “financial statements”) are the responsibility of the Funds’ management. Our responsibility is to express an opinion on these financial statements based on our audits. We conducted our audits of these financial statements in accordance with the standards of the Public Company Accounting Oversight Board (United States). Those standards require that we plan and perform the audit to obtain reasonable assurance about whether the financial statements are free of material misstatement. An audit includes examining, on a test basis, evidence supporting the amounts and disclosures in the financial statements, assessing the accounting principles used and significant estimates made by management, and evaluating the overall financial statement presentation. We believe that our audits, which included confirmation of securities at December 31, 2014 by correspondence with the custodian and transfer agent, provide a reasonable basis for our opinion.
PRICEWATERHOUSECOOPERS LLP
Houston, Texas
February 23, 2015
53 Invesco Balanced-Risk Retirement Funds
Calculating your ongoing Fund expenses
Example
As a shareholder of the Fund, you incur two types of costs: (1) transaction costs, which may include sales charges (loads) on purchase payments or contingent deferred sales charges on redemptions, if any; and (2) ongoing costs, including distribution and/or service (12b-1) fees, and other Fund expenses. This example is intended to help you understand your ongoing costs (in dollars) of investing in the Fund and to compare these costs with ongoing costs of investing in other mutual funds. The example is based on an investment of $1,000 invested at the beginning of the period and held for the entire period July 1, 2014, through December 31, 2014.
In addition to the fees and expenses which the Fund bears directly, the Fund indirectly bears a pro rata share of the fees and expenses of the underlying funds in which your Fund invests. The amount of fees and expenses incurred indirectly by your Fund will vary because the underlying funds have varied expenses and fee levels and the Fund may own different proportions of the underlying funds at different times. Estimated underlying fund expenses are not expenses that are incurred directly by your Fund. They are expenses that are incurred directly by the underlying funds and are deducted from the value of the underlying funds your Fund invests in. The effect of the estimated underlying fund expenses that you bear indirectly are included in your Fund’s total return.
Actual expenses
The table below provides information about actual account values and actual expenses. You may use the information in this table, together with the amount you invested, to estimate the expenses that you paid over the period. Simply divide your account value by $1,000 (for example, an $8,600 account value divided by $1,000 = 8.6), then multiply the result by the number in the table under the heading entitled “Actual Expenses Paid During Period” to estimate the expenses you paid on your account during this period.
Hypothetical example for comparison purposes
The table below also provides information about hypothetical account values and hypothetical expenses based on the Fund’s actual expense ratio and an assumed rate of return of 5% per year before expenses, which is not the Fund’s actual return.
The hypothetical account values and expenses may not be used to estimate the actual ending account balance or expenses you paid for the period. You may use this information to compare the ongoing costs of investing in the Fund and other funds. To do so, compare this 5% hypothetical example with the 5% hypothetical examples that appear in the shareholder reports of the other funds.
Please note that the expenses shown in the table are meant to highlight your ongoing costs only and do not reflect any transaction costs, such as sales charges (loads) on purchase payments or contingent deferred sales charges on redemptions, if any. Therefore, the hypothetical information is useful in comparing ongoing costs only, and will not help you determine the relative total costs of owning different funds. In addition, expenses shown in the table do not include the expenses of the underlying funds, which are borne indirectly by the Fund. If transaction costs and indirect expenses were included, your costs would have been higher.
Invesco Balanced-Risk Retirement Now Fund
| Class | Beginning Account Value (07/01/14) | ACTUAL | HYPOTHETICAL (5% annual return before expenses) | Annualized Expense Ratio | ||||||||||||||||||||
| Ending Account Value (12/31/14)1 | Expenses Paid During Period2 | Ending Account Value (12/31/14) | Expenses Paid During Period2 | |||||||||||||||||||||
A | $ | 1,000.00 | $ | 995.20 | $ | 1.26 | $ | 1,023.95 | $ | 1.28 | 0.25 | % | ||||||||||||
AX | 1,000.00 | 995.20 | 1.26 | 1,023.95 | 1.28 | 0.25 | ||||||||||||||||||
B | 1,000.00 | 991.50 | 5.02 | 1,020.16 | 5.09 | 1.00 | ||||||||||||||||||
C | 1,000.00 | 991.50 | 5.02 | 1,020.16 | 5.09 | 1.00 | ||||||||||||||||||
CX | 1,000.00 | 991.50 | 5.02 | 1,020.16 | 5.09 | 1.00 | ||||||||||||||||||
R | 1,000.00 | 993.30 | 2.51 | 1,022.68 | 2.55 | 0.50 | ||||||||||||||||||
RX | 1,000.00 | 994.40 | 2.51 | 1,022.68 | 2.55 | 0.50 | ||||||||||||||||||
Y | 1,000.00 | 997.20 | 0.00 | 1,025.21 | 0.00 | 0.00 | ||||||||||||||||||
R5 | 1,000.00 | 997.20 | 0.00 | 1,025.21 | 0.00 | 0.00 | ||||||||||||||||||
R6 | 1,000.00 | 997.20 | 0.00 | 1,025.21 | 0.00 | 0.00 | ||||||||||||||||||
54 Invesco Balanced-Risk Retirement Funds
Invesco Balanced-Risk Retirement 2020 Fund
| Class | Beginning Account Value (07/01/14) | ACTUAL | HYPOTHETICAL (5% annual return before expenses) | Annualized Expense Ratio | ||||||||||||||||||||
| Ending Account Value (12/31/14)1 | Expenses Paid During Period2 | Ending Account Value (12/31/14) | Expenses Paid During Period2 | |||||||||||||||||||||
A | $ | 1,000.00 | $ | 993.70 | $ | 1.26 | $ | 1,023.95 | $ | 1.28 | 0.25 | % | ||||||||||||
AX | 1,000.00 | 992.60 | 1.26 | 1,023.95 | 1.28 | 0.25 | ||||||||||||||||||
B | 1,000.00 | 989.80 | 5.02 | 1,020.16 | 5.09 | 1.00 | ||||||||||||||||||
C | 1,000.00 | 989.80 | 5.02 | 1,020.16 | 5.09 | 1.00 | ||||||||||||||||||
CX | 1,000.00 | 989.90 | 5.02 | 1,020.16 | 5.09 | 1.00 | ||||||||||||||||||
R | 1,000.00 | 993.00 | 2.51 | 1,022.68 | 2.55 | 0.50 | ||||||||||||||||||
RX | 1,000.00 | 993.00 | 2.51 | 1,022.68 | 2.55 | 0.50 | ||||||||||||||||||
Y | 1,000.00 | 994.30 | 0.00 | 1,025.21 | 0.00 | 0.00 | ||||||||||||||||||
R5 | 1,000.00 | 995.40 | 0.00 | 1,025.21 | 0.00 | 0.00 | ||||||||||||||||||
R6 | 1,000.00 | 994.40 | 0.00 | 1,025.21 | 0.00 | 0.00 | ||||||||||||||||||
Invesco Balanced-Risk Retirement 2030 Fund
| Class | Beginning Account Value (07/01/14) | ACTUAL | HYPOTHETICAL (5% annual return before expenses) | Annualized Expense Ratio | ||||||||||||||||||||
| Ending Account Value (12/31/14)1 | Expenses Paid During Period2 | Ending Account Value (12/31/14) | Expenses Paid During Period2 | |||||||||||||||||||||
A | $ | 1,000.00 | $ | 992.30 | $ | 1.26 | $ | 1,023.95 | $ | 1.28 | 0.25 | % | ||||||||||||
AX | 1,000.00 | 992.30 | 1.26 | 1,023.95 | 1.28 | 0.25 | ||||||||||||||||||
B | 1,000.00 | 988.80 | 5.01 | 1,020.16 | 5.09 | 1.00 | ||||||||||||||||||
C | 1,000.00 | 987.70 | 5.01 | 1,020.16 | 5.09 | 1.00 | ||||||||||||||||||
CX | 1,000.00 | 987.70 | 5.01 | 1,020.16 | 5.09 | 1.00 | ||||||||||||||||||
R | 1,000.00 | 990.70 | 2.51 | 1,022.68 | 2.55 | 0.50 | ||||||||||||||||||
RX | 1,000.00 | 989.60 | 2.51 | 1,022.68 | 2.55 | 0.50 | ||||||||||||||||||
Y | 1,000.00 | 992.80 | 0.00 | 1,025.21 | 0.00 | 0.00 | ||||||||||||||||||
R5 | 1,000.00 | 992.80 | 0.00 | 1,025.21 | 0.00 | 0.00 | ||||||||||||||||||
R6 | 1,000.00 | 992.80 | 0.00 | 1,025.21 | 0.00 | 0.00 | ||||||||||||||||||
Invesco Balanced-Risk Retirement 2040 Fund
| Class | Beginning Account Value (07/01/14) | ACTUAL | HYPOTHETICAL (5% annual return before expenses) | Annualized Expense Ratio | ||||||||||||||||||||
| Ending Account Value (12/31/14)1 | Expenses Paid During Period2 | Ending Account Value (12/31/14) | Expenses Paid During Period2 | |||||||||||||||||||||
A | $ | 1,000.00 | $ | 990.40 | $ | 1.25 | $ | 1,023.95 | $ | 1.28 | 0.25 | % | ||||||||||||
AX | 1,000.00 | 990.40 | 1.25 | 1,023.95 | 1.28 | 0.25 | ||||||||||||||||||
B | 1,000.00 | 986.20 | 5.01 | 1,020.16 | 5.09 | 1.00 | ||||||||||||||||||
C | 1,000.00 | 986.20 | 5.01 | 1,020.16 | 5.09 | 1.00 | ||||||||||||||||||
CX | 1,000.00 | 986.10 | 5.01 | 1,020.16 | 5.09 | 1.00 | ||||||||||||||||||
R | 1,000.00 | 988.90 | 2.51 | 1,022.68 | 2.55 | 0.50 | ||||||||||||||||||
RX | 1,000.00 | 989.00 | 2.51 | 1,022.68 | 2.55 | 0.50 | ||||||||||||||||||
Y | 1,000.00 | 991.90 | 0.00 | 1,025.21 | 0.00 | 0.00 | ||||||||||||||||||
R5 | 1,000.00 | 991.70 | 0.00 | 1,025.21 | 0.00 | 0.00 | ||||||||||||||||||
R6 | 1,000.00 | 991.70 | 0.00 | 1,025.21 | 0.00 | 0.00 | ||||||||||||||||||
55 Invesco Balanced-Risk Retirement Funds
Invesco Balanced-Risk Retirement 2050 Fund
| Class | Beginning Account Value (07/01/14) | ACTUAL | HYPOTHETICAL (5% annual return before expenses) | Annualized Expense Ratio | ||||||||||||||||||||
| Ending Account Value (12/31/14)1 | Expenses Paid During Period2 | Ending Account Value (12/31/14) | Expenses Paid During Period2 | |||||||||||||||||||||
A | $ | 1,000.00 | $ | 989.00 | $ | 1.25 | $ | 1,023.88 | $ | 1.27 | 0.25 | % | ||||||||||||
AX | 1,000.00 | 989.00 | 1.25 | 1,023.88 | 1.27 | 0.25 | ||||||||||||||||||
B | 1,000.00 | 985.50 | 4.99 | 1,020.11 | 5.08 | 1.00 | ||||||||||||||||||
C | 1,000.00 | 985.50 | 4.99 | 1,020.11 | 5.08 | 1.00 | ||||||||||||||||||
CX | 1,000.00 | 985.50 | 4.99 | 1,020.11 | 5.08 | 1.00 | ||||||||||||||||||
R | 1,000.00 | 987.80 | 2.50 | 1,022.62 | 2.54 | 0.50 | ||||||||||||||||||
RX | 1,000.00 | 987.80 | 2.50 | 1,022.62 | 2.54 | 0.50 | ||||||||||||||||||
Y | 1,000.00 | 991.60 | 0.00 | 1,025.14 | 0.00 | 0.00 | ||||||||||||||||||
R5 | 1,000.00 | 990.20 | 0.00 | 1,025.14 | 0.00 | 0.00 | ||||||||||||||||||
R6 | 1,000.00 | 990.20 | 0.00 | 1,025.14 | 0.00 | 0.00 | ||||||||||||||||||
| 1 | The actual ending account value is based on the actual total return of the Funds for the period July 1, 2014, through December 31, 2014, after actual expenses and will differ from the hypothetical ending account value which is based on each Fund’s expense ratio and a hypothetical annual return of 5% before expenses. |
| 2 | Expenses are equal to each Fund’s annualized expense ratio as indicated above multiplied by the average account value over the period, multiplied by 184/365 to reflect the most recent fiscal half year. |
56 Invesco Balanced-Risk Retirement Funds
Tax Information
Form 1099-DIV, Form 1042-S and other year—end tax information provide shareholders with actual calendar year amounts that should be included in their tax returns. Shareholders should consult their tax advisors.
The following distribution information is being provided as required by the Internal Revenue Code or to meet a specific state’s requirement.
The Funds designate the following amounts or, if subsequently determined to be different, the maximum amount allowable for its fiscal year ended December 31, 2014:
Federal and State Income Tax | ||||||||||||||||
| Long Term Capital Gain Distributions | Qualified Dividend Income* | Corporate Dividends Received Deduction* | U.S. Treasury Obligations* | |||||||||||||
Invesco Balanced-Risk Retirement Now Fund | $ | 996,790 | 0.00 | % | 0.00 | % | 16.49 | % | ||||||||
Invesco Balanced-Risk Retirement 2020 Fund | 3,548,325 | 0.00 | % | 0.00 | % | 16.47 | % | |||||||||
Invesco Balanced-Risk Retirement 2030 Fund | 4,231,942 | 0.00 | % | 0.00 | % | 12.81 | % | |||||||||
Invesco Balanced-Risk Retirement 2040 Fund | 2,650,618 | 0.00 | % | 0.00 | % | 6.95 | % | |||||||||
Invesco Balanced-Risk Retirement 2050 Fund | 1,397,454 | 0.00 | % | 0.00 | % | 2.38 | % | |||||||||
| * | The above percentages are based on ordinary income dividends paid to shareholders during the Fund’s fiscal year. |
57 Invesco Balanced-Risk Retirement Funds
Trustees and Officers
The address of each trustee and officer is AIM Growth Series (Invesco Growth Series) (the “Trust”), 11 Greenway Plaza, Suite 1000, Houston, Texas 77046-1173. The trustees serve for the life of the Trust, subject to their earlier death, incapacitation, resignation, retirement or removal as more specifically provided in the Trust’s organizational documents. Each officer serves for a one year term or until their successors are elected and qualified. Column two below includes length of time served with predecessor entities, if any.
Name, Year of Birth and Position(s) Held with the Trust | Trustee and/ or Officer Since | Principal Occupation(s) During Past 5 Years | Number of Funds in Fund Complex Overseen by Trustee | Other Directorship(s) Held by Trustee During | ||||
| Interested Persons | ||||||||
| Martin L. Flanagan1 — 1960 Trustee | 2007 | Executive Director, Chief Executive Officer and President, Invesco Ltd. (ultimate parent of Invesco and a global investment management firm); Advisor to the Board, Invesco Advisers, Inc. (formerly known as Invesco Institutional (N.A.), Inc.); Trustee, The Invesco Funds; Vice Chair, Investment Company Institute; and Member of Executive Board, SMU Cox School of Business
Formerly: Chairman and Chief Executive Officer, Invesco Advisers, Inc. (registered investment adviser); Director, Chairman, Chief Executive Officer and President, IVZ Inc. (holding company), INVESCO Group Services, Inc. (service provider) and Invesco North American Holdings, Inc. (holding company); Director, Chief Executive Officer and President, Invesco Holding Company Limited (parent of Invesco and a global investment management firm); Director, Invesco Ltd.; Chairman, Investment Company Institute and President, Co-Chief Executive Officer, Co-President, Chief Operating Officer and Chief Financial Officer, Franklin Resources, Inc. (global investment management organization). | 144 | None | ||||
Philip A. Taylor2 — 1954 Trustee, President and Principal Executive Officer | 2006 | Head of North American Retail and Senior Managing Director, Invesco Ltd.; Director, Co-Chairman, Co-President and Co-Chief Executive Officer, Invesco Advisers, Inc. (formerly known as Invesco Institutional (N.A.), Inc.) (registered investment adviser); Director, Chairman, Chief Executive Officer and President, Invesco Management Group, Inc. (formerly known as Invesco Aim Management Group, Inc.) (financial services holding company); Director and President, INVESCO Funds Group, Inc. (registered investment adviser and registered transfer agent); Director and Chairman, Invesco Investment Services, Inc. (formerly known as Invesco Aim Investment Services, Inc.) (registered transfer agent) and IVZ Distributors, Inc. (formerly known as INVESCO Distributors, Inc.) (registered broker dealer); Director, President and Chairman, Invesco Inc. (holding company) and Invesco Canada Holdings Inc. (holding company); Chief Executive Officer, Invesco Corporate Class Inc. (corporate mutual fund company) and Invesco Canada Fund Inc. (corporate mutual fund company); Director, Chairman and Chief Executive Officer, Invesco Canada Ltd. (formerly known as Invesco Trimark Ltd./Invesco Trimark Ltèe) (registered investment adviser and registered transfer agent); Trustee, President and Principal Executive Officer, The Invesco Funds (other than AIM Treasurer’s Series Trust (Invesco Treasurer’s Series Trust) and Short-Term Investments Trust); Trustee and Executive Vice President, The Invesco Funds (AIM Treasurer’s Series Trust (Invesco Treasurer’s Series Trust) and Short-Term Investments Trust only); Director, Invesco Investment Advisers LLC (formerly known as Van Kampen Asset Management); Director, Chief Executive Officer and President, Van Kampen Exchange Corp.
Formerly: Director and Chairman, Van Kampen Investor Services Inc.; Director, Chief Executive Officer and President, 1371 Preferred Inc. (holding company) and Van Kampen Investments Inc.; Director and President, AIM GP Canada Inc. (general partner for limited partnerships) and Van Kampen Advisors, Inc.; Director and Chief Executive Officer, Invesco Trimark Dealer Inc. (registered broker dealer); Director, Invesco Distributors, Inc. (formerly known as Invesco Aim Distributors, Inc.) (registered broker dealer); Manager, Invesco PowerShares Capital Management LLC; Director, Chief Executive Officer and President, Invesco Advisers, Inc.; Director, Chairman, Chief Executive Officer and President, Invesco Aim Capital Management, Inc.; President, Invesco Trimark Dealer Inc. and Invesco Trimark Ltd./Invesco Trimark Ltèe; Director and President, AIM Trimark Corporate Class Inc. and AIM Trimark Canada Fund Inc.; Senior Managing Director, Invesco Holding Company Limited; Director and Chairman, Fund Management Company (former registered broker dealer); President and Principal Executive Officer, The Invesco Funds (AIM Treasurer’s Series Trust (Invesco Treasurer’s Series Trust), and Short-Term Investments Trust only); President, AIM Trimark Global Fund Inc. and AIM Trimark Canada Fund Inc. | 144 | None | ||||
| Independent Trustees | ||||||||
Bruce L. Crockett — 1944 Trustee and Chair | 2001 | Chairman, Crockett Technologies Associates (technology consulting company)
Formerly: Director, Captaris (unified messaging provider); Director, President and Chief Executive Officer, COMSAT Corporation; Chairman, Board of Governors of INTELSAT (international communications company); ACE Limited (insurance company); and Investment Company Institute | 144 | ALPS (Attorneys Liability Protection Society) (insurance company) |
| 1 | Mr. Flanagan is considered an interested person (within the meaning of Section 2(a)(19) of the 1940 Act) of the Trust because he is an officer of the Adviser to the Trust, and an officer and a director of Invesco Ltd., ultimate parent of the Adviser. |
| 2 | Mr. Taylor is considered an interested person (within the meaning of Section 2(a)(19) of the 1940 Act) of the Trust because he is an officer and a director of the Adviser. |
T-1 Invesco Balanced-Risk Retirement Funds
Trustees and Officers—(continued)
Name, Year of Birth and Position(s) Held with the Trust | Trustee and/ or Officer Since | Principal Occupation(s) During Past 5 Years | Number of Funds in Fund Complex Overseen by Trustee | Other Directorship(s) Held by Trustee During | ||||
| Independent Trustees—(continued) | ||||||||
David C. Arch — 1945 Trustee | 2010 | Chairman of Blistex Inc., a consumer health care products manufacturer | 144 | Board member of the Illinois Manufacturers’ Association; Member of the Board of Visitors, Institute for the Humanities, University of Michigan; Member of the Audit Committee of the Edward-Elmhurst Hospital | ||||
James T. Bunch — 1942 Trustee | 2003 | Managing Member, Grumman Hill Group LLC (family office private equity investments)
Formerly: Founder, Green Manning & Bunch Ltd. (investment banking firm) (1988-2010); Executive Committee, United States Golf Association; and Director, Policy Studies, Inc. and Van Gilder Insurance Corporation | 144 | Chairman, Board of Governors, Western Golf Association; Chairman, Evans Scholars Foundation; and Director, Denver Film Society | ||||
Rodney F. Dammeyer — 1940 Trustee | 2010 | Chairman of CAC, LLC, (private company offering capital investment and management advisory services)
Formerly: Prior to 2001, Managing Partner at Equity Group Corporate Investments; Prior to 1995, Chief Executive Officer of Itel Corporation (formerly Anixter International); Prior to 1985, experience includes Senior Vice President and Chief Financial Officer of Household International, Inc., Executive Vice President and Chief Financial Officer of Northwest Industries, Inc. and Partner of Arthur Andersen & Co.; From 1987 to 2010, Director/Trustee of investment companies in the Van Kampen Funds complex | 144 | Director of Quidel Corporation and Stericycle, Inc. | ||||
Albert R. Dowden — 1941 Trustee | 2001 | Director of a number of public and private business corporations, including the Boss Group, Ltd. (private investment and management); Nature’s Sunshine Products, Inc. and Reich & Tang Funds (5 portfolios) (registered investment company)
Formerly: Director, Homeowners of America Holding Corporation/Homeowners of America Insurance Company (property casualty company); Director, Continental Energy Services, LLC (oil and gas pipeline service); Director, CompuDyne Corporation (provider of product and services to the public security market) and Director, Annuity and Life Re (Holdings), Ltd. (reinsurance company); Director, President and Chief Executive Officer, Volvo Group North America, Inc.; Senior Vice President, AB Volvo; Director of various public and private corporations; Chairman, DHJ Media, Inc.; Director, Magellan Insurance Company; and Director, The Hertz Corporation, Genmar Corporation (boat manufacturer), National Media Corporation; Advisory Board of Rotary Power International (designer, manufacturer, and seller of rotary power engines); and Chairman, Cortland Trust, Inc. (registered investment company) | 144 | Director of: Nature’s Sunshine Products, Inc., Reich & Tang Funds, Homeowners of America Holding Corporation/ Homeowners of America Insurance Company, the Boss Group | ||||
Jack M. Fields — 1952 Trustee | 2001 | Chief Executive Officer, Twenty First Century Group, Inc. (government affairs company); Owner and Chief Executive Officer, Dos Angeles Ranch, L.P. (cattle, hunting, corporate entertainment); and Discovery Global Education Fund (non-profit)
Formerly: Chief Executive Officer, Texana Timber LP (sustainable forestry company); Director of Cross Timbers Quail Research Ranch (non-profit); and member of the U.S. House of Representatives | 144 | Insperity, Inc. (formerly known as Administaff) | ||||
Prema Mathai-Davis — 1950 Trustee | 2001 | Retired. Formerly: Chief Executive Officer, YWCA of the U.S.A. | 144 | None | ||||
Larry Soll — 1942 Trustee | 2003 | Retired. Formerly: Chairman, Chief Executive Officer and President, Synergen Corp. (a biotechnology company) | 144 | None | ||||
Hugo F. Sonnenschein — 1940 Trustee | 2010 | President Emeritus and Honorary Trustee of the University of Chicago and the Adam Smith Distinguished Service Professor in the Department of Economics at the University of Chicago. Prior to 2000, President of the University of Chicago | 144 | Trustee of the University of Rochester and a member of its investment committee; Member of the National Academy of Sciences and the American Philosophical Society; Fellow of the American Academy of Arts and Sciences | ||||
Raymond Stickel, Jr. — 1944 Trustee | 2005 | Retired. Formerly: Director, Mainstay VP Series Funds, Inc. (25 portfolios) and Partner, Deloitte & Touche | 144 | None | ||||
T-2 Invesco Balanced-Risk Retirement Funds
Trustees and Officers—(continued)
Name, Year of Birth and Position(s) Held with the Trust | Trustee and/ or Officer Since | Principal Occupation(s) During Past 5 Years | Number of Funds in Fund Complex Overseen by Trustee | Other Directorship(s) Held by Trustee During | ||||
| Independent Trustees—(continued) | ||||||||
Suzanne H. Woolsey — 1941 Trustee | 2014 | Chief Executive Officer of Woolsey Partners LLC | 144 | Emeritus Chair of the Board of Trustees of the Institute for Defense Analyses; Trustee of Colorado College; Trustee of California Institute of Technology; Prior to 2014, Director of Fluor Corp.; Prior to 2010, Trustee of the German Marshall Fund of the United States; Prior to 2010 Trustee of the Rocky Mountain Institute | ||||
| Other Officers | ||||||||
Russell C. Burk — 1958 Senior Vice President and Senior Officer | 2005 | Senior Vice President and Senior Officer, The Invesco Funds | N/A | N/A | ||||
John M. Zerr — 1962 Senior Vice President, Chief Legal Officer and Secretary | 2006 | Director, Senior Vice President, Secretary and General Counsel, Invesco Management Group, Inc. (formerly known as Invesco Aim Management Group, Inc.) and Van Kampen Exchange Corp.; Senior Vice President, Invesco Advisers, Inc. (formerly known as Invesco Institutional (N.A.), Inc.) (registered investment adviser); Senior Vice President and Secretary, Invesco Distributors, Inc. (formerly known as Invesco Aim Distributors, Inc.); Director, Vice President and Secretary, Invesco Investment Services, Inc. (formerly known as Invesco Aim Investment Services, Inc.) and IVZ Distributors, Inc. (formerly known as INVESCO Distributors, Inc.); Director and Vice President, INVESCO Funds Group, Inc.; Senior Vice President, Chief Legal Officer and Secretary, The Invesco Funds; Manager, Invesco PowerShares Capital Management LLC; Director, Secretary and General Counsel, Invesco Investment Advisers LLC (formerly known as Van Kampen Asset Management); Secretary and General Counsel, Invesco Capital Markets, Inc. (formerly known as Van Kampen Funds Inc.) and Chief Legal Officer, PowerShares Exchange-Traded Fund Trust, PowerShares Exchange-Traded Fund Trust II, PowerShares India Exchange-Traded Fund Trust , PowerShares Actively Managed Exchange-Traded Fund Trust; and PowerShares Actively Managed Exchange-Traded Commodity Fund Trust
Formerly: Director and Vice President, Van Kampen Advisors Inc.; Director, Vice President, Secretary and General Counsel, Van Kampen Investor Services Inc.; Director, Invesco Distributors, Inc. (formerly known as Invesco Aim Distributors, Inc.); Director, Senior Vice President, General Counsel and Secretary, Invesco Aim Advisers, Inc. and Van Kampen Investments Inc.; Director, Vice President and Secretary, Fund Management Company; Director, Senior Vice President, Secretary, General Counsel and Vice President, Invesco Aim Capital Management, Inc.; Chief Operating Officer and General Counsel, Liberty Ridge Capital, Inc. (an investment adviser); Vice President and Secretary, PBHG Funds (an investment company) and PBHG Insurance Series Fund (an investment company); Chief Operating Officer, General Counsel and Secretary, Old Mutual Investment Partners (a broker-dealer); General Counsel and Secretary, Old Mutual Fund Services (an administrator) and Old Mutual Shareholder Services (a shareholder servicing center); Executive Vice President, General Counsel and Secretary, Old Mutual Capital, Inc. (an investment adviser); and Vice President and Secretary, Old Mutual Advisors Funds (an investment company) | N/A | N/A | ||||
Sheri Morris — 1964 Vice President, Treasurer and Principal Financial Officer | 1999 | Vice President, Treasurer and Principal Financial Officer, The Invesco Funds; Vice President, Invesco Advisers, Inc. (formerly known as Invesco Institutional (N.A.), Inc.) (registered investment adviser); and Vice President, PowerShares Exchange-Traded Fund Trust, PowerShares Exchange-Traded Fund Trust II, PowerShares India Exchange-Traded Fund Trust, PowerShares Actively Managed Exchange-Traded Fund Trust, and PowerShares Actively Managed Exchange-Traded Commodity Fund Trust
Formerly: Vice President, Invesco Aim Advisers, Inc., Invesco Aim Capital Management, Inc. and Invesco Aim Private Asset Management, Inc.; Assistant Vice President and Assistant Treasurer, The Invesco Funds and Assistant Vice President, Invesco Advisers, Inc., Invesco Aim Capital Management, Inc. and Invesco Aim Private Asset Management, Inc.; and Treasurer, PowerShares Exchange-Traded Fund Trust, PowerShares Exchange-Traded Fund Trust II, PowerShares India Exchange-Traded Fund Trust and PowerShares Actively Managed Exchange-Traded Fund Trust | N/A | N/A | ||||
T-3 Invesco Balanced-Risk Retirement Funds
Trustees and Officers—(continued)
Name, Year of Birth and Position(s) Held with the Trust | Trustee and/ or Officer Since | Principal Occupation(s) During Past 5 Years | Number of Funds in Fund Complex Overseen by Trustee | Other Directorship(s) Held by Trustee During | ||||
| Other Officers—(continued) | ||||||||
Karen Dunn Kelley — 1960 Vice President | 2004 | Senior Managing Director, Investments; Director, Co-President, Co-Chief Executive Officer, and Co-Chairman, Invesco Advisers, Inc. (formerly known as Invesco Institutional (N.A.), Inc.) (registered investment adviser); Chairman, Invesco Senior Secured Management, Inc.; Senior Vice President, Invesco Management Group, Inc. (formerly known as Invesco Aim Management Group, Inc.); Executive Vice President, Invesco Distributors, Inc. (formerly known as Invesco Aim Distributors, Inc.); Director, Invesco Mortgage Capital Inc. and Invesco Management Company Limited; Director and President, INVESCO Asset Management (Bermuda) Ltd., Vice President, The Invesco Funds (other than AIM Treasurer’s Series Trust (Invesco Treasurer’s Series Trust) and Short-Term Investments Trust); and President and Principal Executive Officer, The Invesco Funds (AIM Treasurer’s Series Trust (Invesco Treasurer’s Series Trust) and Short-Term Investments Trust only)
Formerly: Director, INVESCO Global Asset Management Limited and INVESCO Management S.A.; Senior Vice President, Van Kampen Investments Inc. and Invesco Advisers, Inc. (formerly known as Invesco Institutional (N.A.), Inc.) (registered investment adviser); Vice President, Invesco Advisers, Inc. (formerly known as Invesco Institutional (N.A.), Inc.); Director of Cash Management and Senior Vice President, Invesco Advisers, Inc. and Invesco Aim Capital Management, Inc.; Director and President, Fund Management Company; Chief Cash Management Officer, Director of Cash Management, Senior Vice President, and Managing Director, Invesco Aim Capital Management, Inc.; Director of Cash Management, Senior Vice President, and Vice President, Invesco Advisers, Inc. and The Invesco Funds (AIM Treasurer’s Series Trust (Invesco Treasurer’s Series Trust), and Short-Term Investments Trust only) | N/A | N/A | ||||
Crissie M. Wisdom — 1969 Anti-Money Laundering Compliance Officer | 2013 | Anti-Money Laundering Compliance Officer, Invesco Advisers, Inc. (formerly known as Invesco Institutional (N.A.), Inc.) (registered investment adviser), Invesco Capital Markets, Inc. (formerly known as Van Kampen Funds Inc.), Invesco Distributors, Inc., Invesco Investment Services, Inc., Invesco Management Group, Inc., Van Kampen Exchange Corp., The Invesco Funds, and PowerShares Exchange-Traded Fund Trust, PowerShares Exchange-Traded Fund Trust II, PowerShares India Exchange-Traded Fund Trust, PowerShares Actively Managed Exchange-Traded Fund Trust and PowerShares Actively Managed Exchange-Traded Commodity Fund Trust; and Fraud Prevention Manager and Controls and Risk Analysis Manager for Invesco Investment Services, Inc. | N/A | N/A | ||||
Todd L. Spillane — 1958 Chief Compliance Officer | 2006 | Senior Vice President, Invesco Management Group, Inc. (formerly known as Invesco Aim Management Group, Inc.) and Van Kampen Exchange Corp.; Senior Vice President and Chief Compliance Officer, Invesco Advisers, Inc. (registered investment adviser) (formerly known as Invesco Institutional (N.A.), Inc.); Chief Compliance Officer, The Invesco Funds; Vice President, Invesco Distributors, Inc. (formerly known as Invesco Aim Distributors, Inc.) and Invesco Investment Services, Inc. (formerly known as Invesco Aim Investment Services, Inc.)
Formerly: Chief Compliance Officer, Invesco Funds (Chicago); Senior Vice President, Van Kampen Investments Inc.; Senior Vice President and Chief Compliance Officer, Invesco Aim Advisers, Inc. and Invesco Aim Capital Management, Inc.; Chief Compliance Officer, INVESCO Private Capital Investments, Inc. (holding company), Invesco Private Capital, Inc. (registered investment adviser), Invesco Global Asset Management (N.A.), Inc., Invesco Senior Secured Management, Inc. (registered investment adviser), Van Kampen Investor Services Inc., PowerShares Exchange-Traded Fund Trust, PowerShares Exchange-Traded Fund Trust II, PowerShares India Exchange-Traded Fund Trust and PowerShares Actively Managed Exchange-Traded Fund Trust; and Vice President, Invesco Aim Capital Management, Inc. and Fund Management Company | N/A | N/A |
The Statement of Additional Information of the Trust includes additional information about the Fund’s Trustees and is available upon request, without charge, by calling 1.800.959.4246. Please refer to the Fund’s prospectus for information on the Fund’s sub-advisers.
Office of the Fund 11 Greenway Plaza, Suite 1000 Houston, TX 77046-1173 | Investment Adviser Invesco Advisers, Inc. 1555 Peachtree Street, N.E. Atlanta, GA 30309 | Distributor Invesco Distributors, Inc. 11 Greenway Plaza, Suite 1000 Houston, TX 77046-1173 | Auditors PricewaterhouseCoopers LLP 1000 Louisiana Street, Suite 5800 Houston, TX 77002-5678 | |||
Counsel to the Fund Stradley Ronon Stevens & Young, LLP 2005 Market Street, Suite 2600 Philadelphia, PA 19103-7018 | Counsel to the Independent Trustees Goodwin Procter LLP 901 New York Avenue, N.W. Washington, D.C. 20001 | Transfer Agent Invesco Investment Services, Inc. 11 Greenway Plaza, Suite 1000 Houston, TX 77046-1173 | Custodian State Street Bank and Trust Company 225 Franklin Street Boston, MA 02110-2801 | |||
T-4 Invesco Balanced-Risk Retirement Funds

Invesco mailing information
Send general correspondence to Invesco Investment Services, Inc., P.O. Box 219078, Kansas City, MO 64121-9078.
Important notice regarding delivery of security holder documents
To reduce Fund expenses, only one copy of most shareholder documents may be mailed to shareholders with multiple accounts at the same address (Householding). Mailing of your shareholder documents may be householded indefinitely unless you instruct us otherwise. If you do not want the mailing of these documents to be combined with those for other members of your household, please contact Invesco Investment Services, Inc. at 800 959 4246 or contact your financial institution. We will begin sending you individual copies for each account within 30 days after receiving your request.
Fund holdings and proxy voting information
The Fund provides a complete list of its holdings four times in each fiscal year, at the quarter ends. For the second and fourth quarters, the lists appear in the Fund’s semiannual and annual reports to shareholders. For the first and third quarters, the Fund files the lists with the Securities and Exchange Commission (SEC) on Form N-Q. The most recent list of portfolio holdings is available at invesco.com/completeqtrholdings. Shareholders can also look up the Fund’s Forms N-Q on the SEC website at sec.gov. Copies of the Fund’s Forms N-Q may be reviewed and copied at the SEC Public Reference Room in Washington, D.C. You can obtain information on the operation of the Public Reference Room, including information about duplicating fee charges, by calling 202 551 8090 or 800 732 0330, or by electronic request at the following email address: publicinfo@sec.gov. The SEC file numbers for the Fund are shown below.
A description of the policies and procedures that the Fund uses to determine how to vote proxies relating to portfolio securities is available without charge, upon request, from our Client Services department at 800 959 4246 or at invesco.com/proxyguidelines. The information is also available on the SEC website, sec.gov.
Information regarding how the Fund voted proxies related to its portfolio securities during the most recent 12-month period ended June 30 is available at invesco.com/proxysearch. The information is also available on the SEC website, sec.gov. |  | |
Invesco Advisers, Inc. is an investment adviser; it provides investment advisory services to individual and institutional clients and does not sell securities. Invesco Distributors, Inc. is the US distributor for Invesco Ltd.’s retail mutual funds, exchange-traded funds and institutional money market funds. Both are wholly owned, indirect subsidiaries of Invesco Ltd. |
| SEC file numbers: 811-02699 and 002-57526 | IBRR-AR-1 | Invesco Distributors, Inc. |
| ||||
 | Annual Report to Shareholders
| December 31, 2014 | ||
| ||||
Invesco Allocation Funds Invesco Conservative Allocation Fund Invesco Growth Allocation Fund Invesco Moderate Allocation Fund | ||||

Invesco Conservative Allocation Fund’s Long-Term Performance
Results of a $10,000 Investment – Oldest Share Class(es) since Inception
Fund and index data from 4/29/05
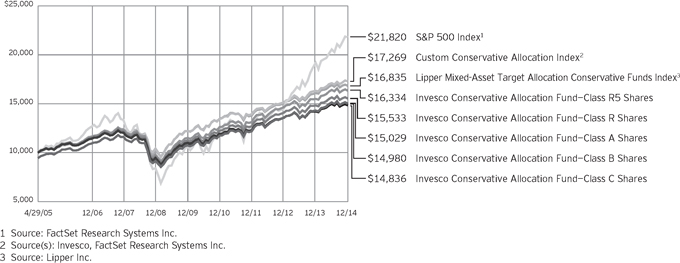
Past performance cannot guarantee comparable future results.
The data shown in the chart include reinvested distributions, applicable sales charges and Fund expenses including management fees. Results for Class B shares are calculated as if a hypothetical shareholder had liquidated his entire investment in the Fund at the close of the reporting period and paid the contingent deferred sales charges, if applicable.
Index results include reinvested dividends, but they do not reflect sales charges. Performance of the peer group, if applicable, reflects fund expenses and management fees; performance of a market index does not. Performance shown in the chart and table(s) does not reflect deduction of taxes a shareholder would pay on Fund distributions or sale of Fund shares.
2 Invesco Allocation Funds
Average Annual Total Returns | |||||
| As of 12/31/14, including maximum applicable sales charges | |||||
| Class A Shares | |||||
| Inception (4/29/05) | 4.30 | % | |||
5 Years | 5.76 | ||||
1 Year | –0.73 | ||||
| Class B Shares | |||||
| Inception (4/29/05) | 4.27 | % | |||
5 Years | 5.85 | ||||
1 Year | –0.66 | ||||
| Class C Shares | |||||
| Inception (4/29/05) | 4.16 | % | |||
5 Years | 6.16 | ||||
1 Year | 3.34 | ||||
| Class R Shares | |||||
| Inception (4/29/05) | 4.66 | % | |||
5 Years | 6.68 | ||||
1 Year | 4.75 | ||||
| Class S Shares | |||||
| Inception | 4.96 | % | |||
5 Years | 7.05 | ||||
1 Year | 5.20 | ||||
| Class Y Shares | |||||
| Inception | 5.06 | % | |||
5 Years | 7.18 | ||||
1 Year | 5.28 | ||||
| Class R5 Shares | |||||
| Inception (4/29/05) | 5.20 | % | |||
5 Years | 7.26 | ||||
1 Year | 5.41 | ||||
Class S shares incepted on June 3, 2011. Performance shown prior to that date is that of Class A shares and includes the 12b-1 fees applicable to Class A shares. Class A share performance reflects any applicable fee waivers or expense reimbursements.
Class Y shares incepted on October 3, 2008. Performance shown prior to that date is that of Class A shares and includes the 12b-1 fees applicable to Class A shares. Class A share performance reflects any applicable fee waivers or expense reimbursements.
The performance data quoted represent past performance and cannot guarantee comparable future results; current performance may be lower or higher. Please visit invesco.com/performance for the most recent month-end performance. Performance figures reflect reinvested distributions, changes in net asset value and the effect of the maximum sales charge unless otherwise stated.
Investment return and principal value will fluctuate so that you may have a gain or loss when you sell shares.
The total annual Fund operating expense ratio set forth in the most recent Fund prospectus as of the date of this report for Class A, Class B, Class C, Class R, Class S, Class Y and Class R5 shares was 1.10%, 1.85%, 1.85%, 1.35%, 1.00%, 0.85% and 0.80%, respectively.1 The expense ratios presented above may vary from the expense ratios presented in other sections of this report that are based on expenses incurred during the period covered by this report.
Class A share performance reflects the maximum 5.50% sales charge, and Class B and Class C share performance reflects the applicable contingent deferred sales charge (CDSC) for the period involved. The CDSC on Class B shares declines from 5% beginning at the time of purchase to 0% at the beginning of the seventh year. The CDSC on Class C shares is 1% for the first year after purchase. Class R, Class S, Class Y and Class R5 shares do not have a front-end sales charge or a CDSC; therefore, performance is at net asset value.
The performance of the Fund’s share classes will differ primarily due to different sales charge structures and class expenses.
Had the adviser not waived fees and/or reimbursed expenses in the past, performance would have been lower.
| 1 | The expense ratio includes acquired fund fees and expenses of the underlying funds in which the Fund invests of 0.60% for Invesco Conservative Allocation Fund. |
3 Invesco Allocation Funds
Invesco Growth Allocation Fund’s Long-Term Performance
Results of a $10,000 Investment – Oldest Share Class(es)
Fund and index data from 12/31/04
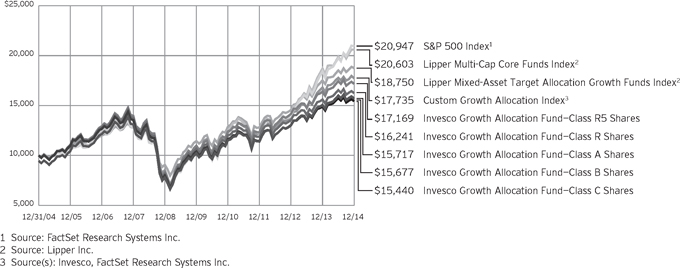
Past performance cannot guarantee comparable future results.
During the reporting period, the Fund has elected to use the Lipper Mixed-Asset Target Allocation Growth Funds Index to represent its peer group benchmark rather than the Lipper Multi-Cap Core Funds Index because the Lipper Mixed-Asset Target Allocation Growth Funds Index more closely reflects the performance of the types of securities in which the Fund invests.
The data shown in the chart include reinvested distributions, applicable sales charges and Fund expenses including management fees. Results for Class B shares are calculated as if a hypothetical shareholder had liquidated his entire investment in the Fund at the close of the reporting period and paid the contingent deferred sales charges, if applicable. Index results include reinvested dividends, but they do not reflect sales charges. Performance of the peer group,
if applicable, reflects fund expenses and management fees; performance of a market index does not. Performance shown in the chart and table(s) does not reflect deduction of taxes a shareholder would pay on Fund distributions or sale of Fund shares.
4 Invesco Allocation Funds
Average Annual Total Returns | |||||
| As of 12/31/14, including maximum applicable sales charges | |||||
| Class A Shares | |||||
| Inception (4/30/04) | 5.55 | % | |||
| 10 Years | 4.63 | ||||
| 5 Years | 7.82 | ||||
| 1 Year | –1.38 | ||||
| Class B Shares | |||||
| Inception (4/30/04) | 5.53 | % | |||
| 10 Years | 4.60 | ||||
| 5 Years | 7.90 | ||||
| 1 Year | –1.44 | ||||
| Class C Shares | |||||
| Inception (4/30/04) | 5.32 | % | |||
| 10 Years | 4.44 | ||||
| 5 Years | 8.21 | ||||
| 1 Year | 2.56 | ||||
| Class R Shares | |||||
| Inception (4/30/04) | 5.85 | % | |||
| 10 Years | 4.97 | ||||
| 5 Years | 8.76 | ||||
| 1 Year | 4.09 | ||||
| Class S Shares | |||||
| 10 Years | 5.27 | % | |||
| 5 Years | 9.13 | ||||
| 1 Year | 4.38 | ||||
| Class Y Shares | |||||
| 10 Years | 5.38 | % | |||
| 5 Years | 9.30 | ||||
| 1 Year | 4.63 | ||||
| Class R5 Shares | |||||
| Inception (4/30/04) | 6.45 | % | |||
| 10 Years | 5.55 | ||||
| 5 Years | 9.38 | ||||
| 1 Year | 4.71 | ||||
Class S shares incepted on September 25, 2009. Performance shown prior to that date is that of Class A shares and includes the 12b-1 fees applicable to Class A shares. Class A share performance reflects any applicable fee waivers or expense reimbursements.
Class Y shares incepted on October 3, 2008. Performance shown prior to that date is that of Class A shares and includes the 12b-1 fees applicable to Class A shares. Class A share performance reflects any applicable fee waivers or expense reimbursements.
The performance data quoted represent past performance and cannot guarantee comparable future results; current performance may be lower or higher. Please visit invesco.com/performance for the most recent month-end performance. Performance figures reflect reinvested distributions, changes in net asset value and the effect of the maximum sales charge unless otherwise stated. Investment return and principal value will fluctuate so that you may have a gain or loss when you sell shares.
The total annual Fund operating expense ratio set forth in the most recent Fund prospectus as of the date of this report for Class A, Class B, Class C, Class R, Class S, Class Y and Class R5 shares was 1.25%, 2.00%, 2.00%, 1.50%, 1.15%, 1.00% and 0.90%, respectively.1 The expense ratios presented above may vary from the expense ratios presented in other sections of this report that are based on expenses incurred during the period covered by this report.
Class A share performance reflects the maximum 5.50% sales charge, and Class B and Class C share performance reflects the applicable contingent deferred sales charge (CDSC) for the period involved. The CDSC on Class B shares declines from 5% beginning at the time of purchase to 0% at the beginning of the seventh year. The CDSC on Class C shares is 1% for the first year after purchase. Class R, Class S, Class Y and Class R5 shares do not have a front-end sales charge or a CDSC; therefore, performance is at net asset value.
The performance of the Fund’s share classes will differ primarily due to different sales charge structures and class expenses.
Had the adviser not waived fees and/or reimbursed expenses on the Fund’s Class A, Class B, Class C, Class R, Class S and Class Y shares in the past, performance would have been lower.
| 1 | The expense ratio includes acquired fund fees and expenses of the underlying funds in which the Fund invests of 0.74% for Invesco Growth Allocation Fund. |
5 Invesco Allocation Funds
Invesco Moderate Allocation Fund’s Long-Term Performance
Results of a $10,000 Investment – Oldest Share Class(es)
Fund and index data from 12/31/04
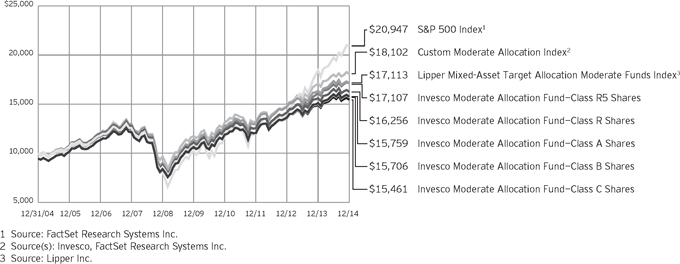
Past performance cannot guarantee comparable future results.
The data shown in the chart include reinvested distributions, applicable sales charges and Fund expenses including management fees. Results for Class B shares are calculated as if a hypothetical shareholder had liquidated his entire investment in the Fund at the close of the reporting period and paid the contingent deferred sales charges, if applicable.
Index results include reinvested dividends, but they do not reflect sales charges. Performance of the peer group, if applicable, reflects fund expenses and management fees; performance of a market index does not. Performance shown in the chart and table(s) does not reflect deduction of taxes a shareholder would pay on Fund distributions or sale of Fund shares.
6 Invesco Allocation Funds
Average Annual Total Returns | |||||
| As of 12/31/14, including maximum applicable sales charges | |||||
| Class A Shares | |||||
| Inception (4/30/04) | 5.28 | % | |||
| 10 Years | 4.65 | ||||
| 5 Years | 6.98 | ||||
| 1 Year | –1.38 | ||||
| Class B Shares | |||||
| Inception (4/30/04) | 5.25 | % | |||
| 10 Years | 4.62 | ||||
| 5 Years | 7.11 | ||||
| 1 Year | –1.38 | ||||
| Class C Shares | |||||
| Inception (4/30/04) | 5.05 | % | |||
| 10 Years | 4.45 | ||||
| 5 Years | 7.39 | ||||
| 1 Year | 2.62 | ||||
| Class R Shares | |||||
| Inception (4/30/04) | 5.58 | % | |||
| 10 Years | 4.98 | ||||
| 5 Years | 7.93 | ||||
| 1 Year | 4.13 | ||||
| Class S Shares | |||||
| 10 Years | 5.29 | % | |||
| 5 Years | 8.31 | ||||
| 1 Year | 4.58 | ||||
| Class Y Shares | |||||
| 10 Years | 5.41 | % | |||
| 5 Years | 8.49 | ||||
| 1 Year | 4.74 | ||||
| Class R5 Shares | |||||
| Inception (4/30/04) | 6.12 | % | |||
| 10 Years | 5.52 | ||||
| 5 Years | 8.46 | ||||
| 1 Year | 4.71 | ||||
Class S shares incepted on September 25, 2009. Performance shown prior to that date is that of Class A shares and includes the 12b-1 fees applicable to Class A shares. Class A share performance reflects any applicable fee waivers or expense reimbursements.
Class Y shares incepted on October 3, 2008. Performance shown prior to that date is that of Class A shares and includes the 12b-1 fees applicable to Class A shares. Class A share performance reflects any applicable fee waivers or expense reimbursements.
The performance data quoted represent past performance and cannot guarantee comparable future results; current performance may be lower or higher. Please visit invesco.com/performance for the most recent month-end performance. Performance figures reflect reinvested distributions, changes in net asset value and the effect of the maximum sales charge unless otherwise stated. Investment return and principal value will fluctuate so that you may have a gain or loss when you sell shares.
The total annual Fund operating expense ratio set forth in the most recent Fund prospectus as of the date of this report for Class A, Class B, Class C, Class R, Class S, Class Y and Class R5 shares was 1.15%, 1.90%, 1.90%, 1.40%, 1.05%, 0.90% and 0.86%, respectively.1 The expense ratios presented above may vary from the expense ratios presented in other sections of this report that are based on expenses incurred during the period covered by this report.
Class A share performance reflects the maximum 5.50% sales charge, and Class B and Class C share performance reflects the applicable contingent deferred sales charge (CDSC) for the period involved. The CDSC on Class B shares declines from 5% beginning at the time of purchase to 0% at the beginning of the seventh year. The CDSC on Class C shares is 1% for the first year after purchase. Class R, Class S, Class Y and Class R5 shares do not have a front-end sales charge or a CDSC; therefore, performance is at net asset value.
The performance of the Fund’s share classes will differ primarily due to different sales charge structures and class expenses.
Had the adviser not waived fees and/ or reimbursed expenses on the Fund’s Class A, Class B, Class C, Class R, Class S and Class Y shares in the past, performance would have been lower
| 1 | The expense ratio includes acquired fund fees and expenses of the underlying funds in which the Fund invests of 0.69% for Invesco Moderate Allocation Fund. |
7 Invesco Allocation Funds
Letters to Shareholders
Philip Taylor | Dear Shareholders: This annual report includes information about your Fund, including performance data and a complete list of its investments as of the close of the reporting period. Inside, your Fund’s portfolio managers discuss how they managed your Fund and the factors that affected its performance during the reporting period. I hope you find this report of interest. During the reporting period, the US economy showed unmistakable signs of improvement. After contracting in the first quarter of 2014, the economy expanded strongly in the second and third quarters as employment data improved markedly. Given continuing positive economic trends, the US Federal Reserve (the Fed) ended its extraordinary asset purchase program in October – but it pledged in December to be “patient” before raising interest rates. Overseas, the story was much different. Concerns about economic stagnation and the potential for deflation depressed European |

markets, while the Chinese economy was hurt by a slowdown in manufacturing.
Political change in Washington, DC; changes to monetary policy by the Fed and other central banks; the future direction of oil prices; and unexpected geopolitical events are likely to affect markets in the US and overseas in 2015. This may make some investors hesitant to begin to save for their long-term financial goals. That’s why Invesco has always encouraged investors to work with a professional financial adviser who can stress the importance of starting to save and invest early and the importance of adhering to a disciplined investment plan – when times are good and when they’re uncertain. A financial adviser who knows your unique financial situation, investment goals and risk tolerance can be an invaluable partner as you seek to achieve your financial goals. He or she can offer a long-term perspective when markets are volatile and time-tested advice and guidance when your financial situation or investment goals change.
Timely information when and where you want it
Invesco’s efforts to help investors achieve their financial objectives include providing individual investors and financial professionals with timely information about the markets, the economy and investing – whenever and wherever they want it.
Our website, invesco.com/us, offers a wide range of market insights and investment perspectives. On the website, you’ll find detailed information about our funds, including prices, performance, holdings and portfolio manager commentaries. You can access information about your individual Invesco account whenever it’s convenient for you; just complete a simple, secure online registration. Use the “Log In” box on our home page to get started.
Invesco’s mobile apps for iPhone® and iPad® (both available free from the App StoreSM) allow you to obtain the same detailed information, monitor your account and create customizable watch lists. Also, they allow you to access investment insights from our investment leaders, market strategists, economists and retirement experts. You can sign up to be alerted when new commentary is added, and you can watch portfolio manager videos and have instant access to Invesco news and updates wherever you may be.
In addition to the resources accessible on our website and through our mobile app, you can obtain timely updates to help you stay informed about the markets, the economy and investing by connecting with Invesco on Twitter, LinkedIn or Facebook. You can access our blog at blog.invesco.us.com. Our goal is to provide you the information you want, when and where you want it.
Have questions?
For questions about your account, feel free to contact an Invesco client services representative at 800 959 4246. For Invesco-related questions or comments, please email me directly at phil@invesco.com.
All of us at Invesco look forward to serving your investment management needs for many years to come. Thank you for investing with us.
Sincerely,

Philip Taylor
Senior Managing Director, Invesco Ltd.
iPhone and iPad are trademarks of Apple Inc., registered in the US and other countries. App Store is a service mark of Apple Inc. Invesco Distributors, Inc. is not affiliated with Apple Inc.
8 Invesco Allocation Funds
Bruce Crockett | Dear Fellow Shareholders: Among the many important lessons I’ve learned in more than 40 years in a variety of business endeavors is the value of a trusted advocate. As independent chair of the Invesco Funds Board, I can assure you that the members of the Board are strong advocates for the interests of investors in Invesco’s mutual funds. We work hard to represent your interests through oversight of the quality of the investment management services your funds receive and other matters important to your investment, including but not limited to: n Ensuring that Invesco offers a diverse lineup of mutual funds that your financial adviser can use to strive to meet your financial needs as your investment goals change over time. n Monitoring how the portfolio management teams of the Invesco funds are performing in light of changing economic and market conditions. |

| n | Assessing each portfolio management team’s investment performance within the context of the investment strategy described in the fund’s prospectus. |
| n | Monitoring for potential conflicts of interests that may impact the nature of the services that your funds receive. |
We believe one of the most important services we provide our fund shareholders is the annual review of the funds’ advisory and sub-advisory contracts with Invesco Advisers and its affiliates. This review is required by the Investment Company Act of 1940 and focuses on the nature and quality of the services Invesco provides as the adviser to the Invesco funds and the reasonableness of the fees that it charges for those services. Each year, we spend months carefully reviewing information received from Invesco and a variety of independent sources, such as performance and fee data prepared by Lipper Inc., an independent, third-party firm widely recognized as a leader in its field. We also meet with our independent legal counsel and other independent advisers to review and help us assess the information that we have received. Our goal is to assure that you receive quality investment management services for a reasonable fee.
I trust the measures outlined above provide assurance that you have a worthy advocate when it comes to choosing the Invesco Funds. As always, please contact me at bruce@brucecrockett.com with any questions or concerns you may have. On behalf of the Board, we look forward to continuing to represent your interests and serving your needs.
Sincerely,

Bruce L. Crockett
Independent Chair
Invesco Funds Board of Trustees
9 Invesco Allocation Funds
Management’s Discussion of Fund Performance
Performance summary — Invesco Conservative Allocation Fund
For the year ended December 31, 2014, Invesco Conservative Allocation Fund underperformed its custom style-specific benchmark, the Custom Conservative Allocation Index. Positive absolute performance from fixed income drove results thoughout the year. Commodities and emerging markets declined overall and experienced meaningful volatility. Global developed-market equities produced positive absolute returns despite a slow start to the year and geopolitical concerns hindering growth in some markets.
Your Fund’s long-term performance appears later in this report.
Fund vs. Indexes
Total returns, 12/31/13 to 12/31/14, at net asset value (NAV). Performance shown does not include applicable contingent deferred sales charges (CDSC) or front-end sales charges, which would have reduced performance.
| Class A Shares | 5.01 | % | |||
| Class B Shares | 4.34 | ||||
| Class C Shares | 4.34 | ||||
| Class R Shares | 4.75 | ||||
| Class S Shares | 5.20 | ||||
| Class Y Shares | 5.28 | ||||
| Class R5 Shares | 5.41 | ||||
| S&P 500 Index‚ (Broad Market Index) | 13.69 | ||||
| Custom Conservative Allocation Indexn (Style-Specific Index) | 5.93 | ||||
Lipper Mixed-Asset Target Allocation Conservative Funds Index¿ (Peer Group Index) | 4.67 |
Source(s): ‚FactSet Research Systems Inc.; nInvesco, FactSet Research Systems Inc.; ¿Lipper Inc.
Market conditions and your Fund
The year ended December 31, 2014, was volatile due to geopolitical issues and weak economic data but, overall, had strong performance in many fixed income markets, domestic equity markets and real estate. Commodities struggled and emerging markets were volatile.
Equities, which had become a popular asset class, were largely negative through mid-March and only select markets, such as Europe and the US, broke
into positive territory at the end of the first quarter. Overall, at the beginning of 2014, equities were off to a weak start. Government bonds generated attractive gains as investors sought perceived “safe havens” from equity and commodity volatility and geopolitical issues. Commodities were mixed, with the precious metals and agricultural complexes up strongly, while prices for industrial metals languished and energy-related commodities turned in mixed performance.
In the second quarter of 2014, bond yields fell as geopolitical concerns drove demand for perceived “safe-haven” assets. Bonds also benefited from weak economic data. Equities continued to climb higher after a weak start despite elevated valuations in key markets and lackluster economic data which indicated that investor sentiment was likely the primary driver of returns. Prices of energy and metals rose on geopolitical fears. Agriculture prices tailed off over the quarter as more favorable weather patterns helped to alleviate concerns about poor crop yields.
Capital markets were mixed for the third quarter of 2014. Government bonds generally saw yields decline as geopolitical concerns and evidence of slowing economic activity in Europe and Asia created demand for perceived “safe haven” assets. Developed equity markets were choppy with US small-cap equities, UK equities and Hong Kong equities trending lower while Japanese, US large-cap and European equities posted gains. Commodities were the clear loser in the third quarter as commodities registered price declines largely in response to the strength of the US dollar and, in many cases, a strong supply outlook.
The final quarter of the year witnessed several key events that shaped asset returns for the period. Chief among them was the October ending of a third round of quantitative easing and the US Federal Reserve’s asset purchase program. The second key event was OPEC’s decision not to curtail production of crude oil despite a mounting supply glut and evidence
Portfolio Composition | |||||||||||||||
| Target | % of Total Net Assets | ||||||||||||||
| Asset Class | Allocation* | as of 12/31/14 | |||||||||||||
| Intermediate Term Taxable Investment Grade | 24.40 | % | 24.54 | % | |||||||||||
| Taxable Non Investment Grade | 14.28 | 14.23 | |||||||||||||
| Balanced Risk | 9.98 | 9.84 | |||||||||||||
| Large Cap Value | 8.54 | 8.60 | |||||||||||||
| Large Cap Growth | 3.86 | 3.82 | |||||||||||||
| International/Global Blend | 4.00 | 3.82 | |||||||||||||
| Inernational/Global Growth | 3.68 | 3.58 | |||||||||||||
| Absolute Return | 3.15 | 3.22 | |||||||||||||
| Emerging Markets Fixed Income | 3.25 | 3.08 | |||||||||||||
| Emerging Markets | 3.19 | 3.01 | |||||||||||||
| Large Cap Blend | 2.97 | 2.96 | |||||||||||||
| Mid Cap Blend | 2.08 | 2.07 | |||||||||||||
| Global Real Estate | 1.92 | 1.91 | |||||||||||||
| Small Cap Blend | 1.76 | 1.79 | |||||||||||||
| Cash Equivalents Plus Other Assets Less Liabilities | 12.44 | 13.53 | |||||||||||||
*Total may not equal 100% due to rounding. |
| ||||||||||||||
Total Net Assets | $367.6 million | ||||
Fund Nasdaq Symbols
| |||||
Class A Shares | CAAMX | ||||
Class B Shares | CMBAX | ||||
Class C Shares | CACMX | ||||
Class R Shares | CMARX | ||||
Class S Shares | CMASX | ||||
Class Y Shares | CAAYX | ||||
Class R5 Shares | CMAIX |
10 Invesco Allocation Funds
of slowing demand. In the face of these events, government bond yields fell throughout the fourth quarter as investors sought safety. High-quality government bond prices were further supported by receding inflation expectations and weakening economic data outside the US. Stock markets contended with heightened volatility and ended mixed, with the US, Hong Kong and Japan posting gains while share prices in Europe and the UK turned negative. Across commodities, agriculture posted nominal gains while metals and particularly energy-related commodity prices fell.
PowerShares 1-30 Laddered Treasury Portfolio, Invesco Core Plus Bond Fund and Invesco Diversified Dividend Fund were the top contributors to absolute Fund performance for the reporting period. Invesco Balanced-Risk Commodity Strategy Fund, PowerShares FTSE RAFI Developed Markets ex-U.S. Portfolio and Invesco Emerging Market Local Currency Debt Fund were the top absolute detractors from overall Fund performance.
Relative to the Fund’s custom style-specific index, PowerShares 1-30 Laddered Treasury, Invesco Core Plus Bond Fund and Invesco International Growth Fund were the largest contributers to Fund performance. Invesco Emerging Market Local Currency Debt Fund, Invesco Floating Rate Fund and Invesco High Yield Fund were the largest detractors from relative performance for the reporting period.
Please note that our strategy in managing some of the underlying funds – which include, but are not limited to, Invesco Balanced-Risk Allocation Fund, Invesco Balanced-Risk Commodity Strategy Fund and Invesco Global Markets Strategy Fund – is primarily implemented with derivatives, which create economic leverage in the underlying funds. These derivative instruments include futures and total return swaps and therefore, all or most of the performance of these underlying funds, both positive and negative, can be attributed to these instruments. The leverage used in the strategy is inherent in these instruments.
Additionally, underlying fund holding Invesco Core Plus Bond Fund invests in derivative instruments such as futures contracts, options and swap agreements. Part of the underlying fund’s strategy to manage credit and currency risk in the portfolio during the reporting period entailed purchasing and selling credit and currency derivatives. These strategies are implemented within the risk profile of the guidelines set forth in the Fund’s prospectus.
Finally, we thank you for your continued commitment to Invesco Conservative Allocation Fund.
The views and opinions expressed in management’s discussion of Fund performance are those of Invesco Advisers, Inc. These views and opinions are subject to change at any time based on factors such as market and economic conditions. These views and opinions may not be relied upon as investment advice or recommendations, or as an offer for a particular security. The information is not a complete analysis of every aspect of any market, country, industry, security or the Fund. Statements of fact are from sources considered reliable, but Invesco Advisers, Inc. makes no representation or warranty as to their completeness or accuracy. Although historical performance is no guarantee of future results, these insights may help you understand our investment management philosophy.
See important Fund and, if applicable, index disclosures later in this report.
 | Mark Ahnrud Chartered Financial Analyst, Portfolio Manager, is manager of Invesco Conservative Allocation Fund. | |
| He joined Invesco in 2000. Mr. Ahnrud earned a BS in finance and investments from Babson College and an MBA from Duke University Fuqua School of Business. | ||
 | Chris Devine Chartered Financial Analyst, Portfolio Manager, is manager of Invesco Conservative Allocation Fund. | |
| He joined Invesco in 1998. Mr. Devine earned a BA in economics from Wake Forest University and an MBA from the University of Georgia. | ||
 | Scott Hixon Chartered Financial Analyst, Portfolio Manager, is manager of Invesco Conservative Allocation Fund. | |
| He joined Invesco in 1994. Mr. Hixon earned a BBA in finance from Georgia Southern University and an MBA in finance from Georgia State University. | ||
 | Christian Ulrich Chartered Financial Analyst, Portfolio Manager, is manager of Invesco Conservative Allocation Fund. | |
| He joined Invesco in 2000. Mr. Ulrich earned the equivalent of a BBA from the KV Zurich Business School in Zurich, Switzerland. | ||
 | Scott Wolle Chartered Financial Analyst, Portfolio Manager, is manager of Invesco Conservative Allocation Fund. | |
He joined Invesco in 1999. Mr. Wolle earned a BS in finance from Virginia Polytechnic Institute and State University and an MBA from Duke University Fuqua School of Business.
Assisted by Invesco’s Global Asset Allocation Team | ||
11 Invesco Allocation Funds
Management’s Discussion of Fund Performance
Performance summary – Invesco Growth Allocation Fund
For the year ended December 31, 2014, Invesco Growth Allocation Fund underperformed its custom style-specific benchmark. Positive absolute performance from fixed income drove results thoughout the year. Commodities and emerging markets declined overall and experienced meaningful volatility. Global developed-market equities produced positive absolute returns despite a slow start to the year and geopolitical concerns hindering growth in some markets.
Your Fund’s long-term performance appears later in this report.
Fund vs. Indexes
Total returns, 12/31/13 to 12/31/14, at net asset value (NAV). Performance shown does not include applicable contingent deferred sales charges (CDSC) or front-end sales charges, which would have reduced performance.
| Class A Shares | 4.35 | % | |||
| Class B Shares | 3.56 | ||||
| Class C Shares | 3.56 | ||||
| Class R Shares | 4.09 | ||||
| Class S Shares | 4.38 | ||||
| Class Y Shares | 4.63 | ||||
| Class R5 Shares | 4.71 | ||||
| S&P 500 Index‚ (Broad Market Index) | 13.69 | ||||
| Custom Growth Allocation Indexn (Style-Specific Index) | 5.54 | ||||
| Lipper Mixed-Asset Target Allocation Growth Funds Index¿ (Peer Group Index)* | 7.04 | ||||
| Lipper Multi-Cap Core Funds Index¿ (Former Peer Group Index)* | 10.06 |
Source(s): ‚FactSet Research Systems Inc.; nInvesco, FactSet Research Systems Inc.; ¿Lipper Inc.
| * | The Fund has elected to use the Lipper Mixed-Asset Target Allocation Growth Funds Index to represent its peer group benchmark rather than the Lipper Multi-Cap Core Funds Index because the Lipper Mixed-Asset Target Allocation Growth Funds Index more closely reflects the performance of the types of securities in which the Fund invests. |
Market conditions and your Fund
The year ended December 31, 2014, was volatile due to geopolitical issues and weak economic data but, overall, had strong performance in many fixed income markets, domestic equity markets and real estate. Commodities struggled and emerging markets were volatile.
Equities, which had become a popular asset class, were largely negative through mid-March and only select markets, such as Europe and the US, broke
into positive territory at the end of the first quarter. Overall, at the beginning of 2014, equities were off to a weak start. Government bonds generated attractive gains as investors sought perceived “safe havens” from equity and commodity volatility and geopolitical issues. Commodities were mixed, with the precious metals and agricultural complexes up strongly, while prices for industrial metals languished and energy-related commodities turned in mixed performance.
In the second quarter of 2014, bond yields fell as geopolitical concerns drove demand for perceived “safe havens” assets. Bonds also benefited from weak economic data. Equities continued to climb higher after a weak start despite elevated valuations in key markets and lackluster economic data which indicated that investor sentiment was likely the primary driver of returns. Prices of energy and metals rose on geopolitical fears. Agriculture prices tailed off over the quarter as more favorable weather patterns helped to alleviate concerns about poor crop yields.
Capital markets were mixed for the third quarter of 2014. Government bonds generally saw yields decline as geopolitical concerns and evidence of slowing economic activity in Europe and Asia created demand for perceived “safe haven” assets. Developed equity markets were choppy with US small-cap equities, UK equities and Hong Kong equities trending lower while Japanese, US large-cap and European equities posted gains. Commodities were the clear loser in the third quarter as commodities registered price declines largely in response to the strength of the US dollar and, in many cases, a strong supply outlook.
The final quarter of the year witnessed several key events that shaped asset returns for the period. Chief among them was the October ending of a third round of quantitative easing and the US Federal Reserve’s asset purchase program. The second key event was OPEC’s decision not to curtail production of crude oil despite a mounting supply glut and evidence of slowing demand. In the face of these events, government bond yields fell throughout the fourth quarter as
Portfolio Composition | ||||||
| Target | % of Total Net Assets | |||||
| Asset Class | Allocation* | as of 12/31/14 | ||||
| Large Cap Value | 18.98% | 19.33% | ||||
| Balanced Risk | 13.97 | 13.93 | ||||
| Large Cap Growth | 8.59 | 8.63 | ||||
| International/Global Blend | 8.91 | 8.63 | ||||
| International/Global Growth | 8.19 | 8.09 | ||||
| Emerging Markets | 7.11 | 6.79 | ||||
| Large Cap Blend | 6.60 | 6.65 | ||||
| Absolute Return | 5.31 | 5.52 | ||||
| Mid Cap Blend | 4.63 | 4.69 | ||||
| Global Real Estate | 4.27 | 4.31 | ||||
| Small Cap Blend | 3.92 | 4.02 | ||||
| Intermediate Term Taxable Investment Grade | 3.00 | 3.06 | ||||
| Cash Equivalents Plus Other Assets Less Liabilities | 6.00 | 6.35 | ||||
*Total may not equal 100% due to rounding. | ||||||
Total Net Assets | $1.2 billion | |||
Fund Nasdaq Symbols | ||||
Class A Shares | AADAX | |||
Class B Shares | AAEBX | |||
Class C Shares | AADCX | |||
Class R Shares | AADRX | |||
Class S Shares | AADSX | |||
Class Y Shares | AADYX | |||
Class R5 Shares | AADIX |
12 Invesco Allocation Funds
investors sought safety. High-quality government bond prices were further supported by receding inflation expectations and weakening economic data outside the US. Stock markets contended with heightened volatility and ended mixed, with the US, Hong Kong and Japan posting gains while share prices in Europe and the UK turned negative. Across commodities, agriculture posted nominal gains while metals and particularly energy-related commodity prices fell.
Invesco Diversified Dividend Fund, PowerShares 1-30 Laddered Treasury Portfolio and PowerShares Fundamental Pure Large Cap Growth Portfolio were the top contributors to absolute performance for the reporting period. Invesco Balanced-Risk Commodity Strategy Fund, PowerShares FTSE RAFI Developed Markets ex-U.S. Portfolio and Invesco Developing Markets Fund were the absolute detractors from overall Fund performance.
Relative to the Fund’s custom style-specific index, PowerShares 1-30 Laddered Treasury Portfolio, Invesco International Growth Fund and Invesco Developing Markets Fund were the largest contributors to Fund performance. Invesco Small Cap Equity Fund, Invesco Charter Fund and Invesco Endeavor Fund were the largest detractors from relative performance for the reporting period.
Please note that our strategy in managing some of the underlying funds – which include, but are not limited to, Invesco Balanced-Risk Allocation Fund, Invesco Balanced-Risk Commodity Strategy Fund and Invesco Global Markets Strategy Fund – is primarily implemented with derivatives, which create economic leverage in the underlying funds. These derivative instruments include futures and total return swaps and therefore, all or most of the performance of these underlying funds, both positive and negative, can be attributed to these instruments. The leverage used in the strategy is inherent in these instruments.
Additionally, underlying fund holding Invesco Core Plus Bond Fund invests in derivative instruments such as futures contracts, options and swap agreements. Part of the underlying fund’s strategy to manage credit and currency risk in the portfolio during the reporting period entailed purchasing and selling credit and currency derivatives. These strategies are implemented within the risk profile of the guidelines set forth in the Fund’s prospectus.
Finally, we thank you for your continued commitment to Invesco Growth Allocation Fund.
The views and opinions expressed in management’s discussion of Fund performance are those of Invesco Advisers, Inc. These views and opinions are subject to change at any time based on factors such as market and economic conditions. These views and opinions may not be relied upon as investment advice or recommendations, or as an offer for a particular security. The information is not a complete analysis of every aspect of any market, country, industry, security or the Fund. Statements of fact are from sources considered reliable, but Invesco Advisers, Inc. makes no representation or warranty as to their completeness or accuracy. Although historical performance is no guarantee of future results, these insights may help you understand our investment management philosophy.
See important Fund and, if applicable, index disclosures later in this report.
 | Mark Ahnrud Chartered Financial Analyst, Portfolio Manager, is manager of Invesco Growth Allocation Fund. He | |
| joined Invesco in 2000. Mr. Ahnrud earned a BS in finance and investments from Babson College and an MBA from Duke University Fuqua School of Business. | ||
 | Chris Devine Chartered Financial Analyst, Portfolio Manager, is manager of Invesco Growth Allocation Fund. He | |
| joined Invesco in 1998. Mr. Devine earned a BA in economics from Wake Forest University and an MBA from the University of Georgia. | ||
 | Scott Hixon Chartered Financial Analyst, Portfolio Manager, is manager of Invesco Growth Allocation Fund. He | |
| joined Invesco in 1994. Mr. Hixon earned a BBA in finance from Georgia Southern University and an MBA in finance from Georgia State University. | ||
 | Christian Ulrich Chartered Financial Analyst, Portfolio Manager, is manager of Invesco Growth Allocation Fund. He | |
| joined Invesco in 2000. Mr. Ulrich earned the equivalent of a BBA from the KV Zurich Business School in Zurich, Switzerland. | ||
 | Scott Wolle Chartered Financial Analyst, Portfolio Manager, is manager of Invesco Growth Allocation Fund. He | |
joined Invesco in 1999. Mr. Wolle earned a BS in finance from Virginia Polytechnic Institute and State University and an MBA from Duke University Fuqua School of Business.
Assisted by Invesco’s Global Asset Allocation Team | ||
13 Invesco Allocation Funds
Management’s Discussion of Fund Performance
Performance summary – Invesco Moderate Allocation Fund
For the year ended December 31, 2014, Invesco Moderate Allocation Fund underperformed its custom style-specific benchmark. Positive absolute performance from fixed income drove results thoughout the year. Commodities and emerging markets declined overall and experienced meaningful volatility. Global developed-market equities produced positive absolute returns despite a slow start to the year and geopolitical concerns hindering growth in some markets.
Your Fund’s long-term performance appears later in this report.
Fund vs. Indexes
Total returns, 12/31/13 to 12/31/14, at net asset value (NAV). Performance shown does not include applicable contingent deferred sales charges (CDSC) or front-end sales charges, which would have reduced performance.
| Class A Shares | 4.39 | % | |||
| Class B Shares | 3.62 | ||||
| Class C Shares | 3.62 | ||||
| Class R Shares | 4.13 | ||||
| Class S Shares | 4.58 | ||||
| Class Y Shares | 4.74 | ||||
| Class R5 Shares | 4.71 | ||||
| S&P 500 Index‚ (Broad Market Index) | 13.69 | ||||
| Custom Moderate Allocation Indexn (Style-Specific Index) | 5.95 | ||||
| Lipper Mixed-Asset Target Allocation Moderate Funds Index¿ (Peer Group Index) | 6.22 |
Source(s): ‚FactSet Research Systems Inc.; nInvesco, FactSet Research Systems Inc.; ¿Lipper Inc.
Market conditions and your Fund
The year ended December 31, 2014, was volatile due to geopolitical issues and weak economic data but, overall, had strong performance in many fixed income markets, domestic equity markets and real estate. Commodities struggled and emerging markets were volatile.
Equities, which had become a popular asset class, were largely negative through mid-March and only select markets, such as Europe and the US, broke into positive territory at the end of the first quarter. Overall, at the beginning of 2014,
equities were off to a weak start. Government bonds generated attractive gains as investors sought perceived “safe havens” from equity and commodity volatility and geopolitical issues. Commodities were mixed, with the precious metals and agricultural complexes up strongly, while prices for industrial metals languished and energy-related commodities turned in mixed performance.
In the second quarter of 2014, bond yields fell as geopolitical concerns drove demand for perceived “safe-haven” assets. Bonds also benefited from weak
economic data. Equities continued to climb higher after a weak start despite elevated valuations in key markets and lackluster economic data which indicated that investor sentiment was likely the primary driver of returns. Prices of energy and metals rose on geopolitical fears. Agriculture prices tailed off over the quarter as more favorable weather patterns helped to alleviate concerns about poor crop yields.
Capital markets were mixed for the third quarter of 2014. Government bonds generally saw yields decline as geopolitical concerns and evidence of slowing economic activity in Europe and Asia created demand for perceived “safe haven” assets. Developed equity markets were choppy with US small-cap equities, UK equities and Hong Kong equities trending lower while Japanese, US large-cap and European equities posted gains. Commodities were the clear loser in the third quarter as commodities registered price declines largely in response to the strength of the US dollar and, in many cases, a strong supply outlook.
The final quarter of the year witnessed several key events that shaped asset returns for the period. Chief among them was the October ending of a third round of quantitative easing and the US Federal Reserve’s asset purchase program. The second key event was OPEC’s decision not to curtail production of crude oil despite a mounting supply glut and evidence of slowing demand. In the face of these events, government bond yields fell throughout the fourth quarter as investors sought safety. High-quality government
Portfolio Composition | |||||||||||||||
| Asset Class | Target Allocation* | % of Total Net Assets as of 12/31/14 | |||||||||||||
| Large Cap Value | 14.23 | % | 14.44 | % | |||||||||||
| Balanced risk | 11.98 | 11.90 | |||||||||||||
| Intermediate Term Taxable Investment Grade | 11.00 | 11.16 | |||||||||||||
| Taxable Non Investment Grade | 7.03 | 7.06 | |||||||||||||
| International/Global Blend | 6.67 | 6.44 | |||||||||||||
| Large Cap Growth | 6.42 | 6.42 | |||||||||||||
| International/Global Growth | 6.14 | 6.04 | |||||||||||||
| Emerging Markets | 5.33 | 5.08 | |||||||||||||
| Large Cap Blend | 4.95 | 4.98 | |||||||||||||
| Absolute Return | 4.15 | 4.30 | |||||||||||||
| Mid Cap Blend | 3.46 | 3.47 | |||||||||||||
| Global Real Estate | 3.20 | 3.22 | |||||||||||||
| Small Cap Blend | 2.94 | 3.01 | |||||||||||||
| Emerging Markets Fixed Income | 3.00 | 2.88 | |||||||||||||
| Cash Equivalents Plus Other Assets Less Liabilities | 9.00 | 9.60 | |||||||||||||
*Total may not equal 100% due to rounding. |
| ||||||||||||||
Total Net Assets | $922.7 million | ||||
Fund Nasdaq Symbols |
| ||||
Class A Shares | AMKAX | ||||
Class B Shares | AMKBX | ||||
Class C Shares | AMKCX | ||||
Class R Shares | AMKRX | ||||
Class S Shares | AMKSX | ||||
Class Y Shares | ABKYX | ||||
Class R5 Shares | AMLIX | ||||
14 Invesco Allocation Funds
bond prices were further supported by receding inflation expectations and weakening economic data outside the US. Stock markets contended with heightened volatility and ended mixed, with the US, Hong Kong and Japan posting gains while share prices in Europe and the UK turned negative. Across commodities, agriculture posted nominal gains while metals and particularly energy-related commodity prices fell.
PowerShares 1-30 Laddered Treasury Portfolio, Invesco Diversified Dividend Fund and Invesco Core Plus Bond Fund were the top contributors to absolute Fund performance for the reporting period. Invesco Balanced-Risk Commodity Strategy Fund, PowerShares FTSE RAFI Developed Markets ex-U.S. Portfolio and Invesco Emerging Market Local Currency Debt Fund were the largest absolute detractors from overall Fund performance.
Relative to the Fund’s custom style-specific index, PowerShares 1-30 Laddered Treasury Portfolio, Invesco International Growth Fund and Invesco Core Plus Bond Fund were the largest contributors to performance. Invesco Emerging Market Local Currency Debt Fund, Invesco Small Cap Equity Fund and Invesco Charter Fund were the largest detractors from relative performance over the period.
Please note that our strategy in managing some of the underlying funds – which include, but are not limited to, Invesco Balanced-Risk Allocation Fund, Invesco Balanced-Risk Commodity Strategy Fund and Invesco Global Markets Strategy Fund – is primarily implemented with derivatives, which create economic leverage in the underlying funds. These derivative instruments include futures and total return swaps and therefore, all or most of the performance of these underlying funds, both positive and negative, can be attributed to these instruments. The leverage used in the strategy is inherent in these instruments.
Additionally, underlying fund holding Invesco Core Plus Bond Fund invests in derivative instruments such as futures contracts, options and swap agreements. Part of the underlying fund’s strategy to manage credit and currency risk in the portfolio during the reporting period entailed purchasing and selling credit and currency derivatives. These strategies are implemented within the risk profile of the guidelines set forth in the Fund’s prospectus.
Finally, we thank you for your continued commitment to Invesco Moderate Allocation Fund.
The views and opinions expressed in management’s discussion of Fund performance are those of Invesco Advisers, Inc. These views and opinions are subject to change at any time based on factors such as market and economic conditions. These views and opinions may not be relied upon as investment advice or recommendations, or as an offer for a particular security. The information is not a complete analysis of every aspect of any market, country, industry, security or the Fund. Statements of fact are from sources considered reliable, but Invesco Advisers, Inc. makes no representation or warranty as to their completeness or accuracy. Although historical performance is no guarantee of future results, these insights may help you understand our investment management philosophy.
See important Fund and, if applicable, index disclosures later in this report.
 | Mark Ahnrud Chartered Financial Analyst, Portfolio Manager, is manager of Invesco Moderate Allocation Fund. | |
| He joined Invesco in 2000. Mr. Ahnrud earned a BS in finance and investments from Babson College and an MBA from Duke University Fuqua School of Business. | ||
 | Chris Devine Chartered Financial Analyst, Portfolio Manager, is manager of Invesco Moderate Allocation Fund. | |
| He joined Invesco in 1998. Mr. Devine earned a BA in economics from Wake Forest University and an MBA from the University of Georgia. | ||
 | Scott Hixon Chartered Financial Analyst, Portfolio Manager, is manager of Invesco Moderate Allocation Fund. | |
| He joined Invesco in 1994. Mr. Hixon earned a BBA in finance from Georgia Southern University and an MBA in finance from Georgia State University. | ||
 | Christian Ulrich Chartered Financial Analyst, Portfolio Manager, is manager of Invesco Moderate Allocation Fund. | |
| He joined Invesco in 2000. Mr. Ulrich earned the equivalent of a BBA from the KV Zurich Business School in Zurich, Switzerland. | ||
 | Scott Wolle Chartered Financial Analyst, Portfolio Manager, is manager of Invesco Moderate Allocation Fund. | |
| He joined Invesco in 1999. Mr. Wolle earned a BS in finance from Virginia Polytechnic Institute and State University and an MBA from Duke University Fuqua School of Business. | ||
Assisted by Invesco’s Global Asset Allocation Team
15 Invesco Allocation Funds
Invesco Conservative Allocation Fund’s investment objective is total return consistent with a lower level of risk relative to the broad stock market.
Invesco Growth Allocation Fund’s investment objective is long-term growth of capital consistent with a higher level of risk relative to the broad stock market.
Invesco Moderate Allocation Fund’s investment objective is total return consistent with a moderate level of risk relative to the broad stock market.
| n | Unless otherwise stated, information presented in this report is as of December 31, 2014, and is based on total net assets. |
| n | Unless otherwise noted, all data provided by Invesco. |
| n | To access your Fund’s reports/prospectus, visit invesco.com/fundreports. |
About share classes
| n | Class B shares may not be purchased for new or additional investments. Please see the prospectus for more information. |
| n | Class R shares are generally available only to employer sponsored retirement and benefit plans. Please see the prospectus for more information. |
| n | Class S shares and Class Y shares are available only to certain investors. Please see the prospectus for more information. |
| n | Class R5 shares are primarily intended for employer sponsored retirement and benefit plans that meet certain standards and for institutional investors. Please see the prospectus for more information. |
Principal risks of investing in the Fund
| Invesco Conservative Allocation Fund | Invesco Growth Allocation Fund | Invesco Moderate Allocation Fund | |||||||||||||
| Active trading risk | X | X | X | ||||||||||||
| Call risk | X | X | X | ||||||||||||
| Collateralized loan obligations risk | X | X | |||||||||||||
| Commodities tax risk | X | X | |||||||||||||
| Commodities tax risk (Invesco Growth Allocation Fund) | X | ||||||||||||||
| Commodity-linked notes risk | X | X | X | ||||||||||||
| Commodity risk | X | X | X | ||||||||||||
| Concentration risk | X | ||||||||||||||
| Correlation risk | X | X | X | ||||||||||||
| Credit risk | X | X | X | ||||||||||||
| Currency/exchange rate risk | X | X | X | ||||||||||||
| Depository receipts risk | X | ||||||||||||||
| Derivatives risk | X | X | X | ||||||||||||
| Developing/emerging markets securities risk | X | X | X | ||||||||||||
| Exchange-traded funds risk | X | X | X | ||||||||||||
| Exchange-traded notes risk | X | X | X | ||||||||||||
| Foreign government debt risk | X | X | X | ||||||||||||
| Foreign securities risk | X | X | X | ||||||||||||
| Fund of funds risk | X | X | X | ||||||||||||
| Geographic focus risk | X | ||||||||||||||
| Growth investing risk | X | ||||||||||||||
| High yield bond (junk bond) risk | X | X | |||||||||||||
| Indexing risk | X | X | |||||||||||||
| Indexing risk (Invesco Growth Allocation Fund) | X | ||||||||||||||
| Interest rate risk | X | X | X | ||||||||||||
| Investing in the European Union risk | X | ||||||||||||||
| Issuer-specific changes risk | X | X | X | ||||||||||||
| Liquidity risk | X | X | X | ||||||||||||
| Management risk | X | X | X | ||||||||||||
| Market risk | X | X | X | ||||||||||||
16 Invesco Allocation Funds
| Invesco Conservative Allocation Fund | Invesco Growth Allocation Fund | Invesco Moderate Allocation Fund | |||||||||||||
| Market trading risk | X | X | X | ||||||||||||
| Mortgage- and asset-backed securities risk | X | X | |||||||||||||
| Municipal securities risk | X | X | |||||||||||||
| Non-correlation risk | X | X | X | ||||||||||||
| Non-diversification risk | X | X | |||||||||||||
| Preferred securities risk | X | ||||||||||||||
| Reinvestment risk | X | X | |||||||||||||
| Small- and mid-capitalization risks | X | ||||||||||||||
| Subsidiary risk | X | X | X | ||||||||||||
| TBA transactions risk | X | X | |||||||||||||
| US government obligations risk | X | X | X | ||||||||||||
| Value investing style risk | X | ||||||||||||||
| Volatility risk | X | X | X | ||||||||||||
| When-issued and delayed delivery risks | X | X | |||||||||||||
| Zero coupon or pay-in-kind securities risk | X | X | |||||||||||||
Principal risks defined
| n | Active trading risk. Certain underlying funds engage in frequent trading of portfolio securities. Active trading results in added expenses and may result in a lower return and increased tax liability. |
| n | Call risk. If interest rates fall, it is possible that issuers of debt securities with high interest rates will prepay or call their securities before their maturity dates. In this event, the proceeds from the called securities would likely be reinvested by an underlying fund in securities bearing the new, lower interest rates, resulting in a possible decline in an underlying funds income and distributions to shareholders. |
| n | Collateralized loan obligations risk. In addition to the normal interest rate, default and other risk of fixed income securities, collateralized loan obligations carry additional risks, including the possibility that distributions from collateral securities will not be adequate to make interest or other payments, the quality of the collateral may decline in value or default, an underlying fund may invest in collateralized loan obligations that are subordinate to other classes, values may be volatile, and disputes with the issuer may produce unexpected investment results. |
| n | Commodities tax risk. If, as a result of any such adverse action, the income of Invesco Balanced-Risk Allocation Fund, |
an underlying fund, from certain commodity-linked derivatives was treated as non-qualifying income, Invesco Balanced-Risk Allocation Fund might fail to qualify as a regulated investment company and be subject to federal income tax at the Fund level. Invesco Balanced-Risk Allocation Fund has received private letter rulings from the Internal Revenue Service confirming that income derived from its investment in the Subsidiary and a form of commodity-linked notes constitutes qualifying income to Invesco Balanced-Risk Allocation Fund. However, the Internal Revenue Service suspended issuance in July 2011 of any further private letter rulings pending a review of its position. Should the Internal Revenue Service issue guidance, or Congress enact legislation, that adversely affects the tax treatment of Invesco Balanced-Risk Allocation Fund’s use of commodity-linked notes, or the Subsidiary, it could limit Invesco Balanced-Risk Allocation Fund’s ability to pursue its investment strategy. In this event, Invesco Balanced-Risk Allocation Fund’s Board of Trustees may authorize a significant change in investment strategy or fund liquidation. Invesco Balanced-Risk Allocation Fund also may incur transaction and other costs to comply with any new or additional guidance from the Internal Revenue Service. |
| n | Commodities tax risk (Invesco Growth |
This report must be accompanied or preceded by a currently effective Fund prospectus, which contains more complete information, including sales charges and expenses. Investors should read it carefully before investing.
NOT FDIC INSURED | MAY LOSE VALUE | NO BANK GUARANTEE
Allocation Fund). The tax treatment of commodity-linked derivative instruments may be adversely affected by changes in legislation, regulations or other legally binding authority. If, as a result of any such adverse action, the income of Invesco Balanced-Risk Allocation Fund, Invesco Balanced-Risk Commodity Strategy Fund, or Invesco Global Markets Strategy Fund, each an underlying fund, from certain commodity-linked derivatives was treated as non-qualifying income, Invesco Balanced-Risk Allocation Fund, Invesco Balanced-Risk Commodity Strategy Fund, or Invesco Global Markets Strategy Fund might fail to qualify as a regulated investment company and be subject to federal income tax at the fund level. Invesco Balanced-Risk Allocation Fund has received private letter rulings from the Internal Revenue Service confirming that income derived from its investments in the Subsidiary and a form of commodity-linked note constitutes qualifying income to Invesco Balanced-Risk Allocation Fund. Invesco Balanced-Risk Commodity Strategy Fund has received a private letter ruling from the Internal Revenue Service confirming that income derived from the Fund’s investment in a form of commodity-linked note constitutes qualifying income to Invesco Balanced-Risk Commodity Strategy Fund. The IRS has also issued a number of similar letter rulings to other funds (upon which only the fund that received the private letter ruling can rely), which indicate that income from a fund’s investment in certain commodity-linked notes and a wholly owned foreign subsidiary that |
continued on page 18
17 Invesco Allocation Funds
continued from page 17
| invests in commodity-linked derivatives, such as the Subsidiary, constitutes qualifying income. However, the Internal Revenue Service suspended issuance of any further private letter rulings in July 2011 pending a review of its position. Should the Internal Revenue Service issue guidance, or Congress enact legislation, that adversely affects the tax treatment of Invesco Balanced-Risk Allocation Fund, Invesco Balanced-Risk Commodity Strategy Fund, or Invesco Global Markets Strategy Fund’s use of commodity-linked notes (which guidance might be applied retroactively to Invesco Global Markets Strategy Fund) or the Subsidiary (which guidance might be applied retroactively to Invesco Global Markets Strategy Fund and Invesco Balanced-Risk Commodity Strategy Fund) it could limit such underlying fund’s ability to pursue its investment strategy and such underlying fund might not qualify as a regulated investment company for one or more years. In this event, such underlying fund’s Board of Trustees may authorize a significant change in investment strategy or fund liquidation. Invesco Balanced-Risk Allocation Fund, Invesco Balanced-Risk Commodity Strategy Fund and Invesco Global Markets Strategy Fund also may incur transaction and other costs to comply with any new or additional guidance from the Internal Revenue Service. |
| n | Commodity-linked notes risk. An underlying fund’s investments in commodity-linked notes may involve substantial risks, including risk of loss of a significant portion of their principal value. In addition to risks associated with the underlying commodities, they may be subject to additional special risks, such as the lack of a secondary trading market and temporary price distortions due to speculators and/or the continuous rolling over of futures contracts underlying the notes. Commodity-linked notes are also subject to counterparty risk, which is the risk that the other party to the contract will not fulfill its contractual obligation to complete the transaction with an underlying fund. |
| n | Commodity risk. Certain of the underlying fund’s significant investment exposure to the commodities markets and/or a particular sector of the commodities markets, which may subject the underlying fund to greater volatility than investments in traditional securities, such as stocks and bonds. The commodities markets may fluctuate widely based on a variety of factors, including changes in overall market movements, domestic and foreign |
| �� | political and economic events and policies, war, acts of terrorism, changes in domestic or foreign interest rates and/or investor expectations concerning interest rates, domestic and foreign inflation rates and investment and trading activities of mutual funds, hedge funds and commodities funds. Prices of various commodities may also be affected by factors such as drought, floods, weather, livestock disease, embargoes, tariffs and other regulatory developments. The prices of commodities can also fluctuate widely due to supply and demand disruptions in major producing or consuming regions. Because certain of the underlying fund’s performance is linked to the performance of potentially volatile commodities, investors should be willing to assume the risks of potentially significant fluctuations in the value of the underlying fund’s shares. |
| n | Concentration risk. To the extent, an underlying fund invests a greater amount in any one sector or industry, an underlying fund’s performance will depend to a greater extent on the overall condition of the sector or industry, and there is increased risk to an underlying fund if conditions adversely affect that sector or industry. |
| n | Correlation risk. Changes in the value of two investments or asset classes may not track or offset each other in the manner anticipated by the portfolio managers. Because an underlying fund’s investment strategy seeks to balance risk across three asset classes and, within each asset class, to balance risk across different countries and commodities, to the extent either the three asset classes or the selected countries and commodities are correlated in a way not anticipated by the portfolio managers an underlying fund’s risk allocation process may not succeed in achieving its investment objective. |
| n | Credit risk. The issuer of instruments in which the underlying fund invests may be unable to meet interest and/or principal payments, thereby causing its instruments to decrease in value and lowering the issuer’s credit rating. |
| n | Currency/exchange rate risk. The dollar value of an underlying fund’s foreign investments will be affected by changes in the exchange rates between the dollar and the currencies in which those investments are traded. |
| n | Depositary receipts risk. Depositary receipts involve many of the same risks as those associated with direct investment in foreign securities. In addition, the underlying issuers of certain depositary receipts, particularly unsponsored |
| or unregistered depositary receipts, are under no obligation to distribute shareholder communications to the holders of such receipts or to pass through to them any voting rights with respect to the deposited securities. |
| n | Derivatives risk. The value of a derivative instrument depends largely on (and is derived from) the value of an underlying security, currency, commodity, interest rate, index or other asset (each referred to as an underlying asset). In addition to risks relating to the underlying assets, the use of derivatives may include other, possibly greater, risks, including counterparty, leverage and liquidity risks. Counterparty risk is the risk that the counterparty to the derivative contract will default on its obligation to pay an underlying fund the amount owed or otherwise perform under the derivative contract. Derivatives create leverage risk because they do not require payment up front equal to the economic exposure created by owning the derivative. As a result, an adverse change in the value of the underlying asset could result in an underlying fund sustaining a loss that is substantially greater than the amount invested in the derivative, which may make an underlying fund’s returns more volatile and increase the risk of loss. Derivative instruments may also be less liquid than more traditional investments and an underlying fund may be unable to sell or close out its derivative positions at a desirable time or price. This risk may be more acute under adverse market conditions, during which an underlying fund may be most in need of liquidating its derivative positions. Derivatives may also be harder to value, less tax efficient and subject to changing government regulation that could impact an underlying fund’s ability to use certain derivatives or their cost. Also, derivatives used for hedging or to gain or limit exposure to a particular market segment may not provide the expected benefits, particularly during adverse market conditions. These risks are greater for certain underlying funds than most other mutual funds because certain underlying funds will implement their investment strategy primarily through derivative instruments rather than direct investments in stocks and bonds. |
| n | Developing/emerging markets securities risk. The prices of securities issued by foreign companies and governments located in developing/emerging market countries may be affected more negatively by inflation, devaluation of their currencies, higher transaction costs, |
18 Invesco Allocation Funds
| delays in settlement, adverse political developments, the introduction of capital controls, withholding taxes, nationalization of private assets, expropriation, social unrest, war or lack of timely information than those in developed countries. |
| n | Exchange-traded funds risk. An investment by an underlying fund in exchange-traded funds generally presents the same primary risks as an investment in a mutual fund. In addition, an exchange-traded fund may be subject to the following: (1) a discount of the exchange-traded fund’s shares to its net asset value; (2) failure to develop an active trading market for the exchange-traded fund’s shares; (3) the listing exchange halting trading of the exchange-traded fund’s shares; (4) failure of the exchange-traded fund’s shares to track the referenced asset; and (5) holding troubled securities in the referenced index or basket of investments. Investments in exchange-traded funds may involve duplication of management fees and certain other expenses, as the underlying fund indirectly bears its proportionate share of any expenses paid by the exchange-traded funds in which it invests. Further, certain of the exchange-traded funds in which the underlying fund may invest are leveraged. The more the underlying fund invests in such leveraged exchange-traded funds, the more this leverage will magnify any losses on those investments. |
| n | Exchange-traded notes risk. Exchange-traded notes are subject to credit risk, including the credit risk of the issuer, and the value of the exchange-traded note may drop due to a downgrade in the issuer’s credit rating, despite the underlying market benchmark or strategy remaining unchanged. The value of an exchange-traded note may also be influenced by time to maturity, level of supply and demand for the exchange-traded note, volatility and lack of liquidity in the underlying market, changes in the applicable interest rates, changes in the issuer’s credit rating, and economic, legal, political, or geographic events that affect the referenced underlying market or strategy. Exchange-traded notes are also subject to the risk that the other party to the contract will not fulfill its contractual obligations, which may cause losses or additional costs to an underlying Fund. |
| n | Foreign government debt risk. Investments in foreign government debt obligations involve certain risks in addition to those relating to foreign securities or debt securities generally. The issuer of |
| the debt or the governmental authorities that control the repayment of the debt may be unable or unwilling to repay principal or interest when due in accordance with the terms of such debt, and an underlying fund may have limited recourse in the event of a default against the defaulting government. Without the approval of debt holders, some governmental debtors have in the past been able to reschedule or restructure their debt payments or declare moratoria on payments. |
| n | Foreign securities risk. An underlying fund’s foreign investments may be affected by changes in a foreign country’s exchange rates, political and social instability; changes in economic or taxation policies, difficulties when enforcing obligations, decreased liquidity, and increased volatility. Foreign companies may be subject to less regulation resulting in less publicly available information about the companies. |
| n | Fund of funds risk. The Fund’s performance depends on the underlying funds in which it invests, and it is subject to the risks of the underlying funds. Market fluctuations may change the target weightings in the underlying funds. The underlying funds may change their investment objectives, policies or practices and may not achieve their investment objectives, all of which may cause the Fund to withdraw its investments therein at a disadvantageous time. |
| n | Geographic focus risk. From time to time an underlying fund may invest a substantial amount of its assets in securities of issuers located in a single country or a limited number of countries. If an underlying fund focuses its investments in this manner, it assumes the risk that economic, political and social conditions in those countries will have a significant impact on its investment performance. An underlying fund’s investment performance may also be more volatile if it focuses its investments in certain countries, especially emerging market countries. |
| n | Growth investing risk. Growth stocks tend to be more expensive relative to their earnings or assets compared with other types of stock. As a result they tend to be more sensitive to changes in their earnings and can be more volatile. |
| n | High yield bond (junk bond) risk. Junk bonds involve a greater risk of default or price changes due to changes in the credit quality of the issuer. The values of junk bonds fluctuate more than those of high-quality bonds in response to company, political, regulatory or |
| economic developments. Values of junk bonds can decline significantly over short periods of time. |
| n | Indexing risk. Unlike many investment companies, an underlying fund does not utilize an investing strategy that seeks returns in excess of the underlying index. Therefore, it would not necessarily sell a security unless that security is removed from the underlying index. |
| n | Indexing risk (Invesco Growth Allocation Fund). Unlike many investment companies, certain underlying exchange-traded funds do not utilize an investing strategy that seeks returns in excess of their benchmark indices. Such underlying exchange-traded funds would not necessarily buy or sell a security due to its general underperformance, unless that security is added to or removed from the applicable benchmark index. |
| n | Interest rate risk. Interest rate risk refers to the risk that bond prices generally fall as interest rates rise; conversely, bond prices generally rise as interest rates fall. Specific bonds differ in their sensitivity to changes in interest rates depending on their individual characteristics, including duration. |
| n | Investing in the European Union risk. Many countries in the European Union are susceptible to high economic risks associated with high levels of debt, notably due to investments in sovereign debts of European countries such as Greece, Italy and Spain. One or more member states might exit the European Union, placing its currency and banking system in jeopardy. The European Union faces major issues involving its membership, structure, procedures and policies, including the adoption, abandonment or adjustment of the new constitutional treaty, the European Union’s enlargement to the south and east, and resolution of the European Union’s problematic fiscal and democratic accountability. Efforts of the member states to further unify their economic and monetary policies may increase the potential for the downward movement of one member state’s market to cause a similar effect on other member states’ markets. European countries that are part of the European Economic and Monetary Union may be significantly affected by the tight fiscal and monetary controls that the union seeks to impose on its members. |
| n | Issuer-specific changes risk. The value of an individual security or particular type of security can be more volatile than the market as a whole and can perform differently from the value of |
continued on page 20
19 Invesco Allocation Funds
continued from page 19
the market as a whole. |
| n | Liquidity risk. An underlying fund may hold illiquid securities that it is unable to sell at the preferred time or price and could lose its entire investment in such securities. |
| n | Management risk. The investment techniques and risk analysis used by the Fund’s and the underlying funds’ portfolio managers may not produce the desired results. Because an underlying fund’s investment process relies heavily on its asset allocation process, market movements that are counter to the portfolio managers’ expectations may have a significant adverse effect on an underlying fund’s net asset value. Further, the portfolio managers’ use of short derivative positions and instruments that provide economic leverage increases the volatility of an underlying fund’s net asset value, which increases the potential of greater losses that may cause an underlying fund to liquidate positions when it may not be advantageous to do so. |
| n | Market risk. The prices of and the income generated by an underlying fund’s securities may decline in response to, among other things, investor sentiment, general economic and market conditions, regional or global instability, and currency and interest rate fluctuations. |
| n | Market trading risk. Risk is inherent in all investing. An investment in an underlying fund involves risks similar to those of investing in any underlying fund of equity or fixed-income securities traded on exchanges. You should anticipate that the value of the Shares will decline, more or less, in correlation with any decline in value of the underlying index of certain underlying exchange-traded funds. |
| n | Mortgage- and asset-backed securities risk. Certain of the underlying funds may invest in mortgage and asset-backed securities that are subject to prepayment or call risk, which is the risk that the borrower’s payments may be received earlier or later than expected due to changes in prepayment rates on underlying loans. Faster prepayments often happen when interest rates are falling. As a result, an underlying fund may reinvest these early payments at lower interest rates, thereby reducing the underlying fund’s income. Conversely, when interest rates rise, prepayments may happen more slowly, causing the security to lengthen in duration. Longer duration securities tend to be more volatile. Securities may be prepaid at a price less than the original purchase value. An unexpectedly high rate of defaults on the mortgages held |
by a mortgage pool may adversely affect the value of mortgage-backed securities and could result in losses to an underlying fund. The risk of such defaults is generally higher in the case of mortgage pools that include subprime mortgages. Subprime mortgages refer to loans made to borrowers with weakened credit histories or with lower capacity to make timely payments on their mortgages. |
| n | Municipal securities risk. An underlying fund may invest in municipal securities. Constitutional amendments, legislative enactments, executive orders, administrative regulations, voter initiatives, and the issuer’s regional economic conditions may affect the municipal security’s value, interest payments, repayment of principal and an underlying fund’s ability to sell it. Failure of a municipal security issuer to comply with applicable tax requirements may make income paid thereon taxable, resulting in a decline in the security’s value. In addition, there could be changes in applicable tax laws or tax treatments that reduce or eliminate the current federal income tax exemption on municipal securities or otherwise adversely affect the current federal or state tax status of municipal securities. |
| n | Non-correlation risk. An underlying fund’s return may not match the return of the underlying index of certain underlying exchange-traded funds for a number of reasons. For example, the Fund incurs operating expenses not applicable to the underlying index, and incurs costs in buying and selling securities, especially when rebalancing an underlying fund’s securities holdings to reflect changes in the composition of an underlying index of certain underlying exchange-traded funds. In addition, the performance of an underlying fund and an underlying index of certain underlying exchange-traded funds may vary due to asset valuation differences and differences between an underlying fund’s portfolio and the underlying index of certain underlying exchange-traded funds resulting from legal restrictions, cost or liquidity constraints. |
| n | Non-diversification risk. Certain of the underlying funds are non-diversified and can invest a greater portion of their assets in a small number of issuers or a single issuer. A change in the value of the issuer could affect the value of an underlying fund more than if it was a diversified fund. |
| n | Preferred securities risk. Preferred securities may include provisions that permit the issuer, in its discretion, to defer or |
omit distributions for a certain period of time. If an underlying fund owns a security that is deferring or omitting its distributions, an underlying fund may be required to report the distribution on its tax returns, even though it may not have received this income. Further, preferred securities may lose substantial value due to the omission or deferment of dividend payments. |
| n | Reinvestment risk. Reinvestment risk is the risk that a bond’s cash flows (coupon income and principal repayment) will be reinvested at an interest rate below that on the original bond. |
| n | Small- and mid-capitalization risks. Stocks of small- and mid-sized companies tend to be more vulnerable to adverse developments and may have little or no operating history or track record of success, and limited product lines, markets, management and financial resources. The securities of small- and mid-sized companies may be more volatile due to less market interest and less publicly available information about the issuer. They also may be illiquid or restricted as to resale, or may trade less frequently and in smaller volumes, all of which may cause difficulty when establishing or closing a position at a desirable price. |
| n | Subsidiary risk. By investing in the Subsidiary, an underlying fund is indirectly exposed to risks associated with the Subsidiary’s investments. The Subsidiary is not registered under the Investment Company Act of 1940, as amended (1940 Act), and except as otherwise noted in the underlying fund’s prospectus, is not subject to the investor protections of the 1940 Act. Changes in the laws of the United States and/or the Cayman Islands, under which the underlying fund and the Subsidiary, respectively, are organized, could result in the inability of the underlying fund and/or the Subsidiary to operate as described in the underlying fund prospectus and SAI and could negatively affect the underlying fund and its shareholders. |
| n | TBA transactions risk. TBA transactions involve the risk that the securities received may be less favorable than what was anticipated by an underlying fund when entering into the TBA transaction. TBA transactions also involve the risk that a counterparty will fail to deliver the securities, exposing an underlying fund to further losses. Whether or not an underlying fund takes delivery of the securities at the termination date of a TBA transaction, an underlying fund will nonetheless be exposed to changes in the value of the underlying investments during the |
20 Invesco Allocation Funds
| term of the agreement. When an underlying fund enters into a short sale of a TBA mortgage it does not own, an underlying fund may have to purchase deliverable mortgages to settle the short sale at a higher price than anticipated, thereby causing a loss. A short position in a TBA mortgage poses more risk than holding the same TBA mortgage long. As there is no limit on how much the price of mortgage securities can increase, an underlying fund’s exposure is unlimited. An underlying fund may not always be able to purchase mortgage securities to close out the short position at a particular time or at an acceptable price. An underlying fund will earmark or segregate liquid assets in an amount at least equal to its exposure for the duration of the contract. An underlying fund will incur increased transaction costs associated with selling TBA mortgages short. In addition, taking short positions in TBA mortgages results in a form of leverage which could increase the volatility of an underlying fund’s share price. |
| n | US government obligations risk. The Fund may invest in obligations issued by US government agencies and instrumentalities that may receive varying levels of support from the government, which could affect an underlying fund’s ability to recover should they default. |
| n | Value investing style risk. Certain underlying funds emphasize a value style of investing, which focuses on undervalued companies with characteristics for improved valuations. This style of investing is subject to the risk that the valuations never improve or that the returns on value equity securities are less than returns on other styles of investing or the overall stock market. Value stocks also may decline in price, even though in theory they are already underpriced. |
| n | Volatility risk. An underlying fund may have investments that appreciate or decrease significantly in value over short periods of time. This may cause an underlying fund’s net asset value per share to experience significant increases or declines in value over short periods of time. |
| n | When-issued and delayed delivery risks. When-issued and delayed delivery transactions are subject to market risk as the value or yield of a security at delivery may be more or less than the purchase price or the yield generally available on securities when delivery occurs. In addition, an underlying fund is subject to counterparty risk because it relies on the buyer or seller, as the case may be, to consummate the transaction, and failure by the other party to |
| complete the transaction may result in an underlying fund missing the opportunity of obtaining a price or yield considered to be advantageous. |
| n | Zero coupon or pay-in-kind securities risk. The value, interest rates, and liquidity of non-cash paying instruments, such as zero coupon and pay-in-kind securities, are subject to greater fluctuation than other types of securities. The higher yields and interest rates on pay-in-kind securities reflect the payment deferral and increased credit risk associated with such instruments and that such investments may represent a higher credit risk than coupon loans. Pay-in-kind securities may have a potential variability in valuations because their continuing accruals require continuing judgments about the collectability of the deferred payments and the value of any associated collateral. |
About indexes used in this report
| n | The S&P 500® Index is an unmanaged index considered representative of the US stock market. |
| n | The Custom Conservative Allocation Index, created by Invesco to serve as a benchmark for Invesco Conservative Allocation Fund, is composed of the following indexes: S&P 500 Index, MSCI EAFE® Index and Barclays U.S. Aggregate Index. The composition of the index may change based on the Fund’s target asset allocation. Therefore, the current composition of the index does not reflect its historical composition and will likely be altered in the future to better reflect the Fund’s objective. |
| n | The Lipper Mixed-Asset Target Allocation Conservative Funds Index is an unmanaged index considered representative of mixed-asset target allocation conservative funds tracked by Lipper. |
| n | The MSCI EAFE Index is an unmanaged index considered representative of stocks of Europe, Australasia and the Far East. The index is computed using the net return, which withholds applicable taxes for non-resident investors. |
| n | The Barclays U.S. Aggregate Index is an unmanaged index considered representative of the US investment-grade, fixed-rate bond market. |
| n | The Custom Growth Allocation Index, created by Invesco to serve as a benchmark for Invesco Growth Allocation Fund, is composed of the following indexes: S&P 500 Index, MSCI EAFE Index and Barclays U.S. Aggregate Index. The composition of the index may change based on the Fund’s target asset allocation. Therefore, the current composition of the index does not |
| reflect its historical composition and will likely be altered in the future to better reflect the Fund’s objective. |
| n | The Lipper Mixed-Asset Target Allocation Growth Funds Index is an unmanaged index considered representative of mixed-asset target allocation growth funds tracked by Lipper. |
| n | The Lipper Multi-Cap Core Funds Index is an unmanaged index considered representative of multicap core funds tracked by Lipper. |
| n | The Custom Moderate Allocation Index, created by Invesco to serve as a benchmark for Invesco Moderate Allocation Fund, is composed of the following indexes: S&P 500 Index, MSCI EAFE Index and Barclays U.S. Aggregate Index. The composition of the index may change based on the Fund’s target asset allocation. Therefore, the current composition of the index does not reflect its historical composition and will likely be altered in the future to better reflect the Fund’s objective. |
| n | The Lipper Mixed-Asset Target Allocation Moderate Funds Index is an unmanaged index considered representative of mixed-asset target allocation moderate funds tracked by Lipper. |
| n | The Funds are not managed to track the performance of any particular index, including the index(es) described here, and consequently, the performance of the Funds may deviate significantly from the performance of the index(es). |
| n | A direct investment cannot be made in an index. Unless otherwise indicated, index results include reinvested dividends, and they do not reflect sales charges. Performance of the peer group, if applicable, reflects fund expenses; performance of a market index does not. |
Other information
| n | The returns shown in management’s discussion of Fund performance are based on net asset values calculated for shareholder transactions. Generally accepted accounting principles require adjustments to be made to the net assets of the Funds at period end for financial reporting purposes, and as such, the net asset values for shareholder transactions and the returns based on those net asset values may differ from the net asset values and returns reported in the Financial Highlights. |
21 Invesco Allocation Funds
Schedule of Investments
December 31, 2014
Invesco Conservative Allocation Fund
Schedule of Investments in Affiliated Issuers–99.96%(a)
| % of Net Assets 12/31/14 | Value 12/31/13 | Purchases at Cost | Proceeds from Sales | Change in Unrealized Appreciation (Depreciation) | Realized Gain (Loss) | Dividend Income | Shares 12/31/14 | Value 12/31/14 | ||||||||||||||||||||||||||||
Asset Allocation Funds–13.06% |
| |||||||||||||||||||||||||||||||||||
Invesco Balanced-Risk Allocation Fund | 6.00 | % | $ | 21,813,558 | $ | 2,659,021 | $ | (2,002,387 | ) | $ (349,752) | $ | 1,097,847 | $ | 518,865 | 1,894,117 | $ | 22,066,459 | |||||||||||||||||||
Invesco Balanced-Risk Commodity Strategy Fund(b) | 3.84 | % | 13,816,219 | 3,343,215 | (579,933 | ) | (2,418,291 | ) | (36,497 | ) | — | 1,888,331 | 14,124,713 | |||||||||||||||||||||||
Invesco Global Markets Strategy Fund | 3.22 | % | 11,004,540 | 1,225,520 | (542,560 | ) | 174,297 | 196,666 | 206,274 | 1,161,705 | 11,849,390 | |||||||||||||||||||||||||
Total Asset Allocation Funds | 46,634,317 | 7,227,756 | (3,124,880 | ) | (2,593,746 | ) | 1,258,016 | 725,139 | 4,944,153 | 48,040,562 | ||||||||||||||||||||||||||
Domestic Equity Funds–19.24% |
| |||||||||||||||||||||||||||||||||||
Invesco American Franchise Fund(b) | 1.96 | % | 7,204,837 | 1,123,168 | (1,111,307 | ) | (446,219 | ) | 1,066,783 | — | 427,974 | 7,211,352 | ||||||||||||||||||||||||
Invesco Charter Fund | 2.96 | % | 10,586,455 | 1,596,020 | (1,032,805 | ) | (477,949 | ) | 1,238,974 | 101,322 | 500,068 | 10,881,479 | ||||||||||||||||||||||||
Invesco Comstock Fund | 2.01 | % | 7,159,075 | 540,005 | (851,271 | ) | 263,348 | 269,957 | 149,012 | 289,455 | 7,381,114 | |||||||||||||||||||||||||
Invesco Diversified Dividend Fund | 3.93 | % | 13,881,892 | 1,150,656 | (1,710,491 | ) | 749,990 | 665,746 | 271,015 | 790,022 | 14,457,406 | |||||||||||||||||||||||||
Invesco Endeavor Fund(b) | 2.07 | % | 7,408,691 | 1,311,145 | (1,075,106 | ) | (263,296 | ) | 880,329 | — | 354,508 | 7,611,283 | ||||||||||||||||||||||||
Invesco Growth and Income Fund | 2.66 | % | 9,336,673 | 1,691,958 | (1,171,214 | ) | (299,965 | ) | 1,070,067 | 223,071 | 367,765 | 9,775,188 | ||||||||||||||||||||||||
Invesco Small Cap Equity Fund(b) | 1.79 | % | 6,309,295 | 1,768,298 | (983,494 | ) | (783,093 | ) | 1,008,540 | — | 403,159 | 6,563,433 | ||||||||||||||||||||||||
PowerShares Fundamental Pure Large Growth Portfolio–ETF | 1.86 | % | 6,648,012 | 115,961 | (840,290 | ) | 729,835 | 198,698 | 107,816 | 210,000 | 6,852,216 | |||||||||||||||||||||||||
Total Domestic Equity Funds | 68,534,930 | 9,297,211 | (8,775,978 | ) | (527,349 | ) | 6,399,094 | 852,236 | 3,342,951 | 70,733,471 | ||||||||||||||||||||||||||
Fixed-Income Funds–54.46% |
| |||||||||||||||||||||||||||||||||||
Invesco Core Plus Bond Fund | 24.54 | % | 85,566,203 | 6,289,297 | (3,963,985 | ) | 2,381,163 | (50,602 | ) | 3,848,923 | 8,315,399 | 90,222,076 | ||||||||||||||||||||||||
Invesco Emerging Market Local Currency Debt Fund | 3.08 | % | 11,334,548 | 1,910,436 | (641,913 | ) | (777,377 | ) | (54,116 | ) | 92,577 | 1,446,001 | 11,336,650 | |||||||||||||||||||||||
Invesco Floating Rate Fund | 5.38 | % | 19,156,500 | 2,133,390 | (833,280 | ) | (676,031 | ) | (7,294 | ) | 906,730 | 2,561,306 | 19,773,285 | |||||||||||||||||||||||
Invesco High Yield Fund | 4.87 | % | 17,297,516 | 1,915,610 | (527,250 | ) | (803,588 | ) | 20,538 | 1,073,609 | 4,173,153 | 17,902,826 | ||||||||||||||||||||||||
Invesco Premium Income Fund | 3.98 | % | 13,809,370 | 781,012 | (544,333 | ) | 589,907 | (19,303 | ) | 754,750 | 1,423,238 | 14,616,653 | ||||||||||||||||||||||||
PowerShares 1-30 Laddered Treasury Portfolio–ETF | 12.61 | % | 42,348,864 | 2,925,807 | (4,074,131 | ) | 5,326,240 | (175,420 | ) | 1,093,125 | 1,408,000 | 46,351,360 | ||||||||||||||||||||||||
Total Fixed-Income Funds | 189,513,001 | 15,955,552 | (10,584,892 | ) | 6,040,314 | (286,197 | ) | 7,769,714 | 19,327,097 | 200,202,850 | ||||||||||||||||||||||||||
Foreign Equity Funds–10.41% |
| |||||||||||||||||||||||||||||||||||
Invesco Developing Markets Fund | 3.01 | % | 11,020,289 | 1,918,641 | (1,248,477 | ) | (663,277 | ) | 241,144 | 172,237 | 364,439 | 11,071,648 | ||||||||||||||||||||||||
Invesco International Growth Fund | 3.58 | % | 13,087,754 | 1,761,230 | (1,121,050 | ) | (726,611 | ) | 594,394 | 220,205 | 403,061 | 13,172,043 | ||||||||||||||||||||||||
PowerShares FTSE RAFI Developed Markets ex-U.S. Portfolio–ETF | 3.82 | % | 14,162,737 | 2,338,979 | (968,326 | ) | (1,646,685 | ) | 135,795 | 517,342 | 355,000 | 14,022,500 | ||||||||||||||||||||||||
Total Foreign Equity Funds | 38,270,780 | 6,018,850 | (3,337,853 | ) | (3,036,573 | ) | 971,333 | 909,784 | 1,122,500 | 38,266,191 | ||||||||||||||||||||||||||
Real Estate Funds–1.91% |
| |||||||||||||||||||||||||||||||||||
Invesco Global Real Estate Fund | 1.91 | % | 6,681,190 | 513,225 | (925,319 | ) | 643,854 | 94,737 | 234,514 | 539,883 | 7,007,687 | |||||||||||||||||||||||||
Money Market Funds–0.88% |
| |||||||||||||||||||||||||||||||||||
Liquid Assets Portfolio–Institutional Class | 0.44 | % | 936,349 | 18,931,921 | (18,250,722 | ) | — | — | 596 | 1,617,548 | 1,617,548 | |||||||||||||||||||||||||
Premier Portfolio–Institutional Class | 0.44 | % | 936,350 | 18,931,920 | (18,250,723 | ) | — | — | 188 | 1,617,547 | 1,617,547 | |||||||||||||||||||||||||
Total Money Market Funds | 1,872,699 | 37,863,841 | (36,501,445 | ) | — | — | 784 | 3,235,095 | 3,235,095 | |||||||||||||||||||||||||||
TOTAL INVESTMENTS IN AFFILIATED ISSUERS | 99.96 | % | $ | 351,506,917 | $ | 76,876,435 | $ | (63,250,367 | ) | $ | 526,500 | (c) | $ | 8,436,983 | (d) | $ | 10,492,171 | $ | 367,485,856 | |||||||||||||||||
OTHER ASSETS LESS LIABILITIES | 0.04 | % | 136,707 | |||||||||||||||||||||||||||||||||
NET ASSETS | 100.00 | % | $ | 367,622,563 | ||||||||||||||||||||||||||||||||
Investment Abbreviations:
ETF – Exchange Traded Fund
Notes to Schedule of Investments:
| (a) | Each underlying fund and the Fund are affiliated by either having the same investment adviser or an investment adviser under common control with the Fund’s investment adviser. The Fund invests in Class R6 shares of the mutual funds listed and the Fund shares of the exchange-traded funds. |
| (b) | Non-income producing security. A security is determined to be non-income producing if the security has not declared a distribution in more than one year from the report date. |
| (c) | Includes $434,928 of return of capital received from Emerging Markets Local Currency Debt Fund. |
| (d) | Includes $1,151,828, $209,073, $625,910, $1,029,216, $280,387, $650,480, $852,331, $756,113, $196,672 and $423,674 of capital gains distributions from Invesco Balanced-Risk Allocation Fund, Invesco Global Markets Strategy Fund, Invesco American Franchise Fund, Invesco Charter Fund, Invesco Diversified Dividend Fund, Invesco Endeavor Fund, Invesco Growth and Income Fund, Invesco Small Cap Equity Fund, Invesco Developing Markets Fund and Invesco International Growth Fund, respectively. |
See accompanying Notes to Financial Statements which are an integral part of the financial statements.
22 Invesco Allocation Funds
Schedule of Investments—(continued)
December 31, 2014
Invesco Growth Allocation Fund
Schedule of Investments in Affiliated Issuers–100.08%(a)
% of Assets | Value 12/31/13 | Purchases at Cost | Proceeds from Sales | Change in Unrealized Appreciation (Depreciation) | Realized Gain (Loss) | Dividend Income | Shares 12/31/14 | Value 12/31/14 | ||||||||||||||||||||||||||||
Asset Allocation Funds–19.45% |
| |||||||||||||||||||||||||||||||||||
Invesco Balanced-Risk Allocation Fund | 8.09 | % | $ | 122,907,101 | $ | 10,087,037 | $ | (37,201,135 | ) | $ | (679,680 | ) | $ | 4,632,985 | $ | 2,229,057 | 8,137,170 | $ | 94,798,026 | |||||||||||||||||
Invesco Balanced-Risk Commodity Strategy Fund(b) | 5.84 | % | 69,147,572 | 14,491,762 | (3,228,231 | ) | (11,772,076 | ) | (280,743 | ) | — | 9,138,808 | 68,358,284 | |||||||||||||||||||||||
Invesco Global Markets Strategy Fund | 5.52 | % | 61,897,648 | 7,811,098 | (5,990,699 | ) | 1,173,380 | 876,279 | 1,125,031 | 6,336,020 | 64,627,406 | |||||||||||||||||||||||||
Total Asset Allocation Funds | 253,952,321 | 32,389,897 | (46,420,065 | ) | (11,278,376 | ) | 5,228,521 | 3,354,088 | 23,611,998 | 227,783,716 | ||||||||||||||||||||||||||
Domestic Equity Funds–43.32% |
| |||||||||||||||||||||||||||||||||||
Invesco American Franchise Fund(b) | 4.40 | % | 53,248,758 | 7,270,138 | (8,908,058 | ) | (2,370,877 | ) | 6,813,114 | — | 3,060,919 | 51,576,489 | ||||||||||||||||||||||||
Invesco Charter Fund | 6.65 | % | 78,330,003 | 9,012,457 | (7,599,202 | ) | (2,909,458 | ) | 8,414,164 | 725,185 | 3,579,117 | 77,881,594 | ||||||||||||||||||||||||
Invesco Comstock Fund | 4.52 | % | 52,857,500 | 2,529,325 | (6,266,054 | ) | 2,314,238 | 1,530,037 | 1,088,087 | 2,077,060 | 52,965,046 | |||||||||||||||||||||||||
Invesco Diversified Dividend Fund | 8.84 | % | 102,679,545 | 5,796,446 | (12,997,555 | ) | 6,289,048 | 3,860,157 | 1,984,967 | 5,662,190 | 103,618,075 | |||||||||||||||||||||||||
Invesco Endeavor Fund(b) | 4.69 | % | 55,042,592 | 7,450,699 | (7,337,810 | ) | (1,198,942 | ) | 5,632,178 | — | 2,556,920 | 54,897,070 | ||||||||||||||||||||||||
Invesco Growth and Income Fund | 5.97 | % | 69,520,255 | 9,727,325 | (8,792,564 | ) | (1,941,525 | ) | 7,469,671 | 1,619,083 | 2,629,394 | 69,889,285 | ||||||||||||||||||||||||
Invesco Small Cap Equity Fund(b) | 4.02 | % | 46,736,199 | 10,499,606 | (6,107,023 | ) | (4,661,401 | ) | 6,093,758 | — | 2,895,058 | 47,131,546 | ||||||||||||||||||||||||
PowerShares Fundamental Pure Large Growth Portfolio–ETF | 4.23 | % | 49,242,632 | — | (6,426,810 | ) | 5,535,334 | 1,232,784 | 791,410 | 1,519,600 | 49,583,940 | |||||||||||||||||||||||||
Total Domestic Equity Funds | 507,657,484 | 52,285,996 | (64,435,076 | ) | 1,056,417 | 41,045,863 | 6,208,732 | 23,980,258 | 507,543,045 | |||||||||||||||||||||||||||
Fixed-Income Funds–9.21% |
| |||||||||||||||||||||||||||||||||||
Invesco Core Plus Bond Fund | 3.06 | % | — | 38,114,519 | (2,737,197 | ) | 430,417 | 9,292 | 1,259,828 | 3,301,109 | 35,817,031 | |||||||||||||||||||||||||
Invesco Premium Income Fund | — | 80,600,826 | 751,851 | (65,969,878 | )(e) | 1,388,511 | 700,254 | 751,851 | — | — | ||||||||||||||||||||||||||
PowerShares 1-30 Laddered Treasury Portfolio–ETF | 6.15 | % | — | 72,503,854 | (6,788,734 | ) | 6,128,883 | 231,045 | 1,452,907 | 2,189,400 | 72,075,048 | |||||||||||||||||||||||||
Total Fixed-Income Funds | 80,600,826 | 111,370,224 | (75,495,809 | ) | 7,947,811 | 940,591 | 3,464,586 | 5,490,509 | 107,892,079 | |||||||||||||||||||||||||||
Foreign Equity Funds–23.51% |
| |||||||||||||||||||||||||||||||||||
Invesco Developing Markets Fund | 6.79 | % | 81,563,605 | 11,934,307 | (9,593,465 | ) | (4,824,773 | ) | 1,896,830 | 1,237,735 | 2,618,933 | 79,563,179 | ||||||||||||||||||||||||
Invesco International Growth Fund | 8.09 | % | 97,069,864 | 7,672,991 | (5,920,236 | ) | (6,240,497 | ) | 5,192,962 | 1,583,628 | 2,898,659 | 94,728,184 | ||||||||||||||||||||||||
PowerShares FTSE RAFI Developed Markets ex-U.S. Portfolio–ETF | 8.63 | % | 104,881,641 | 14,431,772 | (7,110,366 | ) | (11,874,572 | ) | 763,875 | 3,809,480 | 2,559,300 | 101,092,350 | ||||||||||||||||||||||||
Total Foreign Equity Funds | 283,515,110 | 34,039,070 | (22,624,067 | ) | (22,939,842 | ) | 7,853,667 | 6,630,843 | 8,076,892 | 275,383,713 | ||||||||||||||||||||||||||
Real Estate Funds–4.31% |
| |||||||||||||||||||||||||||||||||||
Invesco Global Real Estate Fund | 4.31 | % | 49,437,649 | 3,397,653 | (7,783,360 | ) | 5,599,533 | (156,155 | ) | 1,711,237 | 3,890,240 | 50,495,320 | ||||||||||||||||||||||||
Money Market Funds–0.28% |
| |||||||||||||||||||||||||||||||||||
Liquid Assets Portfolio-Institutional Class | 0.14 | % | 1,794,162 | 84,441,274 | (84,583,900 | ) | — | — | 1,294 | 1,651,536 | 1,651,536 | |||||||||||||||||||||||||
Premier Portfolio-Institutional Class | 0.14 | % | 1,794,162 | 84,441,274 | (84,583,900 | ) | — | — | 419 | 1,651,536 | 1,651,536 | |||||||||||||||||||||||||
Total Money Market Funds | 3,588,324 | 168,882,548 | (169,167,800 | ) | — | — | 1,713 | 3,303,072 | 3,303,072 | |||||||||||||||||||||||||||
TOTAL INVESTMENTS IN AFFILIATED ISSUERS (Cost $990,724,275) | 100.08 | % | $ | 1,178,751,714 | $ | 402,365,388 | $ | (385,926,177 | ) | $ | (19,614,457 | ) | $ | 54,912,487 | (c)(d) | $ | 21,371,199 | $ | 1,172,400,945 | |||||||||||||||||
OTHER ASSETS LESS LIABILITIES | (0.08 | )% | (901,376 | ) | ||||||||||||||||||||||||||||||||
NET ASSETS | 100.00 | % | $ | 1,171,499,569 | ||||||||||||||||||||||||||||||||
Investment Abbreviations:
ETF – Exchange Traded Fund
Notes to Schedule of Investments:
| (a) | Each underlying fund and the Fund are affiliated by either having the same investment adviser or an investment adviser under common control with the Fund’s investment adviser. The Fund invests in Class R6 shares of the mutual funds listed and Fund shares of the exchange-traded funds. |
| (b) | Non-income producing security. A security is determined to be non-income producing if the security has not declared a distribution in more than one year from the report date. |
| (c) | Includes $17,471,564 from sales proceeds paid in kind from Invesco Premium Income Fund. |
| (d) | Includes $4,948,282, $1,140,300, $4,476,586, $7,366,370, $2,009,566, $4,691,647, $6,093,877, $5,429,593, $1,413,325 and $3,046,900 of capital gains distributions from Invesco Balanced-Risk Allocation Fund, Invesco Global Markets Strategy Fund, Invesco American Franchise Fund, Invesco Charter Fund, Invesco Diversified Dividend Fund, Invesco Endeavor Fund, Invesco Growth and Income Fund, Invesco Small Cap Equity Fund, Invesco Developing Markets Fund and Invesco International Growth Fund, respectively. |
| (e) | Reflects sales proceeds for securities received as part of the transfer in kind from Invesco Premium Income Fund. |
See accompanying Notes to Financial Statements which are an integral part of the financial statements.
23 Invesco Allocation Funds
Schedule of Investments—(continued)
December 31, 2014
Invesco Moderate Allocation Fund
Schedule of Investments in Affiliated Issuers–100.04%(a)
| % of Net Assets 12/31/14 | Value 12/31/13 | Purchases at Cost | Proceeds from Sales | Change in Unrealized Appreciation (Depreciation) | Realized Gain (Loss) | Dividend Income | Shares 12/31/14 | Value 12/31/14 | ||||||||||||||||||||||||||||
Asset Allocation Funds–16.20% |
| |||||||||||||||||||||||||||||||||||
Invesco Balanced-Risk Allocation Fund | 7.05 | % | $ | 73,276,690 | $ | 10,988,363 | $ | (18,286,067 | ) | $ | (1,154,181 | ) | $ | 3,635,446 | $ | 1,529,899 | 5,584,895 | $ | 65,064,029 | |||||||||||||||||
Invesco Balanced-Risk Commodity Strategy Fund(b) | 4.85 | % | 44,087,308 | 10,164,206 | (1,622,617 | ) | (7,695,113 | ) | (172,881 | ) | — | 5,984,078 | 44,760,903 | |||||||||||||||||||||||
Invesco Global Markets Strategy Fund | 4.30 | % | 36,836,843 | 6,167,235 | (3,891,179 | ) | 673,861 | 588,585 | 690,666 | 3,889,736 | 39,675,305 | |||||||||||||||||||||||||
Total Asset Allocation Funds | 154,200,841 | 27,319,804 | (23,799,863 | ) | (8,175,433 | ) | 4,051,150 | 2,220,565 | 15,458,709 | 149,500,237 | ||||||||||||||||||||||||||
Domestic Equity Funds–32.32% |
| |||||||||||||||||||||||||||||||||||
Invesco American Franchise Fund(b) | 3.27 | % | 29,837,872 | 4,697,829 | (4,386,443 | ) | (1,548,204 | ) | 4,153,159 | — | 1,788,626 | 30,138,352 | ||||||||||||||||||||||||
Invesco Charter Fund | 4.98 | % | 43,820,854 | 7,597,328 | (4,381,958 | ) | (1,978,646 | ) | 5,172,228 | 427,293 | 2,108,888 | 45,889,394 | ||||||||||||||||||||||||
Invesco Comstock Fund | 3.37 | % | 29,542,302 | 2,949,361 | (3,618,777 | ) | 1,502,590 | 743,371 | 635,456 | 1,220,347 | 31,118,847 | |||||||||||||||||||||||||
Invesco Diversified Dividend Fund | 6.61 | % | 57,460,751 | 5,643,956 | (6,830,400 | ) | 3,607,327 | 2,325,087 | 1,161,062 | 3,334,603 | 61,023,238 | |||||||||||||||||||||||||
Invesco Endeavor Fund(b) | 3.47 | % | 30,724,316 | 5,704,706 | (4,227,272 | ) | (981,015 | ) | 3,568,357 | — | 1,492,781 | 32,050,014 | ||||||||||||||||||||||||
Invesco Growth and Income Fund | 4.46 | % | 38,816,399 | 6,744,653 | (4,003,615 | ) | (1,088,958 | ) | 4,297,371 | 948,459 | 1,549,120 | 41,175,613 | ||||||||||||||||||||||||
Invesco Small Cap Equity Fund(b) | 3.01 | % | 26,150,905 | 7,786,099 | (3,894,555 | ) | (2,971,491 | ) | 3,855,547 | — | 1,703,426 | 27,731,781 | ||||||||||||||||||||||||
PowerShares Fundamental Pure Large Growth Portfolio—ETF | 3.15 | % | 27,627,324 | 1,347,561 | (3,863,646 | ) | 3,156,738 | 772,367 | 462,088 | 890,000 | 29,040,344 | |||||||||||||||||||||||||
Total Domestic Equity Funds | 283,980,723 | 42,471,493 | (35,206,666 | ) | (301,659 | ) | 24,887,487 | 3,634,358 | 14,087,791 | 298,167,583 | ||||||||||||||||||||||||||
Fixed-Income Funds–30.30% |
| |||||||||||||||||||||||||||||||||||
Invesco Core Plus Bond Fund | 11.16 | % | 81,434,082 | 28,154,551 | (9,052,624 | ) | 2,765,856 | (301,575 | ) | 4,307,772 | 9,493,114 | 103,000,290 | ||||||||||||||||||||||||
Invesco Emerging Market Local Currency Debt Fund | 2.88 | % | 21,492,154 | 9,092,658 | (1,189,813 | ) | (1,763,088 | ) | (105,341 | ) | 215,890 | 3,384,116 | 26,531,464 | |||||||||||||||||||||||
Invesco Floating Rate Fund | 3.04 | % | 27,321,949 | 4,075,381 | (2,396,952 | ) | (894,965 | ) | (80,790 | ) | 1,300,930 | 3,630,133 | 28,024,623 | |||||||||||||||||||||||
Invesco High Yield Fund | 4.02 | % | 32,865,359 | 7,934,009 | (2,052,959 | ) | (1,660,432 | ) | (23,595 | ) | 2,214,576 | 8,639,250 | 37,062,382 | |||||||||||||||||||||||
Invesco Premium Income Fund | — | 52,955,705 | 1,664,081 | (44,352,423 | )(f) | 1,030,912 | 358,869 | 499,664 | — | — | ||||||||||||||||||||||||||
PowerShares 1-30 Laddered Treasury Portfolio–ETF | 9.20 | % | 54,242,600 | 31,460,313 | (9,623,448 | ) | 9,232,460 | (381,617 | ) | 1,927,946 | 2,579,900 | 84,930,308 | ||||||||||||||||||||||||
Total Fixed-Income Funds | 270,311,849 | 82,380,993 | (68,668,219 | ) | 8,710,743 | (534,049 | ) | 10,466,778 | 27,726,513 | 279,549,067 | ||||||||||||||||||||||||||
Foreign Equity Funds–17.56% |
| |||||||||||||||||||||||||||||||||||
Invesco Developing Markets Fund | 5.08 | % | 45,651,237 | 8,980,188 | (5,230,815 | ) | (2,782,739 | ) | 1,085,783 | 729,156 | 1,542,826 | 46,871,057 | ||||||||||||||||||||||||
Invesco International Growth Fund | 6.04 | % | 54,211,746 | 6,477,899 | (2,601,537 | ) | (2,637,781 | ) | 2,058,109 | 931,444 | 1,704,906 | 55,716,338 | ||||||||||||||||||||||||
PowerShares FTSE RAFI Developed Markets ex-U.S. Portfolio–ETF | 6.44 | % | 58,620,804 | 10,691,639 | (3,379,241 | ) | (6,715,702 | ) | 230,000 | 2,222,683 | 1,505,000 | 59,447,500 | ||||||||||||||||||||||||
Total Foreign Equity Funds | 158,483,787 | 26,149,726 | (11,211,593 | ) | (12,136,222 | ) | 3,373,892 | 3,883,283 | 4,752,732 | 162,034,895 | ||||||||||||||||||||||||||
Real Estate Funds–3.22% |
| |||||||||||||||||||||||||||||||||||
Invesco Global Real Estate Fund | 3.22 | % | 27,625,838 | 2,899,881 | (3,919,300 | ) | 2,797,951 | 345,376 | 1,002,694 | 2,291,968 | 29,749,746 | |||||||||||||||||||||||||
Money Market Funds–0.44% |
| |||||||||||||||||||||||||||||||||||
Liquid Assets Portfolio-Institutional Class | 0.22 | % | 4,469,025 | 48,109,446 | (50,554,476 | ) | — | — | 1,221 | 2,023,995 | 2,023,995 | |||||||||||||||||||||||||
Premier Portfolio-Institutional Class | 0.22 | % | 4,469,025 | 48,109,446 | (50,554,476 | ) | — | — | 399 | 2,023,995 | 2,023,995 | |||||||||||||||||||||||||
Total Money Market Funds | 8,938,050 | 96,218,892 | (101,108,952 | ) | — | — | 1,620 | 4,047,990 | 4,047,990 | |||||||||||||||||||||||||||
TOTAL INVESTMENTS IN AFFILIATED ISSUERS | 100.04 | % | $ | 903,541,088 | $ | 277,440,789 | $ | (243,914,593 | ) | $ | (9,104,620 | )(c) | $ | 32,123,856 | (d)(e) | $ | 21,209,298 | $ | 923,049,518 | |||||||||||||||||
OTHER ASSETS LESS LIABILITIES | (0.04 | )% | (390,376 | ) | ||||||||||||||||||||||||||||||||
NET ASSETS | 100.00 | % | $ | 922,659,142 | ||||||||||||||||||||||||||||||||
Investment Abbreviations:
ETF — Exchange Traded Fund
Notes to Schedule of Investments:
| (a) | Each underlying fund and the Fund are affiliated by either having the same investment adviser or an investment adviser under common control with the Fund’s investment adviser. The Fund invests in Class R6 shares of the mutual funds listed and the Fund shares of the exchange-traded funds. |
| (b) | Non-income producing security. A security is determined to be non-income producing if the security has not declared a distribution in more than one year from the report date. |
| (c) | Includes $995,106 of return of capital received from Invesco Emerging Markets Local Currency Debt Fund. |
| (d) | Includes $11,657,144 of proceeds from sales of paid in kind from Invesco Premium Income Fund. |
| (e) | Includes $3,396,222, $700,040, $2,615,861, $4,340,412, $1,183,483, $2,739,078, $3,590,237, $3,194,724, $832,597 and $1,792,098 of capital gains distributions from Invesco Balanced-Risk Allocation Fund, Invesco Global Markets Strategy Fund, Invesco American Franchise Fund, Invesco Charter Fund, Invesco Diversified Dividend Fund, Invesco Endeavor Fund, Invesco Growth and Income Fund, Invesco Small Cap Equity Fund, Invesco Developing Markets Fund and Invesco International Growth Fund, respectively. |
| (f) | Reflects sales proceeds for securities received as part of the transfer in kind from Invesco Premium Income Fund. |
See accompanying Notes to Financial Statements which are an integral part of the financial statements.
24 Invesco Allocation Funds
Statement of Assets and Liabilities
December 31, 2014
| Invesco Conservative Allocation Fund | Invesco Growth Allocation Fund | Invesco Moderate Allocation Fund | ||||||||||||||||
Assets: | ||||||||||||||||||
Investments in affiliated underlying funds, at value | $ | 367,485,856 | $ | 1,172,400,945 | $ | 923,049,518 | ||||||||||||
Receivable for: | ||||||||||||||||||
Fund shares sold | 865,563 | 1,099,668 | 1,260,203 | |||||||||||||||
Dividends from affiliated underlying funds | — | 223 | — | |||||||||||||||
Investment for trustee deferred compensation and retirement plans | 87,380 | 196,354 | 137,190 | |||||||||||||||
Other assets | 17,513 | 22,475 | 22,396 | |||||||||||||||
Total assets | 368,456,312 | 1,173,719,665 | 924,469,307 | |||||||||||||||
Liabilities: | ||||||||||||||||||
Payable for: | ||||||||||||||||||
Fund shares reacquired | 470,036 | 1,025,308 | 1,046,315 | |||||||||||||||
Accrued fees to affiliates | 236,265 | 889,674 | 551,368 | |||||||||||||||
Accrued trustees’ and officer’s fees and benefits | 554 | 537 | 693 | |||||||||||||||
Accrued operating expenses | 30,378 | 82,005 | 54,163 | |||||||||||||||
Trustee deferred compensation and retirement plans | 96,516 | 222,572 | 157,626 | |||||||||||||||
Total liabilities | 833,749 | 2,220,096 | 1,810,165 | |||||||||||||||
Net assets applicable to shares outstanding | $ | 367,622,563 | $ | 1,171,499,569 | $ | 922,659,142 | ||||||||||||
Net assets consist of: | ||||||||||||||||||
Shares of beneficial interest | $ | 344,439,627 | $ | 1,146,786,175 | $ | 839,880,238 | ||||||||||||
Undistributed net investment income | 2,135,440 | 435,341 | 3,446,089 | |||||||||||||||
Undistributed net realized gain (loss) | (12,725,005 | ) | (157,398,617 | ) | (37,634,559 | ) | ||||||||||||
Net unrealized appreciation | 33,772,501 | 181,676,670 | 116,967,374 | |||||||||||||||
| $ | 367,622,563 | $ | 1,171,499,569 | $ | 922,659,142 | |||||||||||||
See accompanying Notes to Financial Statements which are an integral part of the financial statements.
25 Invesco Allocation Funds
Statement of Assets and Liabilities—(continued)
December 31, 2014
| Invesco Conservative Allocation Fund | Invesco Growth Allocation Fund | Invesco Moderate Allocation Fund | ||||||||||||||||
Net Assets: | ||||||||||||||||||
Class A | $ | 256,586,885 | $ | 850,812,311 | $ | 659,138,834 | ||||||||||||
Class B | $ | 17,242,607 | $ | 91,798,178 | $ | 48,796,196 | ||||||||||||
Class C | $ | 77,159,193 | $ | 168,736,835 | $ | 154,724,416 | ||||||||||||
Class R | $ | 10,210,654 | $ | 25,308,571 | $ | 21,117,149 | ||||||||||||
Class S | $ | 2,524,797 | $ | 28,379,998 | $ | 31,853,503 | ||||||||||||
Class Y | $ | 3,871,244 | $ | 6,090,170 | $ | 6,869,679 | ||||||||||||
Class R5 | $ | 27,183 | $ | 373,506 | $ | 159,365 | ||||||||||||
Shares outstanding, $0.01 par value per share, |
| |||||||||||||||||
Class A | 22,617,172 | 61,006,450 | 52,392,964 | |||||||||||||||
Class B | 1,538,571 | 6,653,502 | 3,906,488 | |||||||||||||||
Class C | 6,871,621 | 12,221,394 | 12,394,419 | |||||||||||||||
Class R | 903,317 | 1,819,604 | 1,682,199 | |||||||||||||||
Class S | 222,282 | 2,036,949 | 2,532,897 | |||||||||||||||
Class Y | 341,641 | 437,563 | 545,308 | |||||||||||||||
Class R5 | 2,385 | 26,672 | 12,625 | |||||||||||||||
Class A: | ||||||||||||||||||
Net asset value per share | $ | 11.34 | $ | 13.95 | $ | 12.58 | ||||||||||||
Maximum offering price per share | $ | 12.00 | $ | 14.76 | $ | 13.31 | ||||||||||||
Class B: | ||||||||||||||||||
Net asset value and offering price per share | $ | 11.21 | $ | 13.80 | $ | 12.49 | ||||||||||||
Class C: | ||||||||||||||||||
Net asset value and offering price per share | $ | 11.23 | $ | 13.81 | $ | 12.48 | ||||||||||||
Class R: | ||||||||||||||||||
Net asset value and offering price per share | $ | 11.30 | $ | 13.91 | $ | 12.55 | ||||||||||||
Class S: | ||||||||||||||||||
Net asset value and offering price per share | $ | 11.36 | $ | 13.93 | $ | 12.58 | ||||||||||||
Class Y: | ||||||||||||||||||
Net asset value and offering price per share | $ | 11.33 | $ | 13.92 | $ | 12.60 | ||||||||||||
Class R5: | ||||||||||||||||||
Net asset value and offering price per share | $ | 11.40 | $ | 14.00 | $ | 12.62 | ||||||||||||
Cost of Investments in affiliated issuers | $ | 333,713,355 | $ | 990,724,275 | $ | 806,082,144 | ||||||||||||
See accompanying Notes to Financial Statements which are an integral part of the financial statements.
26 Invesco Allocation Funds
Statement of Operations
For the year ended December 31, 2014
| Invesco Conservative Allocation Fund | Invesco Growth Allocation Fund | Invesco Moderate Allocation Fund | ||||||||||||||||
Investment income: | ||||||||||||||||||
Dividends from affiliated underlying funds | $ | 10,492,171 | $ | 21,371,199 | $ | 21,209,298 | ||||||||||||
Other Income | 5,772 | 53,127 | 35,643 | |||||||||||||||
Total investment income | 10,497,943 | 21,424,326 | 21,244,941 | |||||||||||||||
Expenses: | ||||||||||||||||||
Administrative services fees | 113,139 | 303,038 | 242,856 | |||||||||||||||
Custodian fees | 10,633 | 13,482 | 10,968 | |||||||||||||||
Distribution fees: | ||||||||||||||||||
Class A | 630,868 | 2,119,848 | 1,628,335 | |||||||||||||||
Class B | 203,378 | 1,081,817 | 567,492 | |||||||||||||||
Class C | 723,232 | 1,695,972 | 1,544,239 | |||||||||||||||
Class R | 50,143 | 127,077 | 108,826 | |||||||||||||||
Class S | 4,077 | 45,531 | 51,937 | |||||||||||||||
Transfer agent fees — A, B, C, R, S and Y | 498,157 | 2,626,734 | 1,442,866 | |||||||||||||||
Transfer agent fees — R5 | 35 | 370 | 229 | |||||||||||||||
Trustees’ and officers’ fees and benefits | 28,101 | 42,828 | 38,387 | |||||||||||||||
Other | 257,761 | 447,862 | 304,088 | |||||||||||||||
Total expenses | 2,519,524 | 8,504,559 | 5,940,223 | |||||||||||||||
Less: Expense offset arrangement(s) | (1,312 | ) | (6,832 | ) | (4,039 | ) | ||||||||||||
Net expenses | 2,518,212 | 8,497,727 | 5,936,184 | |||||||||||||||
Net investment income | 7,979,731 | 12,926,599 | 15,308,757 | |||||||||||||||
Realized and unrealized gain (loss) from: | ||||||||||||||||||
Net realized gain from: | ||||||||||||||||||
Net realized gain on sales of affiliated underlying fund shares | 2,261,299 | 14,296,041 | 7,739,104 | |||||||||||||||
Net realized gain from distributions of affiliated underlying fund shares | 6,175,684 | 40,616,446 | 24,384,752 | |||||||||||||||
Foreign currencies | — | 15,359 | 10,262 | |||||||||||||||
| 8,436,983 | 54,927,846 | 32,134,118 | ||||||||||||||||
Change in net unrealized appreciation (depreciation) of affiliated underlying fund shares | 526,500 | (19,614,457 | ) | (9,104,620 | ) | |||||||||||||
Net gain from affiliated underlying funds | 8,963,483 | 35,313,389 | 23,029,498 | |||||||||||||||
Net increase in net assets resulting from operations | $ | 16,943,214 | $ | 48,239,988 | $ | 38,338,255 | ||||||||||||
See accompanying Notes to Financial Statements which are an integral part of the financial statements.
27 Invesco Allocation Funds
Statement of Changes in Net Assets
For the years ended December 31, 2014 and 2013
| Invesco Conservative Allocation Fund | Invesco Growth Allocation Fund | |||||||||||||||||||
| 2014 | 2013 | 2014 | 2013 | |||||||||||||||||
Operations: | ||||||||||||||||||||
Net investment income | $ | 7,979,731 | $ | 6,414,447 | $ | 12,926,599 | $ | 8,611,708 | ||||||||||||
Net realized gain | 8,436,983 | 12,907,042 | 54,927,846 | 99,446,192 | ||||||||||||||||
Change in net unrealized appreciation (depreciation) | 526,500 | (1,351,126 | ) | (19,614,457 | ) | 36,680,637 | ||||||||||||||
Net increase in net assets resulting from operations | 16,943,214 | 17,970,363 | 48,239,988 | 144,738,537 | ||||||||||||||||
Distributions to shareholders from net investment income: | ||||||||||||||||||||
Class A | (6,465,578 | ) | (4,647,640 | ) | (14,857,772 | ) | (12,446,938 | ) | ||||||||||||
Class B | (337,494 | ) | (365,417 | ) | (922,817 | ) | (1,084,205 | ) | ||||||||||||
Class C | (1,329,564 | ) | (1,051,977 | ) | (1,655,374 | ) | (1,445,703 | ) | ||||||||||||
Class R | (231,484 | ) | (169,016 | ) | (377,240 | ) | (326,733 | ) | ||||||||||||
Class S | (68,915 | ) | (56,186 | ) | (527,256 | ) | (511,533 | ) | ||||||||||||
Class Y | (104,721 | ) | (71,584 | ) | (121,080 | ) | (80,718 | ) | ||||||||||||
Class R5 | (941 | ) | (965 | ) | (8,311 | ) | (6,661 | ) | ||||||||||||
Total distributions from net investment income | (8,538,697 | ) | (6,362,785 | ) | (18,469,850 | ) | (15,902,491 | ) | ||||||||||||
Share transactions–net: | ||||||||||||||||||||
Class A | 6,913,371 | 7,190,507 | 2,757,125 | 140,441,635 | ||||||||||||||||
Class B | (6,307,687 | ) | (9,035,955 | ) | (33,873,938 | ) | 11,943,006 | |||||||||||||
Class C | 6,894,590 | 3,702,689 | (1,377,221 | ) | 16,232,207 | |||||||||||||||
Class R | 526,924 | 301,000 | (697,324 | ) | (413,281 | ) | ||||||||||||||
Class S | (412,981 | ) | (101,678 | ) | (4,413,534 | ) | (3,918,014 | ) | ||||||||||||
Class Y | 37,378 | 659,463 | 1,402,067 | 1,573,327 | ||||||||||||||||
Class R5 | (20,268 | ) | 22,421 | 18,582 | 101,940 | |||||||||||||||
Net increase (decrease) in net assets resulting from share transactions | 7,631,327 | 2,738,447 | (36,184,243 | ) | 165,960,820 | |||||||||||||||
Net increase (decrease) in net assets | 16,035,844 | 14,346,025 | (6,414,105 | ) | 294,796,866 | |||||||||||||||
Net assets: | ||||||||||||||||||||
Beginning of year | 351,586,719 | 337,240,694 | 1,177,913,674 | 883,116,808 | ||||||||||||||||
End of year* | $ | 367,622,563 | $ | 351,586,719 | $ | 1,171,499,569 | $ | 1,177,913,674 | ||||||||||||
* Includes accumulated undistributed net investment income | $ | 2,135,440 | $ | 1,840,217 | $ | 435,341 | $ | 1,639,432 | ||||||||||||
See accompanying Notes to Financial Statements which are an integral part of the financial statements.
28 Invesco Allocation Funds
Statement of Changes in Net Assets—(continued)
For the years ended December 31, 2014 and 2013
Invesco Moderate Allocation Fund | ||||||||||
| 2014 | 2013 | |||||||||
Operations: | ||||||||||
Net investment income | $ | 15,308,757 | $ | 12,117,943 | ||||||
Net realized gain | 32,134,118 | 41,423,656 | ||||||||
Change in net unrealized appreciation (depreciation) | (9,104,620 | ) | 30,452,368 | |||||||
Net increase in net assets resulting from operations | 38,338,255 | 83,993,967 | ||||||||
Distributions to shareholders from net investment income: | ||||||||||
Class A | (13,271,778 | ) | (10,935,222 | ) | ||||||
Class B | (669,640 | ) | (910,330 | ) | ||||||
Class C | (1,971,212 | ) | (2,008,657 | ) | ||||||
Class R | (383,491 | ) | (382,184 | ) | ||||||
Class S | (712,790 | ) | (649,649 | ) | ||||||
Class Y | (149,884 | ) | (86,806 | ) | ||||||
Class R5 | (5,101 | ) | (4,310 | ) | ||||||
Total distributions from net investment income | (17,163,896 | ) | (14,977,158 | ) | ||||||
Share transactions–net: | ||||||||||
Class A | 16,563,581 | 42,631,811 | ||||||||
Class B | (16,998,448 | ) | (21,556,804 | ) | ||||||
Class C | 3,733,323 | 13,443,792 | ||||||||
Class R | (2,492,258 | ) | 726,111 | |||||||
Class S | (4,690,944 | ) | (4,035,573 | ) | ||||||
Class Y | 1,867,634 | 1,276,437 | ||||||||
Class R5 | (78,556 | ) | (238,928 | ) | ||||||
Net increase (decrease) in net assets resulting from share transactions | (2,095,668 | ) | 32,246,846 | |||||||
Net increase in net assets | 19,078,691 | 101,263,655 | ||||||||
Net assets: | ||||||||||
Beginning of year | 903,580,451 | 802,316,796 | ||||||||
End of year* | $ | 922,659,142 | $ | 903,580,451 | ||||||
* Includes accumulated undistributed net investment income | $ | 3,446,089 | $ | 2,492,777 | ||||||
Notes to Financial Statements
December 31, 2014
NOTE 1—Significant Accounting Policies
AIM Growth Series (Invesco Growth Series) (the “Trust”) is organized as a Delaware statutory trust and is registered under the Investment Company Act of 1940, as amended (the “1940 Act”), as an open-end series management investment company consisting of seventeen separate series portfolios (each constituting a “Fund”), each authorized to issue an unlimited number of shares of beneficial interest. The Funds covered in this report, each a series portfolio of the Trust, are Invesco Conservative Allocation Fund, Invesco Growth Allocation Fund and Invesco Moderate Allocation Fund (collectively, the “Funds”). The assets, liabilities and operations of each portfolio are accounted for separately. Information presented in these financial statements pertains only to the Fund. Matters affecting each portfolio or class will be voted on exclusively by the shareholders of such portfolio or class.
The investment objectives of the Funds are: to provide total return consistent with a lower level of risk relative to the broad stock market for Invesco Conservative Allocation Fund, to provide long-term growth of capital consistent with a higher level of risk relative to the broad stock market for Invesco Growth Allocation Fund, and to provide total return consistent with a moderate level of risk relative to the broad stock market for Invesco Moderate Allocation Fund.
Each Fund is a “fund of funds,” in that it invests in other mutual funds advised by Invesco Advisers, Inc. (“Invesco”) and exchange traded funds advised by Invesco PowerShares Capital Management LLC (“PowerShares Capital”), an affiliate of Invesco (“underlying funds”). Invesco and PowerShares Capital are affiliates of each other as they are indirect, wholly-owned subsidiaries of Invesco Ltd. Invesco may change each Fund’s asset class allocations, the underlying funds or target weightings in the underlying funds without shareholder approval. The underlying funds may engage in a number of investment techniques and practices, which involve certain risks. Each underlying fund’s accounting policies are outlined in the underlying fund’s financial statements and are publically available.
29 Invesco Allocation Funds
Each Fund currently consists of seven different classes of shares: Class A, Class B, Class C, Class R, Class S, Class Y and Class R5. Class A shares are sold with a front-end sales charge unless certain waiver criteria are met and under certain circumstances load waived shares may be subject to contingent deferred sales charges (“CDSC”). Class C shares are sold with a CDSC. Class R, Class S, Class Y and Class R5 shares are sold at net asset value. Effective November 30, 2010, new or additional investments in Class B shares are no longer permitted. Existing shareholders of Class B shares may continue to reinvest dividends and capital gains distributions in Class B shares until they convert to Class A shares. Also, shareholders in Class B shares will be able to exchange those shares for Class B shares of other Invesco Funds offering such shares until they convert to Class A shares. Generally, Class B shares will automatically convert to Class A shares on or about the month-end, which is at least eight years after the date of purchase. Redemption of Class B shares prior to the conversion date will be subject to a CDSC.
The following is a summary of the significant accounting policies followed by the Funds in the preparation of their financial statements.
| A. | Security Valuations — Securities of investment companies that trade on an exchange are valued at the last sales price or official closing price as of the close of the customary trading session on the exchange where the security is principally traded. Investments in shares of funds that are not traded on an exchange are valued at the end of day net asset value per share of such fund. Securities in the underlying funds, including restricted securities, are valued in accordance with the valuation policy of such fund. The policies of the underlying funds affiliated with the Funds as a result of having the same investment adviser are set forth below. |
A security listed or traded on an exchange (except convertible securities) is valued at its last sales price or official closing price as of the close of the customary trading session on the exchange where the security is principally traded, or lacking any sales or official closing price on a particular day, the security may be valued at the closing bid price on that day. Securities traded in the over-the-counter market are valued based on prices furnished by independent pricing services or market makers. When such securities are valued by an independent pricing service they may be considered fair valued. Futures contracts are valued at the final settlement price set by an exchange on which they are principally traded. Listed options are valued at the mean between the last bid and ask prices from the exchange on which they are principally traded. Options not listed on an exchange are valued by an independent source at the mean between the last bid and ask prices. For purposes of determining net asset value per share, futures and option contracts generally are valued 15 minutes after the close of the customary trading session of the New York Stock Exchange (“NYSE”).
Senior secured floating rate loans and senior secured floating rate debt securities are fair valued using an evaluated quote provided by an independent pricing service. Evaluated quotes provided by the pricing service may reflect appropriate factors such as ratings, tranche type, industry, company performance, spread, individual trading characteristics, institution-size trading in similar groups of securities and other market data.
Investments in open-end and closed-end registered investment companies that do not trade on an exchange are valued at the end of day net asset value per share. Investments in open-end and closed-end registered investment companies that trade on an exchange are valued at the last sales price or official closing price as of the close of the customary trading session on the exchange where the security is principally traded.
Debt obligations (including convertible securities) and unlisted equities are fair valued using an evaluated quote provided by an independent pricing service. Evaluated quotes provided by the pricing service may be determined without exclusive reliance on quoted prices, and may reflect appropriate factors such as institution-size trading in similar groups of securities, developments related to specific securities, dividend rate (for unlisted equities), yield (for debt obligations), quality, type of issue, coupon rate (for debt obligations), maturity (for debt obligations), individual trading characteristics and other market data. Debt obligations are subject to interest rate and credit risks. In addition, all debt obligations involve some risk of default with respect to interest and/or principal payments.
Swap agreements are fair valued using an evaluated quote, if available, provided by an independent pricing service. Evaluated quotes provided by the pricing service are valued based on a model which may include end of day net present values, spreads, ratings, industry, company performance and returns of referenced assets.
Foreign securities’ (including foreign exchange contracts) prices are converted into U.S. dollar amounts using the applicable exchange rates as of the close of the NYSE. If market quotations are available and reliable for foreign exchange-traded equity securities, the securities will be valued at the market quotations. Because trading hours for certain foreign securities end before the close of the NYSE, closing market quotations may become unreliable. If between the time trading ends on a particular security and the close of the customary trading session on the NYSE, events occur that the Adviser determines are significant and make the closing price unreliable, the Fund may fair value the security. If the event is likely to have affected the closing price of the security, the security will be valued at fair value in good faith using procedures approved by the Board of Trustees. Adjustments to closing prices to reflect fair value may also be based on a screening process of an independent pricing service to indicate the degree of certainty, based on historical data, that the closing price in the principal market where a foreign security trades is not the current value as of the close of the NYSE. Foreign securities’ prices meeting the approved degree of certainty that the price is not reflective of current value will be priced at the indication of fair value from the independent pricing service. Multiple factors may be considered by the independent pricing service in determining adjustments to reflect fair value and may include information relating to sector indices, American Depositary Receipts and domestic and foreign index futures. Foreign securities may have additional risks including exchange rate changes, potential for sharply devalued currencies and high inflation, political and economic upheaval, the relative lack of issuer information, relatively low market liquidity and the potential lack of strict financial and accounting controls and standards.
Securities for which market prices are not provided by any of the above methods may be valued based upon quotes furnished by independent sources. The last bid price may be used to value equity securities. The mean between the last bid and ask prices is used to value debt obligations, including corporate loans.
Securities for which market quotations are not readily available or became unreliable are valued at fair value as determined in good faith by or under the supervision of the Trust’s officers following procedures approved by the Board of Trustees. Issuer specific events, market trends, bid/ask quotes of brokers and information providers and other market data may be reviewed in the course of making a good faith determination of a security’s fair value.
The Fund may invest in securities that are subject to interest rate risk, meaning the risk that the prices will generally fall as interest rates rise and, conversely, the prices will generally rise as interest rates fall. Specific securities differ in their sensitivity to changes in interest rates depending on their individual characteristics. Changes in interest rates may result in increased market volatility, which may affect the value and/or liquidity of certain of the Fund’s investments.
30 Invesco Allocation Funds
Valuations change in response to many factors including the historical and prospective earnings of the issuer, the value of the issuer’s assets, general economic conditions, interest rates, investor perceptions and market liquidity. Because of the inherent uncertainties of valuation, the values reflected in the financial statements may materially differ from the value received upon actual sale of those investments.
| B. | Securities Transactions and Investment Income — Securities transactions are accounted for on a trade date basis. Realized gains or losses on sales are computed on the basis of specific identification of the securities sold. Distributions from ordinary income from underlying funds, if any, are recorded as dividend income on ex-dividend date. Distributions from gains from underlying funds, if any, are recorded as realized gains on the ex-dividend date. The following policies are followed by the underlying funds: Interest income (net of withholding tax, if any) is recorded on the accrual basis from settlement date. Bond premiums and discounts are amortized and/or accreted for financial reporting purposes. Paydown gains and losses on mortgage and asset-backed securities are recorded as adjustments to interest income. |
The Fund may periodically participate in litigation related to Fund investments. As such, the Fund may receive proceeds from litigation settlements. Any proceeds received are included in the Statement of Operations as realized gain (loss) for investments no longer held and as unrealized gain (loss) for investments still held.
The Fund allocates income and realized and unrealized capital gains and losses to a class based on the relative net assets of each class.
| C. | Distributions — Invesco Conservative Allocation Fund and Invesco Moderate Allocation Fund generally declare and pay dividends from net investment income, if any, quarterly. Invesco Growth Allocation Fund generally declares and pays dividends from net investment income, if any, annually. Distributions from net realized capital gains, if any, are generally declared and paid annually and recorded on the ex-dividend date. The Funds may elect to treat a portion of the proceeds from redemptions as distributions for federal tax purposes. |
| D. | Federal Income Taxes — The Funds intend to comply with the requirements of Subchapter M of the Internal Revenue Code of 1986, as amended (the “Internal Revenue Code”), necessary to qualify as a regulated investment company and to distribute substantially all of the Funds’ taxable earnings to shareholders. As such, the Funds will not be subject to federal income taxes on otherwise taxable income (including net realized capital gain) that is distributed to shareholders. Therefore, no provision for federal income taxes is recorded in the financial statements. |
Each Fund recognizes the tax benefits of uncertain tax positions only when the position is more likely than not to be sustained. Management has analyzed the Funds’ uncertain tax positions and concluded that no liability for unrecognized tax benefits should be recorded related to uncertain tax positions. Management is not aware of any tax positions for which it is reasonably possible that the total amounts of unrecognized tax benefits will change materially in the next 12 months.
Each Fund files tax returns in the U.S. Federal jurisdiction and certain other jurisdictions. Generally, each Fund is subject to examinations by such taxing authorities for up to three years after the filing of the return for the tax period.
| E. | Expenses — Expenses included in the accompanying financial statements reflect the expenses of the Funds and do not include any expenses of the underlying funds. The effects of the underlying funds expenses are included in the realized and unrealized gain/loss on the investments in the underlying funds. Estimated expenses of the underlying funds are discussed further within Note 11. |
Fees provided for under the Rule 12b-1 plan of a particular class of each Fund and which are directly attributable to that class are charged to the operations of such class. Transfer agency fees and expenses and other shareholder recordkeeping fees and expenses attributable to Class R5 are charged to such class. Transfer agency fees and expenses and other shareholder recordkeeping fees and expenses relating to all other classes are allocated among those classes based on relative net assets. All other expenses are allocated among the classes based on relative net assets.
| F. | Accounting Estimates — The preparation of financial statements in conformity with accounting principles generally accepted in the United States of America (“GAAP”) requires management to make estimates and assumptions that affect the reported amounts of assets and liabilities at the date of the financial statements and the reported amounts of revenues and expenses during the reporting period including estimates and assumptions related to taxation. Actual results could differ from those estimates by a significant amount. In addition, the Fund monitors for material events or transactions that may occur or become known after the period-end date and before the date the financial statements are released to print. |
| G. | Indemnifications — Under the Trust’s organizational documents, each Trustee, officer, employee or other agent of the Trust is indemnified against certain liabilities that may arise out of the performance of their duties to the Funds. Additionally, in the normal course of business, the Funds enter into contracts, including each Funds’ servicing agreements, that contain a variety of indemnification clauses. Each Fund’s maximum exposure under these arrangements is unknown as this would involve future claims that may be made against such Fund that have not yet occurred. The risk of material loss as a result of such indemnification claims is considered remote. |
| H. | Foreign Currency Translations — Foreign currency is valued at the close of the NYSE based on quotations posted by banks and major currency dealers. Portfolio securities and other assets and liabilities denominated in foreign currencies are translated into U.S. dollar amounts at date of valuation. Purchases and sales of portfolio securities (net of foreign taxes withheld on disposition) and income items denominated in foreign currencies are translated into U.S. dollar amounts on the respective dates of such transactions. Each Fund does not separately account for the portion of the results of operations resulting from changes in foreign exchange rates on investments and the fluctuations arising from changes in market prices of securities held. The combined results of changes in foreign exchange rates and the fluctuation of market prices on investments (net of estimated foreign tax withholding) are included with the net realized and unrealized gain or loss from investments in the Statement of Operations. Reported net realized foreign currency gains or losses arise from (1) sales of foreign currencies, (2) currency gains or losses realized between the trade and settlement dates on securities transactions, and (3) the difference between the amounts of dividends, interest, and foreign withholding taxes recorded on each Fund’s books and the U.S. dollar equivalent of the amounts actually received or paid. Net unrealized foreign currency gains and losses arise from changes in the fair values of assets and liabilities, other than investments in securities at fiscal period end, resulting from changes in exchange rates. |
Each Fund may invest in foreign securities, which may be subject to foreign taxes on income, gains on investments or currency repatriation, a portion of which may be recoverable. Foreign taxes, if any, are recorded based on the tax regulations and rates that exist in the foreign markets in which each Fund invests and are shown in the Statement of Operations.
| I. | Forward Foreign Currency Contracts — Each Fund may engage in foreign currency transactions either on a spot (i.e. for prompt delivery and settlement) basis or through forward foreign currency contracts to manage or minimize currency or exchange rate risk. |
Each Fund may also enter into forward foreign currency contracts for the purchase or sale of a security denominated in a foreign currency in order to “lock in” the U.S. dollar price of that security, or each Fund may also enter into forward foreign currency contracts that do not provide for physical settlement of the two currencies, but instead are settled by a single cash payment calculated as the difference between the agreed upon exchange rate and the spot rate at settlement based upon an agreed upon notional amount (non-deliverable forwards). Each Fund will set aside liquid assets in an amount equal to daily mark-to-market obligation for forward foreign currency contracts.
31 Invesco Allocation Funds
A forward foreign currency contract is an obligation between two parties (“Counterparties”) to purchase or sell a specific currency for an agreed-upon price at a future date. The use of forward foreign currency contracts does not eliminate fluctuations in the price of the underlying securities each Fund owns or intends to acquire but establishes a rate of exchange in advance. Fluctuations in the value of these contracts are measured by the difference in the contract date and reporting date exchange rates and are recorded as unrealized appreciation (depreciation) until the contracts are closed. When the contracts are closed, realized gains (losses) are recorded. Realized and unrealized gains (losses) on the contracts are included in the Statement of Operations. The primary risks associated with forward foreign currency contracts include failure of the Counterparty to meet the terms of the contract and the value of the foreign currency changing unfavorably. These risks may be in excess of the amounts reflected in the Statement of Assets and Liabilities.
NOTE 2—Advisory Fees and Other Fees Paid to Affiliates
The Trust has entered into a master investment advisory agreement with Invesco. Under the terms of the investment advisory agreement, the Funds do not pay an advisory fee. However, each Fund pays advisory fees to Invesco indirectly as a shareholder of the underlying funds.
Under the terms of a master sub-advisory agreement between the Adviser and each of Invesco Asset Management Deutschland GmbH, Invesco Asset Management Limited, Invesco Asset Management (Japan) Limited, Invesco Australia Limited, Invesco Hong Kong Limited, Invesco Senior Secured Management, Inc. and Invesco Canada Ltd. (collectively, the “Affiliated Sub-Advisers”) the Adviser, not the Funds, may pay 40% of the fees paid to the Adviser to any such Affiliated Sub-Adviser(s) that provide(s) discretionary investment management services to each Fund based on the percentage of assets allocated to such Sub-Adviser(s).
Invesco has contractually agreed, through June 30, 2015, to reimburse expenses to the extent necessary to limit total annual fund operating expenses after expense reimbursement (excluding certain items discussed below) of Class A, Class B, Class C, Class R, Class S, Class Y and Class R5 shares for each Fund as shown in the following table:
| Class A | Class B | Class C | Class R | Class S | Class Y | Class R5 | ||||||||
Invesco Conservative Allocation Fund | 1.50% | 2.25% | 2.25% | 1.75% | 1.40% | 1.25% | 1.25% | |||||||
Invesco Growth Allocation Fund | 2.00% | 2.75% | 2.75% | 2.25% | 1.90% | 1.75% | 1.75% | |||||||
Invesco Moderate Allocation Fund | 1.50% | 2.25% | 2.25% | 1.75% | 1.40% | 1.25% | 1.25% |
In determining Invesco’s obligation to reimburse expenses, the following expenses are not taken into account, and could cause the total annual fund operating expenses after expense reimbursement to exceed the numbers reflected above: (1) interest; (2) taxes; (3) dividend expense on short sales; (4) extraordinary or non-routine items, including litigation expenses; and (5) expenses that the Fund has incurred but did not actually pay because of an expense offset arrangement. Acquired Fund Fees and Expenses are not operating expenses of a Fund directly, but are fees and expenses, including management fees of the investment companies in which a Fund invests. As a result, the total annual fund operating expenses after expense reimbursement may exceed the expense limits above. Unless Invesco continues the fee waiver agreement, it will terminate on June 30, 2015. The fee waiver agreement cannot be terminated during its term. The Adviser did not waive fees and/or reimburse expenses during the period under this expense limitation.
The Trust has entered into a master administrative services agreement with Invesco pursuant to which each Fund has agreed to pay Invesco for certain administrative costs incurred in providing accounting services to such Fund. For the year ended December 31, 2014, expenses incurred under the agreement are shown in the Statement of Operations as Administrative services fees.
The Trust has entered into a transfer agency and service agreement with Invesco Investment Services, Inc. (“IIS”) pursuant to which each Fund has agreed to pay IIS a fee for providing transfer agency and shareholder services to the Fund and reimburse IIS for certain expenses incurred by IIS in the course of providing such services. IIS may make payments to intermediaries that provide omnibus account services, sub-accounting services and/or networking services. All fees payable by IIS to intermediaries that provide omnibus account services or sub-accounting are charged back to each Fund, subject to certain limitations approved by the Trust’s Board of Trustees. For the year ended December 31, 2014, expenses incurred under the agreement are shown in the Statement of Operations as Transfer agent fees.
The Trust has entered into master distribution agreements with Invesco Distributors, Inc. (“IDI”) to serve as the distributor for the Class A, Class B, Class C, Class R, Class S and Class R5 shares of each Fund. The Trust has adopted plans pursuant to Rule 12b-1 under the 1940 Act with respect to each Fund’s Class A, Class B, Class C, Class R and Class S shares (collectively, the “Plans”). Each Fund, pursuant to the Plans, pays IDI compensation at the annual rate of 0.25% of the average daily net assets of Class A shares, 1.00% of the average daily net assets of Class B and Class C shares and 0.50% of the average daily net assets of Class R shares and 0.15% of the average daily net assets of Class S shares. Of the Plan payments, up to 0.25% of the average daily net assets of Class A, Class B, Class C and Class R shares and 0.15% of the average daily net assets of Class S shares may be paid to furnish continuing personal shareholder services to customers who purchase and own shares of such classes. Any amounts not paid as a service fee under the Plans would constitute an asset-based sales charge. Rules of the Financial Industry Regulatory Authority (“FINRA”) impose a cap on the total sales charges, including asset-based sales charges, that may be paid by any class of shares of each Fund. For the year ended December 31, 2014, expenses incurred under the Plans are shown in the Statement of Operations as Distribution fees.
Front-end sales commissions and CDSC (collectively, the “sales charges”) are not recorded as expenses of the Funds. Front-end sales commissions are deducted from proceeds from the sales of Fund shares prior to investment in Class A shares of the Funds. CDSC are deducted from redemption proceeds prior to remittance to the shareholder. During the year ended December 31, 2014, IDI advised the Funds that IDI retained the following in front-end sales commissions from the sale of Class A shares and received the following in CDCS imposed on redemptions by shareholders:
| Front End Sales Charges | Contingent Deferred Sales Charges | |||||||||||||||
| Class A | Class A | Class B | Class C | |||||||||||||
Invesco Conservative Allocation Fund | $ | 119,676 | $ | 2,098 | $ | 12,813 | $ | 4,364 | ||||||||
Invesco Growth Allocation Fund | 333,358 | 1,443 | 38,941 | 12,955 | ||||||||||||
Invesco Moderate Allocation Fund | 271,017 | 2,595 | 24,928 | 7,728 | ||||||||||||
32 Invesco Allocation Funds
The underlying Invesco Funds pay no distribution fees for Class R6 shares and the Funds pay no sales loads or other similar compensation to IDI for acquiring underlying fund shares.
Certain officers and trustees of the Trust are officers and directors of the Adviser, IIS and/or IDI.
NOTE 3—Additional Valuation Information
GAAP defines fair value as the price that would be received to sell an asset or paid to transfer a liability in an orderly transaction between market participants at the measurement date, under current market conditions. GAAP establishes a hierarchy that prioritizes the inputs to valuation methods, giving the highest priority to readily available unadjusted quoted prices in an active market for identical assets (Level 1) and the lowest priority to significant unobservable inputs (Level 3), generally when market prices are not readily available or are unreliable. Based on the valuation inputs, the securities or other investments are tiered into one of three levels. Changes in valuation methods may result in transfers in or out of an investment’s assigned level:
| Level 1 — | Prices are determined using quoted prices in an active market for identical assets. |
| Level 2 — | Prices are determined using other significant observable inputs. Observable inputs are inputs that other market participants may use in pricing a security. These may include quoted prices for similar securities, interest rates, prepayment speeds, credit risk, yield curves, loss severities, default rates, discount rates, volatilities and others. |
| Level 3 — | Prices are determined using significant unobservable inputs. In situations where quoted prices or observable inputs are unavailable (for example, when there is little or no market activity for an investment at the end of the period), unobservable inputs may be used. Unobservable inputs reflect each Fund’s own assumptions about the factors market participants would use in determining fair value of the securities or instruments and would be based on the best available information. |
As of December 31, 2014, all of the securities in each Fund were valued based on Level 1 inputs (see the Schedule of Investments for security categories). The level assigned to the securities valuations may not be an indication of the risk or liquidity associated with investing in those securities. Because of the inherent uncertainties of valuation, the values reflected in the financial statements may materially differ from the value received upon actual sale of those investments.
NOTE 4—Expense Offset Arrangement(s)
The expense offset arrangement is comprised of transfer agency credits which result from balances in demand deposit accounts used by the transfer agent for clearing shareholder transactions. For the year ended December 31, 2014, the Funds received credits from this arrangement, which resulted in the reduction of the Funds’ total expenses of:
| Transfer Agent Credits | ||||
Invesco Conservative Allocation Fund | $ | 1,312 | ||
Invesco Growth Allocation Fund | 6,832 | |||
Invesco Moderate Allocation Fund | 4,039 | |||
NOTE 5—Trustees’ and Officers’ Fees and Benefits
Trustees’ and Officers’ Fees and Benefits include amounts accrued by each Fund to pay remuneration to certain Trustees and Officers of such Fund. Trustees have the option to defer compensation payable by the Funds, and Trustees’ and Officers’ Fees and Benefits also include amounts accrued by each Fund to fund such deferred compensation amounts. Those Trustees who defer compensation have the option to select various Invesco Funds in which their deferral accounts shall be deemed to be invested. Finally, certain current Trustees were eligible to participate in a retirement plan that provided for benefits to be paid upon retirement to Trustees over a period of time based on the number of years of service. The Funds may have certain former Trustees who also participate in a retirement plan and receive benefits under such plan. Trustees’ and Officers’ Fees and Benefits include amounts accrued by each Fund to fund such retirement benefits. Obligations under the deferred compensation and retirement plans represent unsecured claims against the general assets of the Funds.
NOTE 6—Cash Balances
The Funds are permitted to temporarily carry a negative or overdrawn balance in their account with State Street Bank and Trust Company, the custodian bank. Such balances, if any at period end, are shown in the Statement of Assets and Liabilities under the payable caption Amount due custodian. To compensate the custodian bank for such overdrafts, the overdrawn Fund may either (1) leave funds as a compensating balance in the account so the custodian bank can be compensated by earning the additional interest; or (2) compensate by paying the custodian bank at a rate agreed upon by the custodian bank and Invesco, not to exceed the contractually agreed upon rate.
NOTE 7—Distributions to Shareholders and Tax Components of Net Assets
Tax Character of Distributions to Shareholders Paid During the Fiscal Years Ended December 31, 2014 and 2013:
| 2014 | 2013 | |||||||
| Ordinary Income | Ordinary Income | |||||||
Invesco Conservative Allocation Fund | $ | 8,538,697 | $ | 6,362,785 | ||||
Invesco Growth Allocation Fund | 18,469,850 | 15,902,491 | ||||||
Invesco Moderate Allocation Fund | 17,163,896 | 14,977,158 | ||||||
33 Invesco Allocation Funds
Tax Components of Net Assets at Period-End:
| Undistributed Ordinary Income | Net Unrealized Appreciation— Investments | Temporary Book/Tax Differences | Capital Loss Carryforward | Shares of Interest | Total Net Assets | |||||||||||||||||||
Invesco Conservative Allocation Fund | $ | 2,224,950 | $ | 26,057,400 | $ | (89,510 | ) | $ | (5,009,904 | ) | $ | 344,439,627 | $ | 367,622,563 | ||||||||||
Invesco Growth Allocation Fund | 647,606 | 171,565,279 | (212,265 | ) | (147,287,226 | ) | 1,146,786,175 | 1,171,499,569 | ||||||||||||||||
Invesco Moderate Allocation Fund | 3,597,557 | 106,265,714 | (151,468 | ) | (26,932,899 | ) | 839,880,238 | 922,659,142 | ||||||||||||||||
The difference between book-basis and tax-basis unrealized appreciation (depreciation) is due to differences in the timing of recognition of gains and losses on investments for tax and book purposes. The Funds net unrealized appreciation differences are attributable primarily to wash sales.
The temporary book/tax differences are a result of timing differences between book and tax recognition of income and/or expenses. The Funds temporary book/tax differences are the result of the trustee deferral of compensation and retirement plan benefits.
Capital loss carryforward is calculated and reported as of a specific date. Results of transactions and other activity after that date may affect the amount of capital loss carryforward actually available for the Funds to utilize. Capital losses generated in years beginning after December 22, 2010 can be carried forward for an unlimited period, whereas previous losses expire in eight tax years. Capital losses with an expiration period may not be used to offset capital gains until all net capital losses without an expiration date have been utilized. Capital loss carryforwards with no expiration date will retain their character as either short-term or long-term capital losses instead of as short-term capital losses as under prior law. The ability to utilize capital loss carryforward in the future may be limited under the Internal Revenue Code and related regulations based on the results of future transactions.
The Funds capital loss carryforward utilized in the current period to offset net realized capital gain for federal income tax purposes as follows:
Capital Loss Carryforward Utilized | ||||
Invesco Conservative Allocation Fund | $ | 7,702,970 | ||
Invesco Growth Allocation Fund | 50,950,827 | |||
Invesco Moderate Allocation Fund | 30,270,466 | |||
The Funds have a capital loss carryforward as of December 31, 2014 which expires as follows:
| Invesco Conservative Allocation Fund | Invesco Growth Allocation Fund | Invesco Moderate Allocation Fund | ||||||||||||||||||||||||||||||||||
| Expiration* | Short-Term | Long-Term | Total | Short-Term | Long-Term | Total | Short-Term | Long-Term | Total | |||||||||||||||||||||||||||
December 31, 2016 | $ | — | $ | — | $ | — | $ | 5,862,080 | $ | — | $ | 5,862,080 | $ | — | $ | — | $ | — | ||||||||||||||||||
December 31, 2017 | — | — | — | 85,916,771 | — | 85,916,771 | — | — | — | |||||||||||||||||||||||||||
December 31, 2018 | 5,009,904 | — | 5,009,904 | 55,508,375 | — | 55,508,375 | 26,932,899 | — | 26,932,899 | |||||||||||||||||||||||||||
| * | Capital loss carryforward as of the date listed above is reduced for limitations, if any, to the extent required by the Internal Revenue Code and may be further limited depending upon a variety of factors, including the realization of net unrealized gains or losses as of the date of any reorganization. |
NOTE 8—Investment Securities
The aggregate amount of investment securities purchased and sold by each Fund and aggregate cost and the net unrealized appreciation (depreciation) of investments for tax purposes are as follows:
| For the year ended December 31, 2014* | At December 31, 2014 | |||||||||||||||||||||||
| Federal Tax Cost** | Unrealized Appreciation | Unrealized (Depreciation) | Net Unrealized Appreciation | |||||||||||||||||||||
| Purchases | Sales | |||||||||||||||||||||||
Invesco Conservative Allocation Fund | $ | 39,012,594 | $ | 26,748,922 | $ | 341,428,456 | $ | 32,118,773 | $ | (6,061,373 | ) | $ | 26,057,400 | |||||||||||
Invesco Growth Allocation Fund | 233,482,840 | 216,758,377 | 1,000,835,666 | 192,025,762 | (20,460,483 | ) | 171,565,279 | |||||||||||||||||
Invesco Moderate Allocation Fund | 181,221,897 | 142,805,641 | 816,783,804 | 123,831,199 | (17,565,485 | ) | 106,265,714 | |||||||||||||||||
| * | Excludes U.S. Treasury obligations and money market funds, if any. |
| ** | Cost of investments on a tax basis includes the adjustments for financial reporting purposes as of the most recently completed federal income tax reporting period end. |
NOTE 9—Reclassification of Permanent Differences
Primarily as a result of differing book/tax treatment of distributions from underlying funds, on December 31, 2014. These reclassifications had no effect on the net assets of each Fund.
| Undistributed Net Investment Income | Undistributed Net Realized Gain (Loss) | |||||||
Invesco Conservative Allocation Fund | $ | 854,189 | $ | (854,189 | ) | |||
Invesco Growth Allocation Fund | 4,339,160 | (4,339,160 | ) | |||||
Invesco Moderate Allocation Fund | 2,808,451 | (2,808,451 | ) | |||||
34 Invesco Allocation Funds
NOTE 10—Share Information
Invesco Conservative Allocation Fund
| Summary of Share Activity | ||||||||||||||||
| Years ended December 31, | ||||||||||||||||
| 2014(a) | 2013 | |||||||||||||||
| Shares | Amount | Shares | Amount | |||||||||||||
Sold: | ||||||||||||||||
Class A | 4,247,570 | $ | 48,371,575 | 4,933,509 | $ | 54,133,289 | ||||||||||
Class B | 77,373 | 863,498 | 181,373 | 1,972,074 | ||||||||||||
Class C | 2,054,759 | 23,153,510 | 2,021,175 | 21,943,308 | ||||||||||||
Class R | 264,221 | 2,994,902 | 208,281 | 2,278,990 | ||||||||||||
Class S | 6,028 | 68,672 | 8,663 | 95,065 | ||||||||||||
Class Y | 184,377 | 2,093,033 | 117,607 | 1,295,784 | ||||||||||||
Class R5 | 44 | 500 | 1,988 | 21,970 | ||||||||||||
Issued as reinvestment of dividends: | ||||||||||||||||
Class A | 534,235 | 6,041,984 | 394,515 | 4,344,506 | ||||||||||||
Class B | 27,708 | 309,261 | 31,600 | 343,804 | ||||||||||||
Class C | 112,474 | 1,256,736 | 90,588 | 987,555 | ||||||||||||
Class R | 20,513 | 231,062 | 15,404 | 169,016 | ||||||||||||
Class S | 6,083 | 68,915 | 5,088 | 56,080 | ||||||||||||
Class Y | 8,550 | 96,629 | 6,305 | 69,363 | ||||||||||||
Class R5 | 21 | 236 | 42 | 464 | ||||||||||||
Automatic conversion of Class B shares to Class A shares: | ||||||||||||||||
Class A | 329,182 | 3,761,432 | 379,499 | 4,171,081 | ||||||||||||
Class B | (333,497 | ) | (3,761,432 | ) | (383,861 | ) | (4,171,081 | ) | ||||||||
Reacquired: | ||||||||||||||||
Class A | (4,505,474 | ) | (51,261,620 | ) | (5,061,037 | ) | (55,458,369 | ) | ||||||||
Class B | (331,615 | ) | (3,719,014 | ) | (662,326 | ) | (7,180,752 | ) | ||||||||
Class C | (1,557,347 | ) | (17,515,656 | ) | (1,771,800 | ) | (19,228,174 | ) | ||||||||
Class R | (237,802 | ) | (2,699,040 | ) | (196,107 | ) | (2,147,006 | ) | ||||||||
Class S | (47,988 | ) | (550,568 | ) | (23,141 | ) | (252,823 | ) | ||||||||
Class Y | (190,229 | ) | (2,152,284 | ) | (64,926 | ) | (705,684 | ) | ||||||||
Class R5 | (1,861 | ) | (21,004 | ) | (1 | ) | (13 | ) | ||||||||
Net increase in share activity | 667,325 | $ | 7,631,327 | 232,438 | $ | 2,738,447 | ||||||||||
| (a) | There are entities that are record owners of more than 5% of the outstanding shares of the Fund and in the aggregate own 36% of the outstanding shares of the Fund. IDI has an agreement with these entities to sell Fund shares. The Fund, Invesco and/or Invesco affiliates may make payments to these entities, which are considered to be related to the Fund, for providing services to the Fund, Invesco and/or Invesco affiliates including but not limited to services such as securities brokerage, distribution, third party record keeping and account servicing. The Fund has no knowledge as to whether all or any portion of the shares owned of record by these entities are also owned beneficially. |
35 Invesco Allocation Funds
NOTE 10—Share Information—(continued)
Invesco Growth Allocation Fund
| Summary of Share Activity | ||||||||||||||||
| Years ended December 31, | ||||||||||||||||
| 2014(a) | 2013 | |||||||||||||||
| Shares | Amount | Shares | Amount | |||||||||||||
Sold: | ||||||||||||||||
Class A | 7,201,794 | $ | 100,466,226 | 8,311,805 | $ | 107,222,702 | ||||||||||
Class B | 139,988 | 1,921,768 | 168,104 | 2,139,658 | ||||||||||||
Class C | 2,085,610 | 28,673,601 | 2,177,475 | 27,735,707 | ||||||||||||
Class R | 372,294 | 5,185,411 | 351,227 | 4,516,168 | ||||||||||||
Class S | 109,486 | 1,530,827 | 174,357 | �� | 2,229,275 | |||||||||||
Class Y | 213,175 | 2,985,897 | 171,608 | 2,209,248 | ||||||||||||
Class R5 | 6,200 | 86,669 | 13,530 | 176,789 | ||||||||||||
Issued as reinvestment of dividends: | ||||||||||||||||
Class A | 1,053,875 | 14,469,695 | 907,935 | 12,139,085 | ||||||||||||
Class B | 66,695 | 905,713 | 80,078 | 1,059,429 | ||||||||||||
Class C | 118,463 | 1,609,921 | 106,120 | 1,405,034 | ||||||||||||
Class R | 27,556 | 377,235 | 24,492 | 326,728 | ||||||||||||
Class S | 38,458 | 527,256 | 38,289 | 511,533 | ||||||||||||
Class Y | 7,472 | 102,365 | 5,402 | 72,116 | ||||||||||||
Class R5 | 584 | 8,050 | 480 | 6,444 | ||||||||||||
Issued in connection with acquisitions:(b) | ||||||||||||||||
Class A | — | — | 9,817,179 | 126,474,135 | ||||||||||||
Class B | — | — | 3,022,206 | 38,428,396 | ||||||||||||
Class C | — | — | 1,262,772 | 16,047,786 | ||||||||||||
Class Y | — | — | 78,928 | 1,015,518 | ||||||||||||
Automatic conversion of Class B shares to Class A shares: | ||||||||||||||||
Class A | 1,445,766 | 20,316,785 | 1,145,770 | 14,808,803 | ||||||||||||
Class B | (1,466,789 | ) | (20,316,785 | ) | (1,160,452 | ) | (14,808,803 | ) | ||||||||
Reacquired: | ||||||||||||||||
Class A | (9,475,239 | ) | (132,495,581 | ) | (9,316,203 | ) | (120,203,090 | ) | ||||||||
Class B | (1,189,352 | ) | (16,384,634 | ) | (1,164,915 | ) | (14,875,674 | ) | ||||||||
Class C | (2,296,253 | ) | (31,660,743 | ) | (2,271,534 | ) | (28,956,320 | ) | ||||||||
Class R | (451,317 | ) | (6,259,970 | ) | (408,157 | ) | (5,256,177 | ) | ||||||||
Class S | (462,393 | ) | (6,471,617 | ) | (518,320 | ) | (6,658,822 | ) | ||||||||
Class Y | (120,514 | ) | (1,686,195 | ) | (131,965 | ) | (1,723,555 | ) | ||||||||
Class R5 | (5,468 | ) | (76,137 | ) | (6,164 | ) | (81,293 | ) | ||||||||
Net increase (decrease) in share activity | (2,579,909 | ) | $ | (36,184,243 | ) | 12,880,047 | $ | 165,960,820 | ||||||||
| (a) | There are entities that are record owners of more than 5% of the outstanding shares of the Fund and in the aggregate own 26% of the outstanding shares of the Fund. IDI has an agreement with these entities to sell Fund shares. The Fund, Invesco and/or Invesco affiliates may make payments to these entities, which are considered to be related to the Fund, for providing services to the Fund, Invesco and/or Invesco affiliates including but not limited to services such as securities brokerage, distribution, third party record keeping and account servicing. The Fund has no knowledge as to whether all or any portion of the shares owned of record by these entities are also owned beneficially. |
| (b) | As of the opening of business on July 15, 2013, the Fund acquired all the net assets of Invesco Leaders Fund (the “Target Fund”) pursuant to a plan of reorganization approved by the Trustees of the Fund on December 6, 2012 and by the shareholders of the Target Fund on July 2, 2013. The acquisition was accomplished by a tax-free exchange of 14,181,085 shares of the Fund for 16,087,422 shares outstanding of the Target Fund as of the close of business on July 12, 2013. Shares of the Target Fund were exchanged for the like class of shares of the Fund, based on the relative net asset value of the Target Fund to the net asset value of the Fund on the close of business, July 12, 2013. The Target Fund’s net assets as of the close of business on July 12, 2013 of $181,965,835, including $50,107,876 of unrealized appreciation, were combined with those of the Fund. The net assets of the Fund immediately before the acquisition were $935,420,237 and $1,117,386,072 immediately after the acquisition. |
| The pro forma results of operations for the year ended December 31, 2013 assuming the reorganization had been completed on January 1, 2013, the beginning of the annual reporting period are as follows: |
Net investment income | $ | 8,777,032 | ||
Net realized/unrealized gains | 159,360,649 | |||
Change in net assets resulting from operations | $ | 168,137,681 |
| The combined investment portfolios have been managed as a single integrated portfolio since the acquisition was completed, it is not practicable to separate the amounts of revenue and earnings of the Target Fund that have been included in the Fund’s Statement of Operations since July 15, 2013. |
36 Invesco Allocation Funds
NOTE 10—Share Information—(continued)
Invesco Moderate Allocation Fund
| Summary of Share Activity | ||||||||||||||||
| Years ended December 31, | ||||||||||||||||
| 2014(a) | 2013 | |||||||||||||||
| Shares | Amount | Shares | Amount | |||||||||||||
Sold: | ||||||||||||||||
Class A | 7,840,472 | $ | 98,791,203 | 10,462,040 | $ | 124,386,470 | ||||||||||
Class B | 176,770 | 2,206,122 | 258,581 | 3,065,014 | ||||||||||||
Class C | 2,790,751 | 34,758,578 | 3,484,238 | 41,284,887 | ||||||||||||
Class R | 428,292 | 5,369,677 | 503,011 | 5,948,675 | ||||||||||||
Class S | 107,153 | 1,350,025 | 135,561 | 1,606,065 | ||||||||||||
Class Y | 419,065 | 5,316,276 | 202,552 | 2,442,553 | ||||||||||||
Class R5 | 14,674 | 189,351 | 6,499 | 77,233 | ||||||||||||
Issued as reinvestment of dividends: | ||||||||||||||||
Class A | 1,002,545 | 12,556,506 | 861,985 | 10,465,341 | ||||||||||||
Class B | 50,540 | 627,355 | 73,115 | 882,135 | ||||||||||||
Class C | 150,209 | 1,861,934 | 160,368 | 1,933,325 | ||||||||||||
Class R | 29,824 | 372,553 | 31,191 | 377,840 | ||||||||||||
Class S | 56,832 | 712,064 | 53,462 | 649,047 | ||||||||||||
Class Y | 9,036 | 113,568 | 4,515 | 54,907 | ||||||||||||
Class R5 | 379 | 4,776 | 333 | 4,052 | ||||||||||||
Automatic conversion of Class B shares to Class A shares: | ||||||||||||||||
Class A | 855,100 | 10,793,157 | 1,209,247 | 14,363,716 | ||||||||||||
Class B | (861,777 | ) | (10,793,157 | ) | (1,216,987 | ) | (14,363,716 | ) | ||||||||
Reacquired: | ||||||||||||||||
Class A | (8,382,865 | ) | (105,577,285 | ) | (8,957,005 | ) | (106,583,716 | ) | ||||||||
Class B | (723,949 | ) | (9,038,768 | ) | (943,395 | ) | (11,140,237 | ) | ||||||||
Class C | (2,626,947 | ) | (32,887,189 | ) | (2,518,091 | ) | (29,774,420 | ) | ||||||||
Class R | (658,693 | ) | (8,234,488 | ) | (468,819 | ) | (5,600,404 | ) | ||||||||
Class S | (532,330 | ) | (6,753,033 | ) | (527,533 | ) | (6,290,685 | ) | ||||||||
Class Y | (281,733 | ) | (3,562,210 | ) | (101,242 | ) | (1,221,023 | ) | ||||||||
Class R5 | (21,188 | ) | (272,683 | ) | (27,147 | ) | (320,213 | ) | ||||||||
Net increase (decrease) in share activity | (157,840 | ) | $ | (2,095,668 | ) | 2,686,479 | $ | 32,246,846 | ||||||||
| (a) | There are entities that are record owners of more than 5% of the outstanding shares of the Fund and in the aggregate own 25% of the outstanding shares of the Fund. IDI has an agreement with these entities to sell Fund shares. The Fund, Invesco and/or Invesco affiliates may make payments to these entities, which are considered to be related to the Fund, for providing services to the Fund, Invesco and/or Invesco affiliates including but not limited to services such as securities brokerage, distribution, third party record keeping and account servicing. The Fund has no knowledge as to whether all or any portion of the shares owned of record by these entities are also owned beneficially. |
37 Invesco Allocation Funds
NOTE 11—Financial Highlights
The following schedule presents financial highlights for a share of each Fund outstanding throughout the periods indicated.
Invesco Conservative Allocation Fund
| Net asset value, beginning of period | Net investment income(a) | Net gains (losses) on securities (both realized and unrealized) | Total from investment operations | Dividends from net investment income | Net asset value, end of period | Total return(b) | Net assets, end of period (000’s omitted) | Ratio of expenses to average net assets with fee waivers and/or expense reimbursements(c) | Ratio of expenses to average net assets without fee waivers and/or expense reimbursements | Ratio of net investment income to average net assets | Portfolio turnover(d) | |||||||||||||||||||||||||||||||||||||
Class A | ||||||||||||||||||||||||||||||||||||||||||||||||
Year ended 12/31/14 | $ | 11.08 | $ | 0.27 | $ | 0.28 | $ | 0.55 | $ | (0.29 | ) | $ | 11.34 | 5.01 | % | $ | 256,587 | 0.50 | %(e) | 0.50 | %(e) | 2.40 | %(e) | 7 | % | |||||||||||||||||||||||
Year ended 12/31/13 | 10.70 | 0.23 | 0.37 | 0.60 | (0.22 | ) | 11.08 | 5.58 | 243,852 | 0.50 | 0.50 | 2.06 | 20 | |||||||||||||||||||||||||||||||||||
Year ended 12/31/12 | 9.95 | 0.27 | 0.85 | 1.12 | (0.37 | ) | 10.70 | 11.28 | 228,512 | 0.46 | 0.49 | 2.55 | 9 | |||||||||||||||||||||||||||||||||||
Year ended 12/31/11 | 9.94 | 0.33 | 0.04 | 0.37 | (0.36 | ) | 9.95 | 3.77 | 201,299 | 0.39 | 0.53 | 3.26 | 27 | |||||||||||||||||||||||||||||||||||
Year ended 12/31/10 | 9.35 | 0.29 | 0.58 | 0.87 | (0.28 | ) | 9.94 | 9.33 | 46,954 | 0.39 | 0.73 | 3.04 | 70 | |||||||||||||||||||||||||||||||||||
Class B | ||||||||||||||||||||||||||||||||||||||||||||||||
Year ended 12/31/14 | 10.94 | 0.19 | 0.28 | 0.47 | (0.20 | ) | 11.21 | 4.34 | 17,243 | 1.25 | (e) | 1.25 | (e) | 1.65 | (e) | 7 | ||||||||||||||||||||||||||||||||
Year ended 12/31/13 | 10.60 | 0.14 | 0.37 | 0.51 | (0.17 | ) | 10.94 | 4.83 | 22,965 | 1.25 | 1.25 | 1.31 | 20 | |||||||||||||||||||||||||||||||||||
Year ended 12/31/12 | 9.87 | 0.19 | 0.83 | 1.02 | (0.29 | ) | 10.60 | 10.33 | 31,090 | 1.21 | 1.24 | 1.80 | 9 | |||||||||||||||||||||||||||||||||||
Year ended 12/31/11 | 9.88 | 0.25 | 0.05 | 0.30 | (0.31 | ) | 9.87 | 3.06 | 34,832 | 1.14 | 1.28 | 2.51 | 27 | |||||||||||||||||||||||||||||||||||
Year ended 12/31/10 | 9.30 | 0.22 | 0.56 | 0.78 | (0.20 | ) | 9.88 | 8.45 | 9,032 | 1.14 | 1.48 | 2.29 | 70 | |||||||||||||||||||||||||||||||||||
Class C | ||||||||||||||||||||||||||||||||||||||||||||||||
Year ended 12/31/14 | 10.96 | 0.19 | 0.28 | 0.47 | (0.20 | ) | 11.23 | 4.34 | 77,159 | 1.25 | (e) | 1.25 | (e) | 1.65 | (e) | 7 | ||||||||||||||||||||||||||||||||
Year ended 12/31/13 | 10.63 | 0.14 | 0.36 | 0.50 | (0.17 | ) | 10.96 | 4.73 | 68,657 | 1.25 | 1.25 | 1.31 | 20 | |||||||||||||||||||||||||||||||||||
Year ended 12/31/12 | 9.89 | 0.19 | 0.84 | 1.03 | (0.29 | ) | 10.63 | 10.41 | 62,919 | 1.21 | 1.24 | 1.80 | 9 | |||||||||||||||||||||||||||||||||||
Year ended 12/31/11 | 9.90 | 0.25 | 0.05 | 0.30 | (0.31 | ) | 9.89 | 3.05 | 56,322 | 1.14 | 1.28 | 2.51 | 27 | |||||||||||||||||||||||||||||||||||
Year ended 12/31/10 | 9.32 | 0.22 | 0.56 | 0.78 | (0.20 | ) | 9.90 | 8.43 | 14,494 | 1.14 | 1.48 | 2.29 | 70 | |||||||||||||||||||||||||||||||||||
Class R | ||||||||||||||||||||||||||||||||||||||||||||||||
Year ended 12/31/14 | 11.04 | 0.24 | 0.28 | 0.52 | (0.26 | ) | 11.30 | 4.75 | 10,211 | 0.75 | (e) | 0.75 | (e) | 2.15 | (e) | 7 | ||||||||||||||||||||||||||||||||
Year ended 12/31/13 | 10.67 | 0.20 | 0.37 | 0.57 | (0.20 | ) | 11.04 | 5.36 | 9,453 | 0.75 | 0.75 | 1.81 | 20 | |||||||||||||||||||||||||||||||||||
Year ended 12/31/12 | 9.93 | 0.24 | 0.84 | 1.08 | (0.34 | ) | 10.67 | 10.92 | 8,845 | 0.71 | 0.74 | 2.30 | 9 | |||||||||||||||||||||||||||||||||||
Year ended 12/31/11 | 9.92 | 0.30 | 0.05 | 0.35 | (0.34 | ) | 9.93 | 3.60 | 8,197 | 0.64 | 0.78 | 3.01 | 27 | |||||||||||||||||||||||||||||||||||
Year ended 12/31/10 | 9.34 | 0.27 | 0.56 | 0.83 | (0.25 | ) | 9.92 | 8.96 | 3,241 | 0.64 | 0.98 | 2.79 | 70 | |||||||||||||||||||||||||||||||||||
Class S | ||||||||||||||||||||||||||||||||||||||||||||||||
Year ended 12/31/14 | 11.09 | 0.29 | 0.28 | 0.57 | (0.30 | ) | 11.36 | 5.20 | 2,525 | 0.40 | (e) | 0.40 | (e) | 2.50 | (e) | 7 | ||||||||||||||||||||||||||||||||
Year ended 12/31/13 | 10.70 | 0.24 | 0.37 | 0.61 | (0.22 | ) | 11.09 | 5.73 | 2,863 | 0.40 | 0.40 | 2.16 | 20 | |||||||||||||||||||||||||||||||||||
Year ended 12/31/12 | 9.96 | 0.28 | 0.84 | 1.12 | (0.38 | ) | 10.70 | 11.27 | 2,864 | 0.36 | 0.39 | 2.65 | 9 | |||||||||||||||||||||||||||||||||||
Year ended 12/31/11(f) | 10.09 | 0.19 | (0.17 | ) | 0.02 | (0.15 | ) | 9.96 | 0.24 | 2,560 | 0.29 | (g) | 0.43 | (g) | 3.36 | (g) | 27 | |||||||||||||||||||||||||||||||
Class Y | ||||||||||||||||||||||||||||||||||||||||||||||||
Year ended 12/31/14 | 11.07 | 0.30 | 0.28 | 0.58 | (0.32 | ) | 11.33 | 5.28 | 3,871 | 0.25 | (e) | 0.25 | (e) | 2.65 | (e) | 7 | ||||||||||||||||||||||||||||||||
Year ended 12/31/13 | 10.67 | 0.25 | 0.38 | 0.63 | (0.23 | ) | 11.07 | 5.91 | 3,751 | 0.25 | 0.25 | 2.31 | 20 | |||||||||||||||||||||||||||||||||||
Year ended 12/31/12 | 9.93 | 0.30 | 0.84 | 1.14 | (0.40 | ) | 10.67 | 11.46 | 2,987 | 0.21 | 0.24 | 2.80 | 9 | |||||||||||||||||||||||||||||||||||
Year ended 12/31/11 | 9.92 | 0.35 | 0.04 | 0.39 | (0.38 | ) | 9.93 | 3.94 | 1,173 | 0.14 | 0.28 | 3.51 | 27 | |||||||||||||||||||||||||||||||||||
Year ended 12/31/10 | 9.34 | 0.32 | 0.56 | 0.88 | (0.30 | ) | 9.92 | 9.49 | 41 | 0.14 | 0.48 | 3.29 | 70 | |||||||||||||||||||||||||||||||||||
Class R5 | ||||||||||||||||||||||||||||||||||||||||||||||||
Year ended 12/31/14 | 11.13 | 0.31 | 0.29 | 0.60 | (0.33 | ) | 11.40 | 5.41 | 27 | 0.21 | (e) | 0.21 | (e) | 2.69 | (e) | 7 | ||||||||||||||||||||||||||||||||
Year ended 12/31/13 | 10.73 | 0.26 | 0.37 | 0.63 | (0.23 | ) | 11.13 | 5.92 | 47 | 0.20 | 0.20 | 2.36 | 20 | |||||||||||||||||||||||||||||||||||
Year ended 12/31/12 | 9.98 | 0.30 | 0.85 | 1.15 | (0.40 | ) | 10.73 | 11.56 | 23 | 0.17 | 0.21 | 2.83 | 9 | |||||||||||||||||||||||||||||||||||
Year ended 12/31/11 | 9.96 | 0.35 | 0.05 | 0.40 | (0.38 | ) | 9.98 | 4.03 | 77 | 0.14 | 0.21 | 3.51 | 27 | |||||||||||||||||||||||||||||||||||
Year ended 12/31/10 | 9.37 | 0.32 | 0.57 | 0.89 | (0.30 | ) | 9.96 | 9.57 | 32 | 0.14 | 0.36 | 3.29 | 70 | |||||||||||||||||||||||||||||||||||
| (a) | Calculated using average shares outstanding. |
| (b) | Includes adjustments in accordance with accounting principles generally accepted in the United States of America and as such, the net asset value for financial reporting purposes and the returns based upon those net asset values may differ from the net asset value and returns for shareholder transactions. Does not include sales charges and is not annualized for periods less than one year, if applicable. |
| (c) | In addition to the fees and expenses which the Fund bears directly; the Fund indirectly bears a pro rata share of the fees and expenses of the underlying funds in which the Fund invests. Because the underlying funds have varied expenses and fee levels and the Fund may own different proportions at different times, the amount of fees and expenses incurred indirectly by the Fund will vary. Estimated underlying fund expenses are not expenses that are incurred directly by your Fund. They are expenses that are incurred directly by the underlying funds and are deducted from the value of the funds your Fund invests in. The effect of the estimated underlying fund expenses that you bear indirectly is included in your Fund’s total return. Estimated acquired fund fees from underlying funds were 0.63%, 0.60%, 0.64%, 0.64% and 0.64% for the years ended December 31, 2014, December 31, 2013, December 31, 2012, December 31, 2011 and December 31, 2010, respectively. |
| (d) | Portfolio turnover is calculated at the fund level and is not annualized for periods less than one year, if applicable. For the year ending December 31, 2011, the portfolio turnover calculation excludes the value of securities purchased of $226,619,088 and sold of $49,277,466 in the effort to realign the Fund’s portfolio holdings after the reorganization of Invesco Conservative Allocation Fund and Invesco Van Kampen Asset Allocation Conservative Fund into the Fund. |
| (e) | Ratios are based on average daily net assets (000’s omitted) of $252,347, $20,338, $72,323, $10,029, $2,718, $3,685 and $35 for Class A, Class B, Class C, Class R, Class S, Class Y and Class R5 shares, respectively. |
| (f) | Commencement date of June 3, 2011 for Class S shares. |
| (g) | Annualized. |
38 Invesco Allocation Funds
NOTE 11—Financial Highlights—(continued)
Invesco Growth Allocation Fund
| Net asset value, beginning of period | Net investment income (a) | Net gains (losses) on securities (both realized and unrealized) | Total from investment operations | Dividends from net investment income | Net asset value, end of period | Total return(b) | Net assets, end of period (000’s omitted) | Ratio of expenses to average net assets with fee waivers and/or expense reimbursements(c) | Ratio of expenses to average net assets without fee waivers and/or expense reimbursements | Ratio of net investment income (loss) to average net assets | Portfolio turnover(d) | |||||||||||||||||||||||||||||||||||||
Class A | ||||||||||||||||||||||||||||||||||||||||||||||||
Year ended 12/31/14 | $ | 13.61 | $ | 0.18 | $ | 0.41 | $ | 0.59 | $ | (0.25 | ) | $ | 13.95 | 4.35 | % | $ | 850,812 | 0.54 | %(e) | 0.54 | %(e) | 1.27 | %(e) | 18 | % | |||||||||||||||||||||||
Year ended 12/31/13 | 11.98 | 0.14 | 1.70 | 1.84 | (0.21 | ) | 13.61 | 15.37 | 827,241 | 0.51 | 0.51 | 1.03 | 39 | |||||||||||||||||||||||||||||||||||
Year ended 12/31/12 | 10.73 | 0.18 | 1.39 | 1.57 | (0.32 | ) | 11.98 | 14.68 | 597,879 | 0.46 | 0.55 | 1.55 | 10 | |||||||||||||||||||||||||||||||||||
Year ended 12/31/11 | 11.10 | 0.17 | (0.29 | ) | (0.12 | ) | (0.25 | ) | 10.73 | (1.13 | ) | 556,456 | 0.40 | 0.58 | 1.58 | 28 | ||||||||||||||||||||||||||||||||
Year ended 12/31/10 | 10.02 | 0.17 | 1.12 | 1.29 | (0.21 | ) | 11.10 | 12.91 | 285,192 | 0.46 | 0.61 | 1.69 | 73 | |||||||||||||||||||||||||||||||||||
Class B | ||||||||||||||||||||||||||||||||||||||||||||||||
Year ended 12/31/14 | 13.46 | 0.07 | 0.41 | 0.48 | (0.14 | ) | 13.80 | 3.56 | 91,798 | 1.29 | (e) | 1.29 | (e) | 0.52 | (e) | 18 | ||||||||||||||||||||||||||||||||
Year ended 12/31/13 | 11.87 | 0.04 | 1.67 | 1.71 | (0.12 | ) | 13.46 | 14.41 | 122,521 | 1.26 | 1.26 | 0.28 | 39 | |||||||||||||||||||||||||||||||||||
Year ended 12/31/12 | 10.64 | 0.09 | 1.37 | 1.46 | (0.23 | ) | 11.87 | 13.73 | 96,852 | 1.21 | 1.30 | 0.80 | 10 | |||||||||||||||||||||||||||||||||||
Year ended 12/31/11 | 10.93 | 0.09 | (0.28 | ) | (0.19 | ) | (0.10 | ) | 10.64 | (1.79 | ) | 110,133 | 1.15 | 1.33 | 0.83 | 28 | ||||||||||||||||||||||||||||||||
Year ended 12/31/10 | 9.88 | 0.10 | 1.09 | 1.19 | (0.14 | ) | 10.93 | 12.02 | 69,723 | 1.21 | 1.36 | 0.94 | 73 | |||||||||||||||||||||||||||||||||||
Class C | ||||||||||||||||||||||||||||||||||||||||||||||||
Year ended 12/31/14 | 13.47 | 0.07 | 0.41 | 0.48 | (0.14 | ) | 13.81 | 3.56 | 168,737 | 1.29 | (e) | 1.29 | (e) | 0.52 | (e) | 18 | ||||||||||||||||||||||||||||||||
Year ended 12/31/13 | 11.87 | 0.04 | 1.68 | 1.72 | (0.12 | ) | 13.47 | 14.50 | 165,853 | 1.26 | 1.26 | 0.28 | 39 | |||||||||||||||||||||||||||||||||||
Year ended 12/31/12 | 10.64 | 0.09 | 1.37 | 1.46 | (0.23 | ) | 11.87 | 13.73 | 131,069 | 1.21 | 1.30 | 0.80 | 10 | |||||||||||||||||||||||||||||||||||
Year ended 12/31/11 | 10.93 | 0.09 | (0.28 | ) | (0.19 | ) | (0.10 | ) | 10.64 | (1.79 | ) | 124,789 | 1.15 | 1.33 | 0.83 | 28 | ||||||||||||||||||||||||||||||||
Year ended 12/31/10 | 9.88 | 0.10 | 1.09 | 1.19 | (0.14 | ) | 10.93 | 12.02 | 74,096 | 1.21 | 1.36 | 0.94 | 73 | |||||||||||||||||||||||||||||||||||
Class R | ||||||||||||||||||||||||||||||||||||||||||||||||
Year ended 12/31/14 | 13.57 | 0.14 | 0.41 | 0.55 | (0.21 | ) | 13.91 | 4.09 | 25,309 | 0.79 | (e) | 0.79 | (e) | 1.02 | (e) | 18 | ||||||||||||||||||||||||||||||||
Year ended 12/31/13 | 11.95 | 0.10 | 1.70 | 1.80 | (0.18 | ) | 13.57 | 15.08 | 25,394 | 0.76 | 0.76 | 0.78 | 39 | |||||||||||||||||||||||||||||||||||
Year ended 12/31/12 | 10.71 | 0.15 | 1.38 | 1.53 | (0.29 | ) | 11.95 | 14.32 | 22,751 | 0.71 | 0.80 | 1.30 | 10 | |||||||||||||||||||||||||||||||||||
Year ended 12/31/11 | 11.05 | 0.15 | (0.29 | ) | (0.14 | ) | (0.20 | ) | 10.71 | (1.32 | ) | 21,917 | 0.65 | 0.83 | 1.33 | 28 | ||||||||||||||||||||||||||||||||
Year ended 12/31/10 | 9.98 | 0.15 | 1.11 | 1.26 | (0.19 | ) | 11.05 | 12.61 | 14,761 | 0.71 | 0.86 | 1.44 | 73 | |||||||||||||||||||||||||||||||||||
Class S | ||||||||||||||||||||||||||||||||||||||||||||||||
Year ended 12/31/14 | 13.60 | 0.19 | 0.40 | 0.59 | (0.26 | ) | 13.93 | 4.38 | 28,380 | 0.44 | (e) | 0.44 | (e) | 1.37 | (e) | 18 | ||||||||||||||||||||||||||||||||
Year ended 12/31/13 | 11.97 | 0.15 | 1.70 | 1.85 | (0.22 | ) | 13.60 | 15.49 | 31,974 | 0.41 | 0.41 | 1.13 | 39 | |||||||||||||||||||||||||||||||||||
Year ended 12/31/12 | 10.73 | 0.19 | 1.38 | 1.57 | (0.33 | ) | 11.97 | 14.70 | 31,803 | 0.36 | 0.45 | 1.65 | 10 | |||||||||||||||||||||||||||||||||||
Year ended 12/31/11 | 11.10 | 0.19 | (0.29 | ) | (0.10 | ) | (0.27 | ) | 10.73 | (0.96 | ) | 30,420 | 0.30 | 0.48 | 1.68 | 28 | ||||||||||||||||||||||||||||||||
Year ended 12/31/10 | 10.02 | 0.18 | 1.12 | 1.30 | (0.22 | ) | 11.10 | 13.02 | 32,295 | 0.36 | 0.51 | 1.79 | 73 | |||||||||||||||||||||||||||||||||||
Class Y | ||||||||||||||||||||||||||||||||||||||||||||||||
Year ended 12/31/14 | 13.58 | 0.21 | 0.41 | 0.62 | (0.28 | ) | 13.92 | 4.63 | 6,090 | 0.29 | (e) | 0.29 | (e) | 1.52 | (e) | 18 | ||||||||||||||||||||||||||||||||
Year ended 12/31/13 | 11.96 | 0.17 | 1.69 | 1.86 | (0.24 | ) | 13.58 | 15.56 | 4,584 | 0.26 | 0.26 | 1.28 | 39 | |||||||||||||||||||||||||||||||||||
Year ended 12/31/12 | 10.72 | 0.21 | 1.38 | 1.59 | (0.35 | ) | 11.96 | 14.88 | 2,553 | 0.21 | 0.30 | 1.80 | 10 | |||||||||||||||||||||||||||||||||||
Year ended 12/31/11 | 11.10 | 0.20 | (0.28 | ) | (0.08 | ) | (0.30 | ) | 10.72 | (0.79 | ) | 2,585 | 0.15 | 0.33 | 1.83 | 28 | ||||||||||||||||||||||||||||||||
Year ended 12/31/10 | 10.02 | 0.20 | 1.12 | 1.32 | (0.24 | ) | 11.10 | 13.17 | 1,278 | 0.21 | 0.36 | 1.94 | 73 | |||||||||||||||||||||||||||||||||||
Class R5 | ||||||||||||||||||||||||||||||||||||||||||||||||
Year ended 12/31/14 | 13.66 | 0.23 | 0.41 | 0.64 | (0.30 | ) | 14.00 | 4.71 | 374 | 0.17 | (e) | 0.17 | (e) | 1.64 | (e) | 18 | ||||||||||||||||||||||||||||||||
Year ended 12/31/13 | 12.02 | 0.18 | 1.71 | 1.89 | (0.25 | ) | 13.66 | 15.75 | 346 | 0.16 | 0.16 | 1.38 | 39 | |||||||||||||||||||||||||||||||||||
Year ended 12/31/12 | 10.78 | 0.23 | 1.38 | 1.61 | (0.37 | ) | 12.02 | 14.95 | 211 | 0.15 | 0.16 | 1.86 | 10 | |||||||||||||||||||||||||||||||||||
Year ended 12/31/11 | 11.17 | 0.21 | (0.29 | ) | (0.08 | ) | (0.31 | ) | 10.78 | (0.78 | ) | 43 | 0.13 | 0.13 | 1.85 | 28 | ||||||||||||||||||||||||||||||||
Year ended 12/31/10 | 10.08 | 0.21 | 1.12 | 1.33 | (0.24 | ) | 11.17 | 13.24 | 112 | 0.13 | 0.13 | 2.02 | 73 | |||||||||||||||||||||||||||||||||||
| (a) | Calculated using average shares outstanding. |
| (b) | Includes adjustments in accordance with accounting principles generally accepted in the United States of America and as such, the net asset value for financial reporting purposes and the returns based upon those net asset values may differ from the net asset value and returns for shareholder transactions. Does not include sales charges and is not annualized for periods less than one year, if applicable. |
| (c) | In addition to the fees and expenses which the Fund bears directly; the Fund indirectly bears a pro rata share of the fees and expenses of the underlying funds in which the Fund invests. Because the underlying funds have varied expenses and fee levels and the Fund may own different proportions at different times, the amount of fees and expenses incurred indirectly by the Fund will vary. Estimated underlying fund expenses are not expenses that are incurred directly by your Fund. They are expenses that are incurred directly by the underlying funds and are deducted from the value of the funds your Fund invests in. The effect of the estimated underlying fund expenses that you bear indirectly is included in your Fund’s total return. Estimated acquired fund fees from underlying funds were 0.69%, 0.74%, 0.78%, 0.78% and 0.77% for the years ended December 31, 2014, December 31, 2013, December 31, 2012, December 31, 2011 and December 31, 2010, respectively. |
| (d) | Portfolio turnover is calculated at the fund level and is not annualized for periods less than one year, if applicable. For the year ending December 31, 2013, the portfolio turnover calculation excludes the value of securities purchased of $131,262,377 and sold of $75,210,289 in the effort to realign the Fund’s portfolio holdings after the reorganization of Invesco Leaders Fund into the Fund. For the year ending December 31, 2011, the portfolio turnover calculation excludes the value of securities purchased of $430,512,343 and sold of $117,636,196 in the effort to realign the Fund’s portfolio holdings after the reorganization of Invesco Moderate Growth Fund and Invesco Van Kampen Asset Allocation Growth Fund into the Fund. |
| (e) | Ratios are based on average daily net assets (000’s omitted) of $847,939, $108,182, $169,597, $25,415, $30,354, $5,262 and $370 for Class A, Class B, Class C, Class R, Class S, Class Y and Class R5 shares, respectively. |
39 Invesco Allocation Funds
NOTE 11—Financial Highlights—(continued)
Invesco Moderate Allocation Fund
| Net asset value, beginning of period | Net investment income(a) | Net gains (losses) on securities (both realized and unrealized) | Total from investment operations | Dividends from net investment income | Net asset value, end of period | Total return(b) | Net assets, end of period (000’s omitted) | Ratio of expenses to average net assets with fee waivers and/or expense reimbursements(c) | Ratio of expenses to average net assets without fee waivers and/or expense reimbursements | Ratio of net investment income to average net assets | Portfolio turnover(d) | |||||||||||||||||||||||||||||||||||||
Class A | ||||||||||||||||||||||||||||||||||||||||||||||||
Year ended 12/31/14 | $ | 12.30 | $ | 0.23 | $ | 0.31 | $ | 0.54 | $ | (0.26 | ) | $ | 12.58 | 4.39 | % | $ | 659,139 | 0.47 | %(e) | 0.47 | %(e) | 1.83 | %(e) | 15 | % | |||||||||||||||||||||||
Year ended 12/31/13 | 11.32 | 0.19 | 1.01 | 1.20 | (0.22 | ) | 12.30 | 10.61 | 628,036 | 0.46 | 0.46 | 1.61 | 23 | |||||||||||||||||||||||||||||||||||
Year ended 12/31/12 | 10.39 | 0.24 | 1.13 | 1.37 | (0.44 | ) | 11.32 | 13.18 | 537,812 | 0.43 | 0.48 | 2.10 | 11 | |||||||||||||||||||||||||||||||||||
Year ended 12/31/11 | 10.50 | 0.24 | (0.11 | ) | 0.13 | (0.24 | ) | 10.39 | 1.26 | 481,483 | 0.37 | 0.51 | 2.30 | 26 | ||||||||||||||||||||||||||||||||||
Year ended 12/31/10 | 9.63 | 0.29 | 0.86 | 1.15 | (0.28 | ) | 10.50 | 12.03 | 334,067 | 0.37 | 0.52 | 2.87 | 69 | |||||||||||||||||||||||||||||||||||
Class B | ||||||||||||||||||||||||||||||||||||||||||||||||
Year ended 12/31/14 | 12.21 | 0.13 | 0.31 | 0.44 | (0.16 | ) | 12.49 | 3.62 | 48,796 | 1.22 | (e) | 1.22 | (e) | 1.08 | (e) | 15 | ||||||||||||||||||||||||||||||||
Year ended 12/31/13 | 11.28 | 0.10 | 1.00 | 1.10 | (0.17 | ) | 12.21 | 9.78 | 64,268 | 1.21 | 1.21 | 0.86 | 23 | |||||||||||||||||||||||||||||||||||
Year ended 12/31/12 | 10.35 | 0.15 | 1.13 | 1.28 | (0.35 | ) | 11.28 | 12.37 | 80,029 | 1.18 | 1.23 | 1.35 | 11 | |||||||||||||||||||||||||||||||||||
Year ended 12/31/11 | 10.46 | 0.16 | (0.10 | ) | 0.06 | (0.17 | ) | 10.35 | 0.52 | 93,053 | 1.12 | 1.26 | 1.55 | 26 | ||||||||||||||||||||||||||||||||||
Year ended 12/31/10 | 9.59 | 0.21 | 0.87 | 1.08 | (0.21 | ) | 10.46 | 11.25 | 79,150 | 1.12 | 1.27 | 2.12 | 69 | |||||||||||||||||||||||||||||||||||
Class C | ||||||||||||||||||||||||||||||||||||||||||||||||
Year ended 12/31/14 | 12.20 | 0.13 | 0.31 | 0.44 | (0.16 | ) | 12.48 | 3.62 | 154,724 | 1.22 | (e) | 1.22 | (e) | 1.08 | (e) | 15 | ||||||||||||||||||||||||||||||||
Year ended 12/31/13 | 11.27 | 0.10 | 1.00 | 1.10 | (0.17 | ) | 12.20 | 9.79 | 147,372 | 1.21 | 1.21 | 0.86 | 23 | |||||||||||||||||||||||||||||||||||
Year ended 12/31/12 | 10.34 | 0.15 | 1.13 | 1.28 | (0.35 | ) | 11.27 | 12.38 | 123,505 | 1.18 | 1.23 | 1.35 | 11 | |||||||||||||||||||||||||||||||||||
Year ended 12/31/11 | 10.46 | 0.16 | (0.11 | ) | 0.05 | (0.17 | ) | 10.34 | 0.42 | 115,040 | 1.12 | 1.26 | 1.55 | 26 | ||||||||||||||||||||||||||||||||||
Year ended 12/31/10 | 9.59 | 0.21 | 0.87 | 1.08 | (0.21 | ) | 10.46 | 11.26 | 104,060 | 1.12 | 1.27 | 2.12 | 69 | |||||||||||||||||||||||||||||||||||
Class R | ||||||||||||||||||||||||||||||||||||||||||||||||
Year ended 12/31/14 | 12.27 | 0.20 | 0.30 | 0.50 | (0.22 | ) | 12.55 | 4.13 | 21,117 | 0.72 | (e) | 0.72 | (e) | 1.58 | (e) | 15 | ||||||||||||||||||||||||||||||||
Year ended 12/31/13 | 11.31 | 0.16 | 1.00 | 1.16 | (0.20 | ) | 12.27 | 10.30 | 23,099 | 0.71 | 0.71 | 1.36 | 23 | |||||||||||||||||||||||||||||||||||
Year ended 12/31/12 | 10.38 | 0.21 | 1.13 | 1.34 | (0.41 | ) | 11.31 | 12.91 | 20,557 | 0.68 | 0.73 | 1.85 | 11 | |||||||||||||||||||||||||||||||||||
Year ended 12/31/11 | 10.49 | 0.22 | (0.11 | ) | 0.11 | (0.22 | ) | 10.38 | 1.01 | 17,906 | 0.62 | 0.76 | 2.05 | 26 | ||||||||||||||||||||||||||||||||||
Year ended 12/31/10 | 9.62 | 0.26 | 0.87 | 1.13 | (0.26 | ) | 10.49 | 11.77 | 21,639 | 0.62 | 0.77 | 2.62 | 69 | |||||||||||||||||||||||||||||||||||
Class S | ||||||||||||||||||||||||||||||||||||||||||||||||
Year ended 12/31/14 | 12.29 | 0.24 | 0.32 | 0.56 | (0.27 | ) | 12.58 | 4.58 | 31,854 | 0.37 | (e) | 0.37 | (e) | 1.93 | (e) | 15 | ||||||||||||||||||||||||||||||||
Year ended 12/31/13 | 11.31 | 0.20 | 1.00 | 1.20 | (0.22 | ) | 12.29 | 10.68 | 35,661 | 0.36 | 0.36 | 1.71 | 23 | |||||||||||||||||||||||||||||||||||
Year ended 12/31/12 | 10.38 | 0.25 | 1.13 | 1.38 | (0.45 | ) | 11.31 | 13.31 | 36,651 | 0.33 | 0.38 | 2.20 | 11 | |||||||||||||||||||||||||||||||||||
Year ended 12/31/11 | 10.49 | 0.25 | (0.11 | ) | 0.14 | (0.25 | ) | 10.38 | 1.35 | 35,229 | 0.27 | 0.41 | 2.40 | 26 | ||||||||||||||||||||||||||||||||||
Year ended 12/31/10 | 9.62 | 0.30 | 0.86 | 1.16 | (0.29 | ) | 10.49 | 12.15 | 34,746 | 0.27 | 0.42 | 2.97 | 69 | |||||||||||||||||||||||||||||||||||
Class Y | ||||||||||||||||||||||||||||||||||||||||||||||||
Year ended 12/31/14 | 12.31 | 0.26 | 0.32 | 0.58 | (0.29 | ) | 12.60 | 4.74 | 6,870 | 0.22 | (e) | 0.22 | (e) | 2.08 | (e) | 15 | ||||||||||||||||||||||||||||||||
Year ended 12/31/13 | 11.32 | 0.22 | 1.00 | 1.22 | (0.23 | ) | 12.31 | 10.84 | 4,912 | 0.21 | 0.21 | 1.86 | 23 | |||||||||||||||||||||||||||||||||||
Year ended 12/31/12 | 10.39 | 0.27 | 1.13 | 1.40 | (0.47 | ) | 11.32 | 13.46 | 3,319 | 0.18 | 0.23 | 2.35 | 11 | |||||||||||||||||||||||||||||||||||
Year ended 12/31/11 | 10.50 | 0.27 | (0.11 | ) | 0.16 | (0.27 | ) | 10.39 | 1.49 | 1,851 | 0.12 | 0.26 | 2.55 | 26 | ||||||||||||||||||||||||||||||||||
Year ended 12/31/10 | 9.62 | 0.31 | 0.88 | 1.19 | (0.31 | ) | 10.50 | 12.42 | 1,085 | 0.12 | 0.27 | 3.12 | 69 | |||||||||||||||||||||||||||||||||||
Class R5 | ||||||||||||||||||||||||||||||||||||||||||||||||
Year ended 12/31/14 | 12.34 | 0.27 | 0.31 | 0.58 | (0.30 | ) | 12.62 | 4.71 | 159 | 0.16 | (e) | 0.16 | (e) | 2.14 | (e) | 15 | ||||||||||||||||||||||||||||||||
Year ended 12/31/13 | 11.35 | 0.23 | 1.00 | 1.23 | (0.24 | ) | 12.34 | 10.84 | 232 | 0.17 | 0.17 | 1.90 | 23 | |||||||||||||||||||||||||||||||||||
Year ended 12/31/12 | 10.42 | 0.27 | 1.13 | 1.40 | (0.47 | ) | 11.35 | 13.49 | 444 | 0.13 | 0.13 | 2.40 | 11 | |||||||||||||||||||||||||||||||||||
Year ended 12/31/11 | 10.53 | 0.27 | (0.11 | ) | 0.16 | (0.27 | ) | 10.42 | 1.50 | 1,110 | 0.10 | 0.10 | 2.57 | 26 | ||||||||||||||||||||||||||||||||||
Year ended 12/31/10 | 9.66 | 0.32 | 0.86 | 1.18 | (0.31 | ) | 10.53 | 12.28 | 1,061 | 0.11 | 0.11 | 3.13 | 69 | |||||||||||||||||||||||||||||||||||
| (a) | Calculated using average shares outstanding. |
| (b) | Includes adjustments in accordance with accounting principles generally accepted in the United States of America and as such, the net asset value for financial reporting purposes and the returns based upon those net asset values may differ from the net asset value and returns for shareholder transactions. Does not include sales charges and is not annualized for periods less than one year, if applicable. |
| (c) | In addition to the fees and expenses which the Fund bears directly; the Fund indirectly bears a pro rata share of the fees and expenses of the underlying funds in which the Fund invests. Because the underlying funds have varied expenses and fee levels and the Fund may own different proportions at different times, the amount of fees and expenses incurred indirectly by the Fund will vary. Estimated underlying fund expenses are not expenses that are incurred directly by your Fund. They are expenses that are incurred directly by the underlying funds and are deducted from the value of the funds your Fund invests in. The effect of the estimated underlying fund expenses that you bear indirectly is included in your Fund’s total return. Estimated acquired fund fees from underlying funds were 0.67%, 0.69%, 0.72%, 0.72% and 0.71% for the years ended December 31, 2014, December 31, 2013, December 31, 2012, December 31, 2011 and December 31, 2010, respectively. |
| (d) | Portfolio turnover is calculated at the fund level and is not annualized for periods less than one year, if applicable. For the year ending December 31, 2011, the portfolio turnover calculation excludes the value of securities purchased of $218,592,415 and sold of $61,446,608 in the effort to realign the Fund’s portfolio holdings after the reorganization of Invesco Van Kampen Asset Allocation Moderate Fund into the Fund. |
| (e) | Ratios are based on average daily net assets (000’s omitted) of $651,334, $56,749, $154,424, $21,765, $34,624, $6,320 and $245 for Class A, Class B, Class C, Class R, Class S, Class Y and Class R5 shares, respectively. |
40 Invesco Allocation Funds
Report of Independent Registered Public Accounting Firm
To the Board of Trustees of AIM Growth Series (Invesco Growth Series) and Shareholders of Invesco Conservative Allocation Fund, Invesco Growth Allocation Fund and Invesco Moderate Allocation Fund:
In our opinion, the accompanying statements of assets and liabilities, including the schedules of investments, and the related statements of operations and of changes in net assets and the financial highlights present fairly, in all material respects, the financial position of Invesco Conservative Allocation Fund, Invesco Growth Allocation Fund and Invesco Moderate Allocation Fund (three of the funds constituting AIM Growth Series (Invesco Growth Series), hereafter referred to as the “Funds”) at December 31, 2014, the results of each of their operations for the year then ended, the changes in each of their net assets for each of the two years in the period then ended and the financial highlights for each of the five years in the period then ended, in conformity with accounting principles generally accepted in the United States of America. These financial statements and financial highlights (hereafter referred to as “financial statements”) are the responsibility of the Funds’ management. Our responsibility is to express an opinion on these financial statements based on our audits. We conducted our audits of these financial statements in accordance with the standards of the Public Company Accounting Oversight Board (United States). Those standards require that we plan and perform the audit to obtain reasonable assurance about whether the financial statements are free of material misstatement. An audit includes examining, on a test basis, evidence supporting the amounts and disclosures in the financial statements, assessing the accounting principles used and significant estimates made by management, and evaluating the overall financial statement presentation. We believe that our audits, which included confirmation of securities at December 31, 2014 by correspondence with the custodian and transfer agent, provide a reasonable basis for our opinion.
PRICEWATERHOUSECOOPERS LLP
Houston, Texas
February 23, 2015
41 Invesco Allocation Funds
Calculating your ongoing Fund expenses
Example
As a shareholder of the Fund, you incur two types of costs: (1) transaction costs, which may include sales charges (loads) on purchase payments or contingent deferred sales charges on redemptions, if any; and (2) ongoing costs, including distribution and/or service (12b-1) fees, and other Fund expenses. This example is intended to help you understand your ongoing costs (in dollars) of investing in the Fund and to compare these costs with ongoing costs of investing in other mutual funds. The example is based on an investment of $1,000 invested at the beginning of the period and held for the entire period July 1, 2014, through December 31, 2014.
In addition to the fees and expenses which the Fund bears directly, the Fund indirectly bears a pro rata share of the fees and expenses of the underlying funds in which your Fund invests. The amount of fees and expenses incurred indirectly by your Fund will vary because the underlying funds have varied expenses and fee levels and the Fund may own different proportions of the underlying funds at different times. Estimated underlying fund expenses are not expenses that are incurred directly by your Fund. They are expenses that are incurred directly by the underlying funds and are deducted from the value of the underlying funds your Fund invests in. The effect of the estimated underlying fund expenses that you bear indirectly are included in your Fund’s total return.
Actual expenses
The table below provides information about actual account values and actual expenses. You may use the information in this table, together with the amount you invested, to estimate the expenses that you paid over the period. Simply divide your account value by $1,000 (for example, an $8,600 account value divided by $1,000 = 8.6), then multiply the result by the number in the table under the heading entitled “Actual Expenses Paid During Period” to estimate the expenses you paid on your account during this period.
Hypothetical example for comparison purposes
The table below also provides information about hypothetical account values and hypothetical expenses based on the Fund’s actual expense ratio and an assumed rate of return of 5% per year before expenses, which is not the Fund’s actual return.
The hypothetical account values and expenses may not be used to estimate the actual ending account balance or expenses you paid for the period. You may use this information to compare the ongoing costs of investing in the Fund and other funds. To do so, compare this 5% hypothetical example with the 5% hypothetical examples that appear in the shareholder reports of the other funds.
Please note that the expenses shown in the table are meant to highlight your ongoing costs only and do not reflect any transaction costs, such as sales charges (loads) on purchase payments or contingent deferred sales charges on redemptions, if any. Therefore, the hypothetical information is useful in comparing ongoing costs only, and will not help you determine the relative total costs of owning different funds. In addition, expenses shown in the table do not include the expenses of the underlying funds, which are borne indirectly by the Fund. If transaction costs and indirect expenses were included, your costs would have been higher.
Invesco Conservative Allocation Fund
| Class | Beginning Account Value (07/01/14) | ACTUAL | HYPOTHETICAL (5% annual return before expenses) | Annualized Expense Ratio | ||||||||||||||||||||
| Ending Account Value (12/31/14)1 | Expenses Paid During Period2 | Ending Account Value (12/31/14) | Expenses Paid During Period2 | |||||||||||||||||||||
| A | $ | 1,000.00 | $ | 992.80 | $ | 2.56 | $ | 1,022.63 | $ | 2.60 | 0.51 | % | ||||||||||||
| B | 1,000.00 | 989.60 | 6.32 | 1,018.85 | 6.41 | 1.26 | ||||||||||||||||||
| C | 1,000.00 | 989.60 | 6.32 | 1,018.85 | 6.41 | 1.26 | ||||||||||||||||||
| R | 1,000.00 | 992.30 | 3.82 | 1,021.37 | 3.87 | 0.76 | ||||||||||||||||||
| S | 1,000.00 | 994.20 | 2.06 | 1,023.14 | 2.09 | 0.41 | ||||||||||||||||||
| Y | 1,000.00 | 994.90 | 1.31 | 1,023.89 | 1.33 | 0.26 | ||||||||||||||||||
R5 | 1,000.00 | 995.30 | 0.70 | 1,024.50 | 0.71 | 0.14 | ||||||||||||||||||
42 Invesco Allocation Funds
Invesco Growth Allocation Fund
| Class | Beginning Account Value (07/01/14) | ACTUAL | HYPOTHETICAL (5% annual return before expenses) | Annualized Expense Ratio | ||||||||||||||||||||
| Ending Account Value (12/31/14)1 | Expenses Paid During Period2 | Ending Account Value (12/31/14) | Expenses Paid During Period2 | |||||||||||||||||||||
| A | $ | 1,000.00 | $ | 982.80 | $ | 2.65 | $ | 1,022.53 | $ | 2.70 | 0.53 | % | ||||||||||||
| B | 1,000.00 | 978.90 | 6.38 | 1,018.75 | 6.51 | 1.28 | ||||||||||||||||||
| C | 1,000.00 | 978.90 | 6.38 | 1,018.75 | 6.51 | 1.28 | ||||||||||||||||||
| R | 1,000.00 | 981.50 | 3.90 | 1,021.27 | 3.97 | 0.78 | ||||||||||||||||||
| S | 1,000.00 | 983.10 | 2.15 | 1,023.04 | 2.19 | 0.43 | ||||||||||||||||||
| Y | 1,000.00 | 983.90 | 1.40 | 1,023.79 | 1.43 | 0.28 | ||||||||||||||||||
| R5 | 1,000.00 | 984.50 | 0.85 | 1,024.35 | 0.87 | 0.17 | ||||||||||||||||||
Invesco Moderate Allocation Fund
| Class | Beginning Account Value (07/01/14) | ACTUAL | HYPOTHETICAL (5% annual return before expenses) | Annualized Expense Ratio | ||||||||||||||||||||
| Ending Account Value (12/31/14)1 | Expenses Paid During Period2 | Ending Account Value (12/31/14) | Expenses Paid During Period2 | |||||||||||||||||||||
| A | $ | 1,000.00 | $ | 985.50 | $ | 2.30 | $ | 1,022.89 | $ | 2.35 | 0.46 | % | ||||||||||||
| B | 1,000.00 | 981.50 | 6.04 | 1,019.11 | 6.16 | 1.21 | ||||||||||||||||||
| C | 1,000.00 | 981.50 | 6.04 | 1,019.11 | 6.16 | 1.21 | ||||||||||||||||||
| R | 1,000.00 | 983.40 | 3.55 | 1,021.63 | 3.62 | 0.71 | ||||||||||||||||||
| S | 1,000.00 | 986.00 | 1.80 | 1,023.39 | 1.84 | 0.36 | ||||||||||||||||||
| Y | 1,000.00 | 986.80 | 1.05 | 1,024.15 | 1.07 | 0.21 | ||||||||||||||||||
| R5 | 1,000.00 | 986.40 | 0.75 | 1,024.45 | 0.77 | 0.15 | ||||||||||||||||||
| 1 | The actual ending account value is based on the actual total return of the Funds for the period July 1, 2014, through December 31, 2014, after actual expenses and will differ from the hypothetical ending account value which is based on each Fund’s expense ratio and a hypothetical annual return of 5% before expenses. |
| 2 | Expenses are equal to each Fund’s annualized expense ratio as indicated above multiplied by the average account value over the period, multiplied by 184/365 to reflect the most recent fiscal half year. |
43 Invesco Allocation Funds
Tax Information
Form 1099-DIV, Form 1042-S and other year–end tax information provide shareholders with actual calendar year amounts that should be included in their tax returns. Shareholders should consult their tax advisors.
The following distribution information is being provided as required by the Internal Revenue Code or to meet a specific state’s requirement.
The Funds designate the following amounts or, if subsequently determined to be different, the maximum amount allowable for its fiscal year ended December 31, 2014:
Federal and State Income Tax | ||||||||||||
| Qualified Dividend Income* | Corporate Dividends Received Deduction* | U.S. Treasury Obligations* | ||||||||||
Invesco Conservative Allocation Fund | 21.72 | % | 9.61 | % | 9.16 | % | ||||||
Invesco Growth Allocation Fund | 79.65 | % | 38.35 | % | 4.41 | % | ||||||
Invesco Moderate Allocation Fund | 44.37 | % | 18.83 | % | 6.37 | % | ||||||
| * | The above percentages are based on ordinary income dividends paid to shareholders during the Fund’s fiscal year. |
44 Invesco Allocation Funds
Trustees and Officers
The address of each trustee and officer is AIM Growth Series (Invesco Growth Series) (the “Trust”), 11 Greenway Plaza, Suite 1000, Houston, Texas 77046-1173. The trustees serve for the life of the Trust, subject to their earlier death, incapacitation, resignation, retirement or removal as more specifically provided in the Trust’s organizational documents. Each officer serves for a one year term or until their successors are elected and qualified. Column two below includes length of time served with predecessor entities, if any.
Name, Year of Birth and Position(s) Held with the Trust | Trustee and/ or Officer Since | Principal Occupation(s) During Past 5 Years | Number of Funds in Fund Complex Overseen by Trustee | Other Directorship(s) Held by Trustee During | ||||
| Interested Persons | ||||||||
| Martin L. Flanagan1 — 1960 Trustee | 2007 | Executive Director, Chief Executive Officer and President, Invesco Ltd. (ultimate parent of Invesco and a global investment management firm); Advisor to the Board, Invesco Advisers, Inc. (formerly known as Invesco Institutional (N.A.), Inc.); Trustee, The Invesco Funds; Vice Chair, Investment Company Institute; and Member of Executive Board, SMU Cox School of Business
Formerly: Chairman and Chief Executive Officer, Invesco Advisers, Inc. (registered investment adviser); Director, Chairman, Chief Executive Officer and President, IVZ Inc. (holding company), INVESCO Group Services, Inc. (service provider) and Invesco North American Holdings, Inc. (holding company); Director, Chief Executive Officer and President, Invesco Holding Company Limited (parent of Invesco and a global investment management firm); Director, Invesco Ltd.; Chairman, Investment Company Institute and President, Co-Chief Executive Officer, Co-President, Chief Operating Officer and Chief Financial Officer, Franklin Resources, Inc. (global investment management organization). | 144 | None | ||||
Philip A. Taylor2 — 1954 Trustee, President and Principal Executive Officer | 2006 | Head of North American Retail and Senior Managing Director, Invesco Ltd.; Director, Co-Chairman, Co-President and Co-Chief Executive Officer, Invesco Advisers, Inc. (formerly known as Invesco Institutional (N.A.), Inc.) (registered investment adviser); Director, Chairman, Chief Executive Officer and President, Invesco Management Group, Inc. (formerly known as Invesco Aim Management Group, Inc.) (financial services holding company); Director and President, INVESCO Funds Group, Inc. (registered investment adviser and registered transfer agent); Director and Chairman, Invesco Investment Services, Inc. (formerly known as Invesco Aim Investment Services, Inc.) (registered transfer agent) and IVZ Distributors, Inc. (formerly known as INVESCO Distributors, Inc.) (registered broker dealer); Director, President and Chairman, Invesco Inc. (holding company) and Invesco Canada Holdings Inc. (holding company); Chief Executive Officer, Invesco Corporate Class Inc. (corporate mutual fund company) and Invesco Canada Fund Inc. (corporate mutual fund company); Director, Chairman and Chief Executive Officer, Invesco Canada Ltd. (formerly known as Invesco Trimark Ltd./Invesco Trimark Ltèe) (registered investment adviser and registered transfer agent); Trustee, President and Principal Executive Officer, The Invesco Funds (other than AIM Treasurer’s Series Trust (Invesco Treasurer’s Series Trust) and Short-Term Investments Trust); Trustee and Executive Vice President, The Invesco Funds (AIM Treasurer’s Series Trust (Invesco Treasurer’s Series Trust) and Short-Term Investments Trust only); Director, Invesco Investment Advisers LLC (formerly known as Van Kampen Asset Management); Director, Chief Executive Officer and President, Van Kampen Exchange Corp.
Formerly: Director and Chairman, Van Kampen Investor Services Inc.; Director, Chief Executive Officer and President, 1371 Preferred Inc. (holding company) and Van Kampen Investments Inc.; Director and President, AIM GP Canada Inc. (general partner for limited partnerships) and Van Kampen Advisors, Inc.; Director and Chief Executive Officer, Invesco Trimark Dealer Inc. (registered broker dealer); Director, Invesco Distributors, Inc. (formerly known as Invesco Aim Distributors, Inc.) (registered broker dealer); Manager, Invesco PowerShares Capital Management LLC; Director, Chief Executive Officer and President, Invesco Advisers, Inc.; Director, Chairman, Chief Executive Officer and President, Invesco Aim Capital Management, Inc.; President, Invesco Trimark Dealer Inc. and Invesco Trimark Ltd./Invesco Trimark Ltèe; Director and President, AIM Trimark Corporate Class Inc. and AIM Trimark Canada Fund Inc.; Senior Managing Director, Invesco Holding Company Limited; Director and Chairman, Fund Management Company (former registered broker dealer); President and Principal Executive Officer, The Invesco Funds (AIM Treasurer’s Series Trust (Invesco Treasurer’s Series Trust), and Short-Term Investments Trust only); President, AIM Trimark Global Fund Inc. and AIM Trimark Canada Fund Inc. | 144 | None | ||||
| Independent Trustees | ||||||||
Bruce L. Crockett — 1944 Trustee and Chair | 2001 | Chairman, Crockett Technologies Associates (technology consulting company)
Formerly: Director, Captaris (unified messaging provider); Director, President and Chief Executive Officer, COMSAT Corporation; Chairman, Board of Governors of INTELSAT (international communications company); ACE Limited (insurance company); and Investment Company Institute | 144 | ALPS (Attorneys Liability Protection Society) (insurance company) |
| 1 | Mr. Flanagan is considered an interested person (within the meaning of Section 2(a)(19) of the 1940 Act) of the Trust because he is an officer of the Adviser to the Trust, and an officer and a director of Invesco Ltd., ultimate parent of the Adviser. |
| 2 | Mr. Taylor is considered an interested person (within the meaning of Section 2(a)(19) of the 1940 Act) of the Trust because he is an officer and a director of the Adviser. |
T-1 Invesco Allocation Funds
Trustees and Officers—(continued)
Name, Year of Birth and Position(s) Held with the Trust | Trustee and/ or Officer Since | Principal Occupation(s) During Past 5 Years | Number of Funds in Fund Complex Overseen by Trustee | Other Directorship(s) Held by Trustee During | ||||
| Independent Trustees—(continued) | ||||||||
David C. Arch — 1945 Trustee | 2010 | Chairman of Blistex Inc., a consumer health care products manufacturer | 144 | Board member of the Illinois Manufacturers’ Association; Member of the Board of Visitors, Institute for the Humanities, University of Michigan; Member of the Audit Committee of the Edward-Elmhurst Hospital | ||||
James T. Bunch — 1942 Trustee | 2003 | Managing Member, Grumman Hill Group LLC (family office private equity investments)
Formerly: Founder, Green Manning & Bunch Ltd. (investment banking firm) (1988-2010); Executive Committee, United States Golf Association; and Director, Policy Studies, Inc. and Van Gilder Insurance Corporation | 144 | Chairman, Board of Governors, Western Golf Association; Chairman, Evans Scholars Foundation; and Director, Denver Film Society | ||||
Rodney F. Dammeyer — 1940 Trustee | 2010 | Chairman of CAC, LLC, (private company offering capital investment and management advisory services)
Formerly: Prior to 2001, Managing Partner at Equity Group Corporate Investments; Prior to 1995, Chief Executive Officer of Itel Corporation (formerly Anixter International); Prior to 1985, experience includes Senior Vice President and Chief Financial Officer of Household International, Inc., Executive Vice President and Chief Financial Officer of Northwest Industries, Inc. and Partner of Arthur Andersen & Co.; From 1987 to 2010, Director/Trustee of investment companies in the Van Kampen Funds complex | 144 | Director of Quidel Corporation and Stericycle, Inc. | ||||
Albert R. Dowden — 1941 Trustee | 2001 | Director of a number of public and private business corporations, including the Boss Group, Ltd. (private investment and management); Nature’s Sunshine Products, Inc. and Reich & Tang Funds (5 portfolios) (registered investment company)
Formerly: Director, Homeowners of America Holding Corporation/Homeowners of America Insurance Company (property casualty company); Director, Continental Energy Services, LLC (oil and gas pipeline service); Director, CompuDyne Corporation (provider of product and services to the public security market) and Director, Annuity and Life Re (Holdings), Ltd. (reinsurance company); Director, President and Chief Executive Officer, Volvo Group North America, Inc.; Senior Vice President, AB Volvo; Director of various public and private corporations; Chairman, DHJ Media, Inc.; Director, Magellan Insurance Company; and Director, The Hertz Corporation, Genmar Corporation (boat manufacturer), National Media Corporation; Advisory Board of Rotary Power International (designer, manufacturer, and seller of rotary power engines); and Chairman, Cortland Trust, Inc. (registered investment company) | 144 | Director of: Nature’s Sunshine Products, Inc., Reich & Tang Funds, Homeowners of America Holding Corporation/ Homeowners of America Insurance Company, the Boss Group | ||||
Jack M. Fields — 1952 Trustee | 2001 | Chief Executive Officer, Twenty First Century Group, Inc. (government affairs company); Owner and Chief Executive Officer, Dos Angeles Ranch, L.P. (cattle, hunting, corporate entertainment); and Discovery Global Education Fund (non-profit)
Formerly: Chief Executive Officer, Texana Timber LP (sustainable forestry company); Director of Cross Timbers Quail Research Ranch (non-profit); and member of the U.S. House of Representatives | 144 | Insperity, Inc. (formerly known as Administaff) | ||||
Prema Mathai-Davis — 1950 Trustee | 2001 | Retired. Formerly: Chief Executive Officer, YWCA of the U.S.A. | 144 | None | ||||
Larry Soll — 1942 Trustee | 2003 | Retired. Formerly: Chairman, Chief Executive Officer and President, Synergen Corp. (a biotechnology company) | 144 | None | ||||
Hugo F. Sonnenschein — 1940 Trustee | 2010 | President Emeritus and Honorary Trustee of the University of Chicago and the Adam Smith Distinguished Service Professor in the Department of Economics at the University of Chicago. Prior to 2000, President of the University of Chicago | 144 | Trustee of the University of Rochester and a member of its investment committee; Member of the National Academy of Sciences and the American Philosophical Society; Fellow of the American Academy of Arts and Sciences | ||||
Raymond Stickel, Jr. — 1944 Trustee | 2005 | Retired. Formerly: Director, Mainstay VP Series Funds, Inc. (25 portfolios) and Partner, Deloitte & Touche | 144 | None | ||||
T-2 Invesco Allocation Funds
Trustees and Officers—(continued)
Name, Year of Birth and Position(s) Held with the Trust | Trustee and/ or Officer Since | Principal Occupation(s) During Past 5 Years | Number of Funds in Fund Complex Overseen by Trustee | Other Directorship(s) Held by Trustee During | ||||
| Independent Trustees—(continued) | ||||||||
Suzanne H. Woolsey — 1941 Trustee | 2014 | Chief Executive Officer of Woolsey Partners LLC | 144 | Emeritus Chair of the Board of Trustees of the Institute for Defense Analyses; Trustee of Colorado College; Trustee of California Institute of Technology; Prior to 2014, Director of Fluor Corp.; Prior to 2010, Trustee of the German Marshall Fund of the United States; Prior to 2010 Trustee of the Rocky Mountain Institute | ||||
| Other Officers | ||||||||
Russell C. Burk — 1958 Senior Vice President and Senior Officer | 2005 | Senior Vice President and Senior Officer, The Invesco Funds | N/A | N/A | ||||
John M. Zerr — 1962 Senior Vice President, Chief Legal Officer and Secretary | 2006 | Director, Senior Vice President, Secretary and General Counsel, Invesco Management Group, Inc. (formerly known as Invesco Aim Management Group, Inc.) and Van Kampen Exchange Corp.; Senior Vice President, Invesco Advisers, Inc. (formerly known as Invesco Institutional (N.A.), Inc.) (registered investment adviser); Senior Vice President and Secretary, Invesco Distributors, Inc. (formerly known as Invesco Aim Distributors, Inc.); Director, Vice President and Secretary, Invesco Investment Services, Inc. (formerly known as Invesco Aim Investment Services, Inc.) and IVZ Distributors, Inc. (formerly known as INVESCO Distributors, Inc.); Director and Vice President, INVESCO Funds Group, Inc.; Senior Vice President, Chief Legal Officer and Secretary, The Invesco Funds; Manager, Invesco PowerShares Capital Management LLC; Director, Secretary and General Counsel, Invesco Investment Advisers LLC (formerly known as Van Kampen Asset Management); Secretary and General Counsel, Invesco Capital Markets, Inc. (formerly known as Van Kampen Funds Inc.) and Chief Legal Officer, PowerShares Exchange-Traded Fund Trust, PowerShares Exchange-Traded Fund Trust II, PowerShares India Exchange-Traded Fund Trust , PowerShares Actively Managed Exchange-Traded Fund Trust; and PowerShares Actively Managed Exchange-Traded Commodity Fund Trust
Formerly: Director and Vice President, Van Kampen Advisors Inc.; Director, Vice President, Secretary and General Counsel, Van Kampen Investor Services Inc.; Director, Invesco Distributors, Inc. (formerly known as Invesco Aim Distributors, Inc.); Director, Senior Vice President, General Counsel and Secretary, Invesco Aim Advisers, Inc. and Van Kampen Investments Inc.; Director, Vice President and Secretary, Fund Management Company; Director, Senior Vice President, Secretary, General Counsel and Vice President, Invesco Aim Capital Management, Inc.; Chief Operating Officer and General Counsel, Liberty Ridge Capital, Inc. (an investment adviser); Vice President and Secretary, PBHG Funds (an investment company) and PBHG Insurance Series Fund (an investment company); Chief Operating Officer, General Counsel and Secretary, Old Mutual Investment Partners (a broker-dealer); General Counsel and Secretary, Old Mutual Fund Services (an administrator) and Old Mutual Shareholder Services (a shareholder servicing center); Executive Vice President, General Counsel and Secretary, Old Mutual Capital, Inc. (an investment adviser); and Vice President and Secretary, Old Mutual Advisors Funds (an investment company) | N/A | N/A | ||||
Sheri Morris — 1964 Vice President, Treasurer and Principal Financial Officer | 1999 | Vice President, Treasurer and Principal Financial Officer, The Invesco Funds; Vice President, Invesco Advisers, Inc. (formerly known as Invesco Institutional (N.A.), Inc.) (registered investment adviser); and Vice President, PowerShares Exchange-Traded Fund Trust, PowerShares Exchange-Traded Fund Trust II, PowerShares India Exchange-Traded Fund Trust, PowerShares Actively Managed Exchange-Traded Fund Trust, and PowerShares Actively Managed Exchange-Traded Commodity Fund Trust
Formerly: Vice President, Invesco Aim Advisers, Inc., Invesco Aim Capital Management, Inc. and Invesco Aim Private Asset Management, Inc.; Assistant Vice President and Assistant Treasurer, The Invesco Funds and Assistant Vice President, Invesco Advisers, Inc., Invesco Aim Capital Management, Inc. and Invesco Aim Private Asset Management, Inc.; and Treasurer, PowerShares Exchange-Traded Fund Trust, PowerShares Exchange-Traded Fund Trust II, PowerShares India Exchange-Traded Fund Trust and PowerShares Actively Managed Exchange-Traded Fund Trust | N/A | N/A | ||||
T-3 Invesco Allocation Funds
Trustees and Officers—(continued)
Name, Year of Birth and Position(s) Held with the Trust | Trustee and/ or Officer Since | Principal Occupation(s) During Past 5 Years | Number of Funds in Fund Complex Overseen by Trustee | Other Directorship(s) Held by Trustee During | ||||
| Other Officers—(continued) | ||||||||
Karen Dunn Kelley — 1960 Vice President | 2004 | Senior Managing Director, Investments; Director, Co-President, Co-Chief Executive Officer, and Co-Chairman, Invesco Advisers, Inc. (formerly known as Invesco Institutional (N.A.), Inc.) (registered investment adviser); Chairman, Invesco Senior Secured Management, Inc.; Senior Vice President, Invesco Management Group, Inc. (formerly known as Invesco Aim Management Group, Inc.); Executive Vice President, Invesco Distributors, Inc. (formerly known as Invesco Aim Distributors, Inc.); Director, Invesco Mortgage Capital Inc. and Invesco Management Company Limited; Director and President, INVESCO Asset Management (Bermuda) Ltd., Vice President, The Invesco Funds (other than AIM Treasurer’s Series Trust (Invesco Treasurer’s Series Trust) and Short-Term Investments Trust); and President and Principal Executive Officer, The Invesco Funds (AIM Treasurer’s Series Trust (Invesco Treasurer’s Series Trust) and Short-Term Investments Trust only)
Formerly: Director, INVESCO Global Asset Management Limited and INVESCO Management S.A.; Senior Vice President, Van Kampen Investments Inc. and Invesco Advisers, Inc. (formerly known as Invesco Institutional (N.A.), Inc.) (registered investment adviser); Vice President, Invesco Advisers, Inc. (formerly known as Invesco Institutional (N.A.), Inc.); Director of Cash Management and Senior Vice President, Invesco Advisers, Inc. and Invesco Aim Capital Management, Inc.; Director and President, Fund Management Company; Chief Cash Management Officer, Director of Cash Management, Senior Vice President, and Managing Director, Invesco Aim Capital Management, Inc.; Director of Cash Management, Senior Vice President, and Vice President, Invesco Advisers, Inc. and The Invesco Funds (AIM Treasurer’s Series Trust (Invesco Treasurer’s Series Trust), and Short-Term Investments Trust only) | N/A | N/A | ||||
Crissie M. Wisdom — 1969 Anti-Money Laundering Compliance Officer | 2013 | Anti-Money Laundering Compliance Officer, Invesco Advisers, Inc. (formerly known as Invesco Institutional (N.A.), Inc.) (registered investment adviser), Invesco Capital Markets, Inc. (formerly known as Van Kampen Funds Inc.), Invesco Distributors, Inc., Invesco Investment Services, Inc., Invesco Management Group, Inc., Van Kampen Exchange Corp., The Invesco Funds, and PowerShares Exchange-Traded Fund Trust, PowerShares Exchange-Traded Fund Trust II, PowerShares India Exchange-Traded Fund Trust, PowerShares Actively Managed Exchange-Traded Fund Trust and PowerShares Actively Managed Exchange-Traded Commodity Fund Trust; and Fraud Prevention Manager and Controls and Risk Analysis Manager for Invesco Investment Services, Inc. | N/A | N/A | ||||
Todd L. Spillane — 1958 Chief Compliance Officer | 2006 | Senior Vice President, Invesco Management Group, Inc. (formerly known as Invesco Aim Management Group, Inc.) and Van Kampen Exchange Corp.; Senior Vice President and Chief Compliance Officer, Invesco Advisers, Inc. (registered investment adviser) (formerly known as Invesco Institutional (N.A.), Inc.); Chief Compliance Officer, The Invesco Funds; Vice President, Invesco Distributors, Inc. (formerly known as Invesco Aim Distributors, Inc.) and Invesco Investment Services, Inc. (formerly known as Invesco Aim Investment Services, Inc.)
Formerly: Chief Compliance Officer, Invesco Funds (Chicago); Senior Vice President, Van Kampen Investments Inc.; Senior Vice President and Chief Compliance Officer, Invesco Aim Advisers, Inc. and Invesco Aim Capital Management, Inc.; Chief Compliance Officer, INVESCO Private Capital Investments, Inc. (holding company), Invesco Private Capital, Inc. (registered investment adviser), Invesco Global Asset Management (N.A.), Inc., Invesco Senior Secured Management, Inc. (registered investment adviser), Van Kampen Investor Services Inc., PowerShares Exchange-Traded Fund Trust, PowerShares Exchange-Traded Fund Trust II, PowerShares India Exchange-Traded Fund Trust and PowerShares Actively Managed Exchange-Traded Fund Trust; and Vice President, Invesco Aim Capital Management, Inc. and Fund Management Company | N/A | N/A |
The Statement of Additional Information of the Trust includes additional information about the Fund’s Trustees and is available upon request, without charge, by calling 1.800.959.4246. Please refer to the Fund’s prospectus for information on the Fund’s sub-advisers.
Office of the Fund 11 Greenway Plaza, Suite 1000 Houston, TX 77046-1173 | Investment Adviser Invesco Advisers, Inc. 1555 Peachtree Street, N.E. Atlanta, GA 30309 | Distributor Invesco Distributors, Inc. 11 Greenway Plaza, Suite 1000 Houston, TX 77046-1173 | Auditors PricewaterhouseCoopers LLP 1000 Louisiana Street, Suite 5800 Houston, TX 77002-5678 | |||
Counsel to the Fund Stradley Ronon Stevens & Young, LLP 2005 Market Street, Suite 2600 Philadelphia, PA 19103-7018 | Counsel to the Independent Trustees Goodwin Procter LLP 901 New York Avenue, N.W. Washington, D.C. 20001 | Transfer Agent Invesco Investment Services, Inc. 11 Greenway Plaza, Suite 1000 Houston, TX 77046-1173 | Custodian State Street Bank and Trust Company 225 Franklin Street Boston, MA 02110-2801 | |||
T-4 Invesco Allocation Funds

Invesco mailing information
Send general correspondence to Invesco Investment Services, Inc., P.O. Box 219078, Kansas City, MO 64121-9078.
Important notice regarding delivery of security holder documents
To reduce Fund expenses, only one copy of most shareholder documents may be mailed to shareholders with multiple accounts at the same address (Householding). Mailing of your shareholder documents may be householded indefinitely unless you instruct us otherwise. If you do not want the mailing of these documents to be combined with those for other members of your household, please contact Invesco Investment Services, Inc. at 800 959 4246 or contact your financial institution. We will begin sending you individual copies for each account within 30 days after receiving your request.
Fund holdings and proxy voting information
The Fund provides a complete list of its holdings four times in each fiscal year, at the quarter ends. For the second and fourth quarters, the lists appear in the Fund’s semiannual and annual reports to shareholders. For the first and third quarters, the Fund files the lists with the Securities and Exchange Commission (SEC) on Form N-Q. The most recent list of portfolio holdings is available at invesco.com/completeqtrholdings. Shareholders can also look up the Fund’s Forms N-Q on the SEC website at sec.gov. Copies of the Fund’s Forms N-Q may be reviewed and copied at the SEC Public Reference Room in Washington, D.C. You can obtain information on the operation of the Public Reference Room, including information about duplicating fee charges, by calling 202 551 8090 or 800 732 0330, or by electronic request at the following email address: publicinfo@sec.gov. The SEC file numbers for the Fund are shown below.
A description of the policies and procedures that the Fund uses to determine how to vote proxies relating to portfolio securities is available without charge, upon request, from our Client Services department at 800 959 4246 or at invesco.com/proxyguidelines. The information is also available on the SEC website, sec.gov.
Information regarding how the Fund voted proxies related to its portfolio securities during the most recent 12-month period ended June 30 is available at invesco.com/proxysearch. The information is also available on the SEC website, sec.gov. Invesco Advisers, Inc. is an investment adviser; it provides investment advisory services to individual and institutional clients and does not sell securities. Invesco Distributors, Inc. is the US distributor for Invesco Ltd.’s retail mutual funds, exchange-traded funds and institutional money market funds. Both are wholly owned, indirect subsidiaries of Invesco Ltd. |  | |
SEC file numbers: 811-02699 and 002-57526 AAS-AR-1 Invesco Distributors, Inc. | ||

Letters to Shareholders
Philip Taylor | Dear Shareholders: This annual report includes information about your Fund, including performance data and a complete list of its investments as of the close of the reporting period. Inside, your Fund’s portfolio managers discuss how they managed your Fund and the factors that affected its performance during the reporting period. I hope you find this report of interest. During the reporting period, the US economy showed unmistakable signs of improvement. After contracting in the first quarter of 2014, the economy expanded strongly in the second and third quarters as employment data improved markedly. Given continuing positive economic trends, the US Federal Reserve (the Fed) ended its extraordinary asset purchase program in October – but it pledged in December to be “patient” before raising interest rates. Overseas, the story was much different. Concerns about economic stagnation and the potential for deflation depressed European markets, while the Chinese economy was hurt by a | |
| slowdown in manufacturing. | ||
Political change in Washington, DC; changes to monetary policy by the Fed and other central banks; the future direction of oil prices; and unexpected geopolitical events are likely to affect markets in the US and overseas in 2015. This may make some investors hesitant to begin to save for their long-term financial goals. That’s why Invesco has always encouraged investors to work with a professional financial adviser who can stress the importance of starting to save and invest early and the importance of adhering to a disciplined investment plan – when times are good and when they’re uncertain. A financial adviser who knows your unique financial situation, investment goals and risk tolerance can be an invaluable partner as you seek to achieve your financial goals. He or she can offer a long-term perspective when markets are volatile and time-tested advice and guidance when your financial situation or investment goals change. | ||

Timely information when and where you want it
Invesco’s efforts to help investors achieve their financial objectives include providing individual investors and financial professionals with timely information about the markets, the economy and investing – whenever and wherever they want it.
Our website, invesco.com/us, offers a wide range of market insights and investment perspectives. On the website, you’ll find detailed information about our funds, including prices, performance, holdings and portfolio manager commentaries. You can access information about your individual Invesco account whenever it’s convenient for you; just complete a simple, secure online registration. Use the “Log In” box on our home page to get started.
Invesco’s mobile apps for iPhone® and iPad® (both available free from the App StoreSM) allow you to obtain the same detailed information, monitor your account and create customizable watch lists. Also, they allow you to access investment insights from our investment leaders, market strategists, economists and retirement experts. You can sign up to be alerted when new commentary is added, and you can watch portfolio manager videos and have instant access to Invesco news and updates wherever you may be.
In addition to the resources accessible on our website and through our mobile app, you can obtain timely updates to help you stay informed about the markets, the economy and investing by connecting with Invesco on Twitter, LinkedIn or Facebook. You can access our blog at blog.invesco.us.com. Our goal is to provide you the information you want, when and where you want it.
Have questions?
For questions about your account, feel free to contact an Invesco client services representative at 800 959 4246. For Invesco-related questions or comments, please email me directly at phil@invesco.com.
All of us at Invesco look forward to serving your investment management needs for many years to come. Thank you for investing with us.
Sincerely,

Philip Taylor
Senior Managing Director, Invesco Ltd.
iPhone and iPad are trademarks of Apple Inc., registered in the US and other countries. App Store is a service mark of Apple Inc. Invesco Distributors, Inc. is not affiliated with Apple Inc.
| 2 | Invesco Convertible Securities Fund |
Bruce Crockett | Dear Fellow Shareholders: | |||
Among the many important lessons I’ve learned in more than 40 years in a variety of business endeavors is the value of a trusted advocate. | ||||
As independent chair of the Invesco Funds Board, I can assure you that the members of the Board are strong advocates for the interests of investors in Invesco’s mutual funds. We work hard to represent your interests through oversight of the quality of the investment management services your funds receive and other matters important to your investment, including but not limited to: | ||||
n | Ensuring that Invesco offers a diverse lineup of mutual funds that your financial adviser can use to strive to meet your financial needs as your investment goals change over time. | |||
n | Monitoring how the portfolio management teams of the Invesco funds are performing in light of changing economic and market conditions. | |||

| n | Assessing each portfolio management team’s investment performance within the context of the investment strategy described in the fund’s prospectus. |
| n | Monitoring for potential conflicts of interests that may impact the nature of the services that your funds receive. |
We believe one of the most important services we provide our fund shareholders is the annual review of the funds’ advisory and sub-advisory contracts with Invesco Advisers and its affiliates. This review is required by the Investment Company Act of 1940 and focuses on the nature and quality of the services Invesco provides as the adviser to the Invesco funds and the reasonableness of the fees that it charges for those services. Each year, we spend months carefully reviewing information received from Invesco and a variety of independent sources, such as performance and fee data prepared by Lipper Inc., an independent, third-party firm widely recognized as a leader in its field. We also meet with our independent legal counsel and other independent advisers to review and help us assess the information that we have received. Our goal is to assure that you receive quality investment management services for a reasonable fee.
I trust the measures outlined above provide assurance that you have a worthy advocate when it comes to choosing the Invesco Funds.
As always, please contact me at bruce@brucecrockett.com with any questions or concerns you may have. On behalf of the Board, we look forward to continuing to represent your interests and serving your needs.
Sincerely,

Bruce L. Crockett
Independent Chair
Invesco Funds Board of Trustees
| 3 | Invesco Convertible Securities Fund |
Management’s Discussion of Fund Performance
Performance summary | ||||||
For the year ended December 31, 2014, Invesco Convertible Securities Fund, at net asset value (NAV), delivered positive returns but lagged its broad market/style- specific index, the Bank of America Merrill Lynch All U.S. Convertibles Index. Though the health care sector was the top contributor to the Fund’s absolute returns, the sector detracted from results relative to the broad market/style-specific index, given the Fund’s relative underweighting in a few of the outperforming issues. Despite a positive absolute return, security selection in the information technology (IT) sector also detracted from relative performance. The energy sector detracted from both absolute and relative results during the reporting period. Your Fund’s long-term performance appears later in this report.
| ||||||
Fund vs. Indexes Total returns, 12/31/13 to 12/31/14, at net asset value (NAV). Performance shown does not include applicable contingent deferred sales charges (CDSC) or front-end sales charges, which would have reduced performance. | ||||||
Class A Shares | 3.95 | % | ||||
Class B Shares | 3.20 | |||||
Class C Shares | 3.30 | |||||
Class Y Shares | 4.24 | |||||
Class R5 Shares | 4.28 | |||||
Class R6 Shares | 4.35 | |||||
Bank of America Merrill Lynch All U.S. Convertibles Indexq | ||||||
(Broad Market/Style-Specific Index) | 9.44 | |||||
Lipper Convertible Securities Funds Indexn (Peer Group Index) | 6.14 | |||||
Source(s): qFactSet Research Systems Inc.; n Lipper Inc.
| ||||||
Market conditions and your Fund
Slow and steady improvement in the US economy and historically low interest rates led the US equity market higher during the year ended December 31, 2014. As the US economy continued along a slow growth path, the US Federal Reserve reduced its asset purchase program throughout 2014, finally ending all purchases in October. In the early months of 2014, the stock market was often volatile; pulling back as investors began to worry that stocks may have risen too far, too fast during 2013. Also, unusually cold winter weather impacted consumers, but only briefly. Corporate earnings bounced back relatively quickly
and remained generally strong through the rest of the year. Stocks rallied through the summer despite political upheaval in Ukraine and signs of an economic slowdown in China.
As investors digested evidence that US economic growth appeared to be on a stronger footing than the rest of the world, in September the price of oil began a sharp decline, as did US equities. Despite the unknown economic impact of significantly lower oil prices for an extended period, US equity markets stabilized and recovered, ending the year in positive territory, with the S&P 500 returning 13.69%. The S&P 500 Index is considered representative of the performance of the US stock market.
Similar to equities, the convertibles market produced positive returns for the year ended December 31, 2014. The convertible securities market benefited from the strength of underlying equities – primarily large-cap stocks. The Bank of America Merrill Lynch All U.S. Convertibles Index produced a return of 9.44% for the year.
During 2014, the Fund benefited from its investments in the health care and IT sectors. Within health care, Illumina, Gilead Sciences and InterMune were top contributors. We sold our position in InterMune before the year end.
Micron Technology was a key contributor in the IT sector. However, due to our tendency to limit the Fund’s concentration and individual position sizes, we held relative underweights in several top-performing issues in these sectors, including Gilead and Micron Technology. This hurt Fund performance relative to the broad market/style-specific benchmark.
A key detractor from the Fund’s absolute and relative return was GT Advanced Technologies. The company’s convertible bond declined along with the underlying stock following an unexpected bankruptcy filing in October. The company had been under pressure since Apple (not a Fund holding) announced it would not be using the company’s sapphire glass in the new iPhone 6. We sold our position with GT Advanced Technologies before the year end.
Given the sharp decline in oil prices, the energy sector also detracted from results on both a relative and absolute basis. The sector included some of the Fund’s largest detractors for the reporting period, such as Energy XXI, which we sold during the reporting period, and McDermott International and Alpha Natural Resources.
Portfolio Composition |
| |||
By sector |
| |||
Information Technology | 28.2 | % | ||
Health Care | 18.7 | |||
Financials | 15.5 | |||
Consumer Discretionary | 10.9 | |||
Industrials | 7.6 | |||
Utilities | 5.2 | |||
Energy | 4.2 | |||
Materials | 4.0 | |||
Consumer Staples | 2.0 | |||
Telecommunication Services | 0.1 | |||
Money Market Funds Plus Other Assets Less Liabilities | 3.6 | |||
| Top 10 Debt Issuers* | ||||
| 1. Gilead Sciences, Inc. | 1.8 | % | ||
| 2. Micron Technology, Inc. | 1.7 | |||
| 3. Palo Alto Networks, Inc. | 1.6 | |||
| 4. Liberty Interactive LLC | 1.5 | |||
5. BioMarin Pharmaceutical Inc. | 1.4 | |||
| 6. salesforce.com, inc. | 1.4 | |||
| 7. Illumina Inc. | 1.4 | |||
| 8. Intel Corp. | 1.4 | |||
| 9. Jarden Corp. | 1.3 | |||
| 10. Omnicare, Inc. | 1.3 | |||
Total Net Assets | $ | 2.3 billion | ||
Total Number of Holdings* | 152 | |||
The Fund’s holdings are subject to change, and there is no assurance that the Fund will continue to hold any particular security.
*Excluding money market fund holdings.
| 4 | Invesco Convertible Securities Fund |
As always, we continue to focus on companies with healthy balance sheets and reasonable valuations that may benefit from the current economic environment.
Moreover, we strive to avoid issue-specific underperformers, which we believe is the key to delivering strong results. We believe this will prove to be extremely important given the uncertainty that remains in the market.
Thank you for investing in Invesco Convertible Securities Fund and for sharing our long-term investment horizon.
The views and opinions expressed in management’s discussion of Fund performance are those of Invesco Advisers, Inc. These views and opinions are subject to change at any time based on factors such as market and economic conditions. These views and opinions may not be relied upon as investment advice or recommendations, or as an offer for a particular security. The information is not a complete analysis of every aspect of any market, country, industry, security or the Fund. Statements of fact are from sources considered reliable, but Invesco Advisers, Inc. makes no representation or warranty as to their completeness or accuracy. Although historical performance is no guarantee of future results, these insights may help you understand our investment management philosophy.
See important Fund and, if applicable, index disclosures later in this report.
| Ellen Gold | |
| Portfolio Manager, is lead manager of Invesco Convertible Securities Fund. She joined Invesco in | ||
2010. Ms. Gold earned a BBA from George Washington University and an MBA from New York University. | ||
|
Ramez Nashed | |
| Portfolio Manager, is manager of Invesco Convertible Securities Fund. He joined Invesco in 2010. Mr. | ||
Nashed earned a BA in finance from New Jersey City University and an MBA from Seton Hall University. | ||


| 5 | Invesco Convertible Securities Fund |
Your Fund’s Long-Term Performance
Results of a $10,000 Investment – Oldest Share Class(es)
Fund and index data from 12/31/04
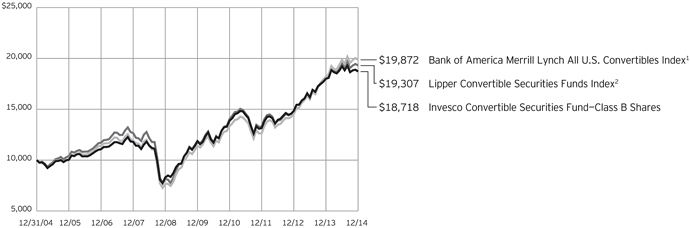
| 1 | Source: FactSet Research Systems Inc. |
| 2 | Source: Lipper Inc. |
Past performance cannot guarantee comparable future results.
The data shown in the chart include reinvested distributions, applicable sales charges and Fund expenses including management fees. Results for Class B shares are calculated as if a hypothetical
shareholder had liquidated his entire investment in the Fund at the close of the reporting period and paid the contingent deferred sales charges, if applicable. Index results include reinvested dividends, but they do not reflect sales charges. Performance of the peer group,
if applicable, reflects Fund expenses and management fees; performance of a market index does not. Performance shown in the chart and table(s) does not reflect deduction of taxes a shareholder would pay on Fund distributions or sale of Fund shares.
continued from page 8
About indexes used in this report
| n | The Bank of America Merrill Lynch All U.S. Convertibles Index tracks the performance of US-dollar-denominated convertible securities that are not currently in bankruptcy and have total market values of more than $50 million at issuance. |
| n | The Lipper Convertible Securities Funds Index represents the average performance of the 10 largest convertible securities mutual funds, as classified by Lipper. |
| n | The S&P 500 Index is an unmanaged index considered representative of the US stock market. |
| n | The Fund is not managed to track the performance of any particular index, including the index(es) described here, and consequently, the performance of the Fund may deviate significantly from the performance of the index(es). |
| n | A direct investment cannot be made in an index. Unless otherwise indicated, index results include reinvested dividends, and they do not reflect sales |
charges. Performance of the peer group, if applicable, reflects Fund expenses; performance of a market index does not. |
Other information
| n | The returns shown in management’s discussion of Fund performance are based on net asset values (NAVs) calculated for shareholder transactions. Generally accepted accounting principles require adjustments to be made to the net assets of the Fund at period end for financial reporting purposes, and as such, the NAVs for shareholder transactions and the returns based on those NAVs may differ from the NAVs and returns reported in the Financial Highlights. |
| n | Industry classifications used in this report are generally according to the Global Industry Classification Standard, which was developed by and is the exclusive property and a service mark of MSCI Inc. and Standard & Poor’s. |
| 6 | Invesco Convertible Securities Fund |
Average Annual Total Returns |
| |||
As of 12/31/14, including maximum applicable sales charges |
| |||
Class A Shares | ||||
Inception (7/28/97) | 6.64 | % | ||
10 Years | 6.52 | |||
5 Years | 8.84 | |||
1 Year | -1.78 | |||
Class B Shares | ||||
Inception (10/31/85) | 7.88 | % | ||
10 Years | 6.47 | |||
5 Years | 8.97 | |||
1 Year | -1.74 | |||
Class C Shares | ||||
Inception (7/28/97) | 6.20 | % | ||
10 Years | 6.36 | |||
5 Years | 9.32 | |||
1 Year | 2.31 | |||
Class Y Shares | ||||
Inception (7/28/97) | 7.24 | % | ||
10 Years | 7.39 | |||
5 Years | 10.35 | |||
1 Year | 4.24 | |||
Class R5 Shares | ||||
10 Years | 7.25 | % | ||
5 Years | 10.35 | |||
1 Year | 4.28 | |||
Class R6 Shares | ||||
10 Years | 7.21 | % | ||
5 Years | 10.26 | |||
1 Year | 4.35 | |||
Effective June 1, 2010, Class A, Class B, Class C and Class I shares of the predecessor fund, Morgan Stanley Convertible Securities Trust, advised by Morgan Stanley Investment Advisors Inc. were reorganized into Class A, Class B, Class C and Class Y shares, respectively, of Invesco Convertible Securities Fund. Returns shown above for Class A, Class B, Class C and Class Y shares are blended returns of the predecessor fund and Invesco Convertible Securities Fund. Share class returns will differ from the
predecessor fund because of different expenses.
Class R5 shares incepted on May 23, 2011. Performance shown prior to that date is that of the Fund’s and the predecessor fund’s Class A shares and includes the 12b-1 fees applicable to Class A shares. Class A share performance reflects any applicable fee waivers or expense reimbursements.
Class R6 shares incepted on September 24, 2012. Performance shown prior to that date is that of the Fund’s and the predecessor fund’s Class A shares and includes the 12b-1 fees applicable to Class A shares. Class A share performance reflects any applicable fee waivers or expense reimbursements.
The performance data quoted represent past performance and cannot guarantee comparable future results; current performance may be lower or higher. Please visit invesco.com/performance for the most recent month-end performance. Performance figures reflect reinvested distributions, changes in net asset value and the effect of the maximum sales charge unless otherwise stated. Investment return and principal value will fluctuate so that you may have a gain or loss when you sell shares.
The net annual Fund operating expense ratio set forth in the most recent Fund prospectus as of the date of this report for Class A, Class B, Class C, Class Y, Class R5 and Class R6 shares was 0.89%, 1.65%, 1.65%, 0.65%, 0.58% and 0.56%, respectively.1 The total annual Fund operating expense ratio set forth in the most recent Fund prospectus as of the date of this report for Class A, Class B, Class C, Class Y, Class R5 and Class R6 shares was 0.90%, 1.66%, 1.66%, 0.66%, 0.59% and 0.57%, respectively. The expense ratios presented above may vary from the expense ratios presented in other sections of this report that are based on expenses incurred during the period covered by this report.
Class A share performance reflects the maximum 5.50% sales charge, and Class B and Class C share performance reflects the applicable contingent deferred sales charge (CDSC) for the period involved. The CDSC on Class B shares declines from 5% beginning at the time of purchase to 0% at the beginning of the seventh year. The CDSC on Class C shares is 1% for the first year after purchase. Class Y, Class R5 and Class R6 shares do not have a front-end sales charge or a CDSC; therefore, performance is at net asset value.
The performance of the Fund’s share classes will differ primarily due to different sales charge structures and class expenses.
| 1 | Total annual Fund operating expenses after any contractual fee waivers and/or expense reimbursements by the adviser in effect through at least June 30, 2015. See current prospectus for more information. |
| 7 | Invesco Convertible Securities Fund |
Invesco Convertible Securities Fund’s investment objective is total return through growth of capital and current income.
| n | Unless otherwise stated, information presented in this report is as of December 31, 2014, and is based on total net assets. |
| n | Unless otherwise noted, all data provided by Invesco. |
| n | To access your Fund’s reports/prospectus, visit invesco.com/fundreports. |
About share classes
| n | Class B shares may not be purchased for new or additional investments. Please see the prospectus for more information. |
| n | Class Y shares are available only to certain investors. Please see the prospectus for more information. |
| n | Class R5 shares and Class R6 shares are primarily intended for employer sponsored retirement and benefit plans that meet certain standards and for institutional investors. Please see the prospectus for more information. |
Principal risks of investing in the Fund
| n | Convertible securities risk. The Fund may own convertible securities, the value of which may be affected by market interest rates, the risk that the issuer will default, the value of the underlying stock or the right of the issuer to buy back the convertible securities. |
| n | Credit risk. The issuer of instruments in which the Fund invests may be unable to meet interest and/or principal payments, thereby causing its instruments to decrease in value and lowering the issuer’s credit rating. |
| n | Depositary receipts risk. Depositary receipts involve many of the same risks as those associated with direct investment in foreign securities. In addition, the underlying issuers of certain depositary receipts, particularly unsponsored or unregistered depositary receipts, are under no obligation to distribute shareholder communications to the holders of such receipts or to pass through to them any voting rights with respect to the deposited securities. |
| n | Derivatives risk. The value of a derivative instrument depends largely on (and is derived from) the value of an underlying security, currency, commodity, interest rate, index or other asset (each referred to as an underlying asset). In addition to risks relating to the underlying assets, the use of derivatives |
may include other, possibly greater, risks, including counterparty, leverage and liquidity risks. Counterparty risk is the risk that the counterparty to the derivative contract will default on its obligation to pay the Fund the amount owed or otherwise perform under the derivative contract. Derivatives create leverage risk because they do not require payment up front equal to the economic exposure created by owning the derivative. As a result, an adverse change in the value of the underlying asset could result in the Fund sustaining a loss that is substantially greater than the amount invested in the derivative, which may make the Fund’s returns more volatile and increase the risk of loss. Derivative instruments may also be less liquid than more traditional investments and the Fund may be unable to sell or close out its derivative positions at a desirable time or price. This risk may be more acute under adverse market conditions, during which the Fund may be most in need of liquidating its derivative positions. Derivatives may also be harder to value, less tax efficient and subject to changing government regulation that could impact the Fund’s ability to use certain derivatives or their cost. Also, derivatives used for hedging or to gain or limit exposure to a particular market segment may not provide the expected benefits, particularly during adverse market conditions. |
| n | Developing/emerging markets securities risk. The prices of securities issued by foreign companies and governments located in developing/emerging market countries may be affected more negatively by inflation, devaluation of their currencies, higher transaction costs, delays in settlement, adverse political developments, the introduction of capital controls, withholding taxes, nationalization of private assets, expropriation, social unrest, war or lack of timely information than those in developed countries. |
| n | Foreign securities risk. The Fund’s foreign investments may be affected by changes in a foreign country’s exchange rates, political and social instability, changes in economic or taxation policies, difficulties when enforcing obligations, decreased liquidity, and increased volatility. Foreign companies may be subject to less regulation resulting in less publicly available information about the companies. |
| n | High yield bond (junk bond) risk. Junk bonds involve a greater risk of default or price changes due to changes in the credit quality of the issuer. The values of junk bonds fluctuate more than those of high-quality bonds in response to company, political, regulatory or economic developments. Values of junk bonds can decline significantly over short periods of time. |
| n | Interest rate risk. Interest rate risk refers to the risk that bond prices generally fall as interest rates rise; conversely, bond prices generally rise as interest rates fall. Specific bonds differ in their sensitivity to changes in interest rates depending on their individual characteristics, including duration. |
| n | Liquidity risk. The Fund may hold illiquid securities that it is unable to sell at the preferred time or price and could lose its entire investment in such securities. |
| n | Management risk. The investment techniques and risk analysis used by the Fund’s portfolio managers may not produce the desired results. |
| n | Market risk. The prices of and the income generated by the Fund’s securities may decline in response to, among other things, investor sentiment, general economic and market conditions, regional or global instability, and currency and interest rate fluctuations. |
| n | Preferred securities risk. Preferred securities may include provisions that permit the issuer, in its discretion, to defer or omit distributions for a certain period of time. If the Fund owns a security that is deferring or omitting its distributions, the Fund may be required to report the distribution on its tax returns, even though it may not have received this income. Further, preferred securities may lose substantial value due to the omission or deferment of dividend payments. |
This report must be accompanied or preceded by a currently effective Fund prospectus, which contains more complete information, including sales charges and expenses. Investors should read it carefully before investing.
|
NOT FDIC INSURED | MAY LOSE VALUE | NO BANK GUARANTEE
| continued on page 6 | ||
| 8 | Invesco Convertible Securities Fund |
Schedule of Investments(a)
December 31, 2014
| Principal Amount | Value | |||||||
U.S. Dollar Denominated Bonds and Notes–83.81% |
| |||||||
| Aerospace & Defense–0.85% | ||||||||
United Technologies Corp., Jr. Unsec. Sub. Conv. Investment Units, 7.50%, 08/01/15 | $ | 15,835,000 | $ | 19,423,211 | ||||
| Air Freight & Logistics–1.04% | ||||||||
UTi Worldwide Inc., Sr. Unsec. Conv. Notes, 4.50%, 03/01/19(b) | 21,465,000 | 23,812,734 | ||||||
| Airport Services–0.55% | ||||||||
Macquarie Infrastructure Co. LLC, Sr. Unsec. Conv. Notes, 2.88%, 07/15/19 | 11,055,000 | 12,616,519 | ||||||
| Apparel, Accessories & Luxury Goods–0.70% | ||||||||
Iconix Brand Group Inc., Sr. Unsec. Sub. Conv. Bonds, 1.50%, 03/15/18 | 3,530,000 | 4,185,256 | ||||||
Sr. Unsec. Sub. Conv. Notes, 2.50%, 06/01/16 | 10,000,000 | 11,806,250 | ||||||
| 15,991,506 | ||||||||
| Application Software–4.22% | ||||||||
Citrix Systems Inc., Sr. Unsec. Conv. Notes, 0.50%, 04/15/19(b) | 19,865,000 | 20,945,159 | ||||||
Mentor Graphics Corp., Unsec. Sub. Conv. Bonds, 4.00%, 04/01/18(c) | 4,950,000 | 5,952,375 | ||||||
Nuance Communications Inc., Sr. Unsec. Conv. Notes, 2.75%, 11/01/17(c) | 10,150,000 | 10,169,031 | ||||||
salesforce.com, inc., Sr. Unsec. Conv. Notes, 0.25%, 04/01/18 | 28,330,000 | 32,349,319 | ||||||
Synchronoss Technologies, Inc., Sr. Unsec. Conv. Notes, 0.75%, 08/15/19 | 9,140,000 | 9,671,263 | ||||||
Workday Inc., Sr. Unsec. Conv. Bonds, 0.75%, 07/15/18 | 14,500,000 | 17,264,062 | ||||||
| 96,351,209 | ||||||||
| Automobile Manufacturers–0.97% | ||||||||
Tesla Motors, Inc., Sr. Unsec. Conv. Notes, | 20,129,000 | 18,707,389 | ||||||
1.25%, 03/01/21 | 3,760,000 | 3,409,850 | ||||||
| 22,117,239 | ||||||||
| Biotechnology–5.01% | ||||||||
BioMarin Pharmaceutical Inc., Sr. Unsec. Sub. Conv. Notes, 0.75%, 10/15/18 | 12,517,000 | 14,777,883 | ||||||
1.50%, 10/15/20 | 14,497,000 | 17,840,371 | ||||||
Cepheid Inc., Sr. Unsec. Conv. Notes, 1.25%, 02/01/21(b) | 18,000,000 | 19,856,250 | ||||||
Emergent Biosolutions Inc., Sr. Unsec. Conv. Notes, 2.88%, 01/15/21(b) | 3,587,000 | 4,042,101 | ||||||
| Principal Amount | Value | |||||||
| Biotechnology–(continued) | ||||||||
Gilead Sciences, Inc., Series D, Sr. Unsec. Conv. Notes, 1.63%, 05/01/16 | $ | 9,882,000 | $ | 40,917,706 | ||||
Incyte Corp. Ltd., Sr. Unsec. Conv. Bonds, | 1,775,000 | 2,660,281 | ||||||
1.25%, 11/15/20 | 1,775,000 | 2,743,484 | ||||||
Medivation Inc., Sr. Unsec. Conv. Notes, 2.63%, 04/01/17 | 6,000,000 | 11,666,250 | ||||||
| 114,504,326 | ||||||||
| Broadcasting–0.95% | ||||||||
Liberty Media Corp., Sr. Unsec. Conv. Bonds, 1.38%, 10/15/23 | 21,825,000 | 21,634,031 | ||||||
| Casinos & Gaming–0.72% | ||||||||
MGM Resorts International, Sr. Unsec. Gtd. Conv. Notes, 4.25%, 04/15/15 | 13,845,000 | 16,371,713 | ||||||
| Catalog Retail–1.48% | ||||||||
Liberty Interactive LLC, Sr. Unsec. Conv. Global Bonds, 0.75%, 03/30/23(c) | 13,800,000 | 19,682,250 | ||||||
Sr. Unsec. Conv. Notes, 1.00%, 10/05/16(b)(c) | 12,835,000 | 14,198,719 | ||||||
| 33,880,969 | ||||||||
| Coal & Consumable Fuels–0.31% | ||||||||
Alpha Natural Resources Inc., Sr. Unsec. Gtd. Conv. Notes, 3.75%, 12/15/17 | 14,250,000 | 7,187,344 | ||||||
| Communications Equipment–2.64% | ||||||||
Finisar Corp., Sr. Unsec. Conv. Bonds, 0.50%, 12/15/18(c) | 6,300,000 | 5,985,000 | ||||||
JDS Uniphase Corp., Sr. Unsec. Conv. Bonds, 0.63%, 08/15/18(c) | 15,730,000 | 16,693,462 | ||||||
Palo Alto Networks, Inc., Sr. Unsec. Conv. Notes, 0.00%, 07/01/19(b)(d) | 29,695,000 | 37,656,972 | ||||||
| 60,335,434 | ||||||||
| Construction Machinery & Heavy Trucks–2.39% | ||||||||
Greenbrier Cos., Inc. (The), Sr. Unsec. Conv. Notes, 3.50%, 04/01/18 | 7,884,000 | 11,894,985 | ||||||
Meritor Inc., Sr. Unsec. Gtd. Conv. Bonds, 7.88%, 12/01/20(c) | 9,414,000 | 15,550,751 | ||||||
Navistar International Corp., Sr. Unsec. Sub. Conv. Bonds, 4.50%, 10/15/18 | 11,880,000 | 11,449,350 | ||||||
Sr. Unsec. Sub. Conv. Notes, 4.75%, 04/15/19(b) | 16,236,000 | 15,606,855 | ||||||
| 54,501,941 | ||||||||
| Consumer Finance–0.89% | ||||||||
PRA Group, Inc., Sr. Unsec. Conv. Bonds, 3.00%, 08/01/20 | 18,060,000 | 20,328,788 | ||||||
See accompanying Notes to Financial Statements which are an integral part of the financial statements.
9 Invesco Convertible Securities Fund
| Principal Amount | Value | |||||||
| Data Processing & Outsourced Services–1.33% | ||||||||
Cardtronics, Inc., Sr. Unsec. Conv. Bonds, 1.00%, 12/01/20 | $ | 18,897,000 | $ | 18,790,704 | ||||
Euronet Worldwide, Inc., Sr. Unsec. Conv. Notes, 1.50%, 10/01/20(b)(c) | 11,400,000 | 11,635,125 | ||||||
| 30,425,829 | ||||||||
| Diversified Metals & Mining–1.06% | ||||||||
RTI International Metals Inc., Sr. Unsec. Gtd. Conv. Notes, 1.63%, 10/15/19 | 24,745,000 | 24,172,772 | ||||||
| Diversified REIT’s–0.63% | ||||||||
Spirit Realty Capital Inc., Sr. Unsec. Conv. Notes, 3.75%, 05/15/21 | 14,800,000 | 14,448,574 | ||||||
| Electric Utilities–2.29% | ||||||||
Exelon Corp., Jr. Unsec. Sub. Conv. Investment Units, 6.50%, 06/01/17 | 24,130,050 | 25,336,552 | ||||||
NextEra Energy, Inc., Conv. Investment Units, 5.80%, 09/01/16 | 23,450,000 | 27,056,610 | ||||||
| 52,393,162 | ||||||||
| Electronic Components–0.28% | ||||||||
InvenSense, Inc., Sr. Unsec. Conv. Bonds, 1.75%, 11/01/18 | 6,295,000 | 6,283,197 | ||||||
| Gold–0.36% | ||||||||
Royal Gold Inc., Sr. Unsec. Conv. Notes, 2.88%, 06/15/19 | 7,926,000 | 8,228,179 | ||||||
| Health Care Equipment–3.84% | ||||||||
HeartWare International Inc., Sr. Unsec. Conv. Notes, 3.50%, 12/15/17 | 7,804,000 | 8,374,667 | ||||||
Hologic Inc., | 8,000,000 | 9,995,000 | ||||||
Series 2012, Sr. Unsec. Conv. Notes, 2.00%, 03/01/18(c)(e) | 4,400,000 | 4,911,500 | ||||||
Insulet Corp., Sr. Unsec. Conv. Notes, 2.00%, 06/15/19 | 9,133,000 | 10,765,524 | ||||||
Integra Lifesciences Holdings Corp., Sr. Unsec. Conv. Notes, 1.63%, 12/15/16 | 4,400,000 | 4,699,750 | ||||||
NuVasive Inc., Sr. Unsec. Conv. Notes, 2.75%, 07/01/17 | 15,000,000 | 19,143,750 | ||||||
Teleflex Inc., Sr. Unsec. Sub. Conv. Notes, 3.88%, 08/01/17 | 8,200,000 | 15,426,250 | ||||||
Wright Medical Group, Inc., Sr. Unsec. Conv. Notes, 2.00%, 08/15/17 | 11,920,000 | 14,445,550 | ||||||
| 87,761,991 | ||||||||
| Health Care Facilities–1.93% | ||||||||
Brookdale Senior Living Inc., Sr. Unsec. Conv. Notes, 2.75%, 06/15/18 | 17,750,000 | 24,239,844 | ||||||
HealthSouth Corp., Sr. Unsec. Sub. Conv. Notes, 2.00%, 12/01/20(c) | 17,868,000 | 19,956,322 | ||||||
| 44,196,166 | ||||||||
| Principal Amount | Value | |||||||
| Health Care REIT’s–0.50% | ||||||||
Health Care REIT, Inc., Sr. Unsec. Conv. Notes, 3.00%, 12/01/19(c) | $ | 7,635,000 | $ | 11,466,816 | ||||
| Health Care Services–1.28% | ||||||||
Omnicare, Inc., Sr. Unsec. Gtd. Sub. Conv. Notes, 3.50%, 02/15/44 | 24,286,000 | 29,143,200 | ||||||
| Health Care Supplies–0.49% | ||||||||
Spectranetics Corp. (The), Sr. Unsec. Conv. Notes, 2.63%, 06/05/21(c) | 8,773,000 | 11,284,271 | ||||||
| Health Care Technology–0.88% | ||||||||
Allscripts Healthcare Solutions, Inc., Sr. Unsec. Conv. Bonds, 1.25%, 07/01/20 | 15,580,000 | 15,404,725 | ||||||
Medidata Solutions, Inc., Sr. Unsec. Conv. Notes, 1.00%, 08/01/18 | 4,337,000 | 4,776,121 | ||||||
| 20,180,846 | ||||||||
| Home Entertainment Software–1.23% | ||||||||
Electronic Arts Inc., Sr. Unsec. Conv. Notes, 0.75%, 07/15/16 | 8,675,000 | 13,110,094 | ||||||
Take-Two Interactive Software, Inc., Sr. Unsec. Conv. Notes, 1.00%, 07/01/18 | 10,700,000 | 14,986,687 | ||||||
| 28,096,781 | ||||||||
| Homebuilding–0.98% | ||||||||
KB Home, Sr. Unsec. Gtd. Conv. Notes, 1.38%, 02/01/19 | 11,182,000 | 11,140,068 | ||||||
Toll Brothers Finance Corp., Sr. Unsec. Gtd. Conv. Notes, 0.50%, 12/15/17(c) | 10,862,000 | 11,133,550 | ||||||
| 22,273,618 | ||||||||
| Homefurnishing Retail–0.58% | ||||||||
Restoration Hardware Holdings Inc., Sr. Unsec. Conv. Notes, 0.00%, 06/15/19(b)(d) | 12,755,000 | 13,241,284 | ||||||
| Housewares & Specialties–1.32% | ||||||||
Jarden Corp., | 16,300,000 | 25,641,938 | ||||||
Sr. Unsec. Gtd. Sub. Conv. Notes, 1.13%, 03/15/24(b)(c) | 4,000,000 | 4,502,500 | ||||||
| 30,144,438 | ||||||||
| Industrial Machinery–1.01% | ||||||||
Stanley Black & Decker, Inc., Conv. Investment Units, 6.25%, 11/17/16 | 19,623,300 | 23,104,473 | ||||||
| Internet Retail–0.85% | ||||||||
Priceline Group Inc. (The), Sr. Unsec. Conv. Bonds, 0.35%, 06/15/20 | 17,300,000 | 19,376,000 | ||||||
| Internet Software & Services–5.67% | ||||||||
Akamai Technologies, Inc., Sr. Unsec. Conv. Notes, 0.00%, 02/15/19(b)(d) | 14,130,000 | 14,730,596 | ||||||
AOL, Inc., Sr. Unsec. Conv. Notes, 0.75%, 09/01/19(b) | 14,796,000 | 15,739,245 | ||||||
See accompanying Notes to Financial Statements which are an integral part of the financial statements.
10 Invesco Convertible Securities Fund
| Principal Amount | Value | |||||||
| Internet Software & Services–(continued) | ||||||||
Cornerstone OnDemand, Inc., Sr. Unsec. Conv. Bonds, 1.50%, 07/01/18 | $ | 15,206,000 | $ | 14,920,887 | ||||
Dealertrack Technologies, Inc., Sr. Unsec. Gtd. Conv. Notes, 1.50%, 03/15/17 | 4,250,000 | 5,532,969 | ||||||
HomeAway, Inc., Sr. Unsec. Conv. Notes, 0.13%, 04/01/19(b) | 14,200,000 | 13,356,875 | ||||||
LinkedIn Corp., Sr. Unsec. Conv. Notes, 0.50%, 11/01/19(b) | 10,000,000 | 10,568,800 | ||||||
MercadoLibre Inc. (Argentina), Sr. Unsec. Conv. Notes, 2.25%, 07/01/19(b) | 4,475,000 | 5,336,438 | ||||||
Twitter, Inc., Sr. Unsec. Conv. Notes, 1.00%, 09/15/21(b) | 18,305,000 | 16,039,756 | ||||||
Web.com Group Inc., Sr. Unsec. Conv. Notes, 1.00%, 08/15/18 | 7,095,000 | 6,522,966 | ||||||
Yahoo! Inc., Sr. Unsec. Conv. Bonds, 0.00%, 12/01/18(d) | 23,530,000 | 26,735,962 | ||||||
| 129,484,494 | ||||||||
| Investment Banking & Brokerage–1.06% | ||||||||
Cowen Group, Inc., Sr. Unsec. Conv. Notes, 3.00%, 03/15/19(b) | 11,300,000 | 12,211,063 | ||||||
FXCM, Inc., Sr. Unsec. Conv. Bonds, 2.25%, 06/15/18 | 11,581,000 | 12,116,621 | ||||||
| 24,327,684 | ||||||||
| Life Sciences Tools & Services–1.41% | ||||||||
Illumina Inc., Sr. Unsec. Conv. Notes, 0.00%, 06/15/19(b)(d) | 9,120,000 | 10,043,400 | ||||||
0.50%, 06/15/21(b) | 19,580,000 | 22,272,250 | ||||||
| 32,315,650 | ||||||||
| Managed Health Care–1.73% | ||||||||
Anthem, Inc., Sr. Unsec. Conv. Bonds, 2.75%, 10/15/42 | 10,410,000 | 17,970,263 | ||||||
Molina Healthcare, Inc., Sr. Unsec. Conv. Bonds, 1.63%, 08/19/18(c) | 5,700,000 | 6,369,750 | ||||||
Sr. Unsec. Conv. Notes, 1.13%, 01/15/20 | 10,853,000 | 15,139,935 | ||||||
| 39,479,948 | ||||||||
| Mortgage REIT’s–2.29% | ||||||||
Blackstone Mortgage Trust, Inc., Sr. Unsec. Conv. Notes, 5.25%, 12/01/18 | 10,711,000 | 11,300,105 | ||||||
Colony Financial, Inc., Sr. Unsec. Conv. Notes, 3.88%, 01/15/21 | 16,567,000 | 16,929,403 | ||||||
iStar Financial Inc., Sr. Unsec. Conv. Notes, 1.50%, 11/15/16(b) | 9,770,000 | 9,959,294 | ||||||
Pennymac Corp., Sr. Unsec. Gtd. Conv. Notes, 5.38%, 05/01/20 | 8,354,000 | 8,019,840 | ||||||
Starwood Property Trust, Inc., Sr. Unsec. Conv. Notes, 4.55%, 03/01/18 | 5,800,000 | 6,191,500 | ||||||
| 52,400,142 | ||||||||
| Principal Amount | Value | |||||||
| Movies & Entertainment–0.86% | ||||||||
Live Nation Entertainment, Inc., Sr. Unsec. Conv. Notes, 2.50%, 05/15/19(b) | $ | 18,448,000 | $ | 19,531,820 | ||||
| Multi-Utilities–1.96% | ||||||||
Dominion Resources, Inc., | 7,480,000 | 8,977,496 | ||||||
6.38%, 07/01/17(g) | 18,606,600 | 19,354,585 | ||||||
Series B, Jr. Unsec. Sub. Conv. Investment Units, 6.00%, 07/01/16 | 13,610,000 | 16,364,664 | ||||||
| 44,696,745 | ||||||||
| Office REIT’s–0.84% | ||||||||
SL Green Operating Partnership L.P., Sr. Unsec. Gtd. Conv. Notes, 3.00%, 10/15/17(b) | 12,958,000 | 19,129,248 | ||||||
| Oil & Gas Equipment & Services–1.79% | ||||||||
Helix Energy Solutions Group, Inc., Sr. Unsec. Conv. Notes, 3.25%, 03/15/18(c) | 8,755,000 | 9,756,353 | ||||||
Hornbeck Offshore Services, Inc., Sr. Unsec. Gtd. Conv. Notes, 1.50%, 09/01/19 | 14,790,000 | 12,331,163 | ||||||
McDermott International, Inc., Conv. Amortizing Notes, 6.25%, 04/01/17 | 14,948,400 | 7,229,046 | ||||||
SEACOR Holdings Inc., Sr. Unsec. Conv. Bonds, 3.00%, 11/19/20(c) | 12,679,000 | 11,617,134 | ||||||
| 40,933,696 | ||||||||
| Oil & Gas Exploration & Production–0.46% | ||||||||
Stone Energy Corp., Sr. Unsec. Gtd. Conv. Notes, 1.75%, 03/01/17 | 11,994,000 | 10,487,254 | ||||||
| Oil & Gas Storage & Transportation–0.61% | ||||||||
Scorpio Tankers Inc. (Monaco), Sr. Unsec. Conv. Notes, 2.38%, 07/01/19(b) | 14,649,000 | 14,035,573 | ||||||
| Packaged Foods & Meats–1.22% | ||||||||
Tyson Foods, Inc., Conv. Amortizing Notes, 4.75%, 07/15/17 | 27,642,850 | 27,830,821 | ||||||
| Pharmaceuticals–1.62% | ||||||||
Jazz Investments I Ltd., Sr. Unsec. Gtd. Conv. Notes, 1.88%, 08/15/21(b) | 17,520,000 | 19,907,100 | ||||||
Pacira Pharmaceuticals Inc., Sr. Unsec. Conv. Bonds, 3.25%, 02/01/19 | 1,233,000 | 4,413,369 | ||||||
Salix Pharmaceuticals Ltd., Sr. Unsec. Conv. Notes, 1.50%, 03/15/19 | 6,951,000 | 12,707,297 | ||||||
| 37,027,766 | ||||||||
| Precious Metals & Minerals–0.46% | ||||||||
Stillwater Mining Co., Sr. Unsec. Conv. Notes, 1.75%, 10/15/19(c) | 8,434,000 | 10,458,160 | ||||||
See accompanying Notes to Financial Statements which are an integral part of the financial statements.
11 Invesco Convertible Securities Fund
| Principal Amount | Value | |||||||
| Railroads–0.56% | ||||||||
Genesee & Wyoming Inc., Conv. Amortizing Notes, 5.00%, 10/01/15 | $ | 10,980,000 | $ | 12,742,290 | ||||
| Real Estate Development–0.30% | ||||||||
Forestar Group, Inc., Conv. Amortizing Notes, 6.00%, 12/15/16 | 8,153,975 | 6,777,584 | ||||||
| Research & Consulting Services–0.42% | ||||||||
Huron Consulting Group, Inc., Sr. Unsec. Conv. Notes, 1.25%, 10/01/19(b) | 9,150,000 | 9,533,156 | ||||||
| Semiconductor Equipment–2.48% | ||||||||
Lam Research Corp., Series A, Sr. Unsec. Conv. Notes, 0.50%, 05/15/16 | 16,200,000 | 21,343,500 | ||||||
Novellus Systems Inc., Sr. Unsec. Gtd. Conv. Notes, 2.63%, 05/15/41 | 4,500,000 | 10,338,750 | ||||||
Photronics Inc., Sr. Unsec. Conv. Notes, 3.25%, 04/01/16 | 4,525,000 | 4,703,172 | ||||||
SunEdison Inc., Sr. Unsec. Conv. Notes, 0.25%, 01/15/20(b) | 9,772,000 | 9,515,485 | ||||||
2.00%, 10/01/18(b) | 7,350,000 | 10,822,875 | ||||||
| 56,723,782 | ||||||||
| Semiconductors–5.78% | ||||||||
Intel Corp., | 8,676,000 | 11,419,785 | ||||||
Jr. Unsec. Sub. Conv. Notes, 3.25%, 08/01/39 | 11,440,000 | 19,912,807 | ||||||
Micron Technology, Inc., Series G, Sr. Unsec. Conv. Global Bonds, 3.00%, 11/15/28(c) | 28,700,000 | 37,901,937 | ||||||
NVIDIA Corp., Sr. Unsec. Conv. Bonds, 1.00%, 12/01/18 | 12,852,000 | 14,836,028 | ||||||
NXP Semiconductors N.V. (Netherlands), Sr. Unsec. Conv. Notes, 1.00%, 12/01/19(b) | 20,100,000 | 20,690,438 | ||||||
ON Semiconductor Corp., Series B, Sr. Unsec. Gtd. Sub. Conv. Notes, 2.63%, 12/15/16(c) | 7,720,000 | 9,206,100 | ||||||
SunPower Corp., Sr. Unsec. Conv. Notes, | 5,300,000 | 4,796,500 | ||||||
4.50%, 03/15/15 | 1,358,000 | 1,591,406 | ||||||
Xilinx Inc., Sr. Unsec. Conv. Notes, 2.63%, 06/15/17 | 7,780,000 | 11,747,800 | ||||||
| 132,102,801 | ||||||||
| Specialty Chemicals–0.85% | ||||||||
RPM International Inc., Sr. Unsec. Conv. Notes, 2.25%, 12/15/20 | 16,526,000 | 19,345,749 | ||||||
| Systems Software–3.08% | ||||||||
NetSuite Inc., Sr. Unsec. Conv. Notes, 0.25%, 06/01/18 | 16,510,000 | 18,573,750 | ||||||
Proofpoint, Inc., Sr. Unsec. Conv. Bonds, 1.25%, 12/15/18 | 9,405,000 | 12,890,728 | ||||||
Red Hat, Inc., Sr. Unsec. Conv. Notes, 0.25%, 10/01/19(b) | 18,075,000 | 21,418,875 | ||||||
| Principal Amount | Value | |||||||
| Systems Software–(continued) | ||||||||
ServiceNow, Inc., Sr. Unsec. Conv. Bonds, 0.00%, 11/01/18(d) | $ | 15,312,000 | $ | 17,493,960 | ||||
| 70,377,313 | ||||||||
| Technology Hardware, Storage & Peripherals–2.09% | ||||||||
Electronics For Imaging, Inc., Sr. Unsec. Conv. Notes, 0.75%, 09/01/19(b) | 22,900,000 | 23,286,438 | ||||||
SanDisk Corp., Sr. Unsec. Conv. Bonds, 0.50%, 10/15/20 | 20,362,000 | 24,561,662 | ||||||
| 47,848,100 | ||||||||
| Thrifts & Mortgage Finance–1.15% | ||||||||
MGIC Investment Corp., Sr. Unsec. Conv. Notes, | 8,000,000 | 11,745,000 | ||||||
5.00%, 05/01/17 | 12,864,000 | 14,512,200 | ||||||
| 26,257,200 | ||||||||
| Tobacco–0.82% | ||||||||
Vector Group Ltd., Sr. Unsec. Conv. Notes, 1.75%, 04/15/20 | 17,685,000 | 18,823,472 | ||||||
| Trading Companies & Distributors–0.74% | ||||||||
Air Lease Corp., Sr. Unsec. Conv. Notes, 3.88%, 12/01/18 | 12,379,000 | 16,974,704 | ||||||
Total U.S. Dollar Denominated Bonds and Notes |
| 1,914,923,713 | ||||||
| Shares | ||||||||
Preferred Stocks–12.41% |
| |||||||
| Aluminum–0.68% | ||||||||
Alcoa Inc., Series 1, $2.69 Conv. Pfd. | 306,972 | 15,486,737 | ||||||
| Asset Management & Custody Banks–0.85% | ||||||||
AMG Capital Trust II, $2.58 Jr. Gtd. Sub. Conv. Pfd. | 315,200 | 19,542,400 | ||||||
| Automobile Manufacturers–0.75% | ||||||||
Fiat Chrysler Automobiles N.V. (United Kingdom), $7.58 Unsec. Sub. Conv. Euro Pfd. | 159,300 | 17,124,750 | ||||||
| Diversified Banks–2.25% | ||||||||
Bank of America Corp., Series L, $72.50 Conv. Pfd. | 22,000 | 25,585,340 | ||||||
Wells Fargo & Co., Class A, Series L, $75.00 Conv. Pfd. | 21,500 | 25,929,000 | ||||||
| 51,514,340 | ||||||||
| Gas Utilities–0.34% | ||||||||
Laclede Group, Inc. (The), $3.38 Jr. Unsec. Sub. Conv. Pfd. | 136,800 | 7,689,528 | ||||||
| Health Care Facilities–0.51% | ||||||||
Amsurg Corp., Series A-1, $5.25 Conv. Pfd. | 103,596 | 11,706,348 | ||||||
| Independent Power Producers & Energy Traders–0.64% | ||||||||
Dynegy Inc., Series A, $5.38 Conv. Pfd. | 142,328 | 14,517,456 | ||||||
See accompanying Notes to Financial Statements which are an integral part of the financial statements.
12 Invesco Convertible Securities Fund
| Shares | Value | |||||||
| Oil & Gas Exploration & Production–1.00% | ||||||||
Chesapeake Energy Corp., $57.50 Conv. Pfd.(b) | 13,155 | $ | 13,656,534 | |||||
Penn Virginia Corp., Series B, $6.00 Conv. Pfd.(b) | 109,269 | 7,198,095 | ||||||
Sanchez Energy Corp., Series A, $2.44 Conv. Pfd. | 67,789 | 1,931,987 | ||||||
| 22,786,616 | ||||||||
| Regional Banks–0.69% | ||||||||
KeyCorp, Series A, $7.75 Conv. Pfd. | 18,000 | 2,349,360 | ||||||
Wintrust Financial Corp., Series C, $50.00 Conv. Pfd. | 10,673 | 13,477,331 | ||||||
| 15,826,691 | ||||||||
| Reinsurance–0.59% | ||||||||
Maiden Holdings Ltd., Series B, $3.63 Conv. Pfd. | 277,348 | 13,401,455 | ||||||
| Specialized REIT’s–3.41% | ||||||||
American Tower Corp., Series A, $5.25 Conv. Pfd. | 230,544 | 26,503,338 | ||||||
Crown Castle International Corp., Series A, $4.50 Conv. Pfd. | 269,770 | 27,783,613 | ||||||
Weyerhaeuser Co., Series A, $3.19 Conv. Pfd. | 411,000 | 23,714,700 | ||||||
| 78,001,651 | ||||||||
| Shares | Value | |||||||
| Steel–0.62% | ||||||||
ArcelorMittal (Luxembourg), Series MTUS, $1.50 Jr. Unsec. Sub. Conv. Pfd. | 815,400 | $ | 14,106,420 | |||||
| Wireless Telecommunication Services–0.08% | ||||||||
T-Mobile US, Inc., Series A, $2.75 Conv. Pfd. | 35,000 | 1,854,650 | ||||||
Total Preferred Stocks | 283,559,042 | |||||||
Common Stocks–0.18% |
| |||||||
| Cable & Satellite–0.18% | ||||||||
Sirius XM Holdings Inc. | 1,194,902 | 4,182,157 | ||||||
Money Market Funds–3.42% |
| |||||||
Liquid Assets Portfolio–Institutional Class(i) | 39,111,556 | 39,111,556 | ||||||
Premier Portfolio–Institutional | 39,111,556 | 39,111,556 | ||||||
Total Money Market Funds |
| 78,223,112 | ||||||
TOTAL INVESTMENTS–99.82% |
| 2,280,888,024 | ||||||
OTHER ASSETS LESS LIABILITIES–0.18% | 4,098,774 | |||||||
NET ASSETS–100.00% | $ | 2,284,986,798 | ||||||
Investment Abbreviations:
| Conv. | – Convertible | |
| Deb. | – Debentures | |
| Gtd. | – Guaranteed | |
| Jr. | – Junior | |
| Pfd. | – Preferred | |
| REIT | – Real Estate Investment Trust | |
| Sr. | – Senior | |
| Sub. | – Subordinated | |
| Unsec. | – Unsecured |
Notes to Schedule of Investments:
| (a) | Industry and/or sector classifications used in this report are generally according to the Global Industry Classification Standard, which was developed by and is the exclusive property and a service mark of MSCI Inc. and Standard & Poor’s. |
| (b) | Security purchased or received in a transaction exempt from registration under the Securities Act of 1933, as amended (the “1933 Act”). The security may be resold pursuant to an exemption from registration under the 1933 Act, typically to qualified institutional buyers. The aggregate value of these securities at December 31, 2014 was $489,277,553, which represented 21.43% of the Fund’s Net Assets. |
| (c) | Security has an irrevocable call by the issuer or mandatory put by the holder. Maturity date reflects such call or put. |
| (d) | Zero coupon bond issued at a discount. The interest rate shown represents the yield to maturity at issue. |
| (e) | Step coupon bond. The interest rate represents the coupon rate at which the bond will accrue at a specified future date. |
| (f) | Each corporate unit consists of a purchase contract for the issuer’s common stock & a 1/20th undivided beneficial ownership interest in the issuer’s Series A, 1.07% subordinated notes due 2021. |
| (g) | Each corporate unit consists of a purchase contract for the issuer’s common stock & a 1/20th undivided beneficial ownership interest in the issuer’s Series A, 1.50% subordinated notes due 2020. |
| (h) | Non-income producing security. |
| (i) | The money market fund and the Fund are affiliated by having the same investment adviser. |
See accompanying Notes to Financial Statements which are an integral part of the financial statements.
13 Invesco Convertible Securities Fund
Statement of Assets and Liabilities
December 31, 2014
Assets: |
| |||
Investments, at value (Cost $2,029,203,497) | $ | 2,202,664,912 | ||
Investments in affiliated money market funds, at value and cost | 78,223,112 | |||
Total investments, at value (Cost $2,107,426,609) | 2,280,888,024 | |||
Receivable for: | ||||
Fund shares sold | 11,172,875 | |||
Dividends and interest | 9,085,044 | |||
Investment for trustee deferred compensation and retirement plans | 102,770 | |||
Other assets | 84,482 | |||
Total assets | 2,301,333,195 | |||
Liabilities: |
| |||
Payable for: | ||||
Investments purchased | 1,842,404 | |||
Fund shares reacquired | 11,782,122 | |||
Amount due custodian | 1,607,417 | |||
Accrued fees to affiliates | 936,122 | |||
Accrued trustees’ and officers’ fees and benefits | 770 | |||
Trustee deferred compensation and retirement plans | 177,562 | |||
Total liabilities | 16,346,397 | |||
Net assets applicable to shares outstanding | $ | 2,284,986,798 | ||
Net assets consist of: |
| |||
Shares of beneficial interest | $ | 2,101,114,700 | ||
Undistributed net investment income | 17,318,840 | |||
Undistributed net realized gain (loss) | (6,908,157 | ) | ||
Net unrealized appreciation | 173,461,415 | |||
| $ | 2,284,986,798 | |||
Net Assets: |
| |||
Class A | $ | 980,513,273 | ||
Class B | $ | 5,641,758 | ||
Class C | $ | 232,064,799 | ||
Class Y | $ | 1,043,553,951 | ||
Class R5 | $ | 6,615,114 | ||
Class R6 | $ | 16,597,903 | ||
Shares outstanding, $0.01 par value per share, |
| |||
Class A | 41,053,832 | |||
Class B | 235,563 | |||
Class C | 9,761,284 | |||
Class Y | 43,645,122 | |||
Class R5 | 276,858 | |||
Class R6 | 694,476 | |||
Class A: | ||||
Net asset value per share | $ | 23.88 | ||
Maximum offering price per share | ||||
(Net asset value of $23.88 ¸ 94.50%) | $ | 25.27 | ||
Class B: | ||||
Net asset value and offering price per share | $ | 23.95 | ||
Class C: | ||||
Net asset value and offering price per share | $ | 23.77 | ||
Class Y: | ||||
Net asset value and offering price per share | $ | 23.91 | ||
Class R5: | ||||
Net asset value and offering price per share | $ | 23.89 | ||
Class R6: | ||||
Net asset value and offering price per share | $ | 23.90 | ||
See accompanying Notes to Financial Statements which are an integral part of the financial statements.
14 Invesco Convertible Securities Fund
Statement of Operations
For the year ended December 31, 2014
Investment income: |
| |||
Interest | $ | 37,423,676 | ||
Dividends | 12,966,911 | |||
Dividends from affiliated money market funds | 45,703 | |||
Total investment income | 50,436,290 | |||
Expenses: | ||||
Advisory fees | 10,510,416 | |||
Administrative services fees | 482,798 | |||
Custodian fees | 40,267 | |||
Distribution fees: | ||||
Class A | 2,497,303 | |||
Class B | 66,762 | |||
Class C | 1,944,571 | |||
Transfer agent fees — A, B, C and Y | 2,871,371 | |||
Transfer agent fees — R5 | 2,953 | |||
Transfer agent fees — R6 | 740 | |||
Trustees’ and officers’ fees and benefits | 58,194 | |||
Other | 440,752 | |||
Total expenses | 18,916,127 | |||
Less: Fees waived and expense offset arrangement(s) | (179,013 | ) | ||
Net expenses | 18,737,114 | |||
Net investment income | 31,699,176 | |||
Realized and unrealized gain (loss) from: | ||||
Net realized gain from investment securities | 68,489,786 | |||
Change in net unrealized appreciation (depreciation) of investment securities | (29,402,794 | ) | ||
Net realized and unrealized gain | 39,086,992 | |||
Net increase in net assets resulting from operations | $ | 70,786,168 | ||
See accompanying Notes to Financial Statements which are an integral part of the financial statements.
15 Invesco Convertible Securities Fund
Statement of Changes in Net Assets
For the years ended December 31, 2014 and 2013
| 2014 | 2013 | |||||||
Operations: |
| |||||||
Net investment income | $ | 31,699,176 | $ | 30,900,231 | ||||
Net realized gain | 68,489,786 | 65,830,650 | ||||||
Change in net unrealized appreciation (depreciation) | (29,402,794 | ) | 142,680,462 | |||||
Net increase in net assets resulting from operations | 70,786,168 | 239,411,343 | ||||||
Distributions to shareholders from net investment income: | ||||||||
Class A | (21,623,593 | ) | (16,300,589 | ) | ||||
Class B | (85,043 | ) | (106,105 | ) | ||||
Class C | (3,066,223 | ) | (1,788,064 | ) | ||||
Class Y | (25,721,876 | ) | (12,542,856 | ) | ||||
Class R5 | (141,198 | ) | (97,800 | ) | ||||
Class R6 | (208,270 | ) | (1,244 | ) | ||||
Total distributions from net investment income | (50,846,203 | ) | (30,836,658 | ) | ||||
Distributions to shareholders from net realized gains: | ||||||||
Class A | (29,129,632 | ) | (21,152,609 | ) | ||||
Class B | (168,094 | ) | (164,265 | ) | ||||
Class C | (6,890,239 | ) | (3,802,721 | ) | ||||
Class Y | (30,581,014 | ) | (16,316,691 | ) | ||||
Class R5 | (217,675 | ) | (112,554 | ) | ||||
Class R6 | (482,852 | ) | (1,464 | ) | ||||
Total distributions from net realized gains | (67,469,506 | ) | (41,550,304 | ) | ||||
Share transactions–net: | ||||||||
Class A | 59,208,695 | 304,706,376 | ||||||
Class B | (1,499,592 | ) | (1,203,517 | ) | ||||
Class C | 63,949,697 | 74,959,516 | ||||||
Class Y | 350,985,169 | 392,013,037 | ||||||
Class R5 | 2,168,066 | 1,542,315 | ||||||
Class R6 | 17,313,231 | 50,007 | ||||||
Net increase in net assets resulting from share transactions | 492,125,266 | 772,067,734 | ||||||
Net increase in net assets | 444,595,725 | 939,092,115 | ||||||
Net assets: | ||||||||
Beginning of year | 1,840,391,073 | 901,298,958 | ||||||
End of year (includes undistributed net investment income of $17,318,840 and $14,017,733, respectively) | $ | 2,284,986,798 | $ | 1,840,391,073 | ||||
Notes to Financial Statements
December 31, 2014
NOTE 1—Significant Accounting Policies
Invesco Convertible Securities Fund (the “Fund”) is a series portfolio of AIM Growth Series (Invesco Growth Series) (the “Trust”). The Trust is organized as a Delaware statutory trust and is registered under the Investment Company Act of 1940, as amended (the “1940 Act”), as an open-end series management investment company consisting of seventeen separate series portfolios, each authorized to issue an unlimited number of shares of beneficial interest. The assets, liabilities and operations of each portfolio are accounted for separately. Information presented in these financial statements pertains only to the Fund. Matters affecting each portfolio or class will be voted on exclusively by the shareholders of such portfolio or class.
The Fund’s investment objective is to seek total return through growth of capital and current income.
The Fund currently consists of six different classes of shares: Class A, Class B, Class C, Class Y, Class R5 and Class R6. Class A shares are sold with a front-end sales charge unless certain waiver criteria are met and under certain circumstances load waived shares may be subject to contingent deferred sales charges (“CDSC”). Class C shares are sold with a CDSC. Class Y, Class R5 and Class R6 shares are sold at net asset value. Effective November 30, 2010, new or additional investments in Class B shares are no longer permitted. Existing shareholders of Class B shares may continue to reinvest dividends and capital gains distributions in Class B shares until they convert to Class A shares. Also, shareholders in Class B shares will be
16 Invesco Convertible Securities Fund
able to exchange those shares for Class B shares of other Invesco Funds offering such shares until they convert to Class A shares. Generally, Class B shares will automatically convert to Class A shares on or about the month-end, which is at least eight years after the date of purchase. Redemption of Class B shares prior to the conversion date will be subject to a CDSC.
The following is a summary of the significant accounting policies followed by the Fund in the preparation of its financial statements.
| A. | Security Valuations — Securities, including restricted securities, are valued according to the following policy. |
Debt obligations (including convertible securities) and unlisted equities are fair valued using an evaluated quote provided by an independent pricing service. Evaluated quotes provided by the pricing service may be determined without exclusive reliance on quoted prices, and may reflect appropriate factors such as institution-size trading in similar groups of securities, developments related to specific securities, dividend rate (for unlisted equities), yield (for debt obligations), quality, type of issue, coupon rate (for debt obligations), maturity (for debt obligations), individual trading characteristics and other market data. Debt obligations are subject to interest rate and credit risks. In addition, all debt obligations involve some risk of default with respect to interest and/or principal payments.
A security listed or traded on an exchange (except convertible securities) is valued at its last sales price or official closing price as of the close of the customary trading session on the exchange where the security is principally traded, or lacking any sales or official closing price on a particular day, the security may be valued at the closing bid price on that day. Securities traded in the over-the-counter market are valued based on prices furnished by independent pricing services or market makers. When such securities are valued by an independent pricing service they may be considered fair valued. Futures contracts are valued at the final settlement price set by an exchange on which they are principally traded. Listed options are valued at the mean between the last bid and ask prices from the exchange on which they are principally traded. Options not listed on an exchange are valued by an independent source at the mean between the last bid and ask prices. For purposes of determining net asset value per share, futures and option contracts generally are valued 15 minutes after the close of the customary trading session of the New York Stock Exchange (“NYSE”).
Investments in open-end and closed-end registered investment companies that do not trade on an exchange are valued at the end of day net asset value per share. Investments in open-end and closed-end registered investment companies that trade on an exchange are valued at the last sales price or official closing price as of the close of the customary trading session on the exchange where the security is principally traded.
Swap agreements are fair valued using an evaluated quote, if available, provided by an independent pricing service. Evaluated quotes provided by the pricing service are valued based on a model which may include end of day net present values, spreads, ratings, industry, company performance and returns of referenced assets.
Foreign securities’ (including foreign exchange contracts) prices are converted into U.S. dollar amounts using the applicable exchange rates as of the close of the NYSE. If market quotations are available and reliable for foreign exchange-traded equity securities, the securities will be valued at the market quotations. Because trading hours for certain foreign securities end before the close of the NYSE, closing market quotations may become unreliable. If between the time trading ends on a particular security and the close of the customary trading session on the NYSE, events occur that the Adviser determines are significant and make the closing price unreliable, the Fund may fair value the security. If the event is likely to have affected the closing price of the security, the security will be valued at fair value in good faith using procedures approved by the Board of Trustees. Adjustments to closing prices to reflect fair value may also be based on a screening process of an independent pricing service to indicate the degree of certainty, based on historical data, that the closing price in the principal market where a foreign security trades is not the current value as of the close of the NYSE. Foreign securities’ prices meeting the approved degree of certainty that the price is not reflective of current value will be priced at the indication of fair value from the independent pricing service. Multiple factors may be considered by the independent pricing service in determining adjustments to reflect fair value and may include information relating to sector indices, American Depositary Receipts and domestic and foreign index futures. Foreign securities may have additional risks including exchange rate changes, potential for sharply devalued currencies and high inflation, political and economic upheaval, the relative lack of issuer information, relatively low market liquidity and the potential lack of strict financial and accounting controls and standards.
Securities for which market prices are not provided by any of the above methods may be valued based upon quotes furnished by independent sources. The last bid price may be used to value equity securities. The mean between the last bid and ask prices is used to value debt obligations, including corporate loans.
Securities for which market quotations are not readily available or became unreliable are valued at fair value as determined in good faith by or under the supervision of the Trust’s officers following procedures approved by the Board of Trustees. Issuer specific events, market trends, bid/ask quotes of brokers and information providers and other market data may be reviewed in the course of making a good faith determination of a security’s fair value.
The Fund may invest in securities that are subject to interest rate risk, meaning the risk that the prices will generally fall as interest rates rise and, conversely, the prices will generally rise as interest rates fall. Specific securities differ in their sensitivity to changes in interest rates depending on their individual characteristics. Changes in interest rates may result in increased market volatility, which may affect the value and/or liquidity of certain of the Fund’s investments.
Valuations change in response to many factors including the historical and prospective earnings of the issuer, the value of the issuer’s assets, general economic conditions, interest rates, investor perceptions and market liquidity. Because of the inherent uncertainties of valuation, the values reflected in the financial statements may materially differ from the value received upon actual sale of those investments.
| B. | Securities Transactions and Investment Income — Securities transactions are accounted for on a trade date basis. Realized gains or losses on sales are computed on the basis of specific identification of the securities sold. Interest income (net of withholding tax, if any) is recorded on the accrual basis from settlement date. Paydown gains and losses on mortgage and asset-backed securities are recorded as adjustments to interest income. Dividend income (net of withholding tax, if any) is recorded on the ex-dividend date. Bond premiums and discounts are amortized and/or accreted for financial reporting purposes. |
The Fund may periodically participate in litigation related to Fund investments. As such, the Fund may receive proceeds from litigation settlements. Any proceeds received are included in the Statement of Operations as realized gain (loss) for investments no longer held and as unrealized gain (loss) for investments still held.
Brokerage commissions and mark ups are considered transaction costs and are recorded as an increase to the cost basis of securities purchased and/or a reduction of proceeds on a sale of securities. Such transaction costs are included in the determination of net realized and
17 Invesco Convertible Securities Fund
unrealized gain (loss) from investment securities reported in the Statement of Operations and the Statement of Changes in Net Assets and the net realized and unrealized gains (losses) on securities per share in the Financial Highlights. Transaction costs are included in the calculation of the Fund’s net asset value and, accordingly, they reduce the Fund’s total returns. These transaction costs are not considered operating expenses and are not reflected in net investment income reported in the Statement of Operations and Statement of Changes in Net Assets, or the net investment income per share and ratios of expenses and net investment income reported in the Financial Highlights, nor are they limited by any expense limitation arrangements between the Fund and the investment adviser.
The Fund allocates income and realized and unrealized capital gains and losses to a class based on the relative net assets of each class.
| C. | Country Determination — For the purposes of making investment selection decisions and presentation in the Schedule of Investments, the investment adviser may determine the country in which an issuer is located and/or credit risk exposure based on various factors. These factors include the laws of the country under which the issuer is organized, where the issuer maintains a principal office, the country in which the issuer derives 50% or more of its total revenues and the country that has the primary market for the issuer’s securities, as well as other criteria. Among the other criteria that may be evaluated for making this determination are the country in which the issuer maintains 50% or more of its assets, the type of security, financial guarantees and enhancements, the nature of the collateral and the sponsor organization. Country of issuer and/or credit risk exposure has been determined to be the United States of America, unless otherwise noted. |
| D. | Distributions — Distributions from net investment income, if any, are declared and paid quarterly and are recorded on the ex-dividend date. Distributions from net realized capital gain, if any, are generally declared and paid annually and recorded on the ex-dividend date. The Fund may elect to treat a portion of the proceeds from redemptions as distributions for federal income tax purposes. |
| E. | Federal Income Taxes — The Fund intends to comply with the requirements of Subchapter M of the Internal Revenue Code of 1986, as amended (the “Internal Revenue Code”), necessary to qualify as a regulated investment company and to distribute substantially all of the Fund’s taxable earnings to shareholders. As such, the Fund will not be subject to federal income taxes on otherwise taxable income (including net realized capital gain) that is distributed to shareholders. Therefore, no provision for federal income taxes is recorded in the financial statements. |
The Fund recognizes the tax benefits of uncertain tax positions only when the position is more likely than not to be sustained. Management has analyzed the Fund’s uncertain tax positions and concluded that no liability for unrecognized tax benefits should be recorded related to uncertain tax positions. Management is not aware of any tax positions for which it is reasonably possible that the total amounts of unrecognized tax benefits will change materially in the next 12 months.
The Fund files tax returns in the U.S. Federal jurisdiction and certain other jurisdictions. Generally, the Fund is subject to examinations by such taxing authorities for up to three years after the filing of the return for the tax period.
| F. | Expenses — Fees provided for under the Rule 12b-1 plan of a particular class of the Fund are charged to the operations of such class. Transfer agency fees and expenses and other shareholder recordkeeping fees and expenses attributable to Class R5 and Class R6 are allocated to each share class based on relative net assets. Sub-accounting fees attributable to Class R5 are charged to the operations of the class. Transfer agency fees and expenses and other shareholder recordkeeping fees and expenses relating to all other classes are allocated among those classes based on relative net assets. All other expenses are allocated among the classes based on relative net assets. |
| G. | Accounting Estimates — The preparation of financial statements in conformity with accounting principles generally accepted in the United States of America (“GAAP”) requires management to make estimates and assumptions that affect the reported amounts of assets and liabilities at the date of the financial statements and the reported amounts of revenues and expenses during the reporting period including estimates and assumptions related to taxation. Actual results could differ from those estimates by a significant amount. In addition, the Fund monitors for material events or transactions that may occur or become known after the period-end date and before the date the financial statements are released to print. |
| H. | Indemnifications — Under the Trust’s organizational documents, each Trustee, officer, employee or other agent of the Trust is indemnified against certain liabilities that may arise out of the performance of their duties to the Fund. Additionally, in the normal course of business, the Fund enters into contracts, including the Fund’s servicing agreements, that contain a variety of indemnification clauses. The Fund’s maximum exposure under these arrangements is unknown as this would involve future claims that may be made against the Fund that have not yet occurred. The risk of material loss as a result of such indemnification claims is considered remote. |
NOTE 2—Advisory Fees and Other Fees Paid to Affiliates
The Trust has entered into a master investment advisory agreement with Invesco Advisers, Inc. (the “Adviser” or “Invesco”). Under the terms of the investment advisory agreement, the Fund pays an advisory fee to the Adviser based on the annual rate of the Fund’s average daily net assets as follows:
| Average Daily Net Assets | Rate | |||||
First $750 million | 0 | .52% | ||||
Next $250 million | 0 | .47% | ||||
Next $500 million | 0 | .42% | ||||
Next $500 million | 0 | .395% | ||||
Next $1 billion | 0 | .37% | ||||
Over $3 billion | 0 | .345% | ||||
For the year ended December 31, 2014, the effective advisory fees incurred by the Fund was 0.44%.
Under the terms of a master sub-advisory agreement between the Adviser and each of Invesco Asset Management Deutschland GmbH, Invesco Asset Management Limited, Invesco Asset Management (Japan) Limited, Invesco Australia Limited, Invesco Hong Kong Limited, Invesco Senior Secured Management, Inc. and Invesco Canada Ltd. (collectively, the “Affiliated Sub-Advisers”) the Adviser, not the Fund, may pay 40% of the fees paid to the Adviser to any such Affiliated Sub-Adviser(s) that provide(s) discretionary investment management services to the Fund based on the percentage of assets allocated to such Sub-Adviser(s).
18 Invesco Convertible Securities Fund
The Adviser has contractually agreed, through at least June 30, 2015, to waive advisory fees and/or reimburse expenses of all shares to the extent necessary to limit total annual fund operating expenses after fee waiver and/or expense reimbursement (excluding certain items discussed below) of Class A, Class B, Class C, Class Y, Class R5 and Class R6 shares to 1.50%, 2.25%, 2.25%, 1.25%, 1.25% and 1.25%, respectively, of average daily net assets. In determining the Adviser’s obligation to waive advisory fees and/or reimburse expenses, the following expenses are not taken into account, and could cause the total annual fund operating expenses after fee waiver and/or expense reimbursement to exceed the numbers reflected above: (1) interest; (2) taxes; (3) dividend expense on short sales; (4) extraordinary or non-routine items, including litigation expenses; and (5) expenses that the Fund has incurred but did not actually pay because of an expense offset arrangement. Unless Invesco continues the fee waiver agreement, it will terminate on June 30, 2015. The fee waiver agreement cannot be terminated during its term. The Adviser did not waive fees and/or reimburse expenses during the period under the expense limitation.
Further, the Adviser has contractually agreed, through at least June 30, 2016, to waive the advisory fee payable by the Fund in an amount equal to 100% of the net advisory fees the Adviser receives from the affiliated money market funds on investments by the Fund of uninvested cash in such affiliated money market funds.
For the year ended December 31, 2014, the Adviser waived advisory fees of $177,500.
The Trust has entered into a master administrative services agreement with Invesco pursuant to which the Fund has agreed to pay Invesco for certain administrative costs incurred in providing accounting services to the Fund. For the year ended December 31, 2014, expenses incurred under the agreement are shown in the Statement of Operations as Administrative services fees.
The Trust has entered into a transfer agency and service agreement with Invesco Investment Services, Inc. (“IIS”) pursuant to which the Fund has agreed to pay IIS a fee for providing transfer agency and shareholder services to the Fund and reimburse IIS for certain expenses incurred by IIS in the course of providing such services. IIS may make payments to intermediaries that provide omnibus account services, sub-accounting services and/or networking services. All fees payable by IIS to intermediaries that provide omnibus account services or sub-accounting are charged back to the Fund, subject to certain limitations approved by the Trust’s Board of Trustees. For the year ended December 31, 2014, expenses incurred under the agreement are shown in the Statement of Operations as Transfer agent fees.
Shares of the Fund are distributed by Invesco Distributors, Inc. (“IDI”), an affiliate of the Adviser. The Fund has adopted a Plan of Distribution (the “Plan”) pursuant to Rule 12b-1 under the 1940 Act. The Plan provides that the Fund will reimburse IDI for distribution related expenses that IDI incurs up to a maximum of the following annual rates: (1) Class A — up to 0.25% of the average daily net assets of Class A shares; (2) Class B — up to 1.00% of the average daily net assets of Class B shares; and (3) Class C — up to 1.00% of the average daily net assets of Class C shares.
In the case of Class B shares, provided that the Plan continues in effect, any cumulative expenses incurred by IDI, but not yet reimbursed to IDI, may be recovered through the payment of future distribution fees from the Fund pursuant to the Plan and contingent deferred sales charges paid by investors upon redemption of Class B shares.
For the year ended December 31, 2014, expenses incurred under these agreements are shown in the Statement of Operations as Distribution fees.
Front-end sales commissions and CDSC (collectively, the “sales charges”) are not recorded as expenses of the Fund. Front-end sales commissions are deducted from proceeds from the sales of Fund shares prior to investment in Class A shares of the Fund. CDSC are deducted from redemption proceeds prior to remittance to the shareholder. During the year ended December 31, 2014, IDI advised the Fund that IDI retained $223,613 in front-end sales commissions from the sale of Class A shares and $19,191, $3,422 and $29,624 from Class A, Class B and Class C shares, respectively, for CDSC imposed on redemptions by shareholders.
Certain officers and trustees of the Trust are officers and directors of the Adviser, IIS and/or IDI.
NOTE 3—Additional Valuation Information
GAAP defines fair value as the price that would be received to sell an asset or paid to transfer a liability in an orderly transaction between market participants at the measurement date, under current market conditions. GAAP establishes a hierarchy that prioritizes the inputs to valuation methods, giving the highest priority to readily available unadjusted quoted prices in an active market for identical assets (Level 1) and the lowest priority to significant unobservable inputs (Level 3), generally when market prices are not readily available or are unreliable. Based on the valuation inputs, the securities or other investments are tiered into one of three levels. Changes in valuation methods may result in transfers in or out of an investment’s assigned level:
| Level 1 — | Prices are determined using quoted prices in an active market for identical assets. |
| Level 2 — | Prices are determined using other significant observable inputs. Observable inputs are inputs that other market participants may use in pricing a security. These may include quoted prices for similar securities, interest rates, prepayment speeds, credit risk, yield curves, loss severities, default rates, discount rates, volatilities and others. |
| Level 3 — | Prices are determined using significant unobservable inputs. In situations where quoted prices or observable inputs are unavailable (for example, when there is little or no market activity for an investment at the end of the period), unobservable inputs may be used. Unobservable inputs reflect the Fund’s own assumptions about the factors market participants would use in determining fair value of the securities or instruments and would be based on the best available information. |
The following is a summary of the tiered valuation input levels, as of December 31, 2014. The level assigned to the securities valuations may not be an indication of the risk or liquidity associated with investing in those securities. Because of the inherent uncertainties of valuation, the values reflected in the financial statements may materially differ from the value received upon actual sale of those investments.
| Level 1 | Level 2 | Level 3 | Total | |||||||||||||
Equity Securities | $ | 285,343,686 | $ | 80,620,625 | $ | — | $ | 365,964,311 | ||||||||
Corporate Debt Securities | 180,190,704 | 1,734,733,009 | — | 1,914,923,713 | ||||||||||||
Total Investments | $ | 465,534,390 | $ | 1,815,353,634 | $ | — | $ | 2,280,888,024 | ||||||||
19 Invesco Convertible Securities Fund
NOTE 4—Expense Offset Arrangement(s)
The expense offset arrangement is comprised of transfer agency credits which result from balances in demand deposit accounts used by the transfer agent for clearing shareholder transactions. For the year ended December 31, 2014, the Fund received credits from this arrangement, which resulted in the reduction of the Fund’s total expenses of $1,513.
NOTE 5—Trustees’ and Officers’ Fees and Benefits
Trustees’ and Officers’ Fees and Benefits include amounts accrued by the Fund to pay remuneration to certain Trustees and Officers of the Fund. Trustees have the option to defer compensation payable by the Fund, and Trustees’ and Officers’ Fees and Benefits also include amounts accrued by the Fund to fund such deferred compensation amounts. Those Trustees who defer compensation have the option to select various Invesco Funds in which their deferral accounts shall be deemed to be invested. Finally, certain current Trustees were eligible to participate in a retirement plan that provided for benefits to be paid upon retirement to Trustees over a period of time based on the number of years of service. The Fund may have certain former Trustees who also participate in a retirement plan and receive benefits under such plan. Trustees’ and Officers’ Fees and Benefits include amounts accrued by the Fund to fund such retirement benefits. Obligations under the deferred compensation and retirement plans represent unsecured claims against the general assets of the Fund.
NOTE 6—Cash Balances
The Fund is permitted to temporarily carry a negative or overdrawn balance in its account with State Street Bank and Trust Company, the custodian bank. Such balances, if any at period end, are shown in the Statement of Assets and Liabilities under the payable caption Amount due custodian. To compensate the custodian bank for such overdrafts, the overdrawn Fund may either (1) leave funds as a compensating balance in the account so the custodian bank can be compensated by earning the additional interest; or (2) compensate by paying the custodian bank at a rate agreed upon by the custodian bank and Invesco, not to exceed the contractually agreed upon rate.
NOTE 7—Distributions to Shareholders and Tax Components of Net Assets
Tax Character of Distributions to Shareholders Paid During the Fiscal Years Ended December 31, 2014 and 2013:
| 2014 | 2013 | |||||||
Ordinary income | $ | 56,582,247 | $ | 36,847,565 | ||||
Long-term capital gain | 61,733,462 | 35,539,397 | ||||||
Total distributions | $ | 118,315,709 | $ | 72,386,962 | ||||
Tax Components of Net Assets at Period-End:
| 2014 | ||||
Undistributed ordinary income | $ | 35,841,641 | ||
Net unrealized appreciation — investments | 154,956,962 | |||
Temporary book/tax differences | (173,047 | ) | ||
Post-October capital loss deferral | (6,753,458 | ) | ||
Shares of beneficial interest | 2,101,114,700 | |||
Total net assets | $ | 2,284,986,798 | ||
The difference between book-basis and tax-basis unrealized appreciation (depreciation) is due to differences in the timing of recognition of gains and losses on investments for tax and book purposes. The Fund’s net unrealized appreciation difference is attributable primarily to wash sales, bond premium amortization and convertible preferred debt instruments.
The temporary book/tax differences are a result of timing differences between book and tax recognition of income and/or expenses. The Fund’s temporary book/tax differences are the result of the trustee deferral of compensation and retirement plan benefits.
Capital loss carryforward is calculated and reported as of a specific date. Results of transactions and other activity after that date may affect the amount of capital loss carryforward actually available for the Fund to utilize. Capital losses generated in years beginning after December 22, 2010 can be carried forward for an unlimited period, whereas previous losses expire in eight tax years. Capital losses with an expiration period may not be used to offset capital gains until all net capital losses without an expiration date have been utilized. Capital loss carryforwards with no expiration date will retain their character as either short-term or long-term capital losses instead of as short-term capital losses as under prior law. The ability to utilize capital loss carryforwards in the future may be limited under the Internal Revenue Code and related regulations based on the results of future transactions.
The Fund does not have a capital loss carryforward as of December 31, 2014.
20 Invesco Convertible Securities Fund
NOTE 8—Investment Securities
The aggregate amount of investment securities (other than short-term securities, U.S. Treasury obligations and money market funds, if any) purchased and sold by the Fund during the year ended December 31, 2014 was $1,720,368,895 and $1,249,757,397, respectively. Cost of investments on a tax basis includes the adjustments for financial reporting purposes as of the most recently completed federal income tax reporting period-end.
| Unrealized Appreciation (Depreciation) of Investment Securities on a Tax Basis | ||||
Aggregate unrealized appreciation of investment securities | $ | 207,699,085 | ||
Aggregate unrealized (depreciation) of investment securities | (52,742,123 | ) | ||
Net unrealized appreciation of investment securities | $ | 154,956,962 | ||
Cost of investments for tax purposes is $2,125,931,062.
NOTE 9—Reclassification of Permanent Differences
Primarily as a result of differing book/tax treatment of convertible preferred debt instruments and bond premium amortization, on December 31, 2014, undistributed net investment income was increased by $22,448,134, undistributed net realized gain (loss) was decreased by $22,445,287 and shares of beneficial interest was decreased by $2,847. This reclassification had no effect on the net assets of the Fund.
NOTE 10—Share Information
| Summary of Share Activity | ||||||||||||||||
| Years ended December 31, | ||||||||||||||||
| 2014(a) | 2013 | |||||||||||||||
| Shares | Amount | Shares | Amount | |||||||||||||
Sold: | ||||||||||||||||
Class A | 19,914,111 | $ | 495,629,049 | 19,894,522 | $ | 465,006,946 | ||||||||||
Class B | 27,238 | 679,032 | 53,934 | 1,260,639 | ||||||||||||
Class C | 3,726,131 | 92,040,371 | 3,763,916 | 88,349,747 | ||||||||||||
Class Y | 36,586,736 | 909,226,631 | 21,832,270 | 507,766,106 | ||||||||||||
Class R5 | 246,200 | 6,178,233 | 116,725 | 2,672,397 | ||||||||||||
Class R6 | 667,481 | 16,738,136 | 2,055 | 47,866 | ||||||||||||
Issued as reinvestment of dividends: | ||||||||||||||||
Class A | 1,943,409 | 46,641,230 | 1,312,518 | 30,644,391 | ||||||||||||
Class B | 9,744 | 233,924 | 9,938 | 232,306 | ||||||||||||
Class C | 393,190 | 9,329,115 | 204,079 | 4,753,908 | ||||||||||||
Class Y | 1,866,921 | 44,803,217 | 839,879 | 19,661,287 | ||||||||||||
Class R5 | 13,659 | 326,531 | 8,432 | 196,703 | ||||||||||||
Class R6 | 29,022 | 690,483 | 91 | 2,141 | ||||||||||||
Automatic conversion of Class B shares to Class A shares: | ||||||||||||||||
Class A | 42,304 | 1,052,390 | 55,652 | 1,263,085 | ||||||||||||
Class B | (42,217 | ) | (1,052,390 | ) | (55,541 | ) | (1,263,085 | ) | ||||||||
Reacquired: | ||||||||||||||||
Class A | (19,587,595 | ) | (484,113,974 | ) | (8,335,103 | ) | (192,208,046 | ) | ||||||||
Class B | (54,938 | ) | (1,360,158 | ) | (62,487 | ) | (1,433,377 | ) | ||||||||
Class C | (1,521,259 | ) | (37,419,789 | ) | (793,408 | ) | (18,144,139 | ) | ||||||||
Class Y | (24,554,095 | ) | (603,044,679 | ) | (5,817,243 | ) | (135,414,356 | ) | ||||||||
Class R5 | (180,741 | ) | (4,336,698 | ) | (57,976 | ) | (1,326,785 | ) | ||||||||
Class R6 | (4,654 | ) | (115,388 | ) | — | — | ||||||||||
Net increase in share activity | 19,520,647 | $ | 492,125,266 | 32,972,253 | $ | 772,067,734 | ||||||||||
| (a) | There are entities that are record owners of more than 5% of the outstanding shares of the Fund and in the aggregate own 53% of the outstanding shares of the Fund. IDI has an agreement with these entities to sell Fund shares. The Fund, Invesco and/or Invesco affiliates may make payments to these entities, which are considered to be related to the Fund, for providing services to the Fund, Invesco and/or Invesco affiliates including but not limited to services such as securities brokerage, distribution, third party record keeping and account servicing. The Fund has no knowledge as to whether all or any portion of the shares owned of record by these entities are also owned beneficially. |
21 Invesco Convertible Securities Fund
NOTE 11—Financial Highlights
The following schedule presents financial highlights for a share of the Fund outstanding throughout the periods indicated.
| Net asset value, beginning of period | Net investment income(a) | Net gains (losses) on securities (both realized and unrealized) | Total from investment operations | Dividends from net investment income | Distributions from net realized gains | Total distributions | Net asset value, end of period | Total return(b) | Net assets, end of period (000’s omitted) | Ratio of expenses to average net assets with fee waivers and/or expenses absorbed | Ratio of expenses to average net assets without fee waivers and/or expenses absorbed | Ratio of net investment income to average net assets | Portfolio turnover(c) | |||||||||||||||||||||||||||||||||||||||||||
Class A | ||||||||||||||||||||||||||||||||||||||||||||||||||||||||
Year ended 12/31/14 | $ | 24.17 | $ | 0.32 | $ | 0.63 | $ | 0.95 | $ | (0.52 | ) | $ | (0.72 | ) | $ | (1.24 | ) | $ | 23.88 | 3.95 | % | $ | 980,513 | 0.84 | %(d)(e) | 0.85 | %(d)(e) | 1.29 | %(d)(e) | 56 | % | |||||||||||||||||||||||||
Year ended 12/31/13 | 20.88 | 0.55 | (f) | 3.84 | 4.39 | (0.53 | ) | (0.57 | ) | (1.10 | ) | 24.17 | 21.31 | 936,425 | 0.88 | (g) | 0.89 | (g) | 2.40 | (f)(g) | 45 | |||||||||||||||||||||||||||||||||||
Year ended 12/31/12 | 18.78 | 0.48 | 2.08 | 2.56 | (0.46 | ) | — | (0.46 | ) | 20.88 | 13.74 | 538,962 | 0.93 | (h) | 0.94 | (h) | 2.41 | (h) | 58 | |||||||||||||||||||||||||||||||||||||
Year ended 12/31/11 | 20.05 | 0.46 | (1.34 | ) | (0.88 | ) | (0.39 | ) | — | (0.39 | ) | 18.78 | (4.46 | ) | 518,426 | 0.97 | 0.98 | 2.37 | 38 | |||||||||||||||||||||||||||||||||||||
Three months ended 12/31/10 | 18.71 | 0.12 | 1.35 | 1.47 | (0.13 | ) | — | (0.13 | ) | 20.05 | 7.86 | 118,359 | 1.09 | (i) | 1.10 | (i) | 2.42 | (i) | 24 | |||||||||||||||||||||||||||||||||||||
Year ended 09/30/10 | 16.86 | 0.59 | 1.97 | 2.56 | (0.71 | ) | — | (0.71 | ) | 18.71 | 15.45 | 90,840 | 1.17 | 1.17 | 3.33 | 85 | ||||||||||||||||||||||||||||||||||||||||
Class B | ||||||||||||||||||||||||||||||||||||||||||||||||||||||||
Year ended 12/31/14 | 24.24 | 0.13 | 0.63 | 0.76 | (0.33 | ) | (0.72 | ) | (1.05 | ) | 23.95 | 3.16 | 5,642 | 1.60 | (d)(e) | 1.61 | (d)(e) | 0.53 | (d)(e) | 56 | ||||||||||||||||||||||||||||||||||||
Year ended 12/31/13 | 20.93 | 0.38 | (f) | 3.86 | 4.24 | (0.36 | ) | (0.57 | ) | (0.93 | ) | 24.24 | 20.45 | 7,167 | 1.64 | (g) | 1.65 | (g) | 1.64 | (f)(g) | 45 | |||||||||||||||||||||||||||||||||||
Year ended 12/31/12 | 18.83 | 0.33 | 2.08 | 2.41 | (0.31 | ) | — | (0.31 | ) | 20.93 | 12.85 | 7,325 | 1.70 | (h) | 1.71 | (h) | 1.64 | (h) | 58 | |||||||||||||||||||||||||||||||||||||
Year ended 12/31/11 | 20.10 | 0.32 | (1.35 | ) | (1.03 | ) | (0.24 | ) | — | (0.24 | ) | 18.83 | (5.16 | ) | 10,505 | 1.72 | 1.73 | 1.62 | 38 | |||||||||||||||||||||||||||||||||||||
Three months ended 12/31/10 | 18.76 | 0.08 | 1.35 | 1.43 | (0.09 | ) | — | (0.09 | ) | 20.10 | 7.64 | 11,038 | 1.84 | (i) | 1.85 | (i) | 1.67 | (i) | 24 | |||||||||||||||||||||||||||||||||||||
Year ended 09/30/10 | 16.90 | 0.46 | 1.97 | 2.43 | (0.57 | ) | — | (0.57 | ) | 18.76 | 14.61 | 11,454 | 1.92 | 1.92 | 2.58 | 85 | ||||||||||||||||||||||||||||||||||||||||
Class C | ||||||||||||||||||||||||||||||||||||||||||||||||||||||||
Year ended 12/31/14 | 24.04 | 0.16 | 0.62 | 0.78 | (0.33 | ) | (0.72 | ) | (1.05 | ) | 23.77 | 3.30 | 232,065 | 1.48 | (d)(e) | 1.49 | (d)(e) | 0.65 | (d)(e) | 56 | ||||||||||||||||||||||||||||||||||||
Year ended 12/31/13 | 20.78 | 0.38 | (f) | 3.81 | 4.19 | (0.36 | ) | (0.57 | ) | (0.93 | ) | 24.04 | 20.37 | 172,232 | 1.64 | (g) | 1.65 | (g) | 1.64 | (f)(g) | 45 | |||||||||||||||||||||||||||||||||||
Year ended 12/31/12 | 18.69 | 0.36 | 2.06 | 2.42 | (0.33 | ) | — | (0.33 | ) | 20.78 | 13.02 | 82,876 | 1.53 | (h) | 1.54 | (h) | 1.81 | (h) | 58 | |||||||||||||||||||||||||||||||||||||
Year ended 12/31/11 | 19.94 | 0.32 | (1.33 | ) | (1.01 | ) | (0.24 | ) | — | (0.24 | ) | 18.69 | (5.12 | ) | 87,388 | 1.72 | 1.73 | 1.62 | 38 | |||||||||||||||||||||||||||||||||||||
Three months ended 12/31/10 | 18.61 | 0.08 | 1.34 | 1.42 | (0.09 | ) | — | (0.09 | ) | 19.94 | 7.64 | 18,719 | 1.84 | (i) | 1.85 | (i) | 1.67 | (i) | 24 | |||||||||||||||||||||||||||||||||||||
Year ended 09/30/10 | 16.77 | 0.46 | 1.96 | 2.42 | (0.58 | ) | — | (0.58 | ) | 18.61 | 14.62 | 9,486 | 1.92 | 1.92 | 2.58 | 85 | ||||||||||||||||||||||||||||||||||||||||
Class Y | ||||||||||||||||||||||||||||||||||||||||||||||||||||||||
Year ended 12/31/14 | 24.20 | 0.38 | 0.63 | 1.01 | (0.58 | ) | (0.72 | ) | (1.30 | ) | 23.91 | 4.20 | 1,043,554 | 0.60 | (d) | 0.61 | (d) | 1.53 | (d) | 56 | ||||||||||||||||||||||||||||||||||||
Year ended 12/31/13 | 20.90 | 0.61 | (f) | 3.84 | 4.45 | (0.58 | ) | (0.57 | ) | (1.15 | ) | 24.20 | 21.62 | 719,722 | 0.64 | 0.65 | 2.64 | (f) | 45 | |||||||||||||||||||||||||||||||||||||
Year ended 12/31/12 | 18.81 | 0.53 | 2.07 | 2.60 | (0.51 | ) | — | (0.51 | ) | 20.90 | 13.94 | 269,400 | 0.70 | 0.71 | 2.64 | 58 | ||||||||||||||||||||||||||||||||||||||||
Year ended 12/31/11 | 20.07 | 0.52 | (1.34 | ) | (0.82 | ) | (0.44 | ) | — | (0.44 | ) | 18.81 | (4.16 | ) | 204,319 | 0.72 | 0.73 | 2.62 | 38 | |||||||||||||||||||||||||||||||||||||
Three months ended 12/31/10 | 18.73 | 0.13 | 1.35 | 1.48 | (0.14 | ) | — | (0.14 | ) | 20.07 | 7.92 | 17,204 | 0.84 | (i) | 0.85 | (i) | 2.67 | (i) | 24 | |||||||||||||||||||||||||||||||||||||
Year ended 09/30/10 | 16.87 | 0.64 | 1.97 | 2.61 | (0.75 | — | (0.75 | ) | 18.73 | 15.78 | 3,661 | 0.92 | 0.92 | 3.58 | 85 | |||||||||||||||||||||||||||||||||||||||||
Class R5 | ||||||||||||||||||||||||||||||||||||||||||||||||||||||||
Year ended 12/31/14 | 24.18 | 0.40 | 0.63 | 1.03 | (0.60 | ) | (0.72 | ) | (1.32 | ) | 23.89 | 4.28 | 6,615 | 0.53 | (d) | 0.54 | (d) | 1.60 | (d) | 56 | ||||||||||||||||||||||||||||||||||||
Year ended 12/31/13 | 20.88 | 0.63 | (f) | 3.84 | 4.47 | (0.60 | ) | (0.57 | ) | (1.17 | ) | 24.18 | 21.72 | 4,781 | 0.57 | 0.58 | 2.71 | (f) | 45 | |||||||||||||||||||||||||||||||||||||
Year ended 12/31/12 | 18.78 | 0.55 | 2.08 | 2.63 | (0.53 | ) | — | (0.53 | ) | 20.88 | 14.13 | 2,726 | 0.60 | 0.61 | 2.74 | 58 | ||||||||||||||||||||||||||||||||||||||||
Year ended 12/31/11(j) | 21.19 | 0.33 | (2.38 | ) | (2.05 | ) | (0.36 | ) | — | (0.36 | ) | 18.78 | (9.70 | ) | 1,851 | 0.57 | (i) | 0.58 | (i) | 2.77 | (i) | 38 | ||||||||||||||||||||||||||||||||||
Class R6 | ||||||||||||||||||||||||||||||||||||||||||||||||||||||||
Year ended 12/31/14 | 24.18 | 0.41 | 0.64 | 1.05 | (0.61 | ) | (0.72 | ) | (1.33 | ) | 23.90 | 4.35 | 16,598 | 0.49 | (d) | 0.50 | (d) | 1.64 | (d) | 56 | ||||||||||||||||||||||||||||||||||||
Year ended 12/31/13 | 20.89 | 0.64 | (f) | 3.83 | 4.47 | (0.61 | ) | (0.57 | ) | (1.18 | ) | 24.18 | 21.69 | 64 | 0.55 | 0.56 | 2.73 | (f) | 45 | |||||||||||||||||||||||||||||||||||||
Year ended 12/31/12(j) | 20.78 | 0.15 | 0.10 | 0.25 | (0.14 | ) | — | (0.14 | ) | 20.89 | 1.23 | 10 | 0.58 | (i) | 0.59 | (i) | 2.76 | (i) | 58 | |||||||||||||||||||||||||||||||||||||
| (a) | Calculated using average shares outstanding. |
| (b) | Includes adjustments in accordance with accounting principles generally accepted in the United States of America and as such, the net asset value for financial reporting purposes and the returns based upon those net asset values may differ from the net asset value and returns for shareholder transactions. Does not include sales charges and is not annualized for periods less than one year, if applicable. |
| (c) | Portfolio turnover is calculated at the fund level and is not annualized for periods less than one year, if applicable. For the year ended December 31, 2011, the portfolio turnover calculation excludes the value of securities purchased of $310,063,973 and sold of $85,053,876 in effect to realign the Fund’s portfolio holdings after the reorganization of Invesco Van Kampen Harbor Fund into the Fund. |
| (d) | Ratios are based on average daily net assets (000’s omitted) of $1,033,658, $6,676, $221,375, $1,093,250, $5,269 and $7,453 for Class A, Class B, Class C, Class Y, Class R5 and Class R6 shares, respectively. |
| (e) | The total return, ratio of expenses to average net assets and ratio of net investment income to average net assets reflect actual 12b-1 fees of 0.24%, 1.00% and 0.88% for Class A, Class B and Class C shares, respectively. |
| (f) | Net investment income per share and the ratio of net investment income to average net assets include material significant dividends received during the year ended December 31, 2013. Net investment income per share and the ratio of net investment income to average net assets excluding the significant dividends are $0.42 and 2.39%, $0.25 and 1.63%, $0.25 and 1.63%, $0.48 and 2.63%, $0.50 and 2.70% and $0.51 and 2.72%, for Class A, Class B, Class C, Class Y, Class R5 and Class R6 shares, respectively. |
| (g) | The total return, ratio of expenses to average net assets and ratio of net investment income to average net assets reflect actual 12b-1 fees of 0.24%, 1.00% and 1.00% for Class A, Class B and Class C shares, respectively. |
| (h) | The total return, ratio of expenses to average net assets and ratio of net investment income to average net assets reflect actual 12b-1 fees of 0.23%, 1.00% and 0.83% for Class A, Class B and Class C shares, respectively. |
| (i) | Annualized. |
| (j) | Commencement date of May 23, 2011 and September 24, 2012 for Class R5 and Class R6 shares, respectively. |
22 Invesco Convertible Securities Fund
Report of Independent Registered Public Accounting Firm
To the Board of Trustees of AIM Growth Series (Invesco Growth Series) and Shareholders of Invesco Convertible Securities Fund:
In our opinion, the accompanying statement of assets and liabilities, including the schedule of investments, and the related statements of operations and of changes in net assets and the financial highlights present fairly, in all material respects, the financial position of Invesco Convertible Securities Fund (one of the funds constituting AIM Growth Series (Invesco Growth Series), hereafter referred to as the “Fund”) at December 31, 2014, the results of its operations for the year then ended, the changes in its net assets for each of the two years in the period then ended and the financial highlights for each of the five years in the period then ended, in conformity with accounting principles generally accepted in the United States of America. These financial statements and financial highlights (hereafter referred to as “financial statements”) are the responsibility of the Fund’s management. Our responsibility is to express an opinion on these financial statements based on our audits. We conducted our audits of these financial statements in accordance with the standards of the Public Company Accounting Oversight Board (United States). Those standards require that we plan and perform the audit to obtain reasonable assurance about whether the financial statements are free of material misstatement. An audit includes examining, on a test basis, evidence supporting the amounts and disclosures in the financial statements, assessing the accounting principles used and significant estimates made by management, and evaluating the overall financial statement presentation. We believe that our audits, which included confirmation of securities at December 31, 2014 by correspondence with the custodian and brokers, and the application of alternative auditing procedures where confirmations of security purchases have not been received, provide a reasonable basis for our opinion.
PRICEWATERHOUSECOOPERS LLP
Houston, Texas
February 23, 2015
23 Invesco Convertible Securities Fund
Calculating your ongoing Fund expenses
Example
As a shareholder of the Fund, you incur two types of costs: (1) transaction costs, which may include sales charges (loads) on purchase payments or contingent deferred sales charges on redemptions, if any; and (2) ongoing costs, including management fees, distribution and/or service (12b-1) fees, and other Fund expenses. This example is intended to help you understand your ongoing costs (in dollars) of investing in the Fund and to compare these costs with ongoing costs of investing in other mutual funds. The example is based on an investment of $1,000 invested at the beginning of the period and held for the entire period July 1, 2014 through December 31, 2014.
Actual expenses
The table below provides information about actual account values and actual expenses. You may use the information in this table, together with the amount you invested, to estimate the expenses that you paid over the period. Simply divide your account value by $1,000 (for example, an $8,600 account value divided by $1,000 = 8.6), then multiply the result by the number in the table under the heading entitled “Actual Expenses Paid During Period” to estimate the expenses you paid on your account during this period.
Hypothetical example for comparison purposes
The table below also provides information about hypothetical account values and hypothetical expenses based on the Fund’s actual expense ratio and an assumed rate of return of 5% per year before expenses, which is not the Fund’s actual return.
The hypothetical account values and expenses may not be used to estimate the actual ending account balance or expenses you paid for the period. You may use this information to compare the ongoing costs of investing in the Fund and other funds. To do so, compare this 5% hypothetical example with the 5% hypothetical examples that appear in the shareholder reports of the other funds.
Please note that the expenses shown in the table are meant to highlight your ongoing costs only and do not reflect any transaction costs, such as sales charges (loads) on purchase payments or contingent deferred sales charges on redemptions, if any. Therefore, the hypothetical information is useful in comparing ongoing costs only, and will not help you determine the relative total costs of owning different funds. In addition, if these transaction costs were included, your costs would have been higher.
| Class | Beginning Account Value (07/01/14) | ACTUAL | HYPOTHETICAL expenses) | Annualized Expense Ratio | ||||||||||||||||||||
| Ending Account Value (12/31/14)1 | Expenses Paid During Period2 | Ending Account Value (12/31/14) | Expenses Paid During Period2 | |||||||||||||||||||||
| A | $ | 1,000.00 | $ | 973.40 | $ | 4.13 | $ | 1,021.02 | $ | 4.23 | 0.83 | % | ||||||||||||
| B | 1,000.00 | 969.80 | 7.89 | 1,017.19 | 8.08 | 1.59 | ||||||||||||||||||
| C | 1,000.00 | 970.70 | 6.76 | 1,018.35 | 6.92 | 1.36 | ||||||||||||||||||
| Y | 1,000.00 | 974.70 | 2.94 | 1,022.23 | 3.01 | 0.59 | ||||||||||||||||||
| R5 | 1,000.00 | 974.70 | 2.69 | 1,022.48 | 2.75 | 0.54 | ||||||||||||||||||
| R6 | 1,000.00 | 975.20 | 2.39 | 1,022.79 | 2.45 | 0.48 | ||||||||||||||||||
| 1 | The actual ending account value is based on the actual total return of the Fund for the period July 1, 2014 through December 31, 2014, after actual expenses and will differ from the hypothetical ending account value which is based on the Fund’s expense ratio and a hypothetical annual return of 5% before expenses. |
| 2 | Expenses are equal to the Fund’s annualized expense ratio as indicated above multiplied by the average account value over the period, multiplied by 184/365 to reflect the most recent fiscal half year. |
24 Invesco Convertible Securities Fund
Tax Information
Form 1099-DIV, Form 1042-S and other year–end tax information provide shareholders with actual calendar year amounts that should be included in their tax returns. Shareholders should consult their tax advisors.
The following distribution information is being provided as required by the Internal Revenue Code or to meet a specific state’s requirement.
The Fund designates the following amounts or, if subsequently determined to be different, the maximum amount allowable for its fiscal year ended December 31, 2014:
Federal and State Income Tax | ||||
Long-Term Capital Gain Distributions | $ | 61,733,462 | ||
Qualified Dividend Income* | 21.50 | % | ||
Corporate Dividends Received Deduction* | 21.40 | % | ||
U.S. Treasury Obligations* | 0.00 | % | ||
| * | The above percentages are based on ordinary income dividends paid to shareholders during the Fund’s fiscal year. |
Non-Resident Alien Shareholders | ||||
Qualified Short-Term Capital Gains | $ | 5,723,763 | ||
25 Invesco Convertible Securities Fund
Trustees and Officers
The address of each trustee and officer is AIM Growth Series (Invesco Growth Series) (the “Trust”), 11 Greenway Plaza, Suite 1000, Houston, Texas 77046-1173. The trustees serve for the life of the Trust, subject to their earlier death, incapacitation, resignation, retirement or removal as more specifically provided in the Trust’s organizational documents. Each officer serves for a one year term or until their successors are elected and qualified. Column two below includes length of time served with predecessor entities, if any.
Name, Year of Birth and Position(s) Held with the Trust | Trustee and/ or Officer Since | Principal Occupation(s) During Past 5 Years | Number of Funds in Fund Complex Overseen by Trustee | Other Directorship(s) Held by Trustee During | ||||
| Interested Persons | ||||||||
| Martin L. Flanagan1 — 1960 Trustee | 2007 | Executive Director, Chief Executive Officer and President, Invesco Ltd. (ultimate parent of Invesco and a global investment management firm); Advisor to the Board, Invesco Advisers, Inc. (formerly known as Invesco Institutional (N.A.), Inc.); Trustee, The Invesco Funds; Vice Chair, Investment Company Institute; and Member of Executive Board, SMU Cox School of Business
Formerly: Chairman and Chief Executive Officer, Invesco Advisers, Inc. (registered investment adviser); Director, Chairman, Chief Executive Officer and President, IVZ Inc. (holding company), INVESCO Group Services, Inc. (service provider) and Invesco North American Holdings, Inc. (holding company); Director, Chief Executive Officer and President, Invesco Holding Company Limited (parent of Invesco and a global investment management firm); Director, Invesco Ltd.; Chairman, Investment Company Institute and President, Co-Chief Executive Officer, Co-President, Chief Operating Officer and Chief Financial Officer, Franklin Resources, Inc. (global investment management organization). | 144 | None | ||||
Philip A. Taylor2 — 1954 Trustee, President and Principal Executive Officer | 2006 | Head of North American Retail and Senior Managing Director, Invesco Ltd.; Director, Co-Chairman, Co-President and Co-Chief Executive Officer, Invesco Advisers, Inc. (formerly known as Invesco Institutional (N.A.), Inc.) (registered investment adviser); Director, Chairman, Chief Executive Officer and President, Invesco Management Group, Inc. (formerly known as Invesco Aim Management Group, Inc.) (financial services holding company); Director and President, INVESCO Funds Group, Inc. (registered investment adviser and registered transfer agent); Director and Chairman, Invesco Investment Services, Inc. (formerly known as Invesco Aim Investment Services, Inc.) (registered transfer agent) and IVZ Distributors, Inc. (formerly known as INVESCO Distributors, Inc.) (registered broker dealer); Director, President and Chairman, Invesco Inc. (holding company) and Invesco Canada Holdings Inc. (holding company); Chief Executive Officer, Invesco Corporate Class Inc. (corporate mutual fund company) and Invesco Canada Fund Inc. (corporate mutual fund company); Director, Chairman and Chief Executive Officer, Invesco Canada Ltd. (formerly known as Invesco Trimark Ltd./Invesco Trimark Ltèe) (registered investment adviser and registered transfer agent); Trustee, President and Principal Executive Officer, The Invesco Funds (other than AIM Treasurer’s Series Trust (Invesco Treasurer’s Series Trust) and Short-Term Investments Trust); Trustee and Executive Vice President, The Invesco Funds (AIM Treasurer’s Series Trust (Invesco Treasurer’s Series Trust) and Short-Term Investments Trust only); Director, Invesco Investment Advisers LLC (formerly known as Van Kampen Asset Management); Director, Chief Executive Officer and President, Van Kampen Exchange Corp.
Formerly: Director and Chairman, Van Kampen Investor Services Inc.; Director, Chief Executive Officer and President, 1371 Preferred Inc. (holding company) and Van Kampen Investments Inc.; Director and President, AIM GP Canada Inc. (general partner for limited partnerships) and Van Kampen Advisors, Inc.; Director and Chief Executive Officer, Invesco Trimark Dealer Inc. (registered broker dealer); Director, Invesco Distributors, Inc. (formerly known as Invesco Aim Distributors, Inc.) (registered broker dealer); Manager, Invesco PowerShares Capital Management LLC; Director, Chief Executive Officer and President, Invesco Advisers, Inc.; Director, Chairman, Chief Executive Officer and President, Invesco Aim Capital Management, Inc.; President, Invesco Trimark Dealer Inc. and Invesco Trimark Ltd./Invesco Trimark Ltèe; Director and President, AIM Trimark Corporate Class Inc. and AIM Trimark Canada Fund Inc.; Senior Managing Director, Invesco Holding Company Limited; Director and Chairman, Fund Management Company (former registered broker dealer); President and Principal Executive Officer, The Invesco Funds (AIM Treasurer’s Series Trust (Invesco Treasurer’s Series Trust), and Short-Term Investments Trust only); President, AIM Trimark Global Fund Inc. and AIM Trimark Canada Fund Inc. | 144 | None | ||||
| Independent Trustees | ||||||||
Bruce L. Crockett — 1944 Trustee and Chair | 2001 | Chairman, Crockett Technologies Associates (technology consulting company)
Formerly: Director, Captaris (unified messaging provider); Director, President and Chief Executive Officer, COMSAT Corporation; Chairman, Board of Governors of INTELSAT (international communications company); ACE Limited (insurance company); and Investment Company Institute | 144 | ALPS (Attorneys Liability Protection Society) (insurance company) |
| 1 | Mr. Flanagan is considered an interested person (within the meaning of Section 2(a)(19) of the 1940 Act) of the Trust because he is an officer of the Adviser to the Trust, and an officer and a director of Invesco Ltd., ultimate parent of the Adviser. |
| 2 | Mr. Taylor is considered an interested person (within the meaning of Section 2(a)(19) of the 1940 Act) of the Trust because he is an officer and a director of the Adviser. |
T-1 Invesco Convertible Securities Fund
Trustees and Officers—(continued)
Name, Year of Birth and Position(s) Held with the Trust | Trustee and/ or Officer Since | Principal Occupation(s) During Past 5 Years | Number of Funds in Fund Complex Overseen by Trustee | Other Directorship(s) Held by Trustee During | ||||
| Independent Trustees—(continued) | ||||||||
David C. Arch — 1945 Trustee | 2010 | Chairman of Blistex Inc., a consumer health care products manufacturer | 144 | Board member of the Illinois Manufacturers’ Association; Member of the Board of Visitors, Institute for the Humanities, University of Michigan; Member of the Audit Committee of the Edward-Elmhurst Hospital | ||||
James T. Bunch — 1942 Trustee | 2003 | Managing Member, Grumman Hill Group LLC (family office private equity investments)
Formerly: Founder, Green Manning & Bunch Ltd. (investment banking firm) (1988-2010); Executive Committee, United States Golf Association; and Director, Policy Studies, Inc. and Van Gilder Insurance Corporation | 144 | Chairman, Board of Governors, Western Golf Association; Chairman, Evans Scholars Foundation; and Director, Denver Film Society | ||||
Rodney F. Dammeyer — 1940 Trustee | 2010 | Chairman of CAC, LLC, (private company offering capital investment and management advisory services)
Formerly: Prior to 2001, Managing Partner at Equity Group Corporate Investments; Prior to 1995, Chief Executive Officer of Itel Corporation (formerly Anixter International); Prior to 1985, experience includes Senior Vice President and Chief Financial Officer of Household International, Inc., Executive Vice President and Chief Financial Officer of Northwest Industries, Inc. and Partner of Arthur Andersen & Co.; From 1987 to 2010, Director/Trustee of investment companies in the Van Kampen Funds complex | 144 | Director of Quidel Corporation and Stericycle, Inc. | ||||
Albert R. Dowden — 1941 Trustee | 2001 | Director of a number of public and private business corporations, including the Boss Group, Ltd. (private investment and management); Nature’s Sunshine Products, Inc. and Reich & Tang Funds (5 portfolios) (registered investment company)
Formerly: Director, Homeowners of America Holding Corporation/Homeowners of America Insurance Company (property casualty company); Director, Continental Energy Services, LLC (oil and gas pipeline service); Director, CompuDyne Corporation (provider of product and services to the public security market) and Director, Annuity and Life Re (Holdings), Ltd. (reinsurance company); Director, President and Chief Executive Officer, Volvo Group North America, Inc.; Senior Vice President, AB Volvo; Director of various public and private corporations; Chairman, DHJ Media, Inc.; Director, Magellan Insurance Company; and Director, The Hertz Corporation, Genmar Corporation (boat manufacturer), National Media Corporation; Advisory Board of Rotary Power International (designer, manufacturer, and seller of rotary power engines); and Chairman, Cortland Trust, Inc. (registered investment company) | 144 | Director of: Nature’s Sunshine Products, Inc., Reich & Tang Funds, Homeowners of America Holding Corporation/ Homeowners of America Insurance Company, the Boss Group | ||||
Jack M. Fields — 1952 Trustee | 2001 | Chief Executive Officer, Twenty First Century Group, Inc. (government affairs company); Owner and Chief Executive Officer, Dos Angeles Ranch, L.P. (cattle, hunting, corporate entertainment); and Discovery Global Education Fund (non-profit)
Formerly: Chief Executive Officer, Texana Timber LP (sustainable forestry company); Director of Cross Timbers Quail Research Ranch (non-profit); and member of the U.S. House of Representatives | 144 | Insperity, Inc. (formerly known as Administaff) | ||||
Prema Mathai-Davis — 1950 Trustee | 2001 | Retired. Formerly: Chief Executive Officer, YWCA of the U.S.A. | 144 | None | ||||
Larry Soll — 1942 Trustee | 2003 | Retired. Formerly: Chairman, Chief Executive Officer and President, Synergen Corp. (a biotechnology company) | 144 | None | ||||
Hugo F. Sonnenschein — 1940 Trustee | 2010 | President Emeritus and Honorary Trustee of the University of Chicago and the Adam Smith Distinguished Service Professor in the Department of Economics at the University of Chicago. Prior to 2000, President of the University of Chicago | 144 | Trustee of the University of Rochester and a member of its investment committee; Member of the National Academy of Sciences and the American Philosophical Society; Fellow of the American Academy of Arts and Sciences | ||||
Raymond Stickel, Jr. — 1944 Trustee | 2005 | Retired. Formerly: Director, Mainstay VP Series Funds, Inc. (25 portfolios) and Partner, Deloitte & Touche | 144 | None | ||||
T-2 Invesco Convertible Securities Fund
Trustees and Officers—(continued)
Name, Year of Birth and Position(s) Held with the Trust | Trustee and/ or Officer Since | Principal Occupation(s) During Past 5 Years | Number of Funds in Fund Complex Overseen by Trustee | Other Directorship(s) Held by Trustee During | ||||
| Independent Trustees—(continued) | ||||||||
Suzanne H. Woolsey — 1941 Trustee | 2014 | Chief Executive Officer of Woolsey Partners LLC | 144 | Emeritus Chair of the Board of Trustees of the Institute for Defense Analyses; Trustee of Colorado College; Trustee of California Institute of Technology; Prior to 2014, Director of Fluor Corp.; Prior to 2010, Trustee of the German Marshall Fund of the United States; Prior to 2010 Trustee of the Rocky Mountain Institute | ||||
| Other Officers | ||||||||
Russell C. Burk — 1958 Senior Vice President and Senior Officer | 2005 | Senior Vice President and Senior Officer, The Invesco Funds | N/A | N/A | ||||
John M. Zerr — 1962 Senior Vice President, Chief Legal Officer and Secretary | 2006 | Director, Senior Vice President, Secretary and General Counsel, Invesco Management Group, Inc. (formerly known as Invesco Aim Management Group, Inc.) and Van Kampen Exchange Corp.; Senior Vice President, Invesco Advisers, Inc. (formerly known as Invesco Institutional (N.A.), Inc.) (registered investment adviser); Senior Vice President and Secretary, Invesco Distributors, Inc. (formerly known as Invesco Aim Distributors, Inc.); Director, Vice President and Secretary, Invesco Investment Services, Inc. (formerly known as Invesco Aim Investment Services, Inc.) and IVZ Distributors, Inc. (formerly known as INVESCO Distributors, Inc.); Director and Vice President, INVESCO Funds Group, Inc.; Senior Vice President, Chief Legal Officer and Secretary, The Invesco Funds; Manager, Invesco PowerShares Capital Management LLC; Director, Secretary and General Counsel, Invesco Investment Advisers LLC (formerly known as Van Kampen Asset Management); Secretary and General Counsel, Invesco Capital Markets, Inc. (formerly known as Van Kampen Funds Inc.) and Chief Legal Officer, PowerShares Exchange-Traded Fund Trust, PowerShares Exchange-Traded Fund Trust II, PowerShares India Exchange-Traded Fund Trust , PowerShares Actively Managed Exchange-Traded Fund Trust; and PowerShares Actively Managed Exchange-Traded Commodity Fund Trust
Formerly: Director and Vice President, Van Kampen Advisors Inc.; Director, Vice President, Secretary and General Counsel, Van Kampen Investor Services Inc.; Director, Invesco Distributors, Inc. (formerly known as Invesco Aim Distributors, Inc.); Director, Senior Vice President, General Counsel and Secretary, Invesco Aim Advisers, Inc. and Van Kampen Investments Inc.; Director, Vice President and Secretary, Fund Management Company; Director, Senior Vice President, Secretary, General Counsel and Vice President, Invesco Aim Capital Management, Inc.; Chief Operating Officer and General Counsel, Liberty Ridge Capital, Inc. (an investment adviser); Vice President and Secretary, PBHG Funds (an investment company) and PBHG Insurance Series Fund (an investment company); Chief Operating Officer, General Counsel and Secretary, Old Mutual Investment Partners (a broker-dealer); General Counsel and Secretary, Old Mutual Fund Services (an administrator) and Old Mutual Shareholder Services (a shareholder servicing center); Executive Vice President, General Counsel and Secretary, Old Mutual Capital, Inc. (an investment adviser); and Vice President and Secretary, Old Mutual Advisors Funds (an investment company) | N/A | N/A | ||||
Sheri Morris — 1964 Vice President, Treasurer and Principal Financial Officer | 1999 | Vice President, Treasurer and Principal Financial Officer, The Invesco Funds; Vice President, Invesco Advisers, Inc. (formerly known as Invesco Institutional (N.A.), Inc.) (registered investment adviser); and Vice President, PowerShares Exchange-Traded Fund Trust, PowerShares Exchange-Traded Fund Trust II, PowerShares India Exchange-Traded Fund Trust, PowerShares Actively Managed Exchange-Traded Fund Trust, and PowerShares Actively Managed Exchange-Traded Commodity Fund Trust
Formerly: Vice President, Invesco Aim Advisers, Inc., Invesco Aim Capital Management, Inc. and Invesco Aim Private Asset Management, Inc.; Assistant Vice President and Assistant Treasurer, The Invesco Funds and Assistant Vice President, Invesco Advisers, Inc., Invesco Aim Capital Management, Inc. and Invesco Aim Private Asset Management, Inc.; and Treasurer, PowerShares Exchange-Traded Fund Trust, PowerShares Exchange-Traded Fund Trust II, PowerShares India Exchange-Traded Fund Trust and PowerShares Actively Managed Exchange-Traded Fund Trust | N/A | N/A | ||||
T-3 Invesco Convertible Securities Fund
Trustees and Officers—(continued)
Name, Year of Birth and Position(s) Held with the Trust | Trustee and/ or Officer Since | Principal Occupation(s) During Past 5 Years | Number of Funds in Fund Complex Overseen by Trustee | Other Directorship(s) Held by Trustee During | ||||
| Other Officers—(continued) | ||||||||
Karen Dunn Kelley — 1960 Vice President | 2004 | Senior Managing Director, Investments; Director, Co-President, Co-Chief Executive Officer, and Co-Chairman, Invesco Advisers, Inc. (formerly known as Invesco Institutional (N.A.), Inc.) (registered investment adviser); Chairman, Invesco Senior Secured Management, Inc.; Senior Vice President, Invesco Management Group, Inc. (formerly known as Invesco Aim Management Group, Inc.); Executive Vice President, Invesco Distributors, Inc. (formerly known as Invesco Aim Distributors, Inc.); Director, Invesco Mortgage Capital Inc. and Invesco Management Company Limited; Director and President, INVESCO Asset Management (Bermuda) Ltd., Vice President, The Invesco Funds (other than AIM Treasurer’s Series Trust (Invesco Treasurer’s Series Trust) and Short-Term Investments Trust); and President and Principal Executive Officer, The Invesco Funds (AIM Treasurer’s Series Trust (Invesco Treasurer’s Series Trust) and Short-Term Investments Trust only)
Formerly: Director, INVESCO Global Asset Management Limited and INVESCO Management S.A.; Senior Vice President, Van Kampen Investments Inc. and Invesco Advisers, Inc. (formerly known as Invesco Institutional (N.A.), Inc.) (registered investment adviser); Vice President, Invesco Advisers, Inc. (formerly known as Invesco Institutional (N.A.), Inc.); Director of Cash Management and Senior Vice President, Invesco Advisers, Inc. and Invesco Aim Capital Management, Inc.; Director and President, Fund Management Company; Chief Cash Management Officer, Director of Cash Management, Senior Vice President, and Managing Director, Invesco Aim Capital Management, Inc.; Director of Cash Management, Senior Vice President, and Vice President, Invesco Advisers, Inc. and The Invesco Funds (AIM Treasurer’s Series Trust (Invesco Treasurer’s Series Trust), and Short-Term Investments Trust only) | N/A | N/A | ||||
Crissie M. Wisdom — 1969 Anti-Money Laundering Compliance Officer | 2013 | Anti-Money Laundering Compliance Officer, Invesco Advisers, Inc. (formerly known as Invesco Institutional (N.A.), Inc.) (registered investment adviser), Invesco Capital Markets, Inc. (formerly known as Van Kampen Funds Inc.), Invesco Distributors, Inc., Invesco Investment Services, Inc., Invesco Management Group, Inc., Van Kampen Exchange Corp., The Invesco Funds, and PowerShares Exchange-Traded Fund Trust, PowerShares Exchange-Traded Fund Trust II, PowerShares India Exchange-Traded Fund Trust, PowerShares Actively Managed Exchange-Traded Fund Trust and PowerShares Actively Managed Exchange-Traded Commodity Fund Trust; and Fraud Prevention Manager and Controls and Risk Analysis Manager for Invesco Investment Services, Inc. | N/A | N/A | ||||
Todd L. Spillane — 1958 Chief Compliance Officer | 2006 | Senior Vice President, Invesco Management Group, Inc. (formerly known as Invesco Aim Management Group, Inc.) and Van Kampen Exchange Corp.; Senior Vice President and Chief Compliance Officer, Invesco Advisers, Inc. (registered investment adviser) (formerly known as Invesco Institutional (N.A.), Inc.); Chief Compliance Officer, The Invesco Funds; Vice President, Invesco Distributors, Inc. (formerly known as Invesco Aim Distributors, Inc.) and Invesco Investment Services, Inc. (formerly known as Invesco Aim Investment Services, Inc.)
Formerly: Chief Compliance Officer, Invesco Funds (Chicago); Senior Vice President, Van Kampen Investments Inc.; Senior Vice President and Chief Compliance Officer, Invesco Aim Advisers, Inc. and Invesco Aim Capital Management, Inc.; Chief Compliance Officer, INVESCO Private Capital Investments, Inc. (holding company), Invesco Private Capital, Inc. (registered investment adviser), Invesco Global Asset Management (N.A.), Inc., Invesco Senior Secured Management, Inc. (registered investment adviser), Van Kampen Investor Services Inc., PowerShares Exchange-Traded Fund Trust, PowerShares Exchange-Traded Fund Trust II, PowerShares India Exchange-Traded Fund Trust and PowerShares Actively Managed Exchange-Traded Fund Trust; and Vice President, Invesco Aim Capital Management, Inc. and Fund Management Company | N/A | N/A |
The Statement of Additional Information of the Trust includes additional information about the Fund’s Trustees and is available upon request, without charge, by calling 1.800.959.4246. Please refer to the Fund’s prospectus for information on the Fund’s sub-advisers.
Office of the Fund 11 Greenway Plaza, Suite 1000 Houston, TX 77046-1173 | Investment Adviser Invesco Advisers, Inc. 1555 Peachtree Street, N.E. Atlanta, GA 30309 | Distributor Invesco Distributors, Inc. 11 Greenway Plaza, Suite 1000 Houston, TX 77046-1173 | Auditors PricewaterhouseCoopers LLP 1000 Louisiana Street, Suite 5800 Houston, TX 77002-5678 | |||
Counsel to the Fund Stradley Ronon Stevens & Young, LLP 2005 Market Street, Suite 2600 Philadelphia, PA 19103-7018 | Counsel to the Independent Trustees Goodwin Procter LLP 901 New York Avenue, N.W. Washington, D.C. 20001 | Transfer Agent Invesco Investment Services, Inc. 11 Greenway Plaza, Suite 1000 Houston, TX 77046-1173 | Custodian State Street Bank and Trust Company 225 Franklin Street Boston, MA 02110-2801 | |||
T-4 Invesco Convertible Securities Fund

Invesco mailing information
Send general correspondence to Invesco Investment Services, Inc., P.O. Box 219078, Kansas City, MO 64121-9078.
Important notice regarding delivery of security holder documents
To reduce Fund expenses, only one copy of most shareholder documents may be mailed to shareholders with multiple accounts at the same address (Householding). Mailing of your shareholder documents may be householded indefinitely unless you instruct us otherwise. If you do not want the mailing of these documents to be combined with those for other members of your household, please contact Invesco Investment Services, Inc. at 800 959 4246 or contact your financial institution. We will begin sending you individual copies for each account within 30 days after receiving your request.
Fund holdings and proxy voting information
The Fund provides a complete list of its holdings four times in each fiscal year, at the quarter ends. For the second and fourth quarters, the lists appear in the Fund’s semiannual and annual reports to shareholders. For the first and third quarters, the Fund files the lists with the Securities and Exchange Commission (SEC) on Form N-Q. The most recent list of portfolio holdings is available at invesco.com/completeqtrholdings. Shareholders can also look up the Fund’s Forms N-Q on the SEC website at sec.gov. Copies of the Fund’s Forms N-Q may be reviewed and copied at the SEC Public Reference Room in Washington, D.C. You can obtain information on the operation of the Public Reference Room, including information about duplicating fee charges, by calling 202 551 8090 or 800 732 0330, or by electronic request at the following email address: publicinfo@sec.gov. The SEC file numbers for the Fund are shown below.
A description of the policies and procedures that the Fund uses to determine how to vote proxies relating to portfolio securities is available without charge, upon request, from our Client Services department at 800 959 4246 or at invesco.com/proxyguidelines. The information is also available on the SEC website, sec.gov.
Information regarding how the Fund voted proxies related to its portfolio securities during the most recent 12-month period ended June 30 is available at invesco.com/proxysearch. The information is also available on the SEC website, sec.gov. |
| |
Invesco Advisers, Inc. is an investment adviser; it provides investment advisory services to individual and institutional clients and does not sell securities. Invesco Distributors, Inc. is the US distributor for Invesco Ltd.’s retail mutual funds, exchange-traded funds and institutional money market funds. Both are wholly owned, indirect subsidiaries of Invesco Ltd. |

| SEC file numbers: 811-02699 and 002-57526 | MS-CSEC-AR-1 | Invesco Distributors, Inc. |
| ||||
 | Annual Report to Shareholders
| December 31, 2014 | ||
| ||||
Invesco Global Low Volatility Equity Yield Fund
Nasdaq: A: GTNDX n B: GNDBX n C: GNDCX n R: GTNRX n Y: GTNYX n R5: GNDIX | ||||

Letters to Shareholders
Philip Taylor | Dear Shareholders: This annual report includes information about your Fund, including performance data and a complete list of its investments as of the close of the reporting period. Inside, your Fund’s portfolio managers discuss how they managed your Fund and the factors that affected its performance during the reporting period. I hope you find this report of interest. During the reporting period, the US economy showed unmistakable signs of improvement. After contracting in the first quarter of 2014, the economy expanded strongly in the second and third quarters as employment data improved markedly. Given continuing positive economic trends, the US Federal Reserve (the Fed) ended its extraordinary asset purchase program in October – but it pledged in December to be “patient” before raising interest rates. Overseas, the story was much different. Concerns about economic stagnation and the potential for |

deflation depressed European markets, while the Chinese economy was hurt by a slowdown in manufacturing.
Political change in Washington, DC; changes to monetary policy by the Fed and other central banks; the future direction of oil prices; and unexpected geopolitical events are likely to affect markets in the US and overseas in 2015. This may make some investors hesitant to begin to save for their long-term financial goals. That’s why Invesco has always encouraged investors to work with a professional financial adviser who can stress the importance of starting to save and invest early and the importance of adhering to a disciplined investment plan – when times are good and when they’re uncertain. A financial adviser who knows your unique financial situation, investment goals and risk tolerance can be an invaluable partner as you seek to achieve your financial goals. He or she can offer a long-term perspective when markets are volatile and time-tested advice and guidance when your financial situation or investment goals change.
Timely information when and where you want it
Invesco’s efforts to help investors achieve their financial objectives include providing individual investors and financial professionals with timely information about the markets, the economy and investing – whenever and wherever they want it.
Our website, invesco.com/us, offers a wide range of market insights and investment perspectives. On the website, you’ll find detailed information about our funds, including prices, performance, holdings and portfolio manager commentaries. You can access information about your individual Invesco account whenever it’s convenient for you; just complete a simple, secure online registration. Use the “Log In” box on our home page to get started.
Invesco’s mobile apps for iPhone® and iPad® (both available free from the App StoreSM) allow you to obtain the same detailed information, monitor your account and create customizable watch lists. Also, they allow you to access investment insights from our investment leaders, market strategists, economists and retirement experts. You can sign up to be alerted when new commentary is added, and you can watch portfolio manager videos and have instant access to Invesco news and updates wherever you may be.
In addition to the resources accessible on our website and through our mobile app, you can obtain timely updates to help you stay informed about the markets, the economy and investing by connecting with Invesco on Twitter, LinkedIn or Facebook. You can access our blog at blog.invesco.us.com. Our goal is to provide you the information you want, when and where you want it.
Have questions?
For questions about your account, feel free to contact an Invesco client services representative at 800 959 4246. For Invesco-related questions or comments, please email me directly at phil@invesco.com.
All of us at Invesco look forward to serving your investment management needs for many years to come. Thank you for investing with us.
Sincerely,

Philip Taylor
Senior Managing Director, Invesco Ltd.
iPhone and iPad are trademarks of Apple Inc., registered in the US and other countries. App Store is a service mark of Apple Inc. Invesco Distributors, Inc. is not affiliated with Apple Inc.
2 Invesco Global Low Volatility Equity Yield Fund
Bruce Crockett | Dear Fellow Shareholders: Among the many important lessons I’ve learned in more than 40 years in a variety of business endeavors is the value of a trusted advocate. As independent chair of the Invesco Funds Board, I can assure you that the members of the Board are strong advocates for the interests of investors in Invesco’s mutual funds. We work hard to represent your interests through oversight of the quality of the investment management services your funds receive and other matters important to your investment, including but not limited to: n Ensuring that Invesco offers a diverse lineup of mutual funds that your financial adviser can use to strive to meet your financial needs as your investment goals change over time. n Monitoring how the portfolio management teams of the Invesco funds are performing in light of changing economic and market conditions. |

| n | Assessing each portfolio management team’s investment performance within the context of the investment strategy described in the fund’s prospectus. |
| n | Monitoring for potential conflicts of interests that may impact the nature of the services that your funds receive. |
We believe one of the most important services we provide our fund shareholders is the annual review of the funds’ advisory and sub-advisory contracts with Invesco Advisers and its affiliates. This review is required by the Investment Company Act of 1940 and focuses on the nature and quality of the services Invesco provides as the adviser to the Invesco funds and the reasonableness of the fees that it charges for those services. Each year, we spend months carefully reviewing information received from Invesco and a variety of independent sources, such as performance and fee data prepared by Lipper Inc., an independent, third-party firm widely recognized as a leader in its field. We also meet with our independent legal counsel and other independent advisers to review and help us assess the information that we have received. Our goal is to assure that you receive quality investment management services for a reasonable fee.
I trust the measures outlined above provide assurance that you have a worthy advocate when it comes to choosing the Invesco Funds.
As always, please contact me at bruce@brucecrockett.com with any questions or concerns you may have. On behalf of the Board, we look forward to continuing to represent your interests and serving your needs.
Sincerely,

Bruce L. Crockett
Independent Chair
Invesco Funds Board of Trustees
3 Invesco Global Low Volatility Equity Yield Fund
Management’s Discussion of Fund Performance
Performance summary
For the year ended December 31, 2014, Invesco Global Low Volatility Equity Yield Fund, at net asset value (NAV), lagged its broad market/style-specific index, the MSCI World Index. During the reporting period, stock selection was weak in the energy, financials and health care sectors. In contrast, the Fund benefited from positive stock selection in the consumer discretionary, information technology (IT) and industrials sectors as well as an overweight exposure to the utilities sector.
Your Fund’s long-term performance appears later in this report.
Fund vs. Indexes
Total returns, 12/31/13 to 12/31/14, at net asset value (NAV). Performance shown does not include applicable contingent deferred sales charges (CDSC) or front-end sales charges, which would have reduced performance.
| Class A Shares | -0.26 | % | |||
| Class B Shares | -1.08 | ||||
| Class C Shares | -0.98 | ||||
| Class R Shares | -0.51 | ||||
| Class Y Shares | -0.04 | ||||
| Class R5 Shares | 0.21 | ||||
| MSCI World Index‚ (Broad Market/Style-Specific Index) | 4.94 | ||||
| Lipper Global Equity Income Funds Indexn (Peer Group Index) | 2.01 |
Source(s): ‚FactSet Research Systems Inc.; nLipper Inc.
Market conditions and your Fund
Following a robust 2013, global equity markets began the year in a relatively quiet fashion. Volatility remained in the global markets as investors began to worry that stocks may have risen too far, too fast in 2013. Stocks rallied through the summer despite upheaval in Ukraine and signs of economic sluggishness in China. Also, equity markets in Europe continued to show momentum supported by the continent’s economic rebound. European Central Bank President Mario Draghi became the first major central banker to cut a key interest rate below zero and signaled a willingness to employ quantitative easing programs if low inflation persists. Investors interpreted these measures as an indication that global interest rates will likely remain low longer than expected.
As investors wrestled with evidence that US growth appeared to be on stronger footing than the rest of the world, in mid-September the price of oil began a sharp decline, along with global equities. Despite the unknown economic impact of significantly lower oil prices for an unforseeable period, equity markets stabilized and recovered even through a subsequent December sell-off to end the year on a positive note overall.
For the reporting period, the MSCI World Index delivered gains, with seven of the 10 sectors posting positive returns. The health care sector had the highest return, while the energy sector posted the lowest return.
During the reporting period, stock selection within the industrials sector was the largest contributor to both absolute performance and relative performance versus the Fund’s style-specific index, the
MSCI World Index. An overweight position in Lockheed Martin, the US-based aerospace and defense company, added to the Fund’s performance. A positive earnings surprise, the announcement of a higher dividend and a share buyback program drove the stock’s price during the reporting period.
In addition, an overweight position in US energy company Enerplus added to the Fund’s performance relative to its style-specific index. Our selection process rated this stock high in both our Market Sentiment concept and Management and Quality concept.
Another strong contributor to Fund performance was Frontier Communications. Frontier is a communications company providing services primarily to rural areas and small- and medium-sized US towns and cities. The company offers a range of voice, data, Internet and television services and products. Strong results at the beginning of the year boosted consumer confidence in this holding.
Stock selection in the energy sector was very difficult during the reporting period. The Fund’s overweight exposure to the energy sector further detracted from performance compared to the Fund’s style-specific index. An overweight position in the Canadian energy sector was also a detractor. The top five detractors from returns relative to the MSCI World Index were all Canadian energy companies. These companies included Baytex Energy, Canadian Oil Sands, Enerplus, Crescent Point Energy and Penn West Petroleum. The tumbling price of oil was the main driver for the underperformance of these stocks.
When looking closely at the countries in which the Fund invests, stock selection in Canada and Norway were the biggest detractors compared to the MSCI World Index. The Fund had significant overweight
| Portfolio Composition | |||||
By sector
| |||||
| Telecommunication Services | 16.1 | % | |||
| Utilities | 15.8 | ||||
| Consumer Discretionary | 14.6 | ||||
| Energy | 11.6 | ||||
| Financials | 10.5 | ||||
| Industrials | 9.8 | ||||
| Health Care | 7.8 | ||||
| Information Technology | 7.1 | ||||
| Consumer Staples | 5.1 | ||||
| Money Market Funds Plus Other Assets Less Liabilities | 1.6 | ||||
| Top 10 Equity Holdings* | |||||
1. Lockheed Martin Corp. | 2.2 | % | |||
2. Hennes & Mauritz AB-Class B | 2.1 | ||||
3. Archer-Daniels-Midland Co. | 2.1 | ||||
4. Western Union Co. (The) | 2.1 | ||||
5. Spark New Zealand Ltd. | 2.1 | ||||
6. Frontier Communications Corp. | 2.0 | ||||
7. Skandinaviska Enskilda Banken AB-Class A | 2.0 | ||||
8. Shaw Communications, Inc.- Class B | 2.0 | ||||
9. Telstra Corp. Ltd. | 2.0 | ||||
10. Belgacom S.A. | 2.0 | ||||
| Top Five Countries* | |||||
| 1. United States | 25.9 | % | |||
2. Australia | 17.0 | ||||
3. Canada | 12.3 | ||||
4. United Kingdom | 10.3 | ||||
5. Sweden | 7.6 | ||||
| Total Net Assets | $188.0 million | ||||
| Total Number of Holdings* | 72 | ||||
The Fund’s holdings are subject to change, and there is no assurance that the Fund will continue to hold any particular security.
*Excluding money market fund holdings.
4 Invesco Global Low Volatility Equity Yield Fund
exposure to Canada which amplified poor stock selection. In addition, the Fund’s significant underweight exposure to the US was a detriment. Conversely, stock selection was very strong in Australia, Belgium, France, Japan and the UK.
While our stock selection model was a good predictor of return when viewed across the full 3400+ security universe, the highest-ranked stocks generally underperformed their peers. The balance in the model proved a benefit in 2014, as the Earnings and Price Momentum concepts were strongest in the second half of the year when our Value and Management and Quality concepts were weakest. Investors rewarded companies with high and improving earnings expectations, as they sought growth in a global economic environment that was lacking it. As oil prices declined, investors also sought out recent winners in an attempt to identify those firms that could weather that storm. The unknown economic impact of significantly lower oil prices for an extended period, as well as deteriorating growth in the eurozone, Japan and China, likely impacted our stock selection model’s Value concept, as investors were unwilling to commit to companies trading at a discount.
We welcome new investors during the year and thank all shareholders for your continued investment in Invesco Global Low Volatility Equity Yield Fund.
The views and opinions expressed in management’s discussion of Fund performance are those of Invesco Advisers, Inc. These views and opinions are subject to change at any time based on factors such as market and economic conditions. These views and opinions may not be relied upon as investment advice or recommendations, or as an offer for a particular security. The information is not a complete analysis of every aspect of any market, country, industry, security or the Fund. Statements of fact are from sources considered reliable, but Invesco Advisers, Inc. makes no representation or warranty as to their completeness or accuracy. Although historical performance is no guarantee of future results, these insights may help you understand our investment management philosophy.
See important Fund and, if applicable, index disclosures later in this report.
 | Michael Abata Chartered Financial Analyst, Portfolio Manager, is manager of Invesco Global Low Volatility Equity Yield | |
| Fund. He joined Invesco in 2011. Mr. Abata earned a BA in economics from Binghamton University. | ||
 | Karl Georg Bayer Portfolio Manager, is manager of Invesco Global Low Volatility Equity Yield Fund. He joined Invesco in | |
| 1991. Mr. Bayer earned Diplom Kaufmann and Diplom Ingenieur degrees from the University of Darmstadt. | ||
 | Uwe Draeger Portfolio Manager, is manager of Invesco Global Low Volatility Equity Yield Fund. He joined Invesco in | |
| 2005. Mr. Draeger earned a Diplom-Ökonom degree from Hoch- schule für Ökonomie Berlin, an MA from City of London Polytechnic and an MBA from Anglia Business School (Cambridge). | ||
 | Nils Huter Chartered Financial Analyst, Portfolio Manager, is manager of Invesco Global Low Volatility Equity Yield | |
| Fund. He joined Invesco in 2007. Mr. Huter earned a Diplom Kaufmann degree from the University of Applied Sciences and Arts in Hildesheim. | ||
 | Charles Ko Chartered Financial Analyst, Portfolio Manager, is manager of Invesco Global Low Volatility Equity Yield | |
| Fund. He joined Invesco in 2012. Mr. Ko earned a BS from MIT and an MBA from Yale University. | ||
 | Jens Langewand Portfolio Manager, is manager of Invesco Global Low Volatility Equity Yield Fund. He joined Invesco in | |
| 2007. Mr. Langewand earned a Diplom-Kaufmann degree from the University of Münster and a PhD from the University of Augsburg. | ||
 | Andrew Waisburd Portfolio Manager, is manager of Invesco Global Low Volatility Equity Yield Fund. He joined Invesco in | |
| 2008. Mr. Waisburd earned a BS in statistics from Cornell University and an MS and a PhD in finance from Indiana University. | ||
5 Invesco Global Low Volatility Equity Yield Fund
Your Fund’s Long-Term Performance
Results of a $10,000 Investment – Oldest Share Class(es)
Fund and index data from 12/31/04

1 Source: Factset Research systems Inc.
Past performance cannot guarantee comparable future results.
The data shown in the chart include reinvested distributions, applicable sales charges and Fund expenses including management fees. Results for Class B shares are calculated as if a hypothetical
shareholder had liquidated his entire investment in the Fund at the close of the reporting period and paid the contingent deferred sales charges, if applicable. Index results include reinvested dividends, but they do not reflect sales charges. Performance of the peer group,
if applicable, reflects fund expenses and management fees; performance of a market index does not. Performance shown in the chart and table(s) does not reflect deduction of taxes a shareholder would pay on Fund distributions or sale of Fund shares.
continued from page 8
| n | Preferred securities risk. Preferred securities may include provisions that permit the issuer, in its discretion, to defer or omit distributions for a certain period of time. If the Fund owns a security that is deferring or omitting its distributions, the Fund may be required to report the distribution on its tax returns, even though it may not have received this income. Further, preferred securities may lose substantial value due to the omission or deferment of dividend payments. |
| n | REIT/real estate risk. Investments in real estate related instruments may be affected by economic, legal, cultural, environmental or technological factors that affect property values, rents or occupancies of real estate related to the Fund’s holdings. Real estate companies, including REITs or similar structures, tend to be small- and mid-cap companies, and their shares may be more volatile and less liquid. The value of investments in real estate related companies may be affected by the quality of management, the ability to repay loans, the utilization of leverage and financial |
covenants related thereto, whether the company carries adequate insurance and environmental factors. If a real estate related company defaults, the Fund may own real estate directly, which involves the following additional risks: environmental liabilities; difficulty in valuing and selling the real estate; and economic or regulatory changes. |
About indexes used in this report
| n | The MSCI World Index is an unmanaged index considered representative of stocks of developed countries. The index is computed using the net return, which withholds applicable taxes for non-resident investors. |
| n | The Lipper Global Equity Income Funds Index is an unmanaged Index considered representative of global equity income funds tracked by Lipper. |
| n | The Fund is not managed to track the performance of any particular index, including the index(es) described here, and consequently, the performance of the Fund may deviate significantly from the performance of the index(es). |
| n | A direct investment cannot be made in an index. Unless otherwise indicated, index results include reinvested dividends, and they do not reflect sales charges. Performance of the peer group, if applicable, reflects fund expenses; performance of a market index does not. |
Other information
| n | The returns shown in management’s discussion of Fund performance are based on net asset values (NAVs) calculated for shareholder transactions. Generally accepted accounting principles require adjustments to be made to the net assets of the Fund at period end for financial reporting purposes, and as such, the NAVs for shareholder transactions and the returns based on those NAVs may differ from the NAVs and returns reported in the Financial Highlights. |
| n | Industry classifications used in this report are generally according to the Global Industry Classification Standard, which was developed by and is the exclusive property and a service mark of MSCI Inc. and Standard & Poor’s. |
6 Invesco Global Low Volatility Equity Yield Fund
| Average Annual Total Returns | |||||
| As of 12/31/14, including maximum applicable sales charges | |||||
| Class A Shares | |||||
| Inception (9/15/97) | 6.06 | % | |||
| 10 Years | 4.01 | ||||
| 5 Years | 8.64 | ||||
| 1 Year | -5.75 | ||||
| Class B Shares | |||||
| Inception (9/15/97) | 6.16 | % | |||
| 10 Years | 3.97 | ||||
| 5 Years | 8.77 | ||||
| 1 Year | -5.89 | ||||
| Class C Shares | |||||
| Inception (1/2/98) | 6.03 | % | |||
| 10 Years | 3.82 | ||||
| 5 Years | 9.06 | ||||
| 1 Year | -1.95 | ||||
| Class R Shares | |||||
| 10 Years | 4.35 | % | |||
| 5 Years | 9.61 | ||||
| 1 Year | -0.51 | ||||
| Class Y Shares | |||||
| 10 Years | 4.75 | % | |||
| 5 Years | 10.14 | ||||
| 1 Year | -0.04 | ||||
| Class R5 Shares | |||||
| Inception (4/30/04) | 6.50 | % | |||
| 10 Years | 5.16 | ||||
| 5 Years | 10.50 | ||||
| 1 Year | 0.21 | ||||
Class R shares incepted on October 31, 2005. Performance shown prior to that date is that of Class A shares, restated to reflect the higher 12b-1 fees applicable to Class R shares. Class A share performance reflects any applicable fee waivers or expense reimbursements.
Class Y shares incepted on October 3, 2008. Performance shown prior to that date is that of Class A shares and includes the 12b-1 fees applicable to Class A shares. Class A share performance reflects any applicable fee waivers or expense reimbursements.
Class R5 shares incepted on April 30, 2004. Performance shown prior to that date is that of Class A shares and includes the 12b-1 fees applicable to Class A shares. Class A share performance reflects any applicable fee waivers or expense reimbursements.
The performance data quoted represent past performance and cannot guarantee comparable future results; current performance may
be lower or higher. Please visit invesco.com/performance for the most recent month-end performance. Performance figures reflect reinvested distributions, changes in net asset value and the effect of the maximum sales charge unless otherwise stated. Investment return and principal value will fluctuate so that you may have a gain or loss when you sell shares.
The total annual Fund operating expense ratio set forth in the most recent Fund prospectus as of the date of this report for Class A, Class B, Class C, Class R, Class Y and Class R5 shares was 1.54%, 2.29%, 2.29%, 1.79%, 1.29% and 1.02%, respectively. The expense ratios presented above may vary from the expense ratios presented in other sections of this report that are based on expenses incurred during the period covered by this report.
Class A share performance reflects the maximum 5.50% sales charge, and Class B and Class C share performance reflects the applicable contingent deferred sales charge (CDSC) for the period involved. The CDSC on Class B shares declines from 5% beginning at the time of purchase to 0% at the beginning of the seventh year. The CDSC on Class C shares is 1% for the first year after purchase. Class R, Class Y and Class R5 shares do not have a front-end sales charge or a CDSC; therefore, performance is at net asset value.
The performance of the Fund’s share classes will differ primarily due to different sales charge structures and class expenses.
7 Invesco Global Low Volatility Equity Yield Fund
Invesco Global Low Volatility Equity Yield Fund’s investment objective is income and long-term growth of capital.
| n | Unless otherwise stated, information presented in this report is as of December 31, 2014, and is based on total net assets. |
| n | Unless otherwise noted, all data provided by Invesco. |
| n | To access your Fund’s reports/prospectus, visit invesco.com/fundreports. |
About share classes
| n | Class B shares may not be purchased for new or additional investments. Please see the prospectus for more information. |
| n | Class R shares are generally available only to employer sponsored retirement and benefit plans. Please see the prospectus for more information. |
| n | Class Y shares are available only to certain investors. Please see the prospectus for more information. |
| n | Class R5 shares are primarily intended for employer sponsored retirement and benefit plans that meet certain standards and for institutional investors. Please see the prospectus for more information. |
Principal risks of investing in the Fund
| n | Currency/exchange rate risk. The dollar value of the Fund’s foreign investments will be affected by changes in the exchange rates between the dollar and the currencies in which those investments are traded. |
| n | Depositary receipts risk. Depositary receipts involve many of the same risks as those associated with direct investment in foreign securities. In addition, the underlying issuers of certain depositary receipts, particularly unsponsored or unregistered depositary receipts, are under no obligation to distribute shareholder communications to the holders of such receipts or to pass through to them any voting rights with respect to the deposited securities. |
| n | Derivatives risk. The value of a derivative instrument depends largely on (and is derived from) the value of an underlying security, currency, commodity, interest rate, index or other asset (each referred to as an underlying asset). In addition to risks relating to the underlying assets, the use of derivatives may include other, possibly greater, risks, including counterparty, leverage and liquidity risks. Counterparty risk is the risk that the counterparty to the derivative contract |
will default on its obligation to pay the Fund the amount owed or otherwise perform under the derivative contract. Derivatives create leverage risk because they do not require payment up front equal to the economic exposure created by owning the derivative. As a result, an adverse change in the value of the underlying asset could result in the Fund sustaining a loss that is substantially greater than the amount invested in the derivative, which may make the Fund’s returns more volatile and increase the risk of loss. Derivative instruments may also be less liquid than more traditional investments and the Fund may be unable to sell or close out its derivative positions at a desirable time or price. This risk may be more acute under adverse market conditions, during which the Fund may be most in need of liquidating its derivative positions. Derivatives may also be harder to value, less tax efficient and subject to changing government regulation that could impact the Fund’s ability to use certain derivatives or their cost. Also, derivatives used for hedging or to gain or limit exposure to a particular market segment may not provide the expected benefits, particularly during adverse market conditions. |
| n | Developing/emerging markets securities risk. The prices of securities issued by foreign companies and governments located in developing/emerging market countries may be affected more negatively by inflation, devaluation of their currencies, higher transaction costs, delays in settlement, adverse political developments, the introduction of capital controls, withholding taxes, nationalization of private assets, expropriation, social unrest, war or lack of timely information than those in developed countries. |
| n | Foreign securities risk. The Fund’s foreign investments may be affected by changes in a foreign country’s exchange rates, political and social instability, changes in economic or taxation policies, difficulties when enforcing obligations, decreased liquidity, and |
This report must be accompanied or preceded by a currently effective Fund prospectus, which contains more complete information, including sales charges and expenses. Investors should read it carefully before investing.
NOT FDIC INSURED | MAY LOSE VALUE | NO BANK GUARANTEE
increased volatility. Foreign companies may be subject to less regulation resulting in less publicly available information about the companies.
| n | Geographic focus risk. From time to time the Fund may invest a substantial amount of its assets in securities of issuers located in a single country or a limited number of countries. If the Fund focuses its investments in this manner, it assumes the risk that economic, political and social conditions in those countries will have a significant impact on its investment performance. The Fund’s investment performance may also be more volatile if it focuses its investments in certain countries, especially emerging markets countries. |
| n | Investing in the European Union risk. Many countries in the European Union are susceptible to high economic risks associated with high levels of debt, notably due to investments in sovereign debts of European countries such as Greece, Italy and Spain. One or more member states might exit the European Union, placing its currency and banking system in jeopardy. The European Union faces major issues involving its membership, structure, procedures and policies, including the adoption, abandonment or adjustment of the new constitutional treaty, the European Union’s enlargement to the south and east, and resolution of the European Union’s problematic fiscal and democratic accountability. Efforts of the member states to further unify their economic and monetary policies may increase the potential for the downward movement of one member state’s market to cause a similar effect on other member states’ markets. European countries that are part of the European Economic and Monetary Union may be significantly affected by the tight fiscal and monetary controls that the union seeks to impose on its members. |
| n | Management risk. The investment techniques and risk analysis used by the Fund’s portfolio managers may not produce the desired results. |
| n | Market risk. The prices of and the income generated by the Fund’s securities may decline in response to, among other things, investor sentiment, general economic and market conditions, regional or global instability, and currency and interest rate fluctuations. |
continued on page 6
8 Invesco Global Low Volatility Equity Yield Fund
Schedule of Investments
December 31, 2014
| Shares | Value | |||||||
Common Stocks & Other Equity Interests–98.43% |
| |||||||
| Australia–17.05% | ||||||||
Bank of Queensland Ltd. | 331,881 | $ | 3,279,668 | |||||
Caltex Australia Ltd. | 125,105 | 3,461,967 | ||||||
Cochlear Ltd.(a) | 42,531 | 2,684,261 | ||||||
Commonwealth Bank of Australia | 30,952 | 2,149,625 | ||||||
CSL Ltd. | 35,650 | 2,510,155 | ||||||
DUET Group | 1,860,115 | 3,652,117 | ||||||
Lend Lease Group | 277,102 | 3,689,546 | ||||||
Ramsay Health Care Ltd. | 75,313 | 3,492,343 | ||||||
Telstra Corp. Ltd. | 775,145 | 3,764,264 | ||||||
Woodside Petroleum Ltd. | 108,350 | 3,368,395 | ||||||
| 32,052,341 | ||||||||
| Austria–0.54% | ||||||||
Oesterreichische Post AG | 20,669 | 1,007,780 | ||||||
| Belgium–3.39% | ||||||||
Belgacom S.A. | 103,382 | 3,743,600 | ||||||
Delhaize Group S.A. | 36,265 | 2,634,467 | ||||||
| 6,378,067 | ||||||||
| Canada–12.29% | ||||||||
Baytex Energy Corp.(a) | 96,600 | 1,606,397 | ||||||
Canadian Oil Sands Ltd. | 209,500 | 1,878,972 | ||||||
Canadian Tire Corp., Ltd.–Class A | 33,100 | 3,496,896 | ||||||
Capital Power Corp.(a) | 72,200 | 1,615,769 | ||||||
Crescent Point Energy Corp.(a) | 79,200 | 1,834,457 | ||||||
Enerplus Corp.(a) | 189,000 | 1,820,374 | ||||||
Metro Inc. | 38,500 | 3,091,797 | ||||||
Penn West Petroleum Ltd.(a) | 464,900 | 972,376 | ||||||
Russel Metals, Inc. | 63,600 | 1,417,834 | ||||||
Shaw Communications, Inc.–Class B(a) | 139,700 | 3,769,663 | ||||||
Stantec Inc. | 14,800 | 406,753 | ||||||
Superior Plus Corp. | 115,800 | 1,195,078 | ||||||
| 23,106,366 | ||||||||
| Denmark–1.07% | ||||||||
Pandora AS | 7,234 | 586,754 | ||||||
TDC A/S | 186,526 | 1,421,415 | ||||||
| 2,008,169 | ||||||||
| France–1.87% | ||||||||
GDF Suez | 150,924 | 3,525,021 | ||||||
| Germany–1.86% | ||||||||
ProSiebenSat.1 Media AG | 83,136 | 3,503,998 | ||||||
| Hong Kong–1.85% | ||||||||
Power Assets Holdings Ltd. | 359,500 | 3,473,006 | ||||||
| Israel–1.72% | ||||||||
Bezeq The Israeli Telecommunication Corp. Ltd. | 1,813,507 | 3,225,683 | ||||||
| Shares | Value | |||||||
| Japan–3.82% | ||||||||
Nippon Telegraph & Telephone Corp. | 71,000 | $ | 3,654,129 | |||||
Tokyo Gas Co., Ltd. | 654,000 | 3,529,680 | ||||||
| 7,183,809 | ||||||||
| New Zealand–3.87% | ||||||||
SKY Network Television Ltd. | 489,227 | 2,305,142 | ||||||
SKYCITY Entertainment Group Ltd. | 369,655 | 1,116,715 | ||||||
Spark New Zealand Ltd. | 1,588,548 | 3,849,161 | ||||||
| 7,271,018 | ||||||||
| Norway–0.61% | ||||||||
Seadrill Ltd.(a) | 99,469 | 1,145,024 | ||||||
| Singapore–1.24% | ||||||||
ComfortDelGro Corp. Ltd. | 229,000 | 448,311 | ||||||
Singapore Post Ltd. | 821,000 | 1,186,439 | ||||||
Venture Corp. Ltd. | 118,000 | 701,034 | ||||||
| 2,335,784 | ||||||||
| Spain–2.88% | ||||||||
Banco Santander S.A. | 419,757 | 3,510,079 | ||||||
Endesa, S.A. | 95,972 | 1,906,216 | ||||||
| 5,416,295 | ||||||||
| Sweden–7.65% | ||||||||
Hennes & Mauritz AB–Class B | 96,277 | 3,993,821 | ||||||
Intrum Justitia AB | 74,356 | 2,199,429 | ||||||
Loomis AB–Class B | 24,425 | 708,116 | ||||||
Skandinaviska Enskilda Banken AB–Class A | 302,983 | 3,832,659 | ||||||
Tele2 AB–Class B | 301,204 | 3,646,514 | ||||||
| 14,380,539 | ||||||||
| Switzerland–0.56% | ||||||||
Forbo Holding AG | 1,056 | 1,056,425 | ||||||
| United Kingdom–10.28% | ||||||||
Berendsen PLC | 79,969 | 1,363,592 | ||||||
Micro Focus International PLC | 78,154 | 1,308,313 | ||||||
National Grid PLC | 201,097 | 2,866,986 | ||||||
Next PLC | 35,242 | 3,717,417 | ||||||
Royal Dutch Shell PLC–Class A | 106,322 | 3,524,425 | ||||||
SSE PLC | 134,549 | 3,378,021 | ||||||
WH Smith PLC | 152,383 | 3,179,500 | ||||||
| 19,338,254 | ||||||||
| United States–25.88% | ||||||||
Amdocs Ltd. | 9,300 | 433,892 | ||||||
Archer-Daniels-Midland Co. | 75,500 | 3,926,000 | ||||||
Edison International | 12,900 | 844,692 | ||||||
Entergy Corp. | 41,500 | 3,630,420 | ||||||
Frontier Communications Corp.(a) | 575,000 | 3,835,250 | ||||||
Garmin Ltd. | 14,200 | 750,186 | ||||||
Hewlett-Packard Co. | 92,400 | 3,708,012 | ||||||
See accompanying Notes to Financial Statements which are an integral part of the financial statements.
9 Invesco Global Low Volatility Equity Yield Fund
| Shares | Value | |||||||
| United States–(continued) | ||||||||
Lexmark International, Inc.–Class A | 81,600 | $ | 3,367,632 | |||||
Lockheed Martin Corp. | 21,100 | 4,063,227 | ||||||
Northrop Grumman Corp. | 23,900 | 3,522,621 | ||||||
PDL BioPharma Inc.(a) | 396,000 | 3,053,160 | ||||||
Pfizer Inc. | 95,000 | 2,959,250 | ||||||
Prospect Capital Corp.(a) | 403,461 | 3,332,588 | ||||||
R. R. Donnelley & Sons Co. | 129,400 | 2,174,567 | ||||||
Transocean Ltd.(a) | 114,500 | 2,098,785 | ||||||
Western Union Co. (The) | 215,700 | 3,863,187 | ||||||
Windstream Holdings Inc.(a) | 377,600 | 3,111,424 | ||||||
| 48,674,893 | ||||||||
Total Common Stocks & Other Equity Interests |
| 185,082,472 | ||||||
Money Market Funds–1.00% |
| |||||||
Liquid Assets Portfolio–Institutional Class(b) | 937,568 | 937,568 | ||||||
Premier Portfolio–Institutional Class(b) | 937,568 | 937,568 | ||||||
Total Money Market Funds |
| 1,875,136 | ||||||
TOTAL INVESTMENTS (excluding investments purchased with cash collateral from securities on loan)–99.43% (Cost $183,973,244) |
| 186,957,608 | ||||||
| Shares | Value | |||||||
Investments Purchased with Cash Collateral from Securities on Loan |
| |||||||
Money Market Funds–11.02% |
| |||||||
Liquid Assets Portfolio–Institutional Class (Cost $20,723,839)(b)(c) | 20,723,839 | $ | 20,723,839 | |||||
TOTAL INVESTMENTS–110.45% |
| 207,681,447 | ||||||
OTHER ASSETS LESS LIABILITIES–(10.45)% |
| (19,637,219 | ) | |||||
NET ASSETS–100.00% |
| $ | 188,044,228 | |||||
Notes to Schedule of Investments:
| (a) | All or a portion of this security was out on loan at December 31, 2014. |
| (b) | The money market fund and the Fund are affiliated by having the same investment adviser. |
| (c) | The security has been segregated to satisfy the commitment to return the cash collateral received in securities lending transactions upon the borrower’s return of the securities loaned. See Note 1I. The following table presents the Fund’s gross and net amount of assets available for offset by the Fund as of December 31, 2014. |
| Counterparty | Gross Amount of Securities on Loan at Value | Cash Collateral Received for Securities Loaned* | Net Amount | |||||||||
State Street Bank and Trust Co. | $ | 19,794,087 | $ | (19,794,087 | ) | $ | — | |||||
| * | Amount does not include excess collateral received. |
See accompanying Notes to Financial Statements which are an integral part of the financial statements.
10 Invesco Global Low Volatility Equity Yield Fund
Statement of Assets and Liabilities
December 31, 2014
Assets: |
| |||
Investments, at value (Cost $182,098,108)* | $ | 185,082,472 | ||
Investments in affiliated money market funds, at value and cost | 22,598,975 | |||
Total investments, at value (Cost $204,697,083) | 207,681,447 | |||
Foreign currencies, at value (Cost $442,939) | 440,016 | |||
Receivable for: | ||||
Deposits with brokers for open futures contracts | 144,421 | |||
Fund shares sold | 360,650 | |||
Dividends | 538,539 | |||
Investment for trustee deferred compensation and retirement plans | 81,919 | |||
Other assets | 42,973 | |||
Total assets | 209,289,965 | |||
Liabilities: |
| |||
Payable for: | ||||
Fund shares reacquired | 246,583 | |||
Amount due custodian | 6,291 | |||
Collateral upon return of securities loaned | 20,723,839 | |||
Variation margin — futures | 4,028 | |||
Accrued fees to affiliates | 120,914 | |||
Accrued trustees’ and officers’ fees and benefits | 478 | |||
Accrued other operating expenses | 51,052 | |||
Trustee deferred compensation and retirement plans | 92,552 | |||
Total liabilities | 21,245,737 | |||
Net assets applicable to shares outstanding | $ | 188,044,228 | ||
Net assets consist of: |
| |||
Shares of beneficial interest | $ | 259,462,275 | ||
Undistributed net investment income | 1,310,178 | |||
Undistributed net realized gain (loss) | (75,732,353 | ) | ||
Net unrealized appreciation | 3,004,128 | |||
| $ | 188,044,228 | |||
Net Assets: |
| |||
Class A | $ | 140,460,588 | ||
Class B | $ | 3,579,901 | ||
Class C | $ | 18,936,080 | ||
Class R | $ | 1,627,051 | ||
Class Y | $ | 10,067,254 | ||
Class R5 | $ | 13,373,354 | ||
Shares outstanding, $0.01 par value per share, |
| |||
Class A | 10,113,762 | |||
Class B | 272,374 | |||
Class C | 1,442,692 | |||
Class R | 116,978 | |||
Class Y | 723,328 | |||
Class R5 | 949,928 | |||
Class A: | ||||
Net asset value per share | $ | 13.89 | ||
Maximum offering price per share | ||||
(Net asset value of $13.89 ¸ 94.50%) | $ | 14.70 | ||
Class B: | ||||
Net asset value and offering price per share | $ | 13.14 | ||
Class C: | ||||
Net asset value and offering price per share | $ | 13.13 | ||
Class R: | ||||
Net asset value and offering price per share | $ | 13.91 | ||
Class Y: | ||||
Net asset value and offering price per share | $ | 13.92 | ||
Class R5: | ||||
Net asset value and offering price per share | $ | 14.08 | ||
| * | At December 31, 2014, securities with an aggregate value of $19,794,087 were on loan to brokers. |
See accompanying Notes to Financial Statements which are an integral part of the financial statements.
11 Invesco Global Low Volatility Equity Yield Fund
Statement of Operations
For the year ended December 31, 2014
Investment income: |
| |||
Dividends (net of foreign withholding taxes of $902,977) | $ | 9,608,273 | ||
Dividends from affiliated money market funds (includes securities lending income of $14,194) | 17,498 | |||
Total investment income | 9,625,771 | |||
Expenses: | ||||
Advisory fees | 1,540,980 | |||
Administrative services fees | 50,000 | |||
Custodian fees | 46,086 | |||
Distribution fees: | ||||
Class A | 352,294 | |||
Class B | 46,862 | |||
Class C | 186,024 | |||
Class R | 7,692 | |||
Transfer agent fees — A, B, C, R and Y | 409,312 | |||
Transfer agent fees — R5 | 2,137 | |||
Trustees’ and officers’ fees and benefits | 26,732 | |||
Other | 209,915 | |||
Total expenses | 2,878,034 | |||
Less: Fees waived and expense offset arrangement(s) | (13,477 | ) | ||
Net expenses | 2,864,557 | |||
Net investment income | 6,761,214 | |||
Realized and unrealized gain (loss) from: | ||||
Net realized gain (loss) from: | ||||
Investment securities | 7,286,865 | |||
Foreign currencies | (53,756 | ) | ||
Futures contracts | 679,224 | |||
| 7,912,333 | ||||
Change in net unrealized appreciation (depreciation) of: | ||||
Investment securities | (17,898,163 | ) | ||
Foreign currencies | (25,870 | ) | ||
Futures contracts | (117,649 | ) | ||
| (18,041,682 | ) | |||
Net realized and unrealized gain (loss) | (10,129,349 | ) | ||
Net increase (decrease) in net assets resulting from operations | $ | (3,368,135 | ) | |
See accompanying Notes to Financial Statements which are an integral part of the financial statements.
12 Invesco Global Low Volatility Equity Yield Fund
Statement of Changes in Net Assets
For the years ended December 31, 2014 and 2013
| 2014 | 2013 | |||||||
Operations: |
| |||||||
Net investment income | $ | 6,761,214 | $ | 3,076,839 | ||||
Net realized gain | 7,912,333 | 22,838,549 | ||||||
Change in net unrealized appreciation (depreciation) | (18,041,682 | ) | 11,149,683 | |||||
Net increase (decrease) in net assets resulting from operations | (3,368,135 | ) | 37,065,071 | |||||
Distributions to shareholders from net investment income: | ||||||||
Class A | (5,036,421 | ) | (2,105,673 | ) | ||||
Class B | (125,084 | ) | (86,576 | ) | ||||
Class C | (541,427 | ) | (162,951 | ) | ||||
Class R | (51,207 | ) | (22,777 | ) | ||||
Class Y | (385,152 | ) | (29,719 | ) | ||||
Class R5 | (657,283 | ) | (494,220 | ) | ||||
Total distributions from net investment income | (6,796,574 | ) | (2,901,916 | ) | ||||
Share transactions–net: | ||||||||
Class A | 31,050,791 | (2,243,589 | ) | |||||
Class B | (1,777,489 | ) | (2,641,008 | ) | ||||
Class C | 6,090,593 | 2,900,630 | ||||||
Class R | 353,446 | 145,344 | ||||||
Class Y | 8,274,567 | 2,202,871 | ||||||
Class R5 | (12,306,494 | ) | 1,425,061 | |||||
Net increase in net assets resulting from share transactions | 31,685,414 | 1,789,309 | ||||||
Net increase in net assets | 21,520,705 | 35,952,464 | ||||||
Net assets: | ||||||||
Beginning of year | 166,523,523 | 130,571,059 | ||||||
End of year (includes undistributed net investment income of $1,310,178 and $1,380,057, respectively) | $ | 188,044,228 | $ | 166,523,523 | ||||
Notes to Financial Statements
December 31, 2014
NOTE 1—Significant Accounting Policies
Invesco Global Low Volatility Equity Yield Fund (the “Fund”) is a series portfolio of AIM Growth Series (Invesco Growth Series) (the “Trust”). The Trust is organized as a Delaware statutory trust and is registered under the Investment Company Act of 1940, as amended (the “1940 Act”), as an open-end series management investment company consisting of seventeen separate series portfolios, each authorized to issue an unlimited number of shares of beneficial interest. The assets, liabilities and operations of each portfolio are accounted for separately. Information presented in these financial statements pertains only to the Fund. Matters affecting each portfolio or class will be voted on exclusively by the shareholders of such portfolio or class.
The Fund’s investment objective is income and long-term growth of capital.
The Fund currently consists of six different classes of shares: Class A, Class B, Class C, Class R, Class Y and Class R5. Class A shares are sold with a front-end sales charge unless certain waiver criteria are met and under certain circumstances load waived shares may be subject to contingent deferred sales charges (“CDSC”). Class C shares are sold with a CDSC. Class R, Class Y and Class R5 shares are sold at net asset value. Effective November 30, 2010, new or additional investments in Class B shares are no longer permitted. Existing shareholders of Class B shares may continue to reinvest dividends and capital gains distributions in Class B shares until they convert to Class A shares. Also, shareholders in Class B shares will be able to exchange those shares for Class B shares of other Invesco Funds offering such shares until they convert to Class A shares. Generally, Class B shares will automatically convert to Class A shares on or about the month-end, which is at least eight years after the date of purchase. Redemption of Class B shares prior to the conversion date will be subject to a CDSC.
The following is a summary of the significant accounting policies followed by the Fund in the preparation of its financial statements.
| A. | Security Valuations — Securities, including restricted securities, are valued according to the following policy. |
A security listed or traded on an exchange (except convertible securities) is valued at its last sales price or official closing price as of the close of the customary trading session on the exchange where the security is principally traded, or lacking any sales or official closing price on a particular day, the security may be valued at the closing bid price on that day. Securities traded in the over-the-counter market are valued based on prices furnished by independent pricing services or market makers. When such securities are valued by an independent pricing service they may be considered fair valued. Futures contracts are valued at the final settlement price set by an exchange on which they are principally traded.
13 Invesco Global Low Volatility Equity Yield Fund
Listed options are valued at the mean between the last bid and ask prices from the exchange on which they are principally traded. Options not listed on an exchange are valued by an independent source at the mean between the last bid and ask prices. For purposes of determining net asset value per share, futures and option contracts generally are valued 15 minutes after the close of the customary trading session of the New York Stock Exchange (“NYSE”).
Investments in open-end and closed-end registered investment companies that do not trade on an exchange are valued at the end of day net asset value per share. Investments in open-end and closed-end registered investment companies that trade on an exchange are valued at the last sales price or official closing price as of the close of the customary trading session on the exchange where the security is principally traded.
Debt obligations (including convertible securities) and unlisted equities are fair valued using an evaluated quote provided by an independent pricing service. Evaluated quotes provided by the pricing service may be determined without exclusive reliance on quoted prices, and may reflect appropriate factors such as institution-size trading in similar groups of securities, developments related to specific securities, dividend rate (for unlisted equities), yield (for debt obligations), quality, type of issue, coupon rate (for debt obligations), maturity (for debt obligations), individual trading characteristics and other market data. Debt obligations are subject to interest rate and credit risks. In addition, all debt obligations involve some risk of default with respect to interest and/or principal payments.
Foreign securities’ (including foreign exchange contracts) prices are converted into U.S. dollar amounts using the applicable exchange rates as of the close of the NYSE. If market quotations are available and reliable for foreign exchange-traded equity securities, the securities will be valued at the market quotations. Because trading hours for certain foreign securities end before the close of the NYSE, closing market quotations may become unreliable. If between the time trading ends on a particular security and the close of the customary trading session on the NYSE, events occur that the Adviser determines are significant and make the closing price unreliable, the Fund may fair value the security. If the event is likely to have affected the closing price of the security, the security will be valued at fair value in good faith using procedures approved by the Board of Trustees. Adjustments to closing prices to reflect fair value may also be based on a screening process of an independent pricing service to indicate the degree of certainty, based on historical data, that the closing price in the principal market where a foreign security trades is not the current value as of the close of the NYSE. Foreign securities’ prices meeting the approved degree of certainty that the price is not reflective of current value will be priced at the indication of fair value from the independent pricing service. Multiple factors may be considered by the independent pricing service in determining adjustments to reflect fair value and may include information relating to sector indices, American Depositary Receipts and domestic and foreign index futures. Foreign securities may have additional risks including exchange rate changes, potential for sharply devalued currencies and high inflation, political and economic upheaval, the relative lack of issuer information, relatively low market liquidity and the potential lack of strict financial and accounting controls and standards.
Securities for which market prices are not provided by any of the above methods may be valued based upon quotes furnished by independent sources. The last bid price may be used to value equity securities. The mean between the last bid and ask prices is used to value debt obligations, including corporate loans.
Securities for which market quotations are not readily available or became unreliable are valued at fair value as determined in good faith by or under the supervision of the Trust’s officers following procedures approved by the Board of Trustees. Issuer specific events, market trends, bid/ask quotes of brokers and information providers and other market data may be reviewed in the course of making a good faith determination of a security’s fair value.
The Fund may invest in securities that are subject to interest rate risk, meaning the risk that the prices will generally fall as interest rates rise and, conversely, the prices will generally rise as interest rates fall. Specific securities differ in their sensitivity to changes in interest rates depending on their individual characteristics. Changes in interest rates may result in increased market volatility, which may affect the value and/or liquidity of certain of the Fund’s investments.
Valuations change in response to many factors including the historical and prospective earnings of the issuer, the value of the issuer’s assets, general economic conditions, interest rates, investor perceptions and market liquidity. Because of the inherent uncertainties of valuation, the values reflected in the financial statements may materially differ from the value received upon actual sale of those investments.
| B. | Securities Transactions and Investment Income — Securities transactions are accounted for on a trade date basis. Realized gains or losses on sales are computed on the basis of specific identification of the securities sold. Interest income (net of withholding tax, if any) is recorded on the accrual basis from settlement date. Dividend income (net of withholding tax, if any) is recorded on the ex-dividend date. |
The Fund may periodically participate in litigation related to Fund investments. As such, the Fund may receive proceeds from litigation settlements. Any proceeds received are included in the Statement of Operations as realized gain (loss) for investments no longer held and as unrealized gain (loss) for investments still held.
Brokerage commissions and mark ups are considered transaction costs and are recorded as an increase to the cost basis of securities purchased and/or a reduction of proceeds on a sale of securities. Such transaction costs are included in the determination of net realized and unrealized gain (loss) from investment securities reported in the Statement of Operations and the Statement of Changes in Net Assets and the net realized and unrealized gains (losses) on securities per share in the Financial Highlights. Transaction costs are included in the calculation of the Fund’s net asset value and, accordingly, they reduce the Fund’s total returns. These transaction costs are not considered operating expenses and are not reflected in net investment income reported in the Statement of Operations and Statement of Changes in Net Assets, or the net investment income per share and ratios of expenses and net investment income reported in the Financial Highlights, nor are they limited by any expense limitation arrangements between the Fund and the investment adviser.
The Fund allocates income and realized and unrealized capital gains and losses to a class based on the relative net assets of each class.
| C. | Country Determination — For the purposes of making investment selection decisions and presentation in the Schedule of Investments, the investment adviser may determine the country in which an issuer is located and/or credit risk exposure based on various factors. These factors include the laws of the country under which the issuer is organized, where the issuer maintains a principal office, the country in which the issuer derives 50% or more of its total revenues and the country that has the primary market for the issuer’s securities, as well as other criteria. Among the other criteria that may be evaluated for making this determination are the country in which the issuer maintains 50% or more of its assets, the type of security, financial guarantees and enhancements, the nature of the collateral and the sponsor organization. Country of issuer and/or credit risk exposure has been determined to be the United States of America, unless otherwise noted. |
14 Invesco Global Low Volatility Equity Yield Fund
| D. | Distributions — Distributions from net investment income, if any, are declared and paid quarterly and are recorded on the ex-dividend date. Distributions from net realized capital gain, if any, are generally declared and paid annually and recorded on the ex-dividend date. The Fund may elect to treat a portion of the proceeds from redemptions as distributions for federal income tax purposes. |
| E. | Federal Income Taxes — The Fund intends to comply with the requirements of Subchapter M of the Internal Revenue Code of 1986, as amended (the “Internal Revenue Code”), necessary to qualify as a regulated investment company and to distribute substantially all of the Fund’s taxable earnings to shareholders. As such, the Fund will not be subject to federal income taxes on otherwise taxable income (including net realized capital gain) that is distributed to shareholders. Therefore, no provision for federal income taxes is recorded in the financial statements. |
The Fund recognizes the tax benefits of uncertain tax positions only when the position is more likely than not to be sustained. Management has analyzed the Fund’s uncertain tax positions and concluded that no liability for unrecognized tax benefits should be recorded related to uncertain tax positions. Management is not aware of any tax positions for which it is reasonably possible that the total amounts of unrecognized tax benefits will change materially in the next 12 months.
The Fund files tax returns in the U.S. Federal jurisdiction and certain other jurisdictions. Generally, the Fund is subject to examinations by such taxing authorities for up to three years after the filing of the return for the tax period.
| F. | Accounting Estimates — The preparation of financial statements in conformity with accounting principles generally accepted in the United States of America (“GAAP”) requires management to make estimates and assumptions that affect the reported amounts of assets and liabilities at the date of the financial statements and the reported amounts of revenues and expenses during the reporting period including estimates and assumptions related to taxation. Actual results could differ from those estimates by a significant amount. In addition, the Fund monitors for material events or transactions that may occur or become known after the period-end date and before the date the financial statements are released to print. |
| G. | Expenses — Fees provided for under the Rule 12b-1 plan of a particular class of the Fund are charged to the operations of such class. Transfer agency fees and expenses and other shareholder recordkeeping fees and expenses attributable to Class R5 are charged to such class. Transfer agency fees and expenses and other shareholder recordkeeping fees and expenses relating to all other classes are allocated among those classes based on relative net assets. All other expenses are allocated among the classes based on relative net assets. |
| H. | Indemnifications – Under the Trust’s organizational documents, each Trustee, officer, employee or other agent of the Trust is indemnified against certain liabilities that may arise out of the performance of their duties to the Fund. Additionally, in the normal course of business, the Fund enters into contracts, including the Fund’s servicing agreements, that contain a variety of indemnification clauses. The Fund’s maximum exposure under these arrangements is unknown as this would involve future claims that may be made against the Fund that have not yet occurred. The risk of material loss as a result of such indemnification claims is considered remote. |
| I. | Securities Lending — The Fund may lend portfolio securities having a market value up to one-third of the Fund’s total assets. Such loans are secured by collateral equal to no less than the market value of the loaned securities determined daily by the securities lending provider. Such collateral will be cash or debt securities issued or guaranteed by the U.S. Government or any of its sponsored agencies. Cash collateral received in connection with these loans is invested in short-term money market instruments or affiliated money market funds and is shown as such on the Schedule of Investments. It is the Fund’s policy to obtain additional collateral from or return excess collateral to the borrower by the end of the next business day, following the valuation date of the securities loaned. Therefore, the value of the collateral held may be temporarily less than the value of the securities on loan. Lending securities entails a risk of loss to the Fund if, and to the extent that, the market value of the securities loaned were to increase and the borrower did not increase the collateral accordingly, and the borrower failed to return the securities. Upon the failure of the borrower to return the securities, collateral may be liquidated and the securities may be purchased on the open market to replace the loaned securities. The Fund could experience delays and costs in gaining access to the collateral. The Fund bears the risk of any deficiency in the amount of the collateral available for return to the borrower due to any loss on the collateral invested. Dividends received on cash collateral investments for securities lending transactions, which are net of compensation to counterparties, is included in Dividends from affiliated money market funds on the Statement of Operations. The aggregate value of securities out on loan is shown as a footnote on the Statement of Assets and Liabilities, if any. |
| J. | Foreign Currency Translations — Foreign currency is valued at the close of the NYSE based on quotations posted by banks and major currency dealers. Portfolio securities and other assets and liabilities denominated in foreign currencies are translated into U.S. dollar amounts at date of valuation. Purchases and sales of portfolio securities (net of foreign taxes withheld on disposition) and income items denominated in foreign currencies are translated into U.S. dollar amounts on the respective dates of such transactions. The Fund does not separately account for the portion of the results of operations resulting from changes in foreign exchange rates on investments and the fluctuations arising from changes in market prices of securities held. The combined results of changes in foreign exchange rates and the fluctuation of market prices on investments (net of estimated foreign tax withholding) are included with the net realized and unrealized gain or loss from investments in the Statement of Operations. Reported net realized foreign currency gains or losses arise from (1) sales of foreign currencies, (2) currency gains or losses realized between the trade and settlement dates on securities transactions, and (3) the difference between the amounts of dividends, interest, and foreign withholding taxes recorded on the Fund’s books and the U.S. dollar equivalent of the amounts actually received or paid. Net unrealized foreign currency gains and losses arise from changes in the fair values of assets and liabilities, other than investments in securities at fiscal period end, resulting from changes in exchange rates. |
The Fund may invest in foreign securities, which may be subject to foreign taxes on income, gains on investments or currency repatriation, a portion of which may be recoverable. Foreign taxes, if any, are recorded based on the tax regulations and rates that exist in the foreign markets in which the Fund invests and are shown in the Statement of Operations.
| K. | Forward Foreign Currency Contracts — The Fund may engage in foreign currency transactions either on a spot (i.e. for prompt delivery and settlement) basis or through forward foreign currency contracts to manage or minimize currency or exchange rate risk. |
The Fund may also enter into forward foreign currency contracts for the purchase or sale of a security denominated in a foreign currency in order to “lock in” the U.S. dollar price of that security, or the Fund may also enter into forward foreign currency contracts that do not provide for physical settlement of the two currencies, but instead are settled by a single cash payment calculated as the difference between the agreed upon exchange rate and the spot rate at settlement based upon an agreed upon notional amount (non-deliverable forwards). The Fund will set aside liquid assets in an amount equal to daily mark-to-market obligation for forward foreign currency contracts.
15 Invesco Global Low Volatility Equity Yield Fund
A forward foreign currency contract is an obligation between two parties (“Counterparties”) to purchase or sell a specific currency for an agreed-upon price at a future date. The use of forward foreign currency contracts does not eliminate fluctuations in the price of the underlying securities the Fund owns or intends to acquire but establishes a rate of exchange in advance. Fluctuations in the value of these contracts are measured by the difference in the contract date and reporting date exchange rates and are recorded as unrealized appreciation (depreciation) until the contracts are closed. When the contracts are closed, realized gains (losses) are recorded. Realized and unrealized gains (losses) on the contracts are included in the Statement of Operations. The primary risks associated with forward foreign currency contracts include failure of the Counterparty to meet the terms of the contract and the value of the foreign currency changing unfavorably. These risks may be in excess of the amounts reflected in the Statement of Assets and Liabilities.
| L. | Futures Contracts — The Fund may enter into futures contracts to manage exposure to interest rate, equity and market price movements and/or currency risks. A futures contract is an agreement between two parties (“Counterparties”) to purchase or sell a specified underlying security, currency or commodity (or delivery of a cash settlement price, in the case of an index future) for a fixed price at a future date. The Fund currently invests only in exchange-traded futures and they are standardized as to maturity date and underlying financial instrument. Initial margin deposits required upon entering into futures contracts are satisfied by the segregation of specific securities or cash as collateral at the futures commission merchant (broker). During the period the futures contracts are open, changes in the value of the contracts are recognized as unrealized gains or losses by recalculating the value of the contracts on a daily basis. Subsequent or variation margin payments are received or made depending upon whether unrealized gains or losses are incurred. These amounts are reflected as receivables or payables on the Statement of Assets and Liabilities. When the contracts are closed or expire, the Fund recognizes a realized gain or loss equal to the difference between the proceeds from, or cost of, the closing transaction and the Fund’s basis in the contract. The net realized gain (loss) and the change in unrealized gain (loss) on futures contracts held during the period is included on the Statement of Operations. The primary risks associated with futures contracts are market risk and the absence of a liquid secondary market. If the Fund were unable to liquidate a futures contract and/or enter into an offsetting closing transaction, the Fund would continue to be subject to market risk with respect to the value of the contracts and continue to be required to maintain the margin deposits on the futures contracts. Futures contracts have minimal Counterparty risk since the exchange’s clearinghouse, as Counterparty to all exchange-traded futures, guarantees the futures against default. Risks may exceed amounts recognized in the Statement of Assets and Liabilities. |
| M. | Collateral — To the extent the Fund has pledged or segregated a security as collateral and that security is subsequently sold, it is the Fund’s practice to replace such collateral no later than the next business day. This practice does not apply to securities pledged as collateral for securities lending transactions. |
NOTE 2—Advisory Fees and Other Fees Paid to Affiliates
The Trust has entered into a master investment advisory agreement with Invesco Advisers, Inc. (the “Adviser” or “Invesco”). Under the terms of the investment advisory agreement, the Fund pays an advisory fee to the Adviser based on the annual rate of the Fund’s average daily net assets as follows:
| Average Daily Net Assets | Rate | |||
First $250 million | 0.80% | |||
Next $250 million | 0.78% | |||
Next $500 million | 0.76% | |||
Next $1.5 billion | 0.74% | |||
Next $2.5 billion | 0.72% | |||
Next $2.5 billion | 0.70% | |||
Next $2.5 billion | 0.68% | |||
Over $10 billion | 0.66% | |||
For the year ended December 31, 2014, the effective advisory fees incurred by the Fund was 0.80%.
Under the terms of a master sub-advisory agreement between the Adviser and each of Invesco Asset Management Deutschland GmbH, Invesco Asset Management Limited, Invesco Asset Management (Japan) Limited, Invesco Australia Limited, Invesco Hong Kong Limited, Invesco Senior Secured Management, Inc. and Invesco Canada Ltd. (collectively, the “Affiliated Sub-Advisers”) the Adviser, not the Fund, may pay 40% of the fees paid to the Adviser to any such Affiliated Sub-Adviser(s) that provide(s) discretionary investment management services to the Fund based on the percentage of assets allocated to such Sub-Adviser(s).
The Adviser has contractually agreed, through at least June 30, 2015, to waive advisory fees and/or reimburse expenses of all shares to the extent necessary to limit total annual fund operating expenses after fee waiver and/or expense reimbursement (excluding certain items discussed below) of Class A, Class B, Class C, Class R, Class Y and Class R5 shares to 2.25%, 3.00%, 3.00%, 2.50%, 2.00% and 2.00%, respectively, of average daily net assets. In determining the Adviser’s obligation to waive advisory fees and/or reimburse expenses, the following expenses are not taken into account, and could cause the total annual fund operating expenses after fee waiver and/or expense reimbursement to exceed the numbers reflected above: (1) interest; (2) taxes; (3) dividend expense on short sales; (4) extraordinary or non-routine items, including litigation expenses; and (5) expenses that the Fund has incurred but did not actually pay because of an expense offset arrangement. Unless Invesco continues the fee waiver agreement, it will terminate on June 30, 2015. The fee waiver agreement cannot be terminated during its term. The Adviser did not waive fees and/or reimburse expenses during the period under the expense limitation.
Further, the Adviser has contractually agreed, through at least June 30, 2016, to waive the advisory fee payable by the Fund in an amount equal to 100% of the net advisory fees the Adviser receives from the affiliated money market funds on investments by the Fund of uninvested cash (excluding investments of cash collateral from securities lending) in such affiliated money market funds.
For the year ended December 31, 2014, the Adviser waived advisory fees of $12,265.
16 Invesco Global Low Volatility Equity Yield Fund
The Trust has entered into a master administrative services agreement with Invesco pursuant to which the Fund has agreed to pay Invesco for certain administrative costs incurred in providing accounting services to the Fund. For the year ended December 31, 2014, expenses incurred under the agreement are shown in the Statement of Operations as Administrative services fees.
The Trust has entered into a transfer agency and service agreement with Invesco Investment Services, Inc. (“IIS”) pursuant to which the Fund has agreed to pay IIS a fee for providing transfer agency and shareholder services to the Fund and reimburse IIS for certain expenses incurred by IIS in the course of providing such services. IIS may make payments to intermediaries that provide omnibus account services, sub-accounting services and/or networking services. All fees payable by IIS to intermediaries that provide omnibus account services or sub-accounting are charged back to the Fund, subject to certain limitations approved by the Trust’s Board of Trustees. For the year ended December 31, 2014, expenses incurred under the agreement are shown in the Statement of Operations as Transfer agent fees.
The Trust has entered into master distribution agreements with Invesco Distributors, Inc. (“IDI”) to serve as the distributor for the Class A, Class B, Class C, Class R, Class Y and Class R5 shares of the Fund. The Trust has adopted plans pursuant to Rule 12b-1 under the 1940 Act with respect to the Fund’s Class A, Class B, Class C and Class R shares (collectively, the “Plans”). The Fund, pursuant to the Plans, pays IDI compensation at the annual rate of 0.25% of the Fund’s average daily net assets of Class A shares, 1.00% of the average daily net assets of Class B and Class C shares and 0.50% of the average daily net assets of Class R shares. Of the Plan payments, up to 0.25% of the average daily net assets of each class of shares may be paid to furnish continuing personal shareholder services to customers who purchase and own shares of such classes. Any amounts not paid as a service fee under the Plans would constitute an asset-based sales charge. Rules of the Financial Industry Regulatory Authority (“FINRA”) impose a cap on the total sales charges, including asset-based sales charges, that may be paid by any class of shares of the Fund. For the year ended December 31, 2014, expenses incurred under the Plans are shown in the Statement of Operations as Distribution fees.
Front-end sales commissions and CDSC (collectively, the “sales charges”) are not recorded as expenses of the Fund. Front-end sales commissions are deducted from proceeds from the sales of Fund shares prior to investment in Class A shares of the Fund. CDSC are deducted from redemption proceeds prior to remittance to the shareholder. During the year ended December 31, 2014, IDI advised the Fund that IDI retained $98,797 in front-end sales commissions from the sale of Class A shares and $129, $2,038 and $1,028 from Class A, Class B and Class C shares, respectively, for CDSC imposed on redemptions by shareholders.
Certain officers and trustees of the Trust are officers and directors of the Adviser, IIS and/or IDI.
NOTE 3—Additional Valuation Information
GAAP defines fair value as the price that would be received to sell an asset or paid to transfer a liability in an orderly transaction between market participants at the measurement date, under current market conditions. GAAP establishes a hierarchy that prioritizes the inputs to valuation methods, giving the highest priority to readily available unadjusted quoted prices in an active market for identical assets (Level 1) and the lowest priority to significant unobservable inputs (Level 3), generally when market prices are not readily available or are unreliable. Based on the valuation inputs, the securities or other investments are tiered into one of three levels. Changes in valuation methods may result in transfers in or out of an investment’s assigned level:
| Level 1 — | Prices are determined using quoted prices in an active market for identical assets. |
| Level 2 — | Prices are determined using other significant observable inputs. Observable inputs are inputs that other market participants may use in pricing a security. These may include quoted prices for similar securities, interest rates, prepayment speeds, credit risk, yield curves, loss severities, default rates, discount rates, volatilities and others. |
| Level 3 — | Prices are determined using significant unobservable inputs. In situations where quoted prices or observable inputs are unavailable (for example, when there is little or no market activity for an investment at the end of the period), unobservable inputs may be used. Unobservable inputs reflect the Fund’s own assumptions about the factors market participants would use in determining fair value of the securities or instruments and would be based on the best available information. |
The following is a summary of the tiered valuation input levels, as of December 31, 2014. The level assigned to the securities valuations may not be an indication of the risk or liquidity associated with investing in those securities. Because of the inherent uncertainties of valuation, the values reflected in the financial statements may materially differ from the value received upon actual sale of those investments.
During the year ended December 31, 2014, there were transfers from Level 1 to Level 2 of $23,089,935 and from Level 2 to Level 1 of $4,212,114, due to foreign fair value adjustments.
| Level 1 | Level 2 | Level 3 | Total | |||||||||||||
Australia | $ | — | $ | 32,052,341 | $ | — | $ | 32,052,341 | ||||||||
Austria | — | 1,007,780 | — | 1,007,780 | ||||||||||||
Belgium | — | 6,378,067 | — | 6,378,067 | ||||||||||||
Canada | 23,106,366 | — | — | 23,106,366 | ||||||||||||
Denmark | — | 2,008,169 | — | 2,008,169 | ||||||||||||
France | — | 3,525,021 | — | 3,525,021 | ||||||||||||
Germany | 3,503,998 | — | — | 3,503,998 | ||||||||||||
Hong Kong | — | 3,473,006 | — | 3,473,006 | ||||||||||||
Israel | — | 3,225,683 | — | 3,225,683 | ||||||||||||
Japan | — | 7,183,809 | — | 7,183,809 | ||||||||||||
New Zealand | 2,305,142 | 4,965,876 | — | 7,271,018 | ||||||||||||
Norway | — | 1,145,024 | — | 1,145,024 | ||||||||||||
Singapore | 701,034 | 1,634,750 | — | 2,335,784 | ||||||||||||
Spain | — | 5,416,295 | — | 5,416,295 | ||||||||||||
17 Invesco Global Low Volatility Equity Yield Fund
| Level 1 | Level 2 | Level 3 | Total | |||||||||||||
Sweden | $ | 708,116 | $ | 13,672,423 | $ | — | $ | 14,380,539 | ||||||||
Switzerland | 1,056,425 | — | — | 1,056,425 | ||||||||||||
United Kingdom | — | 19,338,254 | — | 19,338,254 | ||||||||||||
United States | 71,273,868 | — | — | 71,273,868 | ||||||||||||
| 102,654,949 | 105,026,498 | — | 207,681,447 | |||||||||||||
Futures Contracts* | 28,161 | — | — | 28,161 | ||||||||||||
Total Investments | $ | 102,683,110 | $ | 105,026,498 | $ | — | $ | 207,709,608 | ||||||||
| * | Unrealized appreciation. |
NOTE 4—Derivative Investments
Value of Derivative Investments at Period-End
The table below summarizes the value of the Fund’s derivative investments, detailed by primary risk exposure, held as of December 31, 2014:
| Value | ||||||||
| Risk Exposure/Derivative Type | Assets | Liabilities | ||||||
Market risk: | ||||||||
Futures contracts(a) | $ | 28,161 | $ | — | ||||
| (a) | Includes cumulative appreciation of futures contracts. Only current day’s variation margin receivable is reported within the Statement of Assets and Liabilities. |
Effect of Derivative Investments for the year ended December 31, 2014
The table below summarizes the gains (losses) on derivative investments, detailed by primary risk exposure, recognized in earnings during the period:
| Location of Gain (Loss) on Statement of Operations | ||||
| Futures Contracts | ||||
Realized Gain: | ||||
Market risk | $ | 679,224 | ||
Change in Unrealized Appreciation (Depreciation): | ||||
Market risk | (117,649 | ) | ||
Total | $ | 561,575 | ||
| Open Futures Contracts* | ||||||||||||||||||||
| Long Contracts | Type of Contract | Number of Contracts | Expiration Month | Notional Value | Unrealized Appreciation | |||||||||||||||
CME E-Mini S&P 500 Index | Long | 5 | March-2015 | $ | 513,100 | $ | 17,225 | |||||||||||||
Dow Jones EURO STOXX 50 Index | Long | 4 | March-2015 | 151,650 | 4,170 | |||||||||||||||
FTSE 100 Index | Long | 1 | March-2015 | 101,666 | 6,587 | |||||||||||||||
SGX NIKKEI 225 Index | Long | 2 | March-2015 | 145,124 | 179 | |||||||||||||||
Total — Market Risk | $ | 28,161 | ||||||||||||||||||
| * | Futures contracts collateralized by $144,421 cash held with Merrill Lynch & Co., Inc. |
The table below summarizes the average notional value of futures contracts outstanding during the period.
| Futures Contracts | ||||
Average notional value | $ | 5,455,760 | ||
NOTE 5—Expense Offset Arrangement(s)
The expense offset arrangement is comprised of transfer agency credits which result from balances in demand deposit accounts used by the transfer agent for clearing shareholder transactions. For the year ended December 31, 2014, the Fund received credits from this arrangement, which resulted in the reduction of the Fund’s total expenses of $1,212.
18 Invesco Global Low Volatility Equity Yield Fund
NOTE 6—Trustees’ and Officers’ Fees and Benefits
Trustees’ and Officers’ Fees and Benefits include amounts accrued by the Fund to pay remuneration to certain Trustees and Officers of the Fund. Trustees have the option to defer compensation payable by the Fund, and Trustees’ and Officers’ Fees and Benefits also include amounts accrued by the Fund to fund such deferred compensation amounts. Those Trustees who defer compensation have the option to select various Invesco Funds in which their deferral accounts shall be deemed to be invested. Finally, certain current Trustees were eligible to participate in a retirement plan that provided for benefits to be paid upon retirement to Trustees over a period of time based on the number of years of service. The Fund may have certain former Trustees who also participate in a retirement plan and receive benefits under such plan. Trustees’ and Officers’ Fees and Benefits include amounts accrued by the Fund to fund such retirement benefits. Obligations under the deferred compensation and retirement plans represent unsecured claims against the general assets of the Fund.
NOTE 7—Cash Balances
The Fund is permitted to temporarily carry a negative or overdrawn balance in its account with State Street Bank and Trust Company, the custodian bank. Such balances, if any at period end, are shown in the Statement of Assets and Liabilities under the payable caption Amount due custodian. To compensate the custodian bank for such overdrafts, the overdrawn Fund may either (1) leave funds as a compensating balance in the account so the custodian bank can be compensated by earning the additional interest; or (2) compensate by paying the custodian bank at a rate agreed upon by the custodian bank and Invesco, not to exceed the contractually agreed upon rate.
NOTE 8—Distributions to Shareholders and Tax Components of Net Assets
Tax Character of Distributions to Shareholders Paid During the Fiscal Years Ended December 31, 2014 and 2013:
| 2014 | 2013 | |||||||
Ordinary income | $ | 6,796,574 | $ | 2,901,916 | ||||
Tax Components of Net Assets at Period-End:
| 2014 | ||||
Undistributed ordinary income | $ | 1,397,229 | ||
Net unrealized appreciation — investments | 2,840,599 | |||
Net unrealized appreciation (depreciation) — other investments | (8,318 | ) | ||
Temporary book/tax differences | (87,050 | ) | ||
Post-October deferrals | (1,040,516 | ) | ||
Capital loss carryforward | (74,519,991 | ) | ||
Shares of beneficial interest | 259,462,275 | |||
Total net assets | $ | 188,044,228 | ||
The difference between book-basis and tax-basis unrealized appreciation (depreciation) is due to differences in the timing of recognition of gains and losses on investments for tax and book purposes. The Fund’s net unrealized appreciation difference is attributable primarily to wash sales.
The temporary book/tax differences are a result of timing differences between book and tax recognition of income and/or expenses. The Fund’s temporary book/tax differences are the result of the trustee deferral of compensation and retirement plan benefits.
Capital loss carryforward is calculated and reported as of a specific date. Results of transactions and other activity after that date may affect the amount of capital loss carryforward actually available for the Fund to utilize. Capital losses generated in years beginning after December 22, 2010 can be carried forward for an unlimited period, whereas previous losses expire in eight tax years. Capital losses with an expiration period may not be used to offset capital gains until all net capital losses without an expiration date have been utilized. Capital loss carryforwards with no expiration date will retain their character as either short-term or long-term capital losses instead of as short-term capital losses as under prior law. The ability to utilize capital loss carryforwards in the future may be limited under the Internal Revenue Code and related regulations based on the results of future transactions.
The Fund utilized $9,029,119 of capital loss carryforward in the current period to offset net realized capital gain for federal income tax purposes. The Fund has a capital loss carryforward as of December 31, 2014, which expires as follows:
| Capital Loss Carryforward* | ||||||||||||
| Expiration | Short-Term | Long-Term | Total | |||||||||
December 31, 2016 | $ | 9,183,598 | $ | — | $ | 9,183,598 | ||||||
December 31, 2017 | 65,336,393 | — | 65,336,393 | |||||||||
| $ | 74,519,991 | $ | — | $ | 74,519,991 | |||||||
| * | Capital loss carryforward as of the date listed above is reduced for limitations, if any, to the extent required by the Internal Revenue Code and may be further limited depending upon a variety of factors, including the realization of net unrealized gains or losses as of the date of any reorganization. |
19 Invesco Global Low Volatility Equity Yield Fund
NOTE 9—Investment Securities
The aggregate amount of investment securities (other than short-term securities, U.S. Treasury obligations and money market funds, if any) purchased and sold by the Fund during the year ended December 31, 2014 was $152,368,814 and $116,793,125, respectively. Cost of investments on a tax basis includes the adjustments for financial reporting purposes as of the most recently completed federal income tax reporting period-end.
| Unrealized Appreciation (Depreciation) of Investment Securities on a Tax Basis | ||||
Aggregate unrealized appreciation of investment securities | $ | 20,039,916 | ||
Aggregate unrealized (depreciation) of investment securities | (17,199,317 | ) | ||
Net unrealized appreciation of investment securities | $ | 2,840,599 | ||
Cost of investments for tax purposes is $204,840,848.
NOTE 10—Reclassification of Permanent Differences
Primarily as a result of differing book/tax treatment of foreign currency transactions, on December 31, 2014, undistributed net investment income was decreased by $34,519 and undistributed net realized gain (loss) was increased by $34,519. This reclassification had no effect on the net assets of the Fund.
NOTE 11—Share Information
| Summary of Share Activity | ||||||||||||||||
| Years ended December 31, | ||||||||||||||||
| 2014(a) | 2013 | |||||||||||||||
| Shares | Amount | Shares | Amount | |||||||||||||
Sold: | ||||||||||||||||
Class A | 3,645,949 | $ | 55,524,723 | 892,170 | $ | 12,035,616 | ||||||||||
Class B | 19,430 | 279,092 | 24,692 | 304,057 | ||||||||||||
Class C | 768,700 | 11,069,282 | 351,333 | 4,604,503 | ||||||||||||
Class R | 28,869 | 436,093 | 26,323 | 339,649 | ||||||||||||
Class Y | 1,314,528 | 19,997,440 | 212,216 | 2,976,469 | ||||||||||||
Class R5 | 161,546 | 2,399,041 | 126,716 | 1,700,052 | ||||||||||||
Issued as reinvestment of dividends: | ||||||||||||||||
Class A | 316,244 | 4,668,613 | 143,650 | 1,985,952 | ||||||||||||
Class B | 8,598 | 120,492 | 6,337 | 82,922 | ||||||||||||
Class C | 35,534 | 495,575 | 11,871 | 155,209 | ||||||||||||
Class R | 3,472 | 51,207 | 1,645 | 22,777 | ||||||||||||
Class Y | 22,430 | 332,152 | 1,861 | 25,810 | ||||||||||||
Class R5 | 43,910 | 656,624 | 18,617 | 260,831 | ||||||||||||
Automatic conversion of Class B shares to Class A shares: | ||||||||||||||||
Class A | 97,859 | 1,464,301 | 150,788 | 1,971,696 | ||||||||||||
Class B | (103,467 | ) | (1,464,301 | ) | (159,168 | ) | (1,971,696 | ) | ||||||||
Reacquired: | ||||||||||||||||
Class A | (2,067,448 | ) | (30,606,846 | ) | (1,395,884 | ) | (18,236,853 | ) | ||||||||
Class B | (50,000 | ) | (712,772 | ) | (86,959 | ) | (1,056,291 | ) | ||||||||
Class C | (394,015 | ) | (5,474,264 | ) | (151,961 | ) | (1,859,082 | ) | ||||||||
Class R | (8,823 | ) | (133,854 | ) | (16,103 | ) | (217,082 | ) | ||||||||
Class Y | (832,813 | ) | (12,055,025 | ) | (61,331 | ) | (799,408 | ) | ||||||||
Class R5 | (979,653 | ) | (15,362,159 | ) | (40,140 | ) | (535,822 | ) | ||||||||
Net increase in share activity | 2,030,850 | $ | 31,685,414 | 56,673 | $ | 1,789,309 | ||||||||||
| (a) | There are entities that are record owners of more than 5% of the outstanding shares of the Fund and in the aggregate own 30% of the outstanding shares of the Fund. IDI has an agreement with these entities to sell Fund shares. The Fund, Invesco and/or Invesco affiliates may make payments to these entities, which are considered to be related to the Fund, for providing services to the Fund, Invesco and/or Invesco affiliates including but not limited to services such as securities brokerage, distribution, third party record keeping and account servicing. The Fund has no knowledge as to whether all or any portion of the shares owned of record by these entities are also owned beneficially. |
20 Invesco Global Low Volatility Equity Yield Fund
NOTE 12—Financial Highlights
The following schedule presents financial highlights for a share of the Fund outstanding throughout the periods indicated.
| Net asset value, beginning of period | Net investment income(a) | Net gains on securities | Total from investment operations | Dividends from net investment income | Net asset value, end of period(b) | Total return(c) | Net assets, end of period (000’s omitted) | Ratio of expenses to average net assets with fee waivers and/or expenses absorbed | Ratio of expenses to average net assets without fee waivers and/or expenses absorbed | Ratio of net investment income to average net assets | Portfolio turnover(d) | |||||||||||||||||||||||||||||||||||||
Class A | ||||||||||||||||||||||||||||||||||||||||||||||||
Year ended 12/31/14 | $ | 14.44 | $ | 0.53 | $ | (0.55 | ) | $ | (0.02 | ) | $ | (0.53 | ) | $ | 13.89 | (0.33 | )% | $ | 140,461 | 1.45 | %(e) | 1.46 | %(e) | 3.55 | %(e) | 64 | % | |||||||||||||||||||||
Year ended 12/31/13 | 11.38 | 0.27 | 3.05 | 3.32 | (0.26 | ) | 14.44 | 29.32 | 117,234 | 1.54 | 1.54 | 2.10 | 103 | |||||||||||||||||||||||||||||||||||
Year ended 12/31/12 | 10.28 | 0.13 | 1.24 | 1.37 | (0.27 | ) | 11.38 | 13.32 | 94,785 | 1.63 | 1.63 | 1.21 | 72 | |||||||||||||||||||||||||||||||||||
Year ended 12/31/11 | 10.74 | 0.21 | (0.53 | ) | (0.32 | ) | (0.14 | ) | 10.28 | (2.98 | ) | 98,542 | 1.56 | 1.56 | 1.91 | 86 | ||||||||||||||||||||||||||||||||
Year ended 12/31/10 | 9.63 | 0.11 | 1.14 | 1.25 | (0.14 | ) | 10.74 | 13.00 | 124,102 | 1.61 | 1.61 | 1.09 | 74 | |||||||||||||||||||||||||||||||||||
Class B | ||||||||||||||||||||||||||||||||||||||||||||||||
Year ended 12/31/14 | 13.66 | 0.39 | (0.52 | ) | (0.13 | ) | (0.39 | ) | 13.14 | (1.08 | ) | 3,580 | 2.20 | (e) | 2.21 | (e) | 2.80 | (e) | 64 | |||||||||||||||||||||||||||||
Year ended 12/31/13 | 10.81 | 0.16 | 2.89 | 3.05 | (0.20 | ) | 13.66 | 28.34 | 5,434 | 2.29 | 2.29 | 1.35 | 103 | |||||||||||||||||||||||||||||||||||
Year ended 12/31/12 | 9.74 | 0.05 | 1.17 | 1.22 | (0.15 | ) | 10.81 | 12.53 | 6,626 | 2.38 | 2.38 | 0.46 | 72 | |||||||||||||||||||||||||||||||||||
Year ended 12/31/11 | 10.15 | 0.12 | (0.50 | ) | (0.38 | ) | (0.03 | ) | 9.74 | (3.74 | ) | 9,313 | 2.31 | 2.31 | 1.16 | 86 | ||||||||||||||||||||||||||||||||
Year ended 12/31/10 | 9.09 | 0.03 | 1.08 | 1.11 | (0.05 | ) | 10.15 | 12.18 | 14,370 | 2.36 | 2.36 | 0.34 | 74 | |||||||||||||||||||||||||||||||||||
Class C | ||||||||||||||||||||||||||||||||||||||||||||||||
Year ended 12/31/14 | 13.66 | 0.40 | (0.52 | ) | (0.12 | ) | (0.41 | ) | 13.13 | (1.06 | ) | 18,936 | 2.20 | (e) | 2.21 | (e) | 2.80 | (e) | 64 | |||||||||||||||||||||||||||||
Year ended 12/31/13 | 10.79 | 0.17 | 2.89 | 3.06 | (0.19 | ) | 13.66 | 28.42 | 14,099 | 2.29 | 2.29 | 1.35 | 103 | |||||||||||||||||||||||||||||||||||
Year ended 12/31/12 | 9.73 | 0.05 | 1.16 | 1.21 | (0.15 | ) | 10.79 | 12.44 | 8,864 | 2.38 | 2.38 | 0.46 | 72 | |||||||||||||||||||||||||||||||||||
Year ended 12/31/11 | 10.13 | 0.12 | (0.49 | ) | (0.37 | ) | (0.03 | ) | 9.73 | (3.65 | ) | 9,298 | 2.31 | 2.31 | 1.16 | 86 | ||||||||||||||||||||||||||||||||
Year ended 12/31/10 | 9.08 | 0.03 | 1.07 | 1.10 | (0.05 | ) | 10.13 | 12.09 | 11,535 | 2.36 | 2.36 | 0.34 | 74 | |||||||||||||||||||||||||||||||||||
Class R | ||||||||||||||||||||||||||||||||||||||||||||||||
Year ended 12/31/14 | 14.46 | 0.49 | (0.55 | ) | (0.06 | ) | (0.49 | ) | 13.91 | (0.58 | ) | 1,627 | 1.70 | (e) | 1.71 | (e) | 3.30 | (e) | 64 | |||||||||||||||||||||||||||||
Year ended 12/31/13 | 11.41 | 0.25 | 3.05 | 3.30 | (0.25 | ) | 14.46 | 29.00 | 1,351 | 1.79 | 1.79 | 1.85 | 103 | |||||||||||||||||||||||||||||||||||
Year ended 12/31/12 | 10.30 | 0.11 | 1.23 | 1.34 | (0.23 | ) | 11.41 | 13.01 | 931 | 1.88 | 1.88 | 0.96 | 72 | |||||||||||||||||||||||||||||||||||
Year ended 12/31/11 | 10.74 | 0.18 | (0.52 | ) | (0.34 | ) | (0.10 | ) | 10.30 | (3.13 | ) | 888 | 1.81 | 1.81 | 1.66 | 86 | ||||||||||||||||||||||||||||||||
Year ended 12/31/10 | 9.63 | 0.08 | 1.14 | 1.22 | (0.11 | ) | 10.74 | 12.68 | 1,146 | 1.86 | 1.86 | 0.84 | 74 | |||||||||||||||||||||||||||||||||||
Class Y | ||||||||||||||||||||||||||||||||||||||||||||||||
Year ended 12/31/14 | 14.49 | 0.57 | (0.55 | ) | 0.02 | (0.59 | ) | 13.92 | (0.04 | ) | 10,067 | 1.20 | (e) | 1.21 | (e) | 3.80 | (e) | 64 | ||||||||||||||||||||||||||||||
Year ended 12/31/13 | 11.38 | 0.32 | 3.04 | 3.36 | (0.25 | ) | 14.49 | 29.63 | 3,176 | 1.29 | 1.29 | 2.35 | 103 | |||||||||||||||||||||||||||||||||||
Year ended 12/31/12 | 10.29 | 0.16 | 1.23 | 1.39 | (0.30 | ) | 11.38 | 13.55 | 756 | 1.38 | 1.38 | 1.46 | 72 | |||||||||||||||||||||||||||||||||||
Year ended 12/31/11 | 10.76 | 0.24 | (0.54 | ) | (0.30 | ) | (0.17 | ) | 10.29 | (2.76 | ) | 599 | 1.31 | 1.31 | 2.16 | 86 | ||||||||||||||||||||||||||||||||
Year ended 12/31/10 | 9.65 | 0.13 | 1.15 | 1.28 | (0.17 | ) | 10.76 | 13.27 | 720 | 1.36 | 1.36 | 1.34 | 74 | |||||||||||||||||||||||||||||||||||
Class R5 | ||||||||||||||||||||||||||||||||||||||||||||||||
Year ended 12/31/14 | 14.63 | 0.61 | (0.55 | ) | 0.06 | (0.61 | ) | 14.08 | 0.21 | 13,373 | 0.97 | (e) | 0.98 | (e) | 4.03 | (e) | 64 | |||||||||||||||||||||||||||||||
Year ended 12/31/13 | 11.49 | 0.35 | 3.08 | 3.43 | (0.29 | ) | 14.63 | 29.99 | 25,230 | 1.02 | 1.02 | 2.62 | 103 | |||||||||||||||||||||||||||||||||||
Year ended 12/31/12 | 10.39 | 0.20 | 1.25 | 1.45 | (0.35 | ) | 11.49 | 13.96 | 18,609 | 1.06 | 1.06 | 1.78 | 72 | |||||||||||||||||||||||||||||||||||
Year ended 12/31/11 | 10.88 | 0.28 | (0.54 | ) | (0.26 | ) | (0.23 | ) | 10.39 | (2.44 | ) | 16,133 | 0.98 | 0.98 | 2.49 | 86 | ||||||||||||||||||||||||||||||||
Year ended 12/31/10 | 9.77 | 0.17 | 1.17 | 1.34 | (0.23 | ) | 10.88 | 13.76 | 18,770 | 0.97 | 0.97 | 1.73 | 74 | |||||||||||||||||||||||||||||||||||
| (a) | Calculated using average shares outstanding. |
| (b) | Includes redemption fees added to shares of beneficial interest which were less than $0.005 per share for fiscal years prior to December 31, 2012. |
| (c) | Includes adjustments in accordance with accounting principles generally accepted in the United States of America and as such, the net asset value for financial reporting purposes and the returns based upon those net asset values may differ from the net asset value and returns for shareholder transactions. Does not include sales charges and is not annualized for periods less than one year, if applicable. |
| (d) | Portfolio turnover is calculated at the fund level and is not annualized for periods less than one year, if applicable. |
| (e) | Ratios are based on average daily net assets (000’s omitted) of $140,918, $4,686, $18,602, $1,538, $9,221 and $17,657 for Class A, Class B, Class C, Class R, Class Y and Class R5 shares, respectively. |
21 Invesco Global Low Volatility Equity Yield Fund
Report of Independent Registered Public Accounting Firm
To the Board of Trustees of AIM Growth Series (Invesco Funds Group)
and Shareholders of Invesco Global Low Volatility Equity Yield Fund:
In our opinion, the accompanying statement of assets and liabilities, including the schedule of investments, and the related statements of operations and of changes in net assets and the financial highlights present fairly, in all material respects, the financial position of Invesco Global Low Volatility Equity Yield Fund (one of the funds constituting AIM Growth Series (Invesco Growth Series), hereafter referred to as the “Fund”) at December 31, 2014, the results of its operations for the year then ended, the changes in its net assets for each of the two years in the period then ended and the financial highlights for each of the five years in the period then ended, in conformity with accounting principles generally accepted in the United States of America. These financial statements and financial highlights (hereafter referred to as “financial statements”) are the responsibility of the Fund’s management. Our responsibility is to express an opinion on these financial statements based on our audits. We conducted our audits of these financial statements in accordance with the standards of the Public Company Accounting Oversight Board (United States). Those standards require that we plan and perform the audit to obtain reasonable assurance about whether the financial statements are free of material misstatement. An audit includes examining, on a test basis, evidence supporting the amounts and disclosures in the financial statements, assessing the accounting principles used and significant estimates made by management, and evaluating the overall financial statement presentation. We believe that our audits, which included confirmation of securities at December 31, 2014 by correspondence with the custodian and brokers, provide a reasonable basis for our opinion.
PRICEWATERHOUSECOOPERS LLP
Houston, Texas
February 23, 2015
22 Invesco Global Low Volatility Equity Yield Fund
Calculating your ongoing Fund expenses
Example
As a shareholder of the Fund, you incur two types of costs: (1) transaction costs, which may include sales charges (loads) on purchase payments or contingent deferred sales charges on redemptions, if any; and (2) ongoing costs, including management fees, distribution and/or service (12b-1) fees, and other Fund expenses. This example is intended to help you understand your ongoing costs (in dollars) of investing in the Fund and to compare these costs with ongoing costs of investing in other mutual funds. The example is based on an investment of $1,000 invested at the beginning of the period and held for the entire period July 1, 2014 through December 31, 2014.
Actual expenses
The table below provides information about actual account values and actual expenses. You may use the information in this table, together with the amount you invested, to estimate the expenses that you paid over the period. Simply divide your account value by $1,000 (for example, an $8,600 account value divided by $1,000 = 8.6), then multiply the result by the number in the table under the heading entitled “Actual Expenses Paid During Period” to estimate the expenses you paid on your account during this period.
Hypothetical example for comparison purposes
The table below also provides information about hypothetical account values and hypothetical expenses based on the Fund’s actual expense ratio and an assumed rate of return of 5% per year before expenses, which is not the Fund’s actual return.
The hypothetical account values and expenses may not be used to estimate the actual ending account balance or expenses you paid for the period. You may use this information to compare the ongoing costs of investing in the Fund and other funds. To do so, compare this 5% hypothetical example with the 5% hypothetical examples that appear in the shareholder reports of the other funds.
Please note that the expenses shown in the table are meant to highlight your ongoing costs only and do not reflect any transaction costs, such as sales charges (loads) on purchase payments or contingent deferred sales charges on redemptions, if any. Therefore, the hypothetical information is useful in comparing ongoing costs only, and will not help you determine the relative total costs of owning different funds. In addition, if these transaction costs were included, your costs would have been higher.
| Class | Beginning Account Value (07/01/14) | ACTUAL | HYPOTHETICAL (5% annual return before expenses) | Annualized Expense Ratio | ||||||||||||||||||||
| Ending Account Value (12/31/14)1 | Expenses Paid During Period2 | Ending Account Value (12/31/14) | Expenses Paid During Period2 | |||||||||||||||||||||
| A | $ | 1,000.00 | $ | 890.80 | $ | 6.82 | $ | 1,018.00 | $ | 7.27 | 1.43 | % | ||||||||||||
| B | 1,000.00 | 887.00 | 10.37 | 1,014.22 | 11.07 | 2.18 | ||||||||||||||||||
| C | 1,000.00 | 887.50 | 10.37 | 1,014.22 | 11.07 | 2.18 | ||||||||||||||||||
| R | 1,000.00 | 889.30 | 8.00 | 1,016.74 | 8.54 | 1.68 | ||||||||||||||||||
| Y | 1,000.00 | 891.70 | 5.63 | 1,019.26 | 6.01 | 1.18 | ||||||||||||||||||
| R5 | 1,000.00 | 892.70 | 4.48 | 1,020.47 | 4.79 | 0.94 | ||||||||||||||||||
| 1 | The actual ending account value is based on the actual total return of the Fund for the period July 1, 2014 through December 31, 2014, after actual expenses and will differ from the hypothetical ending account value which is based on the Fund’s expense ratio and a hypothetical annual return of 5% before expenses. |
| 2 | Expenses are equal to the Fund’s annualized expense ratio as indicated above multiplied by the average account value over the period, multiplied by 184/365 to reflect the most recent fiscal half year. |
23 Invesco Global Low Volatility Equity Yield Fund
Tax Information
Form 1099-DIV, Form 1042-S and other year–end tax information provide shareholders with actual calendar year amounts that should be included in their tax returns. Shareholders should consult their tax advisors.
The following distribution information is being provided as required by the Internal Revenue Code or to meet a specific state’s requirement.
The Fund designates the following amounts or, if subsequently determined to be different, the maximum amount allowable for its fiscal year ended December 31, 2014:
Federal and State Income Tax | ||||
Qualified Dividend Income* | 100 | % | ||
Corporate Dividends Received Deduction* | 38.33 | % | ||
U.S. Treasury Obligations* | 0.00 | % | ||
| * | The above percentages are based on ordinary income dividends paid to shareholders during the Fund’s fiscal year. |
24 Invesco Global Low Volatility Equity Yield Fund
Trustees and Officers
The address of each trustee and officer is AIM Growth Series (Invesco Growth Series) (the “Trust”), 11 Greenway Plaza, Suite 1000, Houston, Texas 77046-1173. The trustees serve for the life of the Trust, subject to their earlier death, incapacitation, resignation, retirement or removal as more specifically provided in the Trust’s organizational documents. Each officer serves for a one year term or until their successors are elected and qualified. Column two below includes length of time served with predecessor entities, if any.
Name, Year of Birth and Position(s) Held with the Trust | Trustee and/ or Officer Since | Principal Occupation(s) During Past 5 Years | Number of Funds in Fund Complex Overseen by Trustee | Other Directorship(s) Held by Trustee During | ||||
| Interested Persons | ||||||||
| Martin L. Flanagan1 — 1960 Trustee | 2007 | Executive Director, Chief Executive Officer and President, Invesco Ltd. (ultimate parent of Invesco and a global investment management firm); Advisor to the Board, Invesco Advisers, Inc. (formerly known as Invesco Institutional (N.A.), Inc.); Trustee, The Invesco Funds; Vice Chair, Investment Company Institute; and Member of Executive Board, SMU Cox School of Business
Formerly: Chairman and Chief Executive Officer, Invesco Advisers, Inc. (registered investment adviser); Director, Chairman, Chief Executive Officer and President, IVZ Inc. (holding company), INVESCO Group Services, Inc. (service provider) and Invesco North American Holdings, Inc. (holding company); Director, Chief Executive Officer and President, Invesco Holding Company Limited (parent of Invesco and a global investment management firm); Director, Invesco Ltd.; Chairman, Investment Company Institute and President, Co-Chief Executive Officer, Co-President, Chief Operating Officer and Chief Financial Officer, Franklin Resources, Inc. (global investment management organization). | 144 | None | ||||
Philip A. Taylor2 — 1954 Trustee, President and Principal Executive Officer | 2006 | Head of North American Retail and Senior Managing Director, Invesco Ltd.; Director, Co-Chairman, Co-President and Co-Chief Executive Officer, Invesco Advisers, Inc. (formerly known as Invesco Institutional (N.A.), Inc.) (registered investment adviser); Director, Chairman, Chief Executive Officer and President, Invesco Management Group, Inc. (formerly known as Invesco Aim Management Group, Inc.) (financial services holding company); Director and President, INVESCO Funds Group, Inc. (registered investment adviser and registered transfer agent); Director and Chairman, Invesco Investment Services, Inc. (formerly known as Invesco Aim Investment Services, Inc.) (registered transfer agent) and IVZ Distributors, Inc. (formerly known as INVESCO Distributors, Inc.) (registered broker dealer); Director, President and Chairman, Invesco Inc. (holding company) and Invesco Canada Holdings Inc. (holding company); Chief Executive Officer, Invesco Corporate Class Inc. (corporate mutual fund company) and Invesco Canada Fund Inc. (corporate mutual fund company); Director, Chairman and Chief Executive Officer, Invesco Canada Ltd. (formerly known as Invesco Trimark Ltd./Invesco Trimark Ltèe) (registered investment adviser and registered transfer agent); Trustee, President and Principal Executive Officer, The Invesco Funds (other than AIM Treasurer’s Series Trust (Invesco Treasurer’s Series Trust) and Short-Term Investments Trust); Trustee and Executive Vice President, The Invesco Funds (AIM Treasurer’s Series Trust (Invesco Treasurer’s Series Trust) and Short-Term Investments Trust only); Director, Invesco Investment Advisers LLC (formerly known as Van Kampen Asset Management); Director, Chief Executive Officer and President, Van Kampen Exchange Corp.
Formerly: Director and Chairman, Van Kampen Investor Services Inc.; Director, Chief Executive Officer and President, 1371 Preferred Inc. (holding company) and Van Kampen Investments Inc.; Director and President, AIM GP Canada Inc. (general partner for limited partnerships) and Van Kampen Advisors, Inc.; Director and Chief Executive Officer, Invesco Trimark Dealer Inc. (registered broker dealer); Director, Invesco Distributors, Inc. (formerly known as Invesco Aim Distributors, Inc.) (registered broker dealer); Manager, Invesco PowerShares Capital Management LLC; Director, Chief Executive Officer and President, Invesco Advisers, Inc.; Director, Chairman, Chief Executive Officer and President, Invesco Aim Capital Management, Inc.; President, Invesco Trimark Dealer Inc. and Invesco Trimark Ltd./Invesco Trimark Ltèe; Director and President, AIM Trimark Corporate Class Inc. and AIM Trimark Canada Fund Inc.; Senior Managing Director, Invesco Holding Company Limited; Director and Chairman, Fund Management Company (former registered broker dealer); President and Principal Executive Officer, The Invesco Funds (AIM Treasurer’s Series Trust (Invesco Treasurer’s Series Trust), and Short-Term Investments Trust only); President, AIM Trimark Global Fund Inc. and AIM Trimark Canada Fund Inc. | 144 | None | ||||
| Independent Trustees | ||||||||
Bruce L. Crockett — 1944 Trustee and Chair | 2001 | Chairman, Crockett Technologies Associates (technology consulting company)
Formerly: Director, Captaris (unified messaging provider); Director, President and Chief Executive Officer, COMSAT Corporation; Chairman, Board of Governors of INTELSAT (international communications company); ACE Limited (insurance company); and Investment Company Institute | 144 | ALPS (Attorneys Liability Protection Society) (insurance company) |
| 1 | Mr. Flanagan is considered an interested person (within the meaning of Section 2(a)(19) of the 1940 Act) of the Trust because he is an officer of the Adviser to the Trust, and an officer and a director of Invesco Ltd., ultimate parent of the Adviser. |
| 2 | Mr. Taylor is considered an interested person (within the meaning of Section 2(a)(19) of the 1940 Act) of the Trust because he is an officer and a director of the Adviser. |
T-1 Invesco Global Low Volatility Equity Yield Fund
Trustees and Officers—(continued)
Name, Year of Birth and Position(s) Held with the Trust | Trustee and/ or Officer Since | Principal Occupation(s) During Past 5 Years | Number of Funds in Fund Complex Overseen by Trustee | Other Directorship(s) Held by Trustee During | ||||
| Independent Trustees—(continued) | ||||||||
David C. Arch — 1945 Trustee | 2010 | Chairman of Blistex Inc., a consumer health care products manufacturer | 144 | Board member of the Illinois Manufacturers’ Association; Member of the Board of Visitors, Institute for the Humanities, University of Michigan; Member of the Audit Committee of the Edward-Elmhurst Hospital | ||||
James T. Bunch — 1942 Trustee | 2003 | Managing Member, Grumman Hill Group LLC (family office private equity investments)
Formerly: Founder, Green Manning & Bunch Ltd. (investment banking firm) (1988-2010); Executive Committee, United States Golf Association; and Director, Policy Studies, Inc. and Van Gilder Insurance Corporation | 144 | Chairman, Board of Governors, Western Golf Association; Chairman, Evans Scholars Foundation; and Director, Denver Film Society | ||||
Rodney F. Dammeyer — 1940 Trustee | 2010 | Chairman of CAC, LLC, (private company offering capital investment and management advisory services)
Formerly: Prior to 2001, Managing Partner at Equity Group Corporate Investments; Prior to 1995, Chief Executive Officer of Itel Corporation (formerly Anixter International); Prior to 1985, experience includes Senior Vice President and Chief Financial Officer of Household International, Inc., Executive Vice President and Chief Financial Officer of Northwest Industries, Inc. and Partner of Arthur Andersen & Co.; From 1987 to 2010, Director/Trustee of investment companies in the Van Kampen Funds complex | 144 | Director of Quidel Corporation and Stericycle, Inc. | ||||
Albert R. Dowden — 1941 Trustee | 2001 | Director of a number of public and private business corporations, including the Boss Group, Ltd. (private investment and management); Nature’s Sunshine Products, Inc. and Reich & Tang Funds (5 portfolios) (registered investment company)
Formerly: Director, Homeowners of America Holding Corporation/Homeowners of America Insurance Company (property casualty company); Director, Continental Energy Services, LLC (oil and gas pipeline service); Director, CompuDyne Corporation (provider of product and services to the public security market) and Director, Annuity and Life Re (Holdings), Ltd. (reinsurance company); Director, President and Chief Executive Officer, Volvo Group North America, Inc.; Senior Vice President, AB Volvo; Director of various public and private corporations; Chairman, DHJ Media, Inc.; Director, Magellan Insurance Company; and Director, The Hertz Corporation, Genmar Corporation (boat manufacturer), National Media Corporation; Advisory Board of Rotary Power International (designer, manufacturer, and seller of rotary power engines); and Chairman, Cortland Trust, Inc. (registered investment company) | 144 | Director of: Nature’s Sunshine Products, Inc., Reich & Tang Funds, Homeowners of America Holding Corporation/ Homeowners of America Insurance Company, the Boss Group | ||||
Jack M. Fields — 1952 Trustee | 2001 | Chief Executive Officer, Twenty First Century Group, Inc. (government affairs company); Owner and Chief Executive Officer, Dos Angeles Ranch, L.P. (cattle, hunting, corporate entertainment); and Discovery Global Education Fund (non-profit)
Formerly: Chief Executive Officer, Texana Timber LP (sustainable forestry company); Director of Cross Timbers Quail Research Ranch (non-profit); and member of the U.S. House of Representatives | 144 | Insperity, Inc. (formerly known as Administaff) | ||||
Prema Mathai-Davis — 1950 Trustee | 2001 | Retired. Formerly: Chief Executive Officer, YWCA of the U.S.A. | 144 | None | ||||
Larry Soll — 1942 Trustee | 2003 | Retired. Formerly: Chairman, Chief Executive Officer and President, Synergen Corp. (a biotechnology company) | 144 | None | ||||
Hugo F. Sonnenschein — 1940 Trustee | 2010 | President Emeritus and Honorary Trustee of the University of Chicago and the Adam Smith Distinguished Service Professor in the Department of Economics at the University of Chicago. Prior to 2000, President of the University of Chicago | 144 | Trustee of the University of Rochester and a member of its investment committee; Member of the National Academy of Sciences and the American Philosophical Society; Fellow of the American Academy of Arts and Sciences | ||||
Raymond Stickel, Jr. — 1944 Trustee | 2005 | Retired. Formerly: Director, Mainstay VP Series Funds, Inc. (25 portfolios) and Partner, Deloitte & Touche | 144 | None | ||||
T-2 Invesco Global Low Volatility Equity Yield Fund
Trustees and Officers—(continued)
Name, Year of Birth and Position(s) Held with the Trust | Trustee and/ or Officer Since | Principal Occupation(s) During Past 5 Years | Number of Funds in Fund Complex Overseen by Trustee | Other Directorship(s) Held by Trustee During | ||||
| Independent Trustees—(continued) | ||||||||
Suzanne H. Woolsey — 1941 Trustee | 2014 | Chief Executive Officer of Woolsey Partners LLC | 144 | Emeritus Chair of the Board of Trustees of the Institute for Defense Analyses; Trustee of Colorado College; Trustee of California Institute of Technology; Prior to 2014, Director of Fluor Corp.; Prior to 2010, Trustee of the German Marshall Fund of the United States; Prior to 2010 Trustee of the Rocky Mountain Institute | ||||
| Other Officers | ||||||||
Russell C. Burk — 1958 Senior Vice President and Senior Officer | 2005 | Senior Vice President and Senior Officer, The Invesco Funds | N/A | N/A | ||||
John M. Zerr — 1962 Senior Vice President, Chief Legal Officer and Secretary | 2006 | Director, Senior Vice President, Secretary and General Counsel, Invesco Management Group, Inc. (formerly known as Invesco Aim Management Group, Inc.) and Van Kampen Exchange Corp.; Senior Vice President, Invesco Advisers, Inc. (formerly known as Invesco Institutional (N.A.), Inc.) (registered investment adviser); Senior Vice President and Secretary, Invesco Distributors, Inc. (formerly known as Invesco Aim Distributors, Inc.); Director, Vice President and Secretary, Invesco Investment Services, Inc. (formerly known as Invesco Aim Investment Services, Inc.) and IVZ Distributors, Inc. (formerly known as INVESCO Distributors, Inc.); Director and Vice President, INVESCO Funds Group, Inc.; Senior Vice President, Chief Legal Officer and Secretary, The Invesco Funds; Manager, Invesco PowerShares Capital Management LLC; Director, Secretary and General Counsel, Invesco Investment Advisers LLC (formerly known as Van Kampen Asset Management); Secretary and General Counsel, Invesco Capital Markets, Inc. (formerly known as Van Kampen Funds Inc.) and Chief Legal Officer, PowerShares Exchange-Traded Fund Trust, PowerShares Exchange-Traded Fund Trust II, PowerShares India Exchange-Traded Fund Trust , PowerShares Actively Managed Exchange-Traded Fund Trust; and PowerShares Actively Managed Exchange-Traded Commodity Fund Trust
Formerly: Director and Vice President, Van Kampen Advisors Inc.; Director, Vice President, Secretary and General Counsel, Van Kampen Investor Services Inc.; Director, Invesco Distributors, Inc. (formerly known as Invesco Aim Distributors, Inc.); Director, Senior Vice President, General Counsel and Secretary, Invesco Aim Advisers, Inc. and Van Kampen Investments Inc.; Director, Vice President and Secretary, Fund Management Company; Director, Senior Vice President, Secretary, General Counsel and Vice President, Invesco Aim Capital Management, Inc.; Chief Operating Officer and General Counsel, Liberty Ridge Capital, Inc. (an investment adviser); Vice President and Secretary, PBHG Funds (an investment company) and PBHG Insurance Series Fund (an investment company); Chief Operating Officer, General Counsel and Secretary, Old Mutual Investment Partners (a broker-dealer); General Counsel and Secretary, Old Mutual Fund Services (an administrator) and Old Mutual Shareholder Services (a shareholder servicing center); Executive Vice President, General Counsel and Secretary, Old Mutual Capital, Inc. (an investment adviser); and Vice President and Secretary, Old Mutual Advisors Funds (an investment company) | N/A | N/A | ||||
Sheri Morris — 1964 Vice President, Treasurer and Principal Financial Officer | 1999 | Vice President, Treasurer and Principal Financial Officer, The Invesco Funds; Vice President, Invesco Advisers, Inc. (formerly known as Invesco Institutional (N.A.), Inc.) (registered investment adviser); and Vice President, PowerShares Exchange-Traded Fund Trust, PowerShares Exchange-Traded Fund Trust II, PowerShares India Exchange-Traded Fund Trust, PowerShares Actively Managed Exchange-Traded Fund Trust, and PowerShares Actively Managed Exchange-Traded Commodity Fund Trust
Formerly: Vice President, Invesco Aim Advisers, Inc., Invesco Aim Capital Management, Inc. and Invesco Aim Private Asset Management, Inc.; Assistant Vice President and Assistant Treasurer, The Invesco Funds and Assistant Vice President, Invesco Advisers, Inc., Invesco Aim Capital Management, Inc. and Invesco Aim Private Asset Management, Inc.; and Treasurer, PowerShares Exchange-Traded Fund Trust, PowerShares Exchange-Traded Fund Trust II, PowerShares India Exchange-Traded Fund Trust and PowerShares Actively Managed Exchange-Traded Fund Trust | N/A | N/A | ||||
T-3 Invesco Global Low Volatility Equity Yield Fund
Trustees and Officers—(continued)
Name, Year of Birth and Position(s) Held with the Trust | Trustee and/ or Officer Since | Principal Occupation(s) During Past 5 Years | Number of Funds in Fund Complex Overseen by Trustee | Other Directorship(s) Held by Trustee During | ||||
| Other Officers—(continued) | ||||||||
Karen Dunn Kelley — 1960 Vice President | 2004 | Senior Managing Director, Investments; Director, Co-President, Co-Chief Executive Officer, and Co-Chairman, Invesco Advisers, Inc. (formerly known as Invesco Institutional (N.A.), Inc.) (registered investment adviser); Chairman, Invesco Senior Secured Management, Inc.; Senior Vice President, Invesco Management Group, Inc. (formerly known as Invesco Aim Management Group, Inc.); Executive Vice President, Invesco Distributors, Inc. (formerly known as Invesco Aim Distributors, Inc.); Director, Invesco Mortgage Capital Inc. and Invesco Management Company Limited; Director and President, INVESCO Asset Management (Bermuda) Ltd., Vice President, The Invesco Funds (other than AIM Treasurer’s Series Trust (Invesco Treasurer’s Series Trust) and Short-Term Investments Trust); and President and Principal Executive Officer, The Invesco Funds (AIM Treasurer’s Series Trust (Invesco Treasurer’s Series Trust) and Short-Term Investments Trust only)
Formerly: Director, INVESCO Global Asset Management Limited and INVESCO Management S.A.; Senior Vice President, Van Kampen Investments Inc. and Invesco Advisers, Inc. (formerly known as Invesco Institutional (N.A.), Inc.) (registered investment adviser); Vice President, Invesco Advisers, Inc. (formerly known as Invesco Institutional (N.A.), Inc.); Director of Cash Management and Senior Vice President, Invesco Advisers, Inc. and Invesco Aim Capital Management, Inc.; Director and President, Fund Management Company; Chief Cash Management Officer, Director of Cash Management, Senior Vice President, and Managing Director, Invesco Aim Capital Management, Inc.; Director of Cash Management, Senior Vice President, and Vice President, Invesco Advisers, Inc. and The Invesco Funds (AIM Treasurer’s Series Trust (Invesco Treasurer’s Series Trust), and Short-Term Investments Trust only) | N/A | N/A | ||||
Crissie M. Wisdom — 1969 Anti-Money Laundering Compliance Officer | 2013 | Anti-Money Laundering Compliance Officer, Invesco Advisers, Inc. (formerly known as Invesco Institutional (N.A.), Inc.) (registered investment adviser), Invesco Capital Markets, Inc. (formerly known as Van Kampen Funds Inc.), Invesco Distributors, Inc., Invesco Investment Services, Inc., Invesco Management Group, Inc., Van Kampen Exchange Corp., The Invesco Funds, and PowerShares Exchange-Traded Fund Trust, PowerShares Exchange-Traded Fund Trust II, PowerShares India Exchange-Traded Fund Trust, PowerShares Actively Managed Exchange-Traded Fund Trust and PowerShares Actively Managed Exchange-Traded Commodity Fund Trust; and Fraud Prevention Manager and Controls and Risk Analysis Manager for Invesco Investment Services, Inc. | N/A | N/A | ||||
Todd L. Spillane — 1958 Chief Compliance Officer | 2006 | Senior Vice President, Invesco Management Group, Inc. (formerly known as Invesco Aim Management Group, Inc.) and Van Kampen Exchange Corp.; Senior Vice President and Chief Compliance Officer, Invesco Advisers, Inc. (registered investment adviser) (formerly known as Invesco Institutional (N.A.), Inc.); Chief Compliance Officer, The Invesco Funds; Vice President, Invesco Distributors, Inc. (formerly known as Invesco Aim Distributors, Inc.) and Invesco Investment Services, Inc. (formerly known as Invesco Aim Investment Services, Inc.)
Formerly: Chief Compliance Officer, Invesco Funds (Chicago); Senior Vice President, Van Kampen Investments Inc.; Senior Vice President and Chief Compliance Officer, Invesco Aim Advisers, Inc. and Invesco Aim Capital Management, Inc.; Chief Compliance Officer, INVESCO Private Capital Investments, Inc. (holding company), Invesco Private Capital, Inc. (registered investment adviser), Invesco Global Asset Management (N.A.), Inc., Invesco Senior Secured Management, Inc. (registered investment adviser), Van Kampen Investor Services Inc., PowerShares Exchange-Traded Fund Trust, PowerShares Exchange-Traded Fund Trust II, PowerShares India Exchange-Traded Fund Trust and PowerShares Actively Managed Exchange-Traded Fund Trust; and Vice President, Invesco Aim Capital Management, Inc. and Fund Management Company | N/A | N/A |
The Statement of Additional Information of the Trust includes additional information about the Fund’s Trustees and is available upon request, without charge, by calling 1.800.959.4246. Please refer to the Fund’s prospectus for information on the Fund’s sub-advisers.
Office of the Fund 11 Greenway Plaza, Suite 1000 Houston, TX 77046-1173 | Investment Adviser Invesco Advisers, Inc. 1555 Peachtree Street, N.E. Atlanta, GA 30309 | Distributor Invesco Distributors, Inc. 11 Greenway Plaza, Suite 1000 Houston, TX 77046-1173 | Auditors PricewaterhouseCoopers LLP 1000 Louisiana Street, Suite 5800 Houston, TX 77002-5678 | |||
Counsel to the Fund Stradley Ronon Stevens & Young, LLP 2005 Market Street, Suite 2600 Philadelphia, PA 19103-7018 | Counsel to the Independent Trustees Goodwin Procter LLP 901 New York Avenue, N.W. Washington, D.C. 20001 | Transfer Agent Invesco Investment Services, Inc. 11 Greenway Plaza, Suite 1000 Houston, TX 77046-1173 | Custodian State Street Bank and Trust Company 225 Franklin Street Boston, MA 02110-2801 | |||
T-4 Invesco Global Low Volatility Equity Yield Fund

Invesco mailing information
Send general correspondence to Invesco Investment Services, Inc., P.O. Box 219078, Kansas City, MO 64121-9078.
Important notice regarding delivery of security holder documents
To reduce Fund expenses, only one copy of most shareholder documents may be mailed to shareholders with multiple accounts at the same address (Householding). Mailing of your shareholder documents may be householded indefinitely unless you instruct us otherwise. If you do not want the mailing of these documents to be combined with those for other members of your household, please contact Invesco Investment Services, Inc. at 800 959 4246 or contact your financial institution. We will begin sending you individual copies for each account within 30 days after receiving your request.
Fund holdings and proxy voting information
The Fund provides a complete list of its holdings four times in each fiscal year, at the quarter ends. For the second and fourth quarters, the lists appear in the Fund’s semiannual and annual reports to shareholders. For the first and third quarters, the Fund files the lists with the Securities and Exchange Commission (SEC) on Form N-Q. The most recent list of portfolio holdings is available at invesco.com/completeqtrholdings. Shareholders can also look up the Fund’s Forms
N-Q on the SEC website at sec.gov. Copies of the Fund’s Forms N-Q may be reviewed and copied at the SEC Public Reference Room in Washington, D.C. You can obtain information on the operation of the Public Reference Room, including information about duplicating fee charges, by calling 202 551 8090 or 800 732 0330, or by electronic request at the following email address: publicinfo@sec.gov. The SEC file numbers for the Fund are shown below.
A description of the policies and procedures that the Fund uses to determine how to vote proxies relating to portfolio securities is available without charge, upon request, from our Client Services department at 800 959 4246 or at invesco.com/proxyguidelines. The information is also available on the SEC website, sec.gov.
Information regarding how the Fund voted proxies related to its portfolio securities during the most recent 12-month period ended June 30 is available at invesco.com/proxysearch. The information is also available on the SEC website, sec.gov. Invesco Advisers, Inc. is an investment adviser; it provides investment advisory services to individual and institutional clients and does not sell securities. Invesco Distributors, Inc. is the US distributor for Invesco Ltd.’s retail mutual funds, exchange-traded funds and institutional money market funds. Both are wholly owned, indirect subsidiaries of Invesco Ltd. |  | |
SEC file numbers: 811-02699 and 002-57526 GLVEY-AR-1 Invesco Distributors, Inc. | ||
| ||||
 | Annual Report to Shareholders
| December 31, 2014 | ||
| ||||
Invesco Income Allocation Fund
Nasdaq: A: ALAAX n B: BLIAX n C: CLIAX n R: RLIAX n Y: ALAYX n R5: ILAAX
| ||||

Letters to Shareholders
Philip Taylor | Dear Shareholders: This annual report includes information about your Fund, including performance data and a complete list of its investments as of the close of the reporting period. Inside, your Fund’s portfolio managers discuss how they managed your Fund and the factors that affected its performance during the reporting period. I hope you find this report of interest. During the reporting period, the US economy showed unmistakable signs of improvement. After contracting in the first quarter of 2014, the economy expanded strongly in the second and third quarters as employment data improved markedly. Given continuing positive economic trends, the US Federal Reserve (the Fed) ended its extraordinary asset purchase program in October – but it pledged in December to be “patient” before raising interest rates. Overseas, the story was much different. Concerns about economic stagnation and the potential for deflation depressed European markets, while the Chinese economy was hurt by a slowdown in |

manufacturing.
Political change in Washington, DC; changes to monetary policy by the Fed and other central banks; the future direction of oil prices; and unexpected geopolitical events are likely to affect markets in the US and overseas in 2015. This may make some investors hesitant to begin to save for their long-term financial goals. That’s why Invesco has always encouraged investors to work with a professional financial adviser who can stress the importance of starting to save and invest early and the importance of adhering to a disciplined investment plan – when times are good and when they’re uncertain. A financial adviser who knows your unique financial situation, investment goals and risk tolerance can be an invaluable partner as you seek to achieve your financial goals. He or she can offer a long-term perspective when markets are volatile and time-tested advice and guidance when your financial situation or investment goals change.
Timely information when and where you want it
Invesco’s efforts to help investors achieve their financial objectives include providing individual investors and financial professionals with timely information about the markets, the economy and investing – whenever and wherever they want it.
Our website, invesco.com/us, offers a wide range of market insights and investment perspectives. On the website, you’ll find detailed information about our funds, including prices, performance, holdings and portfolio manager commentaries. You can access information about your individual Invesco account whenever it’s convenient for you; just complete a simple, secure online registration. Use the “Log In” box on our home page to get started.
Invesco’s mobile apps for iPhone® and iPad® (both available free from the App StoreSM) allow you to obtain the same detailed information, monitor your account and create customizable watch lists. Also, they allow you to access investment insights from our investment leaders, market strategists, economists and retirement experts. You can sign up to be alerted when new commentary is added, and you can watch portfolio manager videos and have instant access to Invesco news and updates wherever you may be.
In addition to the resources accessible on our website and through our mobile app, you can obtain timely updates to help you stay informed about the markets, the economy and investing by connecting with Invesco on Twitter, LinkedIn or Facebook. You can access our blog at blog.invesco.us.com. Our goal is to provide you the information you want, when and where you want it.
Have questions?
For questions about your account, feel free to contact an Invesco client services representative at 800 959 4246. For Invesco-related questions or comments, please email me directly at phil@invesco.com.
All of us at Invesco look forward to serving your investment management needs for many years to come. Thank you for investing with us.
Sincerely,

Philip Taylor
Senior Managing Director, Invesco Ltd.
iPhone and iPad are trademarks of Apple Inc., registered in the US and other countries. App Store is a service mark of Apple Inc. Invesco Distributors, Inc. is not affiliated with Apple Inc.
2 Invesco Income Allocation Fund
Bruce Crockett | Dear Fellow Shareholders: Among the many important lessons I’ve learned in more than 40 years in a variety of business endeavors is the value of a trusted advocate. As independent chair of the Invesco Funds Board, I can assure you that the members of the Board are strong advocates for the interests of investors in Invesco’s mutual funds. We work hard to represent your interests through oversight of the quality of the investment management services your funds receive and other matters important to your investment, including but not limited to: n Ensuring that Invesco offers a diverse lineup of mutual funds that your financial adviser can use to strive to meet your financial needs as your investment goals change over time. n Monitoring how the portfolio management teams of the Invesco funds are performing in light of changing economic and market conditions. |

| n | Assessing each portfolio management team’s investment performance within the context of the investment strategy described in the fund’s prospectus. |
| n | Monitoring for potential conflicts of interests that may impact the nature of the services that your funds receive. |
We believe one of the most important services we provide our fund shareholders is the annual review of the funds’ advisory and sub-advisory contracts with Invesco Advisers and its affiliates. This review is required by the Investment Company Act of 1940 and focuses on the nature and quality of the services Invesco provides as the adviser to the Invesco funds and the reasonableness of the fees that it charges for those services. Each year, we spend months carefully reviewing information received from Invesco and a variety of independent sources, such as performance and fee data prepared by Lipper Inc., an independent, third-party firm widely recognized as a leader in its field. We also meet with our independent legal counsel and other independent advisers to review and help us assess the information that we have received. Our goal is to assure that you receive quality investment management services for a reasonable fee.
I trust the measures outlined above provide assurance that you have a worthy advocate when it comes to choosing the Invesco Funds.
As always, please contact me at bruce@brucecrockett.com with any questions or concerns you may have. On behalf of the Board, we look forward to continuing to represent your interests and serving your needs.
Sincerely,

Bruce L. Crockett
Independent Chair
Invesco Funds Board of Trustees
3 Invesco Income Allocation Fund
Management’s Discussion of Fund Performance
Performance summary
For the year ended December 31, 2014, Class A shares of Invesco Income Allocation Fund, at net asset value (NAV), outperformed its style-specific benchmark, the Custom Income Allocation Index. Positive absolute performance from domestic fixed income drove results throughout the year. While 2014 began on an optimistic note, international markets, particularly in Europe and China, pulled back at various points during the year in reaction to economic and geopolitical concerns.
Your Fund’s long-term performance appears later in this report.
Fund vs. Indexes
Total returns, 12/31/13 to 12/31/14, at net asset value (NAV). Performance shown does not include applicable contingent deferred sales charges (CDSC) or front-end sales charges, which would have reduced performance.
| Class A Shares | 8.44 | % | |||
| Class B Shares | 7.63 | ||||
| Class C Shares | 7.63 | ||||
| Class R Shares | 8.26 | ||||
| Class Y Shares | 8.71 | ||||
| Class R5 Shares | 8.71 | ||||
| S&P 500 Index‚ (Broad Market Index) | 13.69 | ||||
| Custom Income Allocation Indexn (Style-Specific Index) | 8.22 | ||||
Lipper Mixed-Asset Target Allocation Conservative Funds Index¿ (Peer Group Index) | 4.67 |
Source(s): ‚FactSet Research Systems Inc.; nInvesco, FactSet Research Systems Inc.;
¿Lipper Inc.
Market conditions and your Fund
The year ended December 31, 2014, experienced volatility from geopolitical issues and weak economic data but, overall, had strong performance in many fixed income markets, domestic equity markets and real estate. Commodities struggled and emerging markets were volatile.
Equities, which had become a popular asset class, were largely negative through mid-March and only select markets, such as Europe and the US, broke into positive territory at the end of the first quarter. Overall, at the beginning of 2014, equities were off to a weak start. Government bonds generated attractive gains as investors sought perceived “safe havens” from equity
and commodity volatility and geopolitical issues. Commodities were mixed, with the precious metals
and agricultural complexes up strongly, while prices for industrial metals languished and energy-related commodities turned-in a mixed performance.
In the second quarter of 2014, bond yields fell as geopolitical concerns drove demand for perceived “safe havens” assets. Bonds also benefited from weak economic data. Equities continued to climb higher after a weak start despite elevated valuations in key markets and lackluster economic data, which indicated that investor sentiment was likely the primary driver of returns. Prices of energy and metals rose on geopolitical fears. Agriculture prices tailed off over the quarter as more favorable weather patterns helped to alleviate concerns about poor crop yields.
| Portfolio Composition | ||||||||||
| Asset Class | Target Allocation | % of Total Net Assets as of 12/31/14 | ||||||||
| Taxable Non-Investment Grade | 31.25 | % | 30.85 | % | ||||||
| Intermediate Term Taxable Investment Grade | 23.75 | 23.44 | ||||||||
| Large Cap Value | 23.00 | 22.74 | ||||||||
| International Blend | 10.00 | 9.90 | ||||||||
| Real Estate | 7.00 | 6.96 | ||||||||
| Short Term Taxable Investment Grade | 5.00 | 4.98 | ||||||||
Other Assets Less Liabilities | 0.00 | 1.13 | ||||||||
Based on the composition of the underlying funds.
Capital markets were mixed for the third quarter of 2014. Government bonds generally saw yields decline as geopolitical concerns and evidence of slowing economic activity in Europe and Asia created perceived “safe-haven” demand. Developed equity markets were choppy with US small-cap equities, UK equities and Hong Kong equities trending lower while Japanese, US large-cap and European equities posted gains. Commodities were the clear loser in the third quarter as commodities registered price declines largely in response to the strength of the US dollar and, in many cases, a strong supply outlook.
The final quarter of the year witnessed several key events that shaped asset returns for the reporting period. Chief among them was the October ending of a third round of quantitative easing and the Federal Reserve’s asset purchase program. The second key event was the Organization of the Petroleum Exporting Countries’ decision not to curtail production of crude oil despite a mounting supply glut and evidence of slowing demand. In the face of these events, government bond yields fell throughout the fourth quarter as investors sought safety. High-quality government bond prices were further supported by receding inflation expectations and weakening economic data outside the US. Stock markets contended with heightened volatility and ended mixed, with the US, Hong Kong and Japan posting gains while share prices in Europe and the UK turned negative. Across commodities, agriculture posted nominal gains while metals and particularly energy-related commodity prices fell.
Invesco Dividend Income Fund, PowerShares Active U.S. Real Estate Fund, Invesco Premium Income Fund and Invesco Core Plus Bond Fund were the top contributors to performance for the
| Total Net Assets | $290.9 million |
The Fund’s holdings are subject to change, and there is no assurance that the Fund will continue to hold any particular security.
4 Invesco Income Allocation Fund
reporting period. PowerShares International Dividend Achievers Portfolio and Invesco International Total Return Fund were the only detractors from Fund performance.
Relative to the Fund’s style-specific index, PowerShares Active U.S. Real Estate Fund, Invesco Premium Income Fund and Invesco Dividend Income Fund were the largest contributors to performance. In contrast, Invesco Floating Rate Fund, Invesco International Total Return Fund and Invesco High Yield Fund were the largest detractors from relative performance for the reporting period.
Please note that some of the underlying funds – which include, but are not limited to, Invesco Core Plus Bond Fund – may utilize derivatives such as futures contracts and swap agreements, including interest rate futures and credit derivatives, credit default swaps and/or credit default indexes.
Finally, we thank you for your continued commitment to Invesco Income Allocation Fund.
The views and opinions expressed in management’s discussion of Fund performance are those of Invesco Advisers, Inc. These views and opinions are subject to change at any time based on factors such as market and economic conditions. These views and opinions may not be relied upon as investment advice or recommendations, or as an offer for a particular security. The information is not a complete analysis of every aspect of any market, country, industry, security or the Fund. Statements of fact are from sources considered reliable, but Invesco Advisers, Inc. makes no representation or warranty as to their completeness or accuracy. Although historical performance is no guarantee of future results, these insights may help you understand our investment management philosophy.
See important Fund and, if applicable, index disclosures later in this report.
 | Duy Nguyen Chartered Financial Analyst, Portfolio Manager and Chief Investment Officer of Invesco Solutions, is |
manager of Invesco Income Allocation Fund. He joined Invesco in 2000. Mr. Nguyen earned a BBA from The University of Texas at Austin and an MS from the University of Houston.
Assisted by the Invesco Solutions Team
5 Invesco Income Allocation Fund
Your Fund’s Long-Term Performance
Results of a $10,000 Investment – Oldest Share Class(es) since Inception
Fund and index data from 10/31/05
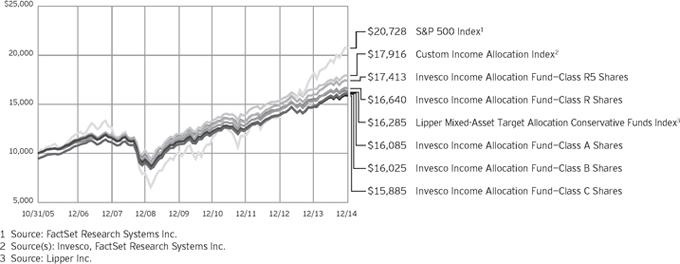
Past performance cannot guarantee comparable future results.
The data shown in the chart include reinvested distributions, applicable sales charges and Fund expenses including management fees. Results for Class B shares are calculated as if a hypothetical shareholder had liquidated his entire investment in the Fund at the close of the reporting period and paid the contingent deferred sales charges, if applicable.
Index results include reinvested dividends, but they do not reflect sales charges. Performance of the peer group, if applicable, reflects fund expenses and management fees; performance of a market index does not. Performance shown in the chart and table(s) does not reflect deduction of taxes a shareholder would pay on Fund distributions or sale of Fund shares.
6 Invesco Income Allocation Fund
| Average Annual Total Returns | |||||
| As of 12/31/14, including maximum applicable sales charges | |||||
| Class A Shares | |||||
| Inception (10/31/05) | 5.32 | % | |||
| 5 Years | 6.82 | ||||
| 1 Year | 2.50 | ||||
| Class B Shares | |||||
| Inception (10/31/05) | 5.28 | % | |||
| 5 Years | 6.92 | ||||
| 1 Year | 2.63 | ||||
| Class C Shares | |||||
| Inception (10/31/05) | 5.18 | % | |||
| 5 Years | 7.22 | ||||
| 1 Year | 6.63 | ||||
| Class R Shares | |||||
| Inception (10/31/05) | 5.71 | % | |||
| 5 Years | 7.76 | ||||
| 1 Year | 8.26 | ||||
| Class Y Shares | |||||
| Inception | 6.15 | % | |||
| 5 Years | 8.31 | ||||
| 1 Year | 8.71 | ||||
| Class R5 Shares | |||||
| Inception (10/31/05) | 6.24 | % | |||
| 5 Years | 8.31 | ||||
| 1 Year | 8.71 | ||||
Class Y shares incepted on October 3, 2008. Performance shown prior to that date is that of Class A shares and includes the 12b-1 fees applicable to Class A shares. Class A share performance reflects any applicable fee waivers or expense reimbursements.
The performance data quoted represent past performance and cannot guarantee comparable future results; current performance may be lower or higher. Please visit invesco.com/performance for the most recent month-end performance. Performance figures reflect reinvested distributions, changes in net asset value and the effect of the maximum sales charge unless otherwise stated. Investment return and principal value will fluctuate so that you may have a gain or loss when you sell shares.
The net annual Fund operating expense ratio set forth in the most recent Fund prospectus as of the date of this report for Class A, Class B, Class C, Class R, Class Y and Class R5 shares was 0.87%, 1.62%, 1.62%,
1.12%, 0.62% and 0.62%, respectively.1,2 The total annual Fund operating expense ratio set forth in the most recent Fund prospectus as of the date of this report for Class A, Class B, Class C, Class R, Class Y and Class R5 shares was 1.18%, 1.93%, 1.93%, 1.43%, 0.93% and 0.89%, respectively.1 The expense ratios presented above may vary from the expense ratios presented in other sections of this report that are based on expenses incurred during the period covered by this report.
Class A share performance reflects the maximum 5.50% sales charge, and Class B and Class C share performance reflects the applicable contingent deferred sales charge (CDSC) for the period involved. The CDSC on Class B shares declines from 5% beginning at the time of purchase to 0% at the beginning of the seventh year. The CDSC on Class C shares is 1% for the first year after purchase. Class R, Class Y and Class R5 shares do not have a front-end sales charge or a CDSC; therefore, performance is at net asset value.
The performance of the Fund’s share classes will differ primarily due to different sales charge structures and class expenses.
Had the adviser not waived fees and/or reimbursed expenses, performance would have been lower.
| 1 | The expense ratio includes acquired fund fees and expenses of the underlying funds in which the Fund invests of 0.62% for Invesco Income Allocation Fund. |
| 2 | Total annual Fund operating expenses after any contractual fee waivers and/or expense reimbursements by the adviser in effect through at least April 30, 2016. See current prospectus for more information. |
7 Invesco Income Allocation Fund
Invesco Income Allocation Fund’s investment objective is current income and, secondarily, growth of capital.
| n | Unless otherwise stated, information presented in this report is as of December 31, 2014, and is based on total net assets. |
| n | Unless otherwise noted, all data provided by Invesco. |
| n | To access your Fund’s reports/prospectus, visit invesco.com/fundreports. |
About share classes
| n | Class B shares may not be purchased for new or additional investments. Please see the prospectus for more information. |
| n | Class R shares are generally available only to employer sponsored retirement and benefit plans. Please see the prospectus for more information. |
| n | Class Y shares are available only to certain investors. Please see the prospectus for more information. |
| n | Class R5 shares are primarily intended for employer sponsored retirement and benefit plans that meet certain standards and for institutional investors. Please see the prospectus for more information. |
Principal risks of investing in the Fund
| n | Active trading risk. Certain underlying funds engage in frequent trading of portfolio securities. Active trading results in added expenses and may result in a lower return and increased tax liability. |
| n | Call risk. If interest rates fall, it is possible that issuers of debt securities with high interest rates will prepay or call their securities before their maturity dates. In this event, the proceeds from the called securities would likely be reinvested by an underlying fund in securities bearing the new, lower interest rates, resulting in a possible decline in an underlying funds income and distributions to shareholders. |
| n | Collateralized loan obligations risk. In addition to the normal interest rate, default and other risk of fixed income securities, collateralized loan obligations carry additional risks, including the possibility that distributions from collateral securities will not be adequate to make interest or other payments, the quality of the collateral may decline in value or default, an underlying fund may invest in collateralized loan obligations that are subordinate to other classes, values may be volatile, and disputes with the issuer may produce |
unexpected investment results. |
| n | Concentration risk. To the extent, an underlying fund invests a greater amount in any one sector or industry, an underlying fund’s performance will depend to a greater extent on the overall condition of the sector or industry, and there is increased risk to an underlying fund if conditions adversely affect that sector or industry. |
| n | Convertible securities risk. An underlying fund may own convertible securities, the value of which may be affected by market interest rates, the risk that the issuer will default, the value of the underlying stock or the right of the issuer to buy back the convertible securities. |
| n | Credit linked notes risk. Risks of credit linked notes include those risks associated with the underlying reference obligation including but not limited to market risk, interest rate risk, credit risk, default risk and foreign currency risk. In the case of a credit linked note created with credit default swaps, the structure will be “funded” such that the par amount of the security will represent the maximum loss that could be incurred on the investment and no leverage is introduced. An investor in a credit linked note bears counterparty risk or the risk that the issuer of the credit linked note will default or become bankrupt and not make timely payment of principal and interest of the structured security. |
| n | Credit risk. The issuer of instruments in which the underlying fund invests may be unable to meet interest and/or principal payments, thereby causing its instruments to decrease in value and lowering the issuer’s credit rating. |
| n | Currency/exchange rate risk. The dollar value of an underlying fund’s foreign investments will be affected by changes in the exchange rates between the dollar and the currencies in which those investments are traded. |
| n | Defaulted securities risk. Defaulted securities involve the substantial risk that principal will not be repaid. Defaulted |
This report must be accompanied or preceded by a currently effective Fund prospectus, which contains more complete information, including sales charges and expenses. Investors should read it carefully before investing.
NOT FDIC INSURED | MAY LOSE VALUE | NO BANK GUARANTEE
| securities and any securities received in an exchange for such securities may be subject to restrictions on resale. |
| n | Derivatives risk. The value of a derivative instrument depends largely on (and is derived from) the value of an underlying security, currency, commodity, interest rate, index or other asset (each referred to as an underlying asset). In addition to risks relating to the underlying assets, the use of derivatives may include other, possibly greater, risks, including counterparty, leverage and liquidity risks. Counterparty risk is the risk that the counterparty to the derivative contract will default on its obligation to pay an underlying fund the amount owed or otherwise perform under the derivative contract. Derivatives create leverage risk because they do not require payment up front equal to the economic exposure created by owning the derivative. As a result, an adverse change in the value of the underlying asset could result in an underlying fund sustaining a loss that is substantially greater than the amount invested in the derivative, which may make an underlying fund’s returns more volatile and increase the risk of loss. Derivative instruments may also be less liquid than more traditional investments and the underlying fund may be unable to sell or close out its derivative positions at a desirable time or price. This risk may be more acute under adverse market conditions, during which an underlying fund may be most in need of liquidating its derivative positions. Derivatives may also be harder to value, less tax efficient and subject to changing government regulation that could impact an underlying fund’s ability to use certain derivatives or their cost. Also, derivatives used for hedging or to gain or limit exposure to a particular market segment may not provide the expected benefits, particularly during adverse market conditions. |
| n | Developing/emerging markets securities risk. The prices of securities issued by foreign companies and governments located in developing/emerging market countries may be affected more negatively by inflation, devaluation of their currencies, higher transaction costs, delays in settlement, adverse political developments, the introduction of capital controls, withholding taxes, |
8 Invesco Income Allocation Fund
nationalization of private assets, expropriation, social unrest, war or lack of timely information than those in developed countries.
| n | Dollar roll transactions risk. Dollar roll transactions involve the risk that the market value and yield of the securities retained by the underlying fund may decline below the price of the mortgage-related securities sold by the underlying fund that it is obligated to repurchase. |
| n | Exchange-traded funds risk. An investment by an underlying fund in exchange-traded funds generally presents the same primary risks as an investment in a mutual fund. In addition, an exchange-traded fund may be subject to the following: (1) a discount of the exchange-traded fund’s shares to its net asset value; (2) failure to develop an active trading market for the exchange-traded fund’s shares; (3) the listing exchange halting trading of the exchange-traded fund’s shares; (4) failure of the exchange-traded fund’s shares to track the referenced asset; and (5) holding troubled securities in the referenced index or basket of investments. Investments in exchange-traded funds may involve duplication of management fees and certain other expenses, as the underlying fund indirectly bears its proportionate share of any expenses paid by the exchange-traded funds in which it invests. Further, certain of the exchange-traded funds in which the underlying fund may invest are leveraged. The more the underlying fund invests in such leveraged exchange-traded funds, the more this leverage will magnify any losses on those investments. |
| n | Financial institutions risk. Investments in financial institutions may be subject to certain risks, including, but not limited to, the risk of regulatory actions, changes in interest rates and concentration of loan portfolios in an industry or sector. Financial institutions are highly regulated and may suffer setbacks should regulatory rules and interpretations under which they operate change. Likewise, there is a high level of competition among financial institutions which could adversely affect the viability of an institution. |
| n | Floating rate securities risk. Some of the underlying funds may invest in senior secured floating rate loans and debt securities that require collateral. There is a risk that the value of the collateral may not be sufficient to cover the amount owed, collateral securing a loan may be found invalid, and collateral may be used to pay other outstanding obligations of the borrower under applicable law or may be difficult to sell. There is also the risk that the collateral may be difficult to liquidate, or that a majority of the collateral may be illiquid. |
| n | Foreign currency tax risk. If the U.S. Treasury Department were to exercise its authority to issue regulations that exclude from the definition of “qualifying income” foreign currency gains not directly related to the underlying fund’s business of investing in securities, the underlying fund may be unable to qualify as a regulated investment company for one or more years. In this event, the underlying fund’s Board may authorize a significant change in investment strategy or fund liquidation. |
| n | Foreign securities risk. An underlying fund’s foreign investments may be affected by changes in a foreign country’s exchange rates, political and social instability; changes in economic or taxation policies, difficulties when enforcing obligations, decreased liquidity, and increased volatility. Foreign companies may be subject to less regulation resulting in less publicly available information about the companies. |
| n | Fund-of-funds risk. The Fund’s performance depends on the underlying funds in which it invests, and it is subject to the risks of the underlying funds. Market fluctuations may change the target weightings in the underlying funds. The underlying funds may change their investment objectives, policies or practices and may not achieve their investment objectives, all of which may cause the Fund to withdraw its investments therein at a disadvantageous time. |
| n | High yield bond (junk bond) risk. Junk bonds involve a greater risk of default or price changes due to changes in the credit quality of the issuer. The values of junk bonds fluctuate more than |
those of high-quality bonds in response to company, political, regulatory or economic developments. Values of junk bonds can decline significantly over short periods of time. |
| n | Income risk. The income you receive from an underlying fund is based primarily on prevailing interest rates, which can vary widely over the short- and long-term. If interest rates drop, your income from an underlying fund may drop as well. |
| n | Industry focus risk. To the extent an underlying fund invests in securities issued or guaranteed by companies in the banking and financial services industries, the underlying fund’s performance will depend on the overall condition of those industries, which may be affected by the following factors: the supply of short-term financing; changes in government regulation and interest rates; and overall economy. |
| n | Interest rate risk. Interest rate risk refers to the risk that bond prices generally fall as interest rates rise; conversely, bond prices generally rise as interest rates fall. Specific bonds differ in their sensitivity to changes in interest rates depending on their individual characteristics, including duration. |
| n | Issuer-specific changes risk. The value of an individual security or particular type of security can be more volatile than the market as a whole and can perform differently from the value of the market as a whole. |
| n | Liquidity risk. An underlying fund may hold illiquid securities that it may be unable to sell at the preferred time or price and could lose its entire investment in such securities. |
| n | Management risk. The investment techniques and risk analysis used by the Fund’s and the underlying funds’ portfolio managers may not produce the desired results. |
| n | Market risk. The prices of and the income generated by an underlying fund’s securities may decline in response to, among other things, investor sentiment, general economic and market conditions, regional or global instability, and currency and interest rate fluctuations. |
continued on page 10
9 Invesco Income Allocation Fund
continued from page 9
| n | Market trading risk. Risk is inherent in all investing. An investment in an underlying fund involves risks similar to those of investing in any underlying fund of equity or fixed-income securities traded on exchanges. You should anticipate that the value of the Shares will decline, more or less, in correlation with any decline in value of the underlying index of certain underlying exchange-traded funds. |
| n | Mortgage- and asset-backed securities risk. Certain of the underlying funds may invest in mortgage and asset-backed securities that are subject to prepayment or call risk, which is the risk that the borrower’s payments may be received earlier or later than expected due to changes in prepayment rates on underlying loans. Faster prepayments often happen when interest rates are falling. As a result, an underlying fund may reinvest these early payments at lower interest rates, thereby reducing the underlying fund’s income. Conversely, when interest rates rise, prepayments may happen more slowly, causing the security to lengthen in duration. Longer duration securities tend to be more volatile. Securities may be prepaid at a price less than the original purchase value. An unexpectedly high rate of defaults on the mortgages held by a mortgage pool may adversely affect the value of mortgage-backed securities and could result in losses to an underlying fund. The risk of such defaults is generally higher in the case of mortgage pools that include subprime mortgages. Subprime mortgages refer to loans made to borrowers with weakened credit histories or with lower capacity to make timely payments on their mortgages. |
| n | Municipal securities risk. An underlying fund may invest in municipal securities. Constitutional amendments, legislative enactments, executive orders, administrative regulations, voter initiatives, and the issuer’s regional economic conditions may affect the municipal security’s value, interest payments, repayment of principal and an underlying fund’s ability to sell it. Failure of a municipal security issuer to comply with applicable tax requirements may make income paid thereon taxable, resulting in a decline in the security’s value. In addition, there could be changes in applicable tax laws or tax treatments that reduce or eliminate the current federal income tax exemption on municipal securities or otherwise adversely affect |
the current federal or state tax status of municipal securities. |
| n | Non-correlation risk. The return of the underlying fund’s preferred equity segment may not match the return of the Index for a number of reasons. For example, an underlying fund incurs operating expenses not applicable to the Index, and incurs costs in buying and selling securities, especially when re-balancing securities holdings to reflect changes in the Index. In addition, the performance of the preferred equity segment and the Index may vary due to asset valuation differences and differences between the preferred equity segment and the Index resulting from legal restrictions, cost or liquidity constraints. |
| n | Non-diversification risk. Certain of the underlying funds are non-diversified and can invest a greater portion of their assets in a small number of issuers or a single issuer. A change in the value of the issuer could affect the value of an underlying fund more than if it was a diversified fund. |
| n | Preferred securities risk. Preferred securities may include provisions that permit the issuer, in its discretion, to defer or omit distributions for a certain period of time. If an underlying fund owns a security that is deferring or omitting its distributions, an underlying fund may be required to report the distribution on its tax returns, even though it may not have received this income. Further, preferred securities may lose substantial value due to the omission or deferment of dividend payments. |
| n | Prepayment risk. An issuer’s ability to prepay principal on a loan or debt security prior to maturity can limit an underlying fund’s potential gains. Prepayments may require the underlying fund to replace the loan or debt security with a lower yielding security, adversely affecting an underlying fund’s yield. |
| n | Reinvestment risk. Reinvestment risk is the risk that a bond’s cash flows (coupon income and principal repayment) will be reinvested at an interest rate below that on the original bond. |
| n | Real estate investment trust (REIT) risk/real estate risk. Investments in real estate related instruments may be affected by economic, legal, cultural, environmental or technological factors that affect property values, rents or occupancies of real estate related to an underlying fund’s holdings. Real estate companies, including REITs or similar |
structures, tend to be small- and mid-cap companies, and their shares may be more volatile and less liquid. The value of investments in real estate related companies may be affected by the quality of management, the ability to repay loans, the utilization of leverage and |
financial covenants related thereto, whether the company carries adequate insurance and environmental factors. If a real estate related company defaults, an underlying fund may own real estate directly, which involves the following additional risks: environmental liabilities; difficulty in valuing and selling the real estate; and economic or regulatory changes.
| n | Small- and mid-capitalization risks. Stocks of small- and mid-sized companies tend to be more vulnerable to adverse developments and may have little or no operating history or track record of success, and limited product lines, markets, management and financial resources. The securities of small- and mid-sized companies may be more volatile due to less market interest and less publicly available information about the issuer. They also may be illiquid or restricted as to resale, or may trade less frequently and in smaller volumes, all of which may cause difficulty when establishing or closing a position at a desirable price. |
| n | Sovereign debt risk. Investments in foreign sovereign debt obligations involve certain risks in addition to those relating to foreign securities or debt securities generally. The issuer of the debt or the governmental authorities that control the repayment of the debt may be unable or unwilling to repay principal or interest when due in accordance with the terms of such debt, and an underlying fund may have limited recourse in the event of a default against the defaulting government. Without the approval of debt holders, some governmental debtors have in the past been able to reschedule or restructure their debt payments or declare moratoria on payments. |
| n | TBA transactions risk. TBA transactions involve the risk that the securities received may be less favorable than what was anticipated by an underlying fund when entering into the TBA transaction. TBA transactions also involve the risk that a counterparty will fail to deliver the securities, exposing an underlying fund to further losses. Whether or not an underlying fund takes delivery of the securities at the termination date of a TBA |
10 Invesco Income Allocation Fund
transaction, an underlying fund will nonetheless be exposed to changes in the value of the underlying investments during the term of the agreement. When an underlying fund enters into a short sale of a TBA mortgage it does not own, an underlying fund may have to purchase deliverable mortgages to settle the short sale at a higher price than anticipated, thereby causing a loss. A short position in a TBA mortgage poses more risk than holding the same TBA mortgage long. As there is no limit on how much the price of mortgage securities can increase, an underlying fund’s exposure is unlimited. An underlying fund may not always be able to purchase mortgage securities to close out the short position at a particular time or at an acceptable price. An underlying fund will earmark or segregate liquid assets in an amount at least equal to its exposure for the duration of the contract. An underlying fund will incur increased transaction costs associated with selling TBA mortgages short. In addition, taking short positions in TBA mortgages results in a form of leverage which could increase the volatility of an underlying fund’s share price.
| n | US government obligations risk. The Fund may invest in obligations issued by US government agencies and instrumentalities that may receive varying levels of support from the government, which could affect an underlying fund’s ability to recover should they default. |
| n | Value investing style risk. Certain underlying funds emphasize a value style of investing, which focuses on undervalued companies with characteristics for improved valuations. This style of investing is subject to the risk that the valuations never improve or that the returns on value equity securities are less than returns on other styles of investing or the overall stock market. Value stocks also may decline in price, even though in theory they are already underpriced. |
| n | When-issued and delayed delivery risks. When-issued and delayed delivery transactions are subject to market risk as the value or yield of a security at delivery may be more or less than the purchase price or the yield generally available on securities when delivery occurs. In addition, an underlying fund is subject to counterparty risk because it relies on the buyer or seller, as the case may be, to consummate the transaction, and failure by the other party to complete the transaction may result in an underlying fund missing the |
opportunity of obtaining a price or yield considered to be advantageous. |
| n | Zero coupon or pay-in-kind securities risk. The value, interest rates, and liquidity of non-cash paying instruments, such as zero coupon and pay-in-kind securities, are subject to greater fluctuation than other types of securities. The higher yields and interest rates on pay-in-kind securities reflect the payment deferral and increased credit risk associated with such instruments and that such investments may represent a higher credit risk than coupon loans. Pay-in-kind securities may have a potential variability in valuations because their continuing accruals require continuing judgments about the collectability of the deferred payments and the value of any associated collateral. |
About indexes used in this report
| n | The S&P 500® Index is an unmanaged index considered representative of the U.S. stock market. |
| n | The Custom Income Allocation Index, created by Invesco to serve as a benchmark for Invesco Income Allocation Fund, is composed of the following indexes: Russell 3000® Index, MSCI EAFE® Index, FTSE NAREIT Equity REITs Index and Barclays U.S. Universal Index. The composition of the index may change based on the fund’s target asset allocation. Therefore, the current composition of the index does not reflect its historical composition and will likely be |
altered in the future to better reflect the fund’s objective.
| n | The Lipper Mixed-Asset Target Allocation Conservative Funds Index is an unmanaged index considered representative of mixed-asset target allocation conservative funds tracked by Lipper. |
| n | The Russell 3000 Index is an unmanaged index considered representative of the US stock market. The Russell 3000 Index is a trademark/service mark of the Frank Russell Co. Russell® is a trademark of the Frank Russell Co. |
| n | The MSCI EAFE Index is an unmanaged index considered representative of stocks of Europe, Australasia and the Far East. The index is computed using the net return, which withholds applicable taxes for non-resident investors. |
| n | The FTSE NAREIT Equity REITs Index is an unmanaged index considered representative of US REITs. The index is computed using the net return which withholds applicable taxes for non-resident investors. |
| n | The Barclays U.S. Universal Index represents the union of the U.S. Aggregate Index, the U.S. High-Yield Corporate Index, the 144A Index, the Euro-dollar Index, the Emerging Markets Index and the non-ERISA portion of the CMBS Index. |
| n | The Fund is not managed to track the performance of any particular index, including the index(es) described here, and consequently, the performance of the Fund may deviate significantly from the performance of the index(es). |
| n | A direct investment cannot be made in an index. Unless otherwise indicated, index results include reinvested dividends, and they do not reflect sales charges. Performance of the peer group, if applicable, reflects fund expenses; performance of a market index does not. |
Other information
| n | The returns shown in management’s discussion of Fund performance are based on net asset values (NAVs) calculated for shareholder transactions. Generally accepted accounting principles require adjustments to be made to the net assets of the Fund at period end for financial reporting purposes, and as such, the NAVs for shareholder transactions and the returns based on those NAVs may differ from the NAVs and returns reported in the Financial Highlights. |
11 Invesco Income Allocation Fund
Schedule of Investments
December 31, 2014
Invesco Income Allocation Fund
Schedule of Investments in Affiliated Issuers–98.87%(a)
% of Net | Value 12/31/13 | Purchases at Cost | Proceeds from Sales | Change in Unrealized Appreciation (Depreciation) | Realized Gain (Loss) | Dividend Income | Shares 12/31/14 | Value 12/31/14 | ||||||||||||||||||||||||||||
Domestic Equity Funds–22.74% |
| |||||||||||||||||||||||||||||||||||
Invesco Diversified Dividend Fund | 7.92 | % | $ | 15,964,443 | $ | 7,980,122 | $ | (2,408,061 | ) | $ | 1,390,025 | $ | 552,732 | $ | 379,412 | 1,259,066 | $ | 23,040,914 | ||||||||||||||||||
Invesco Dividend Income Fund | 14.82 | % | 28,563,972 | 13,608,337 | (3,173,834 | ) | 4,098,137 | 431,288 | 863,963 | 2,056,618 | 43,106,716 | |||||||||||||||||||||||||
Total Domestic Equity Funds | 44,528,415 | 21,588,459 | (5,581,895 | ) | 5,488,162 | 984,020 | 1,243,375 | 66,147,630 | ||||||||||||||||||||||||||||
Fixed-Income Funds–64.25% |
| |||||||||||||||||||||||||||||||||||
Invesco Core Plus Bond Fund | 14.96 | % | 26,801,034 | 16,315,108 | (365,840 | ) | 787,299 | (5,710 | ) | 1,469,951 | 4,012,156 | 43,531,891 | ||||||||||||||||||||||||
Invesco Corporate Bond Fund | 8.48 | % | 14,922,354 | 9,398,221 | (203,911 | ) | 551,172 | (4,733 | ) | 835,332 | 3,387,789 | 24,663,103 | ||||||||||||||||||||||||
Invesco Floating Rate Fund | 6.98 | % | 12,775,875 | 8,312,975 | (167,926 | ) | (622,607 | ) | (1,109 | ) | 734,651 | 2,629,172 | 20,297,208 | |||||||||||||||||||||||
Invesco High Yield Fund | 10.22 | % | 18,768,241 | 12,462,792 | (245,892 | ) | (1,234,603 | ) | (3,567 | ) | 1,417,951 | 6,934,026 | 29,746,971 | |||||||||||||||||||||||
Invesco International Total Return Fund | 4.98 | % | 9,045,510 | 6,326,415 | (213,052 | ) | (655,271 | ) | 179,763 | 155,780 | 1,407,070 | 14,492,819 | ||||||||||||||||||||||||
Invesco Premium Income Fund | 13.65 | % | 23,616,083 | 15,495,417 | (335,853 | ) | 939,851 | (15,051 | ) | 1,626,352 | 3,865,672 | 39,700,447 | ||||||||||||||||||||||||
Invesco Short Term Bond Fund | 4.98 | % | 8,929,978 | 5,810,798 | (119,947 | ) | (126,617 | ) | (508 | ) | 249,075 | 1,681,404 | 14,493,704 | |||||||||||||||||||||||
Total Fixed-Income Funds | 114,859,075 | 74,121,726 | (1,652,421 | ) | (360,776 | ) | 149,085 | 6,489,092 | 186,926,143 | |||||||||||||||||||||||||||
Foreign Equity Funds–4.92% |
| |||||||||||||||||||||||||||||||||||
PowerShares International Dividend Achievers Portfolio–ETF | 4.92 | % | 9,268,878 | 6,297,531 | (502,204 | ) | (729,837 | ) | (4,219 | ) | 424,128 | 818,398 | 14,330,149 | |||||||||||||||||||||||
Real Estate Funds–6.96% |
| |||||||||||||||||||||||||||||||||||
PowerShares Active U.S. Real Estate Fund–ETF | 6.96 | % | 10,964,672 | 5,444,428 | (286,898 | ) | 4,131,196 | (9,085 | ) | 233,135 | 271,984 | 20,244,313 | ||||||||||||||||||||||||
TOTAL INVESTMENTS IN AFFILIATED ISSUERS | 98.87 | % | $ | 179,621,040 | $ | 107,452,144 | $ | (8,023,418 | ) | $ | 8,528,745 | $ | 1,119,801 | (b) | $ | 8,389,730 | $ | 287,648,235 | ||||||||||||||||||
OTHER ASSETS LESS LIABILITIES | 1.13 | % | 3,298,261 | |||||||||||||||||||||||||||||||||
NET ASSETS | 100.00 | % | $ | 290,946,496 | ||||||||||||||||||||||||||||||||
Investment Abbreviations:
ETF – Exchange Traded Fund
Notes to Schedule of Investments:
| (a) | Each underlying fund and the Fund are affiliated by either having the same investment adviser or an investment adviser under common control with the Fund’s investment adviser. The Fund invests in Class R6 shares of the mutual funds listed and the Fund shares of the exchange-traded funds. |
| (b) | Includes $438,347, $421,184 and $190,546 of capital gains distributions from affiliated underlying funds for Invesco Diversified Dividend Fund, Invesco Dividend Income Fund and Invesco International Total Return Fund, respectively. |
See accompanying Notes to Financial Statements which are an integral part of the financial statements.
12 Invesco Income Allocation Fund
Statement of Assets and Liabilities
December 31, 2014
Assets: |
| |||
Investments in affiliated underlying funds, at value (Cost $274,643,856) | $ | 287,648,235 | ||
Cash | 1,809,936 | |||
Receivable for: | ||||
Fund shares sold | 2,058,006 | |||
Fund expenses absorbed | 60,588 | |||
Investment for trustee deferred compensation and retirement plans | 42,267 | |||
Other assets | 45,208 | |||
Total assets | 291,664,240 | |||
Liabilities: | ||||
Payable for: | ||||
Investments purchased — affiliated underlying funds | 213,327 | |||
Fund shares reacquired | 258,070 | |||
Accrued fees to affiliates | 166,414 | |||
Accrued trustees’ and officers’ fees and benefits | 499 | |||
Accrued other operating expenses | 34,149 | |||
Trustee deferred compensation and retirement plans | 45,285 | |||
Total liabilities | 717,744 | |||
Net assets applicable to shares outstanding | $ | 290,946,496 | ||
Net assets consist of: | ||||
Shares of beneficial interest | $ | 283,638,891 | ||
Undistributed net investment income | 592,572 | |||
Undistributed net realized gain (loss) | (6,289,346 | ) | ||
Net unrealized appreciation | 13,004,379 | |||
| $ | 290,946,496 | |||
Net Assets: | ||||
Class A | $ | 199,833,625 | ||
Class B | $ | 4,357,008 | ||
Class C | $ | 68,770,710 | ||
Class R | $ | 3,072,718 | ||
Class Y | $ | 14,030,601 | ||
Class R5 | $ | 881,834 | ||
Shares outstanding, $0.01 par value per share, |
| |||
Class A | 17,874,424 | |||
Class B | 389,308 | |||
Class C | 6,144,563 | |||
Class R | 274,679 | |||
Class Y | 1,255,073 | |||
Class R5 | 78,853 | |||
Class A: | ||||
Net asset value per share | $ | 11.18 | ||
Maximum offering price per share | ||||
(Net asset value of $11.18 ¸ 94.50%) | $ | 11.83 | ||
Class B: | ||||
Net asset value and offering price per share | $ | 11.19 | ||
Class C: | ||||
Net asset value and offering price per share | $ | 11.19 | ||
Class R: | ||||
Net asset value and offering price per share | $ | 11.19 | ||
Class Y: | ||||
Net asset value and offering price per share | $ | 11.18 | ||
Class R5: | ||||
Net asset value and offering price per share | $ | 11.18 | ||
See accompanying Notes to Financial Statements which are an integral part of the financial statements.
13 Invesco Income Allocation Fund
Statement of Operations
For the year ended December 31, 2014
Investment income: |
| |||
Dividends from affiliated underlying funds | $ | 8,389,730 | ||
Other Income | 2,750 | |||
Total investment income | 8,392,480 | |||
Expenses: | ||||
Administrative services fees | 77,582 | |||
Custodian fees | 8,597 | |||
Distribution fees: | ||||
Class A | 406,432 | |||
Class B | 49,092 | |||
Class C | 513,797 | |||
Class R | 14,105 | |||
Transfer agent fees — A, B, C, R and Y | 322,226 | |||
Transfer agent fees — R5 | 524 | |||
Trustees’ and officers’ fees and benefits | 25,484 | |||
Registration and filing fees | 102,809 | |||
Other | 91,202 | |||
Total expenses | 1,611,850 | |||
Less: Expenses reimbursed and expense offset arrangement(s) | (628,799 | ) | ||
Net expenses | 983,051 | |||
Net investment income | 7,409,429 | |||
Realized and unrealized gain from investments in affiliated underlying fund shares | ||||
Net realized gain on sales of affiliated underlying fund shares | 69,724 | |||
Net realized gain from distributions of affiliated underlying fund shares | 1,050,077 | |||
Net realized gain from affiliated underlying fund shares | 1,119,801 | |||
Change in net unrealized appreciation of affiliated underlying fund shares | 8,528,745 | |||
Net gain from affiliated underlying funds | 9,648,546 | |||
Net increase in net assets resulting from operations | $ | 17,057,975 | ||
See accompanying Notes to Financial Statements which are an integral part of the financial statements.
14 Invesco Income Allocation Fund
Statement of Changes in Net Assets
For the years ended December 31, 2014 and 2013
| 2014 | 2013 | |||||||
Operations: |
| |||||||
Net investment income | $ | 7,409,429 | $ | 4,842,513 | ||||
Net realized gain | 1,119,801 | 6,340,868 | ||||||
Change in net unrealized appreciation (depreciation) | 8,528,745 | (2,351,736 | ) | |||||
Net increase in net assets resulting from operations | 17,057,975 | 8,831,645 | ||||||
Distributions to shareholders from net investment income: | ||||||||
Class A | (6,037,241 | ) | (3,779,824 | ) | ||||
Class B | (139,118 | ) | (146,546 | ) | ||||
Class C | (1,547,611 | ) | (860,731 | ) | ||||
Class R | (96,092 | ) | (60,300 | ) | ||||
Class Y | (269,047 | ) | (105,900 | ) | ||||
Class R5 | (21,501 | ) | (10,486 | ) | ||||
Total distributions from net investment income | (8,110,610 | ) | (4,963,787 | ) | ||||
Share transactions–net: | ||||||||
Class A | 61,899,402 | 43,083,981 | ||||||
Class B | (1,034,400 | ) | (990,257 | ) | ||||
Class C | 28,462,440 | 13,871,403 | ||||||
Class R | 900,397 | 91,709 | ||||||
Class Y | 11,121,929 | 354,922 | ||||||
Class R5 | 580,818 | 49,908 | ||||||
Net increase in net assets resulting from share transactions | 101,930,586 | 56,461,666 | ||||||
Net increase in net assets | 110,877,951 | 60,329,524 | ||||||
Net assets: | ||||||||
Beginning of year | 180,068,545 | 119,739,021 | ||||||
End of year (includes undistributed net investment income of $592,572 and $1,019,536, respectively) | $ | 290,946,496 | $ | 180,068,545 | ||||
Notes to Financial Statements
December 31, 2014
NOTE 1—Significant Accounting Policies
Invesco Income Allocation Fund (the “Fund”) is a series portfolio of AIM Growth Series (Invesco Growth Series) (the “Trust”). The Trust is organized as a Delaware statutory trust and is registered under the Investment Company Act of 1940, as amended (the “1940 Act”), as an open-end series management investment company consisting of seventeen separate series portfolios, each authorized to issue an unlimited number of shares of beneficial interest. The assets, liabilities and operations of each portfolio are accounted for separately. Information presented in these financial statements pertains only to the Fund. Matters affecting each portfolio or class will be voted on exclusively by the shareholders of such portfolio or class.
The Fund’s investment objective is current income and, secondarily, growth of capital.
The Fund is a “fund of funds”, in that it invests in other mutual funds (“underlying funds”) advised by Invesco Advisers, Inc. (the “Adviser” or “Invesco”) and exchange traded funds advised by Invesco PowerShares Capital Management LLC (“PowerShares Capital”), an affiliate of Invesco. Invesco and PowerShares Capital are affiliates of each other as they are indirect, wholly-owned subsidiaries of Invesco Ltd. Invesco may change the Fund’s asset class allocations, the underlying funds or the target weightings in the underlying funds without shareholder approval. The underlying funds may engage in a number of investment techniques and practices, which involve certain risks. Each underlying fund’s accounting policies are outlined in the underlying fund’s financial statements and are publically available.
The Fund currently consists of six different classes of shares: Class A, Class B, Class C, Class R, Class Y and Class R5. Class A shares are sold with a front-end sales charge unless certain waiver criteria are met and under certain circumstances load waived shares may be subject to contingent deferred sales charges (“CDSC”). Class C shares are sold with a CDSC. Class R, Class Y and Class R5 shares are sold at net asset value. Effective November 30, 2010, new or additional investments in Class B shares are no longer permitted. Existing shareholders of Class B shares may continue to reinvest dividends and capital gains distributions in Class B shares until they convert to Class A shares. Also, shareholders in Class B shares will be able to exchange those shares for Class B shares of other Invesco Funds offering such shares until they convert to Class A shares. Generally, Class B shares will automatically convert to Class A shares on or about the month-end, which is at least eight years after the date of purchase. Redemption of Class B shares prior to the conversion date will be subject to a CDSC.
15 Invesco Income Allocation Fund
The following is a summary of the significant accounting policies followed by the Fund in the preparation of its financial statements.
| A. | Security Valuations — Securities of investment companies that trade on an exchange are valued at the last sales price or official closing price as of the close of the customary trading session on the exchange where the security is principally traded. Investments in shares of funds that are not traded on an exchange are valued at the end of day net asset value per share of such fund. Securities in the underlying funds, including restricted securities, are valued in accordance with the valuation policy of such fund. The policies of the underlying funds affiliated with the Fund as a result of having the same investment adviser are set forth below. |
A security listed or traded on an exchange (except convertible securities) is valued at its last sales price or official closing price as of the close of the customary trading session on the exchange where the security is principally traded, or lacking any sales or official closing price on a particular day, the security may be valued at the closing bid price on that day. Securities traded in the over-the-counter market are valued based on prices furnished by independent pricing services or market makers. When such securities are valued by an independent pricing service they may be considered fair valued. Futures contracts are valued at the final settlement price set by an exchange on which they are principally traded. Listed options are valued at the mean between the last bid and ask prices from the exchange on which they are principally traded. Options not listed on an exchange are valued by an independent source at the mean between the last bid and ask prices. For purposes of determining net asset value per share, futures and option contracts generally are valued 15 minutes after the close of the customary trading session of the New York Stock Exchange (“NYSE”).
Senior secured floating rate loans and senior secured floating rate debt securities are fair valued using an evaluated quote provided by an independent pricing service. Evaluated quotes provided by the pricing service may reflect appropriate factors such as ratings, tranche type, industry, company performance, spread, individual trading characteristics, institution-size trading in similar groups of securities and other market data.
Investments in open-end and closed-end registered investment companies that do not trade on an exchange are valued at the end of day net asset value per share. Investments in open-end and closed-end registered investment companies that trade on an exchange are valued at the last sales price or official closing price as of the close of the customary trading session on the exchange where the security is principally traded.
Debt obligations (including convertible securities) and unlisted equities are fair valued using an evaluated quote provided by an independent pricing service. Evaluated quotes provided by the pricing service may be determined without exclusive reliance on quoted prices, and may reflect appropriate factors such as institution-size trading in similar groups of securities, developments related to specific securities, dividend rate (for unlisted equities), yield (for debt obligations), quality, type of issue, coupon rate (for debt obligations), maturity (for debt obligations), individual trading characteristics and other market data. Debt obligations are subject to interest rate and credit risks. In addition, all debt obligations involve some risk of default with respect to interest and/or principal payments.
Swap agreements are fair valued using an evaluated quote, if available, provided by an independent pricing service. Evaluated quotes provided by the pricing service are valued based on a model which may include end of day net present values, spreads, ratings, industry, company performance and returns of referenced assets.
Foreign securities’ (including foreign exchange contracts) prices are converted into U.S. dollar amounts using the applicable exchange rates as of the close of the NYSE. If market quotations are available and reliable for foreign exchange-traded equity securities, the securities will be valued at the market quotations. Because trading hours for certain foreign securities end before the close of the NYSE, closing market quotations may become unreliable. If between the time trading ends on a particular security and the close of the customary trading session on the NYSE, events occur that the Adviser determines are significant and make the closing price unreliable, the Fund may fair value the security. If the event is likely to have affected the closing price of the security, the security will be valued at fair value in good faith using procedures approved by the Board of Trustees. Adjustments to closing prices to reflect fair value may also be based on a screening process of an independent pricing service to indicate the degree of certainty, based on historical data, that the closing price in the principal market where a foreign security trades is not the current value as of the close of the NYSE. Foreign securities’ prices meeting the approved degree of certainty that the price is not reflective of current value will be priced at the indication of fair value from the independent pricing service. Multiple factors may be considered by the independent pricing service in determining adjustments to reflect fair value and may include information relating to sector indices, American Depositary Receipts and domestic and foreign index futures. Foreign securities may have additional risks including exchange rate changes, potential for sharply devalued currencies and high inflation, political and economic upheaval, the relative lack of issuer information, relatively low market liquidity and the potential lack of strict financial and accounting controls and standards.
Securities for which market prices are not provided by any of the above methods may be valued based upon quotes furnished by independent sources. The last bid price may be used to value equity securities. The mean between the last bid and ask prices is used to value debt obligations, including corporate loans.
Securities for which market quotations are not readily available or became unreliable are valued at fair value as determined in good faith by or under the supervision of the Trust’s officers following procedures approved by the Board of Trustees. Issuer specific events, market trends, bid/ask quotes of brokers and information providers and other market data may be reviewed in the course of making a good faith determination of a security’s fair value.
The Fund may invest in securities that are subject to interest rate risk, meaning the risk that the prices will generally fall as interest rates rise and, conversely, the prices will generally rise as interest rates fall. Specific securities differ in their sensitivity to changes in interest rates depending on their individual characteristics. Changes in interest rates may result in increased market volatility, which may affect the value and/or liquidity of certain of the Fund’s investments.
Valuations change in response to many factors including the historical and prospective earnings of the issuer, the value of the issuer’s assets, general economic conditions, interest rates, investor perceptions and market liquidity. Because of the inherent uncertainties of valuation, the values reflected in the financial statements may materially differ from the value received upon actual sale of those investments.
| B. | Securities Transactions and Investment Income — Securities transactions are accounted for on a trade date basis. Realized gains or losses on sales are computed on the basis of specific identification of the securities sold. Distributions from ordinary income from underlying funds, if any, are recorded as dividend income on ex-dividend date. Distributions from gains from underlying funds, if any, are recorded as realized gains on the ex-dividend date. The following policies are followed by the underlying funds: Interest income (net of withholding tax, if any) is recorded on the accrual basis from settlement date. Bond premiums and discounts are amortized and/or accreted for financial reporting purposes. Paydown gains and losses on mortgage and asset-backed securities are recorded as adjustments to interest income. |
16 Invesco Income Allocation Fund
The Fund may periodically participate in litigation related to Fund investments. As such, the Fund may receive proceeds from litigation settlements. Any proceeds received are included in the Statement of Operations as realized gain (loss) for investments no longer held and as unrealized gain (loss) for investments still held.
The Fund allocates income and realized and unrealized capital gains and losses to a class based on the relative net assets of each class.
| C. | Distributions — Distributions from net investment income, if any, are declared and paid monthly. Distributions from net realized capital gain, if any, are generally declared and paid annually and recorded on the ex-dividend date. The Fund may elect to treat a portion of the proceeds from redemptions as distributions for federal income tax purposes. |
| D. | Federal Income Taxes — The Fund intends to comply with the requirements of Subchapter M of the Internal Revenue Code of 1986, as amended (the “Internal Revenue Code”), necessary to qualify as a regulated investment company and to distribute substantially all of the Fund’s taxable earnings to shareholders. As such, the Fund will not be subject to federal income taxes on otherwise taxable income (including net realized capital gain) that is distributed to shareholders. Therefore, no provision for federal income taxes is recorded in the financial statements. |
The Fund recognizes the tax benefits of uncertain tax positions only when the position is more likely than not to be sustained. Management has analyzed the Fund’s uncertain tax positions and concluded that no liability for unrecognized tax benefits should be recorded related to uncertain tax positions. Management is not aware of any tax positions for which it is reasonably possible that the total amounts of unrecognized tax benefits will change materially in the next 12 months.
The Fund files tax returns in the U.S. Federal jurisdiction and certain other jurisdictions. Generally, the Fund is subject to examinations by such taxing authorities for up to three years after the filing of the return for the tax period.
| E. | Expenses — Expenses included in the accompanying financial statements reflect the expenses of the Fund and do not include any expenses of the underlying funds. The effects of the underlying funds expenses are included in the realized and unrealized gain/loss on the investments in the underlying funds. Estimated expenses of the underlying funds are discussed further in Note 11. |
Fees provided for under the Rule 12b-1 plan of a particular class of the Fund and which are directly attributable to that class are charged to the operations of such class. Transfer agency fees and expenses and other shareholder recordkeeping fees and expenses attributable to Class R5 are charged to such class. Transfer agency fees and expenses and other shareholder recordkeeping fees and expenses relating to all other classes are allocated among those classes based on relative net assets. All other expenses are allocated among the classes based on relative net assets.
| F. | Accounting Estimates — The preparation of financial statements in conformity with accounting principles generally accepted in the United States of America (“GAAP”) requires management to make estimates and assumptions that affect the reported amounts of assets and liabilities at the date of the financial statements and the reported amounts of revenues and expenses during the reporting period including estimates and assumptions related to taxation. Actual results could differ from those estimates by a significant amount. In addition, the Fund monitors for material events or transactions that may occur or become known after the period-end date and before the date the financial statements are released to print. |
| G. | Indemnifications — Under the Trust’s organizational documents, each Trustee, officer, employee or other agent of the Trust is indemnified against certain liabilities that may arise out of the performance of their duties to the Fund. Additionally, in the normal course of business, the Fund enters into contracts, including the Fund’s servicing agreements, that contain a variety of indemnification clauses. The Fund’s maximum exposure under these arrangements is unknown as this would involve future claims that may be made against the Fund that have not yet occurred. The risk of material loss as a result of such indemnification claims is considered remote. |
NOTE 2—Advisory Fees and Other Fees Paid to Affiliates
The Trust has entered into a master investment advisory agreement with Invesco. Under the terms of the investment advisory agreement, the Fund does not pay an advisory fee. However, the Fund pays advisory fees to Invesco indirectly as a shareholder of the underlying funds.
Under the terms of a master sub-advisory agreement between the Adviser and each of Invesco Asset Management Deutschland GmbH, Invesco Asset Management Limited, Invesco Asset Management (Japan) Limited, Invesco Australia Limited, Invesco Hong Kong Limited, Invesco Senior Secured Management, Inc. and Invesco Canada Ltd. (collectively, the “Affiliated Sub-Advisers”) the Adviser, not the Fund, may pay 40% of the fees paid to the Adviser to any such Affiliated Sub-Adviser(s) that provide(s) discretionary investment management services to the Fund based on the percentage of assets allocated to such Sub-Adviser(s).
The Adviser has contractually agreed, through at least April 30, 2016, to reimburse expenses to the extent necessary to limit total annual fund operating expenses after expense reimbursement (excluding certain items discussed below) of Class A, Class B, Class C, Class R, Class Y and Class R5 shares to 0.25%, 1.00%, 1.00%, 0.50%, 0.00% and 0.00% of average daily net assets, respectively. In determining Adviser’s obligation to reimburse expenses, the following expenses are not taken into account, and could cause the total annual fund operating expenses after expense reimbursement to exceed the numbers reflected above: (1) interest; (2) taxes; (3) dividend expense on short sales; (4) extraordinary or non-routine items, including litigation expenses; and (5) expenses that the Fund has incurred but did not actually pay because of an expense offset arrangement. Acquired Fund Fees and Expenses are not operating expenses of a Fund directly, but are fees and expenses, including management fees of the investment companies in which a Fund invests. As a result, the total annual fund operating expenses after expense reimbursement may exceed the expense limits above. Unless Invesco continues the fee waiver agreement, it will terminate on April 30, 2016. The fee waiver agreement cannot be terminated during its term.
For the year ended December 31, 2014, the Adviser reimbursed Fund level expenses of $306,048 and reimbursed class level expenses of $229,300, $6,924, $72,469, $3,979, $9,041 and $524 of Class A, Class B, Class C, Class R, Class Y and Class R5 shares, respectively.
The Trust has entered into a master administrative services agreement with Invesco pursuant to which the Fund has agreed to pay Invesco for certain administrative costs incurred in providing accounting services to the Fund. For the year ended December 31, 2014, expenses incurred under the agreement are shown in the Statement of Operations as Administrative services fees.
The Trust has entered into a transfer agency and service agreement with Invesco Investment Services, Inc. (“IIS”) pursuant to which the Fund has agreed to pay IIS a fee for providing transfer agency and shareholder services to the Fund and reimburse IIS for certain expenses incurred by IIS in the course of providing such services. IIS may make payments to intermediaries that provide omnibus account services, sub-accounting services and/or networking services. All fees payable by IIS to intermediaries that provide omnibus account services or sub-accounting are charged back to the Fund,
17 Invesco Income Allocation Fund
subject to certain limitations approved by the Trust’s Board of Trustees. For the year ended December 31, 2014, expenses incurred under the agreement are shown in the Statement of Operations as Transfer agent fees.
The Trust has entered into master distribution agreements with Invesco Distributors, Inc. (“IDI”) to serve as the distributor for the Class A, Class B, Class C, Class R, Class Y and Class R5 shares of the Fund. The Trust has adopted plans pursuant to Rule 12b-1 under the 1940 Act with respect to the Fund’s Class A, Class B, Class C and Class R shares (collectively, the “Plans”). The Fund, pursuant to the Plans, pays IDI compensation at the annual rate of 0.25% of the Fund’s average daily net assets of Class A shares, 1.00% of the average daily net assets of Class B and Class C shares and 0.50% of the average daily net assets of Class R shares. Of the Plan payments, up to 0.25% of the average daily net assets of each class of shares may be paid to furnish continuing personal shareholder services to customers who purchase and own shares of such classes. Any amounts not paid as a service fee under the Plans would constitute an asset-based sales charge. Rules of the Financial Industry Regulatory Authority (“FINRA”) impose a cap on the total sales charges, including asset-based sales charges, that may be paid by any class of shares of the Fund. For the year ended December 31, 2014, expenses incurred under the Plans are shown in the Statement of Operations as Distribution fees.
Front-end sales commissions and CDSC (collectively, the “sales charges”) are not recorded as expenses of the Fund. Front-end sales commissions are deducted from proceeds from the sales of Fund shares prior to investment in Class A shares of the Fund. CDSC are deducted from redemption proceeds prior to remittance to the shareholder. During the year ended December 31, 2014, IDI advised the Fund that IDI retained $210,897 in front-end sales commissions from the sale of Class A shares and $1,818, $1,775 and $2,333 from Class A, Class B and Class C shares, respectively, for CDSC imposed on redemptions by shareholders.
The underlying Invesco funds pay no distribution fees for Class R6 and the Fund pays no sales loads or other similar compensation to IDI for acquiring underlying fund shares.
Certain officers and trustees of the Trust are officers and directors of the Adviser, IIS and/or IDI.
NOTE 3—Additional Valuation Information
GAAP defines fair value as the price that would be received to sell an asset or paid to transfer a liability in an orderly transaction between market participants at the measurement date, under current market conditions. GAAP establishes a hierarchy that prioritizes the inputs to valuation methods, giving the highest priority to readily available unadjusted quoted prices in an active market for identical assets (Level 1) and the lowest priority to significant unobservable inputs (Level 3), generally when market prices are not readily available or are unreliable. Based on the valuation inputs, the securities or other investments are tiered into one of three levels. Changes in valuation methods may result in transfers in or out of an investment’s assigned level:
| Level 1 — | Prices are determined using quoted prices in an active market for identical assets. |
| Level 2 — | Prices are determined using other significant observable inputs. Observable inputs are inputs that other market participants may use in pricing a security. These may include quoted prices for similar securities, interest rates, prepayment speeds, credit risk, yield curves, loss severities, default rates, discount rates, volatilities and others. |
| Level 3 — | Prices are determined using significant unobservable inputs. In situations where quoted prices or observable inputs are unavailable (for example, when there is little or no market activity for an investment at the end of the period), unobservable inputs may be used. Unobservable inputs reflect the Fund’s own assumptions about the factors market participants would use in determining fair value of the securities or instruments and would be based on the best available information. |
As of December 31, 2014, all of the securities in this Fund were valued based on Level 1 inputs (see the Schedule of Investments for security categories). The level assigned to the securities valuations may not be an indication of the risk or liquidity associated with investing in those securities.
NOTE 4—Expense Offset Arrangement(s)
The expense offset arrangement is comprised of transfer agency credits which result from balances in demand deposit accounts used by the transfer agent for clearing shareholder transactions. For the year ended December 31, 2014, the Fund received credits from this arrangement, which resulted in the reduction of the Fund’s total expenses of $514.
NOTE 5—Trustees’ and Officers’ Fees and Benefits
Trustees’ and Officers’ Fees and Benefits include amounts accrued by the Fund to pay remuneration to certain Trustees and Officers of the Fund. Trustees have the option to defer compensation payable by the Fund, and Trustees’ and Officers’ Fees and Benefits also include amounts accrued by the Fund to fund such deferred compensation amounts. Those Trustees who defer compensation have the option to select various Invesco Funds in which their deferral accounts shall be deemed to be invested. Finally, certain current Trustees were eligible to participate in a retirement plan that provided for benefits to be paid upon retirement to Trustees over a period of time based on the number of years of service. The Fund may have certain former Trustees who also participate in a retirement plan and receive benefits under such plan. Trustees’ and Officers’ Fees and Benefits include amounts accrued by the Fund to fund such retirement benefits. Obligations under the deferred compensation and retirement plans represent unsecured claims against the general assets of the Fund.
NOTE 6—Cash Balances
The Fund is permitted to temporarily carry a negative or overdrawn balance in its account with State Street Bank and Trust Company, the custodian bank. Such balances, if any at period end, are shown in the Statement of Assets and Liabilities under the payable caption Amount due custodian. To compensate the custodian bank for such overdrafts, the overdrawn Fund may either (1) leave funds as a compensating balance in the account so the custodian bank can be compensated by earning the additional interest; or (2) compensate by paying the custodian bank at a rate agreed upon by the custodian bank and Invesco, not to exceed the contractually agreed upon rate.
18 Invesco Income Allocation Fund
NOTE 7—Distributions to Shareholders and Tax Components of Net Assets
Tax Character of Distributions to Shareholders Paid During the Fiscal Years Ended December 31, 2014 and 2013:
| 2014 | 2013 | |||||||
Ordinary income | $ | 8,110,610 | $ | 4,963,787 | ||||
Tax Components of Net Assets at Period-End:
| 2014 | ||||
Undistributed ordinary income | $ | 633,750 | ||
Undistributed long-term gain | 174,192 | |||
Net unrealized appreciation — investments | 6,540,841 | |||
Temporary book/tax differences | (41,178 | ) | ||
Shares of beneficial interest | 283,638,891 | |||
Total net assets | $ | 290,946,496 | ||
The difference between book-basis and tax-basis unrealized appreciation (depreciation) is due to differences in the timing of recognition of gains and losses on investments for tax and book purposes. The Fund’s net unrealized appreciation difference is attributable primarily to wash sales.
The temporary book/tax differences are a result of timing differences between book and tax recognition of income and/or expenses. The Fund’s temporary book/tax differences are the result of the trustee deferral of compensation and retirement plan benefits.
Capital loss carryforward is calculated and reported as of a specific date. Results of transactions and other activity after that date may affect the amount of capital loss carryforward actually available for the Fund to utilize. Capital losses generated in years beginning after December 22, 2010 can be carried forward for an unlimited period, whereas previous losses expire in eight tax years. Capital losses with an expiration period may not be used to offset capital gains until all net capital losses without an expiration date have been utilized. Capital loss carryforwards with no expiration date will retain their character as either short-term or long-term capital losses instead of as short-term capital losses as under prior law. The ability to utilize capital loss carryforwards in the future may be limited under the Internal Revenue Code and related regulations based on the results of future transactions.
The Fund utilized $762,969 of capital loss carryforward in the current period to offset net realized capital gain for federal income tax purposes. The Fund does not have a capital loss carryforward as of December 31, 2014.
NOTE 8—Investment Securities
The aggregate amount of investment securities (other than short-term securities, U.S. Treasury obligations and money market funds, if any) purchased and sold by the Fund during the year ended December 31, 2014 was $107,452,144 and $8,023,418, respectively. Cost of investments on a tax basis includes the adjustments for financial reporting purposes as of the most recently completed federal income tax reporting period-end.
| Unrealized Appreciation (Depreciation) of Investment Securities on a Tax Basis | ||||
Aggregate unrealized appreciation of investment securities | $ | 8,200,005 | ||
Aggregate unrealized (depreciation) of investment securities | (1,659,164 | ) | ||
Net unrealized appreciation of investment securities | $ | 6,540,841 | ||
Cost of investments for tax purposes is $281,107,394.
NOTE 9—Reclassification of Permanent Differences
Primarily as a result of differing book/tax treatment of distributions from underlying funds, on December 31, 2014, undistributed net investment income was increased by $274,217 and undistributed net realized gain (loss) was decreased by $274,217. This reclassification had no effect on the net assets of the Fund.
19 Invesco Income Allocation Fund
NOTE 10—Share Information
| Summary of Share Activity | ||||||||||||||||
| Years ended December 31, | ||||||||||||||||
| 2014(a) | 2013 | |||||||||||||||
| Shares | Amount | Shares | Amount | |||||||||||||
Sold: | ||||||||||||||||
Class A | 7,569,377 | $ | 84,036,422 | 6,302,752 | $ | 66,696,433 | ||||||||||
Class B | 70,323 | 774,538 | 96,462 | 1,022,570 | ||||||||||||
Class C | 3,820,891 | 42,459,945 | 2,192,131 | 23,321,703 | ||||||||||||
Class R | 197,777 | 2,171,947 | 70,996 | 755,320 | ||||||||||||
Class Y | 1,185,022 | 13,132,580 | 270,780 | 2,885,674 | ||||||||||||
Class R5 | 56,441 | 625,310 | 10,426 | 111,104 | ||||||||||||
Issued as reinvestment of dividends: | ||||||||||||||||
Class A | 465,332 | 5,139,587 | 303,609 | 3,195,604 | ||||||||||||
Class B | 11,024 | 121,760 | 11,935 | 125,791 | ||||||||||||
Class C | 119,287 | 1,318,971 | 69,283 | 729,683 | ||||||||||||
Class R | 8,695 | 96,092 | 5,719 | 60,294 | ||||||||||||
Class Y | 14,473 | 159,902 | 7,712 | 81,094 | ||||||||||||
Class R5 | 1,890 | 20,917 | 949 | 9,985 | ||||||||||||
Automatic conversion of Class B shares to Class A shares: | ||||||||||||||||
Class A | 96,348 | 1,067,889 | 77,760 | 825,697 | ||||||||||||
Class B | (96,251 | ) | (1,067,889 | ) | (77,720 | ) | (825,697 | ) | ||||||||
Reacquired: | ||||||||||||||||
Class A | (2,561,027 | ) | (28,344,496 | ) | (2,620,452 | ) | (27,633,753 | ) | ||||||||
Class B | (77,910 | ) | (862,809 | ) | (124,210 | ) | (1,312,921 | ) | ||||||||
Class C | (1,385,178 | ) | (15,316,476 | ) | (964,030 | ) | (10,179,983 | ) | ||||||||
Class R | (123,119 | ) | (1,367,642 | ) | (68,273 | ) | (723,905 | ) | ||||||||
Class Y | (196,847 | ) | (2,170,553 | ) | (247,856 | ) | (2,611,846 | ) | ||||||||
Class R5 | (5,979 | ) | (65,409 | ) | (6,717 | ) | (71,181 | ) | ||||||||
Net increase in share activity | 9,170,569 | $ | 101,930,586 | 5,311,256 | $ | 56,461,666 | ||||||||||
| (a) | There are entities that are record owners of more than 5% of the outstanding shares of the Fund and in the aggregate own 51% of the outstanding shares of the Fund. IDI has an agreement with these entities to sell Fund shares. The Fund, Invesco and/or Invesco affiliates may make payments to these entities, which are considered to be related to the Fund, for providing services to the Fund, Invesco and/or Invesco affiliates including but not limited to services such as securities brokerage, distribution, third party record keeping and account servicing. The Fund has no knowledge as to whether all or any portion of the shares owned of record by these entities are also owned beneficially. |
20 Invesco Income Allocation Fund
NOTE 11—Financial Highlights
The following schedule presents financial highlights for a share of the Fund outstanding throughout the periods indicated.
| Net asset value, beginning of period | Net investment income(a) | Net gains (losses) on securities (both realized and unrealized) | Total from investment operations | Dividends from net investment income | Net asset value, end of period | Total return(b) | Net assets, end of period (000’s omitted) | Ratio of net assets | Ratio of expenses to average net assets without fee waivers and/or expenses absorbed | Ratio of net investment income to average net assets | Portfolio turnover(d) | |||||||||||||||||||||||||||||||||||||
Class A | ||||||||||||||||||||||||||||||||||||||||||||||||
Year ended 12/31/14 | $ | 10.69 | $ | 0.38 | $ | 0.51 | $ | 0.89 | $ | (0.40 | ) | $ | 11.18 | 8.44 | % | $ | 199,834 | 0.25 | %(e) | 0.52 | %(e) | 3.42 | %(e) | 4 | % | |||||||||||||||||||||||
Year ended 12/31/13 | 10.38 | 0.36 | 0.31 | 0.67 | (0.36 | ) | 10.69 | 6.53 | 131,485 | 0.25 | 0.56 | 3.39 | 24 | |||||||||||||||||||||||||||||||||||
Year ended 12/31/12 | 9.62 | 0.40 | 0.72 | 1.12 | (0.36 | ) | 10.38 | 11.83 | 85,518 | 0.26 | 0.63 | 3.96 | 20 | |||||||||||||||||||||||||||||||||||
Year ended 12/31/11 | 9.64 | 0.39 | (0.05 | ) | 0.34 | (0.36 | ) | 9.62 | 3.54 | 63,727 | 0.28 | 0.65 | 4.00 | 11 | ||||||||||||||||||||||||||||||||||
Year ended 12/31/10 | 9.13 | 0.40 | 0.50 | 0.90 | (0.39 | ) | 9.64 | 10.02 | 55,556 | 0.28 | 0.67 | 4.22 | 16 | |||||||||||||||||||||||||||||||||||
Class B | ||||||||||||||||||||||||||||||||||||||||||||||||
Year ended 12/31/14 | 10.70 | 0.30 | 0.51 | 0.81 | (0.32 | ) | 11.19 | 7.63 | 4,357 | 1.00 | (e) | 1.27 | (e) | 2.67 | (e) | 4 | ||||||||||||||||||||||||||||||||
Year ended 12/31/13 | 10.39 | 0.28 | 0.31 | 0.59 | (0.28 | ) | 10.70 | 5.73 | 5,157 | 1.00 | 1.31 | 2.64 | 24 | |||||||||||||||||||||||||||||||||||
Year ended 12/31/12 | 9.63 | 0.32 | 0.72 | 1.04 | (0.28 | ) | 10.39 | 10.98 | 5,980 | 1.01 | 1.38 | 3.21 | 20 | |||||||||||||||||||||||||||||||||||
Year ended 12/31/11 | 9.65 | 0.31 | (0.05 | ) | 0.26 | (0.28 | ) | 9.63 | 2.77 | 6,592 | 1.03 | 1.40 | 3.25 | 11 | ||||||||||||||||||||||||||||||||||
Year ended 12/31/10 | 9.13 | 0.33 | 0.51 | 0.84 | (0.32 | ) | 9.65 | 9.31 | 6,811 | 1.03 | 1.42 | 3.47 | 16 | |||||||||||||||||||||||||||||||||||
Class C | ||||||||||||||||||||||||||||||||||||||||||||||||
Year ended 12/31/14 | 10.70 | 0.30 | 0.51 | 0.81 | (0.32 | ) | 11.19 | 7.63 | 68,771 | 1.00 | (e) | 1.27 | (e) | 2.67 | (e) | 4 | ||||||||||||||||||||||||||||||||
Year ended 12/31/13 | 10.39 | 0.28 | 0.31 | 0.59 | (0.28 | ) | 10.70 | 5.73 | 38,400 | 1.00 | 1.31 | 2.64 | 24 | |||||||||||||||||||||||||||||||||||
Year ended 12/31/12 | 9.63 | 0.32 | 0.72 | 1.04 | (0.28 | ) | 10.39 | 10.98 | 23,814 | 1.01 | 1.38 | 3.21 | 20 | |||||||||||||||||||||||||||||||||||
Year ended 12/31/11 | 9.65 | 0.31 | (0.05 | ) | 0.26 | (0.28 | ) | 9.63 | 2.77 | 20,669 | 1.03 | 1.40 | 3.25 | 11 | ||||||||||||||||||||||||||||||||||
Year ended 12/31/10 | 9.14 | 0.33 | 0.50 | 0.83 | (0.32 | ) | 9.65 | 9.18 | 19,802 | 1.03 | 1.42 | 3.47 | 16 | |||||||||||||||||||||||||||||||||||
Class R | ||||||||||||||||||||||||||||||||||||||||||||||||
Year ended 12/31/14 | 10.69 | 0.35 | 0.52 | 0.87 | (0.37 | ) | 11.19 | 8.26 | 3,073 | 0.50 | (e) | 0.77 | (e) | 3.17 | (e) | 4 | ||||||||||||||||||||||||||||||||
Year ended 12/31/13 | 10.38 | 0.33 | 0.31 | 0.64 | (0.33 | ) | 10.69 | 6.27 | 2,046 | 0.50 | 0.81 | 3.14 | 24 | |||||||||||||||||||||||||||||||||||
Year ended 12/31/12 | 9.62 | 0.38 | 0.72 | 1.10 | (0.34 | ) | 10.38 | 11.55 | 1,899 | 0.51 | 0.88 | 3.71 | 20 | |||||||||||||||||||||||||||||||||||
Year ended 12/31/11 | 9.65 | 0.36 | (0.06 | ) | 0.30 | (0.33 | ) | 9.62 | 3.18 | 1,173 | 0.53 | 0.90 | 3.75 | 11 | ||||||||||||||||||||||||||||||||||
Year ended 12/31/10 | 9.13 | 0.37 | 0.51 | 0.88 | (0.36 | ) | 9.65 | 9.86 | 1,078 | 0.53 | 0.92 | 3.97 | 16 | |||||||||||||||||||||||||||||||||||
Class Y | ||||||||||||||||||||||||||||||||||||||||||||||||
Year ended 12/31/14 | 10.69 | 0.41 | 0.51 | 0.92 | (0.43 | ) | 11.18 | 8.71 | 14,031 | 0.00 | (e) | 0.27 | (e) | 3.67 | (e) | 4 | ||||||||||||||||||||||||||||||||
Year ended 12/31/13 | 10.38 | 0.38 | 0.31 | 0.69 | (0.38 | ) | 10.69 | 6.80 | 2,697 | 0.00 | 0.31 | 3.64 | 24 | |||||||||||||||||||||||||||||||||||
Year ended 12/31/12 | 9.62 | 0.43 | 0.72 | 1.15 | (0.39 | ) | 10.38 | 12.12 | 2,302 | 0.01 | 0.38 | 4.21 | 20 | |||||||||||||||||||||||||||||||||||
Year ended 12/31/11 | 9.65 | 0.41 | (0.06 | ) | 0.35 | (0.38 | ) | 9.62 | 3.70 | 1,502 | 0.03 | 0.40 | 4.25 | 11 | ||||||||||||||||||||||||||||||||||
Year ended 12/31/10 | 9.13 | 0.42 | 0.51 | 0.93 | (0.41 | ) | 9.65 | 10.42 | 757 | 0.03 | 0.42 | 4.47 | 16 | |||||||||||||||||||||||||||||||||||
Class R5 | ||||||||||||||||||||||||||||||||||||||||||||||||
Year ended 12/31/14 | 10.69 | 0.41 | 0.51 | 0.92 | (0.43 | ) | 11.18 | 8.71 | 882 | 0.00 | (e) | 0.23 | (e) | 3.67 | (e) | 4 | ||||||||||||||||||||||||||||||||
Year ended 12/31/13 | 10.38 | 0.38 | 0.31 | 0.69 | (0.38 | ) | 10.69 | 6.80 | 283 | 0.00 | 0.27 | 3.64 | 24 | |||||||||||||||||||||||||||||||||||
Year ended 12/31/12 | 9.62 | 0.43 | 0.72 | 1.15 | (0.39 | ) | 10.38 | 12.12 | 227 | 0.01 | 0.30 | 4.21 | 20 | |||||||||||||||||||||||||||||||||||
Year ended 12/31/11 | 9.64 | 0.41 | (0.05 | ) | 0.36 | (0.38 | ) | 9.62 | 3.81 | 27 | 0.03 | 0.34 | 4.25 | 11 | ||||||||||||||||||||||||||||||||||
Year ended 12/31/10 | 9.13 | 0.42 | 0.50 | 0.92 | (0.41 | ) | 9.64 | 10.30 | 11 | 0.03 | 0.33 | 4.47 | 16 | |||||||||||||||||||||||||||||||||||
| (a) | Calculated using average shares outstanding. |
| (b) | Includes adjustments in accordance with accounting principles generally accepted in the United States of America and as such, the net asset value for financial reporting purposes and the returns based upon those net asset values may differ from the net asset value and returns for shareholder transactions. Does not include sales charges and is not annualized for periods less than one year, if applicable. |
| (c) | In addition to the fees and expenses which the Fund bears directly; the Fund indirectly bears a pro rata share of the fees and expenses of the underlying funds in which the Fund invests. Because the underlying funds have varied expenses and fee levels and the Fund may own different proportions at different times, the amount of fees and expenses incurred indirectly by the Fund will vary. Estimated underlying fund expenses are not expenses that are incurred directly by your Fund. They are expenses that are incurred directly by the underlying funds and are deducted from the value of the funds your Fund invests in. The effect of the estimated underlying fund expenses that you bear indirectly is included in your Fund’s total return. Estimated acquired fund fees from underlying funds were 0.62%, 0.60%, 0.65%, 0.65% and 0.60% for the years ended December 31, 2014, December 31, 2013, December 31, 2012, December 31, 2011 and December 31, 2010, respectively. |
| (d) | Portfolio turnover is calculated at the fund level and is not annualized for periods less than one year, if applicable. |
| (e) | Ratios are based on average daily net assets (000’s omitted) of $162,573, $4,909, $51,380, $2,821, $6,410 and $525 for Class A, Class B, Class C, Class R, Class Y, and Class R5 shares, respectively. |
21 Invesco Income Allocation Fund
Report of Independent Registered Public Accounting Firm
To the Board of Trustees of AIM Growth Series (Invesco Growth Series)
and Shareholders of Invesco Income Allocation Fund:
In our opinion, the accompanying statement of assets and liabilities, including the schedule of investments, and the related statements of operations and of changes in net assets and the financial highlights present fairly, in all material respects, the financial position of Invesco Income Allocation Fund (one of the funds constituting AIM Growth Series (Invesco Growth Series), hereafter referred to as the “Fund”) at December 31, 2014, the results of its operations for the year then ended, the changes in its net assets for each of the two years in the period then ended and the financial highlights for each of the five years in the period then ended, in conformity with accounting principles generally accepted in the United States of America. These financial statements and financial highlights (hereafter referred to as “financial statements”) are the responsibility of the Fund’s management. Our responsibility is to express an opinion on these financial statements based on our audits. We conducted our audits of these financial statements in accordance with the standards of the Public Company Accounting Oversight Board (United States). Those standards require that we plan and perform the audit to obtain reasonable assurance about whether the financial statements are free of material misstatement. An audit includes examining, on a test basis, evidence supporting the amounts and disclosures in the financial statements, assessing the accounting principles used and significant estimates made by management, and evaluating the overall financial statement presentation. We believe that our audits, which included confirmation of securities at December 31, 2014 by correspondence with the custodian and transfer agent, provide a reasonable basis for our opinion.
PRICEWATERHOUSECOOPERS LLP
Houston, Texas
February 23, 2015
22 Invesco Income Allocation Fund
Calculating your ongoing Fund expenses
Example
As a shareholder of the Fund, you incur two types of costs: (1) transaction costs, which may include sales charges (loads) on purchase payments or contingent deferred sales charges on redemptions, if any; and (2) ongoing costs, including distribution and/or service (12b-1) fees, and other Fund expenses. This example is intended to help you understand your ongoing costs (in dollars) of investing in the Fund and to compare these costs with ongoing costs of investing in other mutual funds. The example is based on an investment of $1,000 invested at the beginning of the period and held for the entire period July 1, 2014, through December 31, 2014.
In addition to the fees and expenses which the Fund bears directly, the Fund indirectly bears a pro rata share of the fees and expenses of the underlying funds in which your Fund invests. The amount of fees and expenses incurred indirectly by your Fund will vary because the underlying funds have varied expenses and fee levels and the Fund may own different proportions of the underlying funds at different times. Estimated underlying fund expenses are not expenses that are incurred directly by your Fund. They are expenses that are incurred directly by the underlying funds and are deducted from the value of the underlying funds your Fund invests in. The effect of the estimated underlying fund expenses that you bear indirectly are included in your Fund’s total return.
Actual expenses
The table below provides information about actual account values and actual expenses. You may use the information in this table, together with the amount you invested, to estimate the expenses that you paid over the period. Simply divide your account value by $1,000 (for example, an $8,600 account value divided by $1,000 = 8.6), then multiply the result by the number in the table under the heading entitled “Actual Expenses Paid During Period” to estimate the expenses you paid on your account during this period.
Hypothetical example for comparison purposes
The table below also provides information about hypothetical account values and hypothetical expenses based on the Fund’s actual expense ratio and an assumed rate of return of 5% per year before expenses, which is not the Fund’s actual return.
The hypothetical account values and expenses may not be used to estimate the actual ending account balance or expenses you paid for the period. You may use this information to compare the ongoing costs of investing in the Fund and other funds. To do so, compare this 5% hypothetical example with the 5% hypothetical examples that appear in the shareholder reports of the other funds.
Please note that the expenses shown in the table are meant to highlight your ongoing costs only and do not reflect any transaction costs, such as sales charges (loads) on purchase payments or contingent deferred sales charges on redemptions, if any. Therefore, the hypothetical information is useful in comparing ongoing costs only, and will not help you determine the relative total costs of owning different funds. In addition, expenses shown in the table do not include the expenses of the underlying funds, which are borne indirectly by the Fund. If transaction costs and indirect expenses were included, your costs would have been higher.
| Class | Beginning | ACTUAL | HYPOTHETICAL (5% annual return before expenses) | Annualized | ||||||||||||||||||||
| Ending Account Value (12/31/14)1 | Expenses Paid During Period2 | Ending Account Value (12/31/14) | Expenses Paid During Period2 | |||||||||||||||||||||
| A | $ | 1,000.00 | $ | 1,011.70 | $ | 1.27 | $ | 1,023.95 | $ | 1.28 | 0.25 | % | ||||||||||||
| B | 1,000.00 | 1,007.90 | 5.06 | 1,020.16 | 5.09 | 1.00 | ||||||||||||||||||
| C | 1,000.00 | 1,007.90 | 5.06 | 1,020.16 | 5.09 | 1.00 | ||||||||||||||||||
| R | 1,000.00 | 1,010.40 | 2.53 | 1,022.68 | 2.55 | 0.50 | ||||||||||||||||||
| Y | 1,000.00 | 1,013.00 | 0.00 | 1,025.21 | 0.00 | 0.00 | ||||||||||||||||||
| R5 | 1,000.00 | 1,012.90 | 0.00 | 1,025.21 | 0.00 | 0.00 | ||||||||||||||||||
| 1 | The actual ending account value is based on the actual total return of the Fund for the period July 1, 2014 through December 31, 2014, after actual expenses and will differ from the hypothetical ending account value which is based on the Fund’s expense ratio and a hypothetical annual return of 5% before expenses. |
| 2 | Expenses are equal to the Fund’s annualized expense ratio as indicated above multiplied by the average account value over the period, multiplied by 184/365 to reflect the most recent fiscal half year. |
23 Invesco Income Allocation Fund
Tax Information
Form 1099-DIV, Form 1042-S and other year–end tax information provide shareholders with actual calendar year amounts that should be included in their tax returns. Shareholders should consult their tax advisors.
The following distribution information is being provided as required by the Internal Revenue Code or to meet a specific state’s requirement.
The Fund designates the following amounts or, if subsequently determined to be different, the maximum amount allowable for its fiscal year ended December 31, 2014:
Federal and State Income Tax | ||||
Qualified Dividend Income* | 24.28 | % | ||
Corporate Dividends Received Deduction* | 18.94 | % | ||
U.S. Treasury Obligations* | 1.52 | % | ||
| * | The above percentages are based on ordinary income dividends paid to shareholders during the Fund’s fiscal year. |
24 Invesco Income Allocation Fund
Trustees and Officers
The address of each trustee and officer is AIM Growth Series (Invesco Growth Series) (the “Trust”), 11 Greenway Plaza, Suite 1000, Houston, Texas 77046-1173. The trustees serve for the life of the Trust, subject to their earlier death, incapacitation, resignation, retirement or removal as more specifically provided in the Trust’s organizational documents. Each officer serves for a one year term or until their successors are elected and qualified. Column two below includes length of time served with predecessor entities, if any.
Name, Year of Birth and Position(s) Held with the Trust | Trustee and/ or Officer Since | Principal Occupation(s) During Past 5 Years | Number of Funds in Fund Complex Overseen by Trustee | Other Directorship(s) Held by Trustee During | ||||
| Interested Persons | ||||||||
| Martin L. Flanagan1 — 1960 Trustee | 2007 | Executive Director, Chief Executive Officer and President, Invesco Ltd. (ultimate parent of Invesco and a global investment management firm); Advisor to the Board, Invesco Advisers, Inc. (formerly known as Invesco Institutional (N.A.), Inc.); Trustee, The Invesco Funds; Vice Chair, Investment Company Institute; and Member of Executive Board, SMU Cox School of Business
Formerly: Chairman and Chief Executive Officer, Invesco Advisers, Inc. (registered investment adviser); Director, Chairman, Chief Executive Officer and President, IVZ Inc. (holding company), INVESCO Group Services, Inc. (service provider) and Invesco North American Holdings, Inc. (holding company); Director, Chief Executive Officer and President, Invesco Holding Company Limited (parent of Invesco and a global investment management firm); Director, Invesco Ltd.; Chairman, Investment Company Institute and President, Co-Chief Executive Officer, Co-President, Chief Operating Officer and Chief Financial Officer, Franklin Resources, Inc. (global investment management organization). | 144 | None | ||||
Philip A. Taylor2 — 1954 Trustee, President and Principal Executive Officer | 2006 | Head of North American Retail and Senior Managing Director, Invesco Ltd.; Director, Co-Chairman, Co-President and Co-Chief Executive Officer, Invesco Advisers, Inc. (formerly known as Invesco Institutional (N.A.), Inc.) (registered investment adviser); Director, Chairman, Chief Executive Officer and President, Invesco Management Group, Inc. (formerly known as Invesco Aim Management Group, Inc.) (financial services holding company); Director and President, INVESCO Funds Group, Inc. (registered investment adviser and registered transfer agent); Director and Chairman, Invesco Investment Services, Inc. (formerly known as Invesco Aim Investment Services, Inc.) (registered transfer agent) and IVZ Distributors, Inc. (formerly known as INVESCO Distributors, Inc.) (registered broker dealer); Director, President and Chairman, Invesco Inc. (holding company) and Invesco Canada Holdings Inc. (holding company); Chief Executive Officer, Invesco Corporate Class Inc. (corporate mutual fund company) and Invesco Canada Fund Inc. (corporate mutual fund company); Director, Chairman and Chief Executive Officer, Invesco Canada Ltd. (formerly known as Invesco Trimark Ltd./Invesco Trimark Ltèe) (registered investment adviser and registered transfer agent); Trustee, President and Principal Executive Officer, The Invesco Funds (other than AIM Treasurer’s Series Trust (Invesco Treasurer’s Series Trust) and Short-Term Investments Trust); Trustee and Executive Vice President, The Invesco Funds (AIM Treasurer’s Series Trust (Invesco Treasurer’s Series Trust) and Short-Term Investments Trust only); Director, Invesco Investment Advisers LLC (formerly known as Van Kampen Asset Management); Director, Chief Executive Officer and President, Van Kampen Exchange Corp.
Formerly: Director and Chairman, Van Kampen Investor Services Inc.; Director, Chief Executive Officer and President, 1371 Preferred Inc. (holding company) and Van Kampen Investments Inc.; Director and President, AIM GP Canada Inc. (general partner for limited partnerships) and Van Kampen Advisors, Inc.; Director and Chief Executive Officer, Invesco Trimark Dealer Inc. (registered broker dealer); Director, Invesco Distributors, Inc. (formerly known as Invesco Aim Distributors, Inc.) (registered broker dealer); Manager, Invesco PowerShares Capital Management LLC; Director, Chief Executive Officer and President, Invesco Advisers, Inc.; Director, Chairman, Chief Executive Officer and President, Invesco Aim Capital Management, Inc.; President, Invesco Trimark Dealer Inc. and Invesco Trimark Ltd./Invesco Trimark Ltèe; Director and President, AIM Trimark Corporate Class Inc. and AIM Trimark Canada Fund Inc.; Senior Managing Director, Invesco Holding Company Limited; Director and Chairman, Fund Management Company (former registered broker dealer); President and Principal Executive Officer, The Invesco Funds (AIM Treasurer’s Series Trust (Invesco Treasurer’s Series Trust), and Short-Term Investments Trust only); President, AIM Trimark Global Fund Inc. and AIM Trimark Canada Fund Inc. | 144 | None | ||||
| Independent Trustees | ||||||||
Bruce L. Crockett — 1944 Trustee and Chair | 2001 | Chairman, Crockett Technologies Associates (technology consulting company)
Formerly: Director, Captaris (unified messaging provider); Director, President and Chief Executive Officer, COMSAT Corporation; Chairman, Board of Governors of INTELSAT (international communications company); ACE Limited (insurance company); and Investment Company Institute | 144 | ALPS (Attorneys Liability Protection Society) (insurance company) |
| 1 | Mr. Flanagan is considered an interested person (within the meaning of Section 2(a)(19) of the 1940 Act) of the Trust because he is an officer of the Adviser to the Trust, and an officer and a director of Invesco Ltd., ultimate parent of the Adviser. |
| 2 | Mr. Taylor is considered an interested person (within the meaning of Section 2(a)(19) of the 1940 Act) of the Trust because he is an officer and a director of the Adviser. |
T-1 Invesco Income Allocation Fund
Trustees and Officers—(continued)
Name, Year of Birth and Position(s) Held with the Trust | Trustee and/ or Officer Since | Principal Occupation(s) During Past 5 Years | Number of Funds in Fund Complex Overseen by Trustee | Other Directorship(s) Held by Trustee During | ||||
| Independent Trustees—(continued) | ||||||||
David C. Arch — 1945 Trustee | 2010 | Chairman of Blistex Inc., a consumer health care products manufacturer | 144 | Board member of the Illinois Manufacturers’ Association; Member of the Board of Visitors, Institute for the Humanities, University of Michigan; Member of the Audit Committee of the Edward-Elmhurst Hospital | ||||
James T. Bunch — 1942 Trustee | 2003 | Managing Member, Grumman Hill Group LLC (family office private equity investments)
Formerly: Founder, Green Manning & Bunch Ltd. (investment banking firm) (1988-2010); Executive Committee, United States Golf Association; and Director, Policy Studies, Inc. and Van Gilder Insurance Corporation | 144 | Chairman, Board of Governors, Western Golf Association; Chairman, Evans Scholars Foundation; and Director, Denver Film Society | ||||
Rodney F. Dammeyer — 1940 Trustee | 2010 | Chairman of CAC, LLC, (private company offering capital investment and management advisory services)
Formerly: Prior to 2001, Managing Partner at Equity Group Corporate Investments; Prior to 1995, Chief Executive Officer of Itel Corporation (formerly Anixter International); Prior to 1985, experience includes Senior Vice President and Chief Financial Officer of Household International, Inc., Executive Vice President and Chief Financial Officer of Northwest Industries, Inc. and Partner of Arthur Andersen & Co.; From 1987 to 2010, Director/Trustee of investment companies in the Van Kampen Funds complex | 144 | Director of Quidel Corporation and Stericycle, Inc. | ||||
Albert R. Dowden — 1941 Trustee | 2001 | Director of a number of public and private business corporations, including the Boss Group, Ltd. (private investment and management); Nature’s Sunshine Products, Inc. and Reich & Tang Funds (5 portfolios) (registered investment company)
Formerly: Director, Homeowners of America Holding Corporation/Homeowners of America Insurance Company (property casualty company); Director, Continental Energy Services, LLC (oil and gas pipeline service); Director, CompuDyne Corporation (provider of product and services to the public security market) and Director, Annuity and Life Re (Holdings), Ltd. (reinsurance company); Director, President and Chief Executive Officer, Volvo Group North America, Inc.; Senior Vice President, AB Volvo; Director of various public and private corporations; Chairman, DHJ Media, Inc.; Director, Magellan Insurance Company; and Director, The Hertz Corporation, Genmar Corporation (boat manufacturer), National Media Corporation; Advisory Board of Rotary Power International (designer, manufacturer, and seller of rotary power engines); and Chairman, Cortland Trust, Inc. (registered investment company) | 144 | Director of: Nature’s Sunshine Products, Inc., Reich & Tang Funds, Homeowners of America Holding Corporation/ Homeowners of America Insurance Company, the Boss Group | ||||
Jack M. Fields — 1952 Trustee | 2001 | Chief Executive Officer, Twenty First Century Group, Inc. (government affairs company); Owner and Chief Executive Officer, Dos Angeles Ranch, L.P. (cattle, hunting, corporate entertainment); and Discovery Global Education Fund (non-profit)
Formerly: Chief Executive Officer, Texana Timber LP (sustainable forestry company); Director of Cross Timbers Quail Research Ranch (non-profit); and member of the U.S. House of Representatives | 144 | Insperity, Inc. (formerly known as Administaff) | ||||
Prema Mathai-Davis — 1950 Trustee | 2001 | Retired. Formerly: Chief Executive Officer, YWCA of the U.S.A. | 144 | None | ||||
Larry Soll — 1942 Trustee | 2003 | Retired. Formerly: Chairman, Chief Executive Officer and President, Synergen Corp. (a biotechnology company) | 144 | None | ||||
Hugo F. Sonnenschein — 1940 Trustee | 2010 | President Emeritus and Honorary Trustee of the University of Chicago and the Adam Smith Distinguished Service Professor in the Department of Economics at the University of Chicago. Prior to 2000, President of the University of Chicago | 144 | Trustee of the University of Rochester and a member of its investment committee; Member of the National Academy of Sciences and the American Philosophical Society; Fellow of the American Academy of Arts and Sciences | ||||
Raymond Stickel, Jr. — 1944 Trustee | 2005 | Retired. Formerly: Director, Mainstay VP Series Funds, Inc. (25 portfolios) and Partner, Deloitte & Touche | 144 | None | ||||
T-2 Invesco Income Allocation Fund
Trustees and Officers—(continued)
Name, Year of Birth and Position(s) Held with the Trust | Trustee and/ or Officer Since | Principal Occupation(s) During Past 5 Years | Number of Funds in Fund Complex Overseen by Trustee | Other Directorship(s) Held by Trustee During | ||||
| Independent Trustees—(continued) | ||||||||
Suzanne H. Woolsey — 1941 Trustee | 2014 | Chief Executive Officer of Woolsey Partners LLC | 144 | Emeritus Chair of the Board of Trustees of the Institute for Defense Analyses; Trustee of Colorado College; Trustee of California Institute of Technology; Prior to 2014, Director of Fluor Corp.; Prior to 2010, Trustee of the German Marshall Fund of the United States; Prior to 2010 Trustee of the Rocky Mountain Institute | ||||
| Other Officers | ||||||||
Russell C. Burk — 1958 Senior Vice President and Senior Officer | 2005 | Senior Vice President and Senior Officer, The Invesco Funds | N/A | N/A | ||||
John M. Zerr — 1962 Senior Vice President, Chief Legal Officer and Secretary | 2006 | Director, Senior Vice President, Secretary and General Counsel, Invesco Management Group, Inc. (formerly known as Invesco Aim Management Group, Inc.) and Van Kampen Exchange Corp.; Senior Vice President, Invesco Advisers, Inc. (formerly known as Invesco Institutional (N.A.), Inc.) (registered investment adviser); Senior Vice President and Secretary, Invesco Distributors, Inc. (formerly known as Invesco Aim Distributors, Inc.); Director, Vice President and Secretary, Invesco Investment Services, Inc. (formerly known as Invesco Aim Investment Services, Inc.) and IVZ Distributors, Inc. (formerly known as INVESCO Distributors, Inc.); Director and Vice President, INVESCO Funds Group, Inc.; Senior Vice President, Chief Legal Officer and Secretary, The Invesco Funds; Manager, Invesco PowerShares Capital Management LLC; Director, Secretary and General Counsel, Invesco Investment Advisers LLC (formerly known as Van Kampen Asset Management); Secretary and General Counsel, Invesco Capital Markets, Inc. (formerly known as Van Kampen Funds Inc.) and Chief Legal Officer, PowerShares Exchange-Traded Fund Trust, PowerShares Exchange-Traded Fund Trust II, PowerShares India Exchange-Traded Fund Trust , PowerShares Actively Managed Exchange-Traded Fund Trust; and PowerShares Actively Managed Exchange-Traded Commodity Fund Trust
Formerly: Director and Vice President, Van Kampen Advisors Inc.; Director, Vice President, Secretary and General Counsel, Van Kampen Investor Services Inc.; Director, Invesco Distributors, Inc. (formerly known as Invesco Aim Distributors, Inc.); Director, Senior Vice President, General Counsel and Secretary, Invesco Aim Advisers, Inc. and Van Kampen Investments Inc.; Director, Vice President and Secretary, Fund Management Company; Director, Senior Vice President, Secretary, General Counsel and Vice President, Invesco Aim Capital Management, Inc.; Chief Operating Officer and General Counsel, Liberty Ridge Capital, Inc. (an investment adviser); Vice President and Secretary, PBHG Funds (an investment company) and PBHG Insurance Series Fund (an investment company); Chief Operating Officer, General Counsel and Secretary, Old Mutual Investment Partners (a broker-dealer); General Counsel and Secretary, Old Mutual Fund Services (an administrator) and Old Mutual Shareholder Services (a shareholder servicing center); Executive Vice President, General Counsel and Secretary, Old Mutual Capital, Inc. (an investment adviser); and Vice President and Secretary, Old Mutual Advisors Funds (an investment company) | N/A | N/A | ||||
Sheri Morris — 1964 Vice President, Treasurer and Principal Financial Officer | 1999 | Vice President, Treasurer and Principal Financial Officer, The Invesco Funds; Vice President, Invesco Advisers, Inc. (formerly known as Invesco Institutional (N.A.), Inc.) (registered investment adviser); and Vice President, PowerShares Exchange-Traded Fund Trust, PowerShares Exchange-Traded Fund Trust II, PowerShares India Exchange-Traded Fund Trust, PowerShares Actively Managed Exchange-Traded Fund Trust, and PowerShares Actively Managed Exchange-Traded Commodity Fund Trust
Formerly: Vice President, Invesco Aim Advisers, Inc., Invesco Aim Capital Management, Inc. and Invesco Aim Private Asset Management, Inc.; Assistant Vice President and Assistant Treasurer, The Invesco Funds and Assistant Vice President, Invesco Advisers, Inc., Invesco Aim Capital Management, Inc. and Invesco Aim Private Asset Management, Inc.; and Treasurer, PowerShares Exchange-Traded Fund Trust, PowerShares Exchange-Traded Fund Trust II, PowerShares India Exchange-Traded Fund Trust and PowerShares Actively Managed Exchange-Traded Fund Trust | N/A | N/A | ||||
T-3 Invesco Income Allocation Fund
Trustees and Officers—(continued)
Name, Year of Birth and Position(s) Held with the Trust | Trustee and/ or Officer Since | Principal Occupation(s) During Past 5 Years | Number of Funds in Fund Complex Overseen by Trustee | Other Directorship(s) Held by Trustee During | ||||
| Other Officers—(continued) | ||||||||
Karen Dunn Kelley — 1960 Vice President | 2004 | Senior Managing Director, Investments; Director, Co-President, Co-Chief Executive Officer, and Co-Chairman, Invesco Advisers, Inc. (formerly known as Invesco Institutional (N.A.), Inc.) (registered investment adviser); Chairman, Invesco Senior Secured Management, Inc.; Senior Vice President, Invesco Management Group, Inc. (formerly known as Invesco Aim Management Group, Inc.); Executive Vice President, Invesco Distributors, Inc. (formerly known as Invesco Aim Distributors, Inc.); Director, Invesco Mortgage Capital Inc. and Invesco Management Company Limited; Director and President, INVESCO Asset Management (Bermuda) Ltd., Vice President, The Invesco Funds (other than AIM Treasurer’s Series Trust (Invesco Treasurer’s Series Trust) and Short-Term Investments Trust); and President and Principal Executive Officer, The Invesco Funds (AIM Treasurer’s Series Trust (Invesco Treasurer’s Series Trust) and Short-Term Investments Trust only)
Formerly: Director, INVESCO Global Asset Management Limited and INVESCO Management S.A.; Senior Vice President, Van Kampen Investments Inc. and Invesco Advisers, Inc. (formerly known as Invesco Institutional (N.A.), Inc.) (registered investment adviser); Vice President, Invesco Advisers, Inc. (formerly known as Invesco Institutional (N.A.), Inc.); Director of Cash Management and Senior Vice President, Invesco Advisers, Inc. and Invesco Aim Capital Management, Inc.; Director and President, Fund Management Company; Chief Cash Management Officer, Director of Cash Management, Senior Vice President, and Managing Director, Invesco Aim Capital Management, Inc.; Director of Cash Management, Senior Vice President, and Vice President, Invesco Advisers, Inc. and The Invesco Funds (AIM Treasurer’s Series Trust (Invesco Treasurer’s Series Trust), and Short-Term Investments Trust only) | N/A | N/A | ||||
Crissie M. Wisdom — 1969 Anti-Money Laundering Compliance Officer | 2013 | Anti-Money Laundering Compliance Officer, Invesco Advisers, Inc. (formerly known as Invesco Institutional (N.A.), Inc.) (registered investment adviser), Invesco Capital Markets, Inc. (formerly known as Van Kampen Funds Inc.), Invesco Distributors, Inc., Invesco Investment Services, Inc., Invesco Management Group, Inc., Van Kampen Exchange Corp., The Invesco Funds, and PowerShares Exchange-Traded Fund Trust, PowerShares Exchange-Traded Fund Trust II, PowerShares India Exchange-Traded Fund Trust, PowerShares Actively Managed Exchange-Traded Fund Trust and PowerShares Actively Managed Exchange-Traded Commodity Fund Trust; and Fraud Prevention Manager and Controls and Risk Analysis Manager for Invesco Investment Services, Inc. | N/A | N/A | ||||
Todd L. Spillane — 1958 Chief Compliance Officer | 2006 | Senior Vice President, Invesco Management Group, Inc. (formerly known as Invesco Aim Management Group, Inc.) and Van Kampen Exchange Corp.; Senior Vice President and Chief Compliance Officer, Invesco Advisers, Inc. (registered investment adviser) (formerly known as Invesco Institutional (N.A.), Inc.); Chief Compliance Officer, The Invesco Funds; Vice President, Invesco Distributors, Inc. (formerly known as Invesco Aim Distributors, Inc.) and Invesco Investment Services, Inc. (formerly known as Invesco Aim Investment Services, Inc.)
Formerly: Chief Compliance Officer, Invesco Funds (Chicago); Senior Vice President, Van Kampen Investments Inc.; Senior Vice President and Chief Compliance Officer, Invesco Aim Advisers, Inc. and Invesco Aim Capital Management, Inc.; Chief Compliance Officer, INVESCO Private Capital Investments, Inc. (holding company), Invesco Private Capital, Inc. (registered investment adviser), Invesco Global Asset Management (N.A.), Inc., Invesco Senior Secured Management, Inc. (registered investment adviser), Van Kampen Investor Services Inc., PowerShares Exchange-Traded Fund Trust, PowerShares Exchange-Traded Fund Trust II, PowerShares India Exchange-Traded Fund Trust and PowerShares Actively Managed Exchange-Traded Fund Trust; and Vice President, Invesco Aim Capital Management, Inc. and Fund Management Company | N/A | N/A |
The Statement of Additional Information of the Trust includes additional information about the Fund’s Trustees and is available upon request, without charge, by calling 1.800.959.4246. Please refer to the Fund’s prospectus for information on the Fund’s sub-advisers.
Office of the Fund 11 Greenway Plaza, Suite 1000 Houston, TX 77046-1173 | Investment Adviser Invesco Advisers, Inc. 1555 Peachtree Street, N.E. Atlanta, GA 30309 | Distributor Invesco Distributors, Inc. 11 Greenway Plaza, Suite 1000 Houston, TX 77046-1173 | Auditors PricewaterhouseCoopers LLP 1000 Louisiana Street, Suite 5800 Houston, TX 77002-5678 | |||
Counsel to the Fund Stradley Ronon Stevens & Young, LLP 2005 Market Street, Suite 2600 Philadelphia, PA 19103-7018 | Counsel to the Independent Trustees Goodwin Procter LLP 901 New York Avenue, N.W. Washington, D.C. 20001 | Transfer Agent Invesco Investment Services, Inc. 11 Greenway Plaza, Suite 1000 Houston, TX 77046-1173 | Custodian State Street Bank and Trust Company 225 Franklin Street Boston, MA 02110-2801 | |||
T-4 Invesco Income Allocation Fund

Invesco mailing information
Send general correspondence to Invesco Investment Services, Inc., P.O. Box 219078, Kansas City, MO 64121-9078.
Important notice regarding delivery of security holder documents
To reduce Fund expenses, only one copy of most shareholder documents may be mailed to shareholders with multiple accounts at the same address (Householding). Mailing of your shareholder documents may be householded indefinitely unless you instruct us otherwise. If you do not want the mailing of these documents to be combined with those for other members of your household, please contact Invesco Investment Services, Inc. at 800 959 4246 or contact your financial institution. We will begin sending you individual copies for each account within 30 days after receiving your request.
Fund holdings and proxy voting information
The Fund provides a complete list of its holdings four times in each fiscal year, at the quarter ends. For the second and fourth quarters, the lists appear in the Fund’s semiannual and annual reports to shareholders. For the first and third quarters, the Fund files the lists with the Securities and Exchange Commission (SEC) on Form N-Q. The most recent list of portfolio holdings is available at invesco.com/completeqtrholdings. Shareholders can also look up the Fund’s Forms N-Q on the SEC website at sec.gov. Copies of the Fund’s Forms N-Q may be reviewed and copied at the SEC Public Reference Room in Washington, D.C. You can obtain information on the operation of the Public Reference Room, including information about duplicating fee charges, by calling 202 551 8090 or 800 732 0330, or by electronic request at the following email address: publicinfo@sec.gov. The SEC file numbers for the Fund are shown below.
A description of the policies and procedures that the Fund uses to determine how to vote proxies relating to portfolio securities is available without charge, upon request, from our Client Services department at 800 959 4246 or at invesco.com/proxyguidelines. The information is also available on the SEC website, sec.gov.
Information regarding how the Fund voted proxies related to its portfolio securities during the most recent 12-month period ended June 30 is available at invesco.com/proxysearch. The information is also available on the SEC website, sec.gov. Invesco Advisers, Inc. is an investment adviser; it provides investment advisory services to individual and institutional clients and does not sell securities. Invesco Distributors, Inc. is the US distributor for Invesco Ltd.’s retail mutual funds, exchange-traded funds and institutional money market funds. Both are wholly owned, indirect subsidiaries of Invesco Ltd. |  | |
SEC file numbers: 811-02699 and 002-57526 INCAL-AR-1 Invesco Distributors, Inc. | ||
| ||||
 | Annual Report to Shareholders
| December 31, 2014 | ||
| ||||
Invesco International Allocation Fund
Nasdaq: A: AINAX n B: INABX n C: INACX n R: RINAX n Y: AINYX n R5: INAIX | ||||

Letters to Shareholders
Philip Taylor | Dear Shareholders: This annual report includes information about your Fund, including performance data and a complete list of its investments as of the close of the reporting period. Inside, your Fund’s portfolio managers discuss how they managed your Fund and the factors that affected its performance during the reporting period. I hope you find this report of interest. During the reporting period, the US economy showed unmistakable signs of improvement. After contracting in the first quarter of 2014, the economy expanded strongly in the second and third quarters as employment data improved markedly. Given continuing positive economic trends, the US Federal Reserve (the Fed) ended its extraordinary asset purchase program in October – but it pledged in December to be “patient” before raising interest rates. Overseas, the story was much different. Concerns about economic stagnation and the potential for |

deflation depressed European markets, while the Chinese economy was hurt by a slowdown in manufacturing.
Political change in Washington, DC; changes to monetary policy by the Fed and other central banks; the future direction of oil prices; and unexpected geopolitical events are likely to affect markets in the US and overseas in 2015. This may make some investors hesitant to begin to save for their long-term financial goals. That’s why Invesco has always encouraged investors to work with a professional financial adviser who can stress the importance of starting to save and invest early and the importance of adhering to a disciplined investment plan – when times are good and when they’re uncertain. A financial adviser who knows your unique financial situation, investment goals and risk tolerance can be an invaluable partner as you seek to achieve your financial goals. He or she can offer a long-term perspective when markets are volatile and time-tested advice and guidance when your financial situation or investment goals change.
Timely information when and where you want it
Invesco’s efforts to help investors achieve their financial objectives include providing individual investors and financial professionals with timely information about the markets, the economy and investing – whenever and wherever they want it.
Our website, invesco.com/us, offers a wide range of market insights and investment perspectives. On the website, you’ll find detailed information about our funds, including prices, performance, holdings and portfolio manager commentaries. You can access information about your individual Invesco account whenever it’s convenient for you; just complete a simple, secure online registration. Use the “Log In” box on our home page to get started.
Invesco’s mobile apps for iPhone® and iPad® (both available free from the App StoreSM) allow you to obtain the same detailed information, monitor your account and create customizable watch lists. Also, they allow you to access investment insights from our investment leaders, market strategists, economists and retirement experts. You can sign up to be alerted when new commentary is added, and you can watch portfolio manager videos and have instant access to Invesco news and updates wherever you may be.
In addition to the resources accessible on our website and through our mobile app, you can obtain timely updates to help you stay informed about the markets, the economy and investing by connecting with Invesco on Twitter, LinkedIn or Facebook. You can access our blog at blog.invesco.us.com. Our goal is to provide you the information you want, when and where you want it.
Have questions?
For questions about your account, feel free to contact an Invesco client services representative at 800 959 4246. For Invesco-related questions or comments, please email me directly at phil@invesco.com.
All of us at Invesco look forward to serving your investment management needs for many years to come. Thank you for investing with us.
Sincerely,

Philip Taylor
Senior Managing Director, Invesco Ltd.
iPhone and iPad are trademarks of Apple Inc., registered in the US and other countries. App Store is a service mark of Apple Inc. Invesco Distributors, Inc. is not affiliated with Apple Inc.
2 �� Invesco International Allocation Fund
Bruce Crockett | Dear Fellow Shareholders: Among the many important lessons I’ve learned in more than 40 years in a variety of business endeavors is the value of a trusted advocate. As independent chair of the Invesco Funds Board, I can assure you that the members of the Board are strong advocates for the interests of investors in Invesco’s mutual funds. We work hard to represent your interests through oversight of the quality of the investment management services your funds receive and other matters important to your investment, including but not limited to: n Ensuring that Invesco offers a diverse lineup of mutual funds that your financial adviser can use to strive to meet your financial needs as your investment goals change over time. n Monitoring how the portfolio management teams of the Invesco funds are performing in light of changing economic and market conditions. |

| n | Assessing each portfolio management team’s investment performance within the context of the investment strategy described in the fund’s prospectus. |
| n | Monitoring for potential conflicts of interests that may impact the nature of the services that your funds receive. |
We believe one of the most important services we provide our fund shareholders is the annual review of the funds’ advisory and sub-advisory contracts with Invesco Advisers and its affiliates. This review is required by the Investment Company Act of 1940 and focuses on the nature and quality of the services Invesco provides as the adviser to the Invesco funds and the reasonableness of the fees that it charges for those services. Each year, we spend months carefully reviewing information received from Invesco and a variety of independent sources, such as performance and fee data prepared by Lipper Inc., an independent, third-party firm widely recognized as a leader in its field. We also meet with our independent legal counsel and other independent advisers to review and help us assess the information that we have received. Our goal is to assure that you receive quality investment management services for a reasonable fee.
I trust the measures outlined above provide assurance that you have a worthy advocate when it comes to choosing the Invesco Funds.
As always, please contact me at bruce@brucecrockett.com with any questions or concerns you may have. On behalf of the Board, we look forward to continuing to represent your interests and serving your needs.
Sincerely,

Bruce L. Crockett
Independent Chair
Invesco Funds Board of Trustees
3 Invesco International Allocation Fund
Management’s Discussion of Fund Performance
Performance summary
For the year ended December 31, 2014, Invesco International Allocation Fund had negative returns but, at net asset value (NAV), outperformed its broad market/ style-specific benchmark, the MSCI All Country World ex-US Index.
Your Fund’s long-term performance appears later in this report.
Fund vs. Indexes
Total returns, 12/31/13 to 12/31/14, at net asset value (NAV). Performance shown does not include applicable contingent deferred sales charges (CDSC) or front-end sales charges, which would have reduced performance.
| Class A Shares | -1.78 | % | |||
| Class B Shares | -2.52 | ||||
| Class C Shares | -2.52 | ||||
| Class R Shares | -2.05 | ||||
| Class Y Shares | -1.52 | ||||
| Class R5 Shares | -1.35 | ||||
| MSCI All Country World ex-US Index‚ (Broad Market/Style-Specific Index) | -3.87 | ||||
| Lipper International Multi-Cap Core Funds Indexn (Peer Group Index) | -4.65 |
Source(s): ‚FactSet Research Systems Inc.; nLipper Inc.
Market conditions and your Fund
While 2014 began on an optimistic note, global equity markets pulled back at various points during the year in reaction to economic and geopolitical concerns. In the US, concerns centered around the potential negative effects of the US Federal Reserve reducing the scope of its asset purchase program beginning in early 2014; it ended all purchases in October. Global equity markets also declined in response to an Argentine sovereign bond default, eurozone banking concerns and geopolitical tensions in Ukraine and the Middle East, which weakened the outlook for global economic growth.
Advanced economies such as the UK and US saw an economic rebound that, while modest, was stronger than in
Europe, where a nascent recovery stalled. While a more supportive monetary policy in the eurozone failed to ignite dramatic economic recovery, it briefly boosted European equity prices despite having little effect on corporate earnings. Meanwhile, the Bank of Japan remained committed to extraordinary monetary stimulus.
Equity market performance in emerging markets was mixed. In Russia, markets declined significantly as a result of a sharp drop in the price of energy, recession concerns and a sharp decline in the value of the ruble. China continued to face headwinds and struggled to balance structural reforms with its desire to maintain satisfactory growth, while equity markets in other Asian countries, including India, Indonesia and the Philippines, experienced gains.
In this environment, the Fund posted negative returns but outperformed the MSCI All Country World ex-US Index. The Fund is a “fund-of-funds” and invests in other underlying Invesco mutual funds or Invesco exchange-traded funds. Within the underlying funds, Invesco International Small Company Fund and PowerShares International Dividend Achievers Portfolio were the top detractors from absolute performance for the reporting period.
Stock selection and overweight exposure to Canada in Invesco International Small Company Fund detracted from both absolute and relative returns versus the Fund’s broad market/style-specific index. Particular weakness was seen in the underlying fund’s Canadian energy holdings, which were significantly hurt by sharply declining oil prices.
Invesco International Growth Fund contributed to Fund performance on an absolute and relative basis. Within Invesco International Growth Fund, stock selection in the UK, Singapore and Australia was the primary driver of performance and contributed to the underlying fund’s performance. The UK, Singapore and Australia were also the top country-level contributors within Invesco International Growth Fund for the reporting period. Overweight exposure to Ireland and Israel and no exposure in the weak Russian market were supportive on a relative basis versus the Fund’s broad market/style-specific benchmark. Stock selection in the underlying fund is driven by the underlying fundamentals of each individual company, not by any top-down macroeconomic views. This focus on bottom-up stock selection is the key driver of the Fund’s overall performance.
Portfolio Composition
| Asset Class | Target Allocation | % of Total Net Assets as of 12/31/14 | ||||||||
| International/Global Growth | 32.50 | % | 32.49 | % | ||||||
| International/Global Blend | 31.00 | 30.93 | ||||||||
| International/Global Value | 27.50 | 27.41 | ||||||||
| Emerging Markets | 9.00 | 8.99 | ||||||||
| Cash Equivalents Plus Other Assets Less Liabilities | 0.00 | 0.18 | ||||||||
Based on the composition of the underlying funds.
| Total Net Assets | $175.2 million |
The Fund’s holdings are subject to change, and there is no assurance that the Fund will continue to hold any particular security.
4 Invesco International Allocation Fund
In closing, volatile markets can test an investor’s resolve, but it’s worth remembering that real investment opportunity can present itself when the markets are turbulent.
We welcome new investors who joined the Fund during the year, and we thank our shareholders for your continued investment in Invesco International Allocation Fund.
The views and opinions expressed in management’s discussion of Fund performance are those of Invesco Advisers, Inc. These views and opinions are subject to change at any time based on factors such as market and economic conditions. These views and opinions may not be relied upon as investment advice or recommendations, or as an offer for a particular security. The information is not a complete analysis of every aspect of any market, country, industry, security or the Fund. Statements of fact are from sources considered reliable, but Invesco Advisers, Inc. makes no representation or warranty as to their completeness or accuracy. Although historical performance is no guarantee of future results, these insights may help you understand our investment management philosophy.
See important Fund and, if applicable, index disclosures later in this report.
 | Duy Nguyen Chartered Financial Analyst, Portfolio Manager and Chief Investment Officer of Invesco Solutions, is | |
| manager of Invesco International Allocation Fund. He joined Invesco in 2000. Mr. Nguyen earned a BBA from The University of Texas at Austin and an MS from the University of Houston. | ||
Assisted by the Invesco Solutions Team
5 Invesco International Allocation Fund
Your Fund’s Long-Term Performance
Results of a $10,000 Investment – Oldest Share Class(es) since Inception
Fund and index data from 10/31/05
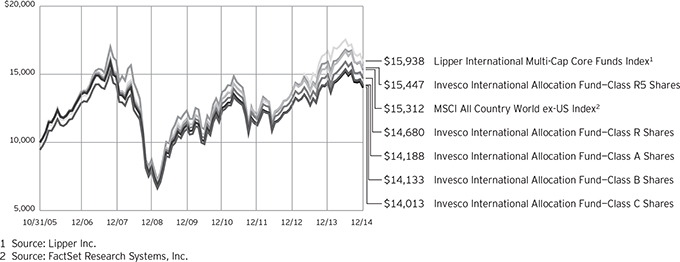
Past performance cannot guarantee comparable future results.
The data shown in the chart include reinvested distributions, applicable sales charges and Fund expenses including management fees. Results for Class B shares are calculated as if a hypothetical shareholder had liquidated his entire investment in the Fund at the close of the reporting period and paid the contingent deferred sales charges, if applicable.
Index results include reinvested dividends, but they do not reflect sales charges. Performance of the peer group, if applicable, reflects fund expenses and management fees; performance of a market index does not. Performance shown in the chart and table(s) does not reflect deduction of taxes a shareholder would pay on Fund distributions or sale of Fund shares.
6 Invesco International Allocation Fund
| Average Annual Total Returns | |||||
| As of 12/31/14, including maximum applicable sales charges | |||||
| Class A Shares | |||||
| Inception (10/31/05) | 3.89 | % | |||
| 5 Years | 4.06 | ||||
| 1 Year | -7.15 | ||||
| Class B Shares | |||||
| Inception (10/31/05) | 3.85 | % | |||
| 5 Years | 4.12 | ||||
| 1 Year | -7.35 | ||||
| Class C Shares | |||||
| Inception (10/31/05) | 3.75 | % | |||
| 5 Years | 4.46 | ||||
| 1 Year | -3.48 | ||||
| Class R Shares | |||||
| Inception (10/31/05) | 4.28 | % | |||
| 5 Years | 5.00 | ||||
| 1 Year | -2.05 | ||||
| Class Y Shares | |||||
| Inception | 4.71 | % | |||
| 5 Years | 5.51 | ||||
| 1 Year | -1.52 | ||||
| Class R5 Shares | |||||
| Inception (10/31/05) | 4.86 | % | |||
| 5 Years | 5.64 | ||||
| 1 Year | -1.35 | ||||
Class Y shares incepted on October 3, 2008. Performance shown prior to that date is that of Class A shares and includes the 12b-1 fees applicable to Class A shares. Class A share performance reflects any applicable fee waivers or expense reimbursements.
The performance data quoted represent past performance and cannot guarantee comparable future results; current performance may be lower or higher. Please visit invesco.com/performance for the most recent month-end performance. Performance figures reflect reinvested distributions, changes in net asset value and the effect of the maximum sales charge unless otherwise stated. Investment return and principal value will fluctuate so that you may have a gain or loss when you sell shares.
The total annual Fund operating expense ratio set forth in the most recent Fund prospectus as of the date of this report for Class A, Class B, Class C, Class R, Class Y and Class R5 shares was 1.52%, 2.27%, 2.27%, 1.77%, 1.27% and 1.06%, respectively.1 The expense ratios presented above may vary from the expense ratios presented in other sections of this report that are based on expenses incurred during the period covered by this report.
Class A share performance reflects the maximum 5.50% sales charge, and Class B and Class C share performance reflects the applicable contingent deferred sales charge (CDSC) for the period involved. The CDSC on Class B shares declines from 5% beginning at the time of purchase to 0% at the beginning of the seventh year. The CDSC on Class C shares is 1% for the first year after purchase. Class R, Class Y and Class R5 shares do not have a front-end sales charge or a CDSC; therefore, performance is at net asset value.
The performance of the Fund’s share classes will differ primarily due to different sales charge structures and class expenses.
Had the adviser not waived fees and/or reimbursed expenses on the Fund’s Class A, Class B, Class C, Class R and Class Y shares in the past, performance would have been lower.
| 1 | The expense ratio includes acquired fund fees and expenses of the underlying funds in which the Fund invests of 0.88% for Invesco International Allocation Fund. |
7 Invesco International Allocation Fund
Invesco International Allocation Fund’s investment objective is long-term growth of capital.
| n | Unless otherwise stated, information presented in this report is as of December 31, 2014, and is based on total net assets. |
| n | Unless otherwise noted, all data provided by Invesco. |
| n | To access your Fund’s reports/prospectus, visit invesco.com/fundreports. |
About share classes
| n | Class B shares may not be purchased for new or additional investments. Please see the prospectus for more information. |
| n | Class R shares are generally available only to employer sponsored retirement and benefit plans. Please see the prospectus for more information. |
| n | Class Y shares are available only to certain investors. Please see the prospectus for more information. |
| n | Class R5 shares are primarily intended for employer sponsored retirement and benefit plans that meet certain standards and for institutional investors. Please see the prospectus for more information. |
Principal risks of investing in the Fund
| n | Concentration risk. To the extent, an underlying fund invests a greater amount in any one sector or industry, an underlying fund’s performance will depend to a greater extent on the overall condition of the sector or industry, and there is increased risk to an underlying fund if conditions adversely affect that sector or industry. |
| n | Depositary receipts risk. Depositary receipts involve many of the same risks as those associated with direct investment in foreign securities. In addition, the underlying issuers of certain depositary receipts, particularly unsponsored or unregistered depositary receipts, are under no obligation to distribute shareholder communications to the holders of such receipts or to pass through to them any voting rights with respect to the deposited securities. |
| n | Derivatives risk. The value of a derivative instrument depends largely on (and is derived from) the value of an underlying security, currency, commodity, interest rate, index or other asset (each referred to as an underlying asset). In addition to risks relating to the underlying assets, the use of derivatives may include other, possibly greater, risks, including counterparty, leverage and |
liquidity risks. Counterparty risk is the risk that the counterparty to the derivative contract will default on its obligation to pay an underlying fund the amount owed or otherwise perform under the derivative contract. Derivatives create leverage risk because they do not require payment up front equal to the economic exposure created by owning the derivative. As a result, an adverse change in the value of the underlying asset could result in an underlying fund sustaining a loss that is substantially greater than the amount invested in the derivative, which may make an underlying fund’s returns more volatile and increase the risk of loss. Derivative instruments may also be less liquid than more traditional investments and the underlying fund may be unable to sell or close out its derivative positions at a desirable time or price. This risk may be more acute under adverse market conditions, during which an underlying fund may be most in need of liquidating its derivative positions. Derivatives may also be harder to value, less tax efficient and subject to changing government regulation that could impact an underlying fund’s ability to use certain derivatives or their cost. Also, derivatives used for hedging or to gain or limit exposure to a particular market segment may not provide the expected benefits, particularly during adverse market conditions. These risks are greater for certain underlying funds than mutual funds that do not use derivative instruments or that use derivative instruments to a lesser extent than certain underlying funds to implement their investment strategy. |
| n | Developing/emerging markets securities risk. The prices of securities issued by foreign companies and governments located in developing/emerging market countries may be affected more negatively by inflation, devaluation of their currencies, higher transaction costs, delays in settlement, adverse political developments, the introduction of capital controls, withholding taxes, nationalization of private assets, expropriation, social unrest, war or lack of |
This report must be accompanied or preceded by a currently effective Fund prospectus, which contains more complete information, including sales charges and expenses. Investors should read it carefully before investing.
NOT FDIC INSURED | MAY LOSE VALUE | NO BANK GUARANTEE
timely information than those in developed countries.
| n | Dividend paying security risk. Securities that pay high dividends as a group can fall out of favor with the market, causing such companies to underperform companies that do not pay high dividends. Also changes in the dividend policies of the companies in the Underlying Index and the capital resources available for such companies’ dividend payments may affect the Fund. |
| n | Financial services sector risk. The financial services sector is subject to extensive government regulation, which may change frequently. In addition, the profitability of businesses in the financial services sector depends on the availability and cost of money and may fluctuate significantly in response to changes in government regulation, interest rates and general economic conditions. Businesses in the financial sector often operate with substantial financial leverage. |
| n | Foreign securities risk. An underlying fund’s foreign investments may be affected by changes in a foreign country’s exchange rates, political and social instability; changes in economic or taxation policies, difficulties when enforcing obligations, decreased liquidity, and increased volatility. Foreign companies may be subject to less regulation resulting in less publicly available information about the companies. |
| n | Fund-of-funds risk. The Fund’s performance depends on the underlying funds in which it invests, and it is subject to the risks of the underlying funds. Market fluctuations may change the target weightings in the underlying funds. The underlying funds may change their investment objectives, policies or practices and may not achieve their investment objectives, all of which may cause the Fund to withdraw its investments therein at a disadvantageous time. |
| n | Geographic focus risk. From time to time an underlying fund may invest a substantial amount of its assets in securities of issuers located in a single country or a limited number of countries. If an underlying fund focuses its investments in this manner, it assumes the risk that economic, political and social conditions in those countries will have a significant impact on its investment performance. An underlying fund’s investment performance may also be more volatile if it focuses its |
8 Invesco International Allocation Fund
investments in certain countries, especially emerging market countries.
| n | Growth investing risk. Growth stocks tend to be more expensive relative to their earnings or assets compared with other types of stock. As a result they tend to be more sensitive to changes in their earnings and can be more volatile. |
| n | Indexing risk. Unlike many investment companies, certain underlying exchange-traded funds do not utilize an investing strategy that seeks returns in excess of their benchmark indices. Such underlying exchange-traded funds would not necessarily buy or sell a security due to its general underperformance, unless that security is added to or removed from the applicable benchmark index. |
| n | Investing in the European Union risk. Many countries in the European Union are susceptible to high economic risks associated with high levels of debt, notably due to investments in sovereign debts of European countries such as Greece, Italy and Spain. One or more member states might exit the European Union, placing its currency and banking system in jeopardy. The European Union faces major issues involving its membership, structure, procedures and policies, including the adoption, abandonment or adjustment of the new constitutional treaty, the European Union’s enlargement to the south and east, and resolution of the European Union’s problematic fiscal and democratic accountability. Efforts of the member states to further unify their economic and monetary policies may increase the potential for the downward movement of one member state’s market to cause a similar effect on other member states’ markets. European countries that are part of the European Economic and Monetary Union may be significantly affected by the tight fiscal and monetary controls that the union seeks to impose on its members. |
| n | Issuer-specific changes risk. The value of an individual security or particular type of security can be more volatile than the market as a whole and can perform differently from the value of the market as a whole. |
| n | Management risk. The investment techniques and risk analysis used by the Fund’s and the underlying funds’ portfolio managers may not produce the desired results. |
| n | Market risk. The prices of and the income generated by an underlying fund’s securities may decline in response to, among other things, investor sentiment, general economic and market conditions, regional or global instability, and currency and interest rate fluctuations. |
| n | Market trading risk. Risk is inherent in all investing. An investment in an underlying fund involves risks similar to those of investing in any underlying fund of equity or fixed-income securities traded on exchanges. You should anticipate that the value of the Shares will decline, more or less, in correlation with any decline in value of the underlying index of certain underlying exchange-traded funds. |
| n | Non-correlation risk. An underlying fund’s return may not match the return of the underlying index of certain underlying exchange-traded funds for a number of reasons. For example, the Fund incurs operating expenses not applicable to the underlying index, and incurs costs in buying and selling securities, especially when rebalancing an underlying fund’s securities holdings to reflect changes in the composition of an underlying index of certain underlying exchange-traded funds. In addition, the performance of an underlying fund and an underlying index of certain underlying exchange-traded funds may vary due to asset valuation differences and differences between an underlying fund’s portfolio and the underlying index of certain underlying exchange-traded funds resulting from legal restrictions, cost or liquidity constraints. |
| n | Preferred securities risk. Preferred securities may include provisions that permit the issuer, in its discretion, to defer or omit distributions for a certain period of time. If an underlying fund owns a security that is deferring or omitting its distributions, an underlying fund may be required to report the distribution on its tax returns, even though it may not have received this income. Further, preferred securities may lose substantial value due to the omission or deferment of dividend payments. |
| n | Small-and mid-capitalization risks. Stocks of small-and mid-sized companies tend to be more vulnerable to adverse developments and may have little or no operating history or track record of success, and limited product lines, markets, management and financial |
resources. The securities of small - and mid-sized companies may be more volatile due to less market interest and less publicly available information about the issuer. They also may be illiquid or restricted as to resale, or may trade less frequently and in smaller volumes, all of which may cause difficulty when establishing or closing a position at a desirable price.
About indexes used in this report
| n | The MSCI All Country World ex-US Index is an index considered representative of developed and emerging market stock markets, excluding the US. The index is computed using the net return, which withholds applicable taxes for non-resident investors. |
| n | The Lipper International Multi-Cap Core Funds Index is an unmanaged index considered representative of international multicap core funds tracked by Lipper. |
| n | The Fund is not managed to track the performance of any particular index, including the index(es) described here, and consequently, the performance of the Fund may deviate significantly from the performance of the index(es). |
| n | A direct investment cannot be made in an index. Unless otherwise indicated, index results include reinvested dividends, and they do not reflect sales charges. Performance of the peer group, if applicable, reflects fund expenses; performance of a market index does not. |
Other information
| n | The returns shown in management’s discussion of Fund performance are based on net asset values (NAVs) calculated for shareholder transactions. Generally accepted accounting principles require adjustments to be made to the net assets of the Fund at period end for financial reporting purposes, and as such, the NAVs for shareholder transactions and the returns based on those NAVs may differ from the NAVs and returns reported in the Financial Highlights. |
9 Invesco International Allocation Fund
Schedule of Investments
December 31, 2014
Invesco International Allocation Fund
Schedule of Investments in Affiliated Issuers–100.12%(a)
| % of Net Assets 12/31/14 | Value 12/31/13 | Purchases at Cost | Proceeds from Sales | Change in Unrealized Appreciation (Depreciation) | Realized Gain (Loss)(b) | Dividend Income | Shares 12/31/14 | Value 12/31/14 | ||||||||||||||||||||||||||||
Foreign Equity Funds–99.82% |
| |||||||||||||||||||||||||||||||||||
Invesco Developing Markets Fund | 4.49 | % | $ | 8,006,446 | $ | 1,243,225 | $ | (907,377 | ) | $ | (415,539 | ) | $ | 68,235 | $ | 119,555 | 258,673 | $ | 7,858,474 | |||||||||||||||||
Invesco Emerging Market Equity Fund | 4.50 | % | �� | 8,472,093 | 723,151 | (945,015 | ) | (291,039 | ) | (68,011 | ) | 59,556 | 1,124,099 | 7,891,179 | ||||||||||||||||||||||
Invesco International Core Equity Fund | 30.93 | % | 58,302,709 | 9,312,889 | (9,859,316 | ) | (2,084,363 | ) | 978,419 | 817,524 | 5,133,435 | 54,209,074 | ||||||||||||||||||||||||
Invesco International Growth Fund | 22.53 | % | 43,700,203 | 4,597,323 | (7,028,907 | ) | (1,727,422 | ) | 1,229,841 | 671,753 | 1,208,035 | 39,478,585 | ||||||||||||||||||||||||
Invesco International Small Company Fund | 9.96 | % | 18,919,003 | 4,412,325 | (3,329,194 | ) | (2,390,372 | ) | 1,189,391 | 329,652 | 955,528 | 17,457,494 | ||||||||||||||||||||||||
PowerShares International Dividend Achievers Portfolio–ETF | 27.41 | % | 53,188,502 | 2,332,633 | (5,068,984 | ) | (2,662,295 | ) | 248,549 | 1,904,739 | 2,743,484 | 48,038,405 | ||||||||||||||||||||||||
Total Foreign Equity Funds | 190,588,956 | 22,621,546 | (27,138,793 | ) | (9,571,030 | ) | 3,646,424 | 3,902,779 | 174,933,211 | |||||||||||||||||||||||||||
Money Market Funds–0.30% |
| |||||||||||||||||||||||||||||||||||
Liquid Assets Portfolio–Institutional Class | 0.15 | % | 411,867 | 9,132,274 | (9,286,392 | ) | — | — | 130 | 257,749 | 257,749 | |||||||||||||||||||||||||
Premier Portfolio–Institutional Class | 0.15 | % | 411,867 | 9,132,273 | (9,286,392 | ) | — | — | 41 | 257,748 | 257,748 | |||||||||||||||||||||||||
Total Money Market Funds | 823,734 | 18,264,547 | (18,572,784 | ) | — | — | 171 | 515,497 | ||||||||||||||||||||||||||||
TOTAL INVESTMENTS IN AFFILIATED ISSUERS (Cost $167,850,793) | 100.12 | % | $ | 191,412,690 | $ | 40,886,093 | $ | (45,711,577 | ) | $ | (9,571,030 | ) | $ | 3,646,424 | (b) | $ | 3,902,950 | $ | 175,448,708 | |||||||||||||||||
OTHER ASSETS LESS LIABILITIES | (0.12 | )% | (200,708 | ) | ||||||||||||||||||||||||||||||||
NET ASSETS | 100.00 | % | $ | 175,248,000 | ||||||||||||||||||||||||||||||||
Investment Abbreviations:
ETF – Exchange Traded Fund
Notes to Schedule of Investments:
| (a) | Each underlying fund and the Fund are affiliated by either having the same investment adviser or an investment adviser under common control with the Fund’s investment adviser. The Fund invests in Class R6 shares of the mutual funds listed and the Fund shares of the exchange-traded fund. |
| (b) | Includes $136,516, $2,441,264, $1,292,453 and $1,343,659 of capital gains from affiliated underlying funds for Invesco Developing Markets Fund, Invesco International Core Equity Fund, Invesco International Growth Fund and Invesco International Small Company Fund, respectively. |
See accompanying Notes to Financial Statements which are an integral part of the financial statements.
10 Invesco International Allocation Fund
Statement of Assets and Liabilities
December 31, 2014
Assets: |
| |||
Investments in affiliated underlying funds, at value | $ | 175,448,708 | ||
Receivable for: | ||||
Investments sold — affiliated underlying funds | 516,407 | |||
Fund shares sold | 92,141 | |||
Dividends from affiliated underlying funds | 28 | |||
Investment for trustee deferred compensation and retirement plans | 57,211 | |||
Other assets | 30,483 | |||
Total assets | 176,144,978 | |||
Liabilities: |
| |||
Payable for: | ||||
Fund shares reacquired | 641,485 | |||
Accrued fees to affiliates | 162,178 | |||
Accrued trustees’ and officers’ fees and benefits | 355 | |||
Accrued other operating expenses | 29,027 | |||
Trustee deferred compensation and retirement plans | 63,933 | |||
Total liabilities | 896,978 | |||
Net assets applicable to shares outstanding | $ | 175,248,000 | ||
Net assets consist of: |
| |||
Shares of beneficial interest | $ | 262,041,898 | ||
Undistributed net investment income | (59,729 | ) | ||
Undistributed net realized gain (loss) | (94,332,084 | ) | ||
Net unrealized appreciation | 7,597,915 | |||
| $ | 175,248,000 | |||
Net Assets: |
| |||
Class A | $ | 128,451,784 | ||
Class B | $ | 5,275,798 | ||
Class C | $ | 27,873,755 | ||
Class R | $ | 6,259,711 | ||
Class Y | $ | 7,345,192 | ||
Class R5 | $ | 41,760 | ||
Shares outstanding, $0.01 par value per share, |
| |||
Class A | 12,017,497 | |||
Class B | 493,323 | |||
Class C | 2,607,186 | |||
Class R | 585,447 | |||
Class Y | 689,595 | |||
Class R5 | 3,909 | |||
Class A: | ||||
Net asset value per share | $ | 10.69 | ||
Maximum offering price per share | ||||
(Net asset value of $10.69 ¸ 94.50%) | $ | 11.31 | ||
Class B: | ||||
Net asset value and offering price per share | $ | 10.69 | ||
Class C: | ||||
Net asset value and offering price per share | $ | 10.69 | ||
Class R: | ||||
Net asset value and offering price per share | $ | 10.69 | ||
Class Y: | ||||
Net asset value and offering price per share | $ | 10.65 | ||
Class R5: | ||||
Net asset value and offering price per share | $ | 10.68 | ||
See accompanying Notes to Financial Statements which are an integral part of the financial statements.
11 Invesco International Allocation Fund
Statement of Operations
For the year ended December 31, 2014
Investment income: |
| |||
Dividends from affiliated underlying funds | $ | 3,902,950 | ||
Other Income | 3,479 | |||
Total investment income | 3,906,429 | |||
Expenses: | ||||
Administrative services fees | 50,000 | |||
Custodian fees | 7,671 | |||
Distribution fees: | ||||
Class A | 339,696 | |||
Class B | 73,350 | |||
Class C | 298,377 | |||
Class R | 33,060 | |||
Transfer agent fees — A, B, C, R and Y | 466,270 | |||
Transfer agent fees — R5 | 187 | |||
Trustees’ and officers’ fees and benefits | 25,864 | |||
Registration and filing fees | 78,736 | |||
Other | 86,837 | |||
Total expenses | 1,460,048 | |||
Less: Expense offset arrangement(s) | (1,338 | ) | ||
Net expenses | 1,458,710 | |||
Net investment income | 2,447,719 | |||
Realized and unrealized gain (loss) from: | ||||
Net realized gain (loss) on sales of affiliated underlying fund shares | (1,567,468 | ) | ||
Net realized gain from distributions of affiliated underlying fund shares | 5,213,892 | |||
| 3,646,424 | ||||
Change in net unrealized appreciation (depreciation) of affiliated underlying fund shares | (9,571,030 | ) | ||
Net gain (loss) from affiliated underlying funds | (5,924,606 | ) | ||
Net increase (decrease) in net assets resulting from operations | $ | (3,476,887 | ) | |
See accompanying Notes to Financial Statements which are an integral part of the financial statements.
12 Invesco International Allocation Fund
Statement of Changes in Net Assets
For the years ended December 31, 2014 and 2013
| 2014 | 2013 | |||||||
Operations: |
| |||||||
Net investment income | $ | 2,447,719 | $ | 2,179,906 | ||||
Net realized gain (loss) | 3,646,424 | (2,279,062 | ) | |||||
Change in net unrealized appreciation (depreciation) | (9,571,030 | ) | 21,998,312 | |||||
Net increase (decrease) in net assets resulting from operations | (3,476,887 | ) | 21,899,156 | |||||
Distributions to shareholders from net investment income: | ||||||||
Class A | (2,138,432 | ) | (1,919,174 | ) | ||||
Class B | (46,784 | ) | (64,632 | ) | ||||
Class C | (234,570 | ) | (214,028 | ) | ||||
Class R | (90,024 | ) | (75,910 | ) | ||||
Class Y | (133,497 | ) | (132,984 | ) | ||||
Class R5 | (5,178 | ) | (21,908 | ) | ||||
Total distributions from net investment income | (2,648,485 | ) | (2,428,636 | ) | ||||
Share transactions–net: | ||||||||
Class A | (3,146,300 | ) | (3,401,253 | ) | ||||
Class B | (3,544,461 | ) | (2,661,470 | ) | ||||
Class C | (1,375,399 | ) | (728,178 | ) | ||||
Class R | 70,103 | 213,760 | ||||||
Class Y | (306,337 | ) | 425,840 | |||||
Class R5 | (1,152,871 | ) | 849,993 | |||||
Net increase (decrease) in net assets resulting from share transactions | (9,455,265 | ) | (5,301,308 | ) | ||||
Net increase (decrease) in net assets | (15,580,637 | ) | 14,169,212 | |||||
Net assets: | ||||||||
Beginning of year | 190,828,637 | 176,659,425 | ||||||
End of year (includes undistributed net investment income of $(59,729) and $(55,799), respectively) | $ | 175,248,000 | $ | 190,828,637 | ||||
Notes to Financial Statements
December 31, 2014
NOTE 1—Significant Accounting Policies
Invesco International Allocation Fund (the “Fund”) is a series portfolio of AIM Growth Series (Invesco Growth Series) (the “Trust”). The Trust is organized as a Delaware statutory trust and is registered under the Investment Company Act of 1940, as amended (the “1940 Act”), as an open-end series management investment company consisting of seventeen separate series portfolios, each authorized to issue an unlimited number of shares of beneficial interest. The assets, liabilities and operations of each portfolio are accounted for separately. Information presented in these financial statements pertains only to the Fund. Matters affecting each portfolio or class will be voted on exclusively by the shareholders of such portfolio or class.
The Fund’s investment objective is to provide long-term growth of capital.
The Fund is a “fund of funds,” in that it invests in other mutual funds (“underlying funds”) advised by Invesco Advisers, Inc. (“Invesco”) and exchange traded funds advised by Invesco PowerShares Capital Management LLC (“PowerShares Capital”), an affiliate of Invesco. Invesco and PowerShares Capital are affiliates of each other as they are indirect, wholly-owned subsidiaries of Invesco Ltd. Invesco may change the Fund’s asset class allocations, the underlying funds or target weightings in the underlying funds without shareholder approval. The underlying funds may engage in a number of investment techniques and practices, which involve certain risks. Each underlying fund’s accounting policies are outlined in the underlying fund’s financial statements and are publically available.
The Fund currently consists of six different classes of shares: Class A, Class B, Class C, Class R, Class Y and Class R5. Class A shares are sold with a front-end sales charge unless certain waiver criteria are met and under certain circumstances load waived shares may be subject to contingent deferred sales charges (“CDSC”). Class C shares are sold with a CDSC. Class R, Class Y and Class R5 shares are sold at net asset value. Effective November 30, 2010, new or additional investments in Class B shares are no longer permitted. Existing shareholders of Class B shares may continue to reinvest dividends and capital gains distributions in Class B shares until they convert to Class A shares. Also, shareholders in Class B shares will be able to exchange those shares for Class B shares of other Invesco Funds offering such shares until they convert to Class A shares. Generally, Class B shares will automatically convert to Class A shares on or about the month-end, which is at least eight years after the date of purchase. Redemption of Class B shares prior to the conversion date will be subject to a CDSC.
13 Invesco International Allocation Fund
The following is a summary of the significant accounting policies followed by the Fund in the preparation of its financial statements.
| A. | Security Valuations — Securities of investment companies that trade on an exchange are valued at the last sales price or official closing price as of the close of the customary trading session on the exchange where the security is principally traded. Investments in shares of funds that are not traded on an exchange are valued at the end of day net asset value per share of such fund. Securities in the underlying funds, including restricted securities, are valued in accordance with the valuation policy of such fund. The policies of the underlying funds affiliated with the Fund as a result of having the same investment adviser are set forth below. |
A security listed or traded on an exchange (except convertible securities) is valued at its last sales price or official closing price as of the close of the customary trading session on the exchange where the security is principally traded, or lacking any sales or official closing price on a particular day, the security may be valued at the closing bid price on that day. Securities traded in the over-the-counter market are valued based on prices furnished by independent pricing services or market makers. When such securities are valued by an independent pricing service they may be considered fair valued. Futures contracts are valued at the final settlement price set by an exchange on which they are principally traded. Listed options are valued at the mean between the last bid and ask prices from the exchange on which they are principally traded. Options not listed on an exchange are valued by an independent source at the mean between the last bid and ask prices. For purposes of determining net asset value per share, futures and option contracts generally are valued 15 minutes after the close of the customary trading session of the New York Stock Exchange (“NYSE”).
Investments in open-end and closed-end registered investment companies that do not trade on an exchange are valued at the end of day net asset value per share. Investments in open-end and closed-end registered investment companies that trade on an exchange are valued at the last sales price or official closing price as of the close of the customary trading session on the exchange where the security is principally traded.
Debt obligations (including convertible securities) and unlisted equities are fair valued using an evaluated quote provided by an independent pricing service. Evaluated quotes provided by the pricing service may be determined without exclusive reliance on quoted prices, and may reflect appropriate factors such as institution-size trading in similar groups of securities, developments related to specific securities, dividend rate (for unlisted equities), yield (for debt obligations), quality, type of issue, coupon rate (for debt obligations), maturity (for debt obligations), individual trading characteristics and other market data. Debt obligations are subject to interest rate and credit risks. In addition, all debt obligations involve some risk of default with respect to interest and/or principal payments.
Foreign securities’ (including foreign exchange contracts) prices are converted into U.S. dollar amounts using the applicable exchange rates as of the close of the NYSE. If market quotations are available and reliable for foreign exchange-traded equity securities, the securities will be valued at the market quotations. Because trading hours for certain foreign securities end before the close of the NYSE, closing market quotations may become unreliable. If between the time trading ends on a particular security and the close of the customary trading session on the NYSE, events occur that the Adviser determines are significant and make the closing price unreliable, the Fund may fair value the security. If the event is likely to have affected the closing price of the security, the security will be valued at fair value in good faith using procedures approved by the Board of Trustees. Adjustments to closing prices to reflect fair value may also be based on a screening process of an independent pricing service to indicate the degree of certainty, based on historical data, that the closing price in the principal market where a foreign security trades is not the current value as of the close of the NYSE. Foreign securities’ prices meeting the approved degree of certainty that the price is not reflective of current value will be priced at the indication of fair value from the independent pricing service. Multiple factors may be considered by the independent pricing service in determining adjustments to reflect fair value and may include information relating to sector indices, American Depositary Receipts and domestic and foreign index futures. Foreign securities may have additional risks including exchange rate changes, potential for sharply devalued currencies and high inflation, political and economic upheaval, the relative lack of issuer information, relatively low market liquidity and the potential lack of strict financial and accounting controls and standards.
Securities for which market prices are not provided by any of the above methods may be valued based upon quotes furnished by independent sources. The last bid price may be used to value equity securities. The mean between the last bid and ask prices is used to value debt obligations, including corporate loans.
Securities for which market quotations are not readily available or became unreliable are valued at fair value as determined in good faith by or under the supervision of the Trust’s officers following procedures approved by the Board of Trustees. Issuer specific events, market trends, bid/ask quotes of brokers and information providers and other market data may be reviewed in the course of making a good faith determination of a security’s fair value.
The Fund may invest in securities that are subject to interest rate risk, meaning the risk that the prices will generally fall as interest rates rise and, conversely, the prices will generally rise as interest rates fall. Specific securities differ in their sensitivity to changes in interest rates depending on their individual characteristics. Changes in interest rates may result in increased market volatility, which may affect the value and/or liquidity of certain of the Fund’s investments.
Valuations change in response to many factors including the historical and prospective earnings of the issuer, the value of the issuer’s assets, general economic conditions, interest rates, investor perceptions and market liquidity. Because of the inherent uncertainties of valuation, the values reflected in the financial statements may materially differ from the value received upon actual sale of those investments.
| B. | Securities Transactions and Investment Income — Securities transactions are accounted for on a trade date basis. Realized gains or losses on sales are computed on the basis of specific identification of the securities sold. Distributions from ordinary income from underlying funds, if any, are recorded as dividend income on ex-dividend date. Distributions from gains from underlying funds, if any, are recorded as realized gains on the ex-dividend date. The following policies are followed by the underlying funds: Interest income (net of withholding tax, if any) is recorded on the accrual basis from settlement date. Bond premiums and discounts are amortized and/or accreted for financial reporting purposes. Paydown gains and losses on mortgage and asset-backed securities are recorded as adjustments to interest income. |
The Fund allocates income and realized and unrealized capital gains and losses to a class based on the relative net assets of each class.
| C. | Distributions — Distributions from net investment income and net realized capital gain, if any, are generally declared and paid annually and recorded on the ex-dividend date. The Fund may elect to treat a portion of the proceeds from redemptions as distributions for federal income tax purposes. |
| D. | Federal Income Taxes — The Fund intends to comply with the requirements of Subchapter M of the Internal Revenue Code of 1986, as amended (the “Internal Revenue Code”), necessary to qualify as a regulated investment company and to distribute substantially all of the Fund’s |
14 Invesco International Allocation Fund
| taxable earnings to shareholders. As such, the Fund will not be subject to federal income taxes on otherwise taxable income (including net realized capital gain) that is distributed to shareholders. Therefore, no provision for federal income taxes is recorded in the financial statements. |
The Fund recognizes the tax benefits of uncertain tax positions only when the position is more likely than not to be sustained. Management has analyzed the Fund’s uncertain tax positions and concluded that no liability for unrecognized tax benefits should be recorded related to uncertain tax positions. Management is not aware of any tax positions for which it is reasonably possible that the total amounts of unrecognized tax benefits will change materially in the next 12 months.
The Fund files tax returns in the U.S. Federal jurisdiction and certain other jurisdictions. Generally, the Fund is subject to examinations by such taxing authorities for up to three years after the filing of the return for the tax period.
| E. | Expenses — Expenses included in the accompanying financial statements reflect the expenses of the Fund and do not include any expenses of the underlying funds. The effects of the underlying funds expenses are included in the realized and unrealized gain/loss on the investments in the underlying funds. Estimated expenses of the underlying funds are discussed further within Note 11. |
Fees provided for under the Rule 12b-1 plan of a particular class of the Fund and which are directly attributable to that class are charged to the operations of such class. Transfer agency fees and expenses and other shareholder recordkeeping fees and expenses attributable to Class R5 are charged to such class. Transfer agency fees and expenses and other shareholder recordkeeping fees and expenses relating to all other classes are allocated among those classes based on relative net assets. All other expenses are allocated among the classes based on relative net assets.
| F. | Accounting Estimates — The preparation of financial statements in conformity with accounting principles generally accepted in the United States of America (“GAAP”) requires management to make estimates and assumptions that affect the reported amounts of assets and liabilities at the date of the financial statements and the reported amounts of revenues and expenses during the reporting period including estimates and assumptions related to taxation. Actual results could differ from those estimates by a significant amount. In addition, the Fund monitors for material events or transactions that may occur or become known after the period-end date and before the date the financial statements are released to print. |
| G. | Indemnifications — Under the Trust’s organizational documents, each Trustee, officer, employee or other agent of the Trust is indemnified against certain liabilities that may arise out of the performance of their duties to the Fund. Additionally, in the normal course of business, the Fund enters into contracts, including the Fund’s servicing agreements, that contain a variety of indemnification clauses. The Fund’s maximum exposure under these arrangements is unknown as this would involve future claims that may be made against the Fund that have not yet occurred. The risk of material loss as a result of such indemnification claims is considered remote. |
NOTE 2—Advisory Fees and Other Fees Paid to Affiliates
The Trust has entered into a master investment advisory agreement with Invesco. Under the terms of the investment advisory agreement, the Fund does not pay an advisory fee. However, the Fund pays advisory fees to Invesco indirectly as a shareholder of the underlying funds.
Under the terms of a master sub-advisory agreement between the Adviser and each of Invesco Asset Management Deutschland GmbH, Invesco Asset Management Limited, Invesco Asset Management (Japan) Limited, Invesco Australia Limited, Invesco Hong Kong Limited, Invesco Senior Secured Management, Inc. and Invesco Canada Ltd. (collectively, the “Affiliated Sub-Advisers”) the Adviser, not the Fund, may pay 40% of the fees paid to the Adviser to any such Affiliated Sub-Adviser(s) that provide(s) discretionary investment management services to the Fund based on the percentage of assets allocated to such Sub-Adviser(s).
The Adviser has contractually agreed, through at least June 30, 2015, to reimburse expenses of all shares to the extent necessary to limit total annual fund operating expenses after expene reimbursement (excluding certain items discussed below) of Class A, Class B, Class C, Class R, Class Y and Class R5 shares to 2.25%, 3.00%, 3.00%, 2.50%, 2.00% and 2.00%, respectively, of average daily net assets. In determining the Adviser’s obligation to reimburse expenses, the following expenses are not taken into account, and could cause the total annual fund operating expenses after expense reimbursement to exceed the numbers reflected above: (1) interest; (2) taxes; (3) dividend expense on short sales; (4) extraordinary or non-routine items, including litigation expenses; and (5) expenses that the Fund has incurred but did not actually pay because of an expense offset arrangement. Acquired Fund Fees and Expenses are not operating expenses of a Fund directly, but are fees and expenses, including management fees of the investment companies in which a Fund invests. As a result, the total annual fund operating expenses after expense reimbursement may exceed the expense limits above. Unless Invesco continues the fee waiver agreement, it will terminate on June 30, 2015. The fee waiver agreement cannot be terminated during its term. The Adviser did not waive fees and/or reimburse expenses during the period under this expense limitation.
The Trust has entered into a master administrative services agreement with Invesco pursuant to which the Fund has agreed to pay Invesco for certain administrative costs incurred in providing accounting services to the Fund. For the year ended December 31, 2014, expenses incurred under the agreement are shown in the Statement of Operations as Administrative services fees.
The Trust has entered into a transfer agency and service agreement with Invesco Investment Services, Inc. (“IIS”) pursuant to which the Fund has agreed to pay IIS a fee for providing transfer agency and shareholder services to the Fund and reimburse IIS for certain expenses incurred by IIS in the course of providing such services. IIS may make payments to intermediaries that provide omnibus account services, sub-accounting services and/or networking services. All fees payable by IIS to intermediaries that provide omnibus account services or sub-accounting are charged back to the Fund, subject to certain limitations approved by the Trust’s Board of Trustees. For the year ended December 31, 2014, expenses incurred under the agreement are shown in the Statement of Operations as Transfer agent fees.
The Trust has entered into master distribution agreements with Invesco Distributors, Inc. (“IDI”) to serve as the distributor for the Class A, Class B, Class C, Class R, Class Y and Class R5 shares of the Fund. The Trust has adopted plans pursuant to Rule 12b-1 under the 1940 Act with respect to the Fund’s Class A, Class B, Class C and Class R shares (collectively, the “Plans”). The Fund, pursuant to the Plans, pays IDI compensation at the annual rate of 0.25% of the Fund’s average daily net assets of Class A shares, 1.00% of the average daily net assets of Class B and Class C shares and 0.50% of the average daily net assets of Class R shares. Of the Plan payments, up to 0.25% of the average daily net assets of each class of shares may be paid to furnish continuing personal shareholder services to customers who purchase and own shares of such classes. Any amounts not paid as a service fee under the Plans would constitute an asset-based sales charge. Rules of the Financial Industry Regulatory Authority (“FINRA”) impose a cap on the total sales charges, including asset-based sales charges, that may be paid by any class of shares of the Fund. For the year ended December 31, 2014, expenses incurred under the Plans are shown in the Statement of Operations as Distribution fees.
15 Invesco International Allocation Fund
Front-end sales commissions and CDSC (collectively, the “sales charges”) are not recorded as expenses of the Fund. Front-end sales commissions are deducted from proceeds from the sales of Fund shares prior to investment in Class A shares of the Fund. CDSC are deducted from redemption proceeds prior to remittance to the shareholder. During the year ended December 31, 2014, IDI advised the Fund that IDI retained $40,150 in front-end sales commissions from the sale of Class A shares and $443, $2,357 and $1,104 from Class A, Class B and Class C shares, respectively, for CDSC imposed on redemptions by shareholders.
The underlying Invesco funds pay no distribution fees for Class R6 and the Fund pays no sales loads or other similar compensation to IDI for acquiring underlying fund shares.
Certain officers and trustees of the Trust are officers and directors of the Adviser, IIS and/or IDI.
NOTE 3—Additional Valuation Information
GAAP defines fair value as the price that would be received to sell an asset or paid to transfer a liability in an orderly transaction between market participants at the measurement date, under current market conditions. GAAP establishes a hierarchy that prioritizes the inputs to valuation methods, giving the highest priority to readily available unadjusted quoted prices in an active market for identical assets (Level 1) and the lowest priority to significant unobservable inputs (Level 3), generally when market prices are not readily available or are unreliable. Based on the valuation inputs, the securities or other investments are tiered into one of three levels. Changes in valuation methods may result in transfers in or out of an investment’s assigned level:
| Level 1 — | Prices are determined using quoted prices in an active market for identical assets. |
| Level 2 — | Prices are determined using other significant observable inputs. Observable inputs are inputs that other market participants may use in pricing a security. These may include quoted prices for similar securities, interest rates, prepayment speeds, credit risk, yield curves, loss severities, default rates, discount rates, volatilities and others. |
| Level 3 — | Prices are determined using significant unobservable inputs. In situations where quoted prices or observable inputs are unavailable (for example, when there is little or no market activity for an investment at the end of the period), unobservable inputs may be used. Unobservable inputs reflect the Fund’s own assumptions about the factors market participants would use in determining fair value of the securities or instruments and would be based on the best available information. |
As of December 31, 2014, all of the securities in this Fund were valued based on Level 1 inputs (see the Schedule of Investments for security categories). The level assigned to the securities valuations may not be an indication of the risk or liquidity associated with investing in those securities.
NOTE 4—Expense Offset Arrangement(s)
The expense offset arrangement is comprised of transfer agency credits which result from balances in demand deposit accounts used by the transfer agent for clearing shareholder transactions. For the year ended December 31, 2014, the Fund received credits from this arrangement, which resulted in the reduction of the Fund’s total expenses of $1,338.
NOTE 5—Trustees’ and Officers’ Fees and Benefits
Trustees’ and Officers’ Fees and Benefits include amounts accrued by the Fund to pay remuneration to certain Trustees and Officers of the Fund. Trustees have the option to defer compensation payable by the Fund, and Trustees’ and Officers’ Fees and Benefits also include amounts accrued by the Fund to fund such deferred compensation amounts. Those Trustees who defer compensation have the option to select various Invesco Funds in which their deferral accounts shall be deemed to be invested. Finally, certain current Trustees were eligible to participate in a retirement plan that provided for benefits to be paid upon retirement to Trustees over a period of time based on the number of years of service. The Fund may have certain former Trustees who also participate in a retirement plan and receive benefits under such plan. Trustees’ and Officers’ Fees and Benefits include amounts accrued by the Fund to fund such retirement benefits. Obligations under the deferred compensation and retirement plans represent unsecured claims against the general assets of the Fund.
NOTE 6—Cash Balances
The Fund is permitted to temporarily carry a negative or overdrawn balance in its account with State Street Bank and Trust Company, the custodian bank. Such balances, if any at period end, are shown in the Statement of Assets and Liabilities under the payable caption Amount due custodian. To compensate the custodian bank for such overdrafts, the overdrawn Fund may either (1) leave funds as a compensating balance in the account so the custodian bank can be compensated by earning the additional interest; or (2) compensate by paying the custodian bank at a rate agreed upon by the custodian bank and Invesco, not to exceed the contractually agreed upon rate.
16 Invesco International Allocation Fund
NOTE 7—Distributions to Shareholders and Tax Components of Net Assets
Tax Character of Distributions to Shareholders Paid During the Fiscal Years Ended December 31, 2014 and 2013:
| 2014 | 2013 | |||||||
Ordinary income | $ | 2,648,485 | $ | 2,428,636 | ||||
Tax Components of Net Assets at Period-End:
| 2014 | ||||
Net unrealized appreciation (depreciation) — investments | $ | (18,264,041 | ) | |
Temporary book/tax differences | (59,728 | ) | ||
Capital loss carryforward | (68,470,129 | ) | ||
Shares of beneficial interest | 262,041,898 | |||
Total net assets | $ | 175,248,000 | ||
The difference between book-basis and tax-basis unrealized appreciation (depreciation) is due to differences in the timing of recognition of gains and losses on investments for tax and book purposes. The Fund’s net unrealized appreciation (depreciation) difference is attributable primarily to wash sales.
The temporary book/tax differences are a result of timing differences between book and tax recognition of income and/or expenses. The Fund’s temporary book/tax differences are the result of the trustee deferral of compensation and retirement plan benefits.
Capital loss carryforward is calculated and reported as of a specific date. Results of transactions and other activity after that date may affect the amount of capital loss carryforward actually available for the Fund to utilize. Capital losses generated in years beginning after December 22, 2010 can be carried forward for an unlimited period, whereas previous losses expire in eight tax years. Capital losses with an expiration period may not be used to offset capital gains until all net capital losses without an expiration date have been utilized. Capital loss carryforwards with no expiration date will retain their character as either short-term or long-term capital losses instead of as short-term capital losses as under prior law. The ability to utilize capital loss carryforwards in the future may be limited under the Internal Revenue Code and related regulations based on the results of future transactions.
The Fund utilized $4,460,259 of capital loss carryforward in the current period to offset net realized capital gain for federal income tax purposes. The Fund has a capital loss carryforward as of December 31, 2014, which expires as follows:
| Capital Loss Carryforward* | ||||||||||||
| Expiration | Short-Term | Long-Term | Total | |||||||||
December 31, 2016 | $ | 27,122,541 | $ | — | $ | 27,122,541 | ||||||
December 31, 2017 | 23,283,288 | — | 23,283,288 | |||||||||
December 31, 2018 | 9,317,140 | — | 9,317,140 | |||||||||
Not subject to expiration | 257,564 | 8,489,596 | 8,747,160 | |||||||||
| $ | 59,980,533 | $ | 8,489,596 | $ | 68,470,129 | |||||||
| * | Capital loss carryforward as of the date listed above is reduced for limitations, if any, to the extent required by the Internal Revenue Code and may be further limited depending upon a variety of factors, including the realization of net unrealized gains or losses as of the date of any reorganization. |
NOTE 8—Investment Securities
The aggregate amount of investment securities (other than short-term securities, U.S. Treasury obligations and money market funds, if any) purchased and sold by the Fund during the year ended December 31, 2014 was $22,621,546 and $27,138,793, respectively. Cost of investments on a tax basis includes the adjustments for financial reporting purposes as of the most recently completed federal income tax reporting period-end.
| Unrealized Appreciation (Depreciation) of Investment Securities on a Tax Basis | ||||
Aggregate unrealized appreciation of investment securities | $ | 11,745,598 | ||
Aggregate unrealized (depreciation) of investment securities | (30,009,639 | ) | ||
Net unrealized appreciation (depreciation) of investment securities | $ | (18,264,041 | ) | |
Cost of investments for tax purposes is $193,712,749.
NOTE 9—Reclassification of Permanent Differences
Primarily as a result of differing book/tax treatment of distributions from underlying funds, on December 31, 2014, undistributed net investment income was increased by $196,836, undistributed net realized gain (loss) was decreased by $186,831 and shares of beneficial interest was decreased by $10,005. This reclassification had no effect on the net assets of the Fund.
17 Invesco International Allocation Fund
NOTE 10—Share Information
| Summary of Share Activity | ||||||||||||||||
| Years ended December 31, | ||||||||||||||||
| 2014(a) | 2013 | |||||||||||||||
| Shares | Amount | Shares | Amount | |||||||||||||
Sold: | ||||||||||||||||
Class A | 1,961,296 | $ | 21,922,387 | 2,386,055 | $ | 24,928,583 | ||||||||||
Class B | 17,676 | 199,727 | 47,633 | 493,815 | ||||||||||||
Class C | 437,812 | 4,889,538 | 483,201 | 5,072,727 | ||||||||||||
Class R | 146,752 | 1,640,369 | 206,214 | 2,125,929 | ||||||||||||
Class Y | 229,043 | 2,568,918 | 235,753 | 2,439,778 | ||||||||||||
Class R5 | 3,422 | 38,309 | 81,932 | 872,718 | ||||||||||||
Issued as reinvestment of dividends: | ||||||||||||||||
Class A | 187,034 | 1,961,988 | 163,169 | 1,752,423 | ||||||||||||
Class B | 4,158 | 43,657 | 5,622 | 60,328 | ||||||||||||
Class C | 20,252 | 212,646 | 18,500 | 198,509 | ||||||||||||
Class R | 8,565 | 89,931 | 7,056 | 75,786 | ||||||||||||
Class Y | 8,471 | 88,603 | 8,016 | 85,776 | ||||||||||||
Class R5 | 416 | 4,366 | 1,946 | 20,902 | ||||||||||||
Automatic conversion of Class B shares to Class A shares: | ||||||||||||||||
Class A | 208,510 | 2,334,929 | 94,120 | 983,537 | ||||||||||||
Class B | (209,218 | ) | (2,334,929 | ) | (94,452 | ) | (983,537 | ) | ||||||||
Reacquired: | ||||||||||||||||
Class A | (2,634,192 | ) | (29,365,604 | ) | (2,976,760 | ) | (31,065,796 | ) | ||||||||
Class B | (130,631 | ) | (1,452,916 | ) | (214,440 | ) | (2,232,076 | ) | ||||||||
Class C | (585,471 | ) | (6,477,583 | ) | (577,384 | ) | (5,999,414 | ) | ||||||||
Class R | (149,297 | ) | (1,660,197 | ) | (192,318 | ) | (1,987,955 | ) | ||||||||
Class Y | (269,507 | ) | (2,963,858 | ) | (201,475 | ) | (2,099,714 | ) | ||||||||
Class R5 | (107,255 | ) | (1,195,546 | ) | (4,094 | ) | (43,627 | ) | ||||||||
Net increase (decrease) in share activity | (852,164 | ) | $ | (9,455,265 | ) | (521,706 | ) | $ | (5,301,308 | ) | ||||||
| (a) | There are entities that are record owners of more than 5% of the outstanding shares of the Fund and in the aggregate own 38% of the outstanding shares of the Fund. IDI has an agreement with these entities to sell Fund shares. The Fund, Invesco and/or Invesco affiliates may make payments to these entities, which are considered to be related to the Fund, for providing services to the Fund, Invesco and/or Invesco affiliates including but not limited to services such as securities brokerage, distribution, third party record keeping and account servicing. The Fund has no knowledge as to whether all or any portion of the shares owned of record by these entities are also owned beneficially. |
18 Invesco International Allocation Fund
NOTE 11—Financial Highlights
The following schedule presents financial highlights for a share of the Fund outstanding throughout the periods indicated.
| Net asset value, beginning of period | Net investment income(a) | Net gains (losses) on securities (both realized and unrealized) | Total from investment operations | Dividends from net investment income | Net asset value, end of period(b) | Total return(c) | Net assets, end of period (000’s omitted) | Ratio of expenses to average net assets with fee waivers and/or expenses absorbed(d) | Ratio of expenses to average net assets without fee waivers and/or expenses absorbed | Ratio of net investment income to average net assets | Portfolio turnover(e) | |||||||||||||||||||||||||||||||||||||
Class A |
| |||||||||||||||||||||||||||||||||||||||||||||||
Year ended 12/31/14 | $ | 11.07 | $ | 0.16 | $ | (0.36 | ) | $ | (0.20 | ) | $ | (0.18 | ) | $ | 10.69 | (1.78 | )% | $ | 128,452 | 0.63 | %(f) | 0.63 | %(f) | 1.46 | %(f) | 12 | % | |||||||||||||||||||||
Year ended 12/31/13 | 9.94 | 0.14 | 1.15 | 1.29 | (0.16 | ) | 11.07 | 13.02 | 136,055 | 0.64 | 0.64 | 1.36 | 8 | |||||||||||||||||||||||||||||||||||
Year ended 12/31/12 | 9.07 | 0.14 | 1.09 | 1.23 | (0.36 | ) | 9.94 | 13.62 | 125,566 | 0.60 | 0.68 | 1.42 | 6 | |||||||||||||||||||||||||||||||||||
Year ended 12/31/11 | 10.10 | 0.20 | (1.07 | ) | (0.87 | ) | (0.16 | ) | 9.07 | (8.57 | ) | 123,677 | 0.43 | 0.66 | 1.97 | 11 | ||||||||||||||||||||||||||||||||
Year ended 12/31/10 | 9.20 | 0.14 | 0.96 | 1.10 | (0.20 | ) | 10.10 | 12.04 | 140,375 | 0.43 | 0.64 | 1.50 | 6 | |||||||||||||||||||||||||||||||||||
Class B |
| |||||||||||||||||||||||||||||||||||||||||||||||
Year ended 12/31/14 | 11.06 | 0.08 | (0.36 | ) | (0.28 | ) | (0.09 | ) | 10.69 | (2.52 | ) | 5,276 | 1.38 | (f) | 1.38 | (f) | 0.71 | (f) | 12 | |||||||||||||||||||||||||||||
Year ended 12/31/13 | 9.94 | 0.06 | 1.14 | 1.20 | (0.08 | ) | 11.06 | 12.09 | 8,974 | 1.39 | 1.39 | 0.61 | 8 | |||||||||||||||||||||||||||||||||||
Year ended 12/31/12 | 8.98 | 0.06 | 1.08 | 1.14 | (0.18 | ) | 9.94 | 12.78 | 10,606 | 1.35 | 1.43 | 0.67 | 6 | |||||||||||||||||||||||||||||||||||
Year ended 12/31/11 | 9.97 | 0.12 | (1.04 | ) | (0.92 | ) | (0.07 | ) | 8.98 | (9.21 | ) | 12,392 | 1.18 | 1.41 | 1.22 | 11 | ||||||||||||||||||||||||||||||||
Year ended 12/31/10 | 9.09 | 0.07 | 0.94 | 1.01 | (0.13 | ) | 9.97 | 11.18 | 17,336 | 1.18 | 1.39 | 0.75 | 6 | |||||||||||||||||||||||||||||||||||
Class C |
| |||||||||||||||||||||||||||||||||||||||||||||||
Year ended 12/31/14 | 11.06 | 0.08 | (0.36 | ) | (0.28 | ) | (0.09 | ) | 10.69 | (2.52 | ) | 27,874 | 1.38 | (f) | 1.38 | (f) | 0.71 | (f) | 12 | |||||||||||||||||||||||||||||
Year ended 12/31/13 | 9.94 | 0.06 | 1.14 | 1.20 | (0.08 | ) | 11.06 | 12.09 | 30,241 | 1.39 | 1.39 | 0.61 | 8 | |||||||||||||||||||||||||||||||||||
Year ended 12/31/12 | 8.98 | 0.06 | 1.08 | 1.14 | (0.18 | ) | 9.94 | 12.78 | 27,929 | 1.35 | 1.43 | 0.67 | 6 | |||||||||||||||||||||||||||||||||||
Year ended 12/31/11 | 9.97 | 0.12 | (1.04 | ) | (0.92 | ) | (0.07 | ) | 8.98 | (9.21 | ) | 29,727 | 1.18 | 1.41 | 1.22 | 11 | ||||||||||||||||||||||||||||||||
Year ended 12/31/10 | 9.09 | 0.07 | 0.94 | 1.01 | (0.13 | ) | 9.97 | 11.18 | 40,020 | 1.18 | 1.39 | 0.75 | 6 | |||||||||||||||||||||||||||||||||||
Class R |
| |||||||||||||||||||||||||||||||||||||||||||||||
Year ended 12/31/14 | 11.07 | 0.14 | (0.37 | ) | (0.23 | ) | (0.15 | ) | 10.69 | (2.05 | ) | 6,260 | 0.88 | (f) | 0.88 | (f) | 1.21 | (f) | 12 | |||||||||||||||||||||||||||||
Year ended 12/31/13 | 9.94 | 0.12 | 1.14 | 1.26 | (0.13 | ) | 11.07 | 12.74 | 6,412 | 0.89 | 0.89 | 1.11 | 8 | |||||||||||||||||||||||||||||||||||
Year ended 12/31/12 | 9.04 | 0.11 | 1.09 | 1.20 | (0.30 | ) | 9.94 | 13.35 | 5,554 | 0.85 | 0.93 | 1.17 | 6 | |||||||||||||||||||||||||||||||||||
Year ended 12/31/11 | 10.06 | 0.17 | (1.06 | ) | (0.89 | ) | (0.13 | ) | 9.04 | (8.81 | ) | 4,929 | 0.68 | 0.91 | 1.72 | 11 | ||||||||||||||||||||||||||||||||
Year ended 12/31/10 | 9.16 | 0.12 | 0.96 | 1.08 | (0.18 | ) | 10.06 | 11.84 | 5,679 | 0.68 | 0.89 | 1.25 | 6 | |||||||||||||||||||||||||||||||||||
Class Y |
| |||||||||||||||||||||||||||||||||||||||||||||||
Year ended 12/31/14 | 11.03 | 0.19 | (0.36 | ) | (0.17 | ) | (0.21 | ) | 10.65 | (1.52 | ) | 7,345 | 0.38 | (f) | 0.38 | (f) | 1.71 | (f) | 12 | |||||||||||||||||||||||||||||
Year ended 12/31/13 | 9.91 | 0.17 | 1.13 | 1.30 | (0.18 | ) | 11.03 | 13.23 | 7,959 | 0.39 | 0.39 | 1.61 | 8 | |||||||||||||||||||||||||||||||||||
Year ended 12/31/12 | 9.07 | 0.16 | 1.09 | 1.25 | (0.41 | ) | 9.91 | 13.90 | 6,732 | 0.35 | 0.43 | 1.67 | 6 | |||||||||||||||||||||||||||||||||||
Year ended 12/31/11 | 10.10 | 0.22 | (1.06 | ) | (0.84 | ) | (0.19 | ) | 9.07 | (8.30 | ) | 4,396 | 0.18 | 0.41 | 2.22 | 11 | ||||||||||||||||||||||||||||||||
Year ended 12/31/10 | 9.20 | 0.16 | 0.97 | 1.13 | (0.23 | ) | 10.10 | 12.29 | 4,965 | 0.18 | 0.39 | 1.75 | 6 | |||||||||||||||||||||||||||||||||||
Class R5 |
| |||||||||||||||||||||||||||||||||||||||||||||||
Year ended 12/31/14 | 11.07 | 0.23 | (0.38 | ) | (0.15 | ) | (0.24 | ) | 10.68 | (1.35 | ) | 42 | 0.17 | (f) | 0.17 | (f) | 1.92 | (f) | 12 | |||||||||||||||||||||||||||||
Year ended 12/31/13 | 9.94 | 0.19 | 1.15 | 1.34 | (0.21 | ) | 11.07 | 13.52 | 1,188 | 0.18 | 0.18 | 1.82 | 8 | |||||||||||||||||||||||||||||||||||
Year ended 12/31/12 | 9.10 | 0.17 | 1.11 | 1.28 | (0.44 | ) | 9.94 | 14.09 | 274 | 0.21 | 0.22 | 1.81 | 6 | |||||||||||||||||||||||||||||||||||
Year ended 12/31/11 | 10.16 | 0.22 | (1.09 | ) | (0.87 | ) | (0.19 | ) | 9.10 | (8.52 | ) | 177 | 0.18 | 0.22 | 2.22 | 11 | ||||||||||||||||||||||||||||||||
Year ended 12/31/10 | 9.23 | 0.17 | 0.99 | 1.16 | (0.23 | ) | 10.16 | 12.59 | 89 | 0.16 | 0.16 | 1.77 | 6 | |||||||||||||||||||||||||||||||||||
| (a) | Calculated using average shares outstanding. |
| (b) | Includes redemption fees added to shares of beneficial interest which were less than $0.005 per share for fiscal years ended December 31, 2011 and prior. |
| (c) | Includes adjustments in accordance with accounting principles generally accepted in the United States of America and as such, the net asset value for financial reporting purposes and the returns based upon those net asset values may differ from the net asset value and returns for shareholder transactions. Does not include sales charges and is not annualized for periods less than one year, if applicable. |
| (d) | In addition to the fees and expenses which the Fund bears directly; the Fund indirectly bears a pro rata share of the fees and expenses of the underlying funds in which the Fund invests. Because the underlying funds have varied expenses and fee levels and the Fund may own different proportions at different times, the amount of fees and expenses incurred indirectly by the Fund will vary. Estimated underlying fund expenses are not expenses that are incurred directly by your Fund. They are expenses that are incurred directly by the underlying funds and are deducted from the value of the funds your Fund invests in. The effect of the estimated underlying fund expenses that you bear indirectly is included in your Fund’s total return. Estimated acquired fund fees from underlying funds were 0.88%, 0.88%, 0.88%, 0.88% and 0.88% for the years ended December 31, 2014, December 31, 2013, December 31, 2012, December 31, 2011 and December 31, 2010, respectively. |
| (e) | Portfolio turnover is calculated at the fund level and is not annualized for periods less than one year, if applicable. |
| (f) | Ratios are based on average daily net assets (000’s omitted) of $135,879, $7,335, $29,838, $6,612, $6,881 and $512, for Class A, Class B, Class C, Class R, Class Y and Class R5 shares, respectively. |
19 Invesco International Allocation Fund
Report of Independent Registered Public Accounting Firm
To the Board of Trustees of AIM Growth Series (Invesco Growth Series)
and Shareholders of Invesco International Allocation Fund:
In our opinion, the accompanying statement of assets and liabilities, including the schedule of investments, and the related statements of operations and of changes in net assets and the financial highlights present fairly, in all material respects, the financial position of Invesco International Allocation Fund (one of the funds constituting AIM Growth Series (Invesco Growth Series), hereafter referred to as the “Fund”) at December 31, 2014, the results of its operations for the year then ended, the changes in its net assets for each of the two years in the period then ended and the financial highlights for each of the five years in the period then ended, in conformity with accounting principles generally accepted in the United States of America. These financial statements and financial highlights (hereafter referred to as “financial statements”) are the responsibility of the Fund’s management. Our responsibility is to express an opinion on these financial statements based on our audits. We conducted our audits of these financial statements in accordance with the standards of the Public Company Accounting Oversight Board (United States). Those standards require that we plan and perform the audit to obtain reasonable assurance about whether the financial statements are free of material misstatement. An audit includes examining, on a test basis, evidence supporting the amounts and disclosures in the financial statements, assessing the accounting principles used and significant estimates made by management, and evaluating the overall financial statement presentation. We believe that our audits, which included confirmation of securities at December 31, 2014 by correspondence with the custodian and transfer agent, provide a reasonable basis for our opinion.
PRICEWATERHOUSECOOPERS LLP
Houston, Texas
February 23, 2015
20 Invesco International Allocation Fund
Calculating your ongoing Fund expenses
Example
As a shareholder of the Fund, you incur two types of costs: (1) transaction costs, which may include sales charges (loads) on purchase payments or contingent deferred sales charges on redemptions, if any; and (2) ongoing costs, including distribution and/or service (12b-1) fees, and other Fund expenses. This example is intended to help you understand your ongoing costs (in dollars) of investing in the Fund and to compare these costs with ongoing costs of investing in other mutual funds. The example is based on an investment of $1,000 invested at the beginning of the period and held for the entire period July 1, 2014, through December 31, 2014.
In addition to the fees and expenses which the Fund bears directly, the Fund indirectly bears a pro rata share of the fees and expenses of the underlying funds in which your Fund invests. The amount of fees and expenses incurred indirectly by your Fund will vary because the underlying funds have varied expenses and fee levels and the Fund may own different proportions of the underlying funds at different times. Estimated underlying fund expenses are not expenses that are incurred directly by your Fund. They are expenses that are incurred directly by the underlying funds and are deducted from the value of the underlying funds your Fund invests in. The effect of the estimated underlying fund expenses that you bear indirectly are included in your Fund’s total return.
Actual expenses
The table below provides information about actual account values and actual expenses. You may use the information in this table, together with the amount you invested, to estimate the expenses that you paid over the period. Simply divide your account value by $1,000 (for example, an $8,600 account value divided by $1,000 = 8.6), then multiply the result by the number in the table under the heading entitled “Actual Expenses Paid During Period” to estimate the expenses you paid on your account during this period.
Hypothetical example for comparison purposes
The table below also provides information about hypothetical account values and hypothetical expenses based on the Fund’s actual expense ratio and an assumed rate of return of 5% per year before expenses, which is not the Fund’s actual return.
The hypothetical account values and expenses may not be used to estimate the actual ending account balance or expenses you paid for the period. You may use this information to compare the ongoing costs of investing in the Fund and other funds. To do so, compare this 5% hypothetical example with the 5% hypothetical examples that appear in the shareholder reports of the other funds.
Please note that the expenses shown in the table are meant to highlight your ongoing costs only and do not reflect any transaction costs, such as sales charges (loads) on purchase payments or contingent deferred sales charges on redemptions, if any. Therefore, the hypothetical information is useful in comparing ongoing costs only, and will not help you determine the relative total costs of owning different funds. In addition, expenses shown in the table do not include the expenses of the underlying funds, which are borne indirectly by the Fund. If transaction costs and indirect expenses were included, your costs would have been higher.
| Class | Beginning Account Value (07/01/14) | ACTUAL | HYPOTHETICAL (5% annual return before expenses) | Annualized Expense Ratio | ||||||||||||||||||||
| Ending Account Value (12/31/14)1 | Expenses Paid During Period2 | Ending Account Value (12/31/14) | Expenses Paid During Period2 | |||||||||||||||||||||
| A | $ | 1,000.00 | $ | 923.00 | $ | 3.01 | $ | 1,022.08 | $ | 3.16 | 0.62 | % | ||||||||||||
| B | 1,000.00 | 919.10 | 6.63 | 1,018.30 | 6.97 | 1.37 | ||||||||||||||||||
| C | 1,000.00 | 919.90 | 6.63 | 1,018.30 | 6.97 | 1.37 | ||||||||||||||||||
| R | 1,000.00 | 922.00 | 4.21 | 1,020.82 | 4.43 | 0.87 | ||||||||||||||||||
| Y | 1,000.00 | 924.40 | 1.79 | 1,023.34 | 1.89 | 0.37 | ||||||||||||||||||
| R5 | 1,000.00 | 925.40 | 0.78 | 1,024.40 | 0.82 | 0.16 | ||||||||||||||||||
| 1 | The actual ending account value is based on the actual total return of the Fund for the period July 1, 2014 through December 31, 2014, after actual expenses and will differ from the hypothetical ending account value which is based on the Fund’s expense ratio and a hypothetical annual return of 5% before expenses. |
| 2 | Expenses are equal to the Fund’s annualized expense ratio as indicated above multiplied by the average account value over the period, multiplied by 184/365 to reflect the most recent fiscal half year. |
21 Invesco International Allocation Fund
Tax Information
Form 1099-DIV, Form 1042-S and other year–end tax information provide shareholders with actual calendar year amounts that should be included in their tax returns. Shareholders should consult their tax advisors.
The following distribution information is being provided as required by the Internal Revenue Code or to meet a specific state’s requirement.
The Fund designates the following amounts or, if subsequently determined to be different, the maximum amount allowable for its fiscal year ended December 31, 2014:
Federal and State Income Tax | ||||
Qualified Dividend Income* | 100 | % | ||
Corporate Dividends Received Deduction* | 0 | % | ||
U.S. Treasury Obligations* | 0 | % | ||
| * | The above percentages are based on ordinary income dividends paid to shareholders during the Fund’s fiscal year. |
22 Invesco International Allocation Fund
Trustees and Officers
The address of each trustee and officer is AIM Growth Series (Invesco Growth Series) (the “Trust”), 11 Greenway Plaza, Suite 1000, Houston, Texas 77046-1173. The trustees serve for the life of the Trust, subject to their earlier death, incapacitation, resignation, retirement or removal as more specifically provided in the Trust’s organizational documents. Each officer serves for a one year term or until their successors are elected and qualified. Column two below includes length of time served with predecessor entities, if any.
Name, Year of Birth and Position(s) Held with the Trust | Trustee and/ or Officer Since | Principal Occupation(s) During Past 5 Years | Number of Funds in Fund Complex Overseen by Trustee | Other Directorship(s) Held by Trustee During | ||||
| Interested Persons | ||||||||
| Martin L. Flanagan1 — 1960 Trustee | 2007 | Executive Director, Chief Executive Officer and President, Invesco Ltd. (ultimate parent of Invesco and a global investment management firm); Advisor to the Board, Invesco Advisers, Inc. (formerly known as Invesco Institutional (N.A.), Inc.); Trustee, The Invesco Funds; Vice Chair, Investment Company Institute; and Member of Executive Board, SMU Cox School of Business
Formerly: Chairman and Chief Executive Officer, Invesco Advisers, Inc. (registered investment adviser); Director, Chairman, Chief Executive Officer and President, IVZ Inc. (holding company), INVESCO Group Services, Inc. (service provider) and Invesco North American Holdings, Inc. (holding company); Director, Chief Executive Officer and President, Invesco Holding Company Limited (parent of Invesco and a global investment management firm); Director, Invesco Ltd.; Chairman, Investment Company Institute and President, Co-Chief Executive Officer, Co-President, Chief Operating Officer and Chief Financial Officer, Franklin Resources, Inc. (global investment management organization). | 144 | None | ||||
Philip A. Taylor2 — 1954 Trustee, President and Principal Executive Officer | 2006 | Head of North American Retail and Senior Managing Director, Invesco Ltd.; Director, Co-Chairman, Co-President and Co-Chief Executive Officer, Invesco Advisers, Inc. (formerly known as Invesco Institutional (N.A.), Inc.) (registered investment adviser); Director, Chairman, Chief Executive Officer and President, Invesco Management Group, Inc. (formerly known as Invesco Aim Management Group, Inc.) (financial services holding company); Director and President, INVESCO Funds Group, Inc. (registered investment adviser and registered transfer agent); Director and Chairman, Invesco Investment Services, Inc. (formerly known as Invesco Aim Investment Services, Inc.) (registered transfer agent) and IVZ Distributors, Inc. (formerly known as INVESCO Distributors, Inc.) (registered broker dealer); Director, President and Chairman, Invesco Inc. (holding company) and Invesco Canada Holdings Inc. (holding company); Chief Executive Officer, Invesco Corporate Class Inc. (corporate mutual fund company) and Invesco Canada Fund Inc. (corporate mutual fund company); Director, Chairman and Chief Executive Officer, Invesco Canada Ltd. (formerly known as Invesco Trimark Ltd./Invesco Trimark Ltèe) (registered investment adviser and registered transfer agent); Trustee, President and Principal Executive Officer, The Invesco Funds (other than AIM Treasurer’s Series Trust (Invesco Treasurer’s Series Trust) and Short-Term Investments Trust); Trustee and Executive Vice President, The Invesco Funds (AIM Treasurer’s Series Trust (Invesco Treasurer’s Series Trust) and Short-Term Investments Trust only); Director, Invesco Investment Advisers LLC (formerly known as Van Kampen Asset Management); Director, Chief Executive Officer and President, Van Kampen Exchange Corp.
Formerly: Director and Chairman, Van Kampen Investor Services Inc.; Director, Chief Executive Officer and President, 1371 Preferred Inc. (holding company) and Van Kampen Investments Inc.; Director and President, AIM GP Canada Inc. (general partner for limited partnerships) and Van Kampen Advisors, Inc.; Director and Chief Executive Officer, Invesco Trimark Dealer Inc. (registered broker dealer); Director, Invesco Distributors, Inc. (formerly known as Invesco Aim Distributors, Inc.) (registered broker dealer); Manager, Invesco PowerShares Capital Management LLC; Director, Chief Executive Officer and President, Invesco Advisers, Inc.; Director, Chairman, Chief Executive Officer and President, Invesco Aim Capital Management, Inc.; President, Invesco Trimark Dealer Inc. and Invesco Trimark Ltd./Invesco Trimark Ltèe; Director and President, AIM Trimark Corporate Class Inc. and AIM Trimark Canada Fund Inc.; Senior Managing Director, Invesco Holding Company Limited; Director and Chairman, Fund Management Company (former registered broker dealer); President and Principal Executive Officer, The Invesco Funds (AIM Treasurer’s Series Trust (Invesco Treasurer’s Series Trust), and Short-Term Investments Trust only); President, AIM Trimark Global Fund Inc. and AIM Trimark Canada Fund Inc. | 144 | None | ||||
| Independent Trustees | ||||||||
Bruce L. Crockett — 1944 Trustee and Chair | 2001 | Chairman, Crockett Technologies Associates (technology consulting company)
Formerly: Director, Captaris (unified messaging provider); Director, President and Chief Executive Officer, COMSAT Corporation; Chairman, Board of Governors of INTELSAT (international communications company); ACE Limited (insurance company); and Investment Company Institute | 144 | ALPS (Attorneys Liability Protection Society) (insurance company) |
| 1 | Mr. Flanagan is considered an interested person (within the meaning of Section 2(a)(19) of the 1940 Act) of the Trust because he is an officer of the Adviser to the Trust, and an officer and a director of Invesco Ltd., ultimate parent of the Adviser. |
| 2 | Mr. Taylor is considered an interested person (within the meaning of Section 2(a)(19) of the 1940 Act) of the Trust because he is an officer and a director of the Adviser. |
T-1 Invesco International Allocation Fund
Trustees and Officers—(continued)
Name, Year of Birth and Position(s) Held with the Trust | Trustee and/ or Officer Since | Principal Occupation(s) During Past 5 Years | Number of Funds in Fund Complex Overseen by Trustee | Other Directorship(s) Held by Trustee During | ||||
| Independent Trustees—(continued) | ||||||||
David C. Arch — 1945 Trustee | 2010 | Chairman of Blistex Inc., a consumer health care products manufacturer | 144 | Board member of the Illinois Manufacturers’ Association; Member of the Board of Visitors, Institute for the Humanities, University of Michigan; Member of the Audit Committee of the Edward-Elmhurst Hospital | ||||
James T. Bunch — 1942 Trustee | 2003 | Managing Member, Grumman Hill Group LLC (family office private equity investments)
Formerly: Founder, Green Manning & Bunch Ltd. (investment banking firm) (1988-2010); Executive Committee, United States Golf Association; and Director, Policy Studies, Inc. and Van Gilder Insurance Corporation | 144 | Chairman, Board of Governors, Western Golf Association; Chairman, Evans Scholars Foundation; and Director, Denver Film Society | ||||
Rodney F. Dammeyer — 1940 Trustee | 2010 | Chairman of CAC, LLC, (private company offering capital investment and management advisory services)
Formerly: Prior to 2001, Managing Partner at Equity Group Corporate Investments; Prior to 1995, Chief Executive Officer of Itel Corporation (formerly Anixter International); Prior to 1985, experience includes Senior Vice President and Chief Financial Officer of Household International, Inc., Executive Vice President and Chief Financial Officer of Northwest Industries, Inc. and Partner of Arthur Andersen & Co.; From 1987 to 2010, Director/Trustee of investment companies in the Van Kampen Funds complex | 144 | Director of Quidel Corporation and Stericycle, Inc. | ||||
Albert R. Dowden — 1941 Trustee | 2001 | Director of a number of public and private business corporations, including the Boss Group, Ltd. (private investment and management); Nature’s Sunshine Products, Inc. and Reich & Tang Funds (5 portfolios) (registered investment company)
Formerly: Director, Homeowners of America Holding Corporation/Homeowners of America Insurance Company (property casualty company); Director, Continental Energy Services, LLC (oil and gas pipeline service); Director, CompuDyne Corporation (provider of product and services to the public security market) and Director, Annuity and Life Re (Holdings), Ltd. (reinsurance company); Director, President and Chief Executive Officer, Volvo Group North America, Inc.; Senior Vice President, AB Volvo; Director of various public and private corporations; Chairman, DHJ Media, Inc.; Director, Magellan Insurance Company; and Director, The Hertz Corporation, Genmar Corporation (boat manufacturer), National Media Corporation; Advisory Board of Rotary Power International (designer, manufacturer, and seller of rotary power engines); and Chairman, Cortland Trust, Inc. (registered investment company) | 144 | Director of: Nature’s Sunshine Products, Inc., Reich & Tang Funds, Homeowners of America Holding Corporation/ Homeowners of America Insurance Company, the Boss Group | ||||
Jack M. Fields — 1952 Trustee | 2001 | Chief Executive Officer, Twenty First Century Group, Inc. (government affairs company); Owner and Chief Executive Officer, Dos Angeles Ranch, L.P. (cattle, hunting, corporate entertainment); and Discovery Global Education Fund (non-profit)
Formerly: Chief Executive Officer, Texana Timber LP (sustainable forestry company); Director of Cross Timbers Quail Research Ranch (non-profit); and member of the U.S. House of Representatives | 144 | Insperity, Inc. (formerly known as Administaff) | ||||
Prema Mathai-Davis — 1950 Trustee | 2001 | Retired. Formerly: Chief Executive Officer, YWCA of the U.S.A. | 144 | None | ||||
Larry Soll — 1942 Trustee | 2003 | Retired. Formerly: Chairman, Chief Executive Officer and President, Synergen Corp. (a biotechnology company) | 144 | None | ||||
Hugo F. Sonnenschein — 1940 Trustee | 2010 | President Emeritus and Honorary Trustee of the University of Chicago and the Adam Smith Distinguished Service Professor in the Department of Economics at the University of Chicago. Prior to 2000, President of the University of Chicago | 144 | Trustee of the University of Rochester and a member of its investment committee; Member of the National Academy of Sciences and the American Philosophical Society; Fellow of the American Academy of Arts and Sciences | ||||
Raymond Stickel, Jr. — 1944 Trustee | 2005 | Retired. Formerly: Director, Mainstay VP Series Funds, Inc. (25 portfolios) and Partner, Deloitte & Touche | 144 | None | ||||
T-2 Invesco International Allocation Fund
Trustees and Officers—(continued)
Name, Year of Birth and Position(s) Held with the Trust | Trustee and/ or Officer Since | Principal Occupation(s) During Past 5 Years | Number of Funds in Fund Complex Overseen by Trustee | Other Directorship(s) Held by Trustee During | ||||
| Independent Trustees—(continued) | ||||||||
Suzanne H. Woolsey — 1941 Trustee | 2014 | Chief Executive Officer of Woolsey Partners LLC | 144 | Emeritus Chair of the Board of Trustees of the Institute for Defense Analyses; Trustee of Colorado College; Trustee of California Institute of Technology; Prior to 2014, Director of Fluor Corp.; Prior to 2010, Trustee of the German Marshall Fund of the United States; Prior to 2010 Trustee of the Rocky Mountain Institute | ||||
| Other Officers | ||||||||
Russell C. Burk — 1958 Senior Vice President and Senior Officer | 2005 | Senior Vice President and Senior Officer, The Invesco Funds | N/A | N/A | ||||
John M. Zerr — 1962 Senior Vice President, Chief Legal Officer and Secretary | 2006 | Director, Senior Vice President, Secretary and General Counsel, Invesco Management Group, Inc. (formerly known as Invesco Aim Management Group, Inc.) and Van Kampen Exchange Corp.; Senior Vice President, Invesco Advisers, Inc. (formerly known as Invesco Institutional (N.A.), Inc.) (registered investment adviser); Senior Vice President and Secretary, Invesco Distributors, Inc. (formerly known as Invesco Aim Distributors, Inc.); Director, Vice President and Secretary, Invesco Investment Services, Inc. (formerly known as Invesco Aim Investment Services, Inc.) and IVZ Distributors, Inc. (formerly known as INVESCO Distributors, Inc.); Director and Vice President, INVESCO Funds Group, Inc.; Senior Vice President, Chief Legal Officer and Secretary, The Invesco Funds; Manager, Invesco PowerShares Capital Management LLC; Director, Secretary and General Counsel, Invesco Investment Advisers LLC (formerly known as Van Kampen Asset Management); Secretary and General Counsel, Invesco Capital Markets, Inc. (formerly known as Van Kampen Funds Inc.) and Chief Legal Officer, PowerShares Exchange-Traded Fund Trust, PowerShares Exchange-Traded Fund Trust II, PowerShares India Exchange-Traded Fund Trust , PowerShares Actively Managed Exchange-Traded Fund Trust; and PowerShares Actively Managed Exchange-Traded Commodity Fund Trust
Formerly: Director and Vice President, Van Kampen Advisors Inc.; Director, Vice President, Secretary and General Counsel, Van Kampen Investor Services Inc.; Director, Invesco Distributors, Inc. (formerly known as Invesco Aim Distributors, Inc.); Director, Senior Vice President, General Counsel and Secretary, Invesco Aim Advisers, Inc. and Van Kampen Investments Inc.; Director, Vice President and Secretary, Fund Management Company; Director, Senior Vice President, Secretary, General Counsel and Vice President, Invesco Aim Capital Management, Inc.; Chief Operating Officer and General Counsel, Liberty Ridge Capital, Inc. (an investment adviser); Vice President and Secretary, PBHG Funds (an investment company) and PBHG Insurance Series Fund (an investment company); Chief Operating Officer, General Counsel and Secretary, Old Mutual Investment Partners (a broker-dealer); General Counsel and Secretary, Old Mutual Fund Services (an administrator) and Old Mutual Shareholder Services (a shareholder servicing center); Executive Vice President, General Counsel and Secretary, Old Mutual Capital, Inc. (an investment adviser); and Vice President and Secretary, Old Mutual Advisors Funds (an investment company) | N/A | N/A | ||||
Sheri Morris — 1964 Vice President, Treasurer and Principal Financial Officer | 1999 | Vice President, Treasurer and Principal Financial Officer, The Invesco Funds; Vice President, Invesco Advisers, Inc. (formerly known as Invesco Institutional (N.A.), Inc.) (registered investment adviser); and Vice President, PowerShares Exchange-Traded Fund Trust, PowerShares Exchange-Traded Fund Trust II, PowerShares India Exchange-Traded Fund Trust, PowerShares Actively Managed Exchange-Traded Fund Trust, and PowerShares Actively Managed Exchange-Traded Commodity Fund Trust
Formerly: Vice President, Invesco Aim Advisers, Inc., Invesco Aim Capital Management, Inc. and Invesco Aim Private Asset Management, Inc.; Assistant Vice President and Assistant Treasurer, The Invesco Funds and Assistant Vice President, Invesco Advisers, Inc., Invesco Aim Capital Management, Inc. and Invesco Aim Private Asset Management, Inc.; and Treasurer, PowerShares Exchange-Traded Fund Trust, PowerShares Exchange-Traded Fund Trust II, PowerShares India Exchange-Traded Fund Trust and PowerShares Actively Managed Exchange-Traded Fund Trust | N/A | N/A | ||||
T-3 Invesco International Allocation Fund
Trustees and Officers—(continued)
Name, Year of Birth and Position(s) Held with the Trust | Trustee and/ or Officer Since | Principal Occupation(s) During Past 5 Years | Number of Funds in Fund Complex Overseen by Trustee | Other Directorship(s) Held by Trustee During | ||||
| Other Officers—(continued) | ||||||||
Karen Dunn Kelley — 1960 Vice President | 2004 | Senior Managing Director, Investments; Director, Co-President, Co-Chief Executive Officer, and Co-Chairman, Invesco Advisers, Inc. (formerly known as Invesco Institutional (N.A.), Inc.) (registered investment adviser); Chairman, Invesco Senior Secured Management, Inc.; Senior Vice President, Invesco Management Group, Inc. (formerly known as Invesco Aim Management Group, Inc.); Executive Vice President, Invesco Distributors, Inc. (formerly known as Invesco Aim Distributors, Inc.); Director, Invesco Mortgage Capital Inc. and Invesco Management Company Limited; Director and President, INVESCO Asset Management (Bermuda) Ltd., Vice President, The Invesco Funds (other than AIM Treasurer’s Series Trust (Invesco Treasurer’s Series Trust) and Short-Term Investments Trust); and President and Principal Executive Officer, The Invesco Funds (AIM Treasurer’s Series Trust (Invesco Treasurer’s Series Trust) and Short-Term Investments Trust only)
Formerly: Director, INVESCO Global Asset Management Limited and INVESCO Management S.A.; Senior Vice President, Van Kampen Investments Inc. and Invesco Advisers, Inc. (formerly known as Invesco Institutional (N.A.), Inc.) (registered investment adviser); Vice President, Invesco Advisers, Inc. (formerly known as Invesco Institutional (N.A.), Inc.); Director of Cash Management and Senior Vice President, Invesco Advisers, Inc. and Invesco Aim Capital Management, Inc.; Director and President, Fund Management Company; Chief Cash Management Officer, Director of Cash Management, Senior Vice President, and Managing Director, Invesco Aim Capital Management, Inc.; Director of Cash Management, Senior Vice President, and Vice President, Invesco Advisers, Inc. and The Invesco Funds (AIM Treasurer’s Series Trust (Invesco Treasurer’s Series Trust), and Short-Term Investments Trust only) | N/A | N/A | ||||
Crissie M. Wisdom — 1969 Anti-Money Laundering Compliance Officer | 2013 | Anti-Money Laundering Compliance Officer, Invesco Advisers, Inc. (formerly known as Invesco Institutional (N.A.), Inc.) (registered investment adviser), Invesco Capital Markets, Inc. (formerly known as Van Kampen Funds Inc.), Invesco Distributors, Inc., Invesco Investment Services, Inc., Invesco Management Group, Inc., Van Kampen Exchange Corp., The Invesco Funds, and PowerShares Exchange-Traded Fund Trust, PowerShares Exchange-Traded Fund Trust II, PowerShares India Exchange-Traded Fund Trust, PowerShares Actively Managed Exchange-Traded Fund Trust and PowerShares Actively Managed Exchange-Traded Commodity Fund Trust; and Fraud Prevention Manager and Controls and Risk Analysis Manager for Invesco Investment Services, Inc. | N/A | N/A | ||||
Todd L. Spillane — 1958 Chief Compliance Officer | 2006 | Senior Vice President, Invesco Management Group, Inc. (formerly known as Invesco Aim Management Group, Inc.) and Van Kampen Exchange Corp.; Senior Vice President and Chief Compliance Officer, Invesco Advisers, Inc. (registered investment adviser) (formerly known as Invesco Institutional (N.A.), Inc.); Chief Compliance Officer, The Invesco Funds; Vice President, Invesco Distributors, Inc. (formerly known as Invesco Aim Distributors, Inc.) and Invesco Investment Services, Inc. (formerly known as Invesco Aim Investment Services, Inc.)
Formerly: Chief Compliance Officer, Invesco Funds (Chicago); Senior Vice President, Van Kampen Investments Inc.; Senior Vice President and Chief Compliance Officer, Invesco Aim Advisers, Inc. and Invesco Aim Capital Management, Inc.; Chief Compliance Officer, INVESCO Private Capital Investments, Inc. (holding company), Invesco Private Capital, Inc. (registered investment adviser), Invesco Global Asset Management (N.A.), Inc., Invesco Senior Secured Management, Inc. (registered investment adviser), Van Kampen Investor Services Inc., PowerShares Exchange-Traded Fund Trust, PowerShares Exchange-Traded Fund Trust II, PowerShares India Exchange-Traded Fund Trust and PowerShares Actively Managed Exchange-Traded Fund Trust; and Vice President, Invesco Aim Capital Management, Inc. and Fund Management Company | N/A | N/A |
The Statement of Additional Information of the Trust includes additional information about the Fund’s Trustees and is available upon request, without charge, by calling 1.800.959.4246. Please refer to the Fund’s prospectus for information on the Fund’s sub-advisers.
Office of the Fund 11 Greenway Plaza, Suite 1000 Houston, TX 77046-1173 | Investment Adviser Invesco Advisers, Inc. 1555 Peachtree Street, N.E. Atlanta, GA 30309 | Distributor Invesco Distributors, Inc. 11 Greenway Plaza, Suite 1000 Houston, TX 77046-1173 | Auditors PricewaterhouseCoopers LLP 1000 Louisiana Street, Suite 5800 Houston, TX 77002-5678 | |||
Counsel to the Fund Stradley Ronon Stevens & Young, LLP 2005 Market Street, Suite 2600 Philadelphia, PA 19103-7018 | Counsel to the Independent Trustees Goodwin Procter LLP 901 New York Avenue, N.W. Washington, D.C. 20001 | Transfer Agent Invesco Investment Services, Inc. 11 Greenway Plaza, Suite 1000 Houston, TX 77046-1173 | Custodian State Street Bank and Trust Company 225 Franklin Street Boston, MA 02110-2801 | |||
T-4 Invesco International Allocation Fund

Invesco mailing information
Send general correspondence to Invesco Investment Services, Inc., P.O. Box 219078, Kansas City, MO 64121-9078.
Important notice regarding delivery of security holder documents
To reduce Fund expenses, only one copy of most shareholder documents may be mailed to shareholders with multiple accounts at the same address (Householding). Mailing of your shareholder documents may be householded indefinitely unless you instruct us otherwise. If you do not want the mailing of these documents to be combined with those for other members of your household, please contact Invesco Investment Services, Inc. at 800 959 4246 or contact your financial institution. We will begin sending you individual copies for each account within 30 days after receiving your request.
Fund holdings and proxy voting information
The Fund provides a complete list of its holdings four times in each fiscal year, at the quarter ends. For the second and fourth quarters, the lists appear in the Fund’s semiannual and annual reports to shareholders. For the first and third quarters, the Fund files the lists with the Securities and Exchange Commission (SEC) on Form N-Q. The most recent list of portfolio holdings is available at invesco.com/completeqtrholdings. Shareholders can also look up the Fund’s Forms N-Q on the SEC website at sec.gov. Copies of the Fund’s Forms N-Q may be reviewed and copied at the SEC Public Reference Room in Washington, D.C. You can obtain information on the operation of the Public Reference Room, including information about duplicating fee charges, by calling 202 551 8090 or 800 732 0330, or by electronic request at the following email address: publicinfo@sec.gov. The SEC file numbers for the Fund are shown below.
A description of the policies and procedures that the Fund uses to determine how to vote proxies relating to portfolio securities is available without charge, upon request, from our Client Services department at 800 959 4246 or at invesco.com/proxyguidelines. The information is also available on the SEC website, sec.gov.
Information regarding how the Fund voted proxies related to its portfolio securities during the most recent 12-month period ended June 30 is available at invesco.com/proxysearch. The information is also available on the SEC website, sec.gov. Invesco Advisers, Inc. is an investment adviser; it provides investment advisory services to individual and institutional clients and does not sell securities. Invesco Distributors, Inc. is the US distributor for Invesco Ltd.’s retail mutual funds, exchange-traded funds and institutional money market funds. Both are wholly owned, indirect subsidiaries of Invesco Ltd. |  | |
SEC file numbers: 811-02699 and 002-57526 INTAL-AR-1 Invesco Distributors, Inc. | ||
| ||||
 | Annual Report to Shareholders
| December 31, 2014 | ||
| ||||
Invesco Mid Cap Core Equity Fund
Nasdaq: A: GTAGX n B: GTABX n C: GTACX n R: GTARX n Y: GTAYX n R5: GTAVX n R6: GTAFX | ||||

Letters to Shareholders
Philip Taylor | Dear Shareholders: This annual report includes information about your Fund, including performance data and a complete list of its investments as of the close of the reporting period. Inside, your Fund’s portfolio managers discuss how they managed your Fund and the factors that affected its performance during the reporting period. I hope you find this report of interest. During the reporting period, the US economy showed unmistakable signs of improvement. After contracting in the first quarter of 2014, the economy expanded strongly in the second and third quarters as employment data improved markedly. Given continuing positive economic trends, the US Federal Reserve (the Fed) ended its extraordinary asset purchase program in October – but it pledged in December to be “patient” before raising interest rates. Overseas, the story was much different. Concerns about economic stagnation and the potential for deflation depressed European markets, while the Chinese economy was hurt by a |

slowdown in manufacturing.
Political change in Washington, DC; changes to monetary policy by the Fed and other central banks; the future direction of oil prices; and unexpected geopolitical events are likely to affect markets in the US and overseas in 2015. This may make some investors hesitant to begin to save for their long-term financial goals. That’s why Invesco has always encouraged investors to work with a professional financial adviser who can stress the importance of starting to save and invest early and the importance of adhering to a disciplined investment plan – when times are good and when they’re uncertain. A financial adviser who knows your unique financial situation, investment goals and risk tolerance can be an invaluable partner as you seek to achieve your financial goals. He or she can offer a long-term perspective when markets are volatile and time-tested advice and guidance when your financial situation or investment goals change.
Timely information when and where you want it
Invesco’s efforts to help investors achieve their financial objectives include providing individual investors and financial professionals with timely information about the markets, the economy and investing – whenever and wherever they want it.
Our website, invesco.com/us, offers a wide range of market insights and investment perspectives. On the website, you’ll find detailed information about our funds, including prices, performance, holdings and portfolio manager commentaries. You can access information about your individual Invesco account whenever it’s convenient for you; just complete a simple, secure online registration. Use the “Log In” box on our home page to get started.
Invesco’s mobile apps for iPhone® and iPad® (both available free from the App StoreSM) allow you to obtain the same detailed information, monitor your account and create customizable watch lists. Also, they allow you to access investment insights from our investment leaders, market strategists, economists and retirement experts. You can sign up to be alerted when new commentary is added, and you can watch portfolio manager videos and have instant access to Invesco news and updates wherever you may be.
In addition to the resources accessible on our website and through our mobile app, you can obtain timely updates to help you stay informed about the markets, the economy and investing by connecting with Invesco on Twitter, LinkedIn or Facebook. You can access our blog at blog.invesco.us.com. Our goal is to provide you the information you want, when and where you want it.
Have questions?
For questions about your account, feel free to contact an Invesco client services representative at 800 959 4246. For Invesco-related questions or comments, please email me directly at phil@invesco.com.
All of us at Invesco look forward to serving your investment management needs for many years to come. Thank you for investing with us.
Sincerely,

Philip Taylor
Senior Managing Director, Invesco Ltd.
iPhone and iPad are trademarks of Apple Inc., registered in the US and other countries. App Store is a service mark of Apple Inc. Invesco Distributors, Inc. is not affiliated with Apple Inc.
2 Invesco Mid Cap Core Equity Fund
Bruce Crockett | Dear Fellow Shareholders: Among the many important lessons I’ve learned in more than 40 years in a variety of business endeavors is the value of a trusted advocate. As independent chair of the Invesco Funds Board, I can assure you that the members of the Board are strong advocates for the interests of investors in Invesco’s mutual funds. We work hard to represent your interests through oversight of the quality of the investment management services your funds receive and other matters important to your investment, including but not limited to: n Ensuring that Invesco offers a diverse lineup of mutual funds that your financial adviser can use to strive to meet your financial needs as your investment goals change over time. n Monitoring how the portfolio management teams of the Invesco funds are performing in light of changing economic and market conditions. |

| n | Assessing each portfolio management team’s investment performance within the context of the investment strategy described in the fund’s prospectus. |
| n | Monitoring for potential conflicts of interests that may impact the nature of the services that your funds receive. |
We believe one of the most important services we provide our fund shareholders is the annual review of the funds’ advisory and sub-advisory contracts with Invesco Advisers and its affiliates. This review is required by the Investment Company Act of 1940 and focuses on the nature and quality of the services Invesco provides as the adviser to the Invesco funds and the reasonableness of the fees that it charges for those services. Each year, we spend months carefully reviewing information received from Invesco and a variety of independent sources, such as performance and fee data prepared by Lipper Inc., an independent, third-party firm widely recognized as a leader in its field. We also meet with our independent legal counsel and other independent advisers to review and help us assess the information that we have received. Our goal is to assure that you receive quality investment management services for a reasonable fee.
I trust the measures outlined above provide assurance that you have a worthy advocate when it comes to choosing the Invesco Funds.
As always, please contact me at bruce@brucecrockett.com with any questions or concerns you may have. On behalf of the Board, we look forward to continuing to represent your interests and serving your needs.
Sincerely,

Bruce L. Crockett
Independent Chair
Invesco Funds Board of Trustees
3 Invesco Mid Cap Core Equity Fund
Management’s Discussion of Fund Performance
Performance summary
Invesco Mid Cap Core Equity Fund delivered positive returns at net asset value for the year ended December 31, 2014, but underperformed its broad market and style-specific benchmarks, the S&P 500 Index and the Russell Midcap Index, respectively. The Fund’s absolute returns benefited from holdings in the consumer staples, information technology (IT) and materials sectors. The Fund also benefited from stock selection in the utilities sector, but the Fund’s underweight exposure (compared to the Russell Midcap Index) in the sector was a drag on relative performance. The Fund’s largest detractors included stock selection in the financials, health care and industrials sectors. The Fund’s allocation to cash also tempered results for the reporting period.
Your Fund’s long-term performance appears later in this report.
Fund vs. Indexes
Total returns, 12/31/13 to 12/31/14, at net asset value (NAV). Performance shown does not include applicable contingent deferred sales charges (CDSC) or front-end sales charges, which would have reduced performance.
| Class A Shares | 4.51 | % | |||
| Class B Shares | 3.74 | ||||
| Class C Shares | 3.69 | ||||
| Class R Shares | 4.24 | ||||
| Class Y Shares | 4.76 | ||||
| Class R5 Shares | 4.88 | ||||
| Class R6 Shares | 4.97 | ||||
| S&P 500 Index‚ (Broad Market Index) | 13.69 | ||||
| Russell Midcap Index‚ (Style-Specific Index) | 13.22 | ||||
| Lipper Mid-Cap Core Funds Indexn (Peer Group Index) | 8.89 |
Source(s): ‚FactSet Research Systems Inc.; nLipper Inc.
Market conditions and your Fund
Slow and steady improvement in the US economy and historically low interest rates led the US equity market higher during the year ended December 31, 2014. As the US economy continued along a slow growth path, the US Federal Reserve reduced its asset purchase program throughout 2014, finally ending all purchases in October. In the early months of 2014, the stock market turned volatile, pulling back as investors began to worry that stocks may have risen too far, too fast in 2013. Unusually cold winter weather also impacted consumers, but only briefly. Relatively quickly,
corporate earnings bounced back and remained generally strong through the rest of the year. Stocks rallied through the summer despite political upheaval in Ukraine and signs of economic sluggishness in China.
As investors wrestled with evidence that US growth appeared to be on stronger footing than the rest of the world, in mid-September the price of oil began a sharp decline, along with US equities. Despite the unknown economic impact of significantly lower oil prices for an extended period, the US equity market stabilized and recovered, ending the year in positive territory.
For the year, major US equity market indexes delivered strong gains, with all sectors of the S&P 500 Index, with the exception of the energy sector, posting positive returns. The utilities sector had the highest return of any sector.
The largest contributor to relative performance was Shire, an Ireland-based pharmaceutical company, which was active during the year in both entertaining takeover offers and acquiring interests in several smaller pharmaceutical companies. During the reporting period, we sold our position in Shire.
Another contributor to relative Fund performance was Sigma Aldrich. This long-term holding in the materials sector, received a buyout offer mid-year, resulting in the liquidation of our position. Sigma Aldrich develops, manufactures and distributes a range of chemicals and biochemicals.
Molson Coors Brewing was a standout performer in its sector, in part due to ongoing speculation regarding potential consolidation in the global brewing industry.
The industrials sector was the largest detractor from Fund performance during the year relative to the style-specific benchmark, the Russell Midcap Index. Within the industrials sector, Kennametal struggled. Kennametal is a supplier of tools and industrial materials used in the energy industry. Despite an increase in year-over-year sales, the company reported earnings in 2014 that were below analysts’ expectations, which weighed on shares. The company also reduced its earnings outlook for the full year due to higher operating expenses and integration costs from a recent acquisition.
Also detracting from the Fund’s performance was energy infrastructure company Chicago Bridge & Iron. During the
| Portfolio Composition | |||||
By sector
| |||||
| Information Technology | 17.0 | % | |||
| Financials | 14.5 | ||||
| Consumer Discretionary | 13.4 | ||||
| Health Care | 12.2 | ||||
| Industrials | 10.4 | ||||
| Energy | 5.7 | ||||
| Materials | 4.6 | ||||
| Consumer Staples | 3.9 | ||||
| Utilities | 1.1 | ||||
| Money Market Funds Plus Other Assets Less Liabilities | 17.2 | ||||
| Top 10 Equity Holdings* | |||||
1. Progressive Corp. (The) | 2.5 | % | |||
2. Linear Technology Corp. | 2.4 | ||||
3. Torchmark Corp. | 2.2 | ||||
4. Moody’s Corp. | 2.2 | ||||
5. Northern Trust Corp. | 2.2 | ||||
6. Stanley Black & Decker, Inc. | 2.1 | ||||
7. Teradyne, Inc. | 2.0 | ||||
8. Amphenol Corp.-Class A | 2.0 | ||||
9. F5 Networks, Inc. | 1.9 | ||||
10. First Republic Bank | 1.9 | ||||
| Top Five Industries* | |||||
| 1. Industrial Machinery | 7.3 | % | |||
2. Semiconductor Equipment | 4.4 | ||||
3. Property & Casualty Insurance | 4.3 | ||||
4. Pharmaceuticals | 4.3 | ||||
5. Semiconductors | 3.9 | ||||
| Total Net Assets | $2.4 billion | ||||
| Total Number of Holdings* | 68 | ||||
The Fund’s holdings are subject to change, and there is no assurance that the Fund will continue to hold any particular security.
*Excluding money market fund holdings.
4 Invesco Mid Cap Core Equity Fund
year, concerns arose regarding potential cost increases for select projects acquired through a recent acquisition. In addition, the sharp decline in oil prices put a slight damper on its core business.
The Fund maintained its slight overweight position in the IT and materials sectors compared to the Russell Midcap Index. The Fund also moved from an overweight position in the consumer staples sector to an underweight position. At the end of the year, our largest overweights relative to the Russell Midcap Index were in the energy and materials sectors, and our largest underweights were in the consumer discretionary and financials sectors.
Regardless of market conditions, our goal remains the same: to serve as a conservative cornerstone for your mid-cap investment allocation, seeking to provide upside participation with a measure of downside protection, so that over a full market cycle we deliver strong investment results with reduced risk relative to the style-specific benchmark.
As always, we thank you for your continued investment in Invesco’s Mid Cap Core Equity Fund.
The views and opinions expressed in management’s discussion of Fund performance are those of Invesco Advisers, Inc. These views and opinions are subject to change at any time based on factors such as market and economic conditions. These views and opinions may not be relied upon as investment advice or recommendations, or as an offer for a particular security. The information is not a complete analysis of every aspect of any market, country, industry, security or the Fund. Statements of fact are from sources considered reliable, but Invesco Advisers, Inc. makes no representation or warranty as to their completeness or accuracy. Although historical performance is no guarantee of future results, these insights may help you understand our investment management philosophy.
See important Fund and, if applicable, index disclosures later in this report.
 | Ronald Sloan Chartered Financial Analyst, Portfolio Manager and Chief Investment Officer of Invesco’s global core |
investments team, is lead manager of Invesco Mid Cap Core Equity Fund. He joined Invesco in 1998. Mr. Sloan earned a BS in business administration and an MBA from the University of Missouri.
 | Brian Nelson Chartered Financial Analyst, Portfolio Manager, is manager of Invesco Mid Cap Core Equity Fund. He |
joined Invesco in 2004. Mr. Nelson earned a BA from the University of California, Santa Barbara.
Assisted by Invesco’s Global Core Equity Team
5 Invesco Mid Cap Core Equity Fund
Your Fund’s Long-Term Performance
Results of a $10,000 Investment – Oldest Share Class(es)
Fund and index data from 12/31/04

Past performance cannot guarantee comparable future results.
The data shown in the chart include reinvested distributions, applicable sales charges and Fund expenses including
management fees. Index results include reinvested dividends, but they do not reflect sales charges. Performance of the peer group, if applicable, reflects fund expenses and management fees;
performance of a market index does not. Performance shown in the chart and table(s) does not reflect deduction of taxes a shareholder would pay on Fund distributions or sale of Fund shares.
continued from page 8
| such, the NAVs for shareholder transactions and the returns based on those NAVs may differ from the NAVs and returns reported in the Financial Highlights. |
| n | Industry classifications used in this report are generally according to the Global Industry Classification Standard, which was developed by and is the exclusive property and a service mark of MSCI Inc. and Standard & Poor’s. |
6 Invesco Mid Cap Core Equity Fund
| Average Annual Total Returns | |||||
| As of 12/31/14, including maximum applicable sales charges | |||||
| Class A Shares | |||||
| Inception (6/9/87) | 10.62 | % | |||
| 10 Years | 6.29 | ||||
| 5 Years | 8.24 | ||||
| 1 Year | -1.25 | ||||
| Class B Shares | |||||
| Inception (4/1/93) | 10.12 | % | |||
| 10 Years | 6.25 | ||||
| 5 Years | 8.37 | ||||
| 1 Year | -0.70 | ||||
| Class C Shares | |||||
| Inception (5/3/99) | 8.30 | % | |||
| 10 Years | 6.09 | ||||
| 5 Years | 8.65 | ||||
| 1 Year | 2.81 | ||||
| Class R Shares | |||||
| Inception (6/3/02) | 7.09 | % | |||
| 10 Years | 6.62 | ||||
| 5 Years | 9.19 | ||||
| 1 Year | 4.24 | ||||
| Class Y Shares | |||||
| 10 Years | 7.06 | % | |||
| 5 Years | 9.74 | ||||
| 1 Year | 4.76 | ||||
| Class R5 Shares | |||||
| Inception (3/15/02) | 7.51 | % | |||
| 10 Years | 7.33 | ||||
| 5 Years | 9.88 | ||||
| 1 Year | 4.88 | ||||
| Class R6 Shares | |||||
| 10 Years | 7.00 | % | |||
| 5 Years | 9.70 | ||||
| 1 Year | 4.97 | ||||
Class Y shares incepted on October 3, 2008. Performance shown prior to that date is that of Class A shares and includes the 12b-1 fees applicable to Class A shares. Class A share performance reflects any applicable fee waivers or expense reimbursements.
Class R6 shares incepted on September 24, 2012. Performance shown prior to that date is that of Class A shares and includes the 12b-1 fees applicable to Class A shares. Class A share performance reflects any applicable fee waivers or expense reimbursements.
The performance data quoted represent past performance and cannot guarantee comparable future results; current performance may be lower or higher. Please visit invesco.com/performance for the most recent month-end performance. Performance figures
reflect reinvested distributions, changes in net asset value and the effect of the maximum sales charge unless otherwise stated. Investment return and principal value will fluctuate so that you may have a gain or loss when you sell shares.
The net annual Fund operating expense ratio set forth in the most recent Fund prospectus as of the date of this report for Class A, Class B, Class C, Class R, Class Y, Class R5 and Class R6 shares was 1.19%, 1.94%, 1.94%, 1.44%, 0.94%, 0.83% and 0.74%, respectively.1 The total annual Fund operating expense ratio set forth in the most recent Fund prospectus as of the date of this report for Class A, Class B, Class C, Class R, Class Y, Class R5 and Class R6 shares was 1.22%, 1.97%, 1.97%, 1.47%, 0.97%, 0.86% and 0.77%, respectively. The expense ratios presented above may vary from the expense ratios presented in other sections of this report that are based on expenses incurred during the period covered by this report.
Class A share performance reflects the maximum 5.50% sales charge, and Class B and Class C share performance reflects the applicable contingent deferred sales charge (CDSC) for the period involved. The CDSC on Class B shares declines from 5% beginning at the time of purchase to 0% at the beginning of the seventh year. The CDSC on Class C shares is 1% for the first year after purchase. Class R, Class Y, Class R5 and Class R6 shares do not have a front-end sales charge or a CDSC; therefore, performance is at net asset value.
The performance of the Fund’s share classes will differ primarily due to different sales charge structures and class expenses.
| 1 | Total annual Fund operating expenses after any contractual fee waivers and/or expense reimbursements by the adviser in effect through at least June 30, 2016. See current prospectus for more information. |
7 Invesco Mid Cap Core Equity Fund
Invesco Mid Cap Core Equity Fund’s investment objective is long-term growth of capital.
| n | Unless otherwise stated, information presented in this report is as of December 31, 2014, and is based on total net assets. |
| n | Unless otherwise noted, all data provided by Invesco. |
| n | To access your Fund’s reports/prospectus, visit invesco.com/fundreports. |
About share classes
| n | Class B shares may not be purchased for new or additional investments. Please see the prospectus for more information. |
| n | Class R shares are generally available only to employer sponsored retirement and benefit plans. Please see the prospectus for more information. |
| n | Class Y shares are available only to certain investors. Please see the prospectus for more information. |
| n | Class R5 shares and Class R6 shares are primarily intended for employer sponsored retirement and benefit plans that meet certain standards and for institutional investors. Please see the prospectus for more information. |
Principal risks of investing in the Fund
| n | Cash/cash equivalents risk. Holding cash or cash equivalents may negatively affect performance. |
| n | Derivatives risk. The value of a derivative instrument depends largely on (and is derived from) the value of an underlying security, currency, commodity, interest rate, index or other asset (each referred to as an underlying asset). In addition to risks relating to the underlying assets, the use of derivatives may include other, possibly greater, risks, including counterparty, leverage and liquidity risks. Counterparty risk is the risk that the counterparty to the derivative contract will default on its obligation to pay the Fund the amount owed or otherwise perform under the derivative contract. Derivatives create leverage risk because they do not require payment up front equal to the economic exposure created by owning the derivative. As a result, an adverse change in the value of the underlying asset could result in the Fund sustaining a loss that is substantially greater than the amount invested in the derivative, which may make the Fund’s returns more volatile and increase the risk of loss. Derivative instruments may also be less liquid |
than more traditional investments and the Fund may be unable to sell or close out its derivative positions at a desirable time or price. This risk may be more acute under adverse market conditions, during which the Fund may be most in need of liquidating its derivative positions. Derivatives may also be harder to value, less tax efficient and subject to changing government regulation that could impact the Fund’s ability to use certain derivatives or their cost. Also, derivatives used for hedging or to gain or limit exposure to a particular market segment may not provide the expected benefits, particularly during adverse market conditions.
| n | Developing/emerging markets securities risk. The prices of securities issued by foreign companies and governments located in developing/emerging market countries may be affected more negatively by inflation, devaluation of their currencies, higher transaction costs, delays in settlement, adverse political developments, the introduction of capital controls, withholding taxes, nationalization of private assets, expropriation, social unrest, war or lack of timely information than those in developed countries. |
| n | Foreign securities risk. The Fund’s foreign investments may be affected by changes in a foreign country’s exchange rates, political and social instability, changes in economic or taxation policies, difficulties when enforcing obligations, decreased liquidity, and increased volatility. Foreign companies may be subject to less regulation resulting in less publicly available information about the companies. |
| n | Management risk. The investment techniques and risk analysis used by the Fund’s portfolio managers may not produce the desired results. |
| n | Market risk. The prices of and the income generated by the Fund’s securities may decline in response to, among other things, investor sentiment, general economic and market conditions, regional or global instability, and currency and interest rate fluctuations. |
This report must be accompanied or preceded by a currently effective Fund prospectus, which contains more complete information, including sales charges and expenses. Investors should read it carefully before investing.
NOT FDIC INSURED | MAY LOSE VALUE | NO BANK GUARANTEE
| n | Small- and mid-capitalization risks. Stocks of small- and mid-sized companies tend to be more vulnerable to adverse developments and may have little or no operating history or track record of success, and limited product lines, markets, management and financial resources. The securities of small- and mid-sized companies may be more volatile due to less market interest and less publicly available information about the issuer. They also may be illiquid or restricted as to resale, or may trade less frequently and in smaller volumes, all of which may cause difficulty when establishing or closing a position at a desirable price. |
About indexes used in this report
| n | The S&P 500® Index is an unmanaged index considered representative of the US stock market. |
| n | The Russell Midcap® Index is an unmanaged index considered representative of mid-cap stocks. The Russell Midcap Index is a trademark/service mark of the Frank Russell Co. Russell® is a trademark of the Frank Russell Co. |
| n | The Lipper Mid-Cap Core Funds Index is an unmanaged index considered representative of mid-cap core funds tracked by Lipper. |
| n | The Fund is not managed to track the performance of any particular index, including the index(es) described here, and consequently, the performance of the Fund may deviate significantly from the performance of the index(es). |
| n | A direct investment cannot be made in an index. Unless otherwise indicated, index results include reinvested dividends, and they do not reflect sales charges. Performance of the peer group, if applicable, reflects fund expenses; performance of a market index does not. |
Other information
| n | The returns shown in management’s discussion of Fund performance are based on net asset values (NAVs) calculated for shareholder transactions. Generally accepted accounting principles require adjustments to be made to the net assets of the Fund at period end for financial reporting purposes, and as |
continued on page 6
8 Invesco Mid Cap Core Equity Fund
Schedule of Investments(a)
December 31, 2014
| Shares | Value | |||||||
Common Stocks–82.80% |
| |||||||
| Apparel Retail–0.80% | ||||||||
Abercrombie & Fitch Co.–Class A | 678,528 | $ | 19,433,042 | |||||
| Apparel, Accessories & Luxury Goods–1.57% | ||||||||
Prada S.p.A. (Italy) | 1,889,300 | 10,707,804 | ||||||
PVH Corp. | 212,369 | 27,219,334 | ||||||
| 37,927,138 | ||||||||
| Asset Management & Custody Banks–2.16% | ||||||||
Northern Trust Corp. | 774,218 | 52,182,293 | ||||||
| Auto Parts & Equipment–1.75% | ||||||||
Dana Holding Corp. | 1,949,067 | 42,372,717 | ||||||
| Brewers–1.43% | ||||||||
Molson Coors Brewing Co.–Class B | 462,941 | 34,498,363 | ||||||
| Communications Equipment–3.58% | ||||||||
F5 Networks, Inc.(b) | 354,962 | 46,310,118 | ||||||
Juniper Networks, Inc. | 1,120,551 | 25,010,698 | ||||||
Polycom, Inc.(b) | 1,129,722 | 15,251,247 | ||||||
| 86,572,063 | ||||||||
| Computer & Electronics Retail–0.88% | ||||||||
GameStop Corp.–Class A | 633,533 | 21,413,415 | ||||||
| Construction & Engineering–0.74% | ||||||||
Chicago Bridge & Iron Co. N.V. | 423,709 | 17,787,304 | ||||||
| Construction Materials–0.93% | ||||||||
CRH PLC (Ireland) | 938,996 | 22,611,953 | ||||||
| Data Processing & Outsourced Services–0.80% | ||||||||
Jack Henry & Associates, Inc. | 309,898 | 19,257,062 | ||||||
| Department Stores–0.57% | ||||||||
Macy’s, Inc. | 209,480 | 13,773,310 | ||||||
| Education Services–0.52% | ||||||||
Houghton Mifflin Harcourt Co.(b) | 606,581 | 12,562,293 | ||||||
| Electrical Components & Equipment–1.14% | ||||||||
Regal-Beloit Corp. | 366,459 | 27,557,717 | ||||||
| Electronic Components–2.00% | ||||||||
Amphenol Corp.–Class A | 900,794 | 48,471,725 | ||||||
| Electronic Equipment & Instruments–0.42% | ||||||||
Keysight Technologies, Inc.(b) | 300,040 | 10,132,351 | ||||||
| Environmental & Facilities Services–1.14% | ||||||||
Republic Services, Inc. | 684,652 | 27,557,243 | ||||||
| Footwear–0.48% | ||||||||
Wolverine World Wide, Inc. | 394,633 | 11,629,835 | ||||||
| Shares | Value | |||||||
| General Merchandise Stores–0.46% | ||||||||
Tuesday Morning Corp.(b) | 514,482 | $ | 11,164,259 | |||||
| Health Care Distributors–1.07% | ||||||||
Cardinal Health, Inc. | 321,883 | 25,985,615 | ||||||
| Health Care Equipment–1.69% | ||||||||
ResMed Inc. | 731,657 | 41,016,691 | ||||||
| Health Care Facilities–2.96% | ||||||||
Community Health Systems Inc.(b) | 735,536 | 39,660,101 | ||||||
Tenet Healthcare Corp.(b) | 631,498 | 31,998,004 | ||||||
| 71,658,105 | ||||||||
| Homebuilding–1.00% | ||||||||
D.R. Horton, Inc. | 956,929 | 24,200,734 | ||||||
| Hotels, Resorts & Cruise Lines–1.43% | ||||||||
Norwegian Cruise Line Holdings Ltd.(b) | 741,101 | 34,653,883 | ||||||
| Human Resource & Employment Services–0.32% | ||||||||
ManpowerGroup Inc. | 112,940 | 7,699,120 | ||||||
| Industrial Machinery–7.33% | ||||||||
ITT Corp. | 509,306 | 20,606,521 | ||||||
Kennametal Inc. | 749,669 | 26,830,653 | ||||||
Lincoln Electric Holdings, Inc. | 336,495 | 23,248,440 | ||||||
SKF AB–Class B (Sweden) | 1,417,848 | 29,827,790 | ||||||
Stanley Black & Decker Inc. | 532,627 | 51,174,802 | ||||||
Xylem, Inc. | 671,902 | 25,579,309 | ||||||
| 177,267,515 | ||||||||
| Insurance Brokers–1.70% | ||||||||
Brown & Brown, Inc. | 1,248,435 | 41,085,996 | ||||||
| Life & Health Insurance–2.20% | ||||||||
Torchmark Corp. | 984,196 | 53,313,897 | ||||||
| Life Sciences Tools & Services–2.20% | ||||||||
Agilent Technologies, Inc. | 600,080 | 24,567,275 | ||||||
Waters Corp.(b) | 254,799 | 28,720,943 | ||||||
| 53,288,218 | ||||||||
| Marine–0.97% | ||||||||
Kirby Corp.(b) | 292,015 | 23,577,291 | ||||||
| Multi-Utilities–1.08% | ||||||||
CMS Energy Corp. | 754,608 | 26,222,628 | ||||||
| Oil & Gas Drilling–0.51% | ||||||||
Nabors Industries Ltd. | 945,596 | 12,273,836 | ||||||
| Oil & Gas Equipment & Services–2.56% | ||||||||
Cameron International Corp.(b) | 647,373 | 32,336,281 | ||||||
Dril-Quip, Inc.(b) | 201,909 | 15,492,478 | ||||||
See accompanying Notes to Financial Statements which are an integral part of the financial statements.
9 Invesco Mid Cap Core Equity Fund
| Shares | Value | |||||||
| Oil & Gas Equipment & Services–(continued) | ||||||||
TETRA Technologies, Inc.(b) | 2,114,269 | $ | 14,123,317 | |||||
| 61,952,076 | ||||||||
| Oil & Gas Exploration & Production–2.62% | ||||||||
Concho Resources Inc.(b) | 273,049 | 27,236,638 | ||||||
Ultra Petroleum Corp.(b) | 1,064,204 | 14,004,924 | ||||||
Vermilion Energy, Inc. (Canada) | 450,007 | 22,078,154 | ||||||
| 63,319,716 | ||||||||
| Packaged Foods & Meats–2.47% | ||||||||
Hain Celestial Group, Inc. (The)(b) | 580,042 | 33,810,648 | ||||||
JM Smucker Co. (The) | 256,880 | 25,939,743 | ||||||
| 59,750,391 | ||||||||
| Paper Packaging–1.28% | ||||||||
Packaging Corp. of America | 397,170 | 30,999,118 | ||||||
| Pharmaceuticals–4.28% | ||||||||
Endo International PLC(b) | 516,519 | 37,251,350 | ||||||
Perrigo Co. PLC | 186,670 | 31,203,757 | ||||||
Salix Pharmaceuticals, Ltd.(b) | 305,051 | 35,062,562 | ||||||
| 103,517,669 | ||||||||
| Property & Casualty Insurance–4.34% | ||||||||
Arch Capital Group Ltd.(b) | 754,000 | 44,561,400 | ||||||
Progressive Corp. (The) | 2,238,740 | 60,423,593 | ||||||
| 104,984,993 | ||||||||
| Regional Banks–1.89% | ||||||||
First Republic Bank | 879,231 | 45,825,520 | ||||||
| Restaurants–0.63% | ||||||||
Brinker International, Inc. | 259,997 | 15,259,224 | ||||||
| Semiconductor Equipment–4.43% | ||||||||
KLA-Tencor Corp. | 288,577 | 20,292,735 | ||||||
Lam Research Corp. | 473,067 | 37,533,136 | ||||||
Teradyne, Inc. | 2,491,946 | 49,315,611 | ||||||
| 107,141,482 | ||||||||
| Shares | Value | |||||||
| Semiconductors–3.93% | ||||||||
Linear Technology Corp. | 1,266,715 | $ | 57,762,204 | |||||
Xilinx, Inc. | 860,307 | 37,242,690 | ||||||
| 95,004,894 | ||||||||
| Specialized Finance–2.16% | ||||||||
Moody’s Corp. | 546,201 | 52,331,518 | ||||||
| Specialty Chemicals–2.40% | ||||||||
Cytec Industries Inc. | 531,195 | 24,525,273 | ||||||
International Flavors & Fragrances Inc. | 330,162 | 33,465,220 | ||||||
| 57,990,493 | ||||||||
| Specialty Stores–1.24% | ||||||||
Dick’s Sporting Goods, Inc. | 602,186 | 29,898,535 | ||||||
| Technology Hardware, Storage & Peripherals–1.81% | ||||||||
NetApp, Inc. | 1,056,562 | 43,794,495 | ||||||
| Trading Companies & Distributors–0.93% | ||||||||
WESCO International, Inc.(b) | 294,675 | 22,457,182 | ||||||
Total Common Stocks |
| 2,003,374,918 | ||||||
Money Market Funds–17.42% |
| |||||||
Liquid Assets Portfolio–Institutional Class(c) | 210,792,206 | 210,792,206 | ||||||
Premier Portfolio–Institutional Class(c) | 210,792,205 | 210,792,205 | ||||||
Total Money Market Funds |
| 421,584,411 | ||||||
TOTAL INVESTMENTS–100.22% |
| 2,424,959,329 | ||||||
OTHER ASSETS LESS LIABILITIES–(0.22)% |
| (5,439,704 | ) | |||||
NET ASSETS–100.00% |
| $ | 2,419,519,625 | |||||
Notes to Schedule of Investments:
| (a) | Industry and/or sector classifications used in this report are generally according to the Global Industry Classification Standard, which -was developed by and is the exclusive property and a service mark of MSCI Inc. and Standard & Poor’s. |
| (b) | Non-income producing security. |
| (c) | The money market fund and the Fund are affiliated by having the same investment adviser. |
See accompanying Notes to Financial Statements which are an integral part of the financial statements.
10 Invesco Mid Cap Core Equity Fund
Statement of Assets and Liabilities
December 31, 2014
Assets: |
| |||
Investments, at value (Cost $1,507,045,560) | $ | 2,003,374,918 | ||
Investments in affiliated money market funds, at value and cost | 421,584,411 | |||
Total investments, at value (Cost $1,928,629,971) | 2,424,959,329 | |||
Foreign currencies, at value (Cost $71,416) | 71,120 | |||
Receivable for: | ||||
Fund shares sold | 5,250,438 | |||
Dividends | 1,576,085 | |||
Investment for trustee deferred compensation and retirement plans | 445,468 | |||
Other assets | 82,944 | |||
Total assets | 2,432,385,384 | |||
Liabilities: |
| |||
Payable for: | ||||
Fund shares reacquired | 10,566,528 | |||
Accrued fees to affiliates | 1,644,096 | |||
Accrued trustees’ and officers’ fees and benefits | 1,111 | |||
Accrued other operating expenses | 129,595 | |||
Trustee deferred compensation and retirement plans | 524,429 | |||
Total liabilities | 12,865,759 | |||
Net assets applicable to shares outstanding | $ | 2,419,519,625 | ||
Net assets consist of: |
| |||
Shares of beneficial interest | $ | 1,920,133,821 | ||
Undistributed net investment income | 1,294,154 | |||
Undistributed net realized gain | 1,762,539 | |||
Net unrealized appreciation | 496,329,111 | |||
| $ | 2,419,519,625 | |||
Net Assets: |
| |||
Class A | $ | 1,155,634,679 | ||
Class B | $ | 25,115,407 | ||
Class C | $ | 180,461,323 | ||
Class R | $ | 99,552,029 | ||
Class Y | $ | 808,894,929 | ||
Class R5 | $ | 146,211,021 | ||
Class R6 | $ | 3,650,237 | ||
Shares outstanding, $0.01 par value per share, |
| |||
Class A | 49,129,871 | |||
Class B | 1,504,141 | |||
Class C | 10,842,129 | |||
Class R | 4,350,559 | |||
Class Y | 34,046,809 | |||
Class R5 | 5,821,712 | |||
Class R6 | 145,173 | |||
Class A: | ||||
Net asset value per share | $ | 23.52 | ||
Maximum offering price per share | ||||
(Net asset value of $23.52 ¸ 94.50%) | $ | 24.89 | ||
Class B: | ||||
Net asset value and offering price per share | $ | 16.70 | ||
Class C: | ||||
Net asset value and offering price per share | $ | 16.64 | ||
Class R: | ||||
Net asset value and offering price per share | $ | 22.88 | ||
Class Y: | ||||
Net asset value and offering price per share | $ | 23.76 | ||
Class R5: | ||||
Net asset value and offering price per share | $ | 25.11 | ||
Class R6: | ||||
Net asset value and offering price per share | $ | 25.14 | ||
See accompanying Notes to Financial Statements which are an integral part of the financial statements.
11 Invesco Mid Cap Core Equity Fund
Statement of Operations
For the year ended December 31, 2014
Investment income: |
| |||
Dividends (net of foreign withholding taxes of $201,200) | $ | 33,846,271 | ||
Dividends from affiliated money market funds | 165,122 | |||
Total investment income | 34,011,393 | |||
Expenses: | ||||
Advisory fees | 17,282,493 | |||
Administrative services fees | 510,650 | |||
Custodian fees | 77,256 | |||
Distribution fees: | ||||
Class A | 3,237,129 | |||
Class B | 296,362 | |||
Class C | 1,951,903 | |||
Class R | 570,638 | |||
Transfer agent fees — A, B, C, R and Y | 5,118,363 | |||
Transfer agent fees — R5 | 179,697 | |||
Transfer agent fees — R6 | 354 | |||
Trustees’ and officers’ fees and benefits | 72,329 | |||
Other | 537,088 | |||
Total expenses | 29,834,262 | |||
Less: Fees waived and expense offset arrangement(s) | (615,123 | ) | ||
Net expenses | 29,219,139 | |||
Net investment income | 4,792,254 | |||
Realized and unrealized gain (loss) from: | ||||
Net realized gain (loss) from: | ||||
Investment securities (includes net gains from securities sold to affiliates of $1,289,225) | 205,506,436 | |||
Foreign currencies | (65,012 | ) | ||
| 205,441,424 | ||||
Change in net unrealized appreciation (depreciation) of: | ||||
Investment securities | (95,299,597 | ) | ||
Foreign currencies | (248 | ) | ||
| (95,299,845 | ) | |||
Net realized and unrealized gain | 110,141,579 | |||
Net increase in net assets resulting from operations | $ | 114,933,833 | ||
See accompanying Notes to Financial Statements which are an integral part of the financial statements.
12 Invesco Mid Cap Core Equity Fund
Statement of Changes in Net Assets
For the years ended December 31, 2014 and 2013
| 2014 | 2013 | |||||||
Operations: |
| |||||||
Net investment income (loss) | $ | 4,792,254 | $ | (879,447 | ) | |||
Net realized gain | 205,441,424 | 269,818,036 | ||||||
Change in net unrealized appreciation (depreciation) | (95,299,845 | ) | 383,299,597 | |||||
Net increase in net assets resulting from operations | 114,933,833 | 652,238,186 | ||||||
Distributions to shareholders from net investment income: | ||||||||
Class A | (67,089 | ) | — | |||||
Class Y | (2,266,788 | ) | — | |||||
Class R5 | (556,116 | ) | — | |||||
Class R6 | (17,056 | ) | — | |||||
Total distributions from net investment income | (2,907,049 | ) | — | |||||
Distributions to shareholders from net realized gains: | ||||||||
Class A | (122,026,362 | ) | (117,282,912 | ) | ||||
Class B | (3,623,743 | ) | (3,796,540 | ) | ||||
Class C | (25,836,129 | ) | (22,409,467 | ) | ||||
Class R | (10,929,551 | ) | (10,813,336 | ) | ||||
Class Y | (83,013,129 | ) | (54,269,126 | ) | ||||
Class R5 | (14,313,691 | ) | (17,858,370 | ) | ||||
Class R6 | (355,488 | ) | (698,489 | ) | ||||
Total distributions from net realized gains | (260,098,093 | ) | (227,128,240 | ) | ||||
Share transactions–net: | ||||||||
Class A | (161,690,874 | ) | (210,837,562 | ) | ||||
Class B | (6,226,018 | ) | (8,146,662 | ) | ||||
Class C | (3,929,073 | ) | (13,943,597 | ) | ||||
Class R | (19,084,069 | ) | (22,609,882 | ) | ||||
Class Y | 210,460,029 | 94,842,358 | ||||||
Class R5 | (69,900,736 | ) | (79,069,622 | ) | ||||
Class R6 | (402,498 | ) | 4,228,034 | |||||
Net increase (decrease) in net assets resulting from share transactions | (50,773,239 | ) | (235,536,933 | ) | ||||
Net increase (decrease) in net assets | (198,844,548 | ) | 189,573,013 | |||||
Net assets: | ||||||||
Beginning of year | 2,618,364,173 | 2,428,791,160 | ||||||
End of year (includes undistributed net investment income (loss) of $1,294,154 and $(509,971), respectively) | $ | 2,419,519,625 | $ | 2,618,364,173 | ||||
Notes to Financial Statements
December 31, 2014
NOTE 1—Significant Accounting Policies
Invesco Mid Cap Core Equity Fund (the “Fund”) is a series portfolio of AIM Growth Series (Invesco Growth Series) (the “Trust”). The Trust is organized as a Delaware statutory trust and is registered under the Investment Company Act of 1940, as amended (the “1940 Act”), as an open-end series management investment company consisting of seventeen separate series portfolios, each authorized to issue an unlimited number of shares of beneficial interest. The assets, liabilities and operations of each portfolio are accounted for separately. Information presented in these financial statements pertains only to the Fund. Matters affecting each portfolio or class will be voted on exclusively by the shareholders of such portfolio or class.
The Fund’s investment objective is long-term growth of capital.
The Fund currently consists of seven different classes of shares: Class A, Class B, Class C, Class R, Class Y, Class R5 and Class R6. Class A shares are sold with a front-end sales charge unless certain waiver criteria are met and under certain circumstances load waived shares may be subject to contingent deferred sales charges (“CDSC”). Class C shares are sold with a CDSC. Class R, Class Y, Class R5 and Class R6 shares are sold at net asset value. Effective November 30, 2010, new or additional investments in Class B shares are no longer permitted. Existing shareholders of Class B shares may continue to reinvest dividends and capital gains distributions in Class B shares until they convert to Class A shares. Also, shareholders in Class B shares will be able to exchange those shares for Class B shares of other Invesco Funds offering such shares until they convert to Class A shares.
13 Invesco Mid Cap Core Equity Fund
Generally, Class B shares will automatically convert to Class A shares on or about the month-end, which is at least eight years after the date of purchase. Redemption of Class B shares prior to the conversion date will be subject to a CDSC.
The following is a summary of the significant accounting policies followed by the Fund in the preparation of its financial statements.
| A. | Security Valuations — Securities, including restricted securities, are valued according to the following policy. |
A security listed or traded on an exchange (except convertible securities) is valued at its last sales price or official closing price as of the close of the customary trading session on the exchange where the security is principally traded, or lacking any sales or official closing price on a particular day, the security may be valued at the closing bid price on that day. Securities traded in the over-the-counter market are valued based on prices furnished by independent pricing services or market makers. When such securities are valued by an independent pricing service they may be considered fair valued. Futures contracts are valued at the final settlement price set by an exchange on which they are principally traded. Listed options are valued at the mean between the last bid and ask prices from the exchange on which they are principally traded. Options not listed on an exchange are valued by an independent source at the mean between the last bid and ask prices. For purposes of determining net asset value per share, futures and option contracts generally are valued 15 minutes after the close of the customary trading session of the New York Stock Exchange (“NYSE”).
Investments in open-end and closed-end registered investment companies that do not trade on an exchange are valued at the end of day net asset value per share. Investments in open-end and closed-end registered investment companies that trade on an exchange are valued at the last sales price or official closing price as of the close of the customary trading session on the exchange where the security is principally traded.
Debt obligations (including convertible securities) and unlisted equities are fair valued using an evaluated quote provided by an independent pricing service. Evaluated quotes provided by the pricing service may be determined without exclusive reliance on quoted prices, and may reflect appropriate factors such as institution-size trading in similar groups of securities, developments related to specific securities, dividend rate (for unlisted equities), yield (for debt obligations), quality, type of issue, coupon rate (for debt obligations), maturity (for debt obligations), individual trading characteristics and other market data. Debt obligations are subject to interest rate and credit risks. In addition, all debt obligations involve some risk of default with respect to interest and/or principal payments.
Foreign securities’ (including foreign exchange contracts) prices are converted into U.S. dollar amounts using the applicable exchange rates as of the close of the NYSE. If market quotations are available and reliable for foreign exchange-traded equity securities, the securities will be valued at the market quotations. Because trading hours for certain foreign securities end before the close of the NYSE, closing market quotations may become unreliable. If between the time trading ends on a particular security and the close of the customary trading session on the NYSE, events occur that the Adviser determines are significant and make the closing price unreliable, the Fund may fair value the security. If the event is likely to have affected the closing price of the security, the security will be valued at fair value in good faith using procedures approved by the Board of Trustees. Adjustments to closing prices to reflect fair value may also be based on a screening process of an independent pricing service to indicate the degree of certainty, based on historical data, that the closing price in the principal market where a foreign security trades is not the current value as of the close of the NYSE. Foreign securities’ prices meeting the approved degree of certainty that the price is not reflective of current value will be priced at the indication of fair value from the independent pricing service. Multiple factors may be considered by the independent pricing service in determining adjustments to reflect fair value and may include information relating to sector indices, American Depositary Receipts and domestic and foreign index futures. Foreign securities may have additional risks including exchange rate changes, potential for sharply devalued currencies and high inflation, political and economic upheaval, the relative lack of issuer information, relatively low market liquidity and the potential lack of strict financial and accounting controls and standards.
Securities for which market prices are not provided by any of the above methods may be valued based upon quotes furnished by independent sources. The last bid price may be used to value equity securities. The mean between the last bid and ask prices is used to value debt obligations, including corporate loans.
Securities for which market quotations are not readily available or became unreliable are valued at fair value as determined in good faith by or under the supervision of the Trust’s officers following procedures approved by the Board of Trustees. Issuer specific events, market trends, bid/ask quotes of brokers and information providers and other market data may be reviewed in the course of making a good faith determination of a security’s fair value.
The Fund may invest in securities that are subject to interest rate risk, meaning the risk that the prices will generally fall as interest rates rise and, conversely, the prices will generally rise as interest rates fall. Specific securities differ in their sensitivity to changes in interest rates depending on their individual characteristics. Changes in interest rates may result in increased market volatility, which may affect the value and/or liquidity of certain of the Fund’s investments.
Valuations change in response to many factors including the historical and prospective earnings of the issuer, the value of the issuer’s assets, general economic conditions, interest rates, investor perceptions and market liquidity. Because of the inherent uncertainties of valuation, the values reflected in the financial statements may materially differ from the value received upon actual sale of those investments.
| B. | Securities Transactions and Investment Income — Securities transactions are accounted for on a trade date basis. Realized gains or losses on sales are computed on the basis of specific identification of the securities sold. Interest income (net of withholding tax, if any) is recorded on the accrual basis from settlement date. Dividend income (net of withholding tax, if any) is recorded on the ex-dividend date. |
The Fund may periodically participate in litigation related to Fund investments. As such, the Fund may receive proceeds from litigation settlements. Any proceeds received are included in the Statement of Operations as realized gain (loss) for investments no longer held and as unrealized gain (loss) for investments still held.
Brokerage commissions and mark ups are considered transaction costs and are recorded as an increase to the cost basis of securities purchased and/or a reduction of proceeds on a sale of securities. Such transaction costs are included in the determination of net realized and unrealized gain (loss) from investment securities reported in the Statement of Operations and the Statement of Changes in Net Assets and the net realized and unrealized gains (losses) on securities per share in the Financial Highlights. Transaction costs are included in the calculation of the Fund’s net asset value and, accordingly, they reduce the Fund’s total returns. These transaction costs are not considered operating expenses and are not reflected in net investment income reported in the Statement of Operations and Statement of Changes in Net Assets, or the net investment income per share and ratios of expenses and net investment income reported in the Financial Highlights, nor are they limited by any expense limitation arrangements between the Fund and the investment adviser.
14 Invesco Mid Cap Core Equity Fund
The Fund allocates income and realized and unrealized capital gains and losses to a class based on the relative net assets of each class.
| C. | Country Determination — For the purposes of making investment selection decisions and presentation in the Schedule of Investments, the investment adviser may determine the country in which an issuer is located and/or credit risk exposure based on various factors. These factors include the laws of the country under which the issuer is organized, where the issuer maintains a principal office, the country in which the issuer derives 50% or more of its total revenues and the country that has the primary market for the issuer’s securities, as well as other criteria. Among the other criteria that may be evaluated for making this determination are the country in which the issuer maintains 50% or more of its assets, the type of security, financial guarantees and enhancements, the nature of the collateral and the sponsor organization. Country of issuer and/or credit risk exposure has been determined to be the United States of America, unless otherwise noted. |
| D. | Distributions — Distributions from net investment income and net realized capital gain, if any, are generally declared and paid annually and recorded on the ex-dividend date. The Fund may elect to treat a portion of the proceeds from redemptions as distributions for federal income tax purposes. |
| E. | Federal Income Taxes — The Fund intends to comply with the requirements of Subchapter M of the Internal Revenue Code of 1986, as amended (the “Internal Revenue Code”), necessary to qualify as a regulated investment company and to distribute substantially all of the Fund’s taxable earnings to shareholders. As such, the Fund will not be subject to federal income taxes on otherwise taxable income (including net realized capital gain) that is distributed to shareholders. Therefore, no provision for federal income taxes is recorded in the financial statements. |
The Fund recognizes the tax benefits of uncertain tax positions only when the position is more likely than not to be sustained. Management has analyzed the Fund’s uncertain tax positions and concluded that no liability for unrecognized tax benefits should be recorded related to uncertain tax positions. Management is not aware of any tax positions for which it is reasonably possible that the total amounts of unrecognized tax benefits will change materially in the next 12 months.
The Fund files tax returns in the U.S. Federal jurisdiction and certain other jurisdictions. Generally, the Fund is subject to examinations by such taxing authorities for up to three years after the filing of the return for the tax period.
| F. | Expenses — Fees provided for under the Rule 12b-1 plan of a particular class of the Fund are charged to the operations of such class. Transfer agency fees and expenses and other shareholder recordkeeping fees and expenses attributable to Class R5 and Class R6 are allocated to each share class based on relative net assets. Sub-accounting fees attributable to Class R5 are charged to the operations of the class. Transfer agency fees and expenses and other shareholder recordkeeping fees and expenses relating to all other classes are allocated among those classes based on relative net assets. All other expenses are allocated among the classes based on relative net assets. |
| G. | Accounting Estimates — The preparation of financial statements in conformity with accounting principles generally accepted in the United States of America (“GAAP”) requires management to make estimates and assumptions that affect the reported amounts of assets and liabilities at the date of the financial statements and the reported amounts of revenues and expenses during the reporting period including estimates and assumptions related to taxation. Actual results could differ from those estimates by a significant amount. In addition, the Fund monitors for material events or transactions that may occur or become known after the period-end date and before the date the financial statements are released to print. |
| H. | Indemnifications — Under the Trust’s organizational documents, each Trustee, officer, employee or other agent of the Trust is indemnified against certain liabilities that may arise out of the performance of their duties to the Fund. Additionally, in the normal course of business, the Fund enters into contracts, including the Fund’s servicing agreements, that contain a variety of indemnification clauses. The Fund’s maximum exposure under these arrangements is unknown as this would involve future claims that may be made against the Fund that have not yet occurred. The risk of material loss as a result of such indemnification claims is considered remote. |
| I. | Foreign Currency Translations — Foreign currency is valued at the close of the NYSE based on quotations posted by banks and major currency dealers. Portfolio securities and other assets and liabilities denominated in foreign currencies are translated into U.S. dollar amounts at date of valuation. Purchases and sales of portfolio securities (net of foreign taxes withheld on disposition) and income items denominated in foreign currencies are translated into U.S. dollar amounts on the respective dates of such transactions. The Fund does not separately account for the portion of the results of operations resulting from changes in foreign exchange rates on investments and the fluctuations arising from changes in market prices of securities held. The combined results of changes in foreign exchange rates and the fluctuation of market prices on investments (net of estimated foreign tax withholding) are included with the net realized and unrealized gain or loss from investments in the Statement of Operations. Reported net realized foreign currency gains or losses arise from (1) sales of foreign currencies, (2) currency gains or losses realized between the trade and settlement dates on securities transactions, and (3) the difference between the amounts of dividends, interest, and foreign withholding taxes recorded on the Fund’s books and the U.S. dollar equivalent of the amounts actually received or paid. Net unrealized foreign currency gains and losses arise from changes in the fair values of assets and liabilities, other than investments in securities at fiscal period end, resulting from changes in exchange rates. |
The Fund may invest in foreign securities, which may be subject to foreign taxes on income, gains on investments or currency repatriation, a portion of which may be recoverable. Foreign taxes, if any, are recorded based on the tax regulations and rates that exist in the foreign markets in which the Fund invests and are shown in the Statement of Operations.
| J. | Forward Foreign Currency Contracts — The Fund may engage in foreign currency transactions either on a spot (i.e. for prompt delivery and settlement) basis or through forward foreign currency contracts to manage or minimize currency or exchange rate risk. |
The Fund may also enter into forward foreign currency contracts for the purchase or sale of a security denominated in a foreign currency in order to “lock in” the U.S. dollar price of that security, or the Fund may also enter into forward foreign currency contracts that do not provide for physical settlement of the two currencies, but instead are settled by a single cash payment calculated as the difference between the agreed upon exchange rate and the spot rate at settlement based upon an agreed upon notional amount (non-deliverable forwards). The Fund will set aside liquid assets in an amount equal to daily mark-to-market obligation for forward foreign currency contracts.
A forward foreign currency contract is an obligation between two parties (“Counterparties”) to purchase or sell a specific currency for an agreed-upon price at a future date. The use of forward foreign currency contracts does not eliminate fluctuations in the price of the underlying securities the Fund owns or intends to acquire but establishes a rate of exchange in advance. Fluctuations in the value of these contracts are measured by the difference in the contract date and reporting date exchange rates and are recorded as unrealized appreciation (depreciation) until the contracts are closed. When the contracts are closed, realized gains (losses) are recorded. Realized and unrealized gains (losses) on the
15 Invesco Mid Cap Core Equity Fund
contracts are included in the Statement of Operations. The primary risks associated with forward foreign currency contracts include failure of the Counterparty to meet the terms of the contract and the value of the foreign currency changing unfavorably. These risks may be in excess of the amounts reflected in the Statement of Assets and Liabilities.
NOTE 2—Advisory Fees and Other Fees Paid to Affiliates
The Trust has entered into a master investment advisory agreement with Invesco Advisers, Inc. (the “Adviser” or “Invesco”). Under the terms of the investment advisory agreement, the Fund pays an advisory fee to the Adviser based on the annual rate of the Fund’s average daily net assets as follows:
| Average Daily Net Assets | Rate | |||||
First $500 million | 0 | .725% | ||||
Next $500 million | 0 | .70% | ||||
Next $500 million | 0 | .675% | ||||
Over $1.5 billion | 0 | .65% | ||||
For the year ended December 31, 2014, the effective advisory fees incurred by the Fund was 0.68%.
Under the terms of a master sub-advisory agreement between the Adviser and each of Invesco Asset Management Deutschland GmbH, Invesco Asset Management Limited, Invesco Asset Management (Japan) Limited, Invesco Australia Limited, Invesco Hong Kong Limited, Invesco Senior Secured Management, Inc. and Invesco Canada Ltd. (collectively, the “Affiliated Sub-Advisers”) the Adviser, not the Fund, may pay 40% of the fees paid to the Adviser to any such Affiliated Sub-Adviser(s) that provide(s) discretionary investment management services to the Fund based on the percentage of assets allocated to such Sub-Adviser(s).
The Adviser has contractually agreed, through at least June 30, 2015, to waive advisory fees and/or reimburse expenses of all shares to the extent necessary to limit total annual fund operating expenses after fee waiver and/or expense reimbursement (excluding certain items discussed below) of Class A, Class B, Class C, Class R, Class Y, Class R5 and Class R6 shares to 2.00%, 2.75%, 2.75%, 2.25%, 1.75%, 1.75% and 1.75%, respectively, of average daily net assets. In determining the Adviser’s obligation to waive advisory fees and/or reimburse expenses, the following expenses are not taken into account, and could cause the total annual fund operating expenses after fee waiver and/or expense reimbursement to exceed the numbers reflected above: (1) interest; (2) taxes; (3) dividend expense on short sales; (4) extraordinary or non-routine items, including litigation expenses; and (5) expenses that the Fund has incurred but did not actually pay because of an expense offset arrangement. Unless Invesco continues the fee waiver agreement, it will terminate on June 30, 2015. The fee waiver agreement cannot be terminated during its term. The Adviser did not waive fees and/or reimburse expenses during the period under this limitation.
Further, the Adviser has contractually agreed, through at least June 30, 2016, to waive the advisory fee payable by the Fund in an amount equal to 100% of the net advisory fees the Adviser receives from the affiliated money market funds on investments by the Fund of uninvested cash in such affiliated money market funds.
For the year ended December 31, 2014, the Adviser waived advisory fees of $610,131.
The Trust has entered into a master administrative services agreement with Invesco pursuant to which the Fund has agreed to pay Invesco for certain administrative costs incurred in providing accounting services to the Fund. For the year ended December 31, 2014, expenses incurred under the agreement are shown in the Statement of Operations as Administrative services fees.
The Trust has entered into a transfer agency and service agreement with Invesco Investment Services, Inc. (“IIS”) pursuant to which the Fund has agreed to pay IIS a fee for providing transfer agency and shareholder services to the Fund and reimburse IIS for certain expenses incurred by IIS in the course of providing such services. IIS may make payments to intermediaries that provide omnibus account services, sub-accounting services and/or networking services. All fees payable by IIS to intermediaries that provide omnibus account services or sub-accounting are charged back to the Fund, subject to certain limitations approved by the Trust’s Board of Trustees. For the year ended December 31, 2014, expenses incurred under the agreement are shown in the Statement of Operations as Transfer agent fees.
The Trust has entered into master distribution agreements with Invesco Distributors, Inc. (“IDI”) to serve as the distributor for the Class A, Class B, Class C, Class R, Class Y, Class R5 and Class R6 shares of the Fund. The Trust has adopted plans pursuant to Rule 12b-1 under the 1940 Act with respect to the Fund’s Class A, Class B, Class C and Class R shares (collectively, the “Plans”). The Fund, pursuant to the Plans, pays IDI compensation at the annual rate of 0.25% of the Fund’s average daily net assets of Class A shares, 1.00% of the average daily net assets of Class B and Class C shares and 0.50% of the average daily net assets of Class R shares. Of the Plan payments, up to 0.25% of the average daily net assets of each class of shares may be paid to furnish continuing personal shareholder services to customers who purchase and own shares of such classes. Any amounts not paid as a service fee under the Plans would constitute an asset-based sales charge. Rules of the Financial Industry Regulatory Authority (“FINRA”) impose a cap on the total sales charges, including asset-based sales charges, that may be paid by any class of shares of the Fund. For the year ended December 31, 2014, expenses incurred under the Plans are shown in the Statement of Operations as Distribution fees.
Front-end sales commissions and CDSC (collectively, the “sales charges”) are not recorded as expenses of the Fund. Front-end sales commissions are deducted from proceeds from the sales of Fund shares prior to investment in Class A shares of the Fund. CDSC are deducted from redemption proceeds prior to remittance to the shareholder. During the year ended December 31, 2014, IDI advised the Fund that IDI retained $225,066 in front-end sales commissions from the sale of Class A shares and $2,680, $19,025 and $5,103 from Class A, Class B and Class C shares, respectively, for CDSC imposed on redemptions by shareholders.
For the year ended December 31, 2014, the Fund incurred $4,374 in brokerage commissions with Invesco Capital Markets, Inc., an affiliate of the Adviser and IDI, for portfolio transactions executed on behalf of the Fund.
Certain officers and trustees of the Trust are officers and directors of the Adviser, IIS and/or IDI.
16 Invesco Mid Cap Core Equity Fund
NOTE 3—Additional Valuation Information
GAAP defines fair value as the price that would be received to sell an asset or paid to transfer a liability in an orderly transaction between market participants at the measurement date, under current market conditions. GAAP establishes a hierarchy that prioritizes the inputs to valuation methods, giving the highest priority to readily available unadjusted quoted prices in an active market for identical assets (Level 1) and the lowest priority to significant unobservable inputs (Level 3), generally when market prices are not readily available or are unreliable. Based on the valuation inputs, the securities or other investments are tiered into one of three levels. Changes in valuation methods may result in transfers in or out of an investment’s assigned level:
| Level 1 — | Prices are determined using quoted prices in an active market for identical assets. |
| Level 2 — | Prices are determined using other significant observable inputs. Observable inputs are inputs that other market participants may use in pricing a security. These may include quoted prices for similar securities, interest rates, prepayment speeds, credit risk, yield curves, loss severities, default rates, discount rates, volatilities and others. |
| Level 3 — | Prices are determined using significant unobservable inputs. In situations where quoted prices or observable inputs are unavailable (for example, when there is little or no market activity for an investment at the end of the period), unobservable inputs may be used. Unobservable inputs reflect the Fund’s own assumptions about the factors market participants would use in determining fair value of the securities or instruments and would be based on the best available information. |
The following is a summary of the tiered valuation input levels, as of December 31, 2014. The level assigned to the securities valuations may not be an indication of the risk or liquidity associated with investing in those securities. Because of the inherent uncertainties of valuation, the values reflected in the financial statements may materially differ from the value received upon actual sale of those investments.
| Level 1 | Level 2 | Level 3 | Total | |||||||||||||
Equity Securities | $ | 2,395,131,539 | $ | 29,827,790 | $ | — | $ | 2,424,959,329 | ||||||||
NOTE 4—Security Transactions with Affiliated Funds
The Fund is permitted to purchase or sell securities from or to certain other Invesco Funds under specified conditions outlined in procedures adopted by the Board of Trustees of the Trust. The procedures have been designed to ensure that any purchase or sale of securities by the Fund from or to another fund or portfolio that is or could be considered an affiliate by virtue of having a common investment adviser (or affiliated investment advisers), common Trustees and/or common officers complies with Rule 17a-7 of the 1940 Act. Further, as defined under the procedures, each transaction is effected at the current market price. Pursuant to these procedures, for the year ended December 31, 2014, the Fund engaged in securities purchases of $5,143,500 and securities sales of $5,687,500, which resulted in net realized gains of $1,289,225.
NOTE 5—Expense Offset Arrangement(s)
The expense offset arrangement is comprised of transfer agency credits which result from balances in demand deposit accounts used by the transfer agent for clearing shareholder transactions. For the year ended December 31, 2014, the Fund received credits from this arrangement, which resulted in the reduction of the Fund’s total expenses of $4,992.
NOTE 6—Trustees’ and Officers’ Fees and Benefits
Trustees’ and Officers’ Fees and Benefits include amounts accrued by the Fund to pay remuneration to certain Trustees and Officers of the Fund. Trustees have the option to defer compensation payable by the Fund, and Trustees’ and Officers’ Fees and Benefits also include amounts accrued by the Fund to fund such deferred compensation amounts. Those Trustees who defer compensation have the option to select various Invesco Funds in which their deferral accounts shall be deemed to be invested. Finally, certain current Trustees were eligible to participate in a retirement plan that provided for benefits to be paid upon retirement to Trustees over a period of time based on the number of years of service. The Fund may have certain former Trustees who also participate in a retirement plan and receive benefits under such plan. Trustees’ and Officers’ Fees and Benefits include amounts accrued by the Fund to fund such retirement benefits. Obligations under the deferred compensation and retirement plans represent unsecured claims against the general assets of the Fund.
NOTE 7—Cash Balances
The Fund is permitted to temporarily carry a negative or overdrawn balance in its account with State Street Bank and Trust Company, the custodian bank. Such balances, if any at period end, are shown in the Statement of Assets and Liabilities under the payable caption Amount due custodian. To compensate the custodian bank for such overdrafts, the overdrawn Fund may either (1) leave funds as a compensating balance in the account so the custodian bank can be compensated by earning the additional interest; or (2) compensate by paying the custodian bank at a rate agreed upon by the custodian bank and Invesco, not to exceed the contractually agreed upon rate.
17 Invesco Mid Cap Core Equity Fund
NOTE 8—Distributions to Shareholders and Tax Components of Net Assets
Tax Character of Distributions to Shareholders Paid During the Fiscal Years Ended December 31, 2014 and 2013:
| 2014 | 2013 | |||||||
Ordinary income | $ | 43,528,386 | $ | 84,961,123 | ||||
Long-term capital gain | 219,476,756 | 142,167,117 | ||||||
Total distributions | $ | 263,005,142 | $ | 227,128,240 | ||||
Tax Components of Net Assets at Period-End:
| 2014 | ||||
Undistributed ordinary income | $ | 626,130 | ||
Undistributed long-term gain | 1,762,539 | |||
Net unrealized appreciation — investments | 497,519,738 | |||
Net unrealized appreciation (depreciation) — other investments | (248 | ) | ||
Temporary book/tax differences | (512,933 | ) | ||
Late-Year ordinary loss deferral | (9,422 | ) | ||
Shares of beneficial interest | 1,920,133,821 | |||
Total net assets | $ | 2,419,519,625 | ||
The difference between book-basis and tax-basis unrealized appreciation (depreciation) is due to differences in the timing of recognition of gains and losses on investments for tax and book purposes. The Fund’s net unrealized appreciation difference is attributable primarily to return of capital distributions.
The temporary book/tax differences are a result of timing differences between book and tax recognition of income and/or expenses. The Fund’s temporary book/tax differences are the result of the trustee deferral of compensation and retirement plan benefits.
Capital loss carryforward is calculated and reported as of a specific date. Results of transactions and other activity after that date may affect the amount of capital loss carryforward actually available for the Fund to utilize. Capital losses generated in years beginning after December 22, 2010 can be carried forward for an unlimited period, whereas previous losses expire in eight tax years. Capital losses with an expiration period may not be used to offset capital gains until all net capital losses without an expiration date have been utilized. Capital loss carryforwards with no expiration date will retain their character as either short-term or long-term capital losses instead of as short-term capital losses as under prior law. The ability to utilize capital loss carryforwards in the future may be limited under the Internal Revenue Code and related regulations based on the results of future transactions.
The Fund does not have a capital loss carryforward as of December 31, 2014.
NOTE 9—Investment Securities
The aggregate amount of investment securities (other than short-term securities, U.S. Treasury obligations and money market funds, if any) purchased and sold by the Fund during the year ended December 31, 2014 was $735,757,887 and $940,575,386, respectively. Cost of investments on a tax basis includes the adjustments for financial reporting purposes as of the most recently completed federal income tax reporting period-end.
| Unrealized Appreciation (Depreciation) of Investment Securities on a Tax Basis | ||||
Aggregate unrealized appreciation of investment securities | $ | 553,480,822 | ||
Aggregate unrealized (depreciation) of investment securities | (55,961,084 | ) | ||
Net unrealized appreciation of investment securities | $ | 497,519,738 | ||
Cost of investments for tax purposes is $1,927,439,591.
NOTE 10—Reclassification of Permanent Differences
Primarily as a result of differing book/tax treatment of foreign currency transactions and distributions, on December 31, 2014, undistributed net investment income was decreased by $81,080 and undistributed net realized gain was increased by $81,080. This reclassification had no effect on the net assets of the Fund.
18 Invesco Mid Cap Core Equity Fund
NOTE 11—Share Information
| Summary of Share Activity | ||||||||||||||||
| Years ended December 31, | ||||||||||||||||
| 2014(a) | 2013 | |||||||||||||||
| Shares | Amount | Shares | Amount | |||||||||||||
Sold: | ||||||||||||||||
Class A | 5,004,982 | $ | 129,388,002 | 7,267,039 | $ | 177,579,330 | ||||||||||
Class B | 35,446 | 674,275 | 59,112 | 1,110,362 | ||||||||||||
Class C | 831,681 | 15,846,763 | 1,092,841 | 20,560,073 | ||||||||||||
Class R | 760,600 | 19,170,344 | 1,176,883 | 28,224,889 | ||||||||||||
Class Y | 9,902,505 | 261,630,770 | 8,447,839 | 208,775,864 | ||||||||||||
Class R5 | 916,297 | 24,608,112 | 1,691,520 | 42,897,037 | ||||||||||||
Class R6 | 15,570 | 431,306 | 323,138 | 8,533,446 | ||||||||||||
Issued as reinvestment of dividends: | ||||||||||||||||
Class A | 5,315,190 | 121,186,351 | 4,623,289 | 111,975,988 | ||||||||||||
Class B | 221,068 | 3,579,082 | 202,034 | 3,652,778 | ||||||||||||
Class C | 1,582,609 | 25,543,218 | 1,181,408 | 21,300,788 | ||||||||||||
Class R | 492,270 | 10,918,541 | 456,083 | 10,804,607 | ||||||||||||
Class Y | 3,673,574 | 84,602,423 | 2,140,785 | 52,320,789 | ||||||||||||
Class R5 | 608,234 | 14,804,423 | 684,061 | 17,566,682 | ||||||||||||
Class R6 | 15,238 | 371,353 | 27,131 | 697,525 | ||||||||||||
Automatic conversion of Class B shares to Class A shares: | ||||||||||||||||
Class A | 216,139 | 5,570,199 | 296,186 | 7,195,054 | ||||||||||||
Class B | (291,597 | ) | (5,570,199 | ) | (384,767 | ) | (7,195,054 | ) | ||||||||
Reacquired: | ||||||||||||||||
Class A | (16,114,997 | ) | (417,835,426 | ) | (20,786,497 | ) | (507,587,934 | ) | ||||||||
Class B | (257,225 | ) | (4,909,176 | ) | (303,806 | ) | (5,714,748 | ) | ||||||||
Class C | (2,388,544 | ) | (45,319,054 | ) | (2,987,325 | ) | (55,804,458 | ) | ||||||||
Class R | (1,957,416 | ) | (49,172,954 | ) | (2,554,243 | ) | (61,639,378 | ) | ||||||||
Class Y | (5,221,466 | ) | (135,773,164 | ) | (6,736,243 | ) | (166,254,295 | ) | ||||||||
Class R5 | (3,943,919 | ) | (109,313,271 | ) | (5,427,767 | ) | (139,533,341 | ) | ||||||||
Class R6 | (44,164 | ) | (1,205,157 | ) | (192,157 | ) | (5,002,937 | ) | ||||||||
Net increase (decrease) in share activity | (627,925 | ) | $ | (50,773,239 | ) | (9,703,456 | ) | $ | (235,536,933 | ) | ||||||
| (a) | There are entities that are record owners of more than 5% of the outstanding shares of the Fund and in the aggregate own 30% of the outstanding shares of the Fund. IDI has an agreement with these entities to sell Fund shares. The Fund, Invesco and/or Invesco affiliates may make payments to these entities, which are considered to be related to the Fund, for providing services to the Fund, Invesco and/or Invesco affiliates including but not limited to services such as securities brokerage, distribution, third party record keeping and account servicing. The Fund has no knowledge as to whether all or any portion of the shares owned of record by these entities are also owned beneficially. |
19 Invesco Mid Cap Core Equity Fund
NOTE 12—Financial Highlights
The following schedule presents financial highlights for a share of the Fund outstanding throughout the periods indicated.
| Net asset value, beginning of period | Net investment income(a) (loss) | Net gains (losses) on securities (both realized and unrealized) | Total from investment operations | Dividends from net investment income | Distributions from net realized gains | Total distributions | Net asset value, end of period | Total return(b) | Net assets, end of period (000’s omitted) | Ratio of expenses to average net assets with fee waivers and/or expenses absorbed | Ratio of expenses to average net assets without fee waivers and/or expenses absorbed | Ratio of net investment income (loss) to average net assets | Portfolio turnover(c) | |||||||||||||||||||||||||||||||||||||||||||
Class A |
| |||||||||||||||||||||||||||||||||||||||||||||||||||||||
Year ended 12/31/14 | $ | 25.20 | $ | 0.04 | $ | 1.01 | $ | 1.05 | $ | (0.00 | ) | $ | (2.73 | ) | $ | (2.73 | ) | $ | 23.52 | 4.51 | % | $ | 1,155,635 | 1.17 | %(d) | 1.19 | %(d) | 0.17 | %(d) | 35 | % | |||||||||||||||||||||||||
Year ended 12/31/13 | 21.37 | (0.01 | ) | 6.15 | 6.14 | — | (2.31 | ) | (2.31 | ) | 25.20 | 29.19 | 1,378,888 | 1.16 | 1.19 | (0.04 | ) | 33 | ||||||||||||||||||||||||||||||||||||||
Year ended 12/31/12 | 21.02 | 0.12 | (e) | 2.03 | 2.15 | (0.12 | ) | (1.68 | ) | (1.80 | ) | 21.37 | 10.38 | 1,352,886 | 1.17 | 1.20 | 0.55 | (e) | 61 | |||||||||||||||||||||||||||||||||||||
Year ended 12/31/11 | 23.17 | (0.02 | ) | (1.42 | ) | (1.44 | ) | — | (0.71 | ) | (0.71 | ) | 21.02 | (6.24 | ) | 1,554,838 | 1.16 | 1.19 | (0.09 | ) | 57 | |||||||||||||||||||||||||||||||||||
Year ended 12/31/10 | 20.95 | 0.01 | 2.61 | 2.62 | (0.01 | ) | (0.39 | ) | (0.40 | ) | 23.17 | 12.52 | 1,838,719 | 1.18 | 1.21 | 0.06 | 61 | |||||||||||||||||||||||||||||||||||||||
Class B | ||||||||||||||||||||||||||||||||||||||||||||||||||||||||
Year ended 12/31/14 | 18.81 | (0.11 | ) | 0.73 | 0.62 | — | (2.73 | ) | (2.73 | ) | 16.70 | 3.74 | 25,115 | 1.92 | (d) | 1.94 | (d) | (0.58 | )(d) | 35 | ||||||||||||||||||||||||||||||||||||
Year ended 12/31/13 | 16.55 | (0.15 | ) | 4.72 | 4.57 | — | (2.31 | ) | (2.31 | ) | 18.81 | 28.20 | 33,795 | 1.91 | 1.94 | (0.79 | ) | 33 | ||||||||||||||||||||||||||||||||||||||
Year ended 12/31/12 | 16.66 | (0.03 | )(e) | 1.60 | 1.57 | — | (1.68 | ) | (1.68 | ) | 16.55 | 9.60 | 36,795 | 1.92 | 1.95 | (0.20 | )(e) | 61 | ||||||||||||||||||||||||||||||||||||||
Year ended 12/31/11 | 18.66 | (0.16 | ) | (1.13 | ) | (1.29 | ) | — | (0.71 | ) | (0.71 | ) | 16.66 | (6.95 | ) | 55,166 | 1.91 | 1.94 | (0.84 | ) | 57 | |||||||||||||||||||||||||||||||||||
Year ended 12/31/10 | 17.06 | (0.12 | ) | 2.10 | 1.98 | — | (0.38 | ) | (0.38 | ) | 18.66 | 11.65 | 114,279 | 1.93 | 1.96 | (0.69 | ) | 61 | ||||||||||||||||||||||||||||||||||||||
Class C | ||||||||||||||||||||||||||||||||||||||||||||||||||||||||
Year ended 12/31/14 | 18.76 | (0.11 | ) | 0.72 | 0.61 | — | (2.73 | ) | (2.73 | ) | 16.64 | 3.69 | 180,461 | 1.92 | (d) | 1.94 | (d) | (0.58 | )(d) | 35 | ||||||||||||||||||||||||||||||||||||
Year ended 12/31/13 | 16.51 | (0.15 | ) | 4.71 | 4.56 | — | (2.31 | ) | (2.31 | ) | 18.76 | 28.21 | 202,919 | 1.91 | 1.94 | (0.79 | ) | 33 | ||||||||||||||||||||||||||||||||||||||
Year ended 12/31/12 | 16.62 | (0.03 | )(e) | 1.60 | 1.57 | — | (1.68 | ) | (1.68 | ) | 16.51 | 9.62 | 190,302 | 1.92 | 1.95 | (0.20 | )(e) | 61 | ||||||||||||||||||||||||||||||||||||||
Year ended 12/31/11 | 18.62 | (0.16 | ) | (1.13 | ) | (1.29 | ) | — | (0.71 | ) | (0.71 | ) | 16.62 | (6.97 | ) | 220,772 | 1.91 | 1.94 | (0.84 | ) | 57 | |||||||||||||||||||||||||||||||||||
Year ended 12/31/10 | 17.02 | (0.12 | ) | 2.10 | 1.98 | — | (0.38 | ) | (0.38 | ) | 18.62 | 11.68 | 249,883 | 1.93 | 1.96 | (0.69 | ) | 61 | ||||||||||||||||||||||||||||||||||||||
Class R | ||||||||||||||||||||||||||||||||||||||||||||||||||||||||
Year ended 12/31/14 | 24.65 | (0.02 | ) | 0.98 | 0.96 | — | (2.73 | ) | (2.73 | ) | 22.88 | 4.24 | 99,552 | 1.42 | (d) | 1.44 | (d) | (0.08 | )(d) | 35 | ||||||||||||||||||||||||||||||||||||
Year ended 12/31/13 | 21.00 | (0.07 | ) | 6.03 | 5.96 | — | (2.31 | ) | (2.31 | ) | 24.65 | 28.85 | 124,622 | 1.41 | 1.44 | (0.29 | ) | 33 | ||||||||||||||||||||||||||||||||||||||
Year ended 12/31/12 | 20.66 | 0.07 | (e) | 2.00 | 2.07 | (0.05 | ) | (1.68 | ) | (1.73 | ) | 21.00 | 10.17 | 125,474 | 1.42 | 1.45 | 0.30 | (e) | 61 | |||||||||||||||||||||||||||||||||||||
Year ended 12/31/11 | 22.85 | (0.08 | ) | (1.40 | ) | (1.48 | ) | — | (0.71 | ) | (0.71 | ) | 20.66 | (6.51 | ) | 165,812 | 1.41 | 1.44 | (0.34 | ) | 57 | |||||||||||||||||||||||||||||||||||
Year ended 12/31/10 | 20.71 | (0.04 | ) | 2.56 | 2.52 | — | (0.38 | ) | (0.38 | ) | 22.85 | 12.21 | 188,803 | 1.43 | 1.46 | (0.19 | ) | 61 | ||||||||||||||||||||||||||||||||||||||
Class Y | ||||||||||||||||||||||||||||||||||||||||||||||||||||||||
Year ended 12/31/14 | 25.44 | 0.11 | 1.01 | 1.12 | (0.07 | ) | (2.73 | ) | (2.80 | ) | 23.76 | 4.76 | 808,895 | 0.92 | (d) | 0.94 | (d) | 0.42 | (d) | 35 | ||||||||||||||||||||||||||||||||||||
Year ended 12/31/13 | 21.50 | 0.05 | 6.20 | 6.25 | — | (2.31 | ) | (2.31 | ) | 25.44 | 29.53 | 653,577 | 0.91 | 0.94 | 0.21 | 33 | ||||||||||||||||||||||||||||||||||||||||
Year ended 12/31/12 | 21.14 | 0.18 | (e) | 2.04 | 2.22 | (0.18 | ) | (1.68 | ) | (1.86 | ) | 21.50 | 10.68 | 469,510 | 0.92 | 0.95 | 0.80 | (e) | 61 | |||||||||||||||||||||||||||||||||||||
Year ended 12/31/11 | 23.25 | 0.04 | (1.44 | ) | (1.40 | ) | — | (0.71 | ) | (0.71 | ) | 21.14 | (6.05 | ) | 175,773 | 0.91 | 0.94 | 0.16 | 57 | |||||||||||||||||||||||||||||||||||||
Year ended 12/31/10 | 20.97 | 0.07 | 2.60 | 2.67 | (0.01 | ) | (0.38 | ) | (0.39 | ) | 23.25 | 12.80 | 192,236 | 0.93 | 0.96 | 0.31 | 61 | |||||||||||||||||||||||||||||||||||||||
Class R5 | ||||||||||||||||||||||||||||||||||||||||||||||||||||||||
Year ended 12/31/14 | 26.73 | 0.15 | 1.07 | 1.22 | (0.11 | ) | (2.73 | ) | (2.84 | ) | 25.11 | 4.88 | 146,211 | 0.81 | (d) | 0.83 | (d) | 0.53 | (d) | 35 | ||||||||||||||||||||||||||||||||||||
Year ended 12/31/13 | 22.47 | 0.08 | 6.49 | 6.57 | — | (2.31 | ) | (2.31 | ) | 26.73 | 29.68 | 220,321 | 0.81 | 0.83 | 0.31 | 33 | ||||||||||||||||||||||||||||||||||||||||
Year ended 12/31/12 | 22.03 | 0.22 | (e) | 2.12 | 2.34 | (0.22 | ) | (1.68 | ) | (1.90 | ) | 22.47 | 10.78 | 253,815 | 0.80 | 0.83 | 0.92 | (e) | 61 | |||||||||||||||||||||||||||||||||||||
Year ended 12/31/11 | 24.15 | 0.07 | (1.48 | ) | (1.41 | ) | — | (0.71 | ) | (0.71 | ) | 22.03 | (5.87 | ) | 339,807 | 0.79 | 0.82 | 0.28 | 57 | |||||||||||||||||||||||||||||||||||||
Year ended 12/31/10 | 21.74 | 0.11 | 2.70 | 2.81 | (0.01 | ) | (0.39 | ) | (0.40 | ) | 24.15 | 12.94 | 311,455 | 0.76 | 0.79 | 0.48 | 61 | |||||||||||||||||||||||||||||||||||||||
Class R6 | ||||||||||||||||||||||||||||||||||||||||||||||||||||||||
Year ended 12/31/14 | 26.76 | 0.17 | 1.07 | 1.24 | (0.13 | ) | (2.73 | ) | (2.86 | ) | 25.14 | 4.97 | 3,650 | 0.72 | (d) | 0.74 | (d) | 0.62 | (d) | 35 | ||||||||||||||||||||||||||||||||||||
Year ended 12/31/13 | 22.48 | 0.11 | 6.48 | 6.59 | — | (2.31 | ) | (2.31 | ) | 26.76 | 29.75 | 4,243 | 0.72 | 0.74 | 0.40 | 33 | ||||||||||||||||||||||||||||||||||||||||
Year ended 12/31/12(f) | 24.00 | 0.07 | (e) | 0.31 | 0.38 | (0.22 | ) | (1.68 | ) | (1.90 | ) | 22.48 | 1.75 | 9 | 0.67 | (g) | 0.70 | (g) | 1.05 | (e)(g) | 61 | |||||||||||||||||||||||||||||||||||
| (a) | Calculated using average shares outstanding. |
| (b) | Includes adjustments in accordance with accounting principles generally accepted in the United States of America and as such, the net asset value for financial reporting purposes and the returns based upon those net asset values may differ from the net asset value and returns for shareholder transactions. Does not include sales charges and is not annualized for periods less than one year, if applicable. |
| (c) | Portfolio turnover is calculated at the fund level and is not annualized for periods less than one year, if applicable. |
| (d) | Ratios are based on average daily net assets (000’s omitted) of $1,294,852, $29,636, $195,190, $114,128, $725,963, $179,855 and $3,836 for Class A, Class B, Class C, Class R, Class Y, Class R5 and Class R6 shares, respectively. |
| (e) | Net investment income (loss) per share and the ratio of net investment income (loss) to average net assets includes a special cash dividend received of $1.00 per share owned of Tellabs Inc. on December 24, 2012. Net investment income (loss) per share and the ratio of net investment income (loss) to average net assets excluding the special dividend are $0.08 and 0.38%, $(0.07) and (0.37)%, $(0.07) and (0.37)%, $0.03 and 0.13%, $0.14 and 0.63%, $0.18 and 0.75%, and $0.03 and 0.88%, for Class A, Class B, Class C, Class R, Class Y, Class R5 and Class R6 shares, respectively. |
| (f) | Commencement date of September 24, 2012 for Class R6 shares. |
| (g) | Annualized. |
20 Invesco Mid Cap Core Equity Fund
Report of Independent Registered Public Accounting Firm
To the Board of Trustees of AIM Funds Group (Invesco Funds Group)
and Shareholders of Invesco Mid Cap Core Equity Fund:
In our opinion, the accompanying statement of assets and liabilities, including the schedule of investments, and the related statements of operations and of changes in net assets and the financial highlights present fairly, in all material respects, the financial position of Invesco Mid Cap Core Equity Fund (one of the funds constituting AIM Funds Group (Invesco Funds Group), hereafter referred to as the “Fund”) at December 31, 2014, the results of its operations for the year then ended, the changes in its net assets for each of the two years in the period then ended and the financial highlights for each of the five years in the period then ended, in conformity with accounting principles generally accepted in the United States of America. These financial statements and financial highlights (hereafter referred to as “financial statements”) are the responsibility of the Fund’s management. Our responsibility is to express an opinion on these financial statements based on our audits. We conducted our audits of these financial statements in accordance with the standards of the Public Company Accounting Oversight Board (United States). Those standards require that we plan and perform the audit to obtain reasonable assurance about whether the financial statements are free of material misstatement. An audit includes examining, on a test basis, evidence supporting the amounts and disclosures in the financial statements, assessing the accounting principles used and significant estimates made by management, and evaluating the overall financial statement presentation. We believe that our audits, which included confirmation of securities at December 31, 2014 by correspondence with the custodian, provide a reasonable basis for our opinion.
PRICEWATERHOUSECOOPERS LLP
Houston, Texas
February 23, 2015
21 Invesco Mid Cap Core Equity Fund
Calculating your ongoing Fund expenses
Example
As a shareholder of the Fund, you incur two types of costs: (1) transaction costs, which may include sales charges (loads) on purchase payments or contingent deferred sales charges on redemptions, if any; and (2) ongoing costs, including management fees, distribution and/or service (12b-1) fees, and other Fund expenses. This example is intended to help you understand your ongoing costs (in dollars) of investing in the Fund and to compare these costs with ongoing costs of investing in other mutual funds. The example is based on an investment of $1,000 invested at the beginning of the period and held for the entire period July 1, 2014 through December 31, 2014.
Actual expenses
The table below provides information about actual account values and actual expenses. You may use the information in this table, together with the amount you invested, to estimate the expenses that you paid over the period. Simply divide your account value by $1,000 (for example, an $8,600 account value divided by $1,000 = 8.6), then multiply the result by the number in the table under the heading entitled “Actual Expenses Paid During Period” to estimate the expenses you paid on your account during this period.
Hypothetical example for comparison purposes
The table below also provides information about hypothetical account values and hypothetical expenses based on the Fund’s actual expense ratio and an assumed rate of return of 5% per year before expenses, which is not the Fund’s actual return.
The hypothetical account values and expenses may not be used to estimate the actual ending account balance or expenses you paid for the period. You may use this information to compare the ongoing costs of investing in the Fund and other funds. To do so, compare this 5% hypothetical example with the 5% hypothetical examples that appear in the shareholder reports of the other funds.
Please note that the expenses shown in the table are meant to highlight your ongoing costs only and do not reflect any transaction costs, such as sales charges (loads) on purchase payments or contingent deferred sales charges on redemptions, if any. Therefore, the hypothetical information is useful in comparing ongoing costs only, and will not help you determine the relative total costs of owning different funds. In addition, if these transaction costs were included, your costs would have been higher.
| Class | Beginning Account Value (07/01/14) | ACTUAL | HYPOTHETICAL expenses) | Annualized Expense Ratio | ||||||||||||||||||||
| Ending Account Value (12/31/14)1 | Expenses Paid During Period2 | Ending Account Value (12/31/14) | Expenses Paid During Period2 | |||||||||||||||||||||
| A | $ | 1,000.00 | $ | 970.00 | $ | 5.81 | $ | 1,019.31 | $ | 5.96 | 1.17 | % | ||||||||||||
| B | 1,000.00 | 966.50 | 9.52 | 1,015.53 | 9.75 | 1.92 | ||||||||||||||||||
| C | 1,000.00 | 965.90 | 9.51 | 1,015.53 | 9.75 | 1.92 | ||||||||||||||||||
| R | 1,000.00 | 968.50 | 7.05 | 1,018.05 | 7.22 | 1.42 | ||||||||||||||||||
| Y | 1,000.00 | 971.30 | 4.57 | 1,020.57 | 4.69 | 0.92 | ||||||||||||||||||
| R5 | 1,000.00 | 971.70 | 4.00 | 1,021.15 | 4.10 | 0.81 | ||||||||||||||||||
| R6 | 1,000.00 | 972.00 | 3.55 | 1,021.60 | 3.64 | 0.72 | ||||||||||||||||||
| 1 | The actual ending account value is based on the actual total return of the Fund for the period July 1, 2014 through December 31, 2014, after actual expenses and will differ from the hypothetical ending account value which is based on the Fund’s expense ratio and a hypothetical annual return of 5% before expenses. |
| 2 | Expenses are equal to the Fund’s annualized expense ratio as indicated above multiplied by the average account value over the period, multiplied by 184/365 to reflect the most recent fiscal half year. |
22 Invesco Mid Cap Core Equity Fund
Tax Information
Form 1099-DIV, Form 1042-S and other year–end tax information provide shareholders with actual calendar year amounts that should be included in their tax returns. Shareholders should consult their tax advisors.
The following distribution information is being provided as required by the Internal Revenue Code or to meet a specific state’s requirement.
The Fund designates the following amounts or, if subsequently determined to be different, the maximum amount allowable for its fiscal year ended December 31, 2014:
Federal and State Income Tax | ||||
Long-Term Capital Gain Distributions | $ | 219,476,756 | ||
Qualified Dividend Income* | 78.53 | % | ||
Corporate Dividends Received Deduction* | 72.53 | % | ||
U.S. Treasury Obligations* | 0.00 | % | ||
| * | The above percentages are based on ordinary income dividends paid to shareholders during the Fund’s fiscal year. |
Non-Resident Alien Shareholders | ||||
Qualified Short-Term Gains | $ | 40,605,269 | ||
23 Invesco Mid Cap Core Equity Fund
Trustees and Officers
The address of each trustee and officer is AIM Growth Series (Invesco Growth Series) (the “Trust”), 11 Greenway Plaza, Suite 1000, Houston, Texas 77046-1173. The trustees serve for the life of the Trust, subject to their earlier death, incapacitation, resignation, retirement or removal as more specifically provided in the Trust’s organizational documents. Each officer serves for a one year term or until their successors are elected and qualified. Column two below includes length of time served with predecessor entities, if any.
Name, Year of Birth and Position(s) Held with the Trust | Trustee and/ or Officer Since | Principal Occupation(s) During Past 5 Years | Number of Funds in Fund Complex Overseen by Trustee | Other Directorship(s) Held by Trustee During | ||||
| Interested Persons | ||||||||
| Martin L. Flanagan1 — 1960 Trustee | 2007 | Executive Director, Chief Executive Officer and President, Invesco Ltd. (ultimate parent of Invesco and a global investment management firm); Advisor to the Board, Invesco Advisers, Inc. (formerly known as Invesco Institutional (N.A.), Inc.); Trustee, The Invesco Funds; Vice Chair, Investment Company Institute; and Member of Executive Board, SMU Cox School of Business
Formerly: Chairman and Chief Executive Officer, Invesco Advisers, Inc. (registered investment adviser); Director, Chairman, Chief Executive Officer and President, IVZ Inc. (holding company), INVESCO Group Services, Inc. (service provider) and Invesco North American Holdings, Inc. (holding company); Director, Chief Executive Officer and President, Invesco Holding Company Limited (parent of Invesco and a global investment management firm); Director, Invesco Ltd.; Chairman, Investment Company Institute and President, Co-Chief Executive Officer, Co-President, Chief Operating Officer and Chief Financial Officer, Franklin Resources, Inc. (global investment management organization). | 144 | None | ||||
Philip A. Taylor2 — 1954 Trustee, President and Principal Executive Officer | 2006 | Head of North American Retail and Senior Managing Director, Invesco Ltd.; Director, Co-Chairman, Co-President and Co-Chief Executive Officer, Invesco Advisers, Inc. (formerly known as Invesco Institutional (N.A.), Inc.) (registered investment adviser); Director, Chairman, Chief Executive Officer and President, Invesco Management Group, Inc. (formerly known as Invesco Aim Management Group, Inc.) (financial services holding company); Director and President, INVESCO Funds Group, Inc. (registered investment adviser and registered transfer agent); Director and Chairman, Invesco Investment Services, Inc. (formerly known as Invesco Aim Investment Services, Inc.) (registered transfer agent) and IVZ Distributors, Inc. (formerly known as INVESCO Distributors, Inc.) (registered broker dealer); Director, President and Chairman, Invesco Inc. (holding company) and Invesco Canada Holdings Inc. (holding company); Chief Executive Officer, Invesco Corporate Class Inc. (corporate mutual fund company) and Invesco Canada Fund Inc. (corporate mutual fund company); Director, Chairman and Chief Executive Officer, Invesco Canada Ltd. (formerly known as Invesco Trimark Ltd./Invesco Trimark Ltèe) (registered investment adviser and registered transfer agent); Trustee, President and Principal Executive Officer, The Invesco Funds (other than AIM Treasurer’s Series Trust (Invesco Treasurer’s Series Trust) and Short-Term Investments Trust); Trustee and Executive Vice President, The Invesco Funds (AIM Treasurer’s Series Trust (Invesco Treasurer’s Series Trust) and Short-Term Investments Trust only); Director, Invesco Investment Advisers LLC (formerly known as Van Kampen Asset Management); Director, Chief Executive Officer and President, Van Kampen Exchange Corp.
Formerly: Director and Chairman, Van Kampen Investor Services Inc.; Director, Chief Executive Officer and President, 1371 Preferred Inc. (holding company) and Van Kampen Investments Inc.; Director and President, AIM GP Canada Inc. (general partner for limited partnerships) and Van Kampen Advisors, Inc.; Director and Chief Executive Officer, Invesco Trimark Dealer Inc. (registered broker dealer); Director, Invesco Distributors, Inc. (formerly known as Invesco Aim Distributors, Inc.) (registered broker dealer); Manager, Invesco PowerShares Capital Management LLC; Director, Chief Executive Officer and President, Invesco Advisers, Inc.; Director, Chairman, Chief Executive Officer and President, Invesco Aim Capital Management, Inc.; President, Invesco Trimark Dealer Inc. and Invesco Trimark Ltd./Invesco Trimark Ltèe; Director and President, AIM Trimark Corporate Class Inc. and AIM Trimark Canada Fund Inc.; Senior Managing Director, Invesco Holding Company Limited; Director and Chairman, Fund Management Company (former registered broker dealer); President and Principal Executive Officer, The Invesco Funds (AIM Treasurer’s Series Trust (Invesco Treasurer’s Series Trust), and Short-Term Investments Trust only); President, AIM Trimark Global Fund Inc. and AIM Trimark Canada Fund Inc. | 144 | None | ||||
| Independent Trustees | ||||||||
Bruce L. Crockett — 1944 Trustee and Chair | 2001 | Chairman, Crockett Technologies Associates (technology consulting company)
Formerly: Director, Captaris (unified messaging provider); Director, President and Chief Executive Officer, COMSAT Corporation; Chairman, Board of Governors of INTELSAT (international communications company); ACE Limited (insurance company); and Investment Company Institute | 144 | ALPS (Attorneys Liability Protection Society) (insurance company) |
| 1 | Mr. Flanagan is considered an interested person (within the meaning of Section 2(a)(19) of the 1940 Act) of the Trust because he is an officer of the Adviser to the Trust, and an officer and a director of Invesco Ltd., ultimate parent of the Adviser. |
| 2 | Mr. Taylor is considered an interested person (within the meaning of Section 2(a)(19) of the 1940 Act) of the Trust because he is an officer and a director of the Adviser. |
T-1 Invesco Mid Cap Core Equity Fund
Trustees and Officers—(continued)
Name, Year of Birth and Position(s) Held with the Trust | Trustee and/ or Officer Since | Principal Occupation(s) During Past 5 Years | Number of Funds in Fund Complex Overseen by Trustee | Other Directorship(s) Held by Trustee During | ||||
| Independent Trustees—(continued) | ||||||||
David C. Arch — 1945 Trustee | 2010 | Chairman of Blistex Inc., a consumer health care products manufacturer | 144 | Board member of the Illinois Manufacturers’ Association; Member of the Board of Visitors, Institute for the Humanities, University of Michigan; Member of the Audit Committee of the Edward-Elmhurst Hospital | ||||
James T. Bunch — 1942 Trustee | 2003 | Managing Member, Grumman Hill Group LLC (family office private equity investments)
Formerly: Founder, Green Manning & Bunch Ltd. (investment banking firm) (1988-2010); Executive Committee, United States Golf Association; and Director, Policy Studies, Inc. and Van Gilder Insurance Corporation | 144 | Chairman, Board of Governors, Western Golf Association; Chairman, Evans Scholars Foundation; and Director, Denver Film Society | ||||
Rodney F. Dammeyer — 1940 Trustee | 2010 | Chairman of CAC, LLC, (private company offering capital investment and management advisory services)
Formerly: Prior to 2001, Managing Partner at Equity Group Corporate Investments; Prior to 1995, Chief Executive Officer of Itel Corporation (formerly Anixter International); Prior to 1985, experience includes Senior Vice President and Chief Financial Officer of Household International, Inc., Executive Vice President and Chief Financial Officer of Northwest Industries, Inc. and Partner of Arthur Andersen & Co.; From 1987 to 2010, Director/Trustee of investment companies in the Van Kampen Funds complex | 144 | Director of Quidel Corporation and Stericycle, Inc. | ||||
Albert R. Dowden — 1941 Trustee | 2001 | Director of a number of public and private business corporations, including the Boss Group, Ltd. (private investment and management); Nature’s Sunshine Products, Inc. and Reich & Tang Funds (5 portfolios) (registered investment company)
Formerly: Director, Homeowners of America Holding Corporation/Homeowners of America Insurance Company (property casualty company); Director, Continental Energy Services, LLC (oil and gas pipeline service); Director, CompuDyne Corporation (provider of product and services to the public security market) and Director, Annuity and Life Re (Holdings), Ltd. (reinsurance company); Director, President and Chief Executive Officer, Volvo Group North America, Inc.; Senior Vice President, AB Volvo; Director of various public and private corporations; Chairman, DHJ Media, Inc.; Director, Magellan Insurance Company; and Director, The Hertz Corporation, Genmar Corporation (boat manufacturer), National Media Corporation; Advisory Board of Rotary Power International (designer, manufacturer, and seller of rotary power engines); and Chairman, Cortland Trust, Inc. (registered investment company) | 144 | Director of: Nature’s Sunshine Products, Inc., Reich & Tang Funds, Homeowners of America Holding Corporation/ Homeowners of America Insurance Company, the Boss Group | ||||
Jack M. Fields — 1952 Trustee | 2001 | Chief Executive Officer, Twenty First Century Group, Inc. (government affairs company); Owner and Chief Executive Officer, Dos Angeles Ranch, L.P. (cattle, hunting, corporate entertainment); and Discovery Global Education Fund (non-profit)
Formerly: Chief Executive Officer, Texana Timber LP (sustainable forestry company); Director of Cross Timbers Quail Research Ranch (non-profit); and member of the U.S. House of Representatives | 144 | Insperity, Inc. (formerly known as Administaff) | ||||
Prema Mathai-Davis — 1950 Trustee | 2001 | Retired. Formerly: Chief Executive Officer, YWCA of the U.S.A. | 144 | None | ||||
Larry Soll — 1942 Trustee | 2003 | Retired. Formerly: Chairman, Chief Executive Officer and President, Synergen Corp. (a biotechnology company) | 144 | None | ||||
Hugo F. Sonnenschein — 1940 Trustee | 2010 | President Emeritus and Honorary Trustee of the University of Chicago and the Adam Smith Distinguished Service Professor in the Department of Economics at the University of Chicago. Prior to 2000, President of the University of Chicago | 144 | Trustee of the University of Rochester and a member of its investment committee; Member of the National Academy of Sciences and the American Philosophical Society; Fellow of the American Academy of Arts and Sciences | ||||
Raymond Stickel, Jr. — 1944 Trustee | 2005 | Retired. Formerly: Director, Mainstay VP Series Funds, Inc. (25 portfolios) and Partner, Deloitte & Touche | 144 | None | ||||
T-2 Invesco Mid Cap Core Equity Fund
Trustees and Officers—(continued)
Name, Year of Birth and Position(s) Held with the Trust | Trustee and/ or Officer Since | Principal Occupation(s) During Past 5 Years | Number of Funds in Fund Complex Overseen by Trustee | Other Directorship(s) Held by Trustee During | ||||
| Independent Trustees—(continued) | ||||||||
Suzanne H. Woolsey — 1941 Trustee | 2014 | Chief Executive Officer of Woolsey Partners LLC | 144 | Emeritus Chair of the Board of Trustees of the Institute for Defense Analyses; Trustee of Colorado College; Trustee of California Institute of Technology; Prior to 2014, Director of Fluor Corp.; Prior to 2010, Trustee of the German Marshall Fund of the United States; Prior to 2010 Trustee of the Rocky Mountain Institute | ||||
| Other Officers | ||||||||
Russell C. Burk — 1958 Senior Vice President and Senior Officer | 2005 | Senior Vice President and Senior Officer, The Invesco Funds | N/A | N/A | ||||
John M. Zerr — 1962 Senior Vice President, Chief Legal Officer and Secretary | 2006 | Director, Senior Vice President, Secretary and General Counsel, Invesco Management Group, Inc. (formerly known as Invesco Aim Management Group, Inc.) and Van Kampen Exchange Corp.; Senior Vice President, Invesco Advisers, Inc. (formerly known as Invesco Institutional (N.A.), Inc.) (registered investment adviser); Senior Vice President and Secretary, Invesco Distributors, Inc. (formerly known as Invesco Aim Distributors, Inc.); Director, Vice President and Secretary, Invesco Investment Services, Inc. (formerly known as Invesco Aim Investment Services, Inc.) and IVZ Distributors, Inc. (formerly known as INVESCO Distributors, Inc.); Director and Vice President, INVESCO Funds Group, Inc.; Senior Vice President, Chief Legal Officer and Secretary, The Invesco Funds; Manager, Invesco PowerShares Capital Management LLC; Director, Secretary and General Counsel, Invesco Investment Advisers LLC (formerly known as Van Kampen Asset Management); Secretary and General Counsel, Invesco Capital Markets, Inc. (formerly known as Van Kampen Funds Inc.) and Chief Legal Officer, PowerShares Exchange-Traded Fund Trust, PowerShares Exchange-Traded Fund Trust II, PowerShares India Exchange-Traded Fund Trust , PowerShares Actively Managed Exchange-Traded Fund Trust; and PowerShares Actively Managed Exchange-Traded Commodity Fund Trust
Formerly: Director and Vice President, Van Kampen Advisors Inc.; Director, Vice President, Secretary and General Counsel, Van Kampen Investor Services Inc.; Director, Invesco Distributors, Inc. (formerly known as Invesco Aim Distributors, Inc.); Director, Senior Vice President, General Counsel and Secretary, Invesco Aim Advisers, Inc. and Van Kampen Investments Inc.; Director, Vice President and Secretary, Fund Management Company; Director, Senior Vice President, Secretary, General Counsel and Vice President, Invesco Aim Capital Management, Inc.; Chief Operating Officer and General Counsel, Liberty Ridge Capital, Inc. (an investment adviser); Vice President and Secretary, PBHG Funds (an investment company) and PBHG Insurance Series Fund (an investment company); Chief Operating Officer, General Counsel and Secretary, Old Mutual Investment Partners (a broker-dealer); General Counsel and Secretary, Old Mutual Fund Services (an administrator) and Old Mutual Shareholder Services (a shareholder servicing center); Executive Vice President, General Counsel and Secretary, Old Mutual Capital, Inc. (an investment adviser); and Vice President and Secretary, Old Mutual Advisors Funds (an investment company) | N/A | N/A | ||||
Sheri Morris — 1964 Vice President, Treasurer and Principal Financial Officer | 1999 | Vice President, Treasurer and Principal Financial Officer, The Invesco Funds; Vice President, Invesco Advisers, Inc. (formerly known as Invesco Institutional (N.A.), Inc.) (registered investment adviser); and Vice President, PowerShares Exchange-Traded Fund Trust, PowerShares Exchange-Traded Fund Trust II, PowerShares India Exchange-Traded Fund Trust, PowerShares Actively Managed Exchange-Traded Fund Trust, and PowerShares Actively Managed Exchange-Traded Commodity Fund Trust
Formerly: Vice President, Invesco Aim Advisers, Inc., Invesco Aim Capital Management, Inc. and Invesco Aim Private Asset Management, Inc.; Assistant Vice President and Assistant Treasurer, The Invesco Funds and Assistant Vice President, Invesco Advisers, Inc., Invesco Aim Capital Management, Inc. and Invesco Aim Private Asset Management, Inc.; and Treasurer, PowerShares Exchange-Traded Fund Trust, PowerShares Exchange-Traded Fund Trust II, PowerShares India Exchange-Traded Fund Trust and PowerShares Actively Managed Exchange-Traded Fund Trust | N/A | N/A | ||||
T-3 Invesco Mid Cap Core Equity Fund
Trustees and Officers—(continued)
Name, Year of Birth and Position(s) Held with the Trust | Trustee and/ or Officer Since | Principal Occupation(s) During Past 5 Years | Number of Funds in Fund Complex Overseen by Trustee | Other Directorship(s) Held by Trustee During | ||||
| Other Officers—(continued) | ||||||||
Karen Dunn Kelley — 1960 Vice President | 2004 | Senior Managing Director, Investments; Director, Co-President, Co-Chief Executive Officer, and Co-Chairman, Invesco Advisers, Inc. (formerly known as Invesco Institutional (N.A.), Inc.) (registered investment adviser); Chairman, Invesco Senior Secured Management, Inc.; Senior Vice President, Invesco Management Group, Inc. (formerly known as Invesco Aim Management Group, Inc.); Executive Vice President, Invesco Distributors, Inc. (formerly known as Invesco Aim Distributors, Inc.); Director, Invesco Mortgage Capital Inc. and Invesco Management Company Limited; Director and President, INVESCO Asset Management (Bermuda) Ltd., Vice President, The Invesco Funds (other than AIM Treasurer’s Series Trust (Invesco Treasurer’s Series Trust) and Short-Term Investments Trust); and President and Principal Executive Officer, The Invesco Funds (AIM Treasurer’s Series Trust (Invesco Treasurer’s Series Trust) and Short-Term Investments Trust only)
Formerly: Director, INVESCO Global Asset Management Limited and INVESCO Management S.A.; Senior Vice President, Van Kampen Investments Inc. and Invesco Advisers, Inc. (formerly known as Invesco Institutional (N.A.), Inc.) (registered investment adviser); Vice President, Invesco Advisers, Inc. (formerly known as Invesco Institutional (N.A.), Inc.); Director of Cash Management and Senior Vice President, Invesco Advisers, Inc. and Invesco Aim Capital Management, Inc.; Director and President, Fund Management Company; Chief Cash Management Officer, Director of Cash Management, Senior Vice President, and Managing Director, Invesco Aim Capital Management, Inc.; Director of Cash Management, Senior Vice President, and Vice President, Invesco Advisers, Inc. and The Invesco Funds (AIM Treasurer’s Series Trust (Invesco Treasurer’s Series Trust), and Short-Term Investments Trust only) | N/A | N/A | ||||
Crissie M. Wisdom — 1969 Anti-Money Laundering Compliance Officer | 2013 | Anti-Money Laundering Compliance Officer, Invesco Advisers, Inc. (formerly known as Invesco Institutional (N.A.), Inc.) (registered investment adviser), Invesco Capital Markets, Inc. (formerly known as Van Kampen Funds Inc.), Invesco Distributors, Inc., Invesco Investment Services, Inc., Invesco Management Group, Inc., Van Kampen Exchange Corp., The Invesco Funds, and PowerShares Exchange-Traded Fund Trust, PowerShares Exchange-Traded Fund Trust II, PowerShares India Exchange-Traded Fund Trust, PowerShares Actively Managed Exchange-Traded Fund Trust and PowerShares Actively Managed Exchange-Traded Commodity Fund Trust; and Fraud Prevention Manager and Controls and Risk Analysis Manager for Invesco Investment Services, Inc. | N/A | N/A | ||||
Todd L. Spillane — 1958 Chief Compliance Officer | 2006 | Senior Vice President, Invesco Management Group, Inc. (formerly known as Invesco Aim Management Group, Inc.) and Van Kampen Exchange Corp.; Senior Vice President and Chief Compliance Officer, Invesco Advisers, Inc. (registered investment adviser) (formerly known as Invesco Institutional (N.A.), Inc.); Chief Compliance Officer, The Invesco Funds; Vice President, Invesco Distributors, Inc. (formerly known as Invesco Aim Distributors, Inc.) and Invesco Investment Services, Inc. (formerly known as Invesco Aim Investment Services, Inc.)
Formerly: Chief Compliance Officer, Invesco Funds (Chicago); Senior Vice President, Van Kampen Investments Inc.; Senior Vice President and Chief Compliance Officer, Invesco Aim Advisers, Inc. and Invesco Aim Capital Management, Inc.; Chief Compliance Officer, INVESCO Private Capital Investments, Inc. (holding company), Invesco Private Capital, Inc. (registered investment adviser), Invesco Global Asset Management (N.A.), Inc., Invesco Senior Secured Management, Inc. (registered investment adviser), Van Kampen Investor Services Inc., PowerShares Exchange-Traded Fund Trust, PowerShares Exchange-Traded Fund Trust II, PowerShares India Exchange-Traded Fund Trust and PowerShares Actively Managed Exchange-Traded Fund Trust; and Vice President, Invesco Aim Capital Management, Inc. and Fund Management Company | N/A | N/A |
The Statement of Additional Information of the Trust includes additional information about the Fund’s Trustees and is available upon request, without charge, by calling 1.800.959.4246. Please refer to the Fund’s prospectus for information on the Fund’s sub-advisers.
Office of the Fund 11 Greenway Plaza, Suite 1000 Houston, TX 77046-1173 | Investment Adviser Invesco Advisers, Inc. 1555 Peachtree Street, N.E. Atlanta, GA 30309 | Distributor Invesco Distributors, Inc. 11 Greenway Plaza, Suite 1000 Houston, TX 77046-1173 | Auditors PricewaterhouseCoopers LLP 1000 Louisiana Street, Suite 5800 Houston, TX 77002-5678 | |||
Counsel to the Fund Stradley Ronon Stevens & Young, LLP 2005 Market Street, Suite 2600 Philadelphia, PA 19103-7018 | Counsel to the Independent Trustees Goodwin Procter LLP 901 New York Avenue, N.W. Washington, D.C. 20001 | Transfer Agent Invesco Investment Services, Inc. 11 Greenway Plaza, Suite 1000 Houston, TX 77046-1173 | Custodian State Street Bank and Trust Company 225 Franklin Street Boston, MA 02110-2801 | |||
T-4 Invesco Mid Cap Core Equity Fund

Invesco mailing information
Send general correspondence to Invesco Investment Services, Inc., P.O. Box 219078, Kansas City, MO 64121-9078.
Important notice regarding delivery of security holder documents
To reduce Fund expenses, only one copy of most shareholder documents may be mailed to shareholders with multiple accounts at the same address (Householding). Mailing of your shareholder documents may be householded indefinitely unless you instruct us otherwise. If you do not want the mailing of these documents to be combined with those for other members of your household, please contact Invesco Investment Services, Inc. at 800 959 4246 or contact your financial institution. We will begin sending you individual copies for each account within 30 days after receiving your request.
Fund holdings and proxy voting information
The Fund provides a complete list of its holdings four times in each fiscal year, at the quarter ends. For the second and fourth quarters, the lists appear in the Fund’s semiannual and annual reports to shareholders. For the first and third quarters, the Fund files the lists with the Securities and Exchange Commission (SEC) on Form N-Q. The most recent list of portfolio holdings is available at invesco.com/completeqtrholdings. Shareholders can also look up the Fund’s Forms N-Q on the SEC website at sec.gov. Copies of the Fund’s Forms N-Q may be reviewed and copied at the SEC Public Reference Room in Washington, D.C. You can obtain information on the operation of the Public Reference Room, including information about duplicating fee charges, by calling 202 551 8090 or 800 732 0330, or by electronic request at the following email address: publicinfo@sec.gov. The SEC file numbers for the Fund are shown below.
A description of the policies and procedures that the Fund uses to determine how to vote proxies relating to portfolio securities is available without charge, upon request, from our Client Services department at 800 959 4246 or at invesco.com/proxyguidelines. The information is also available on the SEC website, sec.gov.
Information regarding how the Fund voted proxies related to its portfolio securities during the most recent 12-month period ended June 30 is available at invesco.com/proxysearch. The information is also available on the SEC website, sec.gov. Invesco Advisers, Inc. is an investment adviser; it provides investment advisory services to individual and institutional clients and does not sell securities. Invesco Distributors, Inc. is the US distributor for Invesco Ltd.’s retail mutual funds, exchange-traded funds and institutional money market funds. Both are wholly owned, indirect subsidiaries of Invesco Ltd. |  | |
SEC file numbers: 811-02699 and 002-57526 MCCE-AR-1 Invesco Distributors, Inc. | ||
| ||||
 | Annual Report to Shareholders
| December 31, 2014 | ||
| ||||
Invesco Multi-Asset Inflation Fund
Nasdaq: A: MIZAX n C: MIZCX n R: MIZRX n Y: MIZYX n R5: MIZFX n R6: MIZSX | ||||

Letters to Shareholders
Philip Taylor | Dear Shareholders: This annual report includes information about your Fund, including performance data and a complete list of its investments as of the close of the reporting period. Inside, your Fund’s portfolio managers discuss how they managed your Fund and the factors that affected its performance during the reporting period. I hope you find this report of interest. During the reporting period, the US economy showed unmistakable signs of improvement. After contracting in the first quarter of 2014, the economy expanded strongly in the second and third quarters as employment data improved markedly. Given continuing positive economic trends, the US Federal Reserve (the Fed) ended its extraordinary asset purchase program in October – but it pledged in December to be “patient” before raising interest rates. Overseas, the story was much different. Concerns about economic stagnation and the potential for |

deflation depressed European markets, while the Chinese economy was hurt by a slowdown in manufacturing.
Political change in Washington, DC; changes to monetary policy by the Fed and other central banks; the future direction of oil prices; and unexpected geopolitical events are likely to affect markets in the US and overseas in 2015. This may make some investors hesitant to begin to save for their long-term financial goals. That’s why Invesco has always encouraged investors to work with a professional financial adviser who can stress the importance of starting to save and invest early and the importance of adhering to a disciplined investment plan – when times are good and when they’re uncertain. A financial adviser who knows your unique financial situation, investment goals and risk tolerance can be an invaluable partner as you seek to achieve your financial goals. He or she can offer a long-term perspective when markets are volatile and time-tested advice and guidance when your financial situation or investment goals change.
Timely information when and where you want it
Invesco’s efforts to help investors achieve their financial objectives include providing individual investors and financial professionals with timely information about the markets, the economy and investing – whenever and wherever they want it.
Our website, invesco.com/us, offers a wide range of market insights and investment perspectives. On the website, you’ll find detailed information about our funds, including prices, performance, holdings and portfolio manager commentaries. You can access information about your individual Invesco account whenever it’s convenient for you; just complete a simple, secure online registration. Use the “Log In” box on our home page to get started.
Invesco’s mobile apps for iPhone® and iPad® (both available free from the App StoreSM) allow you to obtain the same detailed information, monitor your account and create customizable watch lists. Also, they allow you to access investment insights from our investment leaders, market strategists, economists and retirement experts. You can sign up to be alerted when new commentary is added, and you can watch portfolio manager videos and have instant access to Invesco news and updates wherever you may be.
In addition to the resources accessible on our website and through our mobile app, you can obtain timely updates to help you stay informed about the markets, the economy and investing by connecting with Invesco on Twitter, LinkedIn or Facebook. You can access our blog at blog.invesco.us.com. Our goal is to provide you the information you want, when and where you want it.
Have questions?
For questions about your account, feel free to contact an Invesco client services representative at 800 959 4246. For Invesco-related questions or comments, please email me directly at phil@invesco.com.
All of us at Invesco look forward to serving your investment management needs for many years to come. Thank you for investing with us.
Sincerely,

Philip Taylor
Senior Managing Director, Invesco Ltd.
iPhone and iPad are trademarks of Apple Inc., registered in the US and other countries. App Store is a service mark of Apple Inc. Invesco Distributors, Inc. is not affiliated with Apple Inc.
2 Invesco Multi-Asset Inflation Fund
Bruce Crockett | Dear Fellow Shareholders: Among the many important lessons I’ve learned in more than 40 years in a variety of business endeavors is the value of a trusted advocate. As independent chair of the Invesco Funds Board, I can assure you that the members of the Board are strong advocates for the interests of investors in Invesco’s mutual funds. We work hard to represent your interests through oversight of the quality of the investment management services your funds receive and other matters important to your investment, including but not limited to: n Ensuring that Invesco offers a diverse lineup of mutual funds that your financial adviser can use to strive to meet your financial needs as your investment goals change over time. n Monitoring how the portfolio management teams of the Invesco funds are performing in light of changing economic and market conditions. |

| n | Assessing each portfolio management team’s investment performance within the context of the investment strategy described in the fund’s prospectus. |
| n | Monitoring for potential conflicts of interests that may impact the nature of the services that your funds receive. |
We believe one of the most important services we provide our fund shareholders is the annual review of the funds’ advisory and sub-advisory contracts with Invesco Advisers and its affiliates. This review is required by the Investment Company Act of 1940 and focuses on the nature and quality of the services Invesco provides as the adviser to the Invesco funds and the reasonableness of the fees that it charges for those services. Each year, we spend months carefully reviewing information received from Invesco and a variety of independent sources, such as performance and fee data prepared by Lipper Inc., an independent, third-party firm widely recognized as a leader in its field. We also meet with our independent legal counsel and other independent advisers to review and help us assess the information that we have received. Our goal is to assure that you receive quality investment management services for a reasonable fee.
I trust the measures outlined above provide assurance that you have a worthy advocate when it comes to choosing the Invesco Funds.
As always, please contact me at bruce@brucecrockett.com with any questions or concerns you may have. On behalf of the Board, we look forward to continuing to represent your interests and serving your needs.
Sincerely,

Bruce L. Crockett
Independent Chair
Invesco Funds Board of Trustees
3 Invesco Multi-Asset Inflation Fund
Management’s Discussion of Fund Performance
Performance summary
Invesco Multi-Asset Inflation Fund incepted on October 14, 2014. For the two-and-a-half-month reporting period ended December 31, 2014, the Fund, at net asset value (NAV), underperformed the Barclays 1-3 Month Treasury Bill Index.
Additional Fund performance appears later in this report.
Fund vs. Indexes
Cumulative total returns, 10/14/14 to 12/31/14, at net asset value (NAV). Performance shown does not include applicable contingent deferred sales charges (CDSC) or front-end sales charges, which would have reduced performance.
| Class A Shares | –3.55 | % | |||
| Class C Shares | –3.61 | ||||
| Class R Shares | –3.60 | ||||
| Class Y Shares | –3.49 | ||||
| Class R5 Shares | –3.49 | ||||
| Class R6 Shares | –3.49 | ||||
| Barclays 1-3 Month Treasury Bill Index‚ (Broad Market Index) | 0.01 | ||||
| US Consumer Price Index‚ (Style-Specific Index)* | –1.35 | ||||
| Lipper Flexible Portfolio Funds Index‚ (Peer Group Index) | 3.15 | ||||
Source(s): ‚Lipper Inc. | |||||
*The return for the US Consumer Price Index is from 9/30/14, the month-end closest to the Fund’s inception. |
| ||||
Market conditions and your Fund
The Fund incepted on October 14, 2014. For the two-and-a-half month reporting period, the Fund produced negative returns and underperformed its its broad market benchmark, the Barclays 1-3 Month Treasury Bill Index. Upon the Fund’s inception, we fully invested the Fund’s assets in a mix of inflation-sensitive asset classes through underlying mutual funds and exchange traded funds (ETFs).
During the reporting period, the US economy continued to expand, albeit slowly, even as other regions – particularly Europe and Asia – struggled. The US Federal Reserve (the Fed), which had been reducing its asset purchases throughout 2014, finally ended all purchases in October. Concerns that the Fed’s policies would result in higher interest rates proved unfounded as long-term
interest rates largely fell throughout the reporting period. This macroeconomic environment was broadly supportive of US equity markets, which rose during the reporting period. Oil prices began falling sharply in mid-September, leading a broad decline in commodity prices during the reporting period.
Against this backdrop, Invesco Global Health Care Fund and iShares U.S. Consumer Goods ETF contributed to the Fund’s performance. Invesco Global Real Estate Fund, which benefited from the continued recovery of US real estate investment trusts, also contributed to absolute performance. Given the head-winds across commodities, PowerShares DB Oil Fund, Invesco Energy Fund and Invesco Gold & Precious Metals Fund were the largest detractors from Fund performance.
Please note that some of the Fund’s underlying funds, which include, but are not limited to, Invesco Balanced-Risk Commodity Strategy Fund, may use derivatives, which may create economic leverage in the underlying funds. Additionally, please note that the underlying fund listed above has a strategy that may be principally implemented with derivative instruments that include futures and total return swaps. Therefore, all or most of the performance of the underlying fund, both positive and negative, can be attributed to these instruments. Derivatives may amplify traditional investment risks through the creation of leverage and may be less liquid than traditional securities.
Thank you for investing in Invesco Multi-Asset Inflation Fund.
The views and opinions expressed in management’s discussion of Fund performance are those of Invesco Advisers, Inc. These views and opinions are subject to change at any time based on factors such as market and economic conditions. These views and opinions may not be relied upon as investment advice or recommendations, or as an offer for a particular security. The information is not a complete analysis of every aspect of any market, country, industry, security or the Fund. Statements of fact are from sources considered reliable, but Invesco Advisers, Inc. makes no representation or warranty as to their completeness or accuracy. Although historical performance is no guarantee of future results, these insights may help you understand our investment management philosophy.
See important Fund and, if applicable, index disclosures later in this report.
Portfolio Composition*
By security type, based on total investments
| Equity Funds | 41.8 | % | |||
| Exchange-Traded Funds | 27.6 | ||||
| Fixed Income Funds | 19.0 | ||||
| Alternative Funds | 8.8 | ||||
| Money Market Funds | 2.8 | ||||
| * | Based on the Schedule of Investments, which classifies each underlying fund and other investments into broad asset classes based on their predominant investments. |
Total Net Assets | $285.7 thousand |
The Fund’s holdings are subject to change, and there is no assurance that the Fund will continue to hold any particular security.
 | Duy Nguyen Chartered Financial Analyst, Portfolio Manager and Chief Investment Officer of Invesco Solutions, is | |
| manager of Invesco Multi-Asset Inflation Fund. He joined Invesco in 2000. Mr. Nguyen earned a BBA from The University of Texas at Austin and an MS from the University of Houston. | ||
Assisted by Invesco’s Solutions Team
4 Invesco Multi-Asset Inflation Fund
Your Fund’s Performance
| Cumulative Total Returns | |||||
| As of 12/31/14, including maximum applicable sales charges | |||||
| Class A Shares | |||||
| Inception (10/14/14) | –8.83 | % | |||
| Class C Shares | |||||
| Inception (10/14/14) | –4.57 | % | |||
| Class R Shares | |||||
| Inception (10/14/14) | –3.60 | % | |||
| Class Y Shares | |||||
| Inception (10/14/14) | –3.49 | % | |||
| Class R5 Shares | |||||
| Inception (10/14/14) | –3.49 | % | |||
| Class R6 Shares | |||||
| Inception (10/14/14) | –3.49 | % | |||
The performance data quoted represent past performance and cannot guarantee comparable future results; current performance may be lower or higher. Please visit invesco.com/performance for the most recent month-end performance. Performance figures reflect reinvested distributions, changes in net asset value and the effect of the maximum sales charge unless otherwise
stated. Performance figures do not reflect deduction of taxes a shareholder would pay on Fund distributions or sale of Fund shares. Investment return and principal value will fluctuate so that you may have a gain or loss when you sell shares.
The net annual Fund operating expense ratio set forth in the most recent Fund prospectus as of the date of this report for Class A, Class C, Class R, Class Y, Class R5 and Class R6 shares was 1.36%, 2.11%, 1.61%, 1.11%, 1.11% and 1.11%, respectively.1,2 The total annual Fund operating expense ratio set forth in the most recent Fund prospectus as of the date of this report for Class A, Class C, Class R, Class Y, Class R5 and Class R6 shares was 2.78%, 3.53%, 3.03%, 2.53%, 2.43% and 2.38%, respectively.2 The expense ratios presented above may vary from the expense ratios presented in other sections of this report that are based on expenses incurred during the period covered by this report.
Class A share performance reflects the maximum 5.50% sales charge, and Class C share performance reflects the applicable contingent deferred sales charge (CDSC) for the period involved. The CDSC on Class C shares is 1% for the first year after purchase. Class R, Class Y, Class R5 and Class R6 class shares do not have a front-end sales charge or a CDSC; therefore, performance is at net asset value.
The performance of the Fund’s share classes will differ primarily due to different sales charge structures and class expenses.
Had the adviser not waived fees and/ or reimbursed expenses, performance would have been lower.
| 1 | Total annual Fund operating expenses after any contractual fee waivers and/or expense reimbursements by the adviser in effect through at least April 30, 2016. See current prospectus for more information. |
| 2 | The expense ratio includes acquired fund fees and expenses of the underlying funds in which the Fund invests of 0.63% for Invesco Multi-Asset Inflation Fund. |
Invesco Multi-Asset Inflation Fund’s investment objective is total return, comprised of current income and capital appreciation.
| n | Unless otherwise stated, information presented in this report is as of December 31, 2014, and is based on total net assets. |
| n | Unless otherwise noted, all data provided by Invesco. |
| n | To access your Fund’s reports/prospectus, visit invesco.com/fundreports. |
About share classes
| n | Class R shares are generally available only to employer sponsored retirement and benefit plans. Please see the prospectus for more information. |
| n | Class Y shares are available only to certain investors. Please see the prospectus for more information. |
| n | Class R5 shares and Class R6 shares are primarily intended for employer sponsored retirement and benefit plans that meet certain standards and for institutional investors. Please see the prospectus for more information. |
Principal risks of investing in the Fund
The principal risks of investing in the Fund are:
| n | Allocation risk. The Fund’s investment performance depends, in part, on how its assets are allocated among the inflation-sensitive asset classes and, within each asset class, among the underlying funds and other investments held by the Fund. There is a risk that the Adviser’s evaluations and assumptions regarding the Fund’s broad asset classes or the underlying funds in which the Fund invests may be incorrect, causing the Fund to be invested (or not invested) |
This report must be accompanied or preceded by a currently effective Fund prospectus, which contains more complete information, including sales charges and expenses. Investors should read it carefully before investing.
NOT FDIC INSURED | MAY LOSE VALUE | NO BANK GUARANTEE
| in an asset class at an inopportune time. The Adviser’s allocation of the Fund’s assets among asset classes and underlying funds and other investments may therefore not produce the desired results and could cause the Fund to perform poorly or underperform other available funds. The Fund may underperform the rate of inflation during a sudden rapid rise in inflation as the Fund’s investment strategy relies on historical trends and may not react quickly enough to capture a spike in interest rates. |
| n | Exchange-traded funds risk. An investment by the Fund or an underlying fund in exchange-traded funds generally presents the same primary risks as an investment in a mutual fund. In addition, an exchange-traded fund may be subject to the following: (1) a discount of the exchange-traded fund’s shares |
continued on page 6
5 Invesco Multi-Asset Inflation Fund
continued from page 5
| to its net asset value; (2) failure to develop an active trading market for the exchange-traded fund’s shares; (3) the listing exchange halting trading of the exchange-traded fund’s shares; (4) failure of the exchange-traded fund’s shares to track the referenced asset; and (5) holding troubled securities in the referenced index or basket of investments. Investments in exchange-traded funds may involve duplication of management fees and certain other expenses, as the Fund or an underlying fund indirectly bears its proportionate share of any expenses paid by the exchange-traded funds in which it invests. Further, certain of the exchange-traded funds in which the Fund or underlying fund may invest are leveraged. The more the Fund or an underlying fund invests in such leveraged exchange-traded funds, the more this leverage will magnify any losses on those investments. |
| n | Fund of funds risk. The Fund’s performance depends on the underlying funds in which it invests, and it is subject to the risks of the underlying funds. The Fund will indirectly pay a proportional share of the fees and expenses of the underlying funds in which it invests. Market fluctuations may change the target weightings in the underlying funds. The underlying funds may change their investment objectives, policies or practices and may not achieve their investment objectives, all of which may cause the Fund to withdraw its investments therein at a disadvantageous time. |
| n | Inflation-indexed security risk. The value of an inflation-indexed security (such as TIPS) tends to decrease when real interest rates increase and increase when real interest rates decrease. Interest payments on inflation-indexed securities will vary along with changes in the CPI. |
The principal risks of investing in the Fund also include the risks of each underlying fund. These risks include:
| n | Cash/cash equivalents risk. Holding cash or cash equivalents may negatively affect performance. |
| n | Changing fixed income market conditions risk. The current low interest rate environment was created in part by the Federal Reserve Board (FRB) and certain foreign central banks keeping the federal funds and equivalent foreign rates at or near zero. There is a risk that interest rates will rise when the |
| FRB and central banks raise these rates. This risk is heightened due to the potential “tapering” of the FRB’s quantitative easing program and other similar foreign central bank actions. This tapering and eventual increase in the federal funds and equivalent foreign rates may expose fixed income markets to heightened volatility and reduced liquidity for certain fixed income investments, particularly those with longer maturities. In addition, decreases in fixed income dealer market-making capacity may also potentially lead to heightened volatility and reduced liquidity in the fixed income markets. As a result, the value of the underlying fund’s investments and share price may decline. Changes in central bank policies could also result in higher than normal shareholder redemptions, which could potentially increase portfolio turnover and the underlying fund’s transaction costs. |
| n | Collateralized loan obligations risk. In addition to the normal interest rate, default and other risks of fixed income securities, collateralized loan obligations carry additional risks, including the possibility that distributions from collateral securities will not be adequate to make interest or other payments, the quality of the collateral may decline in value or default, an underlying fund may invest in collateralized loan obligations that are subordinate to other classes, values may be volatile, and disputes with the issuer may produce unexpected investment results. |
| n | Commodity-linked notes risk. An underlying fund’s investments in commodity-linked notes may involve substantial risks, including risk of loss of a significant portion of their principal value. In addition to risks associated with the underlying commodities, they may be subject to additional special risks, such as the lack of a secondary trading market and temporary price distortions due to speculators and/or the continuous rolling over of futures contracts underlying the notes. Commodity-linked notes are also subject to counterparty risk, which is the risk that the other party to the contract will not fulfill its contractual obligation to complete the transaction with an underlying fund. |
| n | Commodity risk. Certain of the underlying fund’s significant investment exposure to the commodities markets and/ or a particular sector of the commodities markets, may subject the underlying fund to greater volatility than |
| investments in traditional securities, such as stocks and bonds. The commodities markets may fluctuate widely based on a variety of factors, including changes in overall market movements, domestic and foreign political and economic events and policies, war, acts of terrorism, changes in domestic or foreign interest rates and/or investor expectations concerning interest rates, domestic and foreign inflation rates and investment and trading activities of mutual funds, hedge funds and commodities funds. Prices of various commodities may also be affected by factors such as drought, floods, weather, livestock disease, embargoes, tariffs and other regulatory developments. The prices of commodities can also fluctuate widely due to supply and demand disruptions in major producing or consuming regions. Because certain of the underlying fund’s performance is linked to the performance of potentially volatile commodities, investors should be willing to assume the risks of potentially significant fluctuations in the value of the underlying fund’s shares. |
| n | Commodities tax risk. The tax treatment of commodity-linked derivative instruments may be adversely affected by changes in legislation, regulations or other legally binding authority. If, as a result of any such adverse action, the income of an underlying fund from certain commodity-linked derivatives was treated as non-qualifying income, an underlying fund that invests in commodity-linked derivatives to a significant degree might fail to qualify as a regulated investment company and be subject to federal income tax at the fund level. The Internal Revenue Service has issued a number of private letter rulings to other mutual funds, including to another Invesco fund (upon which only the fund that received the private letter ruling can rely), which indicate that income from a fund’s investment in certain commodity linked notes and a wholly owned foreign subsidiary that invests in commodity-linked derivatives constitutes qualifying income. However, the Internal Revenue Service suspended issuance of any further private letter rulings in July 2011 pending a review of its position. Should the Internal Revenue Service issue guidance, or Congress enact legislation, that adversely affects the tax treatment of an underlying fund’s use of commodity-linked notes or a wholly-owned subsidiary (which guidance might be applied |
6 Invesco Multi-Asset Inflation Fund
| to the underlying fund retroactively), it could limit the underlying fund’s ability to pursue its investment strategy and the underlying fund might not qualify as a regulated investment company for one or more years. In this event, the underlying fund’s Board of Trustees may authorize a significant change in investment strategy or fund liquidation. The underlying fund also may incur transaction and other costs to comply with any new or additional guidance from the Internal Revenue Service. |
| n | Concentration risk. To the extent an underlying fund invests a greater amount in any one sector or industry, an underlying fund’s performance will depend to a greater extent on the overall condition of the sector or industry, and there is increased risk to an underlying fund if conditions adversely affect that sector or industry. |
| n | Consumer discretionary sector risk. An underlying fund may concentrate its investments in securities of issuers in the consumer discretionary sector. Companies engaged in the consumer discretionary sector are affected by fluctuations in supply and demand and changes in consumer preferences. Changes in consumer spending as a result of world events, political and economic conditions, commodity price volatility, changes in exchange rates, imposition of import controls, increased competition, depletion of resources and labor relations also may adversely affect these companies. |
| n | Convertible securities risk. An underlying fund may own convertible securities, the value of which may be affected by market interest rates, the risk that the issuer will default, the value of the underlying stock or the right of the issuer to buy back the convertible securities. |
| n | Correlation risk. Changes in the value of two investments or asset classes may not track or offset each other in the manner anticipated by the portfolio managers. Because an underlying fund’s investment strategy seeks to balance risk across three asset classes and, within each asset class, to balance risk across different countries and commodities, to the extent either the three asset classes or the selected countries and commodities are correlated in a way not anticipated by the portfolio managers an underlying fund’s risk allocation process may not succeed in achieving its investment objective. |
| n | Credit linked notes risk. Risks of credit linked notes include those risks associated with the underlying reference obligation including but not limited to market risk, interest rate risk, credit risk, default risk and foreign currency risk. In the case of a credit linked note created with credit default swaps, the structure will be “funded” such that the par amount of the security will represent the maximum loss that could be incurred on the investment and no leverage is introduced. An investor in a credit linked note bears counterparty risk or the risk that the issuer of the credit linked note will default or become bankrupt and not make timely payment of principal and interest of the structured security. |
| n | Credit risk. The issuer of instruments in which the underlying fund invests may be unable to meet interest and/or principal payments, thereby causing its instruments to decrease in value and lowering the issuer’s credit rating. |
| n | Currency/exchange rate risk. The dollar value of an underlying fund’s foreign investments will be affected by changes in the exchange rates between the dollar and the currencies in which those investments are traded. |
| n | Defaulted securities risk. Defaulted securities involve the substantial risk that principal will not be repaid. Defaulted securities and any securities received in an exchange for such securities may be subject to restrictions on resale. |
| n | Depositary receipts risk. Depositary receipts involve many of the same risks as those associated with direct investment in foreign securities. In addition, the underlying issuers of certain depositary receipts, particularly unsponsored or unregistered depositary receipts, are under no obligation to distribute shareholder communications to the holders of such receipts or to pass through to them any voting rights with respect to the deposited securities. |
| n | Derivatives risk. The value of a derivative instrument depends largely on (and is derived from) the value of an underlying security, currency, commodity, interest rate, index or other asset (each referred to as an underlying asset). In addition to risks relating to the underlying assets, the use of derivatives may include other, possibly greater, risks, including counterparty, leverage and liquidity risks. Counterparty risk is the risk that the counterparty to the derivative contract will default on its obligation |
| to pay an underlying fund the amount owed or otherwise perform under the derivative contract. Derivatives create leverage risk because they do not require payment up front equal to the economic exposure created by owning the derivative. As a result, an adverse change in the value of the underlying asset could result in the underlying fund sustaining a loss that is substantially greater than the amount invested in the derivative, which may make an underlying fund’s returns more volatile and increase the risk of loss. Derivative instruments may also be less liquid than more traditional investments and the underlying fund may be unable to sell or close out its derivative positions at a desirable time or price. This risk may be more acute under adverse market conditions, during which the underlying fund may be most in need of liquidating its derivative positions. Derivatives may also be harder to value, less tax efficient and subject to changing government regulation that could impact the underlying fund’s ability to use certain derivatives or their cost. Also, derivatives used for hedging or to gain or limit exposure to a particular market segment may not provide the expected benefits, particularly during adverse market conditions. These risks are greater for certain underlying funds than mutual funds that do not use derivative instruments or that use derivative instruments to a lesser extent than certain underlying funds to implement their investment strategy. |
| n | Developing/emerging markets securities risk. The prices of securities issued by foreign companies and governments located in developing/emerging market countries held by an underlying fund may be affected more negatively by inflation, devaluation of their currencies, higher transaction costs, delays in settlement, adverse political developments, the introduction of capital controls, withholding taxes, nationalization of private assets, expropriation, social unrest, war or lack of timely information than those in developed countries. |
| n | Energy industry sector risk. Certain underlying funds may concentrate their investments in the securities of issuers engaged primarily in energy related industries. The businesses in which an underlying fund invests may be adversely affected by foreign, federal or state regulations governing energy |
continued on page 8
7 Invesco Multi-Asset Inflation Fund
continued from page 7
| production, distribution and sale as well as supply-and-demand for energy resources. Although individual security selection drives the performance of the Fund, short-term fluctuations in energy prices may cause price fluctuations in its shares. |
| n | Exchange-traded notes risk. Exchange-traded notes are subject to credit risk, including the credit risk of the issuer, and the value of the exchange-traded note may drop due to a downgrade in the issuer’s credit rating, despite the underlying market benchmark or strategy remaining unchanged. The value of an exchange-traded note may also be influenced by time to maturity, level of supply and demand for the exchange-traded note, volatility and lack of liquidity in the underlying market, changes in the applicable interest rates, changes in the issuer’s credit rating, and economic, legal, political, or geographic events that affect the referenced underlying market or strategy. Exchange-traded notes are also subject to counterparty risk. Exchange-traded notes are also subject to the risk that the other party to the contract will not fulfill its contractual obligations, which may cause losses or additional costs to an underlying fund. |
| n | Financial industry focus risk. To the extent an underlying fund invests in securities issued or guaranteed by companies in the banking and financial services industries, the underlying fund’s performance will depend on the overall condition of those industries, which may be affected by the following factors: the supply of short-term financing; changes in government regulation and interest rates; and overall economy. |
| n | Floating rate risk. Some of the underlying funds may invest in senior secured floating rate loans and debt securities that require collateral. There is a risk that the value of the collateral may not be sufficient to cover the amount owed, collateral securing a loan may be found invalid, and collateral may be used to pay other outstanding obligations of the borrower under applicable law or may be difficult to sell. There is also the risk that the collateral may be difficult to liquidate, or that a majority of the collateral may be illiquid. |
| n | Foreign currency tax risk. If the US Treasury Department were to exercise its authority to issue regulations that exclude from the definition of “ qualifying |
| income” foreign currency gains not directly related to an underlying fund’s business of investing in securities, the underlying fund may be unable to qualify as a regulated investment company for one or more years. In this event, the underlying fund’s Board of Trustees may authorize a significant change in investment strategy or fund liquidation. |
| n | Foreign government debt risk. Investments in foreign government debt obligations involve certain risks in addition to those relating to foreign securities or debt securities generally. The issuer of the debt or the governmental authorities that control the repayment of the debt may be unable or unwilling to repay principal or interest when due in accordance with the terms of such debt, and the Fund may have limited recourse in the event of a default against the defaulting government. Without the approval of debt holders, some governmental debtors have in the past been able to reschedule or restructure their debt payments or declare moratoria on payments. |
| n | Foreign securities risk. An underlying fund’s foreign investments may be affected by changes in a foreign country’s exchange rates, political and social instability; changes in economic or taxation policies, difficulties when enforcing obligations, decreased liquidity, and increased volatility. Foreign companies may be subject to less regulation resulting in less publicly available information about the companies. |
| n | Geographic focus risk. From time to time an underlying fund may invest a substantial amount of its assets in securities of issuers located in a single country or a limited number of countries. If an underlying fund focuses its investments in this manner, it assumes the risk that economic, political and social conditions in those countries will have a significant impact on its investment performance. An underlying fund’s investment performance may also be more volatile if it focuses its investments in certain countries, especially emerging market countries. |
| n | Gold bullion risk. To the extent an underlying fund invests in gold bullion, it will earn no income. Appreciation in the market price of gold is the sole manner in which an underlying fund can realize gains on gold bullion, and such investments may incur higher storage and custody costs as compared |
| to purchasing, holding and selling more traditional investments. |
| n | Gold and precious metals industry risk. Fluctuations in the price of gold and precious metals may affect the profitability of companies in the gold and precious metals sector. Changes in the political or economic conditions of countries where companies in the gold and precious metals sector are located may have a direct effect on the price of gold and precious metals. |
| n | Health care sector risk. An underlying fund will concentrate its investments in the securities of domestic and foreign issuers in the health care industry. The underlying fund’s performance is vulnerable to factors affecting the health care industry, including government regulation, obsolescence caused by scientific advances and technological innovations. |
| n | High yield bond (junk bond) risk. Junk bonds involve a greater risk of default or price changes due to changes in the credit quality of the issuer. The values of junk bonds fluctuate more than those of high- quality bonds in response to company, political, regulatory or economic developments. Values of junk bonds can decline significantly over short periods of time. |
| n | Income risk. The income the Fund receives from an underlying fund is based primarily on prevailing interest rates, which can vary widely over the short- and long-term. If interest rates drop, the income from an underlying fund may drop as well. |
| n | Indexing risk. Unlike many investment companies, an underlying fund does not utilize an investing strategy that seeks returns in excess of the underlying index. Therefore, it would not necessarily sell a security unless that security is removed from the underlying index. |
| n | Infrastructure companies risk. Certain underlying funds may concentrate their investments in the infrastructure industry. Infrastructure companies are subject to a variety of factors that may adversely affect their business or operations, including costs associated with environmental, governmental and other regulations, high interest costs in connection with capital construction programs, high leverage, the effects of economic slowdown, surplus capacity, increased competition from other providers of services, uncertainties concerning the availability of fuel at reasonable |
8 Invesco Multi-Asset Inflation Fund
| prices, the effects of energy conservation policies, unfavorable tax laws or accounting policies, and other factors. Infrastructure companies are also affected by environmental damage due to a company’s operations or an accident, difficulty in raising capital in adequate amounts on reasonable terms in periods of high inflation and unsettled capital markets, increased susceptibility to terrorist acts or political actions, and general changes in market sentiment towards infrastructure assets. |
| n | Interest rate risk. Interest rate risk refers to the risk that bond prices generally fall as interest rates rise; conversely, bond prices generally rise as interest rates fall. Specific bonds differ in their sensitivity to changes in interest rates depending on their individual characteristics, including duration. |
| n | Leverage risk. Leverage exists when an underlying fund purchases or sells an asset or enters into a transaction without investing cash in an amount equal to the full economic exposure of the instrument or transaction and the underlying fund could lose more than it invested. Leverage created from borrowing or certain types of transactions or instruments may impair an underlying fund’s liquidity, cause it to liquidate positions at an unfavorable time, increase volatility or otherwise not achieve its intended objective. |
| n | Liquidity risk. An underlying fund may hold illiquid securities that it is unable to sell at the preferred time or price and could lose its entire investment in such securities. |
| n | Management risk. The investment techniques and risk analysis used by the Fund’s and the underlying funds’ portfolio managers may not produce the desired results. |
| n | Market risk. The prices of and the income generated by an underlying fund’s securities may decline in response to, among other things, investor sentiment, general economic and market conditions, regional or global instability, and currency and interest rate fluctuations. |
| n | Market trading risks of exchange-traded funds. Certain underlying exchange-traded funds face market trading risks, including the potential lack of an active market for the underlying fund’s shares, losses from trading in secondary markets, and disruption in the creation/redemption process of the underlying |
fund. Any of these factors may lead to the underlying fund’s shares trading at a premium or discount to the underlying fund’s net asset value (“NAV”).
| n | MLP risk. An MLP is a public limited partnership or limited liability company taxed as a partnership under the Internal Revenue Code (the Code). Although the characteristics of MLPs closely resemble a traditional limited partnership, a major difference is that MLPs may trade on a public exchange or in the over-the-counter market. The ability to trade on a public exchange or in the over-the-counter market provides a certain amount of liquidity not found in many limited partnership investments. However, MLP interests may be less liquid and subject to more abrupt or erratic price movements than conventional publicly traded securities. The risks of investing in an MLP are similar to those of investing in a partnership and include more flexible governance structures, which could result in less protection for investors than investments in a corporation. Investors in an MLP would normally not be liable for the debts of the MLP beyond the amount that the investor has contributed but investors may not be shielded to the same extent that a shareholder of a corporation would be. MLPs are generally considered interest-rate sensitive investments. During periods of interest rate volatility, these investments may not provide attractive returns. MLPs that concentrate in a particular industry or a particular geographic region are subject to risks associated with such industry or region. Additionally, if an underlying fund were to invest more than 25% its total assets in MLPs that are taxed as partnerships this could cause the underlying fund to lose its status as a regulated investment company under Subchapter M of the Internal Revenue Code. |
| n | MLP tax risk. MLPs taxed as partnerships do not pay U.S. federal income tax at the partnership level. Rather, each partner is allocated a share of the partnership’s income, gains, losses, deductions and expenses. A change in current tax law, or a change in the underlying business mix of a given MLP, could result in an MLP being treated as a corporation for U.S. federal income tax purposes, which would result in such MLP being required to pay U.S. federal income tax on its taxable |
| income. The classification of an MLP as a corporation for U.S. federal income tax purposes would have the effect of reducing the amount of cash available for distribution by the MLP. Thus, if any of the MLPs owned by the underlying fund were treated as a corporation for U.S. federal income tax purposes, it could result in a reduction of the value of the underlying fund’s investment, and consequently your investment in the Fund and lower income. |
| n | Mortgage- and asset-backed securities risk. Certain of the underlying funds may invest in mortgage and asset-backed securities that are subject to prepayment or call risk, which is the risk that the borrower’s payments may be received earlier or later than expected due to changes in prepayment rates on underlying loans. Faster prepayments often happen when interest rates are falling. As a result, an underlying fund may reinvest these early payments at lower interest rates, thereby reducing the underlying fund’s income. Conversely, when interest rates rise, prepayments may happen more slowly, causing the security to lengthen in duration. Longer duration securities tend to be more volatile. Securities may be prepaid at a price less than the original purchase value. An unexpectedly high rate of defaults on the mortgages held by a mortgage pool may adversely affect the value of mortgage-backed securities and could result in losses to an underlying fund. The risk of such defaults is generally higher in the case of mortgage pools that include subprime mortgages. Subprime mortgages refer to loans made to borrowers with weakened credit histories or with lower capacity to make timely payments on their mortgages. |
| n | Non-correlation risk. The return of an underlying fund that seeks to track an index may not match the return of the underlying index for a number of reasons. For example, the underlying fund incurs operating expenses not applicable to the underlying index, and incurs costs in buying and selling securities, especially when rebalancing an underlying fund’s securities holdings to reflect changes in the composition of the underlying index. In addition, the performance of an underlying fund and an underlying index may vary due to asset valuation differences and differences between an underlying fund’s portfolio |
continued on page 10
9 Invesco Multi-Asset Inflation Fund
continued from page 9
| and the underlying index resulting from legal restrictions, cost or liquidity constraints. |
| n | Non-diversification risk. Certain of the underlying funds are non-diversified and can invest a greater portion of their assets in a small number of issuers or a single issuer. A change in the value of the issuer could affect the value of an underlying fund more than if it was a diversified fund. |
| n | Preferred securities risk. Preferred securities may include provisions that permit the issuer, in its discretion, to defer or omit distributions for a certain period of time. If an underlying fund owns a security that is deferring or omitting its distributions, an underlying fund may be required to report the distribution on its tax returns, even though it may not have received this income. Further, preferred securities may lose substantial value due to the omission or deferment of dividend payments. |
| n | Prepayment risk. An issuer’s ability to prepay principal on a loan or debt security prior to maturity can limit an underlying fund’s potential gains. Prepayments may require the underlying fund to replace the loan or debt security with a lower yielding security, adversely affecting an underlying fund’s yield. |
| n | Reinvestment risk. Reinvestment risk is the risk that a bond’s cash flows (coupon income and principal repayment) will be reinvested at an interest rate below that on the original bond. If interest rates decline, the underlying bond may rise in value, but the cash flows received from that bond may have to be reinvested at a lower interest rate. |
| n | REIT risk/real estate risk. Certain underlying funds may concentrate their investments in the securities of real estate and real estate related companies. Investments in real estate related instruments may be affected by economic, legal, cultural, environmental or technological factors that affect property values, rents or occupancies of real estate related to and underlying fund’s holdings. Real estate companies, including REITs or similar structures, tend to be small and mid-cap companies, and their shares may be more volatile and less liquid. The value of investments in real estate related companies may be affected by the quality of management, the ability to repay loans, the utilization of leverage and financial covenants related thereto, whether the company carries adequate insurance |
| and environmental factors. If a real estate related company defaults, an underlying fund may own real estate directly, which involves the following additional risks: environmental liabilities; difficulty in valuing and selling the real estate; and economic or regulatory changes. |
| n | Sector fund risk. Certain of the underlying funds’ investments are concentrated in a comparatively narrow segment of the economy, which may make the underlying fund more volatile than non-concentrated funds. |
| n | Securities lending risk. Certain underlying funds may engage in securities lending. Securities lending involves a risk of loss because the borrower may fail to return the securities in a timely manner or at all. If an underlying fund is not able to recover the securities loaned, it may sell the collateral and purchase a replacement security in the market. Lending securities entails a risk of loss to the underlying fund if and to the extent that the market value of the loaned securities increases and the collateral is not increased accordingly. Any cash received as collateral for loaned securities will be invested in an affiliated money market fund. This investment is subject to market appreciation or depreciation and the underlying fund will bear any loss on the investment of cash collateral. |
| n | Short sales risk. If an underlying fund sells short a security that it does not own and the security increases in value, the underlying fund will pay a higher price to repurchase the security and thereby incur a loss. Short sales may cause an underlying fund to repurchase a security at a higher price, causing the underlying fund to incur a loss. A short position in a security poses more risk than holding the same security long. As there is no limit on how much the price of the security can increase, the underlying fund’s exposure is unlimited. In order to establish a short position in a security, the underlying fund must borrow the security from a broker. The underlying fund may not always be able to borrow a security the underlying fund seeks to sell short at a particular time or at an acceptable price. The underlying fund also may not always be able to close out the short position by replacing the borrowed securities at a particular time or at an acceptable price. The underlying fund will incur increased transaction costs associated with selling |
securities short. In addition, taking short positions in securities results in a form of leverage which may cause the underlying fund to be volatile. |
| n | Small- and mid-capitalization risks. Stocks of small- and mid-sized companies tend to be more vulnerable to adverse developments and may have little or no operating history or track record of success, and limited product lines, markets, management and financial resources. The securities of small- and mid-sized companies may be more volatile due to less market interest and less publicly available information about the issuer. They also may be illiquid or restricted as to resale, or may trade less frequently and in smaller volumes, all of which may cause difficulty when establishing or closing a position at a desirable price. |
| n | Subsidiary risk. Certain underlying funds invest in wholly owned subsidiaries to gain exposure to commodities and other non-securities in amounts greater than could be held directly by the underlying funds. By investing in the subsidiary, an underlying fund is indirectly exposed to risks associated with the subsidiary’s investments. The subsidiary is not registered under the Investment Company Act of 1940, as amended (1940 Act), and except as otherwise noted in the underlying fund’s prospectus, is not subject to the investor protections of the 1940 Act. Changes in the laws of the United States and/or the Cayman Islands, under which the underlying fund and the subsidiary, respectively, are organized, could result in the inability of the underlying fund and/or the subsidiary to operate as described in the underlying fund prospectus and SAI and could negatively affect the underlying fund and, therefore, the Fund. |
| n | US government obligations risk. Underlying funds may invest in obligations issued by US government agencies and instrumentalities that may receive varying levels of support from the government, which could affect an underlying fund’s ability to recover should they default. |
| n | Volatility risk. An underlying fund may have investments that appreciate or decrease significantly in value over short periods of time. This may cause an underlying fund’s net asset value per share to experience significant increases or declines in value over short periods of time. |
10 Invesco Multi-Asset Inflation Fund
About indexes used in this report
| n | The Barclays 1-3 Month Treasury Bill Index includes all publicly issued zero-coupon US Treasury bills that have a remaining maturity of less than three months and more than one month, that are rated investment-grade and have $250 million or more of outstanding face value. In addition, the securities must be denominated in US dollars and must be fixed rate and non-convertible. |
| n | The US Consumer Price Index is a measure of change in consumer prices as determined by the US Bureau of Labor Statistics. |
| n | The Lipper Flexible Portfolio Funds Index is an unmanaged index considered representative of flexible portfolio funds tracked by Lipper. |
| n | The Fund is not managed to track the performance of any particular index, including the index(es) described here, and consequently, the performance of the Fund may deviate significantly from the performance of the index(es). |
| n | A direct investment cannot be made in an index. Unless otherwise indicated, index results include reinvested dividends, and they do not reflect sales charges. Performance of the peer group, if applicable, reflects fund expenses; performance of a market index does not. |
Other information
| n | The returns shown in management’s discussion of Fund performance are based on net asset values (NAVs) calculated for shareholder transactions. Generally accepted accounting principles require adjustments to be made to the net assets of the Fund at period end for financial reporting purposes, and as such, the NAVs for shareholder transactions and the returns based on those NAVs may differ from the NAVs and returns reported in the Financial Highlights. |
11 Invesco Multi-Asset Inflation Fund
Schedule of Investments
December 31, 2014
Invesco Multi-Asset Inflation Fund
Schedule of Investments in Affiliated and Unaffiliated Issuers–100.12%(a)
| % of Net Assets 12/31/14 | Value 10/14/14 (Commencement Date) | Purchases at Cost | Proceeds from Sales | Change in Unrealized Appreciation (Depreciation) | Realized Gain (Loss) | Dividend Income | Shares 12/31/14 | Value 12/31/14 | ||||||||||||||||||||||||||||
Alternative Funds–6.41% | ||||||||||||||||||||||||||||||||||||
PowerShares DB Oil Fund–ETF(b) | 6.41 | % | $ | — | $ | 27,194 | $ | — | $ | (8,872 | ) | $ | — | $ | — | 1,167 | $ | 18,322 | ||||||||||||||||||
Asset Allocation Funds–8.86% |
| |||||||||||||||||||||||||||||||||||
Invesco Balanced-Risk Commodity Strategy Fund–Class R6(b) | 8.86 | % | — | 27,361 | — | (2,060 | ) | — | — | 3,383 | 25,301 | |||||||||||||||||||||||||
Domestic Equity Funds–19.47% |
| |||||||||||||||||||||||||||||||||||
Invesco Energy Fund–Class R5 | 12.50 | % | — | 42,304 | (557 | ) | (5,810 | ) | 3,208 | 245 | 1,067 | 35,724 | ||||||||||||||||||||||||
iShares U.S. Consumer Goods ETF(d) | 6.97 | % | — | 19,628 | (1,134 | ) | 1,406 | 4 | 101 | 190 | 19,904 | |||||||||||||||||||||||||
Total Domestic Equity Funds | — | 61,932 | (1,691 | ) | (4,404 | ) | 3,212 | 346 | 1,257 | 55,628 | ||||||||||||||||||||||||||
Fixed-Income Funds–33.27% |
| |||||||||||||||||||||||||||||||||||
Invesco Emerging Market Local Currency Debt Fund–Class R6(c) | 1.88 | % | — | 5,827 | — | (437 | ) | — | 45 | 685 | 5,372 | |||||||||||||||||||||||||
Invesco Floating Rate Fund–Class R6 | 4.80 | % | — | 14,411 | (497 | ) | (198 | ) | (14 | ) | 146 | 1,775 | 13,702 | |||||||||||||||||||||||
Invesco High Yield Fund–Class R6 | 4.45 | % | — | 12,990 | (104 | ) | (173 | ) | (6 | ) | 164 | 2,962 | 12,707 | |||||||||||||||||||||||
iShares TIPS Bond ETF(d) | 14.23 | % | — | 43,231 | (1,916 | ) | (634 | ) | (21 | ) | 23 | 363 | 40,660 | |||||||||||||||||||||||
Invesco U.S. Government Fund–Class R5 | 6.01 | % | — | 18,330 | (1,129 | ) | (22 | ) | 3 | 81 | 1,911 | 17,182 | ||||||||||||||||||||||||
Invesco U.S. Mortgage Fund–Class R5 | 1.90 | % | — | 5,789 | (353 | ) | — | — | 52 | 432 | 5,436 | |||||||||||||||||||||||||
Total Fixed–Income Funds | — | 100,578 | (3,999 | ) | (1,464 | ) | (38 | ) | 511 | 8,128 | 95,059 | |||||||||||||||||||||||||
Foreign Equity Funds–22.69% |
| |||||||||||||||||||||||||||||||||||
Invesco Global Health Care Fund–Class Y | 7.68 | % | — | 23,338 | (1,054 | ) | (230 | ) | 2,221 | 7 | 506 | 21,927 | ||||||||||||||||||||||||
Invesco Global Infrastructure Fund–Class R6 | 6.68 | % | — | 18,291 | — | 796 | 20 | 204 | 1,832 | 19,087 | ||||||||||||||||||||||||||
Invesco Gold & Precious Metals Fund–Class Y(b) | 6.30 | % | — | 19,820 | — | (1,827 | ) | — | — | 4,673 | 17,993 | |||||||||||||||||||||||||
Invesco International Growth Fund–Class R6 | 2.03 | % | — | 5,905 | — | (102 | ) | 187 | 97 | 178 | 5,803 | |||||||||||||||||||||||||
Total Foreign Equity Funds | — | 67,354 | (1,054 | ) | (1,363 | ) | 2,428 | 308 | 7,189 | 64,810 | ||||||||||||||||||||||||||
Real Estate Funds–6.65% |
| |||||||||||||||||||||||||||||||||||
Invesco Global Real Estate Fund–Class R6 | 6.65 | % | — | 18,701 | (358 | ) | 658 | (14 | ) | 352 | 1,463 | 18,987 | ||||||||||||||||||||||||
Money Market Funds–2.77% |
| |||||||||||||||||||||||||||||||||||
Liquid Assets Portfolio–Institutional Class | 1.38 | % | — | 153,922 | (149,956 | ) | — | — | 1 | 3,966 | 3,966 | |||||||||||||||||||||||||
Premier Portfolio–Institutional Class | 1.39 | % | — | 153,923 | (149,957 | ) | — | — | 0 | 3,966 | 3,966 | |||||||||||||||||||||||||
Total Money Market Funds | — | 307,845 | (299,913 | ) | — | — | 1 | 7,932 | 7,932 | |||||||||||||||||||||||||||
TOTAL INVESTMENTS IN AFFILIATED AND UNAFFILIATED ISSUERS | 100.12 | % | $ | — | $ | 610,965 | $ | (307,015 | ) | $ | (17,505 | )(c) | $ | 5,588 | (e) | $ | 1,518 | $ | 286,039 | |||||||||||||||||
OTHER ASSETS LESS LIABILITIES | (0.12 | )% | (357 | ) | ||||||||||||||||||||||||||||||||
NET ASSETS | 100.00 | % | $ | 285,682 | ||||||||||||||||||||||||||||||||
Investment Abbreviations:
ETF – Exchange Traded Fund
TIPS – Treasury Inflation Protected Securities
Notes to Schedule of Investments:
| (a) | Each underlying fund and the Fund are affiliated by either having the same investment adviser or an investment adviser under common control with the Fund’s investment adviser. The Fund invests in the Fund shares of the exchange-traded funds listed. |
| (b) | Non-income producing security. A security is determined to be non-income producing if the security has not declared a distribution in more than one year from the report date. |
| (c) | Includes $18 of return of capital received from Invesco Emerging Markets Local Currency Debt Fund. |
| (d) | Not affiliated with Invesco Advisers, Inc. |
| (e) | Includes $3,421, $2,348, $20 and $187 of capital gains distributions from affiliated underlying funds for Invesco Energy Fund, Invesco Global Health Care Fund, Invesco Global Infrastructure Fund and Invesco International Growth Fund, respectively. |
See accompanying Notes to Financial Statements which are an integral part of the financial statements.
12 Invesco Multi-Asset Inflation Fund
Statement of Assets and Liabilities
December 31, 2014
Assets: |
| |||
Investments in affiliated and unaffiliated underlying funds, at value (Cost $303,544) | $ | 286,039 | ||
Receivable for: | ||||
Dividends — affiliated and unaffiliated underlying funds | 182 | |||
Investment for trustee deferred compensation and retirement plans | 722 | |||
Other assets | 84,809 | |||
Total assets | 371,752 | |||
Liabilities: |
| |||
Payable for: | ||||
Investments purchased — affiliated and unaffiliated underlying funds | 182 | |||
Accrued fees to affiliates | 58,048 | |||
Accrued trustees’ and officers’ fees and benefits | 148 | |||
Accrued other operating expenses | 26,970 | |||
Trustee deferred compensation and retirement plans | 722 | |||
Total liabilities | 86,070 | |||
Net assets applicable to shares outstanding | $ | 285,682 | ||
Net assets consist of: |
| |||
Shares of beneficial interest | $ | 299,205 | ||
Undistributed net investment income | (625 | ) | ||
Undistributed net realized gain | 4,607 | |||
Net unrealized appreciation (depreciation) | (17,505 | ) | ||
| $ | 285,682 | |||
Net Assets: |
| |||
Class A | $ | 107,203 | ||
Class C | $ | 9,555 | ||
Class R | $ | 9,554 | ||
Class Y | $ | 140,262 | ||
Class R5 | $ | 9,554 | ||
Class R6 | $ | 9,554 | ||
Shares outstanding, $0.01 par value per share, |
| |||
Class A | 11,232 | |||
Class C | 1,001 | |||
Class R | 1,001 | |||
Class Y | 14,694 | |||
Class R5 | 1,001 | |||
Class R6 | 1,001 | |||
Class A: | ||||
Net asset value per share | $ | 9.54 | ||
Maximum offering price per share | ||||
(Net asset value of $9.54 ¸ 94.50%) | $ | 10.10 | ||
Class C: | ||||
Net asset value and offering price per share | $ | 9.55 | ||
Class R: | ||||
Net asset value and offering price per share | $ | 9.54 | ||
Class Y: | ||||
Net asset value and offering price per share | $ | 9.55 | ||
Class R5: | ||||
Net asset value and offering price per share | $ | 9.54 | ||
Class R6: | ||||
Net asset value and offering price per share | $ | 9.54 | ||
See accompanying Notes to Financial Statements which are an integral part of the financial statements.
13 Invesco Multi-Asset Inflation Fund
Statement of Operations
For the period October 14, 2014 (commencement date) through December 31, 2014
Investment income: |
| |||
Dividends from affiliated and unaffiliated underlying funds | $ | 1,518 | ||
Other Income | 23 | |||
Total investment income | 1,541 | |||
Expenses: | ||||
Advisory fees | 91 | |||
Administrative services fees | 10,822 | |||
Custodian fees | 668 | |||
Distribution fees: | ||||
Class A | 57 | |||
Class C | 22 | |||
Class R | 11 | |||
Transfer agent fees — A, C, R and Y | 710 | |||
Transfer agent fees — R5 | 2 | |||
Transfer agent fees — R6 | 2 | |||
Trustees’ and officers’ fees and benefits | 4,040 | |||
Registration and filing fees | 22,912 | |||
Reports to shareholders | 6,635 | |||
Professional services fees | 25,504 | |||
Other | 3,640 | |||
Total expenses | 75,116 | |||
Less: Fees waived and expenses reimbursed | (74,735 | ) | ||
Net expenses | 381 | |||
Net investment income | 1,160 | |||
Realized and unrealized gain (loss) from: | ||||
Net realized gain (loss) on sales of affiliated and unaffiliated underlying fund shares | (388 | ) | ||
Net realized gain from distributions of affiliated and unaffiliated underlying fund shares | 5,976 | |||
| 5,588 | ||||
Change in net unrealized appreciation (depreciation) of affiliated and unaffiliated underlying fund shares | (17,505 | ) | ||
Net gain (loss) from affiliated and unaffiliated underlying funds | (11,917 | ) | ||
Net increase (decrease) in net assets resulting from operations | $ | (10,757 | ) | |
See accompanying Notes to Financial Statements which are an integral part of the financial statements.
14 Invesco Multi-Asset Inflation Fund
Statement of Changes in Net Assets
For the period October 14, 2014 (commencement date) through December 31, 2014
October 14, 2014 2014 | ||||
Operations: |
| |||
Net investment income | $ | 1,160 | ||
Net realized gain | 5,588 | |||
Change in net unrealized appreciation (depreciation) | (17,505 | ) | ||
Net increase (decrease) in net assets resulting from operations | (10,757 | ) | ||
Distributions to shareholders from net investment income: | ||||
Class A | (1,128 | ) | ||
Class C | (88 | ) | ||
Class R | (100 | ) | ||
Class Y | (1,611 | ) | ||
Class R5 | (110 | ) | ||
Class R6 | (110 | ) | ||
Total distributions from net investment income | (3,147 | ) | ||
Share transactions–net: | ||||
Class A | 112,127 | |||
Class C | 10,010 | |||
Class R | 10,010 | |||
Class Y | 147,419 | |||
Class R5 | 10,010 | |||
Class R6 | 10,010 | |||
Net increase in net assets resulting from share transactions | 299,586 | |||
Net increase in net assets | 285,682 | |||
Net assets: | ||||
Beginning of period | — | |||
End of period (includes undistributed net investment income of $(625)) | $ | 285,682 | ||
Notes to Financial Statements
December 31, 2014
NOTE 1—Significant Accounting Policies
Invesco Multi-Asset Inflation Fund (the “Fund”) is a series portfolio of AIM Growth Series (Invesco Growth Series) (the “Trust”). The Trust is organized as a Delaware statutory trust and is registered under the Investment Company Act of 1940, as amended (the “1940 Act”), as an open-end series management investment company consisting of seventeen separate series portfolios, each authorized to issue an unlimited number of shares of beneficial interest. The assets, liabilities and operations of each portfolio are accounted for separately. Information presented in these financial statements pertains only to the Fund. Matters affecting each portfolio or class will be voted on exclusively by the shareholders of such portfolio or class. The Fund commenced operations on October 14, 2014.
The Fund’s investment objective is total return, comprised of income and capital appreciation. The Fund is a “fund of funds,” in that it invests in other mutual funds advised by Invesco Advisers, Inc. (the “Adviser” or “Invesco”), and exchange-traded funds advised by Invesco PowerShares Capital Management LLC (“PowerShares Capital”), an affiliate of Invesco or other unaffiliated advisers (“underlying funds”). Invesco and PowerShares Capital are affiliates of each other as they are indirect, wholly-owned subsidiaries of Invesco Ltd. Invesco may change the Fund’s asset class allocations, the underlying funds or the target weightings in the underlying funds without shareholder approval. The underlying funds may engage in a number of investment techniques and practices, which involve certain risks. Each underlying fund’s accounting policies are outlined in the underlying fund’s financial statements and are publically available.
The Fund currently consists of six different classes of shares: Class A, Class C, Class R, Class Y, Class R5 and Class R6. Class A shares are sold with a front-end sales charge unless certain waiver criteria are met and under certain circumstances load waived shares may be subject to contingent deferred sales charges (“CDSC”). Class C shares are sold with a CDSC. Class R, Class Y, Class R5 and Class R6 shares are sold at net asset value.
The following is a summary of the significant accounting policies followed by the Fund in the preparation of its financial statements.
| A. | Security Valuations — Securities of investment companies that trade on an exchange are valued at the last sales price or official closing price as of the close of the customary trading session on the exchange where the security is principally traded. Investments in shares of funds that are |
15 Invesco Multi-Asset Inflation Fund
| not traded on an exchange are valued at the end of day net asset value per share of such fund. Securities in the underlying funds, including restricted securities, are valued in accordance with the valuation policy of such fund. The policies of the underlying funds affiliated with the Fund as a result of having the same investment adviser are set forth below. |
A security listed or traded on an exchange (except convertible securities) is valued at its last sales price or official closing price as of the close of the customary trading session on the exchange where the security is principally traded, or lacking any sales or official closing price on a particular day, the security may be valued at the closing bid price on that day. Securities traded in the over-the-counter market are valued based on prices furnished by independent pricing services or market makers. When such securities are valued by an independent pricing service they may be considered fair valued. Futures contracts are valued at the final settlement price set by an exchange on which they are principally traded. Listed options are valued at the mean between the last bid and ask prices from the exchange on which they are principally traded. Options not listed on an exchange are valued by an independent source at the mean between the last bid and ask prices. For purposes of determining net asset value per share, futures and option contracts generally are valued 15 minutes after the close of the customary trading session of the New York Stock Exchange (“NYSE”).
Senior secured floating rate loans and senior secured floating rate debt securities are fair valued using an evaluated quote provided by an independent pricing service. Evaluated quotes provided by the pricing service may reflect appropriate factors such as ratings, tranche type, industry, company performance, spread, individual trading characteristics, institution-size trading in similar groups of securities and other market data.
Investments in open-end and closed-end registered investment companies that do not trade on an exchange are valued at the end of day net asset value per share. Investments in open-end and closed-end registered investment companies that trade on an exchange are valued at the last sales price or official closing price as of the close of the customary trading session on the exchange where the security is principally traded.
Debt obligations (including convertible securities) and unlisted equities are fair valued using an evaluated quote provided by an independent pricing service. Evaluated quotes provided by the pricing service may be determined without exclusive reliance on quoted prices, and may reflect appropriate factors such as institution-size trading in similar groups of securities, developments related to specific securities, dividend rate (for unlisted equities), yield (for debt obligations), quality, type of issue, coupon rate (for debt obligations), maturity (for debt obligations), individual trading characteristics and other market data. Debt obligations are subject to interest rate and credit risks. In addition, all debt obligations involve some risk of default with respect to interest and/or principal payments.
Foreign securities’ (including foreign exchange contracts) prices are converted into U.S. dollar amounts using the applicable exchange rates as of the close of the NYSE. If market quotations are available and reliable for foreign exchange-traded equity securities, the securities will be valued at the market quotations. Because trading hours for certain foreign securities end before the close of the NYSE, closing market quotations may become unreliable. If between the time trading ends on a particular security and the close of the customary trading session on the NYSE, events occur that the Adviser determines are significant and make the closing price unreliable, the Fund may fair value the security. If the event is likely to have affected the closing price of the security, the security will be valued at fair value in good faith using procedures approved by the Board of Trustees. Adjustments to closing prices to reflect fair value may also be based on a screening process of an independent pricing service to indicate the degree of certainty, based on historical data, that the closing price in the principal market where a foreign security trades is not the current value as of the close of the NYSE. Foreign securities’ prices meeting the approved degree of certainty that the price is not reflective of current value will be priced at the indication of fair value from the independent pricing service. Multiple factors may be considered by the independent pricing service in determining adjustments to reflect fair value and may include information relating to sector indices, American Depositary Receipts and domestic and foreign index futures. Foreign securities may have additional risks including exchange rate changes, potential for sharply devalued currencies and high inflation, political and economic upheaval, the relative lack of issuer information, relatively low market liquidity and the potential lack of strict financial and accounting controls and standards.
Securities for which market prices are not provided by any of the above methods may be valued based upon quotes furnished by independent sources. The last bid price may be used to value equity securities. The mean between the last bid and ask prices is used to value debt obligations, including corporate loans.
Securities for which market quotations are not readily available or became unreliable are valued at fair value as determined in good faith by or under the supervision of the Trust’s officers following procedures approved by the Board of Trustees. Issuer specific events, market trends, bid/ask quotes of brokers and information providers and other market data may be reviewed in the course of making a good faith determination of a security’s fair value.
The Fund may invest in securities that are subject to interest rate risk, meaning the risk that the prices will generally fall as interest rates rise and, conversely, the prices will generally rise as interest rates fall. Specific securities differ in their sensitivity to changes in interest rates depending on their individual characteristics. Changes in interest rates may result in increased market volatility, which may affect the value and/or liquidity of certain of the Fund’s investments.
Valuations change in response to many factors including the historical and prospective earnings of the issuer, the value of the issuer’s assets, general economic conditions, interest rates, investor perceptions and market liquidity. Because of the inherent uncertainties of valuation, the values reflected in the financial statements may materially differ from the value received upon actual sale of those investments.
| B. | Securities Transactions and Investment Income — Securities transactions are accounted for on a trade date basis. Realized gains or losses on sales are computed on the basis of specific identification of the securities sold. Distributions from ordinary income from underlying funds, if any, are recorded as dividend income on ex-dividend date. Distributions from gains from underlying funds, if any, are recorded as realized gains on the ex-dividend date. The following policies are followed by the underlying funds: Interest income (net of withholding tax, if any) is recorded on the accrual basis from settlement date. Bond premiums and discounts are amortized and/or accreted for financial reporting purposes. Paydown gains and losses on mortgage and asset-backed securities are recorded as adjustments to interest income. |
The Fund may periodically participate in litigation related to Fund investments. As such, the Fund may receive proceeds from litigation settlements. Any proceeds received are included in the Statement of Operations as realized gain (loss) for investments no longer held and as unrealized gain (loss) for investments still held.
The Fund allocates income and realized and unrealized capital gains and losses to a class based on the relative net assets of each class.
16 Invesco Multi-Asset Inflation Fund
| C. | Distributions — Distributions from net investment income and net realized capital gain, if any, are generally declared and paid annually and recorded on the ex-dividend date. The Fund may elect to treat a portion of the proceeds from redemptions as distributions for federal income tax purposes. |
| D. | Federal Income Taxes — The Fund intends to comply with the requirements of Subchapter M of the Internal Revenue Code of 1986, as amended (the “Internal Revenue Code”), necessary to qualify as a regulated investment company and to distribute substantially all of the Fund’s taxable earnings to shareholders. As such, the Fund will not be subject to federal income taxes on otherwise taxable income (including net realized capital gain) that is distributed to shareholders. Therefore, no provision for federal income taxes is recorded in the financial statements. |
The Fund recognizes the tax benefits of uncertain tax positions only when the position is more likely than not to be sustained. Management has analyzed the Fund’s uncertain tax positions and concluded that no liability for unrecognized tax benefits should be recorded related to uncertain tax positions. Management is not aware of any tax positions for which it is reasonably possible that the total amounts of unrecognized tax benefits will change materially in the next 12 months.
The Fund files tax returns in the U.S. Federal jurisdiction and certain other jurisdictions. Generally, the Fund is subject to examinations by such taxing authorities for up to three years after the filing of the return for the tax period.
| E. | Expenses — Expenses included in the accompanying financial statements reflect the expenses of the Fund and do not include any expenses of the underlying funds. The effects of the underlying funds expenses are included in the realized and unrealized gain/loss on the investments in the underlying funds. |
Fees provided for under the Rule 12b-1 plan of a particular class of the Fund and which are directly attributable to that class are charged to the operations of such class. Transfer agency fees and expenses and other shareholder recordkeeping fees and expenses attributable to Class R5 and Class R6 are allocated to each share class based on relative net assets. Transfer agency fees and expenses and other shareholder recordkeeping fees and expenses relating to all other classes are allocated among those classes based on relative net assets. All other expenses are allocated among the classes based on relative net assets.
| F. | Accounting Estimates — The preparation of financial statements in conformity with accounting principles generally accepted in the United States of America (“GAAP”) requires management to make estimates and assumptions that affect the reported amounts of assets and liabilities at the date of the financial statements and the reported amounts of revenues and expenses during the reporting period including estimates and assumptions related to taxation. Actual results could differ from those estimates by a significant amount. In addition, the Fund monitors for material events or transactions that may occur or become known after the period-end date and before the date the financial statements are released to print. |
| G. | Indemnifications — Under the Trust’s organizational documents, each Trustee, officer, employee or other agent of the Trust is indemnified against certain liabilities that may arise out of the performance of their duties to the Fund. Additionally, in the normal course of business, the Fund enters into contracts, including the Fund’s servicing agreements, that contain a variety of indemnification clauses. The Fund’s maximum exposure under these arrangements is unknown as this would involve future claims that may be made against the Fund that have not yet occurred. The risk of material loss as a result of such indemnification claims is considered remote. |
NOTE 2—Advisory Fees and Other Fees Paid to Affiliates
The Trust has entered into a master investment advisory agreement with Invesco Advisers, Inc. (the “Adviser” or “Invesco”). Under the terms of the investment advisory agreement, the Fund pays an advisory fee to the Adviser based on the annual rate of 0.15% of the Fund’s average daily net assets.
Under the terms of a master sub-advisory agreement between the Adviser and each of Invesco Asset Management Deutschland GmbH, Invesco Asset Management Limited, Invesco Asset Management (Japan) Limited, Invesco Australia Limited, Invesco Hong Kong Limited, Invesco Senior Secured Management, Inc., Invesco Canada Ltd. and PowerShares Capital (collectively, the “Affiliated Sub-Advisers”) the Adviser, not the Fund, may pay 40% of the fees paid to the Adviser to any such Affiliated Sub-Adviser(s) that provide(s) discretionary investment management services to the Fund based on the percentage of assets allocated to such Sub-Adviser(s).
The Adviser has contractually agreed, through October 31, 2015, to waive advisory fees and/or reimburse expenses to the extent necessary to limit total annual fund operating expenses after fee waiver and/or expense reimbursement (excluding Acquired Fund Fees and Expenses and certain items discussed below) of Class A, Class C, Class R, Class Y, Class R5 and Class R6 shares to 0.73%, 1.48%, 0.98%, 0.48%, 0.48% and 0.48% of average daily net assets, respectively. In determining the Adviser’s obligation to waive advisory fees and/or reimburse expenses, the following expenses are not taken into account, and could cause the total annual fund operating expenses after fee waiver and/or expense reimbursement to exceed the numbers reflected above: (1) interest; (2) taxes; (3) dividend expense on short sales; (4) extraordinary or non-routine items, including litigation expenses; and (5) expenses that the Fund has incurred but did not actually pay because of an expense offset arrangement. Acquired Fund Fees and Expenses are not operating expenses of the Fund directly, but are fees and expenses, including management fees of the investment companies in which the Fund invests. As a result, the total annual fund operating expenses after fee waiver and/or expense reimbursement may exceed the expense limits above. Unless Invesco continues the fee waiver agreement, it will terminate on October 31, 2015. The fee waiver agreement cannot be terminated during its term.
For the period October 14, 2014 (commencement date) through December 31, 2014, the Adviser waived advisory fees and reimbursed fund level expenses of $74,021 and reimbursed class level expenses of $288, $27, $27, $368, $2 and $2 of Class A, Class C, Class R, Class Y, Class R5 and Class R6 shares, respectively.
The Trust has entered into a master administrative services agreement with Invesco pursuant to which the Fund has agreed to pay Invesco for certain administrative costs incurred in providing accounting services to the Fund. For the period October 14, 2014 (commencement date) through December 31, 2014, expenses incurred under the agreement are shown in the Statement of Operations as Administrative services fees.
The Trust has entered into a transfer agency and service agreement with Invesco Investment Services, Inc. (“IIS”) pursuant to which the Fund has agreed to pay IIS a fee for providing transfer agency and shareholder services to the Fund and reimburse IIS for certain expenses incurred by IIS in the course of providing such services. IIS may make payments to intermediaries that provide omnibus account services, sub-accounting services and/or networking services. All fees payable by IIS to intermediaries that provide omnibus account services or sub-accounting are charged back to the Fund,
17 Invesco Multi-Asset Inflation Fund
subject to certain limitations approved by the Trust’s Board of Trustees. For the period October 14, 2014 (commencement date) through December 31, 2014, expenses incurred under the agreement are shown in the Statement of Operations as Transfer agent fees.
The Trust has entered into master distribution agreements with Invesco Distributors, Inc. (“IDI”) to serve as the distributor for the Class A, Class C, Class R, Class Y, Class R5 and Class R6 shares of the Fund. The Trust has adopted plans pursuant to Rule 12b-1 under the 1940 Act with respect to the Fund’s Class A, Class C and Class R shares (collectively, the “Plans”). The Fund, pursuant to the Plans, pays IDI compensation at the annual rate of 0.25% of the Fund’s average daily net assets of Class A shares, 1.00% of the average daily net assets of Class C shares and 0.50% of the average daily net assets of Class R shares. Of the Plan payments, up to 0.25% of the average daily net assets of each class of shares may be paid to furnish continuing personal shareholder services to customers who purchase and own shares of such classes. Any amounts not paid as a service fee under the Plans would constitute an asset-based sales charge. Rules of the Financial Industry Regulatory Authority (“FINRA”) impose a cap on the total sales charges, including asset-based sales charges, that may be paid by any class of shares of the Fund. For the period October 14, 2014 (commencement date) through December 31, 2014, expenses incurred under the Plans are shown in the Statement of Operations as Distribution fees.
Front-end sales commissions and CDSC (collectively, the “sales charges”) are not recorded as expenses of the Fund. Front-end sales commissions are deducted from proceeds from the sales of Fund shares prior to investment in Class A shares of the Fund. CDSC are deducted from redemption proceeds prior to remittance to the shareholder. During the period October 14, 2014 (commencement date) through December 31, 2014, IDI advised the Fund that IDI retained $15 in front-end sales commissions from the sale of Class A shares.
The underlying Invesco funds pay no distribution fees for Class Y and Class R6, and the Fund pays no sales loads or other similar compensation to IDI for acquiring underlying fund shares.
Certain officers and trustees of the Trust are officers and directors of the Adviser, IIS and/or IDI.
NOTE 3—Additional Valuation Information
GAAP defines fair value as the price that would be received to sell an asset or paid to transfer a liability in an orderly transaction between market participants at the measurement date, under current market conditions. GAAP establishes a hierarchy that prioritizes the inputs to valuation methods, giving the highest priority to readily available unadjusted quoted prices in an active market for identical assets (Level 1) and the lowest priority to significant unobservable inputs (Level 3), generally when market prices are not readily available or are unreliable. Based on the valuation inputs, the securities or other investments are tiered into one of three levels. Changes in valuation methods may result in transfers in or out of an investment’s assigned level:
| Level 1 — | Prices are determined using quoted prices in an active market for identical assets. |
| Level 2 — | Prices are determined using other significant observable inputs. Observable inputs are inputs that other market participants may use in pricing a security. These may include quoted prices for similar securities, interest rates, prepayment speeds, credit risk, yield curves, loss severities, default rates, discount rates, volatilities and others. |
| Level 3 — | Prices are determined using significant unobservable inputs. In situations where quoted prices or observable inputs are unavailable (for example, when there is little or no market activity for an investment at the end of the period), unobservable inputs may be used. Unobservable inputs reflect the Fund’s own assumptions about the factors market participants would use in determining fair value of the securities or instruments and would be based on the best available information. |
As of December 31, 2014, all of the securities in this Fund were valued based on Level 1 inputs (see the Schedule of Investments for security categories). The level assigned to the securities valuations may not be an indication of the risk or liquidity associated with investing in those securities.
NOTE 4—Trustees’ and Officers’ Fees and Benefits
Trustees’ and Officers’ Fees and Benefits include amounts accrued by the Fund to pay remuneration to certain Trustees and Officers of the Fund. Trustees have the option to defer compensation payable by the Fund, and Trustees’ and Officers’ Fees and Benefits also include amounts accrued by the Fund to fund such deferred compensation amounts. Those Trustees who defer compensation have the option to select various Invesco Funds in which their deferral accounts shall be deemed to be invested. Obligations under the deferred compensation plan represents unsecured claims against the general assets of the Fund.
NOTE 5—Cash Balances
The Fund is permitted to temporarily carry a negative or overdrawn balance in its account with State Street Bank and Trust Company, the custodian bank. Such balances, if any at period end, are shown in the Statement of Assets and Liabilities under the payable caption Amount due custodian. To compensate the custodian bank for such overdrafts, the overdrawn Fund may either (1) leave funds as a compensating balance in the account so the custodian bank can be compensated by earning the additional interest; or (2) compensate by paying the custodian bank at a rate agreed upon by the custodian bank and Invesco, not to exceed the contractually agreed upon rate.
18 Invesco Multi-Asset Inflation Fund
NOTE 6—Distributions to Shareholders and Tax Components of Net Assets
Tax Character of Distributions to Shareholders Paid During the Period October 14, 2014 (commencement date) through December 31, 2014:
| 2014 | ||||
Ordinary income | $ | 2,166 | ||
Long-term capital gain | 981 | |||
Total distributions | $ | 3,147 | ||
Tax Components of Net Assets at Period-End:
| 2014 | ||||
Undistributed ordinary income | $ | 12 | ||
Undistributed long-term gain | 4,972 | |||
Net unrealized appreciation (depreciation) — investments | (17,882 | ) | ||
Temporary book/tax differences | (625 | ) | ||
Shares of beneficial interest | 299,205 | |||
Total net assets | $ | 285,682 | ||
The difference between book-basis and tax-basis unrealized appreciation (depreciation) is due to differences in the timing of recognition of gains and losses on investments for tax and book purposes. The Fund’s net unrealized appreciation (depreciation) difference is attributable primarily to wash sales.
The temporary book/tax differences are a result of timing differences between book and tax recognition of income and/or expenses. The Fund’s temporary book/tax differences are the result of the trustee deferral of compensation and retirement plan benefits.
Capital loss carryforward is calculated and reported as of a specific date. Results of transactions and other activity after that date may affect the amount of capital loss carryforward actually available for the Fund to utilize. The ability to utilize capital loss carryforward in the future may be limited under the Internal Revenue Code and related regulations based on the results of future transactions.
The Fund did not have a capital loss carryforward as of December 31, 2014.
NOTE 7—Investment Securities
The aggregate amount of investment securities (other than short-term securities, U.S. Treasury obligations and money market funds, if any) purchased and sold by the Fund during the period October 14, 2014 (commencement date) through December 31, 2014 was $303,120 and $7,102, respectively. Cost of investments on a tax basis includes the adjustments for financial reporting purposes as of the most recently completed federal income tax reporting period-end.
| Unrealized Appreciation (Depreciation) of Investment Securities on a Tax Basis | ||||
Aggregate unrealized appreciation of investment securities | $ | 2,861 | ||
Aggregate unrealized (depreciation) of investment securities | (20,743 | ) | ||
Net unrealized appreciation (depreciation) of investment securities | $ | (17,882 | ) | |
Cost of investments for tax purposes is $303,921.
NOTE 8—Reclassification of Permanent Differences
Primarily as a result of differing book/tax treatment of stock issuance costs and dividend reclassification, on December 31, 2014, undistributed net investment income was increased by $1,362, undistributed net realized gain was decreased by $981 and shares of beneficial interest was decreased by $381. This reclassification had no effect on the net assets of the Fund.
19 Invesco Multi-Asset Inflation Fund
NOTE 9—Share Information
| Summary of Share Activity | ||||||||
| October 14, 2014 (commencement date) through December 31, 2014(a) | ||||||||
| Shares | Amount | |||||||
Sold: | ||||||||
Class A | 11,229 | $ | 112,097 | |||||
Class C | 1,001 | 10,010 | ||||||
Class R | 1,001 | 10,010 | ||||||
Class Y | 14,646 | 146,963 | ||||||
Class R5 | 1,001 | 10,010 | ||||||
Class R6 | 1,001 | 10,010 | ||||||
Issued as reinvestment of dividends: | ||||||||
Class A | 3 | 30 | ||||||
Class Y | 48 | 456 | ||||||
Net increase in share activity | 29,930 | $ | 299,586 | |||||
| (a) | 98% of the outstanding shares of the Fund are owned by the Adviser or an affiliate of the Adviser. |
NOTE 10—Financial Highlights
The following schedule presents financial highlights for a share of the Fund outstanding throughout the periods indicated.
| Net asset value, beginning of period | Net investment income(a) | Net gains (losses) on securities (both realized and unrealized) | Total from investment operations | Dividends from net investment income | Net asset value, end of period | Total return(b) | Net assets, end of period (000’s omitted) | Ratio of expenses to average net assets with fee waivers and/or expenses absorbed(c) | Ratio of expenses to average net assets without fee waivers and/or expenses absorbed | Ratio of net investment income to average net assets | Portfolio turnover(d) | |||||||||||||||||||||||||||||||||||||
Class A |
| |||||||||||||||||||||||||||||||||||||||||||||||
Year ended 12/31/14(e) | $ | 10.00 | $ | 0.04 | $ | (0.40 | ) | $ | (0.36 | ) | $ | (0.10 | ) | $ | 9.54 | (3.55 | )% | $ | 107 | 0.73 | %(f) | 124.07 | %(f) | 1.81 | %(f) | 3 | % | |||||||||||||||||||||
Class C |
| |||||||||||||||||||||||||||||||||||||||||||||||
Year ended 12/31/14(e) | 10.00 | 0.02 | (0.38 | ) | (0.36 | ) | (0.09 | ) | 9.55 | (3.61 | ) | 10 | 1.48 | (f) | 124.82 | (f) | 1.06 | (f) | 3 | |||||||||||||||||||||||||||||
Class R |
| |||||||||||||||||||||||||||||||||||||||||||||||
Year ended 12/31/14(e) | 10.00 | 0.03 | (0.39 | ) | (0.36 | ) | (0.10 | ) | 9.54 | (3.60 | ) | 10 | 0.98 | (f) | 124.32 | (f) | 1.56 | (f) | 3 | |||||||||||||||||||||||||||||
Class Y |
| |||||||||||||||||||||||||||||||||||||||||||||||
Year ended 12/31/14(e) | 10.00 | 0.04 | (0.38 | ) | (0.34 | ) | (0.11 | ) | 9.55 | (3.39 | ) | 140 | 0.48 | (f) | 123.82 | (f) | 2.06 | (f) | 3 | |||||||||||||||||||||||||||||
Class R5 |
| |||||||||||||||||||||||||||||||||||||||||||||||
Year ended 12/31/14(e) | 10.00 | 0.04 | (0.39 | ) | (0.35 | ) | (0.11 | ) | 9.54 | (3.49 | ) | 10 | 0.48 | (f) | 122.66 | (f) | 2.06 | (f) | 3 | |||||||||||||||||||||||||||||
Class R6 |
| |||||||||||||||||||||||||||||||||||||||||||||||
Year ended 12/31/14(e) | 10.00 | 0.04 | (0.39 | ) | (0.35 | ) | (0.11 | ) | 9.54 | (3.49 | ) | 10 | 0.48 | (f) | 122.66 | (f) | 2.06 | (f) | 3 | |||||||||||||||||||||||||||||
| (a) | Calculated using average shares outstanding. |
| (b) | Includes adjustments in accordance with accounting principles generally accepted in the United States of America and as such, the net asset value for financial reporting purposes and the returns based upon those net asset values may differ from the net asset value and returns for shareholder transactions. Does not include sales charges and is not annualized for periods less than one year, if applicable. |
| (c) | In addition to the fees and expenses which the Fund bears directly; the Fund indirectly bears a pro rata share of the fees and expenses of the underlying funds in which the Fund invests. Because the underlying funds have varied expenses and fee levels and the Fund may own different proportions at different times, the amount of fees and expenses incurred indirectly by the Fund will vary. Estimated underlying fund expenses are not expenses that are incurred directly by your Fund. They are expenses that are incurred directly by the underlying funds and are deducted from the value of the funds your Fund invests in. The effect of the estimated underlying fund expenses that you bear indirectly is included in your Fund’s total return. Estimated acquired fund fees from underlying funds were 0.62% for the period ended December 31, 2014. |
| (d) | Portfolio turnover is calculated at the fund level and is not annualized for periods less than one year, if applicable. |
| (e) | Commencement date of October 14, 2014. |
| (f) | Ratios are annualized and based on average daily net assets (000’s omitted) of $106, $10, $10, $135, $10 and $10 for Class A, Class C, Class R, Class Y, Class R5 and Class R6 shares, respectively. |
20 Invesco Multi-Asset Inflation Fund
Report of Independent Registered Public Accounting Firm
To the Board of Trustees of AIM Growth Series (Invesco Growth Series) and Shareholders of Invesco Multi-Asset Inflation Fund:
In our opinion, the accompanying statement of assets and liabilities, including the schedule of investments, and the related statements of operations and of changes in net assets and the financial highlights present fairly, in all material respects, the financial position of Invesco Multi-Asset Inflation Fund (one of the funds constituting AIM Growth Series (Invesco Growth Series), hereafter referred to as the “Fund”) at December 31, 2014, and the results of its operations, the changes in its net assets and the financial highlights for the period October 14, 2014 (commencement of operations) through December 31, 2014, in conformity with accounting principles generally accepted in the United States of America. These financial statements and financial highlights (hereafter referred to as “financial statements”) are the responsibility of the Fund’s management. Our responsibility is to express an opinion on these financial statements based on our audit. We conducted our audit of these financial statements in accordance with the standards of the Public Company Accounting Oversight Board (United States). Those standards require that we plan and perform the audit to obtain reasonable assurance about whether the financial statements are free of material misstatement. An audit includes examining, on a test basis, evidence supporting the amounts and disclosures in the financial statements, assessing the accounting principles used and significant estimates made by management, and evaluating the overall financial statement presentation. We believe that our audit, which included confirmation of securities at December 31, 2014 by correspondence with the custodian and transfer agent, provides a reasonable basis for our opinion.
PRICEWATERHOUSECOOPERS LLP
Houston, Texas
February 25, 2015
21 Invesco Multi-Asset Inflation Fund
Calculating your ongoing Fund expenses
Example
As a shareholder of the Fund, you incur two types of costs: (1) transaction costs, which may include sales charges (loads) on purchase payments or contingent deferred sales charges on redemptions, if any; and (2) ongoing costs, including distribution and/or service (12b-1) fees, and other Fund expenses. This example is intended to help you understand your ongoing costs (in dollars) of investing in the Fund and to compare these costs with ongoing costs of investing in other mutual funds. The example is based on an investment of $1,000 invested at the beginning of the period and held for the entire period October 14, 2014 (commencement date) through December 31, 2014.
In addition to the fees and expenses which the Fund bears directly, the Fund indirectly bears a pro rata share of the fees and expenses of the underlying funds in which your Fund invests. The amount of fees and expenses incurred indirectly by your Fund will vary because the underlying funds have varied expenses and fee levels and the Fund may own different proportions of the underlying funds at different times. Estimated underlying fund expenses are not expenses that are incurred directly by your Fund. They are expenses that are incurred directly by the underlying funds and are deducted from the value of the underlying funds your Fund invests in. The effect of the estimated underlying fund expenses that you bear indirectly are included in your Fund’s total return.
Actual expenses
The table below provides information about actual account values and actual expenses. You may use the information in this table, together with the amount you invested, to estimate the expenses that you paid over the period. Simply divide your account value by $1,000 (for example, an $8,600 account value divided by $1,000 = 8.6), then multiply the result by the number in the table under the heading entitled “Actual Expenses Paid During Period” to estimate the expenses you paid on your account during this period (as of the close of business October 14, 2014 (commencement date) through December 31, 2014).
Hypothetical example for comparison purposes
The table below also provides information about hypothetical account values and hypothetical expenses based on the Fund’s actual expense ratio and an assumed rate of return of 5% per year before expenses, which is not the Fund’s actual return.
The hypothetical account values and expenses may not be used to estimate the actual ending account balance or expenses you paid for the period. You may use this information to compare the ongoing costs of investing in the Fund and other funds. To do so, compare this 5% hypothetical example with the 5% hypothetical examples that appear in the shareholder reports of the other funds.
Please note that the expenses shown in the table are meant to highlight your ongoing costs only and do not reflect any transaction costs, such as sales charges (loads) on purchase payments or contingent deferred sales charges on redemptions, if any. Therefore, the hypothetical information is useful in comparing ongoing costs only, and will not help you determine the relative total costs of owning different funds. In addition, expenses shown in the table do not include the expenses of the underlying funds, which are borne indirectly by the Fund. If transaction costs and indirect expenses were included, your costs would have been higher.
| Class | Beginning Account Value (10/14/14) | ACTUAL | HYPOTHETICAL (5% annual return before expenses) | Annualized Expense Ratio | ||||||||||||||||||||
| Ending Account Value (12/31/14)1 | Expenses Period2 | Ending Account Value (12/31/14) | Expenses Paid During | |||||||||||||||||||||
| A | $ | 1,000.00 | $ | 964.50 | $ | 1.55 | $ | 1,021.53 | $ | 3.72 | 0.73 | % | ||||||||||||
| C | 1,000.00 | 963.90 | 3.15 | 1,017.74 | 7.53 | 1.48 | ||||||||||||||||||
| R | 1,000.00 | 964.00 | 2.08 | 1,020.27 | 4.99 | 0.98 | ||||||||||||||||||
| Y | 1,000.00 | 965.10 | 1.02 | 1,022.79 | 2.45 | 0.48 | ||||||||||||||||||
| R5 | 1,000.00 | 965.10 | 1.02 | 1,022.79 | 2.45 | 0.48 | ||||||||||||||||||
| R6 | 1,000.00 | 965.10 | 1.02 | 1,022.79 | 2.45 | 0.48 | ||||||||||||||||||
| 1 | The actual ending account value is based on the actual total return of the Fund for the period October 14, 2014 (commencement date) through December 31, 2014, after actual expenses and will differ from the hypothetical ending account value which is based on the Fund’s expense ratio and a hypothetical annual return of 5% before expenses. |
| 2 | Actual expenses are equal to the Fund’s annualized expense ratio as indicated above multiplied by the average account value over the period, multiplied by 79 (as of close of business October 14, 2014 (commencement date) through December 31, 2014)/365. Because the Fund has not been in existence for a full six-month period, the actual ending account value and expense information shown may not provide a meaningful comparison to fund expense information of classes that show such data for a full six-month period and, because the actual ending account value and expense information in the expense example covers a short time period, return and expense data may not be indicative of return and expense data for longer time periods. |
| 3 | Hypothetical expenses are equal to the annualized expense ratio indicated above multiplied by the average account value over the period, multiplied by 184/365 to reflect a one-half year period. The hypothetical ending account value and expenses may be used to compare ongoing costs of investing in the Fund and other funds because such data is based on a full six-month period. |
22 Invesco Multi-Asset Inflation Fund
Initial Approval of Investment Advisory and Sub-Advisory Agreements
The Board of Trustees (the Board) of AIM Growth Series (Invesco Growth Series) (the Company) is required under the Investment Company Act of 1940, as amended, to approve the Invesco Multi-Asset Inflation Fund (the Fund) investment advisory agreements before the Fund can commence operations. During meetings held on March 25-26, 2014, the Board as a whole and the disinterested or “independent” Trustees voting separately approved (i) an amendment to the Company’s Master Investment Advisory Agreement with Invesco Advisers, Inc. (Invesco Advisers and the investment advisory agreement) to add the Fund, and (ii) (a) an amendment to the Master Intergroup Sub-Advisory Contract for Mutual Funds with Invesco Asset Management Deutschland GmbH, Invesco Asset Management Limited, Invesco Asset Management (Japan) Limited, Invesco Australia Limited, Invesco Hong Kong Limited, Invesco Senior Secured Management, Inc. and Invesco Canada Ltd. to add the Fund, and (b) an amendment to the Sub-Advisory Contract with Invesco PowerShares Capital Management LLC to add the Fund (the sub-advisers, the Affiliated Sub-Advisers; and the contracts, the sub-advisory contracts). In doing so, the Board followed a process similar to the process that it follows in annually reviewing and approving investment advisory agreements and sub-advisory contracts for the series portfolios of funds advised by Invesco Advisers (the Invesco Funds) and considered the information provided in the most recent annual review process as well as the information provided with respect to the Fund. The Board (i) determined that the investment advisory agreement and sub-advisory contracts are in the best interests of the Fund and its shareholders and that the compensation payable to Invesco Advisers and the Affiliated Sub-Advisers under the Fund’s agreements is fair and reasonable and (ii) approved submission of the agreements to the initial shareholder of the Fund.
The Board’s Fund Evaluation Process
The Board’s Investments Committee has established three Sub-Committees that are responsible for overseeing the management of a number of the funds advised by Invesco Advisers (the Invesco Funds). The Fund will be assigned to one of the Sub-Committees. This Sub-Committee structure permits the Trustees to focus on the performance of the Invesco Funds that have been assigned to them. The Sub-Committees meet throughout the year to review the performance, fees, expenses and other matters related to their assigned Invesco Funds. Over the course of each year, the Sub-Committees meet with portfolio managers for their assigned Invesco Funds and other members of management and review with these individuals the performance, investment objective(s), policies, strategies, limitations and investment risks of these funds.
In evaluating the fairness and reasonableness of compensation under the Fund’s investment advisory agreement and sub-advisory contracts, the Board considered, among other things, the factors discussed below. The Board was assisted in its review
by the Senior Officer, an independent officer of the Funds, and by independent legal counsel. The discussion below serves as a summary of the material factors and related conclusions that formed the basis for the Board’s approval of the Fund’s investment advisory agreement and sub-advisory contracts. The Trustees’ review and conclusions are based on the comprehensive consideration of all information presented to them and are not the result of any single determinative factor. Moreover, one Trustee may have weighed a particular piece of information or factor differently than another Trustee.
Factors and Conclusions and Summary of Evaluation of Investment Advisory and Sub-Advisory Agreements
| A. | Nature, Extent and Quality of Services Provided by Invesco Advisers and the Affiliated Sub-Advisers |
The Board reviewed the advisory services to be provided to the Fund by Invesco Advisers under the Fund’s investment advisory agreement and the credentials and experience of the officers and employees of Invesco Advisers who will provide these services. The Board noted that the Fund is a fund of funds investing principally in affiliated funds and exchange trade funds, although the Fund may also invest directly in individual securities and derivatives. The Board’s review of the qualifications of Invesco Advisers to provide these services included the Board’s consideration of Invesco Advisers’ investment process oversight, independent credit analysis and investment risk management. The Board also considered non-advisory services that Invesco Advisers and its affiliates provide to the Invesco Funds and will provide to the Fund, such as various back office support functions, equity and fixed income trading operations, internal audit, distribution and legal and compliance. In determining whether to approve the Fund’s investment advisory agreement, the Board considered the existing relationship between Invesco Advisers and the Invesco Funds, as well as the Board’s knowledge of Invesco Advisers’ operations. The Board concluded that the nature, extent and quality of the advisory services to be provided to the Fund by Invesco Advisers are appropriate.
The Board reviewed the services that may be provided by the Affiliated Sub-Advisers under the sub-advisory contracts and the credentials and experience of the officers and employees of the Affiliated Sub-Advisers who may provide these services. The Board noted that the Affiliated Sub-Advisers have offices and personnel that are located in financial centers around the world. As a result, the Affiliated Sub-Advisers can provide research and investment analysis on the markets and economies of various countries in which the Fund may invest, make recommendations regarding securities and assist with security trades. The Board concluded that the sub-advisory contracts will benefit the Fund and its shareholders by permitting Invesco Advisers to use the resources and talents of the Affiliated Sub-Advisers in managing the Fund. The Board concluded
that the nature, extent and quality of the services that may be provided by the Affiliated Sub-Advisers are appropriate.
| B. | Fund Performance |
The Board did not consider the performance of the Fund because the Fund is new and has no performance history. The Board did review performance expectations for the Fund in different market environments.
| C. | Advisory and Sub-Advisory Fees and Fee Waivers |
The Board considered the contractual management fee rate of the Fund and the proposed fee waivers and expense limitations that will be in place for the Fund through April 30, 2015. The Board also considered the services to be provided by the Affiliated Sub-Advisers pursuant to the sub-advisory contracts and the services to be provided by Invesco Advisers pursuant to the Fund’s investment advisory agreement, as well as the allocation of fees between Invesco Advisers and the Affiliated Sub-Advisers pursuant to the sub-advisory contracts. The Board noted that the sub-advisory fees will have no direct effect on the Fund or its shareholders, as they are paid by Invesco Advisers to the Affiliated Sub-Advisers.
The Board also considered comparative advisory fee data provided by Invesco Advisers for comparable registered funds managed by third-party advisers. The Board noted that although Invesco Advisers manages other fund of funds, it does not manage other funds or client accounts with investment strategies comparable to those of the Fund. The Board noted that the advisory fee is below the Lipper Flexible Portfolio Fund of Funds classification median fee and that the advisory fee is below the fees of three key fund of fund competitors identified by Invesco Advisers at all breakpoints.
Based upon the information provided and considerations described above, the Board concluded that the compensation payable to Invesco Advisers and the Affiliated Sub-Advisers is fair and reasonable.
| D. | Economies of Scale and Breakpoints |
The Board considered the extent to which there may be economies of scale in the provision of advisory services to the Fund. The Board also considered whether the Fund would benefit from such economies of scale through contractual breakpoints in the Fund’s advisory fee schedule and through expense waivers. The Board also noted that the Fund will share directly in economies of scale through lower fees charged by third party service providers based on the combined size of all of the Invesco Funds and other clients advised by Invesco Advisers.
| E. | Profitability and Financial Resources |
The Board considered information from Invesco Advisers concerning the costs of the advisory and other services that Invesco Advisers and its affiliates provide to the Invesco Funds and the profitability of Invesco Advisers and its affiliates in providing these services. The Board received information from Invesco Advisers demonstrating that Invesco Advisers and each Affiliated Sub-Adviser are financially sound and have the resources necessary
23 Invesco Multi-Asset Inflation Fund
to perform their obligations under the Fund’s investment advisory agreement and sub-advisory contracts.
| F. | Collateral Benefits to Invesco Advisers and its Affiliates |
The Board considered various other benefits to be received by Invesco Advisers and its affiliates resulting from Invesco Advisers’ relationship with the Fund, including the fees to be received by Invesco Advisers and its affiliates for their provision of transfer agency and distribution services to the Fund. The Board considered the performance of Invesco Advisers and its affiliates in providing these services to other Invesco Funds and the organizational structure employed by Invesco Advisers and its affiliates to provide these services. The Board also
considered that these services will be provided to the Fund pursuant to written contracts that are reviewed and approved on an annual basis by the Board; that the services are required for the operation of the Fund; that Invesco Advisers and its affiliates can provide services, the nature and quality of which are at least equal to those provided by others offering the same or similar services; and that the fees for such services are fair and reasonable in light of the usual and customary charges by others for services of the same nature and quality.
The Board considered the fact that the Fund’s uninvested cash and cash collateral from any securities lending arrangements may be invested in money market funds advised by Invesco Advisers pursuant to procedures approved by the Board. The
Board noted that Invesco Advisers will receive advisory fees from these affiliated money market funds attributable to such investments, although Invesco Advisers has contractually agreed to waive through at least June 30, 2014, the advisory fees payable by the Fund with respect to such investments. This waiver is in an amount equal to 100% of the net advisory fee Invesco Advisers or its affiliates receive from the affiliated money market funds with respect to the Fund’s investment in the affiliated money market funds of uninvested cash, but not cash collateral from securities lending arrangements. The Board concluded that the Fund’s investment of uninvested cash and cash collateral from any securities lending arrangements in the affiliated money market funds is fair and reasonable.
24 Invesco Multi-Asset Inflation Fund
Tax Information
Form 1099-DIV, Form 1042-S and other year–end tax information provide shareholders with actual calendar year amounts that should be included in their tax returns. Shareholders should consult their tax advisors.
The following distribution information is being provided as required by the Internal Revenue Code or to meet a specific state’s requirement.
The Fund designates the following amounts or, if subsequently determined to be different, the maximum amount allowable for its fiscal year ended December 31, 2014:
Federal and State Income Tax | ||||
Long-Term Capital Gain Distributions | $ | 981 | ||
Qualified Dividend Income* | 100 | % | ||
Corporate Dividends Received Deduction* | 100 | % | ||
U.S. Treasury Obligations* | 0.24 | % | ||
| * | The above percentages are based on ordinary income dividends paid to shareholders during the period October 14, 2014 (commencement date) through December 31, 2014. |
25 Invesco Multi-Asset Inflation Fund
Trustees and Officers
The address of each trustee and officer is AIM Growth Series (Invesco Growth Series) (the “Trust”), 11 Greenway Plaza, Suite 1000, Houston, Texas 77046-1173. The trustees serve for the life of the Trust, subject to their earlier death, incapacitation, resignation, retirement or removal as more specifically provided in the Trust’s organizational documents. Each officer serves for a one year term or until their successors are elected and qualified. Column two below includes length of time served with predecessor entities, if any.
Name, Year of Birth and Position(s) Held with the Trust | Trustee and/ or Officer Since | Principal Occupation(s) During Past 5 Years | Number of Funds in Fund Complex Overseen by Trustee | Other Directorship(s) Held by Trustee During | ||||
| Interested Persons | ||||||||
| Martin L. Flanagan1 — 1960 Trustee | 2007 | Executive Director, Chief Executive Officer and President, Invesco Ltd. (ultimate parent of Invesco and a global investment management firm); Advisor to the Board, Invesco Advisers, Inc. (formerly known as Invesco Institutional (N.A.), Inc.); Trustee, The Invesco Funds; Vice Chair, Investment Company Institute; and Member of Executive Board, SMU Cox School of Business
Formerly: Chairman and Chief Executive Officer, Invesco Advisers, Inc. (registered investment adviser); Director, Chairman, Chief Executive Officer and President, IVZ Inc. (holding company), INVESCO Group Services, Inc. (service provider) and Invesco North American Holdings, Inc. (holding company); Director, Chief Executive Officer and President, Invesco Holding Company Limited (parent of Invesco and a global investment management firm); Director, Invesco Ltd.; Chairman, Investment Company Institute and President, Co-Chief Executive Officer, Co-President, Chief Operating Officer and Chief Financial Officer, Franklin Resources, Inc. (global investment management organization). | 144 | None | ||||
Philip A. Taylor2 — 1954 Trustee, President and Principal Executive Officer | 2006 | Head of North American Retail and Senior Managing Director, Invesco Ltd.; Director, Co-Chairman, Co-President and Co-Chief Executive Officer, Invesco Advisers, Inc. (formerly known as Invesco Institutional (N.A.), Inc.) (registered investment adviser); Director, Chairman, Chief Executive Officer and President, Invesco Management Group, Inc. (formerly known as Invesco Aim Management Group, Inc.) (financial services holding company); Director and President, INVESCO Funds Group, Inc. (registered investment adviser and registered transfer agent); Director and Chairman, Invesco Investment Services, Inc. (formerly known as Invesco Aim Investment Services, Inc.) (registered transfer agent) and IVZ Distributors, Inc. (formerly known as INVESCO Distributors, Inc.) (registered broker dealer); Director, President and Chairman, Invesco Inc. (holding company) and Invesco Canada Holdings Inc. (holding company); Chief Executive Officer, Invesco Corporate Class Inc. (corporate mutual fund company) and Invesco Canada Fund Inc. (corporate mutual fund company); Director, Chairman and Chief Executive Officer, Invesco Canada Ltd. (formerly known as Invesco Trimark Ltd./Invesco Trimark Ltèe) (registered investment adviser and registered transfer agent); Trustee, President and Principal Executive Officer, The Invesco Funds (other than AIM Treasurer’s Series Trust (Invesco Treasurer’s Series Trust) and Short-Term Investments Trust); Trustee and Executive Vice President, The Invesco Funds (AIM Treasurer’s Series Trust (Invesco Treasurer’s Series Trust) and Short-Term Investments Trust only); Director, Invesco Investment Advisers LLC (formerly known as Van Kampen Asset Management); Director, Chief Executive Officer and President, Van Kampen Exchange Corp.
Formerly: Director and Chairman, Van Kampen Investor Services Inc.; Director, Chief Executive Officer and President, 1371 Preferred Inc. (holding company) and Van Kampen Investments Inc.; Director and President, AIM GP Canada Inc. (general partner for limited partnerships) and Van Kampen Advisors, Inc.; Director and Chief Executive Officer, Invesco Trimark Dealer Inc. (registered broker dealer); Director, Invesco Distributors, Inc. (formerly known as Invesco Aim Distributors, Inc.) (registered broker dealer); Manager, Invesco PowerShares Capital Management LLC; Director, Chief Executive Officer and President, Invesco Advisers, Inc.; Director, Chairman, Chief Executive Officer and President, Invesco Aim Capital Management, Inc.; President, Invesco Trimark Dealer Inc. and Invesco Trimark Ltd./Invesco Trimark Ltèe; Director and President, AIM Trimark Corporate Class Inc. and AIM Trimark Canada Fund Inc.; Senior Managing Director, Invesco Holding Company Limited; Director and Chairman, Fund Management Company (former registered broker dealer); President and Principal Executive Officer, The Invesco Funds (AIM Treasurer’s Series Trust (Invesco Treasurer’s Series Trust), and Short-Term Investments Trust only); President, AIM Trimark Global Fund Inc. and AIM Trimark Canada Fund Inc. | 144 | None | ||||
| Independent Trustees | ||||||||
Bruce L. Crockett — 1944 Trustee and Chair | 2001 | Chairman, Crockett Technologies Associates (technology consulting company)
Formerly: Director, Captaris (unified messaging provider); Director, President and Chief Executive Officer, COMSAT Corporation; Chairman, Board of Governors of INTELSAT (international communications company); ACE Limited (insurance company); and Investment Company Institute | 144 | ALPS (Attorneys Liability Protection Society) (insurance company) |
| 1 | Mr. Flanagan is considered an interested person (within the meaning of Section 2(a)(19) of the 1940 Act) of the Trust because he is an officer of the Adviser to the Trust, and an officer and a director of Invesco Ltd., ultimate parent of the Adviser. |
| 2 | Mr. Taylor is considered an interested person (within the meaning of Section 2(a)(19) of the 1940 Act) of the Trust because he is an officer and a director of the Adviser. |
T-1 Invesco Multi-Asset Inflation Fund
Trustees and Officers—(continued)
Name, Year of Birth and Position(s) Held with the Trust | Trustee and/ or Officer Since | Principal Occupation(s) During Past 5 Years | Number of Funds in Fund Complex Overseen by Trustee | Other Directorship(s) Held by Trustee During | ||||
| Independent Trustees—(continued) | ||||||||
David C. Arch — 1945 Trustee | 2010 | Chairman of Blistex Inc., a consumer health care products manufacturer | 144 | Board member of the Illinois Manufacturers’ Association; Member of the Board of Visitors, Institute for the Humanities, University of Michigan; Member of the Audit Committee of the Edward-Elmhurst Hospital | ||||
James T. Bunch — 1942 Trustee | 2003 | Managing Member, Grumman Hill Group LLC (family office private equity investments)
Formerly: Founder, Green Manning & Bunch Ltd. (investment banking firm) (1988-2010); Executive Committee, United States Golf Association; and Director, Policy Studies, Inc. and Van Gilder Insurance Corporation | 144 | Chairman, Board of Governors, Western Golf Association; Chairman, Evans Scholars Foundation; and Director, Denver Film Society | ||||
Rodney F. Dammeyer — 1940 Trustee | 2010 | Chairman of CAC, LLC, (private company offering capital investment and management advisory services)
Formerly: Prior to 2001, Managing Partner at Equity Group Corporate Investments; Prior to 1995, Chief Executive Officer of Itel Corporation (formerly Anixter International); Prior to 1985, experience includes Senior Vice President and Chief Financial Officer of Household International, Inc., Executive Vice President and Chief Financial Officer of Northwest Industries, Inc. and Partner of Arthur Andersen & Co.; From 1987 to 2010, Director/Trustee of investment companies in the Van Kampen Funds complex | 144 | Director of Quidel Corporation and Stericycle, Inc. | ||||
Albert R. Dowden — 1941 Trustee | 2001 | Director of a number of public and private business corporations, including the Boss Group, Ltd. (private investment and management); Nature’s Sunshine Products, Inc. and Reich & Tang Funds (5 portfolios) (registered investment company)
Formerly: Director, Homeowners of America Holding Corporation/Homeowners of America Insurance Company (property casualty company); Director, Continental Energy Services, LLC (oil and gas pipeline service); Director, CompuDyne Corporation (provider of product and services to the public security market) and Director, Annuity and Life Re (Holdings), Ltd. (reinsurance company); Director, President and Chief Executive Officer, Volvo Group North America, Inc.; Senior Vice President, AB Volvo; Director of various public and private corporations; Chairman, DHJ Media, Inc.; Director, Magellan Insurance Company; and Director, The Hertz Corporation, Genmar Corporation (boat manufacturer), National Media Corporation; Advisory Board of Rotary Power International (designer, manufacturer, and seller of rotary power engines); and Chairman, Cortland Trust, Inc. (registered investment company) | 144 | Director of: Nature’s Sunshine Products, Inc., Reich & Tang Funds, Homeowners of America Holding Corporation/ Homeowners of America Insurance Company, the Boss Group | ||||
Jack M. Fields — 1952 Trustee | 2001 | Chief Executive Officer, Twenty First Century Group, Inc. (government affairs company); Owner and Chief Executive Officer, Dos Angeles Ranch, L.P. (cattle, hunting, corporate entertainment); and Discovery Global Education Fund (non-profit)
Formerly: Chief Executive Officer, Texana Timber LP (sustainable forestry company); Director of Cross Timbers Quail Research Ranch (non-profit); and member of the U.S. House of Representatives | 144 | Insperity, Inc. (formerly known as Administaff) | ||||
Prema Mathai-Davis — 1950 Trustee | 2001 | Retired. Formerly: Chief Executive Officer, YWCA of the U.S.A. | 144 | None | ||||
Larry Soll — 1942 Trustee | 2003 | Retired. Formerly: Chairman, Chief Executive Officer and President, Synergen Corp. (a biotechnology company) | 144 | None | ||||
Hugo F. Sonnenschein — 1940 Trustee | 2010 | President Emeritus and Honorary Trustee of the University of Chicago and the Adam Smith Distinguished Service Professor in the Department of Economics at the University of Chicago. Prior to 2000, President of the University of Chicago | 144 | Trustee of the University of Rochester and a member of its investment committee; Member of the National Academy of Sciences and the American Philosophical Society; Fellow of the American Academy of Arts and Sciences | ||||
Raymond Stickel, Jr. — 1944 Trustee | 2005 | Retired. Formerly: Director, Mainstay VP Series Funds, Inc. (25 portfolios) and Partner, Deloitte & Touche | 144 | None | ||||
T-2 Invesco Multi-Asset Inflation Fund
Trustees and Officers—(continued)
Name, Year of Birth and Position(s) Held with the Trust | Trustee and/ or Officer Since | Principal Occupation(s) During Past 5 Years | Number of Funds in Fund Complex Overseen by Trustee | Other Directorship(s) Held by Trustee During | ||||
| Independent Trustees—(continued) | ||||||||
Suzanne H. Woolsey — 1941 Trustee | 2014 | Chief Executive Officer of Woolsey Partners LLC | 144 | Emeritus Chair of the Board of Trustees of the Institute for Defense Analyses; Trustee of Colorado College; Trustee of California Institute of Technology; Prior to 2014, Director of Fluor Corp.; Prior to 2010, Trustee of the German Marshall Fund of the United States; Prior to 2010 Trustee of the Rocky Mountain Institute | ||||
| Other Officers | ||||||||
Russell C. Burk — 1958 Senior Vice President and Senior Officer | 2005 | Senior Vice President and Senior Officer, The Invesco Funds | N/A | N/A | ||||
John M. Zerr — 1962 Senior Vice President, Chief Legal Officer and Secretary | 2006 | Director, Senior Vice President, Secretary and General Counsel, Invesco Management Group, Inc. (formerly known as Invesco Aim Management Group, Inc.) and Van Kampen Exchange Corp.; Senior Vice President, Invesco Advisers, Inc. (formerly known as Invesco Institutional (N.A.), Inc.) (registered investment adviser); Senior Vice President and Secretary, Invesco Distributors, Inc. (formerly known as Invesco Aim Distributors, Inc.); Director, Vice President and Secretary, Invesco Investment Services, Inc. (formerly known as Invesco Aim Investment Services, Inc.) and IVZ Distributors, Inc. (formerly known as INVESCO Distributors, Inc.); Director and Vice President, INVESCO Funds Group, Inc.; Senior Vice President, Chief Legal Officer and Secretary, The Invesco Funds; Manager, Invesco PowerShares Capital Management LLC; Director, Secretary and General Counsel, Invesco Investment Advisers LLC (formerly known as Van Kampen Asset Management); Secretary and General Counsel, Invesco Capital Markets, Inc. (formerly known as Van Kampen Funds Inc.) and Chief Legal Officer, PowerShares Exchange-Traded Fund Trust, PowerShares Exchange-Traded Fund Trust II, PowerShares India Exchange-Traded Fund Trust , PowerShares Actively Managed Exchange-Traded Fund Trust; and PowerShares Actively Managed Exchange-Traded Commodity Fund Trust
Formerly: Director and Vice President, Van Kampen Advisors Inc.; Director, Vice President, Secretary and General Counsel, Van Kampen Investor Services Inc.; Director, Invesco Distributors, Inc. (formerly known as Invesco Aim Distributors, Inc.); Director, Senior Vice President, General Counsel and Secretary, Invesco Aim Advisers, Inc. and Van Kampen Investments Inc.; Director, Vice President and Secretary, Fund Management Company; Director, Senior Vice President, Secretary, General Counsel and Vice President, Invesco Aim Capital Management, Inc.; Chief Operating Officer and General Counsel, Liberty Ridge Capital, Inc. (an investment adviser); Vice President and Secretary, PBHG Funds (an investment company) and PBHG Insurance Series Fund (an investment company); Chief Operating Officer, General Counsel and Secretary, Old Mutual Investment Partners (a broker-dealer); General Counsel and Secretary, Old Mutual Fund Services (an administrator) and Old Mutual Shareholder Services (a shareholder servicing center); Executive Vice President, General Counsel and Secretary, Old Mutual Capital, Inc. (an investment adviser); and Vice President and Secretary, Old Mutual Advisors Funds (an investment company) | N/A | N/A | ||||
Sheri Morris — 1964 Vice President, Treasurer and Principal Financial Officer | 1999 | Vice President, Treasurer and Principal Financial Officer, The Invesco Funds; Vice President, Invesco Advisers, Inc. (formerly known as Invesco Institutional (N.A.), Inc.) (registered investment adviser); and Vice President, PowerShares Exchange-Traded Fund Trust, PowerShares Exchange-Traded Fund Trust II, PowerShares India Exchange-Traded Fund Trust, PowerShares Actively Managed Exchange-Traded Fund Trust, and PowerShares Actively Managed Exchange-Traded Commodity Fund Trust
Formerly: Vice President, Invesco Aim Advisers, Inc., Invesco Aim Capital Management, Inc. and Invesco Aim Private Asset Management, Inc.; Assistant Vice President and Assistant Treasurer, The Invesco Funds and Assistant Vice President, Invesco Advisers, Inc., Invesco Aim Capital Management, Inc. and Invesco Aim Private Asset Management, Inc.; and Treasurer, PowerShares Exchange-Traded Fund Trust, PowerShares Exchange-Traded Fund Trust II, PowerShares India Exchange-Traded Fund Trust and PowerShares Actively Managed Exchange-Traded Fund Trust | N/A | N/A | ||||
T-3 Invesco Multi-Asset Inflation Fund
Trustees and Officers—(continued)
Name, Year of Birth and Position(s) Held with the Trust | Trustee and/ or Officer Since | Principal Occupation(s) During Past 5 Years | Number of Funds in Fund Complex Overseen by Trustee | Other Directorship(s) Held by Trustee During | ||||
| Other Officers—(continued) | ||||||||
Karen Dunn Kelley — 1960 Vice President | 2004 | Senior Managing Director, Investments; Director, Co-President, Co-Chief Executive Officer, and Co-Chairman, Invesco Advisers, Inc. (formerly known as Invesco Institutional (N.A.), Inc.) (registered investment adviser); Chairman, Invesco Senior Secured Management, Inc.; Senior Vice President, Invesco Management Group, Inc. (formerly known as Invesco Aim Management Group, Inc.); Executive Vice President, Invesco Distributors, Inc. (formerly known as Invesco Aim Distributors, Inc.); Director, Invesco Mortgage Capital Inc. and Invesco Management Company Limited; Director and President, INVESCO Asset Management (Bermuda) Ltd., Vice President, The Invesco Funds (other than AIM Treasurer’s Series Trust (Invesco Treasurer’s Series Trust) and Short-Term Investments Trust); and President and Principal Executive Officer, The Invesco Funds (AIM Treasurer’s Series Trust (Invesco Treasurer’s Series Trust) and Short-Term Investments Trust only)
Formerly: Director, INVESCO Global Asset Management Limited and INVESCO Management S.A.; Senior Vice President, Van Kampen Investments Inc. and Invesco Advisers, Inc. (formerly known as Invesco Institutional (N.A.), Inc.) (registered investment adviser); Vice President, Invesco Advisers, Inc. (formerly known as Invesco Institutional (N.A.), Inc.); Director of Cash Management and Senior Vice President, Invesco Advisers, Inc. and Invesco Aim Capital Management, Inc.; Director and President, Fund Management Company; Chief Cash Management Officer, Director of Cash Management, Senior Vice President, and Managing Director, Invesco Aim Capital Management, Inc.; Director of Cash Management, Senior Vice President, and Vice President, Invesco Advisers, Inc. and The Invesco Funds (AIM Treasurer’s Series Trust (Invesco Treasurer’s Series Trust), and Short-Term Investments Trust only) | N/A | N/A | ||||
Crissie M. Wisdom — 1969 Anti-Money Laundering Compliance Officer | 2013 | Anti-Money Laundering Compliance Officer, Invesco Advisers, Inc. (formerly known as Invesco Institutional (N.A.), Inc.) (registered investment adviser), Invesco Capital Markets, Inc. (formerly known as Van Kampen Funds Inc.), Invesco Distributors, Inc., Invesco Investment Services, Inc., Invesco Management Group, Inc., Van Kampen Exchange Corp., The Invesco Funds, and PowerShares Exchange-Traded Fund Trust, PowerShares Exchange-Traded Fund Trust II, PowerShares India Exchange-Traded Fund Trust, PowerShares Actively Managed Exchange-Traded Fund Trust and PowerShares Actively Managed Exchange-Traded Commodity Fund Trust; and Fraud Prevention Manager and Controls and Risk Analysis Manager for Invesco Investment Services, Inc. | N/A | N/A | ||||
Todd L. Spillane — 1958 Chief Compliance Officer | 2006 | Senior Vice President, Invesco Management Group, Inc. (formerly known as Invesco Aim Management Group, Inc.) and Van Kampen Exchange Corp.; Senior Vice President and Chief Compliance Officer, Invesco Advisers, Inc. (registered investment adviser) (formerly known as Invesco Institutional (N.A.), Inc.); Chief Compliance Officer, The Invesco Funds; Vice President, Invesco Distributors, Inc. (formerly known as Invesco Aim Distributors, Inc.) and Invesco Investment Services, Inc. (formerly known as Invesco Aim Investment Services, Inc.)
Formerly: Chief Compliance Officer, Invesco Funds (Chicago); Senior Vice President, Van Kampen Investments Inc.; Senior Vice President and Chief Compliance Officer, Invesco Aim Advisers, Inc. and Invesco Aim Capital Management, Inc.; Chief Compliance Officer, INVESCO Private Capital Investments, Inc. (holding company), Invesco Private Capital, Inc. (registered investment adviser), Invesco Global Asset Management (N.A.), Inc., Invesco Senior Secured Management, Inc. (registered investment adviser), Van Kampen Investor Services Inc., PowerShares Exchange-Traded Fund Trust, PowerShares Exchange-Traded Fund Trust II, PowerShares India Exchange-Traded Fund Trust and PowerShares Actively Managed Exchange-Traded Fund Trust; and Vice President, Invesco Aim Capital Management, Inc. and Fund Management Company | N/A | N/A |
The Statement of Additional Information of the Trust includes additional information about the Fund’s Trustees and is available upon request, without charge, by calling 1.800.959.4246. Please refer to the Fund’s prospectus for information on the Fund’s sub-advisers.
Office of the Fund 11 Greenway Plaza, Suite 1000 Houston, TX 77046-1173 | Investment Adviser Invesco Advisers, Inc. 1555 Peachtree Street, N.E. Atlanta, GA 30309 | Distributor Invesco Distributors, Inc. 11 Greenway Plaza, Suite 1000 Houston, TX 77046-1173 | Auditors PricewaterhouseCoopers LLP 1000 Louisiana Street, Suite 5800 Houston, TX 77002-5678 | |||
Counsel to the Fund Stradley Ronon Stevens & Young, LLP 2005 Market Street, Suite 2600 Philadelphia, PA 19103-7018 | Counsel to the Independent Trustees Goodwin Procter LLP 901 New York Avenue, N.W. Washington, D.C. 20001 | Transfer Agent Invesco Investment Services, Inc. 11 Greenway Plaza, Suite 1000 Houston, TX 77046-1173 | Custodian State Street Bank and Trust Company 225 Franklin Street Boston, MA 02110-2801 | |||
T-4 Invesco Multi-Asset Inflation Fund

Invesco mailing information
Send general correspondence to Invesco Investment Services, Inc., P.O. Box 219078, Kansas City, MO 64121-9078.
Important notice regarding delivery of security holder documents
To reduce Fund expenses, only one copy of most shareholder documents may be mailed to shareholders with multiple accounts at the same address (Householding). Mailing of your shareholder documents may be householded indefinitely unless you instruct us otherwise. If you do not want the mailing of these documents to be combined with those for other members of your household, please contact Invesco Investment Services, Inc. at 800 959 4246 or contact your financial institution. We will begin sending you individual copies for each account within 30 days after receiving your request.
Fund holdings and proxy voting information
The Fund provides a complete list of its holdings four times in each fiscal year, at the quarter ends. For the second and fourth quarters, the lists appear in the Fund’s semiannual and annual reports to shareholders. For the first and third quarters, the Fund files the lists with the Securities and Exchange Commission (SEC) on Form N-Q. The most recent list of portfolio holdings is available at invesco.com/completeqtrholdings. Shareholders can also look up the Fund’s Forms N-Q on the SEC website at sec.gov. Copies of the Fund’s Forms N-Q may be reviewed and copied at the SEC Public Reference Room in Washington, D.C. You can obtain information on the operation of the Public Reference Room, including information about duplicating fee charges, by calling 202 551 8090 or 800 732 0330, or by electronic request at the following email address: publicinfo@sec.gov. The SEC file numbers for the Fund are shown below.
A description of the policies and procedures that the Fund uses to determine how to vote proxies relating to portfolio securities is available without charge, upon request, from our Client Services department at 800 959 4246 or at invesco.com/proxyguidelines. The information is also available on the SEC website, sec.gov.
When available, information regarding how the Fund voted proxies related to its portfolio securities during the most recent 12-month period ended June 30 will be available at invesco.com/proxysearch. The information also will be available on the SEC website, sec.gov. Invesco Advisers, Inc. is an investment adviser; it provides investment advisory services to individual and institutional clients and does not sell securities. Invesco Distributors, Inc. is the US distributor for Invesco Ltd.’s retail mutual funds, exchange-traded funds and institutional money market funds. Both are wholly owned, indirect subsidiaries of Invesco Ltd. |  | |
SEC file numbers: 811-02699 and 002-57526 MAI-AR-1 Invesco Distributors, Inc. | ||
| ||||
 | Annual Report to Shareholders
| December 31, 2014 | ||
| ||||
Invesco Small Cap Growth Fund
Nasdaq: A: GTSAX n B: GTSBX n C: GTSDX n R: GTSRX n Y: GTSYX n Investor: GTSIX R5: GTSVX n R6: GTSFX | ||||

Letters to Shareholders
Philip Taylor | Dear Shareholders: This annual report includes information about your Fund, including performance data and a complete list of its investments as of the close of the reporting period. Inside, your Fund’s portfolio managers discuss how they managed your Fund and the factors that affected its performance during the reporting period. I hope you find this report of interest. During the reporting period, the US economy showed unmistakable signs of improvement. After contracting in the first quarter of 2014, the economy expanded strongly in the second and third quarters as employment data improved markedly. Given continuing positive economic trends, the US Federal Reserve (the Fed) ended its extraordinary asset purchase program in October – but it pledged in December to be “patient” before raising interest rates. Overseas, the story was much different. Concerns about economic stagnation and the potential for deflation depressed European markets, while the Chinese economy was hurt by | ||||||||

a slowdown in manufacturing.
Political change in Washington, DC; changes to monetary policy by the Fed and other central banks; the future direction of oil prices; and unexpected geopolitical events are likely to affect markets in the US and overseas in 2015. This may make some investors hesitant to begin to save for their long-term financial goals. That’s why Invesco has always encouraged investors to work with a professional financial adviser who can stress the importance of starting to save and invest early and the importance of adhering to a disciplined investment plan – when times are good and when they’re uncertain. A financial adviser who knows your unique financial situation, investment goals and risk tolerance can be an invaluable partner as you seek to achieve your financial goals. He or she can offer a long-term perspective when markets are volatile and time-tested advice and guidance when your financial situation or investment goals change.
Timely information when and where you want it
Invesco’s efforts to help investors achieve their financial objectives include providing individual investors and financial professionals with timely information about the markets, the economy and investing – whenever and wherever they want it.
Our website, invesco.com/us, offers a wide range of market insights and investment perspectives. On the website, you’ll find detailed information about our funds, including prices, performance, holdings and portfolio manager commentaries. You can access information about your individual Invesco account whenever it’s convenient for you; just complete a simple, secure online registration. Use the “Log In” box on our home page to get started.
Invesco’s mobile apps for iPhone® and iPad® (both available free from the App StoreSM) allow you to obtain the same detailed information, monitor your account and create customizable watch lists. Also, they allow you to access investment insights from our investment leaders, market strategists, economists and retirement experts. You can sign up to be alerted when new commentary is added, and you can watch portfolio manager videos and have instant access to Invesco news and updates wherever you may be.
In addition to the resources accessible on our website and through our mobile app, you can obtain timely updates to help you stay informed about the markets, the economy and investing by connecting with Invesco on Twitter, LinkedIn or Facebook. You can access our blog at blog.invesco.us.com. Our goal is to provide you the information you want, when and where you want it.
Have questions?
For questions about your account, feel free to contact an Invesco client services representative at 800 959 4246. For Invesco-related questions or comments, please email me directly at phil@invesco.com.
All of us at Invesco look forward to serving your investment management needs for many years to come. Thank you for investing with us.
Sincerely,

Philip Taylor
Senior Managing Director, Invesco Ltd.
iPhone and iPad are trademarks of Apple Inc., registered in the US and other countries. App Store is a service mark of Apple Inc. Invesco Distributors, Inc. is not affiliated with Apple Inc.
2 Invesco Small Cap Growth Fund
Bruce Crockett | Dear Fellow Shareholders: Among the many important lessons I’ve learned in more than 40 years in a variety of business endeavors is the value of a trusted advocate. As independent chair of the Invesco Funds Board, I can assure you that the members of the Board are strong advocates for the interests of investors in Invesco’s mutual funds. We work hard to represent your interests through oversight of the quality of the investment management services your funds receive and other matters important to your investment, including but not limited to: n Ensuring that Invesco offers a diverse lineup of mutual funds that your financial adviser can use to strive to meet your financial needs as your investment goals change over time. n Monitoring how the portfolio management teams of the Invesco funds are performing in light of changing economic and market conditions. | ||||||||

| n | Assessing each portfolio management team’s investment performance within the context of the investment strategy described in the fund’s prospectus. |
| n | Monitoring for potential conflicts of interests that may impact the nature of the services that your funds receive. |
We believe one of the most important services we provide our fund shareholders is the annual review of the funds’ advisory and sub-advisory contracts with Invesco Advisers and its affiliates. This review is required by the Investment Company Act of 1940 and focuses on the nature and quality of the services Invesco provides as the adviser to the Invesco funds and the reasonableness of the fees that it charges for those services. Each year, we spend months carefully reviewing information received from Invesco and a variety of independent sources, such as performance and fee data prepared by Lipper Inc., an independent, third-party firm widely recognized as a leader in its field. We also meet with our independent legal counsel and other independent advisers to review and help us assess the information that we have received. Our goal is to assure that you receive quality investment management services for a reasonable fee.
I trust the measures outlined above provide assurance that you have a worthy advocate when it comes to choosing the Invesco Funds.
As always, please contact me at bruce@brucecrockett.com with any questions or concerns you may have. On behalf of the Board, we look forward to continuing to represent your interests and serving your needs.
Sincerely,

Bruce L. Crockett
Independent Chair
Invesco Funds Board of Trustees
3 Invesco Small Cap Growth Fund
Management’s Discussion of Fund Performance
Performance summary
For the year ended December 31, 2014, Invesco Small Cap Growth Fund, at net asset value (NAV), posted strong positive returns, outperforming its style-specific index, the Russell 2000 Growth Index. The Fund outperformed its style-specific benchmark in several sectors including the health care, consumer discretionary and industrials sectors, but underperformed in the energy sector.
Your Fund’s long-term performance appears later in this report.
Fund vs. Indexes
Total returns, 12/31/13 to 12/31/14, at net asset value (NAV). Performance shown does not include applicable contingent deferred sales charges (CDSC) or front-end sales charges, which would have reduced performance.
| Class A Shares | 7.67 | % | |||
| Class B Shares | 6.87 | ||||
| Class C Shares | 6.85 | ||||
| Class R Shares | 7.40 | ||||
| Class Y Shares | 7.95 | ||||
| Investor Class Shares | 7.67 | ||||
| Class R5 Shares | 8.09 | ||||
| Class R6 Shares | 8.21 | ||||
| S&P 500 Index‚ (Broad Market Index) | 13.69 | ||||
| Russell 2000 Growth Index‚ (Style-Specific Index) | 5.60 | ||||
| Lipper Small-Cap Growth Funds Indexn (Peer Group Index) | 1.98 | ||||
Source(s): ‚FactSet Research Systems Inc.; nLipper Inc. |
Market conditions and your Fund
Slow and steady improvement in the US economy and historically low interest rates led the US equity market higher during the year ended December 31, 2014. As the US economy continued along a slow growth path, the US Federal Reserve reduced its asset purchase program throughout 2014, finally ending all purchases in October. In the early months of 2014, the stock market turned volatile, pulling back as investors began to worry that stocks may have risen too far, too fast in 2013. Unusually cold winter weather also impacted consumers, but only briefly. Relatively quickly, corporate earnings bounced back and remained generally strong through the rest of the year. Stocks rallied through the summer
despite political upheaval in Ukraine and signs of economic sluggishness in China.
As investors wrestled with evidence that US growth appeared to be on stronger footing than the rest of the world, in mid-September the price of oil began a sharp decline, along with US equities. Despite the unknown economic impact of significantly lower oil prices for an extended period, the US equity market stabilized and recovered, ending the year in positive territory.
The Fund did relatively well in this environment, posting a positive return and, at NAV, outperforming its style-specific benchmark due to stock selection decisions across most sectors. The Fund particularly outperformed in the health care, consumer discretionary and industrials sectors. These sectors contributed to
Fund results even after offsetting underperformance in the energy sector, where the Fund’s modest overweight exposure hurt performance as oil prices plummeted.
The Fund outperformed by the widest margin in the health care sector primarily due to stock selection. Intermune Pharmaceuticals was the Fund’s largest contributor to performance. During the year, the company’s stock outperformed when the biotechnology company reported better-than-expected trial results and confirmed efficacy of its key lung disease treatment. The company further appreciated when it was acquired for a significant premium, thus it was no longer a Fund holding at year end. Exact Sciences also benefited Fund performance based on the promising outlook for adoption of its non-invasive screening tool for colorectal cancer.
The Fund also outperformed in the consumer discretionary sector due to stock selection. Top contributors in this sector included Jack in the Box, which reported strong sales and earnings growth throughout the year, and Domino’s Pizza, which benefited from its investments in online and mobile technology to increase market share.
In the fall, the impact of unexpected new oil supply and decreased global demand hit oil markets simultaneously. As commodity prices tumbled, energy was the worst-performing sector of the style-specific index by a wide margin. The Fund underperformed in the sector primarily due to a modest overweight exposure to the weak sector. Nonetheless, due to stock selection, most of the Fund’s energy stocks held up better than those of the style-specific index. However, a few Fund holdings did underperform, including Oasis Petroleum and Laredo Petroleum, two exploration and
| Portfolio Composition | |||||
By sector
| |||||
| Information Technology | 25.7 | % | |||
| Health Care | 21.5 | ||||
| Industrials | 19.3 | ||||
| Consumer Discretionary | 13.5 | ||||
| Financials | 7.1 | ||||
| Materials | 3.1 | ||||
| Energy | 2.8 | ||||
| Utilities | 1.6 | ||||
| Consumer Staples | 1.5 | ||||
| Telecommunication Services | 1.5 | ||||
Money Market Funds Plus Other Assets Less Liabilities | 2.4 | ||||
| Top 10 Equity Holdings* | |||||
1. Manhattan Associates, Inc. | 2.0 | % | |||
2. Jack in the Box Inc. | 1.6 | ||||
3. CoStar Group Inc. | 1.5 | ||||
4. SBA Communications Corp.-Class A | 1.5 | ||||
5. Wabtec Corp. | 1.4 | ||||
6. Exact Sciences Corp. | 1.3 | ||||
7. VCA, Inc. | 1.3 | ||||
8. A.O. Smith Corp. | 1.2 | ||||
9. Knight Transportation, Inc. | 1.2 | ||||
10. Incyte Corp. | 1.2 | ||||
| Top Five Industries* | |||||
| 1. Application Software | 10.3 | % | |||
2. Health Care Equipment | 5.1 | ||||
3. Biotechnology | 5.0 | ||||
4. Semiconductors | 4.1 | ||||
5. Restaurants | 3.9 | ||||
| Total Net Assets | $2.3 billion | ||||
| Total Number of Holdings* | 124 | ||||
The Fund’s holdings are subject to change, and there is no assurance that the Fund will continue to hold any particular security.
*Excluding money market fund holdings.
4 Invesco Small Cap Growth Fund
production companies that trailed the broader energy sector.
Fund positioning did not change dramatically during the year, and is based on a disciplined investment process which keeps the portfolio diversified by matching exposure to index industry groups within a moderate range, and uses rigorous fundamental research to identify attractive individual stocks.
As we’ve discussed, the stock market experienced significant positive performance during the reporting period. However, stocks remained volatile and we caution investors against making investment decisions based on short-term performance.
We thank you for your commitment to Invesco Small Cap Growth Fund.
The views and opinions expressed in management’s discussion of Fund performance are those of Invesco Advisers, Inc. These views and opinions are subject to change at any time based on factors such as market and economic conditions. These views and opinions may not be relied upon as investment advice or recommendations, or as an offer for a particular security. The information is not a complete analysis of every aspect of any market, country, industry, security or the Fund. Statements of fact are from sources considered reliable, but Invesco Advisers, Inc. makes no representation or warranty as to their completeness or accuracy. Although historical performance is no guarantee of future results, these insights may help you understand our investment management philosophy.
See important Fund and, if applicable, index disclosures later in this report.
 | Juliet Ellis Chartered Financial Analyst, Portfolio Manager and chief investment officer of Invesco’s domestic | |
growth investments team, is lead manager of Invesco Small Cap Growth Fund. She joined Invesco in 2004. Ms. Ellis earned a BA in economics and political science from Indiana University.
| ||
 | Juan Hartsfield Chartered Financial Analyst, Portfolio Manager, is manager of Invesco Small Cap Growth Fund. He | |
joined Invesco in 2004. Mr. Hartsfield earned a BS in petroleum engineering from The University of Texas at Austin and an MBA from the University of Michigan.
| ||
 | Clay Manley Chartered Financial Analyst, Portfolio Manager, is manager of Invesco Small Cap Growth Fund. He | |
| joined Invesco in 2001. Mr. Manley earned a BA in history and geology from Vanderbilt University and an MBA with concentrations in finance and accounting from Emory University’s Goizueta Business School. | ||
5 Invesco Small Cap Growth Fund
Your Fund’s Long-Term Performance
Results of a $10,000 Investment – Oldest Share Class(es)
Fund and index data from 12/31/04
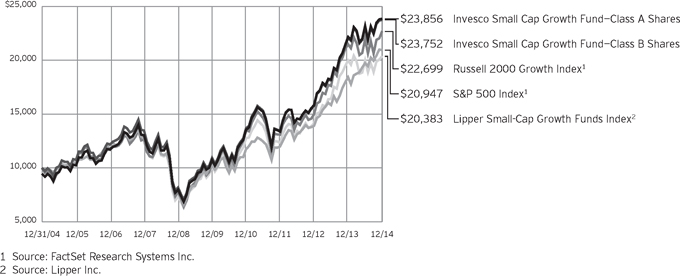
Past performance cannot guarantee comparable future results.
The data shown in the chart include reinvested distributions, applicable sales charges and Fund expenses including management fees. Results for Class B shares are calculated as if a hypothetical
shareholder had liquidated his entire investment in the Fund at the close of the reporting period and paid the contingent deferred sales charges, if applicable. Index results include reinvested dividends, but they do not reflect sales charges. Performance of the peer group,
if applicable, reflects fund expenses and management fees; performance of a market index does not. Performance shown in the chart and table(s) does not reflect deduction of taxes a shareholder would pay on Fund distributions or sale of Fund shares.
6 Invesco Small Cap Growth Fund
| Average Annual Total Returns | |||||
| As of 12/31/14, including maximum applicable sales charges | |||||
| Class A Shares | |||||
| Inception (10/18/95) | 10.66 | % | |||
| 10 Years | 9.08 | ||||
| 5 Years | 16.00 | ||||
| 1 Year | 1.74 | ||||
| Class B Shares | |||||
| Inception (10/18/95) | 10.66 | % | |||
| 10 Years | 9.04 | ||||
| 5 Years | 16.22 | ||||
| 1 Year | 2.57 | ||||
| Class C Shares | |||||
| Inception (5/3/99) | 8.16 | % | |||
| 10 Years | 8.87 | ||||
| 5 Years | 16.45 | ||||
| 1 Year | 5.99 | ||||
| Class R Shares | |||||
| Inception (6/3/02) | 9.03 | % | |||
| 10 Years | 9.42 | ||||
| 5 Years | 17.03 | ||||
| 1 Year | 7.40 | ||||
| Class Y Shares | |||||
| 10 Years | 9.87 | % | |||
| 5 Years | 17.62 | ||||
| 1 Year | 7.95 | ||||
| Investor Class Shares | |||||
| 10 Years | 9.70 | % | |||
| 5 Years | 17.33 | ||||
| 1 Year | 7.67 | ||||
| Class R5 Shares | |||||
| Inception (3/15/02) | 8.91 | % | |||
| 10 Years | 10.17 | ||||
| 5 Years | 17.80 | ||||
| 1 Year | 8.09 | ||||
| Class R6 Shares | |||||
| 10 Years | 9.82 | % | |||
| 5 Years | 17.57 | ||||
| 1 Year | 8.21 | ||||
Class Y shares incepted on October 3, 2008. Performance shown prior to that date is that of Class A shares and includes the 12b-1 fees applicable to Class A shares. Class A share performance reflects any applicable fee waivers or expense reimbursements.
Investor Class shares incepted on April 7, 2006. Performance shown prior to that date is that of Class A shares and includes the 12b-1 fees applicable to Class A shares. Class A share performance reflects any applicable fee waivers or expense reimbursements.
Class R6 shares incepted on September 24, 2012. Performance shown prior
to that date is that of Class A shares and includes the 12b-1 fees applicable to Class A shares. Class A share performance reflects any applicable fee waivers or expense reimbursements.
The performance data quoted represent past performance and cannot guarantee comparable future results; current performance may be lower or higher. Please visit invesco.com/performance for the most recent month-end performance. Performance figures reflect reinvested distributions, changes in net asset value and the effect of the maximum sales charge unless otherwise stated. Investment return and principal value will fluctuate so that you may have a gain or loss when you sell shares.
The total annual Fund operating expense ratio set forth in the most recent Fund prospectus as of the date of this report for Class A, Class B, Class C, Class R, Class Y, Investor Class, Class R5 and Class R6 shares was 1.21%, 1.96%, 1.96%, 1.46%, 0.96%, 1.21%, 0.83% and 0.74%, respectively. The expense ratios presented above may vary from the expense ratios presented in other sections of this report that are based on expenses incurred during the period covered by this report.
Class A share performance reflects the maximum 5.50% sales charge, and Class B and Class C share performance reflects the applicable contingent deferred sales charge (CDSC) for the period involved. The CDSC on Class B shares declines from 5% beginning at the time of purchase to 0% at the beginning of the seventh year. The CDSC on Class C shares is 1% for the first year after purchase. Class R, Class Y, Investor Class, Class R5 and Class R6 shares do not have a front-end sales charge or a CDSC; therefore, performance is at net asset value.
The performance of the Fund’s share classes will differ primarily due to different sales charge structures and class expenses.
7 Invesco Small Cap Growth Fund
Invesco Small Cap Growth Fund’s investment objective is long-term growth of capital.
| n | Unless otherwise stated, information presented in this report is as of December 31, 2014, and is based on total net assets. |
| n | Unless otherwise noted, all data provided by Invesco. |
| n | To access your Fund’s reports/prospectus, visit invesco.com/fundreports. |
About share classes
| n | Class B shares may not be purchased for new or additional investments. Please see the prospectus for more information. |
| n | Class R shares are generally available only to employer sponsored retirement and benefit plans. Please see the prospectus for more information. |
| n | Class Y shares are available only to certain investors. Please see the prospectus for more information. |
| n | Investor Class shares are closed to new investors. Contact your financial adviser about purchasing our other share classes. Please see the prospectus for more information. |
| n | Class R5 shares and Class R6 shares are primarily intended for employer sponsored retirement and benefit plans that meet certain standards and for institutional investors. Please see the prospectus for more information. |
Principal risks of investing in the Fund
| n | Foreign securities risk. The Fund’s foreign investments may be affected by changes in a foreign country’s exchange rates, political and social instability, changes in economic or taxation policies, difficulties when enforcing obligations, decreased liquidity, and increased volatility. Foreign companies may be subject to less regulation resulting in less publicly available information about the companies. |
| n | Growth investing risk. Growth stocks tend to be more expensive relative to their earnings or assets compared with other types of stock. As a result they tend to be more sensitive to changes in their earnings and can be more volatile. |
| n | Management risk. The investment techniques and risk analysis used by the Fund’s portfolio managers may not produce the desired results. |
| n | Market risk. The prices of and the income generated by the Fund’s securities may decline in response to, among other things, investor sentiment, general economic and market conditions, |
regional or global instability, and currency and interest rate fluctuations.
| n | Small- and mid-capitalization risks. Stocks of small- and mid-sized companies tend to be more vulnerable to adverse developments and may have little or no operating history or track record of success, and limited product lines, markets, management and financial resources. The securities of small- and mid-sized companies may be more volatile due to less market interest and less publicly available information about the issuer. They also may be illiquid or restricted as to resale, or may trade less frequently and in smaller volumes, all of which may cause difficulty when establishing or closing a position at a desirable price. |
About indexes used in this report
| n | The S&P 500® Index is an unmanaged index considered representative of the US stock market. |
| n | The Russell 2000® Growth Index is an unmanaged index considered representative of small-cap growth stocks. The Russell 2000 Growth Index is a trademark/service mark of the Frank Russell Co. Russell® is a trademark of the Frank Russell Co. |
| n | The Lipper Small-Cap Growth Funds Index is an unmanaged index considered representative of small-cap growth funds tracked by Lipper. |
| n | The Fund is not managed to track the performance of any particular index, including the index(es) described here, and consequently, the performance of the Fund may deviate significantly from the performance of the index(es). |
| n | A direct investment cannot be made in an index. Unless otherwise indicated, index results include reinvested dividends, and they do not reflect sales charges. Performance of the peer group, if applicable, reflects fund expenses; performance of a market index does not. |
This report must be accompanied or preceded by a currently effective Fund prospectus, which contains more complete information, including sales charges and expenses. Investors should read it carefully before investing.
NOT FDIC INSURED | MAY LOSE VALUE | NO BANK GUARANTEE
Other information
| n | The returns shown in management’s discussion of Fund performance are based on net asset values (NAVs) calculated for shareholder transactions. Generally accepted accounting principles require adjustments to be made to the net assets of the Fund at period end for financial reporting purposes, and as such, the NAVs for shareholder transactions and the returns based on those NAVs may differ from the NAVs and returns reported in the Financial Highlights. |
| n | Industry classifications used in this report are generally according to the Global Industry Classification Standard, which was developed by and is the exclusive property and a service mark of MSCI Inc. and Standard & Poor’s. |
8 Invesco Small Cap Growth Fund
Schedule of Investments(a)
December 31, 2014
| Shares | Value | |||||||
Common Stocks & Other Equity Interests–97.64% |
| |||||||
| Aerospace & Defense–1.51% | ||||||||
Hexcel Corp.(b) | 401,014 | $ | 16,638,071 | |||||
TransDigm Group, Inc. | 94,889 | 18,631,455 | ||||||
| 35,269,526 | ||||||||
| Air Freight & Logistics–0.87% | ||||||||
Forward Air Corp. | 401,997 | 20,248,589 | ||||||
| Apparel Retail–1.44% | ||||||||
ANN Inc.(b) | 420,811 | 15,351,185 | ||||||
DSW Inc.–Class A | 490,617 | 18,300,014 | ||||||
| 33,651,199 | ||||||||
| Apparel, Accessories & Luxury Goods–1.05% | ||||||||
G-III Apparel Group, Ltd.(b) | 243,246 | 24,570,278 | ||||||
| Application Software–10.28% | ||||||||
Aspen Technology, Inc.(b) | 484,654 | 16,972,583 | ||||||
Cadence Design Systems, Inc.(b) | 1,021,278 | 19,373,644 | ||||||
Guidewire Software Inc.(b) | 391,267 | 19,809,848 | ||||||
Interactive Intelligence Group, Inc.(b) | 315,229 | 15,099,469 | ||||||
Manhattan Associates, Inc.(b) | 1,159,146 | 47,200,425 | ||||||
Mentor Graphics Corp. | 771,968 | 16,921,539 | ||||||
MicroStrategy Inc.–Class A(b) | 125,688 | 20,411,731 | ||||||
NetScout Systems, Inc.(b) | 240,282 | 8,779,904 | ||||||
Qlik Technologies Inc.(b) | 626,012 | 19,337,511 | ||||||
SolarWinds, Inc.(b) | 395,129 | 19,689,278 | ||||||
Ultimate Software Group, Inc. (The)(b) | 129,958 | 19,079,784 | ||||||
Verint Systems Inc.(b) | 302,569 | 17,633,721 | ||||||
| 240,309,437 | ||||||||
| Asset Management & Custody Banks–1.70% | ||||||||
Affiliated Managers Group, Inc.(b) | 85,734 | 18,196,184 | ||||||
Janus Capital Group Inc. | 1,336,443 | 21,556,826 | ||||||
| 39,753,010 | ||||||||
| Automotive Retail–0.89% | ||||||||
Group 1 Automotive, Inc. | 231,158 | 20,716,380 | ||||||
| Biotechnology–5.01% | ||||||||
Alnylam Pharmaceuticals Inc.(b) | 206,277 | 20,008,869 | ||||||
Exact Sciences Corp.(b)(c) | 1,086,633 | 29,817,209 | ||||||
Incyte Corp.(b) | 367,987 | 26,903,529 | ||||||
NPS Pharmaceuticals, Inc.(b) | 555,092 | 19,855,641 | ||||||
Repligen Corp.(b) | 397,501 | 7,870,520 | ||||||
Seattle Genetics, Inc.(b)(c) | 394,397 | 12,671,976 | ||||||
| 117,127,744 | ||||||||
| Broadcasting–0.64% | ||||||||
Sinclair Broadcast Group, Inc.–Class A(c) | 549,071 | 15,022,583 | ||||||
| Building Products–1.21% | ||||||||
A.O. Smith Corp. | 500,102 | 28,210,754 | ||||||
| Shares | Value | |||||||
| Communications Equipment–1.57% | ||||||||
ARRIS Group Inc.(b) | 804,482 | $ | 24,287,312 | |||||
Finisar Corp.(b) | 634,278 | 12,311,336 | ||||||
| 36,598,648 | ||||||||
| Construction & Engineering–0.49% | ||||||||
MasTec Inc.(b) | 503,576 | 11,385,853 | ||||||
| Construction Machinery & Heavy Trucks–2.29% | ||||||||
WABCO Holdings Inc.(b) | 209,276 | 21,927,939 | ||||||
Wabtec Corp. | 364,001 | 31,628,047 | ||||||
| 53,555,986 | ||||||||
| Construction Materials–0.68% | ||||||||
Martin Marietta Materials, Inc. | 143,972 | 15,882,991 | ||||||
| Distributors–0.83% | ||||||||
Pool Corp. | 307,039 | 19,478,554 | ||||||
| Electric Utilities–0.92% | ||||||||
ITC Holdings Corp. | 533,905 | 21,585,779 | ||||||
| Electrical Components & Equipment–1.05% | ||||||||
Acuity Brands, Inc. | 175,290 | 24,552,870 | ||||||
| Electronic Equipment & Instruments–1.40% | ||||||||
Cognex Corp.(b) | 435,445 | 17,996,942 | ||||||
National Instruments Corp. | 470,700 | 14,634,063 | ||||||
| 32,631,005 | ||||||||
| Electronic Manufacturing Services–0.53% | ||||||||
IPG Photonics Corp.(b)(c) | 165,186 | 12,375,735 | ||||||
| Environmental & Facilities Services–0.64% | ||||||||
Tetra Tech, Inc. | 559,961 | 14,950,959 | ||||||
| Footwear–0.73% | ||||||||
Steven Madden, Ltd.(b) | 533,491 | 16,981,019 | ||||||
| Health Care Equipment–5.12% | ||||||||
DexCom Inc.(b) | 417,288 | 22,971,704 | ||||||
Insulet Corp.(b) | 377,950 | 17,408,377 | ||||||
NuVasive, Inc.(b) | 489,750 | 23,096,610 | ||||||
Sirona Dental Systems, Inc.(b) | 222,812 | 19,467,085 | ||||||
STERIS Corp. | 384,443 | 24,931,129 | ||||||
Thoratec Corp.(b) | 365,222 | 11,855,106 | ||||||
| 119,730,011 | ||||||||
| Health Care Facilities–3.85% | ||||||||
Community Health Systems Inc.(b) | 430,322 | 23,202,962 | ||||||
Community Health Systems Inc.–Rts.(b) | 1,164,768 | 29,119 | ||||||
HealthSouth Corp. | 500,308 | 19,241,846 | ||||||
Select Medical Holdings Corp. | 1,249,212 | 17,988,653 | ||||||
VCA, Inc.(b) | 606,298 | 29,569,153 | ||||||
| 90,031,733 | ||||||||
See accompanying Notes to Financial Statements which are an integral part of the financial statements.
9 Invesco Small Cap Growth Fund
| Shares | Value | |||||||
| Health Care Services–1.75% | ||||||||
Chemed Corp. | 226,528 | $ | 23,937,214 | |||||
Envision Healthcare Holdings, Inc.(b) | 490,358 | 17,010,519 | ||||||
| 40,947,733 | ||||||||
| Health Care Technology–0.32% | ||||||||
HMS Holdings Corp.(b) | 354,521 | 7,494,574 | ||||||
| Homebuilding–0.65% | ||||||||
Standard Pacific Corp.(b) | 2,074,270 | 15,121,428 | ||||||
| Hotels, Resorts & Cruise Lines–0.78% | ||||||||
Choice Hotels International, Inc. | 326,916 | 18,313,834 | ||||||
| Industrial Machinery–2.54% | ||||||||
Crane Co. | 266,102 | 15,620,187 | ||||||
ITT Corp. | 513,557 | 20,778,516 | ||||||
Lincoln Electric Holdings, Inc. | 333,643 | 23,051,395 | ||||||
| 59,450,098 | ||||||||
| Internet Software & Services–3.62% | ||||||||
CoStar Group Inc.(b) | 193,579 | 35,546,912 | ||||||
Dealertrack Technologies Inc.(b) | 431,956 | 19,139,970 | ||||||
Envestnet, Inc.(b) | 313,210 | 15,391,139 | ||||||
HomeAway Inc.(b) | 489,751 | 14,584,785 | ||||||
| 84,662,806 | ||||||||
| Investment Banking & Brokerage–1.52% | ||||||||
Greenhill & Co., Inc.(c) | 230,089 | 10,031,880 | ||||||
Stifel Financial Corp.(b) | 502,184 | 25,621,428 | ||||||
| 35,653,308 | ||||||||
| IT Consulting & Other Services–1.63% | ||||||||
Booz Allen Hamilton Holding Corp. | 673,919 | 17,879,071 | ||||||
EPAM Systems, Inc.(b) | 425,913 | 20,337,346 | ||||||
| 38,216,417 | ||||||||
| Leisure Products–0.82% | ||||||||
Brunswick Corp. | 372,699 | 19,104,551 | ||||||
| Life & Health Insurance–0.94% | ||||||||
American Equity Investment Life Holding Co. | 756,095 | 22,070,413 | ||||||
| Life Sciences Tools & Services–2.34% | ||||||||
Bio-Techne Corp. | 193,891 | 17,915,528 | ||||||
PAREXEL International Corp.(b) | 361,967 | 20,110,887 | ||||||
PerkinElmer, Inc. | 382,433 | 16,723,795 | ||||||
| 54,750,210 | ||||||||
| Marine–0.69% | ||||||||
Kirby Corp.(b) | 199,575 | 16,113,686 | ||||||
| Metal & Glass Containers–0.96% | ||||||||
Berry Plastics Group Inc.(b) | 714,570 | 22,544,683 | ||||||
| Office Services & Supplies–1.75% | ||||||||
Pitney Bowes Inc. | 907,897 | 22,125,450 | ||||||
Steelcase Inc.–Class A | 1,052,103 | 18,885,249 | ||||||
| 41,010,699 | ||||||||
| Shares | Value | |||||||
| Oil & Gas Drilling–0.60% | ||||||||
Atwood Oceanics, Inc.(b) | 264,592 | $ | 7,506,475 | |||||
Patterson-UTI Energy, Inc. | 391,716 | 6,498,568 | ||||||
| 14,005,043 | ||||||||
| Oil & Gas Equipment & Services–0.63% | ||||||||
Dril-Quip, Inc.(b) | 190,590 | 14,623,971 | ||||||
| Oil & Gas Exploration & Production–1.69% | ||||||||
Energen Corp. | 255,080 | 16,263,901 | ||||||
Laredo Petroleum Inc.(b)(c) | 599,674 | 6,206,626 | ||||||
Oasis Petroleum Inc.(b) | 451,940 | 7,475,087 | ||||||
Ultra Petroleum Corp.(b)(c) | 722,836 | 9,512,522 | ||||||
| 39,458,136 | ||||||||
| Oil & Gas Storage & Transportation–0.60% | ||||||||
SemGroup Corp.–Class A | 205,829 | 14,076,645 | ||||||
| Packaged Foods & Meats–1.48% | ||||||||
B&G Foods Inc. | 477,106 | 14,265,469 | ||||||
Lancaster Colony Corp. | 216,086 | 20,234,293 | ||||||
| 34,499,762 | ||||||||
| Pharmaceuticals–3.09% | ||||||||
Catalent, Inc.(b) | 16,416 | 457,678 | ||||||
Jazz Pharmaceuticals PLC(b) | 109,080 | 17,859,668 | ||||||
Nektar Therapeutics(b) | 1,351,842 | 20,953,551 | ||||||
Pacira Pharmaceuticals, Inc.(b) | 160,813 | 14,257,681 | ||||||
Salix Pharmaceuticals, Ltd.(b) | 163,706 | 18,816,368 | ||||||
| 72,344,946 | ||||||||
| Regional Banks–2.98% | ||||||||
Hancock Holding Co. | 490,897 | 15,070,538 | ||||||
Home BancShares Inc. | 502,474 | 16,159,564 | ||||||
SVB Financial Group(b) | 187,747 | 21,791,794 | ||||||
UMB Financial Corp. | 293,678 | 16,707,341 | ||||||
| 69,729,237 | ||||||||
| Restaurants–3.90% | ||||||||
BJ’s Restaurants Inc.(b) | 369,906 | 18,572,980 | ||||||
Cheesecake Factory Inc. (The) | 342,927 | 17,252,657 | ||||||
Domino’s Pizza, Inc. | 186,967 | 17,606,683 | ||||||
Jack in the Box Inc. | 472,794 | 37,804,608 | ||||||
| 91,236,928 | ||||||||
| Semiconductor Equipment–1.40% | ||||||||
MKS Instruments, Inc. | 401,229 | 14,684,981 | ||||||
Teradyne, Inc. | 912,816 | 18,064,629 | ||||||
| 32,749,610 | ||||||||
| Semiconductors–4.08% | ||||||||
Atmel Corp.(b) | 2,357,802 | 19,793,748 | ||||||
Cavium Inc.(b) | 344,029 | 21,267,873 | ||||||
Monolithic Power Systems Inc. | 380,130 | 18,907,666 | ||||||
Power Integrations, Inc. | 357,417 | 18,492,756 | ||||||
Silicon Laboratories Inc.(b) | 357,694 | 17,033,388 | ||||||
| 95,495,431 | ||||||||
See accompanying Notes to Financial Statements which are an integral part of the financial statements.
10 Invesco Small Cap Growth Fund
| Shares | Value | |||||||
| Specialized REIT’s–0.86% | ||||||||
Corrections Corp. of America | 556,175 | $ | 20,211,400 | |||||
| Specialty Chemicals–0.94% | ||||||||
PolyOne Corp. | 580,216 | 21,995,989 | ||||||
| Specialty Stores–1.14% | ||||||||
Five Below, Inc.(b) | 390,407 | 15,940,318 | ||||||
Vitamin Shoppe, Inc.(b) | 220,999 | 10,736,131 | ||||||
| 26,676,449 | ||||||||
| Steel–0.54% | ||||||||
Carpenter Technology Corp. | 256,131 | 12,614,452 | ||||||
| Systems Software–1.24% | ||||||||
CommVault Systems, Inc.(b) | 215,683 | 11,148,654 | ||||||
Qualys Inc.(b) | 472,792 | 17,847,898 | ||||||
| 28,996,552 | ||||||||
| Technology Distributors–1.13% | ||||||||
SYNNEX Corp. | 337,919 | 26,411,749 | ||||||
| Technology Hardware, Storage & Peripherals–0.97% | ||||||||
Cray, Inc.(b) | 658,354 | 22,700,046 | ||||||
| Trading Companies & Distributors–1.58% | ||||||||
Watsco, Inc. | 186,262 | 19,930,034 | ||||||
WESCO International, Inc.(b)(c) | 221,729 | 16,897,967 | ||||||
| 36,828,001 | ||||||||
| Trucking–2.32% | ||||||||
Knight Transportation, Inc. | 811,457 | 27,313,643 | ||||||
| Shares | Value | |||||||
| Trucking–(continued) | ||||||||
Old Dominion Freight Line, Inc.(b) | 30,994 | $ | 2,406,374 | |||||
Swift Transportation Co.(b) | 853,857 | 24,445,926 | ||||||
| 54,165,943 | ||||||||
| Wireless Telecommunication Services–1.46% | ||||||||
SBA Communications Corp.–Class A(b) | 309,077 | 34,233,369 | ||||||
Total Common Stocks & Other Equity Interests (Cost $1,481,171,959) |
| 2,283,128,742 | ||||||
Money Market Funds–2.96% |
| |||||||
Liquid Assets Portfolio–Institutional Class(d) | 34,616,335 | 34,616,335 | ||||||
Premier Portfolio–Institutional Class(d) | 34,616,335 | 34,616,335 | ||||||
Total Money Market Funds |
| 69,232,670 | ||||||
TOTAL INVESTMENTS (excluding investments purchased with cash collateral from securities on loan)–100.60% (Cost $1,550,404,629) |
| 2,352,361,412 | ||||||
Investments Purchased with Cash |
| |||||||
Money Market Funds–3.19% |
| |||||||
Liquid Assets Portfolio–Institutional Class (Cost $74,591,940)(d)(e) | 74,591,940 | 74,591,940 | ||||||
TOTAL INVESTMENTS–103.79% |
| 2,426,953,352 | ||||||
OTHER ASSETS LESS LIABILITIES–(3.79)% |
| (88,578,100 | ) | |||||
NET ASSETS–100.00% |
| $ | 2,338,375,252 | |||||
Investment Abbreviations:
| REIT | – Real Estate Investment Trust | |
| Rts. | – Rights |
Notes to Schedule of Investments:
| (a) | Industry and/or sector classifications used in this report are generally according to the Global Industry Classification Standard, which was developed by and is the exclusive property and a service mark of MSCI Inc. and Standard & Poor’s. |
| (b) | Non-income producing security. |
| (c) | All or a portion of this security was out on loan at December 31, 2014. |
| (d) | The money market fund and the Fund are affiliated by having the same investment adviser. |
| (e) | The security has been segregated to satisfy the commitment to return the cash collateral received in securities lending transactions upon the borrower’s return of the securities loaned. See Note 1I. The following table presents the Fund’s gross and net amount of assets available for offset by the Fund as of December 31, 2014. |
| Counterparty | Gross Amount of Securities on Loan at Value | Cash Collateral Received for Securities Loaned* | Net Amount | |||||||||
Brown Brothers Harriman | $ | 71,752,875 | $ | (71,752,875 | ) | $ | — | |||||
| * | Amount does not include excess collateral received. |
See accompanying Notes to Financial Statements which are an integral part of the financial statements.
11 Invesco Small Cap Growth Fund
Statement of Assets and Liabilities
December 31, 2014
Assets: | ||||
Investments, at value (Cost $1,481,171,959)* | $ | 2,283,128,742 | ||
Investments in affiliated money market funds, at value and cost | 143,824,610 | |||
Total investments, at value (Cost $1,624,996,569) | 2,426,953,352 | |||
Receivable for: | ||||
Investments sold | 539,305 | |||
Fund shares sold | 4,117,439 | |||
Dividends | 1,062,743 | |||
Investment for trustee deferred compensation and retirement plans | 328,709 | |||
Other assets | 39,826 | |||
Total assets | 2,433,041,374 | |||
Liabilities: | ||||
Payable for: | ||||
Investments purchased | 795,117 | |||
Fund shares reacquired | 17,511,772 | |||
Collateral upon return of securities loaned | 74,591,940 | |||
Accrued fees to affiliates | 1,280,502 | |||
Accrued trustees’ and officers’ fees and benefits | 740 | |||
Accrued other operating expenses | 101,161 | |||
Trustee deferred compensation and retirement plans | 384,890 | |||
Total liabilities | 94,666,122 | |||
Net assets applicable to shares outstanding | $ | 2,338,375,252 | ||
Net assets consist of: | ||||
Shares of beneficial interest | $ | 1,503,712,766 | ||
Undistributed net investment income (loss) | (373,585 | ) | ||
Undistributed net realized gain | 33,079,288 | |||
Net unrealized appreciation | 801,956,783 | |||
| $ | 2,338,375,252 | |||
Net Assets: | ||||
Class A | $ | 710,426,451 | ||
Class B | $ | 3,876,195 | ||
Class C | $ | 20,956,674 | ||
Class R | $ | 108,855,123 | ||
Class Y | $ | 105,193,572 | ||
Investor Class | $ | 279,827,651 | ||
Class R5 | $ | 970,302,778 | ||
Class R6 | $ | 138,936,808 | ||
Shares outstanding, $0.01 par value per share, |
| |||
Class A | 19,763,351 | |||
Class B | 139,643 | |||
Class C | 756,279 | |||
Class R | 3,184,811 | |||
Class Y | 2,874,398 | |||
Investor Class | 7,494,552 | |||
Class R5 | 24,815,828 | |||
Class R6 | 3,547,425 | |||
Class A: | ||||
Net asset value per share | $ | 35.95 | ||
Maximum offering price per share | ||||
(Net asset value of $35.95 ¸ 94.50%) | $ | 38.04 | ||
Class B: | ||||
Net asset value and offering price per share | $ | 27.76 | ||
Class C: | ||||
Net asset value and offering price per share | $ | 27.71 | ||
Class R: | ||||
Net asset value and offering price per share | $ | 34.18 | ||
Class Y: | ||||
Net asset value and offering price per share | $ | 36.60 | ||
Investor Class: | ||||
Net asset value and offering price per share | $ | 37.34 | ||
Class R5: | ||||
Net asset value and offering price per share | $ | 39.10 | ||
Class R6: | ||||
Net asset value and offering price per share | $ | 39.17 | ||
| * | At December 31, 2014, securities with an aggregate value of $71,752,875 were on loan to brokers. |
See accompanying Notes to Financial Statements which are an integral part of the financial statements.
12 Invesco Small Cap Growth Fund
Statement of Operations
For the year ended December 31, 2014
Investment income: |
| |||
Dividends | $ | 21,135,911 | ||
Dividends from affiliated money market funds (includes securities lending income of $1,257,716) | 1,278,364 | |||
Total investment income | 22,414,275 | |||
Expenses: | ||||
Advisory fees | 15,750,789 | |||
Administrative services fees | 485,016 | |||
Custodian fees | 81,325 | |||
Distribution fees: | ||||
Class A | 2,250,478 | |||
Class B | 45,559 | |||
Class C | 210,318 | |||
Class R | 523,375 | |||
Investor Class | 694,450 | |||
Transfer agent fees — A, B, C, R, Y and Investor | 3,418,998 | |||
Transfer agent fees — R5 | 750,775 | |||
Transfer agent fees — R6 | 5,580 | |||
Trustees’ and officers’ fees and benefits | 63,460 | |||
Other | 393,992 | |||
Total expenses | 24,674,115 | |||
Less: Fees waived and expense offset arrangement(s) | (74,484 | ) | ||
Net expenses | 24,599,631 | |||
Net investment income (loss) | (2,185,356 | ) | ||
Realized and unrealized gain (loss) from: | ||||
Net realized gain from investment securities (includes net gains from securities sold to affiliates of $15,831,286) | 367,675,632 | |||
Change in net unrealized appreciation (depreciation) of investment securities | (192,965,916 | ) | ||
Net realized and unrealized gain | 174,709,716 | |||
Net increase in net assets resulting from operations | $ | 172,524,360 | ||
See accompanying Notes to Financial Statements which are an integral part of the financial statements.
13 Invesco Small Cap Growth Fund
Statement of Changes in Net Assets
For the years ended December 31, 2014 and 2013
| 2014 | 2013 | |||||||
Operations: | ||||||||
Net investment income (loss) | $ | (2,185,356 | ) | $ | (5,805,423 | ) | ||
Net realized gain | 367,675,632 | 137,285,199 | ||||||
Change in net unrealized appreciation (depreciation) | (192,965,916 | ) | 554,576,570 | |||||
Net increase in net assets resulting from operations | 172,524,360 | 686,056,346 | ||||||
Distributions to shareholders from net investment income: | ||||||||
Class A | — | (464,703 | ) | |||||
Class Y | — | (142,290 | ) | |||||
Investor Class | — | (131,177 | ) | |||||
Class R5 | — | (2,107,894 | ) | |||||
Class R6 | — | (263,149 | ) | |||||
Total distributions from net investment income | — | (3,109,213 | ) | |||||
Distributions to shareholders from net realized gains: | ||||||||
Class A | (112,329,694 | ) | (50,373,771 | ) | ||||
Class B | (760,931 | ) | (346,313 | ) | ||||
Class C | (4,021,213 | ) | (1,383,920 | ) | ||||
Class R | (17,549,526 | ) | (5,761,621 | ) | ||||
Class Y | (13,580,474 | ) | (3,813,169 | ) | ||||
Investor Class | (41,845,493 | ) | (14,219,636 | ) | ||||
Class R5 | (139,489,926 | ) | (37,861,750 | ) | ||||
Class R6 | (19,766,824 | ) | (4,645,821 | ) | ||||
Total distributions from net realized gains | (349,344,081 | ) | (118,406,001 | ) | ||||
Share transactions–net: | ||||||||
Class A | (198,540,936 | ) | (49,449,943 | ) | ||||
Class B | (1,004,971 | ) | (1,833,964 | ) | ||||
Class C | 1,797,451 | (930,726 | ) | |||||
Class R | 11,877,276 | (6,262,529 | ) | |||||
Class Y | 39,037,806 | 24,780,307 | ||||||
Investor Class | 19,512,081 | 3,899,627 | ||||||
Class R5 | 267,853,461 | (38,219,296 | ) | |||||
Class R6 | 31,495,999 | 102,885,376 | ||||||
Net increase in net assets resulting from share transactions | 172,028,167 | 34,868,852 | ||||||
Net increase (decrease) in net assets | (4,791,554 | ) | 599,409,984 | |||||
Net assets: | ||||||||
Beginning of year | 2,343,166,806 | 1,743,756,822 | ||||||
End of year (includes undistributed net investment income (loss) of $(373,585) and $(363,733), respectively) | $ | 2,338,375,252 | $ | 2,343,166,806 | ||||
Notes to Financial Statements
December 31, 2014
NOTE 1—Significant Accounting Policies
Invesco Small Cap Growth Fund (the “Fund”) is a series portfolio of AIM Growth Series (Invesco Growth Series) (the “Trust”). The Trust is organized as a Delaware statutory trust and is registered under the Investment Company Act of 1940, as amended (the “1940 Act”), as an open-end series management investment company consisting of seventeen separate series portfolios, each authorized to issue an unlimited number of shares of beneficial interest. The assets, liabilities and operations of each portfolio are accounted for separately. Information presented in these financial statements pertains only to the Fund. Matters affecting each portfolio or class will be voted on exclusively by the shareholders of such portfolio or class.
The Fund’s investment objective is long-term growth of capital.
The Fund currently consists of eight different classes of shares: Class A, Class B, Class C, Class R, Class Y, Investor Class, Class R5 and Class R6. Investor Class shares of the Fund are offered only to certain grandfathered investors. Class A shares are sold with a front-end sales charge unless
14 Invesco Small Cap Growth Fund
certain waiver criteria are met and under certain circumstances load waived shares may be subject to contingent deferred sales charges (“CDSC”). Class C shares are sold with a CDSC. Class R, Class Y, Investor Class, Class R5 and Class R6 shares are sold at net asset value. Effective November 30, 2010, new or additional investments in Class B shares are no longer permitted. Existing shareholders of Class B shares may continue to reinvest dividends and capital gains distributions in Class B shares until they convert to Class A shares. Also, shareholders in Class B shares will be able to exchange those shares for Class B shares of other Invesco Funds offering such shares until they convert to Class A shares. Generally, Class B shares will automatically convert to Class A shares on or about the month-end, which is at least eight years after the date of purchase. Redemption of Class B shares prior to the conversion date will be subject to a CDSC.
Effective as of the close of business on March 18, 2002, the Fund’s shares were offered on a limited basis to certain investors.
The following is a summary of the significant accounting policies followed by the Fund in the preparation of its financial statements.
| A. | Security Valuations — Securities, including restricted securities, are valued according to the following policy. |
A security listed or traded on an exchange (except convertible securities) is valued at its last sales price or official closing price as of the close of the customary trading session on the exchange where the security is principally traded, or lacking any sales or official closing price on a particular day, the security may be valued at the closing bid price on that day. Securities traded in the over-the-counter market are valued based on prices furnished by independent pricing services or market makers. When such securities are valued by an independent pricing service they may be considered fair valued. Futures contracts are valued at the final settlement price set by an exchange on which they are principally traded. Listed options are valued at the mean between the last bid and ask prices from the exchange on which they are principally traded. Options not listed on an exchange are valued by an independent source at the mean between the last bid and ask prices. For purposes of determining net asset value per share, futures and option contracts generally are valued 15 minutes after the close of the customary trading session of the New York Stock Exchange (“NYSE”).
Investments in open-end and closed-end registered investment companies that do not trade on an exchange are valued at the end of day net asset value per share. Investments in open-end and closed-end registered investment companies that trade on an exchange are valued at the last sales price or official closing price as of the close of the customary trading session on the exchange where the security is principally traded.
Debt obligations (including convertible securities) and unlisted equities are fair valued using an evaluated quote provided by an independent pricing service. Evaluated quotes provided by the pricing service may be determined without exclusive reliance on quoted prices, and may reflect appropriate factors such as institution-size trading in similar groups of securities, developments related to specific securities, dividend rate (for unlisted equities), yield (for debt obligations), quality, type of issue, coupon rate (for debt obligations), maturity (for debt obligations), individual trading characteristics and other market data. Debt obligations are subject to interest rate and credit risks. In addition, all debt obligations involve some risk of default with respect to interest and/or principal payments.
Foreign securities’ (including foreign exchange contracts) prices are converted into U.S. dollar amounts using the applicable exchange rates as of the close of the NYSE. If market quotations are available and reliable for foreign exchange-traded equity securities, the securities will be valued at the market quotations. Because trading hours for certain foreign securities end before the close of the NYSE, closing market quotations may become unreliable. If between the time trading ends on a particular security and the close of the customary trading session on the NYSE, events occur that the Adviser determines are significant and make the closing price unreliable, the Fund may fair value the security. If the event is likely to have affected the closing price of the security, the security will be valued at fair value in good faith using procedures approved by the Board of Trustees. Adjustments to closing prices to reflect fair value may also be based on a screening process of an independent pricing service to indicate the degree of certainty, based on historical data, that the closing price in the principal market where a foreign security trades is not the current value as of the close of the NYSE. Foreign securities’ prices meeting the approved degree of certainty that the price is not reflective of current value will be priced at the indication of fair value from the independent pricing service. Multiple factors may be considered by the independent pricing service in determining adjustments to reflect fair value and may include information relating to sector indices, American Depositary Receipts and domestic and foreign index futures. Foreign securities may have additional risks including exchange rate changes, potential for sharply devalued currencies and high inflation, political and economic upheaval, the relative lack of issuer information, relatively low market liquidity and the potential lack of strict financial and accounting controls and standards.
Securities for which market prices are not provided by any of the above methods may be valued based upon quotes furnished by independent sources. The last bid price may be used to value equity securities. The mean between the last bid and ask prices is used to value debt obligations, including corporate loans.
Securities for which market quotations are not readily available or became unreliable are valued at fair value as determined in good faith by or under the supervision of the Trust’s officers following procedures approved by the Board of Trustees. Issuer specific events, market trends, bid/ask quotes of brokers and information providers and other market data may be reviewed in the course of making a good faith determination of a security’s fair value.
The Fund may invest in securities that are subject to interest rate risk, meaning the risk that the prices will generally fall as interest rates rise and, conversely, the prices will generally rise as interest rates fall. Specific securities differ in their sensitivity to changes in interest rates depending on their individual characteristics. Changes in interest rates may result in increased market volatility, which may affect the value and/or liquidity of certain of the Fund’s investments.
Valuations change in response to many factors including the historical and prospective earnings of the issuer, the value of the issuer’s assets, general economic conditions, interest rates, investor perceptions and market liquidity. Because of the inherent uncertainties of valuation, the values reflected in the financial statements may materially differ from the value received upon actual sale of those investments.
| B. | Securities Transactions and Investment Income — Securities transactions are accounted for on a trade date basis. Realized gains or losses on sales are computed on the basis of specific identification of the securities sold. Interest income (net of withholding tax, if any) is recorded on the accrual basis from settlement date. Dividend income (net of withholding tax, if any) is recorded on the ex-dividend date. |
The Fund may periodically participate in litigation related to Fund investments. As such, the Fund may receive proceeds from litigation settlements. Any proceeds received are included in the Statement of Operations as realized gain (loss) for investments no longer held and as unrealized gain (loss) for investments still held.
Brokerage commissions and mark ups are considered transaction costs and are recorded as an increase to the cost basis of securities purchased and/or a reduction of proceeds on a sale of securities. Such transaction costs are included in the determination of net realized and
15 Invesco Small Cap Growth Fund
unrealized gain (loss) from investment securities reported in the Statement of Operations and the Statement of Changes in Net Assets and the net realized and unrealized gains (losses) on securities per share in the Financial Highlights. Transaction costs are included in the calculation of the Fund’s net asset value and, accordingly, they reduce the Fund’s total returns. These transaction costs are not considered operating expenses and are not reflected in net investment income reported in the Statement of Operations and Statement of Changes in Net Assets, or the net investment income per share and ratios of expenses and net investment income reported in the Financial Highlights, nor are they limited by any expense limitation arrangements between the Fund and the investment adviser.
The Fund allocates income and realized and unrealized capital gains and losses to a class based on the relative net assets of each class.
| C. | Country Determination — For the purposes of making investment selection decisions and presentation in the Schedule of Investments, the investment adviser may determine the country in which an issuer is located and/or credit risk exposure based on various factors. These factors include the laws of the country under which the issuer is organized, where the issuer maintains a principal office, the country in which the issuer derives 50% or more of its total revenues and the country that has the primary market for the issuer’s securities, as well as other criteria. Among the other criteria that may be evaluated for making this determination are the country in which the issuer maintains 50% or more of its assets, the type of security, financial guarantees and enhancements, the nature of the collateral and the sponsor organization. Country of issuer and/or credit risk exposure has been determined to be the United States of America, unless otherwise noted. |
| D. | Distributions — Distributions from net investment income and net realized capital gain, if any, are generally declared and paid annually and recorded on the ex-dividend date. The Fund may elect to treat a portion of the proceeds from redemptions as distributions for federal income tax purposes. |
| E. | Federal Income Taxes — The Fund intends to comply with the requirements of Subchapter M of the Internal Revenue Code of 1986, as amended (the “Internal Revenue Code”), necessary to qualify as a regulated investment company and to distribute substantially all of the Fund’s taxable earnings to shareholders. As such, the Fund will not be subject to federal income taxes on otherwise taxable income (including net realized capital gain) that is distributed to shareholders. Therefore, no provision for federal income taxes is recorded in the financial statements. |
The Fund recognizes the tax benefits of uncertain tax positions only when the position is more likely than not to be sustained. Management has analyzed the Fund’s uncertain tax positions and concluded that no liability for unrecognized tax benefits should be recorded related to uncertain tax positions. Management is not aware of any tax positions for which it is reasonably possible that the total amounts of unrecognized tax benefits will change materially in the next 12 months.
The Fund files tax returns in the U.S. Federal jurisdiction and certain other jurisdictions. Generally, the Fund is subject to examinations by such taxing authorities for up to three years after the filing of the return for the tax period.
| F. | Expenses — Fees provided for under the Rule 12b-1 plan of a particular class of the Fund are charged to the operations of such class. Transfer agency fees and expenses and other shareholder recordkeeping fees and expenses attributable to Class R5 and Class R6 are allocated to each share class based on relative net assets. Sub-accounting fees attributable to Class R5 are charged to the operations of the class. Transfer agency fees and expenses and other shareholder recordkeeping fees and expenses relating to all other classes are allocated among those classes based on relative net assets. All other expenses are allocated among the classes based on relative net assets. |
| G. | Accounting Estimates — The preparation of financial statements in conformity with accounting principles generally accepted in the United States of America (“GAAP”) requires management to make estimates and assumptions that affect the reported amounts of assets and liabilities at the date of the financial statements and the reported amounts of revenues and expenses during the reporting period including estimates and assumptions related to taxation. Actual results could differ from those estimates by a significant amount. In addition, the Fund monitors for material events or transactions that may occur or become known after the period-end date and before the date the financial statements are released to print. |
| H. | Indemnifications — Under the Trust’s organizational documents, each Trustee, officer, employee or other agent of the Trust is indemnified against certain liabilities that may arise out of the performance of their duties to the Fund. Additionally, in the normal course of business, the Fund enters into contracts, including the Fund’s servicing agreements, that contain a variety of indemnification clauses. The Fund’s maximum exposure under these arrangements is unknown as this would involve future claims that may be made against the Fund that have not yet occurred. The risk of material loss as a result of such indemnification claims is considered remote. |
| I. | Securities Lending — The Fund may lend portfolio securities having a market value up to one-third of the Fund’s total assets. Such loans are secured by collateral equal to no less than the market value of the loaned securities determined daily by the securities lending provider. Such collateral will be cash or debt securities issued or guaranteed by the U.S. Government or any of its sponsored agencies. Cash collateral received in connection with these loans is invested in short-term money market instruments or affiliated money market funds and is shown as such on the Schedule of Investments. It is the Fund’s policy to obtain additional collateral from or return excess collateral to the borrower by the end of the next business day, following the valuation date of the securities loaned. Therefore, the value of the collateral held may be temporarily less than the value of the securities on loan. Lending securities entails a risk of loss to the Fund if, and to the extent that, the market value of the securities loaned were to increase and the borrower did not increase the collateral accordingly, and the borrower failed to return the securities. Upon the failure of the borrower to return the securities, collateral may be liquidated and the securities may be purchased on the open market to replace the loaned securities. The Fund could experience delays and costs in gaining access to the collateral. The Fund bears the risk of any deficiency in the amount of the collateral available for return to the borrower due to any loss on the collateral invested. Dividends received on cash collateral investments for securities lending transactions, which are net of compensation to counterparties, is included in Dividends from affiliated money market funds on the Statement of Operations. The aggregate value of securities out on loan is shown as a footnote on the Statement of Assets and Liabilities, if any. |
16 Invesco Small Cap Growth Fund
NOTE 2—Advisory Fees and Other Fees Paid to Affiliates
The Trust has entered into a master investment advisory agreement with Invesco Advisers, Inc. (the “Adviser” or “Invesco”). Under the terms of the investment advisory agreement, the Fund pays an advisory fee to the Adviser based on the annual rate of the Fund’s average daily net assets as follows:
| Average Daily Net Assets | Rate | |||||
First $500 million | 0 | .725% | ||||
Next $500 million | 0 | .70% | ||||
Next $500 million | 0 | .675% | ||||
Over $1.5 billion | 0 | .65% | ||||
For the year ended December 31, 2014, the effective advisory fees incurred by the Fund was 0.68%.
Under the terms of a master sub-advisory agreement between the Adviser and each of Invesco Asset Management Deutschland GmbH, Invesco Asset Management Limited, Invesco Asset Management (Japan) Limited, Invesco Australia Limited, Invesco Hong Kong Limited, Invesco Senior Secured Management, Inc. and Invesco Canada Ltd. (collectively, the “Affiliated Sub-Advisers”) the Adviser, not the Fund, may pay 40% of the fees paid to the Adviser to any such Affiliated Sub-Adviser(s) that provide(s) discretionary investment management services to the Fund based on the percentage of assets allocated to such Sub-Adviser(s).
The Adviser has contractually agreed, through at least June 30, 2015, to waive advisory fees and/or reimburse expenses of all shares to the extent necessary to limit total annual fund operating expenses after fee waiver and/or expense reimbursement (excluding certain items discussed below) of Class A, Class B, Class C, Class R, Class Y, Investor Class, Class R5 and Class R6 shares to 2.00%, 2.75%, 2.75%, 2.25%, 1.75%, 2.00%, 1.75% and 1.75%, respectively, of average daily net assets. In determining the Adviser’s obligation to waive advisory fees and/or reimburse expenses, the following expenses are not taken into account, and could cause the total annual fund operating expenses after fee waiver and/or expense reimbursement to exceed the numbers reflected above: (1) interest; (2) taxes; (3) dividend expense on short sales; (4) extraordinary or non-routine items, including litigation expenses; and (5) expenses that the Fund has incurred but did not actually pay because of an expense offset arrangement. Unless Invesco continues the fee waiver agreement, it will terminate on June 30, 2015. The fee waiver agreement cannot be terminated during its term. The Adviser did not waive fees and/or reimburse expenses during the period under this expense limitation.
Further, the Adviser has contractually agreed, through at least June 30, 2016, to waive the advisory fee payable by the Fund in an amount equal to 100% of the net advisory fees the Adviser receives from the affiliated money market funds on investments by the Fund of uninvested cash (excluding investments of cash collateral from securities lending) in such affiliated money market funds.
For the year ended December 31, 2014, the Adviser waived advisory fees of $72,207.
The Trust has entered into a master administrative services agreement with Invesco pursuant to which the Fund has agreed to pay Invesco for certain administrative costs incurred in providing accounting services to the Fund. For the year ended December 31, 2014, expenses incurred under the agreement are shown in the Statement of Operations as Administrative services fees.
The Trust has entered into a transfer agency and service agreement with Invesco Investment Services, Inc. (“IIS”) pursuant to which the Fund has agreed to pay IIS a fee for providing transfer agency and shareholder services to the Fund and reimburse IIS for certain expenses incurred by IIS in the course of providing such services. IIS may make payments to intermediaries that provide omnibus account services, sub-accounting services and/or networking services. All fees payable by IIS to intermediaries that provide omnibus account services or sub-accounting are charged back to the Fund, subject to certain limitations approved by the Trust’s Board of Trustees. For the year ended December 31, 2014, expenses incurred under the agreement are shown in the Statement of Operations as Transfer agent fees.
The Trust has entered into master distribution agreements with Invesco Distributors, Inc. (“IDI”) to serve as the distributor for the Class A, Class B, Class C, Class R, Class Y, Investor Class, Class R5 and Class R6 shares of the Fund. The Trust has adopted plans pursuant to Rule 12b-1 under the 1940 Act with respect to the Fund’s Class A, Class B, Class C, Class R and Investor Class shares (collectively, the “Plans”). The Fund, pursuant to the Plans, pays IDI compensation at the annual rate of 0.25% of the Fund’s average daily net assets of Class A shares, 1.00% of the average daily net assets of Class B and Class C shares and 0.50% of the average daily net assets of Class R shares. The Fund, pursuant to the Investor Class Plan, reimburses IDI for its allocated share of expenses incurred pursuant to the Investor Class Plan for the period, up to a maximum annual rate of 0.25% of the average daily net assets of Investor Class shares. Of the Plan payments, up to 0.25% of the average daily net assets of each class of shares may be paid to furnish continuing personal shareholder services to customers who purchase and own shares of such classes. Any amounts not paid as a service fee under the Plans would constitute an asset-based sales charge. Rules of the Financial Industry Regulatory Authority (“FINRA”) impose a cap on the total sales charges, including asset-based sales charges, that may be paid by any class of shares of the Fund. For the year ended December 31, 2014, expenses incurred under the Plans are shown in the Statement of Operations as Distribution fees.
Front-end sales commissions and CDSC (collectively, the “sales charges”) are not recorded as expenses of the Fund. Front-end sales commissions are deducted from proceeds from the sales of Fund shares prior to investment in Class A shares of the Fund. CDSC are deducted from redemption proceeds prior to remittance to the shareholder. During the year ended December 31, 2014, IDI advised the Fund that IDI retained $8,359 in front-end sales commissions from the sale of Class A shares and $36, $774 and $206 from Class A, Class B and Class C shares, respectively, for CDSC imposed on redemptions by shareholders.
For the year ended December 31, 2014, the Fund incurred $18,713 in brokerage commissions with Invesco Capital Markets, Inc., an affiliate of the Adviser and IDI, for portfolio transactions executed on behalf of the Fund.
Certain officers and trustees of the Trust are officers and directors of the Adviser, IIS and/or IDI.
17 Invesco Small Cap Growth Fund
NOTE 3—Additional Valuation Information
GAAP defines fair value as the price that would be received to sell an asset or paid to transfer a liability in an orderly transaction between market participants at the measurement date, under current market conditions. GAAP establishes a hierarchy that prioritizes the inputs to valuation methods, giving the highest priority to readily available unadjusted quoted prices in an active market for identical assets (Level 1) and the lowest priority to significant unobservable inputs (Level 3), generally when market prices are not readily available or are unreliable. Based on the valuation inputs, the securities or other investments are tiered into one of three levels. Changes in valuation methods may result in transfers in or out of an investment’s assigned level:
| Level 1 — | Prices are determined using quoted prices in an active market for identical assets. |
| Level 2 — | Prices are determined using other significant observable inputs. Observable inputs are inputs that other market participants may use in pricing a security. These may include quoted prices for similar securities, interest rates, prepayment speeds, credit risk, yield curves, loss severities, default rates, discount rates, volatilities and others. |
| Level 3 — | Prices are determined using significant unobservable inputs. In situations where quoted prices or observable inputs are unavailable (for example, when there is little or no market activity for an investment at the end of the period), unobservable inputs may be used. Unobservable inputs reflect the Fund’s own assumptions about the factors market participants would use in determining fair value of the securities or instruments and would be based on the best available information. |
As of December 31, 2014, all of the securities in this Fund were valued based on Level 1 inputs (see the Schedule of Investments for security categories). The level assigned to the securities valuations may not be an indication of the risk or liquidity associated with investing in those securities. Because of the inherent uncertainties of valuation, the values reflected in the financial statements may materially differ from the value received upon actual sale of those investments.
NOTE 4—Security Transactions with Affiliated Funds
The Fund is permitted to purchase or sell securities from or to certain other Invesco Funds under specified conditions outlined in procedures adopted by the Board of Trustees of the Trust. The procedures have been designed to ensure that any purchase or sale of securities by the Fund from or to another fund or portfolio that is or could be considered an affiliate by virtue of having a common investment adviser (or affiliated investment advisers), common Trustees and/or common officers complies with Rule 17a-7 of the 1940 Act. Further, as defined under the procedures, each transaction is effected at the current market price. Pursuant to these procedures, for the year ended December 31, 2014, the Fund engaged in securities purchases of $2,861,435 and securities sales of $51,783,806, which resulted in net realized gains of $15,831,286.
NOTE 5—Expense Offset Arrangement(s)
The expense offset arrangement is comprised of transfer agency credits which result from balances in demand deposit accounts used by the transfer agent for clearing shareholder transactions. For the year ended December 31, 2014, the Fund received credits from this arrangement, which resulted in the reduction of the Fund’s total expenses of $2,277.
NOTE 6—Trustees’ and Officers’ Fees and Benefits
Trustees’ and Officers’ Fees and Benefits include amounts accrued by the Fund to pay remuneration to certain Trustees and Officers of the Fund. Trustees have the option to defer compensation payable by the Fund, and Trustees’ and Officers’ Fees and Benefits also include amounts accrued by the Fund to fund such deferred compensation amounts. Those Trustees who defer compensation have the option to select various Invesco Funds in which their deferral accounts shall be deemed to be invested. Finally, certain current Trustees were eligible to participate in a retirement plan that provided for benefits to be paid upon retirement to Trustees over a period of time based on the number of years of service. The Fund may have certain former Trustees who also participate in a retirement plan and receive benefits under such plan. Trustees’ and Officers’ Fees and Benefits include amounts accrued by the Fund to fund such retirement benefits. Obligations under the deferred compensation and retirement plans represent unsecured claims against the general assets of the Fund.
NOTE 7—Cash Balances
The Fund is permitted to temporarily carry a negative or overdrawn balance in its account with State Street Bank and Trust Company, the custodian bank. Such balances, if any at period end, are shown in the Statement of Assets and Liabilities under the payable caption Amount due custodian. To compensate the custodian bank for such overdrafts, the overdrawn Fund may either (1) leave funds as a compensating balance in the account so the custodian bank can be compensated by earning the additional interest; or (2) compensate by paying the custodian bank at a rate agreed upon by the custodian bank and Invesco, not to exceed the contractually agreed upon rate.
18 Invesco Small Cap Growth Fund
NOTE 8—Distributions to Shareholders and Tax Components of Net Assets
Tax Character of Distributions to Shareholders Paid During the Fiscal Years Ended December 31, 2014 and 2013:
| 2014 | 2013 | |||||||
Ordinary income | $ | 47,657,569 | $ | 22,557,611 | ||||
Long-term capital gain | 301,686,512 | 98,957,603 | ||||||
Total distributions | $ | 349,344,081 | $ | 121,515,214 | ||||
Tax Components of Net Assets at Period-End:
| 2014 | ||||
Undistributed long-term gain | $ | 33,599,350 | ||
Net unrealized appreciation — investments | 801,616,262 | |||
Temporary book/tax differences | (373,585 | ) | ||
Post-October deferrals | (179,541 | ) | ||
Shares of beneficial interest | 1,503,712,766 | |||
Total net assets | $ | 2,338,375,252 | ||
The difference between book-basis and tax-basis unrealized appreciation (depreciation) is due to differences in the timing of recognition of gains and losses on investments for tax and book purposes. The Fund’s net unrealized appreciation difference is attributable primarily to wash sales.
The temporary book/tax differences are a result of timing differences between book and tax recognition of income and/or expenses. The Fund’s temporary book/tax differences are the result of the trustee deferral of compensation and retirement plan benefits.
Capital loss carryforward is calculated and reported as of a specific date. Results of transactions and other activity after that date may affect the amount of capital loss carryforward actually available for the Fund to utilize. Capital losses generated in years beginning after December 22, 2010 can be carried forward for an unlimited period, whereas previous losses expire in eight tax years. Capital losses with an expiration period may not be used to offset capital gains until all net capital losses without an expiration date have been utilized. Capital loss carryforwards with no expiration date will retain their character as either short-term or long-term capital losses instead of as short-term capital losses as under prior law. The ability to utilize capital loss carryforwards in the future may be limited under the Internal Revenue Code and related regulations based on the results of future transactions.
The Fund does not have a capital loss carryforward as of December 31, 2014.
NOTE 9—Investment Securities
The aggregate amount of investment securities (other than short-term securities, U.S. Treasury obligations and money market funds, if any) purchased and sold by the Fund during the year ended December 31, 2014 was $640,434,166 and $816,109,697, respectively. Cost of investments on a tax basis includes the adjustments for financial reporting purposes as of the most recently completed federal income tax reporting period-end.
| Unrealized Appreciation (Depreciation) of Investment Securities on a Tax Basis | ||||
Aggregate unrealized appreciation of investment securities | $ | 862,642,664 | ||
Aggregate unrealized (depreciation) of investment securities | (61,026,402 | ) | ||
Net unrealized appreciation of investment securities | $ | 801,616,262 | ||
Cost of investments for tax purposes is $1,625,337,090.
NOTE 10—Reclassification of Permanent Differences
Primarily as a result of differing book/tax treatment of net operating losses, on December 31, 2014, undistributed net investment income (loss) was increased by $2,175,504 and undistributed net realized gain was decreased by $2,175,504. This reclassification had no effect on the net assets of the Fund.
19 Invesco Small Cap Growth Fund
NOTE 11—Share Information
| Summary of Share Activity | ||||||||||||||||
| Years ended December 31, | ||||||||||||||||
| 2014(a) | 2013 | |||||||||||||||
| Shares | Amount | Shares | Amount | |||||||||||||
Sold: | ||||||||||||||||
Class A | 3,533,450 | $ | 141,316,020 | 4,961,797 | $ | 176,236,513 | ||||||||||
Class B | 5,453 | 180,080 | 8,085 | 241,333 | ||||||||||||
Class C | 50,523 | 1,622,011 | 66,257 | 1,931,678 | ||||||||||||
Class R | 774,796 | 29,770,436 | 985,949 | 34,141,640 | ||||||||||||
Class Y | 1,190,168 | 46,481,889 | 872,999 | 31,874,733 | ||||||||||||
Investor Class | 869,200 | 36,059,734 | 1,133,772 | 41,267,610 | ||||||||||||
Class R5 | 7,804,908 | 343,256,765 | 4,792,353 | 178,660,210 | ||||||||||||
Class R6 | 1,140,068 | 48,733,723 | 2,860,247 | 107,479,821 | ||||||||||||
Issued as reinvestment of dividends: | ||||||||||||||||
Class A | 3,168,434 | 110,293,199 | 1,325,013 | 50,204,805 | ||||||||||||
Class B | 27,325 | 734,788 | 10,957 | 338,224 | ||||||||||||
Class C | 146,297 | 3,926,603 | 43,878 | 1,352,764 | ||||||||||||
Class R | 530,178 | 17,548,901 | 158,194 | 5,761,415 | ||||||||||||
Class Y | 371,251 | 13,153,419 | 95,473 | 3,663,312 | ||||||||||||
Investor Class | 1,128,040 | 40,778,642 | 357,615 | 13,993,469 | ||||||||||||
Class R5 | 3,581,094 | 135,544,419 | 949,647 | 38,479,691 | ||||||||||||
Class R6 | 521,364 | 19,764,901 | 121,073 | 4,908,298 | ||||||||||||
Automatic conversion of Class B shares to Class A shares: | ||||||||||||||||
Class A | 32,411 | 1,300,240 | 41,095 | 1,447,293 | ||||||||||||
Class B | (40,099 | ) | (1,300,240 | ) | (49,721 | ) | (1,447,293 | ) | ||||||||
Reacquired: | ||||||||||||||||
Class A | (11,099,217 | ) | (451,450,395 | ) | (7,759,244 | ) | (277,338,554 | ) | ||||||||
Class B | (18,907 | ) | (619,599 | ) | (33,031 | ) | (966,228 | ) | ||||||||
Class C | (115,926 | ) | (3,751,163 | ) | (144,668 | ) | (4,215,168 | ) | ||||||||
Class R | (925,648 | ) | (35,442,061 | ) | (1,364,659 | ) | (46,165,584 | ) | ||||||||
Class Y | (504,562 | ) | (20,597,502 | ) | (292,245 | ) | (10,757,738 | ) | ||||||||
Investor Class | (1,380,628 | ) | (57,326,295 | ) | (1,399,378 | ) | (51,361,452 | ) | ||||||||
Class R5 | (4,950,996 | ) | (210,947,723 | ) | (6,829,713 | ) | (255,359,197 | ) | ||||||||
Class R6 | (861,258 | ) | (37,002,625 | ) | (234,362 | ) | (9,502,743 | ) | ||||||||
Net increase in share activity | 4,977,719 | $ | 172,028,167 | 677,383 | $ | 34,868,852 | ||||||||||
| (a) | There are entities that are record owners of more than 5% of the outstanding shares of the Fund and in the aggregate own 33% of the outstanding shares of the Fund. IDI has an agreement with these entities to sell Fund shares. The Fund, Invesco and/or Invesco affiliates may make payments to these entities, which are considered to be related to the Fund, for providing services to the Fund, Invesco and/or Invesco affiliates including but not limited to services such as securities brokerage, distribution, third party record keeping and account servicing. The Fund has no knowledge as to whether all or any portion of the shares owned of record by these entities are also owned beneficially. |
20 Invesco Small Cap Growth Fund
NOTE 12—Financial Highlights
The following schedule presents financial highlights for a share of the Fund outstanding throughout the periods indicated.
| Net asset value, beginning of period | Net investment income (loss)(a) | Net gains (losses) on securities (both realized and unrealized) | Total from investment operations | Dividends from net investment income | Distributions from net realized gains | Total distributions | Net asset value, end of period | Total return(b) | Net assets, end of period (000’s omitted) | Ratio of expenses to average net assets with fee waivers and/or expenses absorbed | Ratio of expenses to average net assets without fee waivers and/or expenses absorbed | Ratio of net investment income (loss) to average net assets | Portfolio turnover(c) | |||||||||||||||||||||||||||||||||||||||||||
Class A |
| |||||||||||||||||||||||||||||||||||||||||||||||||||||||
Year ended 12/31/14 | $ | 39.68 | $ | (0.10 | ) | $ | 2.93 | $ | 2.83 | $ | — | $ | (6.56 | ) | $ | (6.56 | ) | $ | 35.95 | 7.67 | % | $ | 710,426 | 1.22 | %(d) | 1.22 | %(d) | (0.25 | )%(d) | 28 | % | |||||||||||||||||||||||||
Year ended 12/31/13 | 30.00 | (0.15 | ) | 12.02 | 11.87 | (0.02 | ) | (2.17 | ) | (2.19 | ) | 39.68 | 39.90 | 957,432 | 1.21 | 1.21 | (0.41 | ) | 19 | |||||||||||||||||||||||||||||||||||||
Year ended 12/31/12 | 27.71 | 0.01 | (e) | 5.01 | 5.02 | — | (2.73 | ) | (2.73 | ) | 30.00 | 18.35 | 766,787 | 1.23 | 1.23 | 0.04 | (e) | 24 | ||||||||||||||||||||||||||||||||||||||
Year ended 12/31/11 | 28.59 | (0.19 | ) | (0.17 | ) | (0.36 | ) | — | (0.52 | ) | (0.52 | ) | 27.71 | (1.27 | ) | 829,696 | 1.27 | 1.27 | (0.65 | ) | 38 | |||||||||||||||||||||||||||||||||||
Year ended 12/31/10 | 22.64 | (0.15 | ) | 6.10 | 5.95 | — | — | — | 28.59 | 26.28 | 933,268 | 1.25 | 1.25 | (0.62 | ) | 38 | ||||||||||||||||||||||||||||||||||||||||
Class B | ||||||||||||||||||||||||||||||||||||||||||||||||||||||||
Year ended 12/31/14 | 32.31 | (0.32 | ) | 2.33 | 2.01 | — | (6.56 | ) | (6.56 | ) | 27.76 | 6.87 | 3,876 | 1.97 | (d) | 1.97 | (d) | (1.00 | )(d) | 28 | ||||||||||||||||||||||||||||||||||||
Year ended 12/31/13 | 24.90 | (0.34 | ) | 9.92 | 9.58 | — | (2.17 | ) | (2.17 | ) | 32.31 | 38.87 | 5,360 | 1.96 | 1.96 | (1.16 | ) | 19 | ||||||||||||||||||||||||||||||||||||||
Year ended 12/31/12 | 23.58 | (0.18 | )(e) | 4.23 | 4.05 | — | (2.73 | ) | (2.73 | ) | 24.90 | 17.44 | 5,717 | 1.98 | 1.98 | (0.71 | )(e) | 24 | ||||||||||||||||||||||||||||||||||||||
Year ended 12/31/11 | 24.59 | (0.36 | ) | (0.13 | ) | (0.49 | ) | — | (0.52 | ) | (0.52 | ) | 23.58 | (2.01 | ) | 7,572 | 2.02 | 2.02 | (1.40 | ) | 38 | |||||||||||||||||||||||||||||||||||
Year ended 12/31/10 | 19.62 | (0.28 | ) | 5.25 | 4.97 | — | — | — | 24.59 | 25.33 | 12,195 | 2.00 | 2.00 | (1.37 | ) | 38 | ||||||||||||||||||||||||||||||||||||||||
Class C | ||||||||||||||||||||||||||||||||||||||||||||||||||||||||
Year ended 12/31/14 | 32.27 | (0.32 | ) | 2.32 | 2.00 | — | (6.56 | ) | (6.56 | ) | 27.71 | 6.85 | 20,957 | 1.97 | (d) | 1.97 | (d) | (1.00 | )(d) | 28 | ||||||||||||||||||||||||||||||||||||
Year ended 12/31/13 | 24.87 | (0.34 | ) | 9.91 | 9.57 | — | (2.17 | ) | (2.17 | ) | 32.27 | 38.88 | 21,794 | 1.96 | 1.96 | (1.16 | ) | 19 | ||||||||||||||||||||||||||||||||||||||
Year ended 12/31/12 | 23.55 | (0.18 | )(e) | 4.23 | 4.05 | — | (2.73 | ) | (2.73 | ) | 24.87 | 17.46 | 17,657 | 1.98 | 1.98 | (0.71 | )(e) | 24 | ||||||||||||||||||||||||||||||||||||||
Year ended 12/31/11 | 24.56 | (0.36 | ) | (0.13 | ) | (0.49 | ) | — | (0.52 | ) | (0.52 | ) | 23.55 | (2.01 | ) | 17,851 | 2.02 | 2.02 | (1.40 | ) | 38 | |||||||||||||||||||||||||||||||||||
Year ended 12/31/10 | 19.59 | (0.28 | ) | 5.25 | 4.97 | — | — | — | 24.56 | 25.37 | 21,201 | 2.00 | 2.00 | (1.37 | ) | 38 | ||||||||||||||||||||||||||||||||||||||||
Class R | ||||||||||||||||||||||||||||||||||||||||||||||||||||||||
Year ended 12/31/14 | 38.13 | (0.19 | ) | 2.80 | 2.61 | — | (6.56 | ) | (6.56 | ) | 34.18 | 7.40 | 108,855 | 1.47 | (d) | 1.47 | (d) | (0.50 | )(d) | 28 | ||||||||||||||||||||||||||||||||||||
Year ended 12/31/13 | 28.95 | (0.23 | ) | 11.58 | 11.35 | — | (2.17 | ) | (2.17 | ) | 38.13 | 39.55 | 106,983 | 1.46 | 1.46 | (0.66 | ) | 19 | ||||||||||||||||||||||||||||||||||||||
Year ended 12/31/12 | 26.89 | (0.06 | )(e) | 4.85 | 4.79 | — | (2.73 | ) | (2.73 | ) | 28.95 | 18.05 | 87,606 | 1.48 | 1.48 | (0.21 | )(e) | 24 | ||||||||||||||||||||||||||||||||||||||
Year ended 12/31/11 | 27.83 | (0.26 | ) | (0.16 | ) | (0.42 | ) | — | (0.52 | ) | (0.52 | ) | 26.89 | (1.52 | ) | 70,749 | 1.52 | 1.52 | (0.90 | ) | 38 | |||||||||||||||||||||||||||||||||||
Year ended 12/31/10 | 22.09 | (0.20 | ) | 5.94 | 5.74 | — | — | — | 27.83 | 25.98 | 67,464 | 1.50 | 1.50 | (0.87 | ) | 38 | ||||||||||||||||||||||||||||||||||||||||
Class Y | ||||||||||||||||||||||||||||||||||||||||||||||||||||||||
Year ended 12/31/14 | 40.18 | 0.00 | 2.98 | 2.98 | — | (6.56 | ) | (6.56 | ) | 36.60 | 7.95 | 105,194 | 0.97 | (d) | 0.97 | (d) | 0.00 | (d) | 28 | |||||||||||||||||||||||||||||||||||||
Year ended 12/31/13 | 30.33 | (0.06 | ) | 12.16 | 12.10 | (0.08 | ) | (2.17 | ) | (2.25 | ) | 40.18 | 40.24 | 73,035 | 0.96 | 0.96 | (0.16 | ) | 19 | |||||||||||||||||||||||||||||||||||||
Year ended 12/31/12 | 27.93 | 0.09 | (e) | 5.05 | 5.14 | (0.01 | ) | (2.73 | ) | (2.74 | ) | 30.33 | 18.64 | 34,616 | 0.98 | 0.98 | 0.29 | (e) | 24 | |||||||||||||||||||||||||||||||||||||
Year ended 12/31/11 | 28.73 | (0.12 | ) | (0.16 | ) | (0.28 | ) | — | (0.52 | ) | (0.52 | ) | 27.93 | (0.99 | ) | 8,108 | 1.02 | 1.02 | (0.40 | ) | 38 | |||||||||||||||||||||||||||||||||||
Year ended 12/31/10 | 22.70 | (0.09 | ) | 6.12 | 6.03 | — | — | — | 28.73 | 26.56 | 6,245 | 1.00 | 1.00 | (0.37 | ) | 38 | ||||||||||||||||||||||||||||||||||||||||
Investor Class | ||||||||||||||||||||||||||||||||||||||||||||||||||||||||
Year ended 12/31/14 | 40.97 | (0.10 | ) | 3.03 | 2.93 | — | (6.56 | ) | (6.56 | ) | 37.34 | 7.67 | 279,828 | 1.22 | (d) | 1.22 | (d) | (0.25 | )(d) | 28 | ||||||||||||||||||||||||||||||||||||
Year ended 12/31/13 | 30.92 | (0.15 | ) | 12.39 | 12.24 | (0.02 | ) | (2.17 | ) | (2.19 | ) | 40.97 | 39.92 | 281,811 | 1.21 | 1.21 | (0.41 | ) | 19 | |||||||||||||||||||||||||||||||||||||
Year ended 12/31/12 | 28.49 | 0.01 | (e) | 5.15 | 5.16 | — | (2.73 | ) | (2.73 | ) | 30.92 | 18.34 | 209,842 | 1.23 | 1.23 | 0.04 | (e) | 24 | ||||||||||||||||||||||||||||||||||||||
Year ended 12/31/11 | 29.37 | (0.20 | ) | (0.16 | ) | (0.36 | ) | — | (0.52 | ) | (0.52 | ) | 28.49 | (1.24 | ) | 209,381 | 1.27 | 1.27 | (0.65 | ) | 38 | |||||||||||||||||||||||||||||||||||
Year ended 12/31/10 | 23.26 | (0.15 | ) | 6.26 | 6.11 | — | — | — | 29.37 | 26.27 | 230,909 | 1.25 | 1.25 | (0.62 | ) | 38 | ||||||||||||||||||||||||||||||||||||||||
Class R5 | ||||||||||||||||||||||||||||||||||||||||||||||||||||||||
Year ended 12/31/14 | 42.44 | 0.07 | 3.15 | 3.22 | — | (6.56 | ) | (6.56 | ) | 39.10 | 8.09 | 970,303 | 0.82 | (d) | 0.82 | (d) | 0.15 | (d) | 28 | |||||||||||||||||||||||||||||||||||||
Year ended 12/31/13 | 31.92 | (0.01 | ) | 12.82 | 12.81 | (0.12 | ) | (2.17 | ) | (2.29 | ) | 42.44 | 40.46 | 780,094 | 0.83 | 0.83 | (0.03 | ) | 19 | |||||||||||||||||||||||||||||||||||||
Year ended 12/31/12 | 29.27 | 0.14 | (e) | 5.29 | 5.43 | (0.05 | ) | (2.73 | ) | (2.78 | ) | 31.92 | 18.77 | 621,522 | 0.83 | 0.83 | 0.44 | (e) | 24 | |||||||||||||||||||||||||||||||||||||
Year ended 12/31/11 | 30.03 | (0.06 | ) | (0.18 | ) | (0.24 | ) | — | (0.52 | ) | (0.52 | ) | 29.27 | (0.81 | ) | 501,895 | 0.83 | 0.83 | (0.21 | ) | 38 | |||||||||||||||||||||||||||||||||||
Year ended 12/31/10 | 23.68 | (0.05 | ) | 6.40 | 6.35 | — | — | — | 30.03 | 26.82 | 427,893 | 0.82 | 0.82 | (0.19 | ) | 38 | ||||||||||||||||||||||||||||||||||||||||
Class R6 | ||||||||||||||||||||||||||||||||||||||||||||||||||||||||
Year ended 12/31/14 | 42.46 | 0.10 | 3.17 | 3.27 | — | (6.56 | ) | (6.56 | ) | 39.17 | 8.21 | 138,937 | 0.73 | (d) | 0.73 | (d) | 0.24 | (d) | 28 | |||||||||||||||||||||||||||||||||||||
Year ended 12/31/13 | 31.92 | 0.02 | 12.81 | 12.83 | (0.12 | ) | (2.17 | ) | (2.29 | ) | 42.46 | 40.53 | 116,657 | 0.74 | 0.74 | 0.06 | 19 | |||||||||||||||||||||||||||||||||||||||
Year ended 12/31/12(f) | 34.10 | 0.05 | (e) | 0.56 | 0.61 | (0.06 | ) | (2.73 | ) | (2.79 | ) | 31.92 | 1.97 | 9 | 0.75 | (g) | 0.75 | (g) | 0.52 | (e)(g) | 24 | |||||||||||||||||||||||||||||||||||
| (a) | Calculated using average shares outstanding. |
| (b) | Includes adjustments in accordance with accounting principles generally accepted in the United States of America and as such, the net asset value for financial reporting purposes and the returns based upon those net asset values may differ from the net asset value and returns for shareholder transactions. Does not include sales charges and is not annualized for periods less than one year, if applicable. |
| (c) | Portfolio turnover is calculated at the fund level and is not annualized for periods less than one year, if applicable. |
| (d) | Ratios are based on average daily net assets (000’s omitted) of $900,191, $4,556, $21,032, $104,675, $77,724, $277,780, $791,079 and $130,776 for Class A, Class B, Class C, Class R, Class Y, Investor Class, Class R5 and Class R6 shares, respectively. |
| (e) | Net investment income (loss) per share and the ratio of net investment income (loss) to average net assets includes significant dividends received during the period. Net investment income (loss) per share and the ratio of net investment income (loss) to average net assets excluding the significant dividends are $(0.12) and (0.39)%, $(0.29) and (1.14)%, $(0.29) and (1.14)%, $(0.19) and (0.64)%, $(0.04) and (0.14)%, $(0.12) and (0.39)%, $0.01 and 0.01% and $0.01 and 0.09% for Class A, Class B, Class C, Class R, Class Y, Investor Class, Class R5 and Class R6 shares, respectively. |
| (f) | Commencement date of September 24, 2012. |
| (g) | Annualized. |
21 Invesco Small Cap Growth Fund
Report of Independent Registered Public Accounting Firm
To the Board of Trustees of AIM Funds Group (Invesco Funds Group)
and Shareholders of Invesco Small Cap Growth Fund:
In our opinion, the accompanying statement of assets and liabilities, including the schedule of investments, and the related statements of operations and of changes in net assets and the financial highlights present fairly, in all material respects, the financial position of Invesco Small Cap Growth Fund (one of the funds constituting AIM Funds Group (Invesco Funds Group), hereafter referred to as the “Fund”) at December 31, 2014, the results of its operations for the year then ended, the changes in its net assets for each of the two years in the period then ended and the financial highlights for each of the five years in the period then ended, in conformity with accounting principles generally accepted in the United States of America. These financial statements and financial highlights (hereafter referred to as “financial statements”) are the responsibility of the Fund’s management. Our responsibility is to express an opinion on these financial statements based on our audits. We conducted our audits of these financial statements in accordance with the standards of the Public Company Accounting Oversight Board (United States). Those standards require that we plan and perform the audit to obtain reasonable assurance about whether the financial statements are free of material misstatement. An audit includes examining, on a test basis, evidence supporting the amounts and disclosures in the financial statements, assessing the accounting principles used and significant estimates made by management, and evaluating the overall financial statement presentation. We believe that our audits, which included confirmation of securities at December 31, 2014 by correspondence with the custodian and brokers, and the application of alternative auditing procedures where confirmations of security purchases have not been received, provide a reasonable basis for our opinion.
PRICEWATERHOUSECOOPERS LLP
Houston, Texas
February 23, 2015
22 Invesco Small Cap Growth Fund
Calculating your ongoing Fund expenses
Example
As a shareholder of the Fund, you incur two types of costs: (1) transaction costs, which may include sales charges (loads) on purchase payments or contingent deferred sales charges on redemptions, if any; and (2) ongoing costs, including management fees, distribution and/or service (12b-1) fees, and other Fund expenses. This example is intended to help you understand your ongoing costs (in dollars) of investing in the Fund and to compare these costs with ongoing costs of investing in other mutual funds. The example is based on an investment of $1,000 invested at the beginning of the period and held for the entire period July 1, 2014 through December 31, 2014.
Actual expenses
The table below provides information about actual account values and actual expenses. You may use the information in this table, together with the amount you invested, to estimate the expenses that you paid over the period. Simply divide your account value by $1,000 (for example, an $8,600 account value divided by $1,000 = 8.6), then multiply the result by the number in the table under the heading entitled “Actual Expenses Paid During Period” to estimate the expenses you paid on your account during this period.
Hypothetical example for comparison purposes
The table below also provides information about hypothetical account values and hypothetical expenses based on the Fund’s actual expense ratio and an assumed rate of return of 5% per year before expenses, which is not the Fund’s actual return.
The hypothetical account values and expenses may not be used to estimate the actual ending account balance or expenses you paid for the period. You may use this information to compare the ongoing costs of investing in the Fund and other funds. To do so, compare this 5% hypothetical example with the 5% hypothetical examples that appear in the shareholder reports of the other funds.
Please note that the expenses shown in the table are meant to highlight your ongoing costs only and do not reflect any transaction costs, such as sales charges (loads) on purchase payments or contingent deferred sales charges on redemptions, if any. Therefore, the hypothetical information is useful in comparing ongoing costs only, and will not help you determine the relative total costs of owning different funds. In addition, if these transaction costs were included, your costs would have been higher.
| Class | Beginning Account Value (07/01/14) | ACTUAL | HYPOTHETICAL (5% annual return before | Annualized Expense Ratio | ||||||||||||||||||||
| Ending Account Value (12/31/14)1 | Expenses Paid During Period2 | Ending Account Value (12/31/14) | Expenses Paid During Period2 | |||||||||||||||||||||
| A | $ | 1,000.00 | $ | 1,028.70 | $ | 6.24 | $ | 1,019.06 | $ | 6.21 | 1.22 | % | ||||||||||||
| B | 1,000.00 | 1,024.90 | 10.05 | 1,015.27 | 10.01 | 1.97 | ||||||||||||||||||
| C | 1,000.00 | 1,024.70 | 10.05 | 1,015.27 | 10.01 | 1.97 | ||||||||||||||||||
| R | 1,000.00 | 1,027.40 | 7.51 | 1,017.80 | 7.48 | 1.47 | ||||||||||||||||||
| Y | 1,000.00 | 1,030.00 | 4.96 | 1,020.32 | 4.94 | 0.97 | ||||||||||||||||||
| Investor | 1,000.00 | 1,028.50 | 6.24 | 1,019.06 | 6.21 | 1.22 | ||||||||||||||||||
| R5 | 1,000.00 | 1,030.60 | 4.20 | 1,021.07 | 4.18 | 0.82 | ||||||||||||||||||
| R6 | 1,000.00 | 1,031.30 | 3.74 | 1,021.53 | 3.72 | 0.73 | ||||||||||||||||||
| 1 | The actual ending account value is based on the actual total return of the Fund for the period July 1, 2014 through December 31, 2014, after actual expenses and will differ from the hypothetical ending account value which is based on the Fund’s expense ratio and a hypothetical annual return of 5% before expenses. |
| 2 | Expenses are equal to the Fund’s annualized expense ratio as indicated above multiplied by the average account value over the period, multiplied by 184/365 to reflect the most recent fiscal half year. |
23 Invesco Small Cap Growth Fund
Tax Information
Form 1099-DIV, Form 1042-S and other year–end tax information provide shareholders with actual calendar year amounts that should be included in their tax returns. Shareholders should consult their tax advisors.
The following distribution information is being provided as required by the Internal Revenue Code or to meet a specific state’s requirement.
The Fund designates the following amounts or, if subsequently determined to be different, the maximum amount allowable for its fiscal year ended December 31, 2014:
Federal and State Income Tax | ||||
Long-Term Capital Gain Distributions | $ | 301,686,512 | ||
Qualified Dividend Income* | 29.25 | % | ||
Corporate Dividends Received Deduction* | 29.25 | % | ||
U.S. Treasury Obligations* | 0.00 | % | ||
| * | The above percentages are based on ordinary income dividends paid to shareholders during the Fund’s fiscal year. |
Non-Resident Alien Shareholders | ||||
Qualified Short-Term Gains | $ | 47,657,569 | ||
24 Invesco Small Cap Growth Fund
Trustees and Officers
The address of each trustee and officer is AIM Growth Series (Invesco Growth Series) (the “Trust”), 11 Greenway Plaza, Suite 1000, Houston, Texas 77046-1173. The trustees serve for the life of the Trust, subject to their earlier death, incapacitation, resignation, retirement or removal as more specifically provided in the Trust’s organizational documents. Each officer serves for a one year term or until their successors are elected and qualified. Column two below includes length of time served with predecessor entities, if any.
Name, Year of Birth and Position(s) Held with the Trust | Trustee and/ or Officer Since | Principal Occupation(s) During Past 5 Years | Number of Funds in Fund Complex Overseen by Trustee | Other Directorship(s) Held by Trustee During | ||||
| Interested Persons | ||||||||
| Martin L. Flanagan1 — 1960 Trustee | 2007 | Executive Director, Chief Executive Officer and President, Invesco Ltd. (ultimate parent of Invesco and a global investment management firm); Advisor to the Board, Invesco Advisers, Inc. (formerly known as Invesco Institutional (N.A.), Inc.); Trustee, The Invesco Funds; Vice Chair, Investment Company Institute; and Member of Executive Board, SMU Cox School of Business
Formerly: Chairman and Chief Executive Officer, Invesco Advisers, Inc. (registered investment adviser); Director, Chairman, Chief Executive Officer and President, IVZ Inc. (holding company), INVESCO Group Services, Inc. (service provider) and Invesco North American Holdings, Inc. (holding company); Director, Chief Executive Officer and President, Invesco Holding Company Limited (parent of Invesco and a global investment management firm); Director, Invesco Ltd.; Chairman, Investment Company Institute and President, Co-Chief Executive Officer, Co-President, Chief Operating Officer and Chief Financial Officer, Franklin Resources, Inc. (global investment management organization). | 144 | None | ||||
Philip A. Taylor2 — 1954 Trustee, President and Principal Executive Officer | 2006 | Head of North American Retail and Senior Managing Director, Invesco Ltd.; Director, Co-Chairman, Co-President and Co-Chief Executive Officer, Invesco Advisers, Inc. (formerly known as Invesco Institutional (N.A.), Inc.) (registered investment adviser); Director, Chairman, Chief Executive Officer and President, Invesco Management Group, Inc. (formerly known as Invesco Aim Management Group, Inc.) (financial services holding company); Director and President, INVESCO Funds Group, Inc. (registered investment adviser and registered transfer agent); Director and Chairman, Invesco Investment Services, Inc. (formerly known as Invesco Aim Investment Services, Inc.) (registered transfer agent) and IVZ Distributors, Inc. (formerly known as INVESCO Distributors, Inc.) (registered broker dealer); Director, President and Chairman, Invesco Inc. (holding company) and Invesco Canada Holdings Inc. (holding company); Chief Executive Officer, Invesco Corporate Class Inc. (corporate mutual fund company) and Invesco Canada Fund Inc. (corporate mutual fund company); Director, Chairman and Chief Executive Officer, Invesco Canada Ltd. (formerly known as Invesco Trimark Ltd./Invesco Trimark Ltèe) (registered investment adviser and registered transfer agent); Trustee, President and Principal Executive Officer, The Invesco Funds (other than AIM Treasurer’s Series Trust (Invesco Treasurer’s Series Trust) and Short-Term Investments Trust); Trustee and Executive Vice President, The Invesco Funds (AIM Treasurer’s Series Trust (Invesco Treasurer’s Series Trust) and Short-Term Investments Trust only); Director, Invesco Investment Advisers LLC (formerly known as Van Kampen Asset Management); Director, Chief Executive Officer and President, Van Kampen Exchange Corp.
Formerly: Director and Chairman, Van Kampen Investor Services Inc.; Director, Chief Executive Officer and President, 1371 Preferred Inc. (holding company) and Van Kampen Investments Inc.; Director and President, AIM GP Canada Inc. (general partner for limited partnerships) and Van Kampen Advisors, Inc.; Director and Chief Executive Officer, Invesco Trimark Dealer Inc. (registered broker dealer); Director, Invesco Distributors, Inc. (formerly known as Invesco Aim Distributors, Inc.) (registered broker dealer); Manager, Invesco PowerShares Capital Management LLC; Director, Chief Executive Officer and President, Invesco Advisers, Inc.; Director, Chairman, Chief Executive Officer and President, Invesco Aim Capital Management, Inc.; President, Invesco Trimark Dealer Inc. and Invesco Trimark Ltd./Invesco Trimark Ltèe; Director and President, AIM Trimark Corporate Class Inc. and AIM Trimark Canada Fund Inc.; Senior Managing Director, Invesco Holding Company Limited; Director and Chairman, Fund Management Company (former registered broker dealer); President and Principal Executive Officer, The Invesco Funds (AIM Treasurer’s Series Trust (Invesco Treasurer’s Series Trust), and Short-Term Investments Trust only); President, AIM Trimark Global Fund Inc. and AIM Trimark Canada Fund Inc. | 144 | None | ||||
| Independent Trustees | ||||||||
Bruce L. Crockett — 1944 Trustee and Chair | 2001 | Chairman, Crockett Technologies Associates (technology consulting company)
Formerly: Director, Captaris (unified messaging provider); Director, President and Chief Executive Officer, COMSAT Corporation; Chairman, Board of Governors of INTELSAT (international communications company); ACE Limited (insurance company); and Investment Company Institute | 144 | ALPS (Attorneys Liability Protection Society) (insurance company) |
| 1 | Mr. Flanagan is considered an interested person (within the meaning of Section 2(a)(19) of the 1940 Act) of the Trust because he is an officer of the Adviser to the Trust, and an officer and a director of Invesco Ltd., ultimate parent of the Adviser. |
| 2 | Mr. Taylor is considered an interested person (within the meaning of Section 2(a)(19) of the 1940 Act) of the Trust because he is an officer and a director of the Adviser. |
T-1 Invesco Small Cap Growth Fund
Trustees and Officers—(continued)
Name, Year of Birth and Position(s) Held with the Trust | Trustee and/ or Officer Since | Principal Occupation(s) During Past 5 Years | Number of Funds in Fund Complex Overseen by Trustee | Other Directorship(s) Held by Trustee During | ||||
| Independent Trustees—(continued) | ||||||||
David C. Arch — 1945 Trustee | 2010 | Chairman of Blistex Inc., a consumer health care products manufacturer | 144 | Board member of the Illinois Manufacturers’ Association; Member of the Board of Visitors, Institute for the Humanities, University of Michigan; Member of the Audit Committee of the Edward-Elmhurst Hospital | ||||
James T. Bunch — 1942 Trustee | 2003 | Managing Member, Grumman Hill Group LLC (family office private equity investments)
Formerly: Founder, Green Manning & Bunch Ltd. (investment banking firm) (1988-2010); Executive Committee, United States Golf Association; and Director, Policy Studies, Inc. and Van Gilder Insurance Corporation | 144 | Chairman, Board of Governors, Western Golf Association; Chairman, Evans Scholars Foundation; and Director, Denver Film Society | ||||
Rodney F. Dammeyer — 1940 Trustee | 2010 | Chairman of CAC, LLC, (private company offering capital investment and management advisory services)
Formerly: Prior to 2001, Managing Partner at Equity Group Corporate Investments; Prior to 1995, Chief Executive Officer of Itel Corporation (formerly Anixter International); Prior to 1985, experience includes Senior Vice President and Chief Financial Officer of Household International, Inc., Executive Vice President and Chief Financial Officer of Northwest Industries, Inc. and Partner of Arthur Andersen & Co.; From 1987 to 2010, Director/Trustee of investment companies in the Van Kampen Funds complex | 144 | Director of Quidel Corporation and Stericycle, Inc. | ||||
Albert R. Dowden — 1941 Trustee | 2001 | Director of a number of public and private business corporations, including the Boss Group, Ltd. (private investment and management); Nature’s Sunshine Products, Inc. and Reich & Tang Funds (5 portfolios) (registered investment company)
Formerly: Director, Homeowners of America Holding Corporation/Homeowners of America Insurance Company (property casualty company); Director, Continental Energy Services, LLC (oil and gas pipeline service); Director, CompuDyne Corporation (provider of product and services to the public security market) and Director, Annuity and Life Re (Holdings), Ltd. (reinsurance company); Director, President and Chief Executive Officer, Volvo Group North America, Inc.; Senior Vice President, AB Volvo; Director of various public and private corporations; Chairman, DHJ Media, Inc.; Director, Magellan Insurance Company; and Director, The Hertz Corporation, Genmar Corporation (boat manufacturer), National Media Corporation; Advisory Board of Rotary Power International (designer, manufacturer, and seller of rotary power engines); and Chairman, Cortland Trust, Inc. (registered investment company) | 144 | Director of: Nature’s Sunshine Products, Inc., Reich & Tang Funds, Homeowners of America Holding Corporation/ Homeowners of America Insurance Company, the Boss Group | ||||
Jack M. Fields — 1952 Trustee | 2001 | Chief Executive Officer, Twenty First Century Group, Inc. (government affairs company); Owner and Chief Executive Officer, Dos Angeles Ranch, L.P. (cattle, hunting, corporate entertainment); and Discovery Global Education Fund (non-profit)
Formerly: Chief Executive Officer, Texana Timber LP (sustainable forestry company); Director of Cross Timbers Quail Research Ranch (non-profit); and member of the U.S. House of Representatives | 144 | Insperity, Inc. (formerly known as Administaff) | ||||
Prema Mathai-Davis — 1950 Trustee | 2001 | Retired. Formerly: Chief Executive Officer, YWCA of the U.S.A. | 144 | None | ||||
Larry Soll — 1942 Trustee | 2003 | Retired. Formerly: Chairman, Chief Executive Officer and President, Synergen Corp. (a biotechnology company) | 144 | None | ||||
Hugo F. Sonnenschein — 1940 Trustee | 2010 | President Emeritus and Honorary Trustee of the University of Chicago and the Adam Smith Distinguished Service Professor in the Department of Economics at the University of Chicago. Prior to 2000, President of the University of Chicago | 144 | Trustee of the University of Rochester and a member of its investment committee; Member of the National Academy of Sciences and the American Philosophical Society; Fellow of the American Academy of Arts and Sciences | ||||
Raymond Stickel, Jr. — 1944 Trustee | 2005 | Retired. Formerly: Director, Mainstay VP Series Funds, Inc. (25 portfolios) and Partner, Deloitte & Touche | 144 | None | ||||
T-2 Invesco Small Cap Growth Fund
Trustees and Officers—(continued)
Name, Year of Birth and Position(s) Held with the Trust | Trustee and/ or Officer Since | Principal Occupation(s) During Past 5 Years | Number of Funds in Fund Complex Overseen by Trustee | Other Directorship(s) Held by Trustee During | ||||
| Independent Trustees—(continued) | ||||||||
Suzanne H. Woolsey — 1941 Trustee | 2014 | Chief Executive Officer of Woolsey Partners LLC | 144 | Emeritus Chair of the Board of Trustees of the Institute for Defense Analyses; Trustee of Colorado College; Trustee of California Institute of Technology; Prior to 2014, Director of Fluor Corp.; Prior to 2010, Trustee of the German Marshall Fund of the United States; Prior to 2010 Trustee of the Rocky Mountain Institute | ||||
| Other Officers | ||||||||
Russell C. Burk — 1958 Senior Vice President and Senior Officer | 2005 | Senior Vice President and Senior Officer, The Invesco Funds | N/A | N/A | ||||
John M. Zerr — 1962 Senior Vice President, Chief Legal Officer and Secretary | 2006 | Director, Senior Vice President, Secretary and General Counsel, Invesco Management Group, Inc. (formerly known as Invesco Aim Management Group, Inc.) and Van Kampen Exchange Corp.; Senior Vice President, Invesco Advisers, Inc. (formerly known as Invesco Institutional (N.A.), Inc.) (registered investment adviser); Senior Vice President and Secretary, Invesco Distributors, Inc. (formerly known as Invesco Aim Distributors, Inc.); Director, Vice President and Secretary, Invesco Investment Services, Inc. (formerly known as Invesco Aim Investment Services, Inc.) and IVZ Distributors, Inc. (formerly known as INVESCO Distributors, Inc.); Director and Vice President, INVESCO Funds Group, Inc.; Senior Vice President, Chief Legal Officer and Secretary, The Invesco Funds; Manager, Invesco PowerShares Capital Management LLC; Director, Secretary and General Counsel, Invesco Investment Advisers LLC (formerly known as Van Kampen Asset Management); Secretary and General Counsel, Invesco Capital Markets, Inc. (formerly known as Van Kampen Funds Inc.) and Chief Legal Officer, PowerShares Exchange-Traded Fund Trust, PowerShares Exchange-Traded Fund Trust II, PowerShares India Exchange-Traded Fund Trust , PowerShares Actively Managed Exchange-Traded Fund Trust; and PowerShares Actively Managed Exchange-Traded Commodity Fund Trust
Formerly: Director and Vice President, Van Kampen Advisors Inc.; Director, Vice President, Secretary and General Counsel, Van Kampen Investor Services Inc.; Director, Invesco Distributors, Inc. (formerly known as Invesco Aim Distributors, Inc.); Director, Senior Vice President, General Counsel and Secretary, Invesco Aim Advisers, Inc. and Van Kampen Investments Inc.; Director, Vice President and Secretary, Fund Management Company; Director, Senior Vice President, Secretary, General Counsel and Vice President, Invesco Aim Capital Management, Inc.; Chief Operating Officer and General Counsel, Liberty Ridge Capital, Inc. (an investment adviser); Vice President and Secretary, PBHG Funds (an investment company) and PBHG Insurance Series Fund (an investment company); Chief Operating Officer, General Counsel and Secretary, Old Mutual Investment Partners (a broker-dealer); General Counsel and Secretary, Old Mutual Fund Services (an administrator) and Old Mutual Shareholder Services (a shareholder servicing center); Executive Vice President, General Counsel and Secretary, Old Mutual Capital, Inc. (an investment adviser); and Vice President and Secretary, Old Mutual Advisors Funds (an investment company) | N/A | N/A | ||||
Sheri Morris — 1964 Vice President, Treasurer and Principal Financial Officer | 1999 | Vice President, Treasurer and Principal Financial Officer, The Invesco Funds; Vice President, Invesco Advisers, Inc. (formerly known as Invesco Institutional (N.A.), Inc.) (registered investment adviser); and Vice President, PowerShares Exchange-Traded Fund Trust, PowerShares Exchange-Traded Fund Trust II, PowerShares India Exchange-Traded Fund Trust, PowerShares Actively Managed Exchange-Traded Fund Trust, and PowerShares Actively Managed Exchange-Traded Commodity Fund Trust
Formerly: Vice President, Invesco Aim Advisers, Inc., Invesco Aim Capital Management, Inc. and Invesco Aim Private Asset Management, Inc.; Assistant Vice President and Assistant Treasurer, The Invesco Funds and Assistant Vice President, Invesco Advisers, Inc., Invesco Aim Capital Management, Inc. and Invesco Aim Private Asset Management, Inc.; and Treasurer, PowerShares Exchange-Traded Fund Trust, PowerShares Exchange-Traded Fund Trust II, PowerShares India Exchange-Traded Fund Trust and PowerShares Actively Managed Exchange-Traded Fund Trust | N/A | N/A | ||||
T-3 Invesco Small Cap Growth Fund
Trustees and Officers—(continued)
Name, Year of Birth and Position(s) Held with the Trust | Trustee and/ or Officer Since | Principal Occupation(s) During Past 5 Years | Number of Funds in Fund Complex Overseen by Trustee | Other Directorship(s) Held by Trustee During | ||||
| Other Officers—(continued) | ||||||||
Karen Dunn Kelley — 1960 Vice President | 2004 | Senior Managing Director, Investments; Director, Co-President, Co-Chief Executive Officer, and Co-Chairman, Invesco Advisers, Inc. (formerly known as Invesco Institutional (N.A.), Inc.) (registered investment adviser); Chairman, Invesco Senior Secured Management, Inc.; Senior Vice President, Invesco Management Group, Inc. (formerly known as Invesco Aim Management Group, Inc.); Executive Vice President, Invesco Distributors, Inc. (formerly known as Invesco Aim Distributors, Inc.); Director, Invesco Mortgage Capital Inc. and Invesco Management Company Limited; Director and President, INVESCO Asset Management (Bermuda) Ltd., Vice President, The Invesco Funds (other than AIM Treasurer’s Series Trust (Invesco Treasurer’s Series Trust) and Short-Term Investments Trust); and President and Principal Executive Officer, The Invesco Funds (AIM Treasurer’s Series Trust (Invesco Treasurer’s Series Trust) and Short-Term Investments Trust only)
Formerly: Director, INVESCO Global Asset Management Limited and INVESCO Management S.A.; Senior Vice President, Van Kampen Investments Inc. and Invesco Advisers, Inc. (formerly known as Invesco Institutional (N.A.), Inc.) (registered investment adviser); Vice President, Invesco Advisers, Inc. (formerly known as Invesco Institutional (N.A.), Inc.); Director of Cash Management and Senior Vice President, Invesco Advisers, Inc. and Invesco Aim Capital Management, Inc.; Director and President, Fund Management Company; Chief Cash Management Officer, Director of Cash Management, Senior Vice President, and Managing Director, Invesco Aim Capital Management, Inc.; Director of Cash Management, Senior Vice President, and Vice President, Invesco Advisers, Inc. and The Invesco Funds (AIM Treasurer’s Series Trust (Invesco Treasurer’s Series Trust), and Short-Term Investments Trust only) | N/A | N/A | ||||
Crissie M. Wisdom — 1969 Anti-Money Laundering Compliance Officer | 2013 | Anti-Money Laundering Compliance Officer, Invesco Advisers, Inc. (formerly known as Invesco Institutional (N.A.), Inc.) (registered investment adviser), Invesco Capital Markets, Inc. (formerly known as Van Kampen Funds Inc.), Invesco Distributors, Inc., Invesco Investment Services, Inc., Invesco Management Group, Inc., Van Kampen Exchange Corp., The Invesco Funds, and PowerShares Exchange-Traded Fund Trust, PowerShares Exchange-Traded Fund Trust II, PowerShares India Exchange-Traded Fund Trust, PowerShares Actively Managed Exchange-Traded Fund Trust and PowerShares Actively Managed Exchange-Traded Commodity Fund Trust; and Fraud Prevention Manager and Controls and Risk Analysis Manager for Invesco Investment Services, Inc. | N/A | N/A | ||||
Todd L. Spillane — 1958 Chief Compliance Officer | 2006 | Senior Vice President, Invesco Management Group, Inc. (formerly known as Invesco Aim Management Group, Inc.) and Van Kampen Exchange Corp.; Senior Vice President and Chief Compliance Officer, Invesco Advisers, Inc. (registered investment adviser) (formerly known as Invesco Institutional (N.A.), Inc.); Chief Compliance Officer, The Invesco Funds; Vice President, Invesco Distributors, Inc. (formerly known as Invesco Aim Distributors, Inc.) and Invesco Investment Services, Inc. (formerly known as Invesco Aim Investment Services, Inc.)
Formerly: Chief Compliance Officer, Invesco Funds (Chicago); Senior Vice President, Van Kampen Investments Inc.; Senior Vice President and Chief Compliance Officer, Invesco Aim Advisers, Inc. and Invesco Aim Capital Management, Inc.; Chief Compliance Officer, INVESCO Private Capital Investments, Inc. (holding company), Invesco Private Capital, Inc. (registered investment adviser), Invesco Global Asset Management (N.A.), Inc., Invesco Senior Secured Management, Inc. (registered investment adviser), Van Kampen Investor Services Inc., PowerShares Exchange-Traded Fund Trust, PowerShares Exchange-Traded Fund Trust II, PowerShares India Exchange-Traded Fund Trust and PowerShares Actively Managed Exchange-Traded Fund Trust; and Vice President, Invesco Aim Capital Management, Inc. and Fund Management Company | N/A | N/A |
The Statement of Additional Information of the Trust includes additional information about the Fund’s Trustees and is available upon request, without charge, by calling 1.800.959.4246. Please refer to the Fund’s prospectus for information on the Fund’s sub-advisers.
Office of the Fund 11 Greenway Plaza, Suite 1000 Houston, TX 77046-1173 | Investment Adviser Invesco Advisers, Inc. 1555 Peachtree Street, N.E. Atlanta, GA 30309 | Distributor Invesco Distributors, Inc. 11 Greenway Plaza, Suite 1000 Houston, TX 77046-1173 | Auditors PricewaterhouseCoopers LLP 1000 Louisiana Street, Suite 5800 Houston, TX 77002-5678 | |||
Counsel to the Fund Stradley Ronon Stevens & Young, LLP 2005 Market Street, Suite 2600 Philadelphia, PA 19103-7018 | Counsel to the Independent Trustees Goodwin Procter LLP 901 New York Avenue, N.W. Washington, D.C. 20001 | Transfer Agent Invesco Investment Services, Inc. 11 Greenway Plaza, Suite 1000 Houston, TX 77046-1173 | Custodian State Street Bank and Trust Company 225 Franklin Street Boston, MA 02110-2801 | |||
T-4 Invesco Small Cap Growth Fund

Invesco mailing information
Send general correspondence to Invesco Investment Services, Inc., P.O. Box 219078, Kansas City, MO 64121-9078.
Important notice regarding delivery of security holder documents
To reduce Fund expenses, only one copy of most shareholder documents may be mailed to shareholders with multiple accounts at the same address (Householding). Mailing of your shareholder documents may be householded indefinitely unless you instruct us otherwise. If you do not want the mailing of these documents to be combined with those for other members of your household, please contact Invesco Investment Services, Inc. at 800 959 4246 or contact your financial institution. We will begin sending you individual copies for each account within 30 days after receiving your request.
Fund holdings and proxy voting information
The Fund provides a complete list of its holdings four times in each fiscal year, at the quarter ends. For the second and fourth quarters, the lists appear in the Fund’s semiannual and annual reports to shareholders. For the first and third quarters, the Fund files the lists with the Securities and Exchange Commission (SEC) on Form N-Q. The most recent list of portfolio holdings is available at invesco.com/completeqtrholdings. Shareholders can also look up the Fund’s Forms N-Q on the SEC website at sec.gov. Copies of the Fund’s Forms N-Q may be reviewed and copied at the SEC Public Reference Room in Washington, D.C. You can obtain information on the operation of the Public Reference Room, including information about duplicating fee charges, by calling 202 551 8090 or 800 732 0330, or by electronic request at the following email address: publicinfo@sec.gov. The SEC file numbers for the Fund are shown below.
A description of the policies and procedures that the Fund uses to determine how to vote proxies relating to portfolio securities is available without charge, upon request, from our Client Services department at 800 959 4246 or at invesco.com/proxyguidelines. The information is also available on the SEC website, sec.gov.
Information regarding how the Fund voted proxies related to its portfolio securities during the most recent 12-month period ended June 30 is available at invesco.com/proxysearch. The information is also available on the SEC website, sec.gov. Invesco Advisers, Inc. is an investment adviser; it provides investment advisory services to individual and institutional clients and does not sell securities. Invesco Distributors, Inc. is the US distributor for Invesco Ltd.’s retail mutual funds, exchange-traded funds and institutional money market funds. Both are wholly owned, indirect subsidiaries of Invesco Ltd. |  | |
SEC file numbers: 811-02699 and 002-57526 SCG-AR-1 Invesco Distributors, Inc. | ||
| ||||
 | Annual Report to Shareholders
| December 31, 2014 | ||
| ||||
Invesco U.S. Mortgage Fund
Nasdaq: A: VKMGX n B: VUSBX n C: VUSCX n Y: VUSIX n R5: VUSJX | ||||

Letters to Shareholders
Philip Taylor | Dear Shareholders: This annual report includes information about your Fund, including performance data and a complete list of its investments as of the close of the reporting period. Inside, your Fund’s portfolio managers discuss how they managed your Fund and the factors that affected its performance during the reporting period. I hope you find this report of interest. During the reporting period, the US economy showed unmistakable signs of improvement. After contracting in the first quarter of 2014, the economy expanded strongly in the second and third quarters as employment data improved markedly. Given continuing positive economic trends, the US Federal Reserve (the Fed) ended its extraordinary asset purchase program in October – but it pledged in December to be “patient” before raising interest rates. Overseas, the |

story was much different. Concerns about economic stagnation and the potential for deflation depressed European markets, while the Chinese economy was hurt by a slowdown in manufacturing.
Political change in Washington, DC; changes to monetary policy by the Fed and other central banks; the future direction of oil prices; and unexpected geopolitical events are likely to affect markets in the US and overseas in 2015. This may make some investors hesitant to begin to save for their long-term financial goals. That’s why Invesco has always encouraged investors to work with a professional financial adviser who can stress the importance of starting to save and invest early and the importance of adhering to a disciplined investment plan – when times are good and when they’re uncertain. A financial adviser who knows your unique financial situation, investment goals and risk tolerance can be an invaluable partner as you seek to achieve your financial goals. He or she can offer a long-term perspective when markets are volatile and time-tested advice and guidance when your financial situation or investment goals change.
Timely information when and where you want it
Invesco’s efforts to help investors achieve their financial objectives include providing individual investors and financial professionals with timely information about the markets, the economy and investing – whenever and wherever they want it.
Our website, invesco.com/us, offers a wide range of market insights and investment perspectives. On the website, you’ll find detailed information about our funds, including prices, performance, holdings and portfolio manager commentaries. You can access information about your individual Invesco account whenever it’s convenient for you; just complete a simple, secure online registration. Use the “Log In” box on our home page to get started.
Invesco’s mobile apps for iPhone® and iPad® (both available free from the App StoreSM) allow you to obtain the same detailed information, monitor your account and create customizable watch lists. Also, they allow you to access investment insights from our investment leaders, market strategists, economists and retirement experts. You can sign up to be alerted when new commentary is added, and you can watch portfolio manager videos and have instant access to Invesco news and updates wherever you may be.
In addition to the resources accessible on our website and through our mobile app, you can obtain timely updates to help you stay informed about the markets, the economy and investing by connecting with Invesco on Twitter, LinkedIn or Facebook. You can access our blog at blog.invesco.us.com. Our goal is to provide you the information you want, when and where you want it.
Have questions?
For questions about your account, feel free to contact an Invesco client services representative at 800 959 4246. For Invesco-related questions or comments, please email me directly at phil@invesco.com.
All of us at Invesco look forward to serving your investment management needs for many years to come. Thank you for investing with us.
Sincerely,

Philip Taylor
Senior Managing Director, Invesco Ltd.
iPhone and iPad are trademarks of Apple Inc., registered in the US and other countries. App Store is a service mark of Apple Inc. Invesco Distributors, Inc. is not affiliated with Apple Inc.
2 Invesco U.S. Mortgage Fund
Bruce Crockett | Dear Fellow Shareholders: Among the many important lessons I’ve learned in more than 40 years in a variety of business endeavors is the value of a trusted advocate. As independent chair of the Invesco Funds Board, I can assure you that the members of the Board are strong advocates for the interests of investors in Invesco’s mutual funds. We work hard to represent your interests through oversight of the quality of the investment management services your funds receive and other matters important to your investment, including but not limited to: n Ensuring that Invesco offers a diverse lineup of mutual funds that your financial adviser can use to strive to meet your financial needs as your investment goals change over time. |

| n | Monitoring how the portfolio management teams of the Invesco funds are performing in light of changing economic and market conditions. |
| n | Assessing each portfolio management team’s investment performance within the context of the investment strategy described in the fund’s prospectus. |
| n | Monitoring for potential conflicts of interests that may impact the nature of the services that your funds receive. |
We believe one of the most important services we provide our fund shareholders is the annual review of the funds’ advisory and sub-advisory contracts with Invesco Advisers and its affiliates. This review is required by the Investment Company Act of 1940 and focuses on the nature and quality of the services Invesco provides as the adviser to the Invesco funds and the reasonableness of the fees that it charges for those services. Each year, we spend months carefully reviewing information received from Invesco and a variety of independent sources, such as performance and fee data prepared by Lipper Inc., an independent, third-party firm widely recognized as a leader in its field. We also meet with our independent legal counsel and other independent advisers to review and help us assess the information that we have received. Our goal is to assure that you receive quality investment management services for a reasonable fee.
I trust the measures outlined above provide assurance that you have a worthy advocate when it comes to choosing the Invesco Funds.
As always, please contact me at bruce@brucecrockett.com with any questions or concerns you may have. On behalf of the Board, we look forward to continuing to represent your interests and serving your needs.
Sincerely,

Bruce L. Crockett
Independent Chair
Invesco Funds Board of Trustees
3 Invesco U.S. Mortgage Fund
Management’s Discussion of Fund Performance
Performance summary
For the year ended December 31, 2014, Class A shares of Invesco U.S. Mortgage Fund, at net asset value (NAV), outperformed the Fund’s style-specific index, the Barclays U.S. Mortgage Backed Securities Index. Sector and security selection each played a role in the Fund’s performance for the reporting period.
Your Fund’s long-term performance appears later in this report.
Fund vs. Indexes
Total returns, 12/31/13 to 12/31/14, at net asset value (NAV). Performance shown does not include applicable contingent deferred sales charges (CDSC) or front-end sales charges, which would have reduced performance.
| Class A Shares | 6.27 | % | |||
| Class B Shares | 5.48 | ||||
| Class C Shares | 5.48 | ||||
| Class Y Shares | 6.52 | ||||
| Class R5 Shares | 6.56 | ||||
| Bank of America Merrill Lynch 1-10 Year Treasury Index‚ (Broad Market Index) | 2.82 | ||||
| Barclays U.S. Mortgage Backed Securities Index‚ (Style-Specific Index) | 6.08 |
Source(s): ‚FactSet Research Systems Inc.
Market conditions and your Fund
The year ended December 31, 2014, turned out to be a surprisingly successful year for many bond market participants given the predictions for rising rates that dominated the media and investor psyche at the beginning of the year. Falling long-term bond yields were a driving force behind generally positive intermediate- to long-term, higher-quality bond returns during 2014.
The year began on a positive note for bonds, buoyed by a general decline in yields on concerns over US economic growth following unexpectedly disruptive winter weather in the first quarter of 2014. Yields also were pushed lower due to demand driven by rising tensions in Eastern Europe and the Middle East, which prompted investors to seek safety. The yield on the 10-year US Treasury
note fell to 2.5% by the end of June.1 This happened despite the US Federal Reserve’s (the Fed) tapering of its quantitative easing via bond purchases from $75 billion a month beginning in January to $35 billion a month beginning in July.1
Despite growing geopolitical risk and softer-than-expected global economic growth, investors’ demand for yield also fueled positive results in credit-related markets, such as emerging market debt and high yield corporate bonds, during the first half of the year. While a favorable supply/demand dynamic and solid credit fundamentals throughout the first part of the year supported an environment in which investors were willing to assume somewhat greater credit risk, these credit sectors experienced notable volatility near the end of the reporting period. A steep drop in oil prices in the
second half of 2014 and concerns over the ongoing conflict between Russia and the Ukraine spurred notable sell-offs in both high yield corporate bonds and emerging market debt.
As the reporting period drew to a close, the most credit-sensitive markets made it to the finish line with positive, albeit subdued, returns after a bumpy ride throughout 2014. Meanwhile, long-term Treasury bonds were some of the best-performing bonds in 2014 as yields drifted lower, with the yield on the 30-year US Treasury rate ending the year at 2.75%, down from just under 4.00% at the start of the year.1
In this market environment, Class A shares of Invesco U.S. Mortgage Fund, at NAV, generated positive total returns and outperformed the Fund’s style-specific index, the Barclays U.S. Mortgage Backed Securities Index, mostly due to a favorable sector and security selection versus the style-specific benchmark.
We maintained the Fund’s allocation to non-agency residential mortgage-backed securities (MBS) at between 10–20% of the portfolio’s total net assets; this helped the Fund’s performance versus the style-specific index for much of the year due to a highly supportive supply/demand dynamic and fundamental improvements in the underlying mortgage loans that attracted investors. However, during the fourth quarter of 2014, the shorter duration profile of non-agency MBS hindered their performance versus the style-specific benchmark securities. For similar supply/demand and fundamental reasons, our sustained 10–20% allocation to commercial mortgage backed securities (CMBS) also contributed to relative
| Portfolio Composition | |||||
By security type, based on total investments
| |||||
| U.S. Government Sponsored Agency Mortgage-Backed Securities | 70.8 | % | |||
| Asset-Backed Securities | 26.2 | ||||
| Non-Agency Obligations | 0.7 | ||||
| U.S. Treasury Securities | 0.2 | ||||
| Money Market Funds | 2.1 | ||||
| Top 10 Fixed Income Issuers* | |||||
1. Federal National Mortgage Association | 52.8 | % | |||
2. Federal Home Loan Mortgage Corp. | 33.4 | ||||
3. Government National Mortgage Association | 5.6 | ||||
4. Bear Stearns Commercial Mortgage Securities Trust | 4.1 | ||||
5. Ginnie Mae REMICs | 3.1 | ||||
6. JP Morgan Chase Commercial Mortgage Securities Trust | 3.0 | ||||
7. JP Morgan Mortgage Trust | 2.4 | ||||
8. Citigroup Mortgage Loan Trust, Inc. | 2.2 | ||||
9. La Hipotecaria Panamanian Mortgage Trust | 2.1 | ||||
10. Morgan Stanley Capital I Trust | 1.9 | ||||
| Total Net Assets | $453.8 million | ||||
| Total Number of Holdings* | 895 | ||||
The Fund’s holdings are subject to change, and there is no assurance that the Fund will continue to hold any particular security.
*Excluding money market fund holdings.
4 Invesco U.S. Mortgage Fund
results for the year. Our security selection decisions across the maturity, coupon, vintage and issuer strata of the residential MBS market also helped relative returns. Among agency MBS, the 30-year, fixed rate MBS with coupons below 5% were most beneficial to Fund total returns.
The Fund also benefited from incremental income earned by engaging in dollar (mortgage) roll activity, a type of repurchase transaction in the highly liquid to-be-announced (TBA) market for agency MBS. A dollar roll involves the Fund selling an MBS to a financial institution, with an agreement to repurchase a substantially similar security at an agreed upon price and date. Excess portfolio cash resulting from the use of this strategy is subsequently invested in short-term instruments to generate additional return for the Fund.
The Fund used active duration and yield curve positioning for risk management and for generating “alpha” (the extra return above a specific benchmark), versus its style-specific benchmark. Duration measures a portfolio’s price sensitivity to interest rate changes, with a shorter duration portfolio tending to be less sensitive to these changes. During the reporting period, we maintained the portfolio’s overall duration slightly longer than that of the style-specific benchmark, on average, which produced favorable results as rates fell. However, yield curve positioning within the portfolio emphasized short-term (six months to two years) interest rates, missing much of the performance benefit of falling longer-term rates, and more than offset the positive relative return generated by duration positioning alone. Buying and selling US Treasury futures contracts was an important tool we used for the management of interest rate risk and to maintain our targeted portfolio duration.
Please note that our strategy is implemented using derivative instruments, including futures, swaps and options. Therefore, a portion of the performance of the strategy, both positive and negative, can be attributed to these instruments. Derivatives can be a cost-effective way to gain or hedge exposure to certain risks. However, derivatives may amplify traditional investment risks through the creation of leverage and may be less liquid than traditional securities.
We wish to remind you that the Fund is subject to interest rate risk, meaning when interest rates rise, the value of fixed income securities tend to fall. This
risk may be greater in the current market environment because interest rates are at or near historic lows. The degree to which the value of fixed income securities may decline due to rising interest rates may vary depending on the speed and magnitude of the increase in interest rates, as well as individual security characteristics such as price, maturity, duration and coupon and market forces such as supply and demand for similar securities. We are monitoring interest rates, and the market, economic and geopolitical factors that may impact the direction, speed and magnitude of changes to interest rates across the maturity spectrum, including the potential impact of monetary policy changes by the Fed and certain foreign central banks. If interest rates rise, markets may experience increased volatility, which may affect the value and/or liquidity of certain of the Fund’s investments.
We thank you for your investment in Invesco U.S. Mortgage Fund.
| 1 | Source: Board of Governors of the Federal Reserve System (US) |
The views and opinions expressed in management’s discussion of Fund performance are those of Invesco Advisers, Inc. These views and opinions are subject to change at any time based on factors such as market and economic conditions. These views and opinions may not be relied upon as investment advice or recommendations, or as an offer for a particular security. The information is not a complete analysis of every aspect of any market, country, industry, security or the Fund. Statements of fact are from sources considered reliable, but Invesco Advisers, Inc. makes no representation or warranty as to their completeness or accuracy. Although historical performance is no guarantee of future results, these insights may help you understand our investment management philosophy.
See important Fund and, if applicable, index disclosures later in this report.
 | Clint Dudley Chartered Financial Analyst, Portfolio Manager, is manager of Invesco U.S. Mortgage Fund. He |
joined Invesco in 1998. Mr. Dudley earned a BBA and an MBA from Baylor University.
 | Jason Marshall Portfolio Manager, is manager of Invesco U.S. Mortgage Fund. He joined Invesco in 2007. Mr. Marshall |
earned a BS in finance from Indiana University of Pennsylvania and an MBA from Duquesne University.
 | Brian Norris Chartered Financial Analyst, Portfolio Manager, is manager of Invesco U.S. Mortgage Fund. He |
joined Invesco in 2001. Mr. Norris earned a BS in business administration from the University of Louisville.
5 Invesco U.S. Mortgage Fund
Your Fund’s Long-Term Performance
Results of a $10,000 Investment – Oldest Share Class(es)
Fund and index data from 12/31/04
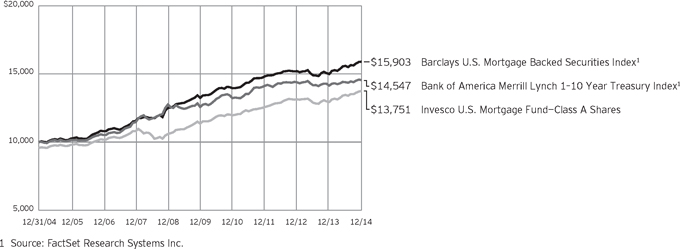
Past performance cannot guarantee comparable future results.
The data shown in the chart include reinvested distributions, applicable sales charges and Fund expenses including
management fees. Index results include reinvested dividends, but they do not reflect sales charges. Performance of the peer group, if applicable, reflects fund expenses and management fees;
performance of a market index does not. Performance shown in the chart and table(s) does not reflect deduction of taxes a shareholder would pay on Fund distributions or sale of Fund shares.
continued from page 8
short position in a TBA mortgage poses more risk than holding the same TBA mortgage long. As there is no limit on how much the price of mortgage securities can increase, the Fund’s exposure is unlimited. The Fund may not always be able to purchase mortgage securities to close out the short position at a particular time or at an acceptable price. A Fund will earmark or segregate liquid assets in an amount at least equal to its exposure for the duration of the contract. The Fund will incur increased transaction costs associated with selling TBA mortgages short. In addition, taking short positions in TBA mortgages results in a form of leverage which could increase the volatility of the Fund’s share price.
| n | US government obligations risk. The Fund may invest in obligations issued by US government agencies and instrumentalities that may receive varying levels of support from the government, which could affect the Fund’s ability to recover should they default. |
| n | When-issued and delayed delivery risks. When-issued and delayed delivery transactions are subject to market risk as the value or yield of a security at delivery may be more or less than the purchase price or the yield generally available on |
securities when delivery occurs. In addition, the Fund is subject to counterparty risk because it relies on the buyer or seller, as the case may be, to consummate the transaction, and failure by the other party to complete the transaction may result in the Fund missing the opportunity of obtaining a price or yield considered to be advantageous. |
| n | Zero coupon or pay-in-kind securities risk. The value, interest rates, and liquidity of non-cash paying instruments, such as zero coupon and pay-in-kind securities, are subject to greater fluctuation than other types of securities. The higher yields and interest rates on pay-in-kind securities reflect the payment deferral and increased credit risk associated with such instruments and that such investments may represent a higher credit risk than coupon loans. Pay-in-kind securities may have a potential variability in valuations because their continuing accruals require continuing judgments about the collectability of the deferred payments and the value of any associated collateral. |
About indexes used in this report
| n | The Bank of America Merrill Lynch 1-10 Year Treasury Index tracks the performance of US Treasury securities with maturities of one to 9.99 years. |
| n | The Barclays U.S. Mortgage Backed Securities Index represents mortgage-backed pass-through securities of Ginnie Mae, Fannie Mae and Freddie Mac. |
| n | The Fund is not managed to track the performance of any particular index, including the index(es) described here, and consequently, the performance of the Fund may deviate significantly from the performance of the index(es). |
| n | A direct investment cannot be made in an index. Unless otherwise indicated, index results include reinvested dividends, and they do not reflect sales charges. Performance of the peer group, if applicable, reflects fund expenses; performance of a market index does not. |
Other information
| n | The returns shown in management’s discussion of Fund performance are based on net asset values (NAVs) calculated for shareholder transactions. Generally accepted accounting principles require adjustments to be made to the net assets of the Fund at period end for financial reporting purposes, and as such, the NAVs for shareholder transactions and the returns based on those NAVs may differ from the NAVs and returns reported in the Financial Highlights. |
6 Invesco U.S. Mortgage Fund
Average Annual Total Returns As of 12/31/14, including maximum applicable | |||||
| Class A Shares | |||||
| Inception (5/31/84) | 6.61 | % | |||
| 10 Years | 3.24 | ||||
| 5 Years | 3.01 | ||||
| 1 Year | 1.74 | ||||
| Class B Shares | |||||
| Inception (8/24/92) | 4.50 | % | |||
| 10 Years | 3.05 | ||||
| 5 Years | 2.78 | ||||
| 1 Year | 0.48 | ||||
| Class C Shares | |||||
| Inception (8/13/93) | 3.79 | % | |||
| 10 Years | 2.90 | ||||
| 5 Years | 3.13 | ||||
| 1 Year | 4.48 | ||||
| Class Y Shares | |||||
| Inception (9/25/06) | 4.12 | % | |||
| 5 Years | 4.17 | ||||
| 1 Year | 6.52 | ||||
| Class R5 Shares | |||||
| 10 Years | 3.81 | % | |||
| 5 Years | 4.17 | ||||
| 1 Year | 6.56 | ||||
Effective June 1, 2010, Class A, Class B, Class C and Class I shares of the predecessor fund, Van Kampen U.S. Mortgage Fund, advised by Van Kampen Asset Management were reorganized into Class A, Class B, Class C and Class Y shares, respectively, of Invesco Van Kampen U.S. Mortgage Fund (renamed Invesco U.S. Mortgage Fund). Returns shown above for Class A, Class B, Class C and Class Y shares are blended returns of the predecessor fund and Invesco U.S. Mortgage Fund. Share class returns will differ from the predecessor fund because of different expenses.
Class R5 shares incepted on June 1, 2010. Performance shown prior to that date is that of the predecessor fund’s Class A shares and includes the 12b-1 fees applicable to Class A shares. Class A share performance reflects any applicable fee waivers or expense reimbursements.
The performance data quoted represent past performance and cannot guarantee comparable future results; current performance may be lower or higher. Please visit invesco.com/performance for the most recent month-end performance. Performance figures
reflect reinvested distributions, changes in net asset value and the effect of the maximum sales charge unless otherwise stated. Investment return and principal value will fluctuate so that you may have a gain or loss when you sell shares.
The total annual Fund operating expense ratio set forth in the most recent Fund prospectus as of the date of this report for Class A, Class B, Class C, Class Y and Class R5 shares was 0.94%, 1.70%, 1.70%, 0.70% and 0.66%, respectively. The expense ratios presented above may vary from the expense ratios presented in other sections of this report that are based on expenses incurred during the period covered by this report.
Class A share performance reflects the maximum 4.25% sales charge, and Class B and Class C share performance reflects the applicable contingent deferred sales charge (CDSC) for the period involved. For shares purchased prior to June 1, 2010, the CDSC on Class B shares declines from 4% at the time of purchase to 0% at the beginning of the seventh year. For shares purchased on or after June 1, 2010, the CDSC on Class B shares declines from 5% at the time of purchase to 0% at the beginning of the seventh year. The CDSC on Class C shares is 1% for the first year after purchase. Class Y and Class R5 shares do not have a front-end sales charge or a CDSC; therefore, performance is at net asset value.
The performance of the Fund’s share classes will differ primarily due to different sales charge structures and class expenses.
7 Invesco U.S. Mortgage Fund
Invesco U.S. Mortgage Fund’s investment objective is to provide a high level of current income, with liquidity and safety of principal.
| n | Unless otherwise stated, information presented in this report is as of December 31, 2014, and is based on total net assets. |
| n | Unless otherwise noted, all data provided by Invesco. |
| n | To access your Fund’s reports/prospectus, visit invesco.com/fundreports. |
About share classes
| n | Class B shares may not be purchased for new or additional investments. Please see the prospectus for more information. |
| n | Class Y shares are available only to certain investors. Please see the prospectus for more information. |
| n | Class R5 shares are primarily intended for employer sponsored retirement and benefit plans that meet certain standards and for institutional investors. Please see the prospectus for more information. |
Principal risks of investing in the Fund
| n | Active trading. The Fund engages in frequent trading of portfolio securities. Active trading results in added expenses and may result in a lower return and increased tax liability. |
| n | Borrowing risk. Borrowing money to buy securities exposes the Fund to leverage because the Fund can achieve a return on a capital base larger than the assets that shareholders have contributed to the Fund. Borrowing may cause the Fund to be more volatile because it may exaggerate the effect of any increase or decrease in the value of the Fund’s portfolio securities. Borrowing may also cause the Fund to liquidate positions when it may not be advantageous to do so. In addition, borrowing will cause the Fund to incur interest expenses and other fees. There can be no assurance that the Fund’s borrowing strategy will be successful. |
| n | Credit risk. The issuer of instruments in which the Fund invests may be unable to meet interest and/or principal payments, thereby causing its instruments to decrease in value and lowering the issuer’s credit rating. |
| n | Derivatives risk. The value of a derivative instrument depends largely on (and is derived from) the value of an underlying security, currency, commodity, interest rate, index or other asset (each referred to as an underlying asset). In addition to risks relating to the underlying assets, the use of derivatives may include other, possibly |
greater, risks, including counterparty, leverage and liquidity risks. |
Counterparty risk is the risk that the counterparty to the derivative contract will default on its obligation to pay the Fund the amount owed or otherwise perform under the derivative contract. Derivatives create leverage risk because they do not require payment up front equal to the economic exposure created by owning the derivative. As a result, an adverse change in the value of the underlying asset could result in the Fund sustaining a loss that is substantially greater than the amount invested in the derivative, which may make the Fund’s returns more volatile and increase the risk of loss. Derivative instruments may also be less liquid than more traditional investments and the Fund may be unable to sell or close out its derivative positions at a desirable time or price. This risk may be more acute under adverse market conditions, during which the Fund may be most in need of liquidating its derivative positions. Derivatives may also be harder to value, less tax efficient and subject to changing government regulation that could impact the Fund’s ability to use certain derivatives or their cost. Also, derivatives used for hedging or to gain or limit exposure to a particular market segment may not provide the expected benefits, particularly during adverse market conditions.
| n | Dollar roll transactions risk. Dollar roll transactions involve the risk that the market value and yield of the securities retained by the Fund may decline below the price of the mortgage-related securities sold by the Fund that it is obligated to repurchase. |
| n | Income risk. The income you receive from the Fund is based primarily on prevailing interest rates, which can vary widely over the short- and long-term. If interest rates drop, your income from the Fund may drop as well. |
| n | Liquidity risk. The Fund may hold illiquid securities that it is unable to sell at the preferred time or price and could lose its entire investment in such securities. |
| n | Management risk. The investment |
This report must be accompanied or preceded by a currently effective Fund prospectus, which contains more complete information, including sales charges and expenses. Investors should read it carefully before investing.
NOT FDIC INSURED | MAY LOSE VALUE | NO BANK GUARANTEE
| techniques and risk analysis used by the Fund’s portfolio managers may not produce the desired results. |
| n | Market risk. The prices of and the income generated by the Fund’s securities may decline in response to, among other things, investor sentiment, general economic and market conditions, regional or global instability, and currency and interest rate fluctuations. |
| n | Mortgage- and asset-backed securities risk. The Fund may invest in mortgage- and asset-backed securities that are subject to prepayment or call risk, which is the risk that the borrower’s payments may be received earlier or later than expected due to changes in prepayment rates on underlying loans. Faster prepayments often happen when interest rates are falling. As a result, the Fund may reinvest these early payments at lower interest rates, thereby reducing the Fund’s income. Conversely, when interest rates rise, prepayments may happen more slowly, causing the security to lengthen in duration. Longer duration securities tend to be more volatile. Securities may be prepaid at a price less than the original purchase value. An unexpectedly high rate of defaults on the mortgages held by a mortgage pool may adversely affect the value of mortgage-backed securities and could result in losses to the Fund. The risk of such defaults is generally higher in the case of mortgage pools that include subprime mortgages. Subprime mortgages refer to loans made to borrowers with weakened credit histories or with lower capacity to make timely payments on their mortgages. |
| n | TBA transactions risk. TBA transactions involve the risk that the securities received may be less favorable than what was anticipated by the Fund when entering into the TBA transaction. TBA transactions also involve the risk that a counterparty will fail to deliver the securities, exposing the Fund to further losses. Whether or not the Fund takes delivery of the securities at the termination date of a TBA transaction, the Fund will nonetheless be exposed to changes in the value of the underlying investments during the term of the agreement. When the Fund enters into a short sale of a TBA mortgage it does not own, the Fund may have to purchase deliverable mortgages to settle the short sale at a higher price than anticipated, thereby causing a loss. A |
continued on page 6
8 Invesco U.S. Mortgage Fund
Schedule of Investments
December 31, 2014
| Principal Amount | Value | |||||||
U.S. Government Sponsored Agency Mortgage-Backed Securities–102.60% |
| |||||||
| Collateralized Mortgage Obligations–10.73% | ||||||||
Fannie Mae ACES, | $ | 4,475,258 | $ | 4,472,522 | ||||
0.66%, 08/25/19(a) | 1,910,038 | 1,919,228 | ||||||
Fannie Mae Grantor Trust | 507,776 | 563,676 | ||||||
Fannie Mae Interest STRIPS, IO, | 324,973 | 37,360 | ||||||
8.00%, 05/01/30 | 1,231,675 | 349,683 | ||||||
7.50%, 01/01/32 | 411,001 | 72,571 | ||||||
Fannie Mae REMICs, | 726,177 | 734,582 | ||||||
7.00%, 09/25/32 | 428,782 | 490,209 | ||||||
6.57%, 06/25/39(a) | 1,596,295 | 1,833,522 | ||||||
Fannie Mae REMICS | 5,522,501 | 5,573,711 | ||||||
Fannie Mae REMICs, IO, | 9,410,047 | 544,486 | ||||||
3.00%, 10/25/26 | 5,079,261 | 510,023 | ||||||
8.00%, 08/18/27 to 09/18/27 | 1,395,332 | 243,999 | ||||||
6.00%, 05/25/33 | 57,700 | 12,239 | ||||||
7.00%, 05/25/33 | 1,288,287 | 257,995 | ||||||
3.50%, 08/25/42 | 2,437,769 | 310,831 | ||||||
1.81%, 03/25/43(a) | 24,210,334 | 1,939,340 | ||||||
Freddie Mac REMICs, | 232,153 | 241,900 | ||||||
3.00%, 10/15/18 to 04/15/26 | 2,355,865 | 2,418,796 | ||||||
3.75%, 10/15/18 | 489,416 | 494,438 | ||||||
Freddie Mac REMICS | 31,292,145 | 2,620,604 | ||||||
Freddie Mac REMICs, IO, | 8,446,277 | 607,731 | ||||||
2.50%, 09/15/27 | 5,091,323 | 505,573 | ||||||
1.70%, 04/15/38(a) | 16,771,371 | 1,224,382 | ||||||
1.83%, 02/15/39(a) | 13,923,788 | 1,216,208 | ||||||
4.00%, 12/15/41 | 3,774,999 | 399,802 | ||||||
Freddie Mac REMICs, PO | 1,477,576 | 1,472,492 | ||||||
Freddie Mac STRIPS, IO | 1,867,649 | 513,242 | ||||||
Freddie Mac Structured Pass Through Securities 6.50%, 02/25/43 | 2,593,216 | 2,991,028 | ||||||
Ginnie Mae REMICs, | 563,580 | 567,858 | ||||||
4.50%, 10/20/33 | 135,869 | 136,405 | ||||||
5.87%, 01/20/39(a) | 3,122,106 | 3,530,884 | ||||||
4.50%, 07/20/41(a) | 5,452,334 | 5,821,623 | ||||||
1.76%, 09/20/41(a) | 3,885,826 | 4,064,434 | ||||||
| 48,693,377 | ||||||||
| Principal Amount | Value | |||||||
| Federal Home Loan Mortgage Corp. (FHLMC)–33.44% | ||||||||
Federal Home Loan Mortgage Corp., | $ | 559,436 | $ | 682,162 | ||||
5.00%, 10/01/18 to 06/01/40 | 14,322,811 | 15,876,052 | ||||||
7.50%, 01/01/20 to 05/01/35 | 624,845 | 759,278 | ||||||
3.50%, 08/01/26 | 1,111,717 | 1,181,453 | ||||||
6.50%, 05/01/28 to 08/01/33 | 873,183 | 992,939 | ||||||
6.00%, 03/01/29 | 7,764 | 8,897 | ||||||
8.00%, 08/01/32 | 379,569 | 474,331 | ||||||
5.50%, 12/01/36 | 606,301 | 678,613 | ||||||
4.50%, 05/01/38 to 02/01/42 | 35,974,468 | 39,187,723 | ||||||
5.35%, 07/01/38 to 10/17/38 | 4,381,501 | 4,923,659 | ||||||
5.80%, 10/01/38 to 01/20/39 | 2,566,801 | 2,925,380 | ||||||
5.45%, 11/25/38 | 4,221,292 | 4,761,876 | ||||||
4.00%, 06/01/42 | 7,378,947 | 7,908,623 | ||||||
Pass Through Ctfs., ARM, | 3,387,902 | 3,630,783 | ||||||
2.68%, 02/01/37(a) | 344,265 | 370,719 | ||||||
2.79%, 03/01/37(a) | 1,233,947 | 1,323,167 | ||||||
2.38%, 05/01/37(a) | 1,371,934 | 1,477,892 | ||||||
2.52%, 11/01/37(a) | 3,117,257 | 3,357,614 | ||||||
2.68%, 01/01/38(a) | 520,541 | 560,642 | ||||||
3.40%, 03/01/41(a) | 546,744 | 579,465 | ||||||
Pass Through Ctfs., TBA, | 23,200,000 | 23,437,436 | ||||||
3.50%, 01/01/45(b) | 21,700,000 | 22,564,608 | ||||||
4.00%, 01/01/45(b) | 13,200,000 | 14,071,406 | ||||||
| 151,734,718 | ||||||||
| Federal National Mortgage Association (FNMA)–52.78% | ||||||||
Federal National Mortgage Association, | 993,954 | 1,215,517 | ||||||
13.00%, 06/01/15 | 376 | 377 | ||||||
7.00%, 02/01/18 to 12/01/33 | 503,207 | 543,465 | ||||||
4.50%, 05/01/19 to 10/01/41 | 19,559,952 | 21,064,677 | ||||||
8.00%, 07/01/20 to 04/01/33 | 854,071 | 1,034,887 | ||||||
6.50%, 06/01/22 to 11/01/38 | 5,430,595 | 6,204,545 | ||||||
5.50%, 11/01/22 to 04/01/38 | 17,124,976 | 19,202,089 | ||||||
4.00%, 06/01/24 to 06/01/44 | 16,180,559 | 17,337,953 | ||||||
5.00%, 06/01/27 to 01/01/41 | 11,244,522 | 12,448,448 | ||||||
9.50%, 04/01/30 | 126,702 | 150,566 | ||||||
8.50%, 10/01/32 | 713,882 | 885,656 | ||||||
6.00%, 12/01/35 to 05/01/40 | 5,478,737 | 6,242,414 | ||||||
5.45%, 01/01/38 | 836,551 | 947,681 | ||||||
5.63%, 03/01/41 | 729,331 | 859,534 | ||||||
3.50%, 11/01/42 | 2,592,430 | 2,716,333 | ||||||
3.00%, 04/01/43 | 3,686,408 | 3,736,556 | ||||||
See accompanying Notes to Financial Statements which are an integral part of the financial statements.
9 Invesco U.S. Mortgage Fund
| Principal Amount | Value | |||||||
| Federal National Mortgage Association (FNMA)–(continued) | ||||||||
Pass Through Ctfs., ARM, | $ | 483,116 | $ | 516,853 | ||||
1.84%, 02/01/39(a) | 5,147,867 | 5,347,238 | ||||||
3.02%, 08/01/42(a) | 1,711,954 | 1,765,201 | ||||||
2.27%, 07/01/43(a) | 4,476,985 | 4,479,866 | ||||||
2.68%, 09/01/43(a) | 2,280,405 | 2,316,098 | ||||||
Pass Through Ctfs., BAL, | 3,200,967 | 3,415,447 | ||||||
Pass Through Ctfs., TBA, | 8,000,000 | 8,145,625 | ||||||
3.00%, 01/01/30 to 01/01/45(b) | 30,900,000 | 31,371,101 | ||||||
3.50%, 01/01/44(b) | 45,700,000 | 47,642,255 | ||||||
4.00%, 01/01/44(b) | 37,420,000 | 39,939,563 | ||||||
| 239,529,945 | ||||||||
| Government National Mortgage Association (GNMA)–5.65% | ||||||||
Government National Mortgage Association, | 328,816 | 336,053 | ||||||
8.00%, 05/15/16 to 12/15/21 | 296,743 | 304,396 | ||||||
8.50%, 02/20/17 | 731 | 767 | ||||||
9.00%, 09/15/17 to 08/15/24 | 625,547 | 644,762 | ||||||
7.00%, 08/15/22 to 01/15/29 | 471,115 | 514,556 | ||||||
6.50%, 04/15/26 to 11/15/28 | 245,213 | 280,040 | ||||||
6.00%, 01/15/28 to 04/20/29 | 645,857 | 732,178 | ||||||
5.50%, 05/15/33 to 10/15/34 | 1,458,625 | 1,643,554 | ||||||
5.00%, 11/20/37 | 2,449,394 | 2,702,406 | ||||||
3.50%, 01/01/45(c) | 13,000,000 | 13,646,953 | ||||||
Pass Through Ctfs., TBA, | 4,500,000 | 4,823,086 | ||||||
| 25,628,751 | ||||||||
Total U.S. Government Sponsored Agency Mortgage-Backed Securities (Cost $458,070,823) |
| 465,586,791 | ||||||
Asset-Backed Securities–38.90% |
| |||||||
| Collateralized Mortgage Obligations–37.97% | ||||||||
American Home Mortgage Investment Trust, Series 2005-1, Class 7A1, Floating Rate Pass Through Ctfs., 2.33%, 06/25/45(a) | 1,542,646 | 1,536,239 | ||||||
Americredit Automobile Receivables Trust, Series 2014-4, Class A2A, Pass Through Ctfs., 0.72%, 04/09/18 | 5,000,000 | 4,998,818 | ||||||
BAMLL-DB Trust, Series 2012-OSI, Class A2FX, Pass Through Ctfs., 3.35%, 04/13/29(d) | 4,997,674 | 5,135,447 | ||||||
Banc of America Funding Trust, Series 2006-3, Class 5A5, Pass Through Ctfs., 5.50%, 03/25/36 | 220,093 | 210,835 | ||||||
| Principal Amount | Value | |||||||
| Collateralized Mortgage Obligations–(continued) | ||||||||
Bear Stearns Commercial Mortgage Securities Trust, | $ | 3,050,000 | $ | 3,057,755 | ||||
Series 2005-PWR8, Class AJ, Pass Through Ctfs., 4.75%, 06/11/41 | 5,000,000 | 5,064,665 | ||||||
Series 2005-PWR9, Class AJ, Variable Rate Pass Through Ctfs., 4.99%, 09/11/42(a) | 500,000 | 511,978 | ||||||
Series 2006-PW11, Class A4, Variable Rate Pass Through Ctfs., 5.43%, 03/11/39(a) | 4,264,100 | 4,407,606 | ||||||
Series 2006-T22, Class AJ, Variable Rate Pass Through Ctfs., 5.58%, 04/12/38(a) | 4,055,000 | 4,235,058 | ||||||
Series 2006-T22, Class B, Variable Rate Pass Through Ctfs., 5.58%, 04/12/38(a)(d) | 1,750,000 | 1,851,804 | ||||||
Cerberus Onshore II Clo-2 LLC, | 3,000,000 | 3,003,300 | ||||||
CGBAM Commercial Mortgage Trust, | 3,000,000 | 2,991,933 | ||||||
Chase Mortgage Finance Trust, | 92,743 | 84,817 | ||||||
CHL Mortgage Pass Through Trust, | 777,995 | 739,762 | ||||||
Citigroup Mortgage Loan Trust, | 165,694 | 159,886 | ||||||
Citigroup Mortgage Loan Trust, Inc., | 3,942,184 | 3,908,378 | ||||||
Series 2004-UST1, Class A4, Floating Rate Pass Through Ctfs., 2.18%, 08/25/34(a) | 728,617 | 724,323 | ||||||
Series 2009-12, Class 5A1, Pass Through Ctfs., 5.50%, 07/25/37(d) | 2,383,547 | 2,455,054 | ||||||
Series 2012-6, Class 2A1, Floating Rate Pass Through Ctfs., 2.35%, 08/25/36(a)(d) | 2,785,561 | 2,817,784 | ||||||
Commercial Mortgage Trust, | 2,366,076 | 2,366,289 | ||||||
Credit Suisse First Boston Mortgage Securities Corp., | 930,000 | 948,673 | ||||||
See accompanying Notes to Financial Statements which are an integral part of the financial statements.
10 Invesco U.S. Mortgage Fund
| Principal Amount | Value | |||||||
| Collateralized Mortgage Obligations–(continued) | ||||||||
Credit Suisse Mortgage Trust, | $ | 18,944 | $ | 18,985 | ||||
Fifth Third Auto Trust, | 4,000,000 | 3,997,010 | ||||||
GCCFC COMM Mortgage Trust, | 5,000,000 | 5,080,310 | ||||||
GSAA Home Equity Trust, | 104,441 | 88,957 | ||||||
JP Morgan Chase Commercial Mortgage Securities Trust, | 5,000,000 | 5,092,777 | ||||||
Series 2006-LDP6, Class AJ, Variable Rate Pass Through Ctfs., 5.57%, 04/15/43(a) | 8,372,000 | 8,665,870 | ||||||
Series 2006-LDP8, Class AJ, Pass Through Ctfs., 5.48%, 05/15/45 | 4,000,000 | 4,196,112 | ||||||
JP Morgan Mortgage Trust, | 2,138,347 | 2,138,893 | ||||||
Series 2005-A6, Class 7A1, Floating Rate Pass Through Ctfs., 2.53%, 08/25/35(a) | 1,720,156 | 1,687,304 | ||||||
Series 2014-1, Class 1A17, Variable Rate Pass Through Ctfs., 4.00%, 01/25/44(a)(d) | 6,738,737 | 7,105,490 | ||||||
JP Morgan Resecuritization Trust, | 5,948,151 | 6,002,487 | ||||||
Series 2009-7, Class 5A1, Pass Through Ctfs., 6.00%, 02/27/37(d) | 901,708 | 930,748 | ||||||
La Hipotecaria El Salvadorian Mortgage Trust (El Salvador), | 5,769,317 | 6,077,618 | ||||||
La Hipotecaria Panamanian Mortgage Trust (El Salvador), | 9,034,117 | 9,389,835 | ||||||
LB-UBS Commercial Mortgage Trust, | 5,420,000 | 5,562,944 | ||||||
| Principal Amount | Value | |||||||
| Collateralized Mortgage Obligations–(continued) | ||||||||
LSTAR Commercial Mortgage Trust, | $ | 3,350,000 | $ | 3,387,384 | ||||
Luminent Mortgage Trust, | 3,802,329 | 3,448,861 | ||||||
Series 2006-1, Class A1, Floating Rate Pass Through Ctfs., 0.41%, 04/25/36(a) | 112,147 | 74,838 | ||||||
Merrill Lynch Mortgage Investors Trust, | 260,896 | 248,824 | ||||||
Series 2005-A, Class A1, Floating Rate Pass Through Ctfs., 0.63%, 03/25/30(a) | 1,974,064 | 1,891,203 | ||||||
Morgan Stanley Capital I Trust, | 7,945,000 | 8,385,959 | ||||||
RALI Trust, Series 2006-QO2, Class A2, Floating Rate Pass Through Ctfs., 0.44%, 02/25/46(a) | 70,701 | 35,068 | ||||||
RBSSP Resecuritization Trust, | 1,593,844 | 1,609,306 | ||||||
Series 2010-1, Class 2A1, Floating Rate Pass Through Ctfs., 2.09%, 07/26/45 (Acquired 01/31/11; Cost $3,087,845)(a)(d) | 3,099,468 | 3,130,767 | ||||||
Sequoia Mortgage Trust, | 2,621,423 | 2,465,271 | ||||||
Series 2013-7, Class A2, Variable Rate Pass Through Ctfs., 3.00%, 06/25/43(a) | 4,571,885 | 4,523,841 | ||||||
Shellpoint Asset Funding Trust, | 4,043,935 | 4,191,219 | ||||||
Structured Adjustable Rate Mortgage Loan Trust, | 828,989 | 741,445 | ||||||
Series 2004-6, Class 3A2, Floating Rate Pass Through Ctfs., 2.39%, 06/25/34(a) | 4,355,504 | 4,445,060 | ||||||
Structured Asset Mortgage Investments, II Trust., Series 2005-AR2, Class 2A1, Floating Rate Pass Through Ctfs., 0.40%, 05/25/45(a) | 1,890,522 | 1,713,423 | ||||||
Structured Asset Securities Corp., | 242,128 | 219,896 | ||||||
See accompanying Notes to Financial Statements which are an integral part of the financial statements.
11 Invesco U.S. Mortgage Fund
| Principal Amount | Value | |||||||
| Collateralized Mortgage Obligations–(continued) | ||||||||
Wachovia Bank Commercial Mortgage Trust, | $ | 500,000 | $ | 511,805 | ||||
Series 2005-C21, Class AJ, Variable Rate Pass Through Ctfs., 5.24%, 10/15/44(a) | 1,254,000 | 1,284,460 | ||||||
WaMu Mortgage Pass-Through Certificates, Series 2005-AR12, Class 1A8, Floating Rate Pass Through Ctfs., 2.33%, 10/25/35(a) | 7,000,191 | 6,817,622 | ||||||
WaMu Mortgage Pass-Through Certificates, Series 2007-HY2, Class 2A1, Floating Rate Pass Through Ctfs., 2.34%, 11/25/36(a) | 349,873 | 308,084 | ||||||
Wells Fargo Mortgage Backed Securities Trust, | 3,038,142 | 3,058,051 | ||||||
Series 2005-AR2, Class 2A2, Floating Rate Pass Through Ctfs., 2.61%, 03/25/35(a) | 398,245 | 406,407 | ||||||
Series 2006-AR8, Class 2A3, Floating Rate Pass Through Ctfs., 2.60%, 04/25/36(a) | 2,210,023 | 2,168,889 | ||||||
Total Collateralized Mortgage Obligations |
| 172,313,427 | ||||||
| Principal Amount | Value | |||||||
| Non-Agency Obligations–0.93% | ||||||||
Freddie Mac, Series 2014-DN1, Class M2, Floating Rate STACR® Debt Notes, 2.37%, 02/25/24(a)(d)(e) (Cost $4,314,273) | $ | 4,300,000 | $ | 4,229,944 | ||||
Total Asset-Backed Securities (Cost $175,212,277) |
| 176,543,371 | ||||||
U.S. Treasury Securities–0.30% |
| |||||||
| U.S. Treasury Bills–0.07% | ||||||||
0.09%, 08/20/15(f) | 305,000 | 304,708 | ||||||
| U.S. Treasury Notes–0.23% | ||||||||
3.25%, 12/31/16(g) | 1,000,000 | 1,050,076 | ||||||
Total U.S. Treasury Securities |
| 1,354,784 | ||||||
| Shares | ||||||||
Money Market Funds–3.10% |
| |||||||
Liquid Assets Portfolio–Institutional Class(h) | 7,042,965 | 7,042,965 | ||||||
Premier Portfolio–Institutional Class(h) | 7,042,965 | 7,042,965 | ||||||
Total Money Market Funds |
| 14,085,930 | ||||||
TOTAL INVESTMENTS–144.90% |
| 657,570,876 | ||||||
OTHER ASSETS LESS LIABILITIES–(44.90)% |
| (203,755,476 | ) | |||||
NET ASSETS–100.00% |
| $ | 453,815,400 | |||||
Investment Abbreviations:
| ACES | – Automatically Convertible Extendable Security | |
| ARM | – Adjustable Rate Mortgage | |
| BAL | – Balloon | |
| Ctfs. | – Certificates | |
| Gtd. | – Guaranteed | |
| REMIC | – Real Estate Mortgage Investment Conduits | |
| Sr. | – Senior | |
| STACR® | – Structured Agency Credit Risk | |
| STRIPS | – Separately Traded Registered Interest and Principal Security | |
| TBA | – To Be Announced | |
| Unsec. | – Unsecured |
Notes to Schedule of Investments:
| (a) | Interest or dividend rate is redetermined periodically. Rate shown is the rate in effect on December 31, 2014. |
| (b) | Security purchased on a forward commitment basis. This security is subject to dollar roll transactions. See Note 1H. |
| (c) | This security is subject to dollar roll transactions. See Note 1H. |
| (d) | Security purchased or received in a transaction exempt from registration under the Securities Act of 1933, as amended (the “1933 Act”). The security may be resold pursuant to an exemption from registration under the 1933 Act, typically to qualified institutional buyers. The aggregate value of these securities at December 31, 2014 was $69,409,415, which represented 15.29% of the Fund’s Net Assets. |
| (e) | Principal payments are determined by the delinquency and principal payment experience on the STACR® reference pool. Freddie Mac transfers credit risk from the mortgages in the reference pool to credit investors who invest in the STACR® debt notes. |
| (f) | Security traded on a discount basis. The interest rate shown represents the discount rate at the time of purchase by the Fund. |
| (g) | All or a portion of the value was pledged as collateral to cover margin requirements for open futures contracts. See Note 1I and Note 4. |
| (h) | The money market fund and the Fund are affiliated by having the same investment adviser. |
See accompanying Notes to Financial Statements which are an integral part of the financial statements.
12 Invesco U.S. Mortgage Fund
Statement of Assets and Liabilities
December 31, 2014
Assets: | ||||
Investments, at value (Cost $634,593,007) | $ | 643,484,946 | ||
Investments in affiliated money market funds, at value and cost | 14,085,930 | |||
Total investments, at value (Cost $648,678,937) | 657,570,876 | |||
Cash | 133,037 | |||
Receivable for: | ||||
Investments sold | 18,212,548 | |||
Fund shares sold | 993,158 | |||
Dividends and interest | 1,946,321 | |||
Principal paydowns | 80,494 | |||
Investment for trustee deferred compensation and retirement plans | 69,073 | |||
Other assets | 22,987 | |||
Total assets | 679,028,494 | |||
Liabilities: | ||||
Payable for: | ||||
Investments purchased | 223,224,767 | |||
Fund shares reacquired | 886,775 | |||
Dividends | 420,364 | |||
Variation margin—futures | 64,000 | |||
Accrued fees to affiliates | 214,247 | |||
Accrued trustees’ and officers’ fees and benefits | 398 | |||
Accrued other operating expenses | 322,339 | |||
Trustee deferred compensation and retirement plans | 80,204 | |||
Total liabilities | 225,213,094 | |||
Net assets applicable to shares outstanding | $ | 453,815,400 | ||
Net assets consist of: | ||||
Shares of beneficial interest | $ | 568,338,786 | ||
Undistributed net investment income | 365,205 | |||
Undistributed net realized gain (loss) | (123,534,288 | ) | ||
Net unrealized appreciation | 8,645,697 | |||
| $ | 453,815,400 | |||
Net Assets: | ||||
Class A | $ | 424,258,679 | ||
Class B | $ | 2,134,639 | ||
Class C | $ | 8,100,492 | ||
Class Y | $ | 19,306,388 | ||
Class R5 | $ | 15,202 | ||
Shares outstanding, $0.01 par value per share, |
| |||
Class A | 33,817,436 | |||
Class B | 171,024 | |||
Class C | 650,251 | |||
Class Y | 1,533,102 | |||
Class R5 | 1,207 | |||
Class A: | ||||
Net asset value per share | $ | 12.55 | ||
Maximum offering price per share | ||||
(Net asset value of $12.55 ¸ 95.75%) | $ | 13.11 | ||
Class B: | ||||
Net asset value and offering price per share | $ | 12.48 | ||
Class C: | ||||
Net asset value and offering price per share | $ | 12.46 | ||
Class Y: | ||||
Net asset value and offering price per share | $ | 12.59 | ||
Class R5: | ||||
Net asset value and offering price per share | $ | 12.59 | ||
See accompanying Notes to Financial Statements which are an integral part of the financial statements.
13 Invesco U.S. Mortgage Fund
Statement of Operations
For the year ended December 31, 2014
Investment income: | ||||
Interest | $ | 14,407,643 | ||
Dividends from affiliated money market funds | 4,233 | |||
Total investment income | 14,411,876 | |||
Expenses: | ||||
Advisory fees | 2,096,113 | |||
Administrative services fees | 122,576 | |||
Custodian fees | 44,602 | |||
Distribution fees: | ||||
Class A | 1,034,396 | |||
Class B | 26,241 | |||
Class C | 78,523 | |||
Transfer agent fees — A, B, C, and Y | 625,930 | |||
Transfer agent fees — R5 | 11 | |||
Trustees’ and officers’ fees and benefits | 29,995 | |||
Other | 291,434 | |||
Total expenses | 4,349,821 | |||
Less: Fees waived and expense offset arrangement(s) | (16,673 | ) | ||
Net expenses | 4,333,148 | |||
Net investment income | 10,078,728 | |||
Realized and unrealized gain (loss) from: | ||||
Net realized gain (loss) from: | ||||
Investment securities | 12,435,864 | |||
Futures contracts | (1,304,807 | ) | ||
| 11,131,057 | ||||
Change in net unrealized appreciation (depreciation) of: | ||||
Investment securities | 6,516,752 | |||
Futures contracts | (577,646 | ) | ||
| 5,939,106 | ||||
Net realized and unrealized gain | 17,070,163 | |||
Net increase in net assets resulting from operations | $ | 27,148,891 | ||
See accompanying Notes to Financial Statements which are an integral part of the financial statements.
14 Invesco U.S. Mortgage Fund
Statement of Changes in Net Assets
For the years ended December 31, 2014 and 2013
| 2014 | 2013 | |||||||
Operations: |
| |||||||
Net investment income | $ | 10,078,728 | $ | 8,074,964 | ||||
Net realized gain (loss) | 11,131,057 | (4,045,559 | ) | |||||
Change in net unrealized appreciation (depreciation) | 5,939,106 | (12,215,849 | ) | |||||
Net increase (decrease) in net assets resulting from operations | 27,148,891 | (8,186,444 | ) | |||||
Distributions to shareholders from net investment income: | ||||||||
Class A | (19,256,450 | ) | (18,165,658 | ) | ||||
Class B | (98,872 | ) | (125,354 | ) | ||||
Class C | (291,848 | ) | (302,885 | ) | ||||
Class Y | (314,767 | ) | (125,279 | ) | ||||
Class R5 | (515 | ) | (397 | ) | ||||
Total distributions from net investment income | (19,962,452 | ) | (18,719,573 | ) | ||||
Share transactions–net: | ||||||||
Class A | (23,705,101 | ) | (64,577,974 | ) | ||||
Class B | (1,107,150 | ) | (2,305,725 | ) | ||||
Class C | 185,855 | (3,650,135 | ) | |||||
Class Y | 16,973,129 | (1,331,835 | ) | |||||
Class R5 | 5,436 | — | ||||||
Net increase (decrease) in net assets resulting from share transactions | (7,647,831 | ) | (71,865,669 | ) | ||||
Net increase (decrease) in net assets | (461,392 | ) | (98,771,686 | ) | ||||
Net assets: | ||||||||
Beginning of year | 454,276,792 | 553,048,478 | ||||||
End of year (includes undistributed net investment income of $365,205 and $1,208,677, respectively) | $ | 453,815,400 | $ | 454,276,792 | ||||
Notes to Financial Statements
December 31, 2014
NOTE 1—Significant Accounting Policies
Invesco U.S. Mortgage Fund (the “Fund”) is a series portfolio of AIM Growth Series (Invesco Growth Series) (the “Trust”). The Trust is organized as a Delaware statutory trust and is registered under the Investment Company Act of 1940, as amended (the “1940 Act”), as an open-end series management investment company consisting of seventeen separate series portfolios, each authorized to issue an unlimited number of shares of beneficial interest. The assets, liabilities and operations of each portfolio are accounted for separately. Information presented in these financial statements pertains only to the Fund. Matters affecting each portfolio or class will be voted on exclusively by the shareholders of such portfolio or class.
The Fund’s investment objective is to provide a high level of current income, with liquidity and safety of principal.
The Fund currently consists of five different classes of shares: Class A, Class B, Class C, Class Y and Class R5. Class A shares are sold with a front-end sales charge unless certain waiver criteria are met and under certain circumstances load waived shares may be subject to contingent deferred sales charges (“CDSC”). Class C shares are sold with a CDSC. Class Y and Class R5 shares are sold at net asset value. Effective November 30, 2010, new or additional investments in Class B shares are no longer permitted. Existing shareholders of Class B shares may continue to reinvest dividends and capital gains distributions in Class B shares until they convert to Class A shares. Also, shareholders in Class B shares will be able to exchange those shares for Class B shares of other Invesco Funds offering such shares until they convert to Class A shares. Generally, Class B shares will automatically convert to Class A shares on or about the month-end, which is at least eight years after the date of purchase. Redemption of Class B shares prior to the conversion date will be subject to a CDSC.
The following is a summary of the significant accounting policies followed by the Fund in the preparation of its financial statements.
| A. | Security Valuations — Securities, including restricted securities, are valued according to the following policy. |
Debt obligations (including convertible securities) and unlisted equities are fair valued using an evaluated quote provided by an independent pricing service. Evaluated quotes provided by the pricing service may be determined without exclusive reliance on quoted prices, and may reflect appropriate factors such as institution-size trading in similar groups of securities, developments related to specific securities, dividend rate (for unlisted equities), yield (for debt obligations), quality, type of issue, coupon rate (for debt obligations), maturity (for debt obligations), individual trading characteristics and other market data. Debt obligations are subject to interest rate and credit risks. In addition, all debt obligations involve some risk of default with respect to interest and/or principal payments.
15 Invesco U.S. Mortgage Fund
A security listed or traded on an exchange (except convertible securities) is valued at its last sales price or official closing price as of the close of the customary trading session on the exchange where the security is principally traded, or lacking any sales or official closing price on a particular day, the security may be valued at the closing bid price on that day. Securities traded in the over-the-counter market are valued based on prices furnished by independent pricing services or market makers. When such securities are valued by an independent pricing service they may be considered fair valued. Futures contracts are valued at the final settlement price set by an exchange on which they are principally traded. Listed options are valued at the mean between the last bid and ask prices from the exchange on which they are principally traded. Options not listed on an exchange are valued by an independent source at the mean between the last bid and ask prices. For purposes of determining net asset value per share, futures and option contracts generally are valued 15 minutes after the close of the customary trading session of the New York Stock Exchange (“NYSE”).
Investments in open-end and closed-end registered investment companies that do not trade on an exchange are valued at the end of day net asset value per share. Investments in open-end and closed-end registered investment companies that trade on an exchange are valued at the last sales price or official closing price as of the close of the customary trading session on the exchange where the security is principally traded.
Swap agreements are fair valued using an evaluated quote, if available, provided by an independent pricing service. Evaluated quotes provided by the pricing service are valued based on a model which may include end of day net present values, spreads, ratings, industry, company performance and returns of referenced assets.
Foreign securities’ (including foreign exchange contracts) prices are converted into U.S. dollar amounts using the applicable exchange rates as of the close of the NYSE. If market quotations are available and reliable for foreign exchange-traded equity securities, the securities will be valued at the market quotations. Because trading hours for certain foreign securities end before the close of the NYSE, closing market quotations may become unreliable. If between the time trading ends on a particular security and the close of the customary trading session on the NYSE, events occur that the Adviser determines are significant and make the closing price unreliable, the Fund may fair value the security. If the event is likely to have affected the closing price of the security, the security will be valued at fair value in good faith using procedures approved by the Board of Trustees. Adjustments to closing prices to reflect fair value may also be based on a screening process of an independent pricing service to indicate the degree of certainty, based on historical data, that the closing price in the principal market where a foreign security trades is not the current value as of the close of the NYSE. Foreign securities’ prices meeting the approved degree of certainty that the price is not reflective of current value will be priced at the indication of fair value from the independent pricing service. Multiple factors may be considered by the independent pricing service in determining adjustments to reflect fair value and may include information relating to sector indices, American Depositary Receipts and domestic and foreign index futures. Foreign securities may have additional risks including exchange rate changes, potential for sharply devalued currencies and high inflation, political and economic upheaval, the relative lack of issuer information, relatively low market liquidity and the potential lack of strict financial and accounting controls and standards.
Securities for which market prices are not provided by any of the above methods may be valued based upon quotes furnished by independent sources. The last bid price may be used to value equity securities. The mean between the last bid and ask prices is used to value debt obligations, including corporate loans.
Securities for which market quotations are not readily available or became unreliable are valued at fair value as determined in good faith by or under the supervision of the Trust’s officers following procedures approved by the Board of Trustees. Issuer specific events, market trends, bid/ask quotes of brokers and information providers and other market data may be reviewed in the course of making a good faith determination of a security’s fair value.
The Fund may invest in securities that are subject to interest rate risk, meaning the risk that the prices will generally fall as interest rates rise and, conversely, the prices will generally rise as interest rates fall. Specific securities differ in their sensitivity to changes in interest rates depending on their individual characteristics. Changes in interest rates may result in increased market volatility, which may affect the value and/or liquidity of certain of the Fund’s investments.
Valuations change in response to many factors including the historical and prospective earnings of the issuer, the value of the issuer’s assets, general economic conditions, interest rates, investor perceptions and market liquidity. Because of the inherent uncertainties of valuation, the values reflected in the financial statements may materially differ from the value received upon actual sale of those investments.
| B. | Securities Transactions and Investment Income — Securities transactions are accounted for on a trade date basis. Realized gains or losses on sales are computed on the basis of specific identification of the securities sold. Interest income (net of withholding tax, if any) is recorded on the accrual basis from settlement date. Paydown gains and losses on mortgage and asset-backed securities are recorded as adjustments to interest income. Dividend income (net of withholding tax, if any) is recorded on the ex-dividend date. Bond premiums and discounts are amortized and/or accreted for financial reporting purposes. |
The Fund may periodically participate in litigation related to Fund investments. As such, the Fund may receive proceeds from litigation settlements. Any proceeds received are included in the Statement of Operations as realized gain (loss) for investments no longer held and as unrealized gain (loss) for investments still held.
Brokerage commissions and mark ups are considered transaction costs and are recorded as an increase to the cost basis of securities purchased and/or a reduction of proceeds on a sale of securities. Such transaction costs are included in the determination of net realized and unrealized gain (loss) from investment securities reported in the Statement of Operations and the Statement of Changes in Net Assets and the net realized and unrealized gains (losses) on securities per share in the Financial Highlights. Transaction costs are included in the calculation of the Fund’s net asset value and, accordingly, they reduce the Fund’s total returns. These transaction costs are not considered operating expenses and are not reflected in net investment income reported in the Statement of Operations and Statement of Changes in Net Assets, or the net investment income per share and ratios of expenses and net investment income reported in the Financial Highlights, nor are they limited by any expense limitation arrangements between the Fund and the investment adviser.
The Fund allocates income and realized and unrealized capital gains and losses to a class based on the relative net assets of each class.
| C. | Distributions — Distributions from net investment income are declared daily and paid monthly. Distributions from net realized capital gain, if any, are generally declared and paid annually and recorded on the ex-dividend date. |
| D. | Federal Income Taxes — The Fund intends to comply with the requirements of Subchapter M of the Internal Revenue Code of 1986, as amended (the “Internal Revenue Code”), necessary to qualify as a regulated investment company and to distribute substantially all of the Fund’s |
16 Invesco U.S. Mortgage Fund
| taxable earnings to shareholders. As such, the Fund will not be subject to federal income taxes on otherwise taxable income (including net realized capital gain) that is distributed to shareholders. Therefore, no provision for federal income taxes is recorded in the financial statements. |
The Fund recognizes the tax benefits of uncertain tax positions only when the position is more likely than not to be sustained. Management has analyzed the Fund’s uncertain tax positions and concluded that no liability for unrecognized tax benefits should be recorded related to uncertain tax positions. Management is not aware of any tax positions for which it is reasonably possible that the total amounts of unrecognized tax benefits will change materially in the next 12 months.
Each Fund files tax returns in the U.S. Federal jurisdiction and certain other jurisdictions. Generally, each Fund is subject to examinations by such taxing authorities for up to three years after the filing of the return for the tax period.
| E. | Expenses — Fees provided for under the Rule 12b-1 plan of a particular class of the Fund are charged to the operations of such class. Transfer agency fees and expenses and other shareholder recordkeeping fees and expenses attributable to Class R5 are charged to such class. Transfer agency fees and expenses and other shareholder recordkeeping fees and expenses relating to all other classes are allocated among those classes based on relative net assets. All other expenses are allocated among the classes based on relative net assets. Prior to June 1, 2010, incremental transfer agency fees which were unique to each class of shares were charged to the operations of such class. |
| F. | Accounting Estimates — The preparation of financial statements in conformity with accounting principles generally accepted in the United States of America (“GAAP”) requires management to make estimates and assumptions that affect the reported amounts of assets and liabilities at the date of the financial statements and the reported amounts of revenues and expenses during the reporting period including estimates and assumptions related to taxation. Actual results could differ from those estimates by a significant amount. In addition, the Fund monitors for material events or transactions that may occur or become known after the period-end date and before the date the financial statements are released to print. |
| G. | Indemnifications — Under the Trust’s organizational documents, each Trustee, officer, employee or other agent of the Trust is indemnified against certain liabilities that may arise out of the performance of their duties to the Fund. Additionally, in the normal course of business, the Fund enters into contracts, including the Fund’s servicing agreements, that contain a variety of indemnification clauses. The Fund’s maximum exposure under these arrangements is unknown as this would involve future claims that may be made against the Fund that have not yet occurred. The risk of material loss as a result of such indemnification claims is considered remote. |
| H. | Dollar Rolls and Forward Commitment Transactions —The Fund may enter into dollar roll transactions to enhance the Fund’s performance. The Fund executes its dollar roll transactions in the to be announced (“TBA”) market whereby the Fund makes a forward commitment to purchase a security and, instead of accepting delivery, the position is offset by the sale of the security with a simultaneous agreement to repurchase at a future date. |
The Fund accounts for dollar roll transactions as purchases and sales and realizes gains and losses on these transactions. These transactions increase the Fund’s portfolio turnover rate. The Fund will segregate liquid assets in an amount equal to its dollar roll commitments. Dollar roll transactions are considered borrowings under the 1940 Act.
Dollar roll transactions involve the risk that a counterparty to the transaction may fail to complete the transaction. If this occurs, the Fund may lose the opportunity to purchase or sell the security at the agreed upon price. Dollar rolls transactions also involve the risk that the value of the securities retained by the Fund may decline below the price of the securities that the Fund has sold but is obligated to purchase under the agreement.
| I. | Futures Contracts — The Fund may enter into futures contracts to manage exposure to interest rate, equity and market price movements and/or currency risks. A futures contract is an agreement between two parties to purchase or sell a specified underlying security, currency or commodity (or delivery of a cash settlement price, in the case of an index future) for a fixed price at a future date. The Fund currently invests only in exchange-traded futures and they are standardized as to maturity date and underlying financial instrument. Initial margin deposits required upon entering into futures contracts are satisfied by the segregation of specific securities or cash as collateral at the futures commission merchant (broker). During the period the futures contracts are open, changes in the value of the contracts are recognized as unrealized gains or losses by recalculating the value of the contracts on a daily basis. Subsequent or variation margin payments are received or made depending upon whether unrealized gains or losses are incurred. These amounts are reflected as receivables or payables on the Statement of Assets and Liabilities. When the contracts are closed or expire, the Fund recognizes a realized gain or loss equal to the difference between the proceeds from, or cost of, the closing transaction and the Fund’s basis in the contract. The net realized gain (loss) and the change in unrealized gain (loss) on futures contracts held during the period is included on the Statement of Operations. The primary risks associated with futures contracts are market risk and the absence of a liquid secondary market. If the Fund were unable to liquidate a futures contract and/or enter into an offsetting closing transaction, the Fund would continue to be subject to market risk with respect to the value of the contracts and continue to be required to maintain the margin deposits on the futures contracts. Futures contracts have minimal Counterparty risk since the exchange’s clearinghouse, as Counterparty to all exchange-traded futures, guarantees the futures against default. Risks may exceed amounts recognized in the Statement of Assets and Liabilities. |
| J. | Other Risks — The Fund may invest in obligations issued by agencies and instrumentalities of the U.S. Government that may vary in the level of support they receive from the government. The government may choose not to provide financial support to government sponsored agencies or instrumentalities if it is not legally obligated to do so. In this case, if the issuer defaulted, the Fund may not be able to recover its investment in such issuer from the U.S. Government. Many securities purchased by the Fund are not guaranteed by the U.S. Government. |
| K. | Collateral — To the extent the Fund has designated or segregated a security as collateral and that security is subsequently sold, it is the Fund’s practice to replace such collateral no later than the next business day. |
17 Invesco U.S. Mortgage Fund
NOTE 2—Advisory Fees and Other Fees Paid to Affiliates
The Trust has entered into a master investment advisory agreement with Invesco Advisers, Inc. (the “Adviser” or “Invesco”). Under the terms of the investment advisory agreement, the Fund pays an advisory fee to the Adviser based on the annual rate of the Fund’s average daily net assets as follows:
| Average Daily Net Assets | Rate | |||||
First $1 billion | 0 | .47% | ||||
Next $500 million | 0 | .445% | ||||
Next $500 million | 0 | .42% | ||||
Next $500 million | 0 | .395% | ||||
Next $2.5 billion | 0 | .37% | ||||
Next $2.5 billion | 0 | .345% | ||||
Next $2.5 billion | 0 | .32% | ||||
Next $2.5 billion | 0 | .295% | ||||
Over $12.5 billion | 0 | .27% | ||||
For the year ended December 31, 2014, the effective advisory fees incurred by the Fund was 0.47%.
Under the terms of a master sub-advisory agreement between the Adviser and each of Invesco Asset Management Deutschland GmbH, Invesco Asset Management Limited, Invesco Asset Management (Japan) Limited, Invesco Australia Limited, Invesco Hong Kong Limited, Invesco Senior Secured Management, Inc. and Invesco Canada Ltd. (collectively, the “Affiliated Sub-Advisers”) the Adviser, not the Fund, may pay 40% of the fees paid to the Adviser to any such Affiliated Sub-Adviser(s) that provide(s) discretionary investment management services to the Fund based on the percentage of assets allocated to such Sub-Adviser(s).
The Adviser has contractually agreed, through at least June 30, 2015, to waive advisory fees and/or reimburse expenses of all shares to the extent necessary to limit total annual fund operating expenses after fee waiver and/or expense reimbursement (excluding certain items discussed below) of Class A, Class B, Class C, Class Y and Class R5 shares to 1.50%, 2.25%, 2.25%, 1.25% and 1.25%, respectively, of average daily net assets. In determining the Adviser’s obligation to waive advisory fees and/or reimburse expenses, the following expenses are not taken into account, and could cause the total annual fund operating expenses after fee waiver and/or expense reimbursement to exceed the numbers reflected above: (1) interest; (2) taxes; (3) dividend expense on short sales; (4) extraordinary or non-routine items, including litigation expenses; and (5) expenses that the Fund has incurred but did not actually pay because of an expense offset arrangement. Unless Invesco continues the fee waiver agreement, it will terminate on June 30, 2015. The fee waiver agreement cannot be terminated during its term. The Adviser did not waive fees and/or reimburse expenses during the period under the expense limitation.
Further, the Adviser has contractually agreed, through at least June 30, 2016, to waive the advisory fee payable by the Fund in an amount equal to 100% of the net advisory fees the Adviser receives from the affiliated money market funds on investments by the Fund of uninvested cash in such affiliated money market funds.
For the year ended December 31, 2014, the Adviser waived advisory fees of $15,009.
The Trust has entered into a master administrative services agreement with Invesco pursuant to which the Fund has agreed to pay Invesco for certain administrative costs incurred in providing accounting services to the Fund. For the year ended December 31, 2014, expenses incurred under the agreement are shown in the Statement of Operations as Administrative services fees.
The Trust has entered into a transfer agency and service agreement with Invesco Investment Services, Inc. (“IIS”) pursuant to which the Fund has agreed to pay IIS a fee for providing transfer agency and shareholder services to the Fund and reimburse IIS for certain expenses incurred by IIS in the course of providing such services. IIS may make payments to intermediaries that provide omnibus account services, sub-accounting services and/or networking services. All fees payable by IIS to intermediaries that provide omnibus account services or sub-accounting are charged back to the Fund, subject to certain limitations approved by the Trust’s Board of Trustees. For the year ended December 31, 2014, expenses incurred under the agreement are shown in the Statement of Operations as Transfer agent fees.
Shares of the Fund are distributed by Invesco Distributors, Inc. (“IDI”). The Fund has adopted a distribution plan pursuant to Rule 12b-1 under the 1940 Act, and a service plan (collectively, the “Plans”) for Class A shares, Class B shares and Class C shares to compensate IDI for the sale, distribution, shareholder servicing and maintenance of shareholder accounts for these shares. Under the Plans, the Fund will incur annual fees of up to 0.25% of Class A average daily net assets and up to 1.00% each of Class B and Class C average daily net assets.
With respect to Class B and Class C shares, the Fund is authorized to reimburse in future years any distribution related expenses that exceed the maximum annual reimbursement rate for such class, so long as such reimbursement does not cause the Fund to exceed the Class B and Class C maximum annual reimbursement rate, respectively. With respect to Class A shares, distribution related expenses that exceed the maximum annual reimbursement rate for such class are not carried forward to future years and the Fund will not reimburse IDI for any such expenses.
For the year ended December 31, 2014, expenses incurred under these agreements are shown in the Statement of Operations as Distribution fees.
Front-end sales commissions and CDSC (collectively, the “sales charges”) are not recorded as expenses of the Fund. Front-end sales commissions are deducted from proceeds from the sales of Fund shares prior to investment in Class A shares of the Fund. CDSC are deducted from redemption proceeds prior to remittance to the shareholder. During the year ended December 31, 2014, IDI advised the Fund that IDI retained $11,110 in front-end sales commissions from the sale of Class A shares and $1,031, $1,701 and $110 from Class A, Class B and Class C shares, respectively, for CDSC imposed on redemptions by shareholders.
Certain officers and trustees of the Trust are officers and directors of the Adviser, IIS and/or IDI.
18 Invesco U.S. Mortgage Fund
NOTE 3—Additional Valuation Information
GAAP defines fair value as the price that would be received to sell an asset or paid to transfer a liability in an orderly transaction between market participants at the measurement date, under current market conditions. GAAP establishes a hierarchy that prioritizes the inputs to valuation methods, giving the highest priority to readily available unadjusted quoted prices in an active market for identical assets (Level 1) and the lowest priority to significant unobservable inputs (Level 3), generally when market prices are not readily available or are unreliable. Based on the valuation inputs, the securities or other investments are tiered into one of three levels. Changes in valuation methods may result in transfers in or out of an investment’s assigned level:
| Level 1 — | Prices are determined using quoted prices in an active market for identical assets. |
| Level 2 — | Prices are determined using other significant observable inputs. Observable inputs are inputs that other market participants may use in pricing a security. These may include quoted prices for similar securities, interest rates, prepayment speeds, credit risk, yield curves, loss severities, default rates, discount rates, volatilities and others. |
| Level 3 — | Prices are determined using significant unobservable inputs. In situations where quoted prices or observable inputs are unavailable (for example, when there is little or no market activity for an investment at the end of the period), unobservable inputs may be used. Unobservable inputs reflect the Fund’s own assumptions about the factors market participants would use in determining fair value of the securities or instruments and would be based on the best available information. |
The following is a summary of the tiered valuation input levels, as of December 31, 2014. The level assigned to the securities valuations may not be an indication of the risk or liquidity associated with investing in those securities. Because of the inherent uncertainties of valuation, the values reflected in the financial statements may materially differ from the value received upon actual sale of those investments.
| Level 1 | Level 2 | Level 3 | Total | |||||||||||||
Equity Securities | $ | 14,085,930 | $ | — | $ | — | $ | 14,085,930 | ||||||||
U.S. Treasury Securities | — | 1,354,784 | — | 1,354,784 | ||||||||||||
U.S. Government Sponsored Securities | — | 465,586,791 | — | 465,586,791 | ||||||||||||
Asset-Backed Securities | — | 172,313,427 | — | 172,313,427 | ||||||||||||
Non-Agency Obligations | — | 4,229,944 | — | 4,229,944 | ||||||||||||
| 14,085,930 | 643,484,946 | — | 657,570,876 | |||||||||||||
Futures Contracts* | (246,242 | ) | — | — | (246,242 | ) | ||||||||||
Total Investments | $ | 13,839,688 | $ | 643,484,946 | $ | — | $ | 657,324,634 | ||||||||
| * | Unrealized appreciation (depreciation). |
NOTE 4—Derivative Investments
Value of Derivative Investments at Period-End
The table below summarizes the value of the Fund’s derivative investments, detailed by primary risk exposure, held as of December 31, 2014:
| Value | ||||||||
| Risk Exposure/Derivative Type | Assets | Liabilities | ||||||
Interest rate risk: | ||||||||
Futures contracts(a) | $ | 218,636 | $ | (464,878 | ) | |||
| (a) | Includes cumulative appreciation (depreciation) of futures contracts. Only current day’s variation margin receivable (payable) is reported within the Statement of Assets and Liabilities. |
Effect of Derivative Investments for the year ended December 31, 2014
The table below summarizes the gains (losses) on derivative investments, detailed by primary risk exposure, recognized in earnings during the period:
| Location of Gain (Loss) on Statement of Operations | ||||
| Futures Contracts | ||||
Realized Gain (Loss): | ||||
Interest rate risk | $ | (1,304,807 | ) | |
Change in Unrealized Appreciation (Depreciation): | ||||
Interest rate risk | (577,646 | ) | ||
Total | $ | (1,882,453 | ) | |
The table below summarizes the average notional value of futures contracts.
| Futures Contracts | ||||
Average notional value | $ | 101,586,759 | ||
19 Invesco U.S. Mortgage Fund
| Open Futures Contracts | ||||||||||||||||||||
| Futures Contracts | Type of Contract | Number of Contracts | Expiration Month | Notional Value | Unrealized Appreciation (Depreciation) | |||||||||||||||
U.S. Treasury 2 Year Notes | Short | 202 | March-2015 | 44,155,938 | $ | 84,787 | ||||||||||||||
U.S. Treasury 5 Year Notes | Short | 174 | March-2015 | 20,693,766 | 10,503 | |||||||||||||||
U.S. Treasury 30 Year Bonds | Short | 118 | March-2015 | 17,058,375 | (464,878 | ) | ||||||||||||||
Ultra U.S. Treasury Bonds | Long | 17 | March-2015 | 2,808,188 | 123,346 | |||||||||||||||
Total Futures Contracts — Interest Rate Risk | $ | (246,242 | ) | |||||||||||||||||
NOTE 5—Expense Offset Arrangement(s)
The expense offset arrangement is comprised of transfer agency credits which result from balances in demand deposit accounts used by the transfer agent for clearing shareholder transactions. For the year ended December 31, 2014, the Fund received credits from this arrangement, which resulted in the reduction of the Fund’s total expenses of $1,664.
NOTE 6—Trustees’ and Officers’ Fees and Benefits
Trustees’ and Officers’ Fees and Benefits include amounts accrued by the Fund to pay remuneration to certain Trustees and Officers of the Fund. Trustees have the option to defer compensation payable by the Fund, and Trustees’ and Officers’ Fees and Benefits also include amounts accrued by the Fund to fund such deferred compensation amounts. Those Trustees who defer compensation have the option to select various Invesco Funds in which their deferral accounts shall be deemed to be invested. Finally, certain current Trustees were eligible to participate in a retirement plan that provided for benefits to be paid upon retirement to Trustees over a period of time based on the number of years of service. The Fund may have certain former Trustees who also participate in a retirement plan and receive benefits under such plan. Trustees’ and Officers’ Fees and Benefits include amounts accrued by the Fund to fund such retirement benefits. Obligations under the deferred compensation and retirement plans represent unsecured claims against the general assets of the Fund.
NOTE 7—Cash Balances
The Fund may borrow for leveraging in an amount up to 5% of the Fund’s total assets (excluding the amount borrowed) at the time the borrowing is made. In doing so, the Fund is permitted to temporarily carry a negative or overdrawn balance in its account with State Street Bank and Trust Company, the custodian bank. Such balances, if any at period end, are shown in the Statement of Assets and Liabilities under the payable caption Amount due custodian. To compensate the custodian bank for such overdrafts, the overdrawn Fund may either (1) leave funds as a compensating balance in the account so the custodian bank can be compensated by earning the additional interest; or (2) compensate by paying the custodian bank at a rate agreed upon by the custodian bank and Invesco, not to exceed the contractually agreed upon rate. A Fund may not purchase additional securities when any borrowings from banks exceeds 5% of the Fund’s total assets.
NOTE 8—Distributions to Shareholders and Tax Components of Net Assets
Tax Character of Distributions to Shareholders Paid During the Fiscal Years Ended December 31, 2014 and 2013:
| 2014 | 2013 | |||||||
Ordinary income | $ | 19,962,452 | $ | 18,719,573 | ||||
Tax Components of Net Assets at Period-End:
| 2014 | ||||
Undistributed ordinary income | $ | 445,496 | ||
Net unrealized appreciation — investments | 8,866,540 | |||
Temporary book/tax differences | (76,789 | ) | ||
Capital loss carryforward | (123,758,633 | ) | ||
Shares of beneficial interest | 568,338,786 | |||
Total net assets | $ | 453,815,400 | ||
The difference between book-basis and tax-basis unrealized appreciation (depreciation) is due to differences in the timing of recognition of gains and losses on investments for tax and book purposes. The Fund’s net unrealized appreciation difference is attributable primarily to wash sales and bond amortization.
The temporary book/tax differences are a result of timing differences between book and tax recognition of income and/or expenses. The Fund’s temporary book/tax differences are the result of the trustee deferral of compensation and retirement plan benefits.
Capital loss carryforward is calculated and reported as of a specific date. Results of transactions and other activity after that date may affect the amount of capital loss carryforward actually available for the Fund to utilize. Capital losses generated in years beginning after December 22, 2010 can be carried forward for an unlimited period, whereas previous losses expire in eight tax years. Capital losses with an expiration period may not be used to offset capital gains until all net capital losses without an expiration date have been utilized. Capital loss carryforwards with no expiration date will retain their character as either short-term or long-term capital losses instead of as short-term capital losses as under prior law. The ability to utilize capital loss carryforwards in the future may be limited under the Internal Revenue Code and related regulations based on the results of future transactions.
20 Invesco U.S. Mortgage Fund
The Fund utilized $5,059,411 of capital loss carryforward in the current period to offset net realized capital gain for federal income tax purposes. The Fund has a capital loss carryforward as of December 31, 2014, which expires as follows:
| Capital Loss Carryforward* | ||||||||||||
| Expiration | Short-Term | Long-Term | Total | |||||||||
December 31, 2015 | $ | 18,400,921 | $ | — | $ | 18,400,921 | ||||||
December 31, 2016 | 91,151,310 | — | 91,151,310 | |||||||||
Not subject to expiration | 9,389,992 | 4,816,410 | 14,206,402 | |||||||||
| $ | 118,942,223 | $ | 4,816,410 | $ | 123,758,633 | |||||||
| * | Capital loss carryforward as of the date listed above is reduced for limitations, if any, to the extent required by the Internal Revenue Code and may be further limited depending upon a variety of factors, including the realization of net unrealized gains or losses as of the date of any reorganization. |
NOTE 9—Investment Securities
The aggregate amount of investment securities (other than short-term securities, U.S. Treasury obligations and money market funds, if any) purchased and sold by the Fund during the year ended December 31, 2014 was $2,821,073,531 and $2,807,535,317, respectively. Cost of investments on a tax basis includes the adjustments for financial reporting purposes as of the most recently completed federal income tax reporting period-end.
| Unrealized Appreciation (Depreciation) of Investment Securities on a Tax Basis | ||||
Aggregate unrealized appreciation of investment securities | $ | 12,381,713 | ||
Aggregate unrealized (depreciation) of investment securities | (3,515,173 | ) | ||
Net unrealized appreciation of investment securities | $ | 8,866,540 | ||
Cost of investments for tax purposes is $648,704,336.
NOTE 10—Reclassification of Permanent Differences
Primarily as a result of differing book/tax treatment of paydowns, dollar rolls and expired capital loss carryforward, on December 31, 2014, undistributed net investment income was increased by $9,040,252 and undistributed net realized gain (loss) was increased by $3,188,689 and shares of beneficial interest was decreased by $12,228,941. This reclassification had no effect on the net assets of the Fund.
21 Invesco U.S. Mortgage Fund
NOTE 11—Share Information
| Summary of Share Activity | ||||||||||||||||
| Years ended December 31, | ||||||||||||||||
| 2014(a) | 2013 | |||||||||||||||
| Shares | Amount | Shares | Amount | |||||||||||||
Sold: | ||||||||||||||||
Class A | 2,331,170 | $ | 29,176,659 | 1,139,557 | $ | 14,539,629 | ||||||||||
Class B | 6,987 | 86,900 | 45,634 | 577,025 | ||||||||||||
Class C | 286,853 | 3,557,354 | 169,393 | 2,151,995 | ||||||||||||
Class Y | 1,497,316 | 18,809,397 | 90,497 | 1,165,042 | ||||||||||||
Class R5 | 459 | 5,789 | — | — | ||||||||||||
Issued as reinvestment of dividends: | ||||||||||||||||
Class A | 1,125,151 | 14,058,377 | 1,034,477 | 13,061,779 | ||||||||||||
Class B | 7,037 | 87,430 | 8,196 | 103,128 | ||||||||||||
Class C | 18,399 | 228,300 | 16,384 | 205,278 | ||||||||||||
Class Y | 18,060 | 226,717 | 8,172 | 103,843 | ||||||||||||
Automatic conversion of Class B shares to Class A shares: | ||||||||||||||||
Class A | 53,100 | 662,730 | 92,276 | 1,171,812 | ||||||||||||
Class B | (53,376 | ) | (662,730 | ) | (92,742 | ) | (1,171,812 | ) | ||||||||
Reacquired: | ||||||||||||||||
Class A | (5,414,289 | ) | (67,602,867 | ) | (7,369,656 | ) | (93,351,194 | ) | ||||||||
Class B | (49,884 | ) | (618,750 | ) | (143,117 | ) | (1,814,066 | ) | ||||||||
Class C | (290,257 | ) | (3,599,799 | ) | (478,952 | ) | (6,007,408 | ) | ||||||||
Class Y | (164,193 | ) | (2,062,985 | ) | (204,462 | ) | (2,600,720 | ) | ||||||||
Class R5 | (28 | ) | (353 | ) | — | — | ||||||||||
Net increase (decrease) in share activity | (627,495 | ) | $ | (7,647,831 | ) | (5,684,343 | ) | $ | (71,865,669 | ) | ||||||
| (a) | There are entities that are record owners of more than 5% of the outstanding shares of the Fund and in the aggregate own 18% of the outstanding shares of the Fund. IDI has an agreement with these entities to sell Fund shares. The Fund, Invesco and/or Invesco affiliates may make payments to these entities, which are considered to be related to the Fund, for providing services to the Fund, Invesco and/or Invesco affiliates including but not limited to services such as securities brokerage, distribution, third party record keeping and account servicing. The Fund has no knowledge as to whether all or any portion of the shares owned of record by these entities are also owned beneficially. |
22 Invesco U.S. Mortgage Fund
NOTE 12—Financial Highlights
The following schedule presents financial highlights for a share of the Fund outstanding throughout the periods indicated.
| Net asset value, beginning of period | Net investment income(a) | Net gains (losses) on securities (both realized and unrealized) | Total from investment operations | Dividends from net investment income | Net asset value, end of period | Total return(b) | Net assets, end of period (000’s omitted) | Ratio of expenses to average net assets with fee waivers and/or expenses absorbed | Ratio of expenses to average net assets without fee waivers and/or expenses absorbed | Ratio of net investment income to average net assets | Portfolio turnover(c) | |||||||||||||||||||||||||||||||||||||
Class A |
| |||||||||||||||||||||||||||||||||||||||||||||||
Year ended 12/31/14 | $ | 12.35 | $ | 0.28 | $ | 0.48 | $ | 0.76 | $ | (0.56 | ) | $ | 12.55 | 6.27 | %(d) | $ | 424,259 | 0.96 | %(d)(e) | 0.96 | %(d)(e) | 2.28 | %(d)(e) | 450 | % | |||||||||||||||||||||||
Year ended 12/31/13 | 13.02 | 0.21 | (0.40 | ) | (0.19 | ) | (0.48 | ) | 12.35 | (1.51 | )(d) | 441,028 | 0.94 | (d) | 0.94 | (d) | 1.63 | (d) | 475 | |||||||||||||||||||||||||||||
Year ended 12/31/12 | 12.99 | 0.25 | 0.33 | 0.58 | (0.55 | ) | 13.02 | 4.54 | 531,547 | 0.94 | 0.94 | 1.88 | 451 | |||||||||||||||||||||||||||||||||||
Year ended 12/31/11 | 13.00 | 0.39 | 0.26 | 0.65 | (0.66 | ) | 12.99 | 5.06 | 564,871 | 0.90 | 0.90 | 2.99 | 395 | |||||||||||||||||||||||||||||||||||
Year ended 12/31/10 | 12.75 | 0.40 | 0.28 | 0.68 | (0.43 | ) | 13.00 | 5.41 | 610,214 | 0.91 | 0.91 | 3.07 | 370 | |||||||||||||||||||||||||||||||||||
Class B |
| |||||||||||||||||||||||||||||||||||||||||||||||
Year ended 12/31/14 | 12.28 | 0.18 | 0.48 | 0.66 | (0.46 | ) | 12.48 | 5.48 | 2,135 | 1.72 | (e) | 1.72 | (e) | 1.52 | (e) | 450 | ||||||||||||||||||||||||||||||||
Year ended 12/31/13 | 12.95 | 0.11 | (0.40 | ) | (0.29 | ) | (0.38 | ) | 12.28 | (2.28 | ) | 3,197 | 1.70 | 1.70 | 0.87 | 475 | ||||||||||||||||||||||||||||||||
Year ended 12/31/12 | 12.93 | 0.15 | 0.32 | 0.47 | (0.45 | ) | 12.95 | 3.67 | 5,729 | 1.69 | 1.69 | 1.13 | 451 | |||||||||||||||||||||||||||||||||||
Year ended 12/31/11 | 12.92 | 0.29 | 0.27 | 0.56 | (0.55 | ) | 12.93 | 4.43 | 8,186 | 1.66 | 1.66 | 2.23 | 395 | |||||||||||||||||||||||||||||||||||
Year ended 12/31/10 | 12.67 | 0.31 | 0.27 | 0.58 | (0.33 | ) | 12.92 | 4.64 | 13,574 | 1.67 | 1.67 | 2.37 | 370 | |||||||||||||||||||||||||||||||||||
Class C |
| |||||||||||||||||||||||||||||||||||||||||||||||
Year ended 12/31/14 | 12.26 | 0.19 | 0.47 | 0.66 | (0.46 | ) | 12.46 | 5.48 | 8,100 | 1.72 | (e) | 1.72 | (e) | 1.52 | (e) | 450 | ||||||||||||||||||||||||||||||||
Year ended 12/31/13 | 12.93 | 0.11 | (0.40 | ) | (0.29 | ) | (0.38 | ) | 12.26 | (2.29 | ) | 7,788 | 1.70 | 1.70 | 0.87 | 475 | ||||||||||||||||||||||||||||||||
Year ended 12/31/12 | 12.90 | 0.15 | 0.33 | 0.48 | (0.45 | ) | 12.93 | 3.75 | 12,003 | 1.69 | 1.69 | 1.13 | 451 | |||||||||||||||||||||||||||||||||||
Year ended 12/31/11 | 12.91 | 0.29 | 0.25 | 0.54 | (0.55 | ) | 12.90 | 4.27 | 9,308 | 1.66 | 1.66 | 2.23 | 395 | |||||||||||||||||||||||||||||||||||
Year ended 12/31/10 | 12.66 | 0.30 | 0.28 | 0.58 | (0.33 | ) | 12.91 | 4.64 | 9,559 | 1.67 | 1.67 | 2.33 | 370 | |||||||||||||||||||||||||||||||||||
Class Y(f) |
| |||||||||||||||||||||||||||||||||||||||||||||||
Year ended 12/31/14 | 12.39 | 0.32 | 0.47 | 0.79 | (0.59 | ) | 12.59 | 6.52 | 19,306 | 0.72 | (e) | 0.72 | (e) | 2.52 | (e) | 450 | ||||||||||||||||||||||||||||||||
Year ended 12/31/13 | 13.07 | 0.24 | (0.41 | ) | (0.17 | ) | (0.51 | ) | 12.39 | (1.32 | ) | 2,254 | 0.70 | 0.70 | 1.87 | 475 | ||||||||||||||||||||||||||||||||
Year ended 12/31/12 | 13.04 | 0.28 | 0.33 | 0.61 | (0.58 | ) | 13.07 | 4.79 | 3,759 | 0.69 | 0.69 | 2.13 | 451 | |||||||||||||||||||||||||||||||||||
Year ended 12/31/11 | 13.04 | 0.42 | 0.27 | 0.69 | (0.69 | ) | 13.04 | 5.40 | 1,721 | 0.66 | 0.66 | 3.23 | 395 | |||||||||||||||||||||||||||||||||||
Year ended 12/31/10 | 12.79 | 0.42 | �� | 0.30 | 0.72 | (0.47 | ) | 13.04 | 5.65 | 2,353 | 0.67 | 0.67 | 3.26 | 370 | ||||||||||||||||||||||||||||||||||
Class R5 |
| |||||||||||||||||||||||||||||||||||||||||||||||
Year ended 12/31/14 | 12.39 | 0.33 | 0.47 | 0.80 | (0.60 | ) | 12.59 | 6.56 | 15 | 0.67 | (e) | 0.67 | (e) | 2.57 | (e) | 450 | ||||||||||||||||||||||||||||||||
Year ended 12/31/13 | 13.06 | 0.25 | (0.41 | ) | (0.16 | ) | (0.51 | ) | 12.39 | (1.23 | ) | 10 | 0.66 | 0.66 | 1.91 | 475 | ||||||||||||||||||||||||||||||||
Year ended 12/31/12 | 13.03 | 0.28 | 0.33 | 0.61 | (0.58 | ) | 13.06 | 4.80 | 10 | 0.65 | 0.65 | 2.17 | 451 | |||||||||||||||||||||||||||||||||||
Year ended 12/31/11 | 13.04 | 0.43 | 0.26 | 0.69 | (0.70 | ) | 13.03 | 5.38 | 10 | 0.63 | 0.63 | 3.26 | 395 | |||||||||||||||||||||||||||||||||||
Year ended 12/31/10(g) | 13.06 | 0.35 | (0.09 | ) | 0.26 | (0.28 | ) | 13.04 | 2.00 | 10 | 0.59 | (h) | 0.59 | (h) | 4.51 | (h) | 370 | |||||||||||||||||||||||||||||||
| (a) | Calculated using average shares outstanding. |
| (b) | Includes adjustments in accordance with accounting principles generally accepted in the United States of America and as such, the net asset value for financial reporting purposes and the returns based upon those net asset values may differ from the net asset value and returns for shareholder transactions. Does not include sales charges and is not annualized for periods less than one year, if applicable. |
| (c) | Portfolio turnover is calculated at the fund level and is not annualized for periods less than one year, if applicable. |
| (d) | The total return, ratio of expenses to average net assets and ratio of net investment income to average net assets reflect actual 12b-1 fees of 0.24% for the years ended December 31, 2014 and 2013. |
| (e) | Ratios are based on average daily net assets (000’s omitted) of $428,499, $2,624, $7,852, $6,996 and $11 for Class A, Class B, Class C, Class Y and Class R5 shares, respectively. |
| (f) | On June 1, 2010, the Fund’s former Class I shares of Invesco Van Kampen U.S. Mortgage Fund were reorganized into Class Y shares of the Fund. |
| (g) | Commencement date of June 1, 2010. |
| (h) | Annualized. |
23 Invesco U.S. Mortgage Fund
Report of Independent Registered Public Accounting Firm
To the Board of Trustees of AIM Growth Series (Invesco Growth Series)
and Shareholders of Invesco U.S. Mortgage Fund:
In our opinion, the accompanying statement of assets and liabilities, including the schedule of investments, and the related statements of operations and of changes in net assets and the financial highlights present fairly, in all material respects, the financial position of Invesco U.S. Mortgage Fund (one of the funds constituting AIM Growth Series (Invesco Growth Series), hereafter referred to as the “Fund”) at December 31, 2014, the results of its operations for the year then ended, the changes in its net assets for each of the two years in the period then ended and the financial highlights for each of the five years in the period then ended, in conformity with accounting principles generally accepted in the United States of America. These financial statements and financial highlights (hereafter referred to as “financial statements”) are the responsibility of the Fund’s management. Our responsibility is to express an opinion on these financial statements based on our audits. We conducted our audits of these financial statements in accordance with the standards of the Public Company Accounting Oversight Board (United States). Those standards require that we plan and perform the audit to obtain reasonable assurance about whether the financial statements are free of material misstatement. An audit includes examining, on a test basis, evidence supporting the amounts and disclosures in the financial statements, assessing the accounting principles used and significant estimates made by management, and evaluating the overall financial statement presentation. We believe that our audits, which included confirmation of securities at December 31, 2014 by correspondence with the custodian and brokers, and the application of alternative auditing procedures where confirmations of security purchases have not been received, provide a reasonable basis for our opinion.
PRICEWATERHOUSECOOPERS LLP
Houston, Texas
February 23, 2015
24 Invesco U.S. Mortgage Fund
Calculating your ongoing Fund expenses
Example
As a shareholder of the Fund, you incur two types of costs: (1) transaction costs, which may include sales charges (loads) on purchase payments or contingent deferred sales charges on redemptions, if any; and (2) ongoing costs, including management fees, distribution and/or service (12b-1) fees, and other Fund expenses. This example is intended to help you understand your ongoing costs (in dollars) of investing in the Fund and to compare these costs with ongoing costs of investing in other mutual funds. The example is based on an investment of $1,000 invested at the beginning of the period and held for the entire period July 1, 2014 through December 31, 2014.
Actual expenses
The table below provides information about actual account values and actual expenses. You may use the information in this table, together with the amount you invested, to estimate the expenses that you paid over the period. Simply divide your account value by $1,000 (for example, an $8,600 account value divided by $1,000 = 8.6), then multiply the result by the number in the table under the heading entitled “Actual Expenses Paid During Period” to estimate the expenses you paid on your account during this period.
Hypothetical example for comparison purposes
The table below also provides information about hypothetical account values and hypothetical expenses based on the Fund’s actual expense ratio and an assumed rate of return of 5% per year before expenses, which is not the Fund’s actual return.
The hypothetical account values and expenses may not be used to estimate the actual ending account balance or expenses you paid for the period. You may use this information to compare the ongoing costs of investing in the Fund and other funds. To do so, compare this 5% hypothetical example with the 5% hypothetical examples that appear in the shareholder reports of the other funds.
Please note that the expenses shown in the table are meant to highlight your ongoing costs only and do not reflect any transaction costs, such as sales charges (loads) on purchase payments or contingent deferred sales charges on redemptions, if any. Therefore, the hypothetical information is useful in comparing ongoing costs only, and will not help you determine the relative total costs of owning different funds. In addition, if these transaction costs were included, your costs would have been higher.
| Class | Beginning Account Value (07/01/14) | ACTUAL | HYPOTHETICAL (5% annual return before expenses) | Annualized Expense Ratio | ||||||||||||||||||||
| Ending Account Value (12/31/14)1 | Expenses Paid During Period2 | Ending Account Value (12/31/14) | Expenses Paid During Period2 | |||||||||||||||||||||
| A | $ | 1,000.00 | $ | 1,021.50 | $ | 4.89 | $ | 1,020.37 | $ | 4.89 | 0.96 | % | ||||||||||||
| B | 1,000.00 | 1,017.70 | 8.75 | 1,016.53 | 8.74 | 1.72 | ||||||||||||||||||
| C | 1,000.00 | 1,017.70 | 8.75 | 1,016.53 | 8.74 | 1.72 | ||||||||||||||||||
| Y | 1,000.00 | 1,022.70 | 3.67 | 1,021.58 | 3.67 | 0.72 | ||||||||||||||||||
| R5 | 1,000.00 | 1,023.00 | 3.42 | 1,021.83 | 3.41 | 0.67 | ||||||||||||||||||
| 1 | The actual ending account value is based on the actual total return of the Fund for the period July 1, 2014 through December 31, 2014, after actual expenses and will differ from the hypothetical ending account value which is based on the Fund’s expense ratio and a hypothetical annual return of 5% before expenses. |
| 2 | Expenses are equal to the Fund’s annualized expense ratio as indicated above multiplied by the average account value over the period, multiplied by 184/365 to reflect the most recent fiscal half year. |
25 Invesco U.S. Mortgage Fund
Tax Information
Form 1099-DIV, Form 1042-S and other year–end tax information provide shareholders with actual calendar year amounts that should be included in their tax returns. Shareholders should consult their tax advisors.
The following distribution information is being provided as required by the Internal Revenue Code or to meet a specific state’s requirement.
The Fund designates the following amounts or, if subsequently determined to be different, the maximum amount allowable for its fiscal year ended December 31, 2014:
Federal and State Income Tax | ||||
Qualified Dividend Income* | 0 | % | ||
Corporate Dividends Received Deduction* | 0 | % | ||
U.S. Treasury Obligations* | 0.14 | % | ||
| * | The above percentages are based on ordinary income dividends paid to shareholders during the Fund’s fiscal year. |
26 Invesco U.S. Mortgage Fund
Trustees and Officers
The address of each trustee and officer is AIM Growth Series (Invesco Growth Series) (the “Trust”), 11 Greenway Plaza, Suite 1000, Houston, Texas 77046-1173. The trustees serve for the life of the Trust, subject to their earlier death, incapacitation, resignation, retirement or removal as more specifically provided in the Trust’s organizational documents. Each officer serves for a one year term or until their successors are elected and qualified. Column two below includes length of time served with predecessor entities, if any.
Name, Year of Birth and Position(s) Held with the Trust | Trustee and/ or Officer Since | Principal Occupation(s) During Past 5 Years | Number of Funds in Fund Complex Overseen by Trustee | Other Directorship(s) Held by Trustee During | ||||
| Interested Persons | ||||||||
| Martin L. Flanagan1 — 1960 Trustee | 2007 | Executive Director, Chief Executive Officer and President, Invesco Ltd. (ultimate parent of Invesco and a global investment management firm); Advisor to the Board, Invesco Advisers, Inc. (formerly known as Invesco Institutional (N.A.), Inc.); Trustee, The Invesco Funds; Vice Chair, Investment Company Institute; and Member of Executive Board, SMU Cox School of Business
Formerly: Chairman and Chief Executive Officer, Invesco Advisers, Inc. (registered investment adviser); Director, Chairman, Chief Executive Officer and President, IVZ Inc. (holding company), INVESCO Group Services, Inc. (service provider) and Invesco North American Holdings, Inc. (holding company); Director, Chief Executive Officer and President, Invesco Holding Company Limited (parent of Invesco and a global investment management firm); Director, Invesco Ltd.; Chairman, Investment Company Institute and President, Co-Chief Executive Officer, Co-President, Chief Operating Officer and Chief Financial Officer, Franklin Resources, Inc. (global investment management organization). | 144 | None | ||||
Philip A. Taylor2 — 1954 Trustee, President and Principal Executive Officer | 2006 | Head of North American Retail and Senior Managing Director, Invesco Ltd.; Director, Co-Chairman, Co-President and Co-Chief Executive Officer, Invesco Advisers, Inc. (formerly known as Invesco Institutional (N.A.), Inc.) (registered investment adviser); Director, Chairman, Chief Executive Officer and President, Invesco Management Group, Inc. (formerly known as Invesco Aim Management Group, Inc.) (financial services holding company); Director and President, INVESCO Funds Group, Inc. (registered investment adviser and registered transfer agent); Director and Chairman, Invesco Investment Services, Inc. (formerly known as Invesco Aim Investment Services, Inc.) (registered transfer agent) and IVZ Distributors, Inc. (formerly known as INVESCO Distributors, Inc.) (registered broker dealer); Director, President and Chairman, Invesco Inc. (holding company) and Invesco Canada Holdings Inc. (holding company); Chief Executive Officer, Invesco Corporate Class Inc. (corporate mutual fund company) and Invesco Canada Fund Inc. (corporate mutual fund company); Director, Chairman and Chief Executive Officer, Invesco Canada Ltd. (formerly known as Invesco Trimark Ltd./Invesco Trimark Ltèe) (registered investment adviser and registered transfer agent); Trustee, President and Principal Executive Officer, The Invesco Funds (other than AIM Treasurer’s Series Trust (Invesco Treasurer’s Series Trust) and Short-Term Investments Trust); Trustee and Executive Vice President, The Invesco Funds (AIM Treasurer’s Series Trust (Invesco Treasurer’s Series Trust) and Short-Term Investments Trust only); Director, Invesco Investment Advisers LLC (formerly known as Van Kampen Asset Management); Director, Chief Executive Officer and President, Van Kampen Exchange Corp.
Formerly: Director and Chairman, Van Kampen Investor Services Inc.; Director, Chief Executive Officer and President, 1371 Preferred Inc. (holding company) and Van Kampen Investments Inc.; Director and President, AIM GP Canada Inc. (general partner for limited partnerships) and Van Kampen Advisors, Inc.; Director and Chief Executive Officer, Invesco Trimark Dealer Inc. (registered broker dealer); Director, Invesco Distributors, Inc. (formerly known as Invesco Aim Distributors, Inc.) (registered broker dealer); Manager, Invesco PowerShares Capital Management LLC; Director, Chief Executive Officer and President, Invesco Advisers, Inc.; Director, Chairman, Chief Executive Officer and President, Invesco Aim Capital Management, Inc.; President, Invesco Trimark Dealer Inc. and Invesco Trimark Ltd./Invesco Trimark Ltèe; Director and President, AIM Trimark Corporate Class Inc. and AIM Trimark Canada Fund Inc.; Senior Managing Director, Invesco Holding Company Limited; Director and Chairman, Fund Management Company (former registered broker dealer); President and Principal Executive Officer, The Invesco Funds (AIM Treasurer’s Series Trust (Invesco Treasurer’s Series Trust), and Short-Term Investments Trust only); President, AIM Trimark Global Fund Inc. and AIM Trimark Canada Fund Inc. | 144 | None | ||||
| Independent Trustees | ||||||||
Bruce L. Crockett — 1944 Trustee and Chair | 2001 | Chairman, Crockett Technologies Associates (technology consulting company)
Formerly: Director, Captaris (unified messaging provider); Director, President and Chief Executive Officer, COMSAT Corporation; Chairman, Board of Governors of INTELSAT (international communications company); ACE Limited (insurance company); and Investment Company Institute | 144 | ALPS (Attorneys Liability Protection Society) (insurance company) |
| 1 | Mr. Flanagan is considered an interested person (within the meaning of Section 2(a)(19) of the 1940 Act) of the Trust because he is an officer of the Adviser to the Trust, and an officer and a director of Invesco Ltd., ultimate parent of the Adviser. |
| 2 | Mr. Taylor is considered an interested person (within the meaning of Section 2(a)(19) of the 1940 Act) of the Trust because he is an officer and a director of the Adviser. |
T-1 Invesco U.S. Mortgage Fund
Trustees and Officers—(continued)
Name, Year of Birth and Position(s) Held with the Trust | Trustee and/ or Officer Since | Principal Occupation(s) During Past 5 Years | Number of Funds in Fund Complex Overseen by Trustee | Other Directorship(s) Held by Trustee During | ||||
| Independent Trustees—(continued) | ||||||||
David C. Arch — 1945 Trustee | 2010 | Chairman of Blistex Inc., a consumer health care products manufacturer | 144 | Board member of the Illinois Manufacturers’ Association; Member of the Board of Visitors, Institute for the Humanities, University of Michigan; Member of the Audit Committee of the Edward-Elmhurst Hospital | ||||
James T. Bunch — 1942 Trustee | 2003 | Managing Member, Grumman Hill Group LLC (family office private equity investments)
Formerly: Founder, Green Manning & Bunch Ltd. (investment banking firm) (1988-2010); Executive Committee, United States Golf Association; and Director, Policy Studies, Inc. and Van Gilder Insurance Corporation | 144 | Chairman, Board of Governors, Western Golf Association; Chairman, Evans Scholars Foundation; and Director, Denver Film Society | ||||
Rodney F. Dammeyer — 1940 Trustee | 2010 | Chairman of CAC, LLC, (private company offering capital investment and management advisory services)
Formerly: Prior to 2001, Managing Partner at Equity Group Corporate Investments; Prior to 1995, Chief Executive Officer of Itel Corporation (formerly Anixter International); Prior to 1985, experience includes Senior Vice President and Chief Financial Officer of Household International, Inc., Executive Vice President and Chief Financial Officer of Northwest Industries, Inc. and Partner of Arthur Andersen & Co.; From 1987 to 2010, Director/Trustee of investment companies in the Van Kampen Funds complex | 144 | Director of Quidel Corporation and Stericycle, Inc. | ||||
Albert R. Dowden — 1941 Trustee | 2001 | Director of a number of public and private business corporations, including the Boss Group, Ltd. (private investment and management); Nature’s Sunshine Products, Inc. and Reich & Tang Funds (5 portfolios) (registered investment company)
Formerly: Director, Homeowners of America Holding Corporation/Homeowners of America Insurance Company (property casualty company); Director, Continental Energy Services, LLC (oil and gas pipeline service); Director, CompuDyne Corporation (provider of product and services to the public security market) and Director, Annuity and Life Re (Holdings), Ltd. (reinsurance company); Director, President and Chief Executive Officer, Volvo Group North America, Inc.; Senior Vice President, AB Volvo; Director of various public and private corporations; Chairman, DHJ Media, Inc.; Director, Magellan Insurance Company; and Director, The Hertz Corporation, Genmar Corporation (boat manufacturer), National Media Corporation; Advisory Board of Rotary Power International (designer, manufacturer, and seller of rotary power engines); and Chairman, Cortland Trust, Inc. (registered investment company) | 144 | Director of: Nature’s Sunshine Products, Inc., Reich & Tang Funds, Homeowners of America Holding Corporation/ Homeowners of America Insurance Company, the Boss Group | ||||
Jack M. Fields — 1952 Trustee | 2001 | Chief Executive Officer, Twenty First Century Group, Inc. (government affairs company); Owner and Chief Executive Officer, Dos Angeles Ranch, L.P. (cattle, hunting, corporate entertainment); and Discovery Global Education Fund (non-profit)
Formerly: Chief Executive Officer, Texana Timber LP (sustainable forestry company); Director of Cross Timbers Quail Research Ranch (non-profit); and member of the U.S. House of Representatives | 144 | Insperity, Inc. (formerly known as Administaff) | ||||
Prema Mathai-Davis — 1950 Trustee | 2001 | Retired. Formerly: Chief Executive Officer, YWCA of the U.S.A. | 144 | None | ||||
Larry Soll — 1942 Trustee | 2003 | Retired. Formerly: Chairman, Chief Executive Officer and President, Synergen Corp. (a biotechnology company) | 144 | None | ||||
Hugo F. Sonnenschein — 1940 Trustee | 2010 | President Emeritus and Honorary Trustee of the University of Chicago and the Adam Smith Distinguished Service Professor in the Department of Economics at the University of Chicago. Prior to 2000, President of the University of Chicago | 144 | Trustee of the University of Rochester and a member of its investment committee; Member of the National Academy of Sciences and the American Philosophical Society; Fellow of the American Academy of Arts and Sciences | ||||
Raymond Stickel, Jr. — 1944 Trustee | 2005 | Retired. Formerly: Director, Mainstay VP Series Funds, Inc. (25 portfolios) and Partner, Deloitte & Touche | 144 | None | ||||
T-2 Invesco U.S. Mortgage Fund
Trustees and Officers—(continued)
Name, Year of Birth and Position(s) Held with the Trust | Trustee and/ or Officer Since | Principal Occupation(s) During Past 5 Years | Number of Funds in Fund Complex Overseen by Trustee | Other Directorship(s) Held by Trustee During | ||||
| Independent Trustees—(continued) | ||||||||
Suzanne H. Woolsey — 1941 Trustee | 2014 | Chief Executive Officer of Woolsey Partners LLC | 144 | Emeritus Chair of the Board of Trustees of the Institute for Defense Analyses; Trustee of Colorado College; Trustee of California Institute of Technology; Prior to 2014, Director of Fluor Corp.; Prior to 2010, Trustee of the German Marshall Fund of the United States; Prior to 2010 Trustee of the Rocky Mountain Institute | ||||
| Other Officers | ||||||||
Russell C. Burk — 1958 Senior Vice President and Senior Officer | 2005 | Senior Vice President and Senior Officer, The Invesco Funds | N/A | N/A | ||||
John M. Zerr — 1962 Senior Vice President, Chief Legal Officer and Secretary | 2006 | Director, Senior Vice President, Secretary and General Counsel, Invesco Management Group, Inc. (formerly known as Invesco Aim Management Group, Inc.) and Van Kampen Exchange Corp.; Senior Vice President, Invesco Advisers, Inc. (formerly known as Invesco Institutional (N.A.), Inc.) (registered investment adviser); Senior Vice President and Secretary, Invesco Distributors, Inc. (formerly known as Invesco Aim Distributors, Inc.); Director, Vice President and Secretary, Invesco Investment Services, Inc. (formerly known as Invesco Aim Investment Services, Inc.) and IVZ Distributors, Inc. (formerly known as INVESCO Distributors, Inc.); Director and Vice President, INVESCO Funds Group, Inc.; Senior Vice President, Chief Legal Officer and Secretary, The Invesco Funds; Manager, Invesco PowerShares Capital Management LLC; Director, Secretary and General Counsel, Invesco Investment Advisers LLC (formerly known as Van Kampen Asset Management); Secretary and General Counsel, Invesco Capital Markets, Inc. (formerly known as Van Kampen Funds Inc.) and Chief Legal Officer, PowerShares Exchange-Traded Fund Trust, PowerShares Exchange-Traded Fund Trust II, PowerShares India Exchange-Traded Fund Trust , PowerShares Actively Managed Exchange-Traded Fund Trust; and PowerShares Actively Managed Exchange-Traded Commodity Fund Trust
Formerly: Director and Vice President, Van Kampen Advisors Inc.; Director, Vice President, Secretary and General Counsel, Van Kampen Investor Services Inc.; Director, Invesco Distributors, Inc. (formerly known as Invesco Aim Distributors, Inc.); Director, Senior Vice President, General Counsel and Secretary, Invesco Aim Advisers, Inc. and Van Kampen Investments Inc.; Director, Vice President and Secretary, Fund Management Company; Director, Senior Vice President, Secretary, General Counsel and Vice President, Invesco Aim Capital Management, Inc.; Chief Operating Officer and General Counsel, Liberty Ridge Capital, Inc. (an investment adviser); Vice President and Secretary, PBHG Funds (an investment company) and PBHG Insurance Series Fund (an investment company); Chief Operating Officer, General Counsel and Secretary, Old Mutual Investment Partners (a broker-dealer); General Counsel and Secretary, Old Mutual Fund Services (an administrator) and Old Mutual Shareholder Services (a shareholder servicing center); Executive Vice President, General Counsel and Secretary, Old Mutual Capital, Inc. (an investment adviser); and Vice President and Secretary, Old Mutual Advisors Funds (an investment company) | N/A | N/A | ||||
Sheri Morris — 1964 Vice President, Treasurer and Principal Financial Officer | 1999 | Vice President, Treasurer and Principal Financial Officer, The Invesco Funds; Vice President, Invesco Advisers, Inc. (formerly known as Invesco Institutional (N.A.), Inc.) (registered investment adviser); and Vice President, PowerShares Exchange-Traded Fund Trust, PowerShares Exchange-Traded Fund Trust II, PowerShares India Exchange-Traded Fund Trust, PowerShares Actively Managed Exchange-Traded Fund Trust, and PowerShares Actively Managed Exchange-Traded Commodity Fund Trust
Formerly: Vice President, Invesco Aim Advisers, Inc., Invesco Aim Capital Management, Inc. and Invesco Aim Private Asset Management, Inc.; Assistant Vice President and Assistant Treasurer, The Invesco Funds and Assistant Vice President, Invesco Advisers, Inc., Invesco Aim Capital Management, Inc. and Invesco Aim Private Asset Management, Inc.; and Treasurer, PowerShares Exchange-Traded Fund Trust, PowerShares Exchange-Traded Fund Trust II, PowerShares India Exchange-Traded Fund Trust and PowerShares Actively Managed Exchange-Traded Fund Trust | N/A | N/A | ||||
T-3 Invesco U.S. Mortgage Fund
Trustees and Officers—(continued)
Name, Year of Birth and Position(s) Held with the Trust | Trustee and/ or Officer Since | Principal Occupation(s) During Past 5 Years | Number of Funds in Fund Complex Overseen by Trustee | Other Directorship(s) Held by Trustee During | ||||
| Other Officers—(continued) | ||||||||
Karen Dunn Kelley — 1960 Vice President | 2004 | Senior Managing Director, Investments; Director, Co-President, Co-Chief Executive Officer, and Co-Chairman, Invesco Advisers, Inc. (formerly known as Invesco Institutional (N.A.), Inc.) (registered investment adviser); Chairman, Invesco Senior Secured Management, Inc.; Senior Vice President, Invesco Management Group, Inc. (formerly known as Invesco Aim Management Group, Inc.); Executive Vice President, Invesco Distributors, Inc. (formerly known as Invesco Aim Distributors, Inc.); Director, Invesco Mortgage Capital Inc. and Invesco Management Company Limited; Director and President, INVESCO Asset Management (Bermuda) Ltd., Vice President, The Invesco Funds (other than AIM Treasurer’s Series Trust (Invesco Treasurer’s Series Trust) and Short-Term Investments Trust); and President and Principal Executive Officer, The Invesco Funds (AIM Treasurer’s Series Trust (Invesco Treasurer’s Series Trust) and Short-Term Investments Trust only)
Formerly: Director, INVESCO Global Asset Management Limited and INVESCO Management S.A.; Senior Vice President, Van Kampen Investments Inc. and Invesco Advisers, Inc. (formerly known as Invesco Institutional (N.A.), Inc.) (registered investment adviser); Vice President, Invesco Advisers, Inc. (formerly known as Invesco Institutional (N.A.), Inc.); Director of Cash Management and Senior Vice President, Invesco Advisers, Inc. and Invesco Aim Capital Management, Inc.; Director and President, Fund Management Company; Chief Cash Management Officer, Director of Cash Management, Senior Vice President, and Managing Director, Invesco Aim Capital Management, Inc.; Director of Cash Management, Senior Vice President, and Vice President, Invesco Advisers, Inc. and The Invesco Funds (AIM Treasurer’s Series Trust (Invesco Treasurer’s Series Trust), and Short-Term Investments Trust only) | N/A | N/A | ||||
Crissie M. Wisdom — 1969 Anti-Money Laundering Compliance Officer | 2013 | Anti-Money Laundering Compliance Officer, Invesco Advisers, Inc. (formerly known as Invesco Institutional (N.A.), Inc.) (registered investment adviser), Invesco Capital Markets, Inc. (formerly known as Van Kampen Funds Inc.), Invesco Distributors, Inc., Invesco Investment Services, Inc., Invesco Management Group, Inc., Van Kampen Exchange Corp., The Invesco Funds, and PowerShares Exchange-Traded Fund Trust, PowerShares Exchange-Traded Fund Trust II, PowerShares India Exchange-Traded Fund Trust, PowerShares Actively Managed Exchange-Traded Fund Trust and PowerShares Actively Managed Exchange-Traded Commodity Fund Trust; and Fraud Prevention Manager and Controls and Risk Analysis Manager for Invesco Investment Services, Inc. | N/A | N/A | ||||
Todd L. Spillane — 1958 Chief Compliance Officer | 2006 | Senior Vice President, Invesco Management Group, Inc. (formerly known as Invesco Aim Management Group, Inc.) and Van Kampen Exchange Corp.; Senior Vice President and Chief Compliance Officer, Invesco Advisers, Inc. (registered investment adviser) (formerly known as Invesco Institutional (N.A.), Inc.); Chief Compliance Officer, The Invesco Funds; Vice President, Invesco Distributors, Inc. (formerly known as Invesco Aim Distributors, Inc.) and Invesco Investment Services, Inc. (formerly known as Invesco Aim Investment Services, Inc.)
Formerly: Chief Compliance Officer, Invesco Funds (Chicago); Senior Vice President, Van Kampen Investments Inc.; Senior Vice President and Chief Compliance Officer, Invesco Aim Advisers, Inc. and Invesco Aim Capital Management, Inc.; Chief Compliance Officer, INVESCO Private Capital Investments, Inc. (holding company), Invesco Private Capital, Inc. (registered investment adviser), Invesco Global Asset Management (N.A.), Inc., Invesco Senior Secured Management, Inc. (registered investment adviser), Van Kampen Investor Services Inc., PowerShares Exchange-Traded Fund Trust, PowerShares Exchange-Traded Fund Trust II, PowerShares India Exchange-Traded Fund Trust and PowerShares Actively Managed Exchange-Traded Fund Trust; and Vice President, Invesco Aim Capital Management, Inc. and Fund Management Company | N/A | N/A |
The Statement of Additional Information of the Trust includes additional information about the Fund’s Trustees and is available upon request, without charge, by calling 1.800.959.4246. Please refer to the Fund’s prospectus for information on the Fund’s sub-advisers.
Office of the Fund 11 Greenway Plaza, Suite 1000 Houston, TX 77046-1173 | Investment Adviser Invesco Advisers, Inc. 1555 Peachtree Street, N.E. Atlanta, GA 30309 | Distributor Invesco Distributors, Inc. 11 Greenway Plaza, Suite 1000 Houston, TX 77046-1173 | Auditors PricewaterhouseCoopers LLP 1000 Louisiana Street, Suite 5800 Houston, TX 77002-5678 | |||
Counsel to the Fund Stradley Ronon Stevens & Young, LLP 2005 Market Street, Suite 2600 Philadelphia, PA 19103-7018 | Counsel to the Independent Trustees Goodwin Procter LLP 901 New York Avenue, N.W. Washington, D.C. 20001 | Transfer Agent Invesco Investment Services, Inc. 11 Greenway Plaza, Suite 1000 Houston, TX 77046-1173 | Custodian State Street Bank and Trust Company 225 Franklin Street Boston, MA 02110-2801 | |||
T-4 Invesco U.S. Mortgage Fund

Invesco mailing information
Send general correspondence to Invesco Investment Services, Inc., P.O. Box 219078, Kansas City, MO 64121-9078.
Important notice regarding delivery of security holder documents
To reduce Fund expenses, only one copy of most shareholder documents may be mailed to shareholders with multiple accounts at the same address (Householding). Mailing of your shareholder documents may be householded indefinitely unless you instruct us otherwise. If you do not want the mailing of these documents to be combined with those for other members of your household, please contact Invesco Investment Services, Inc. at 800 959 4246 or contact your financial institution. We will begin sending you individual copies for each account within 30 days after receiving your request.
Fund holdings and proxy voting information
The Fund provides a complete list of its holdings four times in each fiscal year, at the quarter ends. For the second and fourth quarters, the lists appear in the Fund’s semiannual and annual reports to shareholders. For the first and third quarters, the Fund files the lists with the Securities and Exchange Commission (SEC) on Form N-Q. The most recent list of portfolio holdings is available at invesco.com/completeqtrholdings. Shareholders can also look up the Fund’s
Forms N-Q on the SEC website at sec.gov. Copies of the Fund’s Forms N-Q may be reviewed and copied at the SEC Public Reference Room in Washington, D.C. You can obtain information on the operation of the Public Reference Room, including information about duplicating fee charges, by calling 202 551 8090 or 800 732 0330, or by electronic request at the following email address: publicinfo@sec.gov. The SEC file numbers for the Fund are shown below.
A description of the policies and procedures that the Fund uses to determine how to vote proxies relating to portfolio securities is available without charge, upon request, from our Client Services department at 800 959 4246 or at invesco.com/proxyguidelines. The information is also available on the SEC website, sec.gov.
Information regarding how the Fund voted proxies related to its portfolio securities during the most recent 12-month period ended June 30 is available at invesco.com/proxysearch. The information is also available on the SEC website, sec.gov. Invesco Advisers, Inc. is an investment adviser; it provides investment advisory services to individual and institutional clients and does not sell securities. Invesco Distributors, Inc. is the US distributor for Invesco Ltd.’s retail mutual funds, exchange-traded funds and institutional money market funds. Both are wholly owned, indirect subsidiaries of Invesco Ltd. |  | |
SEC file numbers: 811-02699 and 002-57526 VK-USM-AR-1 Invesco Distributors, Inc. | ||
| ITEM 2. | CODE OF ETHICS. |
As of the end of the period covered by this report, the Registrant had adopted a code of ethics (the “Code”) that applies to the Registrant’s principal executive officer (“PEO”) and principal financial officer (“PFO”). There were no amendments to the Code during the period covered by the report. The Registrant did not grant any waivers, including implicit waivers, from any provisions of the Code to the PEO or PFO during the period covered by this report.
| .ITEM 3. | AUDIT COMMITTEE FINANCIAL EXPERT. |
The Board of Trustees has determined that the Registrant has at least one audit committee financial expert serving on its Audit Committee. The Audit Committee financial expert is Raymond Stickel, Jr. Mr. Stickel is “independent” within the meaning of that term as used in Form N-CSR.
| ITEM 4. | PRINCIPAL ACCOUNTANT FEES AND SERVICES. |
(a) to (d)
Fees Billed by PWC Related to the Registrant
PWC billed the Registrant aggregate fees for services rendered to the Registrant for the last two fiscal years as follows:
| Fees Billed for Services Rendered to the Registrant for fiscal year end 2014 | (e)(2) Percentage of Fees Billed Applicable to Non-Audit Services Provided for fiscal year end 2014 Pursuant to Waiver of Pre- Approval Requirement(1) | Fees Billed for Services Rendered to the Registrant for fiscal year end 2013 | (e)(2) Percentage of Fees Billed Applicable to Non-Audit Services Provided for fiscal year end 2013 Pursuant to Waiver of Pre- Approval Requirement(1) | |||||||||||||
Audit Fees | $ | 337,800 | N/A | $ | 298,000 | N/A | ||||||||||
Audit-Related Fees(2) | $ | 0 | 0 | % | $ | 32,308 | 0 | % | ||||||||
Tax Fees(3) | $ | 109,750 | 0 | % | $ | 160,120 | 0 | % | ||||||||
All Other Fees | $ | 0 | 0 | % | $ | 0 | 0 | % | ||||||||
|
|
|
| |||||||||||||
Total Fees | $ | 447,550 | 0 | % | $ | 490,428 | 0 | % | ||||||||
(g) PWC billed the Registrant aggregate non-audit fees of $109,750 for the fiscal year ended 2014, and $192,428 for the fiscal year ended 2013, for non-audit services rendered to the Registrant.
| (1) | With respect to the provision of non-audit services, the pre-approval requirement is waived pursuant to a de minimis exception if (i) such services were not recognized as non-audit services by the Registrant at the time of engagement, (ii) the aggregate amount of all such services provided is no more than 5% of the aggregate audit and non-audit fees paid by the Registrant to PWC during a fiscal year; and (iii) such services are promptly brought to the attention of the Registrant’s Audit Committee and approved by the Registrant’s Audit Committee prior to the completion of the audit. |
| (2) | Audit-Related fees for the fiscal year end December 31, 2013 includes fees billed for agreed upon procedures related to fund mergers and regulatory filings. |
| (3) | Tax fees for the fiscal year end December 31, 2014 includes fees billed for reviewing tax returns. Tax fees for fiscal year end December 31, 2013 includes fees billed for reviewing tax returns and consultation services. |
Fees Billed by PWC Related to Invesco and Invesco Affiliates
PWC billed Invesco Advisers, Inc. (“Invesco”), the Registrant’s adviser, and any entity controlling, controlled by or under common control with Invesco that provides ongoing services to the Registrant (“Invesco Affiliates”) aggregate fees for pre-approved non-audit services rendered to Invesco and Invesco Affiliates for the last two fiscal years as follows:
| Fees Billed for Non- Audit Services Rendered to Invesco and Invesco Affiliates for fiscal year end 2014 That Were Required to be Pre-Approved by the Registrant’s Audit Committee | (e)(2) Percentage of Fees Billed Applicable to Non-Audit Services Provided for fiscal year end 2014 Pursuant to Waiver of Pre- Approval Requirement(1) | Fees Billed for Non- Audit Services Rendered to Invesco and Invesco Affiliates for fiscal year end 2013 That Were Required to be Pre-Approved by the Registrant’s Audit Committee | (e)(2) Percentage of Fees Billed Applicable to Non-Audit Services Provided for fiscal year end 2013 Pursuant to Waiver of Pre- Approval Requirement(1) | |||||||||||||
Audit-Related Fees | $ | 574,000 | 0 | % | $ | 574,000 | 0 | % | ||||||||
Tax Fees | $ | 0 | 0 | % | $ | 0 | 0 | % | ||||||||
All Other Fees | $ | 0 | 0 | % | $ | 0 | 0 | % | ||||||||
|
|
|
| |||||||||||||
Total Fees(2) | $ | 574,000 | 0 | % | $ | 574,000 | 0 | % | ||||||||
| (1) | With respect to the provision of non-audit services, the pre-approval requirement is waived pursuant to a de minimis exception if (i) such services were not recognized as non-audit services by the Registrant at the time of engagement, (ii) the aggregate amount of all such services provided is no more than 5% of the aggregate audit and non-audit fees paid by the Registrant, Invesco and Invesco Affiliates to PWC during a fiscal year; and (iii) such services are promptly brought to the attention of the Registrant’s Audit Committee and approved by the Registrant’s Audit Committee prior to the completion of the audit. |
| (2) | Audit-Related fees for the year end 2014 include fees billed related to reviewing controls at a service organization. |
(g) Including the fees for services not required to be pre-approved by the registrant’s audit committee, PWC billed Invesco and Invesco Affiliates aggregate non-audit fees of $4,009,694 for the fiscal year ended 2014, and $1,645,309 for the fiscal year ended 2013, for non-audit services rendered to Invesco and Invesco Affiliates.
(h) The Audit Committee also has considered whether the provision of non-audit services that were rendered to Invesco and Invesco Affiliates that were not required to be pre-approved pursuant to SEC regulations, if any, is compatible with maintaining PWC’s independence.
(f) Not applicable.
(e)(1)
PRE-APPROVAL OF AUDIT AND NON-AUDIT SERVICES
POLICIES AND PROCEDURES
As adopted by the Audit Committees of
the Invesco Funds (the “Funds”)
Last Amended May 4, 2010
Statement of Principles
Under the Sarbanes-Oxley Act of 2002 and rules adopted by the Securities and Exchange Commission (“SEC”) (“Rules”), the Audit Committees of the Funds’ (the “Audit Committees”) Board of Trustees (the “Board”) are responsible for the appointment, compensation and oversight of the work of independent accountants (an “Auditor”). As part of this responsibility and to assure that the Auditor’s independence is not impaired, the Audit Committees pre-approve the audit and non-audit services provided to the Funds by each Auditor, as well as all non-audit services provided by the Auditor to the Funds’ investment adviser and to affiliates of the adviser that provide ongoing services to the Funds (“Service Affiliates”) if the services directly impact the Funds’ operations or financial reporting. The SEC Rules also specify the types of services that an Auditor may not provide to its audit client. The following policies and procedures comply with the requirements for pre-approval and provide a mechanism by which management of the Funds may request and secure pre-approval of audit and non-audit services in an orderly manner with minimal disruption to normal business operations.
Proposed services either may be pre-approved without consideration of specific case-by-case services by the Audit Committees (“general pre-approval”) or require the specific pre-approval of the Audit Committees (“specific pre-approval”). As set forth in these policies and procedures, unless a type of service has received general pre-approval, it will require specific pre-approval by the Audit Committees. Additionally, any fees exceeding 110% of estimated pre-approved fee levels provided at the time the service was pre-approved will also require specific approval by the Audit Committees before payment is made. The Audit Committees will also consider the impact of additional fees on the Auditor’s independence when determining whether to approve any additional fees for previously pre-approved services.
The Audit Committees will annually review and generally pre-approve the services that may be provided by each Auditor without obtaining specific pre-approval from the Audit Committee generally on an annual basis. The term of any general pre-approval runs from the date of such pre-approval through September 30th of the following year, unless the Audit Committees consider a different period and state otherwise. The Audit Committees will add to or subtract from the list of general pre-approved services from time to time, based on subsequent determinations.
The purpose of these policies and procedures is to set forth the guidelines to assist the Audit Committees in fulfilling their responsibilities.
Delegation
The Audit Committees may from time to time delegate pre-approval authority to one or more of its members who are Independent Trustees. All decisions to pre-approve a service by a delegated member shall be reported to the Audit Committees at the next quarterly meeting.
Audit Services
The annual audit services engagement terms will be subject to specific pre-approval of the Audit Committees. Audit services include the annual financial statement audit and other procedures such as tax provision work that is required to be performed by the independent auditor to be able to form an opinion on the Funds’ financial statements. The Audit Committees will obtain, review and consider sufficient information concerning the proposed Auditor to make a reasonable evaluation of the Auditor’s qualifications and independence.
In addition to the annual Audit services engagement, the Audit Committees may grant either general or specific pre-approval of other audit services, which are those services that only the independent auditor reasonably can provide. Other Audit services may include services such as issuing consents for the inclusion of audited financial statements with SEC registration statements, periodic reports and other documents filed with the SEC or other documents issued in connection with securities offerings.
Non-Audit Services
The Audit Committees may provide either general or specific pre-approval of any non-audit services to the Funds and its Service Affiliates if the Audit Committees believe that the provision of the service will not impair the independence of the Auditor, is consistent with the SEC’s Rules on auditor independence, and otherwise conforms to the Audit Committees’ general principles and policies as set forth herein.
Audit-Related Services
“Audit-related services” are assurance and related services that are reasonably related to the performance of the audit or review of the Fund’s financial statements or that are traditionally performed by the independent auditor. Audit-related services include, among others, accounting consultations related to accounting, financial reporting or disclosure matters not classified as “Audit services”; assistance with understanding and implementing new accounting and financial reporting guidance from rulemaking authorities; and agreed-upon procedures related to mergers, compliance with ratings agency requirements and interfund lending activities.
Tax Services
“Tax services” include, but are not limited to, the review and signing of the Funds’ federal tax returns, the review of required distributions by the Funds and consultations regarding tax matters such as the tax treatment of new investments or the impact of new regulations. The Audit Committees will scrutinize carefully the retention of the Auditor in connection with a transaction initially recommended by the Auditor, the major business purpose of which may be tax avoidance or the tax treatment of which may not be supported in the Internal Revenue Code and related regulations. The Audit Committees will consult with the Funds’ Treasurer (or his or her designee) and may consult with outside counsel or advisors as necessary to ensure the consistency of Tax services rendered by the Auditor with the foregoing policy.
No Auditor shall represent any Fund or any Service Affiliate before a tax court, district court or federal court of claims.
Under rules adopted by the Public Company Accounting Oversight Board and approved by the SEC, in connection with seeking Audit Committees’ pre-approval of permissible Tax services, the Auditor shall:
| 1. | Describe in writing to the Audit Committees, which writing may be in the form of the proposed engagement letter: |
| a. | The scope of the service, the fee structure for the engagement, and any side letter or amendment to the engagement letter, or any other agreement between the Auditor and the Fund, relating to the service; and |
| b. | Any compensation arrangement or other agreement, such as a referral agreement, a referral fee or fee-sharing arrangement, between the Auditor and any person (other than the Fund) with respect to the promoting, marketing, or recommending of a transaction covered by the service; |
| 2. | Discuss with the Audit Committees the potential effects of the services on the independence of the Auditor; and |
| 3. | Document the substance of its discussion with the Audit Committees. |
All Other Auditor Services
The Audit Committees may pre-approve non-audit services classified as “All other services” that are not categorically prohibited by the SEC, as listed in Exhibit 1 to this policy.
Pre-Approval Fee Levels or Established Amounts
Pre-approval of estimated fees or established amounts for services to be provided by the Auditor under general or specific pre-approval policies will be set periodically by the Audit Committees. Any proposed fees exceeding 110% of the maximum estimated pre-approved fees or established amounts for pre-approved audit and non-audit services will be reported to the Audit Committees at the quarterly Audit Committees meeting and will require specific approval by the Audit Committees before payment is made. The Audit Committees will always factor in the overall relationship of fees for audit and non-audit services in determining whether to pre-approve any such services and in determining whether to approve any additional fees exceeding 110% of the maximum pre-approved fees or established amounts for previously pre-approved services.
Procedures
Generally on an annual basis, Invesco Advisers, Inc. (“Invesco”) will submit to the Audit Committees for general pre-approval, a list of non-audit services that the Funds or Service Affiliates of the Funds may request from the Auditor. The list will describe the non-audit services in reasonable detail and will include an estimated range of fees and such other information as the Audit Committee may request.
Each request for services to be provided by the Auditor under the general pre-approval of the Audit Committees will be submitted to the Funds’ Treasurer (or his or her designee) and must include a detailed description of the services to be rendered. The Treasurer or his or her designee will ensure that such services are included within the list of services that have received the general pre-approval of the Audit Committees. The Audit Committees will be informed at the next quarterly scheduled Audit Committees meeting of any such services for which the Auditor rendered an invoice and whether such services and fees had been pre-approved and if so, by what means.
Each request to provide services that require specific approval by the Audit Committees shall be submitted to the Audit Committees jointly by the Fund’s Treasurer or his or her designee and the Auditor, and must include a joint statement that, in their view, such request is consistent with the policies and procedures and the SEC Rules.
Each request to provide tax services under either the general or specific pre-approval of the Audit Committees will describe in writing: (i) the scope of the service, the fee structure for the engagement, and any side letter or amendment to the engagement letter, or any other agreement between the Auditor and the audit client, relating to the service; and (ii) any compensation arrangement or other agreement between the Auditor and any person (other than the audit client) with respect to the promoting, marketing, or recommending of a transaction covered by the service. The Auditor will discuss with the Audit Committees the potential effects of the services on the Auditor’s independence and will document the substance of the discussion.
Non-audit services pursuant to the de minimis exception provided by the SEC Rules will be promptly brought to the attention of the Audit Committees for approval, including documentation that each of the conditions for this exception, as set forth in the SEC Rules, has been satisfied.
On at least an annual basis, the Auditor will prepare a summary of all the services provided to any entity in the investment company complex as defined in section 2-01(f)(14) of Regulation S-X in sufficient detail as to the nature of the engagement and the fees associated with those services.
The Audit Committees have designated the Funds’ Treasurer to monitor the performance of all services provided by the Auditor and to ensure such services are in compliance with these policies and procedures. The Funds’ Treasurer will report to the Audit Committees on a periodic basis as to the results of such monitoring. Both the Funds’ Treasurer and management of Invesco will immediately report to the chairman of the Audit Committees any breach of these policies and procedures that comes to the attention of the Funds’ Treasurer or senior management of Invesco.
Exhibit 1 to Pre-Approval of Audit and Non-Audit Services Policies and Procedures
Conditionally Prohibited Non-Audit Services (not prohibited if the Fund can reasonably conclude that the results of the service would not be subject to audit procedures in connection with the audit of the Fund’s financial statements)
| • | Bookkeeping or other services related to the accounting records or financial statements of the audit client |
| • | Financial information systems design and implementation |
| • | Appraisal or valuation services, fairness opinions, or contribution-in-kind reports |
| • | Actuarial services |
| • | Internal audit outsourcing services |
Categorically Prohibited Non-Audit Services
| • | Management functions |
| • | Human resources |
| • | Broker-dealer, investment adviser, or investment banking services |
| • | Legal services |
| • | Expert services unrelated to the audit |
| • | Any service or product provided for a contingent fee or a commission |
| • | Services related to marketing, planning, or opining in favor of the tax treatment of confidential transactions or aggressive tax position transactions, a significant purpose of which is tax avoidance |
| • | Tax services for persons in financial reporting oversight roles at the Fund |
| • | Any other service that the Public Company Oversight Board determines by regulation is impermissible. |
| ITEM 5. | AUDIT COMMITTEE OF LISTED REGISTRANTS. |
Not applicable.
| ITEM 6. | SCHEDULE OF INVESTMENTS. |
Investments in securities of unaffiliated issuers is included as part of the reports to stockholders filed under Item 1 of this Form.
| ITEM 7. | DISCLOSURE OF PROXY VOTING POLICIES AND PROCEDURES FOR CLOSED-END MANAGEMENT INVESTMENT COMPANIES. |
Not applicable.
| ITEM 8. | PORTFOLIO MANAGERS OF CLOSED-END MANAGEMENT COMPANIES. |
Not applicable.
| ITEM 9. | PURCHASES OF EQUITY SECURITIES BY CLOSED-END MANAGEMENT INVESTMENT COMPANY AND AFFILIATED PURCHASERS. |
Not applicable.
| ITEM 10. | SUBMISSION OF MATTERS TO A VOTE OF SECURITY HOLDERS. |
None
| ITEM 11. | CONTROLS AND PROCEDURES. |
| (a) | As of February 12, 2015, an evaluation was performed under the supervision and with the participation of the officers of the Registrant, including the PEO and PFO, to assess the effectiveness of the Registrant’s disclosure controls and procedures, as that term is defined in Rule 30a-3(c) under the Investment Company Act of 1940 (the “Act”), as amended. Based on that evaluation, the Registrant’s officers, including the PEO and PFO, concluded that, as of February 12, 2015, the Registrant’s disclosure controls and procedures were reasonably designed to ensure: (1) that information required to be disclosed by the Registrant on Form N-CSR is recorded, processed, summarized and reported within the time periods specified by the rules and forms of the Securities and Exchange Commission; and (2) that material information relating to the Registrant is made known to the PEO and PFO as appropriate to allow timely decisions regarding required disclosure. |
| (b) | There have been no changes in the Registrant’s internal control over financial reporting (as defined in Rule 30a-3(d) under the Act) that occurred during the second fiscal quarter of the period covered by this report that have materially affected, or are reasonably likely to materially affect, the Registrant’s internal control over financial reporting. |
| ITEM 12. | EXHIBITS. |
| 12(a) (1) | Code of Ethics. | |
| 12(a) (2) | Certifications of principal executive officer and principal financial officer as required by Rule 30a-2(a) under the Investment Company Act of 1940. | |
| 12(a) (3) | Not applicable. | |
| 12(b) | Certifications of principal executive officer and principal financial officer as required by Rule 30a-2(b) under the Investment Company Act of 1940. | |
SIGNATURES
Pursuant to the requirements of the Securities Exchange Act of 1934 and the Investment Company Act of 1940, the Registrant has duly caused this report to be signed on its behalf by the undersigned, thereunto duly authorized.
Registrant: AIM Growth Series (Invesco Growth Series)
| By: | /s/ Philip A. Taylor | |
| Philip A. Taylor | ||
| Principal Executive Officer | ||
| Date: | March 6, 2015 | |
Pursuant to the requirements of the Securities and Exchange Act of 1934 and the Investment Company Act of 1940, this report has been signed below by the following persons on behalf of the Registrant and in the capacities and on the dates indicated.
| By: | /s/ Philip A. Taylor | |
| Philip A. Taylor | ||
| Principal Executive Officer | ||
| Date: | March 6, 2015 | |
| By: | /s/ Sheri Morris | |
| Sheri Morris | ||
| Principal Financial Officer | ||
| Date: | March 6, 2015 | |
EXHIBIT INDEX
| 12(a) (1) | Code of Ethics. | |
| 12(a) (2) | Certifications of principal executive officer and principal financial officer as required by Rule 30a-2(a) under the Investment Company Act of 1940. | |
| 12(a) (3) | Not applicable. | |
| 12(b) | Certifications of principal executive officer and principal financial officer as required by Rule 30a-2(b) under the Investment Company Act of 1940. | |