| OMB APPROVAL | ||
OMB Number: 3235-0570 Expires: January 31, 2017 Estimated average burden hours per response: 20.6 |
UNITED STATES
SECURITIES AND EXCHANGE COMMISSION
Washington, D.C. 20549
FORM N-CSR
CERTIFIED SHAREHOLDER REPORT OF REGISTERED
MANAGEMENT INVESTMENT COMPANIES
| Investment Company Act file number | 811-02699 |
| AIM Growth Series (Invesco Growth Series) | ||||
| (Exact name of registrant as specified in charter) |
| 11 Greenway Plaza, Suite 1000 Houston, Texas 77046 | ||||
| (Address of principal executive offices) (Zip code) |
| Philip A. Taylor 11 Greenway Plaza, Suite 1000 Houston, Texas 77046 | ||
| (Name and address of agent for service) |
| Registrant’s telephone number, including area code: | (713) 626-1919 |
| Date of fiscal year end: | 12/31 |
| Date of reporting period: | 12/31/13 |
Item 1. Report to Stockholders.
|
| |||||
Annual Report to Shareholders
| December 31, 2013
| |||||
Invesco Balanced-Risk Retirement Funds | ||||||
Invesco Balanced-Risk Retirement Now Fund Invesco Balanced-Risk Retirement 2020 Fund Invesco Balanced-Risk Retirement 2030 Fund Invesco Balanced-Risk Retirement 2040 Fund Invesco Balanced-Risk Retirement 2050 Fund
| ||||||


Letters to Shareholders
Philip Taylor | Dear Shareholders: This annual report includes information about your Invesco Fund, including performance data and a complete list of its investments as of the close of the reporting period. Inside, your Fund’s portfolio managers discuss how they managed your Fund and the factors that affected its performance during the reporting period. I hope you find this report of interest. During the year covered by this report, major US and global equity market indexes hit multiyear or all-time highs1, the result of a strengthening US economy and relatively healthy corporate profits. Also helping equities was a return of individual investors to stocks – due in part to monetary policies that kept interest rates (and yields on fixed income securities) low. At the end of the reporting period, amid widespread signs of an improving economy, the US Federal Reserve announced that it would begin a long-anticipated reduction in its | ||||||||
| bond-buying program in January 2014; its decision was widely expected and investors reacted positively to the announcement. Despite some mid-summer volatility, overseas equity market indexes in developed and emerging nations generally rose during the year. | |||||||||

Extended periods of strong market performance such as we saw throughout 2013 can lull some investors into a false sense of security – just as extended periods of volatility or market weakness can discourage some investors from undertaking disciplined, long-term investment plans. That’s why Invesco believes it can often be helpful to work with a skilled and trusted financial adviser; he or she can emphasize the importance of adhering to an investment plan designed to achieve long-term goals like a first home, a college education for a child or a comfortable retirement. A financial adviser who is familiar with your individual financial situation, investment goals and risk tolerance can be an invaluable partner as you work toward your financial goals. He or she can provide insight and perspective when markets are volatile; encouragement and reassurance when times are uncertain; and advice and guidance when your financial situation or investment goals change.
Timely information when and where you want it
Invesco’s efforts to help investors achieve their financial objectives include providing individual investors and financial professionals with timely information about the markets, the economy and investing – whenever and wherever they want it.
Our website, invesco.com/us, offers a wide range of market insights and investment perspectives. On the website, you’ll find detailed information about our funds, including prices, performance, holdings and portfolio manager commentaries. You can access information about your individual Invesco account whenever it’s convenient for you; just complete a simple, secure online registration. Use the “Login” box on our home page to get started.
Using Invesco’s mobile app for iPad® (available free from the App StoreSM) allows you to obtain the same detailed information about your funds and the same investment insights from our investment leaders, market strategists, economists and retirement experts on the go. You also can watch portfolio manager videos and have instant access to Invesco news and updates wherever you may be.
In addition to the resources accessible on our website and through our mobile app, you can obtain timely updates to help you stay informed about the markets, the economy and investing by connecting with Invesco on Twitter, LinkedIn or Facebook. You can access our blog at blog.invesco.us.com or by visiting the “Intentional Investing Forum” on our home page. Our goal is to provide you the information you want, when and where you want it.
Have questions?
For questions about your account, feel free to contact an Invesco client services representative at 800 959 4246. For Invesco-related questions or comments, please email me directly at phil@invesco.com.
All of us at Invesco look forward to serving your investment management needs for many years to come. Thank you for investing with us.
Sincerely,

Philip Taylor
Senior Managing Director, Invesco Ltd.
1 Source: Reuters
iPad is a trademark of Apple Inc., registered in the US and other countries. App Store is a service mark of Apple Inc.
2 Invesco Balanced-Risk Retirement Funds
Bruce Crockett | Dear Fellow Shareholders: Many investors enjoyed positive returns on their investments in 2013. While some sectors of the market struggled, many major equity market indexes in the US and around the globe rose last year. The performance of stocks, fixed income securities and alternative investments – and the performance of mutual funds that invest in them – is determined by many factors, including unforeseeable economic and geopolitical events. Your Board certainly can’t determine how well various asset classes in the market perform, but we work hard throughout the year on issues that affect you and your fellow shareholders and determine how your investments are managed. For example, the Invesco Funds Board works to ensure that we provide a lineup of funds that allow financial advisers to build portfolios that meet shareholders’ changing financial needs and goals. Your Board works with Invesco Advisers on a continuing basis to provide financial | ||||||||
| products that may help investors achieve their varied financial goals. We also carefully monitor how the management teams of all the Invesco funds are performing in light of ever-changing and often unpredictable economic and market conditions. Your Board carefully assesses their performance in a constantly changing and highly competitive marketplace. | |||||||||

Your Board also conducts an annual review of the funds’ advisory and sub-advisory contracts with Invesco Advisers and its affiliates. This annual review, which is required by the Investment Company Act of 1940, focuses on the nature and quality of the services Invesco provides as adviser to the Invesco Funds and the reasonableness of the fees that it charges for those services. Each year, we spend months reviewing detailed information that we request from Invesco that allows us to evaluate its services and fees. We also use information from many independent sources, including materials provided by the independent Senior Officer of the Invesco Funds, who reports directly to the independent Trustees on the Board. Additionally, we meet with independent legal counsel and review performance and fee data prepared by Lipper Inc., an independent, third-party firm widely recognized as a leader in its field.
Be assured that your Board will continue working on behalf of fund shareholders, keeping your needs and interests uppermost in our minds.
As always, please contact me at bruce@brucecrockett.com with any questions or concerns you may have. On behalf of the Board, we look forward to continuing to represent your interests and serving your needs.
Sincerely,

Bruce L. Crockett
Independent Chair
Invesco Funds Board of Trustees
3 Invesco Income Allocation Fund
Management’s Discussion of Fund Performance
Performance summary - Invesco Balanced-Risk Retirement Now Fund
For the year ended December 31, 2013, Invesco Balanced-Risk Retirement Now Fund underperformed the Custom Balanced-Risk Retirement Now Index, the Fund’s custom style-specific benchmark. During periods in which equities perform strongly, the Fund may lag its style-specific benchmark due to the Fund’s asset class diversification. While rising yields and sagging commodity prices created headwinds for the Fund during the reporting period, at net asset value, the Fund posted positive absolute returns with its strategic equity and active positioning driving results for the year.
Your Fund’s long-term performance appears later in this report.
Fund vs. Indexes
Total returns, 12/31/12 to 12/31/13, at net asset value (NAV). Performance shown does not include applicable contingent deferred sales charges (CDSC) or front-end sales charges, which would have reduced performance.
| Class A Shares | 1.33 | % | |||
| Class AX Shares | 1.33 | ||||
| Class B Shares | 0.56 | ||||
| Class C Shares | 0.57 | ||||
| Class CX Shares | 0.56 | ||||
| Class R Shares | 1.13 | ||||
| Class RX Shares | 1.03 | ||||
| Class Y Shares | 1.51 | ||||
| Class R5 Shares | 1.63 | ||||
| Class R6 Shares | 1.63 | ||||
| S&P 500 Index‚ (Broad Market Index) | 32.39 | ||||
| Custom Balanced-Risk Allocation Broad Index¡ (Style-Specific Index) | 17.58 | ||||
| Custom Balanced-Risk Retirement Now Index¡ (Style-Specific Index) | 8.52 | ||||
| Lipper Mixed-Asset Target Today Index¡ (Peer Group Index)* | 4.93 | ||||
Lipper Mixed-Asset Target Allocation Conservative Funds Index¿ (Former Peer Group Index)* | 7.08 |
Source(s): ‚Invesco, S&P-Dow Jones via FactSet Research Systems Inc.; ¡Invesco, Lipper Inc.; ¿Lipper Inc.
| * | The Fund has elected to use the Lipper Mixed-Asset Target Today Index as its peer group index rather than the Lipper Mixed-Asset Target Allocation Conservative Funds Index because the Lipper Mixed-Asset Target Today Index more closely reflects the performance of the types of securities in which the Fund invests. |
How we invest
Invesco Balanced-Risk Retirement Now Fund (the Fund) uses a combination of Invesco Balanced-Risk Allocation Fund (IBRA) and affiliated money market funds to provide broad market diversification and execute the Fund’s glide path strategy.
IBRA, an underlying fund, or holding, of the Fund, employs a total return asset allocation strategy that invests in equity,
fixed income and commodity markets. IBRA uses a long-only, proprietary risk-balanced investment process that seeks to provide greater capital loss protection than traditional balanced portfolios. IBRA invests in asset classes that are expected to perform differently in different economic environments to strive to enhance returns. The IBRA investment process, under normal conditions, is implemented with derivatives and other financially
linked instruments (such as total return swaps, futures, commodity-linked notes, exchange-traded notes and exchange-traded funds) that create economic leverage and whose performance is expected to correspond to US and international fixed income, equity and commodity markets. Using derivatives allows us to gain more exposure to the asset classes than investing in more traditional assets such as stocks and bonds would allow. IBRA seeks to gain exposure to the commodity markets primarily through investments in Invesco Cayman Commodity Fund I Ltd. (the Subsidiary), a wholly owned subsidiary of the Fund organized under the laws of the Cayman Islands.
IBRA will maintain 50% to 100% of total assets (including assets held by the Subsidiary) in cash and cash equivalent instruments, including affiliated money market funds, as margin or collateral for the obligations under these derivative transactions. The larger the value of IBRA’s derivative positions, as opposed to positions held in non-derivative instruments, the more IBRA will be required to maintain cash and cash equivalents as margin or collateral for such derivatives.
Market conditions and your Fund
During the year ended December 31, 2013, equity markets experienced periods of volatility due to geopolitical issues but, overall, they performed strongly. Tactical shifts made within IBRA between asset classes throughout the year helped us navigate through difficult environments and benefited overall Fund returns.
Equities were the primary driver of Fund performance for the first quarter, but gains weren’t uniform across all markets. Japan was a top performer for the Fund as investors cheered actions of Japan’s central bank. Bonds also posted gains in the first quarter with German
Target Risk Allocation and Notional Asset Weights† By asset class
| ||||||||||
| Asset Class* | Risk Allocation | % of Net Assets as of 12/31/13** | ||||||||
| Equity | 48.24 | % | 23.89 | % | ||||||
| Fixed Income | 25.92 | 50.14 | ||||||||
| Commodities | 22.42 | 14.21 | ||||||||
| Cash | 3.42 | 39.98 | ||||||||
| Total Net Assets | $52.6 million |
| * | Based on the expected market exposure through investments in the underlying funds. |
| ** | Due to the use of leverage, the percentages may not equal 100%. |
IBRA, an underlying fund, uses commodity-linked derivative investments and enhanced investment techniques such as leverage.
| † | Risk contribution is measured as the standard deviation of each asset as a percentage of total portfolio standard deviation. The risk contribution of each underlying asset determines the dollar-weighting of that asset. Standard deviation measures a fund’s range of total returns and fluctuations over a defined period of time. |
Fund Nasdaq Symbols
| ||
Class A Shares | IANAX | |
Class AX Shares | VIRAX | |
Class B Shares | IANBX | |
Class C Shares | IANCX | |
Class CX Shares | VIRCX | |
Class R Shares | IANRX | |
Class RX Shares | VIRRX | |
Class Y Shares | IANYX | |
Class R5 Shares | IANIX | |
Class R6 Shares | IANFX | |
4 Invesco Balanced-Risk Retirement Funds
government-issued bonds leading the way as European investors sought perceived safe haven assets after the Italian elections and during the Cyprus banking crisis. Commodities performed strongly at the start of the year, but sold off late in the quarter as weakness in the Chinese and European economies, a rising dollar and increased supplies of agricultural commodities and industrial metals depressed prices. Tactical positioning for the quarter aided Fund results as our overweight exposure (relative to the strategic allocations of IBRA) to equities and bonds helped to offset a slight drag from our overweight commodity exposure.
The second quarter was unusual, with a broad cross-section of markets declining, limiting the benefits of the Fund’s focus on economic diversification. Such environments are rare, but not unprecedented, and have typically been short-lived. Equities continued to provide narrow leadership across the major asset classes with European and US markets finishing positively, but not keeping pace with the Japanese market. Only the Hong Kong and the UK markets finished down for the quarter. Most commodity prices fell, with precious metals suffering the steepest decline. Government bonds sold off across the globe as investors perceived that the US Federal Reserve (the Fed) had signaled its intention to accelerate the reduction and cessation of its bond purchasing programs. Fund results from tactical shifts were flat for the second quarter as gains from overweights to equities were offset by losses from overweights to precious metals.
In the third quarter, equities led Fund results as all six markets in which the Fund, through the underlying funds, invests were positive, with Europe, US small caps and Hong Kong posting double-digit gains. Tactical positioning in the Fund benefited results as we were overweight equities for the entire quarter. Our strategic allocation to commodities also aided Fund results as all four commodity complexes – energy, agriculture, industrial metals and precious metals – posted gains. Tactical positioning in commodities detracted from Fund results for the quarter as negative results from agriculture and industrial metals slightly outweighed positive results from precious metals and energy. Bonds rose marginally as the Fund’s gains in Japanese and German government bonds were diluted by negative results from the UK, US, Australia and Canada. Tactical positioning in bonds produced flat results for the Fund
as positive returns from underweight exposure to the UK were negated by losses from our overweight exposure to Germany and the US.
The Fund’s fourth quarter results were led by US large-cap equities, which posted double-digit returns. Japanese, US small cap and European equities also performed well. Our tactical positioning in equities helped Fund performance as we remained overweight to all the markets in which the Fund, through the underlying funds, invests. Government bond yields in developed markets, except Japan, drifted higher for three primary reasons: fears the Fed would begin tapering its asset purchases; improving economic data; and deteriorating investor sentiment for perceived safe haven assets.
As a result, the strategic and tactical performance from government bonds detracted from Fund performance. From an asset class perspective, strategic and tactical allocations to commodities detracted from Fund performance.
Please note that IBRA’s strategy is principally implemented with derivative instruments that include futures and total return swaps. Therefore, all or most of the performance of the strategy, both positive and negative, can be attributed to these instruments. Derivatives can be a cost-effective way to gain exposure to asset classes. However, derivatives may amplify traditional investment risks through the creation of leverage and may be less liquid than traditional securities.
Thank you for your continued commitment to Invesco Balanced-Risk Retirement Now Fund.
The views and opinions expressed in management’s discussion of Fund performance are those of Invesco Advisers, Inc. These views and opinions are subject to change at any time based on factors such as market and economic conditions. These views and opinions may not be relied upon as investment advice or recommendations, or as an offer for a particular security. The information is not a complete analysis of every aspect of any market, country, industry, security or the Fund. Statements of fact are from sources considered reliable, but Invesco Advisers, Inc. makes no representation or warranty as to their completeness or accuracy. Although historical performance is no guarantee of future results, these insights may help you understand our investment management philosophy.
See important Fund and, if applicable, index disclosures later in this report.
 | Mark Ahnrud Chartered Financial Analyst, portfolio manager, is manager of Invesco Balanced-Risk Retirement Now | |
| Fund. He joined Invesco in 2000. Mr. Ahnrud earned a BS in finance and investments from Babson College and an MBA from Duke University Fuqua School of Business. | ||
 | Chris Devine Chartered Financial Analyst, portfolio manager, is manager of Invesco Balanced-Risk Retirement Now | |
| Fund. He joined Invesco in 1998. Mr. Devine earned a BA in economics from Wake Forest University and an MBA from the University of Georgia. | ||
 | Scott Hixon Chartered Financial Analyst, portfolio manager, is manager of Invesco Balanced-Risk Retirement Now | |
| Fund. He joined Invesco in 1994. Mr. Hixon earned a BBA in finance from Georgia Southern University and an MBA in finance from Georgia State University. | ||
 | Christian Ulrich Chartered Financial Analyst, portfolio manager, is manager of Invesco Balanced-Risk Retirement Now | |
| Fund. He joined Invesco in 2000. Mr. Ulrich earned the equivalent of a BBA from the KV Zurich Business School in Zurich, Switzerland. | ||
 | Scott Wolle Chartered Financial Analyst, portfolio manager, is manager of Invesco Balanced-Risk Retirement Now | |
| Fund. He joined Invesco in 1999. Mr. Wolle earned a BS in finance from Virginia Polytechnic Institute and State University and an MBA from Duke University Fuqua School of Business. | ||
Assisted by the Global Asset Allocation Team
5 Invesco Balanced-Risk Retirement Funds
Management’s Discussion of Fund Performance
Performance summary - Invesco Balanced-Risk Retirement 2020 Fund
For the year ended December 31, 2013, Invesco Balanced-Risk Retirement 2020 Fund underperformed the Custom Balanced-Risk Retirement 2020 Index, the Fund’s custom style-specific benchmark. During periods in which equities perform strongly, the Fund may lag its style-specific benchmark due to the Fund’s asset class diversification. While rising yields and sagging commodity prices created headwinds for the Fund during the reporting period, at net asset value, the Fund posted positive absolute returns with its strategic equity and active positioning driving results for the year.
Your Fund’s long-term performance appears later in this report.
Fund vs. Indexes
Total returns, 12/31/12 to 12/31/13, at net asset value (NAV). Performance shown does not include applicable contingent deferred sales charges (CDSC) or front-end sales charges, which would have reduced performance.
| Class A Shares | 2.01 | % | |||
| Class AX Shares | 1.90 | ||||
| Class B Shares | 1.19 | ||||
| Class C Shares | 1.29 | ||||
| Class CX Shares | 1.29 | ||||
| Class R Shares | 1.73 | ||||
| Class RX Shares | 1.73 | ||||
| Class Y Shares | 2.16 | ||||
| Class R5 Shares | 2.26 | ||||
| Class R6 Shares | 2.25 | ||||
| S&P 500 Index‚ (Broad Market Index) | 32.39 | ||||
| Custom Balanced-Risk Allocation Broad Index¡ (Style-Specific Index) | 17.58 | ||||
| Custom Balanced-Risk Retirement 2020 Index¡ (Style-Specific Index) | 15.95 | ||||
| Lipper Mixed-Asset Target 2020 Funds Index¿ (Peer Group Index) | 13.10 |
Source(s): ‚Invesco, S&P-Dow Jones via FactSet Research Systems Inc.; ¡Invesco, Lipper Inc.; ¿Lipper Inc.
How we invest
Invesco Balanced-Risk Retirement 2020 Fund (the Fund) uses a combination of Invesco Balanced-Risk Allocation Fund (IBRA) and affiliated money market funds to provide broad market diversification and execute the Fund’s glide path strategy.
IBRA employs a total return asset allocation strategy that invests in equity, fixed income and commodity markets. IBRA uses a long-only, proprietary risk-balanced investment process that seeks to provide greater capital loss protection than traditional balanced portfolios. IBRA invests in asset classes that are expected to perform differently in different economic environments to strive to enhance returns. The IBRA investment process,
under normal conditions, is implemented with derivatives and other financially linked instruments (such as total return swaps, futures, commodity-linked notes, exchange-traded notes and exchange-traded funds) that create economic leverage and whose performance is expected to correspond to US and international fixed income, equity and commodity markets. Using derivatives allows us to gain more exposure to the asset classes than investing in more traditional assets such as stocks and bonds would allow. IBRA seeks to gain exposure to the commodity markets primarily through investments in Invesco Cayman Commodity Fund I Ltd. (the Subsidiary), a wholly owned subsidiary of the Fund organized under the laws of the Cayman Islands.
IBRA will maintain 50% to 100% of total assets (including assets held by the Subsidiary) in cash and cash equivalent instruments, including affiliated money market funds, as margin or collateral for the obligations under these derivative transactions. The larger the value of IBRA’s derivative positions, as opposed to positions held in non-derivative instruments, the more IBRA will be required to maintain cash and cash equivalents as margin or collateral for such derivatives.
The Fund employs a risk-balanced optimization process which accounts for the glide path; the glide path is the rate at which the asset mix changes over time. The glide path becomes more conservative on a quarterly basis as the Fund’s investments in IBRA decrease and its investments in the affiliated money market funds increase. This results in a blend of 60% IBRA and 40% affiliated money market funds at the target date of on or about 2020.
This glide path is intended to reduce the concerns of investors in the pre-retirement stage (defined as 10 years away from their target retirement date) that the value of their accumulated assets could decline in value due to adverse market conditions and they might not have time before retirement to recoup those losses. The Fund seeks to address such concerns by seeking to manage risk and protect accumulated wealth by transitioning from an accumulation strategy to a real return strategy at the target date.
Market conditions and your Fund
During the year ended December 31, 2013, equity markets experienced periods of volatility due to geopolitical issues but, overall, they performed strongly. Tactical shifts made within IBRA, an underlying fund, between asset classes throughout the year helped us navigate through difficult environments and benefited overall Fund returns.
Equities were the primary driver of Fund performance for the first quarter,
Target Risk Allocation and Notional Asset Weights† By asset class
| ||||||||||
| Asset Class* | Risk Allocation | % of Net Assets as of 12/31/13** | ||||||||
| Equity | 49.54 | % | 34.47 | % | ||||||
| Fixed Income | 26.62 | 72.37 | ||||||||
| Commodities | 23.03 | 20.51 | ||||||||
| Cash | 0.81 | 13.34 | ||||||||
| Total Net Assets | $132.0 million |
| * | Based on the expected market exposure through investments in the underlying funds. |
| ** | Due to the use of leverage, the percentages may not equal 100%. |
IBRA, an underlying fund, uses commodity-linked derivative investments and enhanced investment techniques such as leverage.
| † | Risk contribution is measured as the standard deviation of each asset as a percentage of total portfolio standard deviation. The risk contribution of each underlying asset determines the dollar-weighting of that asset. Standard deviation measures a fund’s range of total returns and fluctuations over a defined period of time. |
Fund Nasdaq Symbols
| ||
Class A Shares | AFTAX | |
Class AX Shares | VRCAX | |
Class B Shares | AFTBX | |
Class C Shares | AFTCX | |
Class CX Shares | VRCCX | |
Class R Shares | ATFRX | |
Class RX Shares | VRCRX | |
Class Y Shares | AFTYX | |
Class R5 Shares | AFTSX | |
Class R6 Shares | VRCFX | |
6 Invesco Balanced-Risk Retirement Funds
but gains weren’t uniform across all markets. Japan was a top performer for the Fund as investors cheered actions of Japan’s central bank. Bonds also posted gains in the first quarter with German government-issued bonds leading the way as European investors sought perceived safe haven assets after the Italian elections and during the Cyprus banking crisis. Commodities performed strongly at the start of the year, but sold off late in the quarter as weakness in the Chinese and European economies, a rising dollar and increased supplies of agricultural commodities and industrial metals depressed prices. Tactical positioning for the quarter aided Fund results as our overweight exposure (relative to the strategic allocations of IBRA) to equities and bonds helped to offset a slight drag from our overweight commodity exposure.
The second quarter was unusual, with a broad cross-section of markets declining, limiting the benefits of the Fund’s focus on economic diversification. Such environments are rare, but not unprecedented, and have typically been short-lived. Equities continued to provide narrow leadership across the major asset classes with European and US markets finishing positively, but not keeping pace with the Japanese market. Only the Hong Kong and the UK markets finished down for the quarter. Most commodity prices fell, with precious metals suffering the steepest decline. Government bonds sold off across the globe as investors perceived that the US Federal Reserve (the Fed) had signaled its intention to accelerate the reduction and cessation of its bond purchasing programs. Fund results from tactical shifts were flat for the second quarter as gains from overweights to equities were offset by losses from overweights to precious metals.
In the third quarter, equities led Fund results as all six markets in which the Fund, through the underlying funds, invests were positive, with Europe, US small caps and Hong Kong posting double-digit gains. Tactical positioning in the Fund benefited Fund results as we were overweight equities for the entire quarter. Our strategic allocation to commodities also aided Fund results as all four commodity complexes – energy, agriculture, industrial metals and precious metals – posted gains. Tactical positioning in commodities detracted from Fund results for the quarter as negative results from agriculture and industrial metals slightly outweighed positive results from precious metals and energy. Bonds rose marginally as gains in Japanese and German government bonds were diluted by
negative results from the UK, US, Australia and Canada. Tactical positioning in bonds produced flat results for the Fund as positive returns from underweight exposure to the UK were negated by losses from our overweight exposure to Germany and the US.
The Fund’s fourth quarter results were led by US large-cap equities, which posted double-digit returns. Japanese, US small cap and European equities also performed well. Our tactical positioning in equities helped Fund performance as we remained overweight to all the markets in which the Fund, through the underlying funds, invests. Government bond yields in developed markets, except Japan, drifted higher for three primary reasons: fears the Fed would begin tapering its asset purchases; improving economic data; and deteriorating investor sentiment for perceived safe haven assets. As a result, the strategic and tactical performance from government bonds detracted from Fund performance. From an asset class perspective, strategic and tactical allocations to commodities detracted from Fund performance.
Please note that IBRA’s strategy is principally implemented with derivative instruments that include futures and total return swaps. Therefore, all or most of the performance of the strategy, both positive and negative, can be attributed to these instruments. Derivatives can be a cost-effective way to gain exposure to asset classes. However, derivatives may amplify traditional investment risks through the creation of leverage and may be less liquid than traditional securities.
Thank you for your continued commitment to Invesco Balanced-Risk Retirement 2020 Fund.
The views and opinions expressed in management’s discussion of Fund performance are those of Invesco Advisers, Inc. These views and opinions are subject to change at any time based on factors such as market and economic conditions. These views and opinions may not be relied upon as investment advice or recommendations, or as an offer for a particular security. The information is not a complete analysis of every aspect of any market, country, industry, security or the Fund. Statements of fact are from sources considered reliable, but Invesco Advisers, Inc. makes no representation or warranty as to their completeness or accuracy. Although historical performance is no guarantee of future results, these insights may help you understand our investment management philosophy.
See important Fund and, if applicable, index disclosures later in this report.
| Mark Ahnrud Chartered Financial Analyst, portfolio manager, is manager of Invesco Balanced-Risk Retirement 2020 | |
| Fund. He joined Invesco in 2000. Mr. Ahnrud earned a BS in finance and investments from Babson College and an MBA from Duke University Fuqua School of Business. | ||
| Chris Devine Chartered Financial Analyst, portfolio manager, is manager of Invesco Balanced-Risk Retirement 2020 | |
| Fund. He joined Invesco in 1998. Mr. Devine earned a BA in economics from Wake Forest University and an MBA from the University of Georgia. | ||
| Scott Hixon Chartered Financial Analyst, portfolio manager, is manager of Invesco Balanced-Risk Retirement 2020 | |
| Fund. He joined Invesco in 1994. Mr. Hixon earned a BBA in finance from Georgia Southern University and an MBA in finance from Georgia State University. | ||
| Christian Ulrich Chartered Financial Analyst, portfolio manager, is manager of Invesco Balanced-Risk Retirement 2020 | |
| Fund. He joined Invesco in 2000. Mr. Ulrich earned the equivalent of a BBA from the KV Zurich Business School in Zurich, Switzerland. | ||
| Scott Wolle Chartered Financial Analyst, portfolio manager, is manager of Invesco Balanced-Risk Retirement 2020 | |
| Fund. He joined Invesco in 1999. Mr. Wolle earned a BS in finance from Virginia Polytechnic Institute and State University and an MBA from Duke University Fuqua School of Business. | ||
Assisted by the Global Asset Allocation Team
7 Invesco Balanced-Risk Retirement Funds
Management’s Discussion of Fund Performance
Performance summary - Invesco Balanced-Risk Retirement 2030 Fund
For the year ended December 31, 2013, Invesco Balanced-Risk Retirement 2030 Fund underperformed the Custom Balanced-Risk Retirement 2030 Index, the Fund’s custom style-specific benchmark. During periods in which equities perform strongly, the Fund may lag its style-specific benchmark due to the Fund’s asset class diversifica-tion. While rising yields and sagging commodity prices created headwinds for the Fund during the reporting period, at net asset value, the Fund posted positive absolute returns with its strategic equity and active positioning driving results for the year.
Your Fund’s long-term performance appears later in this report.
Fund vs. Indexes
Total returns, 12/31/12 to 12/31/13, at net asset value (NAV). Performance shown does not include applicable contingent deferred sales charges (CDSC) or front-end sales charges, which would have reduced performance.
| Class A Shares | 2.28 | % | |||
| Class AX Shares | 2.27 | ||||
| Class B Shares | 1.52 | ||||
| Class C Shares | 1.52 | ||||
| Class CX Shares | 1.64 | ||||
| Class R Shares | 2.03 | ||||
| Class RX Shares | 2.04 | ||||
| Class Y Shares | 2.52 | ||||
| Class R5 Shares | 2.52 | ||||
| Class R6 Shares | 2.52 | ||||
| S&P 500 Index‚ (Broad Market Index) | 32.39 | ||||
| Custom Balanced-Risk Allocation Broad Index¡ (Style-Specific Index) | 17.58 | ||||
| Custom Balanced-Risk Retirement 2030 Index¡ (Style-Specific Index) | 15.27 | ||||
| Lipper Mixed-Asset Target 2030 Funds Index¿ (Peer Group Index) | 18.48 |
Source(s): ‚Invesco, S&P-Dow Jones via FactSet Research Systems Inc.; ¡Invesco, Lipper Inc.; ¿Lipper Inc.
How we invest
Invesco Balanced-Risk Retirement 2030 Fund (the Fund) uses a combination of Invesco Balanced-Risk Aggressive Allocation Fund (IBRAA), Invesco Balanced-Risk Allocation Fund (IBRA) and affiliated money market funds to provide broad market diversification and execute the Fund’s glide path strategy. IBRAA was added as an underlying investment to Invesco Balanced-Risk Retirement 2030 Fund on February 25, 2013.
IBRAA and IBRA employ a total return asset allocation strategy that invests in equity, fixed income and commodity markets. IBRAA and IBRA use a long-only, proprietary risk-balanced investment process that seeks to provide greater capital loss protection than traditional balanced portfolios. IBRAA and IBRA invest in asset
classes that are expected to perform differently in different economic environments to strive to enhance returns. The IBRAA and IBRA investment process, under normal conditions, is implemented with derivatives and other financially linked instruments (such as total return swaps, futures, commodity-linked notes, exchange-traded notes and exchange-traded funds) that create economic leverage and whose performance is expected to correspond to US and international fixed income, equity and commodity markets. Using derivatives allows us to gain more exposure to the asset classes than investing in more traditional assets such as stocks and bonds would allow. IBRAA and IBRA seek to gain exposure to the commodity markets primarily through investments in Invesco Cayman Commodity Fund VI Ltd. and Invesco Cayman Commodity
Fund I Ltd., respectively, wholly owned subsidiaries of the Fund organized under the laws of the Cayman Islands.
IBRAA and IBRA will maintain 50% to 100% of total assets (including assets held by the Subsidiaries) in cash and cash equivalent instruments, including affiliated money market funds, as margin or collateral for the obligations under these derivative transactions. The larger the value of IBRAA’s and IBRA’s derivative positions, as opposed to positions held in non-derivative instruments, the more the underlying funds will be required to maintain cash and cash equivalents as margin or collateral for such derivatives.
The Fund employs a risk-balanced optimization process which accounts for the glide path; the glide path is the rate at which the asset mix changes over time. The glide path becomes more conservative on a quarterly basis as the Fund’s investments in IBRAA decrease and its investments in IBRA increase. Approximately 10 years from the target retirement date, the Fund ceases to invest in IBRAA and begins investing in the affiliated money market funds. The Fund’s investments in the affiliated money market funds continue to increase and its investments in IBRA continues to decrease until approximately the target retirement date. This results in a blend of 60% IBRA and 40% affiliated money market funds at the target date of on or about 2030.
This glide path is intended to reduce the concerns of investors in the pre-retirement stage (defined as 10 years away from their target retirement date) that the value of their accumulated assets could decline in value due to adverse market conditions and they might not have time before retirement to recoup those losses. The Fund seeks to address such concerns by seeking to manage risk and protect accumulated wealth by transitioning from an accumulation strategy to a real return strategy at the target date.
Market conditions and your Fund
During the year ended December 31, 2013, equity markets experienced
Target Risk Allocation and Notional Asset Weights† By asset class
| ||||||||||
| Asset Class* | Risk Allocation | % of Net Assets as of 12/31/13** | ||||||||
| Equity | 49.95 | % | 43.53 | % | ||||||
| Fixed Income | 26.84 | 91.38 | ||||||||
| Commodities | 23.21 | 25.90 | ||||||||
| Cash | 0.00 | 0.00 | ||||||||
| Total Net Assets | $132.3 million |
| * | Based on the expected market exposure through investments in the underlying funds. |
| ** | Due to the use of leverage, the percentages may not equal 100%. |
IBRAA and IBRA, both underlying funds, use commodity-linked derivative investments and enhanced investment techniques such as leverage.
| † | Risk contribution is measured as the standard deviation of each asset as a percentage of total portfolio standard deviation. The risk contribution of each underlying asset determines the dollar-weighting of that asset. Standard deviation measures a fund’s range of total returns and fluctuations over a defined period of time. |
Fund Nasdaq Symbols
| ||
Class A Shares | TNAAX | |
Class AX Shares | VREAX | |
Class B Shares | TNABX | |
Class C Shares | TNACX | |
Class CX Shares | VRECX | |
Class R Shares | TNARX | |
Class RX Shares | VRERX | |
Class Y Shares | TNAYX | |
Class R5 Shares | TNAIX | |
Class R6 Shares | TNAFX | |
8 Invesco Balanced-Risk Retirement Funds
periods of volatility due to geopolitical issues but, overall, they performed strongly. Tactical shifts between asset classes made within IBRAA and IBRA, both underlying funds, throughout the year helped us navigate through difficult environments and benefited overall Fund returns.
Equities were the primary driver of Fund performance for the first quarter, but gains weren’t uniform across all markets. Japan was a top performer for the Fund as investors cheered actions of Japan’s central bank. Bonds also posted gains in the first quarter with German government-issued bonds leading the way as European investors sought perceived safe haven assets after the Italian elections and during the Cyprus banking crisis. Commodities performed strongly at the start of the year, but sold off late in the quarter as weakness in the Chinese and European economies, a rising dollar and increased supplies of agricultural commodities and industrial metals depressed prices. Tactical positioning for the quarter aided Fund results as our overweight exposure (relative to the strategic allocations of IBRAA and IBRA) to equities and bonds helped to offset a slight drag from our overweight commodity exposure.
The second quarter was unusual, with a broad cross-section of markets declining, limiting the benefits of the Fund’s focus on economic diversification. Such environments are rare, but not unprecedented, and have typically been short-lived. Equities continued to provide narrow leadership across the major asset classes with European and US markets finishing positively, but not keeping pace with the Japanese market. Only the Hong Kong and the UK markets finished down for the quarter. Most commodity prices fell, with precious metals suffering the steepest decline. Government bonds sold off across the globe as investors perceived that the US Federal Reserve (the Fed) had signaled its intention to accelerate the reduction and cessation of its bond purchasing programs. Fund results from tactical shifts were flat for the second quarter as gains from overweights to equities were offset by losses from overweights to precious metals.
In the third quarter, equities led Fund results as all six markets in which the Fund, through the underlying funds, invests were positive, with Europe, US small caps and Hong Kong posting double-digit gains. Tactical positioning in the Fund benefited Fund results as we were overweight equities for the entire quarter. Our strategic allocation to commodities also aided Fund results as all four commodity complexes – energy, agriculture, industrial metals and precious metals – posted gains. Tactical positioning in
commodities detracted from Fund results for the quarter as negative results from agriculture and industrial metals slightly outweighed positive results from precious metals and energy. Bonds rose marginally as gains in Japanese and German government bonds were diluted by negative results from the UK, US, Australia and Canada. Tactical positioning in bonds produced flat results for the Fund as positive returns from underweight exposure to the UK were negated by losses from our overweight exposure to Germany and the US.
The Fund’s fourth quarter results were led by US large-cap equities, which posted double-digit returns. Japanese, US small cap and European equities also performed well. Our tactical positioning in equities helped Fund performance as we remained overweight to all the markets in which the Fund, through the underlying funds, invests. Government bond yields in developed markets, except Japan, drifted higher for three primary reasons: fears the Fed would begin tapering its asset purchases; improving economic data; and deteriorating investor sentiment for perceived safe haven assets. As a result, the strategic and tactical performance from government bonds detracted from Fund performance. From an asset class perspective, strategic and tactical allocations to commodities detracted from Fund performance.
Please note that IBRAA’s and IBRA’s strategy is principally implemented with derivative instruments that include futures and total return swaps. Therefore, all or most of the performance of the strategy, both positive and negative, can be attributed to these instruments. Derivatives can be a cost-effective way to gain exposure to asset classes. However, derivatives may amplify traditional investment risks through the creation of leverage and may be less liquid than traditional securities.
Thank you for your continued commitment to Invesco Balanced-Risk Retirement 2030 Fund.
The views and opinions expressed in management’s discussion of Fund performance are those of Invesco Advisers, Inc. These views and opinions are subject to change at any time based on factors such as market and economic conditions. These views and opinions may not be relied upon as investment advice or recommendations, or as an offer for a particular security. The information is not a complete analysis of every aspect of any market, country, industry, security or the Fund. Statements of fact are from sources considered reliable, but Invesco Advisers, Inc. makes no representation or warranty as to their completeness or accuracy. Although historical performance is no guarantee of future results, these insights may help you understand our investment management philosophy.
See important Fund and, if applicable, index disclosures later in this report.
| Mark Ahnrud Chartered Financial Analyst, portfolio manager, is manager of Invesco Balanced-Risk Retirement 2030 Fund. | |
| He joined Invesco in 2000. Mr. Ahnrud earned a BS in finance and investments from Babson College and an MBA from Duke University Fuqua School of Business. | ||
| Chris Devine Chartered Financial Analyst, portfolio manager, is manager of Invesco Balanced-Risk Retirement 2030 Fund. | |
| He joined Invesco in 1998. Mr. Devine earned a BA in economics from Wake Forest University and an MBA from the University of Georgia. | ||
| Scott Hixon Chartered Financial Analyst, portfolio manager, is manager of Invesco Balanced-Risk Retirement 2030 Fund. | |
| He joined Invesco in 1994. Mr. Hixon earned a BBA in finance from Georgia Southern University and an MBA in finance from Georgia State University. | ||
| Christian Ulrich Chartered Financial Analyst, portfolio manager, is manager of Invesco Balanced-Risk Retirement 2030 Fund. | |
| He joined Invesco in 2000. Mr. Ulrich earned the equivalent of a BBA from the KV Zurich Business School in Zurich, Switzerland. | ||
| Scott Wolle Chartered Financial Analyst, portfolio manager, is manager of Invesco Balanced-Risk Retirement 2030 Fund. | |
| He joined Invesco in 1999. Mr. Wolle earned a BS in finance from Virginia Polytechnic Institute and State University and an MBA from Duke University Fuqua School of Business. | ||
Assisted by the Global Asset Allocation Team
9 Invesco Balanced-Risk Retirement Funds
Management’s Discussion of Fund Performance
Performance summary - Invesco Balanced-Risk Retirement 2040 Fund
For the year ended December 31, 2013, Invesco Balanced-Risk Retirement 2040 Fund underperformed the Custom Balanced-Risk Retirement 2040 Index, the Fund’s custom style-specific benchmark. During periods in which equities perform strongly, the Fund may lag its style-specific benchmark due to the Fund’s asset class diversification. While rising yields and sagging commodity prices created headwinds for the Fund during the reporting period, at net asset value, the Fund posted positive absolute returns with its strategic equity and active positioning driving results for the year.
Your Fund’s long-term performance appears later in this report.
Fund vs. Indexes
Total returns, 12/31/12 to 12/31/13, at net asset value (NAV). Performance shown does not include applicable contingent deferred sales charges (CDSC) or front-end sales charges, which would have reduced performance.
| Class A Shares | 2.34 | % | |||
| Class AX Shares | 2.34 | ||||
| Class B Shares | 1.54 | ||||
| Class C Shares | 1.54 | ||||
| Class CX Shares | 1.54 | ||||
| Class R Shares | 1.97 | ||||
| Class RX Shares | 2.08 | ||||
| Class Y Shares | 2.49 | ||||
| Class R5 Shares | 2.60 | ||||
| Class R6 Shares | 2.60 | ||||
| S&P 500 Index‚ (Broad Market Index) | 32.39 | ||||
| Custom Balanced-Risk Allocation Broad Index¡ (Style-Specific Index) | 17.58 | ||||
| Custom Balanced-Risk Retirement 2040 Index¡ (Style-Specific Index) | 16.44 | ||||
| Lipper Mixed-Asset Target 2040 Funds Index¿ (Peer Group Index) | 21.23 |
Source(s): ‚Invesco, S&P-Dow Jones via FactSet Research Systems Inc.; ¡Invesco, Lipper Inc.;
¿ Lipper Inc.
How we invest
Invesco Balanced-Risk Retirement 2040 Fund (the Fund) uses a combination of Invesco Balanced-Risk Aggressive Allocation Fund (IBRAA), Invesco Balanced-Risk Allocation Fund (IBRA) and affiliated money market funds to provide broad market diversification and execute the Fund’s glide path strategy. IBRAA was added as an underlying investment to Invesco Balanced-Risk Retirement 2040 Fund on February 25, 2013.
IBRAA and IBRA employ a total return asset allocation strategy that invests in equity, fixed income and commodity markets. IBRAA and IBRA use a long-only, proprietary risk-balanced investment process that seeks to provide greater capital loss protection than traditional balanced
portfolios. IBRAA and IBRA invest in asset classes that are expected to perform differently in different economic environments to strive to enhance returns. The IBRAA and IBRA investment process, under normal conditions, is implemented with derivatives and other financially linked instruments (such as total return swaps, futures, commodity-linked notes, exchange-traded notes and exchange-traded funds) that create economic leverage and whose performance is expected to correspond to US and international fixed income, equity and commodity markets. Using derivatives allows us to gain more exposure to the asset classes than investing in more traditional assets such as stocks and bonds would allow. IBRAA and IBRA seek to gain exposure to the commodity markets primarily through
investments in Invesco Cayman Commodity Fund VI Ltd. and Invesco Cayman Commodity Fund I Ltd., respectively, wholly owned subsidiaries of the Fund organized under the laws of the Cayman Islands.
IBRAA and IBRA will maintain 50% to 100% of total assets (including assets held by the Subsidiaries) in cash and cash equivalent instruments, including affili-ated money market funds, as margin or collateral for the obligations under these derivative transactions. The larger the value of IBRAA’s and IBRA’s derivative positions, as opposed to positions held in non-derivative instruments, the more the underlying funds will be required to maintain cash and cash equivalents as margin or collateral for such derivatives.
The Fund employs a risk-balanced optimization process which accounts for the glide path; the glide path is the rate at which the asset mix changes over time. The glide path becomes more conservative on a quarterly basis as the Fund’s investments in IBRAA decrease and its investments in IBRA increase. Approximately 10 years from the target retirement date, the Fund ceases to invest in IBRAA and begins investing in the affili-ated money market funds. The Fund’s investments in the affiliated money market funds continue to increase and its investments in IBRA continues to decrease until approximately the target retirement date. This results in a blend of 60% IBRA and 40% affiliated money market funds at the target date of on or about 2040.
This glide path is intended to reduce the concerns of investors in the pre-retirement stage (defined as 10 years away from their target retirement date) that the value of their accumulated assets could decline in value due to adverse market conditions and they might not have time before retirement to recoup those losses. The Fund seeks to address such concerns by seeking to manage risk and protect accumulated wealth by transitioning from an accumulation strategy to a real return strategy at the target date.
Target Risk Allocation and Notional Asset Weights† By asset class
| ||||||||||
| Asset Class* | Risk Allocation | % of Net Assets as of 12/31/13** | ||||||||
| Equity | 49.95 | % | 50.18 | % | ||||||
| Fixed Income | 26.84 | 105.34 | ||||||||
| Commodities | 23.21 | 29.86 | ||||||||
| Cash | 0.00 | 0.00 | ||||||||
| Total Net Assets | $79.1 million |
| * | Based on the expected market exposure through investments in the underlying funds. |
| ** | Due to the use of leverage, the percentages may not equal 100%. |
IBRAA and IBRA, both underlying funds, use commodity-linked derivative investments and enhanced investment techniques such as leverage.
| † | Risk contribution is measured as the standard deviation of each asset as a percentage of total portfolio standard deviation. The risk contribution of each underlying asset determines the dollar-weighting of that asset. Standard deviation measures a fund’s range of total returns and fluctuations over a defined period of time. |
Fund Nasdaq Symbols
| ||
Class A Shares | TNDAX | |
Class AX Shares | VRGAX | |
Class B Shares | TNDBX | |
Class C Shares | TNDCX | |
Class CX Shares | VRGCX | |
Class R Shares | TNDRX | |
Class RX Shares | VRGRX | |
Class Y Shares | TNDYX | |
Class R5 Shares | TNDIX | |
Class R6 Shares | TNDFX | |
10 Invesco Balanced-Risk Retirement Funds
Market conditions and your Fund
During the year ended December 31, 2013, equity markets experienced periods of volatility due to geopolitical issues but, overall, they performed strongly. Tactical shifts between asset classes made within IBRAA and IBRA, both underlying funds, throughout the year helped us navigate through difficult environments and benefited overall Fund returns.
Equities were the primary driver of Fund performance for the first quarter, but gains weren’t uniform across all markets. Japan was a top performer for the Fund as investors cheered actions of Japan’s central bank. Bonds also posted gains in the first quarter with German government-issued bonds leading the way as European investors sought perceived safe haven assets after the Italian elections and during the Cyprus banking crisis. Commodities performed strongly at the start of the year, but sold off late in the quarter as weakness in the Chinese and European economies, a rising dollar and increased supplies of agricultural commodities and industrial metals depressed prices. Tactical positioning for the quarter aided Fund results as our overweight exposure (relative to the strategic allocations of IBRAA and IBRA) to equities and bonds helped to offset a slight drag from our overweight commodity exposure.
The second quarter was unusual, with a broad cross-section of markets declining, limiting the benefits of the Fund’s focus on economic diversification. Such environments are rare, but not unprecedented, and have typically been short-lived. Equities continued to provide narrow leadership across the major asset classes with European and US markets finishing positively, but not keeping pace with the Japanese market. Only the Hong Kong and the UK markets finished down for the quarter. Most commodity prices fell, with precious metals suffering the steepest decline. Government bonds sold off across the globe as investors perceived that the US Federal Reserve (the Fed) had signaled its intention to accelerate the reduction and cessation of its bond purchasing programs. Fund results from tactical shifts were flat for the second quarter as gains from overweights to equities were offset by losses from overweights to precious metals.
In the third quarter, equities led Fund results as all six markets in which the Fund, through the underlying funds, invests were positive, with Europe, US small caps and Hong Kong posting double-digit gains. Tactical positioning in the Fund benefited Fund results as we were overweight equities for the entire quarter. Our strategic allocation to commodities also aided Fund results as all four
commodity complexes – energy, agriculture, industrial metals and precious metals – posted gains. Tactical positioning in commodities detracted from Fund results for the quarter as negative results from agriculture and industrial metals slightly outweighed positive results from precious metals and energy. Bonds rose marginally as gains in Japanese and German government bonds were diluted by negative results from the UK, US, Australia and Canada. Tactical positioning in bonds produced flat results for the Fund as positive returns from underweight exposure to the UK were negated by losses from our overweight exposure to Germany and the US.
The Fund’s fourth quarter results were led by US large-cap equities, which posted double-digit returns. Japanese, US small cap and European equities also performed well. Our tactical positioning in equities helped Fund performance as we remained overweight to all the markets in which the Fund, through the underlying funds, invests. Government bond yields in developed markets, except Japan, drifted higher for three primary reasons: fears the Fed would begin tapering its asset purchases; improving economic data; and deteriorating investor sentiment for perceived safe haven assets. As a result, the strategic and tactical performance from government bonds detracted from Fund performance. From an asset class perspective, strategic and tactical allocations to commodities detracted from Fund performance.
Please note that IBRAA’s and IBRA’s strategy is principally implemented with derivative instruments that include futures and total return swaps. Therefore, all or most of the performance of the strategy, both positive and negative, can be attributed to these instruments. Derivatives can be a cost-effective way to gain exposure to asset classes. However, derivatives may amplify traditional investment risks through the creation of leverage and may be less liquid than traditional securities.
Thank you for your continued commitment to Invesco Balanced-Risk Retirement 2040 Fund.
The views and opinions expressed in management’s discussion of Fund performance are those of Invesco Advisers, Inc. These views and opinions are subject to change at any time based on factors such as market and economic conditions. These views and opinions may not be relied upon as investment advice or recommendations, or as an offer for a particular security. The information is not a complete analysis of every aspect of any market, country, industry, security or the Fund. Statements of fact are from sources considered reliable, but Invesco Advisers, Inc. makes no representation or warranty as to their completeness or accuracy. Although historical performance is no guarantee of future results, these insights may help you understand our investment management philosophy.
See important Fund and, if applicable, index disclosures later in this report.
| Mark Ahnrud Chartered Financial Analyst, portfolio manager, is manager of Invesco Balanced-Risk Retirement 2040 Fund. | |
| He joined Invesco in 2000. Mr. Ahnrud earned a BS in finance and investments from Babson College and an MBA from Duke University Fuqua School of Business. | ||
| Chris Devine Chartered Financial Analyst, portfolio manager, is manager of Invesco Balanced-Risk Retirement 2040 Fund. | |
| He joined Invesco in 1998. Mr. Devine earned a BA in economics from Wake Forest University and an MBA from the University of Georgia. | ||
| Scott Hixon Chartered Financial Analyst, portfolio manager, is manager of Invesco Balanced-Risk Retirement 2040 Fund. | |
| He joined Invesco in 1994. Mr. Hixon earned a BBA in finance from Georgia Southern University and an MBA in finance from Georgia State University. | ||
| Christian Ulrich Chartered Financial Analyst, portfolio manager, is manager of Invesco Balanced-Risk Retirement 2040 Fund. | |
| He joined Invesco in 2000. Mr. Ulrich earned the equivalent of a BBA from the KV Zurich Business School in Zurich, Switzerland. | ||
| Scott Wolle Chartered Financial Analyst, portfolio manager, is manager of Invesco Balanced-Risk Retirement 2040 Fund. | |
| He joined Invesco in 1999. Mr. Wolle earned a BS in finance from Virginia Polytechnic Institute and State University and an MBA from Duke University Fuqua School of Business. | ||
Assisted by the Global Asset Allocation Team
11 Invesco Balanced-Risk Retirement Funds
Management’s Discussion of Fund Performance
Performance summary - Invesco Balanced-Risk Retirement 2050 Fund
For the year ended December 31, 2013, Invesco Balanced-Risk Retirement 2050 Fund underperformed the Custom Balanced-Risk Retirement 2050 Index, the Fund’s custom style-specific benchmark. During periods in which equities perform strongly, the Fund may lag its style-specific benchmark due to the Fund’s asset class diversifica-tion. While rising yields and sagging commodity prices created headwinds for the Fund during the reporting period, at net asset value, the Fund posted positive absolute returns with its strategic equity and active positioning driving results for the year.
Your Fund’s long-term performance appears later in this report.
Fund vs. Indexes
Total returns, 12/31/12 to 12/31/13, at net asset value (NAV). Performance shown does not include applicable contingent deferred sales charges (CDSC) or front-end sales charges, which would have reduced performance.
| Class A Shares | 2.42 | % | |||
| Class AX Shares | 2.30 | ||||
| Class B Shares | 1.65 | ||||
| Class C Shares | 1.65 | ||||
| Class CX Shares | 1.65 | ||||
| Class R Shares | 2.18 | ||||
| Class RX Shares | 2.06 | ||||
| Class Y Shares | 2.68 | ||||
| Class R5 Shares | 2.68 | ||||
| Class R6 Shares | 2.67 | ||||
| S&P 500 Index‚ (Broad Market Index) | 32.39 | ||||
| Custom Balanced-Risk Allocation Broad Index¡ (Style-Specific Index) | 17.58 | ||||
| Custom Balanced-Risk Retirement 2050 Index¡ (Style-Specific Index) | 17.62 | ||||
| Lipper Mixed-Asset Target 2050 Funds Classification Average¿ (Peer Group) | 20.97 |
Source(s): ‚Invesco, S&P-Dow Jones via FactSet Research Systems Inc.; ¡Invesco, Lipper Inc.; ¿Lipper Inc.
How we invest
Invesco Balanced-Risk Retirement 2050 Fund (the Fund) uses a combination of Invesco Balanced-Risk Aggressive Allocation Fund (IBRAA), Invesco Balanced-Risk Allocation Fund (IBRA) and affiliated money market funds to provide broad market diversification and execute the Fund’s glide path strategy. IBRAA was added as an underlying investment to Invesco Balanced-Risk Retirement 2050 Fund on February 25, 2013.
IBRAA and IBRA employ a total return asset allocation strategy that invests in equity, fixed income and commodity markets. IBRAA and IBRA use a long-only, proprietary risk-balanced investment process that seeks to provide greater capital loss protection than traditional balanced portfolios. IBRAA and IBRA invest in asset
classes that are expected to perform differently in different economic environments to strive to enhance returns. The IBRAA and IBRA investment process, under normal conditions, is implemented with derivatives and other financially linked instruments (such as total return swaps, futures, commodity-linked notes, exchange-traded notes and exchange-traded funds) that create economic leverage and whose performance is expected to correspond to US and international fixed income, equity and commodity markets. Using derivatives allows us to gain more exposure to the asset classes than investing in more traditional assets such as stocks and bonds would allow. IBRAA and IBRA seek to gain exposure to the commodity markets primarily through investments in Invesco Cayman Commodity
Fund VI Ltd. and Invesco Cayman Commodity Fund I Ltd., respectively, wholly owned subsidiaries of the Fund organized under the laws of the Cayman Islands.
IBRAA and IBRA will maintain 50% to 100% of total assets (including assets held by the Subsidiaries) in cash and cash equivalent instruments, including affiliated money market funds, as margin or collateral for the obligations under these derivative transactions. The larger the value of IBRAA’s and IBRA’s derivative positions, as opposed to positions held in non-derivative instruments, the more the underlying funds will be required to maintain cash and cash equivalents as margin or collateral for such derivatives.
The Fund employs a risk-balanced optimization process which accounts for the glide path; the glide path is the rate at which the asset mix changes over time. The glide path becomes more conservative on a quarterly basis as the Fund’s investments in IBRAA decrease and its investments in IBRA increase. Approximately 10 years from the target retirement date, the Fund ceases to invest in IBRAA and begins investing in the affiliated money market funds. The Fund’s investments in the affiliated money market funds continue to increase and its investments in IBRA continues to decrease until approximately the target retirement date. This results in a blend of 60% IBRA and 40% affiliated money market funds at the target date of on or about 2050.
This glide path is intended to reduce the concerns of investors in the pre-retirement stage (defined as 10 years away from their target retirement date) that the value of their accumulated assets could decline in value due to adverse market conditions and they might not have time before retirement to recoup those losses. The Fund seeks to address such concerns by seeking to manage risk and protect accumulated wealth by transitioning from an accumulation strategy to a real return strategy at the target date.
Target Risk Allocation and Notional Asset Weights† By asset class
| ||||||||||
| Asset Class* | Risk Allocation | % of Net Assets as of 12/31/13** | ||||||||
| Equity | 49.95 | % | 56.74 | % | ||||||
| Fixed Income | 26.84 | 119.10 | ||||||||
| Commodities | 23.21 | 33.76 | ||||||||
| Cash | 0.00 | 0.00 | ||||||||
| Total Net Assets | $40.7 million |
| * | Based on the expected market exposure through investments in the underlying funds. |
| ** | Due to the use of leverage, the percentages may not equal 100%. |
IBRAA and IBRA, both underlying funds, use commodity-linked derivative investments and enhanced investment techniques such as leverage.
| † | Risk contribution is measured as the standard deviation of each asset as a percentage of total portfolio standard deviation. The risk contribution of each underlying asset determines the dollar-weighting of that asset. Standard deviation measures a fund’s range of total returns and fluctuations over a defined period of time. |
Fund Nasdaq Symbols
| ||
Class A Shares | TNEAX | |
Class AX Shares | VRIAX | |
Class B Shares | TNEBX | |
Class C Shares | TNECX | |
Class CX Shares | VRICX | |
Class R Shares | TNERX | |
Class RX Shares | VRIRX | |
Class Y Shares | TNEYX | |
Class R5 Shares | TNEIX | |
Class R6 Shares | TNEFX | |
12 Invesco Balanced-Risk Retirement Funds
Market conditions and your Fund
During the year ended December 31, 2013, equity markets experienced periods of volatility due to geopolitical issues but, overall, they performed strongly. Tactical shifts between asset classes made within IBRAA and IBRA, both underlying funds, throughout the year helped us navigate through difficult environments and benefited overall Fund returns.
Equities were the primary driver of Fund performance for the first quarter, but gains weren’t uniform across all markets. Japan was a top performer for the Fund as investors cheered actions of Japan’s central bank. Bonds also posted gains in the first quarter with German government-issued bonds leading the way as European investors sought perceived safe haven assets after the Italian elections and during the Cyprus banking crisis. Commodities performed strongly at the start of the year, but sold off late in the quarter as weakness in the Chinese and European economies, a rising dollar and increased supplies of agricultural commodities and industrial metals depressed prices. Tactical positioning for the quarter aided Fund results as our overweight exposure (relative to the strategic allocations of IBRAA and IBRA) to equities and bonds helped to offset a slight drag from our overweight commodity exposure.
The second quarter was unusual, with a broad cross-section of markets declining, limiting the benefits of the Fund’s focus on economic diversification. Such environments are rare, but not unprecedented, and have typically been short-lived. Equities continued to provide narrow leadership across the major asset classes with European and US markets finishing positively, but not keeping pace with the Japanese market. Only the Hong Kong and the UK markets finished down for the quarter. Most commodity prices fell, with precious metals suffering the steepest decline. Government bonds sold off across the globe as investors perceived that the US Federal Reserve (the Fed) had signaled its intention to accelerate the reduction and cessation of its bond purchasing programs. Fund results from tactical shifts were flat for the second quarter as gains from overweights to equities were offset by losses from overweights to precious metals.
In the third quarter, equities led Fund results as all six markets in which the Fund, through the underlying funds, invests were positive, with Europe, US small caps and Hong Kong posting double-digit gains. Tactical positioning in the Fund benefited Fund results as we were overweight equities for the entire quarter. Our strategic allocation to commodities also aided Fund results as all four
commodity complexes – energy, agriculture, industrial metals and precious metals – posted gains. Tactical positioning in commodities detracted from Fund results for the quarter as negative results from agriculture and industrial metals slightly outweighed positive results from precious metals and energy. Bonds rose marginally as gains in Japanese and German government bonds were diluted by negative results from the UK, US, Australia and Canada. Tactical positioning in bonds produced flat results for the Fund as positive returns from underweight exposure to the UK were negated by losses from our overweight exposure to Germany and the US.
The Fund’s fourth quarter results were led by US large-cap equities, which posted double-digit returns. Japanese, US small cap and European equities also performed well. Our tactical positioning in equities helped Fund performance as we remained overweight to all the markets in which the Fund, through the underlying funds, invests. Government bond yields in developed markets, except Japan, drifted higher for three primary reasons: fears the Fed would begin tapering its asset purchases; improving economic data; and deteriorating investor sentiment for perceived safe haven assets. As a result, the strategic and tactical performance from government bonds detracted from Fund performance. From an asset class perspective, strategic and tactical allocations to commodities detracted from Fund performance.
Please note that IBRAA’s and IBRA’s strategy is principally implemented with derivative instruments that include futures and total return swaps. Therefore, all or most of the performance of the strategy, both positive and negative, can be attributed to these instruments. Derivatives can be a cost-effective way to gain exposure to asset classes. However, derivatives may amplify traditional investment risks through the creation of leverage and may be less liquid than traditional securities.
Thank you for your continued commitment to Invesco Balanced-Risk Retirement 2050 Fund.
The views and opinions expressed in management’s discussion of Fund performance are those of Invesco Advisers, Inc. These views and opinions are subject to change at any time based on factors such as market and economic conditions. These views and opinions may not be relied upon as investment advice or recommendations, or as an offer for a particular security. The information is not a complete analysis of every aspect of any market, country, industry, security or the Fund. Statements of fact are from sources considered reliable, but Invesco Advisers, Inc. makes no representation or warranty as to their completeness or accuracy. Although historical performance is no guarantee of future results, these insights may help you understand our investment management philosophy.
See important Fund and, if applicable, index disclosures later in this report.
| Mark Ahnrud Chartered Financial Analyst, portfolio manager, is manager of Invesco Balanced-Risk Retirement 2050 Fund. | |
| He joined Invesco in 2000. Mr. Ahnrud earned a BS in finance and investments from Babson College and an MBA from Duke University Fuqua School of Business. | ||
| Chris Devine Chartered Financial Analyst, portfolio manager, is manager of Invesco Balanced-Risk Retirement 2050 Fund. | |
| He joined Invesco in 1998. Mr. Devine earned a BA in economics from Wake Forest University and an MBA from the University of Georgia. | ||
| Scott Hixon Chartered Financial Analyst, portfolio manager, is manager of Invesco Balanced-Risk Retirement 2050 Fund. | |
| He joined Invesco in 1994. Mr. Hixon earned a BBA in finance from Georgia Southern University and an MBA in finance from Georgia State University. | ||
| Christian Ulrich Chartered Financial Analyst, portfolio manager, is manager of Invesco Balanced-Risk Retirement 2050 Fund. | |
| He joined Invesco in 2000. Mr. Ulrich earned the equivalent of a BBA from the KV Zurich Business School in Zurich, Switzerland. | ||
| Scott Wolle Chartered Financial Analyst, portfolio manager, is manager of Invesco Balanced-Risk Retirement 2050 Fund. | |
| He joined Invesco in 1999. Mr. Wolle earned a BS in finance from Virginia Polytechnic Institute and State University and an MBA from Duke University Fuqua School of Business. | ||
Assisted by the Global Asset Allocation Team
13 Invesco Balanced-Risk Retirement Funds
Invesco Balanced-Risk Retirement Now Fund’s Long-Term Performance
Results of a $10,000 Investment – Oldest Share Class(es) since Inception
Fund and index data from 1/31/07
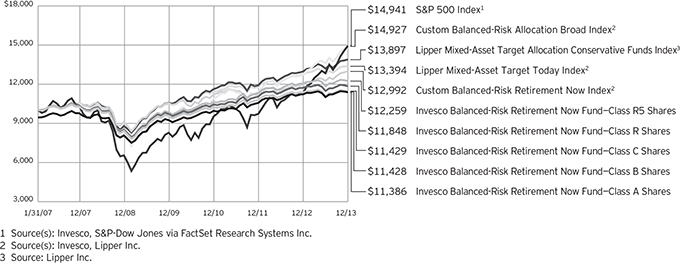
Past performance cannot guarantee comparable future results.
During the reporting period, the Fund has elected to use the Lipper Mixed-Asset Target Today Index as its peer group index rather than the Lipper Mixed-Asset Target Allocation Conservative Funds Index because the Lipper Mixed-Asset Target Today Index more closely reflects the performance of the types of securities in which the Fund invests. Because this is the first reporting
period since we have adopted the new index, Securities and Exchange Commission guidelines require that we compare performance to both the old and new indexes.
The data shown in the chart include reinvested distributions, applicable sales charges and Fund expenses including management fees. Results for Class B shares are calculated as if a hypothetical shareholder had liquidated his entire investment in the Fund at the close of the
reporting period and paid the contingent deferred sales charges, if applicable. Index results include reinvested dividends, but they do not reflect sales charges. Performance of the peer group, if applicable, reflects fund expenses and management fees; performance of a market index does not. Performance shown in the chart and table(s) does not reflect deduction of taxes a shareholder would pay on Fund distributions or sale of Fund shares.
14 Invesco Balanced-Risk Retirement Funds
| Average Annual Total Returns | |||||
As of 12/31/13, including maximum applicable sales charges | |||||
| Class A Shares | |||||
| Inception (1/31/07) | 1.89 | % | |||
| 5 Years | 5.91 | ||||
| 1 Year | -4.27 | ||||
| Class AX Shares | |||||
| Inception | 1.88 | % | |||
| 5 Years | 5.89 | ||||
| 1 Year | -4.27 | ||||
| Class B Shares | |||||
| Inception (1/31/07) | 1.95 | % | |||
| 5 Years | 5.97 | ||||
| 1 Year | -4.32 | ||||
| Class C Shares | |||||
| Inception (1/31/07) | 1.95 | % | |||
| 5 Years | 6.32 | ||||
| 1 Year | -0.41 | ||||
| Class CX Shares | |||||
| Inception | 1.94 | % | |||
| 5 Years | 6.29 | ||||
| 1 Year | -0.41 | ||||
| Class R Shares | |||||
| Inception (1/31/07) | 2.48 | % | |||
| 5 Years | 6.87 | ||||
| 1 Year | 1.13 | ||||
| Class RX Shares | |||||
| Inception | 2.45 | % | |||
| 5 Years | 6.81 | ||||
| 1 Year | 1.03 | ||||
| Class Y Shares | |||||
| Inception | 2.92 | % | |||
| 5 Years | 7.38 | ||||
| 1 Year | 1.51 | ||||
| Class R5 Shares | |||||
| Inception (1/31/07) | 2.99 | % | |||
| 5 Years | 7.38 | ||||
| 1 Year | 1.63 | ||||
| Class R6 Shares | |||||
| Inception | 2.78 | % | |||
| 5 Years | 7.19 | ||||
| 1 Year | 1.63 | ||||
Class AX shares incepted on June 1, 2010. Performance shown prior to that date is that of Class A shares and includes the 12b-1 fees applicable to Class A shares. Class A share performance reflects any applicable fee waivers or expense reimbursements.
Class CX and Class RX shares incepted on June 1, 2010. Performance shown prior to that date is that
of Class A shares, restated to reflect the higher 12b-1 fees applicable to Class CX and Class RX shares. Class A share performance reflects any applicable fee waivers or expense reimbursements.
Class Y shares incepted on October 3, 2008. Performance shown prior to that date is that of Class A shares and includes the 12b-1 fees applicable to Class A shares. Class A share performance reflects any applicable fee waivers or expense reimbursements.
Class R6 shares incepted on September 24, 2012. Performance shown prior to that date is that of Class A shares and includes the 12b-1 fees applicable to Class A shares. Class A share performance reflects any applicable fee waivers or expense reimbursements.
The performance data quoted represent past performance and cannot guarantee comparable future results; current performance may be lower or higher. Please visit invesco.com/performance for the most recent month-end performance. Performance figures reflect reinvested distributions, changes in net asset value and the effect of the maximum sales charge unless otherwise stated. Investment return and principal value will fluctuate so that you may have a gain or loss when you sell shares.
The net annual Fund operating expense ratio set forth in the most recent Fund prospectus as of the date of this report for Class A, Class AX, Class B, Class C, Class CX, Class R, Class RX, Class Y, Class R5 and Class R6 shares was 0.77%, 0.77%, 1.52%, 1.52%, 1.52%, 1.02%, 1.02%, 0.52%, 0.52% and 0.52%, respectively.1,2 The total annual Fund operating expense ratio set forth in the most recent Fund prospectus as of the date of this report for Class A, Class AX, Class B, Class C, Class CX, Class R, Class RX, Class Y, Class R5 and Class R6 shares was 1.48%, 1.48%, 2.23%, 2.23%, 2.23%, 1.73%, 1.73%, 1.23%, 1.18% and 1.08%, respectively.1 The expense ratios presented above may vary from the expense ratios presented in other sections of this report that are based on expenses incurred during the period covered by this report.
Class A and Class AX share performance reflects the maximum 5.50% sales charge, and Class B, Class C and Class CX share performance reflects the applicable contingent deferred sales charge (CDSC) for the period involved. The CDSC on Class B shares declines from 5% beginning at the time of purchase to 0% at the beginning of the seventh year. The CDSC on Class C and Class CX shares is 1% for the first year after purchase. Class R, Class RX, Class Y, Class R5 and Class R6 shares do not have a front-end sales charge or a CDSC; therefore, performance is at net asset value.
The performance of the Fund’s share classes will differ primarily due to different sales charge structures and class expenses.
Had the adviser not waived fees and/or reimbursed expenses, performance would have been lower.
| 1 | The expense ratio includes acquired fund fees and expenses of the underlying funds in which the Fund invests of 0.52% for Invesco Balanced-Risk Retirement Now Fund. |
| 2 | Total annual Fund operating expenses after any contractual fee waivers and/or expense reimbursements by the adviser in effect through at least April 30, 2015. See current prospectus for more information. |
15 Invesco Balanced-Risk Retirement Funds
Invesco Balanced-Risk Retirement 2020 Fund’s Long-Term Performance
Results of a $10,000 Investment – Oldest Share Class(es) since Inception
Fund and index data from 1/31/07
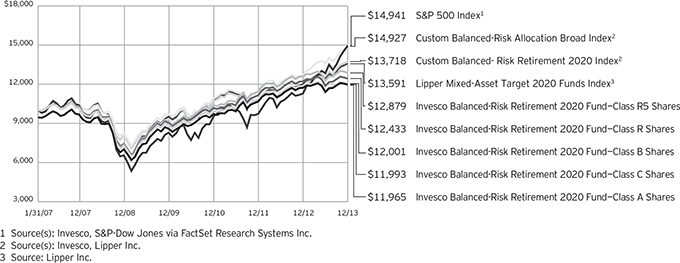
Past performance cannot guarantee comparable future results.
The data shown in the chart include reinvested distributions, applicable sales charges and Fund expenses including management fees. Results for Class B shares are calculated as if a hypothetical shareholder had liquidated his entire investment in the Fund at the close of the reporting period and paid the contingent deferred sales charges, if applicable. Index results include reinvested dividends,
but they do not reflect sales charges. Performance of the peer group, if applicable, reflects fund expenses and management fees; performance of a market index does not. Performance shown in the chart and table(s) does not reflect deduction of taxes a shareholder would pay on Fund distributions or sale of Fund shares.
16 Invesco Balanced-Risk Retirement Funds
| Average Annual Total Returns | |||||
As of 12/31/13, including maximum applicable sales charges | |||||
| Class A Shares | |||||
| Inception (1/31/07) | 2.63 | % | |||
| 5 Years | 10.03 | ||||
| 1 Year | -3.57 | ||||
| Class AX Shares | |||||
| Inception | 2.61 | % | |||
| 5 Years | 10.01 | ||||
| 1 Year | -3.67 | ||||
| Class B Shares | |||||
| Inception (1/31/07) | 2.67 | % | |||
| 5 Years | 10.12 | ||||
| 1 Year | -3.71 | ||||
| Class C Shares | |||||
| Inception (1/31/07) | 2.66 | % | |||
| 5 Years | 10.44 | ||||
| 1 Year | 0.31 | ||||
| Class CX Shares | |||||
| Inception | 2.69 | % | |||
| 5 Years | 10.44 | ||||
| 1 Year | 0.31 | ||||
| Class R Shares | |||||
| Inception (1/31/07) | 3.20 | % | |||
| 5 Years | 10.98 | ||||
| 1 Year | 1.73 | ||||
| Class RX Shares | |||||
| Inception | 3.20 | % | |||
| 5 Years | 10.99 | ||||
| 1 Year | 1.73 | ||||
| Class Y Shares | |||||
| Inception | 3.63 | % | |||
| 5 Years | 11.50 | ||||
| 1 Year | 2.16 | ||||
| Class R5 Shares | |||||
| Inception (1/31/07) | 3.73 | % | |||
| 5 Years | 11.53 | ||||
| 1 Year | 2.26 | ||||
| Class R6 Shares | |||||
| Inception | 3.52 | % | |||
| 5 Years | 11.35 | ||||
| 1 Year | 2.25 | ||||
Class AX shares incepted on June 1, 2010. Performance shown prior to that date is that of Class A shares and includes the 12b-1 fees applicable to Class A shares. Class A share performance reflects any applicable fee waivers or expense reimbursements.
Class CX and Class RX shares incepted on June 1, 2010. Performance shown prior to that date is that
of Class A shares, restated to reflect the higher 12b-1 fees applicable to Class CX and Class RX shares. Class A share performance reflects any applicable fee waivers or expense reimbursements.
Class Y shares incepted on October 3, 2008. Performance shown prior to that date is that of Class A shares and includes the 12b-1 fees applicable to Class A shares. Class A share performance reflects any applicable fee waivers or expense reimbursements.
Class R6 shares incepted on September 24, 2012. Performance shown prior to that date is that of Class A shares and includes the 12b-1 fees applicable to Class A shares. Class A share performance reflects any applicable fee waivers or expense reimbursements.
The performance data quoted represent past performance and cannot guarantee comparable future results; current performance may be lower or higher. Please visit invesco.com/performance for the most recent month-end performance. Performance figures reflect reinvested distributions, changes in net asset value and the effect of the maximum sales charge unless otherwise stated. Investment return and principal value will fluctuate so that you may have a gain or loss when you sell shares.
The net annual Fund operating expense ratio set forth in the most recent Fund prospectus as of the date of this report for Class A, Class AX, Class B, Class C, Class CX, Class R, Class RX, Class Y, Class R5 and Class R6 shares was 0.96%, 0.96%, 1.71%, 1.71%, 1.71%, 1.21%, 1.21%, 0.71%, 0.71% and 0.71%, respectively.1,2 The total annual Fund operating expense ratio set forth in the most recent Fund prospectus as of the date of this report for Class A, Class AX, Class B, Class C, Class CX, Class R, Class RX, Class Y, Class R5 and Class R6 shares was 1.46%, 1.46%, 2.21%, 2.21%, 2.21%, 1.71%, 1.71%, 1.21%, 1.13% and 1.03%, respectively.1 The expense ratios presented above may vary from the expense ratios presented in other sections of this report that are based on expenses incurred during the period covered by this report.
Class A and Class AX share performance reflects the maximum 5.50% sales charge, and Class B, Class C and Class CX share performance reflects the applicable contingent deferred sales charge (CDSC) for the period involved. The CDSC on Class B shares declines from 5% beginning at the time of purchase to 0% at the beginning of the seventh year. The CDSC on Class C and Class CX shares is 1% for the first year after purchase. Class R, Class RX, Class Y, Class R5 and Class R6 shares do not have a front-end sales charge or a CDSC; therefore, performance is at net asset value.
The performance of the Fund’s share classes will differ primarily due to different sales charge structures and class expenses.
Had the adviser not waived fees and/or reimbursed expenses, performance would have been lower.
| 1 | The expense ratio includes acquired fund fees and expenses of the underlying funds in which the Fund invests of 0.71% for Invesco Balanced-Risk Retirement 2020 Fund. |
| 2 | Total annual Fund operating expenses after any contractual fee waivers and/or expense reimbursements by the adviser in effect through at least April 30, 2015. See current prospectus for more information. |
17 Invesco Balanced-Risk Retirement Funds
Invesco Balanced-Risk Retirement 2030 Fund’s Long-Term Performance
Results of a $10,000 Investment – Oldest Share Class(es) since Inception
Fund and index data from 1/31/07
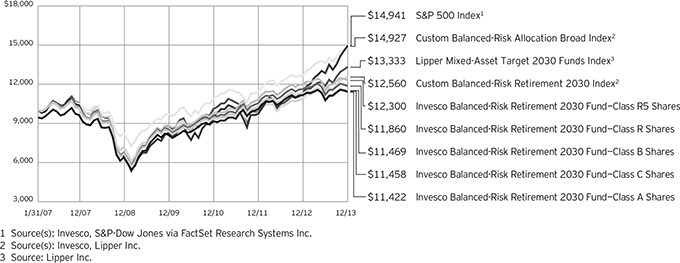
Past performance cannot guarantee comparable future results.
The data shown in the chart include reinvested distributions, applicable sales charges and Fund expenses including management fees. Results for Class B shares are calculated as if a hypothetical shareholder had liquidated his entire investment in the Fund at the close of the reporting period and paid the contingent deferred sales charges, if applicable. Index results include reinvested dividends,
but they do not reflect sales charges. Performance of the peer group, if applicable, reflects fund expenses and management fees; performance of a market index does not. Performance shown in the chart and table(s) does not reflect deduction of taxes a shareholder would pay on Fund distributions or sale of Fund shares.
18 Invesco Balanced-Risk Retirement Funds
| Average Annual Total Returns | |||||
As of 12/31/13, including maximum applicable sales charges | |||||
| Class A Shares | |||||
| Inception (1/31/07) | 1.94 | % | |||
| 5 Years | 11.02 | ||||
| 1 Year | -3.37 | ||||
| Class AX Shares | |||||
| Inception | 1.94 | % | |||
| 5 Years | 11.02 | ||||
| 1 Year | -3.38 | ||||
| Class B Shares | |||||
| Inception (1/31/07) | 2.00 | % | |||
| 5 Years | 11.17 | ||||
| 1 Year | -3.38 | ||||
| Class C Shares | |||||
| Inception (1/31/07) | 1.99 | % | |||
| 5 Years | 11.41 | ||||
| 1 Year | 0.54 | ||||
| Class CX Shares | |||||
| Inception | 2.02 | % | |||
| 5 Years | 11.47 | ||||
| 1 Year | 0.66 | ||||
| Class R Shares | |||||
| Inception (1/31/07) | 2.50 | % | |||
| 5 Years | 12.01 | ||||
| 1 Year | 2.03 | ||||
| Class RX Shares | |||||
| Inception | 2.52 | % | |||
| 5 Years | 12.02 | ||||
| 1 Year | 2.04 | ||||
| Class Y Shares | |||||
| Inception | 2.97 | % | |||
| 5 Years | 12.57 | ||||
| 1 Year | 2.52 | ||||
| Class R5 Shares | |||||
| Inception (1/31/07) | 3.04 | % | |||
| 5 Years | 12.58 | ||||
| 1 Year | 2.52 | ||||
| Class R6 Shares | |||||
| Inception | 2.82 | % | |||
| 5 Years | 12.36 | ||||
| 1 Year | 2.52 | ||||
Class AX shares incepted on June 1, 2010. Performance shown prior to that date is that of Class A shares and includes the 12b-1 fees applicable to Class A shares. Class A share performance reflects any applicable fee waivers or expense reimbursements.
Class CX and Class RX shares incepted on June 1, 2010. Performance shown prior to that date is that of Class A shares, restated to reflect
the higher 12b-1 fees applicable to Class CX and Class RX shares. Class A share performance reflects any applicable fee waivers or expense reimbursements.
Class Y shares incepted on October 3, 2008. Performance shown prior to that date is that of Class A shares and includes the 12b-1 fees applicable to Class A shares. Class A share performance reflects any applicable fee waivers or expense reimbursements.
Class R6 shares incepted on September 24, 2012. Performance shown prior to that date is that of Class A shares and includes the 12b-1 fees applicable to Class A shares. Class A share performance reflects any applicable fee waivers or expense reimbursements.
The performance data quoted represent past performance and cannot guarantee comparable future results; current performance may be lower or higher. Please visit invesco.com/performance for the most recent month-end performance. Performance figures reflect reinvested distributions, changes in net asset value and the effect of the maximum sales charge unless otherwise stated. Investment return and principal value will fluctuate so that you may have a gain or loss when you sell shares.
The net annual Fund operating expense ratio set forth in the most recent Fund prospectus as of the date of this report for Class A, Class AX, Class B, Class C, Class CX, Class R, Class RX, Class Y, Class R5 and Class R6 shares was 1.10%, 1.10%, 1.85%, 1.85%, 1.85%, 1.35%, 1.35%, 0.85%, 0.85% and 0.85%, respectively.1,2 The total annual Fund operating expense ratio set forth in the most recent Fund prospectus as of the date of this report for Class A, Class AX, Class B, Class C, Class CX, Class R, Class RX, Class Y, Class R5 and Class R6 shares was 1.61%, 1.61%, 2.36%, 2.36%, 2.36%, 1.86%, 1.86%, 1.36%, 1.25% and 1.17%, respectively.1 The expense ratios presented above may vary from the expense ratios presented in other sections of this report that are based on expenses incurred during the period covered by this report.
Class A and Class AX share performance reflects the maximum 5.50% sales charge, and Class B, Class C and Class CX share performance reflects the applicable contingent deferred sales charge (CDSC) for the period involved. The CDSC on Class B shares declines from 5% beginning at the time of purchase to 0% at the beginning of the seventh year. The CDSC on Class C and Class CX shares is 1% for the first year after purchase. Class R, Class RX, Class Y, Class R5 and Class R6 shares do not have a front-end sales charge or a CDSC; therefore, performance is at net asset value.
The performance of the Fund’s share classes will differ primarily due to different sales charge structures and class expenses.
Had the adviser not waived fees and/or reimbursed expenses, performance would have been lower.
| 1 | The expense ratio includes acquired fund fees and expenses of the underlying funds in which the Fund invests of 0.85% for Invesco Balanced-Risk Retirement 2030 Fund. |
| 2 | Total annual Fund operating expenses after any contractual fee waivers and/or expense reimbursements by the adviser in effect through at least April 30, 2015. See current prospectus for more information. |
19 Invesco Balanced-Risk Retirement Funds
Invesco Balanced-Risk Retirement 2040 Fund’s Long-Term Performance
Results of a $10,000 Investment – Oldest Share Class(es) since Inception
Fund and index data from 1/31/07
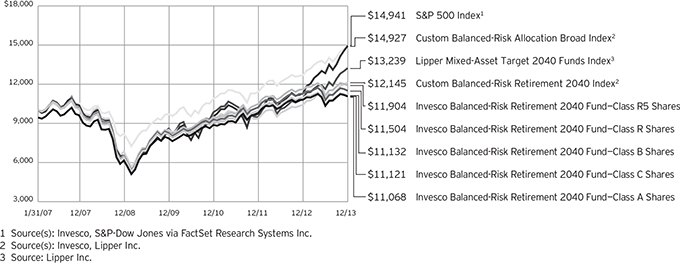
Past performance cannot guarantee comparable future results.
The data shown in the chart include reinvested distributions, applicable sales charges and Fund expenses including management fees. Results for Class B shares are calculated as if a hypothetical shareholder had liquidated his entire investment in the Fund at the close of the reporting period and paid the contingent deferred sales charges, if applicable. Index results include reinvested dividends,
but they do not reflect sales charges. Performance of the peer group, if applicable, reflects fund expenses and management fees; performance of a market index does not. Performance shown in the chart and table(s) does not reflect deduction of taxes a shareholder would pay on Fund distributions or sale of Fund shares.
20 Invesco Balanced-Risk Retirement Funds
| Average Annual Total Returns | |||||
As of 12/31/13, including maximum applicable sales charges | |||||
| Class A Shares | |||||
| Inception (1/31/07) | 1.48 | % | |||
| 5 Years | 11.19 | ||||
| 1 Year | -3.29 | ||||
| Class AX Shares | |||||
| Inception | 1.48 | % | |||
| 5 Years | 11.19 | ||||
| 1 Year | -3.29 | ||||
| Class B Shares | |||||
| Inception (1/31/07) | 1.56 | % | |||
| 5 Years | 11.38 | ||||
| 1 Year | -3.22 | ||||
| Class C Shares | |||||
| Inception (1/31/07) | 1.55 | % | |||
| 5 Years | 11.62 | ||||
| 1 Year | 0.59 | ||||
| Class CX Shares | |||||
| Inception | 1.54 | % | |||
| 5 Years | 11.60 | ||||
| 1 Year | 0.59 | ||||
| Class R Shares | |||||
| Inception (1/31/07) | 2.05 | % | |||
| 5 Years | 12.18 | ||||
| 1 Year | 1.97 | ||||
| Class RX Shares | |||||
| Inception | 2.07 | % | |||
| 5 Years | 12.18 | ||||
| 1 Year | 2.08 | ||||
| Class Y Shares | |||||
| Inception | 2.50 | % | |||
| 5 Years | 12.72 | ||||
| 1 Year | 2.49 | ||||
| Class R5 Shares | |||||
| Inception (1/31/07) | 2.55 | % | |||
| 5 Years | 12.74 | ||||
| 1 Year | 2.60 | ||||
| Class R6 Shares | |||||
| Inception | 2.37 | % | |||
| 5 Years | 12.54 | ||||
| 1 Year | 2.60 | ||||
Class AX shares incepted on June 1, 2010. Performance shown prior to that date is that of Class A shares and includes the 12b-1 fees applicable to Class A shares. Class A share performance reflects any applicable fee waivers or expense reimbursements.
Class CX and Class RX shares incepted on June 1, 2010. Performance shown prior to that date is that of Class A shares, restated to reflect
the higher 12b-1 fees applicable to Class CX and Class RX shares. Class A share performance reflects any applicable fee waivers or expense reimbursements.
Class Y shares incepted on October 3, 2008. Performance shown prior to that date is that of Class A shares and includes the 12b-1 fees applicable to Class A shares. Class A share performance reflects any applicable fee waivers or expense reimbursements.
Class R6 shares incepted on September 24, 2012. Performance shown prior to that date is that of Class A shares and includes the 12b-1 fees applicable to Class A shares. Class A share performance reflects any applicable fee waivers or expense reimbursements.
The performance data quoted represent past performance and cannot guarantee comparable future results; current performance may be lower or higher. Please visit invesco.com/performance for the most recent month-end performance. Performance figures reflect reinvested distributions, changes in net asset value and the effect of the maximum sales charge unless otherwise stated. Investment return and principal value will fluctuate so that you may have a gain or loss when you sell shares.
The net annual Fund operating expense ratio set forth in the most recent Fund prospectus as of the date of this report for Class A, Class AX, Class B, Class C, Class CX, Class R, Class RX, Class Y, Class R5 and Class R6 shares was 1.23%, 1.23%, 1.98%, 1.98%, 1.98%, 1.48%, 1.48%, 0.98%, 0.98% and 0.98%, respectively.1,2 The total annual Fund operating expense ratio set forth in the most recent Fund prospectus as of the date of this report for Class A, Class AX, Class B, Class C, Class CX, Class R, Class RX, Class Y, Class R5 and Class R6 shares was 2.05%, 2.05%, 2.80%, 2.80%, 2.80%, 2.30%, 2.30%, 1.80%, 1.63% and 1.54%, respectively.1 The expense ratios presented above may vary from the expense ratios presented in other sections of this report that are based on expenses incurred during the period covered by this report.
Class A and Class AX share performance reflects the maximum 5.50% sales charge, and Class B, Class C and Class CX share performance reflects the applicable contingent deferred sales charge (CDSC) for the period involved. The CDSC on Class B shares declines from 5% beginning at the time of purchase to 0% at the beginning of the seventh year. The CDSC on Class C and Class CX shares is 1% for the first year after purchase. Class R, Class RX, Class Y, Class R5 and Class R6 shares do not have a front-end sales charge or a CDSC; therefore, performance is at net asset value.
The performance of the Fund’s share classes will differ primarily due to different sales charge structures and class expenses.
Had the adviser not waived fees and/ or reimbursed expenses, performance would have been lower.
| 1 | The expense ratio includes acquired fund fees and expenses of the underlying funds in which the Fund invests of 0.98% for Invesco Balanced-Risk Retirement 2040 Fund. |
| 2 | Total annual Fund operating expenses after any contractual fee waivers and/or expense reimbursements by the adviser in effect through at least April 30, 2015. See current prospectus for more information. |
21 Invesco Balanced-Risk Retirement Funds
Invesco Balanced-Risk Retirement 2050 Fund’s Long-Term Performance
Results of a $10,000 Investment – Oldest Share Class(es) since Inception
Fund and index data from 1/31/07
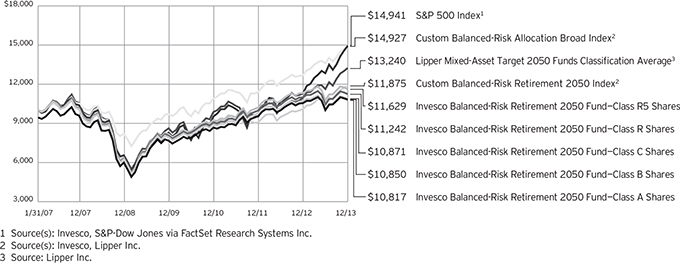
Past performance cannot guarantee comparable future results.
The data shown in the chart include reinvested distributions, applicable sales charges and Fund expenses including management fees. Results for Class B shares are calculated as if a hypothetical shareholder had liquidated his entire investment in the Fund at the close of the reporting period and paid the contingent deferred sales charges, if applicable. Index results include reinvested dividends,
but they do not reflect sales charges. Performance of the peer group, if applicable, reflects fund expenses and management fees; performance of a market index does not. Performance shown in the chart and table(s) does not reflect deduction of taxes a shareholder would pay on Fund distributions or sale of Fund shares.
22 Invesco Balanced-Risk Retirement Funds
| Average Annual Total Returns | |||||
As of 12/31/13, including maximum applicable sales charges | |||||
| Class A Shares | |||||
| Inception (1/31/07) | 1.14 | % | |||
| 5 Years | 11.25 | ||||
| 1 Year | -3.27 | ||||
| Class AX Shares | |||||
| Inception | 1.12 | % | |||
| 5 Years | 11.22 | ||||
| 1 Year | -3.37 | ||||
| Class B Shares | |||||
| Inception (1/31/07) | 1.19 | % | |||
| 5 Years | 11.42 | ||||
| 1 Year | -3.07 | ||||
| Class C Shares | |||||
| Inception (1/31/07) | 1.21 | % | |||
| 5 Years | 11.68 | ||||
| 1 Year | 0.70 | ||||
| Class CX Shares | |||||
| Inception | 1.19 | % | |||
| 5 Years | 11.65 | ||||
| 1 Year | 0.70 | ||||
| Class R Shares | |||||
| Inception (1/31/07) | 1.71 | % | |||
| 5 Years | 12.27 | ||||
| 1 Year | 2.18 | ||||
| Class RX Shares | |||||
| Inception | 1.70 | % | |||
| 5 Years | 12.21 | ||||
| 1 Year | 2.06 | ||||
| Class Y Shares | |||||
| Inception | 2.15 | % | |||
| 5 Years | 12.77 | ||||
| 1 Year | 2.68 | ||||
| Class R5 Shares | |||||
| Inception (1/31/07) | 2.21 | % | |||
| 5 Years | 12.79 | ||||
| 1 Year | 2.68 | ||||
| Class R6 Shares | |||||
| Inception | 2.02 | % | |||
| 5 Years | 12.59 | ||||
| 1 Year | 2.67 | ||||
Class AX shares incepted on June 1, 2010. Performance shown prior to that date is that of Class A shares and includes the 12b-1 fees applicable to Class A shares. Class A share performance reflects any applicable fee waivers or expense reimbursements.
Class CX and Class RX shares incepted on June 1, 2010. Performance shown prior to that date is that of Class A shares, restated to reflect
the higher 12b-1 fees applicable to Class CX and Class RX shares. Class A share performance reflects any applicable fee waivers or expense reimbursements.
Class Y shares incepted on October 3, 2008. Performance shown prior to that date is that of Class A shares and includes the 12b-1 fees applicable to Class A shares. Class A share performance reflects any applicable fee waivers or expense reimbursements.
Class R6 shares incepted on September 24, 2012. Performance shown prior to that date is that of Class A shares and includes the 12b-1 fees applicable to Class A shares. Class A share performance reflects any applicable fee waivers or expense reimbursements.
The performance data quoted represent past performance and cannot guarantee comparable future results; current performance may be lower or higher. Please visit invesco.com/performance for the most recent month-end performance. Performance figures reflect reinvested distributions, changes in net asset value and the effect of the maximum sales charge unless otherwise stated. Investment return and principal value will fluctuate so that you may have a gain or loss when you sell shares.
The net annual Fund operating expense ratio set forth in the most recent Fund prospectus as of the date of this report for Class A, Class AX, Class B, Class C, Class CX, Class R, Class RX, Class Y, Class R5 and Class R6 shares was 1.36%, 1.36%, 2.11%, 2.11%, 2.11%, 1.61%, 1.61%, 1.11%, 1.11% and 1.11%, respectively.1,2 The total annual Fund operating expense ratio set forth in the most recent Fund prospectus as of the date of this report for Class A, Class AX, Class B, Class C, Class CX, Class R, Class RX, Class Y, Class R5 and Class R6 shares was 2.68%, 2.68%, 3.43%, 3.43%, 3.43%, 2.93%, 2.93%, 2.43%, 2.19% and 2.10%, respectively.1 The expense ratios presented above may vary from the expense ratios presented in other sections of this report that are based on expenses incurred during the period covered by this report.
Class A and Class AX share performance reflects the maximum 5.50% sales charge, and Class B, Class C and Class CX share performance reflects the applicable contingent deferred sales charge (CDSC) for the period involved. The CDSC on Class B shares declines from 5% beginning at the time of purchase to 0% at the beginning of the seventh year. The CDSC on Class C and Class CX shares is 1% for the first year after purchase. Class R, Class RX, Class Y, Class R5 and Class R6 shares do not have a front-end sales charge or a CDSC; therefore, performance is at net asset value.
The performance of the Fund’s share classes will differ primarily due to different sales charge structures and class expenses.
Had the adviser not waived fees and/or reimbursed expenses, performance would have been lower.
| 1 | The expense ratio includes acquired fund fees and expenses of the underlying funds in which the Fund invests of 1.11% for Invesco Balanced-Risk Retirement 2050 Fund. |
| 2 | Total annual Fund operating expenses after any contractual fee waivers and/or expense reimbursements by the adviser in effect through at least April 30, 2015. See current prospectus for more information. |
23 Invesco Balanced-Risk Retirement Funds
Invesco Balanced-Risk Retirement Now Fund’s investment objective is to provide real return and, as a secondary objective, capital preservation.
Invesco Balanced-Risk Retirement 2020 Fund’s, Invesco Balanced-Risk Retirement 2030 Fund’s, Invesco Balanced-Risk Retirement 2040 Fund’s and Invesco Balanced-Risk Retirement 2050 Fund’s investment objective is to provide total return with a low to moderate correlation to traditional financial market indices, and as a secondary objective, capital preservation.
| n | Unless otherwise stated, information presented in this report is as of December 31, 2013, and is based on total net assets. |
| n | Unless otherwise noted, all data provided by Invesco. |
| n | To access your Fund’s reports/prospectus, visit invesco.com/fundreports. |
About share classes
| n | Class AX shares, Class CX shares, Class RX shares and Class Y shares are available only to certain investors. Please see the prospectus for more information. |
| n | Class B shares may not be purchased for new or additional investments. Please see the prospectus for more information. |
| n | Class R shares are generally available only to employee benefit plans. Please see the prospectus for more information. |
| n | Class R5 shares and Class R6 shares are primarily intended for retirement plans that meet certain standards and for institutional investors. Please see the prospectus for more information. |
Principal risks of investing in Invesco Balanced-Risk Retirement Funds
| n | Commodity-linked notes risk. An underlying fund’s investments in commodity-linked notes involve substantial risks, including risk of loss of a significant portion of their principal value. In addition to risks associated with the underlying commodities, they may be subject to additional special risks, such as risk of loss of interest and principal, lack of a secondary market and risk of greater volatility, that do not affect traditional equity and debt securities. If payment of interest on a commodity-linked note is linked to the value of a particular commodity, commodity index or other economic variable, an underlying fund might not receive all (or a portion) of the interest due on its investment if there is a loss of value of the underlying variable to which the interest is linked. To the extent that the amount of the principal to be repaid upon maturity |
is linked to the value of a particular commodity, commodity index or other economic variable, an underlying fund might not receive all or a portion of the principal at maturity of the investment. A liquid secondary market may not exist for the commodity-linked notes an underlying fund buys, which may make it difficult for an underlying fund to sell them at an acceptable price or to accurately value them. Commodity-linked notes are also subject to the credit risk of the issuer. If the issuer becomes bankrupt or otherwise fails to pay, an underlying fund could lose money. The value of the commodity-linked notes an underlying fund buys may fluctuate significantly because the values of the underlying investments to which they are linked are themselves volatile. Additionally, commodity-linked notes employ “economic” leverage that does not result in the possibility of an underlying fund incurring obligations beyond its investment, but that nonetheless permit an underlying fund to gain exposure that is greater than would be the case in an unlevered security. The particular terms of a commodity-linked note may create economic leverage by requiring payment by the issuer of an amount that is a multiple of the price increase or decrease of the underlying commodity, commodity index, or other economic variable. For example, a three-times leveraged note will change by a magnitude of three for every percentage change (positive or negative) in the value of the underlying commodity, index or other economic variable. Such economic leverage will increase the volatility of the value of these commodity-linked notes and an underlying fund to the extent it invests in such notes. An underlying fund does not segregate assets or otherwise cover |
| This report must be accompanied or preceded by a currently effective Fund prospectus, which contains more complete information, including sales charges and expenses. Investors should read it carefully before investing. |
NOT FDIC INSURED | MAY LOSE VALUE | NO BANK GUARANTEE |
investments in securities with economic leverage. |
| n | Commodity risk. Invesco Balanced-Risk Allocation Fund and Invesco Balanced-Risk Aggressive Allocation Fund, each an underlying fund, have significant investment exposure to the commodities markets and/or a particular sector of the commodities markets, which may subject the underlying fund to greater volatility than investments in traditional securities, such as stocks and bonds. The commodities markets may fluctuate widely based on a variety of factors, including changes in overall market movements, domestic and foreign political and economic events and policies, war, acts of terrorism, changes in domestic or foreign interest rates and/or investor expectations concerning interest rates, domestic and foreign inflation rates and investment and trading activities of mutual funds, hedge funds and commodities funds. Prices of various commodities may also be affected by factors such as drought, floods, weather, livestock disease, embargoes, tariffs and other regulatory developments. The prices of commodities can also fluctuate widely due to supply and demand disruptions in major producing or consuming regions. Certain commodities may be produced in a limited number of countries and may be controlled by a small number of producers or groups of producers. As a result, political, economic and supply related events in such countries could have a disproportionate impact on the prices of such commodities. Because certain of the underlying funds’ performance is linked to the performance of potentially volatile commodities, investors should be willing to assume the risks of potentially significant fluctuations in the value of the underlying fund’s shares. |
| n | Correlation risk. Changes in the value of two investments or asset classes may not track or offset each other in the manner anticipated by the portfolio managers. Because the Fund’s investment strategy seeks to balance risk across three asset classes and, within |
24 Invesco Balanced-Risk Retirement Funds
| each asset class, to balance risk across different countries and commodities, to the extent either the three asset classes or the selected countries and commodities are correlated in a way not anticipated by the portfolio managers the Fund’s risk allocation process may not succeed in achieving its investment objective. |
| n | Counterparty risk. Counterparty risk is the risk that the other party to the contract will not fulfill its contractual obligations, which may cause losses or additional costs to the Fund. |
| n | Credit risk. The issuers of instruments in which an underlying fund invests may be unable to meet interest and/or principal payments. An issuer’s securities may decrease in value if its financial strength weakens, which may reduce its credit rating and possibly its ability to meet its contractual obligations. |
| n | Currency/exchange rate risk. The dollar value of an underlying fund’s foreign investments will be affected by changes in the exchange rates between the dollar and the currencies in which those investments are traded. An underlying fund may buy or sell currencies other than the US dollar in order to capitalize on anticipated changes in exchange rates. There is no guarantee that these investments will be successful. |
| n | Derivatives risk. A derivative is an instrument whose value depends largely on (and is derived from) the value of an underlying security, currency, commodity, interest rate, index or other asset (each referred to as an underlying asset). In addition to risks relating to the underlying assets, the use of derivatives may include other, possibly greater, risks, which are described below. These risks are greater for an underlying fund than most other mutual funds because an underlying fund will implement its investment strategy primarily through derivative instruments rather than direct investments in stocks and bonds. |
| - | Counterparty Risk. Certain derivatives do not trade on an established exchange (referred to as over-the-counter (OTC) derivatives) and are simply financial contracts between an underlying fund and a counter-party. When an underlying fund is owed money on an OTC derivative, an underlying fund is dependent on the counterparty to pay or, in some cases, deliver the underlying asset, unless an underlying fund can otherwise sell its derivative contract to a |
| third party prior to its expiration. Many counterparties are financial institutions such as banks and broker-dealers and their creditworthiness (and ability to pay or perform) may be negatively impacted by factors affecting financial institutions generally. In addition, in the event that a counterparty becomes bankrupt or insolvent, an underlying fund’s ability to recover the collateral that an underlying fund has on deposit with the counterparty could be delayed or impaired. For derivatives traded on a centralized exchange, an underlying fund generally is dependent upon the solvency of the exchange for payment on derivative instruments for which an underlying fund is owed money. |
| - | Leverage Risk. Many derivatives do not require a payment up front equal to the economic exposure created by owning the derivative, which creates a form of leverage. As a result, an adverse change in the value of the underlying asset could result in an underlying fund sustaining a loss that is substantially greater than the amount invested in the derivative. Leverage may therefore make an underlying fund’s returns more volatile and increase the risk of loss. An underlying fund segregates or earmarks liquid assets with a value at least equal to the amount that an underlying fund owes the derivative counter-party each day, if any, or otherwise holds instruments that offset an underlying fund’s daily obligation under the derivatives instrument. This process is sometimes referred to as “cover.” The amount of liquid assets needed as cover will fluctuate over time as the value of the derivative instrument rises and falls. If the value of an underlying fund’s derivative positions or the value of the assets used as cover unexpectedly decreases, an underlying fund may be forced to segregate additional liquid assets as cover or sell assets at a disadvantageous time or price to meet its derivative obligations or to meet redemption requests, which could affect management of an underlying fund and an underlying fund’s returns. In certain market conditions, losses on derivative instruments can grow larger while the value of an underlying fund’s other assets fall, resulting in an underlying fund’s derivative positions becoming a larger percentage of an underlying fund’s investments. |
| - | Liquidity Risk. There is a smaller pool of buyers and sellers for certain derivatives, particularly OTC derivatives, than more traditional investments such as stocks. These buyers and sellers are often financial institutions that may be unable or unwilling to buy or sell derivatives during times of financial or market stress. Derivative instruments may therefore be less liquid than more traditional investments and an underlying fund may be unable to sell or exit its derivative positions at a desirable time or price. This risk may be more acute under adverse market conditions, during which an underlying fund may be most in need of liquidating its derivative positions. To the extent that an underlying fund is unable to exit a derivative position because of market illiquidity, an underlying fund may not be able to prevent further losses of value in its derivatives holdings and the liquidity of an underlying fund and its ability to meet redemption requests may be impaired to the extent that a substantial portion of an underlying fund’s otherwise liquid assets must be used as margin or cover. Another consequence of illiquidity is that an underlying fund may be required to hold a derivative instrument to maturity and take or make delivery of the underlying asset that the adviser would otherwise have attempted to avoid. |
| - | Other Risks. Compared to other types of investments, derivatives may be harder to value and may also be less tax efficient, as described under the “Taxes” section of the prospectus. In addition, changes in government regulation of derivative instruments could affect the character, timing and amount of an underlying fund’s taxable income or gains, and may limit or prevent an underlying fund from using certain types of derivative instruments as a part of its investment strategy, which could make the investment strategy more costly to implement or require an underlying fund to change its investment strategy. To the extent that an underlying fund uses derivatives for hedging or to gain or limit exposure to a particular market or market segment, there may be imperfect correlation between the value of the derivative instrument and the value of the instrument being hedged or the relevant market or market segment, in which case an underlying fund may |
continued on page 26
25 Invesco Balanced-Risk Retirement Funds
continued from page 25
| not realize the intended benefits. There is also the risk that during adverse market conditions, an instrument which would usually operate as a hedge provides no hedging benefits at all. An underlying fund’s use of derivatives may be limited by the requirements for taxation of an underlying fund as a regulated investment company. |
| n | Developing/emerging markets securities risk. The prices of securities issued by foreign companies and governments located in developing/emerging markets countries may be impacted by certain factors more than those in countries with mature economies. For example, developing/emerging markets countries may experience higher rates of inflation or sharply devalue their currencies against the US dollar, thereby causing the value of investments issued by the government or companies located in those countries to decline. Governments in developing/emerging markets may be relatively less stable. The introduction of capital controls, withholding taxes, nationalization of private assets, expropriation, social unrest, or war may result in adverse volatility in the prices of securities or currencies. Other factors may include additional transaction costs, delays in settlement procedures, and lack of timely information. |
| n | Exchange-traded funds risk. An investment by an underlying fund in exchange-traded funds generally presents the same primary risks as an investment in a mutual fund. In addition, an exchange-traded fund may be subject to the following risks that do not apply to mutual funds: (1) the market price of an exchange-traded fund’s shares may trade above or below their net asset value; (2) an active trading market for the exchange-traded fund’s shares may not develop or be maintained; (3) trading an exchange-traded fund’s shares may be halted if the listing exchange’s officials deem such action appropriate; (4) an exchange-traded fund may not be actively managed and may not accurately track the performance of the reference asset; (5) an exchange-traded fund would not necessarily sell a security because the issuer of the security was in financial trouble unless the security is removed from the index that the exchange-traded fund seeks to track; and (6) the value of an investment in an exchange-traded fund |
will decline more or less in correlation with any decline in the value of the index the exchange-traded fund seeks to track. Exchange-traded funds may involve duplication of management fees and certain other expenses, as the underlying fund indirectly bears its proportionate share of any expenses paid by the exchange-traded funds in which it invests. Further, certain of the exchange-traded funds in which the underlying fund may invest are leveraged. The more the underlying fund invests in such leveraged exchange-traded funds, the more this leverage will magnify any losses on those investments. |
| n | Exchange-traded notes risk. Exchange-traded notes are subject to credit risk, including the credit risk of the issuer, and the value of the exchange-traded note may drop due to a downgrade in the issuer’s credit rating, despite the underlying market benchmark or strategy remaining unchanged. The value of an exchange-traded note may also be influenced by time to maturity, level of supply and demand for the exchange-traded note, volatility and lack of liquidity in the underlying market, changes in the applicable interest rates, changes in the issuer’s credit rating, and economic, legal, political, or geographic events that affect the referenced underlying market or strategy. Exchange-traded notes are also subject to the risk that the other party to the contract will not fulfill its contractual obligations, which may cause losses or additional costs to the Fund. |
| n | Foreign securities risk. The Fund’s foreign investments may be affected by changes in a foreign country’s exchange rates, political and social instability, changes in economic or taxation policies, difficulties when enforcing obligations, decreased liquidity, and increased volatility. Foreign companies may be subject to less regulation resulting in less publicly available information about the companies. |
| n | Fund of funds risk. The Fund’s performance depends on that of the underlying funds in which it invests. Accordingly, the risks associated with an investment in the Fund are also the risks associated with investments in the underlying funds. There is a risk that the adviser’s evaluations and assumptions regarding the Fund’s broad asset classes or the underlying funds in which the Fund invests may be incorrect based on actual market conditions. |
There is a risk that the Fund will vary from the target weightings in the underlying funds due to factors such as market fluctuations. There can be no assurance that the underlying funds will achieve their investment objectives, and their performance may be lower than their represented asset classes. The underlying funds may change their investment objectives, policies or practices without the approval of the Fund, which may cause the Fund to withdraw its investments therein at a disadvantageous time. |
| n | Interest rate risk. Interest rate risk refers to the risk that bond prices generally fall as interest rates rise; conversely, bond prices generally rise as interest rates fall. Specific bonds differ in their sensitivity to changes in interest rates depending on their individual characteristics. One measure of this sensitivity is called duration. The longer the duration of a particular bond, the greater is its price sensitivity is to interest rates. Similarly, a longer duration portfolio of securities has greater price sensitivity. Falling interest rates may also prompt some issuers to refinance existing debt, which could affect an underlying fund’s performance. |
| n | Leverage risk. Leverage exists when an underlying fund purchases or sells an instrument or enters into a transaction without investing cash in an amount equal to the full economic exposure of the asset or transaction and the underlying fund could lose more than it invested. Economic leveraging tends to magnify, sometimes significantly depending on the amount of leverage used, the effect of any increase or decrease in the Fund’s exposure to an asset class and may cause the Fund’s net asset value to be more volatile than a fund that does not use leverage. For example, if the adviser gains exposure to a specific asset class through an instrument that provides leveraged exposure to the class, and that leveraged instrument increases in value, the gain to the Fund will be magnified; however, if the leveraged instrument decreases in value, the loss to the Fund will be magnified. Such instruments may include, among others, written options and derivatives, and transactions may include the use of when-issued, delayed delivery or forward commitment transactions. An underlying fund mitigates leverage risk by segregating or earmarking liquid assets or otherwise |
26 Invesco Balanced-Risk Retirement Funds
| covers transactions that may give rise to such risk. To the extent that an underlying fund is not able to close out a leveraged position because of market illiquidity, an underlying fund’s liquidity may be impaired to the extent that it has a substantial portion of liquid assets segregated or earmarked to cover obligations and may liquidate portfolio positions when it may not be advantageous to do so. Leveraging may cause an underlying fund to be more volatile because it may exaggerate the effect of any increase or decrease in the value of an underlying fund’s portfolio securities. There can be no assurance that an underlying fund’s leverage strategy will be successful. An underlying fund’s significant use of derivatives and leverage could, under certain market conditions, cause the underlying fund’s losses to be more significant than other mutual funds and, in extreme market conditions, could cause a complete loss of your investment. |
| n | Liquidity risk. A security is considered to be illiquid if an underlying fund is unable to sell such security at a fair price within a reasonable amount of time. A security may be deemed illiquid due to a lack of trading volume in the security or if the security is privately placed and not traded in any public market or is otherwise restricted from trading. An underlying fund may be unable to sell illiquid securities at the time or price it desires and could lose its entire investment in such securities. Further, certain restricted securities require special registration, liabilities and costs, and could pose valuation difficulties. An underlying fund’s significant use of derivative instruments may cause liquidity risk to be greater than other mutual funds that invest in more traditional assets such as stocks and bonds, which trade on markets with more market participants. |
| n | Management risk. The investment techniques and risk analysis used by the Fund’s portfolio managers may not produce the desired results. Because the Fund’s investment process relies heavily on its asset allocation process, market movements that are counter to the portfolio managers’ expectations may have a significant adverse effect on the Fund’s net asset value. Further, the portfolio managers’ use of instruments that provide economic leverage increases the volatility of the Fund’s net asset value, which increases the potential |
of greater losses that may cause the Fund to liquidate positions when it may not be advantageous to do so. |
| n | Market risk. The prices of and the income generated by the Fund’s securities may decline in response to, among other things, investor sentiment, general economic and market conditions, regional or global instability, and currency and interest rate fluctuations. |
| n | Non-diversification risk. Certain of the underlying funds in which the Fund invests are non-diversified, meaning they can invest a greater portion of their assets in the obligations or securities of a small number of issuers or any single issuer than a diversified fund can. To the extent that a large percentage of an underlying fund’s assets may be invested in a limited number of issuers, a change in the value of the issuers’ securities could affect the value of an underlying fund more than would occur in a diversified fund. |
| n | Subsidiary risk. By investing in the Subsidiary, an underlying fund is indirectly exposed to risks associated with the Subsidiary’s investments. The derivatives and other investments held by the Subsidiary are generally similar to those that are permitted to be held by the underlying fund and are subject to the same risks that apply to similar investments if held directly by the underlying fund. There can be no assurance that the investment objective of the Subsidiary will be achieved. The Subsidiary is not registered under the 1940 Act and, except as otherwise noted in the prospectus, is not subject to the investor protections of the 1940 Act. In addition, changes in the laws of the United States and/or the Cayman Islands could result in the inability of the underlying fund and/or the Subsidiary to operate as described in the underlying fund prospectus and SAI and could adversely affect the Fund. For example, the government of the Cayman Islands does not currently impose any income, corporate or capital gains tax, estate duty, inheritance tax, gift tax or withholding tax on the Subsidiary. If Cayman Islands law changes such that the Subsidiary must pay Cayman Islands taxes, an underlying fund’s shareholders would likely suffer decreased investment returns. |
| n | Tax risk. The tax treatment of commodity-linked derivative instruments may be adversely affected by changes in legislation, regulations or other legally |
binding authority. If, as a result of any such adverse action, the income of Invesco Balanced-Risk Allocation Fund or Invesco Balanced-Risk Aggressive Allocation Fund, each an underlying fund, from certain commodity-linked derivatives was treated as non-qualifying income, Invesco Balanced-Risk Allocation Fund or Invesco Balanced-Risk Aggressive Allocation Fund might fail to qualify as a regulated investment company and be subject to federal income tax at the fund level. As a regulated investment company, each of Invesco Balanced-Risk Allocation Fund and Invesco Balanced-Risk Aggressive Allocation Fund must derive at least 90% of its gross income for each taxable year from sources treated as qualifying income under the Internal Revenue Code of 1986, as amended. Invesco Balanced-Risk Allocation Fund has received private letter rulings from the Internal Revenue Service confirming that income derived from its investments in the Subsidiary and a form of commodity-linked note constitutes qualifying income to Invesco Balanced-Risk Allocation Fund. The IRS has also issued a number of similar letter rulings to other funds (upon which only the fund that received the private letter ruling can rely), which indicate that income from a fund’s investment in certain commodity-linked notes and a wholly owned foreign subsidiary that invests in commodity-linked derivatives, such as the Subsidiary, constitutes qualifying income. However, the Internal Revenue Service has suspended issuance of any further private letter rulings pending a review of its position. Should the Internal Revenue Service issue guidance, or Congress enact legislation, that adversely affects the tax treatment of Invesco Balanced-Risk Allocation Fund’s or Invesco Balanced-Risk Aggressive Allocation Fund’s use of commodity-linked notes or the Subsidiary (which guidance might be applied retroactively to Invesco Balanced-Risk Aggressive Allocation Fund) it could limit such underlying fund’s ability to pursue its investment strategy and such underlying fund might not qualify as a regulated investment company for one or more years. In this event, such underlying fund’s Board of Trustees may authorize a significant change in investment strategy or fund liquidation. In lieu of potential disqualification, such underlying fund is permitted to pay a |
continued on page 28
27 Invesco Balanced-Risk Retirement Funds
continued from page 27
| tax for certain failures to satisfy the income requirement, which, in general, are limited to those due to reasonable cause and not willful neglect. Invesco Balanced-Risk Allocation Fund and Invesco Balanced-Risk Aggressive Allocation Fund also may incur transaction and other costs to comply with any new or additional guidance from the Internal Revenue Service. For more information, please see the “Dividends, Distributions and Tax Matters” section in the SAIs for Invesco Balanced-Risk Allocation Fund and Invesco Balanced-Risk Aggressive Allocation Fund. |
| n | US government obligations risk. The Fund may invest in obligations issued by US government agencies and instrumentalities that may receive varying levels of support from the government, which could affect the Fund’s ability to recover should they default. |
| n | Volatility risk. The Fund may have investments that appreciate or decrease significantly in value over short periods of time. This may cause the Fund’s net asset value per share to experience significant increases or declines in value over short periods of time. |
Additional risks of investing in Invesco Balanced-Risk Retirement Now Fund and Invesco Balanced-Risk Retirement 2020 Fund
| n | Foreign credit exposure risk. US dollar-denominated securities carrying foreign credit exposure may be affected by unfavorable political, economic or governmental developments that could affect payments of principal and interest. |
| n | Industry focus risk. To the extent an underlying fund invests in securities issued or guaranteed by companies in the banking and financial services industries, the underlying fund’s performance will depend on the overall condition of those industries. Financial services companies are highly dependent on the supply of short-term financing. The value of securities of issuers in the banking and financial services industry can be sensitive to changes in government regulation and interest rates and to economic downturns in the United States and abroad. |
| n | Money market fund risk. Although the underlying fund seeks to preserve the value of your investment at $1.00 per share, you may lose money by investing in the underlying fund. The share price of money market funds can fall below the $1.00 share price. You should not |
rely on or expect the underlying fund’s adviser or its affiliates to enter into support agreements or take other actions to maintain the Fund’s $1.00 share price. The credit quality of the underlying fund’s holdings can change rapidly in certain markets, and the default of a single holding could have an adverse impact on the underlying fund’s share price. An underlying fund’s share price can also be negatively affected during periods of high redemption pressures and/or illiquid markets. Furthermore, additional government regulation, including by the SEC, could impact the way the underlying fund is managed and possibly negatively impacting its return. |
| n | Municipal securities risk. Certain of the underlying funds may invest in municipal securities. Constitutional amendments, legislative enactments, executive orders, administrative regulations, voter initiatives, and the issuer’s regional economic conditions may affect the municipal security’s value, interest payments, repayment of principal and an underlying fund’s ability to sell it. Revenue bonds are generally not backed by the taxing power of the issuing municipality. To the extent that a municipal security is not heavily followed by the investment community or such security issue is relatively small, the security may be difficult to value or sell at a desirable price. If the Internal Revenue Service determines that an issuer of a municipal security has not complied with applicable tax requirements, interest from the security could be treated as taxable, which could result in a decline in the security’s value. In addition, there could be changes in applicable tax laws or tax treatments that reduce or eliminate the current federal income tax exemption on municipal securities or otherwise adversely affect the current federal or state tax status of municipal securities. |
| n | Repurchase agreement risk. If the seller of a repurchase agreement in which an underlying fund invests defaults on its obligation or declares bankruptcy, the underlying fund may experience delays in selling the securities underlying the repurchase agreement. As a result, an underlying fund may incur losses arising from decline in the value of those securities, reduced levels of income and expenses of enforcing its rights. |
| n | Variable-rate demand notes risk. The absence of an active secondary market for certain variable and floating rate |
notes could make it difficult to dispose of the instruments, and a portfolio could suffer a loss if the issuer defaults during periods in which a portfolio is not entitled to exercise its demand rights. |
About indexes used in this report
| n | The Barclays U.S. Aggregate Index is an unmanaged index considered representative of the US investment-grade, fixed-rate bond market. |
| n | The Barclays U.S. Universal Index represents the union of the U.S. Aggregate Index, the U.S. High-Yield Corporate Index, the 144A Index, the Euro dollar Index, the Emerging Markets Index and the non-ERISA portion of the CMBS Index. |
| n | The Custom Balanced-Risk Allocation Broad Index consists of 60% S&P 500 Index and 40% Barclays U.S. Aggregate Index. |
| n | The Custom Balanced-Risk Retirement Now Index was created by Invesco to serve as a style-specific benchmark for Invesco Balanced-Risk Retirement Now Fund. From the inception of the Fund to November 4, 2009, the index comprised the Custom Independence Now Index, which included the following indexes: the Russell 3000 Index, the MSCI EAFE Index, the FTSE NAREIT All Equity REITs Index, the Barclays U.S. Universal Index and the three-month US Treasury bill. From November 4, 2009 through November 30, 2009, the index comprised the MSCI World Index, the JPMorgan Global Government Bond Index and the three-month US Treasury bill. Since December 1, 2009, the index has comprised the MSCI World Index, the Barclays U.S. Aggregate Index and the three-month US Treasury bill. |
| n | The Custom Balanced-Risk Retirement 2020 Index was created by Invesco to serve as a style-specific benchmark for Invesco Balanced-Risk Retirement 2020 Fund. From the inception of the Fund to November 4, 2009, the index comprised the Custom Independence 2020 Index, which included the following indexes: the Russell 3000 Index, the MSCI EAFE Index, the FTSE NAREIT All Equity REITs Index and the Barclays U.S. Universal Index. From November 4, 2009, through November 30, 2009, the index comprised the MSCI World Index and the JP Morgan Global Government Bond Index. Since December 1, 2009, the index has comprised the MSCI World Index and |
28 Invesco Balanced-Risk Retirement Funds
the Barclays U.S. Aggregate Index.
| n | The Custom Balanced-Risk Retirement 2030 Index was created by Invesco to serve as a style-specific benchmark for Invesco Balanced-Risk Retirement 2030 Fund. From the inception of the Fund to November 4, 2009, the index comprised the Custom Independence 2030 Index, which included the following indexes: the Russell 3000 Index, the MSCI EAFE Index, the FTSE NAREIT All Equity REITs index and the Barclays U.S. Universal Index. From November 4, 2009, through November 30, 2009, the index comprised the MSCI World Index and the JP Morgan Global Government Bond Index. Since December 1, 2009, the index has comprised the MSCI World Index and the Barclays U.S. Aggregate Index. |
| n | The Custom Balanced-Risk Retirement 2040 Index was created by Invesco to serve as a style-specific benchmark for Invesco Balanced-Risk Retirement 2040 Fund. From the inception of the Fund to November 4, 2009, the index comprised the Custom Independence 2040 Index, which included the following indexes: the Russell 3000 Index, the MSCI EAFE Index, the FTSE NAREIT All Equity REITs Index and the Barclays U.S. Universal Index. From November 4, 2009, through November 30, 2009, the index comprised the MSCI World Index and the JP Morgan Global Government Bond Index. Since December 1, 2009, the index has comprised the MSCI World Index and the Barclays U.S. Aggregate Index. |
| n | The Custom Balanced-Risk Retirement 2050 Index was created by Invesco to serve as a style-specific benchmark for Invesco Balanced-Risk Retirement 2050 Fund. From the inception of the Fund to November 4, 2009, the index comprised the Custom Independence 2050 Index, which included the following indexes: the Rus-sell 3000 Index, the MSCI EAFE Index, the FTSE NAREIT All Equity REITs Index and the Barclays U.S. Universal Index. From November 4, 2009, through November 30, 2009, the index comprised the MSCI World Index and the JP Morgan Global Government Bond Index. Since December 1, 2009, the index has comprised the MSCI World Index and the Barclays U.S. Aggregate Index. |
| n | The FTSE NAREIT All Equity REITs Index is an unmanaged index considered representative of US REITs. |
| n | The JP Morgan Global Government Bond Index is a total return, market |
capitalization weighted index that is rebalanced monthly and includes the following countries: Australia, Belgium, Canada, Denmark, Germany, Italy, Japan, the Netherlands, Spain, Sweden, the United Kingdom and the United States. |
| n | The Lipper Mixed-Asset Target Today Index is an unmanaged index considered representative of mixed-asset target today funds tracked by Lipper. |
| n | The Lipper Mixed-Asset Target Allocation Conservative Funds Index is an unmanaged index considered representative of mixed-asset target allocation conservative funds tracked by Lipper. |
| n | The Lipper Mixed-Asset Target 2020 Funds Index is an unmanaged index considered representative of mixed-asset target 2020 funds tracked by Lipper. |
| n | The Lipper Mixed-Asset Target 2030 Funds Index is an unmanaged index considered representative of mixed-asset target 2030 funds tracked by Lipper. |
| n | The Lipper Mixed-Asset Target 2040 Funds Index is an unmanaged index considered representative of mixed-asset target 2040 funds tracked by Lipper. |
| n | The Lipper Mixed-Asset Target 2050 Funds Classification Average represents an average of all funds in the Lipper Mixed-Asset Target 2050+ Funds classification. |
| n | The MSCI EAFE® Index is an unmanaged index considered representative of stocks of Europe, Australasia and the Far East. The index is computed using the net return, which withholds applicable taxes for non-resident investors. |
| n | The MSCI World IndexSM is an unmanaged index considered representative of stocks of developed countries. The index is computed using the net return, which withholds applicable taxes for non-resident investors. |
| n | The Russell 3000® Index is an unmanaged index considered representative of the US stock market. The Russell 3000 Index is a trademark/service mark of the Frank Russell Co. Russell® is a trademark of the Frank Russell Co. |
| n | The S&P 500® Index is an unmanaged index considered representative of the US stock market. |
| n | The composition of a custom index may change from time to time based on the target asset allocation of a fund. Therefore, the current composition of a custom index does not reflect its historical composition and will likely be altered in the future to better reflect the objective of a fund. |
| n | The funds are not managed to track the performance of any particular index, including the index(es) described here, and consequently, the performance of a fund may deviate significantly from the performance of the index(es). |
| n | A direct investment cannot be made in an index. Unless otherwise indicated, index results include reinvested dividends, and they do not reflect sales charges. Performance of the peer group, if applicable, reflects fund expenses; performance of a market index does not. |
Other information
| n | The returns shown in management’s discussion of Fund performance are based on net asset values calculated for shareholder transactions. Generally accepted accounting principles require adjustments to be made to the net assets of a fund at period end for financial reporting purposes, and as such, the net asset values for shareholder transactions and the returns based on those net asset values may differ from the net asset values and returns reported in the Financial Highlights. |
29 Invesco Balanced-Risk Retirement Funds
Schedule of Investments
December 31, 2013
Invesco Balanced-Risk Retirement Now Fund
Schedule of Investments in Affiliated Issuers–100.16%(a)
| % of Net Assets 12/31/13 | Value 12/31/12 | Purchases at Cost | Proceeds from Sales | Change in Unrealized Appreciation (Depreciation) | Realized Gain | Dividend Income | Shares 12/31/13 | Value 12/31/13 | ||||||||||||||||||||||||||||
Asset Allocation Funds–60.16% |
| |||||||||||||||||||||||||||||||||||
Invesco Balanced-Risk Allocation Fund–Class R6(b) | 60.16 | % | $ | 29,072,193 | $ | 8,936,032 | $ | (4,930,362 | ) | $ | (1,651,018 | ) | $ | 2,438,723 | $ | — | 2,656,590 | $ | 31,613,424 | |||||||||||||||||
Money Market Funds–40.00% |
| |||||||||||||||||||||||||||||||||||
Liquid Assets Portfolio-Institutional Class | 20.00 | % | 9,751,659 | 9,216,252 | (8,455,780 | ) | — | — | 9,864 | 10,512,131 | 10,512,131 | |||||||||||||||||||||||||
Premier Portfolio-Institutional Class | 20.00 | % | 9,751,659 | 9,216,253 | (8,455,780 | ) | — | — | 5,005 | 10,512,132 | 10,512,132 | |||||||||||||||||||||||||
Total Money Market Funds | 19,503,318 | 18,432,505 | (16,911,560 | ) | — | — | 14,869 | 21,024,263 | 21,024,263 | |||||||||||||||||||||||||||
TOTAL INVESTMENTS IN AFFILIATED ISSUERS | 100.16 | % | $ | 48,575,511 | $ | 27,368,537 | $ | (21,841,922 | ) | $ | (1,651,018 | ) | $ | 2,438,723 | (c) | $ | 14,869 | $ | 52,637,687 | |||||||||||||||||
OTHER ASSETS LESS LIABILITIES | (0.16 | )% | (82,796 | ) | ||||||||||||||||||||||||||||||||
NET ASSETS | 100.00 | % | $ | 52,554,891 | ||||||||||||||||||||||||||||||||
Invesco Balanced-Risk Retirement 2020 Fund
Schedule of Investments in Affiliated Issuers–101.18%(a)
| % of Net Assets 12/31/13 | Value 12/31/12 | Purchases at Cost | Proceeds from Sales | Change in Unrealized Appreciation (Depreciation) | Realized Gain | Dividend Income | Shares 12/31/13 | Value 12/31/13 | ||||||||||||||||||||||||||||
Asset Allocation Funds–87.70% |
| |||||||||||||||||||||||||||||||||||
Invesco Balanced-Risk Allocation Fund–Class R6(b) | 87.70 | % | $88,253,017 | $ | 52,056,145 | $(18,965,028) | $(5,353,570) | $7,992,484 | $ | — | 9,725,872 | $115,737,869 | ||||||||||||||||||||||||
Money Market Funds–13.48% |
| |||||||||||||||||||||||||||||||||||
Liquid Assets Portfolio-Institutional Class | 6.74 | % | 4,981,916 | 33,829,195 | (29,916,732 | ) | — | — | 7,304 | 8,894,379 | 8,894,379 | |||||||||||||||||||||||||
Premier Portfolio-Institutional Class | 6.74 | % | 4,981,916 | 33,829,195 | (29,916,732 | ) | — | — | 3,650 | 8,894,379 | 8,894,379 | |||||||||||||||||||||||||
Total Money Market Funds | 9,963,832 | 67,658,390 | (59,833,464 | ) | — | — | 10,954 | 17,788,758 | 17,788,758 | |||||||||||||||||||||||||||
TOTAL INVESTMENTS IN AFFILIATED ISSUERS | 101.18 | % | $ | 98,216,849 | $ | 119,714,535 | $ | (78,798,492 | ) | $ | (5,353,570 | ) | $ | 7,992,484 | (c) | $ | 10,954 | $ | 133,526,627 | |||||||||||||||||
OTHER ASSETS LESS LIABILITIES | (1.18 | )% | (1,559,669 | ) | ||||||||||||||||||||||||||||||||
NET ASSETS | 100.00 | % | $ | 131,966,958 | ||||||||||||||||||||||||||||||||
Invesco Balanced-Risk Retirement 2030 Fund
Schedule of Investments in Affiliated Issuers–100.32%(a)
| % of Net Assets 12/31/13 | Value 12/31/12 | Purchases at Cost | Proceeds from Sales | Change in Unrealized Appreciation (Depreciation) | Realized Gain | Dividend Income | Shares 12/31/13 | Value 12/31/13 | ||||||||||||||||||||||||||||
Asset Allocation Funds–99.56% |
| |||||||||||||||||||||||||||||||||||
Invesco Balanced-Risk Allocation Fund–Class R6(b) | 78.90 | % | $ | 100,513,852 | $ | 46,506,697 | $ | (37,636,306 | ) | $ | (5,075,448 | ) | $ | 7,496,485 | $ | — | 8,770,584 | $ | 104,369,953 | |||||||||||||||||
Invesco Balanced-Risk Aggressive Allocation Fund(b) | 20.66 | % | — | 34,055,318 | (5,618,596 | ) | (1,060,516 | ) | 1,514,821 | — | 2,855,419 | 27,326,360 | ||||||||||||||||||||||||
Total Asset Allocation Funds | 100,513,852 | 80,562,015 | (43,254,902 | ) | (6,135,964 | ) | 9,011,306 | — | 11,626,003 | 131,696,313 | ||||||||||||||||||||||||||
Money Market Funds–0.76% |
| |||||||||||||||||||||||||||||||||||
Liquid Assets Portfolio-Institutional Class | 0.38 | % | 588,190 | 39,592,270 | (39,679,907 | ) | — | — | 420 | 500,553 | 500,553 | |||||||||||||||||||||||||
Premier Portfolio-Institutional Class | 0.38 | % | 588,190 | 39,592,270 | (39,679,907 | ) | — | — | 232 | 500,553 | 500,553 | |||||||||||||||||||||||||
Total Money Market Funds | 1,176,380 | 79,184,540 | (79,359,814 | ) | — | — | 652 | 1,001,106 | 1,001,106 | |||||||||||||||||||||||||||
TOTAL INVESTMENTS IN AFFILIATED ISSUERS | 100.32 | % | $ | 101,690,232 | $ | 159,746,555 | $ | (122,614,716 | ) | $ | (6,135,964 | ) | $ | 9,011,306 | (c) | $ | 652 | $ | 132,697,419 | |||||||||||||||||
OTHER ASSETS LESS LIABILITIES | (0.32 | )% | (423,705 | ) | ||||||||||||||||||||||||||||||||
NET ASSETS | 100.00 | % | $ | 132,273,714 | ||||||||||||||||||||||||||||||||
Notes to Schedule of Investments:
| (a) | Each underlying fund and the Fund are affiliated by either having the same investment adviser or an investment adviser under common control with the Fund’s investment adviser. |
| (b) | Non-income producing security. A security is determined to be non-income producing if the security has not declared on income distribution in more than one year from the report date. |
| (c) | Includes $2,252,144, $8,245,179 and $8,999,994 of capital gains distributions from affiliated underlying funds for Invesco Balanced-Risk Retirement Now Fund, Invesco Balanced-Risk Retirement 2020 Fund and Invesco Balanced-Risk Retirement 2030 Fund, respectively. |
See accompanying Notes to Financial Statements which are an integral part of the financial statements.
30 Invesco Balanced-Risk Retirement Funds
Schedule of Investments—(continued)
December 31, 2013
Invesco Balanced-Risk Retirement 2040 Fund
Schedule of Investments in Affiliated Issuers–99.26%(a)
| % of Net Assets 12/31/13 | Value 12/31/12 | Purchases at Cost | Proceeds from Sales | Change in Unrealized Appreciation (Depreciation) | Realized Gain | Dividend Income | Shares 12/31/13 | Value 12/31/13 | ||||||||||||||||||||||||||||
Asset Allocation Funds–98.50% |
| |||||||||||||||||||||||||||||||||||
Invesco Balanced-Risk Allocation Fund–Class R6(b) | 44.81 | % | $ | 56,786,150 | $ | 26,998,010 | $ | (46,899,088 | ) | $ | (4,439,330 | ) | $ | 5,543,582 | $ | — | 2,977,486 | $ | 35,432,090 | |||||||||||||||||
Invesco Balanced-Risk Aggressive Allocation Fund(b) | 53.69 | % | — | 49,931,787 | (5,765,998 | ) | (1,689,419 | ) | 2,403,029 | — | 4,435,615 | 42,448,840 | ||||||||||||||||||||||||
Total Asset Allocation Funds | 56,786,150 | 76,929,797 | (52,665,086 | ) | (6,128,749 | ) | 7,946,611 | — | 7,413,101 | 77,880,930 | ||||||||||||||||||||||||||
Money Market Funds–0.76% |
| |||||||||||||||||||||||||||||||||||
Liquid Assets Portfolio-Institutional Class | 0.38 | % | 186,783 | 37,573,794 | (37,457,470 | ) | — | — | 310 | 303,107 | 303,107 | |||||||||||||||||||||||||
Premier Portfolio-Institutional Class | 0.38 | % | 186,783 | 37,573,795 | (37,457,471 | ) | — | — | 174 | 303,107 | 303,107 | |||||||||||||||||||||||||
Total Money Market Funds | 373,566 | 75,147,589 | (74,914,941 | ) | — | — | 484 | 606,214 | 606,214 | |||||||||||||||||||||||||||
TOTAL INVESTMENTS IN AFFILIATED ISSUERS (Cost $80,830,168) | 99.26 | % | $ | 57,159,716 | $ | 152,077,386 | $ | (127,580,027 | ) | $ | (6,128,749 | ) | $ | 7,946,611 | (c) | $ | 484 | $ | 78,487,144 | |||||||||||||||||
OTHER ASSETS LESS LIABILITIES | 0.74 | % | 587,343 | |||||||||||||||||||||||||||||||||
NET ASSETS | 100.00 | % | $ | 79,074,487 | ||||||||||||||||||||||||||||||||
Invesco Balanced-Risk Retirement 2050 Fund
Schedule of Investments in Affiliated Issuers–100.10%(a)
| % of Net Assets 12/31/13 | Value 12/31/12 | Purchases at Cost | Proceeds from Sales | Change in Unrealized Appreciation (Depreciation) | Realized Gain | Dividend Income | Shares 12/31/13 | Value 12/31/13 | ||||||||||||||||||||||||||||
Asset Allocation Funds–99.34% |
| |||||||||||||||||||||||||||||||||||
Invesco Balanced-Risk Allocation Fund–Class R6(b) | 12.14 | % | $ | 29,816,869 | $ | 8,850,229 | $ | (33,752,188 | ) | $ | (1,916,510 | ) | $ | 2,298,874 | $ | — | 415,004 | $ | 4,938,551 | |||||||||||||||||
Invesco Balanced-Risk Aggressive Allocation Fund(b) | 87.20 | % | — | 39,264,918 | (2,302,168 | ) | (1,405,219 | ) | 1,979,737 | — | 3,707,480 | 35,480,587 | ||||||||||||||||||||||||
Total Asset Allocation Funds | 29,816,869 | 48,115,147 | (36,054,356 | ) | (3,321,729 | ) | 4,278,611 | — | 4,122,484 | 40,419,138 | ||||||||||||||||||||||||||
Money Market Funds–0.76% |
| |||||||||||||||||||||||||||||||||||
Liquid Assets Portfolio-Institutional Class | 0.38 | % | 162,578 | 24,319,327 | (24,326,550 | ) | — | — | 185 | 155,355 | 155,355 | |||||||||||||||||||||||||
Premier Portfolio-Institutional Class | 0.38 | % | 162,578 | 24,319,327 | (24,326,550 | ) | — | — | 100 | 155,355 | 155,355 | |||||||||||||||||||||||||
Total Money Market Funds | 325,156 | 48,638,654 | (48,653,100 | ) | — | — | 285 | 310,710 | 310,710 | |||||||||||||||||||||||||||
TOTAL INVESTMENTS IN AFFILIATED ISSUERS (Cost $42,359,229) | 100.10 | % | $ | 30,142,025 | $ | 96,753,801 | $ | (84,707,456 | ) | $ | (3,321,729 | ) | $ | 4,278,611 | (c) | $ | 285 | $ | 40,729,848 | |||||||||||||||||
OTHER ASSETS LESS LIABILITIES | (0.10 | )% | (41,289 | ) | ||||||||||||||||||||||||||||||||
NET ASSETS | 100.00 | % | $ | 40,688,559 | ||||||||||||||||||||||||||||||||
Notes to Schedule of Investments:
| (a) | Each underlying fund and the Fund are affiliated by either having the same investment adviser or an investment adviser under common control with the Fund’s investment adviser. |
| (b) | Non-income producing security. A security is determined to be non-income producing if the security has not declared on income distribution in more than one year from the report date. |
| (c) | Includes $4,987,793 and $2,415,404 of capital gains distributions from affiliated underlying funds for Invesco Balanced-Risk Retirement 2040 Fund and Invesco Balanced-Risk Retirement 2050 Fund, respectively. |
See accompanying Notes to Financial Statements which are an integral part of the financial statements.
31 Invesco Balanced-Risk Retirement Funds
Statement of Assets and Liabilities
December 31, 2013
| Invesco Balanced-Risk Retirement Now Fund | Invesco Balanced-Risk Retirement 2020 Fund | Invesco Balanced-Risk Retirement 2030 Fund | Invesco Balanced-Risk Retirement 2040 Fund | Invesco Balanced-Risk Retirement 2050 Fund | ||||||||||||||||||||||||||
Assets: | ||||||||||||||||||||||||||||||
Investments in affiliated underlying funds, at value | $ | 52,637,687 | $ | 133,526,627 | $ | 132,697,419 | $ | 78,487,144 | $ | 40,729,848 | ||||||||||||||||||||
Receivable for: | ||||||||||||||||||||||||||||||
Fund shares sold | 262,717 | 104,063 | 346,691 | 966,535 | 55,607 | |||||||||||||||||||||||||
Dividends from underlying funds | 892 | 769 | 32 | 12 | 8 | |||||||||||||||||||||||||
Fund expenses absorbed | — | 22,985 | 14,924 | 19,014 | 9,577 | |||||||||||||||||||||||||
Investment for trustee deferred compensation and retirement plans | 37,541 | 30,224 | 29,937 | 27,319 | 24,220 | |||||||||||||||||||||||||
Other assets | 39,885 | 42,493 | 42,784 | 41,423 | 40,626 | |||||||||||||||||||||||||
Total assets | 52,978,722 | 133,727,161 | 133,131,787 | 79,541,447 | 40,859,886 | |||||||||||||||||||||||||
Liabilities: | ||||||||||||||||||||||||||||||
Payable for: | ||||||||||||||||||||||||||||||
Fund shares reacquired | 278,785 | 1,607,647 | 702,377 | 353,710 | 88,036 | |||||||||||||||||||||||||
Dividends | 25 | 142 | 191 | 313 | 216 | |||||||||||||||||||||||||
Accrued fees to affiliates | 80,706 | 91,900 | 95,632 | 60,205 | 33,811 | |||||||||||||||||||||||||
Accrued trustees’ and officer’s fees and benefits | 898 | 776 | 800 | 938 | 1,050 | |||||||||||||||||||||||||
Accrued operating expenses | 25,039 | 27,823 | 27,559 | 23,608 | 23,270 | |||||||||||||||||||||||||
Trustee deferred compensation and retirement plans | 38,378 | 31,915 | 31,514 | 28,186 | 24,944 | |||||||||||||||||||||||||
Total liabilities | 423,831 | 1,760,203 | 858,073 | 466,960 | 171,327 | |||||||||||||||||||||||||
Net assets applicable to shares outstanding | $ | 52,554,891 | $ | 131,966,958 | $ | 132,273,714 | $ | 79,074,487 | $ | 40,688,559 | ||||||||||||||||||||
Net assets consist of: | ||||||||||||||||||||||||||||||
Shares of beneficial interest | $ | 49,799,103 | $ | 126,183,941 | $ | 126,896,004 | $ | 78,604,926 | $ | 41,026,482 | ||||||||||||||||||||
Undistributed net investment income (loss) | (32,418 | ) | (13,739 | ) | (12,555 | ) | 334,856 | (20,073 | ) | |||||||||||||||||||||
Undistributed net realized gain | 974,016 | 3,310,846 | 4,038,903 | 2,477,729 | 1,311,530 | |||||||||||||||||||||||||
Net unrealized appreciation (depreciation) | 1,814,190 | 2,485,910 | 1,351,362 | (2,343,024 | ) | (1,629,380 | ) | |||||||||||||||||||||||
| $ | 52,554,891 | $ | 131,966,958 | $ | 132,273,714 | $ | 79,074,487 | $ | 40,688,559 | |||||||||||||||||||||
See accompanying Notes to Financial Statements which are an integral part of the financial statements.
32 Invesco Balanced-Risk Retirement Funds
Statement of Assets and Liabilities—(continued)
December 31, 2013
| Invesco Balanced-Risk Retirement Now Fund | Invesco Balanced-Risk Retirement 2020 Fund | Invesco Balanced-Risk Retirement 2030 Fund | Invesco Balanced-Risk Retirement 2040 Fund | Invesco Balanced-Risk Retirement 2050 Fund | ||||||||||||||||||||||||||
Net Assets: |
| |||||||||||||||||||||||||||||
Class A | $ | 15,858,321 | $ | 51,351,548 | $ | 51,748,695 | $ | 33,815,681 | $ | 13,569,850 | ||||||||||||||||||||
Class AX | $ | 14,816,693 | $ | 11,986,123 | $ | 8,353,389 | $ | 3,493,301 | $ | 1,229,997 | ||||||||||||||||||||
Class B | $ | 480,232 | $ | 2,425,137 | $ | 2,759,404 | $ | 1,109,257 | $ | 392,882 | ||||||||||||||||||||
Class C | $ | 5,083,699 | $ | 10,107,549 | $ | 12,050,218 | $ | 5,999,117 | $ | 3,923,501 | ||||||||||||||||||||
Class CX | $ | 3,861,053 | $ | 2,950,542 | $ | 1,821,424 | $ | 563,477 | $ | 133,981 | ||||||||||||||||||||
Class R | $ | 1,958,657 | $ | 10,374,798 | $ | 13,006,658 | $ | 8,644,265 | $ | 4,886,748 | ||||||||||||||||||||
Class RX | $ | 295,382 | $ | 1,282,412 | $ | 1,118,848 | $ | 614,351 | $ | 255,323 | ||||||||||||||||||||
Class Y | $ | 2,117,921 | $ | 8,496,976 | $ | 5,406,447 | $ | 2,716,344 | $ | 1,941,297 | ||||||||||||||||||||
Class R5 | $ | 7,801,968 | $ | 32,090,647 | $ | 35,103,576 | $ | 21,149,120 | $ | 14,065,040 | ||||||||||||||||||||
Class R6 | $ | 280,965 | $ | 901,226 | $ | 905,055 | $ | 969,574 | $ | 289,940 | ||||||||||||||||||||
Shares outstanding, $0.01 par value per share, |
| |||||||||||||||||||||||||||||
Class A | 1,779,741 | 5,512,386 | 5,724,169 | 4,052,761 | 1,653,354 | |||||||||||||||||||||||||
Class AX | 1,664,791 | 1,286,776 | 923,759 | 418,966 | 149,731 | |||||||||||||||||||||||||
Class B | 54,833 | 263,277 | 308,238 | 134,334 | 48,489 | |||||||||||||||||||||||||
Class C | 580,164 | 1,099,206 | 1,347,130 | 727,488 | 483,378 | |||||||||||||||||||||||||
Class CX | 440,797 | 320,793 | 203,617 | 68,394 | 16,515 | |||||||||||||||||||||||||
Class R | 220,643 | 1,118,207 | 1,446,264 | 1,041,044 | 598,213 | |||||||||||||||||||||||||
Class RX | 33,335 | 138,235 | 124,480 | 73,918 | 31,237 | |||||||||||||||||||||||||
Class Y | 236,443 | 912,271 | 596,617 | 324,843 | 236,066 | |||||||||||||||||||||||||
Class R5 | 871,082 | 3,429,078 | 3,865,084 | 2,525,867 | 1,708,982 | |||||||||||||||||||||||||
Class R6 | 31,373 | 96,179 | 99,651 | 115,818 | 35,185 | |||||||||||||||||||||||||
Class A: | ||||||||||||||||||||||||||||||
Net asset value per share | $ | 8.91 | $ | 9.32 | $ | 9.04 | $ | 8.34 | $ | 8.21 | ||||||||||||||||||||
Maximum offering price per share | ||||||||||||||||||||||||||||||
(Net asset value ¸ 94.50%) | $ | 9.43 | $ | 9.86 | $ | 9.57 | $ | 8.83 | $ | 8.69 | ||||||||||||||||||||
Class AX: | ||||||||||||||||||||||||||||||
Net asset value per share | $ | 8.90 | $ | 9.31 | $ | 9.04 | $ | 8.34 | $ | 8.21 | ||||||||||||||||||||
Maximum offering price per share | ||||||||||||||||||||||||||||||
(Net asset value ¸ 94.50%) | $ | 9.42 | $ | 9.85 | $ | 9.57 | $ | 8.83 | $ | 8.69 | ||||||||||||||||||||
Class B: | $ | 8.76 | $ | 9.21 | $ | 8.95 | $ | 8.26 | $ | 8.10 | ||||||||||||||||||||
Class C: | $ | 8.76 | $ | 9.20 | $ | 8.95 | $ | 8.25 | $ | 8.12 | ||||||||||||||||||||
Class CX: | $ | 8.76 | $ | 9.20 | $ | 8.95 | $ | 8.24 | $ | 8.11 | ||||||||||||||||||||
Class R: | $ | 8.88 | $ | 9.28 | $ | 8.99 | $ | 8.30 | $ | 8.17 | ||||||||||||||||||||
Class RX: | $ | 8.86 | $ | 9.28 | $ | 8.99 | $ | 8.31 | $ | 8.17 | ||||||||||||||||||||
Class Y: | $ | 8.96 | $ | 9.31 | $ | 9.06 | $ | 8.36 | $ | 8.22 | ||||||||||||||||||||
Class R5: | $ | 8.96 | $ | 9.36 | $ | 9.08 | $ | 8.37 | $ | 8.23 | ||||||||||||||||||||
Class R6: | $ | 8.96 | $ | 9.37 | $ | 9.08 | $ | 8.37 | $ | 8.24 | ||||||||||||||||||||
Cost of Investments in affiliated underlying funds | $ | 50,823,497 | $ | 131,040,717 | $ | 131,346,057 | $ | 80,830,168 | $ | 42,359,229 | ||||||||||||||||||||
See accompanying Notes to Financial Statements which are an integral part of the financial statements.
33 Invesco Balanced-Risk Retirement Funds
Statement of Operations
For the year ended December 31, 2013
| Invesco Balanced-Risk Retirement Now Fund | Invesco Balanced-Risk Retirement 2020 Fund | Invesco Balanced-Risk Retirement 2030 Fund | Invesco Balanced-Risk Retirement 2040 Fund | Invesco Balanced-Risk Retirement 2050 Fund | ||||||||||||||||||||||||||
Investment income: | ||||||||||||||||||||||||||||||
Dividends from affiliated underlying funds | $ | 14,869 | $ | 10,954 | $ | 652 | $ | 484 | $ | 285 | ||||||||||||||||||||
Interest | 1,646 | 1,102 | 1,109 | 1,104 | 1,050 | |||||||||||||||||||||||||
Total investment income | 16,515 | 12,056 | 1,761 | 1,588 | 1,335 | |||||||||||||||||||||||||
Expenses: | ||||||||||||||||||||||||||||||
Administrative services fees | 50,000 | 50,000 | 50,000 | 50,000 | 50,000 | |||||||||||||||||||||||||
Custodian fees | 7,730 | 7,757 | 8,003 | 7,988 | 7,898 | |||||||||||||||||||||||||
Distribution fees: | ||||||||||||||||||||||||||||||
Class A | 37,603 | 125,626 | 120,527 | 87,331 | 37,022 | |||||||||||||||||||||||||
Class AX | 41,262 | 32,728 | 23,973 | 9,414 | 3,154 | |||||||||||||||||||||||||
Class B | 5,710 | 31,363 | 31,960 | 11,871 | 4,606 | |||||||||||||||||||||||||
Class C | 49,354 | 107,669 | 117,111 | 64,597 | 40,874 | |||||||||||||||||||||||||
Class CX | 43,567 | 34,749 | 19,299 | 5,525 | 1,320 | |||||||||||||||||||||||||
Class R | 10,414 | 59,011 | 66,041 | 43,692 | 22,363 | |||||||||||||||||||||||||
Class RX | 2,613 | 9,444 | 6,817 | 4,358 | 1,158 | |||||||||||||||||||||||||
Transfer agent fees — A, AX, B, C, CX, R, RX and Y | 74,377 | 188,667 | 188,881 | 148,947 | 97,253 | |||||||||||||||||||||||||
Transfer agent fees — R5 | 7,676 | 31,673 | 36,607 | 19,735 | 12,093 | |||||||||||||||||||||||||
Transfer agent fees — R6 | 28 | 33 | 27 | 55 | 23 | |||||||||||||||||||||||||
Trustees’ and officers’ fees and benefits | 25,520 | 28,996 | 28,894 | 26,572 | 25,133 | |||||||||||||||||||||||||
Registration and filing fees | 115,976 | 120,106 | 122,100 | 117,593 | 114,825 | |||||||||||||||||||||||||
Professional services fees | 45,363 | 46,021 | 45,846 | 44,820 | 45,151 | |||||||||||||||||||||||||
Other | (12,907 | ) | 46,430 | 48,545 | 42,705 | 37,415 | ||||||||||||||||||||||||
Total expenses | 504,286 | 920,273 | 914,631 | 685,203 | 500,288 | |||||||||||||||||||||||||
Less: Expenses reimbursed and expense offset arrangement(s) | (313,767 | ) | (519,699 | ) | (528,921 | ) | (458,420 | ) | (389,792 | ) | ||||||||||||||||||||
Net expenses | 190,519 | 400,574 | 385,710 | 226,783 | 110,496 | |||||||||||||||||||||||||
Net investment income (loss) | (174,004 | ) | (388,518 | ) | (383,949 | ) | (225,195 | ) | (109,161 | ) | ||||||||||||||||||||
Realized and unrealized gain (loss) from: | ||||||||||||||||||||||||||||||
Net realized gain (loss) from affiliated underlying funds | 186,579 | (252,695 | ) | 11,312 | 2,958,818 | 1,863,207 | ||||||||||||||||||||||||
Net realized gain from distributions of affiliated underlying fund shares | 2,252,144 | 8,245,179 | 8,999,994 | 4,987,793 | 2,415,404 | |||||||||||||||||||||||||
Net realized gain from affiliated underlying fund shares | 2,438,723 | 7,992,484 | 9,011,306 | 7,946,611 | 4,278,611 | |||||||||||||||||||||||||
Change in net unrealized appreciation (depreciation) of affiliated underlying fund shares | (1,651,018 | ) | (5,353,570 | ) | (6,135,964 | ) | (6,128,749 | ) | (3,321,729 | ) | ||||||||||||||||||||
Net increase in net assets resulting from operations | $ | 613,701 | $ | 2,250,396 | $ | 2,491,393 | $ | 1,592,667 | $ | 847,721 | ||||||||||||||||||||
See accompanying Notes to Financial Statements which are an integral part of the financial statements.
34 Invesco Balanced-Risk Retirement Funds
Statement of Changes in Net Assets
For the years ended December 31, 2013 and 2012
| Invesco Balanced-Risk Retirement Now Fund | Invesco Balanced-Risk Retirement 2020 Fund | |||||||||||||||||||
| 2013 | 2012 | 2013 | 2012 | |||||||||||||||||
Operations: | ||||||||||||||||||||
Net investment income (loss) | $ | (174,004 | ) | $ | 532,791 | $ | (388,518 | ) | $ | 1,751,382 | ||||||||||
Net realized gain | 2,438,723 | 1,006,924 | 7,992,484 | 2,697,144 | ||||||||||||||||
Change in net unrealized appreciation (depreciation) | (1,651,018 | ) | 1,139,634 | (5,353,570 | ) | 2,816,468 | ||||||||||||||
Net increase in net assets resulting from operations | 613,701 | 2,679,349 | 2,250,396 | 7,264,994 | ||||||||||||||||
Distributions to shareholders from net investment income: | ||||||||||||||||||||
Class A | (336,825 | ) | (299,926 | ) | (1,673,963 | ) | (1,335,635 | ) | ||||||||||||
Class AX | (318,764 | ) | (406,439 | ) | (388,401 | ) | (472,452 | ) | ||||||||||||
Class B | (9,503 | ) | (12,854 | ) | (61,482 | ) | (93,869 | ) | ||||||||||||
Class C | (99,103 | ) | (86,393 | ) | (255,127 | ) | (286,752 | ) | ||||||||||||
Class CX | (75,699 | ) | (84,769 | ) | (73,858 | ) | (103,448 | ) | ||||||||||||
Class R | (38,802 | ) | (40,136 | ) | (328,045 | ) | (343,233 | ) | ||||||||||||
Class RX | (10,870 | ) | (10,242 | ) | (54,697 | ) | (60,516 | ) | ||||||||||||
Class Y | (48,000 | ) | (14,994 | ) | (304,498 | ) | (232,925 | ) | ||||||||||||
Class R5 | (169,304 | ) | (65,288 | ) | (1,110,635 | ) | (193,084 | ) | ||||||||||||
Class R6 | (6,415 | ) | (207 | ) | (31,156 | ) | (353 | ) | ||||||||||||
Total distributions from net investment income | (1,113,285 | ) | (1,021,248 | ) | (4,281,862 | ) | (3,122,267 | ) | ||||||||||||
Distributions to shareholders from net realized gains: | ||||||||||||||||||||
Class A | (142,268 | ) | (167,650 | ) | (349,656 | ) | (419,007 | ) | ||||||||||||
Class AX | (134,575 | ) | (223,709 | ) | (81,129 | ) | (148,215 | ) | ||||||||||||
Class B | (4,471 | ) | (8,702 | ) | (17,154 | ) | (36,203 | ) | ||||||||||||
Class C | (46,524 | ) | (58,465 | ) | (71,183 | ) | (110,594 | ) | ||||||||||||
Class CX | (35,578 | ) | (57,385 | ) | (20,607 | ) | (39,897 | ) | ||||||||||||
Class R | (18,063 | ) | (23,807 | ) | (74,753 | ) | (114,633 | ) | ||||||||||||
Class RX | (4,779 | ) | (6,028 | ) | (12,464 | ) | (20,211 | ) | ||||||||||||
Class Y | (19,568 | ) | (8,097 | ) | (58,953 | ) | (68,597 | ) | ||||||||||||
Class R5 | (68,917 | ) | (35,155 | ) | (215,026 | ) | (56,864 | ) | ||||||||||||
Class R6 | (2,615 | ) | (121 | ) | (6,032 | ) | (104 | ) | ||||||||||||
Total distributions from net realized gains | (477,358 | ) | (589,119 | ) | (906,957 | ) | (1,014,325 | ) | ||||||||||||
Share transactions–net: | ||||||||||||||||||||
Class A | 2,179,234 | 3,562,416 | 10,569,458 | 14,139,281 | ||||||||||||||||
Class AX | (3,287,455 | ) | (2,589,651 | ) | (1,931,048 | ) | (1,962,200 | ) | ||||||||||||
Class B | (193,521 | ) | (147,609 | ) | (1,033,827 | ) | 172,834 | |||||||||||||
Class C | 429,199 | 2,323,503 | (251,506 | ) | 5,006,139 | |||||||||||||||
Class CX | (720,053 | ) | (338,074 | ) | (766,656 | ) | (290,351 | ) | ||||||||||||
Class R | (13,283 | ) | 192,022 | (253,483 | ) | 4,776,823 | ||||||||||||||
Class RX | (190,797 | ) | 17,608 | (640,372 | ) | 449,315 | ||||||||||||||
Class Y | 1,513,267 | 361,235 | 2,288,090 | 6,107,226 | ||||||||||||||||
Class R5 | 4,990,704 | 2,875,078 | 26,966,208 | 5,664,585 | ||||||||||||||||
Class R6 | 277,506 | 10,000 | 917,292 | 10,000 | ||||||||||||||||
Net increase in net assets resulting from share transactions | 4,984,801 | 6,266,528 | 35,864,156 | 34,073,652 | ||||||||||||||||
Net increase in net assets | 4,007,859 | 7,335,510 | 32,925,733 | 37,202,054 | ||||||||||||||||
Net assets: | ||||||||||||||||||||
Beginning of year | 48,547,032 | 41,211,522 | 99,041,225 | 61,839,171 | ||||||||||||||||
End of year* | $ | 52,554,891 | $ | 48,547,032 | $ | 131,966,958 | $ | 99,041,225 | ||||||||||||
* Includes accumulated undistributed net investment income (loss) | $ | (32,418 | ) | $ | (26,927 | ) | $ | (13,739 | ) | $ | 8,014 | |||||||||
See accompanying Notes to Financial Statements which are an integral part of the financial statements.
35 Invesco Balanced-Risk Retirement Funds
Statement of Changes in Net Assets—(continued)
For the years ended December 31, 2013 and 2012
| Invesco Balanced-Risk Retirement 2030 Fund | Invesco Balanced-Risk Retirement 2040 Fund | |||||||||||||||||||
| 2013 | 2012 | 2013 | 2012 | |||||||||||||||||
Operations: | ||||||||||||||||||||
Net investment income (loss) | $ | (383,949 | ) | $ | 2,101,833 | $ | (225,195 | ) | $ | 1,163,603 | ||||||||||
Net realized gain | 9,011,306 | 2,584,055 | 7,946,611 | 1,445,954 | ||||||||||||||||
Change in net unrealized appreciation (depreciation) | (6,135,964 | ) | 3,003,733 | (6,128,749 | ) | 1,542,391 | ||||||||||||||
Net increase in net assets resulting from operations | 2,491,393 | 7,689,621 | 1,592,667 | 4,151,948 | ||||||||||||||||
Distributions to shareholders from net investment income: | ||||||||||||||||||||
Class A | (1,770,989 | ) | (1,381,098 | ) | (832,307 | ) | (1,021,751 | ) | ||||||||||||
Class AX | (285,729 | ) | (381,811 | ) | (86,582 | ) | (147,086 | ) | ||||||||||||
Class B | (75,363 | ) | (111,871 | ) | (19,149 | ) | (39,445 | ) | ||||||||||||
Class C | (322,239 | ) | (322,351 | ) | (100,957 | ) | (193,340 | ) | ||||||||||||
Class CX | (49,562 | ) | (63,073 | ) | (9,590 | ) | (18,219 | ) | ||||||||||||
Class R | (421,569 | ) | (447,355 | ) | (191,683 | ) | (275,939 | ) | ||||||||||||
Class RX | (46,627 | ) | (40,965 | ) | (19,982 | ) | (26,682 | ) | ||||||||||||
Class Y | (176,378 | ) | (238,473 | ) | (52,006 | ) | (81,260 | ) | ||||||||||||
Class R5 | (1,258,426 | ) | (715,653 | ) | (566,940 | ) | (231,269 | ) | ||||||||||||
Class R6 | (32,778 | ) | (391 | ) | (26,288 | ) | (386 | ) | ||||||||||||
Total distributions from net investment income | (4,439,660 | ) | (3,703,041 | ) | (1,905,484 | ) | (2,035,377 | ) | ||||||||||||
Distributions to shareholders from net realized gains: | ||||||||||||||||||||
Class A | (419,510 | ) | (196,416 | ) | (1,466,444 | ) | — | |||||||||||||
Class AX | (67,675 | ) | (54,300 | ) | (152,647 | ) | — | |||||||||||||
Class B | (22,885 | ) | (19,148 | ) | (49,704 | ) | — | |||||||||||||
Class C | (97,855 | ) | (55,173 | ) | (262,058 | ) | — | |||||||||||||
Class CX | (15,050 | ) | (10,796 | ) | (24,894 | ) | — | |||||||||||||
Class R | (107,692 | ) | (67,295 | ) | (377,448 | ) | — | |||||||||||||
Class RX | (11,911 | ) | (6,162 | ) | (39,347 | ) | — | |||||||||||||
Class Y | (39,007 | ) | (32,091 | ) | (82,933 | ) | — | |||||||||||||
Class R5 | (278,309 | ) | (96,305 | ) | (904,083 | ) | — | |||||||||||||
Class R6 | (7,249 | ) | (53 | ) | (41,921 | ) | — | |||||||||||||
Total distributions from net realized gains | (1,067,143 | ) | (537,739 | ) | (3,401,479 | ) | — | |||||||||||||
Share transactions–net: | ||||||||||||||||||||
Class A | 14,783,452 | 14,256,599 | 6,998,097 | 14,043,110 | ||||||||||||||||
Class AX | (1,790,237 | ) | (1,193,851 | ) | (350,698 | ) | (350,806 | ) | ||||||||||||
Class B | (699,034 | ) | 256,113 | (103,230 | ) | (106,429 | ) | |||||||||||||
Class C | 1,322,576 | 4,508,710 | (97,938 | ) | 2,668,058 | |||||||||||||||
Class CX | (157,794 | ) | 26,908 | (1,993 | ) | (40,277 | ) | |||||||||||||
Class R | 1,009,664 | 4,276,054 | 860,535 | 4,231,062 | ||||||||||||||||
Class RX | (25,494 | ) | 279,384 | (126,247 | ) | 108,855 | ||||||||||||||
Class Y | 1,461,179 | 1,679,219 | 831,549 | 1,786,587 | ||||||||||||||||
Class R5 | 17,510,481 | 18,104,226 | 16,074,157 | 5,772,560 | ||||||||||||||||
Class R6 | 923,801 | 10,000 | 1,015,873 | 10,000 | ||||||||||||||||
Net increase in net assets resulting from share transactions | 34,338,594 | 42,203,362 | 25,100,105 | 28,122,720 | ||||||||||||||||
Net increase in net assets | 31,323,184 | 45,652,203 | 21,385,809 | 30,239,291 | ||||||||||||||||
Net assets: | ||||||||||||||||||||
Beginning of year | 100,950,530 | 55,298,327 | 57,688,678 | 27,449,387 | ||||||||||||||||
End of year* | $ | 132,273,714 | $ | 100,950,530 | $ | 79,074,487 | $ | 57,688,678 | ||||||||||||
* Includes accumulated undistributed net investment income (loss) | $ | (12,555 | ) | $ | 648 | $ | 334,856 | $ | 59,479 | |||||||||||
See accompanying Notes to Financial Statements which are an integral part of the financial statements.
36 Invesco Balanced-Risk Retirement Funds
Statement of Changes in Net Assets—(continued)
For the years ended December 31, 2013 and 2012
| Invesco Balanced-Risk Retirement 2050 Fund | ||||||||||
| 2013 | 2012 | |||||||||
Operations: | ||||||||||
Net investment income (loss) | $ | (109,161 | ) | $ | 627,869 | |||||
Net realized gain | 4,278,611 | 812,928 | ||||||||
Change in net unrealized appreciation (depreciation) | (3,321,729 | ) | 853,068 | |||||||
Net increase in net assets resulting from operations | 847,721 | 2,293,865 | ||||||||
Distributions to shareholders from net investment income: | ||||||||||
Class A | (312,499 | ) | (502,940 | ) | ||||||
Class AX | (27,423 | ) | (48,878 | ) | ||||||
Class B | (5,946 | ) | (15,982 | ) | ||||||
Class C | (58,672 | ) | (129,615 | ) | ||||||
Class CX | (2,012 | ) | (4,255 | ) | ||||||
Class R | (97,937 | ) | (143,806 | ) | ||||||
Class RX | (5,114 | ) | (7,555 | ) | ||||||
Class Y | (48,501 | ) | (53,084 | ) | ||||||
Class R5 | (347,830 | ) | (232,589 | ) | ||||||
Class R6 | (7,190 | ) | (409 | ) | ||||||
Total distributions from net investment income | (913,124 | ) | (1,139,113 | ) | ||||||
Distributions to shareholders from net realized gains: | ||||||||||
Class A | (747,878 | ) | (35,884 | ) | ||||||
Class AX | (65,627 | ) | (3,487 | ) | ||||||
Class B | (21,599 | ) | (1,343 | ) | ||||||
Class C | (213,141 | ) | (10,888 | ) | ||||||
Class CX | (7,311 | ) | (357 | ) | ||||||
Class R | (262,863 | ) | (10,781 | ) | ||||||
Class RX | (13,726 | ) | (566 | ) | ||||||
Class Y | (104,105 | ) | (3,595 | ) | ||||||
Class R5 | (746,608 | ) | (15,753 | ) | ||||||
Class R6 | (15,434 | ) | (28 | ) | ||||||
Total distributions from net realized gains | (2,198,292 | ) | (82,682 | ) | ||||||
Share transactions–net: | ||||||||||
Class A | 1,416,113 | 4,833,007 | ||||||||
Class AX | 39,079 | (263,983 | ) | |||||||
Class B | (60,070 | ) | (33,237 | ) | ||||||
Class C | 159,158 | 1,992,261 | ||||||||
Class CX | 13,121 | 22,773 | ||||||||
Class R | 1,320,328 | 1,827,797 | ||||||||
Class RX | 64,126 | 49,749 | ||||||||
Class Y | 742,230 | 849,613 | ||||||||
Class R5 | 9,047,611 | 5,515,524 | ||||||||
Class R6 | 299,854 | 10,000 | ||||||||
Net increase in net assets resulting from share transactions | 13,041,550 | 14,803,504 | ||||||||
Net increase in net assets | 10,777,855 | 15,875,574 | ||||||||
Net assets: | ||||||||||
Beginning of year | 29,910,704 | 14,035,130 | ||||||||
End of year* | $ | 40,688,559 | $ | 29,910,704 | ||||||
* Includes accumulated undistributed net investment income (loss) | $ | (20,073 | ) | $ | (15,997 | ) | ||||
See accompanying Notes to Financial Statements which are an integral part of the financial statements.
37 Invesco Balanced-Risk Retirement Funds
Notes to Financial Statements
December 31, 2013
NOTE 1—Significant Accounting Policies
AIM Growth Series (Invesco Growth Series) (the “Trust”) is organized as a Delaware statutory trust and is registered under the Investment Company Act of 1940, as amended (the “1940 Act”), as an open-end series management investment company consisting of fifteen separate series portfolios (each constituting a “Fund”), each authorized to issue an unlimited number of shares of beneficial interest. The Funds covered in this report ,each a series portfolio of the Trust, are Invesco Balanced-Risk Retirement Now Fund, Invesco Balanced-Risk Retirement 2020 Fund, Invesco Balanced-Risk Retirement 2030 Fund, Invesco Balanced-Risk Retirement 2040 Fund and Invesco Balanced-Risk Retirement 2050 Fund (collectively, the “Funds”). The assets, liabilities and operations of each Fund are accounted for separately. Information presented in these financial statements pertains only to the Funds. Matters affecting each Fund or class will be voted on exclusively by the shareholders of such Fund or class.
The investment objectives of the Funds are: to provide real return and, as a secondary objective, capital preservation for Invesco Balanced-Risk Retirement Now Fund; and to provide total return with a low to moderate correlation to traditional financial market indices and, as a secondary objective, capital preservation for Invesco Balanced-Risk Retirement 2020 Fund, Invesco Balanced-Risk Retirement 2030 Fund, Invesco Balanced-Risk Retirement 2040 Fund and Invesco Balanced-Risk Retirement 2050 Fund.
Each Fund currently consists of ten different classes of shares: Class A, Class AX, Class B, Class C, Class CX, Class R, Class RX, Class Y, Class R5 and Class R6. Class AX, Class CX and Class RX shares are closed to new investors. Class A shares and Class AX shares are sold with a front-end sales charge unless certain waiver criteria are met and under certain circumstances load waived shares may be subject to contingent deferred sales charges (“CDSC”). Class C and Class CX shares are sold with a CDSC. Class R, Class RX, Class Y, Class R5 and Class R6 shares are sold at net asset value. Effective November 30, 2010, new or additional investments in Class B shares are no longer permitted. Existing shareholders of Class B shares may continue to reinvest dividends and capital gains distributions in Class B shares until they convert to Class A shares. Also, shareholders in Class B shares will be able to exchange those shares for Class B shares of other Invesco Funds offering such shares until they convert to Class A shares. Generally, Class B shares will automatically convert to Class A shares on or about the month-end, which is at least eight years after the date of purchase. Redemption of Class B shares prior to the conversion date will be subject to a CDSC.
Each Fund is a “fund of funds,” in that it invests in other mutual funds (“underlying funds”) advised by Invesco Advisers, Inc. (the “Adviser” or “Invesco”). The Adviser may change each Fund’s asset class allocations, the underlying funds or the target weightings in an underlying fund without shareholder approval. The underlying funds may engage in a number of investment techniques and practices, which involve certain risks. Each underlying fund’s accounting policies are outlined in the underlying fund’s financial statements and are publicly available.
The following is a summary of the significant accounting policies followed by the Funds in the preparation of their financial statements.
| A. | Security Valuations — Securities of investment companies that trade on an exchange are valued at the last sales price or official closing price as of the close of the customary trading session on the exchange where the security is principally traded. Investments in shares of funds that are not traded on an exchange are valued at the end of day net asset value per share of such fund. Securities in the underlying funds, including restricted securities are valued in accordance with valuation policy of such fund. The policies of underlying funds affiliated with the funds as a result of having the same investment advisor are set forth below. |
A security listed or traded on an exchange (except convertible bonds) is valued at its last sales price or official closing price as of the close of the customary trading session on the exchange where the security is principally traded, or lacking any sales or official closing price on a particular day, the security may be valued at the closing bid price on that day. Securities traded in the over-the-counter market are valued based on prices furnished by independent pricing services or market makers. When such securities are valued by an independent pricing service they may be considered fair valued. Futures contracts are valued at the final settlement price set by an exchange on which they are principally traded. Listed options are valued at the mean between the last bid and ask prices from the exchange on which they are principally traded. Options not listed on an exchange are valued by an independent source at the mean between the last bid and ask prices. For purposes of determining net asset value per share, futures and option contracts generally are valued 15 minutes after the close of the customary trading session of the New York Stock Exchange (“NYSE”).
Senior secured floating rate loans and senior secured floating rate debt securities are fair valued using an evaluated quote provided by an independent pricing service. Evaluated quotes provided by the pricing service may reflect appropriate factors such as ratings, tranche type, industry, company performance, spread, individual trading characteristics, institution-size trading in similar groups of securities and other market data.
Investments in open-end and closed-end registered investment companies that do not trade on an exchange are valued at the end of day net asset value per share. Investments in open-end and closed-end registered investment companies that trade on an exchange are valued at the last sales price or official closing price as of the close of the customary trading session on the exchange where the security is principally traded.
Debt obligations (including convertible bonds) and unlisted equities are fair valued using an evaluated quote provided by an independent pricing service. Evaluated quotes provided by the pricing service may be determined without exclusive reliance on quoted prices, and may reflect appropriate factors such as institution-size trading in similar groups of securities, developments related to specific securities, dividend rate (for unlisted equities), yield (for debt obligations), quality, type of issue, coupon rate (for debt obligations), maturity (for debt obligations), individual trading characteristics and other market data. Debt obligations are subject to interest rate and credit risks. In addition, all debt obligations involve some risk of default with respect to interest and/or principal payments.
Foreign securities’ (including foreign exchange contracts) prices are converted into U.S. dollar amounts using the applicable exchange rates as of the close of the NYSE. If market quotations are available and reliable for foreign exchange-traded equity securities, the securities will be valued at the market quotations. Because trading hours for certain foreign securities end before the close of the NYSE, closing market quotations may become unreliable. If between the time trading ends on a particular security and the close of the customary trading session on the NYSE, events occur that the Adviser determines are significant and make the closing price unreliable, the Fund may fair value the security. If the event is likely to have affected the closing price of the security, the security will be valued at fair value in good faith using procedures approved by the Board of Trustees. Adjustments to closing prices to reflect fair value may also be based on a screening process of an independent pricing service to indicate the degree of certainty, based on historical data, that the closing price in the principal market where a foreign security trades is not the
38 Invesco Balanced-Risk Retirement Funds
current value as of the close of the NYSE. Foreign securities’ prices meeting the approved degree of certainty that the price is not reflective of current value will be priced at the indication of fair value from the independent pricing service. Multiple factors may be considered by the independent pricing service in determining adjustments to reflect fair value and may include information relating to sector indices, American Depositary Receipts and domestic and foreign index futures. Foreign securities may have additional risks including exchange rate changes, potential for sharply devalued currencies and high inflation, political and economic upheaval, the relative lack of issuer information, relatively low market liquidity and the potential lack of strict financial and accounting controls and standards.
Swap agreements are fair valued using an evaluated quote provided by an independent pricing service. Evaluated quotes provided by the pricing service are valued based on a model which may include end of day net present values, spreads, ratings, industry, and company performance.
Securities for which market prices are not provided by any of the above methods may be valued based upon quotes furnished by independent sources. The last bid price may be used to value equity securities. The mean between the last bid and asked prices is used to value debt obligations, including corporate loans.
Securities for which market quotations are not readily available or became unreliable are valued at fair value as determined in good faith by or under the supervision of the Trust’s officers following procedures approved by the Board of Trustees. Issuer specific events, market trends, bid/ask quotes of brokers and information providers and other market data may be reviewed in the course of making a good faith determination of a security’s fair value.
Valuations change in response to many factors including the historical and prospective earnings of the issuer, the value of the issuer’s assets, general economic conditions, interest rates, investor perceptions and market liquidity. Because of the inherent uncertainties of valuation, the values reflected in the financial statements may materially differ from the value received upon actual sale of those investments.
| B. | Securities Transactions and Investment Income — Securities transactions are accounted for on a trade date basis. Realized gains or losses on sales are computed on the basis of specific identification of the securities sold. Distributions from ordinary income from underlying funds, if any, are recorded as dividend income on ex-dividend date. Distributions from gains from underlying funds, if any, are recorded as realized gains on the ex-dividend date. The following policies are followed by the underlying funds: Interest income is recorded on the accrual basis from settlement date. Bond premiums and discounts are amortized and/or accreted for financial reporting purposes. Paydown gains and losses on mortgage and asset-backed securities are recorded as adjustments to interest income. |
Each Fund allocates income and realized and unrealized capital gains and losses to a class based on the relative net assets of each class.
| C. | Distributions — Invesco Balanced-Risk Retirement Now Fund generally declares and pays dividends from income, if any, quarterly. Invesco Balanced-Risk Retirement 2020 Fund, Invesco Balanced-Risk Retirement 2030 Fund, Invesco Balanced-Risk Retirement 2040 Fund and Invesco Balanced-Risk Retirement 2050 Fund generally declare and pay dividends from income, if any, annually. Distributions from net realized capital gains, if any, are generally paid annually and recorded on the ex-dividend date. The Funds may elect to treat a portion of the proceeds from redemptions as distributions for federal income tax purposes. |
| D. | Federal Income Taxes — The Funds intend to comply with the requirements of Subchapter M of the Internal Revenue Code of 1986, as amended (the “Internal Revenue Code”), necessary to qualify as a regulated investment company and to distribute substantially all of the Funds’ taxable earnings to shareholders. As such, the Funds will not be subject to federal income taxes on otherwise taxable income (including net realized capital gain) that is distributed to shareholders. Therefore, no provision for federal income taxes is recorded in the financial statements. |
Each Fund files tax returns in the U.S. Federal jurisdiction and certain other jurisdictions. Generally, each Fund is subject to examinations by such taxing authorities for up to three years after the filing of the return for the tax period.
| E. | Expenses — Expenses included in the accompanying financial statements reflect the expenses of the Funds and do not include any expenses of the underlying funds. The effects of the underlying funds expenses are included in the realized and unrealized gain/loss on the investments in the underlying funds. Estimated expenses of the underlying funds are discussed further within Note 11. |
Fees provided for under the Rule 12b-1 plan of a particular class of each Fund and which are directly attributable to that class are charged to the operations of such class. Transfer agency fees and expenses and other shareholder recordkeeping fees and expenses attributable to Class R5 and Class R6 are allocated to each share class based on relative net assets. Sub-accounting fees attributable to Class R5 are charged to the operations of the class. Transfer agency fees and expenses and other shareholder recordkeeping fees and expenses relating to all other classes are allocated among those classes based on relative net assets. All other expenses are allocated among the classes based on relative net assets.
| F. | Accounting Estimates — The preparation of financial statements in conformity with accounting principles generally accepted in the United States of America (“GAAP”) requires management to make estimates and assumptions that affect the reported amounts of assets and liabilities at the date of the financial statements and the reported amounts of revenues and expenses during the reporting period including estimates and assumptions related to taxation. Actual results could differ from those estimates by a significant amount. In addition, each Fund monitors for material events or transactions that may occur or become known after the period-end date and before the date the financial statements are released to print. |
| G. | Indemnifications — Under the Trust’s organizational documents, each Trustee, officer, employee or other agent of the Trust is indemnified against certain liabilities that may arise out of the performance of their duties to the Funds. Additionally, in the normal course of business, the Funds enter into contracts, including each Funds’ servicing agreements, that contain a variety of indemnification clauses. Each Fund’s maximum exposure under these arrangements is unknown as this would involve future claims that may be made against such Fund that have not yet occurred. The risk of material loss as a result of such indemnification claims is considered remote. |
NOTE 2—Advisory Fees and Other Fees Paid to Affiliates
The Trust has entered into a master investment advisory agreement with Invesco. Under the terms of the investment advisory agreement, the Funds do not pay an advisory fee. However, each Fund pays advisory fees to Invesco indirectly as a shareholder of the underlying funds.
Under the terms of a master sub-advisory agreement between the Adviser and each of Invesco Asset Management Deutschland GmbH, Invesco Asset Management Limited, Invesco Asset Management (Japan) Limited, Invesco Australia Limited, Invesco Hong Kong Limited, Invesco Senior Secured Management, Inc. and Invesco Canada Ltd. (collectively, the “Affiliated Sub-Advisers”) the Adviser, not the Funds, may pay 40% of the fees paid to the Adviser to any such Affiliated Sub-Adviser(s) that provide(s) discretionary investment management services to each Fund based on the percentage of assets allocated to such Sub-Adviser(s).
39 Invesco Balanced-Risk Retirement Funds
Invesco has contractually agreed, through at least April 30, 2015, to reimburse expenses to the extent necessary to limit total annual fund operating expenses after expense reimbursement (excluding certain items discussed below) of Class A, Class AX, Class B, Class C, Class CX, Class R, Class RX, Class Y, Class R5 and Class R6 shares for each Fund as shown in the following table:
| Class A/AX | Class B | Class C/CX | Class R/RX | Class Y | Class R5 | Class R6 | ||||||||||||||||||||||
Invesco Balanced-Risk Retirement Now Fund | 0.25 | % | 1.00 | % | 1.00 | % | 0.50 | % | 0.00 | % | 0.00 | % | 0.00 | % | ||||||||||||||
Invesco Balanced-Risk Retirement 2020 Fund | 0.25 | % | 1.00 | % | 1.00 | % | 0.50 | % | 0.00 | % | 0.00 | % | 0.00 | % | ||||||||||||||
Invesco Balanced-Risk Retirement 2030 Fund | 0.25 | % | 1.00 | % | 1.00 | % | 0.50 | % | 0.00 | % | 0.00 | % | 0.00 | % | ||||||||||||||
Invesco Balanced-Risk Retirement 2040 Fund | 0.25 | % | 1.00 | % | 1.00 | % | 0.50 | % | 0.00 | % | 0.00 | % | 0.00 | % | ||||||||||||||
Invesco Balanced-Risk Retirement 2050 Fund | 0.25 | % | 1.00 | % | 1.00 | % | 0.50 | % | 0.00 | % | 0.00 | % | 0.00 | % | ||||||||||||||
In determining Invesco’s obligation to reimburse expenses, the following expenses are not taken into account, and could cause the total annual fund operating expenses after expense reimbursement to exceed the numbers reflected above: (1) interest; (2) taxes; (3) dividend expense on short sales; (4) extraordinary or non-routine items, including litigation expenses; and (5) expenses that the Funds have incurred but did not actually pay because of an expense offset arrangement. The total annual fund operating expenses used in determining whether each Fund meets or exceeds the expense limitations described above do not include Acquired Fund Fees and Expenses. Acquired Fund Fees and Expenses are not operating expenses of a Fund directly, but are fees and expenses, including management fees of the investment companies in which a Fund invests. As a result, the total annual fund operating expenses after expense reimbursement may exceed the expense limits above. Unless Invesco continues each Fund’s fee waiver agreement, it will terminate on April 30, 2015. The fee waiver agreement cannot be terminated during its term.
For the year ended December 31, 2013, Invesco reimbursed the following expenses:
| Fund Level | Class A | Class AX | Class B | Class C | Class CX | Class R | Class RX | Class Y | Class R5 | Class R6 | ||||||||||||||||||||||||||||||||||
Invesco Balanced-Risk Retirement Now Fund | $ | 231,686 | $ | 24,809 | $ | 27,223 | $ | 942 | $ | 8,141 | $ | 7,186 | $ | 3,436 | $ | 862 | $ | 1,644 | $ | 7,676 | $ | 28 | ||||||||||||||||||||||
Invesco Balanced-Risk Retirement 2020 Fund | 299,325 | 93,451 | 24,345 | 5,832 | 20,023 | 6,462 | 21,949 | 3,513 | 12,770 | 31,673 | 33 | |||||||||||||||||||||||||||||||||
Invesco Balanced-Risk Retirement 2030 Fund | 303,406 | 97,649 | 19,423 | 6,473 | 23,720 | 3,909 | 26,753 | 2,762 | 7,838 | 36,607 | 27 | |||||||||||||||||||||||||||||||||
Invesco Balanced-Risk Retirement 2040 Fund | 289,683 | 88,661 | 9,558 | 3,013 | 16,395 | 1,402 | 22,179 | 2,212 | 5,235 | 19,735 | 55 | |||||||||||||||||||||||||||||||||
Invesco Balanced-Risk Retirement 2050 Fund | 280,423 | 52,573 | 4,479 | 1,635 | 14,511 | 469 | 15,878 | 822 | 6,666 | 12,093 | 24 | |||||||||||||||||||||||||||||||||
The Trust has entered into a master administrative services agreement with Invesco pursuant to which each Fund has agreed to pay Invesco for certain administrative costs incurred in providing accounting services to such Fund. For the year ended December 31, 2013, expenses incurred under the agreement are shown in the Statement of Operations as Administrative services fees.
The Trust has entered into a transfer agency and service agreement with Invesco Investment Services, Inc. (“IIS”) pursuant to which each Fund has agreed to pay IIS a fee for providing transfer agency and shareholder services to such Fund. For the year ended December 31, 2013, expenses incurred under the agreement are shown in the Statement of Operations as Transfer agent fees.
The Trust has entered into master distribution agreements with Invesco Distributors, Inc. (“IDI”) to serve as the distributor for the Class A, Class AX, Class B, Class C, Class CX, Class R, Class RX, Class Y, Class R5 and Class R6 shares of each Fund. The Trust has adopted plans pursuant to Rule 12b-1 under the 1940 Act with respect to each Fund’s Class A, Class AX, Class B, Class C, Class CX, Class R and Class RX shares (collectively, the “Plans”). Each Fund, pursuant to the Plans, pays IDI compensation at the annual rate of 0.25% of the average daily net assets of Class A shares, 1.00% of the average daily net assets of Class B and Class C shares and 0.50% of the average daily net assets of Class R shares. Also, each Fund, pursuant to the Plans, reimburses IDI up to a maximum annual rate of 0.25% of each Fund’s average daily net assets of Class AX shares, 1.00% of the average daily net assets of each Fund’s Class CX shares and 0.50% of each Fund’s average daily net assets of Class RX shares. Of the Plan payments, up to 0.25% of the average daily net assets of each class of shares may be paid to furnish continuing personal shareholder services to customers who purchase and own shares of such classes. Any amounts not paid as a service fee under the Plans would constitute an asset-based sales charge. Rules of the Financial Industry Regulatory Authority (“FINRA”) impose a cap on the total sales charges, including asset-based sales charges, that may be paid by any class of shares of each Fund. For the year ended December 31, 2013, expenses incurred under the Plans are shown in the Statement of Operations as Distribution fees.
Front-end sales commissions and CDSC are not recorded as expenses of the Funds. Front-end sales commissions are deducted from proceeds from the sales of Fund shares prior to investment in Class A and Class AX shares of the Funds. CDSC are deducted from redemption proceeds prior to remittance to the shareholder. During the year ended December 31, 2013, IDI advised the Funds that IDI retained the following in front-end sales commissions from the sale of Class A and Class AX shares and received the following in CDSC imposed on redemptions by shareholders:
| Front End Sales Charges | Contingent Deferred Sales Charges | |||||||||||||||||||||||||||
| Class A | Class AX | Class A | Class AX | Class B | Class C | Class CX | ||||||||||||||||||||||
Invesco Balanced-Risk Retirement Now Fund | $ | 5,947 | $ | 411 | $ | 0 | $ | 0 | $ | 762 | $ | 1,343 | $ | 58 | ||||||||||||||
Invesco Balanced-Risk Retirement 2020 Fund | 22,031 | 860 | 307 | 0 | 4,668 | 2,500 | 18 | |||||||||||||||||||||
Invesco Balanced-Risk Retirement 2030 Fund | 29,131 | 984 | 25 | 0 | 4,100 | 4,225 | 0 | |||||||||||||||||||||
Invesco Balanced-Risk Retirement 2040 Fund | 18,425 | 1,652 | 80 | 0 | 1,179 | 1,510 | 12 | |||||||||||||||||||||
Invesco Balanced-Risk Retirement 2050 Fund | 8,681 | 475 | 24 | 0 | 853 | 763 | 33 | |||||||||||||||||||||
The underlying Invesco Funds pay no distribution fees for Class R6 shares and the Funds pay no sales loads or other similar compensation to IDI for acquiring underlying fund shares.
Certain officers and trustees of the Trust are officers and directors of the Adviser, IIS and/or IDI.
40 Invesco Balanced-Risk Retirement Funds
NOTE 3—Additional Valuation Information
GAAP defines fair value as the price that would be received to sell an asset or paid to transfer a liability in an orderly transaction between market participants at the measurement date, under current market conditions. GAAP establishes a hierarchy that prioritizes the inputs to valuation methods, giving the highest priority to readily available unadjusted quoted prices in an active market for identical assets (Level 1) and the lowest priority to significant unobservable inputs (Level 3), generally when market prices are not readily available or are unreliable. Based on the valuation inputs, the securities or other investments are tiered into one of three levels. Changes in valuation methods may result in transfers in or out of an investment’s assigned level:
| Level 1 — | Prices are determined using quoted prices in an active market for identical assets. |
| Level 2 — | Prices are determined using other significant observable inputs. Observable inputs are inputs that other market participants may use in pricing a security. These may include quoted prices for similar securities, interest rates, prepayment speeds, credit risk, yield curves, loss severities, default rates, discount rates, volatilities and others. |
| Level 3 — | Prices are determined using significant unobservable inputs. In situations where quoted prices or observable inputs are unavailable (for example, when there is little or no market activity for an investment at the end of the period), unobservable inputs may be used. Unobservable inputs reflect the Fund’s own assumptions about the factors market participants would use in determining fair value of the securities or instruments and would be based on the best available information. |
The following is a summary of the tiered valuation input levels, as of December 31, 2013. The level assigned to the securities valuations may not be an indication of the risk or liquidity associated with investing in those securities. Because of the inherent uncertainties of valuation, the values reflected in the financial statements may materially differ from the value received upon actual sale of those investments.
| Equity Securities | ||||||||||||||||
| Fund Name | Level 1 | Level 2 | Level 3 | Total | ||||||||||||
Invesco Balanced-Risk Retirement Now Fund | $ | 52,637,687 | $ | — | $ | — | $ | 52,637,687 | ||||||||
Invesco Balanced-Risk Retirement 2020 Fund | 133,526,627 | — | — | 133,526,627 | ||||||||||||
Invesco Balanced-Risk Retirement 2030 Fund | 105,371,059 | 27,326,360 | — | 132,697,419 | ||||||||||||
Invesco Balanced-Risk Retirement 2040 Fund | 36,038,304 | 42,448,840 | — | 78,487,144 | ||||||||||||
Invesco Balanced-Risk Retirement 2050 Fund | 5,249,261 | 35,480,587 | — | 40,729,848 | ||||||||||||
NOTE 4—Expense Offset Arrangement(s)
The expense offset arrangement is comprised of transfer agency credits which result from balances in demand deposit accounts used by the transfer agent for clearing shareholder transactions. For the year ended December 31, 2013, the Funds received credits from this arrangement, which resulted in the reduction of the Funds’ total expenses of:
| Transfer Agent Credits | ||||
Invesco Balanced-Risk Retirement Now Fund | $ | 134 | ||
Invesco Balanced-Risk Retirement 2020 Fund | 323 | |||
Invesco Balanced-Risk Retirement 2030 Fund | 354 | |||
Invesco Balanced-Risk Retirement 2040 Fund | 292 | |||
Invesco Balanced-Risk Retirement 2050 Fund | 219 | |||
NOTE 5—Trustees’ and Officers’ Fees and Benefits
Trustees’ and Officers’ Fees and Benefits include amounts accrued by each Fund to pay remuneration to certain Trustees and Officers of such Fund. Trustees have the option to defer compensation payable by the Funds, and Trustees’ and Officers’ Fees and Benefits also include amounts accrued by each Fund to fund such deferred compensation amounts. Those Trustees who defer compensation have the option to select various Invesco Funds in which their deferral accounts shall be deemed to be invested. Finally, certain current Trustees were eligible to participate in a retirement plan that provided for benefits to be paid upon retirement to Trustees over a period of time based on the number of years of service. The Funds may have certain former Trustees who also participate in a retirement plan and receive benefits under such plan. Trustees’ and Officers’ Fees and Benefits include amounts accrued by each Fund to fund such retirement benefits. Obligations under the deferred compensation and retirement plans represent unsecured claims against the general assets of the Funds.
NOTE 6—Cash Balances
The Funds are permitted to temporarily carry a negative or overdrawn balance in their account with State Street Bank and Trust Company, the custodian bank. Such balances, if any at period end, are shown in the Statement of Assets and Liabilities under the payable caption Amount due custodian. To compensate the custodian bank for such overdrafts, the overdrawn Fund may either (1) leave funds as a compensating balance in the account so the custodian bank can be compensated by earning the additional interest; or (2) compensate by paying the custodian bank at a rate agreed upon by the custodian bank and Invesco, not to exceed the contractually agreed upon rate.
41 Invesco Balanced-Risk Retirement Funds
NOTE 7—Distributions to Shareholders and Tax Components of Net Assets
Tax Character of Distributions to Shareholders Paid During the Years Ended December 31, 2013 and 2012:
| 2013 | 2012 | |||||||||||||||||||||||
| Ordinary Income | Long-term Capital Gain | Total Distributions | Ordinary Income | Long-term Capital Gain | Total Distributions | |||||||||||||||||||
Invesco Balanced-Risk Retirement Now Fund | $ | 1,101,352 | $ | 489,291 | $ | 1,590,643 | $ | 1,021,248 | $ | 589,119 | $ | 1,610,367 | ||||||||||||
Invesco Balanced-Risk Retirement 2020 Fund | 4,281,862 | 906,957 | 5,188,819 | 3,122,267 | 1,014,325 | 4,136,592 | ||||||||||||||||||
Invesco Balanced-Risk Retirement 2030 Fund | 4,452,281 | 1,054,522 | 5,506,803 | 3,703,041 | 537,739 | 4,240,780 | ||||||||||||||||||
Invesco Balanced-Risk Retirement 2040 Fund | 1,905,484 | 3,401,479 | 5,306,963 | 2,035,377 | — | 2,035,377 | ||||||||||||||||||
Invesco Balanced-Risk Retirement 2050 Fund | 913,124 | 2,198,292 | 3,111,416 | 1,137,746 | 84,049 | 1,221,795 | ||||||||||||||||||
Tax Components of Net Assets at Period-End:
| Undistributed Ordinary Income | Undistributed Long-term Gain | Net Unrealized Appreciation (Depreciation)- Investments | Temporary Book/Tax Differences | Shares of Beneficial Interest | Total Net Assets | |||||||||||||||||||
Invesco Balanced-Risk Retirement Now Fund | $ | — | $ | 995,401 | $ | 1,792,805 | $ | (32,418 | ) | $ | 49,799,103 | $ | 52,554,891 | |||||||||||
Invesco Balanced-Risk Retirement 2020 Fund | 13,981 | 3,546,017 | 2,250,738 | (27,719 | ) | 126,183,941 | 131,966,958 | |||||||||||||||||
Invesco Balanced-Risk Retirement 2030 Fund | 14,745 | 4,229,812 | 1,160,453 | (27,300 | ) | 126,896,004 | 132,273,714 | |||||||||||||||||
Invesco Balanced-Risk Retirement 2040 Fund | 358,856 | 2,589,965 | (2,455,260 | ) | (24,000 | ) | 78,604,926 | 79,074,487 | ||||||||||||||||
Invesco Balanced-Risk Retirement 2050 Fund | 891 | 1,397,555 | (1,715,406 | ) | (20,963 | ) | 41,026,482 | 40,668,559 | ||||||||||||||||
The difference between book-basis and tax-basis unrealized appreciation (depreciation) is due to differences in the timing of recognition of gains and losses on investments for tax and book purposes. The Funds net unrealized appreciation (depreciation) differences are attributable primarily to wash sales.
The temporary book/tax differences are a result of timing differences between book and tax recognition of income and/or expenses. The Funds temporary book/tax differences are the result of the trustee deferral of compensation and retirement plan benefits.
The Funds do not have a capital loss carryforward as of December 31, 2013.
NOTE 8—Investment Securities
The aggregate amount of investment securities purchased and sold by each Fund and aggregate cost and the net unrealized appreciation (depreciation) of investments for tax purposes are as follows:
| For the year ended December 31, 2013* | At December 31, 2013 | |||||||||||||||||||||||||
| Purchases | Sales | Federal Tax Cost** | Unrealized Appreciation | Unrealized (Depreciation) | Net Unrealized Appreciation (Depreciation) | |||||||||||||||||||||
Invesco Balanced-Risk Retirement Now Fund | $ | 8,936,032 | $ | 4,930,362 | $ | 50,844,882 | $ | 1,792,805 | $ | — | $ | 1,792,805 | ||||||||||||||
Invesco Balanced-Risk Retirement 2020 Fund | 52,056,145 | 18,965,028 | 131,275,889 | 2,250,738 | — | 2,250,738 | ||||||||||||||||||||
Invesco Balanced-Risk Retirement 2030 Fund | 80,562,015 | 43,254,902 | 131,536,966 | 2,220,968 | (1,060,515 | ) | 1,160,453 | |||||||||||||||||||
Invesco Balanced-Risk Retirement 2040 Fund | 76,929,797 | 52,665,086 | 80,942,404 | — | (2,455,260 | ) | (2,455,260 | ) | ||||||||||||||||||
Invesco Balanced-Risk Retirement 2050 Fund | 48,115,147 | 36,054,356 | 42,445,254 | — | (1,715,406 | ) | (1,715,406 | ) | ||||||||||||||||||
| * | Excludes U.S. Treasury obligations and money market funds, if any. |
| ** | Cost of investments on a tax basis includes the adjustments for financial reporting purposes as of the most recently completed federal income tax reporting period- end. |
NOTE 9—Reclassification of Permanent Differences
Primarily as a result of differing book/tax treatment of capital gain distributions from the underlying funds, on December 31, 2013, reclassifications were made to the Funds, as shown below. These reclassifications had no effect on the net assets of each Fund.
| Undistributed Net Investment Income | Undistributed Net Realized Gain (Loss) | Shares of Beneficial Interest | ||||||||||
Invesco Balanced-Risk Retirement Now Fund | $ | 1,281,798 | $ | (1,281,798 | ) | $ | — | |||||
Invesco Balanced-Risk Retirement 2020 Fund | 4,648,627 | (4,648,627 | ) | — | ||||||||
Invesco Balanced-Risk Retirement 2030 Fund | 4,810,406 | (4,810,406 | ) | — | ||||||||
Invesco Balanced-Risk Retirement 2040 Fund | 2,406,056 | (2,406,056 | ) | — | ||||||||
Invesco Balanced-Risk Retirement 2050 Fund | 1,018,210 | (1,018,210 | ) | — | ||||||||
42 Invesco Balanced-Risk Retirement Funds
NOTE 10—Share Information
Invesco Balanced-Risk Retirement Now Fund
| Summary of Share Activity | ||||||||||||||||
| Years ended December 31, | ||||||||||||||||
| 2013(a) | 2012 | |||||||||||||||
| Shares | Amount | Shares | Amount | |||||||||||||
Sold: | ||||||||||||||||
Class A | 844,684 | $ | 7,707,125 | 715,048 | $ | 6,533,884 | ||||||||||
Class AX | 11,496 | 104,867 | 39,388 | 360,775 | ||||||||||||
Class B | 4,770 | 43,135 | 18,380 | 167,023 | ||||||||||||
Class C | 173,448 | 1,562,763 | 329,012 | 2,978,836 | ||||||||||||
Class CX | 12,775 | 115,129 | 20,455 | 185,072 | ||||||||||||
Class R | 87,648 | 796,717 | 84,736 | 775,898 | ||||||||||||
Class RX | 10,127 | 92,024 | 24,592 | 223,990 | ||||||||||||
Class Y | 253,891 | 2,348,808 | 43,445 | 398,194 | ||||||||||||
Class R5 | 912,942 | 8,342,951 | 786,118 | 7,096,390 | ||||||||||||
Class R6(b) | 39,848 | 365,202 | 1,066 | 10,000 | ||||||||||||
Issued as reinvestment of dividends: | ||||||||||||||||
Class A | 49,246 | 437,299 | 50,107 | 453,426 | ||||||||||||
Class AX | 48,541 | 430,074 | 68,992 | 623,611 | ||||||||||||
Class B | 1,449 | 12,651 | 2,330 | 20,856 | ||||||||||||
Class C | 14,451 | 126,162 | 14,882 | 133,342 | ||||||||||||
Class CX | 12,169 | 106,236 | 15,237 | 136,372 | ||||||||||||
Class R | 6,400 | 56,577 | 6,649 | 59,780 | ||||||||||||
Class RX | 1,738 | 15,349 | 1,701 | 15,343 | ||||||||||||
Class Y | 7,505 | 66,950 | 2,498 | 22,681 | ||||||||||||
Class R5 | 26,671 | 237,907 | 11,020 | 100,040 | ||||||||||||
Class R6(b) | 978 | 8,725 | — | — | ||||||||||||
Automatic conversion of Class B shares to Class A shares: | ||||||||||||||||
Class A | 7,328 | 67,078 | 15,267 | 139,631 | ||||||||||||
Class B | (7,434 | ) | (67,078 | ) | (15,418 | ) | (139,631 | ) | ||||||||
Reacquired: | ||||||||||||||||
Class A | (660,014 | ) | (6,032,268 | ) | (390,114 | ) | (3,564,525 | ) | ||||||||
Class AX | (419,392 | ) | (3,822,396 | ) | (391,027 | ) | (3,574,037 | ) | ||||||||
Class B | (20,161 | ) | (182,229 | ) | (21,608 | ) | (195,857 | ) | ||||||||
Class C | (139,540 | ) | (1,259,726 | ) | (87,279 | ) | (788,675 | ) | ||||||||
Class CX | (104,313 | ) | (941,418 | ) | (72,890 | ) | (659,518 | ) | ||||||||
Class R | (95,169 | ) | (866,577 | ) | (70,708 | ) | (643,656 | ) | ||||||||
Class RX | (33,495 | ) | (298,170 | ) | (24,295 | ) | (221,725 | ) | ||||||||
Class Y | (98,826 | ) | (902,491 | ) | (6,436 | ) | (59,640 | ) | ||||||||
Class R5 | (390,916 | ) | (3,590,154 | ) | (477,641 | ) | (4,321,352 | ) | ||||||||
Class R6(b) | (10,519 | ) | (96,421 | ) | — | — | ||||||||||
Net increase in share activity | 548,326 | $ | 4,984,801 | 693,507 | $ | 6,256,528 | ||||||||||
| (a) | There are entities that are record owners of more than 5% of the outstanding shares of the Fund and in the aggregate own 28% of the outstanding shares of the Fund. IDI has an agreement with these entities to sell Fund shares. The Fund, Invesco and/or Invesco affiliates may make payments to these entities, which are considered to be related to the Fund, for providing services to the Fund, Invesco and/or Invesco affiliates including but not limited to services such as securities brokerage, distribution, third party record keeping and account servicing. The Trust has no knowledge as to whether all or any portion of the shares owned of record by these entities are also owned beneficially. |
| (b) | Commencement date of September 24, 2012. |
43 Invesco Balanced-Risk Retirement Funds
NOTE 10—Share Information—(continued)
Invesco Balanced-Risk Retirement 2020 Fund
| Summary of Share Activity | ||||||||||||||||
| Years ended December 31, | ||||||||||||||||
| 2013(a) | 2012 | |||||||||||||||
| Shares | Amount | Shares | Amount | |||||||||||||
Sold: | ||||||||||||||||
Class A | 2,705,827 | $ | 25,993,942 | 2,228,771 | $ | 21,313,085 | ||||||||||
Class AX | 41,242 | 396,254 | 60,768 | 579,800 | ||||||||||||
Class B | 20,575 | 195,137 | 111,750 | 1,043,189 | ||||||||||||
Class C | 493,579 | 4,675,156 | 679,001 | 6,419,657 | ||||||||||||
Class CX | 17,959 | 170,062 | 19,869 | 186,622 | ||||||||||||
Class R | 609,724 | 5,865,913 | 640,526 | 6,139,466 | ||||||||||||
Class RX | 33,690 | 321,858 | 82,783 | 792,571 | ||||||||||||
Class Y | 845,319 | 8,217,859 | 777,340 | 7,466,745 | ||||||||||||
Class R5 | 3,803,461 | 36,493,238 | 1,524,369 | 14,268,205 | ||||||||||||
Class R6(b) | 99,895 | 964,828 | 1,004 | 10,000 | ||||||||||||
Issued as reinvestment of dividends: | ||||||||||||||||
Class A | 212,036 | 1,963,456 | 172,526 | 1,633,821 | ||||||||||||
Class AX | 50,220 | 465,041 | 65,537 | 620,631 | ||||||||||||
Class B | 8,228 | 75,371 | 13,769 | 129,015 | ||||||||||||
Class C | 34,544 | 316,080 | 37,841 | 353,818 | ||||||||||||
Class CX | 10,219 | 93,501 | 13,671 | 127,825 | ||||||||||||
Class R | 43,512 | 401,616 | 38,257 | 361,152 | ||||||||||||
Class RX | 7,237 | 66,789 | 7,530 | 71,091 | ||||||||||||
Class Y | 35,976 | 333,141 | 31,620 | 299,444 | ||||||||||||
Class R5 | 142,486 | 1,325,118 | 26,191 | 249,336 | ||||||||||||
Class R6(b) | 3,947 | 36,783 | — | — | ||||||||||||
Automatic conversion of Class B shares to Class A shares: | ||||||||||||||||
Class A | 40,261 | 387,346 | 51,100 | 490,372 | ||||||||||||
Class B | (40,851 | ) | (387,346 | ) | (51,773 | ) | (490,372 | ) | ||||||||
Reacquired: | ||||||||||||||||
Class A | (1,850,279 | ) | (17,775,286 | ) | (965,723 | ) | (9,297,997 | ) | ||||||||
Class AX | (290,484 | ) | (2,792,343 | ) | (329,325 | ) | (3,162,631 | ) | ||||||||
Class B | (97,110 | ) | (916,989 | ) | (54,079 | ) | (508,998 | ) | ||||||||
Class C | (553,542 | ) | (5,242,742 | ) | (186,835 | ) | (1,767,336 | ) | ||||||||
Class CX | (107,964 | ) | (1,030,219 | ) | (64,372 | ) | (604,798 | ) | ||||||||
Class R | (690,702 | ) | (6,521,012 | ) | (180,276 | ) | (1,723,795 | ) | ||||||||
Class RX | (109,410 | ) | (1,029,019 | ) | (43,534 | ) | (414,347 | ) | ||||||||
Class Y | (651,099 | ) | (6,262,910 | ) | (170,548 | ) | (1,658,963 | ) | ||||||||
Class R5 | (1,128,021 | ) | (10,852,148 | ) | (940,755 | ) | (8,852,956 | ) | ||||||||
Class R6(b) | (8,667 | ) | (84,319 | ) | — | — | ||||||||||
Net increase in share activity | 3,731,808 | $ | 35,864,156 | 3,597,003 | $ | 34,063,652 | ||||||||||
| (a) | There are entities that are record owners of more than 5% of the outstanding shares of the Fund and in the aggregate own 28% of the outstanding shares of the Fund. IDI has an agreement with these entities to sell Fund shares. The Fund, Invesco and/or Invesco affiliates may make payments to these entities, which are considered to be related to the Fund, for providing services to the Fund, Invesco and/or Invesco affiliates including but not limited to services such as securities brokerage, distribution, third party record keeping and account servicing. The Trust has no knowledge as to whether all or any portion of the shares owned of record by these entities are also owned beneficially. |
| (b) | Commencement date of September 24, 2012. |
44 Invesco Balanced-Risk Retirement Funds
NOTE 10—Share Information—(continued)
Invesco Balanced-Risk Retirement 2030 Fund
| Summary of Share Activity | ||||||||||||||||
| Years ended December 31, | ||||||||||||||||
| 2013(a) | 2012 | |||||||||||||||
| Shares | Amount | Shares | Amount | |||||||||||||
Sold: | ||||||||||||||||
Class A | 2,699,963 | $ | 25,226,385 | 2,034,968 | $ | 18,779,447 | ||||||||||
Class AX | 50,655 | 472,452 | 58,555 | 539,931 | ||||||||||||
Class B | 13,122 | 121,957 | 93,722 | 851,946 | ||||||||||||
Class C | 569,070 | 5,230,367 | 614,314 | 5,620,373 | ||||||||||||
Class CX | 12,477 | 115,515 | 18,821 | 171,195 | ||||||||||||
Class R | 603,429 | 5,594,366 | 761,061 | 7,051,791 | ||||||||||||
Class RX | 45,556 | 422,496 | 44,380 | 406,905 | ||||||||||||
Class Y | 302,771 | 2,833,877 | 578,830 | 5,497,810 | ||||||||||||
Class R5 | 3,289,074 | 30,603,780 | 3,685,652 | 33,404,755 | ||||||||||||
Class R6(b) | 101,709 | 954,532 | 1,036 | 10,000 | ||||||||||||
Issued as reinvestment of dividends: | ||||||||||||||||
Class A | 239,495 | 2,147,827 | 151,230 | 1,389,802 | ||||||||||||
Class AX | 38,603 | 346,651 | 47,261 | 434,331 | ||||||||||||
Class B | 11,002 | 97,812 | 14,376 | 130,968 | ||||||||||||
Class C | 46,345 | 411,546 | 36,556 | 332,660 | ||||||||||||
Class CX | 7,258 | 64,449 | 5,001 | 45,508 | ||||||||||||
Class R | 58,531 | 522,685 | 39,884 | 364,940 | ||||||||||||
Class RX | 6,482 | 57,821 | 4,877 | 44,578 | ||||||||||||
Class Y | 23,469 | 210,985 | 29,311 | 269,957 | ||||||||||||
Class R5 | 170,495 | 1,536,158 | 87,906 | 811,369 | ||||||||||||
Class R6(b) | 4,394 | 39,591 | — | — | ||||||||||||
Automatic conversion of Class B shares to Class A shares: | ||||||||||||||||
Class A | 41,917 | 391,701 | 39,471 | 366,562 | ||||||||||||
Class B | (42,445 | ) | (391,701 | ) | (39,913 | ) | (366,562 | ) | ||||||||
Reacquired: | ||||||||||||||||
Class A | (1,391,009 | ) | (12,982,461 | ) | (673,348 | ) | (6,279,212 | ) | ||||||||
Class AX | (278,586 | ) | (2,609,340 | ) | (234,900 | ) | (2,168,113 | ) | ||||||||
Class B | (57,019 | ) | (527,102 | ) | (39,124 | ) | (360,239 | ) | ||||||||
Class C | (470,124 | ) | (4,319,337 | ) | (155,611 | ) | (1,444,323 | ) | ||||||||
Class CX | (36,996 | ) | (337,758 | ) | (20,813 | ) | (189,795 | ) | ||||||||
Class R | (555,120 | ) | (5,107,387 | ) | (341,087 | ) | (3,140,677 | ) | ||||||||
Class RX | (55,792 | ) | (505,811 | ) | (18,729 | ) | (172,099 | ) | ||||||||
Class Y | (170,480 | ) | (1,583,683 | ) | (442,422 | ) | (4,088,548 | ) | ||||||||
Class R5 | (1,587,825 | ) | (14,629,457 | ) | (1,781,592 | ) | (16,111,898 | ) | ||||||||
Class R6(b) | (7,488 | ) | (70,322 | ) | — | — | ||||||||||
Net increase in share activity | 3,682,933 | $ | 34,338,594 | 4,599,673 | $ | 42,203,362 | ||||||||||
| (a) | There are entities that are record owners of more than 5% of the outstanding shares of the Fund and in the aggregate own 39% of the outstanding shares of the Fund. IDI has an agreement with these entities to sell Fund shares. The Fund, Invesco and/or Invesco affiliates may make payments to these entities, which are considered to be related to the Fund, for providing services to the Fund, Invesco and/or Invesco affiliates including but not limited to services such as securities brokerage, distribution, third party record keeping and account servicing. The Trust has no knowledge as to whether all or any portion of the shares owned of record by these entities are also owned beneficially. |
| (b) | Commencement date of September 24, 2012. |
45 Invesco Balanced-Risk Retirement Funds
NOTE 10—Share Information—(continued)
Invesco Balanced-Risk Retirement 2040 Fund
| Summary of Share Activity | ||||||||||||||||
| Years ended December 31, | ||||||||||||||||
| 2013(a) | 2012 | |||||||||||||||
| Shares | Amount | Shares | Amount | |||||||||||||
Sold: | ||||||||||||||||
Class A | 1,929,074 | $ | 17,048,742 | 2,082,300 | $ | 18,222,449 | ||||||||||
Class AX | 49,230 | 435,592 | 34,221 | 297,292 | ||||||||||||
Class B | 8,044 | 70,081 | 22,178 | 188,864 | ||||||||||||
Class C | 308,308 | 2,687,825 | 437,131 | 3,758,028 | ||||||||||||
Class CX | 13,806 | 119,805 | 8,597 | 73,597 | ||||||||||||
Class R | 409,427 | 3,599,219 | 720,789 | 6,284,502 | ||||||||||||
Class RX | 27,655 | 243,367 | 22,794 | 197,734 | ||||||||||||
Class Y | 197,956 | 1,703,429 | 229,600 | 2,034,826 | ||||||||||||
Class R5 | 2,122,568 | 18,767,052 | 1,974,249 | 16,728,209 | ||||||||||||
Class R6(b) | 119,477 | 1,063,908 | 1,100 | 10,000 | ||||||||||||
Issued as reinvestment of dividends: | ||||||||||||||||
Class A | 276,109 | 2,280,422 | 103,674 | 905,072 | ||||||||||||
Class AX | 28,927 | 239,230 | 16,868 | 147,086 | ||||||||||||
Class B | 8,407 | 68,853 | 4,540 | 39,223 | ||||||||||||
Class C | 43,443 | 355,364 | 19,044 | 164,348 | ||||||||||||
Class CX | 4,030 | 32,929 | 1,537 | 13,245 | ||||||||||||
Class R | 68,516 | 563,891 | 22,914 | 198,895 | ||||||||||||
Class RX | 7,118 | 58,652 | 2,876 | 24,989 | ||||||||||||
Class Y | 16,162 | 133,982 | 9,239 | 80,754 | ||||||||||||
Class R5 | 177,115 | 1,470,060 | 26,370 | 230,736 | ||||||||||||
Class R6(b) | 8,134 | 67,512 | — | — | ||||||||||||
Automatic conversion of Class B shares to Class A shares: | ||||||||||||||||
Class A | 12,941 | 114,455 | 13,367 | 116,805 | ||||||||||||
Class B | (13,109 | ) | (114,455 | ) | (13,528 | ) | (116,805 | ) | ||||||||
Reacquired: | ||||||||||||||||
Class A | (1,410,795 | ) | (12,445,522 | ) | (592,883 | ) | (5,201,216 | ) | ||||||||
Class AX | (116,064 | ) | (1,025,520 | ) | (91,412 | ) | (795,184 | ) | ||||||||
Class B | (14,740 | ) | (127,709 | ) | (25,494 | ) | (217,711 | ) | ||||||||
Class C | (360,839 | ) | (3,141,127 | ) | (145,438 | ) | (1,254,318 | ) | ||||||||
Class CX | (17,647 | ) | (154,727 | ) | (14,982 | ) | (127,119 | ) | ||||||||
Class R | (377,191 | ) | (3,302,575 | ) | (253,991 | ) | (2,252,335 | ) | ||||||||
Class RX | (50,409 | ) | (428,266 | ) | (13,110 | ) | (113,868 | ) | ||||||||
Class Y | (113,423 | ) | (1,005,862 | ) | (37,789 | ) | (328,993 | ) | ||||||||
Class R5 | (465,850 | ) | (4,162,955 | ) | (1,310,106 | ) | (11,186,385 | ) | ||||||||
Class R6(b) | (12,893 | ) | (115,547 | ) | — | — | ||||||||||
Net increase in share activity | 2,883,487 | $ | 25,100,105 | 3,254,655 | $ | 28,122,720 | ||||||||||
| (a) | There are entities that are record owners of more than 5% of the outstanding shares of the Fund and in the aggregate own 44% of the outstanding shares of the Fund. IDI has an agreement with these entities to sell Fund shares. The Fund, Invesco and/or Invesco affiliates may make payments to these entities, which are considered to be related to the Fund, for providing services to the Fund, Invesco and/or Invesco affiliates including but not limited to services such as securities brokerage, distribution, third party record keeping and account servicing. The Trust has no knowledge as to whether all or any portion of the shares owned of record by these entities are also owned beneficially. |
| (b) | Commencement date of September 24, 2012. |
46 Invesco Balanced-Risk Retirement Funds
NOTE 10—Share Information—(continued)
Invesco Balanced-Risk Retirement 2050 Fund
| Summary of Share Activity | ||||||||||||||||
| Years ended December 31, | ||||||||||||||||
| 2013(a) | 2012 | |||||||||||||||
| Shares | Amount | Shares | Amount | |||||||||||||
Sold: | ||||||||||||||||
Class A | 785,663 | $ | 6,894,227 | 821,397 | $ | 7,109,258 | ||||||||||
Class AX | 17,513 | 154,882 | 15,345 | 132,618 | ||||||||||||
Class B | 389 | 3,378 | 17,919 | 153,140 | ||||||||||||
Class C | 211,572 | 1,823,324 | 299,063 | 2,565,971 | ||||||||||||
Class CX | 3,429 | 29,277 | 3,111 | 26,796 | ||||||||||||
Class R | 252,112 | 2,200,068 | 267,894 | 2,342,207 | ||||||||||||
Class RX | 7,549 | 65,627 | 6,654 | 57,597 | ||||||||||||
Class Y | 168,657 | 1,493,511 | 139,250 | 1,230,423 | ||||||||||||
Class R5 | 1,226,099 | 10,688,543 | 1,723,529 | 14,543,814 | ||||||||||||
Class R6(b) | 33,384 | 295,331 | 1,104 | 10,000 | ||||||||||||
Issued as reinvestment of dividends: | ||||||||||||||||
Class A | 121,928 | 991,277 | 60,781 | 525,152 | ||||||||||||
Class AX | 11,404 | 92,712 | 6,051 | 52,338 | ||||||||||||
Class B | 3,075 | 24,660 | 2,029 | 17,325 | ||||||||||||
Class C | 31,544 | 253,617 | 14,220 | 121,726 | ||||||||||||
Class CX | 1,149 | 9,228 | 439 | 3,751 | ||||||||||||
Class R | 44,571 | 360,579 | 13,312 | 114,613 | ||||||||||||
Class RX | 2,164 | 17,505 | 858 | 7,384 | ||||||||||||
Class Y | 18,621 | 151,575 | 6,477 | 56,093 | ||||||||||||
Class R5 | 134,171 | 1,093,494 | 28,582 | 247,805 | ||||||||||||
Class R6(b) | 2,678 | 21,856 | — | — | ||||||||||||
Automatic conversion of Class B shares to Class A shares: | ||||||||||||||||
Class A | 860 | 7,467 | 6,697 | 57,661 | ||||||||||||
Class B | (873 | ) | (7,467 | ) | (6,790 | ) | (57,661 | ) | ||||||||
Reacquired: | ||||||||||||||||
Class A | (745,399 | ) | (6,476,858 | ) | (324,013 | ) | (2,859,064 | ) | ||||||||
Class AX | (23,995 | ) | (208,515 | ) | (50,903 | ) | (448,939 | ) | ||||||||
Class B | (9,267 | ) | (80,641 | ) | (16,872 | ) | (146,041 | ) | ||||||||
Class C | (222,703 | ) | (1,917,783 | ) | (80,729 | ) | (695,436 | ) | ||||||||
Class CX | (2,947 | ) | (25,384 | ) | (907 | ) | (7,774 | ) | ||||||||
Class R | (143,565 | ) | (1,240,319 | ) | (72,366 | ) | (629,023 | ) | ||||||||
Class RX | (2,130 | ) | (19,006 | ) | (1,714 | ) | (15,232 | ) | ||||||||
Class Y | (104,916 | ) | (902,856 | ) | (50,776 | ) | (436,903 | ) | ||||||||
Class R5 | (311,582 | ) | (2,734,426 | ) | (1,093,173 | ) | (9,276,095 | ) | ||||||||
Class R6(b) | (1,981 | ) | (17,333 | ) | — | — | ||||||||||
Net increase in share activity | 1,509,174 | $ | 13,041,550 | 1,736,469 | $ | 14,803,504 | ||||||||||
| (a) | There are entities that are record owners of more than 5% of the outstanding shares of the Fund and in the aggregate own 45% of the outstanding shares of the Fund. IDI has an agreement with these entities to sell Fund shares. The Fund, Invesco and/or Invesco affiliates may make payments to these entities, which are considered to be related to the Fund, for providing services to the Fund, Invesco and/or Invesco affiliates including but not limited to services such as securities brokerage, distribution, third party record keeping and account servicing. The Trust has no knowledge as to whether all or any portion of the shares owned of record by these entities are also owned beneficially. |
| (b) | Commencement date of September 24, 2012. |
47 Invesco Balanced-Risk Retirement Funds
NOTE 11—Financial Highlights
The following schedule presents financial highlights for a share of each Fund outstanding throughout the periods indicated.
Invesco Balanced-Risk Retirement Now Fund
| Net asset value, beginning of period | Net investment income (loss)(a) | Net gains on securities (both realized and unrealized) | Total from investment operations | Dividends from net investment income | Distributions from net realized gains | Total distributions | Net asset value, end of period | Total return(b) | Net assets, end of period (000s omitted) | Ratio of expenses to average net assets with fee waivers and/or expense reimbursements(c) | Ratio of expenses to average net assets without fee waivers and/or expense reimbursements | Ratio of net investment income (loss) to average net assets | Portfolio turnover(d) | |||||||||||||||||||||||||||||||||||||||||||||||||||||||||
Class A | ||||||||||||||||||||||||||||||||||||||||||||||||||||||||||||||||||||||
Year ended 12/31/13 | $ | 9.07 | $ | (0.02 | ) | $ | 0.14 | $ | 0.12 | $ | (0.20 | ) | $ | (0.08 | ) | $ | (0.28 | ) | $ | 8.91 | 1.33 | % | $ | 15,858 | 0.25 | %(e) | 0.85 | %(e) | (0.22 | )%(e) | 16 | % | ||||||||||||||||||||||||||||||||||||||
Year ended 12/31/12 | 8.84 | 0.12 | 0.42 | 0.54 | (0.20 | ) | (0.11 | ) | (0.31 | ) | 9.07 | 6.22 | 13,959 | 0.25 | 0.96 | 1.30 | 7 | |||||||||||||||||||||||||||||||||||||||||||||||||||||
Year ended 12/31/11 | 8.58 | 0.17 | 0.35 | 0.52 | (0.14 | ) | (0.12 | ) | (0.26 | ) | 8.84 | 6.18 | 10,150 | 0.25 | 1.09 | 1.95 | 15 | |||||||||||||||||||||||||||||||||||||||||||||||||||||
Year ended 12/31/10 | 8.23 | 0.37 | 0.26 | 0.63 | (0.28 | ) | — | (0.28 | ) | 8.58 | 7.74 | 2,488 | 0.25 | 3.45 | 4.35 | 67 | ||||||||||||||||||||||||||||||||||||||||||||||||||||||
Year ended 12/31/09 | 7.59 | 0.47 | 0.61 | 1.08 | (0.44 | ) | — | (0.44 | ) | 8.23 | 14.53 | 1,399 | 0.27 | 10.47 | 5.93 | 155 | ||||||||||||||||||||||||||||||||||||||||||||||||||||||
Class AX | ||||||||||||||||||||||||||||||||||||||||||||||||||||||||||||||||||||||
Year ended 12/31/13 | 9.06 | (0.02 | ) | 0.14 | 0.12 | (0.20 | ) | (0.08 | ) | (0.28 | ) | 8.90 | 1.33 | 14,817 | 0.25 | (e) | 0.85 | (e) | (0.22 | )(e) | 16 | |||||||||||||||||||||||||||||||||||||||||||||||||
Year ended 12/31/12 | 8.83 | 0.12 | 0.42 | 0.54 | (0.20 | ) | (0.11 | ) | (0.31 | ) | 9.06 | 6.22 | 18,345 | 0.25 | 0.96 | 1.30 | 7 | |||||||||||||||||||||||||||||||||||||||||||||||||||||
Year ended 12/31/11 | 8.58 | 0.17 | 0.34 | 0.51 | (0.14 | ) | (0.12 | ) | (0.26 | ) | 8.83 | 6.06 | 20,371 | 0.25 | 1.09 | 1.95 | 15 | |||||||||||||||||||||||||||||||||||||||||||||||||||||
Year ended 12/31/10(f) | 8.30 | 0.22 | 0.32 | 0.54 | (0.26 | ) | — | (0.26 | ) | 8.58 | 6.53 | 12,929 | 0.25 | (g) | 1.24 | (g) | 4.35 | (g) | 67 | |||||||||||||||||||||||||||||||||||||||||||||||||||
Class B | ||||||||||||||||||||||||||||||||||||||||||||||||||||||||||||||||||||||
Year ended 12/31/13 | 8.97 | (0.09 | ) | 0.14 | 0.05 | (0.18 | ) | (0.08 | ) | (0.26 | ) | 8.76 | 0.56 | 480 | 1.00 | (e) | 1.60 | (e) | (0.97 | )(e) | 16 | |||||||||||||||||||||||||||||||||||||||||||||||||
Year ended 12/31/12 | 8.77 | 0.05 | 0.43 | 0.48 | (0.17 | ) | (0.11 | ) | (0.28 | ) | 8.97 | 5.50 | 684 | 1.00 | 1.71 | 0.55 | 7 | |||||||||||||||||||||||||||||||||||||||||||||||||||||
Year ended 12/31/11 | 8.56 | 0.11 | 0.33 | 0.44 | (0.11 | ) | (0.12 | ) | (0.23 | ) | 8.77 | 5.19 | 812 | 1.00 | 1.84 | 1.20 | 15 | |||||||||||||||||||||||||||||||||||||||||||||||||||||
Year ended 12/31/10 | 8.24 | 0.30 | 0.27 | 0.57 | (0.25 | ) | — | (0.25 | ) | 8.56 | 6.95 | 301 | 1.00 | 4.20 | 3.60 | 67 | ||||||||||||||||||||||||||||||||||||||||||||||||||||||
Year ended 12/31/09 | 7.60 | 0.41 | 0.61 | 1.02 | (0.38 | ) | — | (0.38 | ) | 8.24 | 13.66 | 374 | 1.02 | 11.22 | 5.18 | 155 | ||||||||||||||||||||||||||||||||||||||||||||||||||||||
Class C | ||||||||||||||||||||||||||||||||||||||||||||||||||||||||||||||||||||||
Year ended 12/31/13 | 8.98 | (0.09 | ) | 0.13 | 0.04 | (0.18 | ) | (0.08 | ) | (0.26 | ) | 8.76 | 0.45 | 5,084 | 1.00 | (e) | 1.60 | (e) | (0.97 | )(e) | 16 | |||||||||||||||||||||||||||||||||||||||||||||||||
Year ended 12/31/12 | 8.78 | 0.05 | 0.43 | 0.48 | (0.17 | ) | (0.11 | ) | (0.28 | ) | 8.98 | 5.49 | 4,773 | 1.00 | 1.71 | 0.55 | 7 | |||||||||||||||||||||||||||||||||||||||||||||||||||||
Year ended 12/31/11 | 8.56 | 0.11 | 0.34 | 0.45 | (0.11 | ) | (0.12 | ) | (0.23 | ) | 8.78 | 5.31 | 2,416 | 1.00 | 1.84 | 1.20 | 15 | |||||||||||||||||||||||||||||||||||||||||||||||||||||
Year ended 12/31/10 | 8.23 | 0.31 | 0.27 | 0.58 | (0.25 | ) | — | (0.25 | ) | 8.56 | 7.08 | 874 | 1.00 | 4.20 | 3.60 | 67 | ||||||||||||||||||||||||||||||||||||||||||||||||||||||
Year ended 12/31/09 | 7.59 | 0.41 | 0.61 | 1.02 | (0.38 | ) | — | (0.38 | ) | 8.23 | 13.67 | 277 | 1.02 | 11.22 | 5.18 | 155 | ||||||||||||||||||||||||||||||||||||||||||||||||||||||
Class CX | ||||||||||||||||||||||||||||||||||||||||||||||||||||||||||||||||||||||
Year ended 12/31/13 | 8.97 | (0.09 | ) | 0.14 | 0.05 | (0.18 | ) | (0.08 | ) | (0.26 | ) | 8.76 | 0.56 | 3,861 | 1.00 | (e) | 1.60 | (e) | (0.97 | )(e) | 16 | |||||||||||||||||||||||||||||||||||||||||||||||||
Year ended 12/31/12 | 8.78 | 0.05 | 0.42 | 0.47 | (0.17 | ) | (0.11 | ) | (0.28 | ) | 8.97 | 5.38 | 4,667 | 1.00 | 1.71 | 0.55 | 7 | |||||||||||||||||||||||||||||||||||||||||||||||||||||
Year ended 12/31/11 | 8.56 | 0.11 | 0.34 | 0.45 | (0.11 | ) | (0.12 | ) | (0.23 | ) | 8.78 | 5.31 | 4,891 | 1.00 | 1.84 | 1.20 | 15 | |||||||||||||||||||||||||||||||||||||||||||||||||||||
Year ended 12/31/10(f) | 8.30 | 0.18 | 0.32 | 0.50 | (0.24 | ) | — | (0.24 | ) | 8.56 | 6.08 | 2,905 | 1.00 | (g) | 1.99 | (g) | 3.60 | (g) | 67 | |||||||||||||||||||||||||||||||||||||||||||||||||||
Class R | ||||||||||||||||||||||||||||||||||||||||||||||||||||||||||||||||||||||
Year ended 12/31/13 | 9.04 | (0.04 | ) | 0.14 | 0.10 | (0.18 | ) | (0.08 | ) | (0.26 | ) | 8.88 | 1.13 | 1,959 | 0.50 | (e) | 1.10 | (e) | (0.47 | )(e) | 16 | |||||||||||||||||||||||||||||||||||||||||||||||||
Year ended 12/31/12 | 8.82 | 0.10 | 0.42 | 0.52 | (0.19 | ) | (0.11 | ) | (0.30 | ) | 9.04 | 5.98 | 2,006 | 0.50 | 1.21 | 1.05 | 7 | |||||||||||||||||||||||||||||||||||||||||||||||||||||
Year ended 12/31/11 | 8.58 | 0.15 | 0.34 | 0.49 | (0.13 | ) | (0.12 | ) | (0.25 | ) | 8.82 | 5.81 | 1,774 | 0.50 | 1.34 | 1.70 | 15 | |||||||||||||||||||||||||||||||||||||||||||||||||||||
Year ended 12/31/10 | 8.24 | 0.35 | 0.26 | 0.61 | (0.27 | ) | — | (0.27 | ) | 8.58 | 7.47 | 750 | 0.50 | 3.70 | 4.10 | 67 | ||||||||||||||||||||||||||||||||||||||||||||||||||||||
Year ended 12/31/09 | 7.59 | 0.45 | 0.62 | 1.07 | (0.42 | ) | — | (0.42 | ) | 8.24 | 14.38 | 371 | 0.52 | 10.72 | 5.68 | 155 | ||||||||||||||||||||||||||||||||||||||||||||||||||||||
Class RX | ||||||||||||||||||||||||||||||||||||||||||||||||||||||||||||||||||||||
Year ended 12/31/13 | 9.04 | (0.04 | ) | 0.13 | 0.09 | (0.19 | ) | (0.08 | ) | (0.27 | ) | 8.86 | 1.03 | 295 | 0.50 | (e) | 1.10 | (e) | (0.47 | )(e) | 16 | |||||||||||||||||||||||||||||||||||||||||||||||||
Year ended 12/31/12 | 8.82 | 0.10 | 0.42 | 0.52 | (0.19 | ) | (0.11 | ) | (0.30 | ) | 9.04 | 5.98 | 497 | 0.50 | 1.21 | 1.05 | 7 | |||||||||||||||||||||||||||||||||||||||||||||||||||||
Year ended 12/31/11 | 8.58 | 0.15 | 0.34 | 0.49 | (0.13 | ) | (0.12 | ) | (0.25 | ) | 8.82 | 5.82 | 467 | 0.50 | 1.34 | 1.70 | 15 | |||||||||||||||||||||||||||||||||||||||||||||||||||||
Year ended 12/31/10(f) | 8.31 | 0.20 | 0.32 | 0.52 | (0.25 | ) | — | (0.25 | ) | 8.58 | 6.34 | 17 | 0.50 | (g) | 1.49 | (g) | 4.10 | (g) | 67 | |||||||||||||||||||||||||||||||||||||||||||||||||||
Class Y | ||||||||||||||||||||||||||||||||||||||||||||||||||||||||||||||||||||||
Year ended 12/31/13 | 9.11 | 0.00 | 0.13 | 0.13 | (0.20 | ) | (0.08 | ) | (0.28 | ) | 8.96 | 1.51 | 2,118 | 0.00 | (e) | 0.60 | (e) | 0.03 | (e) | 16 | ||||||||||||||||||||||||||||||||||||||||||||||||||
Year ended 12/31/12 | 8.86 | 0.14 | 0.44 | 0.58 | (0.22 | ) | (0.11 | ) | (0.33 | ) | 9.11 | 6.58 | 673 | 0.00 | 0.71 | 1.55 | 7 | |||||||||||||||||||||||||||||||||||||||||||||||||||||
Year ended 12/31/11 | 8.60 | 0.20 | 0.34 | 0.54 | (0.16 | ) | (0.12 | ) | (0.28 | ) | 8.86 | 6.30 | 305 | 0.00 | 0.84 | 2.20 | 15 | |||||||||||||||||||||||||||||||||||||||||||||||||||||
Year ended 12/31/10 | 8.23 | 0.39 | 0.27 | 0.66 | (0.29 | ) | — | (0.29 | ) | 8.60 | 8.13 | 136 | 0.00 | 3.20 | 4.60 | 67 | ||||||||||||||||||||||||||||||||||||||||||||||||||||||
Year ended 12/31/09 | 7.59 | 0.49 | 0.61 | 1.10 | (0.46 | ) | — | (0.46 | ) | 8.23 | 14.82 | 18 | 0.02 | 10.22 | 6.18 | 155 | ||||||||||||||||||||||||||||||||||||||||||||||||||||||
Class R5 | ||||||||||||||||||||||||||||||||||||||||||||||||||||||||||||||||||||||
Year ended 12/31/13 | 9.10 | 0.00 | 0.14 | 0.14 | (0.20 | ) | (0.08 | ) | (0.28 | ) | 8.96 | 1.63 | 7,802 | 0.00 | (e) | 0.54 | (e) | 0.03 | (e) | 16 | ||||||||||||||||||||||||||||||||||||||||||||||||||
Year ended 12/31/12 | 8.86 | 0.14 | 0.43 | 0.57 | (0.22 | ) | (0.11 | ) | (0.33 | ) | 9.10 | 6.46 | 2,935 | 0.00 | 0.66 | 1.55 | 7 | |||||||||||||||||||||||||||||||||||||||||||||||||||||
Year ended 12/31/11 | 8.59 | 0.20 | 0.35 | 0.55 | (0.16 | ) | (0.12 | ) | (0.28 | ) | 8.86 | 6.42 | 26 | 0.00 | 0.75 | 2.20 | 15 | |||||||||||||||||||||||||||||||||||||||||||||||||||||
Year ended 12/31/10 | 8.23 | 0.39 | 0.26 | 0.65 | (0.29 | ) | — | (0.29 | ) | 8.59 | 8.00 | 13 | 0.00 | 2.93 | 4.60 | 67 | ||||||||||||||||||||||||||||||||||||||||||||||||||||||
Year ended 12/31/09 | 7.59 | 0.49 | 0.61 | 1.10 | (0.46 | ) | — | (0.46 | ) | 8.23 | 14.82 | 49 | 0.02 | 9.92 | 6.18 | 155 | ||||||||||||||||||||||||||||||||||||||||||||||||||||||
Class R6 | ||||||||||||||||||||||||||||||||||||||||||||||||||||||||||||||||||||||
Year ended 12/31/13 | 9.10 | 0.00 | 0.14 | 0.14 | (0.20 | ) | (0.08 | ) | (0.28 | ) | 8.96 | 1.63 | 281 | 0.00 | (e) | 0.45 | (e) | 0.03 | (e) | 16 | ||||||||||||||||||||||||||||||||||||||||||||||||||
Year ended 12/31/12(f) | 9.38 | 0.04 | (0.02 | ) | 0.02 | (0.19 | ) | (0.11 | ) | (0.30 | ) | 9.10 | 0.30 | 10 | 0.00 | (g) | 0.62 | (g) | 1.55 | (g) | 7 | |||||||||||||||||||||||||||||||||||||||||||||||||
| (a) | Calculated using average shares outstanding. |
| (b) | Includes adjustments in accordance with accounting principles generally accepted in the United States of America and as such, the net asset value for financial reporting purposes and the returns based upon those net asset values may differ from the net asset value and returns for shareholder transactions. Does not include sales charges and is not annualized for periods less than one year, if applicable. |
| (c) | In addition to the fees and expenses which the Fund bears directly; the Fund indirectly bears a pro rata share of the fees and expenses of the underlying funds in which the Fund invests. Because the underlying funds have varied expenses and fee levels and the Fund may own different proportions at different times, the amount of fees and expenses incurred indirectly by the Fund will vary. Estimated underlying fund expenses are not expenses that are incurred directly by your Fund. They are expenses that are incurred directly by the underlying funds and are deducted from the value of the funds your Fund invests in. The effect of the estimated underlying fund expenses that you bear indirectly is included in your Fund’s total return. Estimated acquired fund fees from underlying funds were 0.54%, 0.52%, 0.59%, 0.55% and 0.63% for the years ended December 31, 2013, December 31, 2012, December 31, 2011, December 31, 2010 and December 31, 2009, respectively. |
| (d) | Portfolio turnover is calculated at the fund level and is not annualized for periods less than one year, if applicable. |
| (e) | Ratios are based on average daily net assets (000’s omitted) of $15,041, $16,505, $571, $4,935, $4,357, $2,083, $523, $997, $7,679 and $242 for Class A, Class AX, Class B, Class C, Class CX, Class R Class RX, Class Y, Class R5 and Class R6 shares, respectively. |
| (f) | Commencement date of June 1, 2010 for Class AX, Class CX and Class RX shares and September 24, 2012 for Class R6 shares, respectively. |
| (g) | Annualized. |
48 Invesco Balanced-Risk Retirement Funds
NOTE 11—Financial Highlights—(continued)
Invesco Balanced-Risk Retirement 2020 Fund
| Net asset value, beginning of period | Net investment income (loss)(a) | Net gains on securities (both realized and unrealized) | Total from investment operations | Dividends from net investment income | Distributions from net realized gains | Total distributions | Net asset value, end of period | Total return(b) | Net assets, end of period (000s omitted) | Ratio of expenses to average net assets with fee waivers and/or expense reimbursements(c) | Ratio of expenses to average net assets without fee waivers and/or expense reimbursements | Ratio of net investment income (loss) to average net assets | Portfolio turnover(d) | |||||||||||||||||||||||||||||||||||||||||||
Class A | ||||||||||||||||||||||||||||||||||||||||||||||||||||||||
Year ended 12/31/13 | $ | 9.51 | $ | (0.02 | ) | $ | 0.21 | $ | 0.19 | $ | (0.31 | ) | $ | (0.07 | ) | $ | (0.38 | ) | $ | 9.32 | 2.01 | % | $ | 51,352 | 0.25 | %(e) | 0.66 | %(e) | (0.24 | )%(e) | 16 | % | ||||||||||||||||||||||||
Year ended 12/31/12 | 9.05 | 0.22 | 0.67 | 0.89 | (0.33 | ) | (0.10 | ) | (0.43 | ) | 9.51 | 9.89 | 41,873 | 0.25 | 0.75 | 2.24 | 6 | |||||||||||||||||||||||||||||||||||||||
Year ended 12/31/11 | 8.56 | 0.23 | 0.61 | 0.84 | (0.23 | ) | (0.12 | ) | (0.35 | ) | 9.05 | 9.84 | 26,420 | 0.25 | 0.80 | 2.59 | 15 | |||||||||||||||||||||||||||||||||||||||
Year ended 12/31/10 | 7.97 | 0.55 | 0.49 | 1.04 | (0.44 | ) | (0.01 | ) | (0.45 | ) | 8.56 | 13.11 | 17,933 | 0.25 | 1.13 | 6.61 | 57 | |||||||||||||||||||||||||||||||||||||||
Year ended 12/31/09 | 6.93 | 0.62 | 0.94 | 1.56 | (0.52 | ) | — | (0.52 | ) | 7.97 | 22.49 | 11,371 | 0.30 | 2.08 | 8.23 | 185 | ||||||||||||||||||||||||||||||||||||||||
Class AX | ||||||||||||||||||||||||||||||||||||||||||||||||||||||||
Year ended 12/31/13 | 9.51 | (0.02 | ) | 0.20 | 0.18 | (0.31 | ) | (0.07 | ) | (0.38 | ) | 9.31 | 1.90 | 11,986 | 0.25 | (e) | 0.66 | (e) | (0.24 | )(e) | 16 | |||||||||||||||||||||||||||||||||||
Year ended 12/31/12 | 9.05 | 0.21 | 0.68 | 0.89 | (0.33 | ) | (0.10 | ) | (0.43 | ) | 9.51 | 9.89 | 14,125 | 0.25 | 0.75 | 2.24 | 6 | |||||||||||||||||||||||||||||||||||||||
Year ended 12/31/11 | 8.56 | 0.23 | 0.61 | 0.84 | (0.23 | ) | (0.12 | ) | (0.35 | ) | 9.05 | 9.84 | 15,291 | 0.25 | 0.80 | 2.59 | 15 | |||||||||||||||||||||||||||||||||||||||
Year ended 12/31/10(f) | 8.14 | 0.33 | 0.54 | 0.87 | (0.44 | ) | (0.01 | ) | (0.45 | ) | 8.56 | 10.75 | 21,136 | 0.25 | (g) | 0.73 | (g) | 6.61 | (g) | 57 | ||||||||||||||||||||||||||||||||||||
Class B | ||||||||||||||||||||||||||||||||||||||||||||||||||||||||
Year ended 12/31/13 | 9.40 | (0.09 | ) | 0.20 | 0.11 | (0.23 | ) | (0.07 | ) | (0.30 | ) | 9.21 | 1.19 | 2,425 | 1.00 | (e) | 1.41 | (e) | (0.99 | )(e) | 16 | |||||||||||||||||||||||||||||||||||
Year ended 12/31/12 | 8.97 | 0.14 | 0.66 | 0.80 | (0.27 | ) | (0.10 | ) | (0.37 | ) | 9.40 | 8.95 | 3,501 | 1.00 | 1.50 | 1.49 | 6 | |||||||||||||||||||||||||||||||||||||||
Year ended 12/31/11 | 8.49 | 0.16 | 0.60 | 0.76 | (0.16 | ) | (0.12 | ) | (0.28 | ) | 8.97 | 9.04 | 3,163 | 1.00 | 1.55 | 1.84 | 15 | |||||||||||||||||||||||||||||||||||||||
Year ended 12/31/10 | 7.91 | 0.49 | 0.48 | 0.97 | (0.38 | ) | (0.01 | ) | (0.39 | ) | 8.49 | 12.30 | 2,899 | 1.00 | 1.88 | 5.86 | 57 | |||||||||||||||||||||||||||||||||||||||
Year ended 12/31/09 | 6.90 | 0.56 | 0.92 | 1.48 | (0.47 | ) | — | (0.47 | ) | 7.91 | 21.45 | 1,997 | 1.05 | 2.83 | 7.48 | 185 | ||||||||||||||||||||||||||||||||||||||||
Class C | ||||||||||||||||||||||||||||||||||||||||||||||||||||||||
Year ended 12/31/13 | 9.38 | (0.09 | ) | 0.21 | 0.12 | (0.23 | ) | (0.07 | ) | (0.30 | ) | 9.20 | 1.29 | 10,108 | 1.00 | (e) | 1.41 | (e) | (0.99 | )(e) | 16 | |||||||||||||||||||||||||||||||||||
Year ended 12/31/12 | 8.95 | 0.14 | 0.66 | 0.80 | (0.27 | ) | (0.10 | ) | (0.37 | ) | 9.38 | 8.97 | 10,550 | 1.00 | 1.50 | 1.49 | 6 | |||||||||||||||||||||||||||||||||||||||
Year ended 12/31/11 | 8.47 | 0.16 | 0.60 | 0.76 | (0.16 | ) | (0.12 | ) | (0.28 | ) | 8.95 | 9.06 | 5,322 | 1.00 | 1.55 | 1.84 | 15 | |||||||||||||||||||||||||||||||||||||||
Year ended 12/31/10 | 7.90 | 0.49 | 0.47 | 0.96 | (0.38 | ) | (0.01 | ) | (0.39 | ) | 8.47 | 12.19 | 3,966 | 1.00 | 1.88 | 5.86 | 57 | |||||||||||||||||||||||||||||||||||||||
Year ended 12/31/09 | 6.88 | 0.56 | 0.93 | 1.49 | (0.47 | ) | — | (0.47 | ) | 7.90 | 21.66 | 2,125 | 1.05 | 2.83 | 7.48 | 185 | ||||||||||||||||||||||||||||||||||||||||
Class CX | ||||||||||||||||||||||||||||||||||||||||||||||||||||||||
Year ended 12/31/13 | 9.38 | (0.09 | ) | 0.21 | 0.12 | (0.23 | ) | (0.07 | ) | (0.30 | ) | 9.20 | 1.29 | 2,951 | 1.00 | (e) | 1.41 | (e) | (0.99 | )(e) | 16 | |||||||||||||||||||||||||||||||||||
Year ended 12/31/12 | 8.95 | 0.14 | 0.66 | 0.80 | (0.27 | ) | (0.10 | ) | (0.37 | ) | 9.38 | 8.97 | 3,759 | 1.00 | 1.50 | 1.49 | 6 | |||||||||||||||||||||||||||||||||||||||
Year ended 12/31/11 | 8.48 | 0.16 | 0.60 | 0.76 | (0.17 | ) | (0.12 | ) | (0.29 | ) | 8.95 | 8.93 | 3,862 | 1.00 | 1.55 | 1.84 | 15 | |||||||||||||||||||||||||||||||||||||||
Year ended 12/31/10(f) | 8.04 | 0.29 | 0.54 | 0.83 | (0.38 | ) | (0.01 | ) | (0.39 | ) | 8.48 | 10.37 | 4,543 | 1.00 | (g) | 1.48 | (g) | 5.86 | (g) | 57 | ||||||||||||||||||||||||||||||||||||
Class R | ||||||||||||||||||||||||||||||||||||||||||||||||||||||||
Year ended 12/31/13 | 9.47 | (0.05 | ) | 0.22 | 0.17 | (0.29 | ) | (0.07 | ) | (0.36 | ) | 9.28 | 1.73 | 10,375 | 0.50 | (e) | 0.91 | (e) | (0.49 | )(e) | 16 | |||||||||||||||||||||||||||||||||||
Year ended 12/31/12 | 9.02 | 0.19 | 0.67 | 0.86 | (0.31 | ) | (0.10 | ) | (0.41 | ) | 9.47 | 9.58 | 10,942 | 0.50 | 1.00 | 1.99 | 6 | |||||||||||||||||||||||||||||||||||||||
Year ended 12/31/11 | 8.54 | 0.21 | 0.60 | 0.81 | (0.21 | ) | (0.12 | ) | (0.33 | ) | 9.02 | 9.49 | 5,930 | 0.50 | 1.05 | 2.34 | 15 | |||||||||||||||||||||||||||||||||||||||
Year ended 12/31/10 | 7.95 | 0.53 | 0.49 | 1.02 | (0.42 | ) | (0.01 | ) | (0.43 | ) | 8.54 | 12.90 | 5,214 | 0.50 | 1.38 | 6.36 | 57 | |||||||||||||||||||||||||||||||||||||||
Year ended 12/31/09 | 6.92 | 0.61 | 0.92 | 1.53 | (0.50 | ) | — | (0.50 | ) | 7.95 | 22.15 | 2,542 | 0.55 | 2.33 | 7.98 | 185 | ||||||||||||||||||||||||||||||||||||||||
Class RX | ||||||||||||||||||||||||||||||||||||||||||||||||||||||||
Year ended 12/31/13 | 9.47 | (0.05 | ) | 0.22 | 0.17 | (0.29 | ) | (0.07 | ) | (0.36 | ) | 9.28 | 1.73 | 1,282 | 0.50 | (e) | 0.91 | (e) | (0.49 | )(e) | 16 | |||||||||||||||||||||||||||||||||||
Year ended 12/31/12 | 9.02 | 0.19 | 0.67 | 0.86 | (0.31 | ) | (0.10 | ) | (0.41 | ) | 9.47 | 9.58 | 1,957 | 0.50 | 1.00 | 1.99 | 6 | |||||||||||||||||||||||||||||||||||||||
Year ended 12/31/11 | 8.54 | 0.21 | 0.60 | 0.81 | (0.21 | ) | (0.12 | ) | (0.33 | ) | 9.02 | 9.49 | 1,443 | 0.50 | 1.05 | 2.34 | 15 | |||||||||||||||||||||||||||||||||||||||
Year ended 12/31/10(f) | 8.11 | 0.32 | 0.54 | 0.86 | (0.42 | ) | (0.01 | ) | (0.43 | ) | 8.54 | 10.67 | 1,328 | 0.50 | (g) | 0.98 | (g) | 6.36 | (g) | 57 | ||||||||||||||||||||||||||||||||||||
Class Y | ||||||||||||||||||||||||||||||||||||||||||||||||||||||||
Year ended 12/31/13 | 9.51 | 0.00 | 0.21 | 0.21 | (0.34 | ) | (0.07 | ) | (0.41 | ) | 9.31 | 2.16 | 8,497 | 0.00 | (e) | 0.41 | (e) | 0.01 | (e) | 16 | ||||||||||||||||||||||||||||||||||||
Year ended 12/31/12 | 9.06 | 0.24 | 0.66 | 0.90 | (0.35 | ) | (0.10 | ) | (0.45 | ) | 9.51 | 10.00 | 6,486 | 0.00 | 0.50 | 2.49 | 6 | |||||||||||||||||||||||||||||||||||||||
Year ended 12/31/11 | 8.57 | 0.25 | 0.61 | 0.86 | (0.25 | ) | (0.12 | ) | (0.37 | ) | 9.06 | 10.08 | 395 | 0.00 | 0.55 | 2.84 | 15 | |||||||||||||||||||||||||||||||||||||||
Year ended 12/31/10 | 7.97 | 0.58 | 0.49 | 1.07 | (0.46 | ) | (0.01 | ) | (0.47 | ) | 8.57 | 13.52 | 133 | 0.00 | 0.88 | 6.86 | 57 | |||||||||||||||||||||||||||||||||||||||
Year ended 12/31/09 | 6.93 | 0.63 | 0.94 | 1.57 | (0.53 | ) | — | (0.53 | ) | 7.97 | 22.70 | 16 | 0.05 | 1.83 | 8.48 | 185 | ||||||||||||||||||||||||||||||||||||||||
Class R5 | ||||||||||||||||||||||||||||||||||||||||||||||||||||||||
Year ended 12/31/13 | 9.55 | 0.00 | 0.22 | 0.22 | (0.34 | ) | (0.07 | ) | (0.41 | ) | 9.36 | 2.26 | 32,091 | 0.00 | (e) | 0.32 | (e) | 0.01 | (e) | 16 | ||||||||||||||||||||||||||||||||||||
Year ended 12/31/12 | 9.09 | 0.24 | 0.67 | 0.91 | (0.35 | ) | (0.10 | ) | (0.45 | ) | 9.55 | 10.08 | 5,839 | 0.00 | 0.42 | 2.49 | 6 | |||||||||||||||||||||||||||||||||||||||
Year ended 12/31/11 | 8.60 | 0.25 | 0.61 | 0.86 | (0.25 | ) | (0.12 | ) | (0.37 | ) | 9.09 | 10.04 | 12 | 0.00 | 0.47 | 2.84 | 15 | |||||||||||||||||||||||||||||||||||||||
Year ended 12/31/10 | 8.00 | 0.58 | 0.49 | 1.07 | (0.46 | ) | (0.01 | ) | (0.47 | ) | 8.60 | 13.47 | 12 | 0.00 | 0.72 | 6.86 | 57 | |||||||||||||||||||||||||||||||||||||||
Year ended 12/31/09 | 6.95 | 0.64 | 0.94 | 1.58 | (0.53 | ) | — | (0.53 | ) | 8.00 | 22.79 | 11 | 0.07 | 1.68 | 8.46 | 185 | ||||||||||||||||||||||||||||||||||||||||
Class R6 | ||||||||||||||||||||||||||||||||||||||||||||||||||||||||
Year ended 12/31/13 | 9.56 | 0.00 | 0.22 | 0.22 | (0.34 | ) | (0.07 | ) | (0.41 | ) | 9.37 | 2.25 | 901 | 0.00 | (e) | 0.23 | (e) | 0.01 | (e) | 16 | ||||||||||||||||||||||||||||||||||||
Year ended 12/31/12(f) | 9.96 | 0.07 | (0.02 | ) | 0.05 | (0.35 | ) | (0.10 | ) | (0.45 | ) | 9.56 | 0.57 | 10 | 0.00 | (g) | 0.30 | (g) | 2.49 | (g) | 6 | |||||||||||||||||||||||||||||||||||
| (a) | Calculated using average shares outstanding. |
| (b) | Includes adjustments in accordance with accounting principles generally accepted in the United States of America and as such, the net asset value for financial reporting purposes and the returns based upon those net asset values may differ from the net asset value and returns for shareholder transactions. Does not include sales charges and is not annualized for periods less than one year, if applicable. |
| (c) | In addition to the fees and expenses which the Fund bears directly; the Fund indirectly bears a pro rata share of the fees and expenses of the underlying funds in which the Fund invests. Because the underlying funds have varied expenses and fee levels and the Fund may own different proportions at different times, the amount of fees and expenses incurred indirectly by the Fund will vary. Estimated underlying fund expenses are not expenses that are incurred directly by your Fund. They are expenses that are incurred directly by the underlying funds and are deducted from the value of the funds your Fund invests in. The effect of the estimated underlying fund expenses that you bear indirectly is included in your Fund’s total return. Estimated acquired fund fees from underlying funds were 0.71%, 0.71%, 0.85%, 0.79% and 0.74% for the years ended December 31, 2013, December 31, 2012, December 31, 2011, December 31, 2010 and December 31, 2009, respectively. |
| (d) | Portfolio turnover is calculated at the fund level and is not annualized for periods less than one year, if applicable. |
| (e) | Ratios are based on average daily net assets (000’s omitted) of $50,250, $13,091, $3,126, $10,767, $3,475, $11,802, $1889, $6,867, $31,676 and $745 for Class A, Class AX, Class B, Class C, Class CX, Class R Class RX, Class Y, Class R5 and Class R6 shares, respectively. |
| (f) | Commencement date of June 1, 2010 for Class AX, CX and RX shares and September 24, 2012 for Class R6 shares, respectively. |
| (g) | Annualized. |
49 Invesco Balanced-Risk Retirement Funds
NOTE 11—Financial Highlights—(continued)
Invesco Balanced-Risk Retirement 2030 Fund
| Net asset value, beginning of period | Net investment income (loss)(a) | Net gains on securities (both realized and unrealized) | Total from investment operations | Dividends from net investment income | Distributions from net realized gains | Total distributions | Net asset value, end of period | Total return(b) | Net assets, end of period (000s omitted) | Ratio of expenses to average net assets with fee waivers and/or expense reimbursements(c) | Ratio of and/or expense | Ratio of net investment income (loss) to average net assets | Portfolio turnover(d) | |||||||||||||||||||||||||||||||||||||||||||||||||||||||||
Class A | ||||||||||||||||||||||||||||||||||||||||||||||||||||||||||||||||||||||
Year ended 12/31/13 | $ | 9.23 | $ | (0.02 | ) | $ | 0.23 | $ | 0.21 | $ | (0.32 | ) | $ | (0.08 | ) | $ | (0.40 | ) | $ | 9.04 | 2.28 | % | $ | 51,749 | 0.25 | %(e) | 0.68 | %(e) | (0.25 | )%(e) | 34 | % | ||||||||||||||||||||||||||||||||||||||
Year ended 12/31/12 | 8.72 | 0.25 | 0.67 | 0.92 | (0.36 | ) | (0.05 | ) | (0.41 | ) | 9.23 | 10.55 | 38,142 | 0.25 | 0.76 | 2.66 | 3 | |||||||||||||||||||||||||||||||||||||||||||||||||||||
Year ended 12/31/11 | 8.14 | 0.25 | 0.57 | 0.82 | (0.23 | ) | (0.01 | ) | (0.24 | ) | 8.72 | 10.16 | 22,508 | 0.25 | 0.95 | 2.89 | 9 | |||||||||||||||||||||||||||||||||||||||||||||||||||||
Year ended 12/31/10 | 7.58 | 0.53 | 0.45 | 0.98 | (0.42 | ) | — | (0.42 | ) | 8.14 | 13.06 | 13,983 | 0.25 | 1.32 | 6.63 | 32 | ||||||||||||||||||||||||||||||||||||||||||||||||||||||
Year ended 12/31/09 | 6.33 | 0.57 | 1.12 | 1.69 | (0.44 | ) | — | (0.44 | ) | 7.58 | 26.76 | 8,346 | 0.33 | 2.40 | 8.05 | 201 | ||||||||||||||||||||||||||||||||||||||||||||||||||||||
Class AX | ||||||||||||||||||||||||||||||||||||||||||||||||||||||||||||||||||||||
Year ended 12/31/13 | 9.23 | (0.02 | ) | 0.23 | 0.21 | (0.32 | ) | (0.08 | ) | (0.40 | ) | 9.04 | 2.27 | 8,353 | 0.25 | (e) | 0.68 | (e) | (0.25 | )(e) | 34 | |||||||||||||||||||||||||||||||||||||||||||||||||
Year ended 12/31/12 | 8.72 | 0.25 | 0.67 | 0.92 | (0.36 | ) | (0.05 | ) | (0.41 | ) | 9.23 | 10.55 | 10,273 | 0.25 | 0.76 | 2.66 | 3 | |||||||||||||||||||||||||||||||||||||||||||||||||||||
Year ended 12/31/11 | 8.14 | 0.25 | 0.57 | 0.82 | (0.23 | ) | (0.01 | ) | (0.24 | ) | 8.72 | 10.16 | 10,834 | 0.25 | 0.95 | 2.89 | 9 | |||||||||||||||||||||||||||||||||||||||||||||||||||||
Year ended 12/31/10(f) | 7.73 | 0.32 | 0.51 | 0.83 | (0.42 | ) | — | (0.42 | ) | 8.14 | 10.86 | 13,388 | 0.25 | (g) | 0.92 | (g) | 6.63 | (g) | 32 | |||||||||||||||||||||||||||||||||||||||||||||||||||
Class B | ||||||||||||||||||||||||||||||||||||||||||||||||||||||||||||||||||||||
Year ended 12/31/13 | 9.14 | (0.09 | ) | 0.23 | 0.14 | (0.25 | ) | (0.08 | ) | (0.33 | ) | 8.95 | 1.52 | 2,759 | 1.00 | (e) | 1.43 | (e) | (1.00 | )(e) | 34 | |||||||||||||||||||||||||||||||||||||||||||||||||
Year ended 12/31/12 | 8.65 | 0.18 | 0.66 | 0.84 | (0.30 | ) | (0.05 | ) | (0.35 | ) | 9.14 | 9.70 | 3,507 | 1.00 | 1.51 | 1.91 | 3 | |||||||||||||||||||||||||||||||||||||||||||||||||||||
Year ended 12/31/11 | 8.08 | 0.18 | 0.57 | 0.75 | (0.17 | ) | (0.01 | ) | (0.18 | ) | 8.65 | 9.36 | 3,068 | 1.00 | 1.70 | 2.14 | 9 | |||||||||||||||||||||||||||||||||||||||||||||||||||||
Year ended 12/31/10 | 7.54 | 0.46 | 0.44 | 0.90 | (0.36 | ) | — | (0.36 | ) | 8.08 | 12.08 | 3,223 | 1.00 | 2.07 | 5.88 | 32 | ||||||||||||||||||||||||||||||||||||||||||||||||||||||
Year ended 12/31/09 | 6.31 | 0.51 | 1.12 | 1.63 | (0.40 | ) | — | (0.40 | ) | 7.54 | 25.86 | 2,424 | 1.08 | 3.15 | 7.30 | 201 | ||||||||||||||||||||||||||||||||||||||||||||||||||||||
Class C | ||||||||||||||||||||||||||||||||||||||||||||||||||||||||||||||||||||||
Year ended 12/31/13 | 9.13 | (0.09 | ) | 0.24 | 0.15 | (0.25 | ) | (0.08 | ) | (0.33 | ) | 8.95 | 1.64 | 12,050 | 1.00 | (e) | 1.43 | (e) | (1.00 | )(e) | 34 | |||||||||||||||||||||||||||||||||||||||||||||||||
Year ended 12/31/12 | 8.64 | 0.18 | 0.66 | 0.84 | (0.30 | ) | (0.05 | ) | (0.35 | ) | 9.13 | 9.71 | 10,976 | 1.00 | 1.51 | 1.91 | 3 | |||||||||||||||||||||||||||||||||||||||||||||||||||||
Year ended 12/31/11 | 8.07 | 0.18 | 0.57 | 0.75 | (0.17 | ) | (0.01 | ) | (0.18 | ) | 8.64 | 9.37 | 6,107 | 1.00 | 1.70 | 2.14 | 9 | |||||||||||||||||||||||||||||||||||||||||||||||||||||
Year ended 12/31/10 | 7.54 | 0.46 | 0.43 | 0.89 | (0.36 | ) | — | (0.36 | ) | 8.07 | 11.95 | 3,550 | 1.00 | 2.07 | 5.88 | 32 | ||||||||||||||||||||||||||||||||||||||||||||||||||||||
Year ended 12/31/09 | 6.31 | 0.52 | 1.11 | 1.63 | (0.40 | ) | — | (0.40 | ) | 7.54 | 25.86 | 2,164 | 1.08 | 3.15 | 7.30 | 201 | ||||||||||||||||||||||||||||||||||||||||||||||||||||||
Class CX | ||||||||||||||||||||||||||||||||||||||||||||||||||||||||||||||||||||||
Year ended 12/31/13 | 9.13 | (0.09 | ) | 0.24 | 0.15 | (0.25 | ) | (0.08 | ) | (0.33 | ) | 8.95 | 1.64 | 1,821 | 1.00 | (e) | 1.43 | (e) | (1.00 | )(e) | 34 | |||||||||||||||||||||||||||||||||||||||||||||||||
Year ended 12/31/12 | 8.64 | 0.17 | 0.67 | 0.84 | (0.30 | ) | (0.05 | ) | (0.35 | ) | 9.13 | 9.71 | 2,017 | 1.00 | 1.51 | 1.91 | 3 | |||||||||||||||||||||||||||||||||||||||||||||||||||||
Year ended 12/31/11 | 8.07 | 0.18 | 0.57 | 0.75 | (0.17 | ) | (0.01 | ) | (0.18 | ) | 8.64 | 9.37 | 1,883 | 1.00 | 1.70 | 2.14 | 9 | |||||||||||||||||||||||||||||||||||||||||||||||||||||
Year ended 12/31/10(f) | 7.65 | 0.28 | 0.50 | 0.78 | (0.36 | ) | — | (0.36 | ) | 8.07 | 10.34 | 2,989 | 1.00 | (g) | 1.67 | (g) | 5.88 | (g) | 32 | |||||||||||||||||||||||||||||||||||||||||||||||||||
Class R | ||||||||||||||||||||||||||||||||||||||||||||||||||||||||||||||||||||||
Year ended 12/31/13 | 9.18 | (0.05 | ) | 0.24 | 0.19 | (0.30 | ) | (0.08 | ) | (0.38 | ) | 8.99 | 2.03 | 13,007 | 0.50 | (e) | 0.93 | (e) | (0.50 | )(e) | 34 | |||||||||||||||||||||||||||||||||||||||||||||||||
Year ended 12/31/12 | 8.68 | 0.22 | 0.67 | 0.89 | (0.34 | ) | (0.05 | ) | (0.39 | ) | 9.18 | 10.25 | 12,296 | 0.50 | 1.01 | 2.41 | 3 | |||||||||||||||||||||||||||||||||||||||||||||||||||||
Year ended 12/31/11 | 8.11 | 0.22 | 0.57 | 0.79 | (0.21 | ) | (0.01 | ) | (0.22 | ) | 8.68 | 9.83 | 7,636 | 0.50 | 1.20 | 2.64 | 9 | |||||||||||||||||||||||||||||||||||||||||||||||||||||
Year ended 12/31/10 | 7.56 | 0.51 | 0.44 | 0.95 | (0.40 | ) | — | (0.40 | ) | 8.11 | 12.71 | 6,707 | 0.50 | 1.57 | 6.38 | 32 | ||||||||||||||||||||||||||||||||||||||||||||||||||||||
Year ended 12/31/09 | 6.31 | 0.56 | 1.12 | 1.68 | (0.43 | ) | — | (0.43 | ) | 7.56 | 26.64 | 3,934 | 0.58 | 2.65 | 7.80 | 201 | ||||||||||||||||||||||||||||||||||||||||||||||||||||||
Class RX | ||||||||||||||||||||||||||||||||||||||||||||||||||||||||||||||||||||||
Year ended 12/31/13 | 9.18 | (0.05 | ) | 0.24 | 0.19 | (0.30 | ) | (0.08 | ) | (0.38 | ) | 8.99 | 2.04 | 1,119 | 0.50 | (e) | 0.93 | (e) | (0.50 | )(e) | 34 | |||||||||||||||||||||||||||||||||||||||||||||||||
Year ended 12/31/12 | 8.68 | 0.22 | 0.67 | 0.89 | (0.34 | ) | (0.05 | ) | (0.39 | ) | 9.18 | 10.26 | 1,177 | 0.50 | 1.01 | 2.41 | 3 | |||||||||||||||||||||||||||||||||||||||||||||||||||||
Year ended 12/31/11 | 8.10 | 0.22 | 0.58 | 0.80 | (0.21 | ) | (0.01 | ) | (0.22 | ) | 8.68 | 9.97 | 848 | 0.50 | 1.20 | 2.64 | 9 | |||||||||||||||||||||||||||||||||||||||||||||||||||||
Year ended 12/31/10(f) | 7.69 | 0.30 | 0.51 | 0.81 | (0.40 | ) | — | (0.40 | ) | 8.10 | 10.68 | 696 | 0.50 | (g) | 1.17 | (g) | 6.38 | (g) | 32 | |||||||||||||||||||||||||||||||||||||||||||||||||||
Class Y | ||||||||||||||||||||||||||||||||||||||||||||||||||||||||||||||||||||||
Year ended 12/31/13 | 9.25 | 0.00 | 0.23 | 0.23 | (0.34 | ) | (0.08 | ) | (0.42 | ) | 9.06 | 2.52 | 5,406 | 0.00 | (e) | 0.43 | (e) | 0.00 | (e) | 34 | ||||||||||||||||||||||||||||||||||||||||||||||||||
Year ended 12/31/12 | 8.73 | 0.27 | 0.68 | 0.95 | (0.38 | ) | (0.05 | ) | (0.43 | ) | 9.25 | 10.88 | 4,077 | 0.00 | 0.51 | 2.91 | 3 | |||||||||||||||||||||||||||||||||||||||||||||||||||||
Year ended 12/31/11 | 8.15 | 0.27 | 0.57 | 0.84 | (0.25 | ) | (0.01 | ) | (0.26 | ) | 8.73 | 10.40 | 2,403 | 0.00 | 0.70 | 3.14 | 9 | |||||||||||||||||||||||||||||||||||||||||||||||||||||
Year ended 12/31/10 | 7.59 | 0.55 | 0.45 | 1.00 | (0.44 | ) | — | (0.44 | ) | 8.15 | 13.30 | 1,112 | 0.00 | 1.07 | 6.88 | 32 | ||||||||||||||||||||||||||||||||||||||||||||||||||||||
Year ended 12/31/09 | 6.33 | 0.60 | 1.12 | 1.72 | (0.46 | ) | — | (0.46 | ) | 7.59 | 27.13 | 221 | 0.08 | 2.15 | 8.30 | 201 | ||||||||||||||||||||||||||||||||||||||||||||||||||||||
Class R5 | ||||||||||||||||||||||||||||||||||||||||||||||||||||||||||||||||||||||
Year ended 12/31/13 | 9.27 | 0.00 | 0.23 | 0.23 | (0.34 | ) | (0.08 | ) | (0.42 | ) | 9.08 | 2.52 | 35,104 | 0.00 | (e) | 0.33 | (e) | 0.00 | (e) | 34 | ||||||||||||||||||||||||||||||||||||||||||||||||||
Year ended 12/31/12 | 8.75 | 0.27 | 0.68 | 0.95 | (0.38 | ) | (0.05 | ) | (0.43 | ) | 9.27 | 10.86 | 18,476 | 0.00 | 0.40 | 2.91 | 3 | |||||||||||||||||||||||||||||||||||||||||||||||||||||
Year ended 12/31/11 | 8.17 | 0.27 | 0.57 | 0.84 | (0.25 | ) | (0.01 | ) | (0.26 | ) | 8.75 | 10.37 | 12 | 0.00 | 0.51 | 3.14 | 9 | |||||||||||||||||||||||||||||||||||||||||||||||||||||
Year ended 12/31/10 | 7.60 | 0.55 | 0.46 | 1.01 | (0.44 | ) | — | (0.44 | ) | 8.17 | 13.43 | 18 | 0.00 | 0.91 | 6.88 | 32 | ||||||||||||||||||||||||||||||||||||||||||||||||||||||
Year ended 12/31/09 | 6.34 | 0.58 | 1.14 | 1.72 | (0.46 | ) | — | (0.46 | ) | 7.60 | 27.10 | 10 | 0.09 | 1.90 | 8.29 | 201 | ||||||||||||||||||||||||||||||||||||||||||||||||||||||
Class R6 | ||||||||||||||||||||||||||||||||||||||||||||||||||||||||||||||||||||||
Year ended 12/31/13 | 9.27 | 0.00 | 0.23 | 0.23 | (0.34 | ) | (0.08 | ) | (0.42 | ) | 9.08 | 2.52 | 905 | 0.00 | (e) | 0.24 | (e) | 0.00 | (e) | 34 | ||||||||||||||||||||||||||||||||||||||||||||||||||
Year ended 12/31/12(f) | 9.65 | 0.07 | (0.02 | ) | 0.05 | (0.38 | ) | (0.05 | ) | (0.43 | ) | 9.27 | 0.52 | 10 | 0.00 | (g) | 0.32 | (g) | 2.91 | (g) | 3 | |||||||||||||||||||||||||||||||||||||||||||||||||
| (a) | Calculated using average shares outstanding. |
| (b) | Includes adjustments in accordance with accounting principles generally accepted in the United States of America and as such, the net asset value for financial reporting purposes and the returns based upon those net asset values may differ from the net asset value and returns for shareholder transactions. Does not include sales charges and is not annualized for periods less than one year, if applicable. |
| (c) | In addition to the fees and expenses which the Fund bears directly; the Fund indirectly bears a pro rata share of the fees and expenses of the underlying funds in which the Fund invests. Because the underlying funds have varied expenses and fee levels and the Fund may own different proportions at different times, the amount of fees and expenses incurred indirectly by the Fund will vary. Estimated underlying fund expenses are not expenses that are incurred directly by your Fund. They are expenses that are incurred directly by the underlying funds and are deducted from the value of the funds your Fund invests in. The effect of the estimated underlying fund expenses that you bear indirectly is included in your Fund’s total return. Estimated acquired fund fees from underlying funds were 0.87%, 0.85%, 0.87%, 0.79% and 0.78% for the years ended December 31, 2013, December 31, 2012, December 31, 2011, December 31, 2010 and December 31, 2009, respectively. |
| (d) | Portfolio turnover is calculated at the fund level and is not annualized for periods less than one year, if applicable. |
| (e) | Ratios are based on average daily net assets (000’s omitted) of $48,211, $9,589, $3,196, $11,711, $1,930, $13,208, $1,363, $3,870, $37,326 and $667 for Class A, Class AX, Class B, Class C, Class CX, Class R Class RX, Class Y, Class R5 and Class R6 shares, respectively. |
| (f) | Commencement date of June 1, 2010 for Class AX, Class CX and Class RX shares and September 24, 2012 for Class R6 shares, respectively. |
| (g) | Annualized. |
50 Invesco Balanced-Risk Retirement Funds
NOTE 11—Financial Highlights—(continued)
Invesco Balanced-Risk Retirement 2040 Fund
| Net asset value, beginning of period | Net investment income (loss)(a) | Net gains on securities (both realized and unrealized) | Total from investment operations | Dividends from net investment income | Distributions from net realized gains | Total distributions | Net asset value, end of period | Total return(b) | Net assets, end of period (000s omitted) | Ratio of expenses to average net assets with fee waivers and/or expense reimbursements(c) | Ratio of expenses to average net assets without fee waivers and/or expense reimbursements | Ratio of net investment income (loss) to average net assets | Portfolio turnover(d) | |||||||||||||||||||||||||||||||||||||||||||
Class A | ||||||||||||||||||||||||||||||||||||||||||||||||||||||||
Year ended 12/31/13 | $ | 8.76 | $ | (0.02 | ) | $ | 0.21 | $ | 0.19 | $ | (0.22 | ) | $ | (0.39 | ) | $ | (0.61 | ) | $ | 8.34 | 2.23 | % | $ | 33,816 | 0.25 | %(e) | 0.87 | %(e) | (0.25 | )%(e) | 68 | % | ||||||||||||||||||||||||
Year ended 12/31/12 | 8.23 | 0.24 | 0.62 | 0.86 | (0.33 | ) | — | (0.33 | ) | 8.76 | 10.38 | 28,426 | 0.25 | 1.07 | 2.69 | 4 | ||||||||||||||||||||||||||||||||||||||||
Year ended 12/31/11 | 7.79 | 0.23 | 0.57 | 0.80 | (0.36 | ) | — | (0.36 | ) | 8.23 | 10.30 | 13,484 | 0.25 | 1.52 | 2.88 | 14 | ||||||||||||||||||||||||||||||||||||||||
Year ended 12/31/10 | 7.36 | 0.53 | 0.42 | 0.95 | (0.25 | ) | (0.27 | ) | (0.52 | ) | 7.79 | 13.03 | 8,727 | 0.25 | 1.94 | 6.79 | 26 | |||||||||||||||||||||||||||||||||||||||
Year ended 12/31/09 | 6.09 | 0.53 | 1.15 | 1.68 | (0.41 | ) | — | (0.41 | ) | 7.36 | 27.59 | 4,605 | 0.33 | 4.14 | 7.69 | 214 | ||||||||||||||||||||||||||||||||||||||||
Class AX | ||||||||||||||||||||||||||||||||||||||||||||||||||||||||
Year ended 12/31/13 | 8.75 | (0.02 | ) | 0.22 | 0.20 | (0.22 | ) | (0.39 | ) | (0.61 | ) | 8.34 | 2.34 | 3,493 | 0.25 | (e) | 0.87 | (e) | (0.25 | )(e) | 68 | |||||||||||||||||||||||||||||||||||
Year ended 12/31/12 | 8.22 | 0.23 | 0.63 | 0.86 | (0.33 | ) | — | (0.33 | ) | 8.75 | 10.51 | 3,999 | 0.25 | 1.07 | 2.69 | 4 | ||||||||||||||||||||||||||||||||||||||||
Year ended 12/31/11 | 7.79 | 0.23 | 0.56 | 0.79 | (0.36 | ) | — | (0.36 | ) | 8.22 | 10.17 | 4,087 | 0.25 | 1.52 | 2.88 | 14 | ||||||||||||||||||||||||||||||||||||||||
Year ended 12/31/10(f) | 7.50 | 0.31 | 0.50 | 0.81 | (0.25 | ) | (0.27 | ) | (0.52 | ) | 7.79 | 10.92 | 6,212 | 0.25 | (g) | 1.42 | (g) | 6.79 | (g) | 26 | ||||||||||||||||||||||||||||||||||||
Class B | ||||||||||||||||||||||||||||||||||||||||||||||||||||||||
Year ended 12/31/13 | 8.67 | (0.09 | ) | 0.22 | 0.13 | (0.15 | ) | (0.39 | ) | (0.54 | ) | 8.26 | 1.54 | 1,109 | 1.00 | (e) | 1.62 | (e) | (1.00 | )(e) | 68 | |||||||||||||||||||||||||||||||||||
Year ended 12/31/12 | 8.15 | 0.17 | 0.63 | 0.80 | (0.28 | ) | — | (0.28 | ) | 8.67 | 9.79 | 1,263 | 1.00 | 1.82 | 1.94 | 4 | ||||||||||||||||||||||||||||||||||||||||
Year ended 12/31/11 | 7.73 | 0.17 | 0.55 | 0.72 | (0.30 | ) | — | (0.30 | ) | 8.15 | 9.37 | 1,289 | 1.00 | 2.27 | 2.13 | 14 | ||||||||||||||||||||||||||||||||||||||||
Year ended 12/31/10 | 7.32 | 0.46 | 0.41 | 0.87 | (0.19 | ) | (0.27 | ) | (0.46 | ) | 7.73 | 12.08 | 1,115 | 1.00 | 2.69 | 6.04 | 26 | |||||||||||||||||||||||||||||||||||||||
Year ended 12/31/09 | 6.06 | 0.47 | 1.16 | 1.63 | (0.37 | ) | — | (0.37 | ) | 7.32 | 26.90 | 773 | 1.08 | 4.89 | 6.94 | 214 | ||||||||||||||||||||||||||||||||||||||||
Class C | ||||||||||||||||||||||||||||||||||||||||||||||||||||||||
Year ended 12/31/13 | 8.66 | (0.09 | ) | 0.22 | 0.13 | (0.15 | ) | (0.39 | ) | (0.54 | ) | 8.25 | 1.54 | 5,999 | 1.00 | (e) | 1.62 | (e) | (1.00 | )(e) | 68 | |||||||||||||||||||||||||||||||||||
Year ended 12/31/12 | 8.14 | 0.17 | 0.63 | 0.80 | (0.28 | ) | — | (0.28 | ) | 8.66 | 9.81 | 6,377 | 1.00 | 1.82 | 1.94 | 4 | ||||||||||||||||||||||||||||||||||||||||
Year ended 12/31/11 | 7.73 | 0.17 | 0.54 | 0.71 | (0.30 | ) | — | (0.30 | ) | 8.14 | 9.24 | 3,468 | 1.00 | 2.27 | 2.13 | 14 | ||||||||||||||||||||||||||||||||||||||||
Year ended 12/31/10 | 7.31 | 0.46 | 0.42 | 0.88 | (0.19 | ) | (0.27 | ) | (0.46 | ) | 7.73 | 12.24 | 2,136 | 1.00 | 2.69 | 6.04 | 26 | |||||||||||||||||||||||||||||||||||||||
Year ended 12/31/09 | 6.06 | 0.47 | 1.15 | 1.62 | (0.37 | ) | — | (0.37 | ) | 7.31 | 26.72 | 1,387 | 1.08 | 4.89 | 6.94 | 214 | ||||||||||||||||||||||||||||||||||||||||
Class CX | ||||||||||||||||||||||||||||||||||||||||||||||||||||||||
Year ended 12/31/13 | 8.65 | (0.09 | ) | 0.22 | 0.13 | (0.15 | ) | (0.39 | ) | (0.54 | ) | 8.24 | 1.54 | 563 | 1.00 | (e) | 1.62 | (e) | (1.00 | )(e) | 68 | |||||||||||||||||||||||||||||||||||
Year ended 12/31/12 | 8.14 | 0.17 | 0.62 | 0.79 | (0.28 | ) | — | (0.28 | ) | 8.65 | 9.68 | 590 | 1.00 | 1.82 | 1.94 | 4 | ||||||||||||||||||||||||||||||||||||||||
Year ended 12/31/11 | 7.72 | 0.17 | 0.55 | 0.72 | (0.30 | ) | — | (0.30 | ) | 8.14 | 9.38 | 595 | 1.00 | 2.27 | 2.13 | 14 | ||||||||||||||||||||||||||||||||||||||||
Year ended 12/31/10(f) | 7.42 | 0.28 | 0.48 | 0.76 | (0.19 | ) | (0.27 | ) | (0.46 | ) | 7.72 | 10.44 | 747 | 1.00 | (g) | 2.17 | (g) | 6.04 | (g) | 26 | ||||||||||||||||||||||||||||||||||||
Class R | ||||||||||||||||||||||||||||||||||||||||||||||||||||||||
Year ended 12/31/13 | 8.72 | (0.04 | ) | 0.21 | 0.17 | (0.20 | ) | (0.39 | ) | (0.59 | ) | 8.30 | 1.97 | 8,644 | 0.50 | (e) | 1.12 | (e) | (0.50 | )(e) | 68 | |||||||||||||||||||||||||||||||||||
Year ended 12/31/12 | 8.19 | 0.21 | 0.63 | 0.84 | (0.31 | ) | — | (0.31 | ) | 8.72 | 10.33 | 8,197 | 0.50 | 1.32 | 2.44 | 4 | ||||||||||||||||||||||||||||||||||||||||
Year ended 12/31/11 | 7.77 | 0.21 | 0.55 | 0.76 | (0.34 | ) | — | (0.34 | ) | 8.19 | 9.81 | 3,692 | 0.50 | 1.77 | 2.63 | 14 | ||||||||||||||||||||||||||||||||||||||||
Year ended 12/31/10 | 7.34 | 0.51 | 0.42 | 0.93 | (0.23 | ) | (0.27 | ) | (0.50 | ) | 7.77 | 12.83 | 3,536 | 0.50 | 2.19 | 6.54 | 26 | |||||||||||||||||||||||||||||||||||||||
Year ended 12/31/09 | 6.07 | 0.52 | 1.15 | 1.67 | (0.40 | ) | — | (0.40 | ) | 7.34 | 27.47 | 1,840 | 0.58 | 4.39 | 7.44 | 214 | ||||||||||||||||||||||||||||||||||||||||
Class RX | ||||||||||||||||||||||||||||||||||||||||||||||||||||||||
Year ended 12/31/13 | 8.72 | (0.04 | ) | 0.22 | 0.18 | (0.20 | ) | (0.39 | ) | (0.59 | ) | 8.31 | 2.08 | 614 | 0.50 | (e) | 1.12 | (e) | (0.50 | )(e) | 68 | |||||||||||||||||||||||||||||||||||
Year ended 12/31/12 | 8.20 | 0.21 | 0.62 | 0.83 | (0.31 | ) | — | (0.31 | ) | 8.72 | 10.19 | 781 | 0.50 | 1.32 | 2.44 | 4 | ||||||||||||||||||||||||||||||||||||||||
Year ended 12/31/11 | 7.76 | 0.21 | 0.57 | 0.78 | (0.34 | ) | — | (0.34 | ) | 8.20 | 10.08 | 631 | 0.50 | 1.77 | 2.63 | 14 | ||||||||||||||||||||||||||||||||||||||||
Year ended 12/31/10(f) | 7.47 | 0.30 | 0.49 | 0.79 | (0.23 | ) | (0.27 | ) | (0.50 | ) | 7.76 | 10.73 | 570 | 0.50 | (g) | 1.67 | (g) | 6.54 | (g) | 26 | ||||||||||||||||||||||||||||||||||||
Class Y | ||||||||||||||||||||||||||||||||||||||||||||||||||||||||
Year ended 12/31/13 | 8.78 | 0.00 | 0.21 | 0.21 | (0.24 | ) | (0.39 | ) | (0.63 | ) | 8.36 | 2.49 | 2,716 | 0.00 | (e) | 0.62 | (e) | 0.00 | (e) | 68 | ||||||||||||||||||||||||||||||||||||
Year ended 12/31/12 | 8.24 | 0.26 | 0.63 | 0.89 | (0.35 | ) | — | (0.35 | ) | 8.78 | 10.83 | 1,967 | 0.00 | 0.82 | 2.94 | 4 | ||||||||||||||||||||||||||||||||||||||||
Year ended 12/31/11 | 7.81 | 0.25 | 0.56 | 0.81 | (0.38 | ) | — | (0.38 | ) | 8.24 | 10.39 | 190 | 0.00 | 1.27 | 3.13 | 14 | ||||||||||||||||||||||||||||||||||||||||
Year ended 12/31/10 | 7.37 | 0.55 | 0.43 | 0.98 | (0.27 | ) | (0.27 | ) | (0.54 | ) | 7.81 | 13.42 | 398 | 0.00 | 1.69 | 7.04 | 26 | |||||||||||||||||||||||||||||||||||||||
Year ended 12/31/09 | 6.09 | 0.56 | 1.14 | 1.70 | (0.42 | ) | — | (0.42 | ) | 7.37 | 27.96 | 75 | 0.08 | 3.89 | 7.94 | 214 | ||||||||||||||||||||||||||||||||||||||||
Class R5 | ||||||||||||||||||||||||||||||||||||||||||||||||||||||||
Year ended 12/31/13 | 8.78 | 0.00 | 0.22 | 0.22 | (0.24 | ) | (0.39 | ) | (0.63 | ) | 8.37 | 2.60 | 21,149 | 0.00 | (e) | 0.47 | (e) | 0.00 | (e) | 68 | ||||||||||||||||||||||||||||||||||||
Year ended 12/31/12 | 8.25 | 0.26 | 0.62 | 0.88 | (0.35 | ) | — | (0.35 | ) | 8.78 | 10.69 | 6,079 | 0.00 | 0.65 | 2.94 | 4 | ||||||||||||||||||||||||||||||||||||||||
Year ended 12/31/11 | 7.81 | 0.25 | 0.57 | 0.82 | (0.38 | ) | — | (0.38 | ) | 8.25 | 10.52 | 13 | 0.00 | 1.02 | 3.13 | 14 | ||||||||||||||||||||||||||||||||||||||||
Year ended 12/31/10 | 7.38 | 0.55 | 0.42 | 0.97 | (0.27 | ) | (0.27 | ) | (0.54 | ) | 7.81 | 13.25 | 12 | 0.00 | 1.38 | 7.04 | 26 | |||||||||||||||||||||||||||||||||||||||
Year ended 12/31/09 | 6.09 | 0.53 | 1.18 | 1.71 | (0.42 | ) | — | (0.42 | ) | 7.38 | 28.13 | 11 | 0.08 | 3.49 | 7.94 | 214 | ||||||||||||||||||||||||||||||||||||||||
Class R6 | ||||||||||||||||||||||||||||||||||||||||||||||||||||||||
Year ended 12/31/13 | 8.78 | 0.00 | 0.22 | 0.22 | (0.24 | ) | (0.39 | ) | (0.63 | ) | 8.37 | 2.60 | 970 | 0.00 | (e) | 0.37 | (e) | 0.00 | (e) | 68 | ||||||||||||||||||||||||||||||||||||
Year ended 12/31/12(f) | 9.09 | 0.07 | (0.03 | ) | 0.04 | (0.35 | ) | — | (0.35 | ) | 8.78 | 0.46 | 10 | 0.00 | (g) | 0.53 | (g) | 2.94 | (g) | 4 | ||||||||||||||||||||||||||||||||||||
| (a) | Calculated using average shares outstanding. |
| (b) | Includes adjustments in accordance with accounting principles generally accepted in the United States of America and as such, the net asset value for financial reporting purposes and the returns based upon those net asset values may differ from the net asset value and returns for shareholder transactions. Does not include sales charges and is not annualized for periods less than one year, if applicable. |
| (c) | In addition to the fees and expenses which the Fund bears directly; the Fund indirectly bears a pro rata share of the fees and expenses of the underlying funds in which the Fund invests. Because the underlying funds have varied expenses and fee levels and the Fund may own different proportions at different times, the amount of fees and expenses incurred indirectly by the Fund will vary. Estimated underlying fund expenses are not expenses that are incurred directly by your Fund. They are expenses that are incurred directly by the underlying funds and are deducted from the value of the funds your Fund invests in. The effect of the estimated underlying fund expenses that you bear indirectly is included in your Fund’s total return. Estimated acquired fund fees from underlying funds were 0.99%, 0.98%, 0.87%, 0.79%, and 0.81% for the years ended December 31, 2013, December 31, 2012, December 31, 2011, December 31, 2010, and December 31, 2009, respectively. |
| (d) | Portfolio turnover is calculated at the fund level and is not annualized for periods less than one year, if applicable. |
| (e) | Ratios are based on average daily net assets (000’s omitted) of $34,932, $3,766, $1,187, $6,460, $552, $8,738, $872, $2,063, $19,735 and $779 for Class A, Class AX, Class B, Class C, Class CX, Class R Class RX, Class Y, Class R5 and Class R6 shares, respectively. |
| (f) | Commencement date of June 1, 2010 for Class AX, Class CX and Class RX shares and September 24, 2012 for Class R6 shares, respectively. |
| (g) | Annualized. |
51 Invesco Balanced-Risk Retirement Funds
NOTE 11—Financial Highlights—(continued)
Invesco Balanced-Risk Retirement 2050 Fund
| Net asset value, beginning of period | Net investment income (loss)(a) | Net gains on securities (both realized and unrealized) | Total from investment operations | Dividends from net investment income | Distributions from net realized gains | Total distributions | Net asset value, end of period | Total return(b) | Net assets, end of period (000s omitted) | Ratio of expenses to average net assets with fee waivers and/or expense reimbursements(c) | Ratio of expenses to average net assets without fee waivers and/or expense reimbursements | Ratio of net investment income (loss) to average net assets | Portfolio turnover(d) | |||||||||||||||||||||||||||||||||||||||||||
Class A | ||||||||||||||||||||||||||||||||||||||||||||||||||||||||
Year ended 12/31/13 | $ | 8.68 | $ | (0.02 | ) | $ | 0.22 | $ | 0.20 | $ | (0.20 | ) | $ | (0.47 | ) | $ | (0.67 | ) | $ | 8.21 | 2.42 | % | $ | 13,570 | 0.25 | %(e) | 1.31 | %(e) | (0.25 | )%(e) | 93 | % | ||||||||||||||||||||||||
Year ended 12/31/12 | 8.20 | 0.23 | 0.63 | 0.86 | (0.35 | ) | (0.03 | ) | (0.38 | ) | 8.68 | 10.47 | 12,933 | 0.25 | 1.57 | 2.62 | 4 | |||||||||||||||||||||||||||||||||||||||
Year ended 12/31/11 | 7.62 | 0.27 | 0.50 | 0.77 | (0.19 | ) | — | (0.19 | ) | 8.20 | 10.16 | 7,586 | 0.25 | 3.01 | 3.34 | 22 | ||||||||||||||||||||||||||||||||||||||||
Year ended 12/31/10 | 7.13 | 0.48 | 0.44 | 0.92 | (0.43 | ) | — | (0.43 | ) | 7.62 | 13.08 | 3,693 | 0.25 | 3.63 | 6.42 | 27 | ||||||||||||||||||||||||||||||||||||||||
Year ended 12/31/09 | 5.87 | 0.45 | 1.19 | 1.64 | (0.38 | ) | — | (0.38 | ) | 7.13 | 27.92 | 2,533 | 0.32 | 7.20 | 6.87 | 214 | ||||||||||||||||||||||||||||||||||||||||
Class AX | ||||||||||||||||||||||||||||||||||||||||||||||||||||||||
Year ended 12/31/13 | 8.69 | (0.02 | ) | 0.21 | 0.19 | (0.20 | ) | (0.47 | ) | (0.67 | ) | 8.21 | 2.30 | 1,230 | 0.25 | (e) | 1.31 | (e) | (0.25 | )(e) | 93 | |||||||||||||||||||||||||||||||||||
Year ended 12/31/12 | 8.20 | 0.23 | 0.64 | 0.87 | (0.35 | ) | (0.03 | ) | (0.38 | ) | 8.69 | 10.59 | 1,258 | 0.25 | 1.57 | 2.62 | 4 | |||||||||||||||||||||||||||||||||||||||
Year ended 12/31/11 | 7.62 | 0.27 | 0.50 | 0.77 | (0.19 | ) | — | (0.19 | ) | 8.20 | 10.16 | 1,430 | 0.25 | 3.01 | 3.34 | 22 | ||||||||||||||||||||||||||||||||||||||||
Year ended 12/31/10(f) | 7.27 | 0.29 | 0.49 | 0.78 | (0.43 | ) | — | (0.43 | ) | 7.62 | 10.91 | 1,793 | 0.25 | (g) | 2.97 | (g) | 6.42 | (g) | 27 | |||||||||||||||||||||||||||||||||||||
Class B | ||||||||||||||||||||||||||||||||||||||||||||||||||||||||
Year ended 12/31/13 | 8.57 | (0.09 | ) | 0.22 | 0.13 | (0.13 | ) | (0.47 | ) | (0.60 | ) | 8.10 | 1.65 | 393 | 1.00 | (e) | 2.06 | (e) | (1.00 | )(e) | 93 | |||||||||||||||||||||||||||||||||||
Year ended 12/31/12 | 8.11 | 0.16 | 0.63 | 0.79 | (0.30 | ) | (0.03 | ) | (0.33 | ) | 8.57 | 9.68 | 473 | 1.00 | 2.32 | 1.86 | 4 | |||||||||||||||||||||||||||||||||||||||
Year ended 12/31/11 | 7.55 | 0.20 | 0.51 | 0.71 | (0.15 | ) | — | (0.15 | ) | 8.11 | 9.39 | 478 | 1.00 | 3.76 | 2.59 | 22 | ||||||||||||||||||||||||||||||||||||||||
Year ended 12/31/10 | 7.08 | 0.42 | 0.43 | 0.85 | (0.38 | ) | — | (0.38 | ) | 7.55 | 12.13 | 489 | 1.00 | 4.38 | 5.67 | 27 | ||||||||||||||||||||||||||||||||||||||||
Year ended 12/31/09 | 5.84 | 0.40 | 1.18 | 1.58 | (0.34 | ) | — | (0.34 | ) | 7.08 | 27.02 | 432 | 1.07 | 7.95 | 6.12 | 214 | ||||||||||||||||||||||||||||||||||||||||
Class C | ||||||||||||||||||||||||||||||||||||||||||||||||||||||||
Year ended 12/31/13 | 8.59 | (0.09 | ) | 0.22 | 0.13 | (0.13 | ) | (0.47 | ) | (0.60 | ) | 8.12 | 1.65 | 3,924 | 1.00 | (e) | 2.06 | (e) | (1.00 | )(e) | 93 | |||||||||||||||||||||||||||||||||||
Year ended 12/31/12 | 8.13 | 0.16 | 0.63 | 0.79 | (0.30 | ) | (0.03 | ) | (0.33 | ) | 8.59 | 9.66 | 3,975 | 1.00 | 2.32 | 1.87 | 4 | |||||||||||||||||||||||||||||||||||||||
Year ended 12/31/11 | 7.57 | 0.20 | 0.51 | 0.71 | (0.15 | ) | — | (0.15 | ) | 8.13 | 9.36 | 1,872 | 1.00 | 3.76 | 2.59 | 22 | ||||||||||||||||||||||||||||||||||||||||
Year ended 12/31/10 | 7.09 | 0.42 | 0.44 | 0.86 | (0.38 | ) | — | (0.38 | ) | 7.57 | 12.26 | 709 | 1.00 | 4.38 | 5.67 | 27 | ||||||||||||||||||||||||||||||||||||||||
Year ended 12/31/09 | 5.85 | 0.40 | 1.18 | 1.58 | (0.34 | ) | — | (0.34 | ) | 7.09 | 26.97 | 487 | 1.07 | 7.95 | 6.12 | 214 | ||||||||||||||||||||||||||||||||||||||||
Class CX | ||||||||||||||||||||||||||||||||||||||||||||||||||||||||
Year ended 12/31/13 | 8.58 | (0.09 | ) | 0.22 | 0.13 | (0.13 | ) | (0.47 | ) | (0.60 | ) | 8.11 | 1.65 | 134 | 1.00 | (e) | 2.06 | (e) | (1.00 | )(e) | 93 | |||||||||||||||||||||||||||||||||||
Year ended 12/31/12 | 8.12 | 0.16 | 0.63 | 0.79 | (0.30 | ) | (0.03 | ) | (0.33 | ) | 8.58 | 9.67 | 128 | 1.00 | 2.32 | 1.87 | 4 | |||||||||||||||||||||||||||||||||||||||
Year ended 12/31/11 | 7.56 | 0.20 | 0.51 | 0.71 | (0.15 | ) | — | (0.15 | ) | 8.12 | 9.37 | 99 | 1.00 | 3.76 | 2.59 | 22 | ||||||||||||||||||||||||||||||||||||||||
Year ended 12/31/10(f) | 7.20 | 0.25 | 0.49 | 0.74 | (0.38 | ) | — | (0.38 | ) | 7.56 | 10.40 | 335 | 1.00 | (g) | 3.72 | (g) | 5.67 | (g) | 27 | |||||||||||||||||||||||||||||||||||||
Class R | ||||||||||||||||||||||||||||||||||||||||||||||||||||||||
Year ended 12/31/13 | 8.64 | (0.04 | ) | 0.22 | 0.18 | (0.18 | ) | (0.47 | ) | (0.65 | ) | 8.17 | 2.18 | 4,887 | 0.50 | (e) | 1.56 | (e) | (0.50 | )(e) | 93 | |||||||||||||||||||||||||||||||||||
Year ended 12/31/12 | 8.17 | 0.21 | �� | 0.62 | 0.83 | (0.33 | ) | (0.03 | ) | (0.36 | ) | 8.64 | 10.17 | 3,846 | 0.50 | 1.82 | 2.37 | 4 | ||||||||||||||||||||||||||||||||||||||
Year ended 12/31/11 | 7.59 | 0.24 | 0.51 | 0.75 | (0.17 | ) | — | (0.17 | ) | 8.17 | 9.98 | 1,930 | 0.50 | 3.26 | 3.09 | 22 | ||||||||||||||||||||||||||||||||||||||||
Year ended 12/31/10 | 7.11 | 0.46 | 0.43 | 0.89 | (0.41 | ) | — | (0.41 | ) | 7.59 | 12.74 | 1,708 | 0.50 | 3.88 | 6.17 | 27 | ||||||||||||||||||||||||||||||||||||||||
Year ended 12/31/09 | 5.85 | 0.44 | 1.18 | 1.62 | (0.36 | ) | — | (0.36 | ) | 7.11 | 27.80 | 969 | 0.57 | 7.45 | 6.62 | 214 | ||||||||||||||||||||||||||||||||||||||||
Class RX | ||||||||||||||||||||||||||||||||||||||||||||||||||||||||
Year ended 12/31/13 | 8.65 | (0.04 | ) | 0.21 | 0.17 | (0.18 | ) | (0.47 | ) | (0.65 | ) | 8.17 | 2.06 | 255 | 0.50 | (e) | 1.56 | (e) | (0.50 | )(e) | 93 | |||||||||||||||||||||||||||||||||||
Year ended 12/31/12 | 8.17 | 0.21 | 0.63 | 0.84 | (0.33 | ) | (0.03 | ) | (0.36 | ) | 8.65 | 10.30 | 205 | 0.50 | 1.82 | 2.37 | 4 | |||||||||||||||||||||||||||||||||||||||
Year ended 12/31/11 | 7.60 | 0.24 | 0.50 | 0.74 | (0.17 | ) | — | (0.17 | ) | 8.17 | 9.84 | 146 | 0.50 | 3.26 | 3.09 | 22 | ||||||||||||||||||||||||||||||||||||||||
Year ended 12/31/10(f) | 7.24 | 0.27 | 0.51 | 0.78 | (0.42 | ) | — | (0.42 | ) | 7.60 | 10.85 | 135 | 0.50 | (g) | 3.22 | (g) | 6.17 | (g) | 27 | |||||||||||||||||||||||||||||||||||||
Class Y | ||||||||||||||||||||||||||||||||||||||||||||||||||||||||
Year ended 12/31/13 | 8.69 | 0.00 | 0.22 | 0.22 | (0.22 | ) | (0.47 | ) | (0.69 | ) | 8.22 | 2.68 | 1,941 | 0.00 | (e) | 1.06 | (e) | 0.00 | (e) | 93 | ||||||||||||||||||||||||||||||||||||
Year ended 12/31/12 | 8.21 | 0.25 | 0.63 | 0.88 | (0.37 | ) | (0.03 | ) | (0.40 | ) | 8.69 | 10.68 | 1,336 | 0.00 | 1.32 | 2.87 | 4 | |||||||||||||||||||||||||||||||||||||||
Year ended 12/31/11 | 7.63 | 0.29 | 0.50 | 0.79 | (0.21 | ) | — | (0.21 | ) | 8.21 | 10.36 | 482 | 0.00 | 2.76 | 3.59 | 22 | ||||||||||||||||||||||||||||||||||||||||
Year ended 12/31/10 | 7.14 | 0.51 | 0.43 | 0.94 | (0.45 | ) | — | (0.45 | ) | 7.63 | 13.33 | 196 | 0.00 | 3.38 | 6.67 | 27 | ||||||||||||||||||||||||||||||||||||||||
Year ended 12/31/09 | 5.87 | 0.47 | 1.19 | 1.66 | (0.39 | ) | — | (0.39 | ) | 7.14 | 28.32 | 51 | 0.07 | 6.95 | 7.12 | 214 | ||||||||||||||||||||||||||||||||||||||||
Class R5 | ||||||||||||||||||||||||||||||||||||||||||||||||||||||||
Year ended 12/31/13 | 8.70 | 0.00 | 0.22 | 0.22 | (0.22 | ) | (0.47 | ) | (0.69 | ) | 8.23 | 2.68 | 14,065 | 0.00 | (e) | 0.81 | (e) | 0.00 | (e) | 93 | ||||||||||||||||||||||||||||||||||||
Year ended 12/31/12 | 8.21 | 0.25 | 0.64 | 0.89 | (0.37 | ) | (0.03 | ) | (0.40 | ) | 8.70 | 10.80 | 5,747 | 0.00 | 1.08 | 2.87 | 4 | |||||||||||||||||||||||||||||||||||||||
Year ended 12/31/11 | 7.62 | 0.29 | 0.51 | 0.80 | (0.21 | ) | — | (0.21 | ) | 8.21 | 10.50 | 11 | 0.00 | 2.36 | 3.59 | 22 | ||||||||||||||||||||||||||||||||||||||||
Year ended 12/31/10 | 7.14 | 0.50 | 0.43 | 0.93 | (0.45 | ) | — | (0.45 | ) | 7.62 | 13.18 | 10 | 0.00 | 3.03 | 6.67 | 27 | ||||||||||||||||||||||||||||||||||||||||
Year ended 12/31/09 | 5.87 | 0.44 | 1.22 | 1.66 | (0.39 | ) | — | (0.39 | ) | 7.14 | 28.32 | 21 | 0.06 | 6.36 | 7.13 | 214 | ||||||||||||||||||||||||||||||||||||||||
Class R6 | ||||||||||||||||||||||||||||||||||||||||||||||||||||||||
Year ended 12/31/13 | 8.71 | 0.00 | 0.22 | 0.22 | (0.22 | ) | (0.47 | ) | (0.69 | ) | 8.24 | 2.67 | 290 | 0.00 | (e) | 0.72 | (e) | 0.00 | (e) | 93 | ||||||||||||||||||||||||||||||||||||
Year ended 12/31/12(f) | 9.06 | 0.07 | (0.02 | ) | 0.05 | (0.37 | ) | (0.03 | ) | (0.40 | ) | 8.71 | 0.52 | 10 | 0.00 | (g) | 0.99 | (g) | 2.87 | (g) | 4 | |||||||||||||||||||||||||||||||||||
| (a) | Calculated using average shares outstanding. |
| (b) | Includes adjustments in accordance with accounting principles generally accepted in the United States of America and as such, the net asset value for financial reporting purposes and the returns based upon those net asset values may differ from the net asset value and returns for shareholder transactions. Does not include sales charges and is not annualized for periods less than one year, if applicable. |
| (c) | In addition to the fees and expenses which the Fund bears directly; the Fund indirectly bears a pro rata share of the fees and expenses of the underlying funds in which the Fund invests. Because the underlying funds have varied expenses and fee levels and the Fund may own different proportions at different times, the amount of fees and expenses incurred indirectly by the Fund will vary. Estimated underlying fund expenses are not expenses that are incurred directly by your Fund. They are expenses that are incurred directly by the underlying funds and are deducted from the value of the funds your Fund invests in. The effect of the estimated underlying fund expenses that you bear indirectly is included in your Fund’s total return. Estimated acquired fund fees from underlying funds were 1.11%, 1.11%, 0.87%, 0.79% and 0.82% the years ended December 31, 2013, December 31, 2012, December 31, 2011, December 31, 2010 and December 31, 2009, respectively. |
| (d) | Portfolio turnover is calculated at the fund level and is not annualized for periods less than one year, if applicable. |
| (e) | Ratios are based on average daily net assets (000’s) of $14,809, $1,262, $461, $4,087, $132, $4,473, $232, $1,878, $12,095 and $212 for Class A, Class AX, Class B, Class C, Class CX, Class R Class RX, Class Y, Class R5 and Class R6 shares, respectively. |
| (f) | Commencement date of June 1, 2010 for Class AX, Class CX and RX shares and September 24, 2012 for Class R6 shares, respectively. |
| (g) | Annualized. |
52 Invesco Balanced-Risk Retirement Funds
Report of Independent Registered Public Accounting Firm
To the Board of Trustees of AIM Growth Series (Invesco Growth Series)
and Shareholders of Invesco Balanced-Risk Retirement Now Fund,
Invesco Balanced-Risk Retirement 2020 Fund,
Invesco Balanced-Risk Retirement 2030 Fund,
Invesco Balanced-Risk Retirement 2040 Fund,
and Invesco Balanced-Risk Retirement 2050 Fund:
In our opinion, the accompanying statements of assets and liabilities, including the schedules of investments, and the related statements of operations and of changes in net assets and the financial highlights present fairly, in all material respects, the financial position of Invesco Balanced-Risk Retirement Now Fund, Invesco Balanced-Risk Retirement 2020 Fund, Invesco Balanced-Risk Retirement 2030 Fund, Invesco Balanced-Risk Retirement 2040 Fund and Invesco Balanced-Risk Retirement 2050 Fund (five of the funds constituting AIM Growth Series (Invesco Growth Series), hereafter referred to as the “Funds”) at December 31, 2013, the results of each of their operations for the year then ended, the changes in each of their net assets for each of the two years in the period then ended and each of their financial highlights for each of the five years in the period then ended, in conformity with accounting principles generally accepted in the United States of America. These financial statements and financial highlights (hereafter referred to as “financial statements”) are the responsibility of the Funds’ management; our responsibility is to express an opinion on these financial statements based on our audits. We conducted our audits of these financial statements in accordance with the standards of the Public Company Accounting Oversight Board (United States). Those standards require that we plan and perform the audit to obtain reasonable assurance about whether the financial statements are free of material misstatement. An audit includes examining, on a test basis, evidence supporting the amounts and disclosures in the financial statements, assessing the accounting principles used and significant estimates made by management, and evaluating the overall financial statement presentation. We believe that our audits, which included confirmation of securities at December 31, 2013 by correspondence with the custodian and transfer agent, provide a reasonable basis for our opinion.
PRICEWATERHOUSECOOPERS LLP
February 26, 2014
Houston, Texas
53 Invesco Balanced-Risk Retirement Funds
Calculating your ongoing Fund expenses
Example
As a shareholder of the Fund, you incur two types of costs: (1) transaction costs, which may include sales charges (loads) on purchase payments or contingent deferred sales charges on redemptions, if any; and (2) ongoing costs, including distribution and/or service (12b-1) fees, and other Fund expenses. This example is intended to help you understand your ongoing costs (in dollars) of investing in the Fund and to compare these costs with ongoing costs of investing in other mutual funds. The example is based on an investment of $1,000 invested at the beginning of the period and held for the entire period July 1, 2013, through December 31, 2013.
In addition to the fees and expenses which the Fund bears directly, the Fund indirectly bears a pro rata share of the fees and expenses of the underlying funds in which your Fund invests. The amount of fees and expenses incurred indirectly by your Fund will vary because the underlying funds have varied expenses and fee levels and the Fund may own different proportions of the underlying funds at different times. Estimated underlying fund expenses are not expenses that are incurred directly by your Fund. They are expenses that are incurred directly by the underlying funds and are deducted from the value of the underlying funds your Fund invests in. The effect of the estimated underlying fund expenses that you bear indirectly are included in your Fund’s total return.
Actual expenses
The table below provides information about actual account values and actual expenses. You may use the information in this table, together with the amount you invested, to estimate the expenses that you paid over the period. Simply divide your account value by $1,000 (for example, an $8,600 account value divided by $1,000 = 8.6), then multiply the result by the number in the table under the heading entitled “Actual Expenses Paid During Period” to estimate the expenses you paid on your account during this period.
Hypothetical example for comparison purposes
The table below also provides information about hypothetical account values and hypothetical expenses based on the Fund’s actual expense ratio and an assumed rate of return of 5% per year before expenses, which is not the Fund’s actual return.
The hypothetical account values and expenses may not be used to estimate the actual ending account balance or expenses you paid for the period. You may use this information to compare the ongoing costs of investing in the Fund and other funds. To do so, compare this 5% hypothetical example with the 5% hypothetical examples that appear in the shareholder reports of the other funds.
Please note that the expenses shown in the table are meant to highlight your ongoing costs only and do not reflect any transaction costs, such as sales charges (loads) on purchase payments or contingent deferred sales charges on redemptions, if any. Therefore, the hypothetical information is useful in comparing ongoing costs only, and will not help you determine the relative total costs of owning different funds. In addition, expenses shown in the table do not include the expenses of the underlying funds, which are borne indirectly by the Fund. If transaction costs and indirect expenses were included, your costs would have been higher.
Invesco Balanced-Risk Retirement Now Fund
| Class | Beginning Account Value (07/01/13) | ACTUAL | HYPOTHETICAL (5% annual return before expenses) | Annualized Expense Ratio | ||||||||||||||||||||
| Ending Account Value (12/31/13)1 | Expenses Paid During Period2 | Ending Account Value (12/31/13) | Expenses Paid During Period2 | |||||||||||||||||||||
A | $ | 1,000.00 | $ | 1,032.60 | $ | 1.28 | $ | 1,023.95 | $ | 1.28 | 0.25 | % | ||||||||||||
AX | 1,000.00 | 1,032.70 | 1.28 | 1,023.95 | 1.28 | 0.25 | ||||||||||||||||||
B | 1,000.00 | 1,028.50 | 5.11 | 1,020.16 | 5.09 | 1.00 | ||||||||||||||||||
C | 1,000.00 | 1,028.60 | 5.11 | 1,020.16 | 5.09 | 1.00 | ||||||||||||||||||
CX | 1,000.00 | 1,028.60 | 5.11 | 1,020.16 | 5.09 | 1.00 | ||||||||||||||||||
R | 1,000.00 | 1,031.90 | 2.56 | 1,022.68 | 2.55 | 0.50 | ||||||||||||||||||
RX | 1,000.00 | 1,030.80 | 2.56 | 1,022.68 | 2.55 | 0.50 | ||||||||||||||||||
Y | 1,000.00 | 1,033.30 | 0.00 | 1,025.21 | 0.00 | 0.00 | ||||||||||||||||||
R5 | 1,000.00 | 1,034.50 | 0.00 | 1,025.21 | 0.00 | 0.00 | ||||||||||||||||||
R6 | 1,000.00 | 1,034.40 | 0.00 | 1,025.21 | 0.00 | 0.00 | ||||||||||||||||||
54 Invesco Balanced-Risk Retirement Funds
Invesco Balanced-Risk Retirement 2020 Fund
| Class | Beginning Account Value (07/01/13) | ACTUAL | HYPOTHETICAL (5% annual return before expenses) | Annualized Expense Ratio | ||||||||||||||||||||
| Ending Account Value (12/31/13)1 | Expenses Paid During Period2 | Ending Account Value (12/31/13) | Expenses Paid During Period2 | |||||||||||||||||||||
A | $ | 1,000.00 | $ | 1,048.80 | $ | 1.29 | $ | 1,023.95 | $ | 1.28 | 0.25 | % | ||||||||||||
AX | 1,000.00 | 1,047.60 | 1.29 | 1,023.95 | 1.28 | 0.25 | ||||||||||||||||||
B | 1,000.00 | 1,042.90 | 5.15 | 1,020.16 | 5.09 | 1.00 | ||||||||||||||||||
C | 1,000.00 | 1,044.10 | 5.15 | 1,020.16 | 5.09 | 1.00 | ||||||||||||||||||
CX | 1,000.00 | 1,044.10 | 5.15 | 1,020.16 | 5.09 | 1.00 | ||||||||||||||||||
R | 1,000.00 | 1,047.20 | 2.58 | 1,022.68 | 2.55 | 0.50 | ||||||||||||||||||
RX | 1,000.00 | 1,047.20 | 2.58 | 1,022.68 | 2.55 | 0.50 | ||||||||||||||||||
Y | 1,000.00 | 1,048.00 | 0.00 | 1,025.21 | 0.00 | 0.00 | ||||||||||||||||||
R5 | 1,000.00 | 1,048.90 | 0.00 | 1,025.21 | 0.00 | 0.00 | ||||||||||||||||||
R6 | 1,000.00 | 1,048.90 | 0.00 | 1,025.21 | 0.00 | 0.00 | ||||||||||||||||||
Invesco Balanced-Risk Retirement 2030 Fund
| Class | Beginning Account Value (07/01/13) | ACTUAL | HYPOTHETICAL (5% annual return before expenses) | Annualized Expense Ratio | ||||||||||||||||||||
| Ending Account Value (12/31/13)1 | Expenses Paid During Period2 | Ending Account Value (12/31/13) | Expenses Paid During Period2 | |||||||||||||||||||||
A | $ | 1,000.00 | $ | 1,060.70 | $ | 1.30 | $ | 1,023.95 | $ | 1.28 | 0.25 | % | ||||||||||||
AX | 1,000.00 | 1,060.70 | 1.30 | 1,023.95 | 1.28 | 0.25 | ||||||||||||||||||
B | 1,000.00 | 1,055.60 | 5.18 | 1,020.16 | 5.09 | 1.00 | ||||||||||||||||||
C | 1,000.00 | 1,056.90 | 5.18 | 1,020.16 | 5.09 | 1.00 | ||||||||||||||||||
CX | 1,000.00 | 1,058.10 | 5.19 | 1,020.16 | 5.09 | 1.00 | ||||||||||||||||||
R | 1,000.00 | 1,059.60 | 2.60 | 1,022.68 | 2.55 | 0.50 | ||||||||||||||||||
RX | 1,000.00 | 1,059.60 | 2.60 | 1,022.68 | 2.55 | 0.50 | ||||||||||||||||||
Y | 1,000.00 | 1,062.00 | 0.00 | 1,025.21 | 0.00 | 0.00 | ||||||||||||||||||
R5 | 1,000.00 | 1,061.80 | 0.00 | 1,025.21 | 0.00 | 0.00 | ||||||||||||||||||
R6 | 1,000.00 | 1,061.80 | 0.00 | 1,025.21 | 0.00 | 0.00 | ||||||||||||||||||
Invesco Balanced-Risk Retirement 2040 Fund
| Class | Beginning Account Value (07/01/13) | ACTUAL | HYPOTHETICAL (5% annual return before expenses) | Annualized Expense Ratio | ||||||||||||||||||||
| Ending Account Value (12/31/13)1 | Expenses Paid During Period2 | Ending Account Value (12/31/13) | Expenses Paid During Period2 | |||||||||||||||||||||
A | $ | 1,000.00 | $ | 1,068.60 | $ | 1.30 | $ | 1,023.95 | $ | 1.28 | 0.25 | % | ||||||||||||
AX | 1,000.00 | 1,069.90 | 1.30 | 1,023.95 | 1.28 | 0.25 | ||||||||||||||||||
B | 1,000.00 | 1,065.80 | 5.21 | 1,020.16 | 5.09 | 1.00 | ||||||||||||||||||
C | 1,000.00 | 1,065.90 | 5.21 | 1,020.16 | 5.09 | 1.00 | ||||||||||||||||||
CX | 1,000.00 | 1,066.00 | 5.21 | 1,020.16 | 5.09 | 1.00 | ||||||||||||||||||
R | 1,000.00 | 1,067.40 | 2.61 | 1,022.68 | 2.55 | 0.50 | ||||||||||||||||||
RX | 1,000.00 | 1,068.60 | 2.61 | 1,022.68 | 2.55 | 0.50 | ||||||||||||||||||
Y | 1,000.00 | 1,070.00 | 0.00 | 1,025.21 | 0.00 | 0.00 | ||||||||||||||||||
R5 | 1,000.00 | 1,069.90 | 0.00 | 1,025.21 | 0.00 | 0.00 | ||||||||||||||||||
R6 | 1,000.00 | 1,071.20 | 0.00 | 1,025.21 | 0.00 | 0.00 | ||||||||||||||||||
55 Invesco Balanced-Risk Retirement Funds
Invesco Balanced-Risk Retirement 2050 Fund
| Class | Beginning Account Value (07/01/13) | ACTUAL | HYPOTHETICAL (5% annual return before expenses) | Annualized Expense Ratio | ||||||||||||||||||||
| Ending Account Value (12/31/13)1 | Expenses Paid During Period2 | Ending Account Value (12/31/13) | Expenses Paid During Period2 | |||||||||||||||||||||
A | $ | 1,000.00 | $ | 1,078.90 | $ | 1.31 | $ | 1,023.95 | $ | 1.28 | 0.25 | % | ||||||||||||
AX | 1,000.00 | 1,078.90 | 1.31 | 1,023.95 | 1.28 | 0.25 | ||||||||||||||||||
B | 1,000.00 | 1,074.20 | 5.23 | 1,020.16 | 5.09 | 1.00 | ||||||||||||||||||
C | 1,000.00 | 1,075.30 | 5.23 | 1,020.16 | 5.09 | 1.00 | ||||||||||||||||||
CX | 1,000.00 | 1,074.10 | 5.23 | 1,020.16 | 5.09 | 1.00 | ||||||||||||||||||
R | 1,000.00 | 1,077.90 | 2.62 | 1,022.68 | 2.55 | 0.50 | ||||||||||||||||||
RX | 1,000.00 | 1,076.60 | 2.62 | 1,022.68 | 2.55 | 0.50 | ||||||||||||||||||
Y | 1,000.00 | 1,080.20 | 0.00 | 1,025.21 | 0.00 | 0.00 | ||||||||||||||||||
R5 | 1,000.00 | 1,080.10 | 0.00 | 1,025.21 | 0.00 | 0.00 | ||||||||||||||||||
R6 | 1,000.00 | 1,080.00 | 0.00 | 1,025.21 | 0.00 | 0.00 | ||||||||||||||||||
| 1 | The actual ending account value is based on the actual total return of the Funds for the period July 1, 2013, through December 31, 2013, after actual expenses and will differ from the hypothetical ending account value which is based on each Fund’s expense ratio and a hypothetical annual return of 5% before expenses. |
| 2 | Expenses are equal to each Fund’s annualized expense ratio as indicated above multiplied by the average account value over the period, multiplied by 184/365 to reflect the most recent fiscal half year. |
56 Invesco Balanced-Risk Retirement Funds
Tax Information
Form 1099-DIV, Form 1042-S and other year–end tax information provide shareholders with actual calendar year amounts that should be included in their tax returns. Shareholders should consult their tax advisors.
The following distribution information is being provided as required by the Internal Revenue Code or to meet a specific state’s requirement.
The Funds designate the following amounts or, if subsequently determined to be different, the maximum amount allowable for its fiscal year ended December 31, 2013:
Federal and State Income Tax | ||||||||||||||||
| Long Term Capital Gain Distributions | Qualified Dividend Income* | Corporate Dividends Received Deduction* | U.S. Treasury Obligations* | |||||||||||||
Invesco Balanced-Risk Retirement Now Fund | $ | 489,291 | 0.00 | % | 0.00 | % | 0.74 | % | ||||||||
Invesco Balanced-Risk Retirement 2020 Fund | 906,957 | 0.00 | % | 0.00 | % | 0.74 | % | |||||||||
Invesco Balanced-Risk Retirement 2030 Fund | 1,054,522 | 0.00 | % | 0.00 | % | 0.87 | % | |||||||||
Invesco Balanced-Risk Retirement 2040 Fund | 3,401,479 | 0.00 | % | 0.00 | % | 1.11 | % | |||||||||
Invesco Balanced-Risk Retirement 2050 Fund | 2,198,292 | 0.00 | % | 0.00 | % | 1.39 | % | |||||||||
| * | The above percentages are based on ordinary income dividends paid to shareholders during the Fund’s fiscal year. |
Non-Resident Alien Shareholders | ||||
| Qualified Short-Term Gains | ||||
Invesco Balanced-Risk Retirement Now Fund | $ | 108 | ||
Invesco Balanced-Risk Retirement 2020 Fund | — | |||
Invesco Balanced-Risk Retirement 2030 Fund | 10,235 | |||
Invesco Balanced-Risk Retirement 2040 Fund | — | |||
Invesco Balanced-Risk Retirement 2050 Fund | — | |||
57 Invesco Balanced-Risk Retirement Funds
Trustees and Officers
The address of each trustee and officer is AIM Growth Series (Invesco Growth Series) (the “Trust”), 11 Greenway Plaza, Suite 1000, Houston, Texas 77046-1173. The trustees serve for the life of the Trust, subject to their earlier death, incapacitation, resignation, retirement or removal as more specifically provided in the Trust’s organizational documents. Each officer serves for a one year term or until their successors are elected and qualified. Column two below includes length of time served with predecessor entities, if any.
| Name, Year of Birth and Position(s) Held with the Trust | Trustee and/ or Officer Since | Principal Occupation(s) During Past 5 Years | Number of Funds in Fund Complex Overseen by Trustee | Other Directorship(s) Held by Trustee During Past 5 Years | ||||
| Interested Persons | ||||||||
| Martin L. Flanagan1 — 1960 Trustee | 2007 | Executive Director, Chief Executive Officer and President, Invesco Ltd. (ultimate parent of Invesco and a global investment management firm); Advisor to the Board, Invesco Advisers, Inc. (formerly known as Invesco Institutional (N.A.), Inc.); Trustee, The Invesco Funds; Vice Chair, Investment Company Institute; and Member of Executive Board, SMU Cox School of Business
Formerly: Chairman and Chief Executive Officer, Invesco Advisers, Inc. (registered investment adviser); Director, Chairman, Chief Executive Officer and President, IVZ Inc. (holding company), INVESCO Group Services, Inc. (service provider) and Invesco North American Holdings, Inc. (holding company); Director, Chief Executive Officer and President, Invesco Holding Company Limited (parent of Invesco and a global investment management firm); Director, Invesco Ltd.; Chairman, Investment Company Institute and President, Co-Chief Executive Officer, Co-President, Chief Operating Officer and Chief Financial Officer, Franklin Resources, Inc. (global investment management organization) | 123 | None | ||||
| Philip A. Taylor2 — 1954 Trustee, President and Principal Executive Officer | 2006 | Head of North American Retail and Senior Managing Director, Invesco Ltd.; Director, Co-Chairman, Co-President and Co-Chief Executive Officer, Invesco Advisers, Inc. (formerly known as Invesco Institutional (N.A.), Inc.) (registered investment adviser); Director, Chairman, Chief Executive Officer and President, Invesco Management Group, Inc. (formerly known as Invesco Aim Management Group, Inc.) (financial services holding company); Director and President, INVESCO Funds Group, Inc. (registered investment adviser and registered transfer agent); Director and Chairman, Invesco Investment Services, Inc. (formerly known as Invesco Aim Investment Services, Inc.) (registered transfer agent) and IVZ Distributors, Inc. (formerly known as INVESCO Distributors, Inc.) (registered broker dealer); Director, President and Chairman, Invesco Inc. (holding company) and Invesco Canada Holdings Inc. (holding company); Chief Executive Officer, Invesco Corporate Class Inc. (corporate mutual fund company) and Invesco Canada Fund Inc. (corporate mutual fund company); Director, Chairman and Chief Executive Officer, Invesco Canada Ltd. (formerly known as Invesco Trimark Ltd./Invesco Trimark Ltèe) (registered investment adviser and registered transfer agent); Trustee, President and Principal Executive Officer, The Invesco Funds (other than AIM Treasurer’s Series Trust (Invesco Treasurer’s Series Trust) and Short-Term Investments Trust); Trustee and Executive Vice President, The Invesco Funds (AIM Treasurer’s Series Trust (Invesco Treasurer’s Series Trust) and Short-Term Investments Trust only); Director, Invesco Investment Advisers LLC (formerly known as Van Kampen Asset Management); Director, Chief Executive Officer and President, Van Kampen Exchange Corp.
Formerly: Director and Chairman, Van Kampen Investor Services Inc.: Director, Chief Executive Officer and President, 1371 Preferred Inc. (holding company); and Van Kampen Investments Inc.; Director and President, AIM GP Canada Inc. (general partner for limited partnerships); and Van Kampen Advisors, Inc.; Director and Chief Executive Officer, Invesco Trimark Dealer Inc. (registered broker dealer); Director, Invesco Distributors, Inc. (formerly known as Invesco Aim Distributors, Inc.) (registered broker dealer); Manager, Invesco PowerShares Capital Management LLC; Director, Chief Executive Officer and President, Invesco Advisers, Inc.; Director, Chairman, Chief Executive Officer and President, Invesco Aim Capital Management, Inc.; President, Invesco Trimark Dealer Inc. and Invesco Trimark Ltd./Invesco Trimark Ltèe; Director and President, AIM Trimark Corporate Class Inc. and AIM Trimark Canada Fund Inc.; Senior Managing Director, Invesco Holding Company Limited; Trustee and Executive Vice President, Tax-Free Investments Trust; Director and Chairman, Fund Management Company (former registered broker dealer); President and Principal Executive Officer, The Invesco Funds (AIM Treasurer’s Series Trust (Invesco Treasurer’s Series Trust), Short-Term Investments Trust and Tax-Free Investments Trust only); President, AIM Trimark Global Fund Inc. and AIM Trimark Canada Fund Inc. | 123 | None | ||||
Wayne W. Whalen3 — 1939 Trustee | 2010 | Of Counsel, and prior to 2010, partner in the law firm of Skadden, Arps, Slate, Meagher & Flom LLP, legal counsel to certain funds in the Fund Complex | 136 | Director of the Mutual Fund Directors Forum, a nonprofit membership organization for investment directors; Chairman and Director of the Abraham Lincoln Presidential Library Foundation; and Director of the Stevenson Center for Democracy |
| 1 | Mr. Flanagan is considered an interested person of the Trust because he is an officer of the adviser to the Trust, and an officer and a director of Invesco Ltd., ultimate parent of the adviser to the Trust. |
| 2 | Mr. Taylor is considered an interested person of the Trust because he is an officer and a director of the adviser to, and a director of the principal underwriter of, the Trust. |
| 3 | Mr. Whalen is considered an “interested person” (within the meaning of Section 2(a)(19) of the 1940 Act) of certain Funds in the Invesco Fund Complex because he and his firm currently provide legal services as legal counsel to such Funds. |
T-1 Invesco Balanced-Risk Retirement Funds
Trustees and Officers—(continued)
| Name, Year of Birth and Position(s) Held with the Trust | Trustee and/ or Officer Since | Principal Occupation(s) During Past 5 Years | Number of Funds in Fund Complex Overseen by Trustee | Other Directorship(s) Held by Trustee During Past 5 Years | ||||
| Independent Trustees | ||||||||
Bruce L. Crockett — 1944 Trustee and Chair | 2001 | Chairman, Crockett Technologies Associates (technology consulting company)
Formerly: Director, Captaris (unified messaging provider); Director, President and Chief Executive Officer COMSAT Corporation; and Chairman, Board of Governors of INTELSAT (international communications company) | 123 | ACE Limited (insurance company); Investment Company Institute | ||||
David C. Arch — 1945 Trustee | 2010 | Chairman and Chief Executive Officer of Blistex Inc., (consumer health care products manufacturer)
Formerly: Member of the Heartland Alliance Advisory Board, a nonprofit organization serving human needs based in Chicago | 136 | Board member of the Illinois Manufacturers’ Association; Member of the Board of Visitors, Institute for the Humanities, University of Michigan | ||||
Frank S. Bayley — 1939 Trustee | 1985 | Retired
Formerly: Director, Badgley Funds, Inc. (registered investment company) (2 portfolios) and General Partner and Of Counsel, law firm of Baker & McKenzie, LLP | 123 | Director and Chairman, C.D. Stimson Company (a real estate investment company); Trustee and Overseer, The Curtis Institute of Music | ||||
James T. Bunch — 1942 Trustee | 2003 | Managing Member, Grumman Hill Group LLC (family office private equity management)
Formerly: Founder, Green, Manning & Bunch Ltd. (investment banking firm) (1988-2010); Executive Committee, United States Golf Association; and Director, Policy Studies, Inc. and Van Gilder Insurance Corporation | 123 | Chairman, Board of Governors, Western Golf Association; Chairman-elect, Evans Scholars Foundation; and Director, Denver Film Society | ||||
Rodney F. Dammeyer — 1940 Trustee | 2010 | Chairman of CAC, LLC, (private company offering capital investment and management advisory services)
Formerly: Prior to 2001, Managing Partner at Equity Group Corporate Investments; Prior to 1995, Chief Executive Officer of Itel Corporation (formerly Anixter International); Prior to 1985, experience includes Senior Vice President and Chief Financial Officer of Household International, Inc., Executive Vice President and Chief Financial Officer of Northwest Industries, Inc. and Partner of Arthur Andersen & Co.; From 1987 to 2010, Director/Trustee of investment companies in the Van Kampen Funds complex | 123 | Director of Quidel Corporation and Stericycle, Inc.; Prior to May 2008, Trustee of The Scripps Research Institute; Prior to February 2008, Director of Ventana Medical Systems, Inc. | ||||
Albert R. Dowden — 1941 Trustee | 2001 | Director of a number of public and private business corporations, including the Boss Group, Ltd. (private investment and management); and Reich & Tang Funds (5 portfolios) (registered investment company)
Formerly: Director, Homeowners of America Holding Corporation/Homeowners of America Insurance Company (property casualty company); Director, Continental Energy Services, LLC (oil and gas pipeline service); Director, CompuDyne Corporation (provider of product and services to the public security market) and Director, Annuity and Life Re (Holdings), Ltd. (reinsurance company); Director, President and Chief Executive Officer, Volvo Group North America, Inc.; Senior Vice President, AB Volvo; Director of various public and private corporations; Chairman, DHJ Media, Inc.; Director, Magellan Insurance Company; and Director, The Hertz Corporation, Genmar Corporation (boat manufacturer), National Media Corporation; Advisory Board of Rotary Power International (designer, manufacturer, and seller of rotary power engines); and Chairman, Cortland Trust, Inc. (registered investment company) | 123 | Director of Nature’s Sunshine Products, Inc. | ||||
Jack M. Fields — 1952 Trustee | 2001 | Chief Executive Officer, Twenty First Century Group, Inc. (government affairs company); Owner and Chief Executive Officer, Dos Angeles Ranch, L.P. (cattle, hunting, corporate entertainment); and Discovery Global Education Fund (non-profit)
Formerly: Chief Executive Officer, Texana Timber LP (sustainable forestry company); Director of Cross Timbers Quail Research Ranch (non-profit); and member of the U.S. House of Representatives | 123 | Insperity, Inc. (formerly known as Administaff) | ||||
Prema Mathai-Davis — 1950 Trustee | 2001 | Retired
Formerly: Chief Executive Officer, YWCA of the U.S.A. | 123 | None | ||||
Larry Soll — 1942 Trustee | 2003 | Retired
Formerly: Chairman, Chief Executive Officer and President, Synergen Corp. (a biotechnology company) | 123 | None | ||||
Hugo F. Sonnenschein — 1940 Trustee | 2010 | Distinguished Service Professor and President Emeritus of the University of Chicago and the Adam Smith Distinguished Service Professor in the Department of Economics at the University of Chicago
Formerly: President of the University of Chicago | 136 | Trustee of the University of Rochester and a member of its investment committee. Member of the National Academy of Sciences, the American Philosophical Society and a fellow of the American Academy of Arts and Sciences |
T-2 Invesco Balanced-Risk Retirement Funds
Trustees and Officers—(continued)
| Name, Year of Birth and Position(s) Held with the Trust | Trustee and/ or Officer Since | Principal Occupation(s) During Past 5 Years | Number of Funds in Fund Complex Overseen by Trustee | Other Directorship(s) Held by Trustee During Past 5 Years | ||||
| Independent Trustees—(continued) | ||||||||
Raymond Stickel, Jr. — 1944 Trustee | 2005 | Retired
Formerly: Director, Mainstay VP Series Funds, Inc. (25 portfolios) and Partner, Deloitte & Touche | 123 | None | ||||
| Other Officers | ||||||||
| Russell C. Burk — 1958 Senior Vice President and Senior Officer | 2005 | Senior Vice President and Senior Officer, The Invesco Funds | N/A | N/A | ||||
| John M. Zerr — 1962 Senior Vice President, Chief Legal Officer and Secretary | 2006 | Director, Senior Vice President, Secretary and General Counsel, Invesco Management Group, Inc. (formerly known as Invesco Aim Management Group, Inc.) and Van Kampen Exchange Corp.; Senior Vice President, Invesco Advisers, Inc. (formerly known as Invesco Institutional (N.A.), Inc.) (registered investment adviser); Senior Vice President and Secretary, Invesco Distributors, Inc. (formerly known as Invesco Aim Distributors, Inc.); Director, Vice President and Secretary, Invesco Investment Services, Inc. (formerly known as Invesco Aim Investment Services, Inc.) and IVZ Distributors, Inc. (formerly known as INVESCO Distributors, Inc.); Director and Vice President, INVESCO Funds Group, Inc.; Senior Vice President, Chief Legal Officer and Secretary, The Invesco Funds; Manager, Invesco PowerShares Capital Management LLC; Director, Secretary and General Counsel, Invesco Investment Advisers LLC (formerly known as Van Kampen Asset Management); Secretary and General Counsel, Invesco Capital Markets, Inc. (formerly known as Van Kampen Funds Inc.) and Chief Legal Officer, PowerShares Exchange-Traded Fund Trust, PowerShares Exchange-Traded Fund Trust II, PowerShares India Exchange-Traded Fund Trust and PowerShares Actively Managed Exchange-Traded Fund Trust
Formerly: Director and Vice President, Van Kampen Advisors Inc.; Director, Vice President, Secretary and General Counsel, Van Kampen Investor Services Inc.; Director, Invesco Distributors, Inc. (formerly known as Invesco Aim Distributors, Inc.); Director, Senior Vice President, General Counsel and Secretary, Invesco Aim Advisers, Inc. and Van Kampen Investments Inc.; Director, Vice President and Secretary, Fund Management Company; Director, Senior Vice President, Secretary, General Counsel and Vice President, Invesco Aim Capital Management, Inc.; Chief Operating Officer and General Counsel, Liberty Ridge Capital, Inc. (an investment adviser); Vice President and Secretary, PBHG Funds (an investment company) and PBHG Insurance Series Fund (an investment company); Chief Operating Officer, General Counsel and Secretary, Old Mutual Investment Partners (a broker-dealer); General Counsel and Secretary, Old Mutual Fund Services (an administrator) and Old Mutual Shareholder Services (a shareholder servicing center); Executive Vice President, General Counsel and Secretary, Old Mutual Capital, Inc. (an investment adviser); and Vice President and Secretary, Old Mutual Advisors Funds (an investment company) | N/A | N/A | ||||
| Karen Dunn Kelley — 1960 Vice President | 2004 | Senior Managing Director, Investments; Director, Co-President, Co-Chief Executive Officer, and Co-Chairman, Invesco Advisers, Inc. (formerly known as Invesco Institutional (N.A.), Inc.) (registered investment adviser); Chairman, Invesco Senior Secured Management, Inc.; Senior Vice President, Invesco Management Group, Inc. (formerly known as Invesco Aim Management Group, Inc.); Executive Vice President, Invesco Distributors, Inc. (formerly known as Invesco Aim Distributors, Inc.); Director, Invesco Mortgage Capital Inc., and Invesco Management Company Limited; Director and President, INVESCO Asset Management (Bermuda) Ltd., Vice President, The Invesco Funds (other than AIM Treasurer’s Series Trust (Invesco Treasurer’s Series Trust) and Short-Term Investments Trust); and President and Principal Executive Officer, The Invesco Funds (AIM Treasurer’s Series Trust (Invesco Treasurer’s Series Trust) and Short-Term Investments Trust only)
Formerly: Director, INVESCO Global Asset Management Limited and INVESCO Management S.A.; Senior Vice President, Van Kampen Investments Inc. and Invesco Advisers, Inc. (formerly known as Invesco Institutional (N.A.), Inc.) (registered investment adviser); Vice President, Invesco Advisers, Inc. (formerly known as Invesco Institutional (N.A.), Inc.); Director of Cash Management and Senior Vice President, Invesco Advisers, Inc. and Invesco Aim Capital Management, Inc.; President and Principal Executive Officer, Tax-Free Investments Trust; Director and President, Fund Management Company; Chief Cash Management Officer, Director of Cash Management, Senior Vice President, and Managing Director, Invesco Aim Capital Management, Inc.; Director of Cash Management, Senior Vice President, and Vice President, Invesco Advisers, Inc. and The Invesco Funds (AIM Treasurer’s Series Trust (Invesco Treasurer’s Series Trust), Short-Term Investments Trust and Tax-Free Investments Trust only) | N/A | N/A | ||||
T-3 Invesco Balanced-Risk Retirement Funds
Trustees and Officers—(continued)
| Name, Year of Birth and Position(s) Held with the Trust | Trustee and/ or Officer Since | Principal Occupation(s) During Past 5 Years | Number of Funds in Fund Complex Overseen by Trustee | Other Directorship(s) Held by Trustee During Past 5 Years | ||||
| Other Officers—(continued) | ||||||||
| Sheri Morris — 1964 Vice President, Treasurer and Principal Financial Officer | 1999 | Vice President, Treasurer and Principal Financial Officer, The Invesco Funds; Vice President, Invesco Advisers, Inc. (formerly known as Invesco Institutional (N.A.), Inc.) (registered investment adviser); and Vice President, PowerShares Exchange-Traded Fund Trust, PowerShares Exchange-Traded Fund Trust II, PowerShares India Exchange-Traded Fund Trust and PowerShares Actively Managed Exchange-Traded Fund Trust
Formerly: Vice President, Invesco Aim Advisers, Inc., Invesco Aim Capital Management, Inc. and Invesco Aim Private Asset Management, Inc.; Assistant Vice President and Assistant Treasurer, The Invesco Funds and Assistant Vice President, Invesco Advisers, Inc., Invesco Aim Capital Management, Inc. and Invesco Aim Private Asset Management, Inc.; and Treasurer, PowerShares Exchange-Traded Fund Trust, PowerShares Exchange-Traded Fund Trust II, PowerShares India Exchange-Traded Fund Trust and PowerShares Actively Managed Exchange-Traded Fund Trust | N/A | N/A | ||||
Crissie M. Wisdom — 1969 Anti-Money Laundering Compliance Officer | 2013 | Anti-Money Laundering Compliance Officer, Invesco Advisers, Inc. (formerly known as Invesco Institutional (N.A.), Inc.) (registered investment adviser), Invesco Capital Markets, Inc. (formerly known as Van Kampen Funds Inc.), Invesco Distributors, Inc., Invesco Investment Services, Inc., Invesco Management Group, Inc., Van Kampen Exchange Corp., The Invesco Funds, Invesco Funds (Chicago), and PowerShares Exchange-Traded Fund Trust, PowerShares Exchange-Traded Fund Trust II, PowerShares India Exchange-Traded Fund Trust, and PowerShares Actively Managed Exchange-Traded Fund Trust; and Fraud Prevention Manager and Controls and Risk Analysis Manager for Invesco Investment Services, Inc. | N/A | N/A | ||||
| Todd L. Spillane — 1958 Chief Compliance Officer | 2006 | Senior Vice President, Invesco Management Group, Inc. (formerly known as Invesco Aim Management Group, Inc.) and Van Kampen Exchange Corp.; Senior Vice President and Chief Compliance Officer, Invesco Advisers, Inc. (registered investment adviser) (formerly known as Invesco Institutional (N.A.), Inc.); Chief Compliance Officer, The Invesco Funds; Vice President, Invesco Distributors, Inc. (formerly known as Invesco Aim Distributors, Inc.) and Invesco Investment Services, Inc. (formerly known as Invesco Aim Investment Services, Inc.)
Formerly: Chief Compliance Officer, Invesco Funds (Chicago); Senior Vice President, Van Kampen Investments Inc.; Senior Vice President and Chief Compliance Officer, Invesco Aim Advisers, Inc. and Invesco Aim Capital Management, Inc.; Chief Compliance Officer, INVESCO Private Capital Investments, Inc. (holding company), Invesco Private Capital, Inc. (registered investment adviser), Invesco Global Asset Management (N.A.), Inc., Invesco Senior Secured Management, Inc. (registered investment adviser), Van Kampen Investor Services Inc., PowerShares Exchange-Traded Fund Trust, PowerShares Exchange-Traded Fund Trust II, PowerShares India Exchange-Traded Fund Trust and PowerShares Actively Managed Exchange-Traded Fund Trust; and Vice President, Invesco Aim Capital Management, Inc. and Fund Management Company | N/A | N/A |
The Statement of Additional Information of the Trust includes additional information about the Fund’s Trustees and is available upon request, without charge, by calling 1.800.959.4246. Please refer to the Fund’s prospectus for information on the Fund’s sub-advisers.
Office of the Fund 11 Greenway Plaza, Suite 1000 Houston, TX 77046-1173 | Investment Adviser Invesco Advisers, Inc. 1555 Peachtree Street, N.E. Atlanta, GA 30309 | Distributor Invesco Distributors, Inc. 11 Greenway Plaza, Suite 1000 Houston, TX 77046-1173 | Auditors PricewaterhouseCoopers LLP 1201 Louisiana Street, Suite 2900 Houston, TX 77002-5678 | |||
Counsel to the Fund Stradley Ronon Stevens & Young, LLP 2005 Market Street, Suite 2600 Philadelphia, PA 19103-7018 | Counsel to the Independent Trustees Goodwin Procter LLP 901 New York Avenue, N.W. Washington, D.C. 20001 | Transfer Agent Invesco Investment Services, Inc. 11 Greenway Plaza, Suite 1000 Houston, TX 77046-1173 | Custodian State Street Bank and Trust Company 225 Franklin Street Boston, MA 02110-2801 | |||
T-4 Invesco Balanced-Risk Retirement Funds

Invesco mailing information
Send general correspondence to Invesco Investment Services, Inc., P.O. Box 219078, Kansas City, MO 64121-9078.
Invesco privacy policy
You share personal and financial information with us that is necessary for your transactions and your account records. We take very seriously the obligation to keep that information confidential and private.
Invesco collects nonpublic personal information about you from account applications or other forms you complete and from your transactions with us or our affiliates. We do not disclose information about you or our former customers to service providers or other third parties except to the extent necessary to service your account and in other limited circumstances as permitted by law. For example, we use this information to facilitate the delivery of transaction confirmations, financial reports, prospectuses and tax forms.
Even within Invesco, only people involved in the servicing of your accounts and compliance monitoring have access to your information. To ensure the highest level of confidentiality and security, Invesco maintains physical, electronic and procedural safeguards that meet or exceed federal standards. Special measures, such as data encryption and authentication, apply to your communications with us on our website. More detail is available to you at invesco.com/privacy.
Important notice regarding delivery of security holder documents
To reduce Fund expenses, only one copy of most shareholder documents may be mailed to shareholders with multiple accounts at the same address (Householding). Mailing of your shareholder documents may be householded indefinitely unless you instruct us otherwise. If you do not want the mailing of these documents to be combined with those for other members of your household, please contact Invesco Investment Services, Inc. at 800 959 4246 or contact your financial institution. We will begin sending you individual copies for each account within 30 days after receiving your request.
Fund holdings and proxy voting information
The Fund provides a complete list of its holdings four times in each fiscal year, at the quarter ends. For the second and fourth quarters, the lists appear in the Fund’s semiannual and annual reports to shareholders. For the first and third quarters, the Fund files the lists with the Securities and Exchange Commission (SEC) on Form N-Q. The most recent list of portfolio holdings is available at invesco.com/completeqtrholdings. Shareholders can also look up the Fund’s Forms N-Q on the SEC website at sec.gov. Copies of the Fund’s Forms N-Q may be reviewed and copied at the SEC Public Reference Room in Washington, D.C. You can obtain information on the operation of the Public Reference Room, including information about duplicating fee charges, by calling 202 551 8090 or 800 732 0330, or by electronic request at the following email address: publicinfo@sec.gov. The SEC file numbers for the Fund are shown below.
A description of the policies and procedures that the Fund uses to determine how to vote proxies relating to portfolio securities is available without charge, upon request, from our Client Services department at 800 959 4246 or at invesco.com/proxyguidelines. The information is also available on the SEC website, sec.gov.
Information regarding how the Fund voted proxies related to its portfolio securities during the most recent 12-month period ended June 30 is available at invesco.com/proxysearch. The information is also available on the SEC website, sec.gov. Invesco Advisers, Inc. is an investment adviser; it provides investment advisory services to individual and institutional clients and does not sell securities. Invesco Distributors, Inc. is the US distributor for Invesco Ltd.’s retail mutual funds, exchange-traded funds and institutional money market funds. Both are wholly owned, indirect subsidiaries of Invesco Ltd. |  | |
| SEC file numbers: 811-02699 and 002-57526 IBRR-AR-1 Invesco Distributors, Inc. | ||
|
| |||||
Annual Report to Shareholders
| December 31, 2013
| |||||
Invesco Allocation Funds | ||||||
Invesco Conservative Allocation Fund Invesco Growth Allocation Fund Invesco Moderate Allocation Fund | ||||||


Invesco Conservative Allocation Fund’s Long-Term Performance
Results of a $10,000 Investment – Oldest Share Class(es) since Inception
Fund data from 4/29/05; index data from 4/30/05
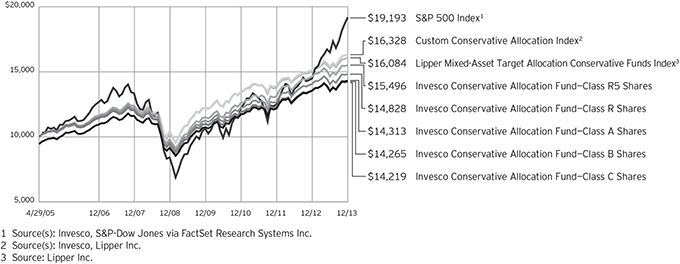
Past performance cannot guarantee comparable future results.
The data shown in the chart include reinvested distributions, applicable sales charges and Fund expenses including management fees. Results for Class B shares are calculated as if a hypothetical
shareholder had liquidated his entire investment in the Fund at the close of the reporting period and paid the contingent deferred sales charges, if applicable. Index results include reinvested dividends, but they do not reflect sales charges. Performance of the peer group,
if applicable, reflects fund expenses and management fees; performance of a market index does not. Performance shown in the chart and table(s) does not reflect deduction of taxes a shareholder would pay on Fund distributions or sale of Fund shares.
2 Invesco Allocation Funds
| Average Annual Total Returns | |||||
| As of 12/31/13, including maximum applicable sales charges | |||||
| Class A Shares | |||||
| Inception (4/29/05) | 4.22 | % | |||
| 5 Years | 8.11 | ||||
| 1 Year | -0.20 | ||||
| Class B Shares | |||||
| Inception (4/29/05) | 4.18 | % | |||
| 5 Years | 8.24 | ||||
| 1 Year | -0.17 | ||||
| Class C Shares | |||||
| Inception (4/29/05) | 4.14 | % | |||
| 5 Years | 8.51 | ||||
| 1 Year | 3.83 | ||||
| Class R Shares | |||||
| Inception (4/29/05) | 4.65 | % | |||
| 5 Years | 9.08 | ||||
| 1 Year | 5.36 | ||||
| Class S Shares | |||||
| Inception | 4.93 | % | |||
| 5 Years | 9.41 | ||||
| 1 Year | 5.73 | ||||
| Class Y Shares | |||||
| Inception | 5.03 | % | |||
| 5 Years | 9.57 | ||||
| 1 Year | 5.91 | ||||
| Class R5 Shares | |||||
| Inception (4/29/05) | 5.18 | % | |||
| 5 Years | 9.61 | ||||
| 1 Year | 5.92 | ||||
Class S shares incepted on June 3, 2011. Performance shown prior to that date is that of Class A shares and includes the 12b-1 fees applicable to Class A shares. Class A share performance reflects any applicable fee waivers or expense reimbursements.
Class Y shares incepted on October 3, 2008. Performance shown prior to that date is that of Class A shares and includes the 12b-1 fees applicable to Class A shares. Class A share performance reflects any applicable fee waivers or expense reimbursements.
The performance data quoted represent past performance and cannot guarantee comparable future results; current performance may be lower or higher. Please visit invesco.com/performance for the most recent month-end performance. Performance figures reflect reinvested distributions, changes in net asset value and the effect of the maximum sales charge unless otherwise stated.
Investment return and principal value will fluctuate so that you may have a gain or loss when you sell shares.
The total annual Fund operating expense ratio set forth in the most recent Fund prospectus as of the date of this report for Class A, Class B, Class C, Class R, Class S, Class Y and Class R5 shares was 1.14%, 1.89%, 1.89%, 1.39%, 1.04%, 0.89% and 0.86%, respectively.1 The expense ratios presented above may vary from the expense ratios presented in other sections of this report that are based on expenses incurred during the period covered by this report.
Class A share performance reflects the maximum 5.50% sales charge, and Class B and Class C share performance reflects the applicable contingent deferred sales charge (CDSC) for the period involved. The CDSC on Class B shares declines from 5% beginning at the time of purchase to 0% at the beginning of the seventh year. The CDSC on Class C shares is 1% for the first year after purchase. Class R, Class S, Class Y and Class R5 shares do not have a front-end sales charge or a CDSC; therefore, performance is at net asset value.
The performance of the Fund’s share classes will differ primarily due to different sales charge structures and class expenses.
Had the adviser not waived fees and/or reimbursed expenses in the past, performance would have been lower.
| 1 | The expense ratio includes acquired fund fees and expenses of the underlying funds in which the Fund invests of 0.65% for Invesco Conservative Allocation Fund. |
3 Invesco Allocation Funds
Invesco Growth Allocation Fund’s Long-Term Performance
Results of a $10,000 Investment – Oldest Share Class(es) since Inception
Fund and index data from 4/30/04
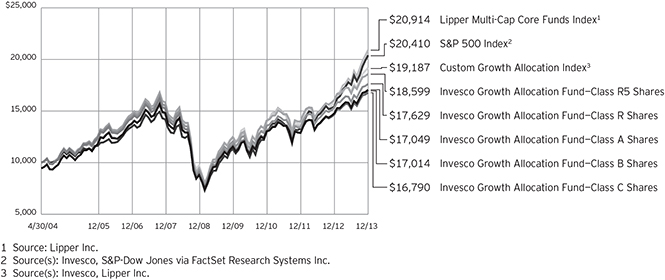
Past performance cannot guarantee comparable future results.
The data shown in the chart include reinvested distributions, applicable sales charges and Fund expenses including management fees. Results for Class B shares are calculated as if a hypothetical
shareholder had liquidated his entire investment in the Fund at the close of the reporting period and paid the contingent deferred sales charges, if applicable. Index results include reinvested dividends, but they do not reflect sales charges. Performance of the peer group,
if applicable, reflects fund expenses and management fees; performance of a market index does not. Performance shown in the chart and table(s) does not reflect deduction of taxes a shareholder would pay on Fund distributions or sale of Fund shares.
4 Invesco Allocation Funds
| Average Annual Total Returns | |||||
| As of 12/31/13, including maximum applicable sales charges | |||||
| Class A Shares | |||||
| Inception (4/30/04) | 5.67 | % | |||
| 5 Years | 12.87 | ||||
| 1 Year | 9.00 | ||||
| Class B Shares | |||||
| Inception (4/30/04) | 5.65 | % | |||
| 5 Years | 13.02 | ||||
| 1 Year | 9.41 | ||||
| Class C Shares | |||||
| Inception (4/30/04) | 5.50 | % | |||
| 5 Years | 13.28 | ||||
| 1 Year | 13.50 | ||||
| Class R Shares | |||||
| Inception (4/30/04) | 6.04 | % | |||
| 5 Years | 13.84 | ||||
| 1 Year | 15.08 | ||||
| Class S Shares | |||||
| Inception | 6.34 | % | |||
| 5 Years | 14.25 | ||||
| 1 Year | 15.49 | ||||
| Class Y Shares | |||||
| Inception | 6.43 | % | |||
| 5 Years | 14.41 | ||||
| 1 Year | 15.56 | ||||
| Class R5 Shares | |||||
| Inception (4/30/04) | 6.63 | % | |||
| 5 Years | 14.49 | ||||
| 1 Year | 15.75 | ||||
Class S shares incepted on September 25, 2009. Performance shown prior to that date is that of Class A shares and includes the 12b-1 fees applicable to Class A shares. Class A share performance reflects any applicable fee waivers or expense reimbursements.
Class Y shares incepted on October 3, 2008. Performance shown prior to that date is that of Class A shares and includes the 12b-1 fees applicable to Class A shares. Class A share performance reflects any applicable fee waivers or expense reimbursements.
The performance data quoted represent past performance and cannot guarantee comparable future results; current performance may be lower or higher. Please visit invesco.com/performance for the most recent month-end performance. Performance figures reflect reinvested distributions, changes in net asset value and the effect of the maximum
sales charge unless otherwise stated. Performance figures do not reflect deduction of taxes a shareholder would pay on Fund distributions or sale of Fund shares. Investment return and principal value will fluctuate so that you may have a gain or loss when you sell shares.
The total annual Fund operating expense ratio set forth in the most recent Fund prospectus as of the date of this report for Class A, Class B, Class C, Class R, Class S, Class Y and Class R5 shares was 1.32%, 2.07%, 2.07%, 1.57%, 1.22%, 1.07% and 0.93%, respectively.1 The expense ratios presented above may vary from the expense ratios presented in other sections of this report that are based on expenses incurred during the period covered by this report.
Class A share performance reflects the maximum 5.50% sales charge, and Class B and Class C share performance reflects the applicable contingent deferred sales charge (CDSC) for the period involved. The CDSC on Class B shares declines from 5% beginning at the time of purchase to 0% at the beginning of the seventh year. The CDSC on Class C shares is 1% for the first year after purchase. Class R, Class S, Class Y and Class R5 shares do not have a front-end sales charge or a CDSC; therefore, performance is at net asset value.
The performance of the Fund’s share classes will differ primarily due to different sales charge structures and class expenses.
Had the adviser not waived fees and/or reimbursed expenses on the Fund’s Class A, B, C, R, S and Y shares in the past, performance would have been lower.
| 1 | The expense ratio includes acquired fund fees and expenses of the underlying funds in which the Fund invests of 0.77% for Invesco Growth Allocation Fund. |
5 Invesco Allocation Funds
Invesco Moderate Allocation Fund’s Long-Term Performance
Results of a $10,000 Investment – Oldest Share Class(es) since Inception
Fund and index data from 4/30/04
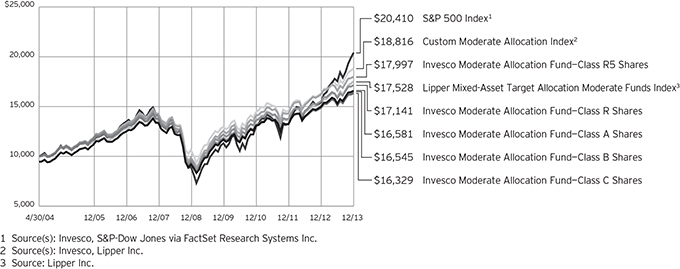
Past performance cannot guarantee comparable future results.
The data shown in the chart include reinvested distributions, applicable sales charges and Fund expenses including management fees. Results for Class B shares are calculated as if a hypothetical
shareholder had liquidated his entire investment in the Fund at the close of the reporting period and paid the contingent deferred sales charges, if applicable. Index results include reinvested dividends, but they do not reflect sales charges. Performance of the peer group,
if applicable, reflects fund expenses and management fees; performance of a market index does not. Performance shown in the chart and table(s) does not reflect deduction of taxes a shareholder would pay on Fund distributions or sale of Fund shares.
6 Invesco Allocation Funds
| Average Annual Total Returns | |||||
| As of 12/31/13, including maximum applicable sales charges | |||||
| Class A Shares | |||||
| Inception (4/30/04) | 5.37 | % | |||
| 5 Years | 11.23 | ||||
| 1 Year | 4.52 | ||||
| Class B Shares | |||||
| Inception (4/30/04) | 5.34 | % | |||
| 5 Years | 11.40 | ||||
| 1 Year | 4.78 | ||||
| Class C Shares | |||||
| Inception (4/30/04) | 5.20 | % | |||
| 5 Years | 11.64 | ||||
| 1 Year | 8.79 | ||||
| Class R Shares | |||||
| Inception (4/30/04) | 5.73 | % | |||
| 5 Years | 12.20 | ||||
| 1 Year | 10.30 | ||||
| Class S Shares | |||||
| Inception | 6.02 | % | |||
| 5 Years | 12.56 | ||||
| 1 Year | 10.68 | ||||
| Class Y Shares | |||||
| Inception | 6.12 | % | |||
| 5 Years | 12.76 | ||||
| 1 Year | 10.84 | ||||
| Class R5 Shares | |||||
| Inception (4/30/04) | 6.26 | % | |||
| 5 Years | 12.77 | ||||
| 1 Year | 10.84 | ||||
Class S shares incepted on September 25, 2009. Performance shown prior to that date is that of Class A shares and includes the 12b-1 fees applicable to Class A shares. Class A share performance reflects any applicable fee waivers or expense reimbursements.
Class Y shares incepted on October 3, 2008. Performance shown prior to that date is that of Class A shares and includes the 12b-1 fees applicable to Class A shares. Class A share performance reflects any applicable fee waivers or expense reimbursements.
The performance data quoted represent past performance and cannot guarantee comparable future results; current performance may be lower or higher. Please visit invesco.com/performance for the most recent month-end performance. Performance figures reflect reinvested distributions, changes in net asset value and the effect of the maximum
sales charge unless otherwise stated. Performance figures do not reflect deduction of taxes a shareholder would pay on Fund distributions or sale of Fund shares. Investment return and principal value will fluctuate so that you may have a gain or loss when you sell shares.
The total annual Fund operating expense ratio set forth in the most recent Fund prospectus as of the date of this report for Class A, Class B, Class C, Class R, Class S, Class Y and Class R5 shares was 1.20%, 1.95%, 1.95%, 1.45%, 1.10%, 0.95% and 0.85%, respectively.1 The expense ratios presented above may vary from the expense ratios presented in other sections of this report that are based on expenses incurred during the period covered by this report.
Class A share performance reflects the maximum 5.50% sales charge, and Class B and Class C share performance reflects the applicable contingent deferred sales charge (CDSC) for the period involved. The CDSC on Class B shares declines from 5% beginning at the time of purchase to 0% at the beginning of the seventh year. The CDSC on Class C shares is 1% for the first year after purchase. Class R, Class S, Class Y and Class R5 shares do not have a front-end sales charge or a CDSC; therefore, performance is at net asset value.
The performance of the Fund’s share classes will differ primarily due to different sales charge structures and class expenses.
Had the adviser not waived fees and/or reimbursed expenses on the Fund’s Class A, B, C, R, S and Y shares in the past, performance would have been lower.
| 1 | The expense ratio includes acquired fund fees and expenses of the underlying funds in which the Fund invests of 0.72% for Invesco Moderate Allocation Fund. |
7 Invesco Allocation Funds
Letters to Shareholders
Philip Taylor | Dear Shareholders: | |
This annual report includes information about your Invesco Fund, including performance data and a complete list of its investments as of the close of the reporting period. Inside, your Fund’s portfolio managers discuss how they managed your Fund and the factors that affected its performance during the reporting period. I hope you find this report of interest. During the year covered by this report, major US and global equity market indexes hit multiyear or all-time highs1, the result of a strengthening US economy and relatively healthy corporate profits. Also helping equities was a return of individual investors to stocks – due in part to monetary policies that kept interest rates (and yields on fixed income securities) low. At the end of the reporting period, amid widespread signs of an improving economy, the US Federal Reserve announced that it would begin a long-anticipated reduction in its bond-buying |

program in January 2014; its decision was widely expected and investors reacted positively to the announcement. Despite some mid-summer volatility, overseas equity market indexes in developed and emerging nations generally rose during the year.
Extended periods of strong market performance such as we saw throughout 2013 can lull some investors into a false sense of security – just as extended periods of volatility or market weakness can discourage some investors from undertaking disciplined, long-term investment plans. That’s why Invesco believes it can often be helpful to work with a skilled and trusted financial adviser; he or she can emphasize the importance of adhering to an investment plan designed to achieve long-term goals like a first home, a college education for a child or a comfortable retirement. A financial adviser who is familiar with your individual financial situation, investment goals and risk tolerance can be an invaluable partner as you work toward your financial goals. He or she can provide insight and perspective when markets are volatile; encouragement and reassurance when times are uncertain; and advice and guidance when your financial situation or investment goals change.
Timely information when and where you want it
Invesco’s efforts to help investors achieve their financial objectives include providing individual investors and financial professionals with timely information about the markets, the economy and investing – whenever and wherever they want it.
Our website, invesco.com/us, offers a wide range of market insights and investment perspectives. On the website, you’ll find detailed information about our funds, including prices, performance, holdings and portfolio manager commentaries. You can access information about your individual Invesco account whenever it’s convenient for you; just complete a simple, secure online registration. Use the “Login” box on our home page to get started.
Using Invesco’s mobile app for iPad® (available free from the App StoreSM) allows you to obtain the same detailed information about your funds and the same investment insights from our investment leaders, market strategists, economists and retirement experts on the go. You also can watch portfolio manager videos and have instant access to Invesco news and updates wherever you may be.
In addition to the resources accessible on our website and through our mobile app, you can obtain timely updates to help you stay informed about the markets, the economy and investing by connecting with Invesco on Twitter, LinkedIn or Facebook. You can access our blog at blog.invesco.us.com or by visiting the “Intentional Investing Forum” on our home page. Our goal is to provide you the information you want, when and where you want it.
Have questions?
For questions about your account, feel free to contact an Invesco client services representative at 800 959 4246. For Invesco-related questions or comments, please email me directly at phil@invesco.com.
All of us at Invesco look forward to serving your investment management needs for many years to come. Thank you for investing with us.
Sincerely,

Philip Taylor
Senior Managing Director, Invesco Ltd.
1 Source: Reuters
iPad is a trademark of Apple Inc., registered in the US and other countries. App Store is a service mark of Apple Inc.
8 Invesco Allocation Funds
Bruce Crockett | Dear Fellow Shareholders: | |
Many investors enjoyed positive returns on their investments in 2013. While some sectors of the market struggled, many major equity market indexes in the US and around the globe rose last year. The performance of stocks, fixed income securities and alternative investments – and the performance of mutual funds that invest in them – is determined by many factors, including unforeseeable economic and geopolitical events. Your Board certainly can’t determine how well various asset classes in the market perform, but we work hard throughout the year on issues that affect you and your fellow shareholders and determine how your investments are managed. For example, the Invesco Funds Board works to ensure that we provide a lineup of funds that allow financial advisers to build portfolios that meet shareholders’ changing financial needs and goals. Your Board works with Invesco Advisers on a continuing basis to provide financial |

products that may help investors achieve their varied financial goals. We also carefully monitor how the management teams of all the Invesco funds are performing in light of ever-changing and often unpredictable economic and market conditions. Your Board carefully assesses their performance in a constantly changing and highly competitive marketplace.
Your Board also conducts an annual review of the funds’ advisory and sub-advisory contracts with Invesco Advisers and its affiliates. This annual review, which is required by the Investment Company Act of 1940, focuses on the nature and quality of the services Invesco provides as adviser to the Invesco Funds and the reasonableness of the fees that it charges for those services. Each year, we spend months reviewing detailed information that we request from Invesco that allows us to evaluate its services and fees. We also use information from many independent sources, including materials provided by the independent Senior Officer of the Invesco Funds, who reports directly to the independent Trustees on the Board. Additionally, we meet with independent legal counsel and review performance and fee data prepared by Lipper Inc., an independent, third-party firm widely recognized as a leader in its field.
Be assured that your Board will continue working on behalf of fund shareholders, keeping your needs and interests uppermost in our minds.
As always, please contact me at bruce@brucecrockett.com with any questions or concerns you may have. On behalf of the Board, we look forward to continuing to represent your interests and serving your needs.
Sincerely,

Bruce L. Crockett
Independent Chair
Invesco Funds Board of Trustees
9 Invesco Allocation Funds
Management’s Discussion of Fund Performance
Performance summary – Invesco Conservative Allocation Fund
For the year ended December 31, 2013, Invesco Conservative Allocation Fund underperformed the Fund’s style-specific benchmark, the Custom Conservative Allocation Index. In all, positive absolute performance from global developed market equities drove results throughout the year. Commodities declined overall and experienced meaningful volatility. Government bonds produced positive absolute returns despite rising yields.
Your Fund’s long-term performance appears later in this report.
Fund vs. Indexes
Total returns, 12/31/12 to 12/31/13, at net asset value (NAV). Performance shown does not include applicable contingent deferred sales charges (CDSC) or front-end sales charges, which would have reduced performance.
| Class A Shares | 5.58 | % | |||
| Class B Shares | 4.83 | ||||
| Class C Shares | 4.83 | ||||
| Class R Shares | 5.36 | ||||
| Class S Shares | 5.73 | ||||
| Class Y Shares | 5.91 | ||||
| Class R5 Shares | 5.92 | ||||
| S&P 500 Index‚ (Broad Market Index) | 32.39 | ||||
| Custom Conservative Allocation Indexn (Style-Specific Index) | 7.85 | ||||
| Lipper Mixed-Asset Target Allocation Conservative Funds Index¿ (Peer Group Index) | 7.08 |
Source(s): ‚Invesco, S&P-Dow Jones via FactSet Research Systems Inc.; nInvesco, Lipper Inc.; ¿Lipper Inc.
How we invest
Invesco Conservative Allocation Fund is intended for investors with low to moderate risk tolerance. The Fund invests in underlying mutual funds and exchange-traded funds (underlying funds) diversified among asset classes (stocks, bonds and commodities), investment styles (value, blend/core and growth), regions (domestic and international) and market capitalizations (mid and large). The underlying funds’ targets include bond funds, which represent 54.50% of the portfolio; stock funds, which represent 30.08%; and alternative funds such as global real estate, balanced-risk allocation and commodity funds, which represent the remaining 15.42%.
Investments in Invesco Global Markets Strategy Fund, Invesco Balanced-Risk Allocation Fund and Invesco Balanced-Risk Commodity Strategy Fund, as underlying funds, can shift exposures between equities, sovereign debt and commodities. They gain exposure to their underlying assets through the use of derivatives, specifically futures and swap agreements.
While no fund can guarantee positive performance, the broad portfolio diversification strives to provide exposure to areas of the market that may perform well in any given period. It also attempts to manage exposure to any one area of the market that may underperform.
We establish target asset class weightings and underlying fund
selections for the Fund and monitor the Fund on an ongoing basis. The underlying funds are actively managed by their respective management teams based on individual fund objectives, investment strategies and management techniques.
While the weightings of various underlying funds in the portfolio may vary from their targets during the year due to market fluctuations, cash flows and other factors, we rebalance the portfolio quarterly to maintain its target asset class allocations. There are also additional triggers in place to rebalance intra-quarter if allocations get out of a specified range.
Market conditions and your Fund
The year ended December 31, 2013, experienced volatility from geopolitical issues but, overall, was dominated by strong equity markets.
Equities were the primary driver of results for the first quarter, but gains weren’t uniform across all markets. Bonds also posted gains in the first quarter of the year with German government-issued bonds leading the way as European investors sought perceived safe haven assets after the Italian elections and during the Cyprus banking crisis. Commodities performed strongly at the start of the year, but sold off late in the quarter as weakness in the Chinese and European economies, a rising dollar and increased supplies of agricultural commodities and industrial metals depressed prices.
The second quarter was unusual, with a broad cross-section of markets declining, limiting the benefits of the Fund’s focus on economic diversification. Equities continued to provide narrow leadership across the major asset classes with European and US markets finishing positively, but not keeping pace with the Japanese
Portfolio Composition
| Asset Class | Target Allocation Range | % of Total Net Assets as of 12/31/13 | ||
| Intermediate Term Taxable Investment Grade | 24.52% | 24.34% | ||
| Taxable Non Investment Grade | 14.36 | 14.30 | ||
| Balanced Risk | 10.30 | 10.14 | ||
| Large Cap Value | 8.54 | 8.64 | ||
| International/Global Blend | 4.00 | 4.03 | ||
| Large Cap Growth | 3.85 | 3.94 | ||
| International/Global Growth | 3.68 | 3.72 | ||
| Emerging Markets Fixed Income | 3.27 | 3.22 | ||
| Emerging Markets | 3.20 | 3.14 | ||
| Absolute Return | 3.20 | 3.13 | ||
| Large Cap Blend | 2.97 | 3.01 | ||
| Mid Cap Blend | 2.08 | 2.11 | ||
| Global Real Estate | 1.92 | 1.90 | ||
| Small Cap Blend | 1.76 | 1.79 | ||
| Cash Equivalents Plus Other Assets Less Liabilities | 12.35 | 12.59 |
| Total Net Assets | $351.6 million |
Fund Nasdaq Symbols
| |||||
| Class A Shares | CAAMX | ||||
| Class B Shares | CMBAX | ||||
| Class C Shares | CACMX | ||||
| Class R Shares | CMARX | ||||
| Class S Shares | CMASX | ||||
| Class Y Shares | CAAYX | ||||
| Class R5 Shares | CMAIX | ||||
10 Invesco Allocation Funds
market. Most commodity prices fell, with precious metals suffering the steepest decline. Government bonds sold off across the globe as investors perceived that the US Federal Reserve (the Fed) had signaled its intention to accelerate the reduction and cessation of its bond purchasing programs.
In the third quarter, equities led results as global markets were generally positive, with Europe, US small caps and Hong Kong markets performing especially strong. All four commodity complexes posted gains. Bonds rose marginally as gains were seen in Japanese and German government bonds. However, negative results were seen from the UK, the US, Australia and Canada.
Fourth quarter results were led by US large cap equities which posted double-digit returns, but price advances in Japanese, US small cap and European equities were impressive as well. With the exception of Japan, government bond yields in developed markets drifted higher on fears the Fed would begin tapering its asset purchases, improving economic data and deteriorating investor sentiment for perceived safe haven assets.
Invesco Diversified Dividend Fund, PowerShares FTSE RAFI Developed Markets ex-US Portfolio and Invesco Growth and Income Fund were the top contributors to absolute Fund performance for the reporting period. PowerShares 1-30 Laddered Treasury Portfolio, Invesco Balanced-Risk Commodity Strategy Fund and Invesco Emerging Market Local Currency Debt Fund were the largest absolute detractors from overall Fund performance. Relative to the Fund’s custom style-specific index, Invesco Balanced-Risk Allocation Fund, Invesco Developing Markets Fund and PowerShares 1-30 Laddered Treasury Portfolio were the largest detractors from performance.
Please note that our strategy in managing some of the underlying funds – which include, but are not limited to, Invesco Balanced-Risk Allocation Fund, Invesco Balanced-Risk Commodity Strategy Fund, Invesco Global Markets Strategy Fund and Invesco Core Plus Bond Fund – may be implemented with derivatives, which may create economic leverage in the underlying funds. Derivatives can be a cost-effective way to gain exposure to asset classes. However, derivatives may amplify traditional investment risks through the creation of leverage and may be less liquid than traditional securities.
Finally, we thank you for your continued commitment to Invesco Conservative Allocation Fund.
The views and opinions expressed in management’s discussion of Fund performance are those of Invesco Advisers, Inc. These views and opinions are subject to change at any time based on factors such as market and economic conditions. These views and opinions may not be relied upon as investment advice or recommendations, or as an offer for a particular security. The information is not a complete analysis of every aspect of any market, country, industry, security or the Fund. Statements of fact are from sources considered reliable, but Invesco Advisers, Inc. makes no representation or warranty as to their completeness or accuracy. Although historical performance is no guarantee of future results, these insights may help you understand our investment management philosophy.
See important Fund and, if applicable, index disclosures later in this report.
 | Mark Ahnrud Chartered Financial Analyst, portfolio manager, is manager of Invesco Conservative Allocation Fund. He | |
| joined Invesco in 2000. Mr. Ahnrud earned a BS in finance and investments from Babson College and an MBA from Duke University Fuqua School of Business. | ||
 | Chris Devine Chartered Financial Analyst, portfolio manager, is manager of Invesco Conservative Allocation Fund. He | |
| joined Invesco in 1998. Mr. Devine earned a BA in economics from Wake Forest University and an MBA from the University of Georgia. | ||
 | Scott Hixon Chartered Financial Analyst, portfolio manager, is manager of Invesco Conservative Allocation Fund. He | |
| joined Invesco in 1994. Mr. Hixon earned a BBA in finance from Georgia Southern University and an MBA in finance from Georgia State University. | ||
 | Christian Ulrich Chartered Financial Analyst, portfolio manager, is manager of Invesco Conservative Allocation Fund. He | |
| joined Invesco in 2000. Mr. Ulrich earned the equivalent of a BBA from the KV Zurich Business School in Zurich, Switzerland. | ||
 | Scott Wolle Chartered Financial Analyst, portfolio manager, is manager of Invesco Conservative Allocation Fund. He | |
| joined Invesco in 1999. Mr. Wolle earned a BS in finance from Virginia Polytechnic Institute and State University and an MBA from Duke University Fuqua School of Business. | ||
Assisted by the Global Asset Allocation Team
11 Invesco Allocation Funds
Management’s Discussion of Fund Performance
Performance summary – Invesco Growth Allocation Fund
For the year ended December 31, 2013, Invesco Growth Allocation Fund under-performed the Fund’s style-specific benchmark, the Custom Growth Allocation Index. In all, positive absolute performance from global developed market equities drove results throughout the year. Commodities declined overall and experienced meaningful volatility. Government bonds produced positive absolute returns despite rising yields.
Your Fund’s long-term performance appears later in this report.
Fund vs. Indexes
Total returns, 12/31/12 to 12/31/13, at net asset value (NAV). Performance shown does not include applicable contingent deferred sales charges (CDSC) or front-end sales charges, which would have reduced performance.
| Class A Shares | 15.37 | % | |||
| Class B Shares | 14.41 | ||||
| Class C Shares | 14.50 | ||||
| Class R Shares | 15.08 | ||||
| Class S Shares | 15.49 | ||||
| Class Y Shares | 15.56 | ||||
| Class R5 Shares | 15.75 | ||||
| S&P 500 Index‚ (Broad Market Index) | 32.39 | ||||
| Custom Growth Allocation Indexn (Style-Specific Index) | 21.68 | ||||
| Lipper Multi-Cap Core Funds Index¿ (Peer Group Index) | 32.58 | ||||
| Source(s): ‚Invesco, S&P-Dow Jones via FactSet Research Systems Inc.; nInvesco, Lipper Inc.; ¿Lipper Inc. | |||||
How we invest
Invesco Growth Allocation Fund is intended for investors with relatively high risk tolerance. The Fund invests in underlying mutual funds and exchange-traded funds (underlying funds) diversified among asset classes (stocks, bonds and commodities), investment styles (value, blend/core and growth), regions (domestic and international) and market capitalizations (small, mid and large). The underlying funds’ targets include stock funds, which represent 66.74% of the portfolio; alternative funds such as global real estate, balanced-risk allocation and commodity funds, which represent 26.26%; and one bond fund, which represents the remaining 7%
Investments in Invesco Global Markets Strategy Fund, Invesco Balanced-Risk Allocation Fund and Invesco Balanced-Risk Commodity Strategy Fund, as underlying funds, can shift exposures between equities, sovereign debt and commodities. They gain exposure to their underlying assets through the use of derivatives, specifically futures and swap agreements.
While no fund can guarantee positive performance, the broad portfolio diversification strives to provide exposure to areas of the market that may perform well in any given period. It also attempts to manage exposure to any one area of the market that may underperform.
We establish target asset class weightings and underlying fund
.
selections for the Fund and monitor the Fund on an ongoing basis. The underlying funds are actively managed by their respective management teams based on individual fund objectives, investment strategies and management techniques.
While the weightings of various underlying funds in the portfolio may vary from their targets during the year due to market fluctuations, cash flows and other factors, we rebalance the portfolio quarterly to maintain its target asset class allocations. There are also additional triggers in place to rebalance intra-quarter if allocations get out of a specified range.
Market conditions and your Fund
The year ended December 31, 2013, experienced volatility from geopolitical issues but, overall, was dominated by strong equity markets.
Equities were the primary driver of results for the first quarter, but gains weren’t uniform across all markets. Bonds also posted gains in the first quarter of the year with German government-issued bonds leading the way as European investors sought perceived safe haven assets after the Italian elections and during the Cyprus banking crisis. Commodities performed strongly at the start of the year, but sold off late in the quarter as weakness in the Chinese and European economies, a rising dollar and increased supplies of agricultural commodities and industrial metals depressed prices.
The second quarter was unusual, with a broad cross-section of markets declining, limiting the benefits of the Fund’s focus on economic diversification. Equities continued to provide narrow leadership across the major asset classes with European and US markets finishing positively, but not keeping pace with the Japanese
Portfolio Composition
| Asset Class | Target Allocation Range* | % of Total Net Assets as of 12/31/13 | ||
| Large Cap Value | 18.94% | 19.11% | ||
| Balanced Risk | 16.70 | 16.30 | ||
| International/Global Blend | 8.88 | 8.90 | ||
| Large Cap Growth | 8.56 | 8.70 | ||
| International/Global Growth | 8.17 | 8.24 | ||
| Emerging Markets | 7.10 | 6.93 | ||
| Taxable Non Investment grade | 7.00 | 6.84 | ||
| Large Cap Blend | 6.58 | 6.65 | ||
| Absolute Return | 5.30 | 5.26 | ||
| Mid Cap Blend | 4.62 | 4.67 | ||
| Global Real Estate | 4.26 | 4.20 | ||
| Small Cap Blend | 3.91 | 3.97 | ||
| Cash Equivalents Plus Other Assets Less Liabilities | 0.00 | 0.23 |
*Total may not equal 100% due to rounding.
| Total Net Assets | $1.2 billion |
Fund Nasdaq Symbols
| |||||
| Class A Shares | AADAX | ||||
| Class B Shares | AAEBX | ||||
| Class C Shares | AADCX | ||||
| Class R Shares | AADRX | ||||
| Class S Shares | AADSX | ||||
| Class Y Shares | AADYX | ||||
| Class R5 Shares | AADIX | ||||
| 12 Invesco Allocation Funds |
market. Most commodity prices fell, with precious metals suffering the steepest decline. Government bonds sold off across the globe as investors perceived that the Fed had signaled its intention to accelerate the reduction and cessation of its bond purchasing programs.
In the third quarter, equities led results as global markets were generally positive, with Europe, US small caps and Hong Kong markets performing especially strong. All four commodity complexes posted gains. Bonds rose marginally as gains were seen in Japanese and German government bonds. However, negative results were seen from the UK, the US, Australia and Canada.
Fourth quarter results were led by US large cap equities which posted double-digit returns, but price advances in Japanese, US small cap and European equities were impressive as well. With the exception of Japan, government bond yields in developed markets drifted higher on fears the Fed would begin tapering its asset purchases, improving economic data and deteriorating investor sentiment for perceived safe haven assets.
Invesco Diversified Dividend Fund, PowerShares FTSE RAFI Developed Markets ex-US Portfolio and Invesco Growth and Income Fund were the top contributors to absolute Fund performance for the reporting period. Invesco Balanced-Risk Commodity Strategy Fund, Invesco Developing Markets Fund and Invesco Premium Income Fund were the largest absolute detractors from overall Fund performance. Relative to the Fund’s custom style-specific index, Invesco Developing Markets Fund, Invesco Balanced-Risk Allocation Fund and Invesco Global Real Estate Fund were the largest detractors from performance.
Please note that our strategy in managing some of the underlying funds – which include, but are not limited to, Invesco Balanced-Risk Allocation Fund, Invesco Balanced-Risk Commodity Strategy Fund, Invesco Global Markets Strategy Fund and Invesco Core Plus Bond Fund – may be implemented with derivatives, which may create economic leverage in the underlying funds. Derivatives can be a cost-effective way to gain exposure to asset classes. However, derivatives may amplify traditional investment risks through the creation of leverage and may be less liquid than traditional securities.
Finally, we thank you for your continued commitment to Invesco Growth Allocation Fund.
The views and opinions expressed in management’s discussion of Fund performance are those of Invesco Advisers, Inc. These views and opinions are subject to change at any time based on factors such as market and economic conditions. These views and opinions may not be relied upon as investment advice or recommendations, or as an offer for a particular security. The information is not a complete analysis of every aspect of any market, country, industry, security or the Fund. Statements of fact are from sources considered reliable, but Invesco Advisers, Inc. makes no representation or warranty as to their completeness or accuracy. Although historical performance is no guarantee of future results, these insights may help you understand our investment management philosophy.
See important Fund and, if applicable, index disclosures later in this report.
| Mark Ahnrud Chartered Financial Analyst, portfolio manager, is manager of Invesco Growth Allocation Fund. He joined Invesco in 2000. | |
| Mr. Ahnrud earned a BS in finance and investments from Babson College and an MBA from Duke University Fuqua School of Business. | ||
| Chris Devine Chartered Financial Analyst, portfolio manager, is manager of Invesco Growth Allocation Fund. He joined Invesco in 1998. | |
| Mr. Devine earned a BA in economics from Wake Forest University and an MBA from the University of Georgia. | ||
| Scott Hixon Chartered Financial Analyst, portfolio manager, is manager of Invesco Growth Allocation Fund. He joined Invesco in 1994. | |
| Mr. Hixon earned a BBA in finance from Georgia Southern University and an MBA in finance from Georgia State University. | ||
| Christian Ulrich Chartered Financial Analyst, portfolio manager, is manager of Invesco Growth Allocation Fund. He joined Invesco in 2000. | |
| Mr. Ulrich earned the equivalent of a BBA from the KV Zurich Business School in Zurich, Switzerland. | ||
| Scott Wolle Chartered Financial Analyst, portfolio manager, is manager of Invesco Growth Allocation Fund. He joined Invesco in 1999. | |
| Mr. Wolle earned a BS in finance from Virginia Polytechnic Institute and State University and an MBA from Duke University Fuqua School of Business. | ||
Assisted by the Global Asset Allocation Team
13 Invesco Allocation Funds
Management’s Discussion of Fund Performance
Performance summary – Invesco Moderate Allocation Fund
For the year ended December 31, 2013, Invesco Moderate Allocation Fund under-performed the Fund’s style-specific benchmark, the Custom Moderate Allocation Index. In all, positive absolute performance from global developed market equities drove results throughout the year. Commodities declined overall and experienced meaningful volatility. Government bonds produced positive absolute returns despite rising yields.
Your Fund’s long-term performance appears later in this report.
Fund vs. Indexes
Total returns, 12/31/12 to 12/31/13, at net asset value (NAV). Performance shown does not include applicable contingent deferred sales charges (CDSC) or front-end sales charges, which would have reduced performance.
| Class A Shares | 10.61 | % | |||
| Class B Shares | 9.78 | ||||
| Class C Shares | 9.79 | ||||
| Class R Shares | 10.30 | ||||
| Class S Shares | 10.68 | ||||
| Class Y Shares | 10.84 | ||||
| Class R5 Shares | 10.84 | ||||
| S&P 500 Index‚ (Broad Market Index) | 32.39 | ||||
| Custom Moderate Allocation Indexn (Style-Specific Index) | 15.46 | ||||
| Lipper Mixed-Asset Target Allocation Moderate Funds Index¿ (Peer Group Index) | 14.77 |
Source(s): ‚Invesco, S&P-Dow Jones via FactSet Research Systems Inc.; nInvesco, Lipper Inc.; ¿Lipper Inc.
How we invest
Invesco Moderate Allocation Fund is intended for investors with moderate risk tolerance. The Fund invests in underlying mutual funds and exchange-traded funds (underlying funds) diversified among asset classes (stocks, bonds and commodities), investment styles (value, blend/core and growth), regions (domestic and international) and market capitalizations (small, mid and large). The underlying funds’ targets include stock funds, which represent 48.88% of the portfolio; bond funds, which represent 30.50%; and alternative funds such as global real estate, balanced-risk allocation and commodity, which represent the remaining 20.62%.
Investments in Invesco Global Markets Strategy Fund, Invesco Balanced-Risk Allocation Fund and Invesco Balanced-Risk Commodity Strategy Fund, as underlying funds, can shift exposures between equities, sovereign debt and commodities. They gain exposure to their underlying assets through the use of derivatives, specifically futures and swap agreements.
While no fund can guarantee positive performance, the broad portfolio diversification strives to provide exposure to areas of the market that may perform well in any given period. It also attempts to manage exposure to any one area of the market that may underperform.
We establish target asset class weightings and underlying fund selections for the Fund and monitor the Fund on an ongoing basis. The underlying funds are actively managed by their respective management teams based on individual fund objectives, investment strategies and management techniques.
While the weightings of various underlying funds in the portfolio may vary from their targets during the year due to market fluctuations, cash flows and other factors, we rebalance the portfolio quarterly to maintain its target asset class allocations. There are also additional triggers in place to rebalance intra-quarter if allocations get out of a specified range.
Market conditions and your Fund
The year ended December 31, 2013, experienced volatility from geopolitical issues but, overall, was dominated by strong equity markets.
Equities were the primary driver of results for the first quarter, but gains weren’t uniform across all markets. Bonds also posted gains in the first quarter of the year with German government-issued bonds leading the way as European investors sought perceived safe haven assets after the Italian elections and during the Cyprus banking crisis. Commodities performed strongly at the start of the year, but sold off late in the quarter as weakness in the Chinese and European economies, a rising dollar and increased supplies of agricultural commodities and industrial metals depressed prices.
The second quarter was unusual, with a broad cross-section of markets declining, limiting the benefits of the Fund’s focus on economic diversification. Equities continued to provide narrow
Portfolio Composition
| Asset Class | Target Allocation Range | % of Total Net Assets as of 12/31/13 | ||
| Large Cap Value | 13.87% | 13.93% | ||
| Balanced risk | 13.30 | 12.99 | ||
| Taxable Non Investment Grade | 12.71 | 12.52 | ||
| Intermediate Term Taxable Investment grade | 9.15 | 9.01 | ||
| International/Global Blend | 6.50 | 6.49 | ||
| Large Cap Growth | 6.27 | 6.36 | ||
| International/Global Growth | 5.98 | 6.00 | ||
| Emerging Markets | 5.20 | 5.05 | ||
| Large Cap Blend | 4.82 | 4.85 | ||
| Absolute Return | 4.20 | 4.08 | ||
| Mid Cap Blend | 3.38 | 3.40 | ||
| Global Real Estate | 3.12 | 3.06 | ||
| Small Cap Blend | 2.86 | 2.89 | ||
| Emerging Markets Fixed Income | 2.44 | 2.38 | ||
| Cash Equivalents Plus Other Assets Less Liabilities | 6.20 | 6.99 |
| Total Net Assets | $903.6 million |
Fund Nasdaq Symbols
| |||||
| Class A Shares | AMKAX | ||||
| Class B Shares | AMKBX | ||||
| Class C Shares | AMKCX | ||||
| Class R Shares | AMKRX | ||||
| Class S Shares | AMKSX | ||||
| Class Y Shares | ABKYX | ||||
| Class R5 Shares | AMLIX | ||||
14 Invesco Allocation Funds
leadership across the major asset classes with European and US markets finishing positively, but not keeping pace with the Japanese market. Most commodity prices fell, with precious metals suffering the steepest decline. Government bonds sold off across the globe as investors perceived that the Fed had signaled its intention to accelerate the reduction and cessation of its bond purchasing programs.
In the third quarter, equities led results as global markets were generally positive, with Europe, US small caps and Hong Kong markets performing especially strong. All four commodity complexes posted gains. Bonds rose marginally as gains were seen in Japanese and German government bonds. However, negative results were seen from the UK, the US, Australia and Canada.
Fourth quarter results were led by US large cap equities which posted double-digit returns, but price advances in Japanese, US small cap and European equities were impressive as well. With the exception of Japan, government bond yields in developed markets drifted higher on fears the Fed would begin tapering its asset purchases, improving economic data and deteriorating investor sentiment for perceived safe haven assets.
Invesco Diversified Dividend Fund, PowerShares FTSE RAFI Developed Markets ex-US Portfolio and Invesco Growth and Income Fund were the top contributors to absolute Fund performance for the reporting period. Invesco Balanced-Risk Commodity Strategy Fund, PowerShares 1-30 Laddered Treasury Portfolio and Invesco Emerging Market Local Currency Debt Fund were the largest absolute detractors from overall Fund performance. Relative to the Fund’s custom style-specific index, Invesco Developing Markets Fund, Invesco Balanced-Risk Allocation Fund and Invesco Global Real Estate Fund were the largest detractors from performance.
Please note that our strategy in managing some of the underlying funds – which include, but are not limited to, Invesco Balanced-Risk Allocation Fund, Invesco Balanced-Risk Commodity Strategy Fund, Invesco Global Markets Strategy Fund and Invesco Core Plus Bond Fund – may be implemented with derivatives, which may create economic leverage in the underlying funds. Derivatives can be a cost-effective way to gain exposure to asset classes. However, derivatives may amplify traditional investment risks through the creation of leverage and may be less liquid than traditional securities.
Finally, we thank you for your continued commitment to Invesco Moderate Allocation Fund.
The views and opinions expressed in management’s discussion of Fund performance are those of Invesco Advisers, Inc. These views and opinions are subject to change at any time based on factors such as market and economic conditions. These views and opinions may not be relied upon as investment advice or recommendations, or as an offer for a particular security. The information is not a complete analysis of every aspect of any market, country, industry, security or the Fund. Statements of fact are from sources considered reliable, but Invesco Advisers, Inc. makes no representation or warranty as to their completeness or accuracy. Although historical performance is no guarantee of future results, these insights may help you understand our investment management philosophy.
See important Fund and, if applicable, index disclosures later in this report.
| Mark Ahnrud Chartered Financial Analyst, portfolio manager, is manager of Invesco Moderate Allocation Fund. He joined Invesco in 2000. | |
| Mr. Ahnrud earned a BS in finance and investments from Babson College and an MBA from Duke University Fuqua School of Business. | ||
| Chris Devine Chartered Financial Analyst, portfolio manager, is manager of Invesco Moderate Allocation Fund. He joined Invesco in 1998. | |
| Mr. Devine earned a BA in economics from Wake Forest University and an MBA from the University of Georgia. | ||
| Scott Hixon Chartered Financial Analyst, portfolio manager, is manager of Invesco Moderate Allocation Fund. He joined Invesco in 1994. | |
| Mr. Hixon earned a BBA in finance from Georgia Southern University and an MBA in finance from Georgia State University. | ||
| Christian Ulrich Chartered Financial Analyst, portfolio manager, is manager of Invesco Moderate Allocation Fund. He joined Invesco in 2000. | |
| Mr. Ulrich earned the equivalent of a BBA from the KV Zurich Business School in Zurich, Switzerland. | ||
| Scott Wolle Chartered Financial Analyst, portfolio manager, is manager of Invesco Moderate Allocation Fund. He joined Invesco in 1999. | |
| Mr. Wolle earned a BS in finance from Virginia Polytechnic Institute and State University and an MBA from Duke University Fuqua School of Business. | ||
Assisted by the Global Asset Allocation Team
15 Invesco Allocation Funds
Invesco Conservative Allocation Fund’s investment objective is total return consistent with a lower level of risk relative to the broad stock market.
Invesco Growth Allocation Fund’s investment objective is long-term growth of capital consistent with a higher level of risk relative to the broad stock market.
Invesco Moderate Allocation Fund’s investment objective is total return consistent with a moderate level of risk relative to the broad stock market.
| n | Unless otherwise stated, information presented in this report is as of December 31, 2013, and is based on total net assets. |
| n | Unless otherwise noted, all data provided by Invesco. |
| n | To access your Fund’s reports/prospectus, visit invesco.com/fundreports. |
About share classes
| n | Class B shares may not be purchased for new or additional investments. Please see the prospectus for more information. |
| n | Class R shares are generally available only to employer sponsored retirement and benefit plans. Please see the prospectus for more information. |
| n | Class S shares and Class Y shares are available only to certain investors. Please see the prospectus for more information. |
| n | Class R5 shares are primarily intended for employer sponsored retirement and benefit plans that meet certain standards and for institutional investors. |
Principal risks of investing in the Fund
| Invesco | Invesco | Invesco | ||||||||||
| Conservative | Growth | Moderate | ||||||||||
| Allocation Fund | Allocation Fund | Allocation Fund | ||||||||||
| Call risk | X | X | ||||||||||
| Commodity-linked notes risk | X | X | X | |||||||||
| Commodity risk | X | X | X | |||||||||
| Concentration risk | X | |||||||||||
| Convertible securities risk | X | |||||||||||
| Correlation risk | X | X | X | |||||||||
| Counterparty risk | X | X | X | |||||||||
| Credit linked notes risk | X | |||||||||||
| Credit risk | X | X | X | |||||||||
| Currency/exchange rate risk | X | X | X | |||||||||
| Depositary receipts risk | X | |||||||||||
| Derivatives risk | X | X | X | |||||||||
| Developing/emerging markets securities risk | X | X | X | |||||||||
| Dollar roll transactions risk | X | X | ||||||||||
| Exchange-traded funds risk | X | X | X | |||||||||
| Exchange-traded notes risk | X | X | X | |||||||||
| Financial institutions risk | X | |||||||||||
| Foreign securities risk | X | X | X | |||||||||
| Fund of funds risk | X | X | X | |||||||||
| Geographic focus risk | X | |||||||||||
| Growth investing risk | X | |||||||||||
| High yield bond (junk bond) risk | X | X | X | |||||||||
| Indexing risk | X | X | ||||||||||
| Investing in the European Union risk | X | |||||||||||
| Interest rate risk | X | X | X | |||||||||
| Issuer-specific changes risk | X | X | ||||||||||
| Leverage risk | X | X | X | |||||||||
| Liquidity risk | X | X | X | |||||||||
| Management risk | X | X | X | |||||||||
| Market risk | X | X | X |
16 Invesco Allocation Funds
| Invesco | Invesco | Invesco | ||||||||||
| Conservative | Growth | Moderate | ||||||||||
| Allocation Fund | Allocation Fund | Allocation Fund | ||||||||||
| Market trading risk | X | X | ||||||||||
| Mortgage- and asset-backed securities risk | X | X | X | |||||||||
| Non-correlation risk | X | X | ||||||||||
| Non-diversification risk | X | X | X | |||||||||
| Preferred securities risk | X | |||||||||||
| Reinvestment risk | X | X | X | |||||||||
| Real estate investment trust/real estate risk | X | |||||||||||
| Small- and mid-capitalization risk | X | |||||||||||
| Sovereign debt risk | X | |||||||||||
| Subsidiary risk | X | X | X | |||||||||
| Tax risk | X | X | X | |||||||||
| US government obligations risk | X | X | X | |||||||||
| Value inveseting style risk | X | |||||||||||
| Volatility risk | X | X | X |
Principal risks defined
| n | Call risk. If interest rates fall, it is possible that issuers of debt securities with high interest rates will prepay or call their securities before their maturity dates. In this event, the proceeds from the called securities would likely be reinvested by an underlying fund in securities bearing the new, lower interest rates, resulting in a possible decline in an underlying funds income and distributions to shareholders. |
| n | Commodity-linked notes risk. An underlying fund’s investments in commodity-linked notes may involve substantial risks, including risk of loss of a significant portion of their principal value. In addition to risks associated with the underlying commodities, they may be subject to additional special risks, such as the lack of a secondary trading market and temporary price distortions due to speculators and/or the continuous rolling over of futures contracts underlying the notes. Commodity-linked notes are also subject to counterparty risk, which is the risk that the other party to the contract will not fulfill its contractual obligation to complete the transaction with an underlying fund. |
| n | Commodity risk. Certain of the underlying fund’s significant investment exposure to the commodities markets and/ or a particular sector of the commodities markets may subject the underlying |
fund to greater volatility than investments in traditional securities, such as stocks and bonds. The commodities markets may fluctuate widely based on a variety of factors, including changes in overall market movements, domestic and foreign political and economic events and policies, war, acts of terrorism, changes in domestic or foreign interest rates and/or investor expectations concerning interest rates, domestic and foreign inflation rates and investment and trading activities of mutual funds, hedge funds and commodities funds. Prices of various commodities may also be affected by factors such as drought, floods, weather, livestock disease, embargoes, tariffs and other regulatory developments. The prices of commodities can also fluctuate widely due to supply and demand disruptions in major producing or consuming regions. Because certain of the underlying fund’s performance is linked to the performance of potentially volatile commodities, investors should be willing to assume the risks of potentially significant fluctuations in the value of the underlying fund’s shares.
| n | Concentration risk. To the extent, an underlying fund invests a greater amount in any one sector or industry, an underlying fund’s performance will depend to a greater extent on the overall condition of the sector or industry, |
This report must be accompanied or preceded by a currently effective Fund prospectus, which contains more complete information, including sales charges and expenses. Investors should read it carefully before investing.
NOT FDIC INSURED | MAY LOSE VALUE | NO BANK GUARANTEE
and there is increased risk to an underlying fund if conditions adversely affect that sector or industry.
| n | Convertible securities risk. An underlying fund may own convertible securities, the value of which may be affected by market interest rates, the risk that the issuer will default, the value of the underlying stock or the right of the issuer to buy back the convertible securities. |
| n | Correlation risk. Changes in the value of two investments or asset classes may not track or offset each other in the manner anticipated by the portfolio managers. Because an underlying fund’s investment strategy seeks to balance risk across three asset classes and, within each asset class, to balance risk across different countries and commodities, to the extent either the three asset classes or the selected countries and commodities are correlated in a way not anticipated by the portfolio managers an underlying fund’s risk allocation process may not succeed in achieving its investment objective. |
| n | Counterparty risk. Counterparty risk is the risk that the other party to the contract will not fulfill its contractual obligations, which may cause losses or additional costs to an underlying fund. |
| n | Credit linked notes risk. Risks of credit linked notes include those risks associated with the underlying reference obligation including but not limited to market risk, interest rate risk, credit risk, default risk and foreign currency risk. In the case of a credit linked note created with credit default swaps, the structure will be “funded” such that the par amount of the security will |
continued on page 18
17 Invesco Allocation Funds
continued from page 17
represent the maximum loss that could be incurred on the investment and no leverage is introduced. An investor in a credit linked note bears counterparty risk or the risk that the issuer of the credit linked note will default or become bankrupt and not make timely payment of principal and interest of the structured security.
| n | Credit risk. The issuer of instruments in which the underlying fund invests may be unable to meet interest and/or principal payments, thereby causing its instruments to decrease in value and lowering the issuer’s credit rating. |
| n | Currency/exchange rate risk. The dollar value of an underlying fund’s foreign investments will be affected by changes in the exchange rates between the dollar and the currencies in which those investments are traded. |
| n | Depositary receipts risk. Depositary receipts involve many of the same risks as those associated with direct investment in foreign securities. In addition, the underlying issuers of certain depositary receipts, particularly unsponsored or unregistered depositary receipts, are under no obligation to distribute shareholder communications to the holders of such receipts or to pass through to them any voting rights with respect to the deposited securities. |
| n | Derivatives risk. The value of a derivative instrument depends largely on (and is derived from) the value of an underlying security, currency, commodity, interest rate, index or other asset (each referred to as an underlying asset). In addition to risks relating to the underlying assets, the use of derivatives may include other, possibly greater, risks, including counterparty, leverage and liquidity risks. Counterparty risk is the risk that the counterparty to the derivative contract will default on its obligation to pay an underlying fund the amount owed or otherwise perform under the derivative contract. Derivatives create leverage risk because they do not require payment up front equal to the economic exposure created by owning the derivative. As a result, an adverse change in the value of the underlying asset could result in an underlying fund sustaining a loss that is substantially greater than the amount invested in the derivative, which may make an underlying fund’s returns more volatile and increase the risk of loss. Derivative instruments may also be less liquid than more traditional investments and an underlying fund |
may be unable to sell or close out its derivative positions at a desirable time or price. This risk may be more acute under adverse market conditions, during which an underlying fund may be most in need of liquidating its derivative positions. Derivatives may also be harder to value, less tax efficient and subject to changing government regulation that could impact an underlying fund’s ability to use certain derivatives or their cost. Also, derivatives used for hedging or to gain or limit exposure to a particular market segment may not provide the expected benefits, particularly during adverse market conditions.
| n | Developing/emerging markets securities risk. The prices of securities issued by foreign companies and governments located in developing/emerging markets countries may be affected more negatively by inflation, devaluation of their currencies, higher transaction costs, delays in settlement, adverse political developments, the introduction of capital controls, withholding taxes, nationalization of private assets, expropriation, social unrest, war or lack of timely information than those in developed countries. |
| n | Dollar roll transactions risk. Dollar roll transactions involve the risk that the market value and yield of the securities retained by an underlying fund may decline below the price of the mortgage-related securities sold by the underlying fund that it is obligated to repurchase. |
| n | Exchange-traded funds risk. An investment by an underlying fund in exchange-traded funds generally presents the same primary risks as an investment in a mutual fund. In addition, an exchange-traded fund may be subject to the following: (1) a discount of the exchange-traded fund’s shares to its net asset value; (2) failure to develop an active trading market for the exchange-traded fund’s shares; (3) the listing exchange halting trading of the exchange-traded fund’s shares; (4) failure of the exchange-traded fund’s shares to track the referenced asset; and (5) holding troubled securities in the referenced index or basket of investments. Exchange-traded funds may involve duplication of management fees and certain other expenses, as the underlying fund indirectly bears its proportionate share of any expenses paid by the exchange-traded funds in which it invests. Further, certain of the exchange-traded funds in which the underlying fund may invest are |
leveraged. The more the underlying fund invests in such leveraged exchange-traded funds, the more this leverage will magnify any losses on those investments.
| n | Exchange-traded notes risk. Exchange-traded notes are subject to credit risk, including the credit risk of the issuer, and the value of the exchange-traded note may drop due to a downgrade in the issuer’s credit rating, despite the underlying market benchmark or strategy remaining unchanged. The value of an exchange-traded note may also be influenced by time to maturity, level of supply and demand for the exchange-traded note, volatility and lack of liquidity in the underlying market, changes in the applicable interest rates, changes in the issuer’s credit rating, and economic, legal, political, or geographic events that affect the referenced underlying market or strategy. Exchange-traded notes are also subject to counterparty risk. |
| n | Financial institutions risk. Investments in financial institutions may be subject to certain risks, including, but not limited to, the risk of regulatory actions, changes in interest rates and concentration of loan portfolios in an industry or sector. Financial institutions are highly regulated and may suffer setbacks should regulatory rules and interpretations under which they operate change. Likewise, there is a high level of competition among financial institutions which could adversely affect the viability of an institution. |
| n | Foreign securities risk. An underlying fund’s foreign investments may be affected by changes in a foreign country’s exchange rates, political and social instability; changes in economic or taxation policies, difficulties when enforcing obligations, decreased liquidity, and increased volatility. Foreign companies may be subject to less regulation resulting in less publicly available information about the companies. |
| n | Fund of funds risk. The Fund’s performance depends on the underlying funds in which it invests, and it is subject to the risks of the underlying funds. Market fluctuations may change the target weightings in the underlying funds. The underlying funds may change their investment objectives, policies or practices and may not achieve their investment objectives, all of which may cause the Fund to withdraw its investments therein at a disadvantageous time. |
18 Invesco Allocation Funds
| n | Geographic focus risk. From time to time an underlying fund may invest a substantial amount of its assets in securities of issuers located in a single country or a limited number of countries. If an underlying fund focuses its investments in this manner, it assumes the risk that economic, political and social conditions in those countries will have a significant impact on its investment performance. An underlying fund’s investment performance may also be more volatile if it focuses its investments in certain countries, especially emerging market countries. |
| n | Growth investing risk. Growth stocks tend to be more expensive relative to their earnings or assets compared with other types of stock. As a result they tend to be more sensitive to changes in their earnings and can be more volatile. |
| n | High yield bond (junk bond) risk. Junk bonds involve a greater risk of default or price changes due to changes in the credit quality of the issuer. The values of junk bonds fluctuate more than those of high-quality bonds in response to company, political, regulatory or economic developments. Values of junk bonds can decline significantly over short periods of time. |
| n | Indexing risk. Unlike many investment companies, certain underlying exchange-traded funds do not utilize an investing strategy that seeks returns in excess of their benchmark indexes. Such underlying exchange-traded funds would not necessarily buy or sell a security due to its general under-performance, unless that security is added to or removed from the applicable benchmark index. |
| n | Investing in the European Union risk. Many countries in the European Union are susceptible to high economic risks associated with high levels of debt, notably due to investments in sovereign debts of European countries such as Greece, Italy and Spain. One or more member states might exit the European Union, placing its currency and banking system in jeopardy. The European Union faces major issues involving its membership, structure, procedures and policies, including the adoption, abandonment or adjustment of the new constitutional treaty, the European Union’s enlargement to the south and east, and resolution of the European Union’s problematic fiscal and democratic accountability. Efforts of the member states to further unify their economic and monetary policies may increase the |
potential for the downward movement of one member state’s market to cause a similar effect on other member states’ markets. European countries that are part of the European Economic and Monetary Union may be significantly affected by the tight fiscal and monetary controls that the union seeks to impose on its members.
| n | Interest rate risk. Interest rate risk refers to the risk that bond prices generally fall as interest rates rise; conversely, bond prices generally rise as interest rates fall. Specific bonds differ in their sensitivity to changes in interest rates depending on their individual characteristics, including duration. |
| n | Issuer-specific changes risk. The value of an individual security or particular type of security can be more volatile than the market as a whole and can perform differently from the value of the market as a whole. |
| n | Leverage risk. Leverage exists when an underlying fund purchases or sells an instrument or enters into a transaction without investing cash in an amount equal to the full economic exposure of the asset or transaction and the underlying fund could lose more than it invested. Leverage created from certain types of transactions or instruments may impair an underlying fund’s liquidity, cause it to liquidate positions at an unfavorable time, increase volatility or otherwise not achieve its intended objective. An underlying fund’s significant use of derivatives and leverage could, under certain market conditions, cause the underlying fund’s losses to be more significant than other mutual funds. |
| n | Liquidity risk. An underlying fund may hold illiquid securities that it is unable to sell at the preferred time or price and could lose its entire investment in such securities. An underlying fund’s significant use of derivative instruments may cause liquidity risk to be greater than other mutual funds that invest in more traditional assets such as stocks and bonds, which trade on markets with more participants. |
| n | Management risk. The investment techniques and risk analysis used by the Fund’s and the underlying funds’ portfolio managers may not produce the desired results. Because an underlying fund’s investment process relies heavily on its asset allocation process, market movements that are counter to the portfolio managers’ expectations may have a significant adverse effect |
on an underlying fund’s net asset value. Further, the portfolio managers’ use of instruments that provide economic leverage increases the volatility of an underlying fund’s net asset value, which increases the potential of greater losses that may cause an underlying fund to liquidate positions when it may not be advantageous to do so.
| n | Market risk. The prices of and the income generated by an underlying fund’s securities may decline in response to, among other things, investor sentiment, general economic and market conditions, regional or global instability, and currency and interest rate fluctuations. |
| n | Market trading risk. Risk is inherent in all investing. An investment in an underlying fund involves risks similar to those of investing in any underlying fund of equity or fixed-income securities traded on exchanges. You should anticipate that the value of the shares will decline, more or less, in correlation with any decline in value of the underlying index of certain underlying exchange-traded funds. |
| n | Mortgage- and asset-backed securities risk. Certain of the underlying funds may invest in mortgage- and asset-backed securities that are subject to prepayment or call risk, which is the risk that the borrower’s payments may be received earlier or later than expected due to changes in prepayment rates on underlying loans. Faster prepayments often happen when interest rates are falling. As a result, an underlying fund may reinvest these early payments at lower interest rates, thereby reducing the underlying fund’s income. Conversely, when interest rates rise, prepayments may happen more slowly, causing the security to lengthen in duration. Longer duration securities tend to be more volatile. Securities may be prepaid at a price less than the original purchase value. An unexpectedly high rate of defaults on the mortgages held by a mortgage pool may adversely affect the value of mortgage-backed securities and could result in losses to an underlying fund. The risk of such defaults is generally higher in the case of mortgage pools that include subprime mortgages. Subprime mortgages refer to loans made to borrowers with weakened credit histories or with lower capacity to make timely payments on their mortgages. |
| n | Non-correlation risk. An underlying fund’s return may not match the return |
continued on page 20
19 Invesco Allocation Funds
continued from page 19
of the underlying index of certain underlying exchange-traded funds for a number of reasons. For example, the Fund incurs operating expenses not applicable to the underlying index, and incurs costs in buying and selling securities, especially when rebalancing an underlying fund’s securities holdings to reflect changes in the composition of an underlying index of certain underlying exchange-traded funds. In addition, the performance of an underlying fund and an underlying index of certain underlying exchange-traded funds may vary due to asset valuation differences and differences between an underlying fund’s portfolio and the underlying index of certain underlying exchange-traded funds resulting from legal restrictions, cost or liquidity constraints.
| n | Non-diversification risk. Certain of the underlying funds are non-diversified and can invest a greater portion of their assets in a small number of issuers or a single issuer. A change in the value of the issuer could affect the value of an underlying fund more than if it was a diversified fund. |
| n | Preferred securities risk. Preferred securities may include provisions that permit the issuer, in its discretion, to defer or omit distributions for a certain period of time. If an underlying fund owns a security that is deferring or omitting its distributions, an underlying fund may be required to report the distribution on its tax returns, even though it may not have received this income. Further, preferred securities may lose substantial value due to the omission or deferment of dividend payments. |
| n | Reinvestment risk. Reinvestment risk is the risk that a bond’s cash flows (coupon income and principal repayment) will be reinvested at an interest rate below that on the original bond. |
| n | Real estate investment trust/real estate risk. Investments in real estate related instruments may be affected by economic, legal, cultural, environmental or technological factors that affect property values, rents or occupancies of real estate related to and underlying fund’s holdings. Real estate companies, including REITs or similar structures, tend to be small and mid cap companies, and their shares may be more volatile and less liquid. The value of investments in real estate related companies may be affected by the quality of management, the ability to repay loans, the utilization |
of leverage and financial covenants related thereto, whether the company carries adequate insurance and environmental factors. If a real estate related company defaults, an underlying fund may own real estate directly, which involves the following additional risks: environmental liabilities; difficulty in valuing and selling the real estate; and economic or regulatory changes.
| n | Small- and mid-capitalization risk. |
Stocks of small- and mid-sized companies tend to be more vulnerable to adverse developments and may have little or no operating history or track record of success, and limited product lines, markets, management and financial resources. The securities of small- and mid-sized companies may be more volatile due to less market interest and less publicly available information about the issuer. They also may be illiquid or restricted as to resale, or may trade less frequently and in smaller volumes, all of which may cause difficulty when establishing or closing a position at a desirable price.
| n | Sovereign debt risk. Investments in foreign sovereign debt obligations involve certain risks in addition to those relating to foreign securities or debt securities generally. The issuer of the debt or the governmental authorities that control the repayment of the debt may be unable or unwilling to repay principal or interest when due in accordance with the terms of such debt, and an underlying fund may have limited recourse in the event of a default against the defaulting government. Without the approval of debt holders, some governmental debtors have in the past been able to reschedule or restructure their debt payments or declare moratoria on payments. |
| n | Subsidiary risk. By investing in the Subsidiary, an underlying fund is indirectly exposed to risks associated with the Subsidiary’s investments. The Subsidiary is not registered under the Investment Company Act of 1940, as amended (1940 Act), and except as otherwise noted in the underlying fund’s prospectus, is not subject to the investor protections of the 1940 Act. Changes in the laws of the United States and/or the Cayman Islands, under which the underlying fund and the Subsidiary, respectively, are organized, could result in the inability of the underlying fund and/or the Subsidiary to operate as described in the underlying |
fund prospectus and SAI and could negatively affect the underlying fund and its shareholders.
| n | Tax risk. The tax treatment of commodity-linked derivative instruments may be adversely affected by changes in legislation, regulations or other legally binding authority. If, as a result of any such adverse action, the income of Invesco Balanced-Risk Allocation Fund, an underlying fund, from certain commodity-linked derivatives was treated as non-qualifying income, Invesco Balanced-Risk Allocation Fund might fail to qualify as a regulated investment company and be subject to federal income tax at the Fund level. Invesco Balanced-Risk Allocation Fund has received private letter rulings from the Internal Revenue Service confirming that income derived from its investment in the Subsidiary and a form of commodity-linked notes constitutes qualifying income to Invesco Balanced-Risk Allocation Fund. However, the Internal Revenue Service has suspended issuance of any further private letter rulings pending a review of its position. Should the Internal Revenue Service issue guidance, or Congress enact legislation, that adversely affects the tax treatment of Invesco Balanced-Risk Allocation Fund’s use of commodity-linked notes, or the Subsidiary, it could limit Invesco Balanced-Risk Allocation Fund’s ability to pursue its investment strategy. In this event, Invesco Balanced-Risk Allocation Fund’s Board of Trustees may authorize a significant change in investment strategy or fund liquidation. Invesco Balanced-Risk Allocation Fund also may incur transaction and other costs to comply with any new or additional guidance from the Internal Revenue Service. |
| n | US government obligations risk. An underlying fund may invest in obligations issued by US government agencies and instrumentalities that may receive varying levels of support from the government, which could affect an underlying fund’s ability to recover should they default. |
| n | Value investing style risk. Certain underlying funds emphasize a value style of investing, which focuses on undervalued companies with characteristics for improved valuations. This style of investing is subject to the risk that the valuations never improve or that the returns on value equity securities are less than returns on other |
20 Invesco Allocation Funds
styles of investing or the overall stock market. Value stocks also may decline in price, even though in theory they are already underpriced.
| n | Volatility risk. An underlying fund may have investments that appreciate or decrease significantly in value over short periods of time. This may cause an underlying fund’s net asset value per share to experience significant increases or declines in value over short periods of time. |
About indexes used in this report
| n | The S&P 500® Index is an unmanaged index considered representative of the US stock market. |
| n | The Custom Conservative Allocation Index, created by Invesco to serve as a benchmark for Invesco Conservative Allocation Fund, comprises the S&P 500, the MSCI EAFE® and the Barclays U.S. Aggregate. The composition of the index may change from time to time based on the target asset allocation of the Fund. Therefore, the current composition of the index does not reflect its historical composition and will likely be altered in the future to better reflect the objective of the Fund. |
| n | The Lipper Mixed-Asset Target Allocation Conservative Funds Index is an unmanaged index considered representative of mixed-asset target allocation conservative funds tracked by Lipper. |
| n | The MSCI EAFE Index is an unmanaged index considered representative of stocks of Europe, Australasia and the Far East. The index is computed using the net return, which withholds applicable taxes for non-resident investors. |
| n | The Barclays U.S. Aggregate Index is an unmanaged index considered representative of the US investment-grade, fixed-rate bond market. |
| n | The Custom Growth Allocation Index, created by Invesco to serve as a benchmark for Invesco Growth Allocation Fund, comprises the S&P 500, MSCI EAFE and Barclays U.S. Aggregate indexes. The composition of the index may change from time to time based on the Fund’s target asset allocation. Therefore, the current composition of the index does not reflect its historical composition and will likely be altered in the future to better reflect the objective of the Fund. |
| n | The Lipper Multi-Cap Core Funds Index is an unmanaged index considered representative of multicap core funds tracked by Lipper. |
| n | The Custom Moderate Allocation Index, created by Invesco to serve as a benchmark for Invesco Moderate Allocation Fund, comprises the S&P 500, MSCI EAFE and Barclays U.S. Aggregate indexes. The composition of the index may change from time to time based on the Fund’s target asset allocation. Therefore, the current composition of the index does not reflect its historical composition and will likely be altered in the future to better reflect the objective of the Fund. |
| n | The Lipper Mixed-Asset Target Allocation Moderate Funds Index is an unmanaged index considered representative of mixed-asset target allocation moderate funds tracked by Lipper. |
| n | The Funds are not managed to track the performance of any particular index, including the index(es) described here, and consequently, the performance of a Fund may deviate significantly from the performance of the index(es). |
| n | A direct investment cannot be made in an index. Unless otherwise indicated, index results include reinvested dividends, and they do not reflect sales charges. Performance of the peer group, if applicable, reflects fund expenses; performance of a market index does not. |
Other information
| n | The returns shown in management’s discussion of Fund performance are based on net asset values calculated for shareholder transactions. Generally accepted accounting principles require adjustments to be made to the net assets of the Funds at period end for financial reporting purposes, and as such, the net asset values for shareholder transactions and the returns based on those net asset values may differ from the net asset values and returns reported in the Financial Highlights. |
21 Invesco Allocation Funds
Schedule of Investments
December 31, 2013
Invesco Conservative Allocation Fund
Schedule of Investments in Affiliated Issuers–99.98%(a)
| % of Net Assets 12/31/13 | Value 12/31/12 | Purchases at Cost | Proceeds from Sales | Change in Unrealized Appreciation (Depreciation) | Realized Gain (Loss) | Dividend Income | Shares 12/31/13 | Value 12/31/13 | ||||||||||||||||||||||||||||
Asset Allocation Funds–13.27% |
| |||||||||||||||||||||||||||||||||||
Invesco Balanced-Risk Allocation Fund | 6.21 | % | $ | 31,692,331 | $ | 2,642,967 | $ | (11,634,972 | ) | $ | (1,944,973 | ) | $ | 2,612,205 | $ | — | 1,833,072 | $ | 21,813,558 | |||||||||||||||||
Invesco Balanced-Risk Commodity Strategy Fund | 3.93 | % | 12,458,490 | 5,081,159 | (1,807,002 | ) | (1,746,561 | ) | (169,867 | ) | 9,286 | 1,555,881 | 13,816,219 | |||||||||||||||||||||||
Invesco Global Markets Strategy Fund | 3.13 | % | — | 12,041,080 | (718,083 | ) | (328,826 | ) | 704,487 | — | 1,090,638 | 11,004,540 | ||||||||||||||||||||||||
Total Asset Allocation Funds | 44,150,821 | 19,765,206 | (14,160,057 | ) | (4,020,360 | ) | 3,146,825 | 9,286 | 4,479,591 | 46,634,317 | ||||||||||||||||||||||||||
Domestic Equity Funds–19.49% |
| |||||||||||||||||||||||||||||||||||
Invesco American Franchise Fund | 2.05 | % | 12,692,655 | 522,592 | (8,347,552 | ) | 477,796 | 2,135,941 | 23,504 | 423,566 | 7,204,837 | |||||||||||||||||||||||||
Invesco Charter Fund | 3.01 | % | 9,207,489 | 1,104,648 | (1,761,752 | ) | 1,582,171 | 874,852 | 127,884 | 470,509 | 10,586,455 | |||||||||||||||||||||||||
Invesco Comstock Fund | 2.04 | % | 8,576,123 | 332,143 | (3,902,171 | ) | 1,068,757 | 1,084,223 | 120,845 | 301,308 | 7,159,075 | |||||||||||||||||||||||||
Invesco Diversified Dividend Fund | 3.95 | % | 14,082,019 | 697,328 | (4,077,951 | ) | 2,178,141 | 1,132,313 | 263,406 | 819,958 | 13,881,892 | |||||||||||||||||||||||||
Invesco Endeavor Fund | 2.11 | % | 7,260,880 | 606,434 | (1,979,552 | ) | 1,114,267 | 686,229 | 27,046 | 339,692 | 7,408,691 | |||||||||||||||||||||||||
Invesco Growth and Income Fund | 2.65 | % | 7,098,486 | 1,933,896 | (1,946,200 | ) | 1,675,122 | 783,460 | 156,541 | 345,036 | 9,336,673 | |||||||||||||||||||||||||
Invesco Small Cap Equity Fund | 1.79 | % | 6,041,379 | 635,637 | (1,996,967 | ) | 1,047,662 | 927,289 | — | 350,127 | 6,309,295 | |||||||||||||||||||||||||
PowerShares Fundamental Pure Large Growth Portfolio–ETF | 1.89 | % | — | 6,486,767 | (1,064,750 | ) | 1,129,370 | 128,054 | 117,093 | 233,100 | 6,648,012 | |||||||||||||||||||||||||
Total Domestic Equity Funds | 64,959,031 | 12,319,445 | (25,076,895 | ) | 10,273,286 | 7,752,361 | 836,319 | 3,283,296 | 68,534,930 | |||||||||||||||||||||||||||
Fixed-Income Funds–53.90% |
| |||||||||||||||||||||||||||||||||||
Invesco Core Plus Bond Fund | 24.34 | % | 82,109,944 | 10,062,807 | (3,203,506 | ) | (3,252,996 | ) | (150,046 | ) | 3,152,784 | 8,102,860 | 85,566,203 | |||||||||||||||||||||||
Invesco Emerging Market Local Currency Debt Fund | 3.22 | % | 11,260,263 | 2,538,607 | (857,996 | ) | (1,409,762 | ) | (62,002 | ) | 370,689 | 1,295,377 | 11,334,548 | |||||||||||||||||||||||
Invesco Floating Rate Fund | 5.45 | % | 18,394,352 | 1,975,833 | (1,493,445 | ) | 293,843 | (14,083 | ) | 857,496 | 2,397,559 | 19,156,500 | ||||||||||||||||||||||||
Invesco High Yield Fund | 4.92 | % | 16,825,625 | 1,532,132 | (1,254,400 | ) | 181,816 | 12,343 | 1,028,637 | 3,861,053 | 17,297,516 | |||||||||||||||||||||||||
Invesco Premium Income Fund | 3.93 | % | 13,315,136 | 2,135,722 | (548,594 | ) | (1,081,370 | ) | (11,524 | ) | 757,564 | 1,400,545 | 13,809,370 | |||||||||||||||||||||||
PowerShares 1-30 Laddered Treasury Portfolio | 12.04 | % | 40,437,040 | 7,945,144 | (1,646,993 | ) | (4,282,092 | ) | (102,146 | ) | 969,147 | 1,442,400 | 42,348,864 | |||||||||||||||||||||||
Total Fixed-Income Funds | 182,342,360 | 26,190,245 | (9,004,934 | ) | (9,550,561 | ) | (327,458 | ) | 7,136,317 | 18,499,794 | 189,513,001 | |||||||||||||||||||||||||
Foreign Equity Funds–10.89% |
| |||||||||||||||||||||||||||||||||||
Invesco Developing Markets Fund | 3.14 | % | 11,156,919 | 1,874,651 | (1,581,536 | ) | (509,359 | ) | 111,555 | 140,199 | 340,553 | 11,020,289 | ||||||||||||||||||||||||
Invesco International Core Equity Fund | — | 14,368,042 | — | (13,768,803 | )(e) | (1,029,492 | ) | 1,488,992 | — | — | — | |||||||||||||||||||||||||
Invesco International Growth Fund | 3.72 | % | 12,701,281 | 542,286 | (2,241,207 | ) | 1,658,018 | 427,376 | 189,181 | 381,901 | 13,087,754 | |||||||||||||||||||||||||
PowerShares FTSE RAFI Developed Markets ex-U.S. Portfolio–ETF | 4.03 | % | — | 14,521,682 | (2,423,517 | ) | 1,938,828 | 125,744 | 364,187 | 322,100 | 14,162,737 | |||||||||||||||||||||||||
Total Foreign Equity Funds | 38,226,242 | 16,938,619 | (20,015,063 | ) | 2,057,995 | 2,153,667 | 693,567 | 1,044,554 | 38,270,780 | |||||||||||||||||||||||||||
Real Estate Funds–1.90% |
| |||||||||||||||||||||||||||||||||||
Invesco Global Real Estate Fund | 1.90 | % | 6,801,953 | 1,176,610 | (1,359,156 | ) | (111,486 | ) | 173,269 | 177,920 | 571,042 | 6,681,190 | ||||||||||||||||||||||||
Money Market Funds–0.53% |
| |||||||||||||||||||||||||||||||||||
Liquid Assets Portfolio | 0.26 | % | 530,265 | 29,231,140 | (28,825,056 | ) | — | — | 877 | 936,349 | 936,349 | |||||||||||||||||||||||||
Premier Portfolio | 0.27 | % | 530,266 | 29,231,140 | (28,825,056 | ) | — | — | 468 | 936,350 | 936,350 | |||||||||||||||||||||||||
Total Money Market Funds | 1,060,531 | 58,462,280 | (57,650,112 | ) | — | — | 1,345 | 1,872,699 | 1,872,699 | |||||||||||||||||||||||||||
TOTAL INVESTMENTS IN AFFILIATED ISSUERS (Cost $318,260,916) | 99.98 | % | $ | 337,540,938 | $ | 134,852,405 | $ | (127,266,217 | ) | $ | (1,351,126 | )(b) | $ | 12,898,664 | (c)(d) | $ | 8,854,754 | $ | 351,506,917 | |||||||||||||||||
OTHER ASSETS LESS LIABILITIES | 0.02 | % | �� | 79,802 | ||||||||||||||||||||||||||||||||
NET ASSETS | 100.00 | % | $ | 351,586,719 | ||||||||||||||||||||||||||||||||
Investment Abbreviations:
| ETF | – Exchange Traded Fund |
Notes to Schedule of Investments:
| (a) | Each underlying fund and the Fund are affiliated by either having the same investment adviser or an investment adviser under common control with the Fund’s investment adviser. The Fund invests in Class R6 shares of the mutual funds listed and the Fund shares of the exchange-traded funds. |
| (b) | Includes $134,562 of return of capital from Emerging Markets Local Currency Debt Fund. |
| (c) | Includes $1,058,739 from sales proceeds paid in kind from Invesco International Core Equity Fund. |
| (d) | Includes $1,554,000, $694,118, $276,595, $420,953, $129,958, $279,567, $208,091, $345,705, $31,429, $2,089 and $31,941 of capital gains distributions from Invesco Balanced-Risk Allocation Fund, Invesco Global Markets Strategy Fund, Invesco American Franchise Fund, Invesco Charter Fund, Invesco Diversified Dividend Fund, Invesco Endeavor Fund, Invesco Growth and Income Fund, Invesco Small Cap Equity Fund, PowerShares Fundamental Pure Large Growth Portfolio, PowerShares 1-30 Laddered Treasury Portfolio and Invesco Developing Markets Fund, respectively. |
| (e) | Reflects sales proceeds for securities received as part of the transfer in kind from Invesco International Core Equity Fund. |
See accompanying Notes to Financial Statements which are an integral part of the financial statements.
22 Invesco Allocation Funds
Schedule of Investments—(continued)
December 31, 2013
Invesco Growth Allocation Fund
Schedule of Investments in Affiliated Issuers–100.07%(a)
| % of Net Assets 12/31/13 | Value 12/31/12 | Purchases at Cost | Proceeds from Sales | Transactions in Connection with Acquisitions | Change in Unrealized Appreciation (Depreciation) | Realized Gain (Loss) | Dividend Income | Shares 12/31/13 | Value 12/31/13 | |||||||||||||||||||||||||||||||
Asset Allocation Funds–21.56% |
| |||||||||||||||||||||||||||||||||||||||
Invesco Balanced-Risk Allocation Fund | 10.43 | % | $ | 138,360,305 | $ | 36,336,193 | $ | (46,446,443 | ) | $ | — | $ | (11,796,910 | ) | $ | 15,209,872 | $ | — | 10,328,328 | $ | 122,907,101 | |||||||||||||||||||
Invesco Balanced-Risk Commodity Strategy Fund | 5.87 | % | 48,393,959 | 34,653,587 | (6,226,427 | ) | — | (7,138,869 | ) | (534,678 | ) | 45,109 | 7,786,889 | 69,147,572 | ||||||||||||||||||||||||||
Invesco Global Markets Strategy Fund | 5.26 | % | — | 64,720,942 | (783,600 | ) | — | (2,036,613 | ) | 3,901,153 | — | 6,134,554 | 61,897,648 | |||||||||||||||||||||||||||
Total Asset Allocation Funds | 186,754,264 | 135,710,722 | (53,456,470 | ) | — | (20,972,392 | ) | 18,576,347 | 45,109 | 24,249,771 | 253,952,321 | |||||||||||||||||||||||||||||
Domestic Equity Funds–43.10% |
| |||||||||||||||||||||||||||||||||||||||
Invesco American Franchise Fund | 4.52 | % | 73,055,121 | 10,787,280 | (45,673,514 | ) | — | 6,813,923 | 10,310,177 | 172,203 | 3,130,438 | 53,248,758 | ||||||||||||||||||||||||||||
Invesco Charter Fund | 6.65 | % | 52,806,575 | 20,670,031 | (7,513,474 | ) | — | 10,419,446 | 5,062,091 | 946,223 | 3,481,333 | 78,330,003 | ||||||||||||||||||||||||||||
Invesco Comstock Fund | 4.49 | % | 49,376,152 | 1,947,474 | (72,945,726 | ) | 38,058,871 | 12,566,535 | 23,854,194 | 791,530 | 2,224,642 | 52,857,500 | ||||||||||||||||||||||||||||
Invesco Diversified Dividend Fund | 8.72 | % | 81,206,700 | 21,568,640 | (19,812,546 | ) | — | 14,894,030 | 5,783,972 | 1,727,145 | 6,064,946 | 102,679,545 | ||||||||||||||||||||||||||||
Invesco Endeavor Fund | 4.67 | % | 41,931,648 | 12,484,970 | (8,577,008 | ) | — | 7,047,399 | 4,232,615 | 200,941 | 2,523,732 | 55,042,592 | ||||||||||||||||||||||||||||
Invesco Equity & Income Fund | — | — | — | (60,491,523 | ) | 44,046,167 | — | 16,445,356 | — | — | — | |||||||||||||||||||||||||||||
Invesco Growth and Income Fund | 5.90 | % | 40,861,308 | 24,515,499 | (9,716,927 | ) | — | 10,938,337 | 4,471,470 | 1,044,649 | 2,569,115 | 69,520,255 | ||||||||||||||||||||||||||||
Invesco Small Cap Equity Fund | 3.97 | % | 34,702,602 | 11,131,024 | (9,187,221 | ) | — | 7,360,150 | 5,290,456 | — | 2,593,574 | 46,736,199 | ||||||||||||||||||||||||||||
PowerShares Fundamental Pure Large Growth Portfolio–ETF | 4.18 | % | — | 45,916,207 | (4,788,976 | ) | — | 7,860,928 | 465,277 | 768,056 | 1,726,600 | 49,242,632 | ||||||||||||||||||||||||||||
Total Domestic Equity Funds | 373,940,106 | 149,021,125 | (238,706,915 | ) | 82,105,038 | 77,900,748 | 75,915,608 | 5,650,747 | 24,314,380 | 507,657,484 | ||||||||||||||||||||||||||||||
Fixed-Income Funds–6.84% |
| |||||||||||||||||||||||||||||||||||||||
Invesco Premium Income Fund | 6.84 | % | 60,457,841 | 27,061,462 | (1,696,970 | ) | — | (5,197,698 | ) | (23,809 | ) | 3,921,562 | 8,174,526 | 80,600,826 | ||||||||||||||||||||||||||
Foreign Equity Funds–24.07% |
| |||||||||||||||||||||||||||||||||||||||
Invesco Developing Markets Fund | 6.93 | % | 64,369,718 | 26,552,260 | (6,637,300 | ) | — | (2,969,717 | ) | 485,048 | 1,037,648 | 2,520,507 | 81,563,605 | |||||||||||||||||||||||||||
Invesco International Core Equity Fund | — | 82,819,970 | — | (79,614,532 | )(e) | — | 6,338,383 | (3,687,671 | ) | — | — | — | ||||||||||||||||||||||||||||
Invesco International Growth Fund | 8.24 | % | 73,190,858 | 2,463,778 | (52,983,377 | ) | 49,157,339 | 17,102,681 | 8,138,585 | 1,403,126 | 2,832,503 | 97,069,864 | ||||||||||||||||||||||||||||
PowerShares FTSE RAFI Developed Markets ex-U.S. Portfolio–ETF | 8.90 | % | — | 101,310,812 | (11,002,839 | ) | — | 14,162,211 | 411,457 | 2,453,708 | 2,385,300 | 104,881,641 | ||||||||||||||||||||||||||||
Total Foreign Equity Funds | 220,380,546 | 130,326,850 | (150,238,048 | ) | 49,157,339 | 34,633,558 | 5,347,419 | 4,894,482 | 7,738,310 | 283,515,110 | ||||||||||||||||||||||||||||||
Real Estate Funds–4.20% |
| |||||||||||||||||||||||||||||||||||||||
Invesco Global Real Estate Fund | 4.20 | % | 39,085,902 | 16,279,816 | (5,934,947 | ) | — | 424,297 | (417,419 | ) | 1,208,151 | 4,225,440 | 49,437,649 | |||||||||||||||||||||||||||
Money Market Funds–0.30% |
| |||||||||||||||||||||||||||||||||||||||
Liquid Assets Portfolio | 0.15 | % | 1,627,557 | 133,270,068 | (133,547,719 | ) | 444,256 | — | — | 2,328 | 1,794,162 | 1,794,162 | ||||||||||||||||||||||||||||
Premier Portfolio | 0.15 | % | 1,627,557 | 133,270,069 | (133,547,720 | ) | 444,256 | — | — | 1,272 | 1,794,162 | 1,794,162 | ||||||||||||||||||||||||||||
Total Money Market Funds | 3,255,114 | 266,540,137 | (267,095,439 | ) | 888,512 | — | — | 3,600 | 3,588,324 | 3,588,324 | ||||||||||||||||||||||||||||||
TOTAL INVESTMENTS IN AFFILIATED ISSUERS | 100.07 | % | $ | 883,873,773 | $ | 724,940,112 | $ | (717,128,789 | ) | $ | 132,150,889 | $ | 86,788,513 | (b) | $ | 99,398,146 | (c)(d) | $ | 15,723,651 | $ | 1,178,751,714 | |||||||||||||||||||
OTHER ASSETS LESS LIABILITIES | (0.07 | )% | (838,040 | ) | ||||||||||||||||||||||||||||||||||||
NET ASSETS | 100.00 | % | $ | 1,177,913,674 | ||||||||||||||||||||||||||||||||||||
Investment Abbreviations:
ETF – Exchange Traded Fund
Notes to Schedule of Investments:
| (a) | Each underlying fund and the Fund are affiliated by either having the same investment adviser or an investment adviser under common control with the Fund’s investment adviser. The Fund invests in Class R6 shares of the mutual funds listed. |
| (b) | Includes $50,107,876 of unrealized appreciation from the acquisition of Invesco Leaders Fund. |
| (c) | Includes $5,856,150 from sales proceeds paid in kind from Invesco International Core Equity Fund. |
| (d) | Includes $8,755,916, $3,904,234, $2,044,229, $3,114,666, $961,251, $2,077,032, $1,549,432, $2,560,812, $210,804 and $236,404 of capital gains distributions from Invesco Balanced-Risk Allocation Fund, Invesco Global Markets Strategy Fund, Invesco American Franchise Fund, Invesco Charter Fund, Invesco Diversified Dividend Fund, Invesco Endeavor Fund, Invesco Growth and Income Fund, Invesco Small Cap Equity Fund, PowerShares Fundamental Pure Large Growth Portfolio and Invesco Developing Markets Fund, respectively. |
| (e) | Reflects sales proceeds for securities received as part of the transfer in kind from Invesco International Core Equity Fund. |
See accompanying Notes to Financial Statements which are an integral part of the financial statements.
23 Invesco Allocation Funds
Schedule of Investments—(continued)
December 31, 2013
Invesco Moderate Allocation Fund
Schedule of Investments in Affiliated Issuers–100.00%(a)
| % of Net Assets 12/31/13 | Value 12/31/12 | Purchases at Cost | Proceeds from Sales | Change in Unrealized Appreciation (Depreciation) | Realized Gain (Loss) | Dividend Income | Shares 12/31/13 | Value 12/31/13 | ||||||||||||||||||||||||||||
Asset Allocation Funds–17.07% |
| |||||||||||||||||||||||||||||||||||
Invesco Balanced-Risk Allocation Fund | 8.11 | % | $ | 98,781,435 | $ | 10,537,492 | $ | (32,941,765 | ) | $ | (6,393,026 | ) | $ | 8,512,794 | $ | — | 6,157,705 | $ | 73,276,690 | |||||||||||||||||
Invesco Balanced-Risk Commodity Strategy Fund | 4.88 | % | 36,859,194 | 16,928,871 | (3,877,419 | ) | (5,488,158 | ) | (335,180 | ) | 28,815 | 4,964,787 | 44,087,308 | |||||||||||||||||||||||
Invesco Global Markets Strategy Fund | 4.08 | % | — | 38,408,990 | (459,438 | ) | (1,113,904 | ) | 2,324,702 | — | 3,650,827 | 36,836,843 | ||||||||||||||||||||||||
Total Asset Allocation Funds | 135,640,629 | 65,875,353 | (37,278,622 | ) | (12,995,088 | ) | 10,502,316 | 28,815 | 14,773,319 | 154,200,841 | ||||||||||||||||||||||||||
Domestic Equity Funds–31.43% |
| |||||||||||||||||||||||||||||||||||
Invesco American Franchise Fund | 3.30 | % | 48,931,729 | 2,221,573 | (30,572,085 | ) | 2,940,116 | 7,462,020 | 97,107 | 1,754,138 | 29,837,872 | |||||||||||||||||||||||||
Invesco Charter Fund | 4.85 | % | 35,206,353 | 5,295,699 | (4,653,492 | ) | 6,726,902 | 2,987,857 | 529,354 | 1,947,593 | 43,820,854 | |||||||||||||||||||||||||
Invesco Comstock Fund | 3.27 | % | 32,906,888 | 1,598,065 | (13,479,203 | ) | 4,783,263 | 3,733,289 | 483,276 | 1,243,363 | 29,542,302 | |||||||||||||||||||||||||
Invesco Diversified Dividend Fund | 6.36 | % | 54,455,042 | 3,521,729 | (13,120,686 | ) | 9,367,949 | 3,774,645 | 1,059,302 | 3,394,019 | 57,460,751 | |||||||||||||||||||||||||
Invesco Endeavor Fund | 3.40 | % | 28,059,676 | 2,934,346 | (6,284,483 | ) | 4,592,662 | 2,581,497 | 112,163 | 1,408,726 | 30,724,316 | |||||||||||||||||||||||||
Invesco Growth and Income Fund | 4.30 | % | 27,371,843 | 8,071,790 | (5,520,112 | ) | 7,236,440 | 2,521,558 | 631,707 | 1,434,457 | 38,816,399 | |||||||||||||||||||||||||
Invesco Small Cap Equity Fund | 2.89 | % | 23,254,585 | 2,619,460 | (6,136,026 | ) | 4,678,162 | 3,167,608 | — | 1,451,215 | 26,150,905 | |||||||||||||||||||||||||
PowerShares Fundamental Pure Large Growth Portfolio–ETF | 3.06 | % | — | 25,526,493 | (2,848,605 | ) | 4,693,352 | 383,377 | 471,728 | 968,700 | 27,627,324 | |||||||||||||||||||||||||
Total Domestic Equity Funds | 250,186,116 | 51,789,155 | (82,614,692 | ) | 45,018,846 | 26,611,851 | 3,384,637 | 13,602,211 | 283,980,723 | |||||||||||||||||||||||||||
Fixed-Income Funds–29.91% |
| |||||||||||||||||||||||||||||||||||
Invesco Core Plus Bond Fund | 9.01 | % | 72,668,293 | 12,612,741 | (805,650 | ) | (3,000,822 | ) | (40,480 | ) | 2,898,629 | 7,711,561 | 81,434,082 | |||||||||||||||||||||||
Invesco Emerging Market Local Currency Debt Fund | 2.38 | % | 19,897,071 | 5,341,839 | (827,862 | ) | (2,625,506 | ) | (49,362 | ) | 678,765 | 2,456,246 | 21,492,154 | |||||||||||||||||||||||
Invesco Floating Rate Fund | 3.02 | % | 24,343,755 | 3,894,914 | (1,294,645 | ) | 393,148 | (15,223 | ) | 1,176,402 | 3,419,518 | 27,321,949 | ||||||||||||||||||||||||
Invesco High Yield Fund | 3.64 | % | 29,779,667 | 3,642,618 | (927,360 | ) | 361,193 | 9,241 | 1,881,536 | 7,336,018 | 32,865,359 | |||||||||||||||||||||||||
Invesco Premium Income Fund | 5.86 | % | 47,384,733 | 9,992,153 | (457,635 | ) | (3,975,498 | ) | 11,952 | 2,793,512 | 5,370,761 | 52,955,705 | ||||||||||||||||||||||||
PowerShares 1-30 Laddered Treasury Portfolio | 6.00 | % | 48,192,580 | 11,773,565 | (350,972 | ) | (5,367,969 | ) | (1,948 | ) | 1,197,046 | 1,847,500 | 54,242,600 | |||||||||||||||||||||||
Total Fixed-Income Funds | 242,266,099 | 47,257,830 | (4,664,124 | ) | (14,215,454 | ) | (85,820 | ) | 10,625,890 | 28,141,604 | 270,311,849 | |||||||||||||||||||||||||
Foreign Equity Funds–17.54% |
| |||||||||||||||||||||||||||||||||||
Invesco Developing Markets Fund | 5.05 | % | 42,991,251 | 8,672,011 | (4,245,064 | ) | (1,944,889 | ) | 310,244 | 580,773 | 1,410,730 | 45,651,237 | ||||||||||||||||||||||||
Invesco International Core Equity Fund | — | 55,414,538 | — | (53,259,026 | )(e) | (512,032 | ) | 2,285,511 | — | — | — | |||||||||||||||||||||||||
Invesco International Growth Fund | 6.00 | % | 49,018,310 | 2,057,732 | (5,178,563 | ) | 7,381,687 | 932,580 | 783,620 | 1,581,901 | 54,211,746 | |||||||||||||||||||||||||
PowerShares FTSE RAFI Developed Markets ex-U.S. Portfolio–ETF | 6.49 | % | — | 56,672,866 | (6,414,996 | ) | 8,048,322 | 314,612 | 1,463,533 | 1,333,200 | 58,620,804 | |||||||||||||||||||||||||
Total Foreign Equity Funds | 147,424,099 | 67,402,609 | (69,097,649 | ) | 12,973,088 | 3,842,947 | 2,827,926 | 4,325,831 | 158,483,787 | |||||||||||||||||||||||||||
Real Estate Funds–3.06% |
| |||||||||||||||||||||||||||||||||||
Invesco Global Real Estate Fund | 3.06 | % | 26,119,490 | 4,966,926 | (3,651,813 | ) | (329,024 | ) | 520,259 | 717,110 | 2,361,183 | 27,625,838 | ||||||||||||||||||||||||
Money Market Funds–0.99% |
| |||||||||||||||||||||||||||||||||||
Liquid Assets Portfolio | 0.49 | % | 636,041 | 72,742,440 | (68,909,456 | ) | — | — | 2,627 | 4,469,025 | 4,469,025 | |||||||||||||||||||||||||
Premier Portfolio | 0.50 | % | 636,041 | 72,742,440 | (68,909,456 | ) | — | — | 1,370 | 4,469,025 | 4,469,025 | |||||||||||||||||||||||||
Total Money Market Funds | 1,272,082 | 145,484,880 | (137,818,912 | ) | — | — | 3,997 | 8,938,050 | 8,938,050 | |||||||||||||||||||||||||||
TOTAL INVESTMENTS IN AFFILIATED ISSUERS (Cost $777,469,094) | 100.00 | % | $ | 802,908,515 | $ | 382,776,753 | $ | (335,125,812 | ) | $ | 30,452,368 | (b) | $ | 41,391,553 | (c)(d) | $ | 17,588,375 | $ | 903,541,088 | |||||||||||||||||
OTHER ASSETS LESS LIABILITIES | 0.00 | % | 39,363 | |||||||||||||||||||||||||||||||||
NET ASSETS | 100.00 | % | $ | 903,580,451 | ||||||||||||||||||||||||||||||||
Investment Abbreviations:
ETF – Exchange Traded Fund
Notes to Schedule of Investments:
| (a) | Each underlying fund and the Fund are affiliated by either having the same investment adviser or an investment adviser under common control with the Fund’s investment adviser. The Fund invests in Class R6 shares of the mutual funds listed and the Fund shares of the exchange-traded funds. |
| (b) | Includes $244,026 of return of capital from Invesco Emerging Markets Local Currency Debt Fund. |
| (c) | Includes $3,928,991 from sales proceeds paid in kind from Invesco International Core Equity Fund. |
| (d) | Includes $5,220,240, $2,323,507, $1,145,481, $1,742,465, $537,928, $1,159,382, $865,120, $1,432,884, $127,293, $2,656 and $132,316 of capital gains distributions from Invesco Balanced-Risk Allocation Fund, Invesco Global Markets Strategy Fund, Invesco American Franchise Fund, Invesco Charter Fund, Invesco Diversified Dividend Fund, Invesco Endeavor Fund, Invesco Growth and Income Fund, Invesco Small Cap Equity Fund, PowerShares Fundamental Pure Large Growth Portfolio, PowerShares 1-30 Laddered Treasury Portfolio and Invesco Developing Markets Fund, respectively. |
| (e) | Reflects sales proceeds for securities received as part of the transfer in kind from Invesco International Core Equity Fund. |
See accompanying Notes to Financial Statements which are an integral part of the financial statements.
24 Invesco Allocation Funds
Statement of Assets and Liabilities
December 31, 2013
| Invesco Conservative Allocation Fund | Invesco Growth Allocation Fund | Invesco Moderate Allocation Fund | ||||||||||||||||
Assets: | ||||||||||||||||||
Investments in affiliated underlying funds, at value | $ | 351,506,917 | $ | 1,178,751,714 | $ | 903,541,088 | ||||||||||||
Receivable for: | ||||||||||||||||||
Fund shares sold | 622,652 | 993,251 | 1,700,132 | |||||||||||||||
Dividends — affiliated underlying funds | 171 | 151 | 421 | |||||||||||||||
Investment for trustee deferred compensation and retirement plans | 82,304 | 185,304 | 127,746 | |||||||||||||||
Other assets | 122,126 | 33,886 | 38,721 | |||||||||||||||
Total assets | 352,334,170 | 1,179,964,306 | 905,408,108 | |||||||||||||||
Liabilities: | ||||||||||||||||||
Payable for: | ||||||||||||||||||
Fund shares reacquired | 369,399 | 985,422 | 1,083,714 | |||||||||||||||
Accrued fees to affiliates | 285,163 | 844,972 | 545,085 | |||||||||||||||
Accrued trustees’ and officers’ fees and benefits | 1,450 | 1,525 | 1,294 | |||||||||||||||
Accrued other operating expenses | — | 2,332 | 46,078 | |||||||||||||||
Trustee deferred compensation and retirement plans | 91,439 | 216,381 | 151,486 | |||||||||||||||
Total liabilities | 747,451 | 2,050,632 | 1,827,657 | |||||||||||||||
Net assets applicable to shares outstanding | $ | 351,586,719 | $ | 1,177,913,674 | $ | 903,580,451 | ||||||||||||
Net assets consist of: | ||||||||||||||||||
Shares of beneficial interest | $ | 336,808,300 | $ | 1,182,970,418 | $ | 841,975,906 | ||||||||||||
Undistributed net investment income | 1,840,217 | 1,639,432 | 2,492,777 | |||||||||||||||
Undistributed net realized gain (loss) | (20,307,799 | ) | (207,987,303 | ) | (66,960,226 | ) | ||||||||||||
Unrealized appreciation | 33,246,001 | 201,291,127 | 126,071,994 | |||||||||||||||
| $ | 351,586,719 | $ | 1,177,913,674 | $ | 903,580,451 | |||||||||||||
Net Assets: |
| |||||||||||||||||
Class A | $ | 243,851,733 | $ | 827,241,225 | $ | 628,035,962 | ||||||||||||
Class B | $ | 22,964,805 | $ | 122,521,172 | $ | 64,267,931 | ||||||||||||
Class C | $ | 68,656,608 | $ | 165,853,334 | $ | 147,372,131 | ||||||||||||
Class R | $ | 9,452,870 | $ | 25,393,969 | $ | 23,099,359 | ||||||||||||
Class S | $ | 2,863,411 | $ | 31,973,619 | $ | 35,661,348 | ||||||||||||
Class Y | $ | 3,750,751 | $ | 4,583,871 | $ | 4,912,218 | ||||||||||||
Class R5 | $ | 46,541 | $ | 346,484 | $ | 231,502 | ||||||||||||
Shares outstanding, $0.01 par value per share, | ||||||||||||||||||
Class A | 22,011,659 | 60,780,254 | 51,077,712 | |||||||||||||||
Class B | 2,098,602 | 9,102,960 | 5,264,904 | |||||||||||||||
Class C | 6,261,735 | 12,313,574 | 12,080,406 | |||||||||||||||
Class R | 856,385 | 1,871,071 | 1,882,776 | |||||||||||||||
Class S | 258,159 | 2,351,398 | 2,901,242 | |||||||||||||||
Class Y | 338,943 | 337,430 | 398,940 | |||||||||||||||
Class R5 | 4,181 | 25,356 | 18,760 | |||||||||||||||
Class A: | ||||||||||||||||||
Net asset value per share | $ | 11.08 | $ | 13.61 | $ | 12.30 | ||||||||||||
Maximum offering price per share | $ | 11.72 | $ | 14.40 | $ | 13.02 | ||||||||||||
Class B: | $ | 10.94 | $ | 13.46 | $ | 12.21 | ||||||||||||
Class C: | $ | 10.96 | $ | 13.47 | $ | 12.20 | ||||||||||||
Class R: | $ | 11.04 | $ | 13.57 | $ | 12.27 | ||||||||||||
Class S: | $ | 11.09 | $ | 13.60 | $ | 12.29 | ||||||||||||
Class Y: | $ | 11.07 | $ | 13.58 | $ | 12.31 | ||||||||||||
Class R5: | $ | 11.13 | $ | 13.66 | $ | 12.34 | ||||||||||||
Cost of Investments in affiliated issuers | $ | 318,260,916 | $ | 977,460,587 | $ | 777,469,094 | ||||||||||||
See accompanying Notes to Financial Statements which are an integral part of the financial statements.
25 Invesco Allocation Funds
Statement of Operations
For the year ended December 31, 2013
| Invesco Conservative Allocation Fund | Invesco Growth Allocation Fund | Invesco Moderate Allocation Fund | ||||||||||||||||
Investment income: | ||||||||||||||||||
Dividends from affiliated underlying funds | $ | 8,854,754 | $ | 15,723,651 | $ | 17,588,375 | ||||||||||||
Other Income | 2,517 | 3,573 | 2,170 | |||||||||||||||
Total investment income | 8,857,271 | 15,727,224 | 17,590,545 | |||||||||||||||
Expenses: | ||||||||||||||||||
Administrative services fees | 109,817 | 265,313 | 226,432 | |||||||||||||||
Custodian fees | 6,450 | 7,312 | 10,478 | |||||||||||||||
Distribution fees: | ||||||||||||||||||
Class A | 595,451 | 1,765,699 | 1,462,653 | |||||||||||||||
Class B | 268,393 | 1,090,288 | 714,950 | |||||||||||||||
Class C | 667,395 | 1,475,975 | 1,341,939 | |||||||||||||||
Class R | 46,033 | 121,126 | 113,593 | |||||||||||||||
Class S | 4,267 | 47,873 | 54,596 | |||||||||||||||
Transfer agent fees — A, B, C, R, S and Y | 525,096 | 2,010,165 | 1,212,351 | |||||||||||||||
Transfer agent fees — R5 | 40 | 297 | 265 | |||||||||||||||
Trustees’ and officers’ fees and benefits | 39,775 | 70,518 | 62,374 | |||||||||||||||
Other | 181,420 | 266,753 | 276,647 | |||||||||||||||
Total expenses | 2,444,137 | 7,121,319 | 5,476,278 | |||||||||||||||
Less: Expense offset arrangement(s) | (1,313 | ) | (5,803 | ) | (3,676 | ) | ||||||||||||
Net expenses | 2,442,824 | 7,115,516 | 5,472,602 | |||||||||||||||
Net investment income | 6,414,447 | 8,611,708 | 12,117,943 | |||||||||||||||
Realized and unrealized gain (loss) from: | ||||||||||||||||||
Net realized gain from: | ||||||||||||||||||
Net realized gain on sales of affiliated underlying fund shares | 8,924,218 | 73,983,366 | 26,702,281 | |||||||||||||||
Net realized gain from distributions of affiliated underlying fund shares | 3,974,446 | 25,414,780 | 14,689,272 | |||||||||||||||
Foreign currencies | 8,378 | 48,046 | 32,103 | |||||||||||||||
| 12,907,042 | 99,446,192 | 41,423,656 | ||||||||||||||||
Change in net unrealized appreciation (depreciation) of affiliated underlying fund shares | (1,351,126 | ) | 36,680,637 | 30,452,368 | ||||||||||||||
Net gain from affiliated underlying funds | 11,555,916 | 136,126,829 | 71,876,024 | |||||||||||||||
Net increase in net assets resulting from operations | $ | 17,970,363 | $ | 144,738,537 | $ | 83,993,967 | ||||||||||||
See accompanying Notes to Financial Statements which are an integral part of the financial statements.
26 Invesco Allocation Funds
Statement of Changes in Net Assets
For the years ended December 31, 2013 and 2012
| Invesco Conservative Allocation Fund | Invesco Growth Allocation Fund | Invesco Moderate Allocation Fund | ||||||||||||||||||||||||||||
| 2013 | 2012 | 2013 | 2012 | 2013 | 2012 | |||||||||||||||||||||||||
Operations: | ||||||||||||||||||||||||||||||
Net investment income | $ | 6,414,447 | $ | 7,520,509 | $ | 8,611,708 | $ | 11,807,134 | $ | 12,117,943 | $ | 14,842,077 | ||||||||||||||||||
Net realized gain | 12,907,042 | 3,309,918 | 99,446,192 | 14,198,631 | 41,423,656 | 11,562,446 | ||||||||||||||||||||||||
Change in net unrealized appreciation (depreciation) | (1,351,126 | ) | 22,489,142 | 36,680,637 | 91,229,929 | 30,452,368 | 68,460,231 | |||||||||||||||||||||||
Net increase in net assets resulting from operations | 17,970,363 | 33,319,569 | 144,738,537 | 117,235,694 | 83,993,967 | 94,864,754 | ||||||||||||||||||||||||
Distributions to shareholders from net investment income: | ||||||||||||||||||||||||||||||
Class A | (4,647,640 | ) | (7,648,747 | ) | (12,446,938 | ) | (15,644,861 | ) | (10,935,222 | ) | (19,979,574 | ) | ||||||||||||||||||
Class B | (365,417 | ) | (836,442 | ) | (1,084,205 | ) | (1,864,476 | ) | (910,330 | ) | (2,442,144 | ) | ||||||||||||||||||
Class C | (1,051,977 | ) | (1,668,782 | ) | (1,445,703 | ) | (2,484,578 | ) | (2,008,657 | ) | (3,692,988 | ) | ||||||||||||||||||
Class R | (169,016 | ) | (280,424 | ) | (326,733 | ) | (537,111 | ) | (382,184 | ) | (706,003 | ) | ||||||||||||||||||
Class S | (56,186 | ) | (99,121 | ) | (511,533 | ) | (867,434 | ) | (649,649 | ) | (1,394,591 | ) | ||||||||||||||||||
Class Y | (71,584 | ) | (107,199 | ) | (80,718 | ) | (73,643 | ) | (86,806 | ) | (132,600 | ) | ||||||||||||||||||
Class R5 | (965 | ) | (865 | ) | (6,661 | ) | (5,804 | ) | (4,310 | ) | (17,292 | ) | ||||||||||||||||||
Total distributions from net investment income | (6,362,785 | ) | (10,641,580 | ) | (15,902,491 | ) | (21,477,907 | ) | (14,977,158 | ) | (28,365,192 | ) | ||||||||||||||||||
Share transactions–net: | ||||||||||||||||||||||||||||||
Class A | 7,190,507 | 12,270,308 | 140,441,635 | (21,918,931 | ) | 42,631,811 | 13,170,268 | |||||||||||||||||||||||
Class B | (9,035,955 | ) | (6,263,467 | ) | 11,943,006 | (25,202,878 | ) | (21,556,804 | ) | (21,080,133 | ) | |||||||||||||||||||
Class C | 3,702,689 | 2,354,652 | 16,232,207 | (7,864,664 | ) | 13,443,792 | (1,731,268 | ) | ||||||||||||||||||||||
Class R | 301,000 | (5,973 | ) | (413,281 | ) | (1,745,700 | ) | 726,111 | 980,867 | |||||||||||||||||||||
Class S | (101,678 | ) | 111,476 | (3,918,014 | ) | (2,090,121 | ) | (4,035,573 | ) | (1,706,327 | ) | |||||||||||||||||||
Class Y | 659,463 | 1,696,669 | 1,573,327 | (323,419 | ) | 1,276,437 | 1,283,454 | |||||||||||||||||||||||
Class R5 | 22,421 | (59,424 | ) | 101,940 | 162,813 | (238,928 | ) | (771,577 | ) | |||||||||||||||||||||
Net increase (decrease) in net assets resulting from share transactions | 2,738,447 | 10,104,241 | 165,960,820 | (58,982,900 | ) | 32,246,846 | (9,854,716 | ) | ||||||||||||||||||||||
Net increase in net assets | 14,346,025 | 32,782,230 | 294,796,866 | 36,774,887 | 101,263,655 | 56,644,846 | ||||||||||||||||||||||||
Net assets: | ||||||||||||||||||||||||||||||
Beginning of year | 337,240,694 | 304,458,464 | 883,116,808 | 846,341,921 | 802,316,796 | 745,671,950 | ||||||||||||||||||||||||
End of year* | $ | 351,586,719 | $ | 337,240,694 | $ | 1,177,913,674 | $ | 883,116,808 | $ | 903,580,451 | $ | 802,316,796 | ||||||||||||||||||
* Includes accumulated undistributed net investment income | $ | 1,840,217 | $ | 380,600 | $ | 1,639,432 | $ | 736,234 | $ | 2,492,777 | $ | 489,056 | ||||||||||||||||||
Notes to Financial Statements
December 31, 2013
NOTE 1—Significant Accounting Policies
AIM Growth Series (Invesco Growth Series) (the “Trust”) is organized as a Delaware statutory trust and is registered under the Investment Company Act of 1940, as amended (the “1940 Act”), as an open-end series management investment company consisting of fifteen separate series portfolios (each constituting a “Fund”), each authorized to issue an unlimited number of shares of beneficial interest. The Funds covered in this report, each a series portfolio of the Trust, are Invesco Conservative Allocation Fund, Invesco Growth Allocation Fund and Invesco Moderate Allocation Fund (collectively, the “Funds”). The assets, liabilities and operations of each portfolio are accounted for separately. Information presented in these financial statements pertains only to the Funds. Matters affecting each portfolio or class will be voted on exclusively by the shareholders of such portfolio or class.
The investment objectives of the Funds are: to provide total return consistent with a lower level of risk relative to the broad stock market for Invesco Conservative Allocation Fund, to provide long-term growth of capital consistent with a higher level of risk relative to the broad stock market for Invesco Growth Allocation Fund, and to provide total return consistent with a moderate level of risk relative to the broad stock market for Invesco Moderate Allocation Fund.
27 Invesco Allocation Funds
Each Fund is a “fund of funds,” in that it invests in other mutual funds (“underlying funds”) advised by Invesco Advisers, Inc. (“Invesco”) and exchange-traded funds advised by Invesco Powershares Capital Management LLC (“PowerShares Capital”), an affiliate of Invesco. Invesco and PowerShares Capital are affiliates of each other as they are indirect wholly-owned subsidiaries of Invesco Ltd. Invesco may change each Fund’s asset class allocations, the underlying funds or target weightings in the underlying funds without shareholder approval. The underlying funds may engage in a number of investment techniques and practices, which involve certain risks. Each underlying fund’s accounting policies are outlined in the underlying fund’s financial statements and are publicly available.
Each Fund currently consists of seven different classes of shares: Class A, Class B, Class C, Class R, Class S, Class Y and Class R5. Class A shares are sold with a front-end sales charge unless certain waiver criteria are met and under certain circumstances load waived shares may be subject to contingent deferred sales charges (“CDSC”). Class C shares are sold with a CDSC. Class R, Class S, Class Y and Class R5 shares are sold at net asset value. Effective November 30, 2010, new or additional investments in Class B shares are no longer permitted. Existing shareholders of Class B shares may continue to reinvest dividends and capital gains distributions in Class B shares until they convert to Class A shares. Also, shareholders in Class B shares will be able to exchange those shares for Class B shares of other Invesco Funds offering such shares until they convert to Class A shares. Generally, Class B shares will automatically convert to Class A shares on or about the month-end, which is at least eight years after the date of purchase. Redemption of Class B shares prior to the conversion date will be subject to a CDSC.
The following is a summary of the significant accounting policies followed by the Funds in the preparation of their financial statements.
| A. | Security Valuations — Securities of investment companies that trade on an exchange are valued at the last sales price or official closing price as of the close of the customary trading session on the exchange where the security is principally traded. Investments in shares of funds that are not traded on an exchange are valued at the end of day net asset value per share of such fund. Securities in the underlying funds, including restricted securities, are valued in accordance with the valuation policy of such fund. The policies of the underlying funds affiliated with the funds as a result of having the same investment adviser are set forth below. |
A security listed or traded on an exchange (except convertible bonds) is valued at its last sales price or official closing price as of the close of the customary trading session on the exchange where the security is principally traded, or lacking any sales or official closing price on a particular day, the security may be valued at the closing bid price on that day. Securities traded in the over-the-counter market are valued based on prices furnished by independent pricing services or market makers. When such securities are valued by an independent pricing service they may be considered fair valued. Futures contracts are valued at the final settlement price set by an exchange on which they are principally traded. Listed options are valued at the mean between the last bid and ask prices from the exchange on which they are principally traded. Options not listed on an exchange are valued by an independent source at the mean between the last bid and ask prices. For purposes of determining net asset value per share, futures and option contracts generally are valued 15 minutes after the close of the customary trading session of the New York Stock Exchange (“NYSE”).
Senior secured floating rate loans and senior secured floating rate debt securities are fair valued using an evaluated quote provided by an independent pricing service. Evaluated quotes provided by the pricing service may reflect appropriate factors such as ratings, tranche type, industry, company performance, spread, individual trading characteristics, institution-size trading in similar groups of securities and other market data.
Investments in open-end and closed-end registered investment companies that do not trade on an exchange are valued at the end of day net asset value per share. Investments in open-end and closed-end registered investment companies that trade on an exchange are valued at the last sales price or official closing price as of the close of the customary trading session on the exchange where the security is principally traded.
Debt obligations (including convertible bonds) and unlisted equities are fair valued using an evaluated quote provided by an independent pricing service. Evaluated quotes provided by the pricing service may be determined without exclusive reliance on quoted prices, and may reflect appropriate factors such as institution-size trading in similar groups of securities, developments related to specific securities, dividend rate (for unlisted equities), yield (for debt obligations), quality, type of issue, coupon rate (for debt obligations), maturity (for debt obligations), individual trading characteristics and other market data. Debt obligations are subject to interest rate and credit risks. In addition, all debt obligations involve some risk of default with respect to interest and/or principal payments.
Swap agreements are fair valued using an evaluated quote provided by an independent pricing service. Evaluated quotes provided by the pricing service are valued based on a model which may include end of day net present values, spreads, ratings, industry, and company performance.
Foreign securities’ (including foreign exchange contracts) prices are converted into U.S. dollar amounts using the applicable exchange rates as of the close of the NYSE. If market quotations are available and reliable for foreign exchange-traded equity securities, the securities will be valued at the market quotations. Because trading hours for certain foreign securities end before the close of the NYSE, closing market quotations may become unreliable. If between the time trading ends on a particular security and the close of the customary trading session on the NYSE, events occur that the Adviser determines are significant and make the closing price unreliable, the Fund may fair value the security. If the event is likely to have affected the closing price of the security, the security will be valued at fair value in good faith using procedures approved by the Board of Trustees. Adjustments to closing prices to reflect fair value may also be based on a screening process of an independent pricing service to indicate the degree of certainty, based on historical data, that the closing price in the principal market where a foreign security trades is not the current value as of the close of the NYSE. Foreign securities’ prices meeting the approved degree of certainty that the price is not reflective of current value will be priced at the indication of fair value from the independent pricing service. Multiple factors may be considered by the independent pricing service in determining adjustments to reflect fair value and may include information relating to sector indices, American Depositary Receipts and domestic and foreign index futures. Foreign securities may have additional risks including exchange rate changes, potential for sharply devalued currencies and high inflation, political and economic upheaval, the relative lack of issuer information, relatively low market liquidity and the potential lack of strict financial and accounting controls and standards.
Securities for which market prices are not provided by any of the above methods may be valued based upon quotes furnished by independent sources. The last bid price may be used to value equity securities. The mean between the last bid and asked prices is used to value debt obligations, including corporate loans.
Securities for which market quotations are not readily available or became unreliable are valued at fair value as determined in good faith by or under the supervision of the Trust’s officers following procedures approved by the Board of Trustees. Issuer specific events, market trends, bid/ask quotes of brokers and information providers and other market data may be reviewed in the course of making a good faith determination of a security’s fair value.
28 Invesco Allocation Funds
Valuations change in response to many factors including the historical and prospective earnings of the issuer, the value of the issuer’s assets, general economic conditions, interest rates, investor perceptions and market liquidity. Because of the inherent uncertainties of valuation, the values reflected in the financial statements may materially differ from the value received upon actual sale of those investments.
| B. | Securities Transactions and Investment Income — Securities transactions are accounted for on a trade date basis. Realized gains or losses on sales are computed on the basis of specific identification of the securities sold. Distributions from ordinary income from underlying funds, if any, are recorded as dividend income on ex-dividend date. Distributions from gains from underlying funds, if any, are recorded as realized gains on the ex-dividend date. The following policies are followed by the underlying funds: Interest income is recorded on the accrual basis from settlement date. Bond premiums and discounts are amortized and/or accreted for financial reporting purposes. Paydown gains and losses on mortgage and asset-backed securities are recorded as adjustments to interest income. |
The Fund may periodically participate in litigation related to Fund investments. As such, the Fund may receive proceeds from litigation settlements. Any proceeds received are included in the Statement of Operations as realized gain (loss) for investments no longer held and as unrealized gain (loss) for investments still held.
The Fund allocates income and realized and unrealized capital gains and losses to a class based on the relative net assets of each class.
| C. | Distributions — Effective June 20, 2013, Invesco Conservative Allocation Fund and Invesco Moderate Allocation Fund generally declare and pay dividends from income, if any, quarterly. Invesco Growth Allocation Fund generally declares and pays dividends from income, if any, annually. Prior to June 20, 2013, Invesco Conservative Allocation Fund and Invesco Moderate Allocation Fund declared and paid dividends from income annually. Distributions from net realized capital gains, if any, are generally paid annually and recorded on the ex-dividend date. The Funds may elect to treat a portion of the proceeds from redemptions as distributions for federal income tax purposes. |
| D. | Federal Income Taxes — The Funds intend to comply with the requirements of Subchapter M of the Internal Revenue Code of 1986, as amended (the “Internal Revenue Code”), necessary to qualify as a regulated investment company and to distribute substantially all of the Funds’ taxable earnings to shareholders. As such, the Funds will not be subject to federal income taxes on otherwise taxable income (including net realized capital gain) that is distributed to shareholders. Therefore, no provision for federal income taxes is recorded in the financial statements. |
Each Fund files tax returns in the U.S. Federal jurisdiction and certain other jurisdictions. Generally, each Fund is subject to examinations by such taxing authorities for up to three years after the filing of the return for the tax period.
| E. | Expenses — Expenses included in the accompanying financial statements reflect the expenses of the Funds and do not include any expenses of the underlying funds. The effects of the underlying funds expenses are included in the realized and unrealized gain/loss on the investments in the underlying funds. Estimated expenses of the underlying funds are discussed further within Note 11. |
Fees provided for under the Rule 12b-1 plan of a particular class of each Fund and which are directly attributable to that class are charged to the operations of such class. Transfer agency fees and expenses and other shareholder recordkeeping fees and expenses attributable to Class R5 are charged to such class. Transfer agency fees and expenses and other shareholder recordkeeping fees and expenses relating to all other classes are allocated among those classes based on relative net assets. All other expenses are allocated among the classes based on relative net assets.
| F. | Accounting Estimates — The preparation of financial statements in conformity with accounting principles generally accepted in the United States of America (“GAAP”) requires management to make estimates and assumptions that affect the reported amounts of assets and liabilities at the date of the financial statements and the reported amounts of revenues and expenses during the reporting period including estimates and assumptions related to taxation. Actual results could differ from those estimates by a significant amount. In addition, the Fund monitors for material events or transactions that may occur or become known after the period-end date and before the date the financial statements are released to print. |
| G. | Indemnifications — Under the Trust’s organizational documents, each Trustee, officer, employee or other agent of the Trust is indemnified against certain liabilities that may arise out of the performance of their duties to the Funds. Additionally, in the normal course of business, the Funds enter into contracts, including each Funds’ servicing agreements, that contain a variety of indemnification clauses. Each Fund’s maximum exposure under these arrangements is unknown as this would involve future claims that may be made against such Fund that have not yet occurred. The risk of material loss as a result of such indemnification claims is considered remote. |
NOTE 2—Advisory Fees and Other Fees Paid to Affiliates
The Trust has entered into a master investment advisory agreement with Invesco. Under the terms of the investment advisory agreement, the Funds do not pay an advisory fee. However, each Fund pays advisory fees to Invesco indirectly as a shareholder of the underlying funds.
Under the terms of a master sub-advisory agreement between the Adviser and each of Invesco Asset Management Deutschland GmbH, Invesco Asset Management Limited, Invesco Asset Management (Japan) Limited, Invesco Australia Limited, Invesco Hong Kong Limited, Invesco Senior Secured Management, Inc. and Invesco Canada Ltd. (collectively, the “Affiliated Sub-Advisers”) the Adviser, not the Funds, may pay 40% of the fees paid to the Adviser to any such Affiliated Sub-Adviser(s) that provide(s) discretionary investment management services to each Fund based on the percentage of assets allocated to such Sub-Adviser(s).
Invesco has contractually agreed, through June 30, 2014, to reimburse expenses to the extent necessary to limit total annual fund operating expenses after expense reimbursement (excluding certain items discussed below) of Class A, Class B, Class C, Class R, Class S, Class Y and Class R5 shares for each Fund as shown in the following table:
| Class A | Class B | Class C | Class R | Class S | Class Y | Class R5 | ||||||||||||||||||||||
Invesco Conservative Allocation Fund | 1.50 | % | 2.25 | % | 2.25 | % | 1.75 | % | 1.40 | % | 1.25 | % | 1.25 | % | ||||||||||||||
Invesco Growth Allocation Fund | 2.00 | % | 2.75 | % | 2.75 | % | 2.25 | % | 1.90 | % | 1.75 | % | 1.75 | % | ||||||||||||||
Invesco Moderate Allocation Fund | 1.50 | % | 2.25 | % | 2.25 | % | 1.75 | % | 1.40 | % | 1.25 | % | 1.25 | % | ||||||||||||||
In determining Invesco’s obligation to reimburse expenses, the following expenses are not taken into account, and could cause the total annual fund operating expenses after expense reimbursement to exceed the numbers reflected above: (1) interest; (2) taxes; (3) dividend expense on short sales; (4) extraordinary or non-routine items, including litigation expenses; and (5) expenses that the Fund has incurred but did not actually pay because of an expense offset arrangement. The total annual fund operating expenses used in determining whether each Fund meets or exceeds the
29 Invesco Allocation Funds
expense limitations described above do not include Acquired Fund Fees and Expenses. Acquired Fund Fees and Expenses are not operating expenses of a Fund directly, but are fees and expenses, including management fees of the investment companies in which a Fund invests. As a result, the total annual fund operating expenses after expense reimbursement may exceed the expense limits above. Unless Invesco continues the fee waiver agreement, it will terminate on June 30, 2014. The fee waiver agreement cannot be terminated during its term. The Adviser did not waive fees and/or reimburse expenses during the period under this expense limitation.
The Trust has entered into a master administrative services agreement with Invesco pursuant to which each Fund has agreed to pay Invesco for certain administrative costs incurred in providing accounting services to such Fund. For the year ended December 31, 2013, expenses incurred under the agreement are shown in the Statement of Operations as Administrative services fees.
The Trust has entered into a transfer agency and service agreement with Invesco Investment Services, Inc. (“IIS”) pursuant to which each Fund has agreed to pay IIS a fee for providing transfer agency and shareholder services to the Fund and reimburse IIS for certain expenses incurred by IIS in the course of providing such services. IIS may make payments to intermediaries that provide omnibus account services, sub-accounting services and/or networking services. All fees payable by IIS to intermediaries that provide omnibus account services or sub-accounting are charged back to each Fund, subject to certain limitations approved by the Trust’s Board of Trustees. For the year ended December 31, 2013, expenses incurred under the agreement are shown in the Statement of Operations as Transfer agent fees.
The Trust has entered into master distribution agreements with Invesco Distributors, Inc. (“IDI”) to serve as the distributor for the Class A, Class B, Class C, Class R, Class S and Class R5 shares of each Fund. The Trust has adopted plans pursuant to Rule 12b-1 under the 1940 Act with respect to each Fund’s Class A, Class B, Class C, Class R and Class S shares (collectively, the “Plans”). Each Fund, pursuant to the Plans, pays IDI compensation at the annual rate of 0.25% of the average daily net assets of Class A shares, 1.00% of the average daily net assets of Class B and Class C shares and 0.50% of the average daily net assets of Class R shares and 0.15% of the average daily net assets of Class S shares. Of the Plan payments, up to 0.25% of the average daily net assets of Class A, Class B, Class C and Class R shares and 0.15% of the average daily net assets of Class S shares may be paid to furnish continuing personal shareholder services to customers who purchase and own shares of such classes. Any amounts not paid as a service fee under the Plans would constitute an asset-based sales charge. Rules of the Financial Industry Regulatory Authority (“FINRA”) impose a cap on the total sales charges, including asset-based sales charges, that may be paid by any class of shares of each Fund. For the year ended December 31, 2013, expenses incurred under the Plans are shown in the Statement of Operations as Distribution fees.
Front-end sales commissions and CDSC (collectively, the “sales charges”) are not recorded as expenses of the Funds. Front-end sales commissions are deducted from proceeds from the sales of Fund shares prior to investment in Class A shares of the Funds. CDSC are deducted from redemption proceeds prior to remittance to the shareholder. During the year ended December 31, 2013, IDI advised the Funds that IDI retained the following in front-end sales commissions from the sale of Class A shares and received the following in CDCS imposed on redemptions by shareholders:
| Front End Sales Charges | Contingent Deferred Sales Charges | |||||||||||||||
| Class A | Class A | Class B | Class C | |||||||||||||
Invesco Conservative Allocation Fund | $ | 147,823 | $ | — | $ | 24,612 | $ | 5,708 | ||||||||
Invesco Growth Allocation Fund | 369,540 | 969 | 64,649 | 10,442 | ||||||||||||
Invesco Moderate Allocation Fund | 370,999 | 1,654 | 59,564 | 15,161 | ||||||||||||
The underlying Invesco Funds pay no distribution fees for Class R6 shares and the Funds pay no sales loads or other similar compensation to IDI for acquiring underlying fund shares.
Certain officers and trustees of the Trust are officers and directors of the Adviser, IIS and/or IDI.
NOTE 3—Additional Valuation Information
GAAP defines fair value as the price that would be received to sell an asset or paid to transfer a liability in an orderly transaction between market participants at the measurement date, under current market conditions. GAAP establishes a hierarchy that prioritizes the inputs to valuation methods, giving the highest priority to readily available unadjusted quoted prices in an active market for identical assets (Level 1) and the lowest priority to significant unobservable inputs (Level 3), generally when market prices are not readily available or are unreliable. Based on the valuation inputs, the securities or other investments are tiered into one of three levels. Changes in valuation methods may result in transfers in or out of an investment’s assigned level:
| Level 1 — | Prices are determined using quoted prices in an active market for identical assets. |
| Level 2 — | Prices are determined using other significant observable inputs. Observable inputs are inputs that other market participants may use in pricing a security. These may include quoted prices for similar securities, interest rates, prepayment speeds, credit risk, yield curves, loss severities, default rates, discount rates, volatilities and others. |
| Level 3 — | Prices are determined using significant unobservable inputs. In situations where quoted prices or observable inputs are unavailable (for example, when there is little or no market activity for an investment at the end of the period), unobservable inputs may be used. Unobservable inputs reflect each Fund’s own assumptions about the factors market participants would use in determining fair value of the securities or instruments and would be based on the best available information. |
As of December 31, 2013, all of the securities in each Fund were valued based on Level 1 inputs (see the Schedule of Investments for security categories). The level assigned to the securities valuations may not be an indication of the risk or liquidity associated with investing in those securities. Because of the inherent uncertainties of valuation, the values reflected in the financial statements may materially differ from the value received upon actual sale of those investments.
30 Invesco Allocation Funds
NOTE 4—Expense Offset Arrangement(s)
The expense offset arrangement is comprised of transfer agency credits which result from balances in demand deposit accounts used by the transfer agent for clearing shareholder transactions. For the year ended December 31, 2013, the Funds received credits from this arrangement, which resulted in the reduction of the Funds’ total expenses of:
| Transfer Agent Credits | ||||
Invesco Conservative Allocation Fund | $ | 1,313 | ||
Invesco Growth Allocation Fund | 5,803 | |||
Invesco Moderate Allocation Fund | 3,676 | |||
NOTE 5—Trustees’ and Officers’ Fees and Benefits
Trustees’ and Officers’ Fees and Benefits include amounts accrued by each Fund to pay remuneration to certain Trustees and Officers of such Fund. Trustees have the option to defer compensation payable by the Funds, and Trustees’ and Officers’ Fees and Benefits also include amounts accrued by each Fund to fund such deferred compensation amounts. Those Trustees who defer compensation have the option to select various Invesco Funds in which their deferral accounts shall be deemed to be invested. Finally, certain current Trustees were eligible to participate in a retirement plan that provided for benefits to be paid upon retirement to Trustees over a period of time based on the number of years of service. The Funds may have certain former Trustees who also participate in a retirement plan and receive benefits under such plan. Trustees’ and Officers’ Fees and Benefits include amounts accrued by each Fund to fund such retirement benefits. Obligations under the deferred compensation and retirement plans represent unsecured claims against the general assets of the Funds.
NOTE 6—Cash Balances
The Funds are permitted to temporarily carry a negative or overdrawn balance in their account with State Street Bank and Trust Company, the custodian bank. Such balances, if any at period end, are shown in the Statement of Assets and Liabilities under the payable caption Amount due custodian. To compensate the custodian bank for such overdrafts, the overdrawn Fund may either (1) leave funds as a compensating balance in the account so the custodian bank can be compensated by earning the additional interest; or (2) compensate by paying the custodian bank at a rate agreed upon by the custodian bank and Invesco, not to exceed the contractually agreed upon rate.
NOTE 7—Distributions to Shareholders and Tax Components of Net Assets
Tax Character of Distributions to Shareholders Paid During the Years Ended December 31, 2013 and 2012:
| 2013 | 2012 | |||||||
| Ordinary Income | Ordinary Income | |||||||
Invesco Conservative Allocation Fund | $ | 6,362,785 | $ | 10,641,580 | ||||
Invesco Growth Allocation Fund | 15,902,491 | 21,477,907 | ||||||
Invesco Moderate Allocation Fund | 14,977,158 | 28,365,192 | ||||||
Tax Components of Net Assets at Period-End:
| Undistributed Ordinary Income | Net Unrealized Appreciation Investments | Temporary Book/Tax Differences | Capital Loss Carryforward | Post- October Deferrals | Shares of Beneficial Interest | Total Net Assets | ||||||||||||||||||||||
Invesco Conservative Allocation Fund | $ | 1,922,923 | $ | 25,651,076 | $ | (82,706 | ) | $ | (12,712,874 | ) | $ | — | $ | 336,808,300 | $ | 351,586,719 | ||||||||||||
Invesco Growth Allocation Fund | 1,842,396 | 191,541,877 | (202,964 | ) | (198,238,053 | ) | — | 1,182,970,418 | 1,177,913,674 | |||||||||||||||||||
Invesco Moderate Allocation Fund | 2,636,389 | 116,315,133 | (143,612 | ) | (56,988,267 | ) | (215,098 | ) | 841,975,906 | 903,580,451 | ||||||||||||||||||
The difference between book-basis and tax-basis unrealized appreciation (depreciation) is due to differences in the timing of recognition of gains and losses on investments for tax and book purposes. The Funds net unrealized appreciation differences are attributable primarily to wash sales.
The temporary book/tax differences are a result of timing differences between book and tax recognition of income and/or expenses. The Funds temporary book/tax differences are the result of the trustee deferral of compensation and retirement plan benefits.
Capital loss carryforward is calculated and reported as of a specific date. Results of transactions and other activity after that date may affect the amount of capital loss carryforward actually available for the Funds to utilize. Capital losses generated in years beginning after December 22, 2010 can be carried forward for an unlimited period, whereas previous losses expire in 8 tax years. Capital losses with an expiration period may not be used to offset capital gains until all net capital losses without an expiration date have been utilized. Capital loss carryforwards with no expiration date will retain their character as either short-term or long-term capital losses instead of as short-term capital losses as under prior law. The ability to utilize capital loss carryforward in the future may be limited under the Internal Revenue Code and related regulations based on the results of future transactions.
31 Invesco Allocation Funds
The Funds capital loss carryforward limitations and amounts utilized in the current period to offset net realized capital gain for federal income tax purposes as follows:
| Capital Loss Carryforward Utilized | ||||
Invesco Conservative Allocation Fund | $ | 10,721,989 | ||
Invesco Growth Allocation Fund | 82,659,968 | |||
Invesco Moderate Allocation Fund | 34,527,487 | |||
The Funds have a capital loss carryforward as of December 31, 2013 which expires as follows:
| Invesco Conservative Allocation Fund | Invesco Growth Allocation Fund | Invesco Moderate Allocation Fund | ||||||||||||||||||||||||||||||||||
| Expiration* | Short-Term | Long-Term | Total | Short-Term | Long-Term | Total | Short-Term | Long-Term | Total | |||||||||||||||||||||||||||
December 31, 2016 | $ | — | $ | — | $ | — | $ | 23,040,646 | $ | — | $ | 23,040,646 | $ | — | $ | — | $ | — | ||||||||||||||||||
December 31, 2017 | 3,628,775 | — | 3,628,775 | 107,770,298 | — | 107,770,298 | 5,601,482 | — | 5,601,482 | |||||||||||||||||||||||||||
December 31, 2018 | 9,084,099 | — | 9,084,099 | 67,427,109 | — | 67,427,109 | 51,386,785 | — | 51,386,785 | |||||||||||||||||||||||||||
| * | Capital loss carryforward as of the date listed above is reduced for limitations, if any, to the extent required by the Internal Revenue Code and may be further limited depending upon a variety of factors, including the realization of net unrealized gains or losses as of the date of any reorganization. |
NOTE 8—Investment Securities
The aggregate amount of investment securities purchased and sold by each Fund and aggregate cost and the net unrealized appreciation (depreciation) of investments for tax purposes are as follows:
| For the year ended December 31, 2013* | At December 31, 2013 | |||||||||||||||||||||||
| Federal Tax Cost** | Unrealized Appreciation | Unrealized (Depreciation) | Net Unrealized Appreciation (Depreciation) | |||||||||||||||||||||
| Purchases | Sales | |||||||||||||||||||||||
Invesco Conservative Allocation Fund | $ | 76,390,125 | $ | 69,616,105 | $ | 325,855,841 | $ | 29,195,642 | $ | (3,544,566 | ) | $ | 25,651,076 | |||||||||||
Invesco Growth Allocation Fund | 458,399,975 | 374,823,061 | 987,209,837 | 200,470,156 | (8,928,279 | ) | 191,541,877 | |||||||||||||||||
Invesco Moderate Allocation Fund | 237,291,873 | 197,306,900 | 787,225,955 | 127,937,372 | (11,622,239 | ) | 116,315,133 | |||||||||||||||||
| * | Excludes U.S. Treasury obligations and money market funds, if any. |
| ** | Cost of investments on a tax basis includes the adjustments for financial reporting purposes as of the most recently completed federal income tax reporting period end. |
NOTE 9—Reclassification of Permanent Differences
Primarily as a result of differing book/tax treatment of distributions from underlying funds and expired capital loss carryforwards, on December 31, 2013.
| Undistributed Net Investment Income | Undistributed Net Realized Gain (Loss) | Shares of Beneficial Interest | ||||||||||
Invesco Conservative Allocation Fund | $ | 1,407,955 | $ | (1,407,955 | ) | $ | — | |||||
Invesco Growth Allocation Fund | 8,217,581 | (5,159,382 | ) | (3,058,199 | ) | |||||||
Invesco Moderate Allocation Fund | 4,862,936 | (4,862,936 | ) | — | ||||||||
Further, as a result of tax deferrals acquired in the reorganization of Invesco Leaders Fund into Invesco Growth Allocation Fund,
| Undistributed Net Investment Income | Undistributed Net Realized Gain (Loss) | Shares of Beneficial Interest | ||||||||||
Invesco Growth Allocation Fund | $ | (23,600 | ) | $ | (75,899,131 | ) | $ | 75,922,731 | ||||
These reclassifications had no effect on the net assets of each Fund.
32 Invesco Allocation Funds
NOTE 10—Share Information
Invesco Conservative Allocation Fund
| Summary of Share Activity | ||||||||||||||||
| Years ended December 31, | ||||||||||||||||
| 2013(a) | 2012 | |||||||||||||||
| Shares | Amount | Shares | Amount | |||||||||||||
Sold: | ||||||||||||||||
Class A | 4,933,509 | $ | 54,133,289 | 4,546,179 | $ | 48,358,668 | ||||||||||
Class B | 181,373 | 1,972,074 | 294,544 | 3,098,376 | ||||||||||||
Class C | 2,021,175 | 21,943,308 | 1,346,787 | 14,120,355 | ||||||||||||
Class R | 208,281 | 2,278,990 | 249,040 | 2,616,894 | ||||||||||||
Class S | 8,663 | 95,065 | 23,341 | 247,431 | ||||||||||||
Class Y | 117,607 | 1,295,784 | 274,424 | 2,884,676 | ||||||||||||
Class R5 | 1,988 | 21,970 | — | — | ||||||||||||
Issued as reinvestment of dividends: | ||||||||||||||||
Class A | 394,515 | 4,344,506 | 674,967 | 7,188,400 | ||||||||||||
Class B | 31,600 | 343,804 | 73,932 | 781,467 | ||||||||||||
Class C | 90,588 | 987,555 | 149,106 | 1,579,029 | ||||||||||||
Class R | 15,404 | 169,016 | 26,381 | 280,424 | ||||||||||||
Class S | 5,088 | 56,080 | 9,109 | 97,103 | ||||||||||||
Class Y | 6,305 | 69,363 | 9,660 | 102,692 | ||||||||||||
Class R5 | 42 | 464 | — | — | ||||||||||||
Automatic conversion of Class B shares to Class A shares: | ||||||||||||||||
Class A | 379,499 | 4,171,081 | 373,574 | 3,972,822 | ||||||||||||
Class B | (383,861 | ) | (4,171,081 | ) | (378,561 | ) | (3,972,822 | ) | ||||||||
Reacquired: | ||||||||||||||||
Class A | (5,061,037 | ) | (55,458,369 | ) | (4,459,184 | ) | (47,249,582 | ) | ||||||||
Class B | (662,326 | ) | (7,180,752 | ) | (587,622 | ) | (6,170,488 | ) | ||||||||
Class C | (1,771,800 | ) | (19,228,174 | ) | (1,270,437 | ) | (13,344,732 | ) | ||||||||
Class R | (196,107 | ) | (2,147,006 | ) | (272,058 | ) | (2,903,291 | ) | ||||||||
Class S | (23,141 | ) | (252,823 | ) | (21,973 | ) | (233,058 | ) | ||||||||
Class Y | (64,926 | ) | (705,684 | ) | (122,267 | ) | (1,290,699 | ) | ||||||||
Class R5 | (1 | ) | (13 | ) | (5,540 | ) | (59,424 | ) | ||||||||
Net increase in share activity | 232,438 | $ | 2,738,447 | 933,402 | $ | 10,104,241 | ||||||||||
| (a) | There are entities that are record owners of more than 5% of the outstanding shares of the Fund and in the aggregate own 33% of the outstanding shares of the Fund. IDI has an agreement with these entities to sell Fund shares. The Fund, Invesco and/or Invesco affiliates may make payments to these entities, which are considered to be related to the Fund, for providing services to the Fund, Invesco and/or Invesco affiliates including but not limited to services such as securities brokerage, distribution, third party record keeping and account servicing. The Fund has no knowledge as to whether all or any portion of the shares owned of record by these entities are also owned beneficially. |
33 Invesco Allocation Funds
NOTE 10—Share Information—(continued)
Invesco Growth Allocation Fund
| Summary of Share Activity | ||||||||||||||||
| Years ended December 31, | ||||||||||||||||
| 2013(a) | 2012 | |||||||||||||||
| Shares | Amount | Shares | Amount | |||||||||||||
Sold: | ||||||||||||||||
Class A | 8,311,805 | $ | 107,222,702 | 5,825,149 | $ | 67,963,557 | ||||||||||
Class B | 168,104 | 2,139,658 | 145,644 | 1,672,825 | ||||||||||||
Class C | 2,177,475 | 27,735,707 | 1,450,212 | 16,663,075 | ||||||||||||
Class R | 351,227 | 4,516,168 | 412,240 | 4,779,583 | ||||||||||||
Class S | 174,357 | 2,229,275 | 211,191 | 2,456,852 | ||||||||||||
Class Y | 171,608 | 2,209,248 | 32,751 | 382,804 | ||||||||||||
Class R5 | 13,530 | 176,789 | 13,954 | 167,418 | ||||||||||||
Issued as reinvestment of dividends: | ||||||||||||||||
Class A | 907,935 | 12,139,085 | 1,286,839 | 15,261,907 | ||||||||||||
Class B | 80,078 | 1,059,429 | 154,395 | 1,815,684 | ||||||||||||
Class C | 106,120 | 1,405,034 | 204,610 | 2,406,212 | ||||||||||||
Class R | 24,492 | 326,728 | 45,402 | 537,103 | ||||||||||||
Class S | 38,289 | 511,533 | 73,201 | 867,434 | ||||||||||||
Class Y | 5,402 | 72,116 | 5,751 | 68,084 | ||||||||||||
Class R5 | 480 | 6,444 | 460 | 5,474 | ||||||||||||
Issued in connection with acquisitions:(b) | ||||||||||||||||
Class A | 9,817,179 | 126,474,135 | — | — | ||||||||||||
Class B | 3,022,206 | 38,428,396 | — | — | ||||||||||||
Class C | 1,262,772 | 16,047,786 | — | — | ||||||||||||
Class Y | 78,928 | 1,015,518 | — | — | ||||||||||||
Automatic conversion of Class B shares to Class A shares: | ||||||||||||||||
Class A | 1,145,770 | 14,808,803 | 1,007,572 | 11,805,258 | ||||||||||||
Class B | (1,160,452 | ) | (14,808,803 | ) | (1,019,345 | ) | (11,805,258 | ) | ||||||||
Reacquired: | ||||||||||||||||
Class A | (9,316,203 | ) | (120,203,090 | ) | (10,043,962 | ) | (116,949,653 | ) | ||||||||
Class B | (1,164,915 | ) | (14,875,674 | ) | (1,474,978 | ) | (16,886,129 | ) | ||||||||
Class C | (2,271,534 | ) | (28,956,320 | ) | (2,344,256 | ) | (26,933,951 | ) | ||||||||
Class R | (408,157 | ) | (5,256,177 | ) | (600,190 | ) | (7,062,386 | ) | ||||||||
Class S | (518,320 | ) | (6,658,822 | ) | (463,403 | ) | (5,414,407 | ) | ||||||||
Class Y | (131,965 | ) | (1,723,555 | ) | (66,207 | ) | (774,307 | ) | ||||||||
Class R5 | (6,164 | ) | (81,293 | ) | (858 | ) | (10,079 | ) | ||||||||
Net increase (decrease) in share activity | 12,880,047 | $ | 165,960,820 | (5,143,828 | ) | $ | (58,982,900 | ) | ||||||||
| (a) | There are entities that are record owners of more than 5% of the outstanding shares of the Fund and in the aggregate own 25% of the outstanding shares of the Fund. IDI has an agreement with these entities to sell Fund shares. The Fund, Invesco and/or Invesco affiliates may make payments to these entities, which are considered to be related to the Fund, for providing services to the Fund, Invesco and/or Invesco affiliates including but not limited to services such as securities brokerage, distribution, third party record keeping and account servicing. The Fund has no knowledge as to whether all or any portion of the shares owned of record by these entities are also owned beneficially. |
| (b) | As of the opening of business on July 15, 2013, the Fund acquired all the net assets of Invesco Leaders Fund (the “Target Fund”) pursuant to a plan of reorganization approved by the Trustees of the Fund on December 6, 2012 and by the shareholders of the Target Fund on July 2, 2013. The acquisition was accomplished by a tax-free exchange of 14,181,085 shares of the Fund for 16,087,422 shares outstanding of the Target Fund as of the close of business on July 12, 2013. Shares of the Target Fund were exchanged for the like class of shares of the Fund, based on the relative net asset value of the Target Fund to the net asset value of the Fund on the close of business, July 12, 2013. The Target Fund’s net assets as of the close of business on July 12, 2013 of $181,965,835, including $50,107,876 of unrealized appreciation, were combined with those of the Fund. The net assets of the Fund immediately before the acquisition were $935,420,237 and $1,117,386,072 immediately after the acquisition. |
| The pro forma results of operations for the year ended December 31, 2013 assuming the reorganization had been completed on January 1, 2013, the beginning of the annual reporting period are as follows: |
Net investment income | $ | 8,777,032 | ||
Net realized/unrealized gains | 159,360,649 | |||
Change in net assets resulting from operations | $ | 168,137,681 |
| The combined investment portfolios have been managed as a single integrated portfolio since the acquisition was completed, it is not practicable to separate the amounts of revenue and earnings of the Target Fund that have been included in the Fund’s Statement of Operations since July 15, 2013. |
34 Invesco Allocation Funds
NOTE 10—Share Information—(continued)
Invesco Moderate Allocation Fund
| Summary of Share Activity | ||||||||||||||||
| Years ended December 31, | ||||||||||||||||
| 2013(a) | 2012 | |||||||||||||||
| Shares | Amount | Shares | Amount | |||||||||||||
Sold: | ||||||||||||||||
Class A | 10,462,040 | $ | 124,386,470 | 7,481,234 | $ | 83,710,897 | ||||||||||
Class B | 258,581 | 3,065,014 | 317,478 | 3,502,321 | ||||||||||||
Class C | 3,484,238 | 41,284,887 | 1,581,941 | 17,538,747 | ||||||||||||
Class R | 503,011 | 5,948,675 | 413,876 | 4,581,033 | ||||||||||||
Class S | 135,561 | 1,606,065 | 257,468 | 2,878,725 | ||||||||||||
Class Y | 202,552 | 2,442,553 | 184,207 | 2,055,080 | ||||||||||||
Class R5 | 6,499 | 77,233 | 41,661 | 461,630 | ||||||||||||
Issued as reinvestment of dividends: | ||||||||||||||||
Class A | 861,985 | 10,465,341 | 1,701,207 | 19,121,562 | ||||||||||||
Class B | 73,115 | 882,135 | 211,217 | 2,367,746 | ||||||||||||
Class C | 160,368 | 1,933,325 | 317,485 | 3,555,835 | ||||||||||||
Class R | 31,191 | 377,840 | 62,042 | 696,735 | ||||||||||||
Class S | 53,462 | 649,047 | 124,086 | 1,393,489 | ||||||||||||
Class Y | 4,515 | 54,907 | 8,331 | 93,639 | ||||||||||||
Class R5 | 333 | 4,052 | 1,489 | 16,777 | ||||||||||||
Automatic conversion of Class B shares to Class A shares: | ||||||||||||||||
Class A | 1,209,247 | 14,363,716 | 1,070,655 | 12,038,704 | ||||||||||||
Class B | (1,216,987 | ) | (14,363,716 | ) | (1,078,355 | ) | (12,038,704 | ) | ||||||||
Reacquired: | ||||||||||||||||
Class A | (8,957,005 | ) | (106,583,716 | ) | (9,101,222 | ) | (101,700,895 | ) | ||||||||
Class B | (943,395 | ) | (11,140,237 | ) | (1,346,797 | ) | (14,911,496 | ) | ||||||||
Class C | (2,518,091 | ) | (29,774,420 | ) | (2,066,188 | ) | (22,825,850 | ) | ||||||||
Class R | (468,819 | ) | (5,600,404 | ) | (383,832 | ) | (4,296,901 | ) | ||||||||
Class S | (527,533 | ) | (6,290,685 | ) | (535,835 | ) | (5,978,541 | ) | ||||||||
Class Y | (101,242 | ) | (1,221,023 | ) | (77,617 | ) | (865,265 | ) | ||||||||
Class R5 | (27,147 | ) | (320,213 | ) | (110,631 | ) | (1,249,984 | ) | ||||||||
Net increase (decrease) in share activity | 2,686,479 | $ | 32,246,846 | (926,100 | ) | $ | (9,854,716 | ) | ||||||||
| (a) | There is an entity that is a record owner of more than 5% of the outstanding shares of the Fund and owns 22% of the outstanding shares of the Fund. IDI has an agreement with this entity to sell Fund shares. The Fund, Invesco and/or Invesco affiliates may make payments to this entity, which is considered to be related to the Fund, for providing services to the Fund, Invesco and/or Invesco affiliates including but not limited to services such as, securities brokerage, distribution, third party record keeping and account servicing. The Fund has no knowledge as to whether all or any portion of the shares owned of record by this entity are also owned beneficially. |
35 Invesco Allocation Funds
NOTE 11—Financial Highlights
The following schedule presents financial highlights for a share of each Fund outstanding throughout the periods indicated.
Invesco Conservative Allocation Fund
| Net asset value, beginning of period | Net investment income(a) | Net gains (losses) on securities (both realized and unrealized) | Total from investment operations | Dividends from net investment income | Net asset value, end of period | Total return(b) | Net assets, end of period (000s omitted) | Ratio of expenses to average net assets with fee waivers and/or expense reimbursements(c) | Ratio of expenses to average net assets without fee waivers and/or expense reimbursements | Ratio of net investment income to average net assets | Portfolio turnover(d) | |||||||||||||||||||||||||||||||||||||
Class A |
| |||||||||||||||||||||||||||||||||||||||||||||||
Year ended 12/31/13 | $ | 10.70 | $ | 0.23 | $ | 0.37 | $ | 0.60 | $ | (0.22 | ) | $ | 11.08 | 5.58 | % | $ | 243,852 | 0.50 | %(e) | 0.50 | %(e) | 2.06 | %(e) | 20 | % | |||||||||||||||||||||||
Year ended 12/31/12 | 9.95 | 0.27 | 0.85 | 1.12 | (0.37 | ) | 10.70 | 11.28 | 228,512 | 0.46 | 0.49 | 2.55 | 9 | |||||||||||||||||||||||||||||||||||
Year ended 12/31/11 | 9.94 | 0.33 | 0.04 | 0.37 | (0.36 | ) | 9.95 | 3.77 | 201,299 | 0.39 | 0.53 | 3.26 | 27 | |||||||||||||||||||||||||||||||||||
Year ended 12/31/10 | 9.35 | 0.29 | 0.58 | 0.87 | (0.28 | ) | 9.94 | 9.33 | 46,954 | 0.39 | 0.73 | 3.04 | 70 | |||||||||||||||||||||||||||||||||||
Year ended 12/31/09 | 8.35 | 0.32 | 1.12 | 1.44 | (0.44 | ) | 9.35 | 17.28 | 41,152 | 0.39 | 0.71 | 3.66 | 26 | |||||||||||||||||||||||||||||||||||
Class B |
| |||||||||||||||||||||||||||||||||||||||||||||||
Year ended 12/31/13 | 10.60 | 0.14 | 0.37 | 0.51 | (0.17 | ) | 10.94 | 4.83 | 22,965 | 1.25 | (e) | 1.25 | (e) | 1.31 | (e) | 20 | ||||||||||||||||||||||||||||||||
Year ended 12/31/12 | 9.87 | 0.19 | 0.83 | 1.02 | (0.29 | ) | 10.60 | 10.33 | 31,090 | 1.21 | 1.24 | 1.80 | 9 | |||||||||||||||||||||||||||||||||||
Year ended 12/31/11 | 9.88 | 0.25 | 0.05 | 0.30 | (0.31 | ) | 9.87 | 3.06 | 34,832 | 1.14 | 1.28 | 2.51 | 27 | |||||||||||||||||||||||||||||||||||
Year ended 12/31/10 | 9.30 | 0.22 | 0.56 | 0.78 | (0.20 | ) | 9.88 | 8.45 | 9,032 | 1.14 | 1.48 | 2.29 | 70 | |||||||||||||||||||||||||||||||||||
Year ended 12/31/09 | 8.31 | 0.26 | 1.11 | 1.37 | (0.38 | ) | 9.30 | 16.46 | 9,129 | 1.14 | 1.46 | 2.91 | 26 | |||||||||||||||||||||||||||||||||||
Class C |
| |||||||||||||||||||||||||||||||||||||||||||||||
Year ended 12/31/13 | 10.63 | 0.14 | 0.36 | 0.50 | (0.17 | ) | 10.96 | 4.73 | 68,657 | 1.25 | (e) | 1.25 | (e) | 1.31 | (e) | 20 | ||||||||||||||||||||||||||||||||
Year ended 12/31/12 | 9.89 | 0.19 | 0.84 | 1.03 | (0.29 | ) | 10.63 | 10.41 | 62,919 | 1.21 | 1.24 | 1.80 | 9 | |||||||||||||||||||||||||||||||||||
Year ended 12/31/11 | 9.90 | 0.25 | 0.05 | 0.30 | (0.31 | ) | 9.89 | 3.05 | 56,322 | 1.14 | 1.28 | 2.51 | 27 | |||||||||||||||||||||||||||||||||||
Year ended 12/31/10 | 9.32 | 0.22 | 0.56 | 0.78 | (0.20 | ) | 9.90 | 8.43 | 14,494 | 1.14 | 1.48 | 2.29 | 70 | |||||||||||||||||||||||||||||||||||
Year ended 12/31/09 | 8.33 | 0.26 | 1.11 | 1.37 | (0.38 | ) | 9.32 | 16.42 | 14,731 | 1.14 | 1.46 | 2.91 | 26 | |||||||||||||||||||||||||||||||||||
Class R |
| |||||||||||||||||||||||||||||||||||||||||||||||
Year ended 12/31/13 | 10.67 | 0.20 | 0.37 | 0.57 | (0.20 | ) | 11.04 | 5.36 | 9,453 | 0.75 | (e) | 0.75 | (e) | 1.81 | (e) | 20 | ||||||||||||||||||||||||||||||||
Year ended 12/31/12 | 9.93 | 0.24 | 0.84 | 1.08 | (0.34 | ) | 10.67 | 10.92 | 8,845 | 0.71 | 0.74 | 2.30 | 9 | |||||||||||||||||||||||||||||||||||
Year ended 12/31/11 | 9.92 | 0.30 | 0.05 | 0.35 | (0.34 | ) | 9.93 | 3.60 | 8,197 | 0.64 | 0.78 | 3.01 | 27 | |||||||||||||||||||||||||||||||||||
Year ended 12/31/10 | 9.34 | 0.27 | 0.56 | 0.83 | (0.25 | ) | 9.92 | 8.96 | 3,241 | 0.64 | 0.98 | 2.79 | 70 | |||||||||||||||||||||||||||||||||||
Year ended 12/31/09 | 8.34 | 0.30 | 1.12 | 1.42 | (0.42 | ) | 9.34 | 17.05 | 2,580 | 0.64 | 0.96 | 3.41 | 26 | |||||||||||||||||||||||||||||||||||
Class S |
| |||||||||||||||||||||||||||||||||||||||||||||||
Year ended 12/31/13 | 10.70 | 0.24 | 0.37 | 0.61 | (0.22 | ) | 11.09 | 5.73 | 2,863 | 0.40 | (e) | 0.40 | (e) | 2.16 | (e) | 20 | ||||||||||||||||||||||||||||||||
Year ended 12/31/12 | 9.96 | 0.28 | 0.84 | 1.12 | (0.38 | ) | 10.70 | 11.27 | 2,864 | 0.36 | 0.39 | 2.65 | 9 | |||||||||||||||||||||||||||||||||||
Year ended 12/31/11(f) | 10.09 | 0.19 | (0.17 | ) | 0.02 | (0.15 | ) | 9.96 | 0.24 | 2,560 | 0.29 | (g) | 0.43 | (g) | 3.36 | (g) | 27 | |||||||||||||||||||||||||||||||
Class Y |
| |||||||||||||||||||||||||||||||||||||||||||||||
Year ended 12/31/13 | 10.67 | 0.25 | 0.38 | 0.63 | (0.23 | ) | 11.07 | 5.91 | 3,751 | 0.25 | (e) | 0.25 | (e) | 2.31 | (e) | 20 | ||||||||||||||||||||||||||||||||
Year ended 12/31/12 | 9.93 | 0.30 | 0.84 | 1.14 | (0.40 | ) | 10.67 | 11.46 | 2,987 | 0.21 | 0.24 | 2.80 | 9 | |||||||||||||||||||||||||||||||||||
Year ended 12/31/11 | 9.92 | 0.35 | 0.04 | 0.39 | (0.38 | ) | 9.93 | 3.94 | 1,173 | 0.14 | 0.28 | 3.51 | 27 | |||||||||||||||||||||||||||||||||||
Year ended 12/31/10 | 9.34 | 0.32 | 0.56 | 0.88 | (0.30 | ) | 9.92 | 9.49 | 41 | 0.14 | 0.48 | 3.29 | 70 | |||||||||||||||||||||||||||||||||||
Year ended 12/31/09 | 8.35 | 0.35 | 1.11 | 1.46 | (0.47 | ) | 9.34 | 17.54 | 70 | 0.14 | 0.46 | 3.91 | 26 | |||||||||||||||||||||||||||||||||||
Class R5 |
| |||||||||||||||||||||||||||||||||||||||||||||||
Year ended 12/31/13 | 10.73 | 0.26 | 0.37 | 0.63 | (0.23 | ) | 11.13 | 5.92 | 47 | 0.20 | (e) | 0.20 | (e) | 2.36 | (e) | 20 | ||||||||||||||||||||||||||||||||
Year ended 12/31/12 | 9.98 | 0.30 | 0.85 | 1.15 | (0.40 | ) | 10.73 | 11.56 | 23 | 0.17 | 0.21 | 2.83 | 9 | |||||||||||||||||||||||||||||||||||
Year ended 12/31/11 | 9.96 | 0.35 | 0.05 | 0.40 | (0.38 | ) | 9.98 | 4.03 | 77 | 0.14 | 0.21 | 3.51 | 27 | |||||||||||||||||||||||||||||||||||
Year ended 12/31/10 | 9.37 | 0.32 | 0.57 | 0.89 | (0.30 | ) | 9.96 | 9.57 | 32 | 0.14 | 0.36 | 3.29 | 70 | |||||||||||||||||||||||||||||||||||
Year ended 12/31/09 | 8.38 | 0.35 | 1.11 | 1.46 | (0.47 | ) | 9.37 | 17.48 | 29 | 0.14 | 0.32 | 3.91 | 26 | |||||||||||||||||||||||||||||||||||
| (a) | Calculated using average shares outstanding. |
| (b) | Includes adjustments in accordance with accounting principles generally accepted in the United States of America and as such, the net asset value for financial reporting purposes and the returns based upon those net asset values may differ from the net asset value and returns for shareholder transactions. Does not include sales charges and is not annualized for periods less than one year, if applicable. |
| (c) | In addition to the fees and expenses which the Fund bears directly; the Fund indirectly bears a pro rata share of the fees and expenses of the underlying funds in which the Fund invests. Because the underlying funds have varied expenses and fee levels and the Fund may own different proportions at different times, the amount of fees and expenses incurred indirectly by the Fund will vary. Estimated underlying fund expenses are not expenses that are incurred directly by your Fund. They are expenses that are incurred directly by the underlying funds and are deducted from the value of the funds your Fund invests in. The effect of the estimated underlying fund expenses that you bear indirectly is included in your Fund’s total return. Estimated acquired fund fees from underlying funds were 0.60%, 0.64%, 0.64%, 0.64% and 0.67% for the years ended December 31, 2013, December 31, 2012, December 31, 2011, December 31, 2010 and December 31, 2009, respectively. |
| (d) | Portfolio turnover is calculated at the fund level and is not annualized for periods less than one year, if applicable. For the year ending December 31, 2011, the portfolio turnover calculation excludes the value of securities purchased of $226,619,088 and sold of $49,277,466 in the effort to realign the Fund’s portfolio holdings after the reorganization of Invesco Conservative Allocation Fund and Invesco Van Kampen Asset Allocation Conservative Fund into the Fund. |
| (e) | Ratios are based on average daily net assets (000’s omitted) of $238,181, $26,839, $66,740, $9,207, $2,845, $3,180 and $40 for Class A, Class B, Class C, Class R, Class S, Class Y and Class R5 shares, respectively. |
| (f) | Commencement date of June 3, 2011 for Class S shares. |
| (g) | Annualized. |
36 Invesco Allocation Funds
NOTE 11—Financial Highlights—(continued)
Invesco Growth Allocation Fund
| Net asset value, beginning of period | Net investment income (a) | Net gains (losses) on securities (both realized and unrealized) | Total from investment operations | Dividends from net investment income | Net asset value, end of period | Total return(b) | Net assets, end of period (000s omitted) | Ratio of expenses to average net assets with fee waivers and/or expense reimbursements(c) | Ratio of expenses to average net assets without fee waivers and/or expense reimbursements | Ratio of net investment income (loss) to average net assets | Portfolio turnover(d) | |||||||||||||||||||||||||||||||||||||
Class A | ||||||||||||||||||||||||||||||||||||||||||||||||
Year ended 12/31/13 | $ | 11.98 | $ | 0.14 | $ | 1.70 | $ | 1.84 | $ | (0.21 | ) | $ | 13.61 | 15.37 | % | $ | 827,241 | 0.51 | %(e) | 0.51 | %(e) | 1.03 | %(e) | 39 | % | |||||||||||||||||||||||
Year ended 12/31/12 | 10.73 | 0.18 | 1.39 | 1.57 | (0.32 | ) | 11.98 | 14.68 | 597,879 | 0.46 | 0.55 | 1.55 | 10 | |||||||||||||||||||||||||||||||||||
Year ended 12/31/11 | 11.10 | 0.17 | (0.29 | ) | (0.12 | ) | (0.25 | ) | 10.73 | (1.13 | ) | 556,456 | 0.40 | 0.58 | 1.58 | 28 | ||||||||||||||||||||||||||||||||
Year ended 12/31/10 | 10.02 | 0.17 | 1.12 | 1.29 | (0.21 | ) | 11.10 | 12.91 | 285,192 | 0.46 | 0.61 | 1.69 | 73 | |||||||||||||||||||||||||||||||||||
Year ended 12/31/09 | 7.76 | 0.18 | 2.24 | 2.42 | (0.16 | ) | 10.02 | 31.22 | 269,062 | 0.46 | 0.68 | 2.13 | 28 | |||||||||||||||||||||||||||||||||||
Class B | ||||||||||||||||||||||||||||||||||||||||||||||||
Year ended 12/31/13 | 11.87 | 0.04 | 1.67 | 1.71 | (0.12 | ) | 13.46 | 14.41 | 122,521 | 1.26 | (e) | 1.26 | (e) | 0.28 | (e) | 39 | ||||||||||||||||||||||||||||||||
Year ended 12/31/12 | 10.64 | 0.09 | 1.37 | 1.46 | (0.23 | ) | 11.87 | 13.73 | 96,852 | 1.21 | 1.30 | 0.80 | 10 | |||||||||||||||||||||||||||||||||||
Year ended 12/31/11 | 10.93 | 0.09 | (0.28 | ) | (0.19 | ) | (0.10 | ) | 10.64 | (1.79 | ) | 110,133 | 1.15 | 1.33 | 0.83 | 28 | ||||||||||||||||||||||||||||||||
Year ended 12/31/10 | 9.88 | 0.10 | 1.09 | 1.19 | (0.14 | ) | 10.93 | 12.02 | 69,723 | 1.21 | 1.36 | 0.94 | 73 | |||||||||||||||||||||||||||||||||||
Year ended 12/31/09 | 7.64 | 0.12 | 2.19 | 2.31 | (0.07 | ) | 9.88 | 30.20 | 73,887 | 1.21 | 1.43 | 1.38 | 28 | |||||||||||||||||||||||||||||||||||
Class C | ||||||||||||||||||||||||||||||||||||||||||||||||
Year ended 12/31/13 | 11.87 | 0.04 | 1.68 | 1.72 | (0.12 | ) | 13.47 | 14.50 | 165,853 | 1.26 | (e) | 1.26 | (e) | 0.28 | (e) | 39 | ||||||||||||||||||||||||||||||||
Year ended 12/31/12 | 10.64 | 0.09 | 1.37 | 1.46 | (0.23 | ) | 11.87 | 13.73 | 131,069 | 1.21 | 1.30 | 0.80 | 10 | |||||||||||||||||||||||||||||||||||
Year ended 12/31/11 | 10.93 | 0.09 | (0.28 | ) | (0.19 | ) | (0.10 | ) | 10.64 | (1.79 | ) | 124,789 | 1.15 | 1.33 | 0.83 | 28 | ||||||||||||||||||||||||||||||||
Year ended 12/31/10 | 9.88 | 0.10 | 1.09 | 1.19 | (0.14 | ) | 10.93 | 12.02 | 74,096 | 1.21 | 1.36 | 0.94 | 73 | |||||||||||||||||||||||||||||||||||
Year ended 12/31/09 | 7.64 | 0.12 | 2.19 | 2.31 | (0.07 | ) | 9.88 | 30.20 | 72,462 | 1.21 | 1.43 | 1.38 | 28 | |||||||||||||||||||||||||||||||||||
Class R | ||||||||||||||||||||||||||||||||||||||||||||||||
Year ended 12/31/13 | 11.95 | 0.10 | 1.70 | 1.80 | (0.18 | ) | 13.57 | 15.08 | 25,394 | 0.76 | (e) | 0.76 | (e) | 0.78 | (e) | 39 | ||||||||||||||||||||||||||||||||
Year ended 12/31/12 | 10.71 | 0.15 | 1.38 | 1.53 | (0.29 | ) | 11.95 | 14.32 | 22,751 | 0.71 | 0.80 | 1.30 | 10 | |||||||||||||||||||||||||||||||||||
Year ended 12/31/11 | 11.05 | 0.15 | (0.29 | ) | (0.14 | ) | (0.20 | ) | 10.71 | (1.32 | ) | 21,917 | 0.65 | 0.83 | 1.33 | 28 | ||||||||||||||||||||||||||||||||
Year ended 12/31/10 | 9.98 | 0.15 | 1.11 | 1.26 | (0.19 | ) | 11.05 | 12.61 | 14,761 | 0.71 | 0.86 | 1.44 | 73 | |||||||||||||||||||||||||||||||||||
Year ended 12/31/09 | 7.73 | 0.16 | 2.22 | 2.38 | (0.13 | ) | 9.98 | 30.81 | 13,034 | 0.71 | 0.93 | 1.88 | 28 | |||||||||||||||||||||||||||||||||||
Class S | ||||||||||||||||||||||||||||||||||||||||||||||||
Year ended 12/31/13 | 11.97 | 0.15 | 1.70 | 1.85 | (0.22 | ) | 13.60 | 15.49 | 31,974 | 0.41 | (e) | 0.41 | (e) | 1.13 | (e) | 39 | ||||||||||||||||||||||||||||||||
Year ended 12/31/12 | 10.73 | 0.19 | 1.38 | 1.57 | (0.33 | ) | 11.97 | 14.70 | 31,803 | 0.36 | 0.45 | 1.65 | 10 | |||||||||||||||||||||||||||||||||||
Year ended 12/31/11 | 11.10 | 0.19 | (0.29 | ) | (0.10 | ) | (0.27 | ) | 10.73 | (0.96 | ) | 30,420 | 0.30 | 0.48 | 1.68 | 28 | ||||||||||||||||||||||||||||||||
Year ended 12/31/10 | 10.02 | 0.18 | 1.12 | 1.30 | (0.22 | ) | 11.10 | 13.02 | 32,295 | 0.36 | 0.51 | 1.79 | 73 | |||||||||||||||||||||||||||||||||||
Year ended 12/31/09(f) | 9.61 | 0.06 | 0.51 | 0.57 | (0.16 | ) | 10.02 | 6.00 | 15,961 | 0.36 | (g) | 0.47 | (g) | 2.23 | (g) | 28 | ||||||||||||||||||||||||||||||||
Class Y | ||||||||||||||||||||||||||||||||||||||||||||||||
Year ended 12/31/13 | 11.96 | 0.17 | 1.69 | 1.86 | (0.24 | ) | 13.58 | 15.56 | 4,584 | 0.26 | (e) | 0.26 | (e) | 1.28 | (e) | 39 | ||||||||||||||||||||||||||||||||
Year ended 12/31/12 | 10.72 | 0.21 | 1.38 | 1.59 | (0.35 | ) | 11.96 | 14.88 | 2,553 | 0.21 | 0.30 | 1.80 | 10 | |||||||||||||||||||||||||||||||||||
Year ended 12/31/11 | 11.10 | 0.20 | (0.28 | ) | (0.08 | ) | (0.30 | ) | 10.72 | (0.79 | ) | 2,585 | 0.15 | 0.33 | 1.83 | 28 | ||||||||||||||||||||||||||||||||
Year ended 12/31/10 | 10.02 | 0.20 | 1.12 | 1.32 | (0.24 | ) | 11.10 | 13.17 | 1,278 | 0.21 | 0.36 | 1.94 | 73 | |||||||||||||||||||||||||||||||||||
Year ended 12/31/09 | 7.77 | 0.21 | 2.23 | 2.44 | (0.19 | ) | 10.02 | 31.50 | 1,386 | 0.21 | 0.43 | 2.38 | 28 | |||||||||||||||||||||||||||||||||||
Class R5 | ||||||||||||||||||||||||||||||||||||||||||||||||
Year ended 12/31/13 | 12.02 | 0.18 | 1.71 | 1.89 | (0.25 | ) | 13.66 | 15.75 | 346 | 0.16 | (e) | 0.16 | (e) | 1.38 | (e) | 39 | ||||||||||||||||||||||||||||||||
Year ended 12/31/12 | 10.78 | 0.23 | 1.38 | 1.61 | (0.37 | ) | 12.02 | 14.95 | 211 | 0.15 | 0.16 | 1.86 | 10 | |||||||||||||||||||||||||||||||||||
Year ended 12/31/11 | 11.17 | 0.21 | (0.29 | ) | (0.08 | ) | (0.31 | ) | 10.78 | (0.78 | ) | 43 | 0.13 | 0.13 | 1.85 | 28 | ||||||||||||||||||||||||||||||||
Year ended 12/31/10 | 10.08 | 0.21 | 1.12 | 1.33 | (0.24 | ) | 11.17 | 13.24 | 112 | 0.13 | 0.13 | 2.02 | 73 | |||||||||||||||||||||||||||||||||||
Year ended 12/31/09 | 7.82 | 0.21 | 2.26 | 2.47 | (0.21 | ) | 10.08 | 31.59 | 100 | 0.16 | 0.16 | 2.43 | 28 | |||||||||||||||||||||||||||||||||||
| (a) | Calculated using average shares outstanding. |
| (b) | Includes adjustments in accordance with accounting principles generally accepted in the United States of America and as such, the net asset value for financial reporting purposes and the returns based upon those net asset values may differ from the net asset value and returns for shareholder transactions. Does not include sales charges and is not annualized for periods less than one year, if applicable. |
| (c) | In addition to the fees and expenses which the Fund bears directly; the Fund indirectly bears a pro rata share of the fees and expenses of the underlying funds in which the Fund invests. Because the underlying funds have varied expenses and fee levels and the Fund may own different proportions at different times, the amount of fees and expenses incurred indirectly by the Fund will vary. Estimated underlying fund expenses are not expenses that are incurred directly by your Fund. They are expenses that are incurred directly by the underlying funds and are deducted from the value of the funds your Fund invests in. The effect of the estimated underlying fund expenses that you bear indirectly is included in your Fund’s total return. Estimated acquired fund fees from underlying funds were 0.74%, 0.78%, 0.78%, 0.77% and 0.82% for the years ended December 31, 2013, December 31, 2012, December 31, 2011, December 31, 2010 and December 31, 2009, respectively. |
| (d) | Portfolio turnover is calculated at the fund level and is not annualized for periods less than one year, if applicable. For the year ending December 31, 2013, the portfolio turnover calculation excludes the value of securities purchased of $131,262,377 and sold of $75,210,289 in the effort to realign the Fund’s portfolio holdings after the reorganization of Invesco Leaders Fund into the Fund. For the year ending December 31, 2011, the portfolio turnover calculation excludes the value of securities purchased of $430,512,343 and sold of $117,636,196 in the effort to realign the Fund’s portfolio holdings after the reorganization of Invesco Moderate Growth Fund and Invesco Van Kampen Asset Allocation Growth Fund into the Fund. |
| (e) | Ratios are based on average daily net assets (000’s omitted) of $706,280, $109,029, $147,597, $24,225, $31,915, $3,757 and $297 for Class A, Class B, Class C, Class R, Class S, Class Y and Class R5 shares, respectively. |
| (f) | Commencement date of September 25, 2009 for Class S shares. |
| (g) | Annualized. |
37 Invesco Allocation Funds
NOTE 11—Financial Highlights—(continued)
Invesco Moderate Allocation Fund
| Net asset value, beginning of period | Net investment income(a) | Net gains (losses) on securities (both realized and unrealized) | Total from investment operations | Dividends from net investment income | Net asset value, end of period | Total return(b) | Net assets, end of period (000s omitted) | Ratio of expenses to average net assets with fee waivers and/or expense reimbursements(c) | Ratio of expenses to average net assets without fee waivers and/or expense reimbursements | Ratio of net investment income to average net assets | Portfolio turnover(d) | |||||||||||||||||||||||||||||||||||||
Class A |
| |||||||||||||||||||||||||||||||||||||||||||||||
Year ended 12/31/13 | $ | 11.32 | $ | 0.19 | $ | 1.01 | $ | 1.20 | $ | (0.22 | ) | $ | 12.30 | 10.61 | % | $ | 628,036 | 0.46 | %(e) | 0.46 | %(e) | 1.61 | %(e) | 23 | % | |||||||||||||||||||||||
Year ended 12/31/12 | 10.39 | 0.24 | 1.13 | 1.37 | (0.44 | ) | 11.32 | 13.18 | 537,812 | 0.43 | 0.48 | 2.10 | 11 | |||||||||||||||||||||||||||||||||||
Year ended 12/31/11 | 10.50 | 0.24 | (0.11 | ) | 0.13 | (0.24 | ) | 10.39 | 1.26 | 481,483 | 0.37 | 0.51 | 2.30 | 26 | ||||||||||||||||||||||||||||||||||
Year ended 12/31/10 | 9.63 | 0.29 | 0.86 | 1.15 | (0.28 | ) | 10.50 | 12.03 | 334,067 | 0.37 | 0.52 | 2.87 | 69 | |||||||||||||||||||||||||||||||||||
Year ended 12/31/09 | 7.87 | 0.31 | 1.80 | 2.11 | (0.35 | ) | 9.63 | 26.86 | 312,736 | 0.37 | 0.57 | 3.64 | 21 | |||||||||||||||||||||||||||||||||||
Class B |
| |||||||||||||||||||||||||||||||||||||||||||||||
Year ended 12/31/13 | 11.28 | 0.10 | 1.00 | 1.10 | (0.17 | ) | 12.21 | 9.78 | 64,268 | 1.21 | (e) | 1.21 | (e) | 0.86 | (e) | 23 | ||||||||||||||||||||||||||||||||
Year ended 12/31/12 | 10.35 | 0.15 | 1.13 | 1.28 | (0.35 | ) | 11.28 | 12.37 | 80,029 | 1.18 | 1.23 | 1.35 | 11 | |||||||||||||||||||||||||||||||||||
Year ended 12/31/11 | 10.46 | 0.16 | (0.10 | ) | 0.06 | (0.17 | ) | 10.35 | 0.52 | 93,053 | 1.12 | 1.26 | 1.55 | 26 | ||||||||||||||||||||||||||||||||||
Year ended 12/31/10 | 9.59 | 0.21 | 0.87 | 1.08 | (0.21 | ) | 10.46 | 11.25 | 79,150 | 1.12 | 1.27 | 2.12 | 69 | |||||||||||||||||||||||||||||||||||
Year ended 12/31/09 | 7.85 | 0.25 | 1.77 | 2.02 | (0.28 | ) | 9.59 | 25.80 | 85,714 | 1.12 | 1.32 | 2.89 | 21 | |||||||||||||||||||||||||||||||||||
Class C |
| |||||||||||||||||||||||||||||||||||||||||||||||
Year ended 12/31/13 | 11.27 | 0.10 | 1.00 | 1.10 | (0.17 | ) | 12.20 | 9.79 | 147,372 | 1.21 | (e) | 1.21 | (e) | 0.86 | (e) | 23 | ||||||||||||||||||||||||||||||||
Year ended 12/31/12 | 10.34 | 0.15 | 1.13 | 1.28 | (0.35 | ) | 11.27 | 12.38 | 123,505 | 1.18 | 1.23 | 1.35 | 11 | |||||||||||||||||||||||||||||||||||
Year ended 12/31/11 | 10.46 | 0.16 | (0.11 | ) | 0.05 | (0.17 | ) | 10.34 | 0.42 | 115,040 | 1.12 | 1.26 | 1.55 | 26 | ||||||||||||||||||||||||||||||||||
Year ended 12/31/10 | 9.59 | 0.21 | 0.87 | 1.08 | (0.21 | ) | 10.46 | 11.26 | 104,060 | 1.12 | 1.27 | 2.12 | 69 | |||||||||||||||||||||||||||||||||||
Year ended 12/31/09 | 7.85 | 0.25 | 1.77 | 2.02 | (0.28 | ) | 9.59 | 25.80 | 99,807 | 1.12 | 1.32 | 2.89 | 21 | |||||||||||||||||||||||||||||||||||
Class R |
| |||||||||||||||||||||||||||||||||||||||||||||||
Year ended 12/31/13 | 11.31 | 0.16 | 1.00 | 1.16 | (0.20 | ) | 12.27 | 10.30 | 23,099 | 0.71 | (e) | 0.71 | (e) | 1.36 | (e) | 23 | ||||||||||||||||||||||||||||||||
Year ended 12/31/12 | 10.38 | 0.21 | 1.13 | 1.34 | (0.41 | ) | 11.31 | 12.91 | 20,557 | 0.68 | 0.73 | 1.85 | 11 | |||||||||||||||||||||||||||||||||||
Year ended 12/31/11 | 10.49 | 0.22 | (0.11 | ) | 0.11 | (0.22 | ) | 10.38 | 1.01 | 17,906 | 0.62 | 0.76 | 2.05 | 26 | ||||||||||||||||||||||||||||||||||
Year ended 12/31/10 | 9.62 | 0.26 | 0.87 | 1.13 | (0.26 | ) | 10.49 | 11.77 | 21,639 | 0.62 | 0.77 | 2.62 | 69 | |||||||||||||||||||||||||||||||||||
Year ended 12/31/09 | 7.87 | 0.29 | 1.79 | 2.08 | (0.33 | ) | 9.62 | 26.44 | 18,886 | 0.62 | 0.82 | 3.39 | 21 | |||||||||||||||||||||||||||||||||||
Class S |
| |||||||||||||||||||||||||||||||||||||||||||||||
Year ended 12/31/13 | 11.31 | 0.20 | 1.00 | 1.20 | (0.22 | ) | 12.29 | 10.68 | 35,661 | 0.36 | (e) | 0.36 | (e) | 1.71 | (e) | 23 | ||||||||||||||||||||||||||||||||
Year ended 12/31/12 | 10.38 | 0.25 | 1.13 | 1.38 | (0.45 | ) | 11.31 | 13.31 | 36,651 | 0.33 | 0.38 | 2.20 | 11 | |||||||||||||||||||||||||||||||||||
Year ended 12/31/11 | 10.49 | 0.25 | (0.11 | ) | 0.14 | (0.25 | ) | 10.38 | 1.35 | 35,229 | 0.27 | 0.41 | 2.40 | 26 | ||||||||||||||||||||||||||||||||||
Year ended 12/31/10 | 9.62 | 0.30 | 0.86 | 1.16 | (0.29 | ) | 10.49 | 12.15 | 34,746 | 0.27 | 0.42 | 2.97 | 69 | |||||||||||||||||||||||||||||||||||
Year ended 12/31/09(f) | 9.48 | 0.10 | 0.39 | 0.49 | (0.35 | ) | 9.62 | 5.23 | 18,006 | 0.27 | (g) | 0.40 | (g) | 3.74 | (g) | 21 | ||||||||||||||||||||||||||||||||
Class Y |
| |||||||||||||||||||||||||||||||||||||||||||||||
Year ended 12/31/13 | 11.32 | 0.22 | 1.00 | 1.22 | (0.23 | ) | 12.31 | 10.84 | 4,912 | 0.21 | (e) | 0.21 | (e) | 1.86 | (e) | 23 | ||||||||||||||||||||||||||||||||
Year ended 12/31/12 | 10.39 | 0.27 | 1.13 | 1.40 | (0.47 | ) | 11.32 | 13.46 | 3,319 | 0.18 | 0.23 | 2.35 | 11 | |||||||||||||||||||||||||||||||||||
Year ended 12/31/11 | 10.50 | 0.27 | (0.11 | ) | 0.16 | (0.27 | ) | 10.39 | 1.49 | 1,851 | 0.12 | 0.26 | 2.55 | 26 | ||||||||||||||||||||||||||||||||||
Year ended 12/31/10 | 9.62 | 0.31 | 0.88 | 1.19 | (0.31 | ) | 10.50 | 12.42 | 1,085 | 0.12 | 0.27 | 3.12 | 69 | |||||||||||||||||||||||||||||||||||
Year ended 12/31/09 | 7.87 | 0.34 | 1.78 | 2.12 | (0.37 | ) | 9.62 | 27.02 | 1,131 | 0.12 | 0.32 | 3.89 | 21 | |||||||||||||||||||||||||||||||||||
Class R5 |
| |||||||||||||||||||||||||||||||||||||||||||||||
Year ended 12/31/13 | 11.35 | 0.23 | 1.00 | 1.23 | (0.24 | ) | 12.34 | 10.84 | 232 | 0.17 | (e) | 0.17 | (e) | 1.90 | (e) | 23 | ||||||||||||||||||||||||||||||||
Year ended 12/31/12 | 10.42 | 0.27 | 1.13 | 1.40 | (0.47 | ) | 11.35 | 13.49 | 444 | 0.13 | 0.13 | 2.40 | 11 | |||||||||||||||||||||||||||||||||||
Year ended 12/31/11 | 10.53 | 0.27 | (0.11 | ) | 0.16 | (0.27 | ) | 10.42 | 1.50 | 1,110 | 0.10 | 0.10 | 2.57 | 26 | ||||||||||||||||||||||||||||||||||
Year ended 12/31/10 | 9.66 | 0.32 | 0.86 | 1.18 | (0.31 | ) | 10.53 | 12.28 | 1,061 | 0.11 | 0.11 | 3.13 | 69 | |||||||||||||||||||||||||||||||||||
Year ended 12/31/09 | 7.89 | 0.34 | 1.80 | 2.14 | (0.37 | ) | 9.66 | 27.21 | 11 | 0.13 | 0.19 | 3.88 | 21 | |||||||||||||||||||||||||||||||||||
| (a) | Calculated using average shares outstanding. |
| (b) | Includes adjustments in accordance with accounting principles generally accepted in the United States of America and as such, the net asset value for financial reporting purposes and the returns based upon those net asset values may differ from the net asset value and returns for shareholder transactions. Does not include sales charges and is not annualized for periods less than one year, if applicable. |
| (c) | In addition to the fees and expenses which the Fund bears directly; the Fund indirectly bears a pro rata share of the fees and expenses of the underlying funds in which the Fund invests. Because the underlying funds have varied expenses and fee levels and the Fund may own different proportions at different times, the amount of fees and expenses incurred indirectly by the Fund will vary. Estimated underlying fund expenses are not expenses that are incurred directly by your Fund. They are expenses that are incurred directly by the underlying funds and are deducted from the value of the funds your Fund invests in. The effect of the estimated underlying fund expenses that you bear indirectly is included in your Fund’s total return. Estimated acquired fund fees from underlying funds were 0.69%, 0.72%, 0.72%, 0.71% and 0.72% for the years ended December 31, 2013, December 31, 2012, December 31, 2011, December 31, 2010 and December 31, 2009, respectively. |
| (d) | Portfolio turnover is calculated at the fund level and is not annualized for periods less than one year, if applicable. For the year ending December 31, 2011, the portfolio turnover calculation excludes the value of securities purchased of $218,592,415 and sold of $61,446,608 in the effort to realign the Fund’s portfolio holdings after the reorganization of Invesco Van Kampen Asset Allocation Moderate Fund into the Fund. |
| (e) | Ratios are based on average daily net assets (000’s omitted) of $585,061, $71,495, $134,194, $22,719, $36,398, $3,920 and $265 for Class A, Class B, Class C, Class R, Class S, Class Y and Class R5 shares, respectively. |
| (f) | Commencement date of September 25, 2009 for Class S shares. |
| (g) | Annualized. |
38 Invesco Allocation Funds
Report of Independent Registered Public Accounting Firm
To the Board of Trustees of AIM Growth Series (Invesco Growth Series)
and Shareholders of Invesco Conservative Allocation Fund, Invesco Growth Allocation Fund,
and Invesco Moderate Allocation Fund:
In our opinion, the accompanying statements of assets and liabilities, including the schedules of investments, and the related statements of operations and of changes in net assets and the financial highlights present fairly, in all material respects, the financial position of Invesco Conservative Allocation Fund, Invesco Growth Allocation Fund and Invesco Moderate Allocation Fund (three of the funds constituting AIM Growth Series (Invesco Growth Series), hereafter referred to as the “Funds”) at December 31, 2013, the results of each of their operations for the year then ended, the changes in each of their net assets for each of the two years in the period then ended and the financial highlights for each of the five years in the period then ended, in conformity with accounting principles generally accepted in the United States of America. These financial statements and financial highlights (hereafter referred to as “financial statements”) are the responsibility of the Funds’ management; our responsibility is to express an opinion on these financial statements based on our audits. We conducted our audits of these financial statements in accordance with the standards of the Public Company Accounting Oversight Board (United States). Those standards require that we plan and perform the audit to obtain reasonable assurance about whether the financial statements are free of material misstatement. An audit includes examining, on a test basis, evidence supporting the amounts and disclosures in the financial statements, assessing the accounting principles used and significant estimates made by management, and evaluating the overall financial statement presentation. We believe that our audits, which included confirmation of securities at December 31, 2013 by correspondence with the custodian and transfer agent, provide a reasonable basis for our opinion.
PRICEWATERHOUSECOOPERS LLP
February 26, 2014
Houston, Texas
39 Invesco Allocation Funds
Calculating your ongoing Fund expenses
Example
As a shareholder of the Fund, you incur two types of costs: (1) transaction costs, which may include sales charges (loads) on purchase payments or contingent deferred sales charges on redemptions, if any; and (2) ongoing costs, including distribution and/or service (12b-1) fees, and other Fund expenses. This example is intended to help you understand your ongoing costs (in dollars) of investing in the Fund and to compare these costs with ongoing costs of investing in other mutual funds. The example is based on an investment of $1,000 invested at the beginning of the period and held for the entire period July 1, 2013, through December 31, 2013.
In addition to the fees and expenses which the Fund bears directly, the Fund indirectly bears a pro rata share of the fees and expenses of the underlying funds in which your Fund invests. The amount of fees and expenses incurred indirectly by your Fund will vary because the underlying funds have varied expenses and fee levels and the Fund may own different proportions of the underlying funds at different times. Estimated underlying fund expenses are not expenses that are incurred directly by your Fund. They are expenses that are incurred directly by the underlying funds and are deducted from the value of the underlying funds your Fund invests in. The effect of the estimated underlying fund expenses that you bear indirectly are included in your Fund’s total return.
Actual expenses
The table below provides information about actual account values and actual expenses. You may use the information in this table, together with the amount you invested, to estimate the expenses that you paid over the period. Simply divide your account value by $1,000 (for example, an $8,600 account value divided by $1,000 = 8.6), then multiply the result by the number in the table under the heading entitled “Actual Expenses Paid During Period” to estimate the expenses you paid on your account during this period.
Hypothetical example for comparison purposes
The table below also provides information about hypothetical account values and hypothetical expenses based on the Fund’s actual expense ratio and an assumed rate of return of 5% per year before expenses, which is not the Fund’s actual return.
The hypothetical account values and expenses may not be used to estimate the actual ending account balance or expenses you paid for the period. You may use this information to compare the ongoing costs of investing in the Fund and other funds. To do so, compare this 5% hypothetical example with the 5% hypothetical examples that appear in the shareholder reports of the other funds.
Please note that the expenses shown in the table are meant to highlight your ongoing costs only and do not reflect any transaction costs, such as sales charges (loads) on purchase payments or contingent deferred sales charges on redemptions, if any. Therefore, the hypothetical information is useful in comparing ongoing costs only, and will not help you determine the relative total costs of owning different funds. In addition, expenses shown in the table do not include the expenses of the underlying funds, which are borne indirectly by the Fund. If transaction costs and indirect expenses were included, your costs would have been higher.
Invesco Conservative Allocation Fund
| Class | Beginning Account Value (07/01/13) | ACTUAL | HYPOTHETICAL (5% annual return before expenses) | Annualized Expense Ratio | ||||||||||||||||||||
| Ending Account Value (12/31/13)1 | Expenses Paid During Period2 | Ending Account Value (12/31/13) | Expenses Paid During Period2 | |||||||||||||||||||||
| A | $ | 1,000.00 | $ | 1,056.80 | $ | 2.54 | $ | 1,022.74 | $ | 2.50 | 0.49 | % | ||||||||||||
| B | 1,000.00 | 1,052.30 | 6.41 | 1,018.95 | 6.31 | 1.24 | ||||||||||||||||||
| C | 1,000.00 | 1,052.20 | 6.41 | 1,018.95 | 6.31 | 1.24 | ||||||||||||||||||
| R | 1,000.00 | 1,055.60 | 3.83 | 1,021.48 | 3.77 | 0.74 | ||||||||||||||||||
| S | 1,000.00 | 1,057.30 | 2.02 | 1,023.24 | 1.99 | 0.39 | ||||||||||||||||||
| Y | 1,000.00 | 1,059.10 | 1.25 | 1,024.00 | 1.22 | 0.24 | ||||||||||||||||||
| R5 | 1,000.00 | 1,058.20 | 0.99 | 1,024.25 | 0.97 | 0.19 | ||||||||||||||||||
40 Invesco Allocation Funds
Invesco Growth Allocation Fund
| Class | Beginning Account Value (07/01/13) | ACTUAL | HYPOTHETICAL (5% annual return before expenses) | Annualized Expense Ratio | ||||||||||||||||||||
| Ending Account Value (12/31/13)1 | Expenses Paid During Period2 | Ending Account Value (12/31/13) | Expenses Paid During Period2 | |||||||||||||||||||||
| A | $ | 1,000.00 | $ | 1,111.10 | $ | 2.66 | $ | 1,022.68 | $ | 2.55 | 0.50 | % | ||||||||||||
| B | 1,000.00 | 1,105.00 | 6.63 | 1,018.90 | 6.36 | 1.25 | ||||||||||||||||||
| C | 1,000.00 | 1,105.80 | 6.63 | 1,018.90 | 6.36 | 1.25 | ||||||||||||||||||
| R | 1,000.00 | 1,109.00 | 3.99 | 1,021.42 | 3.82 | 0.75 | ||||||||||||||||||
| S | 1,000.00 | 1,111.20 | 2.13 | 1,023.19 | 2.04 | 0.40 | ||||||||||||||||||
| Y | 1,000.00 | 1,111.10 | 1.33 | 1,023.95 | 1.28 | 0.25 | ||||||||||||||||||
| R5 | 1,000.00 | 1,112.10 | 0.85 | 1,024.40 | 0.82 | 0.16 | ||||||||||||||||||
Invesco Moderate Allocation Fund
| Class | Beginning Account Value (07/01/13) | ACTUAL | HYPOTHETICAL (5% annual return before expenses) | Annualized Expense Ratio | ||||||||||||||||||||
| Ending Account Value (12/31/13)1 | Expenses Paid During Period2 | Ending Account Value (12/31/13) | Expenses Paid During Period2 | |||||||||||||||||||||
| A | $ | 1,000.00 | $ | 1,084.10 | $ | 2.42 | $ | 1,022.89 | $ | 2.35 | 0.46 | % | ||||||||||||
| B | 1,000.00 | 1,080.50 | 6.35 | 1,019.11 | 6.16 | 1.21 | ||||||||||||||||||
| C | 1,000.00 | 1,079.70 | 6.34 | 1,019.11 | 6.16 | 1.21 | ||||||||||||||||||
| R | 1,000.00 | 1,082.90 | 3.73 | 1,021.63 | 3.62 | 0.71 | ||||||||||||||||||
| S | 1,000.00 | 1,084.70 | 1.89 | 1,023.39 | 1.84 | 0.36 | ||||||||||||||||||
| Y | 1,000.00 | 1,085.40 | 1.10 | 1,024.15 | 1.07 | 0.21 | ||||||||||||||||||
| R5 | 1,000.00 | 1,085.50 | 0.89 | 1,024.35 | 0.87 | 0.17 | ||||||||||||||||||
| 1 | The actual ending account value is based on the actual total return of the Funds for the period July 1, 2013, through December 31, 2013, after actual expenses and will differ from the hypothetical ending account value which is based on each Fund’s expense ratio and a hypothetical annual return of 5% before expenses. |
| 2 | Expenses are equal to each Fund’s annualized expense ratio as indicated above multiplied by the average account value over the period, multiplied by 184/365 to reflect the most recent fiscal half year. |
41 Invesco Allocation Funds
Tax Information
Form 1099-DIV, Form 1042-S and other year–end tax information provide shareholders with actual calendar year amounts that should be included in their tax returns. Shareholders should consult their tax advisors.
The following distribution information is being provided as required by the Internal Revenue Code or to meet a specific state’s requirement.
The Funds designate the following amounts or, if subsequently determined to be different, the maximum amount allowable for its fiscal year ended December 31, 2013:
Federal and State Income Tax | ||||||||||||
| Qualified Dividend Income* | Corporate Dividends Received Deduction* | U.S. Treasury Obligations* | ||||||||||
Invesco Conservative Allocation Fund | 21.50 | % | 11.00 | % | 9.11 | % | ||||||
Invesco Growth Allocation Fund | 69.50 | % | 35.00 | % | 0.73 | % | ||||||
Invesco Moderate Allocation Fund | 40.41 | % | 17.75 | % | 4.74 | % | ||||||
| * | The above percentages are based on ordinary income dividends paid to shareholders during the Fund’s fiscal year. |
42 Invesco Allocation Funds
Trustees and Officers
The address of each trustee and officer is AIM Growth Series (Invesco Growth Series) (the “Trust”), 11 Greenway Plaza, Suite 1000, Houston, Texas 77046-1173. The trustees serve for the life of the Trust, subject to their earlier death, incapacitation, resignation, retirement or removal as more specifically provided in the Trust’s organizational documents. Each officer serves for a one year term or until their successors are elected and qualified. Column two below includes length of time served with predecessor entities, if any.
| Name, Year of Birth and Position(s) Held with the Trust | Trustee and/ or Officer Since | Principal Occupation(s) During Past 5 Years | Number of Funds in Fund Complex Overseen by Trustee | Other Directorship(s) Held by Trustee During Past 5 Years | ||||
| Interested Persons | ||||||||
| Martin L. Flanagan1 — 1960 Trustee | 2007 | Executive Director, Chief Executive Officer and President, Invesco Ltd. (ultimate parent of Invesco and a global investment management firm); Advisor to the Board, Invesco Advisers, Inc. (formerly known as Invesco Institutional (N.A.), Inc.); Trustee, The Invesco Funds; Vice Chair, Investment Company Institute; and Member of Executive Board, SMU Cox School of Business
Formerly: Chairman and Chief Executive Officer, Invesco Advisers, Inc. (registered investment adviser); Director, Chairman, Chief Executive Officer and President, IVZ Inc. (holding company), INVESCO Group Services, Inc. (service provider) and Invesco North American Holdings, Inc. (holding company); Director, Chief Executive Officer and President, Invesco Holding Company Limited (parent of Invesco and a global investment management firm); Director, Invesco Ltd.; Chairman, Investment Company Institute and President, Co-Chief Executive Officer, Co-President, Chief Operating Officer and Chief Financial Officer, Franklin Resources, Inc. (global investment management organization) | 123 | None | ||||
| Philip A. Taylor2 — 1954 Trustee, President and Principal Executive Officer | 2006 | Head of North American Retail and Senior Managing Director, Invesco Ltd.; Director, Co-Chairman, Co-President and Co-Chief Executive Officer, Invesco Advisers, Inc. (formerly known as Invesco Institutional (N.A.), Inc.) (registered investment adviser); Director, Chairman, Chief Executive Officer and President, Invesco Management Group, Inc. (formerly known as Invesco Aim Management Group, Inc.) (financial services holding company); Director and President, INVESCO Funds Group, Inc. (registered investment adviser and registered transfer agent); Director and Chairman, Invesco Investment Services, Inc. (formerly known as Invesco Aim Investment Services, Inc.) (registered transfer agent) and IVZ Distributors, Inc. (formerly known as INVESCO Distributors, Inc.) (registered broker dealer); Director, President and Chairman, Invesco Inc. (holding company) and Invesco Canada Holdings Inc. (holding company); Chief Executive Officer, Invesco Corporate Class Inc. (corporate mutual fund company) and Invesco Canada Fund Inc. (corporate mutual fund company); Director, Chairman and Chief Executive Officer, Invesco Canada Ltd. (formerly known as Invesco Trimark Ltd./Invesco Trimark Ltèe) (registered investment adviser and registered transfer agent); Trustee, President and Principal Executive Officer, The Invesco Funds (other than AIM Treasurer’s Series Trust (Invesco Treasurer’s Series Trust) and Short-Term Investments Trust); Trustee and Executive Vice President, The Invesco Funds (AIM Treasurer’s Series Trust (Invesco Treasurer’s Series Trust) and Short-Term Investments Trust only); Director, Invesco Investment Advisers LLC (formerly known as Van Kampen Asset Management); Director, Chief Executive Officer and President, Van Kampen Exchange Corp.
Formerly: Director and Chairman, Van Kampen Investor Services Inc.: Director, Chief Executive Officer and President, 1371 Preferred Inc. (holding company); and Van Kampen Investments Inc.; Director and President, AIM GP Canada Inc. (general partner for limited partnerships); and Van Kampen Advisors, Inc.; Director and Chief Executive Officer, Invesco Trimark Dealer Inc. (registered broker dealer); Director, Invesco Distributors, Inc. (formerly known as Invesco Aim Distributors, Inc.) (registered broker dealer); Manager, Invesco PowerShares Capital Management LLC; Director, Chief Executive Officer and President, Invesco Advisers, Inc.; Director, Chairman, Chief Executive Officer and President, Invesco Aim Capital Management, Inc.; President, Invesco Trimark Dealer Inc. and Invesco Trimark Ltd./Invesco Trimark Ltèe; Director and President, AIM Trimark Corporate Class Inc. and AIM Trimark Canada Fund Inc.; Senior Managing Director, Invesco Holding Company Limited; Trustee and Executive Vice President, Tax-Free Investments Trust; Director and Chairman, Fund Management Company (former registered broker dealer); President and Principal Executive Officer, The Invesco Funds (AIM Treasurer’s Series Trust (Invesco Treasurer’s Series Trust), Short-Term Investments Trust and Tax-Free Investments Trust only); President, AIM Trimark Global Fund Inc. and AIM Trimark Canada Fund Inc. | 123 | None | ||||
Wayne W. Whalen3 — 1939 Trustee | 2010 | Of Counsel, and prior to 2010, partner in the law firm of Skadden, Arps, Slate, Meagher & Flom LLP, legal counsel to certain funds in the Fund Complex | 136 | Director of the Mutual Fund Directors Forum, a nonprofit membership organization for investment directors; Chairman and Director of the Abraham Lincoln Presidential Library Foundation; and Director of the Stevenson Center for Democracy |
| 1 | Mr. Flanagan is considered an interested person of the Trust because he is an officer of the adviser to the Trust, and an officer and a director of Invesco Ltd., ultimate parent of the adviser to the Trust. |
| 2 | Mr. Taylor is considered an interested person of the Trust because he is an officer and a director of the adviser to, and a director of the principal underwriter of, the Trust. |
| 3 | Mr. Whalen is considered an “interested person” (within the meaning of Section 2(a)(19) of the 1940 Act) of certain Funds in the Invesco Fund Complex because he and his firm currently provide legal services as legal counsel to such Funds. |
T-1 Invesco Allocation Funds
Trustees and Officers—(continued)
| Name, Year of Birth and Position(s) Held with the Trust | Trustee and/ or Officer Since | Principal Occupation(s) During Past 5 Years | Number of Funds in Fund Complex Overseen by Trustee | Other Directorship(s) Held by Trustee During Past 5 Years | ||||
| Independent Trustees | ||||||||
Bruce L. Crockett — 1944 Trustee and Chair | 2001 | Chairman, Crockett Technologies Associates (technology consulting company)
Formerly: Director, Captaris (unified messaging provider); Director, President and Chief Executive Officer COMSAT Corporation; and Chairman, Board of Governors of INTELSAT (international communications company) | 123 | ACE Limited (insurance company); Investment Company Institute | ||||
David C. Arch — 1945 Trustee | 2010 | Chairman and Chief Executive Officer of Blistex Inc., (consumer health care products manufacturer)
Formerly: Member of the Heartland Alliance Advisory Board, a nonprofit organization serving human needs based in Chicago | 136 | Board member of the Illinois Manufacturers’ Association; Member of the Board of Visitors, Institute for the Humanities, University of Michigan | ||||
Frank S. Bayley — 1939 Trustee | 1985 | Retired
Formerly: Director, Badgley Funds, Inc. (registered investment company) (2 portfolios) and General Partner and Of Counsel, law firm of Baker & McKenzie, LLP | 123 | Director and Chairman, C.D. Stimson Company (a real estate investment company); Trustee and Overseer, The Curtis Institute of Music | ||||
James T. Bunch — 1942 Trustee | 2003 | Managing Member, Grumman Hill Group LLC (family office private equity management)
Formerly: Founder, Green, Manning & Bunch Ltd. (investment banking firm) (1988-2010); Executive Committee, United States Golf Association; and Director, Policy Studies, Inc. and Van Gilder Insurance Corporation | 123 | Chairman, Board of Governors, Western Golf Association; Chairman-elect, Evans Scholars Foundation; and Director, Denver Film Society | ||||
Rodney F. Dammeyer — 1940 Trustee | 2010 | Chairman of CAC, LLC, (private company offering capital investment and management advisory services)
Formerly: Prior to 2001, Managing Partner at Equity Group Corporate Investments; Prior to 1995, Chief Executive Officer of Itel Corporation (formerly Anixter International); Prior to 1985, experience includes Senior Vice President and Chief Financial Officer of Household International, Inc., Executive Vice President and Chief Financial Officer of Northwest Industries, Inc. and Partner of Arthur Andersen & Co.; From 1987 to 2010, Director/Trustee of investment companies in the Van Kampen Funds complex | 123 | Director of Quidel Corporation and Stericycle, Inc.; Prior to May 2008, Trustee of The Scripps Research Institute; Prior to February 2008, Director of Ventana Medical Systems, Inc. | ||||
Albert R. Dowden — 1941 Trustee | 2001 | Director of a number of public and private business corporations, including the Boss Group, Ltd. (private investment and management); and Reich & Tang Funds (5 portfolios) (registered investment company)
Formerly: Director, Homeowners of America Holding Corporation/Homeowners of America Insurance Company (property casualty company); Director, Continental Energy Services, LLC (oil and gas pipeline service); Director, CompuDyne Corporation (provider of product and services to the public security market) and Director, Annuity and Life Re (Holdings), Ltd. (reinsurance company); Director, President and Chief Executive Officer, Volvo Group North America, Inc.; Senior Vice President, AB Volvo; Director of various public and private corporations; Chairman, DHJ Media, Inc.; Director, Magellan Insurance Company; and Director, The Hertz Corporation, Genmar Corporation (boat manufacturer), National Media Corporation; Advisory Board of Rotary Power International (designer, manufacturer, and seller of rotary power engines); and Chairman, Cortland Trust, Inc. (registered investment company) | 123 | Director of Nature’s Sunshine Products, Inc. | ||||
Jack M. Fields — 1952 Trustee | 2001 | Chief Executive Officer, Twenty First Century Group, Inc. (government affairs company); Owner and Chief Executive Officer, Dos Angeles Ranch, L.P. (cattle, hunting, corporate entertainment); and Discovery Global Education Fund (non-profit)
Formerly: Chief Executive Officer, Texana Timber LP (sustainable forestry company); Director of Cross Timbers Quail Research Ranch (non-profit); and member of the U.S. House of Representatives | 123 | Insperity, Inc. (formerly known as Administaff) | ||||
Prema Mathai-Davis — 1950 Trustee | 2001 | Retired
Formerly: Chief Executive Officer, YWCA of the U.S.A. | 123 | None | ||||
Larry Soll — 1942 Trustee | 2003 | Retired
Formerly: Chairman, Chief Executive Officer and President, Synergen Corp. (a biotechnology company) | 123 | None | ||||
Hugo F. Sonnenschein — 1940 Trustee | 2010 | Distinguished Service Professor and President Emeritus of the University of Chicago and the Adam Smith Distinguished Service Professor in the Department of Economics at the University of Chicago
Formerly: President of the University of Chicago | 136 | Trustee of the University of Rochester and a member of its investment committee. Member of the National Academy of Sciences, the American Philosophical Society and a fellow of the American Academy of Arts and Sciences |
T-2 Invesco Allocation Funds
Trustees and Officers—(continued)
| Name, Year of Birth and Position(s) Held with the Trust | Trustee and/ or Officer Since | Principal Occupation(s) During Past 5 Years | Number of Funds in Fund Complex Overseen by Trustee | Other Directorship(s) Held by Trustee During Past 5 Years | ||||
| Independent Trustees—(continued) | ||||||||
Raymond Stickel, Jr. — 1944 Trustee | 2005 | Retired
Formerly: Director, Mainstay VP Series Funds, Inc. (25 portfolios) and Partner, Deloitte & Touche | 123 | None | ||||
| Other Officers | ||||||||
| Russell C. Burk — 1958 Senior Vice President and Senior Officer | 2005 | Senior Vice President and Senior Officer, The Invesco Funds | N/A | N/A | ||||
| John M. Zerr — 1962 Senior Vice President, Chief Legal Officer and Secretary | 2006 | Director, Senior Vice President, Secretary and General Counsel, Invesco Management Group, Inc. (formerly known as Invesco Aim Management Group, Inc.) and Van Kampen Exchange Corp.; Senior Vice President, Invesco Advisers, Inc. (formerly known as Invesco Institutional (N.A.), Inc.) (registered investment adviser); Senior Vice President and Secretary, Invesco Distributors, Inc. (formerly known as Invesco Aim Distributors, Inc.); Director, Vice President and Secretary, Invesco Investment Services, Inc. (formerly known as Invesco Aim Investment Services, Inc.) and IVZ Distributors, Inc. (formerly known as INVESCO Distributors, Inc.); Director and Vice President, INVESCO Funds Group, Inc.; Senior Vice President, Chief Legal Officer and Secretary, The Invesco Funds; Manager, Invesco PowerShares Capital Management LLC; Director, Secretary and General Counsel, Invesco Investment Advisers LLC (formerly known as Van Kampen Asset Management); Secretary and General Counsel, Invesco Capital Markets, Inc. (formerly known as Van Kampen Funds Inc.) and Chief Legal Officer, PowerShares Exchange-Traded Fund Trust, PowerShares Exchange-Traded Fund Trust II, PowerShares India Exchange-Traded Fund Trust and PowerShares Actively Managed Exchange-Traded Fund Trust
Formerly: Director and Vice President, Van Kampen Advisors Inc.; Director, Vice President, Secretary and General Counsel, Van Kampen Investor Services Inc.; Director, Invesco Distributors, Inc. (formerly known as Invesco Aim Distributors, Inc.); Director, Senior Vice President, General Counsel and Secretary, Invesco Aim Advisers, Inc. and Van Kampen Investments Inc.; Director, Vice President and Secretary, Fund Management Company; Director, Senior Vice President, Secretary, General Counsel and Vice President, Invesco Aim Capital Management, Inc.; Chief Operating Officer and General Counsel, Liberty Ridge Capital, Inc. (an investment adviser); Vice President and Secretary, PBHG Funds (an investment company) and PBHG Insurance Series Fund (an investment company); Chief Operating Officer, General Counsel and Secretary, Old Mutual Investment Partners (a broker-dealer); General Counsel and Secretary, Old Mutual Fund Services (an administrator) and Old Mutual Shareholder Services (a shareholder servicing center); Executive Vice President, General Counsel and Secretary, Old Mutual Capital, Inc. (an investment adviser); and Vice President and Secretary, Old Mutual Advisors Funds (an investment company) | N/A | N/A | ||||
| Karen Dunn Kelley — 1960 Vice President | 2004 | Senior Managing Director, Investments; Director, Co-President, Co-Chief Executive Officer, and Co-Chairman, Invesco Advisers, Inc. (formerly known as Invesco Institutional (N.A.), Inc.) (registered investment adviser); Chairman, Invesco Senior Secured Management, Inc.; Senior Vice President, Invesco Management Group, Inc. (formerly known as Invesco Aim Management Group, Inc.); Executive Vice President, Invesco Distributors, Inc. (formerly known as Invesco Aim Distributors, Inc.); Director, Invesco Mortgage Capital Inc., and Invesco Management Company Limited; Director and President, INVESCO Asset Management (Bermuda) Ltd., Vice President, The Invesco Funds (other than AIM Treasurer’s Series Trust (Invesco Treasurer’s Series Trust) and Short-Term Investments Trust); and President and Principal Executive Officer, The Invesco Funds (AIM Treasurer’s Series Trust (Invesco Treasurer’s Series Trust) and Short-Term Investments Trust only)
Formerly: Director, INVESCO Global Asset Management Limited and INVESCO Management S.A.; Senior Vice President, Van Kampen Investments Inc. and Invesco Advisers, Inc. (formerly known as Invesco Institutional (N.A.), Inc.) (registered investment adviser); Vice President, Invesco Advisers, Inc. (formerly known as Invesco Institutional (N.A.), Inc.); Director of Cash Management and Senior Vice President, Invesco Advisers, Inc. and Invesco Aim Capital Management, Inc.; President and Principal Executive Officer, Tax-Free Investments Trust; Director and President, Fund Management Company; Chief Cash Management Officer, Director of Cash Management, Senior Vice President, and Managing Director, Invesco Aim Capital Management, Inc.; Director of Cash Management, Senior Vice President, and Vice President, Invesco Advisers, Inc. and The Invesco Funds (AIM Treasurer’s Series Trust (Invesco Treasurer’s Series Trust), Short-Term Investments Trust and Tax-Free Investments Trust only) | N/A | N/A | ||||
T-3 Invesco Allocation Funds
Trustees and Officers—(continued)
| Name, Year of Birth and Position(s) Held with the Trust | Trustee and/ or Officer Since | Principal Occupation(s) During Past 5 Years | Number of Funds in Fund Complex Overseen by Trustee | Other Directorship(s) Held by Trustee During Past 5 Years | ||||
| Other Officers—(continued) | ||||||||
| Sheri Morris — 1964 Vice President, Treasurer and Principal Financial Officer | 1999 | Vice President, Treasurer and Principal Financial Officer, The Invesco Funds; Vice President, Invesco Advisers, Inc. (formerly known as Invesco Institutional (N.A.), Inc.) (registered investment adviser); and Vice President, PowerShares Exchange-Traded Fund Trust, PowerShares Exchange-Traded Fund Trust II, PowerShares India Exchange-Traded Fund Trust and PowerShares Actively Managed Exchange-Traded Fund Trust
Formerly: Vice President, Invesco Aim Advisers, Inc., Invesco Aim Capital Management, Inc. and Invesco Aim Private Asset Management, Inc.; Assistant Vice President and Assistant Treasurer, The Invesco Funds and Assistant Vice President, Invesco Advisers, Inc., Invesco Aim Capital Management, Inc. and Invesco Aim Private Asset Management, Inc.; and Treasurer, PowerShares Exchange-Traded Fund Trust, PowerShares Exchange-Traded Fund Trust II, PowerShares India Exchange-Traded Fund Trust and PowerShares Actively Managed Exchange-Traded Fund Trust | N/A | N/A | ||||
Crissie M. Wisdom — 1969 Anti-Money Laundering Compliance Officer | 2013 | Anti-Money Laundering Compliance Officer, Invesco Advisers, Inc. (formerly known as Invesco Institutional (N.A.), Inc.) (registered investment adviser), Invesco Capital Markets, Inc. (formerly known as Van Kampen Funds Inc.), Invesco Distributors, Inc., Invesco Investment Services, Inc., Invesco Management Group, Inc., Van Kampen Exchange Corp., The Invesco Funds, Invesco Funds (Chicago), and PowerShares Exchange-Traded Fund Trust, PowerShares Exchange-Traded Fund Trust II, PowerShares India Exchange-Traded Fund Trust, and PowerShares Actively Managed Exchange-Traded Fund Trust; and Fraud Prevention Manager and Controls and Risk Analysis Manager for Invesco Investment Services, Inc. | N/A | N/A | ||||
| Todd L. Spillane — 1958 Chief Compliance Officer | 2006 | Senior Vice President, Invesco Management Group, Inc. (formerly known as Invesco Aim Management Group, Inc.) and Van Kampen Exchange Corp.; Senior Vice President and Chief Compliance Officer, Invesco Advisers, Inc. (registered investment adviser) (formerly known as Invesco Institutional (N.A.), Inc.); Chief Compliance Officer, The Invesco Funds; Vice President, Invesco Distributors, Inc. (formerly known as Invesco Aim Distributors, Inc.) and Invesco Investment Services, Inc. (formerly known as Invesco Aim Investment Services, Inc.)
Formerly: Chief Compliance Officer, Invesco Funds (Chicago); Senior Vice President, Van Kampen Investments Inc.; Senior Vice President and Chief Compliance Officer, Invesco Aim Advisers, Inc. and Invesco Aim Capital Management, Inc.; Chief Compliance Officer, INVESCO Private Capital Investments, Inc. (holding company), Invesco Private Capital, Inc. (registered investment adviser), Invesco Global Asset Management (N.A.), Inc., Invesco Senior Secured Management, Inc. (registered investment adviser), Van Kampen Investor Services Inc., PowerShares Exchange-Traded Fund Trust, PowerShares Exchange-Traded Fund Trust II, PowerShares India Exchange-Traded Fund Trust and PowerShares Actively Managed Exchange-Traded Fund Trust; and Vice President, Invesco Aim Capital Management, Inc. and Fund Management Company | N/A | N/A |
The Statement of Additional Information of the Trust includes additional information about the Fund’s Trustees and is available upon request, without charge, by calling 1.800.959.4246. Please refer to the Fund’s prospectus for information on the Fund’s sub-advisers.
Office of the Fund 11 Greenway Plaza, Suite 1000 Houston, TX 77046-1173 | Investment Adviser Invesco Advisers, Inc. 1555 Peachtree Street, N.E. Atlanta, GA 30309 | Distributor Invesco Distributors, Inc. 11 Greenway Plaza, Suite 1000 Houston, TX 77046-1173 | Auditors PricewaterhouseCoopers LLP 1201 Louisiana Street, Suite 2900 Houston, TX 77002-5678 | |||
Counsel to the Fund Stradley Ronon Stevens & Young, LLP 2005 Market Street, Suite 2600 Philadelphia, PA 19103-7018 | Counsel to the Independent Trustees Goodwin Procter LLP 901 New York Avenue, N.W. Washington, D.C. 20001 | Transfer Agent Invesco Investment Services, Inc. 11 Greenway Plaza, Suite 1000 Houston, TX 77046-1173 | Custodian State Street Bank and Trust Company 225 Franklin Street Boston, MA 02110-2801 | |||
T-4 Invesco Allocation Funds

Invesco mailing information
Send general correspondence to Invesco Investment Services, Inc., P.O. Box 219078, Kansas City, MO 64121-9078.
Invesco privacy policy
You share personal and financial information with us that is necessary for your transactions and your account records. We take very seriously the obligation to keep that information confidential and private.
Invesco collects nonpublic personal information about you from account applications or other forms you complete and from your transactions with us or our affiliates. We do not disclose information about you or our former customers to service providers or other third parties except to the extent necessary to service your account and in other limited circumstances as permitted by law. For example, we use this information to facilitate the delivery of transaction confirmations, financial reports, prospectuses and tax forms.
Even within Invesco, only people involved in the servicing of your accounts and compliance monitoring have access to your information. To ensure the highest level of confidentiality and security, Invesco maintains physical, electronic and procedural safeguards that meet or exceed federal standards. Special measures, such as data encryption and authentication, apply to your communications with us on our website. More detail is available to you at invesco.com/privacy.
Important notice regarding delivery of security holder documents
To reduce Fund expenses, only one copy of most shareholder documents may be mailed to shareholders with multiple accounts at the same address (Householding). Mailing of your shareholder documents may be householded indefinitely unless you instruct us otherwise. If you do not want the mailing of these documents to be combined with those for other members of your household, please contact Invesco Investment Services, Inc. at 800 959 4246 or contact your financial institution. We will begin sending you individual copies for each account within 30 days after receiving your request.
Fund holdings and proxy voting information
The Fund provides a complete list of its holdings four times in each fiscal year, at the quarter ends. For the second and fourth quarters, the lists appear in the Fund’s semiannual and annual reports to shareholders. For the first and third quarters, the Fund files the lists with the Securities and Exchange Commission (SEC) on Form N-Q. The most recent list of portfolio holdings is available at invesco.com/completeqtrholdings. Shareholders can also look up the Fund’s Forms N-Q on the SEC website at sec.gov. Copies of the Fund’s Forms N-Q may be reviewed and copied at the SEC Public Reference Room in Washington, D.C. You can obtain information on the operation of the Public Reference Room, including information about duplicating fee charges, by calling 202 551 8090 or 800 732 0330, or by electronic request at the following email address: publicinfo@sec.gov. The SEC file numbers for the Fund are shown below.
A description of the policies and procedures that the Fund uses to determine how to vote proxies relating to portfolio securities is available without charge, upon request, from our Client Services department at 800 959 4246 or at invesco.com/proxyguidelines. The information is also available on the SEC website, sec.gov.
Information regarding how the Fund voted proxies related to its portfolio securities during the most recent 12-month period ended June 30 is available at invesco.com/proxysearch. The information is also available on the SEC website, sec.gov. Invesco Advisers, Inc. is an investment adviser; it provides investment advisory services to individual and institutional clients and does not sell securities. Invesco Distributors, Inc. is the US distributor for Invesco Ltd.’s retail mutual funds, exchange-traded funds and institutional money market funds. Both are wholly owned, indirect subsidiaries of Invesco Ltd. |  | |
| SEC file numbers: 811-02699 and 002-57526 AAS-AR-1 Invesco Distributors, Inc. | ||
|
| |||||
Annual Report to Shareholders
| December 31, 2013
| |||||
Invesco Convertible Securities Fund
| ||||||
Nasdaq: A: CNSAX ¡ B: CNSBX ¡ C: CNSCX ¡ Y: CNSDX ¡ R5: CNSIX ¡ R6: CNSFX | ||||||


Letters to Shareholders
Philip Taylor | Dear Shareholders: This annual report includes information about your Invesco Fund, including performance data and a complete list of its investments as of the close of the reporting period. Inside, your Fund’s portfolio managers discuss how they managed your Fund and the factors that affected its performance during the reporting period. I hope you find this report of interest. During the year covered by this report, major US and global equity market indexes hit multiyear or all-time highs1, the result of a strengthening US economy and relatively healthy corporate profits. Also helping equities was a return of individual investors to stocks – due in part to monetary policies that kept interest rates (and yields on fixed income securities) low. At the end of the reporting period, amid widespread signs of an improving economy, the US Federal Reserve announced that it would begin a long-anticipated reduction in its bond-buying program in January 2014; its decision was widely expected and investors reacted positively | ||||||||
| to the announcement. Despite some mid-summer volatility, overseas equity market indexes in developed and emerging nations generally rose during the year. | |||||||||

Extended periods of strong market performance such as we saw throughout 2013 can lull some investors into a false sense of security – just as extended periods of volatility or market weakness can discourage some investors from undertaking disciplined, long-term investment plans. That’s why Invesco believes it can often be helpful to work with a skilled and trusted financial adviser; he or she can emphasize the importance of adhering to an investment plan designed to achieve long-term goals like a first home, a college education for a child or a comfortable retirement. A financial adviser who is familiar with your individual financial situation, investment goals and risk tolerance can be an invaluable partner as you work toward your financial goals. He or she can provide insight and perspective when markets are volatile; encouragement and reassurance when times are uncertain; and advice and guidance when your financial situation or investment goals change.
Timely information when and where you want it
Invesco’s efforts to help investors achieve their financial objectives include providing individual investors and financial professionals with timely information about the markets, the economy and investing – whenever and wherever they want it.
Our website, invesco.com/us, offers a wide range of market insights and investment perspectives. On the website, you’ll find detailed information about our funds, including prices, performance, holdings and portfolio manager commentaries. You can access information about your individual Invesco account whenever it’s convenient for you; just complete a simple, secure online registration. Use the “Login” box on our home page to get started.
Using Invesco’s mobile app for iPad® (available free from the App StoreSM) allows you to obtain the same detailed information about your funds and the same investment insights from our investment leaders, market strategists, economists and retirement experts on the go. You also can watch portfolio manager videos and have instant access to Invesco news and updates wherever you may be.
In addition to the resources accessible on our website and through our mobile app, you can obtain timely updates to help you stay informed about the markets, the economy and investing by connecting with Invesco on Twitter, LinkedIn or Facebook. You can access our blog at blog.invesco.us.com or by visiting the “Intentional Investing Forum” on our home page. Our goal is to provide you the information you want, when and where you want it.
Have questions?
For questions about your account, feel free to contact an Invesco client services representative at 800 959 4246. For Invesco-related questions or comments, please email me directly at phil@invesco.com.
All of us at Invesco look forward to serving your investment management needs for many years to come. Thank you for investing with us.
Sincerely,

Philip Taylor
Senior Managing Director, Invesco Ltd.
1 Source: Reuters
iPad is a trademark of Apple Inc., registered in the US and other countries. App Store is a service mark of Apple Inc.
2 Invesco Convertible Securities Fund
Bruce Crockett | Dear Fellow Shareholders: Many investors enjoyed positive returns on their investments in 2013. While some sectors of the market struggled, many major equity market indexes in the US and around the globe rose last year. The performance of stocks, fixed income securities and alternative investments – and the performance of mutual funds that invest in them – is determined by many factors, including unforeseeable economic and geopolitical events. Your Board certainly can’t determine how well various asset classes in the market perform, but we work hard throughout the year on issues that affect you and your fellow shareholders and determine how your investments are managed. For example, the Invesco Funds Board works to ensure that we provide a lineup of funds that allow financial advisers to build portfolios that meet shareholders’ changing financial needs and goals. Your Board works with Invesco Advisers on a continuing basis to provide | ||||||||
| financial products that may help investors achieve their varied financial goals. We also carefully monitor how the management teams of all the Invesco funds are performing in light of ever-changing and often unpredictable economic and market conditions. Your Board carefully assesses their performance in a constantly changing and highly competitive marketplace. | |||||||||

Your Board also conducts an annual review of the funds’ advisory and sub-advisory contracts with Invesco Advisers and its affiliates. This annual review, which is required by the Investment Company Act of 1940, focuses on the nature and quality of the services Invesco provides as adviser to the Invesco Funds and the reasonableness of the fees that it charges for those services. Each year, we spend months reviewing detailed information that we request from Invesco that allows us to evaluate its services and fees. We also use information from many independent sources, including materials provided by the independent Senior Officer of the Invesco Funds, who reports directly to the independent Trustees on the Board. Additionally, we meet with independent legal counsel and review performance and fee data prepared by Lipper Inc., an independent, third-party firm widely recognized as a leader in its field.
Be assured that your Board will continue working on behalf of fund shareholders, keeping your needs and interests uppermost in our minds.
As always, please contact me at bruce@brucecrockett.com with any questions or concerns you may have. On behalf of the Board, we look forward to continuing to represent your interests and serving your needs.
Sincerely,

Bruce L. Crockett
Independent Chair
Invesco Funds Board of Trustees
3 Invesco Convertible Securities Fund
Management’s Discussion of Fund Performance
Performance summary
For the year ended December 31, 2013, Invesco Convertible Securities Fund, at net asset value (NAV), delivered double-digit returns, but lagged its broad market/ style-specific index, the Bank of America Merrill Lynch All U.S. Convertibles Index. During the reporting period, the Fund benefited from its investments in the information technology (IT), consumer cyclicals and financials sectors. Though the consumer non-cyclical sector was the top contributor to the Fund’s overall return, the sector detracted from results relative to its benchmark. The Fund’s cash position also tempered results relative to its benchmark.
Your Fund’s long-term performance appears later in this report.
Fund vs. Indexes
Total returns, 12/31/12 to 12/31/13, at net asset value (NAV). Performance shown does not include applicable contingent deferred sales charges (CDSC) or front-end sales charges, which would have reduced performance.
| Class A Shares | 21.31 | % | |||
| Class B Shares | 20.40 | ||||
| Class C Shares | 20.37 | ||||
| Class Y Shares | 21.57 | ||||
| Class R5 Shares | 21.72 | ||||
| Class R6 Shares | 21.76 | ||||
Bank of America Merrill Lynch All U.S. Convertibles Index‚ (Broad Market Index/Style-Specific Index) | 24.92 | ||||
| Lipper Convertible Securities Funds Index¡ (Peer Group Index) | 22.64 |
Source(s): ‚Invesco, Bank of America Merrill Lynch via FactSet Research Systems Inc.; ¡Lipper Inc.
How we invest
Our investment objective is to seek total return through growth of capital and current income.
The Fund normally invests at least 80% of its net assets (plus any borrowings for investment purposes) in convertible securities. A convertible security is a bond, preferred stock or other security that may be converted into a prescribed amount of common stock at a prestated price. We may retain that common stock to permit its orderly sale or to establish long-term holding periods for tax purposes. The Fund is not required to sell the common stock to assure that the required percentage of its assets is invested in convertible securities. The Fund’s convertible securities may include lower-rated fixed income
securities commonly known as junk bonds. Convertible securities also may include exchangeable and synthetic convertible securities. Unlike traditional convertible securities whose conversion values are based on the common stock of the issuer of the convertible security, synthetic and exchangeable convertible securities are preferred stocks or debt obligations of an issuer that are combined with an equity component whose conversion value is based on the value of the common stock of a different issuer or a particular benchmark (which may include a foreign issuer or basket of foreign stocks, or a company whose stock is not yet publicly traded). In deciding which securities to buy, hold or sell, we consider market, economic and political conditions.
The Fund may also utilize derivative instruments, including forward foreign currency contracts. The Fund may utilize forward foreign currency contracts to manage the risk of foreign currency exposure. A forward foreign currency contract is an agreement between parties to exchange a specified amount of currency at a specified future time at a specified rate. Forward foreign currency contracts are used to protect against uncertainty about future currency exchange rates. The Fund uses these contracts to hedge against adverse movements in the foreign currencies in which portfolio securities are denominated. The Fund may also invest in real estate investment trusts.
The remaining 20% of the Fund’s assets may be invested in common stocks, non-convertible preferred stocks, non-convertible fixed income securities, and/or foreign securities. The foreign securities may include non-US dollar denominated securities and depositary receipts. The Fund’s fixed income investments may include zero coupon securities, which are purchased at a discount and generally accrue interest, but make no payment until maturity.
We have considerable discretion in deciding which investments we buy, hold or sell on a day-to-day basis and which investment strategies we use. For example, we may, at our discretion, use some permitted investment strategies while not using others. We sell a security when we believe that it no longer fits the Fund’s investment criteria.
Market conditions and your Fund
The year ended December 31, 2013 was characterized by slow but steady improvement in the US economy and strong US equity market returns. As the year began, consumer confidence trended higher based on the recovery
Portfolio Composition By sector
| |||||
| Information Technology | 20.7 | % | |||
| Health Care | 19.8 | ||||
| Financials | 13.4 | ||||
| Consumer Discretionary | 11.4 | ||||
| Industrials | 9.0 | ||||
| Materials | 7.1 | ||||
| Energy | 5.8 | ||||
| Utilities | 3.0 | ||||
| Consumer Staples | 1.1 | ||||
| Telecommunication Services | 1.1 | ||||
| Money Market Funds Plus Other Assets Less Liabilities | 7.6 | ||||
| Top Five Holdings* | |||||
1. Gilead Sciences Inc. | 1.9 | % | |||
2. United States Steel Corp. | 1.1 | ||||
3. Chesapeake Energy Corp. | 1.1 | ||||
4. Crown Castle International Corp. | 1.1 | ||||
5. Jarden Corp. | 1.1 | ||||
| Total Net Assets | $1.8 billion | ||||
| Total Number of Holdings* | 163 | ||||
The Fund’s holdings are subject to change, and there is no assurance that the Fund will continue to hold any particular security.
* Excluding money market fund holdings.
4 Invesco Convertible Securities Fund
of the US housing market, despite uncertainty surrounding the outcome of tax and spending negotiations between the White House and Congress – and implementation of sequestration spending cuts – which consequently left many businesses hesitant to spend.
US equity markets rose for the first half of the year, but from late May through June, capital markets declined following US Federal Reserve (the Fed) Chairman Ben Bernanke’s comments suggesting that the time had come for the Fed to begin to reduce the size of its bond buying program, also known as quantitative easing (QE). This sell-off was brief but broad, and few asset classes were immune. Markets stabilized in mid-summer, despite some volatility in August surrounding a potential US military reaction to instability in Syria. The fourth quarter began amid uncertainty created by a two-week federal government shutdown, yet the markets shrugged off this news and rallied steadily throughout the last three months of the year. In December, as expected, the Fed officially announced that it would begin reducing the scope of QE in early 2014. Despite the Fed’s actions, equities continued to rise, as the announcement was widely anticipated and largely priced into stock valuations.
For the reporting period, major US equity market indexes delivered strong double-digit gains, with the S&P 500 Index returning 32.29%, and the Russell 2000 Index, representing small caps, returning 38.82%.1
Similar to equities, the convertibles market produced strong returns for the year ended December 31, 2013. Performance was primarily driven by the strong returns of the underlying equities, which continued to benefit from improving economic conditions and low interest rates. The Bank of America Merrill Lynch All U.S. Convertibles Index returned 24.92% for the year.
The pace of new US convertible securities issuance accelerated in 2013 from the prior year, with 157 deals totaling approximately $49 billion, a level not seen since 2008.2 However, on a net basis, issuance was essentially flat, as approximately $47 billion in redemptions in the form of calls, puts or maturities, hit the market during the reporting period.2
During the reporting period, the Fund benefited from its investments in the health care and IT sectors. However, despite positive overall performance, our relative underweight allocation within these sectors detracted from results versus the Fund’s benchmark.
The Fund’s allocation in the financials sector made a positive contribution to both absolute and relative results. However, the Fund’s allocation to cash was a drag on relative returns in a very strong equity market.
We continue to focus on companies with healthy balance sheets and reasonable valuations on their convertible securities that may benefit from the current economic environment. We continue to believe that avoiding issue-specific underperformers will be the key to delivering strong results. We believe this will prove to be even more important than picking issue-specific winners, given the asymmetric risks that are present in the market today.
As always, thank you for investing in Invesco Convertible Securities Fund and for sharing our long-term investment horizon.
1 Source: Lipper Inc.
2 Source: Prospect News
The views and opinions expressed in management’s discussion of Fund performance are those of Invesco Advisers, Inc. These views and opinions are subject to change at any time based on factors such as market and economic conditions. These views and opinions may not be relied upon as investment advice or recommendations, or as an offer for a particular security. The information is not a complete analysis of every aspect of any market, country, industry, security or the Fund. Statements of fact are from sources considered reliable, but Invesco Advisers, Inc. makes no representation or warranty as to their completeness or accuracy. Although historical performance is no guarantee of future results, these insights may help you understand our investment management philosophy.
See important Fund and, if applicable, index disclosures later in this report.
 | Ellen Gold Portfolio manager, is lead manager of Invesco Convertible Securities Fund. She joined Invesco in 2010. | |
| Ms. Gold earned a BBA from George Washington University and an MBA from New York University. | ||
 | Ramez Nashed Portfolio manager, is manager of Invesco Convertible Securities Fund. He joined Invesco in 2010. | |
| Mr. Nashed earned a BA in finance from New Jersey City University and an MBA from Seton Hall University. | ||
5 Invesco Convertible Securities Fund
Your Fund’s Long-Term Performance
Results of a $10,000 Investment – Oldest Share Class(es)
Fund and index data from 12/31/03
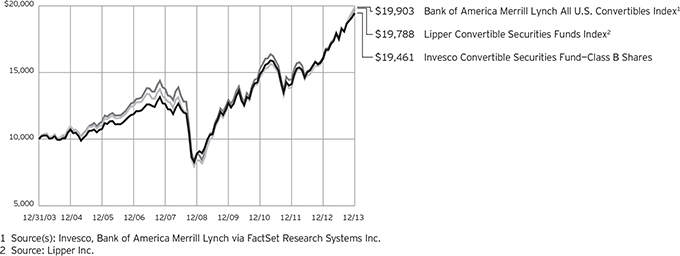
Past performance cannot guarantee comparable future results.
The data shown in the chart include reinvested distributions, applicable sales charges and Fund expenses including management fees. Results for Class B shares are calculated as if a hypothetical shareholder had liquidated his entire
investment in the Fund at the close of the reporting period and paid the contingent deferred sales charges, if applicable. Index results include reinvested dividends, but they do not reflect sales charges. Performance of the peer group, if applicable, reflects fund expenses and management fees; performance of a
market index does not. Performance shown in the chart and table(s) does not reflect deduction of taxes a shareholder would pay on Fund distributions or sale of Fund shares.
continued from page 8
About indexes used in this report
| n | The Bank of America Merrill Lynch All U.S. Convertibles IndexSM tracks the performance of US-dollar-denominated convertible securities that are not currently in bankruptcy and have total market values of more than $50 million at issuance. |
| n | The Lipper Convertible Securities Funds Index represents the average performance of the 10 largest convertible securities mutual funds, as classified by Lipper. |
| n | The S&P 500® Index is an unmanaged index considered representative of the US stock market. |
| n | The Russell 2000® Index is an unmanaged index considered representative of small-cap stocks. The Russell 2000 Index is a trademark/service mark of the Frank Russell Co. Russell® is a trademark of the Frank Russell Co. |
| n | The Fund is not managed to track the performance of any particular index, including the index(es) described here, and consequently, the performance of the Fund may deviate significantly from the performance of the index(es). |
| n | A direct investment cannot be made in an index. Unless otherwise indicated, index results include reinvested dividends, and they do not reflect sales charges. Performance of the peer group, if applicable, reflects fund expenses; performance of a market index does not. |
Other information
| n | The returns shown in management’s discussion of Fund performance are based on net asset values calculated for shareholder transactions. Generally accepted accounting principles require adjustments to be made to the net assets of the Fund at period end for |
financial reporting purposes, and as such, the net asset values for shareholder transactions and the returns based on those net asset values may differ from the net asset values and returns reported in the Financial Highlights. |
| n | Industry classifications used in this report are generally according to the Global Industry Classification Standard, which was developed by and is the exclusive property and a service mark of MSCI Inc. and Standard & Poor’s. |
6 Invesco Convertible Securities Fund
| Average Annual Total Returns | |||||
| As of 12/31/13, including maximum applicable sales charges | |||||
| Class A Shares | |||||
| Inception (7/28/97) | 6.80 | % | |||
| 10 Years | 6.92 | ||||
| 5 Years | 16.14 | ||||
| 1 Year | 14.61 | ||||
| Class B Shares | |||||
| Inception (10/31/85) | 8.02 | % | |||
| 10 Years | 6.88 | ||||
| 5 Years | 16.35 | ||||
| 1 Year | 15.40 | ||||
| Class C Shares | |||||
| Inception (7/28/97) | 6.38 | % | |||
| 10 Years | 6.75 | ||||
| 5 Years | 16.62 | ||||
| 1 Year | 19.37 | ||||
| Class Y Shares | |||||
| Inception (7/28/97) | 7.43 | % | |||
| 10 Years | 7.80 | ||||
| 5 Years | 17.75 | ||||
| 1 Year | 21.57 | ||||
| Class R5 Shares | |||||
| 10 Years | 7.62 | % | |||
| 5 Years | 17.67 | ||||
| 1 Year | 21.72 | ||||
| Class R6 Shares | |||||
| 10 Years | 7.57 | % | |||
| 5 Years | 17.56 | ||||
| 1 Year | 21.76 | ||||
Effective June 1, 2010, Class A, Class B, Class C and Class I shares of the predecessor fund, Morgan Stanley Convertible Securities Trust, advised by Morgan Stanley Investment Advisors Inc. were reorganized into Class A, Class B, Class C and Class Y shares, respectively, of Invesco Convertible Securities Fund. Returns shown above for Class A, Class B, Class C and Class Y shares are blended returns of the predecessor fund and Invesco Convertible Securities Fund. Share class returns will differ from the predecessor fund because of different expenses.
Class R5 shares incepted on May 23, 2011. Performance shown prior to that date is that of the Fund’s and the predecessor fund’s Class A shares and includes the 12b-1 fees applicable to Class A shares. Class A share performance reflects any applicable fee waivers or expense reimbursements.
Class R6 shares incepted on September 24, 2012. Performance shown prior to that date is that of the Fund’s and the predecessor fund’s Class A shares and includes the 12b-1 fees applicable to Class A shares. Class A share performance reflects any applicable fee waivers or expense reimbursements.
The performance data quoted represent past performance and cannot guarantee comparable future results; current performance may be lower or higher. Please visit invesco.com/performance for the most recent month-end performance. Performance figures reflect reinvested distributions, changes in net asset value and the effect of the maximum sales charge unless otherwise stated. Investment return and principal value will fluctuate so that you may have a gain or loss when you sell shares.
The total annual Fund operating expense ratio set forth in the most recent Fund prospectus as of the date of this report for Class A, Class B, Class C, Class Y, Class R5 and Class R6 shares was 0.94%, 1.71%, 1.54%, 0.71%, 0.61% and 0.59%, respectively. The expense ratios presented above may vary from the expense ratios presented in other sections of this report that are based on expenses incurred during the period covered by this report.
Class A share performance reflects the maximum 5.50% sales charge, and Class B and Class C share performance reflects the applicable contingent deferred sales charge (CDSC) for the period involved. The CDSC on Class B shares declines from 5% beginning at the time of purchase to 0% at the beginning of the seventh year. The CDSC on Class C shares is 1% for the first year after purchase. Class Y, Class R5 and Class R6 shares do not have a front-end sales charge or a CDSC; therefore, performance is at net asset value.
The performance of the Fund’s share classes will differ primarily due to different sales charge structures and class expenses.
7 Invesco Convertible Securities Fund
Invesco Convertible Securities Fund’s investment objective is to seek total return through growth of capital and current income.
| n | Unless otherwise stated, information presented in this report is as of December 31, 2013, and is based on total net assets. |
| n | Unless otherwise noted, all data provided by Invesco. |
| n | To access your Fund’s reports/prospectus, visit invesco.com/fundreports. |
About share classes
| n | Class B shares may not be purchased for new or additional investments. Please see the prospectus for more information. |
| n | Class Y shares are available only to certain investors. Please see the prospectus for more information. |
| n | Class R5 shares and Class R6 shares are primarily intended for employer sponsored retirement and benefit plans that meet certain standards and for institutional investors. Please see the prospectus for more information. |
Principal risks of investing in the Fund
| n | Convertible securities risk. The Fund may own convertible securities, the value of which may be affected by market interest rates, the risk that the issuer will default, the value of the underlying stock or the right of the issuer to buy back the convertible securities. |
| n | Credit risk. The issuer of instruments in which the Fund invests may be unable to meet interest and/or principal payments, thereby causing its instruments to decrease in value and lowering the issuer’s credit rating. |
| n | Depositary receipts risk. Depositary receipts involve many of the same risks as those associated with direct investment in foreign securities. In addition, the underlying issuers of certain depositary receipts, particularly unsponsored or unregistered depositary receipts, are under no obligation to distribute shareholder communications to the holders of such receipts or to pass through to them any voting rights with respect to the deposited securities. |
| n | Derivatives risk. The value of a derivative instrument depends largely on (and is derived from) the value of an underlying security, currency, commodity, interest rate, index or other asset (each referred to as an underlying asset). In addition to risks relating to the underlying |
assets, the use of derivatives may include other, possibly greater, risks, including counterparty, leverage and liquidity risks. Counterparty risk is the risk that the counterparty to the derivative contract will default on its obligation to pay the Fund the amount owed or otherwise perform under the derivative contract. Derivatives create leverage risk because they do not require payment up front equal to the economic exposure created by owning the derivative. As a result, an adverse change in the value of the underlying asset could result in the Fund sustaining a loss that is substantially greater than the amount invested in the derivative, which may make the Fund’s returns more volatile and increase the risk of loss. Derivative instruments may also be less liquid than more traditional investments and the Fund may be unable to sell or close out its derivative positions at a desirable time or price. This risk may be more acute under adverse market conditions, during which the Fund may be most in need of liquidating its derivative positions. Derivatives may also be harder to value, less tax efficient and subject to changing government regulation that could impact the Fund’s ability to use certain derivatives or their cost. Also, derivatives used for hedging or to gain or limit exposure to a particular market segment may not provide the expected benefits, particularly during adverse market conditions. |
| n | Developing/emerging markets securities risk. The prices of securities issued by foreign companies and governments located in developing/emerging markets countries may be affected more negatively by inflation, devaluation of their currencies, higher transaction costs, delays in settlement, adverse political developments, the introduction of capital controls, withholding taxes, nationalization of private assets, expropriation, social unrest, war or lack of timely information than those in developed countries. |
| n | Foreign securities risk. The Fund’s foreign investments may be affected by changes in a foreign country’s exchange rates, political and social instability, changes in economic or taxation policies, difficulties when enforcing obligations, decreased liquidity, and increased volatility. Foreign companies may be subject to less regulation resulting in less publicly available information about the companies. |
| n | High yield bond (junk bond) risk. Junk bonds involve a greater risk of default or price changes due to changes in the credit quality of the issuer. The values of junk bonds fluctuate more than those of high- quality bonds in response to company, political, regulatory or economic developments. Values of junk bonds can decline significantly over short periods of time. |
| n | Interest rate risk. Interest rate risk refers to the risk that bond prices generally fall as interest rates rise; conversely, bond prices generally rise as interest rates fall. Specific bonds differ in their sensitivity to changes in interest rates depending on their individual characteristics, including duration. |
| n | Liquidity risk. The Fund may hold illiquid securities that it is unable to sell at the preferred time or price and could lose its entire investment in such securities. |
| n | Management risk. The investment techniques and risk analysis used by the Fund’s portfolio managers may not produce the desired results. |
| n | Market risk. The prices of and the income generated by the Fund’s securities may decline in response to, among other things, investor sentiment, general economic and market conditions, regional or global instability, and currency and interest rate fluctuations. |
continued on page 6
This report must be accompanied or preceded by a currently effective Fund prospectus, which contains more complete information, including sales charges and expenses. Investors should read it carefully before investing.
NOT FDIC INSURED | MAY LOSE VALUE | NO BANK GUARANTEE
Fund Nasdaq Symbols
| |||||
| Class A Shares | CNSAX | ||||
| Class B Shares | CNSBX | ||||
| Class C Shares | CNSCX | ||||
| Class Y Shares | CNSDX | ||||
| Class R5 Shares | CNSIX | ||||
| Class R6 Shares | CNSFX | ||||
8 Invesco Convertible Securities Fund
Schedule of Investments(a)
December 31, 2013
| Principal Amount | Value | |||||||
U.S. Dollar Denominated Bonds and Notes–73.30% |
| |||||||
| Air Freight & Logistics–0.61% | ||||||||
XPO Logistics Inc., Sr. Unsec. Conv. Notes, 4.50%, 10/01/17 | $ | 6,651,000 | $ | 11,161,209 | ||||
| Apparel, Accessories & Luxury Goods–0.98% | ||||||||
Iconix Brand Group Inc., Sr. Unsec. Sub. Conv. Notes, 1.50%, | 3,100,000 | 4,247,000 | ||||||
2.50%, 06/01/16 | 10,000,000 | 13,781,250 | ||||||
| 18,028,250 | ||||||||
| Application Software–3.34% | ||||||||
Bottomline Technologies de Inc., Sr. Unsec. Conv. Notes, 1.50%, 12/01/17 | 3,370,000 | 4,532,650 | ||||||
Mentor Graphics Corp., Unsec. Sub. Conv. Deb., 4.00%, 04/01/18(c) | 6,350,000 | 8,473,281 | ||||||
Nuance Communications Inc., Sr. Unsec. Conv. Notes, 2.75%, 11/01/17(c) | 8,150,000 | 8,002,281 | ||||||
Salesforce.com, Inc., Sr. Unsec. Conv. Notes, 0.25%, 04/01/18(b) | 16,435,000 | 17,883,334 | ||||||
TiVo Inc., Sr. Unsec. Conv. Notes, 4.00%, 03/15/16(b) | 4,000,000 | 5,467,500 | ||||||
Workday Inc., Sr. Unsec. Conv. Notes, 0.75%, 07/15/18(b) | 14,500,000 | 17,082,813 | ||||||
| 61,441,859 | ||||||||
| Asset Management & Custody Banks–1.38% | ||||||||
Ares Capital Corp., Sr. Unsec. Conv. Notes, | 3,895,000 | 4,209,034 | ||||||
5.75%, 02/01/16(b) | 6,000,000 | 6,483,750 | ||||||
Walter Investment Management Corp., Sr. Unsec. Sub. Conv. Notes, 4.50%, 11/01/19 | 14,580,000 | 14,634,675 | ||||||
| 25,327,459 | ||||||||
| Automobile Manufacturers–0.69% | ||||||||
Ford Motor Co., Sr. Unsec. Conv. Notes, 4.25%, 11/15/16 | 6,834,000 | 12,642,900 | ||||||
| Biotechnology–5.70% | ||||||||
Array BioPharma Inc., Sr. Unsec. Conv. Notes, 3.00%, 06/01/20 | 2,493,000 | 2,602,069 | ||||||
BioMarin Pharmaceutical Inc., Sr. Unsec. Sub. Conv. Notes, 0.75%, 10/15/18 | 8,517,000 | 9,065,282 | ||||||
1.50%, 10/15/20 | 7,337,000 | 7,882,689 | ||||||
Cubist Pharmaceuticals Inc., | 7,173,000 | 8,217,568 | ||||||
Sr. Unsec. Conv. Notes, 1.13%, 09/01/18(b) | 5,845,000 | 6,740,016 | ||||||
2.50%, 11/01/17 | 2,870,000 | 6,988,450 | ||||||
| Principal Amount | Value | |||||||
| Biotechnology–(continued) | ||||||||
Exelixis Inc., Sr. Unsec. Sub. Conv. Notes, 4.25%, 08/15/19 | $ | 3,000,000 | $ | 3,688,125 | ||||
Gilead Sciences Inc., Series D, Sr. Unsec. Conv. Notes, 1.63%, 05/01/16 | 10,656,000 | 35,164,853 | ||||||
Incyte Corp. Ltd., Sr. Unsec. Conv. Notes, | 1,775,000 | 2,131,109 | ||||||
1.25%, 11/15/20(b) | 1,775,000 | 2,162,172 | ||||||
InterMune Inc., Sr. Unsec. Conv. Notes, 2.50%, 09/15/18 | 5,470,000 | 4,899,069 | ||||||
Medivation Inc., Sr. Unsec. Conv. Notes, 2.63%, 04/01/17 | 6,000,000 | 8,790,000 | ||||||
Therravance Inc., Unsec. Sub. Conv. Notes, 2.13%, 01/15/23 | 4,500,000 | 6,564,375 | ||||||
| 104,895,777 | ||||||||
| Broadcasting–1.04% | ||||||||
Liberty Media Corp., Sr. Unsec. Conv. Notes, 1.38%, 10/15/23(b) | 19,160,000 | 19,171,975 | ||||||
| Casinos & Gaming–1.04% | ||||||||
MGM Resorts International, Sr. Unsec. Gtd. Conv. Notes, 4.25%, 04/15/15 | 13,845,000 | 19,071,488 | ||||||
| Catalog Retail–1.30% | ||||||||
Liberty Interactive LLC, Sr. Unsec. Conv. Notes, | 13,800,000 | 17,267,250 | ||||||
1.00%, 10/05/16(b)(c) | 6,247,000 | 6,606,203 | ||||||
| 23,873,453 | ||||||||
| Coal & Consumable Fuels–1.04% | ||||||||
Alpha Natural Resources Inc., Sr. Unsec. Gtd. Conv. Notes, 3.75%, 12/15/17 | 14,716,000 | 15,332,233 | ||||||
Peabody Energy Corp., Jr. Unsec. Sub. Conv. Deb., 4.75%, 12/15/41 | 4,770,000 | 3,795,131 | ||||||
| 19,127,364 | ||||||||
| Communications Equipment–1.87% | ||||||||
Ciena Corp., Sr. Unsec. Conv. Notes, 4.00%, 12/15/20(b) | 8,855,000 | 13,072,194 | ||||||
Ixia, Sr. Unsec. Conv. Notes, 3.00%, 12/15/15 | 5,430,000 | 5,877,975 | ||||||
JDS Uniphase Corp., Sr. Unsec. Conv. Notes, 0.63%, | 15,450,000 | 15,527,250 | ||||||
| 34,477,419 | ||||||||
| Computer Storage & Peripherals–0.97% | ||||||||
SanDisk Corp., Sr. Unsec. Conv. Notes, 0.50%, 10/15/20(b) | 17,862,000 | 17,772,690 | ||||||
| Construction & Engineering–0.17% | ||||||||
MasTec Inc., Sr. Unsec. Gtd. Conv. Notes, 4.00%, 06/15/14 | 1,500,000 | 3,122,813 | ||||||
See accompanying Notes to Financial Statements which are an integral part of the financial statements.
9 Invesco Convertible Securities Fund
| Principal Amount | Value | |||||||
| Construction & Farm Machinery & Heavy Trucks–3.08% | ||||||||
Greenbrier Cos., Inc. (The), Sr. Unsec. Conv. Notes, 3.50%, 04/01/18 | $ | 11,510,000 | $ | 13,668,125 | ||||
Meritor Inc., Sr. Unsec. Gtd. Conv. Notes, 7.88%, 12/01/20(b)(c) | 11,242,000 | 16,195,506 | ||||||
Navistar International Corp., Sr. Unsec. Sub. Conv. Notes, 4.50%, 10/15/18(b) | 16,186,000 | 16,722,161 | ||||||
Wabash National Corp., Sr. Unsec. Conv. Notes, 3.38%, 05/01/18 | 7,796,000 | 10,178,653 | ||||||
| 56,764,445 | ||||||||
| Construction Materials–0.47% | ||||||||
Cemex S.A.B. de C.V. (Mexico), Unsec. Sub. Conv. Global Notes, 3.25%, 03/15/16 | 6,600,000 | 8,712,000 | ||||||
| Consumer Finance–0.80% | ||||||||
Portfolio Recovery Associates, Inc., Sr. Unsec. Conv. Notes, 3.00%, 08/01/20(b) | 13,460,000 | 14,814,413 | ||||||
| Diversified Metals & Mining–1.51% | ||||||||
Molycorp Inc., Sr. Unsec. Conv. Notes, 6.00%, 09/01/17 | 15,481,000 | 12,597,664 | ||||||
RTI International Metals Inc., Sr. Unsec. Gtd. Conv. Notes, 1.63%, 10/15/19 | 9,580,000 | 10,112,887 | ||||||
3.00%, 12/01/15 | 4,480,000 | 5,098,800 | ||||||
| 27,809,351 | ||||||||
| Electrical Components & Equipment–0.63% | ||||||||
EnerSys, Sr. Unsec. Conv. Notes, 3.38%, 06/01/15(c)(d) | 3,532,000 | 6,242,828 | ||||||
General Cable Corp., Unsec. Sub. Conv. Global Notes, 4.50%, 11/15/29(e) | 2,000,000 | 2,146,250 | ||||||
SolarCity Corp., Sr. Unsec. Conv. Notes, 2.75%, 11/01/18 | 2,651,000 | 3,149,719 | ||||||
| 11,538,797 | ||||||||
| Electronic Components–0.42% | ||||||||
InvenSense Inc., Sr. Unsec. Conv. Notes, 1.75%, 11/01/18(b) | 3,550,000 | 4,151,282 | ||||||
Vishay Intertechnoloy Inc., Sr. Unsec. Conv. Notes, 2.25%, 05/15/41(b) | 4,150,000 | 3,628,656 | ||||||
| 7,779,938 | ||||||||
| Gold–0.12% | ||||||||
Royal Gold Inc., Sr. Unsec. Conv. Notes, 2.88%, 06/15/19 | 2,324,000 | 2,245,565 | ||||||
| Health Care Equipment–4.95% | ||||||||
HeartWare International Inc., Sr. Unsec. Conv. Notes, 3.50%, 12/15/17 | 6,304,000 | 7,596,320 | ||||||
Hologic Inc., | 8,000,000 | 9,345,000 | ||||||
Series 2012, Sr. Unsec. Conv. Notes, 2.00%, 03/01/18(c)(d) | 2,400,000 | 2,457,000 | ||||||
| Principal Amount | Value | |||||||
| Health Care Equipment–(continued) | ||||||||
Insulet Corp., Sr. Unsec. Conv. Notes, 3.75%, 06/15/16 | $ | 6,077,000 | $ | 8,955,979 | ||||
Integra Lifesciences Holdings Corp., Sr. Unsec. Conv. Notes, 1.63%, 12/15/16 | 8,500,000 | 9,169,375 | ||||||
NuVasive Inc., Sr. Unsec. Conv. Notes, 2.75%, 07/01/17 | 8,500,000 | 9,249,062 | ||||||
Teleflex Inc., Sr. Unsec. Sub. Conv. Notes, 3.88%, 08/01/17 | 8,200,000 | 12,976,500 | ||||||
Volcano Corp., Sr. Unsec. Conv. Notes, 1.75%, 12/01/17 | 13,780,000 | 13,590,525 | ||||||
Wright Medical Group, Inc., Sr. Unsec. Conv. Notes, 2.00%, 08/15/17 | 13,250,000 | 17,730,156 | ||||||
| 91,069,917 | ||||||||
| Health Care Facilities–1.66% | ||||||||
Brookdale Senior Living Inc., Sr. Unsec. Conv. Notes, 2.75%, 06/15/18 | 9,750,000 | 11,626,875 | ||||||
HealthSouth Corp., Sr. Unsec. Sub. Conv. Notes, 2.00%, 12/01/20(c) | 12,868,000 | 13,623,995 | ||||||
LifePoint Hospitals Inc., Sr. Unsec. Sub. Conv. Notes, 3.50%, 05/15/14 | 4,800,000 | 5,241,000 | ||||||
| 30,491,870 | ||||||||
| Health Care Services–1.20% | ||||||||
Omnicare, Inc., | 10,397,000 | 15,751,455 | ||||||
Sr. Unsec. Sub. Conv. Notes, 3.50%, 02/15/44 | 6,200,000 | 6,281,375 | ||||||
| 22,032,830 | ||||||||
| Health Care Technology–1.26% | ||||||||
Allscripts Healthcare Solutions Inc., Sr. Unsec. Conv. Notes, 1.25%, 07/01/20(b) | 15,580,000 | 17,546,975 | ||||||
Medidata Solutions Inc., Sr. Unsec. Conv. Notes, 1.00%, 08/01/18(b) | 4,337,000 | 5,554,071 | ||||||
| 23,101,046 | ||||||||
| Home Entertainment Software–1.49% | ||||||||
Electronic Arts Inc., Sr. Unsec. Conv. Notes, 0.75%, 07/15/16 | 13,100,000 | 14,000,625 | ||||||
Take-Two Interactive Software, Inc., Sr. Unsec. Conv. Notes, 1.00%, 07/01/18 | 12,500,000 | 13,398,437 | ||||||
| 27,399,062 | ||||||||
| Homebuilding–1.45% | ||||||||
KB Home, Sr. Unsec. Gtd. Conv. Notes, 1.38%, 02/01/19 | 10,146,000 | 10,126,976 | ||||||
Ryland Group Inc. (The), Sr. Unsec. Gtd. Conv. Notes, 1.63%, 05/15/18 | 7,190,000 | 10,996,206 | ||||||
Standard Pacific Corp., Sr. Unsec. Gtd. Conv. Notes, 1.25%, 08/01/17(c) | 4,166,000 | 5,535,573 | ||||||
| 26,658,755 | ||||||||
See accompanying Notes to Financial Statements which are an integral part of the financial statements.
10 Invesco Convertible Securities Fund
| Principal Amount | Value | |||||||
| Housewares & Specialties–1.06% | ||||||||
Jarden Corp., Sr. Unsec. Gtd. Sub. Conv. Notes, 1.88%, 09/15/18 | $ | 13,800,000 | $ | 19,561,500 | ||||
| Industrial Machinery–0.42% | ||||||||
Chart Industries Inc., Sr. Unsec. Sub. Conv. Notes, 2.00%, 08/01/18 | 5,000,000 | 7,746,875 | ||||||
| Industrial REIT’s–0.21% | ||||||||
ProLogis L.P., Sr. Unsec. Gtd. Conv. Notes., 3.25%, 03/15/15 | 3,400,000 | 3,803,750 | ||||||
| Internet Retail–2.10% | ||||||||
Ctrip.com International Ltd. (China), Sr. Unsec. Conv. Notes, 1.25%, 10/15/16(b)(c) | 4,420,000 | 4,381,325 | ||||||
priceline.com Inc., Sr. Unsec. Conv. Notes, 1.00%, 03/15/18 | 12,800,000 | 17,712,000 | ||||||
Shutterfly Inc., Sr. Unsec. Conv. Notes, 0.25%, 05/15/18(b) | 15,476,000 | 16,627,027 | ||||||
| 38,720,352 | ||||||||
| Internet Software & Services–3.71% | ||||||||
Cornerstone OnDemand Inc., Sr. Unsec. Conv. Notes, 1.50%, 07/01/18(b) | 13,206,000 | 16,094,812 | ||||||
Dealertrack Technologies, Inc., Sr. Unsec. Gtd. Conv. Notes, 1.50%, 03/15/17 | 10,900,000 | 15,123,750 | ||||||
Move Inc., Sr. Unsec. Conv. Notes, 2.75%, 09/01/18(b) | 4,337,000 | 4,906,231 | ||||||
Qihoo 360 Technology Co. Ltd. (China), Sr. Unsec. Conv. Notes, 2.50%, 09/15/16(b)(c) | 5,070,000 | 5,418,563 | ||||||
VeriSign Inc., Jr. Unsec. Sub. Conv. Global Notes, 3.25%, 08/15/37 | 4,905,000 | 8,871,919 | ||||||
Yahoo! Inc., Sr. Unsec. Conv. Notes, 0.00%, 12/01/18(b)(f) | 17,230,000 | 17,886,894 | ||||||
| 68,302,169 | ||||||||
| Investment Banking & Brokerage–0.82% | ||||||||
FXCM Inc., Sr. Unsec. Conv. Notes, 2.25%, 06/15/18(b) | 13,342,000 | 15,076,460 | ||||||
| Leisure Products–0.20% | ||||||||
Callaway Golf Co., Sr. Unsec. Conv. Bonds, 3.75%, 08/15/19 | 3,000,000 | 3,708,750 | ||||||
| Life Sciences Tools & Services–1.01% | ||||||||
Illumina Inc., Sr. Unsec. Conv. Notes, 0.25%, 03/15/16(b) | 13,400,000 | 18,651,125 | ||||||
| Managed Health Care–1.36% | ||||||||
Molina Healthcare Inc., Sr. Unsec. Conv. Notes, 1.13%, 01/15/20(b) | 8,513,000 | 8,991,856 | ||||||
Wellpoint Inc., Sr. Unsec. Conv. Bonds, 2.75%, 10/15/42 | 11,800,000 | 16,033,250 | ||||||
| 25,025,106 | ||||||||
| Mortgage REIT’s–1.08% | ||||||||
Annaly Capital Management Inc., Sr. Unsec. Conv. Notes, 5.00%, 05/15/15 | 9,333,000 | 9,455,496 | ||||||
| Principal Amount | Value | |||||||
| Mortgage REIT’s–(continued) | ||||||||
Pennymac Corp., Sr. Unsec. Gtd. Conv. Notes, 5.38%, 05/01/20(b) | $ | 10,854,000 | $ | 10,433,407 | ||||
| 19,888,903 | ||||||||
| Movies & Entertainment–0.23% | ||||||||
XM Satellite Radio Inc., Sr. Unsec. Gtd. Sub. Conv. Notes, 7.00%, 12/01/14(b) | 2,200,000 | 4,284,500 | ||||||
| Office REIT’s–0.61% | ||||||||
SL Green Operating Partnership L.P., Sr. Unsec. Gtd. Conv. Notes, 3.00%, 10/15/17(b) | 9,000,000 | 11,244,375 | ||||||
| Oil & Gas Equipment & Services–1.75% | ||||||||
Helix Energy Solutions Group, Inc., Sr. Unsec. Conv. Notes, 3.25%, 03/15/18(c) | 7,535,000 | 9,046,709 | ||||||
Hornbeck Offshore Services, Inc., Sr. Unsec. Gtd. Conv. Notes, 1.50%, 09/01/19 | 8,989,000 | 10,680,056 | ||||||
SEACOR Holdings Inc., | 1,556,000 | 1,914,853 | ||||||
Sr. Unsec. Conv. Notes, 3.00%, 11/19/20(b)(c) | 10,674,000 | 10,627,301 | ||||||
| 32,268,919 | ||||||||
| Oil & Gas Exploration & Production–1.30% | ||||||||
Chesapeake Energy Corp., Sr. Unsec. Gtd. Conv. Notes, 2.50%, | 8,330,000 | 8,496,600 | ||||||
Goodrich Petroleum Corp., Sr. Unsec. Gtd. Conv. Notes, 5.00%, | 2,673,000 | 2,733,142 | ||||||
Stone Energy Corp., Sr. Unsec. Gtd. Conv. Notes, 1.75%, 03/01/17 | 11,421,000 | 12,663,034 | ||||||
| 23,892,776 | ||||||||
| Oil & Gas Refining & Marketing–0.43% | ||||||||
Alon USA Energy, Inc., Sr. Unsec. Conv. Notes, 3.00%, 09/15/18(b) | 6,192,000 | 7,879,320 | ||||||
| Packaged Foods & Meats–0.28% | ||||||||
Chiquita Brands International Inc., Sr. Unsec. Conv. Notes, 4.25%, 08/15/16 | 5,357,000 | 5,223,075 | ||||||
| Pharmaceuticals–2.64% | ||||||||
Akorn Inc., Sr. Unsec. Conv. Notes, 3.50%, 06/01/16 | 4,000,000 | 11,390,000 | ||||||
Auxilium Pharmaceuticals Inc., Sr. Unsec. Conv. Notes, 1.50%, 07/15/18 | 7,824,000 | 8,674,860 | ||||||
Medicines Co. (The), Sr. Unsec. Conv. Bonds, 1.38%, 06/01/17 | 5,000,000 | 7,543,750 | ||||||
Pacira Pharmaceuticals Inc., Sr. Unsec. Conv. Notes, 3.25%, 02/01/19(b) | 1,233,000 | 2,962,282 | ||||||
Salix Pharmaceuticals Ltd., Sr. Unsec. Conv. Notes, 1.50%, 03/15/19 | 12,000,000 | 17,947,500 | ||||||
| 48,518,392 | ||||||||
See accompanying Notes to Financial Statements which are an integral part of the financial statements.
11 Invesco Convertible Securities Fund
| Principal Amount | Value | |||||||
| Precious Metals & Minerals–0.53% | ||||||||
Stillwater Mining Co., Sr. Unsec. Conv. Notes, 1.75%, 10/15/19(c) | $ | 8,700,000 | $ | 9,798,375 | ||||
| Semiconductor Equipment–1.84% | ||||||||
GT Advanced Technologies Inc., Sr. Unsec. Conv. Notes, 3.00%, 12/15/20 | 6,684,000 | 6,800,970 | ||||||
Lam Research Corp., Series B, Sr. Unsec. Conv. Notes, 1.25%, 05/15/18 | 10,800,000 | 13,189,500 | ||||||
Novellus Systems Inc., Sr. Unsec. Gtd. Conv. Notes, 2.63%, 05/15/41 | 4,500,000 | 7,543,125 | ||||||
Photronics Inc., Sr. Unsec. Conv. Notes, 3.25%, 04/01/16 | 5,525,000 | 6,374,469 | ||||||
| 33,908,064 | ||||||||
| Semiconductors–5.43% | ||||||||
Intel Corp., | 1,300,000 | 1,459,250 | ||||||
2.95%, 12/15/35 | 8,476,000 | 9,514,310 | ||||||
Jr. Unsec. Sub. Conv. Notes, 3.25%, 08/01/39 | 8,940,000 | 12,199,077 | ||||||
Linear Technology Corp., Series A, Sr. Unsec. Conv. Global Notes, 3.00%, 05/01/14(c) | 13,075,000 | 14,938,188 | ||||||
Micron Technology Inc., | 7,627,000 | 15,501,877 | ||||||
Series G, Sr. Unsec. Conv. Bonds, 3.00%, 11/15/18(c) | 3,539,000 | 3,501,398 | ||||||
NVIDIA Corp., Sr. Unsec. Conv. Notes, 1.00%, 12/01/18(b) | 8,900,000 | 9,155,875 | ||||||
ON Semiconductor Corp., Series B, Sr. Unsec. Gtd. Sub. Conv. Notes, 2.63%, 12/15/16(c) | 16,220,000 | 17,912,962 | ||||||
SunPower Corp., Sr. Unsec. Conv. Notes, | 1,358,000 | 1,908,839 | ||||||
4.75%, 04/15/14 | 2,850,000 | 3,402,188 | ||||||
Xilinx Inc., Sr. Unsec. Conv. Notes, 2.63%, 06/15/17 | 6,530,000 | 10,448,000 | ||||||
| 99,941,964 | ||||||||
| Specialized Finance–0.78% | ||||||||
Air Lease Corp., Sr. Unsec. Conv. Notes, 3.88%, 12/01/18 | 10,600,000 | 14,283,500 | ||||||
| Specialty Chemicals–0.51% | ||||||||
RPM International Inc., Sr. Unsec. Conv. Notes, 2.25%, 12/15/20 | 8,464,000 | 9,410,910 | ||||||
| Steel–2.14% | ||||||||
AK Steel Corp., Sr. Unsec. Gtd. Conv. Notes, 5.00%, 11/15/19 | 11,453,000 | 18,532,386 | ||||||
United States Steel Corp., Sr. Unsec. Conv. Notes, 2.75%, 04/01/19 | 15,650,000 | 20,794,937 | ||||||
| 39,327,323 | ||||||||
| Principal Amount | Value | |||||||
| Systems Software–1.61% | ||||||||
NetSuite Inc., Sr. Unsec. Conv. Notes, 0.25%, 06/01/18(b) | $ | 14,510,000 | $ | 16,069,825 | ||||
ServiceNow Inc., Sr. Unsec. Conv. Notes, 0.00%, 11/01/18(b)(f) | 13,312,000 | 13,536,640 | ||||||
| 29,606,465 | ||||||||
| Thrifts & Mortgage Finance–1.16% | ||||||||
MGIC Investment Corp., Sr. Unsec. Conv. Notes, | 5,191,000 | 7,189,535 | ||||||
5.00%, 05/01/17 | 5,219,000 | 5,949,660 | ||||||
Radian Group Inc., Sr. Unsec. Conv. Notes, | 2,799,000 | 4,118,029 | ||||||
3.00%, 11/15/17 | 2,894,000 | 4,120,332 | ||||||
| 21,377,556 | ||||||||
| Tobacco–0.32% | ||||||||
Vector Group Ltd., Sr. Unsec. Conv. Notes, 2.50%, 01/15/19 | 5,040,000 | 5,961,670 | ||||||
| Trucking–0.60% | ||||||||
Avis Budget Group Inc., Sr. Unsec. Conv. Notes, 3.50%, 10/01/14 | 4,406,000 | 11,100,366 | ||||||
Total U.S. Dollar Denominated Bonds and Notes |
| 1,349,045,185 | ||||||
| Shares | ||||||||
Preferred Stocks–17.35% |
| |||||||
| Aerospace & Defense–0.81% | ||||||||
United Technologies Corp., $3.75 Jr. Unsec. Sub. Conv. Pfd. | 228,100 | 14,933,707 | ||||||
| Asset Management & Custody Banks–1.00% | ||||||||
AMG Capital Trust II, $2.58 Jr. Gtd. Sub. Conv. Pfd. | 289,600 | 18,389,600 | ||||||
| Diversified Banks–0.87% | ||||||||
Wells Fargo & Co., Class A, Series L, $75.00 Conv. Pfd. | 14,500 | 16,022,500 | ||||||
| Electric Utilities–1.95% | ||||||||
NextEra Energy, Inc., $2.94 Conv. Pfd. | 312,100 | 17,674,223 | ||||||
PPL Corp., $4.38 Conv. Pfd. | 345,500 | 18,270,040 | ||||||
| 35,944,263 | ||||||||
| Industrial Machinery–0.48% | ||||||||
Stanley Black & Decker, Inc., $6.25 Conv. Pfd. | 85,333 | 8,806,366 | ||||||
| Life & Health Insurance–1.00% | ||||||||
MetLife Inc., $1.25 Conv. Pfd. | 582,100 | 18,359,434 | ||||||
| Multi-Utilities–1.00% | ||||||||
Dominion Resources, Inc., Series B, $3.00 Conv. Pfd. | 337,000 | 18,344,561 | ||||||
| Oil & Gas Exploration & Production–1.30% | ||||||||
Chesapeake Energy Corp., $57.50 Conv. Pfd.(b) | 17,173 | 20,081,677 | ||||||
See accompanying Notes to Financial Statements which are an integral part of the financial statements.
12 Invesco Convertible Securities Fund
| Share | Value | |||||||
| Oil & Gas Exploration & Production–(continued) | ||||||||
Sanchez Energy Corp., Series A, $2.44 Conv. Pfd.(b) | 62,028 | $ | 3,876,750 | |||||
| 23,958,427 | ||||||||
| Other Diversified Financial Services–0.88% | ||||||||
Bank of America Corp., Series L, $72.50 Conv. Pfd. | 15,300 | 16,233,300 | ||||||
| Packaged Foods & Meats–0.51% | ||||||||
Post Holdings, Inc., $3.75 Conv. Pfd.(b) | 41,411 | 4,920,455 | ||||||
Post Holdings, Inc., Series C, $2.50 | 44,585 | 4,461,287 | ||||||
| 9,381,742 | ||||||||
| Railroads–0.84% | ||||||||
Genesee & Wyoming Inc., $5.00 Conv. Pfd. | 119,700 | 15,411,375 | ||||||
| Real Estate Development–0.27% | ||||||||
Forestar Group, Inc., $1.50 Conv. Pfd. | 175,259 | 4,907,252 | ||||||
| Regional Banks–1.07% | ||||||||
KeyCorp, Series A, $7.75 Conv. Pfd. | 18,000 | 2,322,000 | ||||||
Wintrust Financial Corp., Class C $50.00 Conv. Pfd. | 14,000 | 17,328,500 | ||||||
| 19,650,500 | ||||||||
| Reinsurance–0.84% | ||||||||
Maiden Holdings Ltd., Series B, $3.63 Conv. Pfd. | 338,948 | 15,445,860 | ||||||
| Specialty Properties–1.00% | ||||||||
Weyerhaeuser Co., Series A, $3.19 | 329,200 | 18,448,368 | ||||||
| Steel–1.78% | ||||||||
ArcelorMittal (Luxembourg), Series MTUS, $1.50 Jr. Unsec. Sub. Conv. Pfd. | 716,700 | 18,634,200 | ||||||
Cliffs Natural Resources Inc., $1.75 Conv. Pfd. | 616,986 | 14,165,998 | ||||||
| 32,800,198 | ||||||||
| Share | Value | |||||||
| Tires & Rubber–0.66% | ||||||||
Goodyear Tire & Rubber Co. (The), $2.94 Conv. Pfd. | 182,800 | $ | 12,220,180 | |||||
| Wireless Telecommunication Services–1.09% | ||||||||
Crown Castle International Corp., Series A, $4.50 Conv. Pfd. | 198,270 | 19,950,919 | ||||||
Total Preferred Stocks |
| 319,208,552 | ||||||
Common Stocks–1.73% |
| |||||||
| Automobile Manufacturers–0.69% | ||||||||
General Motors Co.(g) | 308,854 | 12,622,861 | ||||||
| Life & Health Insurance–0.21% | ||||||||
MetLife, Inc. | 71,559 | 3,858,461 | ||||||
| Other Diversified Financial Services–0.24% | ||||||||
Citigroup Inc. | 84,714 | 4,414,447 | ||||||
| Trucking–0.59% | ||||||||
Swift Transportation Co.(g) | 491,494 | 10,916,087 | ||||||
Total Common Stocks |
| 31,811,856 | ||||||
Money Market Funds–7.09% |
| |||||||
Liquid Assets Portfolio–Institutional Class(h) | 65,253,284 | 65,253,284 | ||||||
Premier Portfolio–Institutional Class(h) | 65,253,285 | 65,253,285 | ||||||
Total Money Market Funds |
| 130,506,569 | ||||||
TOTAL INVESTMENTS–99.47% |
| 1,830,572,162 | ||||||
OTHER ASSETS LESS LIABILITIES–0.53% |
| 9,818,911 | ||||||
NET ASSETS–100.00% |
| $ | 1,840,391,073 | |||||
Investment Abbreviations:
| Conv. | – Convertible | |
| Deb. | – Debentures | |
| Gtd. | — Guaranteed | |
| Jr. | – Junior | |
| Pfd. | – Preferred |
| REIT | – Real Estate Investment Trust | |
| Sr. | – Senior | |
| Sub. | – Subordinated | |
| Unsec. | – Unsecured |
Notes to Schedule of Investments:
| (a) | Industry and/or sector classifications used in this report are generally according to the Global Industry Classification Standard, which was developed by and is the exclusive property and a service mark of MSCI Inc. and Standard & Poor’s. |
| (b) | Security purchased or received in a transaction exempt from registration under the Securities Act of 1933, as amended (the “1933 Act”). The security may be resold pursuant to an exemption from registration under the 1933 Act, typically to qualified institutional buyers. The aggregate value of these securities at December 31, 2013 was $482,975,002, which represented 26.24% of the Fund’s Net Assets. |
| (c) | Security has an irrevocable call by the issuer or mandatory put by the holder. Maturity date reflects such call or put. |
| (d) | Step coupon bond. Rate shown is the rate in effect on December 31, 2013. |
| (e) | Step coupon bond. The interest rate represents the coupon rate at which the bond will accrue at a specified future date. |
| (f) | Zero coupon bond issued at a discount. The interest rate shown represents the yield to maturity at issue. |
| (g) | Non-income producing security. |
| (h) | The money market fund and the Fund are affiliated by having the same investment adviser. |
See accompanying Notes to Financial Statements which are an integral part of the financial statements.
13 Invesco Convertible Securities Fund
Statement of Assets and Liabilities
December 31, 2013
Assets: |
| |||
Investments, at value (Cost $1,497,201,384) | $ | 1,700,065,593 | ||
Investments in affiliated money market funds, at value and cost | 130,506,569 | |||
Total investments, at value (Cost $1,627,707,953) | 1,830,572,162 | |||
Cash | 77,033 | |||
Receivable for: | ||||
Investments sold | 1,777,874 | |||
Fund shares sold | 12,804,493 | |||
Dividends and interest | 7,244,986 | |||
Investment for trustee deferred compensation and retirement plans | 90,675 | |||
Other assets | 57,198 | |||
Total assets | 1,852,624,421 | |||
Liabilities: |
| |||
Payable for: | ||||
Investments purchased | 9,721,808 | |||
Fund shares reacquired | 1,544,876 | |||
Accrued fees to affiliates | 702,482 | |||
Accrued trustees’ and officers’ fees and benefits | 1,582 | |||
Accrued other operating expenses | 94,204 | |||
Trustee deferred compensation and retirement plans | 168,396 | |||
Total liabilities | 12,233,348 | |||
Net assets applicable to shares outstanding | $ | 1,840,391,073 | ||
Net assets consist of: |
| |||
Shares of beneficial interest | $ | 1,608,992,281 | ||
Undistributed net investment income | 14,017,733 | |||
Undistributed net realized gain | 14,516,850 | |||
Net unrealized appreciation | 202,864,209 | |||
| $ | 1,840,391,073 | |||
Net Assets: |
| |||
Class A | $ | 936,425,227 | ||
Class B | $ | 7,167,268 | ||
Class C | $ | 172,231,594 | ||
Class Y | $ | 719,722,066 | ||
Class R5 | $ | 4,781,390 | ||
Class R6 | $ | 63,528 | ||
Shares outstanding, $0.01 par value per share, |
| |||
Class A | 38,741,603 | |||
Class B | 295,736 | |||
Class C | 7,163,222 | |||
Class Y | 29,745,560 | |||
Class R5 | 197,740 | |||
Class R6 | 2,627 | |||
Class A: | ||||
Net asset value per share | $ | 24.17 | ||
Maximum offering price per share | ||||
(Net asset value of $24.17 ¸ 94.50%) | $ | 25.58 | ||
Class B: | ||||
Net asset value and offering price per share | $ | 24.24 | ||
Class C: | ||||
Net asset value and offering price per share | $ | 24.04 | ||
Class Y: | ||||
Net asset value and offering price per share | $ | 24.20 | ||
Class R5: | ||||
Net asset value and offering price per share | $ | 24.18 | ||
Class R6: | ||||
Net asset value and offering price per share | $ | 24.18 | ||
See accompanying Notes to Financial Statements which are an integral part of the financial statements.
14 Invesco Convertible Securities Fund
Statement of Operations
For the year ended December 31, 2013
Investment income: |
| |||
Interest | $ | 22,986,628 | ||
Dividends | 18,973,238 | |||
Dividends from affiliated money market funds | 45,743 | |||
Total investment income | 42,005,609 | |||
Expenses: | ||||
Advisory fees | 6,259,905 | |||
Administrative services fees | 319,888 | |||
Custodian fees | 31,923 | |||
Distribution fees: | ||||
Class A | 1,647,162 | |||
Class B | 70,342 | |||
Class C | 1,108,072 | |||
Transfer agent fees — A, B, C and Y | 1,275,361 | |||
Transfer agent fees — R5 | 861 | |||
Transfer agent fees — R6 | 4 | |||
Trustees’ and officers’ fees and benefits | 82,078 | |||
Other | 408,487 | |||
Total expenses | 11,204,083 | |||
Less: Fees waived and expense offset arrangement(s) | (98,705 | ) | ||
Net expenses | 11,105,378 | |||
Net investment income | 30,900,231 | |||
Realized and unrealized gain from: | ||||
Net realized gain from investment securities | 65,830,650 | |||
Change in net unrealized appreciation of investment securities | 142,680,462 | |||
Net realized and unrealized gain | 208,511,112 | |||
Net increase in net assets resulting from operations | $ | 239,411,343 | ||
See accompanying Notes to Financial Statements which are an integral part of the financial statements.
15 Invesco Convertible Securities Fund
Statement of Changes in Net Assets
For the years ended December 31, 2013 and 2012
| 2013 | 2012 | |||||||
Operations: |
| |||||||
Net investment income | $ | 30,900,231 | $ | 20,984,763 | ||||
Net realized gain | 65,830,650 | 19,129,108 | ||||||
Change in net unrealized appreciation | 142,680,462 | 69,911,582 | ||||||
Net increase in net assets resulting from operations | 239,411,343 | 110,025,453 | ||||||
Distributions to shareholders from net investment income: | ||||||||
Class A | (16,300,589 | ) | (12,090,682 | ) | ||||
Class B | (106,105 | ) | (131,515 | ) | ||||
Class C | (1,788,064 | ) | (1,384,026 | ) | ||||
Class Y | (12,542,856 | ) | (6,224,036 | ) | ||||
Class R5 | (97,800 | ) | (68,920 | ) | ||||
Class R6 | (1,244 | ) | (69 | ) | ||||
Total distributions from net investment income | (30,836,658 | ) | (19,899,248 | ) | ||||
Distributions to shareholders from net realized gains: | ||||||||
Class A | (21,152,609 | ) | — | |||||
Class B | (164,265 | ) | — | |||||
Class C | (3,802,721 | ) | — | |||||
Class Y | (16,316,691 | ) | — | |||||
Class R5 | (112,554 | ) | — | |||||
Class R6 | (1,464 | ) | — | |||||
Total distributions from net realized gains | (41,550,304 | ) | — | |||||
Share transactions–net: | ||||||||
Class A | 304,706,376 | (35,397,834 | ) | |||||
Class B | (1,203,517 | ) | (4,205,115 | ) | ||||
Class C | 74,959,516 | (13,591,258 | ) | |||||
Class Y | 392,013,037 | 41,215,438 | ||||||
Class R5 | 1,542,315 | 652,715 | ||||||
Class R6 | 50,007 | 10,000 | ||||||
Net increase (decrease) in net assets resulting from share transactions | 772,067,734 | (11,316,054 | ) | |||||
Net increase in net assets | 939,092,115 | 78,810,151 | ||||||
Net assets: | ||||||||
Beginning of year | 901,298,958 | 822,488,807 | ||||||
End of year (includes undistributed net investment income of $14,017,733 and $4,395,968, respectively) | $ | 1,840,391,073 | $ | 901,298,958 | ||||
Notes to Financial Statements
December 31, 2013
NOTE 1—Significant Accounting Policies
Invesco Convertible Securities Fund (the “Fund”) is a series portfolio of AIM Growth Series (Invesco Growth Series) (the “Trust”). The Trust is organized as a Delaware statutory trust and is registered under the Investment Company Act of 1940, as amended (the “1940 Act”), as an open-end series management investment company consisting of fifteen separate series portfolios, each authorized to issue an unlimited number of shares of beneficial interest. The assets, liabilities and operations of each portfolio are accounted for separately. Information presented in these financial statements pertains only to the Fund. Matters affecting each portfolio or class will be voted on exclusively by the shareholders of such portfolio or class.
The Fund’s investment objective is to seek total return through growth of capital and current income.
The Fund currently consists of six different classes of shares: Class A, Class B, Class C, Class Y, Class R5 and Class R6. Class A shares are sold with a front-end sales charge unless certain waiver criteria are met and under certain circumstances load waived shares may be subject to contingent deferred sales charges (“CDSC”). Class C shares are sold with a CDSC. Class Y, Class R5 and Class R6 shares are sold at net asset value. Effective November 30, 2010, new or additional investments in Class B shares are no longer permitted. Existing shareholders of Class B shares may continue to reinvest dividends and capital gains distributions in Class B shares until they convert to Class A shares. Also, shareholders in Class B shares will be
16 Invesco Convertible Securities Fund
able to exchange those shares for Class B shares of other Invesco Funds offering such shares until they convert to Class A shares. Generally, Class B shares will automatically convert to Class A shares on or about the month-end, which is at least eight years after the date of purchase. Redemption of Class B shares prior to the conversion date will be subject to a CDSC.
The following is a summary of the significant accounting policies followed by the Fund in the preparation of its financial statements.
| A. | Security Valuations — Securities, including restricted securities, are valued according to the following policy. |
Debt obligations (including convertible bonds) and unlisted equities are fair valued using an evaluated quote provided by an independent pricing service. Evaluated quotes provided by the pricing service may be determined without exclusive reliance on quoted prices, and may reflect appropriate factors such as institution-size trading in similar groups of securities, developments related to specific securities, dividend rate (for unlisted equities), yield (for debt obligations), quality, type of issue, coupon rate (for debt obligations), maturity (for debt obligations), individual trading characteristics and other market data. Debt obligations are subject to interest rate and credit risks. In addition, all debt obligations involve some risk of default with respect to interest and/or principal payments.
A security listed or traded on an exchange (except convertible bonds) is valued at its last sales price or official closing price as of the close of the customary trading session on the exchange where the security is principally traded, or lacking any sales or official closing price on a particular day, the security may be valued at the closing bid price on that day. Securities traded in the over-the-counter market are valued based on prices furnished by independent pricing services or market makers. When such securities are valued by an independent pricing service they may be considered fair valued. Futures contracts are valued at the final settlement price set by an exchange on which they are principally traded. Listed options are valued at the mean between the last bid and ask prices from the exchange on which they are principally traded. Options not listed on an exchange are valued by an independent source at the mean between the last bid and ask prices. For purposes of determining net asset value per share, futures and option contracts generally are valued 15 minutes after the close of the customary trading session of the New York Stock Exchange (“NYSE”).
Investments in open-end and closed-end registered investment companies that do not trade on an exchange are valued at the end of day net asset value per share. Investments in open-end and closed-end registered investment companies that trade on an exchange are valued at the last sales price or official closing price as of the close of the customary trading session on the exchange where the security is principally traded.
Swap agreements are fair valued using an evaluated quote provided by an independent pricing service. Evaluated quotes provided by the pricing service are valued based on a model which may include end of day net present values, spreads, ratings, industry, and company performance.
Foreign securities’ (including foreign exchange contracts) prices are converted into U.S. dollar amounts using the applicable exchange rates as of the close of the NYSE. If market quotations are available and reliable for foreign exchange-traded equity securities, the securities will be valued at the market quotations. Because trading hours for certain foreign securities end before the close of the NYSE, closing market quotations may become unreliable. If between the time trading ends on a particular security and the close of the customary trading session on the NYSE, events occur that the Adviser determines are significant and make the closing price unreliable, the Fund may fair value the security. If the event is likely to have affected the closing price of the security, the security will be valued at fair value in good faith using procedures approved by the Board of Trustees. Adjustments to closing prices to reflect fair value may also be based on a screening process of an independent pricing service to indicate the degree of certainty, based on historical data, that the closing price in the principal market where a foreign security trades is not the current value as of the close of the NYSE. Foreign securities’ prices meeting the approved degree of certainty that the price is not reflective of current value will be priced at the indication of fair value from the independent pricing service. Multiple factors may be considered by the independent pricing service in determining adjustments to reflect fair value and may include information relating to sector indices, American Depositary Receipts and domestic and foreign index futures. Foreign securities may have additional risks including exchange rate changes, potential for sharply devalued currencies and high inflation, political and economic upheaval, the relative lack of issuer information, relatively low market liquidity and the potential lack of strict financial and accounting controls and standards.
Securities for which market prices are not provided by any of the above methods may be valued based upon quotes furnished by independent sources. The last bid price may be used to value equity securities. The mean between the last bid and asked prices is used to value debt obligations, including corporate loans.
Securities for which market quotations are not readily available or became unreliable are valued at fair value as determined in good faith by or under the supervision of the Trust’s officers following procedures approved by the Board of Trustees. Issuer specific events, market trends, bid/ask quotes of brokers and information providers and other market data may be reviewed in the course of making a good faith determination of a security’s fair value.
Valuations change in response to many factors including the historical and prospective earnings of the issuer, the value of the issuer’s assets, general economic conditions, interest rates, investor perceptions and market liquidity. Because of the inherent uncertainties of valuation, the values reflected in the financial statements may materially differ from the value received upon actual sale of those investments.
| B. | Securities Transactions and Investment Income — Securities transactions are accounted for on a trade date basis. Realized gains or losses on sales are computed on the basis of specific identification of the securities sold. Interest income is recorded on the accrual basis from settlement date. Paydown gains and losses on mortgage and asset-backed securities are recorded as adjustments to interest income. Dividend income (net of withholding tax, if any) is recorded on the ex-dividend date. Bond premiums and discounts are amortized and/or accreted for financial reporting purposes. |
The Fund may periodically participate in litigation related to Fund investments. As such, the Fund may receive proceeds from litigation settlements. Any proceeds received are included in the Statement of Operations as realized gain (loss) for investments no longer held and as unrealized gain (loss) for investments still held.
Brokerage commissions and mark ups are considered transaction costs and are recorded as an increase to the cost basis of securities purchased and/or a reduction of proceeds on a sale of securities. Such transaction costs are included in the determination of net realized and unrealized gain (loss) from investment securities reported in the Statement of Operations and the Statement of Changes in Net Assets and the net realized and unrealized gains (losses) on securities per share in the Financial Highlights. Transaction costs are included in the calculation of the Fund’s net asset value and, accordingly, they reduce the Fund’s total returns. These transaction costs are not considered operating expenses and are not reflected in net investment income reported in the Statement of Operations and Statement of Changes in Net Assets, or the net investment
17 Invesco Convertible Securities Fund
income per share and ratios of expenses and net investment income reported in the Financial Highlights, nor are they limited by any expense limitation arrangements between the Fund and the investment adviser.
The Fund allocates income and realized and unrealized capital gains and losses to a class based on the relative net assets of each class.
| C. | Country Determination — For the purposes of making investment selection decisions and presentation in the Schedule of Investments, the investment adviser may determine the country in which an issuer is located and/or credit risk exposure based on various factors. These factors include the laws of the country under which the issuer is organized, where the issuer maintains a principal office, the country in which the issuer derives 50% or more of its total revenues and the country that has the primary market for the issuer’s securities, as well as other criteria. Among the other criteria that may be evaluated for making this determination are the country in which the issuer maintains 50% or more of its assets, the type of security, financial guarantees and enhancements, the nature of the collateral and the sponsor organization. Country of issuer and/or credit risk exposure has been determined to be the United States of America, unless otherwise noted. |
| D. | Distributions — Distributions from income, if any, are declared and paid quarterly and are recorded on the ex-dividend date. Distributions from net realized capital gain, if any, are generally declared and paid annually and recorded on the ex-dividend date. The Fund may elect to treat a portion of the proceeds from redemptions as distributions for federal income tax purposes. |
| E. | Federal Income Taxes — The Fund intends to comply with the requirements of Subchapter M of the Internal Revenue Code of 1986, as amended (the “Internal Revenue Code”), necessary to qualify as a regulated investment company and to distribute substantially all of the Fund’s taxable earnings to shareholders. As such, the Fund will not be subject to federal income taxes on otherwise taxable income (including net realized capital gain) that is distributed to shareholders. Therefore, no provision for federal income taxes is recorded in the financial statements. |
The Fund files tax returns in the U.S. Federal jurisdiction and certain other jurisdictions. Generally, the Fund is subject to examinations by such taxing authorities for up to three years after the filing of the return for the tax period.
| F. | Expenses — Fees provided for under the Rule 12b-1 plan of a particular class of the Fund are charged to the operations of such class. Transfer agency fees and expenses and other shareholder recordkeeping fees and expenses attributable to Class R5 and Class R6 are allocated to each share class based on relative net assets. Sub-accounting fees attributable to Class R5 are charged to the operations of the class. Transfer agency fees and expenses and other shareholder recordkeeping fees and expenses relating to all other classes are allocated among those classes based on relative net assets. All other expenses are allocated among the classes based on relative net assets. |
| G. | Accounting Estimates — The preparation of financial statements in conformity with accounting principles generally accepted in the United States of America (“GAAP”) requires management to make estimates and assumptions that affect the reported amounts of assets and liabilities at the date of the financial statements and the reported amounts of revenues and expenses during the reporting period including estimates and assumptions related to taxation. Actual results could differ from those estimates by a significant amount. In addition, the Fund monitors for material events or transactions that may occur or become known after the period-end date and before the date the financial statements are released to print. |
| H. | Indemnifications — Under the Trust’s organizational documents, each Trustee, officer, employee or other agent of the Trust is indemnified against certain liabilities that may arise out of the performance of their duties to the Fund. Additionally, in the normal course of business, the Fund enters into contracts, including the Fund’s servicing agreements, that contain a variety of indemnification clauses. The Fund’s maximum exposure under these arrangements is unknown as this would involve future claims that may be made against the Fund that have not yet occurred. The risk of material loss as a result of such indemnification claims is considered remote. |
NOTE 2—Advisory Fees and Other Fees Paid to Affiliates
The Trust has entered into a master investment advisory agreement with Invesco Advisers, Inc. (the “Adviser” or “Invesco”). Under the terms of the investment advisory agreement, the Fund pays an advisory fee to the Adviser based on the annual rate of the Fund’s average daily net assets as follows:
| Average Daily Net Assets | Rate | |||||
First $750 million | 0 | .52% | ||||
Next $250 million | 0 | .47% | ||||
Next $500 million | 0 | .42% | ||||
Next $500 million | 0 | .395% | ||||
Next $1 billion | 0 | .37% | ||||
Over $3 billion | 0 | .345% | ||||
Under the terms of a master sub-advisory agreement between the Adviser and each of Invesco Asset Management Deutschland GmbH, Invesco Asset Management Limited, Invesco Asset Management (Japan) Limited, Invesco Australia Limited, Invesco Hong Kong Limited, Invesco Senior Secured Management, Inc. and Invesco Canada Ltd. (collectively, the “Affiliated Sub-Advisers”) the Adviser, not the Fund, may pay 40% of the fees paid to the Adviser to any such Affiliated Sub-Adviser(s) that provide(s) discretionary investment management services to the Fund based on the percentage of assets allocated to such Sub-Adviser(s).
The Adviser has contractually agreed, through at least June 30, 2014, to waive advisory fees and/or reimburse expenses of all shares to the extent necessary to limit total annual fund operating expenses after fee waiver and/or expense reimbursement (excluding certain items discussed below) of Class A, Class B, Class C, Class Y, Class R5 and Class R6 shares to 1.50%, 2.25%, 2.25%, 1.25%, 1.25% and 1.25%, respectively, of average daily net assets. In determining the Adviser’s obligation to waive advisory fees and/or reimburse expenses, the following expenses are not taken into account, and could cause the total annual fund operating expenses after fee waiver and/or expense reimbursement to exceed the numbers reflected above: (1) interest; (2) taxes; (3) dividend expense on short sales; (4) extraordinary or non-routine items, including litigation expenses; and (5) expenses that the Fund has incurred but did not actually pay because of an expense offset arrangement. Unless Invesco continues the fee waiver agreement, it will terminate on June 30, 2014. The fee waiver agreement cannot be terminated during its term. The Adviser did not waive fees and/or reimburse expenses during the period under the expense limitation.
18 Invesco Convertible Securities Fund
Further, the Adviser has contractually agreed, through at least April 30, 2015, to waive the advisory fee payable by the Fund in an amount equal to 100% of the net advisory fees the Adviser receives from the affiliated money market funds on investments by the Fund of uninvested cash in such affiliated money market funds.
For the year ended December 31, 2013, the Adviser waived advisory fees of $97,178.
The Trust has entered into a master administrative services agreement with Invesco pursuant to which the Fund has agreed to pay Invesco for certain administrative costs incurred in providing accounting services to the Fund. For the year ended December 31, 2013, expenses incurred under the agreement are shown in the Statement of Operations as Administrative services fees.
The Trust has entered into a transfer agency and service agreement with Invesco Investment Services, Inc. (“IIS”) pursuant to which the Fund has agreed to pay IIS a fee for providing transfer agency and shareholder services to the Fund and reimburse IIS for certain expenses incurred by IIS in the course of providing such services. IIS may make payments to intermediaries that provide omnibus account services, sub-accounting services and/or networking services. All fees payable by IIS to intermediaries that provide omnibus account services or sub-accounting are charged back to the Fund, subject to certain limitations approved by the Trust’s Board of Trustees. For the year ended December 31, 2013, expenses incurred under the agreement are shown in the Statement of Operations as Transfer agent fees.
Shares of the Fund are distributed by Invesco Distributors, Inc. (“IDI”), an affiliate of the Adviser. The Fund has adopted a Plan of Distribution (the “Plan”) pursuant to Rule 12b-1 under the 1940 Act. The Plan provides that the Fund will reimburse IDI for distribution related expenses that IDI incurs up to a maximum of the following annual rates: (1) Class A — up to 0.25% of the average daily net assets of Class A shares; (2) Class B — up to 1.00% of the average daily net assets of Class B shares; and (3) Class C — up to 1.00% of the average daily net assets of Class C shares.
In the case of Class B shares, provided that the Plan continues in effect, any cumulative expenses incurred by IDI, but not yet reimbursed to IDI, may be recovered through the payment of future distribution fees from the Fund pursuant to the Plan and contingent deferred sales charges paid by investors upon redemption of Class B shares.
For the year ended December 31, 2013, expenses incurred under these agreements are shown in the Statement of Operations as Distribution fees.
Front-end sales commissions and CDSC (collectively, the “sales charges”) are not recorded as expenses of the Fund. Front-end sales commissions are deducted from proceeds from the sales of Fund shares prior to investment in Class A shares of the Fund. CDSC are deducted from redemption proceeds prior to remittance to the shareholder. During the year ended December 31, 2013, IDI advised the Fund that IDI retained $209,132 in front-end sales commissions from the sale of Class A shares and $5,730, $8,666 and $11,294 from Class A, Class B and Class C shares, respectively, for CDSC imposed on redemptions by shareholders.
Certain officers and trustees of the Trust are officers and directors of the Adviser, IIS and/or IDI.
NOTE 3—Additional Valuation Information
GAAP defines fair value as the price that would be received to sell an asset or paid to transfer a liability in an orderly transaction between market participants at the measurement date, under current market conditions. GAAP establishes a hierarchy that prioritizes the inputs to valuation methods, giving the highest priority to readily available unadjusted quoted prices in an active market for identical assets (Level 1) and the lowest priority to significant unobservable inputs (Level 3), generally when market prices are not readily available or are unreliable. Based on the valuation inputs, the securities or other investments are tiered into one of three levels. Changes in valuation methods may result in transfers in or out of an investment’s assigned level:
| Level 1 — | Prices are determined using quoted prices in an active market for identical assets. |
| Level 2 — | Prices are determined using other significant observable inputs. Observable inputs are inputs that other market participants may use in pricing a security. These may include quoted prices for similar securities, interest rates, prepayment speeds, credit risk, yield curves, loss severities, default rates, discount rates, volatilities and others. |
| Level 3 — | Prices are determined using significant unobservable inputs. In situations where quoted prices or observable inputs are unavailable (for example, when there is little or no market activity for an investment at the end of the period), unobservable inputs may be used. Unobservable inputs reflect the Fund’s own assumptions about the factors market participants would use in determining fair value of the securities or instruments and would be based on the best available information. |
The following is a summary of the tiered valuation input levels, as of December 31, 2013. The level assigned to the securities valuations may not be an indication of the risk or liquidity associated with investing in those securities. Because of the inherent uncertainties of valuation, the values reflected in the financial statements may materially differ from the value received upon actual sale of those investments.
| Level 1 | Level 2 | Level 3 | Total | |||||||||||||
Equity Securities | $ | 353,854,601 | $ | 127,672,376 | $ | — | $ | 481,526,977 | ||||||||
Corporate Debt Securities | — | 1,349,045,185 | — | 1,349,045,185 | ||||||||||||
| $ | 353,854,601 | $ | 1,476,717,561 | $ | — | $ | 1,830,572,162 | |||||||||
NOTE 4—Expense Offset Arrangement(s)
The expense offset arrangement is comprised of transfer agency credits which result from balances in demand deposit accounts used by the transfer agent for clearing shareholder transactions. For the year ended December 31, 2013, the Fund received credits from this arrangement, which resulted in the reduction of the Fund’s total expenses of $1,527.
19 Invesco Convertible Securities Fund
NOTE 5—Trustees’ and Officers’ Fees and Benefits
Trustees’ and Officers’ Fees and Benefits include amounts accrued by the Fund to pay remuneration to certain Trustees and Officers of the Fund. Trustees have the option to defer compensation payable by the Fund, and Trustees’ and Officers’ Fees and Benefits also include amounts accrued by the Fund to fund such deferred compensation amounts. Those Trustees who defer compensation have the option to select various Invesco Funds in which their deferral accounts shall be deemed to be invested. Finally, certain current Trustees were eligible to participate in a retirement plan that provided for benefits to be paid upon retirement to Trustees over a period of time based on the number of years of service. The Fund may have certain former Trustees who also participate in a retirement plan and receive benefits under such plan. Trustees’ and Officers’ Fees and Benefits include amounts accrued by the Fund to fund such retirement benefits. Obligations under the deferred compensation and retirement plans represent unsecured claims against the general assets of the Fund.
NOTE 6—Cash Balances
The Fund is permitted to temporarily carry a negative or overdrawn balance in its account with State Street Bank and Trust Company, the custodian bank. Such balances, if any at period end, are shown in the Statement of Assets and Liabilities under the payable caption Amount due custodian. To compensate the custodian bank for such overdrafts, the overdrawn Fund may either (1) leave funds as a compensating balance in the account so the custodian bank can be compensated by earning the additional interest; or (2) compensate by paying the custodian bank at a rate agreed upon by the custodian bank and Invesco, not to exceed the contractually agreed upon rate.
NOTE 7—Distributions to Shareholders and Tax Components of Net Assets
Tax Character of Distributions to Shareholders Paid During the Years Ended December 31, 2013 and 2012:
| 2013 | 2012 | |||||||
Ordinary income | $ | 36,847,565 | $ | 19,899,248 | ||||
Long-term capital gain | 35,539,397 | — | ||||||
Total distributions | $ | 72,386,962 | $ | 19,899,248 | ||||
Tax Components of Net Assets at Period-End:
| 2013 | ||||
Undistributed ordinary income | $ | 31,744,936 | ||
Undistributed long-term gain | 10,569,698 | |||
Net unrealized appreciation — investments | 189,247,633 | |||
Temporary book/tax differences | (163,475 | ) | ||
Shares of beneficial interest | 1,608,992,281 | |||
Total net assets | $ | 1,840,391,073 | ||
The difference between book-basis and tax-basis unrealized appreciation (depreciation) is due to differences in the timing of recognition of gains and losses on investments for tax and book purposes. The Fund’s net unrealized appreciation (depreciation) difference is attributable primarily to wash sales and book and tax accretion and amortization differences.
The temporary book/tax differences are a result of timing differences between book and tax recognition of income and/or expenses. The Fund’s temporary book/tax differences are the result of the trustee deferral of compensation and retirement plan benefits.
Capital loss carryforward is calculated and reported as of a specific date. Results of transactions and other activity after that date may affect the amount of capital loss carryforward actually available for the Fund to utilize. Capital losses generated in years beginning after December 22, 2010 can be carried forward for an unlimited period, whereas previous losses expire in 8 tax years. Capital losses with an expiration period may not be used to offset capital gains until all net capital losses without an expiration date have been utilized. Capital loss carryforwards with no expiration date will retain their character as either short-term or long-term capital losses instead of as short-term capital losses as under prior law. The ability to utilize capital loss carryforward in the future may be limited under the Internal Revenue Code and related regulations based on the results of future transactions.
The Fund does not have a capital loss carryforward as of December 31, 2013.
NOTE 8—Investment Securities
The aggregate amount of investment securities (other than short-term securities, U.S. Treasury obligations and money market funds, if any) purchased and sold by the Fund during the year ended December 31, 2013 was $1,152,095,615 and $540,550,729, respectively. Cost of investments on a tax basis includes the adjustments for financial reporting purposes as of the most recently completed federal income tax reporting period-end.
| Unrealized Appreciation (Depreciation) of Investment Securities on a Tax Basis | ||||
Aggregate unrealized appreciation of investment securities | $ | 206,905,471 | ||
Aggregate unrealized (depreciation) of investment securities | (17,657,838 | ) | ||
Net unrealized appreciation of investment securities | $ | 189,247,633 | ||
Cost of investments for tax purposes is $1,641,324,529.
20 Invesco Convertible Securities Fund
NOTE 9—Reclassification of Permanent Differences
Primarily as a result of differing book/tax treatment of sales on convertible preferred debt instruments and bond premium amortization, on December 31, 2013, undistributed net investment income was increased by $9,558,192 and undistributed net realized gain was decreased by $9,558,192. This reclassification had no effect on the net assets of the Fund.
NOTE 10—Share Information
| Summary of Share Activity | ||||||||||||||||
| Years ended December 31, | ||||||||||||||||
| 2013(a) | 2012 | |||||||||||||||
| Shares | Amount | Shares | Amount | |||||||||||||
Sold: | ||||||||||||||||
Class A | 19,894,522 | $ | 465,006,946 | 6,880,930 | $ | 139,319,188 | ||||||||||
Class B | 53,934 | 1,260,639 | 31,321 | 630,446 | ||||||||||||
Class C | 3,763,916 | 88,349,747 | 1,065,967 | 21,480,711 | ||||||||||||
Class Y | 21,832,270 | 507,766,106 | 8,767,192 | 177,589,797 | ||||||||||||
Class R5 | 116,725 | 2,672,397 | 60,488 | 1,229,279 | ||||||||||||
Class R6(b) | 2,055 | 47,866 | 481 | 10,000 | ||||||||||||
Issued as reinvestment of dividends: | ||||||||||||||||
Class A | 1,312,518 | 30,644,391 | 470,959 | 9,542,077 | ||||||||||||
Class B | 9,938 | 232,306 | 5,292 | 107,367 | ||||||||||||
Class C | 204,079 | 4,753,908 | 53,479 | 1,078,990 | ||||||||||||
Class Y | 839,879 | 19,661,287 | 207,873 | 4,212,523 | ||||||||||||
Class R5 | 8,432 | 196,703 | 3,298 | 66,779 | ||||||||||||
Class R6 | 91 | 2,141 | — | — | ||||||||||||
Automatic conversion of Class B shares to Class A shares: | ||||||||||||||||
Class A | 55,652 | 1,263,085 | 145,080 | 2,934,262 | ||||||||||||
Class B | (55,541 | ) | (1,263,085 | ) | (144,404 | ) | (2,934,262 | ) | ||||||||
Reacquired: | ||||||||||||||||
Class A | (8,335,103 | ) | (192,208,046 | ) | (9,287,480 | ) | (187,193,361 | ) | ||||||||
Class B | (62,487 | ) | (1,433,377 | ) | (100,198 | ) | (2,008,666 | ) | ||||||||
Class C | (793,408 | ) | (18,144,139 | ) | (1,806,467 | ) | (36,150,959 | ) | ||||||||
Class Y | (5,817,243 | ) | (135,414,356 | ) | (6,945,469 | ) | (140,586,882 | ) | ||||||||
Class R5 | (57,976 | ) | (1,326,785 | ) | (31,769 | ) | (643,343 | ) | ||||||||
Net increase (decrease) in share activity | 32,972,253 | $ | 772,067,734 | (623,427 | ) | $ | (11,316,054 | ) | ||||||||
| (a) | There are entities that are record owners of more than 5% of the outstanding shares of the Fund and in the aggregate own 46% of the outstanding shares of the Fund. IDI has an agreement with these entities to sell Fund shares. The Fund, Invesco and/or Invesco affiliates may make payments to these entities, which are considered to be related to the Fund, for providing services to the Fund, Invesco and/or Invesco affiliates including but not limited to services such as securities brokerage, distribution, third party record keeping and account servicing. The Fund has no knowledge as to whether all or any portion of the shares owned of record by these entities are also owned beneficially. |
| (b) | Commencement date of September 24, 2012 for Class R6 shares. |
21 Invesco Convertible Securities Fund
NOTE 11—Financial Highlights
The following schedule presents financial highlights for a share of the Fund outstanding throughout the periods indicated.
| Net asset value, beginning of period | Net investment income(a) | Net gains (losses) on securities (both realized and unrealized) | Total from investment operations | Dividends from net investment income | Distributions from net realized gains | Total distributions | Net asset value, end of period | Total return(b) | Net assets, (000’s omitted) | Ratio of expenses to average net assets with fee waivers and/or expenses absorbed | Ratio of expenses to average net assets without fee waivers and/or expenses absorbed | Ratio of net investment income to average net assets | Portfolio turnover(c) | |||||||||||||||||||||||||||||||||||||||||||
Class A |
| |||||||||||||||||||||||||||||||||||||||||||||||||||||||
Year ended 12/31/13 | $ | 20.88 | $ | 0.55 | (d) | $ | 3.84 | $ | 4.39 | $ | (0.53 | ) | $ | (0.57 | ) | $ | (1.10 | ) | $ | 24.17 | 21.31 | % | $ | 936,425 | 0.88 | %(e)(f) | 0.89 | %(e)(f) | 2.40 | %(d)(e)(f) | 45 | % | ||||||||||||||||||||||||
Year ended 12/31/12 | 18.78 | 0.48 | 2.08 | 2.56 | (0.46 | ) | — | (0.46 | ) | 20.88 | 13.74 | 538,962 | 0.93 | (g) | 0.94 | (g) | 2.41 | (g) | 58 | |||||||||||||||||||||||||||||||||||||
Year ended 12/31/11 | 20.05 | 0.46 | (1.34 | ) | (0.88 | ) | (0.39 | ) | — | (0.39 | ) | 18.78 | (4.46 | ) | 518,426 | 0.97 | 0.98 | 2.37 | 38 | |||||||||||||||||||||||||||||||||||||
Three months ended 12/31/10 | 18.71 | 0.12 | 1.35 | 1.47 | (0.13 | ) | — | (0.13 | ) | 20.05 | 7.86 | 118,359 | 1.09 | (h) | 1.10 | (h) | 2.42 | (h) | 24 | |||||||||||||||||||||||||||||||||||||
Year ended 09/30/10 | 16.86 | 0.59 | 1.97 | 2.56 | (0.71 | ) | — | (0.71 | ) | 18.71 | 15.45 | 90,840 | 1.17 | 1.17 | 3.33 | 85 | ||||||||||||||||||||||||||||||||||||||||
Year ended 09/30/09 | 15.35 | 0.40 | 1.72 | 2.12 | (0.49 | ) | (0.12 | ) | (0.61 | ) | 16.86 | 14.80 | 82,241 | 1.27 | (i) | 2.86 | (i) | 104 | ||||||||||||||||||||||||||||||||||||||
Class B |
| |||||||||||||||||||||||||||||||||||||||||||||||||||||||
Year ended 12/31/13 | 20.93 | 0.38 | (d) | 3.86 | 4.24 | (0.36 | ) | (0.57 | ) | (0.93 | ) | 24.24 | 20.45 | 7,167 | 1.64 | (e)(f) | 1.65 | (e)(f) | 1.64 | (d)(e)(f) | 45 | |||||||||||||||||||||||||||||||||||
Year ended 12/31/12 | 18.83 | 0.33 | 2.08 | 2.41 | (0.31 | ) | — | (0.31 | ) | 20.93 | 12.85 | 7,325 | 1.70 | (g) | 1.71 | (g) | 1.64 | (g) | 58 | |||||||||||||||||||||||||||||||||||||
Year ended 12/31/11 | 20.10 | 0.32 | (1.35 | ) | (1.03 | ) | (0.24 | ) | — | (0.24 | ) | 18.83 | (5.16 | ) | 10,505 | 1.72 | 1.73 | 1.62 | 38 | |||||||||||||||||||||||||||||||||||||
Three months ended 12/31/10 | 18.76 | 0.08 | 1.35 | 1.43 | (0.09 | ) | — | (0.09 | ) | 20.10 | 7.64 | 11,038 | 1.84 | (h) | 1.85 | (h) | 1.67 | (h) | 24 | |||||||||||||||||||||||||||||||||||||
Year ended 09/30/10 | 16.90 | 0.46 | 1.97 | 2.43 | (0.57 | ) | — | (0.57 | ) | 18.76 | 14.61 | 11,454 | 1.92 | 1.92 | 2.58 | 85 | ||||||||||||||||||||||||||||||||||||||||
Year ended 09/30/09 | 15.39 | 0.29 | 1.72 | 2.01 | (0.38 | ) | (0.12 | ) | (0.50 | ) | 16.90 | 13.93 | 16,790 | 2.02 | (i) | 2.11 | (i) | 104 | ||||||||||||||||||||||||||||||||||||||
Class C |
| |||||||||||||||||||||||||||||||||||||||||||||||||||||||
Year ended 12/31/13 | 20.78 | 0.38 | (d) | 3.81 | 4.19 | (0.36 | ) | (0.57 | ) | (0.93 | ) | 24.04 | 20.37 | 172,232 | 1.64 | (e)(f) | 1.65 | (e)(f) | 1.64 | (d)(e)(f) | 45 | |||||||||||||||||||||||||||||||||||
Year ended 12/31/12 | 18.69 | 0.36 | 2.06 | 2.42 | (0.33 | ) | — | (0.33 | ) | 20.78 | 13.02 | 82,876 | 1.53 | (g) | 1.54 | (g) | 1.81 | (g) | 58 | |||||||||||||||||||||||||||||||||||||
Year ended 12/31/11 | 19.94 | 0.32 | (1.33 | ) | (1.01 | ) | (0.24 | ) | — | (0.24 | ) | 18.69 | (5.12 | ) | 87,388 | 1.72 | 1.73 | 1.62 | 38 | |||||||||||||||||||||||||||||||||||||
Three months ended 12/31/10 | 18.61 | 0.08 | 1.34 | 1.42 | (0.09 | ) | — | (0.09 | ) | 19.94 | 7.64 | 18,719 | 1.84 | (h) | 1.85 | (h) | 1.67 | (h) | 24 | |||||||||||||||||||||||||||||||||||||
Year ended 09/30/10 | 16.77 | 0.46 | 1.96 | 2.42 | (0.58 | ) | — | (0.58 | ) | 18.61 | 14.62 | 9,486 | 1.92 | 1.92 | 2.58 | 85 | ||||||||||||||||||||||||||||||||||||||||
Year ended 09/30/09 | 15.28 | 0.30 | 1.70 | 2.00 | (0.39 | ) | (0.12 | ) | (0.51 | ) | 16.77 | 13.96 | 6,175 | 2.02 | (i) | 2.11 | (i) | 104 | ||||||||||||||||||||||||||||||||||||||
Class Y |
| |||||||||||||||||||||||||||||||||||||||||||||||||||||||
Year ended 12/31/13 | 20.90 | 0.61 | (d) | 3.84 | 4.45 | (0.58 | ) | (0.57 | ) | (1.15 | ) | 24.20 | 21.62 | 719,722 | 0.64 | (e) | 0.65 | (e) | 2.64 | (d)(e) | 45 | |||||||||||||||||||||||||||||||||||
Year ended 12/31/12 | 18.81 | 0.53 | 2.07 | 2.60 | (0.51 | ) | — | (0.51 | ) | 20.90 | 13.94 | 269,400 | 0.70 | 0.71 | 2.64 | 58 | ||||||||||||||||||||||||||||||||||||||||
Year ended 12/31/11 | 20.07 | 0.52 | (1.34 | ) | (0.82 | ) | (0.44 | ) | — | (0.44 | ) | 18.81 | (4.16 | ) | 204,319 | 0.72 | 0.73 | 2.62 | 38 | |||||||||||||||||||||||||||||||||||||
Three months ended 12/31/10 | 18.73 | 0.13 | 1.35 | 1.48 | (0.14 | ) | — | (0.14 | ) | 20.07 | 7.92 | 17,204 | 0.84 | (h) | 0.85 | (h) | 2.67 | (h) | 24 | |||||||||||||||||||||||||||||||||||||
Year ended 09/30/10 | 16.87 | 0.64 | 1.97 | 2.61 | (0.75 | ) | — | (0.75 | ) | 18.73 | 15.78 | 3,661 | 0.92 | 0.92 | 3.58 | 85 | ||||||||||||||||||||||||||||||||||||||||
Year ended 09/30/09 | 15.37 | 0.57 | 1.58 | 2.15 | (0.53 | ) | (0.12 | ) | (0.65 | ) | 16.87 | 15.07 | 1,022 | 1.02 | (i) | 3.11 | (i) | 104 | ||||||||||||||||||||||||||||||||||||||
Class R5 |
| |||||||||||||||||||||||||||||||||||||||||||||||||||||||
Year ended 12/31/13 | 20.88 | 0.63 | (d) | 3.84 | 4.47 | (0.60 | ) | (0.57 | ) | (1.17 | ) | 24.18 | 21.72 | 4,781 | 0.57 | (e) | 0.58 | (e) | 2.71 | (d)(e) | 45 | |||||||||||||||||||||||||||||||||||
Year ended 12/31/12 | 18.78 | 0.55 | 2.08 | 2.63 | (0.53 | ) | — | (0.53 | ) | 20.88 | 14.13 | 2,726 | 0.60 | 0.61 | 2.74 | 58 | ||||||||||||||||||||||||||||||||||||||||
Year ended 12/31/11(j) | 21.19 | 0.33 | (2.38 | ) | (2.05 | ) | (0.36 | ) | — | (0.36 | ) | 18.78 | (9.70 | ) | 1,851 | 0.57 | (h) | 0.58 | (h) | 2.77 | (h) | 38 | ||||||||||||||||||||||||||||||||||
Class R6 |
| |||||||||||||||||||||||||||||||||||||||||||||||||||||||
Year ended 12/31/13 | 20.89 | 0.64 | (d) | 3.83 | 4.47 | (0.61 | ) | (0.57 | ) | (1.18 | ) | 24.18 | 21.69 | 64 | 0.55 | (e) | 0.56 | (e) | 2.73 | (d)(e) | 45 | |||||||||||||||||||||||||||||||||||
Year ended 12/31/12(j) | 20.78 | 0.15 | 0.10 | 0.25 | (0.14 | ) | — | (0.14 | ) | 20.89 | 1.23 | 10 | 0.58 | (h) | 0.59 | (h) | 2.76 | (h) | 58 | |||||||||||||||||||||||||||||||||||||
| (a) | Calculated using average shares outstanding. |
| (b) | Includes adjustments in accordance with accounting principles generally accepted in the United States of America and as such, the net asset value for financial reporting purposes and the returns based upon those net asset values may differ from the net asset value and returns for shareholder transactions. Does not include sales charges and is not annualized for periods less than one year, if applicable. |
| (c) | Portfolio turnover is calculated at the fund level and is not annualized for periods less than one year, if applicable. For the period ending December 31, 2011, the portfolio turnover calculation excludes the value of securities purchased of $310,063,973 and sold of $85,053,876 in effect to realign the Fund’s portfolio holdings after the reorganization of Invesco Van Kampen Harbor Fund into the Fund. |
| (d) | Net investment income per share and the ratio of net investment income to average net assets include material significant dividends received during the year ended December 31, 2013. Net investment income per share and the ratio of net investment income to average net assets excluding the significant dividends are $0.42 and 2.39%, $0.25 and 1.63%, $0.25 and 1.63%, $0.48 and 2.63%, $0.50 and 2.70% and $0.51 and 2.72%, for Class A, Class B, Class C, Class Y, Class R5 and Class R6 shares, respectively. |
| (e) | Ratios are based on average daily net assets (000’s omitted) of $691,395, $7,034, $110,807, $469,158, $3,685, and $40 for Class A, Class B, Class C, Class Y, Class R5 and Class R6 shares, respectively. |
| (f) | The total return, ratio of expenses to average net assets and ratio of net investment income to average net assets reflect actual 12b-1 fees of 0.24%, 1.00% and 1.00% for Class A, Class B and Class C shares, respectively. |
| (g) | The total return, ratio of expenses to average net assets and ratio of net investment income to average net assets reflect actual 12b-1 fees of 0.23%, 1.00% and 0.83% for Class A, Class B and Class C shares, respectively. |
| (h) | Annualized. |
| (i) | The ratios reflect the rebate of certain Fund expenses in connection with investments in a Morgan Stanley affiliate during the period. The effect of the rebate on the ratios was less than 0.005% for the year ended December 31, 2009. |
| (j) | Commencement date of May 23, 2011 and September 24, 2012 for Class R5 and Class R6 shares, respectively. |
22 Invesco Convertible Securities Fund
Report of Independent Registered Public Accounting Firm
To the Board of Trustees of AIM Growth Series (Invesco Growth Series)
and Shareholders of Invesco Convertible Securities Fund:
In our opinion, the accompanying statement of assets and liabilities, including the schedule of investments, and the related statements of operations and of changes in net assets and the financial highlights present fairly, in all material respects, the financial position of Invesco Convertible Securities Fund (one of the funds constituting AIM Growth Series (Invesco Growth Series), hereafter referred to as the “Fund”) at December 31, 2013, the results of its operations for the year then ended, the changes in its net assets for each of the two years in the period then ended and the financial highlights for each of the three years in the period then ended, the three month period ended December 31, 2010, and the year ended September 30, 2010, in conformity with accounting principles generally accepted in the United States of America. These financial statements and financial highlights (hereafter referred to as “financial statements”) are the responsibility of the Fund’s management; our responsibility is to express an opinion on these financial statements based on our audits. We conducted our audits of these financial statements in accordance with the standards of the Public Company Accounting Oversight Board (United States). Those standards require that we plan and perform the audit to obtain reasonable assurance about whether the financial statements are free of material misstatement. An audit includes examining, on a test basis, evidence supporting the amounts and disclosures in the financial statements, assessing the accounting principles used and significant estimates made by management, and evaluating the overall financial statement presentation. We believe that our audits, which included confirmation of securities at December 31, 2013 by correspondence with the custodian and brokers, provide a reasonable basis for our opinion. The financial highlights of the Fund for the period ended September 30, 2009 were audited by another independent registered public accounting firm whose report dated November 24, 2009 expressed an unqualified opinion on such financial statement.
PRICEWATERHOUSECOOPERS LLP
February 26, 2014
Houston, Texas
23 Invesco Convertible Securities Fund
Calculating your ongoing Fund expenses
Example
As a shareholder of the Fund, you incur two types of costs: (1) transaction costs, which may include sales charges (loads) on purchase payments or contingent deferred sales charges on redemptions, if any; and (2) ongoing costs, including management fees, distribution and/or service (12b-1) fees, and other Fund expenses. This example is intended to help you understand your ongoing costs (in dollars) of investing in the Fund and to compare these costs with ongoing costs of investing in other mutual funds. The example is based on an investment of $1,000 invested at the beginning of the period and held for the entire period July 1, 2013 through December 31, 2013.
Actual expenses
The table below provides information about actual account values and actual expenses. You may use the information in this table, together with the amount you invested, to estimate the expenses that you paid over the period. Simply divide your account value by $1,000 (for example, an $8,600 account value divided by $1,000 = 8.6), then multiply the result by the number in the table under the heading entitled “Actual Expenses Paid During Period” to estimate the expenses you paid on your account during this period.
Hypothetical example for comparison purposes
The table below also provides information about hypothetical account values and hypothetical expenses based on the Fund’s actual expense ratio and an assumed rate of return of 5% per year before expenses, which is not the Fund’s actual return.
The hypothetical account values and expenses may not be used to estimate the actual ending account balance or expenses you paid for the period. You may use this information to compare the ongoing costs of investing in the Fund and other funds. To do so, compare this 5% hypothetical example with the 5% hypothetical examples that appear in the shareholder reports of the other funds.
Please note that the expenses shown in the table are meant to highlight your ongoing costs only and do not reflect any transaction costs, such as sales charges (loads) on purchase payments or contingent deferred sales charges on redemptions, if any. Therefore, the hypothetical information is useful in comparing ongoing costs only, and will not help you determine the relative total costs of owning different funds. In addition, if these transaction costs were included, your costs would have been higher.
| Class | Beginning Account Value | ACTUAL | HYPOTHETICAL (5% annual return before | Annualized Expense Ratio | ||||||||||||||||||||
| Ending Account Value (12/31/13)1 | Expenses Paid During Period2 | Ending Account Value (12/31/13) | Expenses Paid During Period2 | |||||||||||||||||||||
| A | $ | 1,000.00 | $ | 1,112.50 | $ | 4.53 | $ | 1,020.92 | $ | 4.33 | 0.85 | % | ||||||||||||
| B | 1,000.00 | 1,108.00 | 8.61 | 1,017.04 | 8.24 | 1.62 | ||||||||||||||||||
| C | 1,000.00 | 1,107.90 | 8.61 | 1,017.04 | 8.24 | 1.62 | ||||||||||||||||||
| Y | 1,000.00 | 1,113.20 | 3.30 | 1,022.08 | 3.16 | 0.62 | ||||||||||||||||||
| R5 | 1,000.00 | 1,114.10 | 2.88 | 1,022.48 | 2.75 | 0.54 | ||||||||||||||||||
| R6 | 1,000.00 | 1,114.20 | 2.88 | 1,022.48 | 2.75 | 0.54 | ||||||||||||||||||
| 1 | The actual ending account value is based on the actual total return of the Fund for the period July 1, 2013 through December 31, 2013, after actual expenses and will differ from the hypothetical ending account value which is based on the Fund’s expense ratio and a hypothetical annual return of 5% before expenses. |
| 2 | Expenses are equal to the Fund’s annualized expense ratio as indicated above multiplied by the average account value over the period, multiplied by 184/365 to reflect the most recent fiscal half year. |
24 Invesco Convertible Securities Fund
Tax Information
Form 1099-DIV, Form 1042-S and other year–end tax information provide shareholders with actual calendar year amounts that should be included in their tax returns. Shareholders should consult their tax advisors.
The following distribution information is being provided as required by the Internal Revenue Code or to meet a specific state’s requirement.
The Fund designates the following amounts or, if subsequently determined to be different, the maximum amount allowable for its fiscal year ended December 31, 2013:
Federal and State Income Tax | ||||
Long-term Capital Gain Distribution | $ | 35,539,397 | ||
Qualified Dividend Income* | 42.48 | % | ||
Corporate Dividends Received Deduction* | 41.85 | % | ||
| * | The above percentages are based on ordinary income dividends paid to shareholders during the Fund’s fiscal year. |
Non-Resident Alien Shareholders | ||||
Qualified Short-Term Capital Gains | $ | 6,010,907 | ||
25 Invesco Convertible Securities Fund
Trustees and Officers
The address of each trustee and officer is AIM Growth Series (Invesco Growth Series) (the “Trust”), 11 Greenway Plaza, Suite 1000, Houston, Texas 77046-1173. The trustees serve for the life of the Trust, subject to their earlier death, incapacitation, resignation, retirement or removal as more specifically provided in the Trust’s organizational documents. Each officer serves for a one year term or until their successors are elected and qualified. Column two below includes length of time served with predecessor entities, if any.
| Name, Year of Birth and Position(s) Held with the Trust | Trustee and/ or Officer Since | Principal Occupation(s) During Past 5 Years | Number of Funds in Fund Complex Overseen by Trustee | Other Directorship(s) Held by Trustee During Past 5 Years | ||||
| Interested Persons | ||||||||
| Martin L. Flanagan1 — 1960 Trustee | 2007 | Executive Director, Chief Executive Officer and President, Invesco Ltd. (ultimate parent of Invesco and a global investment management firm); Advisor to the Board, Invesco Advisers, Inc. (formerly known as Invesco Institutional (N.A.), Inc.); Trustee, The Invesco Funds; Vice Chair, Investment Company Institute; and Member of Executive Board, SMU Cox School of Business
Formerly: Chairman and Chief Executive Officer, Invesco Advisers, Inc. (registered investment adviser); Director, Chairman, Chief Executive Officer and President, IVZ Inc. (holding company), INVESCO Group Services, Inc. (service provider) and Invesco North American Holdings, Inc. (holding company); Director, Chief Executive Officer and President, Invesco Holding Company Limited (parent of Invesco and a global investment management firm); Director, Invesco Ltd.; Chairman, Investment Company Institute and President, Co-Chief Executive Officer, Co-President, Chief Operating Officer and Chief Financial Officer, Franklin Resources, Inc. (global investment management organization) | 123 | None | ||||
| Philip A. Taylor2 — 1954 Trustee, President and Principal Executive Officer | 2006 | Head of North American Retail and Senior Managing Director, Invesco Ltd.; Director, Co-Chairman, Co-President and Co-Chief Executive Officer, Invesco Advisers, Inc. (formerly known as Invesco Institutional (N.A.), Inc.) (registered investment adviser); Director, Chairman, Chief Executive Officer and President, Invesco Management Group, Inc. (formerly known as Invesco Aim Management Group, Inc.) (financial services holding company); Director and President, INVESCO Funds Group, Inc. (registered investment adviser and registered transfer agent); Director and Chairman, Invesco Investment Services, Inc. (formerly known as Invesco Aim Investment Services, Inc.) (registered transfer agent) and IVZ Distributors, Inc. (formerly known as INVESCO Distributors, Inc.) (registered broker dealer); Director, President and Chairman, Invesco Inc. (holding company) and Invesco Canada Holdings Inc. (holding company); Chief Executive Officer, Invesco Corporate Class Inc. (corporate mutual fund company) and Invesco Canada Fund Inc. (corporate mutual fund company); Director, Chairman and Chief Executive Officer, Invesco Canada Ltd. (formerly known as Invesco Trimark Ltd./Invesco Trimark Ltèe) (registered investment adviser and registered transfer agent); Trustee, President and Principal Executive Officer, The Invesco Funds (other than AIM Treasurer’s Series Trust (Invesco Treasurer’s Series Trust) and Short-Term Investments Trust); Trustee and Executive Vice President, The Invesco Funds (AIM Treasurer’s Series Trust (Invesco Treasurer’s Series Trust) and Short-Term Investments Trust only); Director, Invesco Investment Advisers LLC (formerly known as Van Kampen Asset Management); Director, Chief Executive Officer and President, Van Kampen Exchange Corp.
Formerly: Director and Chairman, Van Kampen Investor Services Inc.: Director, Chief Executive Officer and President, 1371 Preferred Inc. (holding company); and Van Kampen Investments Inc.; Director and President, AIM GP Canada Inc. (general partner for limited partnerships); and Van Kampen Advisors, Inc.; Director and Chief Executive Officer, Invesco Trimark Dealer Inc. (registered broker dealer); Director, Invesco Distributors, Inc. (formerly known as Invesco Aim Distributors, Inc.) (registered broker dealer); Manager, Invesco PowerShares Capital Management LLC; Director, Chief Executive Officer and President, Invesco Advisers, Inc.; Director, Chairman, Chief Executive Officer and President, Invesco Aim Capital Management, Inc.; President, Invesco Trimark Dealer Inc. and Invesco Trimark Ltd./Invesco Trimark Ltèe; Director and President, AIM Trimark Corporate Class Inc. and AIM Trimark Canada Fund Inc.; Senior Managing Director, Invesco Holding Company Limited; Trustee and Executive Vice President, Tax-Free Investments Trust; Director and Chairman, Fund Management Company (former registered broker dealer); President and Principal Executive Officer, The Invesco Funds (AIM Treasurer’s Series Trust (Invesco Treasurer’s Series Trust), Short-Term Investments Trust and Tax-Free Investments Trust only); President, AIM Trimark Global Fund Inc. and AIM Trimark Canada Fund Inc. | 123 | None | ||||
Wayne W. Whalen3 — 1939 Trustee | 2010 | Of Counsel, and prior to 2010, partner in the law firm of Skadden, Arps, Slate, Meagher & Flom LLP, legal counsel to certain funds in the Fund Complex | 136 | Director of the Mutual Fund Directors Forum, a nonprofit membership organization for investment directors; Chairman and Director of the Abraham Lincoln Presidential Library Foundation; and Director of the Stevenson Center for Democracy |
| 1 | Mr. Flanagan is considered an interested person of the Trust because he is an officer of the adviser to the Trust, and an officer and a director of Invesco Ltd., ultimate parent of the adviser to the Trust. |
| 2 | Mr. Taylor is considered an interested person of the Trust because he is an officer and a director of the adviser to, and a director of the principal underwriter of, the Trust. |
| 3 | Mr. Whalen is considered an “interested person” (within the meaning of Section 2(a)(19) of the 1940 Act) of certain Funds in the Invesco Fund Complex because he and his firm currently provide legal services as legal counsel to such Funds. |
T-1 Invesco Convertible Securities Fund
Trustees and Officers—(continued)
| Name, Year of Birth and Position(s) Held with the Trust | Trustee and/ or Officer Since | Principal Occupation(s) During Past 5 Years | Number of Funds in Fund Complex Overseen by Trustee | Other Directorship(s) Held by Trustee During Past 5 Years | ||||
| Independent Trustees | ||||||||
Bruce L. Crockett — 1944 Trustee and Chair | 2001 | Chairman, Crockett Technologies Associates (technology consulting company)
Formerly: Director, Captaris (unified messaging provider); Director, President and Chief Executive Officer COMSAT Corporation; and Chairman, Board of Governors of INTELSAT (international communications company) | 123 | ACE Limited (insurance company); Investment Company Institute | ||||
David C. Arch — 1945 Trustee | 2010 | Chairman and Chief Executive Officer of Blistex Inc., (consumer health care products manufacturer)
Formerly: Member of the Heartland Alliance Advisory Board, a nonprofit organization serving human needs based in Chicago | 136 | Board member of the Illinois Manufacturers’ Association; Member of the Board of Visitors, Institute for the Humanities, University of Michigan | ||||
Frank S. Bayley — 1939 Trustee | 1985 | Retired
Formerly: Director, Badgley Funds, Inc. (registered investment company) (2 portfolios) and General Partner and Of Counsel, law firm of Baker & McKenzie, LLP | 123 | Director and Chairman, C.D. Stimson Company (a real estate investment company); Trustee and Overseer, The Curtis Institute of Music | ||||
James T. Bunch — 1942 Trustee | 2003 | Managing Member, Grumman Hill Group LLC (family office private equity management)
Formerly: Founder, Green, Manning & Bunch Ltd. (investment banking firm) (1988-2010); Executive Committee, United States Golf Association; and Director, Policy Studies, Inc. and Van Gilder Insurance Corporation | 123 | Chairman, Board of Governors, Western Golf Association; Chairman-elect, Evans Scholars Foundation; and Director, Denver Film Society | ||||
Rodney F. Dammeyer — 1940 Trustee | 2010 | Chairman of CAC, LLC, (private company offering capital investment and management advisory services)
Formerly: Prior to 2001, Managing Partner at Equity Group Corporate Investments; Prior to 1995, Chief Executive Officer of Itel Corporation (formerly Anixter International); Prior to 1985, experience includes Senior Vice President and Chief Financial Officer of Household International, Inc., Executive Vice President and Chief Financial Officer of Northwest Industries, Inc. and Partner of Arthur Andersen & Co.; From 1987 to 2010, Director/Trustee of investment companies in the Van Kampen Funds complex | 123 | Director of Quidel Corporation and Stericycle, Inc.; Prior to May 2008, Trustee of The Scripps Research Institute; Prior to February 2008, Director of Ventana Medical Systems, Inc. | ||||
Albert R. Dowden — 1941 Trustee | 2001 | Director of a number of public and private business corporations, including the Boss Group, Ltd. (private investment and management); and Reich & Tang Funds (5 portfolios) (registered investment company)
Formerly: Director, Homeowners of America Holding Corporation/Homeowners of America Insurance Company (property casualty company); Director, Continental Energy Services, LLC (oil and gas pipeline service); Director, CompuDyne Corporation (provider of product and services to the public security market) and Director, Annuity and Life Re (Holdings), Ltd. (reinsurance company); Director, President and Chief Executive Officer, Volvo Group North America, Inc.; Senior Vice President, AB Volvo; Director of various public and private corporations; Chairman, DHJ Media, Inc.; Director, Magellan Insurance Company; and Director, The Hertz Corporation, Genmar Corporation (boat manufacturer), National Media Corporation; Advisory Board of Rotary Power International (designer, manufacturer, and seller of rotary power engines); and Chairman, Cortland Trust, Inc. (registered investment company) | 123 | Director of Nature’s Sunshine Products, Inc. | ||||
Jack M. Fields — 1952 Trustee | 2001 | Chief Executive Officer, Twenty First Century Group, Inc. (government affairs company); Owner and Chief Executive Officer, Dos Angeles Ranch, L.P. (cattle, hunting, corporate entertainment); and Discovery Global Education Fund (non-profit)
Formerly: Chief Executive Officer, Texana Timber LP (sustainable forestry company); Director of Cross Timbers Quail Research Ranch (non-profit); and member of the U.S. House of Representatives | 123 | Insperity, Inc. (formerly known as Administaff) | ||||
Prema Mathai-Davis — 1950 Trustee | 2001 | Retired
Formerly: Chief Executive Officer, YWCA of the U.S.A. | 123 | None | ||||
Larry Soll — 1942 Trustee | 2003 | Retired
Formerly: Chairman, Chief Executive Officer and President, Synergen Corp. (a biotechnology company) | 123 | None | ||||
Hugo F. Sonnenschein — 1940 Trustee | 2010 | Distinguished Service Professor and President Emeritus of the University of Chicago and the Adam Smith Distinguished Service Professor in the Department of Economics at the University of Chicago
Formerly: President of the University of Chicago | 136 | Trustee of the University of Rochester and a member of its investment committee. Member of the National Academy of Sciences, the American Philosophical Society and a fellow of the American Academy of Arts and Sciences |
T-2 Invesco Convertible Securities Fund
Trustees and Officers—(continued)
| Name, Year of Birth and Position(s) Held with the Trust | Trustee and/ or Officer Since | Principal Occupation(s) During Past 5 Years | Number of Funds in Fund Complex Overseen by Trustee | Other Directorship(s) Held by Trustee During Past 5 Years | ||||
| Independent Trustees—(continued) | ||||||||
Raymond Stickel, Jr. — 1944 Trustee | 2005 | Retired
Formerly: Director, Mainstay VP Series Funds, Inc. (25 portfolios) and Partner, Deloitte & Touche | 123 | None | ||||
| Other Officers | ||||||||
| Russell C. Burk — 1958 Senior Vice President and Senior Officer | 2005 | Senior Vice President and Senior Officer, The Invesco Funds | N/A | N/A | ||||
| John M. Zerr — 1962 Senior Vice President, Chief Legal Officer and Secretary | 2006 | Director, Senior Vice President, Secretary and General Counsel, Invesco Management Group, Inc. (formerly known as Invesco Aim Management Group, Inc.) and Van Kampen Exchange Corp.; Senior Vice President, Invesco Advisers, Inc. (formerly known as Invesco Institutional (N.A.), Inc.) (registered investment adviser); Senior Vice President and Secretary, Invesco Distributors, Inc. (formerly known as Invesco Aim Distributors, Inc.); Director, Vice President and Secretary, Invesco Investment Services, Inc. (formerly known as Invesco Aim Investment Services, Inc.) and IVZ Distributors, Inc. (formerly known as INVESCO Distributors, Inc.); Director and Vice President, INVESCO Funds Group, Inc.; Senior Vice President, Chief Legal Officer and Secretary, The Invesco Funds; Manager, Invesco PowerShares Capital Management LLC; Director, Secretary and General Counsel, Invesco Investment Advisers LLC (formerly known as Van Kampen Asset Management); Secretary and General Counsel, Invesco Capital Markets, Inc. (formerly known as Van Kampen Funds Inc.) and Chief Legal Officer, PowerShares Exchange-Traded Fund Trust, PowerShares Exchange-Traded Fund Trust II, PowerShares India Exchange-Traded Fund Trust and PowerShares Actively Managed Exchange-Traded Fund Trust
Formerly: Director and Vice President, Van Kampen Advisors Inc.; Director, Vice President, Secretary and General Counsel, Van Kampen Investor Services Inc.; Director, Invesco Distributors, Inc. (formerly known as Invesco Aim Distributors, Inc.); Director, Senior Vice President, General Counsel and Secretary, Invesco Aim Advisers, Inc. and Van Kampen Investments Inc.; Director, Vice President and Secretary, Fund Management Company; Director, Senior Vice President, Secretary, General Counsel and Vice President, Invesco Aim Capital Management, Inc.; Chief Operating Officer and General Counsel, Liberty Ridge Capital, Inc. (an investment adviser); Vice President and Secretary, PBHG Funds (an investment company) and PBHG Insurance Series Fund (an investment company); Chief Operating Officer, General Counsel and Secretary, Old Mutual Investment Partners (a broker-dealer); General Counsel and Secretary, Old Mutual Fund Services (an administrator) and Old Mutual Shareholder Services (a shareholder servicing center); Executive Vice President, General Counsel and Secretary, Old Mutual Capital, Inc. (an investment adviser); and Vice President and Secretary, Old Mutual Advisors Funds (an investment company) | N/A | N/A | ||||
| Karen Dunn Kelley — 1960 Vice President | 2004 | Senior Managing Director, Investments; Director, Co-President, Co-Chief Executive Officer, and Co-Chairman, Invesco Advisers, Inc. (formerly known as Invesco Institutional (N.A.), Inc.) (registered investment adviser); Chairman, Invesco Senior Secured Management, Inc.; Senior Vice President, Invesco Management Group, Inc. (formerly known as Invesco Aim Management Group, Inc.); Executive Vice President, Invesco Distributors, Inc. (formerly known as Invesco Aim Distributors, Inc.); Director, Invesco Mortgage Capital Inc., and Invesco Management Company Limited; Director and President, INVESCO Asset Management (Bermuda) Ltd., Vice President, The Invesco Funds (other than AIM Treasurer’s Series Trust (Invesco Treasurer’s Series Trust) and Short-Term Investments Trust); and President and Principal Executive Officer, The Invesco Funds (AIM Treasurer’s Series Trust (Invesco Treasurer’s Series Trust) and Short-Term Investments Trust only)
Formerly: Director, INVESCO Global Asset Management Limited and INVESCO Management S.A.; Senior Vice President, Van Kampen Investments Inc. and Invesco Advisers, Inc. (formerly known as Invesco Institutional (N.A.), Inc.) (registered investment adviser); Vice President, Invesco Advisers, Inc. (formerly known as Invesco Institutional (N.A.), Inc.); Director of Cash Management and Senior Vice President, Invesco Advisers, Inc. and Invesco Aim Capital Management, Inc.; President and Principal Executive Officer, Tax-Free Investments Trust; Director and President, Fund Management Company; Chief Cash Management Officer, Director of Cash Management, Senior Vice President, and Managing Director, Invesco Aim Capital Management, Inc.; Director of Cash Management, Senior Vice President, and Vice President, Invesco Advisers, Inc. and The Invesco Funds (AIM Treasurer’s Series Trust (Invesco Treasurer’s Series Trust), Short-Term Investments Trust and Tax-Free Investments Trust only) | N/A | N/A | ||||
T-3 Invesco Convertible Securities Fund
Trustees and Officers—(continued)
| Name, Year of Birth and Position(s) Held with the Trust | Trustee and/ or Officer Since | Principal Occupation(s) During Past 5 Years | Number of Funds in Fund Complex Overseen by Trustee | Other Directorship(s) Held by Trustee During Past 5 Years | ||||
| Other Officers—(continued) | ||||||||
| Sheri Morris — 1964 Vice President, Treasurer and Principal Financial Officer | 1999 | Vice President, Treasurer and Principal Financial Officer, The Invesco Funds; Vice President, Invesco Advisers, Inc. (formerly known as Invesco Institutional (N.A.), Inc.) (registered investment adviser); and Vice President, PowerShares Exchange-Traded Fund Trust, PowerShares Exchange-Traded Fund Trust II, PowerShares India Exchange-Traded Fund Trust and PowerShares Actively Managed Exchange-Traded Fund Trust
Formerly: Vice President, Invesco Aim Advisers, Inc., Invesco Aim Capital Management, Inc. and Invesco Aim Private Asset Management, Inc.; Assistant Vice President and Assistant Treasurer, The Invesco Funds and Assistant Vice President, Invesco Advisers, Inc., Invesco Aim Capital Management, Inc. and Invesco Aim Private Asset Management, Inc.; and Treasurer, PowerShares Exchange-Traded Fund Trust, PowerShares Exchange-Traded Fund Trust II, PowerShares India Exchange-Traded Fund Trust and PowerShares Actively Managed Exchange-Traded Fund Trust | N/A | N/A | ||||
Crissie M. Wisdom — 1969 Anti-Money Laundering Compliance Officer | 2013 | Anti-Money Laundering Compliance Officer, Invesco Advisers, Inc. (formerly known as Invesco Institutional (N.A.), Inc.) (registered investment adviser), Invesco Capital Markets, Inc. (formerly known as Van Kampen Funds Inc.), Invesco Distributors, Inc., Invesco Investment Services, Inc., Invesco Management Group, Inc., Van Kampen Exchange Corp., The Invesco Funds, Invesco Funds (Chicago), and PowerShares Exchange-Traded Fund Trust, PowerShares Exchange-Traded Fund Trust II, PowerShares India Exchange-Traded Fund Trust, and PowerShares Actively Managed Exchange-Traded Fund Trust; and Fraud Prevention Manager and Controls and Risk Analysis Manager for Invesco Investment Services, Inc. | N/A | N/A | ||||
| Todd L. Spillane — 1958 Chief Compliance Officer | 2006 | Senior Vice President, Invesco Management Group, Inc. (formerly known as Invesco Aim Management Group, Inc.) and Van Kampen Exchange Corp.; Senior Vice President and Chief Compliance Officer, Invesco Advisers, Inc. (registered investment adviser) (formerly known as Invesco Institutional (N.A.), Inc.); Chief Compliance Officer, The Invesco Funds; Vice President, Invesco Distributors, Inc. (formerly known as Invesco Aim Distributors, Inc.) and Invesco Investment Services, Inc. (formerly known as Invesco Aim Investment Services, Inc.)
Formerly: Chief Compliance Officer, Invesco Funds (Chicago); Senior Vice President, Van Kampen Investments Inc.; Senior Vice President and Chief Compliance Officer, Invesco Aim Advisers, Inc. and Invesco Aim Capital Management, Inc.; Chief Compliance Officer, INVESCO Private Capital Investments, Inc. (holding company), Invesco Private Capital, Inc. (registered investment adviser), Invesco Global Asset Management (N.A.), Inc., Invesco Senior Secured Management, Inc. (registered investment adviser), Van Kampen Investor Services Inc., PowerShares Exchange-Traded Fund Trust, PowerShares Exchange-Traded Fund Trust II, PowerShares India Exchange-Traded Fund Trust and PowerShares Actively Managed Exchange-Traded Fund Trust; and Vice President, Invesco Aim Capital Management, Inc. and Fund Management Company | N/A | N/A |
The Statement of Additional Information of the Trust includes additional information about the Fund’s Trustees and is available upon request, without charge, by calling 1.800.959.4246. Please refer to the Fund’s prospectus for information on the Fund’s sub-advisers.
Office of the Fund 11 Greenway Plaza, Suite 1000 Houston, TX 77046-1173 | Investment Adviser Invesco Advisers, Inc. 1555 Peachtree Street, N.E. Atlanta, GA 30309 | Distributor Invesco Distributors, Inc. 11 Greenway Plaza, Suite 1000 Houston, TX 77046-1173 | Auditors PricewaterhouseCoopers LLP 1201 Louisiana Street, Suite 2900 Houston, TX 77002-5678 | |||
Counsel to the Fund Stradley Ronon Stevens & Young, LLP 2005 Market Street, Suite 2600 Philadelphia, PA 19103-7018 | Counsel to the Independent Trustees Goodwin Procter LLP 901 New York Avenue, N.W. Washington, D.C. 20001 | Transfer Agent Invesco Investment Services, Inc. 11 Greenway Plaza, Suite 1000 Houston, TX 77046-1173 | Custodian State Street Bank and Trust Company 225 Franklin Street Boston, MA 02110-2801 | |||
T-4 Invesco Convertible Securities Fund

Invesco mailing information
Send general correspondence to Invesco Investment Services, Inc., P.O. Box 219078, Kansas City, MO 64121-9078.
Invesco privacy policy
You share personal and financial information with us that is necessary for your transactions and your account records. We take very seriously the obligation to keep that information confidential and private.
Invesco collects nonpublic personal information about you from account applications or other forms you complete and from your transactions with us or our affiliates. We do not disclose information about you or our former customers to service providers or other third parties except to the extent necessary to service your account and in other limited circumstances as permitted by law. For example, we use this information to facilitate the delivery of transaction confirmations, financial reports, prospectuses and tax forms.
Even within Invesco, only people involved in the servicing of your accounts and compliance monitoring have access to your information. To ensure the highest level of confidentiality and security, Invesco maintains physical, electronic and procedural safeguards that meet or exceed federal standards. Special measures, such as data encryption and authentication, apply to your communications with us on our website. More detail is available to you at invesco.com/privacy.
Important notice regarding delivery of security holder documents
To reduce Fund expenses, only one copy of most shareholder documents may be mailed to shareholders with multiple accounts at the same address (Householding). Mailing of your shareholder documents may be householded indefinitely unless you instruct us otherwise. If you do not want the mailing of these documents to be combined with those for other members of your household, please contact Invesco Investment Services, Inc. at 800 959 4246 or contact your financial institution. We will begin sending you individual copies for each account within 30 days after receiving your request.
Fund holdings and proxy voting information
The Fund provides a complete list of its holdings four times in each fiscal year, at the quarter ends. For the second and fourth quarters, the lists appear in the Fund’s semiannual and annual reports to shareholders. For the first and third quarters, the Fund files the lists with the Securities and Exchange Commission (SEC) on Form N-Q. The most recent list of portfolio holdings is available at invesco.com/completeqtrholdings. Shareholders can also look up the Fund’s Forms N-Q on the SEC website at sec.gov. Copies of the Fund’s Forms N-Q may be reviewed and copied at the SEC Public Reference Room in Washington, D.C. You can obtain information on the operation of the Public Reference Room, including information about duplicating fee charges, by calling 202 551 8090 or 800 732 0330, or by electronic request at the following email address: publicinfo@sec.gov. The SEC file numbers for the Fund are shown below.
A description of the policies and procedures that the Fund uses to determine how to vote proxies relating to portfolio securities is available without charge, upon request, from our Client Services department at 800 959 4246 or at invesco.com/proxyguidelines. The information is also available on the SEC website, sec.gov.
Information regarding how the Fund voted proxies related to its portfolio securities during the most recent 12-month period ended June 30 is available at invesco.com/proxysearch. The information is also available on the SEC website, sec.gov. Invesco Advisers, Inc. is an investment adviser; it provides investment advisory services to individual and institutional clients and does not sell securities. Invesco Distributors, Inc. is the US distributor for Invesco Ltd.’s retail mutual funds, exchange-traded funds and institutional money market funds. Both are wholly owned, indirect subsidiaries of Invesco Ltd. |  | |||
| SEC file numbers: 811-02699 and 002-57526 MS-CSEC-AR-1 Invesco Distributors, Inc. | ||||
|
| |||||
Annual Report to Shareholders
| December 31, 2013
| |||||
Invesco Global Low Volatility Equity Yield Fund | ||||||
Nasdaq: A: GTNDX § B: GNDBX § C: GNDCX § R: GTNRX § Y: GTNYX § R5: GNDIX | ||||||

Letters to Shareholders
Philip Taylor | Dear Shareholders: This annual report includes information about your Invesco Fund, including performance data and a complete list of its investments as of the close of the reporting period. Inside, your Fund’s portfolio managers discuss how they managed your Fund and the factors that affected its performance during the reporting period. I hope you find this report of interest. During the year covered by this report, major US and global equity market indexes hit multiyear or all-time highs1, the result of a strengthening US economy and relatively healthy corporate profits. Also helping equities was a return of individual investors to stocks – due in part to monetary policies that kept interest rates (and yields on fixed income securities) low. At the end of the reporting period, amid widespread signs of an improving economy, the US Federal Reserve announced that it would begin a long-anticipated reduction in its bond-buying program in January 2014; its decision was widely expected and investors reacted positively to | ||||||||
the announcement. Despite some mid-summer volatility, overseas equity market indexes in developed and emerging nations generally rose during the year. Extended periods of strong market performance such as we saw throughout 2013 can lull some investors into a false sense of security – just as extended periods of volatility or market weakness can discourage some investors from undertaking disciplined, long-term investment plans. That’s why Invesco believes it can often be helpful to work with a skilled and trusted financial adviser; he or she can emphasize the importance of adhering to an investment plan designed to achieve long-term goals like a first home, a college education for a child or a comfortable retirement. A financial adviser who is familiar with your individual financial situation, investment goals and risk tolerance can be an invaluable partner as you work toward your financial goals. He or she can provide insight and perspective when markets are volatile; encouragement and reassurance when times are uncertain; and advice and guidance when your financial situation or investment goals change. | |||||||||

Timely information when and where you want it
Invesco’s efforts to help investors achieve their financial objectives include providing individual investors and financial professionals with timely information about the markets, the economy and investing – whenever and wherever they want it.
Our website, invesco.com/us, offers a wide range of market insights and investment perspectives. On the website, you’ll find detailed information about our funds, including prices, performance, holdings and portfolio manager commentaries. You can access information about your individual Invesco account whenever it’s convenient for you; just complete a simple, secure online registration. Use the “Login” box on our home page to get started.
Using Invesco’s mobile app for iPad® (available free from the App StoreSM) allows you to obtain the same detailed information about your funds and the same investment insights from our investment leaders, market strategists, economists and retirement experts on the go. You also can watch portfolio manager videos and have instant access to Invesco news and updates wherever you may be.
In addition to the resources accessible on our website and through our mobile app, you can obtain timely updates to help you stay informed about the markets, the economy and investing by connecting with Invesco on Twitter, LinkedIn or Facebook. You can access our blog at blog.invesco.us.com or by visiting the “Intentional Investing Forum” on our home page. Our goal is to provide you the information you want, when and where you want it.
Have questions?
For questions about your account, feel free to contact an Invesco client services representative at 800 959 4246. For Invesco-related questions or comments, please email me directly at phil@invesco.com.
All of us at Invesco look forward to serving your investment management needs for many years to come. Thank you for investing with us.
Sincerely,

Philip Taylor
Senior Managing Director, Invesco Ltd.
1 Source: Reuters
iPad is a trademark of Apple Inc., registered in the US and other countries. App Store is a service mark of Apple Inc.
2 Invesco Global Low Volatility Equity Yield Fund
Bruce Crockett | Dear Fellow Shareholders: Many investors enjoyed positive returns on their investments in 2013. While some sectors of the market struggled, many major equity market indexes in the US and around the globe rose last year. The performance of stocks, fixed income securities and alternative investments – and the performance of mutual funds that invest in them – is determined by many factors, including unforeseeable economic and geopolitical events. Your Board certainly can’t determine how well various asset classes in the market perform, but we work hard throughout the year on issues that affect you and your fellow shareholders and determine how your investments are managed. For example, the Invesco Funds Board works to ensure that we provide a lineup of funds that allow financial advisers to build portfolios that meet shareholders’ changing financial needs and goals. Your Board works with Invesco Advisers on a continuing basis to provide financial | ||||||||
| products that may help investors achieve their varied financial goals. We also carefully monitor how the management teams of all the Invesco funds are performing in light of ever-changing and often unpredictable economic and market conditions. Your Board carefully assesses their performance in a constantly changing and highly competitive marketplace. | |||||||||

Your Board also conducts an annual review of the funds’ advisory and sub-advisory contracts with Invesco Advisers and its affiliates. This annual review, which is required by the Investment Company Act of 1940, focuses on the nature and quality of the services Invesco provides as adviser to the Invesco Funds and the reasonableness of the fees that it charges for those services. Each year, we spend months reviewing detailed information that we request from Invesco that allows us to evaluate its services and fees. We also use information from many independent sources, including materials provided by the independent Senior Officer of the Invesco Funds, who reports directly to the independent Trustees on the Board. Additionally, we meet with independent legal counsel and review performance and fee data prepared by Lipper Inc., an independent, third-party firm widely recognized as a leader in its field.
Be assured that your Board will continue working on behalf of fund shareholders, keeping your needs and interests uppermost in our minds.
As always, please contact me at bruce@brucecrockett.com with any questions or concerns you may have. On behalf of the Board, we look forward to continuing to represent your interests and serving your needs.
Sincerely,

Bruce L. Crockett
Independent Chair
Invesco Funds Board of Trustees
3 Invesco Global Low Volatility Equity Yield Fund
Management’s Discussion of Fund Performance
Performance summary
For the year ended December 31, 2013, Invesco Global Low Volatility Equity Yield Fund, at net asset value (NAV), outperformed its broad market/style-specific index, the MSCI World Index. The Fund benefited from positive stock selection in the consumer discretionary, consumer staples, financials and industrials sectors. In contrast, stock selection was weak in the energy, health care, information technology (IT), telecommunication services and utilities sectors.
Your Fund’s long-term performance appears later in this report.
Fund vs. Indexes
Total returns, 12/31/12 to 12/31/13, at net asset value (NAV). Performance shown does not include applicable contingent deferred sales charges (CDSC) or front-end sales charges, which would have reduced performance.
| Class A Shares | 29.23 | % | |||
| Class B Shares | 28.34 | ||||
| Class C Shares | 28.32 | ||||
| Class R Shares | 28.92 | ||||
| Class Y Shares | 29.63 | ||||
| Class R5 Shares | 29.99 | ||||
| MSCI World Index‚ (Broad Market/Style-Specific Index) | 26.68 | ||||
| Lipper Global Multi-Cap Core Funds Indexn (Former Peer Group Index)* | 25.81 | ||||
| Lipper Global Equity Income Funds Index¨ (Peer Group Index)* | 20.15 |
Source(s): ‚Invesco, MSCI via FactSet Research Systems Inc.; nLipper Inc.; ¨Invesco, Lipper Inc.
| * | The Fund has elected to use the Lipper Global Equity Income Funds Index as its peer group rather than the Lipper Global Multi-Cap Core Funds Index because the Lipper Global Equity Income Funds Index more closely reflects the performance of the types of securities in which the Fund invests. |
How we invest
On July 31, 2013, Invesco Global Quantitative Core Fund was renamed Invesco Global Low Volatility Equity Yield Fund. We believe this change may better position the Fund by potentially reducing risk without sacrificing return or income.
We manage your Fund to provide exposure to global large-cap stocks. Beginning July 31, 2013, the investment team began using a holistic, total-return approach seeking the benefits of integrating desired outcomes of price appreciation, higher income and low volatility. This is achieved by using a disciplined investment process where returns are driven by a successful, long-standing stock selection model based on four investment
concepts: company earnings momentum, price trend, management action and relative valuation.
We take a comprehensive approach to risk management, considering risk at both the individual stock and total portfolio levels. To develop a risk assessment, we integrate our team’s qualitative risk review with the forecast from our proprietary risk model. We consider risk management to be an integral part of the portfolio construction process.
The team employs a low volatility approach to construct the portfolio by relaxing the benchmark-relative constraints, creating a wider opportunity set with the freedom to seek the highest level of return and generate income (dividend yield) for a lower level of total risk.
Market conditions and your Fund
While US and global equity markets enjoyed generally strong returns for the year ended December 31, 2013, the US and global economies improved only slowly. Despite a contentious battle over extending the nation’s debt ceiling and a two-week federal government shutdown, the US economy grew throughout 2013; economic data improved notably in the latter part of the year.
Improving macroeconomic data and reduced political uncertainty buoyed European equity markets during the reporting period. UK equities ended the reporting period strongly, spurred by improving housing and employment data. Continental European equity markets posted strong gains for the reporting period as well; indeed, the eurozone officially exited recession in late summer.
Japanese equities rose sharply, based on investors’ hopes that the new government led by Prime Minister Shinzo Abe, along with new leadership at the Bank of Japan, would finally arrest deflation. However, the market consolidated in May amid a tug of war between optimism about Abe’s leadership and the potential of “Abenomics” and concern about political developments in China and economic prospects in the US and emerging markets.
Emerging market economies had a difficult year, with slowing world trade and abrupt corrections to their equity, bond and currency markets after the US Federal Reserve (the Fed) indicated mid-year it might reduce its bond-buying program in 2013. The economies most seriously affected – including Brazil, India, Indonesia, Turkey and South Africa – had allowed money and credit growth to expand significantly in the preceding three years.
Portfolio Composition By sector
| |||||
| Telecommunication Services | 21.4 | % | |||
| Energy | 13.3 | ||||
| Health Care | 11.8 | ||||
| Industrials | 10.3 | ||||
| Utilities | 8.8 | ||||
| Consumer Staples | 7.9 | ||||
| Financials | 7.9 | ||||
| Consumer Discretionary | 6.7 | ||||
| Information Technology | 6.2 | ||||
| Materials | 1.9 | ||||
Money Market Funds Plus Other Assets Less Liabilities | 3.8 | ||||
| Top 10 Equity Holdings* | |||||
1. Skandinaviska Enskilda Banken AB-Class A | 2.2 | % | |||
2. Lockheed Martin Corp. | 2.1 | ||||
3. Next PLC | 2.1 | ||||
4. Cisco Systems, Inc. | 2.0 | ||||
5. Banco Santander S.A. | 2.0 | ||||
6. AstraZeneca PLC | 2.0 | ||||
7. BP PLC | 2.0 | ||||
8. Archer-Daniels-Midland Co. | 2.0 | ||||
9. Freenet AG | 2.0 | ||||
10. Husky Energy Inc. | 2.0 | ||||
| Top Five Countries* | |||||
1. United States | 29.6 | % | |||
2. Australia | 14.7 | ||||
3. United Kingdom | 13.0 | ||||
4. Canada | 10.2 | ||||
5. Sweden | 5.6 | ||||
| Total Net Assets | $166.5 million | ||||
| Total Number of Holdings* | 71 | ||||
The Fund’s holdings are subject to change, and there is no assurance that the Fund will continue to hold any particular security.
*Excluding money market fund holdings.
4 Invesco Global Low Volatility Equity Yield Fund
For the reporting period, Invesco Global Low Volatility Equity Yield Fund, at NAV, outpaced the MSCI World Index. The Fund’s stock selection in consumer discretionary, consumer staples, financials and industrials was quite strong and contributed to the Fund’s outperformance versus the MSCI World Index. In contrast, stock selection in the energy, health care, IT, telecommunication services, and utilities sectors detracted from the Fund’s overall performance.
Strong performance in the industrials sector was led by several holdings including Central Japan Railway (liquidated during the reporting period) and Northrup Grumman. Northrup Grumman posted a double-digit earnings surprise each quarter of 2013.1 Central Japan Railway, Japan’s largest railway company, also beat earnings estimates in the fourth quarter, by a reported 50%.1
Swedish bank, Skandinaviska Enskilda Banken, delivered strong earnings as it rebounded from its 2008 lows. The bank also announced a possible merger with Danske Bank (not a Fund holding).1
Also contributing to the outperformance of the Fund versus the MSCI World Index were Gap (liquidated during the reporting period) and Lockheed Martin.
During the reporting period, holdings in the energy sector were key detractors from Fund performance. Both Lightstream Resources (liquidated during the reporting period) and Fred Olsen Energy delivered negative returns. Fred Olsen Energy struggled during the year and missed estimates in the third quarter. Main reasons included higher costs in both the drilling and engineering segments of its business.1 In addition, Lightstream Resources suffered from a long period of poor share price performance.
Within the IT sector, Canon (liquidated during the reporting period) was the top detractor. Canon, the world’s leading camera maker, cut its sales and profit forecasts during the reporting period. Canon faced slowing demand for compact and high-end cameras with interchangeable lenses.1
Other detractors from Fund performance included Garmin and Boliden, which were both liquidated during the reporting period.
When looking closely at the countries in which the Fund invests, stock selection in Canada, Hong Kong, and Norway lagged the MSCI World Index. Conversely, stock selection was very strong in France, Germany, the UK and the US.
Equity markets have posted strong results for several years making some investors skeptical that the strength will continue in the near term. The US political environment remains volatile, but the major hurdles of the government shut- down and uncertainty about who would be named the new Fed chair are behind us, providing a small degree of clarity as we move forward. The global economic recovery still remains fragile, and we believe it likely will have more bumps on the road.
We welcome new investors during the year, and thank all shareholders for continued investment in Invesco Global Low Volatility Equity Yield Fund.
| 1 | Source: Bloomberg L.P. |
The views and opinions expressed in management’s discussion of Fund performance are those of Invesco Advisers, Inc. These views and opinions are subject to change at any time based on factors such as market and economic conditions. These views and opinions may not be relied upon as investment advice or recommendations, or as an offer for a particular security. The information is not a complete analysis of every aspect of any market, country, industry, security or the Fund. Statements of fact are from sources considered reliable, but Invesco Advisers, Inc. makes no representation or warranty as to their completeness or accuracy. Although historical performance is no guarantee of future results, these insights may help you understand our investment management philosophy.
See important Fund and, if applicable, index disclosures later in this report.
 | Michael Abata Chartered Financial Analyst, portfolio manager, is manager of Invesco Global Low Volatility Equity Yield | |
| Fund. He joined Invesco in 2011. Mr. Abata earned a BA in economics from Binghamton University. | ||
 | Karl Georg Bayer Portfolio manager, is manager of Invesco Global Low Volatility Equity Yield Fund. He joined Invesco in 1991. | |
| Mr. Bayer earned Diplom Kaufmann and Diplom Ingenieur degrees from the University of Darmstadt. | ||
 | Uwe Draeger Portfolio manager, is manager of Invesco Global Low Volatility Equity Yield Fund. He joined Invesco in 2005. | |
| Mr. Draeger earned a Diplom-Ökonom degree from Hochschule für Ökonomie Berlin, an MA from City of London Polytechnic and an MBA from Anglia Business School (Cambridge). | ||
 | Nils Huter Chartered Financial Analyst, portfolio manager, is manager of Invesco Global Low Volatility Equity Yield | |
| Fund. He joined Invesco in 2007. Mr. Huter earned a Diplom Kaufmann degree from the University of Applied Sciences and Arts in Hildesheim. | ||
 | Charles Ko Chartered Financial Analyst, portfolio manager, is manager of Invesco Global Low Volatility Equity Yield | |
| Fund. He joined Invesco in 2012. Mr. Ko earned a BS from MIT and an MBA from Yale University. | ||
 | Jens Langewand Portfolio manager, is manager of Invesco Global Low Volatility Equity Yield Fund. He joined Invesco in 2007. | |
| Mr. Langewand earned a Diplom Kaufmann degree from the University of Münster and a PhD from the University of Augsburg. | ||
 | Andrew Waisburd Portfolio manager, is manager of Invesco Global Low Volatility Equity Yield Fund. He joined Invesco in 2008. | |
| Mr. Waisburd earned a BS in statistics from Cornell University and an MS and a PhD in finance from Indiana University. | ||
5 Invesco Global Low Volatility Equity Yield Fund
Your Fund’s Long-Term Performance
Results of a $10,000 Investment – Oldest Share Class(es)
Fund and index data from 12/31/03
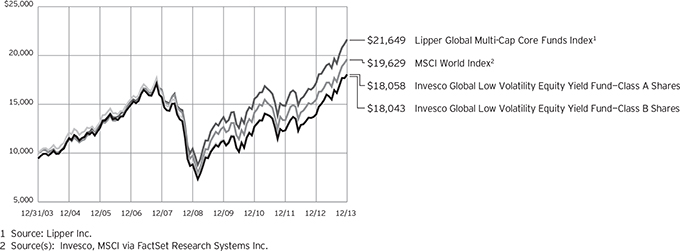
Past performance cannot guarantee comparable future results.
The data for the Fund’s new peer group index, the Lipper Global Equity Income Index, is not available prior to June 30, 2009, so the index is not shown on the chart.
The data shown in the chart include reinvested distributions, applicable sales
charges and Fund expenses including management fees. Results for Class B shares are calculated as if a hypothetical shareholder had liquidated his entire investment in the Fund at the close of the reporting period and paid the contingent deferred sales charges, if applicable. Index results include reinvested dividends, but they do not reflect sales
charges. Performance of the peer group, if applicable, reflects fund expenses and management fees; performance of a market index does not. Performance shown in the chart and table(s) does not reflect deduction of taxes a shareholder would pay on Fund distributions or sale of Fund shares.
continued from page 8
market to cause a similar effect on other member states’ markets. European countries that are part of the European Economic and Monetary Union may be significantly affected by the tight fiscal and monetary controls that the union seeks to impose on its members.
| n | Management risk. The investment techniques and risk analysis used by the Fund’s portfolio managers may not produce the desired results. |
| n | Market risk. The prices of and the income generated by the Fund’s securities may decline in response to, among other things, investor sentiment, general economic and market conditions, regional or global instability, and currency and interest rate fluctuations. |
About indexes used in this report
| n | The MSCI World IndexSM is an unmanaged index considered representative of stocks of developed countries. The index is computed using the net return, which withholds applicable taxes for non-resident investors. |
| n | The Lipper Global Multi-Cap Core Funds Index is an unmanaged index considered representative of global multicap core funds tracked by Lipper. |
| n | The Lipper Global Equity Income Funds Index is an unmanaged Index considered representative of global equity income funds tracked by Lipper. |
| n | The Fund is not managed to track the performance of any particular index, including the index(es) described here, and consequently, the performance of the Fund may deviate significantly from the performance of the index(es). |
| n | A direct investment cannot be made in an index. Unless otherwise indicated, index results include reinvested dividends, and they do not reflect sales charges. Performance of the peer group, if applicable, reflects fund expenses; performance of a market index does not. |
Other information
| n | The returns shown in management’s discussion of Fund performance are based on net asset values calculated for shareholder transactions. Generally accepted accounting principles require adjustments to be made to the net assets of the Fund at period end for financial reporting purposes, and as such, the net asset values for shareholder transactions and the returns based on those net asset values may differ from the net asset values and returns reported in the Financial Highlights. |
| n | Industry classifications used in this report are generally according to the Global Industry Classification Standard, which was developed by and is the exclusive property and a service mark of MSCI Inc. and Standard & Poor’s. |
6 Invesco Global Low Volatility Equity Yield Fund
| Average Annual Total Returns | ||||
As of 12/31/13, including maximum applicable sales charges
|
| |||
| Class A Shares | ||||
| Inception (9/15/97) | 6.46 | % | ||
| 10 Years | 6.09 | |||
| 5 Years | 14.09 | |||
| 1 Year | 22.15 | |||
| Class B Shares | ||||
| Inception (9/15/97) | 6.57 | % | ||
| 10 Years | 6.08 | |||
| 5 Years | 14.32 | |||
| 1 Year | 23.34 | |||
| Class C Shares | ||||
| Inception (1/2/98) | 6.49 | % | ||
| 10 Years | 5.93 | |||
| 5 Years | 14.54 | |||
| 1 Year | 27.32 | |||
| Class R Shares | ||||
| 10 Years | 6.45 | % | ||
| 5 Years | 15.12 | |||
| 1 Year | 28.92 | |||
| Class Y Shares | ||||
| 10 Years | 6.83 | % | ||
| 5 Years | 15.67 | |||
| 1 Year | 29.63 | |||
| Class R5 Shares | ||||
| 10 Years | 7.27 | % | ||
| 5 Years | 16.13 | |||
| 1 Year | 29.99 | |||
Class R shares incepted on October 31, 2005. Performance shown prior to that date is that of Class A shares, restated to reflect the higher 12b-1 fees applicable to Class R shares. Class A share performance reflects any applicable fee waivers or expense reimbursements.
Class Y shares incepted on October 3, 2008. Performance shown prior to that date is that of Class A shares and includes the 12b-1 fees applicable to Class A shares. Class A share performance reflects any applicable fee waivers or expense reimbursements.
Class R5 shares incepted on April 30, 2004. Performance shown prior to that date is that of Class A shares and includes the 12b-1 fees applicable to Class A shares. Class A share performance reflects any applicable fee waivers or expense reimbursements.
The performance data quoted represent past performance and cannot guarantee comparable future results; current performance may be lower or higher. Please visit invesco.com/performance for the
most recent month-end performance. Performance figures reflect reinvested distributions, changes in net asset value and the effect of the maximum sales charge unless otherwise stated. Investment return and principal value will fluctuate so that you may have a gain or loss when you sell shares.
The total annual Fund operating expense ratio set forth in the most recent Fund prospectus as of the date of this report for Class A, Class B, Class C, Class R, Class Y and Class R5 shares was 1.63%, 2.38%, 2.38%, 1.88%, 1.38% and 1.06%, respectively. The expense ratios presented above may vary from the expense ratios presented in other sections of this report that are based on expenses incurred during the period covered by this report.
Class A share performance reflects the maximum 5.50% sales charge, and Class B and Class C share performance reflects the applicable contingent deferred sales charge (CDSC) for the period involved. The CDSC on Class B shares declines from 5% beginning at the time of purchase to 0% at the beginning of the seventh year. The CDSC on Class C shares is 1% for the first year after purchase. Class R, Class Y and Class R5 shares do not have a front-end sales charge or a CDSC; therefore, performance is at net asset value.
The performance of the Fund’s share classes will differ primarily due to different sales charge structures and class expenses
7 Invesco Global Low Volatility Equity Yield Fund
Invesco Global Low Volatility Equity Yield Fund’s investment objective is income and long-term growth of capital.
| n | Unless otherwise stated, information presented in this report is as of December 31, 2013, and is based on total net assets. |
| n | Unless otherwise noted, all data provided by Invesco. |
| n | To access your Fund’s reports/prospectus, visit invesco.com/fundreports. |
About share classes
| n | Class B shares may not be purchased for new or additional investments. Please see the prospectus for more information. |
| n | Class R shares are generally available only to employer sponsored retirement and benefit plans. Please see the prospectus for more information. |
| n | Class Y shares are available only to certain investors. Please see the prospectus for more information. |
| n | Class R5 shares are primarily intended for employer sponsored retirement and benefit plans that meet certain standards and for institutional investors. Please see the prospectus for more information. |
Principal risks of investing in the Fund
| n | Active trading risk. The Fund engages in frequent trading of portfolio securities. Active trading results in added expenses and may result in a lower return and increased tax liability. |
| n | Currency/exchange rate risk. The dollar value of the Fund’s foreign investments will be affected by changes in the exchange rates between the dollar and the currencies in which those investments are traded. |
| n | Depositary receipts risk. Depositary receipts involve many of the same risks as those associated with direct investment in foreign securities. In addition, the underlying issuers of certain depositary receipts, particularly unsponsored or unregistered depositary receipts, are under no obligation to distribute shareholder communications to the holders of such receipts or to pass through to them any voting rights with respect to the deposited securities. |
| n | Derivatives risk. The value of a derivative instrument depends largely on (and is derived from) the value of an underlying security, currency, commodity, interest rate, index or other asset (each referred to as an underlying asset). In |
addition to risks relating to the underlying assets, the use of derivatives may include other, possibly greater, risks, including counterparty, leverage and liquidity risks. Counterparty risk is the risk that the counterparty to the derivative contract will default on its obligation to pay the Fund the amount owed or otherwise perform under the derivative contract. Derivatives create leverage risk because they do not require payment up front equal to the economic exposure created by owning the derivative. As a result, an adverse change in the value of the underlying asset could result in the Fund sustaining a loss that is substantially greater than the amount invested in the derivative, which may make the Fund’s returns more volatile and increase the risk of loss. Derivative instruments may also be less liquid than more traditional investments and the Fund may be unable to sell or close out its derivative positions at a desirable time or price. This risk may be more acute under adverse market conditions, during which the Fund may be most in need of liquidating its derivative positions. Derivatives may also be harder to value, less tax efficient and subject to changing government regulation that could impact the Fund’s ability to use certain derivatives or their cost. Also, derivatives used for hedging or to gain or limit exposure to a particular market segment may not provide the expected benefits, particularly during adverse market conditions. |
| n | Developing/emerging markets securities risk. The prices of securities issued by foreign companies and governments located in developing/emerging markets countries may be affected more negatively by inflation, devaluation of their currencies, higher transaction costs, delays in settlement, adverse political developments, the introduction of capital controls, withholding taxes, nationalization of private assets, expropriation, social unrest, |
| war or lack of timely information than those in developed countries. |
| n | Foreign securities risk. The Fund’s foreign investments may be affected by changes in a foreign country’s exchange rates, political and social instability, changes in economic or taxation policies, difficulties when enforcing obligations, decreased liquidity, and increased volatility. Foreign companies may be subject to less regulation resulting in less publicly available information about the companies. |
| n | Geographic focus risk. From time to time the Fund may invest a substantial amount of its assets in securities of issuers located in a single country or a limited number of countries. If the Fund focuses its investments in this manner, it assumes the risk that economic, political and social conditions in those countries will have a significant impact on its investment performance. The Fund’s investment performance may also be more volatile if it focuses its investments in certain countries, especially emerging markets countries. |
| n | Investing in the European Union risk. Many countries in the European Union are susceptible to high economic risks associated with high levels of debt, notably due to investments in sovereign debts of European countries such as Greece, Italy and Spain. One or more member states might exit the European Union, placing its currency and banking system in jeopardy. The European Union faces major issues involving its membership, structure, procedures and policies, including the adoption, abandonment or adjustment of the new constitutional treaty, the European Union’s enlargement to the south and east, and resolution of the European Union’s problematic fiscal and democratic accountability. Efforts of the member states to further unify their economic and monetary policies may increase the potential for the downward movement of one member state’s |
continued on page 6
This report must be accompanied or preceded by a currently effective Fund prospectus, which contains more complete information, including sales charges and expenses. Investors should read it carefully before investing.
NOT FDIC INSURED | MAY LOSE VALUE | NO BANK GUARANTEE
Fund Nasdaq Symbols
| |||||
| Class A Shares | GTNDX | ||||
| Class B Shares | GNDBX | ||||
| Class C Shares | GNDCX | ||||
| Class R Shares | GTNRX | ||||
| Class Y Shares | GTNYX | ||||
| Class R5 Shares | GNDIX | ||||
8 Invesco Global Low Volatility Equity Yield Fund
Schedule of Investments
December 31, 2013
| Shares | Value | |||||||
Common Stocks & Other Equity Interests–96.16% |
| |||||||
| Australia–14.70% | ||||||||
Amcor Ltd. | 296,893 | $ | 2,806,638 | |||||
Commonwealth Bank of Australia | 30,952 | 2,155,933 | ||||||
CSL Ltd. | 35,650 | 2,199,853 | ||||||
DUET Group–Rts. | 1,004,696 | 1,797,149 | ||||||
Flight Centre Travel Group Ltd. | 60,925 | 2,585,848 | ||||||
Orora Ltd.(a) | 296,893 | 307,408 | ||||||
Ramsay Health Care Ltd. | 80,982 | 3,134,443 | ||||||
Sonic Healthcare Ltd. | 199,118 | 2,958,366 | ||||||
Suncorp Group Ltd. | 139,049 | 1,632,810 | ||||||
Telstra Corp. Ltd. | 622,289 | 2,916,140 | ||||||
Woodside Petroleum Ltd. | 14,234 | 494,235 | ||||||
Woolworths Ltd. | 48,940 | 1,478,698 | ||||||
| 24,467,521 | ||||||||
| Austria–0.59% | ||||||||
Oesterreichische Post AG | 20,669 | 990,468 | ||||||
| Belgium–1.92% | ||||||||
Belgacom S.A. | 108,112 | 3,198,664 | ||||||
| Canada–10.24% | ||||||||
Bell Aliant, Inc. | 110,900 | 2,790,771 | ||||||
Canadian Oil Sands Ltd. | 142,600 | 2,682,308 | ||||||
Davis + Henderson Corp. | 58,600 | 1,643,470 | ||||||
Enerplus Corp. | 177,700 | 3,228,780 | ||||||
Husky Energy Inc. | 103,400 | 3,280,531 | ||||||
Superior Plus Corp. | 115,800 | 1,346,385 | ||||||
TransAlta Corp. | 164,500 | 2,087,611 | ||||||
| 17,059,856 | ||||||||
| Denmark–3.21% | ||||||||
GN Store Nord AS | 90,118 | 2,221,385 | ||||||
TDC AS | 322,161 | 3,125,123 | ||||||
| 5,346,508 | ||||||||
| France–1.88% | ||||||||
GDF Suez | 132,534 | 3,127,746 | ||||||
| Germany–2.85% | ||||||||
Freenet AG | 109,587 | 3,310,739 | ||||||
ProSiebenSat.1 Media AG | 28,820 | 1,429,795 | ||||||
| 4,740,534 | ||||||||
| Israel–1.63% | ||||||||
Bezeq The Israeli Telecommunication Corp. Ltd. | 1,599,198 | 2,709,374 | ||||||
| Japan–1.87% | ||||||||
Daito Trust Construction Co., Ltd. | 2,500 | 233,403 | ||||||
Tokyo Gas Co., Ltd. | 583,000 | 2,873,291 | ||||||
| 3,106,694 | ||||||||
| Shares | Value | |||||||
| Netherlands–0.61% | ||||||||
Koninklijke Ahold N.V. | 56,947 | $ | 1,022,437 | |||||
| New Zealand–1.79% | ||||||||
Telecom Corp. of New Zealand Ltd. | 1,573,953 | 2,983,273 | ||||||
| Norway–2.35% | ||||||||
Fred. Olsen Energy ASA | 75,802 | 3,092,791 | ||||||
Marine Harvest ASA | 668,394 | 816,020 | ||||||
| 3,908,811 | ||||||||
| Singapore–0.52% | ||||||||
Singapore Post Ltd. | 821,000 | 862,778 | ||||||
| Spain–2.00% | ||||||||
Banco Santander S.A. | 369,765 | 3,337,118 | ||||||
| Sweden–5.60% | ||||||||
Intrum Justitia AB | 74,356 | 2,087,673 | ||||||
Loomis AB–Class B | 24,425 | 581,712 | ||||||
Skandinaviska Enskilda Banken AB–Class A | 271,771 | 3,595,811 | ||||||
TeliaSonera AB | 367,046 | 3,061,483 | ||||||
| 9,326,679 | ||||||||
| Switzerland–1.77% | ||||||||
Roche Holding AG | 10,533 | 2,952,413 | ||||||
| United Kingdom–13.02% | ||||||||
AstraZeneca PLC | 56,030 | 3,323,579 | ||||||
Berendsen PLC | 79,969 | 1,244,835 | ||||||
BP PLC | 409,317 | 3,315,882 | ||||||
Britvic PLC | 220,424 | 2,533,302 | ||||||
Micro Focus International PLC | 84,172 | 1,070,506 | ||||||
Next PLC | 37,909 | 3,421,363 | ||||||
Reed Elsevier PLC | 40,877 | 609,306 | ||||||
Royal Dutch Shell PLC–Class A | 83,537 | 3,000,266 | ||||||
WH Smith PLC | 190,078 | 3,159,873 | ||||||
| 21,678,912 | ||||||||
| United States–29.61% | ||||||||
Alliant Techsystems Inc. | 11,500 | 1,399,320 | ||||||
Amdocs Ltd. | 9,300 | 383,532 | ||||||
Archer–Daniels-Midland Co. | 76,300 | 3,311,420 | ||||||
AT&T Inc. | 71,500 | 2,513,940 | ||||||
CA, Inc. | 17,400 | 585,510 | ||||||
Cisco Systems, Inc. | 148,800 | 3,340,560 | ||||||
ConocoPhillips | 43,400 | 3,066,210 | ||||||
Edison International | 12,900 | 597,270 | ||||||
Entergy Corp. | 45,500 | 2,878,785 | ||||||
Everest Re Group, Ltd. | 10,300 | 1,605,461 | ||||||
Frontier Communications Corp. | 652,600 | 3,034,590 | ||||||
Lexmark International, Inc.–Class A | 65,500 | 2,326,560 | ||||||
Lockheed Martin Corp. | 23,500 | 3,493,510 | ||||||
Lorillard, Inc. | 62,400 | 3,162,432 | ||||||
See accompanying Notes to Financial Statements which are an integral part of the financial statements.
9 Invesco Global Low Volatility Equity Yield Fund
| Shares | Value | |||||||
| United States–(continued) | ||||||||
Marvell Technology Group Ltd. | 69,900 | $ | 1,005,162 | |||||
Northrop Grumman Corp. | 28,100 | 3,220,541 | ||||||
Pfizer Inc. | 95,000 | 2,909,850 | ||||||
Prospect Capital Corp. | 45,719 | 512,967 | ||||||
R. R. Donnelley & Sons Co. | 161,300 | 3,271,164 | ||||||
Safeway Inc. | 22,900 | 745,853 | ||||||
Verizon Communications Inc. | 59,900 | 2,943,486 | ||||||
Windstream Holdings Inc. | 375,300 | 2,994,894 | ||||||
| 49,303,017 | ||||||||
Total Common Stocks & Other Equity Interests |
| 160,122,803 | ||||||
| Shares | Value | |||||||
Money Market Funds–2.29% |
| |||||||
Liquid Assets Portfolio– | 1,905,558 | $ | 1,905,558 | |||||
Premier Portfolio–Institutional Class(b) | 1,905,559 | 1,905,559 | ||||||
Total Money Market Funds |
| 3,811,117 | ||||||
TOTAL INVESTMENTS–98.45% | 163,933,920 | |||||||
OTHER ASSETS LESS LIABILITIES–1.55% |
| 2,589,603 | ||||||
NET ASSETS–100.00% | $ | 166,523,523 | ||||||
Investment Abbreviations:
| Rts. | – Rights |
Notes to Schedule of Investments:
| (a) | Non-income producing security. |
| (b) | The money market fund and the Fund are affiliated by having the same investment adviser. |
See accompanying Notes to Financial Statements which are an integral part of the financial statements.
10 Invesco Global Low Volatility Equity Yield Fund
Statement of Assets and Liabilities
December 31, 2013
Assets: | ||||
Investments, at value (Cost $139,240,276) | $ | 160,122,803 | ||
Investments in affiliated money market funds, at value and cost | 3,811,117 | |||
Total investments, at value (Cost $143,051,393) | 163,933,920 | |||
Foreign currencies, at value (Cost $1,899,079) | 1,914,132 | |||
Receivable for: | ||||
Deposits with brokers for open futures contracts | 200,829 | |||
Variation margin | 4,672 | |||
Fund shares sold | 397,183 | |||
Dividends | 354,374 | |||
Investment for trustee deferred compensation and retirement plans | 77,182 | |||
Other assets | 31,388 | |||
Total assets | 166,913,680 | |||
Liabilities: | ||||
Payable for: | ||||
Fund shares reacquired | 140,394 | |||
Accrued fees to affiliates | 102,106 | |||
Accrued trustees’ and officers’ fees and benefits | 864 | |||
Accrued other operating expenses | 58,979 | |||
Trustee deferred compensation and retirement plans | 87,814 | |||
Total liabilities | 390,157 | |||
Net assets applicable to shares outstanding | $ | 166,523,523 | ||
Net assets consist of: | ||||
Shares of beneficial interest | $ | 227,776,861 | ||
Undistributed net investment income | 1,380,057 | |||
Undistributed net realized gain (loss) | (83,679,205 | ) | ||
Net unrealized appreciation | 21,045,810 | |||
| $ | 166,523,523 | |||
Net Assets: | ||||
Class A | $ | 117,233,835 | ||
Class B | $ | 5,434,076 | ||
Class C | $ | 14,099,072 | ||
Class R | $ | 1,351,153 | ||
Class Y | $ | 3,175,611 | ||
Class R5 | $ | 25,229,776 | ||
Shares outstanding, $0.01 par value per share, |
| |||
Class A | 8,121,158 | |||
Class B | 397,813 | |||
Class C | 1,032,473 | |||
Class R | 93,460 | |||
Class Y | 219,183 | |||
Class R5 | 1,724,125 | |||
Class A: | ||||
Net asset value per share | $ | 14.44 | ||
Maximum offering price per share | ||||
(Net asset value of $14.44 ¸ 94.50%) | $ | 15.28 | ||
Class B: | ||||
Net asset value and offering price per share | $ | 13.66 | ||
Class C: | ||||
Net asset value and offering price per share | $ | 13.66 | ||
Class R: | ||||
Net asset value and offering price per share | $ | 14.46 | ||
Class Y: | ||||
Net asset value and offering price per share | $ | 14.49 | ||
Class R5: | ||||
Net asset value and offering price per share | $ | 14.63 | ||
See accompanying Notes to Financial Statements which are an integral part of the financial statements.
11 Invesco Global Low Volatility Equity Yield Fund
Statement of Operations
For the year ended December 31, 2013
Investment income: |
| |||
Dividends (net of foreign withholding taxes of $369,800) | $ | 5,229,333 | ||
Dividends from affiliated money market funds (includes securities lending income of $96,321) | 98,407 | |||
Total investment income | 5,327,740 | |||
Expenses: | ||||
Advisory fees | 1,169,803 | |||
Administrative services fees | 50,000 | |||
Custodian fees | 33,233 | |||
Distribution fees: | ||||
Class A | 263,958 | |||
Class B | 60,534 | |||
Class C | 101,283 | |||
Class R | 6,069 | |||
Transfer agent fees — A, B, C, R and Y | 341,843 | |||
Transfer agent fees — R5 | 1,868 | |||
Trustees’ and officers’ fees and benefits | 29,660 | |||
Other | 198,292 | |||
Total expenses | 2,256,543 | |||
Less: Fees waived and expense offset arrangement(s) | (5,642 | ) | ||
Net expenses | 2,250,901 | |||
Net investment income | 3,076,839 | |||
Realized and unrealized gain (loss) from: | ||||
Net realized gain (loss) from: | ||||
Investment securities | 22,221,514 | |||
Foreign currencies | (90,245 | ) | ||
Futures contracts | 707,280 | |||
| 22,838,549 | ||||
Change in net unrealized appreciation of: | ||||
Investment securities | 10,998,793 | |||
Foreign currencies | 6,693 | |||
Futures contracts | 144,197 | |||
| 11,149,683 | ||||
Net realized and unrealized gain | 33,988,232 | |||
Net increase in net assets resulting from operations | $ | 37,065,071 | ||
See accompanying Notes to Financial Statements which are an integral part of the financial statements.
12 Invesco Global Low Volatility Equity Yield Fund
Statement of Changes in Net Assets
For the years ended December 31, 2013 and 2012
| 2013 | 2012 | |||||||
Operations: | ||||||||
Net investment income | $ | 3,076,839 | $ | 1,590,542 | ||||
Net realized gain | 22,838,549 | 6,613,078 | ||||||
Change in net unrealized appreciation | 11,149,683 | 8,614,773 | ||||||
Net increase in net assets resulting from operations | 37,065,071 | 16,818,393 | ||||||
Distributions to shareholders from net investment income: | ||||||||
Class A | (2,105,673 | ) | (2,226,850 | ) | ||||
Class B | (86,576 | ) | (93,077 | ) | ||||
Class C | (162,951 | ) | (122,844 | ) | ||||
Class R | (22,777 | ) | (19,325 | ) | ||||
Class Y | (29,719 | ) | (21,434 | ) | ||||
Class R5 | (494,220 | ) | (546,510 | ) | ||||
Total distributions from net investment income | (2,901,916 | ) | (3,030,040 | ) | ||||
Share transactions–net: | ||||||||
Class A | (2,243,589 | ) | (13,815,022 | ) | ||||
Class B | (2,641,008 | ) | (3,577,292 | ) | ||||
Class C | 2,900,630 | (1,390,767 | ) | |||||
Class R | 145,344 | (45,138 | ) | |||||
Class Y | 2,202,871 | 92,773 | ||||||
Class R5 | 1,425,061 | 744,793 | ||||||
Net increase (decrease) in net assets resulting from share transactions | 1,789,309 | (17,990,653 | ) | |||||
Net increase (decrease) in net assets | 35,952,464 | (4,202,300 | ) | |||||
Net assets: | ||||||||
Beginning of year | 130,571,059 | 134,773,359 | ||||||
End of year (includes undistributed net investment income of $1,380,057 and $1,294,653, respectively) | $ | 166,523,523 | $ | 130,571,059 | ||||
Notes to Financial Statements
December 31, 2013
NOTE 1—Significant Accounting Policies
Invesco Global Low Volatility Equity Yield Fund (the “Fund”), formerly Invesco Global Quantitative Core Fund, is a series portfolio of AIM Growth Series (Invesco Growth Series) (the “Trust”). The Trust is organized as a Delaware statutory trust and is registered under the Investment Company Act of 1940, as amended (the “1940 Act”), as an open-end series management investment company consisting of fifteen separate series portfolios, each authorized to issue an unlimited number of shares of beneficial interest. The assets, liabilities and operations of each portfolio are accounted for separately. Information presented in these financial statements pertains only to the Fund. Matters affecting each portfolio or class will be voted on exclusively by the shareholders of such portfolio or class.
The Fund’s investment objective is income and long-term growth of capital.
The Fund currently consists of six different classes of shares: Class A, Class B, Class C, Class R, Class Y and Class R5. Class A shares are sold with a front-end sales charge unless certain waiver criteria are met and under certain circumstances load waived shares may be subject to contingent deferred sales charges (“CDSC”). Class C shares are sold with a CDSC. Class R, Class Y and Class R5 shares are sold at net asset value. Effective November 30, 2010, new or additional investments in Class B shares are no longer permitted. Existing shareholders of Class B shares may continue to reinvest dividends and capital gains distributions in Class B shares until they convert to Class A shares. Also, shareholders in Class B shares will be able to exchange those shares for Class B shares of other Invesco Funds offering such shares until they convert to Class A shares. Generally, Class B shares will automatically convert to Class A shares on or about the month-end, which is at least eight years after the date of purchase. Redemption of Class B shares prior to the conversion date will be subject to a CDSC.
The following is a summary of the significant accounting policies followed by the Fund in the preparation of its financial statements.
| A. | Security Valuations — Securities, including restricted securities, are valued according to the following policy. |
A security listed or traded on an exchange (except convertible bonds) is valued at its last sales price or official closing price as of the close of the customary trading session on the exchange where the security is principally traded, or lacking any sales or official closing price on a particular day, the security may be valued at the closing bid price on that day. Securities traded in the over-the-counter market are valued based on prices furnished by independent pricing services or market makers. When such securities are valued by an independent pricing service they may be considered fair valued. Futures contracts are valued at the final settlement price set by an exchange on which they are principally traded. Listed options are valued at
13 Invesco Global Low Volatility Equity Yield Fund
the mean between the last bid and ask prices from the exchange on which they are principally traded. Options not listed on an exchange are valued by an independent source at the mean between the last bid and ask prices. For purposes of determining net asset value per share, futures and option contracts generally are valued 15 minutes after the close of the customary trading session of the New York Stock Exchange (“NYSE”).
Investments in open-end and closed-end registered investment companies that do not trade on an exchange are valued at the end of day net asset value per share. Investments in open-end and closed-end registered investment companies that trade on an exchange are valued at the last sales price or official closing price as of the close of the customary trading session on the exchange where the security is principally traded.
Debt obligations (including convertible bonds) and unlisted equities are fair valued using an evaluated quote provided by an independent pricing service. Evaluated quotes provided by the pricing service may be determined without exclusive reliance on quoted prices, and may reflect appropriate factors such as institution-size trading in similar groups of securities, developments related to specific securities, dividend rate (for unlisted equities), yield (for debt obligations), quality, type of issue, coupon rate (for debt obligations), maturity (for debt obligations), individual trading characteristics and other market data. Debt obligations are subject to interest rate and credit risks. In addition, all debt obligations involve some risk of default with respect to interest and/or principal payments.
Foreign securities’ (including foreign exchange contracts) prices are converted into U.S. dollar amounts using the applicable exchange rates as of the close of the NYSE. If market quotations are available and reliable for foreign exchange-traded equity securities, the securities will be valued at the market quotations. Because trading hours for certain foreign securities end before the close of the NYSE, closing market quotations may become unreliable. If between the time trading ends on a particular security and the close of the customary trading session on the NYSE, events occur that the Adviser determines are significant and make the closing price unreliable, the Fund may fair value the security. If the event is likely to have affected the closing price of the security, the security will be valued at fair value in good faith using procedures approved by the Board of Trustees. Adjustments to closing prices to reflect fair value may also be based on a screening process of an independent pricing service to indicate the degree of certainty, based on historical data, that the closing price in the principal market where a foreign security trades is not the current value as of the close of the NYSE. Foreign securities’ prices meeting the approved degree of certainty that the price is not reflective of current value will be priced at the indication of fair value from the independent pricing service. Multiple factors may be considered by the independent pricing service in determining adjustments to reflect fair value and may include information relating to sector indices, American Depositary Receipts and domestic and foreign index futures. Foreign securities may have additional risks including exchange rate changes, potential for sharply devalued currencies and high inflation, political and economic upheaval, the relative lack of issuer information, relatively low market liquidity and the potential lack of strict financial and accounting controls and standards.
Securities for which market prices are not provided by any of the above methods may be valued based upon quotes furnished by independent sources. The last bid price may be used to value equity securities. The mean between the last bid and asked prices is used to value debt obligations, including corporate loans.
Securities for which market quotations are not readily available or became unreliable are valued at fair value as determined in good faith by or under the supervision of the Trust’s officers following procedures approved by the Board of Trustees. Issuer specific events, market trends, bid/ask quotes of brokers and information providers and other market data may be reviewed in the course of making a good faith determination of a security’s fair value.
Valuations change in response to many factors including the historical and prospective earnings of the issuer, the value of the issuer’s assets, general economic conditions, interest rates, investor perceptions and market liquidity. Because of the inherent uncertainties of valuation, the values reflected in the financial statements may materially differ from the value received upon actual sale of those investments.
| B. | Securities Transactions and Investment Income — Securities transactions are accounted for on a trade date basis. Realized gains or losses on sales are computed on the basis of specific identification of the securities sold. Interest income is recorded on the accrual basis from settlement date. Dividend income (net of withholding tax, if any) is recorded on the ex-dividend date. |
The Fund may periodically participate in litigation related to Fund investments. As such, the Fund may receive proceeds from litigation settlements. Any proceeds received are included in the Statement of Operations as realized gain (loss) for investments no longer held and as unrealized gain (loss) for investments still held.
Brokerage commissions and mark ups are considered transaction costs and are recorded as an increase to the cost basis of securities purchased and/or a reduction of proceeds on a sale of securities. Such transaction costs are included in the determination of net realized and unrealized gain (loss) from investment securities reported in the Statement of Operations and the Statement of Changes in Net Assets and the net realized and unrealized gains (losses) on securities per share in the Financial Highlights. Transaction costs are included in the calculation of the Fund’s net asset value and, accordingly, they reduce the Fund’s total returns. These transaction costs are not considered operating expenses and are not reflected in net investment income reported in the Statement of Operations and Statement of Changes in Net Assets, or the net investment income per share and ratios of expenses and net investment income reported in the Financial Highlights, nor are they limited by any expense limitation arrangements between the Fund and the investment adviser.
The Fund allocates income and realized and unrealized capital gains and losses to a class based on the relative net assets of each class.
| C. | Country Determination — For the purposes of making investment selection decisions and presentation in the Schedule of Investments, the investment adviser may determine the country in which an issuer is located and/or credit risk exposure based on various factors. These factors include the laws of the country under which the issuer is organized, where the issuer maintains a principal office, the country in which the issuer derives 50% or more of its total revenues and the country that has the primary market for the issuer’s securities, as well as other criteria. Among the other criteria that may be evaluated for making this determination are the country in which the issuer maintains 50% or more of its assets, the type of security, financial guarantees and enhancements, the nature of the collateral and the sponsor organization. Country of issuer and/or credit risk exposure has been determined to be the United States of America, unless otherwise noted. |
| D. | Distributions — Distributions from income and net realized capital gain, if any, are generally declared and paid annually and recorded on the ex-dividend date. The Fund may elect to treat a portion of the proceeds from redemptions as distributions for federal income tax purposes. |
| E. | Federal Income Taxes — The Fund intends to comply with the requirements of Subchapter M of the Internal Revenue Code of 1986, as amended (the “Internal Revenue Code”), necessary to qualify as a regulated investment company and to distribute substantially all of the Fund’s taxable earnings to shareholders. As such, the Fund will not be subject to federal income taxes on otherwise taxable income (including net realized capital gain) that is distributed to shareholders. Therefore, no provision for federal income taxes is recorded in the financial statements. |
14 Invesco Global Low Volatility Equity Yield Fund
The Fund files tax returns in the U.S. Federal jurisdiction and certain other jurisdictions. Generally, the Fund is subject to examinations by such taxing authorities for up to three years after the filing of the return for the tax period.
| F. | Expenses — Fees provided for under the Rule 12b-1 plan of a particular class of the Fund are charged to the operations of such class. Transfer agency fees and expenses and other shareholder recordkeeping fees and expenses attributable to Class R5 are charged to such class. Transfer agency fees and expenses and other shareholder recordkeeping fees and expenses relating to all other classes are allocated among those classes based on relative net assets. All other expenses are allocated among the classes based on relative net assets. |
| G. | Accounting Estimates — The preparation of financial statements in conformity with accounting principles generally accepted in the United States of America (“GAAP”) requires management to make estimates and assumptions that affect the reported amounts of assets and liabilities at the date of the financial statements and the reported amounts of revenues and expenses during the reporting period including estimates and assumptions related to taxation. Actual results could differ from those estimates by a significant amount. In addition, the Fund monitors for material events or transactions that may occur or become known after the period-end date and before the date the financial statements are released to print. |
| H. | Indemnifications — Under the Trust’s organizational documents, each Trustee, officer, employee or other agent of the Trust is indemnified against certain liabilities that may arise out of the performance of their duties to the Fund. Additionally, in the normal course of business, the Fund enters into contracts, including the Fund’s servicing agreements, that contain a variety of indemnification clauses. The Fund’s maximum exposure under these arrangements is unknown as this would involve future claims that may be made against the Fund that have not yet occurred. The risk of material loss as a result of such indemnification claims is considered remote. |
| I. | Securities Lending — The Fund may lend portfolio securities having a market value up to one-third of the Fund’s total assets. Such loans are secured by collateral equal to no less than the market value of the loaned securities determined daily by the securities lending provider. Such collateral will be cash or debt securities issued or guaranteed by the U.S. Government or any of its sponsored agencies. Cash collateral received in connection with these loans is invested in short-term money market instruments or affiliated money market funds and is shown as such on the Schedule of Investments. It is the Fund’s policy to obtain additional collateral from or return excess collateral to the borrower by the end of the next business day, following the valuation date of the securities loaned. Therefore, the value of the collateral held may be temporarily less than the value of the securities on loan. Lending securities entails a risk of loss to the Fund if, and to the extent that, the market value of the securities loaned were to increase and the borrower did not increase the collateral accordingly, and the borrower failed to return the securities. Upon the failure of the borrower to return the securities, collateral may be liquidated and the securities may be purchased on the open market to replace the loaned securities. The Fund could experience delays and costs in gaining access to the collateral. The Fund bears the risk of any deficiency in the amount of the collateral available for return to the borrower due to any loss on the collateral invested. Dividends received on cash collateral investments for securities lending transactions, which are net of compensation to counterparties, is included in Dividends from affiliated money market funds on the Statement of Operations. The aggregate value of securities out on loan is shown as a footnote on the Statement of Assets and Liabilities, if any. |
| J. | Foreign Currency Translations — Foreign currency is valued at the close of the NYSE based on quotations posted by banks and major currency dealers. Portfolio securities and other assets and liabilities denominated in foreign currencies are translated into U.S. dollar amounts at date of valuation. Purchases and sales of portfolio securities (net of foreign taxes withheld on disposition) and income items denominated in foreign currencies are translated into U.S. dollar amounts on the respective dates of such transactions. The Fund does not separately account for the portion of the results of operations resulting from changes in foreign exchange rates on investments and the fluctuations arising from changes in market prices of securities held. The combined results of changes in foreign exchange rates and the fluctuation of market prices on investments (net of estimated foreign tax withholding) are included with the net realized and unrealized gain or loss from investments in the Statement of Operations. Reported net realized foreign currency gains or losses arise from (1) sales of foreign currencies, (2) currency gains or losses realized between the trade and settlement dates on securities transactions, and (3) the difference between the amounts of dividends, interest, and foreign withholding taxes recorded on the Fund’s books and the U.S. dollar equivalent of the amounts actually received or paid. Net unrealized foreign currency gains and losses arise from changes in the fair values of assets and liabilities, other than investments in securities at fiscal period end, resulting from changes in exchange rates. |
The Fund may invest in foreign securities which may be subject to foreign taxes on income, gains on investments or currency repatriation, a portion of which may be recoverable.
| K. | Forward Foreign Currency Contracts — The Fund may enter into forward foreign currency contracts to manage or minimize currency or exchange rate risk. The Fund may also enter into forward foreign currency contracts for the purchase or sale of a security denominated in a foreign currency in order to “lock in” the U.S. dollar price of that security. A forward foreign currency contract is an obligation to purchase or sell a specific currency for an agreed-upon price at a future date. The use of forward foreign currency contracts does not eliminate fluctuations in the price of the underlying securities the Fund owns or intends to acquire but establishes a rate of exchange in advance. Fluctuations in the value of these contracts are measured by the difference in the contract date and reporting date exchange rates and are recorded as unrealized appreciation (depreciation) until the contracts are closed. When the contracts are closed, realized gains (losses) are recorded. Realized and unrealized gains (losses) on the contracts are included in the Statement of Operations. The primary risks associated with forward foreign currency contracts include failure of the counterparty to meet the terms of the contract and the value of the foreign currency changing unfavorably. These risks may be in excess of the amounts reflected in the Statement of Assets and Liabilities. |
| L. | Futures Contracts — The Fund may enter into futures contracts to manage exposure to interest rate, equity and market price movements and/or currency risks. A futures contract is an agreement between two parties to purchase or sell a specified underlying security, currency or commodity (or delivery of a cash settlement price, in the case of an index future) for a fixed price at a future date. The Fund currently invests only in exchange-traded futures and they are standardized as to maturity date and underlying financial instrument. Initial margin deposits required upon entering into futures contracts are satisfied by the segregation of specific securities or cash as collateral at the futures commission merchant (broker). During the period the futures contracts are open, changes in the value of the contracts are recognized as unrealized gains or losses by recalculating the value of the contracts on a daily basis. Subsequent or variation margin payments are received or made depending upon whether unrealized gains or losses are incurred. These amounts are reflected as receivables or payables on the Statement of Assets and Liabilities. When the contracts are closed or expire, the Fund recognizes a realized gain or loss equal to the difference between the proceeds |
15 Invesco Global Low Volatility Equity Yield Fund
| from, or cost of, the closing transaction and the Fund’s basis in the contract. The net realized gain (loss) and the change in unrealized gain (loss) on futures contracts held during the period is included on the Statement of Operations. The primary risks associated with futures contracts are market risk and the absence of a liquid secondary market. If the Fund were unable to liquidate a futures contract and/or enter into an offsetting closing transaction, the Fund would continue to be subject to market risk with respect to the value of the contracts and continue to be required to maintain the margin deposits on the futures contracts. Futures contracts have minimal counterparty risk since the exchange’s clearinghouse, as counterparty to all exchange-traded futures, guarantees the futures against default. Risks may exceed amounts recognized in the Statement of Assets and Liabilities. |
| M. | Collateral — To the extent the Fund has pledged or segregated a security as collateral and that security is subsequently sold, it is the Fund’s practice to replace such collateral no later than the next business day. This practice does not apply to securities pledged as collateral for securities lending transactions. |
NOTE 2—Advisory Fees and Other Fees Paid to Affiliates
The Trust has entered into a master investment advisory agreement with Invesco Advisers, Inc. (the “Adviser” or “Invesco”). Under the terms of the investment advisory agreement, the Fund pays an advisory fee to the Adviser based on the annual rate of the Fund’s average daily net assets as follows:
| Average Daily Net Assets | Rate | |||
First $250 million | 0.80% | |||
Next $250 million | 0.78% | |||
Next $500 million | 0.76% | |||
Next $1.5 billion | 0.74% | |||
Next $2.5 billion | 0.72% | |||
Next $2.5 billion | 0.70% | |||
Next $2.5 billion | 0.68% | |||
Over $10 billion | 0.66% | |||
Under the terms of a master sub-advisory agreement between the Adviser and each of Invesco Asset Management Deutschland GmbH, Invesco Asset Management Limited, Invesco Asset Management (Japan) Limited, Invesco Australia Limited, Invesco Hong Kong Limited, Invesco Senior Secured Management, Inc. and Invesco Canada Ltd. (collectively, the “Affiliated Sub-Advisers”) the Adviser, not the Fund, may pay 40% of the fees paid to the Adviser to any such Affiliated Sub-Adviser(s) that provide(s) discretionary investment management services to the Fund based on the percentage of assets allocated to such Sub-Adviser(s).
The Adviser has contractually agreed, through at least June 30, 2014, to waive advisory fees and/or reimburse expenses of all shares to the extent necessary to limit total annual fund operating expenses after fee waiver and/or expense reimbursement (excluding certain items discussed below) of Class A, Class B, Class C, Class R, Class Y and Class R5 shares to 2.25%, 3.00%, 3.00%, 2.50%, 2.00% and 2.00%, respectively, of average daily net assets. In determining the Adviser’s obligation to waive advisory fees and/or reimburse expenses, the following expenses are not taken into account, and could cause the total annual fund operating expenses after fee waiver and/or expense reimbursement to exceed the numbers reflected above: (1) interest; (2) taxes; (3) dividend expense on short sales; (4) extraordinary or non-routine items, including litigation expenses; and (5) expenses that the Fund has incurred but did not actually pay because of an expense offset arrangement. Unless Invesco continues the fee waiver agreement, it will terminate on June 30, 2014. The fee waiver agreement cannot be terminated during its term. The Adviser did not waive fees and/or reimburse expenses during the period under the expense limitation.
Further, the Adviser has contractually agreed, through at least April 30, 2015, to waive the advisory fee payable by the Fund in an amount equal to 100% of the net advisory fees the Adviser receives from the affiliated money market funds on investments by the Fund of uninvested cash (excluding investments of cash collateral from securities lending) in such affiliated money market funds.
For the year ended December 31, 2013, the Adviser waived advisory fees of $4,551.
The Trust has entered into a master administrative services agreement with Invesco pursuant to which the Fund has agreed to pay Invesco for certain administrative costs incurred in providing accounting services to the Fund. For the year ended December 31, 2013, expenses incurred under the agreement are shown in the Statement of Operations as Administrative services fees.
The Trust has entered into a transfer agency and service agreement with Invesco Investment Services, Inc. (“IIS”) pursuant to which the Fund has agreed to pay IIS a fee for providing transfer agency and shareholder services to the Fund and reimburse IIS for certain expenses incurred by IIS in the course of providing such services. IIS may make payments to intermediaries that provide omnibus account services, sub-accounting services and/or networking services. All fees payable by IIS to intermediaries that provide omnibus account services or sub-accounting are charged back to the Fund, subject to certain limitations approved by the Trust’s Board of Trustees. For the year ended December 31, 2013, expenses incurred under the agreement are shown in the Statement of Operations as Transfer agent fees.
The Trust has entered into master distribution agreements with Invesco Distributors, Inc. (“IDI”) to serve as the distributor for the Class A, Class B, Class C, Class R, Class Y and Class R5 shares of the Fund. The Trust has adopted plans pursuant to Rule 12b-1 under the 1940 Act with respect to the Fund’s Class A, Class B, Class C and Class R shares (collectively, the “Plans”). The Fund, pursuant to the Plans, pays IDI compensation at the annual rate of 0.25% of the Fund’s average daily net assets of Class A shares, 1.00% of the average daily net assets of Class B and Class C shares and 0.50% of the average daily net assets of Class R shares. Of the Plan payments, up to 0.25% of the average daily net assets of each class of shares may be paid to furnish continuing personal shareholder services to customers who purchase and own shares of such classes. Any amounts not paid as a service fee under the Plans would constitute an asset-based sales charge. Rules of the Financial Industry Regulatory Authority (“FINRA”) impose a cap on the total sales charges, including asset-based sales charges, that may be paid by any class of shares of the Fund. For the year ended December 31, 2013, expenses incurred under the Plans are shown in the Statement of Operations as Distribution fees.
16 Invesco Global Low Volatility Equity Yield Fund
Front-end sales commissions and CDSC (collectively, the “sales charges”) are not recorded as expenses of the Fund. Front-end sales commissions are deducted from proceeds from the sales of Fund shares prior to investment in Class A shares of the Fund. CDSC are deducted from redemption proceeds prior to remittance to the shareholder. During the year ended December 31, 2013, IDI advised the Fund that IDI retained $26,331 in front-end sales commissions from the sale of Class A shares and $57, $3,347 and $822 from Class A, Class B and Class C shares, respectively, for CDSC imposed on redemptions by shareholders.
Certain officers and trustees of the Trust are officers and directors of the Adviser, IIS and/or IDI.
NOTE 3—Additional Valuation Information
GAAP defines fair value as the price that would be received to sell an asset or paid to transfer a liability in an orderly transaction between market participants at the measurement date, under current market conditions. GAAP establishes a hierarchy that prioritizes the inputs to valuation methods, giving the highest priority to readily available unadjusted quoted prices in an active market for identical assets (Level 1) and the lowest priority to significant unobservable inputs (Level 3), generally when market prices are not readily available or are unreliable. Based on the valuation inputs, the securities or other investments are tiered into one of three levels. Changes in valuation methods may result in transfers in or out of an investment’s assigned level:
| Level 1 — | Prices are determined using quoted prices in an active market for identical assets. |
| Level 2 — | Prices are determined using other significant observable inputs. Observable inputs are inputs that other market participants may use in pricing a security. These may include quoted prices for similar securities, interest rates, prepayment speeds, credit risk, yield curves, loss severities, default rates, discount rates, volatilities and others. |
| Level 3 — | Prices are determined using significant unobservable inputs. In situations where quoted prices or observable inputs are unavailable (for example, when there is little or no market activity for an investment at the end of the period), unobservable inputs may be used. Unobservable inputs reflect the Fund’s own assumptions about the factors market participants would use in determining fair value of the securities or instruments and would be based on the best available information. |
The following is a summary of the tiered valuation input levels, as of December 31, 2013. The level assigned to the securities valuations may not be an indication of the risk or liquidity associated with investing in those securities. Because of the inherent uncertainties of valuation, the values reflected in the financial statements may materially differ from the value received upon actual sale of those investments.
During the year ended December 31, 2013, there were transfers from Level 2 to Level 1 of $11,821,911, due to foreign fair value adjustments.
| Level 1 | Level 2 | Level 3 | Total | |||||||||||||
Australia | $ | 7,782,329 | $ | 16,685,192 | $ | — | $ | 24,467,521 | ||||||||
Austria | — | 990,468 | — | 990,468 | ||||||||||||
Belgium | 3,198,664 | — | — | 3,198,664 | ||||||||||||
Canada | 17,059,856 | — | — | 17,059,856 | ||||||||||||
Denmark | 3,125,123 | 2,221,385 | — | 5,346,508 | ||||||||||||
France | — | 3,127,746 | — | 3,127,746 | ||||||||||||
Germany | — | 4,740,534 | — | 4,740,534 | ||||||||||||
Israel | 2,709,374 | — | — | 2,709,374 | ||||||||||||
Japan | 233,403 | 2,873,291 | — | 3,106,694 | ||||||||||||
Netherlands | 1,022,437 | — | — | 1,022,437 | ||||||||||||
New Zealand | 2,983,273 | — | — | 2,983,273 | ||||||||||||
Norway | — | 3,908,811 | — | 3,908,811 | ||||||||||||
Singapore | — | 862,778 | — | 862,778 | ||||||||||||
Spain | — | 3,337,118 | — | 3,337,118 | ||||||||||||
Sweden | — | 9,326,679 | — | 9,326,679 | ||||||||||||
Switzerland | — | 2,952,413 | — | 2,952,413 | ||||||||||||
United Kingdom | 4,491,869 | 17,187,043 | — | 21,678,912 | ||||||||||||
United States | 53,114,134 | — | — | 53,114,134 | ||||||||||||
| $ | 95,720,462 | $ | 68,213,458 | $ | — | $ | 163,933,920 | |||||||||
Futures* | 145,810 | — | — | 145,810 | ||||||||||||
Total Investments | $ | 95,866,272 | $ | 68,213,458 | $ | — | $ | 164,079,730 | ||||||||
| * | Unrealized appreciation. |
17 Invesco Global Low Volatility Equity Yield Fund
NOTE 4—Derivative Investments
Value of Derivative Investments at Period-End
The table below summarizes the value of the Fund’s derivative investments, detailed by primary risk exposure, held as of December 31, 2013:
| Value | ||||||||
| Risk Exposure/Derivative Type | Assets | Liabilities | ||||||
Market risk | ||||||||
Futures contracts(a) | $ | 145,810 | $ | — | ||||
| (a) | Includes cumulative appreciation of futures contracts. Only current day’s variation margin receivable is reported within the Statement of Assets and Liabilities. |
Effect of Derivative Investments for the year ended December 31, 2013
The table below summarizes the gains on derivative investments, detailed by primary risk exposure, recognized in earnings during the period:
| Location of Gain on Statement of Operations | ||||
| Futures Contracts* | ||||
Realized Gain | ||||
Market risk | $ | 707,280 | ||
Change in Unrealized Appreciation | ||||
Market risk | 144,197 | |||
Total | $ | 851,477 | ||
| * | The average notional value of futures contracts outstanding during the period was $3,520,476. |
| Open Futures Contracts at Period-End* | ||||||||||||||||||||
Futures Contracts | Type of Contract | Number of Contracts | Expiration Month | Notional Value | Unrealized Appreciation | |||||||||||||||
CME E-Mini S&P 500 Index | Long | 22 | March-2014 | $ | 2,025,210 | $ | 74,663 | |||||||||||||
Dow Jones EURO STOXX 50 Index | Long | 23 | March-2014 | 983,477 | 44,365 | |||||||||||||||
FTSE 100 Index | Long | 3 | March-2014 | 332,732 | 12,134 | |||||||||||||||
SGX NIKKEI 225 Index | Long | 5 | March-2014 | 385,958 | 14,648 | |||||||||||||||
Total Futures Contracts | $ | 145,810 | ||||||||||||||||||
| * | Futures contracts collateralized by $200,829 cash held with Merrill Lynch & Co., Inc. |
Offsetting Assets and Liabilities
Effective with the beginning of the Fund’s fiscal year, the Fund has adopted Accounting Standards Update (“ASU”) No. 2011-11, Disclosures about Offsetting Assets and Liabilities, which was subsequently clarified in Financial Accounting Standards Board ASU 2013-01 “Clarifying the Scope of Disclosures about Offsetting Assets and Liabilities”. This update is intended to enhance disclosures about financial instruments and derivative instruments that are subject to offsetting on the Statement of Assets and Liabilities and to enable investors to better understand the effect of those arrangements on its financial position. In order for an arrangement to be eligible for netting, the Fund must have a basis to conclude that such netting arrangements are legally enforceable. The Fund enters into netting agreements and collateral agreements in an attempt to reduce the Fund’s counterparty credit risk by providing for a single net settlement with a counterparty of all financial transactions covered by the agreement in an event of default as defined under such agreement.
There were no derivative instruments subject to a netting agreement for which the Fund is not currently netting. The following tables present derivative instruments that are either subject to an enforceable netting agreement or offset by collateral arrangements as of December 31, 2013.
| Assets: | ||||||||||||||||||||||||
Gross amounts
| Gross amounts
| Net amounts of assets
| Collateral Received | |||||||||||||||||||||
| Counterparty | Financial Instruments | Cash | Net Amount | |||||||||||||||||||||
Merrill Lynch & Co., Inc. | $ | 145,810 | $ | — | $ | 145,810 | $ | — | $ | — | $ | 145,810 | ||||||||||||
| * | Includes cumulative appreciation of futures contracts. |
NOTE 5—Expense Offset Arrangement(s)
The expense offset arrangements is comprised of transfer agency credits which result from balances in demand deposit accounts used by the transfer agent for clearing shareholder transactions. For the year ended December 31, 2013, the Fund received credits from this arrangement, which resulted in the reduction of the Fund’s total expenses of $1,091.
18 Invesco Global Low Volatility Equity Yield Fund
NOTE 6—Trustees’ and Officers’ Fees and Benefits
Trustees’ and Officers’ Fees and Benefits include amounts accrued by the Fund to pay remuneration to certain Trustees and Officers of the Fund. Trustees have the option to defer compensation payable by the Fund, and Trustees’ and Officers’ Fees and Benefits also include amounts accrued by the Fund to fund such deferred compensation amounts. Those Trustees who defer compensation have the option to select various Invesco Funds in which their deferral accounts shall be deemed to be invested. Finally, certain current Trustees were eligible to participate in a retirement plan that provided for benefits to be paid upon retirement to Trustees over a period of time based on the number of years of service. The Fund may have certain former Trustees who also participate in a retirement plan and receive benefits under such plan. Trustees’ and Officers’ Fees and Benefits include amounts accrued by the Fund to fund such retirement benefits. Obligations under the deferred compensation and retirement plans represent unsecured claims against the general assets of the Fund.
NOTE 7—Cash Balances
The Fund is permitted to temporarily carry a negative or overdrawn balance in its account with State Street Bank and Trust Company, the custodian bank. Such balances, if any at period end, are shown in the Statement of Assets and Liabilities under the payable caption Amount due custodian. To compensate the custodian bank for such overdrafts, the overdrawn Fund may either (1) leave funds as a compensating balance in the account so the custodian bank can be compensated by earning the additional interest; or (2) compensate by paying the custodian bank at a rate agreed upon by the custodian bank and Invesco, not to exceed the contractually agreed upon rate.
NOTE 8—Distributions to Shareholders and Tax Components of Net Assets
Tax Character of Distributions to Shareholders Paid During the Years Ended December 31, 2013 and 2012:
| 2013 | 2012 | |||||||
Ordinary income | $ | 2,901,916 | $ | 3,030,040 | ||||
Tax Components of Net Assets at Period-End:
| 2013 | ||||
Undistributed ordinary income | $ | 1,460,909 | ||
Net unrealized appreciation — investments | 20,869,072 | |||
Net unrealized appreciation — other investments | 32,118 | |||
Temporary book/tax differences | (80,852 | ) | ||
Capital loss carryforward | (83,534,585 | ) | ||
Shares of beneficial interest | 227,776,861 | |||
Total net assets | $ | 166,523,523 | ||
The difference between book-basis and tax-basis unrealized appreciation (depreciation) is due to differences in the timing of recognition of gains and losses on investments for tax and book purposes. The Fund’s net unrealized appreciation difference is attributable primarily to wash sales.
The temporary book/tax differences are a result of timing differences between book and tax recognition of income and/or expenses. The Fund’s temporary book/tax differences are the result of the trustee deferral of compensation and retirement plan benefits.
Capital loss carryforward is calculated and reported as of a specific date. Results of transactions and other activity after that date may affect the amount of capital loss carryforward actually available for the Fund to utilize. Capital losses generated in years beginning after December 22, 2010 can be carried forward for an unlimited period, whereas previous losses expire in 8 tax years. Capital losses with an expiration period may not be used to offset capital gains until all net capital losses without an expiration date have been utilized. Capital loss carryforwards with no expiration date will retain their character as either short-term or long-term capital losses instead of as short-term capital losses as under prior law. The ability to utilize capital loss carryforward in the future may be limited under the Internal Revenue Code and related regulations based on the results of future transactions.
The Fund utilized $23,071,244 of capital loss carryforward in the current period to offset net realized capital gain for federal income tax purposes. The Fund has a capital loss carryforward as of December 31, 2013, which expires as follows:
| Capital Loss Carryforward* | ||||||||||||
| Expiration | Short-Term | Long-Term | Total | |||||||||
December 31, 2016 | $ | 18,198,191 | $ | — | $ | 18,198,191 | ||||||
December 31, 2017 | 65,336,394 | — | 65,336,394 | |||||||||
| $ | 83,534,585 | $ | — | $ | 83,534,585 | |||||||
| * | Capital loss carryforward as of the date listed above is reduced for limitations, if any, to the extent required by the Internal Revenue Code and may be further limited depending upon a variety of factors, including the realization of net unrealized gains or losses as of the date of any reorganization. |
19 Invesco Global Low Volatility Equity Yield Fund
NOTE 9—Investment Securities
The aggregate amount of investment securities (other than short-term securities, U.S. Treasury obligations and money market funds, if any) purchased and sold by the Fund during the year ended December 31, 2013 was $144,714,414 and $145,451,025, respectively. Cost of investments on a tax basis includes the adjustments for financial reporting purposes as of the most recently completed federal income tax reporting period-end.
| Unrealized Appreciation (Depreciation) of Investment Securities on a Tax Basis | ||||
Aggregate unrealized appreciation of investment securities | $ | 23,090,198 | ||
Aggregate unrealized (depreciation) of investment securities | (2,221,126 | ) | ||
Net unrealized appreciation of investment securities | $ | 20,869,072 | ||
Cost of investments for tax purposes is $143,064,848.
NOTE 10—Reclassification of Permanent Differences
Primarily as a result of differing book/tax treatment of foreign currency transactions, on December 31, 2013, undistributed net investment income was decreased by $89,519 and undistributed net realized gain (loss) was increased by $89,519. This reclassification had no effect on the net assets of the Fund.
NOTE 11—Share Information
| Summary of Share Activity | ||||||||||||||||
| Years ended December 31, | ||||||||||||||||
| 2013(a) | 2012 | |||||||||||||||
| Shares | Amount | Shares | Amount | |||||||||||||
Sold: | ||||||||||||||||
Class A | 892,170 | $ | 12,035,616 | 368,099 | $ | 4,066,079 | ||||||||||
Class B | 24,692 | 304,057 | 10,485 | 108,689 | ||||||||||||
Class C | 351,333 | 4,604,503 | 72,073 | 741,753 | ||||||||||||
Class R | 26,323 | 339,649 | 29,398 | 324,738 | ||||||||||||
Class Y | 212,216 | 2,976,469 | 36,805 | 412,000 | ||||||||||||
Class R5 | 126,716 | 1,700,052 | 67,297 | 741,549 | ||||||||||||
Issued as reinvestment of dividends: | ||||||||||||||||
Class A | 143,650 | 1,985,952 | 184,798 | 2,086,372 | ||||||||||||
Class B | 6,337 | 82,922 | 8,369 | 89,799 | ||||||||||||
Class C | 11,871 | 155,209 | 10,876 | 116,589 | ||||||||||||
Class R | 1,645 | 22,777 | 1,707 | 19,325 | ||||||||||||
Class Y | 1,861 | 25,810 | 1,584 | 17,882 | ||||||||||||
Class R5 | 18,617 | 260,831 | 47,940 | 546,510 | ||||||||||||
Automatic conversion of Class B shares to Class A shares: | ||||||||||||||||
Class A | 150,788 | 1,971,696 | 188,753 | 2,096,605 | ||||||||||||
Class B | (159,168 | ) | (1,971,696 | ) | (199,936 | ) | (2,096,605 | ) | ||||||||
Reacquired: | ||||||||||||||||
Class A | (1,395,884 | ) | (18,236,853 | ) | (1,998,868 | ) | (22,064,078 | ) | ||||||||
Class B | (86,959 | ) | (1,056,291 | ) | (161,806 | ) | (1,679,175 | ) | ||||||||
Class C | (151,961 | ) | (1,859,082 | ) | (217,409 | ) | (2,249,109 | ) | ||||||||
Class R | (16,103 | ) | (217,082 | ) | (35,802 | ) | (389,201 | ) | ||||||||
Class Y | (61,331 | ) | (799,408 | ) | (30,120 | ) | (337,109 | ) | ||||||||
Class R5 | (40,140 | ) | (535,822 | ) | (48,677 | ) | (543,266 | ) | ||||||||
Net increase (decrease) in share activity | 56,673 | $ | 1,789,309 | (1,664,434 | ) | $ | (17,990,653 | ) | ||||||||
| (a) | There are entities that are record owners of more than 5% of the outstanding shares of the Fund and in the aggregate own 24% of the outstanding shares of the Fund. IDI has an agreement with these entities to sell Fund shares. The Fund, Invesco and/or Invesco affiliates may make payments to these entities, which are considered to be related to the Fund, for providing services to the Fund, Invesco and/or Invesco affiliates including but not limited to services such as securities brokerage, distribution, third party record keeping and account servicing. The Fund has no knowledge as to whether all or any portion of the shares owned of record by these entities are also owned beneficially. |
20 Invesco Global Low Volatility Equity Yield Fund
NOTE 12—Financial Highlights
The following schedule presents financial highlights for a share of the Fund outstanding throughout the periods indicated.
| Net asset value, beginning of period | Net investment income(a) | Net gains (losses) on securities (both realized and unrealized) | Total from investment operations | Dividends from net investment income | Net asset value, end of period(b) | Total return(c) | Net assets, end of period (000’s omitted) | Ratio of expenses to average net assets with fee waivers and/or expenses absorbed | Ratio of expenses to average net assets without fee waivers and/or expenses absorbed | Ratio of net investment income to average net assets | Portfolio turnover(d) | |||||||||||||||||||||||||||||||||||||
Class A |
| |||||||||||||||||||||||||||||||||||||||||||||||
Year ended 12/31/13 | $ | 11.38 | $ | 0.27 | $ | 3.05 | $ | 3.32 | $ | (0.26 | ) | $ | 14.44 | 29.32 | % | $ | 117,234 | 1.54 | %(e) | 1.54 | %(e) | 2.10 | %(e) | 103 | % | |||||||||||||||||||||||
Year ended 12/31/12 | 10.28 | 0.13 | 1.24 | 1.37 | (0.27 | ) | 11.38 | 13.32 | 94,785 | 1.63 | 1.63 | 1.21 | 72 | |||||||||||||||||||||||||||||||||||
Year ended 12/31/11 | 10.74 | 0.21 | (0.53 | ) | (0.32 | ) | (0.14 | ) | 10.28 | (2.98 | ) | 98,542 | 1.56 | 1.56 | 1.91 | 86 | ||||||||||||||||||||||||||||||||
Year ended 12/31/10 | 9.63 | 0.11 | 1.14 | 1.25 | (0.14 | ) | 10.74 | 13.00 | 124,102 | 1.61 | 1.61 | 1.09 | 74 | |||||||||||||||||||||||||||||||||||
Year ended 12/31/09 | 7.70 | 0.09 | 2.02 | 2.11 | (0.18 | ) | 9.63 | 27.47 | 138,058 | 1.66 | 1.66 | 1.13 | 72 | |||||||||||||||||||||||||||||||||||
Class B |
| |||||||||||||||||||||||||||||||||||||||||||||||
Year ended 12/31/13 | 10.81 | 0.16 | 2.89 | 3.05 | (0.20 | ) | 13.66 | 28.34 | 5,434 | 2.29 | (e) | 2.29 | (e) | 1.35 | (e) | 103 | ||||||||||||||||||||||||||||||||
Year ended 12/31/12 | 9.74 | 0.05 | 1.17 | 1.22 | (0.15 | ) | 10.81 | 12.53 | 6,626 | 2.38 | 2.38 | 0.46 | 72 | |||||||||||||||||||||||||||||||||||
Year ended 12/31/11 | 10.15 | 0.12 | (0.50 | ) | (0.38 | ) | (0.03 | ) | 9.74 | (3.74 | ) | 9,313 | 2.31 | 2.31 | 1.16 | 86 | ||||||||||||||||||||||||||||||||
Year ended 12/31/10 | 9.09 | 0.03 | 1.08 | 1.11 | (0.05 | ) | 10.15 | 12.18 | 14,370 | 2.36 | 2.36 | 0.34 | 74 | |||||||||||||||||||||||||||||||||||
Year ended 12/31/09 | 7.21 | 0.03 | 1.88 | 1.91 | (0.03 | ) | 9.09 | 26.50 | 19,741 | 2.41 | 2.41 | 0.38 | 72 | |||||||||||||||||||||||||||||||||||
Class C |
| |||||||||||||||||||||||||||||||||||||||||||||||
Year ended 12/31/13 | 10.79 | 0.17 | 2.89 | 3.06 | (0.19 | ) | 13.66 | 28.42 | 14,099 | 2.29 | (e) | 2.29 | (e) | 1.35 | (e) | 103 | ||||||||||||||||||||||||||||||||
Year ended 12/31/12 | 9.73 | 0.05 | 1.16 | 1.21 | (0.15 | ) | 10.79 | 12.44 | 8,864 | 2.38 | 2.38 | 0.46 | 72 | |||||||||||||||||||||||||||||||||||
Year ended 12/31/11 | 10.13 | 0.12 | (0.49 | ) | (0.37 | ) | (0.03 | ) | 9.73 | (3.65 | ) | 9,298 | 2.31 | 2.31 | 1.16 | 86 | ||||||||||||||||||||||||||||||||
Year ended 12/31/10 | 9.08 | 0.03 | 1.07 | 1.10 | (0.05 | ) | 10.13 | 12.09 | 11,535 | 2.36 | 2.36 | 0.34 | 74 | |||||||||||||||||||||||||||||||||||
Year ended 12/31/09 | 7.20 | 0.03 | 1.88 | 1.91 | (0.03 | ) | 9.08 | 26.54 | 13,008 | 2.41 | 2.41 | 0.38 | 72 | |||||||||||||||||||||||||||||||||||
Class R |
| |||||||||||||||||||||||||||||||||||||||||||||||
Year ended 12/31/13 | 11.41 | 0.25 | 3.05 | 3.30 | (0.25 | ) | 14.46 | 29.00 | 1,351 | 1.79 | (e) | 1.79 | (e) | 1.85 | (e) | 103 | ||||||||||||||||||||||||||||||||
Year ended 12/31/12 | 10.30 | 0.11 | 1.23 | 1.34 | (0.23 | ) | 11.41 | 13.01 | 931 | 1.88 | 1.88 | 0.96 | 72 | |||||||||||||||||||||||||||||||||||
Year ended 12/31/11 | 10.74 | 0.18 | (0.52 | ) | (0.34 | ) | (0.10 | ) | 10.30 | (3.13 | ) | 888 | 1.81 | 1.81 | 1.66 | 86 | ||||||||||||||||||||||||||||||||
Year ended 12/31/10 | 9.63 | 0.08 | 1.14 | 1.22 | (0.11 | ) | 10.74 | 12.68 | 1,146 | 1.86 | 1.86 | 0.84 | 74 | |||||||||||||||||||||||||||||||||||
Year ended 12/31/09 | 7.68 | 0.07 | 2.01 | 2.08 | (0.13 | ) | 9.63 | 27.14 | 875 | 1.91 | 1.91 | 0.88 | 72 | |||||||||||||||||||||||||||||||||||
Class Y |
| |||||||||||||||||||||||||||||||||||||||||||||||
Year ended 12/31/13 | 11.38 | 0.32 | 3.04 | 3.36 | (0.25 | ) | 14.49 | 29.63 | 3,176 | 1.29 | (e) | 1.29 | (e) | 2.35 | (e) | 103 | ||||||||||||||||||||||||||||||||
Year ended 12/31/12 | 10.29 | 0.16 | 1.23 | 1.39 | (0.30 | ) | 11.38 | 13.55 | 756 | 1.38 | 1.38 | 1.46 | 72 | |||||||||||||||||||||||||||||||||||
Year ended 12/31/11 | 10.76 | 0.24 | (0.54 | ) | (0.30 | ) | (0.17 | ) | 10.29 | (2.76 | ) | 599 | 1.31 | 1.31 | 2.16 | 86 | ||||||||||||||||||||||||||||||||
Year ended 12/31/10 | 9.65 | 0.13 | 1.15 | 1.28 | (0.17 | ) | 10.76 | 13.27 | 720 | 1.36 | 1.36 | 1.34 | 74 | |||||||||||||||||||||||||||||||||||
Year ended 12/31/09 | 7.71 | 0.12 | 2.01 | 2.13 | (0.19 | ) | 9.65 | 27.69 | 662 | 1.41 | 1.41 | 1.38 | 72 | |||||||||||||||||||||||||||||||||||
Class R5 |
| |||||||||||||||||||||||||||||||||||||||||||||||
Year ended 12/31/13 | 11.49 | 0.35 | 3.08 | 3.43 | (0.29 | ) | 14.63 | 29.99 | 25,230 | 1.02 | (e) | 1.02 | (e) | 2.62 | (e) | 103 | ||||||||||||||||||||||||||||||||
Year ended 12/31/12 | 10.39 | 0.20 | 1.25 | 1.45 | (0.35 | ) | 11.49 | 13.96 | 18,609 | 1.06 | 1.06 | 1.78 | 72 | |||||||||||||||||||||||||||||||||||
Year ended 12/31/11 | 10.88 | 0.28 | (0.54 | ) | (0.26 | ) | (0.23 | ) | 10.39 | (2.44 | ) | 16,133 | 0.98 | 0.98 | 2.49 | 86 | ||||||||||||||||||||||||||||||||
Year ended 12/31/10 | 9.77 | 0.17 | 1.17 | 1.34 | (0.23 | ) | 10.88 | 13.76 | 18,770 | 0.97 | 0.97 | 1.73 | 74 | |||||||||||||||||||||||||||||||||||
Year ended 12/31/09 | 7.81 | 0.16 | 2.06 | 2.22 | (0.26 | ) | 9.77 | 28.47 | 18,031 | 0.86 | 0.86 | 1.93 | 72 | |||||||||||||||||||||||||||||||||||
| (a) | Calculated using average shares outstanding. |
| (b) | Includes redemption fees added to shares of beneficial interest which were less than $0.005 per share for fiscal years prior to December 31, 2012. |
| (c) | Includes adjustments in accordance with accounting principles generally accepted in the United States of America and as such, the net asset value for financial reporting purposes and the returns based upon those net asset values may differ from the net asset value and returns for shareholder transactions. Does not include sales charges and is not annualized for periods less than one year, if applicable. |
| (d) | Portfolio turnover is calculated at the fund level and is not annualized for periods less than one year, if applicable. |
| (e) | Ratios are based on average daily net assets (000’s omitted) of $105,583, $6,053, $10,128, $1,214, $1,099 and $22,148 for Class A, Class B, Class C, Class R, Class Y and Class R5 shares, respectively. |
21 Invesco Global Low Volatility Equity Yield Fund
Report of Independent Registered Public Accounting Firm
To the Board of Trustees of AIM Growth Series (Invesco Funds Group)
and Shareholders of Invesco Global Low Volatility Equity Yield Fund:
In our opinion, the accompanying statement of assets and liabilities, including the schedule of investments, and the related statements of operations and of changes in net assets and the financial highlights present fairly, in all material respects, the financial position of Invesco Global Low Volatility Equity Yield Fund (formerly known as Invesco Global Quantitative Core Fund, one of the funds constituting AIM Growth Series (Invesco Growth Series), hereafter referred to as the “Fund”) at December 31, 2013, the results of its operations for the year then ended, the changes in its net assets for each of the two years in the period then ended and the financial highlights for each of the five years in the period then ended, in conformity with accounting principles generally accepted in the United States of America. These financial statements and financial highlights (hereafter referred to as “financial statements”) are the responsibility of the Fund’s management; our responsibility is to express an opinion on these financial statements based on our audits. We conducted our audits of these financial statements in accordance with the standards of the Public Company Accounting Oversight Board (United States). Those standards require that we plan and perform the audit to obtain reasonable assurance about whether the financial statements are free of material misstatement. An audit includes examining, on a test basis, evidence supporting the amounts and disclosures in the financial statements, assessing the accounting principles used and significant estimates made by management, and evaluating the overall financial statement presentation. We believe that our audits, which included confirmation of securities at December 31, 2013 by correspondence with the custodian and brokers, provide a reasonable basis for our opinion.
PRICEWATERHOUSECOOPERS LLP
February 26, 2014
Houston, Texas
22 Invesco Global Low Volatility Equity Yield Fund
Calculating your ongoing Fund expenses
Example
As a shareholder of the Fund, you incur two types of costs: (1) transaction costs, which may include sales charges (loads) on purchase payments or contingent deferred sales charges on redemptions, if any; and (2) ongoing costs, including management fees, distribution and/or service (12b-1) fees, and other Fund expenses. This example is intended to help you understand your ongoing costs (in dollars) of investing in the Fund and to compare these costs with ongoing costs of investing in other mutual funds. The example is based on an investment of $1,000 invested at the beginning of the period and held for the entire period July 1, 2013 through December 31, 2013.
Actual expenses
The table below provides information about actual account values and actual expenses. You may use the information in this table, together with the amount you invested, to estimate the expenses that you paid over the period. Simply divide your account value by $1,000 (for example, an $8,600 account value divided by $1,000 = 8.6), then multiply the result by the number in the table under the heading entitled “Actual Expenses Paid During Period” to estimate the expenses you paid on your account during this period.
Hypothetical example for comparison purposes
The table below also provides information about hypothetical account values and hypothetical expenses based on the Fund’s actual expense ratio and an assumed rate of return of 5% per year before expenses, which is not the Fund’s actual return.
The hypothetical account values and expenses may not be used to estimate the actual ending account balance or expenses you paid for the period. You may use this information to compare the ongoing costs of investing in the Fund and other funds. To do so, compare this 5% hypothetical example with the 5% hypothetical examples that appear in the shareholder reports of the other funds.
Please note that the expenses shown in the table are meant to highlight your ongoing costs only and do not reflect any transaction costs, such as sales charges (loads) on purchase payments or contingent deferred sales charges on redemptions, if any. Therefore, the hypothetical information is useful in comparing ongoing costs only, and will not help you determine the relative total costs of owning different funds. In addition, if these transaction costs were included, your costs would have been higher.
Class | Beginning | ACTUAL | HYPOTHETICAL (5% annual return before expenses) | Annualized | ||||||||||||||||||||
| Ending Account Value (12/31/13)1 | Expenses Paid During Period2 | Ending Account Value (12/31/13) | Expenses Paid During Period2 | |||||||||||||||||||||
| A | $ | 1,000.00 | $ | 1,165.30 | $ | 8.15 | $ | 1,017.67 | $ | 7.60 | 1.49 | % | ||||||||||||
| B | 1,000.00 | 1,161.00 | 12.22 | 1,013.89 | 11.39 | 2.24 | ||||||||||||||||||
| C | 1,000.00 | 1,160.60 | 12.22 | 1,013.89 | 11.39 | 2.24 | ||||||||||||||||||
| R | 1,000.00 | 1,163.70 | 9.51 | 1,016.41 | 8.86 | 1.74 | ||||||||||||||||||
| Y | 1,000.00 | 1,167.10 | 6.80 | 1,018.93 | 6.33 | 1.24 | ||||||||||||||||||
| R5 | 1,000.00 | 1,168.70 | 5.58 | 1,020.06 | 5.19 | 1.02 | ||||||||||||||||||
| 1 | The actual ending account value is based on the actual total return of the Fund for the period July 1, 2013 through December 31, 2013, after actual expenses and will differ from the hypothetical ending account value which is based on the Fund’s expense ratio and a hypothetical annual return of 5% before expenses. |
| 2 | Expenses are equal to the Fund’s annualized expense ratio as indicated above multiplied by the average account value over the period, multiplied by 184/365 to reflect the most recent fiscal half year. |
23 Invesco Global Low Volatility Equity Yield Fund
Tax Information
Form 1099-DIV, Form 1042-S and other year–end tax information provide shareholders with actual calendar year amounts that should be included in their tax returns. Shareholders should consult their tax advisors.
The following distribution information is being provided as required by the Internal Revenue Code or to meet a specific state’s requirement.
The Fund designates the following amounts or, if subsequently determined to be different, the maximum amount allowable for its fiscal year ended December 31, 2013:
Federal and State Income Tax | ||||
Qualified Dividend Income* | 100 | % | ||
Corporate Dividends Received Deduction* | 28.55 | % | ||
| * | The above percentages are based on ordinary income dividends paid to shareholders during the Fund’s fiscal year. |
24 Invesco Global Low Volatility Equity Yield Fund
Trustees and Officers
The address of each trustee and officer is AIM Growth Series (Invesco Growth Series) (the “Trust”), 11 Greenway Plaza, Suite 1000, Houston, Texas 77046-1173. The trustees serve for the life of the Trust, subject to their earlier death, incapacitation, resignation, retirement or removal as more specifically provided in the Trust’s organizational documents. Each officer serves for a one year term or until their successors are elected and qualified. Column two below includes length of time served with predecessor entities, if any.
| Name, Year of Birth and Position(s) Held with the Trust | Trustee and/ or Officer Since | Principal Occupation(s) During Past 5 Years | Number of Funds in Fund Complex Overseen by Trustee | Other Directorship(s) Held by Trustee During Past 5 Years | ||||
| Interested Persons | ||||||||
| Martin L. Flanagan1 — 1960 Trustee | 2007 | Executive Director, Chief Executive Officer and President, Invesco Ltd. (ultimate parent of Invesco and a global investment management firm); Advisor to the Board, Invesco Advisers, Inc. (formerly known as Invesco Institutional (N.A.), Inc.); Trustee, The Invesco Funds; Vice Chair, Investment Company Institute; and Member of Executive Board, SMU Cox School of Business
Formerly: Chairman and Chief Executive Officer, Invesco Advisers, Inc. (registered investment adviser); Director, Chairman, Chief Executive Officer and President, IVZ Inc. (holding company), INVESCO Group Services, Inc. (service provider) and Invesco North American Holdings, Inc. (holding company); Director, Chief Executive Officer and President, Invesco Holding Company Limited (parent of Invesco and a global investment management firm); Director, Invesco Ltd.; Chairman, Investment Company Institute and President, Co-Chief Executive Officer, Co-President, Chief Operating Officer and Chief Financial Officer, Franklin Resources, Inc. (global investment management organization) | 123 | None | ||||
| Philip A. Taylor2 — 1954 Trustee, President and Principal Executive Officer | 2006 | Head of North American Retail and Senior Managing Director, Invesco Ltd.; Director, Co-Chairman, Co-President and Co-Chief Executive Officer, Invesco Advisers, Inc. (formerly known as Invesco Institutional (N.A.), Inc.) (registered investment adviser); Director, Chairman, Chief Executive Officer and President, Invesco Management Group, Inc. (formerly known as Invesco Aim Management Group, Inc.) (financial services holding company); Director and President, INVESCO Funds Group, Inc. (registered investment adviser and registered transfer agent); Director and Chairman, Invesco Investment Services, Inc. (formerly known as Invesco Aim Investment Services, Inc.) (registered transfer agent) and IVZ Distributors, Inc. (formerly known as INVESCO Distributors, Inc.) (registered broker dealer); Director, President and Chairman, Invesco Inc. (holding company) and Invesco Canada Holdings Inc. (holding company); Chief Executive Officer, Invesco Corporate Class Inc. (corporate mutual fund company) and Invesco Canada Fund Inc. (corporate mutual fund company); Director, Chairman and Chief Executive Officer, Invesco Canada Ltd. (formerly known as Invesco Trimark Ltd./Invesco Trimark Ltèe) (registered investment adviser and registered transfer agent); Trustee, President and Principal Executive Officer, The Invesco Funds (other than AIM Treasurer’s Series Trust (Invesco Treasurer’s Series Trust) and Short-Term Investments Trust); Trustee and Executive Vice President, The Invesco Funds (AIM Treasurer’s Series Trust (Invesco Treasurer’s Series Trust) and Short-Term Investments Trust only); Director, Invesco Investment Advisers LLC (formerly known as Van Kampen Asset Management); Director, Chief Executive Officer and President, Van Kampen Exchange Corp.
Formerly: Director and Chairman, Van Kampen Investor Services Inc.: Director, Chief Executive Officer and President, 1371 Preferred Inc. (holding company); and Van Kampen Investments Inc.; Director and President, AIM GP Canada Inc. (general partner for limited partnerships); and Van Kampen Advisors, Inc.; Director and Chief Executive Officer, Invesco Trimark Dealer Inc. (registered broker dealer); Director, Invesco Distributors, Inc. (formerly known as Invesco Aim Distributors, Inc.) (registered broker dealer); Manager, Invesco PowerShares Capital Management LLC; Director, Chief Executive Officer and President, Invesco Advisers, Inc.; Director, Chairman, Chief Executive Officer and President, Invesco Aim Capital Management, Inc.; President, Invesco Trimark Dealer Inc. and Invesco Trimark Ltd./Invesco Trimark Ltèe; Director and President, AIM Trimark Corporate Class Inc. and AIM Trimark Canada Fund Inc.; Senior Managing Director, Invesco Holding Company Limited; Trustee and Executive Vice President, Tax-Free Investments Trust; Director and Chairman, Fund Management Company (former registered broker dealer); President and Principal Executive Officer, The Invesco Funds (AIM Treasurer’s Series Trust (Invesco Treasurer’s Series Trust), Short-Term Investments Trust and Tax-Free Investments Trust only); President, AIM Trimark Global Fund Inc. and AIM Trimark Canada Fund Inc. | 123 | None | ||||
Wayne W. Whalen3 — 1939 Trustee | 2010 | Of Counsel, and prior to 2010, partner in the law firm of Skadden, Arps, Slate, Meagher & Flom LLP, legal counsel to certain funds in the Fund Complex | 136 | Director of the Mutual Fund Directors Forum, a nonprofit membership organization for investment directors; Chairman and Director of the Abraham Lincoln Presidential Library Foundation; and Director of the Stevenson Center for Democracy |
| 1 | Mr. Flanagan is considered an interested person of the Trust because he is an officer of the adviser to the Trust, and an officer and a director of Invesco Ltd., ultimate parent of the adviser to the Trust. |
| 2 | Mr. Taylor is considered an interested person of the Trust because he is an officer and a director of the adviser to, and a director of the principal underwriter of, the Trust. |
| 3 | Mr. Whalen is considered an “interested person” (within the meaning of Section 2(a)(19) of the 1940 Act) of certain Funds in the Invesco Fund Complex because he and his firm currently provide legal services as legal counsel to such Funds. |
T-1 Invesco Global Low Volatility Equity Yield Fund
Trustees and Officers—(continued)
| Name, Year of Birth and Position(s) Held with the Trust | Trustee and/ or Officer Since | Principal Occupation(s) During Past 5 Years | Number of Funds in Fund Complex Overseen by Trustee | Other Directorship(s) Held by Trustee During Past 5 Years | ||||
| Independent Trustees | ||||||||
Bruce L. Crockett — 1944 Trustee and Chair | 2001 | Chairman, Crockett Technologies Associates (technology consulting company)
Formerly: Director, Captaris (unified messaging provider); Director, President and Chief Executive Officer COMSAT Corporation; and Chairman, Board of Governors of INTELSAT (international communications company) | 123 | ACE Limited (insurance company); Investment Company Institute | ||||
David C. Arch — 1945 Trustee | 2010 | Chairman and Chief Executive Officer of Blistex Inc., (consumer health care products manufacturer)
Formerly: Member of the Heartland Alliance Advisory Board, a nonprofit organization serving human needs based in Chicago | 136 | Board member of the Illinois Manufacturers’ Association; Member of the Board of Visitors, Institute for the Humanities, University of Michigan | ||||
Frank S. Bayley — 1939 Trustee | 1985 | Retired
Formerly: Director, Badgley Funds, Inc. (registered investment company) (2 portfolios) and General Partner and Of Counsel, law firm of Baker & McKenzie, LLP | 123 | Director and Chairman, C.D. Stimson Company (a real estate investment company); Trustee and Overseer, The Curtis Institute of Music | ||||
James T. Bunch — 1942 Trustee | 2003 | Managing Member, Grumman Hill Group LLC (family office private equity management)
Formerly: Founder, Green, Manning & Bunch Ltd. (investment banking firm) (1988-2010); Executive Committee, United States Golf Association; and Director, Policy Studies, Inc. and Van Gilder Insurance Corporation | 123 | Chairman, Board of Governors, Western Golf Association; Chairman-elect, Evans Scholars Foundation; and Director, Denver Film Society | ||||
Rodney F. Dammeyer — 1940 Trustee | 2010 | Chairman of CAC, LLC, (private company offering capital investment and management advisory services)
Formerly: Prior to 2001, Managing Partner at Equity Group Corporate Investments; Prior to 1995, Chief Executive Officer of Itel Corporation (formerly Anixter International); Prior to 1985, experience includes Senior Vice President and Chief Financial Officer of Household International, Inc., Executive Vice President and Chief Financial Officer of Northwest Industries, Inc. and Partner of Arthur Andersen & Co.; From 1987 to 2010, Director/Trustee of investment companies in the Van Kampen Funds complex | 123 | Director of Quidel Corporation and Stericycle, Inc.; Prior to May 2008, Trustee of The Scripps Research Institute; Prior to February 2008, Director of Ventana Medical Systems, Inc. | ||||
Albert R. Dowden — 1941 Trustee | 2001 | Director of a number of public and private business corporations, including the Boss Group, Ltd. (private investment and management); and Reich & Tang Funds (5 portfolios) (registered investment company)
Formerly: Director, Homeowners of America Holding Corporation/Homeowners of America Insurance Company (property casualty company); Director, Continental Energy Services, LLC (oil and gas pipeline service); Director, CompuDyne Corporation (provider of product and services to the public security market) and Director, Annuity and Life Re (Holdings), Ltd. (reinsurance company); Director, President and Chief Executive Officer, Volvo Group North America, Inc.; Senior Vice President, AB Volvo; Director of various public and private corporations; Chairman, DHJ Media, Inc.; Director, Magellan Insurance Company; and Director, The Hertz Corporation, Genmar Corporation (boat manufacturer), National Media Corporation; Advisory Board of Rotary Power International (designer, manufacturer, and seller of rotary power engines); and Chairman, Cortland Trust, Inc. (registered investment company) | 123 | Director of Nature’s Sunshine Products, Inc. | ||||
Jack M. Fields — 1952 Trustee | 2001 | Chief Executive Officer, Twenty First Century Group, Inc. (government affairs company); Owner and Chief Executive Officer, Dos Angeles Ranch, L.P. (cattle, hunting, corporate entertainment); and Discovery Global Education Fund (non-profit)
Formerly: Chief Executive Officer, Texana Timber LP (sustainable forestry company); Director of Cross Timbers Quail Research Ranch (non-profit); and member of the U.S. House of Representatives | 123 | Insperity, Inc. (formerly known as Administaff) | ||||
Prema Mathai-Davis — 1950 Trustee | 2001 | Retired
Formerly: Chief Executive Officer, YWCA of the U.S.A. | 123 | None | ||||
Larry Soll — 1942 Trustee | 2003 | Retired
Formerly: Chairman, Chief Executive Officer and President, Synergen Corp. (a biotechnology company) | 123 | None | ||||
Hugo F. Sonnenschein — 1940 Trustee | 2010 | Distinguished Service Professor and President Emeritus of the University of Chicago and the Adam Smith Distinguished Service Professor in the Department of Economics at the University of Chicago
Formerly: President of the University of Chicago | 136 | Trustee of the University of Rochester and a member of its investment committee. Member of the National Academy of Sciences, the American Philosophical Society and a fellow of the American Academy of Arts and Sciences |
T-2 Invesco Global Low Volatility Equity Yield Fund
Trustees and Officers—(continued)
| Name, Year of Birth and Position(s) Held with the Trust | Trustee and/ or Officer Since | Principal Occupation(s) During Past 5 Years | Number of Funds in Fund Complex Overseen by Trustee | Other Directorship(s) Held by Trustee During Past 5 Years | ||||
| Independent Trustees—(continued) | ||||||||
Raymond Stickel, Jr. — 1944 Trustee | 2005 | Retired
Formerly: Director, Mainstay VP Series Funds, Inc. (25 portfolios) and Partner, Deloitte & Touche | 123 | None | ||||
| Other Officers | ||||||||
| Russell C. Burk — 1958 Senior Vice President and Senior Officer | 2005 | Senior Vice President and Senior Officer, The Invesco Funds | N/A | N/A | ||||
| John M. Zerr — 1962 Senior Vice President, Chief Legal Officer and Secretary | 2006 | Director, Senior Vice President, Secretary and General Counsel, Invesco Management Group, Inc. (formerly known as Invesco Aim Management Group, Inc.) and Van Kampen Exchange Corp.; Senior Vice President, Invesco Advisers, Inc. (formerly known as Invesco Institutional (N.A.), Inc.) (registered investment adviser); Senior Vice President and Secretary, Invesco Distributors, Inc. (formerly known as Invesco Aim Distributors, Inc.); Director, Vice President and Secretary, Invesco Investment Services, Inc. (formerly known as Invesco Aim Investment Services, Inc.) and IVZ Distributors, Inc. (formerly known as INVESCO Distributors, Inc.); Director and Vice President, INVESCO Funds Group, Inc.; Senior Vice President, Chief Legal Officer and Secretary, The Invesco Funds; Manager, Invesco PowerShares Capital Management LLC; Director, Secretary and General Counsel, Invesco Investment Advisers LLC (formerly known as Van Kampen Asset Management); Secretary and General Counsel, Invesco Capital Markets, Inc. (formerly known as Van Kampen Funds Inc.) and Chief Legal Officer, PowerShares Exchange-Traded Fund Trust, PowerShares Exchange-Traded Fund Trust II, PowerShares India Exchange-Traded Fund Trust and PowerShares Actively Managed Exchange-Traded Fund Trust
Formerly: Director and Vice President, Van Kampen Advisors Inc.; Director, Vice President, Secretary and General Counsel, Van Kampen Investor Services Inc.; Director, Invesco Distributors, Inc. (formerly known as Invesco Aim Distributors, Inc.); Director, Senior Vice President, General Counsel and Secretary, Invesco Aim Advisers, Inc. and Van Kampen Investments Inc.; Director, Vice President and Secretary, Fund Management Company; Director, Senior Vice President, Secretary, General Counsel and Vice President, Invesco Aim Capital Management, Inc.; Chief Operating Officer and General Counsel, Liberty Ridge Capital, Inc. (an investment adviser); Vice President and Secretary, PBHG Funds (an investment company) and PBHG Insurance Series Fund (an investment company); Chief Operating Officer, General Counsel and Secretary, Old Mutual Investment Partners (a broker-dealer); General Counsel and Secretary, Old Mutual Fund Services (an administrator) and Old Mutual Shareholder Services (a shareholder servicing center); Executive Vice President, General Counsel and Secretary, Old Mutual Capital, Inc. (an investment adviser); and Vice President and Secretary, Old Mutual Advisors Funds (an investment company) | N/A | N/A | ||||
| Karen Dunn Kelley — 1960 Vice President | 2004 | Senior Managing Director, Investments; Director, Co-President, Co-Chief Executive Officer, and Co-Chairman, Invesco Advisers, Inc. (formerly known as Invesco Institutional (N.A.), Inc.) (registered investment adviser); Chairman, Invesco Senior Secured Management, Inc.; Senior Vice President, Invesco Management Group, Inc. (formerly known as Invesco Aim Management Group, Inc.); Executive Vice President, Invesco Distributors, Inc. (formerly known as Invesco Aim Distributors, Inc.); Director, Invesco Mortgage Capital Inc., and Invesco Management Company Limited; Director and President, INVESCO Asset Management (Bermuda) Ltd., Vice President, The Invesco Funds (other than AIM Treasurer’s Series Trust (Invesco Treasurer’s Series Trust) and Short-Term Investments Trust); and President and Principal Executive Officer, The Invesco Funds (AIM Treasurer’s Series Trust (Invesco Treasurer’s Series Trust) and Short-Term Investments Trust only)
Formerly: Director, INVESCO Global Asset Management Limited and INVESCO Management S.A.; Senior Vice President, Van Kampen Investments Inc. and Invesco Advisers, Inc. (formerly known as Invesco Institutional (N.A.), Inc.) (registered investment adviser); Vice President, Invesco Advisers, Inc. (formerly known as Invesco Institutional (N.A.), Inc.); Director of Cash Management and Senior Vice President, Invesco Advisers, Inc. and Invesco Aim Capital Management, Inc.; President and Principal Executive Officer, Tax-Free Investments Trust; Director and President, Fund Management Company; Chief Cash Management Officer, Director of Cash Management, Senior Vice President, and Managing Director, Invesco Aim Capital Management, Inc.; Director of Cash Management, Senior Vice President, and Vice President, Invesco Advisers, Inc. and The Invesco Funds (AIM Treasurer’s Series Trust (Invesco Treasurer’s Series Trust), Short-Term Investments Trust and Tax-Free Investments Trust only) | N/A | N/A | ||||
T-3 Invesco Global Low Volatility Equity Yield Fund
Trustees and Officers—(continued)
| Name, Year of Birth and Position(s) Held with the Trust | Trustee and/ or Officer Since | Principal Occupation(s) During Past 5 Years | Number of Funds in Fund Complex Overseen by Trustee | Other Directorship(s) Held by Trustee During Past 5 Years | ||||
| Other Officers—(continued) | ||||||||
| Sheri Morris — 1964 Vice President, Treasurer and Principal Financial Officer | 1999 | Vice President, Treasurer and Principal Financial Officer, The Invesco Funds; Vice President, Invesco Advisers, Inc. (formerly known as Invesco Institutional (N.A.), Inc.) (registered investment adviser); and Vice President, PowerShares Exchange-Traded Fund Trust, PowerShares Exchange-Traded Fund Trust II, PowerShares India Exchange-Traded Fund Trust and PowerShares Actively Managed Exchange-Traded Fund Trust
Formerly: Vice President, Invesco Aim Advisers, Inc., Invesco Aim Capital Management, Inc. and Invesco Aim Private Asset Management, Inc.; Assistant Vice President and Assistant Treasurer, The Invesco Funds and Assistant Vice President, Invesco Advisers, Inc., Invesco Aim Capital Management, Inc. and Invesco Aim Private Asset Management, Inc.; and Treasurer, PowerShares Exchange-Traded Fund Trust, PowerShares Exchange-Traded Fund Trust II, PowerShares India Exchange-Traded Fund Trust and PowerShares Actively Managed Exchange-Traded Fund Trust | N/A | N/A | ||||
Crissie M. Wisdom — 1969 Anti-Money Laundering Compliance Officer | 2013 | Anti-Money Laundering Compliance Officer, Invesco Advisers, Inc. (formerly known as Invesco Institutional (N.A.), Inc.) (registered investment adviser), Invesco Capital Markets, Inc. (formerly known as Van Kampen Funds Inc.), Invesco Distributors, Inc., Invesco Investment Services, Inc., Invesco Management Group, Inc., Van Kampen Exchange Corp., The Invesco Funds, Invesco Funds (Chicago), and PowerShares Exchange-Traded Fund Trust, PowerShares Exchange-Traded Fund Trust II, PowerShares India Exchange-Traded Fund Trust, and PowerShares Actively Managed Exchange-Traded Fund Trust; and Fraud Prevention Manager and Controls and Risk Analysis Manager for Invesco Investment Services, Inc. | N/A | N/A | ||||
| Todd L. Spillane — 1958 Chief Compliance Officer | 2006 | Senior Vice President, Invesco Management Group, Inc. (formerly known as Invesco Aim Management Group, Inc.) and Van Kampen Exchange Corp.; Senior Vice President and Chief Compliance Officer, Invesco Advisers, Inc. (registered investment adviser) (formerly known as Invesco Institutional (N.A.), Inc.); Chief Compliance Officer, The Invesco Funds; Vice President, Invesco Distributors, Inc. (formerly known as Invesco Aim Distributors, Inc.) and Invesco Investment Services, Inc. (formerly known as Invesco Aim Investment Services, Inc.)
Formerly: Chief Compliance Officer, Invesco Funds (Chicago); Senior Vice President, Van Kampen Investments Inc.; Senior Vice President and Chief Compliance Officer, Invesco Aim Advisers, Inc. and Invesco Aim Capital Management, Inc.; Chief Compliance Officer, INVESCO Private Capital Investments, Inc. (holding company), Invesco Private Capital, Inc. (registered investment adviser), Invesco Global Asset Management (N.A.), Inc., Invesco Senior Secured Management, Inc. (registered investment adviser), Van Kampen Investor Services Inc., PowerShares Exchange-Traded Fund Trust, PowerShares Exchange-Traded Fund Trust II, PowerShares India Exchange-Traded Fund Trust and PowerShares Actively Managed Exchange-Traded Fund Trust; and Vice President, Invesco Aim Capital Management, Inc. and Fund Management Company | N/A | N/A |
The Statement of Additional Information of the Trust includes additional information about the Fund’s Trustees and is available upon request, without charge, by calling 1.800.959.4246. Please refer to the Fund’s prospectus for information on the Fund’s sub-advisers.
Office of the Fund 11 Greenway Plaza, Suite 1000 Houston, TX 77046-1173 | Investment Adviser Invesco Advisers, Inc. 1555 Peachtree Street, N.E. Atlanta, GA 30309 | Distributor Invesco Distributors, Inc. 11 Greenway Plaza, Suite 1000 Houston, TX 77046-1173 | Auditors PricewaterhouseCoopers LLP 1201 Louisiana Street, Suite 2900 Houston, TX 77002-5678 | |||
Counsel to the Fund Stradley Ronon Stevens & Young, LLP 2005 Market Street, Suite 2600 Philadelphia, PA 19103-7018 | Counsel to the Independent Trustees Goodwin Procter LLP 901 New York Avenue, N.W. Washington, D.C. 20001 | Transfer Agent Invesco Investment Services, Inc. 11 Greenway Plaza, Suite 1000 Houston, TX 77046-1173 | Custodian State Street Bank and Trust Company 225 Franklin Street Boston, MA 02110-2801 | |||
T-4 Invesco Global Low Volatility Equity Yield Fund

Invesco mailing information
Send general correspondence to Invesco Investment Services, Inc., P.O. Box 219078, Kansas City, MO 64121-9078.
Invesco privacy policy
You share personal and financial information with us that is necessary for your transactions and your account records. We take very seriously the obligation to keep that information confidential and private.
Invesco collects nonpublic personal information about you from account applications or other forms you complete and from your transactions with us or our affiliates. We do not disclose information about you or our former customers to service providers or other third parties except to the extent necessary to service your account and in other limited circumstances as permitted by law. For example, we use this information to facilitate the delivery of transaction confirmations, financial reports, prospectuses and tax forms.
Even within Invesco, only people involved in the servicing of your accounts and compliance monitoring have access to your information. To ensure the highest level of confidentiality and security, Invesco maintains physical, electronic and procedural safeguards that meet or exceed federal standards. Special measures, such as data encryption and authentication, apply to your communications with us on our website. More detail is available to you at invesco.com/privacy.
Important notice regarding delivery of security holder documents
To reduce Fund expenses, only one copy of most shareholder documents may be mailed to shareholders with multiple accounts at the same address (Householding). Mailing of your shareholder documents may be householded indefinitely unless you instruct us otherwise. If you do not want the mailing of these documents to be combined with those for other members of your household, please contact Invesco Investment Services, Inc. at 800 959 4246 or contact your financial institution. We will begin sending you individual copies for each account within 30 days after receiving your request.
Fund holdings and proxy voting information
The Fund provides a complete list of its holdings four times in each fiscal year, at the quarter ends. For the second and fourth quarters, the lists appear in the Fund’s semiannual and annual reports to shareholders. For the first and third quarters, the Fund files the lists with the Securities and Exchange Commission (SEC) on Form N-Q. The most recent list of portfolio holdings is available at invesco.com/completeqtrholdings. Shareholders can also look up the Fund’s Forms N-Q on the SEC website at sec.gov. Copies of the Fund’s Forms N-Q may be reviewed and copied at the SEC Public Reference Room in Washington, D.C. You can obtain information on the operation of the Public Reference Room, including information about duplicating fee charges, by calling 202 551 8090 or 800 732 0330, or by electronic request at the following email address: publicinfo@sec.gov. The SEC file numbers for the Fund are shown below.
A description of the policies and procedures that the Fund uses to determine how to vote proxies relating to portfolio securities is available without charge, upon request, from our Client Services department at 800 959 4246 or at invesco.com/proxyguidelines. The information is also available on the SEC website, sec.gov.
Information regarding how the Fund voted proxies related to its portfolio securities during the most recent 12-month period ended June 30 is available at invesco.com/proxysearch. The information is also available on the SEC website, sec.gov. Invesco Advisers, Inc. is an investment adviser; it provides investment advisory services to individual and institutional clients and does not sell securities. Invesco Distributors, Inc. is the US distributor for Invesco Ltd.’s retail mutual funds, exchange-traded funds and institutional money market funds. Both are wholly owned, indirect subsidiaries of Invesco Ltd. |  | |
| SEC file numbers: 811-02699 and 002-57526 GLVEY-AR-1 Invesco Distributors, Inc. | ||
|
| |||||
Annual Report to Shareholders
| December 31, 2013
| |||||
Invesco Income Allocation Fund | ||||||
Nasdaq: A: ALAAX § B: BLIAX § C: CLIAX § R: RLIAX § Y: ALAYX § R5: ILAAX | ||||||

Letters to Shareholders
Philip Taylor | Dear Shareholders: This annual report includes information about your Invesco Fund, including performance data and a complete list of its investments as of the close of the reporting period. Inside, your Fund’s portfolio managers discuss how they managed your Fund and the factors that affected its performance during the reporting period. I hope you find this report of interest. During the year covered by this report, major US and global equity market indexes hit multiyear or all-time highs1, the result of a strengthening US economy and relatively healthy corporate profits. Also helping equities was a return of individual investors to stocks – due in part to monetary policies that kept interest rates (and yields on fixed income securities) low. At the end of the reporting period, amid widespread signs of an improving economy, the US Federal Reserve announced that it would begin a long-anticipated reduction in its bond-buying | ||||||||
| program in January 2014; its decision was widely expected and investors reacted positively to the announcement. Despite some mid-summer volatility, overseas equity market indexes in developed and emerging nations generally rose during the year. | |||||||||

Extended periods of strong market performance such as we saw throughout 2013 can lull some investors into a false sense of security – just as extended periods of volatility or market weakness can discourage some investors from undertaking disciplined, long-term investment plans. That’s why Invesco believes it can often be helpful to work with a skilled and trusted financial adviser; he or she can emphasize the importance of adhering to an investment plan designed to achieve long-term goals like a first home, a college education for a child or a comfortable retirement. A financial adviser who is familiar with your individual financial situation, investment goals and risk tolerance can be an invaluable partner as you work toward your financial goals. He or she can provide insight and perspective when markets are volatile; encouragement and reassurance when times are uncertain; and advice and guidance when your financial situation or investment goals change.
Timely information when and where you want it
Invesco’s efforts to help investors achieve their financial objectives include providing individual investors and financial professionals with timely information about the markets, the economy and investing – whenever and wherever they want it.
Our website, invesco.com/us, offers a wide range of market insights and investment perspectives. On the website, you’ll find detailed information about our funds, including prices, performance, holdings and portfolio manager commentaries. You can access information about your individual Invesco account whenever it’s convenient for you; just complete a simple, secure online registration. Use the “Login” box on our home page to get started.
Using Invesco’s mobile app for iPad® (available free from the App StoreSM) allows you to obtain the same detailed information about your funds and the same investment insights from our investment leaders, market strategists, economists and retirement experts on the go. You also can watch portfolio manager videos and have instant access to Invesco news and updates wherever you may be.
In addition to the resources accessible on our website and through our mobile app, you can obtain timely updates to help you stay informed about the markets, the economy and investing by connecting with Invesco on Twitter, LinkedIn or Facebook. You can access our blog at blog.invesco.us.com or by visiting the “Intentional Investing Forum” on our home page. Our goal is to provide you the information you want, when and where you want it.
Have questions?
For questions about your account, feel free to contact an Invesco client services representative at 800 959 4246. For Invesco-related questions or comments, please email me directly at phil@invesco.com.
All of us at Invesco look forward to serving your investment management needs for many years to come. Thank you for investing with us.
Sincerely,

Philip Taylor
Senior Managing Director, Invesco Ltd.
1 Source: Reuters
iPad is a trademark of Apple Inc., registered in the US and other countries. App Store is a service mark of Apple Inc.
2 Invesco Income Allocation Fund
Bruce Crockett | Dear Fellow Shareholders: Many investors enjoyed positive returns on their investments in 2013. While some sectors of the market struggled, many major equity market indexes in the US and around the globe rose last year. The performance of stocks, fixed income securities and alternative investments – and the performance of mutual funds that invest in them – is determined by many factors, including unforeseeable economic and geopolitical events. Your Board certainly can’t determine how well various asset classes in the market perform, but we work hard throughout the year on issues that affect you and your fellow shareholders and determine how your investments are managed. For example, the Invesco Funds Board works to ensure that we provide a lineup of funds that allow financial advisers to build portfolios that meet shareholders’ changing financial needs and goals. Your Board works with Invesco Advisers on a continuing basis to provide financial | ||||||||
| products that may help investors achieve their varied financial goals. We also carefully monitor how the management teams of all the Invesco funds are performing in light of ever-changing and often unpredictable economic and market conditions. Your Board carefully assesses their performance in a constantly changing and highly competitive marketplace. | |||||||||

Your Board also conducts an annual review of the funds’ advisory and sub-advisory contracts with Invesco Advisers and its affiliates. This annual review, which is required by the Investment Company Act of 1940, focuses on the nature and quality of the services Invesco provides as adviser to the Invesco Funds and the reasonableness of the fees that it charges for those services. Each year, we spend months reviewing detailed information that we request from Invesco that allows us to evaluate its services and fees. We also use information from many independent sources, including materials provided by the independent Senior Officer of the Invesco Funds, who reports directly to the independent Trustees on the Board. Additionally, we meet with independent legal counsel and review performance and fee data prepared by Lipper Inc., an independent, third-party firm widely recognized as a leader in its field.
Be assured that your Board will continue working on behalf of fund shareholders, keeping your needs and interests uppermost in our minds.
As always, please contact me at bruce@brucecrockett.com with any questions or concerns you may have. On behalf of the Board, we look forward to continuing to represent your interests and serving your needs.
Sincerely,

Bruce L Crockett
Independent Chair
Invesco Funds Board of Trustees
3 Invesco Income Allocation Fund
Management’s Discussion of Fund Performance
Performance summary
For the year ended December 31, 2013, Invesco Income Allocation Fund under-performed its style-specific benchmark, the Custom Income Allocation Index. Positive absolute performance from global developed market equities drove results throughout the year. Government bonds produced positive absolute returns despite rising yields.
Your Fund’s long-term performance appears later in this report.
Fund vs. Indexes
Total returns, 12/31/12 to 12/31/13, at net asset value (NAV). Performance shown does not include applicable contingent deferred sales charges (CDSC) or front-end sales charges, which would have reduced performance.
| Class A Shares | 6.53 | % | |||
| Class B Shares | 5.73 | ||||
| Class C Shares | 5.73 | ||||
| Class R Shares | 6.27 | ||||
| Class Y Shares | 6.80 | ||||
| Class R5 Shares | 6.80 | ||||
| S&P 500 Index‚ (Broad Market Index) | 32.39 | ||||
| Custom Income Allocation Index¡ (Style-Specific Index) | 7.47 | ||||
| Lipper Mixed-Asset Target Allocation Conservative Funds Index¿ (Peer Group Index) | 7.08 |
Source(s): ‚Invesco, S&P-Dow Jones via FactSet Research Systems Inc.; ¡Invesco, Lipper Inc.; ¿Lipper Inc.
How we invest
Invesco Income Allocation Fund invests in underlying funds diversified among asset classes (bonds, stocks and cash), investment styles (value and blend/core), regions (domestic and international) and market capitalizations (large and mid). These underlying funds’ targeted percentages include bond funds, which represent 60% of the portfolio, stock funds, which represent 33%, and real estate, which represents the remaining 7%. The underlying funds invest in a wide range of income-producing securities, which may generate an attractive yield with less price volatility than individual asset classes.
While no fund can guarantee positive performance, the broad portfolio diversi-
fication strives to provide exposure to areas of the market that may perform well in any given period. It also attempts to limit exposure to any one area of the market that may underperform.
We establish target asset class weightings and underlying fund selections for the Fund and also monitor the Fund on an ongoing basis. The underlying funds are actively managed by their respective management teams based on individual fund objectives, investment strategies and management techniques.
While the weightings of various underlying funds in the portfolio may vary from their targets during the year due to market movements, we rebalance the portfolio annually to maintain its target asset class allocations.
Market conditions and your Fund
The year ended December 31, 2013, experienced volatility from geopolitical issues, but overall, was dominated by strong equity markets.
Equities were the primary driver of results for the first quarter, but gains weren’t uniform across all markets. Bonds also posted gains in the first quarter with German government-issued bonds leading the way as European investors sought perceived safe haven assets after the Italian elections and during the Cyprus banking crisis.
The second quarter was unusual, with a broad cross-section of markets declining, limiting the benefits of the Fund’s focus on economic diversification. Equities continued to provide narrow leadership across major asset classes with European and US markets finishing positively, but not keeping pace with the Japanese market. Government bonds sold off across the globe as investors perceived that the US Federal Reserve (the Fed) had signaled its intention to accelerate the reduction and cessation of its bond purchasing programs.
In the third quarter, equities led results as all six markets in which the Fund invests were positive, with Europe, US small caps and Hong Kong posting double-digit gains. Bonds rose marginally as gains in Japanese and German government bonds were diluted by negative results from the UK, the US, Australia and Canada.
Fourth quarter results were led by US large cap equities which posted double-digit returns, but price advances in Japanese, US small cap and European equities were impressive as well. With the exception of Japan, government bond yields in developed markets drifted higher due to
| Portfolio Composition | ||||||||||
Asset Class | | Target Allocation | | | % of Total Net Assets as of 12/31/13 | | ||||
| Taxable Non-Investment Grade | 31.25 | % | 30.63 | % | ||||||
| Intermediate Term Taxable Investment Grade | 23.75 | 23.17 | ||||||||
| Sector | 15.00 | 15.86 | ||||||||
| International Blend | 10.00 | 10.17 | ||||||||
| Large Cap Value | 8.00 | 8.87 | ||||||||
| Real Estate | 7.00 | 6.09 | ||||||||
| Short Term Taxable Investment Grade | 5.00 | 4.96 | ||||||||
| Other Assets Less Liabilities | 0.00 | 0.25 | ||||||||
Based on the composition of the underlying funds.
| Total Net Assets | $180.1 million |
The Fund’s holdings are subject to change, and there is no assurance that the Fund will continue to hold any particular security.
4 Invesco Income Allocation Fund
fears the Fed would begin tapering its asset purchases, due to improving economic data and due to reduced investor demand for perceived safe haven assets.
Within the underlying funds, Invesco Dividend Income Fund, Invesco Diversified Dividend Fund and PowerShares International Dividend AchieversTM Portfolio contributed the most to absolute Fund performance for the reporting period. Invesco Premium Income Fund, Invesco International Total Return Fund and Invesco Core Plus Bond Fund were the absolute detractors from overall Fund performance. Relative to the Fund’s style-specific index, Invesco Dividend Income Fund and PowerShares Active U.S. Real Estate Fund detracted the most from overall Fund performance.
Please note that some of the underlying funds – which include, but are not limited to Invesco Core Plus Bond Fund – may utilize derivatives such as futures contracts and swap agreements, including interest rate futures and credit derivatives, credit default swaps and/or credit default indexes.
We thank you for your continued commitment to Invesco Income Allocation Fund.
The views and opinions expressed in management’s discussion of Fund performance are those of Invesco Advisers, Inc. These views and opinions are subject to change at any time based on factors such as market and economic conditions. These views and opinions may not be relied upon as investment advice or recommendations, or as an offer for a particular security. The information is not a complete analysis of every aspect of any market, country, industry, security or the Fund. Statements of fact are from sources considered reliable, but Invesco Advisers, Inc. makes no representation or warranty as to their completeness or accuracy. Although historical performance is no guarantee of future results, these insights may help you understand our investment management philosophy.
See important Fund and, if applicable, index disclosures later in this report.
 | Gary Wendler Head of Product Development and Investment Performance/Risk, is manager of Invesco | |
| Income Allocation Fund. He joined Invesco in 1995. Mr. Wendler earned a BBA in finance from Texas A&M University. | ||
5 Invesco Income Allocation Fund
Your Fund’s Long-Term Performance
Results of a $10,000 Investment – Oldest Share Class(es) since Inception
Fund and index data from 10/31/05
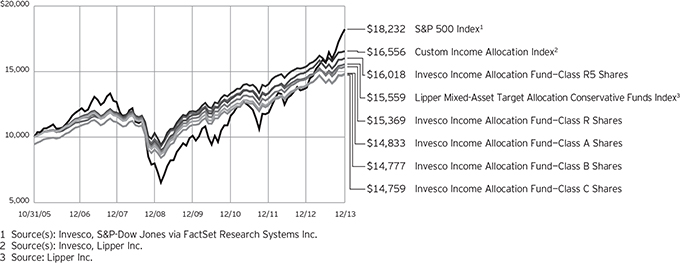
Past performance cannot guarantee comparable future results.
The data shown in the chart include reinvested distributions, applicable sales charges and Fund expenses including management fees. Results for Class B shares are calculated as if a hypothetical
shareholder had liquidated his entire investment in the Fund at the close of the reporting period and paid the contingent deferred sales charges, if applicable. Index results include reinvested dividends, but they do not reflect sales charges. Performance of the peer group,
if applicable, reflects fund expenses and management fees; performance of a market index does not. Performance shown in the chart and table(s) does not reflect deduction of taxes a shareholder would pay on Fund distributions or sale of Fund shares.
continued from page 10
About indexes used in this report
| n | The S&P 500® Index is an unmanaged index considered representative of the US stock market. |
| n | The Custom Income Allocation Index, created by Invesco to serve as a benchmark for Invesco Income Allocation Fund, comprises the following indexes: Russell 3000, MSCI EAFE, FTSE NAREIT Equity REITs and Barclays U.S. Universal. The composition of the index may change based on the fund’s target asset allocation. Therefore, the current composition of the index does not reflect its historical composition and will likely be altered in the future to better reflect the fund’s objective. The Russell 3000 Index is a trademark/service mark of the Frank Russell Co. Russell® is a trademark of the Frank Russell Co. |
| n | The Lipper Mixed-Asset Target Allocation Conservative Funds Index is an unmanaged index considered representative of mixed-asset target allocation conservative funds tracked by Lipper. |
| n | The Russell 3000® Index is an unmanaged index considered representative of the US stock market. |
| n | The MSCI EAFE® Index is an unmanaged index considered representative of stocks of Europe, Australasia and the Far East. The index is computed using the net return, which withholds applicable taxes for non-resident investors. |
| n | The FTSE NAREIT Equity REITs Index is an unmanaged index considered representative of US REITs. |
| n | The Barclays U.S. Universal Index is an unmanaged index comprising US dollar-denominated, taxable bonds that are rated investment grade or below investment grade. |
| n | The Fund is not managed to track the performance of any particular index, including the index(es) described here, and consequently, the performance of the Fund may deviate significantly from the performance of the index(es). |
| n | A direct investment cannot be made in an index. Unless otherwise indicated, |
index results include reinvested dividends, and they do not reflect sales charges. Performance of the peer group, if applicable, reflects fund expenses; performance of a market index does not.
Other information
| n | The returns shown in management’s discussion of Fund performance are based on net asset values calculated for shareholder transactions. Generally accepted accounting principles require adjustments to be made to the net assets of the Fund at period end for financial reporting purposes, and as such, the net asset values for shareholder transactions and the returns based on those net asset values may differ from the net asset values and returns reported in the Financial Highlights. |
6 Invesco Income Allocation Fund
| Average Annual Total Returns | |||||
| As of 12/31/13, including maximum applicable sales charges | |||||
| Class A Shares | |||||
| Inception (10/31/05) | 4.95 | % | |||
| 5 Years | 9.16 | ||||
| 1 Year | 0.71 | ||||
| Class B Shares | |||||
| Inception (10/31/05) | 4.90 | % | |||
| 5 Years | 9.28 | ||||
| 1 Year | 0.73 | ||||
| Class C Shares | |||||
| Inception (10/31/05) | 4.88 | % | |||
| 5 Years | 9.56 | ||||
| 1 Year | 4.73 | ||||
| Class R Shares | |||||
| Inception (10/31/05) | 5.40 | % | |||
| 5 Years | 10.09 | ||||
| 1 Year | 6.27 | ||||
| Class Y Shares | |||||
| Inception | 5.84 | % | |||
| 5 Years | 10.64 | ||||
| 1 Year | 6.80 | ||||
| Class R5 Shares | |||||
| Inception (10/31/05) | 5.94 | % | |||
| 5 Years | 10.64 | ||||
| 1 Year | 6.80 | ||||
Class Y shares incepted on October 3, 2008. Performance shown prior to that date is that of Class A shares and includes the 12b-1 fees applicable to Class A shares. Class A share performance reflects any applicable fee waivers or expense reimbursements.
The performance data quoted represent past performance and cannot guarantee comparable future results; current performance may be lower or higher. Please visit invesco.com/performance for the most recent month-end performance. Performance figures reflect reinvested distributions, changes in net asset value and the effect of the maximum sales charge unless otherwise stated. Investment return and principal value will fluctuate so that you may have a gain or loss when you sell shares.
The net annual Fund operating expense ratio set forth in the most recent Fund prospectus as of the date of this report for Class A, Class B, Class C, Class R, Class Y and Class R5 shares was 0.88%, 1.63%, 1.63%, 1.13%, 0.63% and 0.63%, respectively.1,2 The total annual Fund operating expense ratio set forth in the most recent Fund
prospectus as of the date of this report for Class A, Class B, Class C, Class R, Class Y and Class R5 shares was 1.26%, 2.01%, 2.01%, 1.51%, 1.01% and 0.93%, respectively.1 The expense ratios presented above may vary from the expense ratios presented in other sections of this report that are based on expenses incurred during the period covered by this report.
Class A share performance reflects the maximum 5.50% sales charge, and Class B and Class C share performance reflects the applicable contingent deferred sales charge (CDSC) for the period involved. The CDSC on Class B shares declines from 5% beginning at the time of purchase to 0% at the beginning of the seventh year. The CDSC on Class C shares is 1% for the first year after purchase. Class R, Class Y and Class R5 shares do not have a front-end sales charge or a CDSC; therefore, performance is at net asset value.
The performance of the Fund’s share classes will differ primarily due to different sales charge structures and class expenses.
Had the adviser not waived fees and/or reimbursed expenses, performance would have been lower.
| 1 | The expense ratio includes acquired fund fees and expenses of the underlying funds in which the Fund invests of 0.63% for Invesco Income Allocation Fund. |
| 2 | Total annual Fund operating expenses after any contractual fee waivers and/or expense reimbursements by the adviser in effect through at least April 30, 2015. See current prospectus for more information. |
7 Invesco Income Allocation Fund
Invesco Income Allocation Fund’s investment objective is current income and, secondarily, growth of capital.
| n | Unless otherwise stated, information presented in this report is as of December 31, 2013, and is based on total net assets. |
| n | Unless otherwise noted, all data provided by Invesco. |
| n | To access your Fund’s reports/prospectus, visit invesco.com/fundreports. |
About share classes
| n | Class B shares may not be purchased for new or additional investments. Please see the prospectus for more information. |
| n | Class R shares are generally available only to employer sponsored retirement and benefit plans. Please see the prospectus for more information. |
| n | Class Y shares are available only to certain investors. Please see the prospectus for more information. |
| n | Class R5 shares are primarily intended for employer sponsored retirement and benefit plans that meet certain standards and for institutional investors. Please see the prospectus for more information. |
Principal risks of investing in the Fund
| n | Call risk. If interest rates fall, it is possible that issuers of debt securities with high interest rates will prepay or call their securities before their maturity dates. In this event, the proceeds from the called securities would likely be reinvested by an underlying fund in securities bearing the new, lower interest rates, resulting in a possible decline in an underlying funds income and distributions to shareholders. |
| n | Collateralized loan obligations risk. In addition to the normal interest rate, default and other risk of fixed income securities, collateralized loan obligations carry additional risks, including the possibility that distributions from collateral securities will not be adequate to make interest or other payments, the quality of the collateral may decline in value or default, the underlying fund may invest in collateralized loan obligations that are subordinate to other classes, values may be volatile, and disputes with the issuer may produce unexpected investment results. |
| n | Concentration risk. To the extent an underlying fund invests a greater amount in any one sector or industry, an underlying fund’s performance will depend to a greater extent on the overall condition of the sector or industry, and there is increased risk to an underlying fund if conditions adversely affect that sector or industry. |
| n | Convertible securities risk. An underlying fund may own convertible securities, the value of which may be affected by market interest rates, the risk that the issuer will default, the value of the underlying stock or the right of the issuer to buy back the convertible securities. |
| n | Counterparty risk. Counterparty risk is the risk that the other party to the contract will not fulfill its contractual obligations, which may cause losses or additional costs to an underlying fund. |
| n | Credit linked notes risk. Risks of credit linked notes include those risks associated with the underlying reference obligation including but not limited to market risk, interest rate risk, credit risk, default risk and foreign currency risk. In the case of a credit linked note created with credit default swaps, the structure will be “funded” such that the par amount of the security will represent the maximum loss that could be incurred on the investment and no leverage is introduced. An investor in a credit linked note bears counterparty risk or the risk that the issuer of the credit linked note will default or become bankrupt and not make timely payment of principal and interest of the structured security. |
| n | Credit risk. The issuer of instruments in which the underlying fund invests may be unable to meet interest and/or principal payments, thereby causing its instruments to decrease in value and lowering the issuer’s credit rating. |
| n | Currency/exchange rate risk. The dollar value of an underlying fund’s foreign investments will be affected by changes in the exchange rates between the dollar and the currencies in which those investments are traded. |
| n | Debt securities risk. An underlying fund may invest in debt securities that are affected by changing interest rates and changes in their effective maturities and credit quality. |
| n | Defaulted securities risk. Defaulted securities involve the substantial risk that principal will not be repaid. Defaulted securities and any securities received in an exchange for such securities may be subject to restrictions on resale. |
| n | Derivatives risk. The value of a derivative instrument depends largely on (and is derived from) the value of an underlying security, currency, commodity, interest rate, index or other asset (each referred to as an underlying asset). In addition to risks relating to the underlying assets, the use of derivatives may include other, possibly greater, risks, including counterparty, leverage and liquidity risks. Counterparty risk is the risk that the counterparty to the derivative contract will default on its obligation to pay an underlying fund the amount owed or otherwise perform under the derivative contract. Derivatives create leverage risk because they do not require payment up front equal to the economic exposure created by owning the derivative. As a result, an adverse change in the value of the underlying asset could result in an underlying fund sustaining a loss that is substantially greater than the amount invested in the derivative, which may make an underlying fund’s returns more volatile and increase the risk of loss. Derivative instruments may also be less liquid than more traditional investments and an underlying fund may be unable to sell or close out its derivative positions at a desirable time or price. This risk may be more acute under adverse market conditions, during which an underlying fund may be most in need of liquidating its derivative positions. Derivatives may also be harder to value, less tax efficient and subject to changing government regulation that could impact an underlying fund’s ability to use certain derivatives or their cost. Also, derivatives used for hedging or to gain or limit exposure to a particular market segment may not provide the expected benefits, particularly during adverse market conditions. |
| n | Developing/emerging markets securities risk. The prices of securities issued by foreign companies and governments located in developing/emerging markets countries may be affected more negatively by inflation, devaluation of their currencies, higher transaction costs, delays in settlement, adverse political developments, the |
continued on next page
This report must be accompanied or preceded by a currently effective Fund prospectus, which contains more complete information, including sales charges and expenses. Investors should read it carefully before investing.
NOT FDIC INSURED | MAY LOSE VALUE | NO BANK GUARANTEE
| Fund Nasdaq Symbols | |||||
| Class A Shares | ALAAX | ||||
| Class B Shares | BLIAX | ||||
| Class C Shares | CLIAX | ||||
| Class R Shares | RLIAX | ||||
| Class Y Shares | ALAYX | ||||
| Class R5 Shares | ILAAX | ||||
8 Invesco Income Allocation Fund
introduction of capital controls, withholding taxes, nationalization of private assets, expropriation, social unrest, war or lack of timely information than those in developed countries.
| n | Dollar roll transactions risk. Dollar roll transactions involve the risk that the market value and yield of the securities retained by an underlying fund may decline below the price of the mortgage-related securities sold by the underlying fund that it is obligated to repurchase. |
| n | Exchange-traded funds risk. An investment by an underlying fund in exchange-traded funds generally presents the same primary risks as an investment in a mutual fund. In addition, an exchange-traded fund may be subject to the following: (1) a discount of the exchange-traded fund’s shares to its net asset value; (2) failure to develop an active trading market for the exchange-traded fund’s shares; (3) the listing exchange halting trading of the exchange-traded fund’s shares; (4) failure of the exchange-traded fund’s shares to track the referenced asset; and (5) holding troubled securities in the referenced index or basket of investments. Exchange-traded funds may involve duplication of management fees and certain other expenses, as the underlying fund indirectly bears its proportionate share of any expenses paid by the exchange-traded funds in which it invests. Further, certain of the exchange-traded funds in which the underlying fund may invest are leveraged. The more the underlying fund invests in such leveraged exchange-traded funds, the more this leverage will magnify any losses on those investments. |
| n | Financial institutions risk. Investments in financial institutions may be subject to certain risks, including, but not limited to, the risk of regulatory actions, changes in interest rates and concentration of loan portfolios in an industry or sector. Financial institutions are highly regulated and may suffer setbacks should regulatory rules and interpretations under which they operate change. Likewise, there is a high level of competition among financial institutions which could adversely affect the viability of an institution. |
| n | Floating rate risk. Some of the underlying funds may invest in senior secured floating rate loans and debt securities that require collateral. There is a risk that the value of the collateral may not be sufficient to cover the amount owed, collateral securing a loan may be found invalid, and collateral may be used to pay other outstanding obligations of the borrower under applicable law or may be difficult to sell. |
There is also the risk that the collateral may be difficult to liquidate, or that a majority of the collateral may be illiquid.
| n | Foreign securities risk. An underlying fund’s foreign investments may be affected by changes in a foreign country’s exchange rates, political and social instability; changes in economic or taxation policies, difficulties when enforcing obligations, decreased liquidity, and increased volatility. Foreign companies may be subject to less regulation resulting in less publicly available information about the companies. |
| n | Fund of funds risk. The Fund’s performance depends on the underlying funds in which it invests, and it is subject to the risks of the underlying funds. Market fluctuations may change the target weightings in the underlying funds. The underlying funds may change their investment objectives, policies or practices and may not achieve their investment objectives, all of which may cause the Fund to withdraw its investments therein at a disadvantageous time. |
| n | High yield bond (junk bond) risk. Junk bonds involve a greater risk of default or price changes due to changes in the credit quality of the issuer. The values of junk bonds fluctuate more than those of high- quality bonds in response to company, political, regulatory or economic developments. Values of junk bonds can decline significantly over short periods of time. |
| n | Income risk. The income you receive from an underlying fund is based primarily on prevailing interest rates, which can vary widely over the short- and long-term. If interest rates drop, your income from an underlying fund may drop as well. |
| n | Industry focus risk. To the extent an underlying fund invests in securities issued or guaranteed by companies in the banking and financial services industries, the underlying fund’s performance will depend on the overall condition of those industries, which may be affected by the following factors: the supply of short-term financing; changes in government regulation and interest rates; and overall economy. |
| n | Interest rate risk. Interest rate risk refers to the risk that bond prices generally fall as interest rates rise; conversely, bond prices generally rise as interest rates fall. Specific bonds differ in their sensitivity to changes in interest rates depending on their individual characteristics, including duration. |
| n | Issuer-specific changes risk. The value of an individual security or particular type of security can be more volatile than the market as a whole and can perform differently from the value of the market as a whole. |
| n | Leverage risk. Leverage exists when an underlying fund purchases or sells an instrument or enters into a transaction without investing cash in an amount equal to the full economic exposure of the asset or transaction and the underlying fund could lose more than it invested. Leverage created from borrowing or certain types of transactions or instruments may impair an underlying fund’s liquidity, cause it to liquidate positions at an unfavorable time, increase volatility or otherwise not achieve its intended objective. |
| n | Liquidity risk. An underlying fund may hold illiquid securities that it is unable to sell at the preferred time or price and could lose its entire investment in such securities. |
| n | Management risk. The investment techniques and risk analysis used by the Fund’s and the underlying funds’ portfolio managers may not produce the desired results. |
| n | Market risk. The prices of and the income generated by an underlying fund’s securities may decline in response to, among other things, investor sentiment, general economic and market conditions, regional or global instability, and currency and interest rate fluctuations. |
| n | Market trading risk. Risk is inherent in all investing. An investment in an underlying fund involves risks similar to those of investing in any underlying fund of equity or fixed-income securities traded on exchanges. You should anticipate that the value of the shares will decline, more or less, in correlation with any decline in value of the underlying index of certain underlying exchange-traded funds. |
| n | Mortgage- and asset-backed securities risk. Certain of the underlying funds may invest in mortgage and asset-backed securities that are subject to prepayment or call risk, which is the risk that the borrower’s payments may be received earlier or later than expected due to changes in prepayment rates on underlying loans. Faster prepayments often happen when interest rates are falling. As a result, an underlying fund may reinvest these early payments at lower interest rates, thereby reducing the underlying fund’s income. Conversely, when interest rates rise, prepayments may happen more slowly, causing the security to lengthen in duration. |
continued on page 10
9 Invesco Income Allocation Fund
continued from page 9
Longer duration securities tend to be more volatile. Securities may be prepaid at a price less than the original purchase value. An unexpectedly high rate of defaults on the mortgages held by a mortgage pool may adversely affect the value of mortgage-backed securities and could result in losses to an underlying fund. The risk of such defaults is generally higher in the case of mortgage pools that include subprime mortgages. Subprime mortgages refer to loans made to borrowers with weakened credit histories or with lower capacity to make timely payments on their mortgages.
| n | Non-correlation risk. An underlying fund’s return may not match the return of the underlying index of certain underlying exchange-traded funds for a number of reasons. For example, the Fund incurs operating expenses not applicable to the underlying index, and incurs costs in buying and selling securities, especially when rebalancing an underlying fund’s securities holdings to reflect changes in the composition of an underlying index of certain underlying exchange-traded funds. In addition, the performance of an underlying fund and an underlying index of certain underlying exchange-traded funds may vary due to asset valuation differences and differences between an underlying fund’s portfolio and the underlying index of certain underlying exchange-traded funds resulting from legal restrictions, cost or liquidity constraints. |
| n | Non-diversification risk. Certain of the underlying funds are non-diversified and can invest a greater portion of their assets in a small number of issuers or a single issuer. A change in the value of the issuer could affect the value of an underlying fund more than if it was a diversified fund. |
| n | Preferred securities risk. There are special risks associated with investing in preferred securities. Preferred securities may include provisions that permit the issuer, in its discretion, to defer or omit distributions for a certain period of time. If the underlying fund owns a security that is deferring or omitting its distributions, the Fund may be required to report the distribution on its tax returns, even though it may not have received this income. Further, preferred securities may lose substantial value due to the omission or deferment of dividend payments. |
| n | Prepayment risk. An issuer’s ability to prepay principal on a loan or debt security prior to maturity can limit an underlying fund’s potential gains. Prepayments may require the underlying fund |
to replace the loan or debt security with a lower yielding security, adversely affecting an underlying fund’s yield.
| n | Reinvestment risk. Reinvestment risk is the risk that a bond’s cash flows (coupon income and principal repayment) will be reinvested at an interest rate below that on the original bond. |
| n | Real estate investment trust (REIT)/real estate risk. Investments in real estate related instruments may be affected by economic, legal, cultural, environmental or technological factors that affect property values, rents or occupancies of real estate related to and underlying fund’s holdings. Real estate companies, including REITs or similar structures, tend to be small and mid-cap companies, and their shares may be more volatile and less liquid. The value of investments in real estate related companies may be affected by the quality of management, the ability to repay loans, the utilization of leverage and financial covenants related thereto, whether the company carries adequate insurance and environmental factors. If a real estate related company defaults, an underlying fund may own real estate directly, which involves the following additional risks: environmental liabilities; difficulty in valuing and selling the real estate; and economic or regulatory changes. |
| n | Short sales risk. Short sales may cause an underlying fund to repurchase a security at a higher price, causing a loss. A short position in a security poses more risk than holding the same security long. As there is no limit on how much the price of the security can increase, the underlying fund’s exposure is unlimited. In order to establish a short position in a security, an underlying fund must borrow the security from a broker. An underlying fund may not always be able to borrow a security an underlying fund seeks to sell short at a particular time or at an acceptable price. An underlying fund also may not always be able to close out the short position by replacing the borrowed securities at a particular time or at an acceptable price. An underlying fund will incur increased transaction costs associated with selling securities short. In addition, taking short positions in securities results in a form of leverage which may cause an underlying fund to be volatile. |
| n | Small- and mid-capitalization risk. Stocks of small- and mid-sized companies tend to be more vulnerable to adverse developments and may have |
little or no operating history or track record of success, and limited product lines, markets, management and financial resources. The securities of small- and mid-sized companies may be more volatile due to less market interest and less publicly available information about the issuer. They also may be illiquid or restricted as to resale, or may trade less frequently and in smaller volumes, all of which may cause difficulty when establishing or closing a position at a desirable price.
| n | Sovereign debt risk. Investments in foreign sovereign debt obligations involve certain risks in addition to those relating to foreign securities or debt securities generally. The issuer of the debt or the governmental authorities that control the repayment of the debt may be unable or unwilling to repay principal or interest when due in accordance with the terms of such debt, and an underlying fund may have limited recourse in the event of a default against the defaulting government. Without the approval of debt holders, some governmental debtors have in the past been able to reschedule or restructure their debt payments or declare moratoria on payments. |
| n | Tax risk. If the US Treasury Department were to exercise its authority to issue regulations that exclude from the definition of “qualifying income” foreign currency gains not directly related to the underlying fund’s business of investing in securities, the underlying fund may be unable to qualify as a regulated investment company for one or more years. In this event, the underlying fund’s Board may authorize a significant change in investment strategy or fund liquidation. |
| n | US government obligations risk. The Fund may invest in obligations issued by US government agencies and instrumentalities that may receive varying levels of support from the government, which could affect an underlying fund’s ability to recover should they default. |
| n | Value investing style risk. Certain underlying funds emphasize a value style of investing, which focuses on undervalued companies with characteristics for improved valuations. This style of investing is subject to the risk that the valuations never improve or that the returns on value equity securities are less than returns on other styles of investing or the overall stock market. Value stocks also may decline in price, even though in theory they are already underpriced. |
continued on page 6
10 Invesco Income Allocation Fund
Schedule of Investments
December 31, 2013
Invesco Income Allocation Fund
Schedule of Investments in Affiliated Issuers–99.75%(a)
| % of Net Assets 12/31/13 | Value 12/31/12 | Purchases at Cost | Proceeds from Sales | Change in Unrealized Appreciation (Depreciation) | Realized Gain (Loss) | Dividend Income | Shares 12/31/13 | Value 12/31/13 | ||||||||||||||||||||||||||||
Domestic Equity Funds–24.73% |
| |||||||||||||||||||||||||||||||||||
Invesco Diversified Dividend Fund | 8.87 | % | $ | 18,665,102 | $ | 6,066,135 | $ | (12,752,045 | ) | $ | 817,619 | $ | 3,315,346 | $ | 306,115 | 942,968 | $ | 15,964,443 | ||||||||||||||||||
Invesco Dividend Income | 15.86 | % | 9,166,547 | 18,514,179 | (747,081 | ) | 1,660,537 | 916,141 | 611,809 | 1,529,121 | 28,563,972 | |||||||||||||||||||||||||
Total Domestic Equity Funds | 27,831,649 | 24,580,314 | (13,499,126 | ) | 2,478,156 | 4,231,487 | 917,924 | 44,528,415 | ||||||||||||||||||||||||||||
Fixed-Income Funds–63.78% |
| |||||||||||||||||||||||||||||||||||
Invesco Core Plus Bond Fund | 14.88 | % | 17,743,569 | 10,886,025 | (938,987 | ) | (828,413 | ) | (61,160 | ) | 852,291 | 2,537,977 | 26,801,034 | |||||||||||||||||||||||
Invesco Corporate Bond Fund | 8.29 | % | 10,031,764 | 5,880,941 | (523,370 | ) | (419,399 | ) | (47,582 | ) | 538,743 | 2,125,691 | 14,922,354 | |||||||||||||||||||||||
Invesco Floating Rate Fund | 7.10 | % | 8,286,046 | 4,785,752 | (431,010 | ) | 163,905 | (28,818 | ) | 480,355 | 1,598,983 | 12,775,875 | ||||||||||||||||||||||||
Invesco High Yield Fund | 10.42 | % | 12,535,272 | 6,806,004 | (747,261 | ) | 152,004 | 22,222 | 944,329 | 4,189,339 | 18,768,241 | |||||||||||||||||||||||||
Invesco International Total Return Fund | 5.02 | % | 5,773,257 | 3,845,395 | (307,864 | ) | (263,709 | ) | 177,904 | 94,360 | 841,443 | 9,045,510 | ||||||||||||||||||||||||
Invesco Premium Income Fund | 13.11 | % | 16,546,687 | 9,608,456 | (862,021 | ) | (1,631,492 | ) | (45,547 | ) | 1,121,546 | 2,395,140 | 23,616,083 | |||||||||||||||||||||||
Invesco Short Term Bond Fund | 4.96 | % | 5,721,711 | 3,556,987 | (307,864 | ) | (24,669 | ) | (16,187 | ) | 144,476 | 1,026,434 | 8,929,978 | |||||||||||||||||||||||
Total Fixed-Income Funds | 76,638,306 | 45,369,560 | (4,118,377 | ) | (2,851,773 | ) | 832 | 4,176,100 | 114,859,075 | |||||||||||||||||||||||||||
Foreign Equity Funds–5.15% |
| |||||||||||||||||||||||||||||||||||
Invesco International Core Equity Fund | 0.00 | % | 6,672,082 | 741,154 | (7,678,147 | ) | 15,427 | 249,484 | — | — | — | |||||||||||||||||||||||||
PowerShares International Dividend Achievers Portfolio–ETF | 5.15 | % | — | 8,905,828 | (236,734 | ) | 605,703 | (5,919 | ) | 161,255 | 502,651 | 9,268,878 | ||||||||||||||||||||||||
Total Foreign Equity Funds | 6,672,082 | 9,646,982 | (7,914,881 | ) | 621,130 | 243,565 | 161,255 | 9,268,878 | ||||||||||||||||||||||||||||
Real Estate Funds–6.09% |
| |||||||||||||||||||||||||||||||||||
Invesco Global Real Estate Income Fund | 0.00 | % | 8,615,678 | 1,120,261 | (10,304,700 | ) | (1,342,814 | ) | 1,911,575 | 82,645 | — | — | ||||||||||||||||||||||||
PowerShares Active U.S. Real Estate Fund–ETF | 6.09 | % | — | 12,598,904 | (331,206 | ) | (1,256,435 | ) | (46,591 | ) | 155,978 | 193,020 | 10,964,672 | |||||||||||||||||||||||
Total Real Estate Funds | 8,615,678 | 13,719,165 | (10,635,906 | ) | (2,599,249 | ) | 1,864,984 | 238,623 | 10,964,672 | |||||||||||||||||||||||||||
TOTAL INVESTMENTS IN AFFILIATED ISSUERS |
| |||||||||||||||||||||||||||||||||||
(Cost $175,145,406) | 99.75 | % | $ | 119,757,715 | $ | 93,316,021 | $ | (36,168,290 | ) | $ | (2,351,736 | ) | $ | 6,340,868 | (c) | $ | 5,493,902 | $ | 179,621,040 | |||||||||||||||||
OTHER ASSETS LESS LIABILITIES | 0.25 | % | 447,505 | |||||||||||||||||||||||||||||||||
NET ASSETS | 100.00 | % | $ | 180,068,545 | ||||||||||||||||||||||||||||||||
Investment Abbreviations:
ETF – Exchange-Traded Fund
Notes to Schedule of Investments:
| (a) | Each underlying fund and the Fund are affiliated by either having the same investment adviser or an investment adviser under common control with the Fund’s investment adviser. The Fund invests in Class R6 shares of the mutual funds listed and the Fund shares of the exchange-traded fund. |
| (b) | Effective February 6, 2013, Invesco Utilities Fund was renamed Invesco Dividend Income Fund. |
| (c) | Includes $147,714, $946,351 and $179,473 of capital gains distributions from affiliated underlying funds for Invesco Diversified Dividend Fund, Invesco Dividend Income Fund and Invesco International Total Return Fund, respectively. |
See accompanying Notes to Financial Statements which are an integral part of the financial statements.
11 Invesco Income Allocation Fund
Statement of Assets and Liabilities
December 31, 2013
Assets: |
| |||
Investments in affiliated underlying funds, at value (Cost $175,145,406) | $ | 179,621,040 | ||
Cash | 647,656 | |||
Receivable for: | ||||
Fund shares sold | 476,679 | |||
Dividends from affiliated underlying funds | 111 | |||
Fund expenses absorbed | 48,449 | |||
Investment for trustee deferred compensation and retirement plans | 37,742 | |||
Other assets | 44,137 | |||
Total assets | 180,875,814 | |||
Liabilities: |
| |||
Payable for: | ||||
Investments purchased — affiliated underlying funds | 423,212 | |||
Fund shares reacquired | 205,739 | |||
Accrued fees to affiliates | 104,546 | |||
Accrued trustees’ and officers’ fees and benefits | 981 | |||
Accrued other operating expenses | 32,030 | |||
Trustee deferred compensation and retirement plans | 40,761 | |||
Total liabilities | 807,269 | |||
Net assets applicable to shares outstanding | $ | 180,068,545 | ||
Net assets consist of: |
| |||
Shares of beneficial interest | $ | 181,708,305 | ||
Undistributed net investment income | 1,019,536 | |||
Undistributed net realized gain (loss) | (7,134,930 | ) | ||
Net unrealized appreciation | 4,475,634 | |||
| $ | 180,068,545 | |||
Net Assets: |
| |||
Class A | $ | 131,485,223 | ||
Class B | $ | 5,157,250 | ||
Class C | $ | 38,399,663 | ||
Class R | $ | 2,045,892 | ||
Class Y | $ | 2,697,254 | ||
Class R5 | $ | 283,263 | ||
Shares outstanding, $0.01 par value per share, |
| |||
Class A | 12,304,394 | |||
Class B | 482,122 | |||
Class C | 3,589,563 | |||
Class R | 191,326 | |||
Class Y | 252,425 | |||
Class R5 | 26,501 | |||
Class A: | ||||
Net asset value per share | $ | 10.69 | ||
Maximum offering price per share | ||||
(Net asset value of $10.69 ¸ 94.50%) | $ | 11.31 | ||
Class B: | ||||
Net asset value and offering price per share | $ | 10.70 | ||
Class C: | ||||
Net asset value and offering price per share | $ | 10.70 | ||
Class R: | ||||
Net asset value and offering price per share | $ | 10.69 | ||
Class Y: | ||||
Net asset value and offering price per share | $ | 10.69 | ||
Class R5: | ||||
Net asset value and offering price per share | $ | 10.69 | ||
See accompanying Notes to Financial Statements which are an integral part of the financial statements.
12 Invesco Income Allocation Fund
Statement of Operations
For the year ended December 31, 2013
Investment income: |
| |||
Dividends from affiliated underlying funds | $ | 5,493,902 | ||
Other Income | 1,276 | |||
Total investment income | 5,495,178 | |||
Expenses: | ||||
Administrative services fees | 50,000 | |||
Custodian fees | 8,728 | |||
Distribution fees: | ||||
Class A | 272,834 | |||
Class B | 55,991 | |||
Class C | 314,219 | |||
Class R | 9,880 | |||
Transfer agent fees — A, B, C, R and Y | 198,924 | |||
Transfer agent fees — R5 | 281 | |||
Trustees’ and officers’ fees and benefits | 29,915 | |||
Registration and filing fees | 80,928 | |||
Other | 93,337 | |||
Total expenses | 1,115,037 | |||
Less: Expenses reimbursed and expense offset arrangement(s) | (462,372 | ) | ||
Net expenses | 652,665 | |||
Net investment income | 4,842,513 | |||
Realized and unrealized gain (loss) from investments in affiliated underlying fund shares | ||||
Net realized gain on sales of affiliated underlying fund shares | 5,067,330 | |||
Net realized gain from distributions of affiliated underlying fund shares | 1,273,538 | |||
Net realized gain from affiliated underlying fund shares | 6,340,868 | |||
Change in net unrealized appreciation (depreciation) of affiliated underlying fund shares | (2,351,736 | ) | ||
Net gain from affiliated underlying funds | 3,989,132 | |||
Net increase in net assets resulting from operations | $ | 8,831,645 | ||
See accompanying Notes to Financial Statements which are an integral part of the financial statements.
13 Invesco Income Allocation Fund
Statement of Changes in Net Assets
For the years ended December 31, 2013 and 2012
| 2013 | 2012 | |||||||
Operations: |
| |||||||
Net investment income | $ | 4,842,513 | $ | 3,863,092 | ||||
Net realized gain (loss) | 6,340,868 | (299,489 | ) | |||||
Change in net unrealized appreciation (depreciation) | (2,351,736 | ) | 7,614,006 | |||||
Net increase in net assets resulting from operations | 8,831,645 | 11,177,609 | ||||||
Distributions to shareholders from net investment income: | ||||||||
Class A | (3,779,824 | ) | (2,638,154 | ) | ||||
Class B | (146,546 | ) | (171,364 | ) | ||||
Class C | (860,731 | ) | (615,843 | ) | ||||
Class R | (60,300 | ) | (53,334 | ) | ||||
Class Y | (105,900 | ) | (60,435 | ) | ||||
Class R5 | (10,486 | ) | (3,965 | ) | ||||
Total distributions from net investment income | (4,963,787 | )�� | (3,543,095 | ) | ||||
Share transactions–net: | ||||||||
Class A | 43,083,981 | 16,485,594 | ||||||
Class B | (990,257 | ) | (1,087,901 | ) | ||||
Class C | 13,871,403 | 1,508,959 | ||||||
Class R | 91,709 | 614,148 | ||||||
Class Y | 354,922 | 698,448 | ||||||
Class R5 | 49,908 | 195,244 | ||||||
Net increase in net assets resulting from share transactions | 56,461,666 | 18,414,492 | ||||||
Net increase in net assets | 60,329,524 | 26,049,006 | ||||||
Net assets: | ||||||||
Beginning of year | 119,739,021 | 93,690,015 | ||||||
End of year (includes undistributed net investment income of $1,019,536 and $1,074,881, respectively) | $ | 180,068,545 | $ | 119,739,021 | ||||
Notes to Financial Statements
December 31, 2013
NOTE 1—Significant Accounting Policies
Invesco Income Allocation Fund (the “Fund”) is a series portfolio of AIM Growth Series (Invesco Growth Series) (the “Trust”). The Trust is organized as a Delaware statutory trust and is registered under the Investment Company Act of 1940, as amended (the “1940 Act”), as an open-end series management investment company consisting of fifteen separate series portfolios, each authorized to issue an unlimited number of shares of beneficial interest. The assets, liabilities and operations of each portfolio are accounted for separately. Information presented in these financial statements pertains only to the Fund. Matters affecting each portfolio or class will be voted on exclusively by the shareholders of such portfolio or class.
The Fund’s investment objective is current income and, secondarily, growth of capital. The Fund is a “fund of funds”, in that it invests in other mutual funds (“underlying funds”) advised by Invesco Advisers, Inc. (the “Adviser” or “Invesco”). The Adviser may change the Fund’s asset class allocations, the underlying funds or the target weightings in the underlying funds without shareholder approval. The underlying funds may engage in a number of investment techniques and practices, which involve certain risks. Each underlying fund’s accounting policies are outlined in the underlying fund’s financial statements and are publicly available.
The Fund currently consists of six different classes of shares: Class A, Class B, Class C, Class R, Class Y and Class R5. Class A shares are sold with a front-end sales charge unless certain waiver criteria are met and under certain circumstances load waived shares may be subject to contingent deferred sales charges (“CDSC”). Class C shares are sold with a CDSC. Class R, Class Y and Class R5 shares are sold at net asset value. Effective November 30, 2010, new or additional investments in Class B shares are no longer permitted. Existing shareholders of Class B shares may continue to reinvest dividends and capital gains distributions in Class B shares until they convert to Class A shares. Also, shareholders in Class B shares will be able to exchange those shares for Class B shares of other Invesco Funds offering such shares until they convert to Class A shares. Generally, Class B shares will automatically convert to Class A shares on or about the month-end, which is at least eight years after the date of purchase. Redemption of Class B shares prior to the conversion date will be subject to a CDSC.
The following is a summary of the significant accounting policies followed by the Fund in the preparation of its financial statements.
| A. | Security Valuations — Securities of investment companies that trade on an exchange are valued at the last sales price or official closing price as of the close of the customary trading session on the exchange where the security is principally traded. Investments in shares of funds that are |
14 Invesco Income Allocation Fund
| not traded on an exchange are valued at the end of day net asset value per share of such fund. Securities in the underlying funds, including restricted securities, are valued in accordance with the valuation policy of such fund. The policies of the underlying funds affiliated with the Fund as a result of having the same investment adviser are set forth below. |
A security listed or traded on an exchange (except convertible bonds) is valued at its last sales price or official closing price as of the close of the customary trading session on the exchange where the security is principally traded, or lacking any sales or official closing price on a particular day, the security may be valued at the closing bid price on that day. Securities traded in the over-the-counter market are valued based on prices furnished by independent pricing services or market makers. When such securities are valued by an independent pricing service they may be considered fair valued. Futures contracts are valued at the final settlement price set by an exchange on which they are principally traded. Listed options are valued at the mean between the last bid and ask prices from the exchange on which they are principally traded. Options not listed on an exchange are valued by an independent source at the mean between the last bid and ask prices. For purposes of determining net asset value per share, futures and option contracts generally are valued 15 minutes after the close of the customary trading session of the New York Stock Exchange (“NYSE”).
Senior secured floating rate loans and senior secured floating rate debt securities are fair valued using an evaluated quote provided by an independent pricing service. Evaluated quotes provided by the pricing service may reflect appropriate factors such as ratings, tranche type, industry, company performance, spread, individual trading characteristics, institution-size trading in similar groups of securities and other market data.
Investments in open-end and closed-end registered investment companies that do not trade on an exchange are valued at the end of day net asset value per share. Investments in open-end and closed-end registered investment companies that trade on an exchange are valued at the last sales price or official closing price as of the close of the customary trading session on the exchange where the security is principally traded.
Debt obligations (including convertible bonds) and unlisted equities are fair valued using an evaluated quote provided by an independent pricing service. Evaluated quotes provided by the pricing service may be determined without exclusive reliance on quoted prices, and may reflect appropriate factors such as institution-size trading in similar groups of securities, developments related to specific securities, dividend rate (for unlisted equities), yield (for debt obligations), quality, type of issue, coupon rate (for debt obligations), maturity (for debt obligations), individual trading characteristics and other market data. Debt obligations are subject to interest rate and credit risks. In addition, all debt obligations involve some risk of default with respect to interest and/or principal payments.
Foreign securities’ (including foreign exchange contracts) prices are converted into U.S. dollar amounts using the applicable exchange rates as of the close of the NYSE. If market quotations are available and reliable for foreign exchange-traded equity securities, the securities will be valued at the market quotations. Because trading hours for certain foreign securities end before the close of the NYSE, closing market quotations may become unreliable. If between the time trading ends on a particular security and the close of the customary trading session on the NYSE, events occur that the Adviser determines are significant and make the closing price unreliable, the Fund may fair value the security. If the event is likely to have affected the closing price of the security, the security will be valued at fair value in good faith using procedures approved by the Board of Trustees. Adjustments to closing prices to reflect fair value may also be based on a screening process of an independent pricing service to indicate the degree of certainty, based on historical data, that the closing price in the principal market where a foreign security trades is not the current value as of the close of the NYSE. Foreign securities’ prices meeting the approved degree of certainty that the price is not reflective of current value will be priced at the indication of fair value from the independent pricing service. Multiple factors may be considered by the independent pricing service in determining adjustments to reflect fair value and may include information relating to sector indices, American Depositary Receipts and domestic and foreign index futures. Foreign securities may have additional risks including exchange rate changes, potential for sharply devalued currencies and high inflation, political and economic upheaval, the relative lack of issuer information, relatively low market liquidity and the potential lack of strict financial and accounting controls and standards.
Securities for which market prices are not provided by any of the above methods may be valued based upon quotes furnished by independent sources. The last bid price may be used to value equity securities. The mean between the last bid and asked prices is used to value debt obligations, including corporate loans.
Securities for which market quotations are not readily available or became unreliable are valued at fair value as determined in good faith by or under the supervision of the Trust’s officers following procedures approved by the Board of Trustees. Issuer specific events, market trends, bid/ask quotes of brokers and information providers and other market data may be reviewed in the course of making a good faith determination of a security’s fair value.
Valuations change in response to many factors including the historical and prospective earnings of the issuer, the value of the issuer’s assets, general economic conditions, interest rates, investor perceptions and market liquidity. Because of the inherent uncertainties of valuation, the values reflected in the financial statements may materially differ from the value received upon actual sale of those investments.
| B. | Securities Transactions and Investment Income — Securities transactions are accounted for on a trade date basis. Realized gains or losses on sales are computed on the basis of specific identification of the securities sold. Distributions from ordinary income from underlying funds, if any, are recorded as dividend income on ex-dividend date. Distributions from gains from underlying funds, if any, are recorded as realized gains on the ex-dividend date. The following policies are followed by the underlying funds: Interest income is recorded on the accrual basis from settlement date. Bond premiums and discounts are amortized and/or accreted for financial reporting purposes. Paydown gains and losses on mortgage and asset-backed securities are recorded as adjustments to interest income. |
The Fund may periodically participate in litigation related to Fund investments. As such, the Fund may receive proceeds from litigation settlements. Any proceeds received are included in the Statement of Operations as realized gain (loss) for investments no longer held and as unrealized gain (loss) for investments still held.
The Fund allocates income and realized and unrealized capital gains and losses to a class based on the relative net assets of each class.
| C. | Distributions — Distributions from income are declared and paid monthly. Distributions from net realized capital gain, if any, are generally declared and paid annually and recorded on the ex-dividend date. The Fund may elect to treat a portion of the proceeds from redemptions as distributions for federal income tax purposes. |
| D. | Federal Income Taxes — The Fund intends to comply with the requirements of Subchapter M of the Internal Revenue Code of 1986, as amended (the “Internal Revenue Code”), necessary to qualify as a regulated investment company and to distribute substantially all of the Fund’s taxable earnings to shareholders. As such, the Fund will not be subject to federal income taxes on otherwise taxable income (including net realized capital gain) that is distributed to shareholders. Therefore, no provision for federal income taxes is recorded in the financial statements. |
15 Invesco Income Allocation Fund
The Fund files tax returns in the U.S. Federal jurisdiction and certain other jurisdictions. Generally, the Fund is subject to examinations by such taxing authorities for up to three years after the filing of the return for the tax period.
| E. | Expenses — Expenses included in the accompanying financial statements reflect the expenses of the Fund and do not include any expenses of the underlying funds. The effects of the underlying funds expenses are included in the realized and unrealized gain/loss on the investments in the underlying funds. Estimated expenses of the underlying funds are discussed further in Note 11. |
Fees provided for under the Rule 12b-1 plan of a particular class of the Fund and which are directly attributable to that class are charged to the operations of such class. Transfer agency fees and expenses and other shareholder recordkeeping fees and expenses attributable to Class R5 are charged to such class. Transfer agency fees and expenses and other shareholder recordkeeping fees and expenses relating to all other classes are allocated among those classes based on relative net assets. All other expenses are allocated among the classes based on relative net assets.
| F. | Accounting Estimates — The preparation of financial statements in conformity with accounting principles generally accepted in the United States of America (“GAAP”) requires management to make estimates and assumptions that affect the reported amounts of assets and liabilities at the date of the financial statements and the reported amounts of revenues and expenses during the reporting period including estimates and assumptions related to taxation. Actual results could differ from those estimates by a significant amount. In addition, the Fund monitors for material events or transactions that may occur or become known after the period-end date and before the date the financial statements are released to print. |
| G. | Indemnifications — Under the Trust’s organizational documents, each Trustee, officer, employee or other agent of the Trust is indemnified against certain liabilities that may arise out of the performance of their duties to the Fund. Additionally, in the normal course of business, the Fund enters into contracts, including the Fund’s servicing agreements, that contain a variety of indemnification clauses. The Fund’s maximum exposure under these arrangements is unknown as this would involve future claims that may be made against the Fund that have not yet occurred. The risk of material loss as a result of such indemnification claims is considered remote. |
NOTE 2—Advisory Fees and Other Fees Paid to Affiliates
The Trust has entered into a master investment advisory agreement with Invesco. Under the terms of the investment advisory agreement, the Fund does not pay an advisory fee. However, the Fund pays advisory fees to Invesco indirectly as a shareholder of the underlying funds.
Under the terms of a master sub-advisory agreement between the Adviser and each of Invesco Asset Management Deutschland GmbH, Invesco Asset Management Limited, Invesco Asset Management (Japan) Limited, Invesco Australia Limited, Invesco Hong Kong Limited, Invesco Senior Secured Management, Inc. and Invesco Canada Ltd. (collectively, the “Affiliated Sub-Advisers”) the Adviser, not the Fund, may pay 40% of the fees paid to the Adviser to any such Affiliated Sub-Adviser(s) that provide(s) discretionary investment management services to the Fund based on the percentage of assets allocated to such Sub-Adviser(s).
The Adviser has contractually agreed, through at least April 30, 2015, to reimburse expenses to the extent necessary to limit total annual fund operating expenses after expense reimbursement (excluding certain items discussed below) of Class A, Class B, Class C, Class R, Class Y and Class R5 shares to 0.25%, 1.00%, 1.00%, 0.50%, 0.00% and 0.00% of average daily net assets, respectively. In determining Adviser’s obligation to reimburse expenses, the following expenses are not taken into account, and could cause the total annual fund operating expenses after expense reimbursement to exceed the numbers reflected above: (1) interest; (2) taxes; (3) dividend expense on short sales; (4) extraordinary or non-routine items, including litigation expenses; and (5) expenses that the Fund has incurred but did not actually pay because of an expense offset arrangement. The total annual fund operating expenses used in determining whether the Fund meets or exceeds the expense limitations described above do not include Acquired Fund Fees and Expenses. Acquired Fund Fees and Expenses are not operating expenses of a Fund directly, but are fees and expenses, including management fees of the investment companies in which a Fund invests. As a result, the total annual fund operating expenses after expense reimbursement may exceed the expense limits above. Unless Invesco continues the fee waiver agreement, it will terminate on April 30, 2015. The fee waiver agreement cannot be terminated during its term.
For the year ended December 31, 2013, the Adviser reimbursed Fund level expenses of $263,167 and reimbursed class level expenses of $143,565, $7,366, $41,335, $2,599, $3,628 and $281 of Class A, Class B, Class C, Class R, Class Y and Class R5 shares, respectively.
The Trust has entered into a master administrative services agreement with Invesco pursuant to which the Fund has agreed to pay Invesco for certain administrative costs incurred in providing accounting services to the Fund. For the year ended December 31, 2013, expenses incurred under the agreement are shown in the Statement of Operations as Administrative services fees.
The Trust has entered into a transfer agency and service agreement with Invesco Investment Services, Inc. (“IIS”) pursuant to which the Fund has agreed to pay IIS a fee for providing transfer agency and shareholder services to the Fund and reimburse IIS for certain expenses incurred by IIS in the course of providing such services. IIS may make payments to intermediaries that provide omnibus account services, sub-accounting services and/or networking services. All fees payable by IIS to intermediaries that provide omnibus account services or sub-accounting are charged back to the Fund, subject to certain limitations approved by the Trust’s Board of Trustees. For the year ended December 31, 2013, expenses incurred under the agreement are shown in the Statement of Operations as Transfer agent fees.
The Trust has entered into master distribution agreements with Invesco Distributors, Inc. (“IDI”) to serve as the distributor for the Class A, Class B, Class C, Class R, Class Y and Class R5 shares of the Fund. The Trust has adopted plans pursuant to Rule 12b-1 under the 1940 Act with respect to the Fund’s Class A, Class B, Class C and Class R shares (collectively, the “Plans”). The Fund, pursuant to the Plans, pays IDI compensation at the annual rate of 0.25% of the Fund’s average daily net assets of Class A shares, 1.00% of the average daily net assets of Class B and Class C shares and 0.50% of the average daily net assets of Class R shares. Of the Plan payments, up to 0.25% of the average daily net assets of each class of shares may be paid to furnish continuing personal shareholder services to customers who purchase and own shares of such classes. Any amounts not paid as a service fee under the Plans would constitute an asset-based sales charge. Rules of the Financial Industry Regulatory Authority (“FINRA”) impose a cap on the total sales charges, including asset-based sales charges, that may be paid by any class of shares of the Fund. For the year ended December 31, 2013, expenses incurred under the Plans are shown in the Statement of Operations as Distribution fees.
Front-end sales commissions and CDSC (collectively, the “sales charges”) are not recorded as expenses of the Fund. Front-end sales commissions are deducted from proceeds from the sales of Fund shares prior to investment in Class A shares of the Fund. CDSC are deducted from redemption proceeds prior to remittance to the shareholder. During the year ended December 31, 2013, IDI advised the Fund that IDI retained $178,773 in front-end sales commissions from the sale of Class A shares and $5,222, $3,690 and $2,333 from Class A, Class B and Class C shares, respectively, for CDSC imposed on redemptions by shareholders.
16 Invesco Income Allocation Fund
The underlying Invesco Funds pay no distribution fees for Class R6 and the Fund pays no sales loads or other similar compensation to IDI for acquiring underlying fund shares.
Certain officers and trustees of the Trust are officers and directors of the Adviser, IIS and/or IDI.
NOTE 3—Additional Valuation Information
GAAP defines fair value as the price that would be received to sell an asset or paid to transfer a liability in an orderly transaction between market participants at the measurement date, under current market conditions. GAAP establishes a hierarchy that prioritizes the inputs to valuation methods, giving the highest priority to readily available unadjusted quoted prices in an active market for identical assets (Level 1) and the lowest priority to significant unobservable inputs (Level 3), generally when market prices are not readily available or are unreliable. Based on the valuation inputs, the securities or other investments are tiered into one of three levels. Changes in valuation methods may result in transfers in or out of an investment’s assigned level:
| Level 1 — | Prices are determined using quoted prices in an active market for identical assets. |
| Level 2 — | Prices are determined using other significant observable inputs. Observable inputs are inputs that other market participants may use in pricing a security. These may include quoted prices for similar securities, interest rates, prepayment speeds, credit risk, yield curves, loss severities, default rates, discount rates, volatilities and others. |
| Level 3 — | Prices are determined using significant unobservable inputs. In situations where quoted prices or observable inputs are unavailable (for example, when there is little or no market activity for an investment at the end of the period), unobservable inputs may be used. Unobservable inputs reflect the Fund’s own assumptions about the factors market participants would use in determining fair value of the securities or instruments and would be based on the best available information. |
As of December 31, 2013, all of the securities in this Fund were valued based on Level 1 inputs (see the Schedule of Investments for security categories). The level assigned to the securities valuations may not be an indication of the risk or liquidity associated with investing in those securities.
NOTE 4—Expense Offset Arrangement(s)
The expense offset arrangement is comprised of transfer agency credits which result from balances in demand deposit accounts used by the transfer agent for clearing shareholder transactions. For the year ended December 31, 2013, the Fund received credits from this arrangement, which resulted in the reduction of the Fund’s total expenses of $431.
NOTE 5—Trustees’ and Officers’ Fees and Benefits
Trustees’ and Officers’ Fees and Benefits include amounts accrued by the Fund to pay remuneration to certain Trustees and Officers of the Fund. Trustees have the option to defer compensation payable by the Fund, and Trustees’ and Officers’ Fees and Benefits also include amounts accrued by the Fund to fund such deferred compensation amounts. Those Trustees who defer compensation have the option to select various Invesco Funds in which their deferral accounts shall be deemed to be invested. Finally, certain current Trustees were eligible to participate in a retirement plan that provided for benefits to be paid upon retirement to Trustees over a period of time based on the number of years of service. The Fund may have certain former Trustees who also participate in a retirement plan and receive benefits under such plan. Trustees’ and Officers’ Fees and Benefits include amounts accrued by the Fund to fund such retirement benefits. Obligations under the deferred compensation and retirement plans represent unsecured claims against the general assets of the Fund.
NOTE 6—Cash Balances
The Fund is permitted to temporarily carry a negative or overdrawn balance in its account with State Street Bank and Trust Company, the custodian bank. Such balances, if any at period end, are shown in the Statement of Assets and Liabilities under the payable caption Amount due custodian. To compensate the custodian bank for such overdrafts, the overdrawn Fund may either (1) leave funds as a compensating balance in the account so the custodian bank can be compensated by earning the additional interest; or (2) compensate by paying the custodian bank at a rate agreed upon by the custodian bank and Invesco, not to exceed the contractually agreed upon rate.
NOTE 7—Distributions to Shareholders and Tax Components of Net Assets
Tax Character of Distributions to Shareholders Paid During the Years Ended December 31, 2013 and 2012:
| 2013 | 2012 | |||||||
Ordinary income | $ | 4,963,787 | $ | 3,543,095 | ||||
Tax Components of Net Assets at Period-End:
| 2013 | ||||
Undistributed ordinary income | $ | 1,055,598 | ||
Net unrealized appreciation (depreciation) — investments | (1,896,328 | ) | ||
Temporary book/tax differences | (36,061 | ) | ||
Capital loss carryforward | (762,969 | ) | ||
Shares of beneficial interest | 181,708,305 | |||
Total net assets | $ | 180,068,545 | ||
17 Invesco Income Allocation Fund
The difference between book-basis and tax-basis unrealized appreciation (depreciation) is due to differences in the timing of recognition of gains and losses on investments for tax and book purposes. The Fund’s net unrealized appreciation (depreciation) difference is attributable primarily to wash sales.
The temporary book/tax differences are a result of timing differences between book and tax recognition of income and/or expenses. The Fund’s temporary book/tax differences are the result of the trustee deferral of compensation and retirement plan benefits.
Capital loss carryforward is calculated and reported as of a specific date. Results of transactions and other activity after that date may affect the amount of capital loss carryforward actually available for the Fund to utilize. Capital losses generated in years beginning after December 22, 2010 can be carried forward for an unlimited period, whereas previous losses expire in 8 tax years. Capital losses with an expiration period may not be used to offset capital gains until all net capital losses without an expiration date have been utilized. Capital loss carryforwards with no expiration date will retain their character as either short-term or long-term capital losses instead of as short-term capital losses as under prior law. The ability to utilize capital loss carryforward in the future may be limited under the Internal Revenue Code and related regulations based on the results of future transactions.
The Fund utilized $3,192,675 of capital loss carryforward in the current period to offset net realized capital gain for federal income tax purposes. The Fund has a capital loss carryforward as of December 31, 2013, which expires as follows:
| Capital Loss Carryforward* | ||||||||||||
| Expiration | Short-Term | Long-Term | Total | |||||||||
December 31, 2017 | $ | 308,747 | $ | — | $ | 308,747 | ||||||
December 31, 2018 | 454,222 | — | 454,222 | |||||||||
Total capital loss carryforward | $ | 762,969 | $ | — | $ | 762,969 | ||||||
| * | Capital loss carryforward as of the date listed above is reduced for limitations, if any, to the extent required by the Internal Revenue Code and may be further limited depending upon a variety of factors, including the realization of net unrealized gains or losses as of the date of any reorganization. |
NOTE 8—Investment Securities
The aggregate amount of investment securities (other than short-term securities, U.S. Treasury obligations and money market funds, if any) purchased and sold by the Fund during the year ended December 31, 2013 was $93,316,021 and $36,168,290, respectively. Cost of investments on a tax basis includes the adjustments for financial reporting purposes as of the most recently completed federal income tax reporting period-end.
| Unrealized Appreciation (Depreciation) of Investment Securities on a Tax Basis | ||||
Aggregate unrealized appreciation of investment securities | $ | 1,451,588 | ||
Aggregate unrealized (depreciation) of investment securities | (3,347,916 | ) | ||
Net unrealized appreciation (depreciation) of investment securities | $ | (1,896,328 | ) | |
Cost of investments for tax purposes is $181,517,368.
NOTE 9—Reclassification of Permanent Differences
Primarily as a result of differing book/tax treatment of distributions from underlying funds on December 31, 2013, undistributed net investment income was increased by $65,929 and undistributed net realized gain (loss) was decreased by $65,929. This reclassification had no effect on the net assets of the Fund.
18 Invesco Income Allocation Fund
NOTE 10—Share Information
| Summary of Share Activity | ||||||||||||||||
| Years ended December 31, | ||||||||||||||||
| 2013(a) | 2012 | |||||||||||||||
| Shares | Amount | Shares | Amount | |||||||||||||
Sold: | ||||||||||||||||
Class A | 6,302,752 | $ | 66,696,433 | 2,833,744 | $ | 28,782,224 | ||||||||||
Class B | 96,462 | 1,022,570 | 125,081 | 1,264,189 | ||||||||||||
Class C | 2,192,131 | 23,321,703 | 614,478 | 6,239,154 | ||||||||||||
Class R | 70,996 | 755,320 | 93,036 | 936,093 | ||||||||||||
Class Y | 270,780 | 2,885,674 | 171,353 | 1,753,048 | ||||||||||||
Class R5 | 10,426 | 111,104 | 20,853 | 213,827 | ||||||||||||
Issued as reinvestment of dividends: | ||||||||||||||||
Class A | 303,609 | 3,195,604 | 217,470 | 2,199,080 | ||||||||||||
Class B | 11,935 | 125,791 | 14,603 | 147,470 | ||||||||||||
Class C | 69,283 | 729,683 | 51,076 | 516,445 | ||||||||||||
Class R | 5,719 | 60,294 | 5,262 | 53,334 | ||||||||||||
Class Y | 7,712 | 81,094 | 4,547 | 46,052 | ||||||||||||
Class R5 | 949 | 9,985 | 345 | 3,520 | ||||||||||||
Automatic conversion of Class B shares to Class A shares: | ||||||||||||||||
Class A | 77,760 | 825,697 | 85,209 | 854,521 | ||||||||||||
Class B | (77,720 | ) | (825,697 | ) | (85,359 | ) | (854,521 | ) | ||||||||
Reacquired: | ||||||||||||||||
Class A | (2,620,452 | ) | (27,633,753 | ) | (1,522,938 | ) | (15,350,231 | ) | ||||||||
Class B | (124,210 | ) | (1,312,921 | ) | (163,555 | ) | (1,645,039 | ) | ||||||||
Class C | (964,030 | ) | (10,179,983 | ) | (520,556 | ) | (5,246,640 | ) | ||||||||
Class R | (68,273 | ) | (723,905 | ) | (37,306 | ) | (375,279 | ) | ||||||||
Class Y | (247,856 | ) | (2,611,846 | ) | (110,276 | ) | (1,100,652 | ) | ||||||||
Class R5 | (6,717 | ) | (71,181 | ) | (2,144 | ) | (22,103 | ) | ||||||||
Net increase in share activity | 5,311,256 | $ | 56,461,666 | 1,794,923 | $ | 18,414,492 | ||||||||||
| (a) | There are entities that are record owners of more than 5% of the outstanding shares of the Fund and in the aggregate own 52% of the outstanding shares of the Fund. IDI has an agreement with these entities to sell Fund shares. The Fund, Invesco and/or Invesco affiliates may make payments to these entities, which are considered to be related to the Fund, for providing services to the Fund, Invesco and/or Invesco affiliates including but not limited to services such as securities brokerage, distribution, third party record keeping and account servicing. The Fund has no knowledge as to whether all or any portion of the shares owned of record by these entities are also owned beneficially. |
19 Invesco Income Allocation Fund
NOTE 11—Financial Highlights
The following schedule presents financial highlights for a share of the Fund outstanding throughout the periods indicated.
| Net asset value, beginning of period | Net investment income(a) | Net gains (losses) on securities (both realized and unrealized) | Total from investment operations | Dividends from net investment income | Net asset value, end of period | Total return(b) | Net assets, end of period (000’s omitted) | Ratio of expenses to average net assets with fee waivers and/or expenses absorbed(c) | Ratio of expenses to average net assets without fee waivers and/or expenses absorbed | Ratio of net investment income to average net assets | Portfolio turnover(d) | |||||||||||||||||||||||||||||||||||||
Class A | ||||||||||||||||||||||||||||||||||||||||||||||||
Year ended 12/31/13 | $ | 10.38 | $ | 0.36 | $ | 0.31 | $ | 0.67 | $ | (0.36 | ) | $ | 10.69 | 6.53 | % | $ | 131,485 | 0.25 | %(e) | 0.56 | %(e) | 3.39 | %(e) | 24 | % | |||||||||||||||||||||||
Year ended 12/31/12 | 9.62 | 0.40 | 0.72 | 1.12 | (0.36 | ) | 10.38 | 11.83 | 85,518 | 0.26 | 0.63 | 3.96 | 20 | |||||||||||||||||||||||||||||||||||
Year ended 12/31/11 | 9.64 | 0.39 | (0.05 | ) | 0.34 | (0.36 | ) | 9.62 | 3.54 | 63,727 | 0.28 | 0.65 | 4.00 | 11 | ||||||||||||||||||||||||||||||||||
Year ended 12/31/10 | 9.13 | 0.40 | 0.50 | 0.90 | (0.39 | ) | 9.64 | 10.02 | 55,556 | 0.28 | 0.67 | 4.22 | 16 | |||||||||||||||||||||||||||||||||||
Year ended 12/31/09 | 7.94 | 0.41 | 1.19 | 1.60 | (0.41 | ) | 9.13 | 20.80 | 49,394 | 0.28 | 0.74 | 4.94 | 20 | |||||||||||||||||||||||||||||||||||
Class B | ||||||||||||||||||||||||||||||||||||||||||||||||
Year ended 12/31/13 | 10.39 | 0.28 | 0.31 | 0.59 | (0.28 | ) | 10.70 | 5.73 | 5,157 | 1.00 | (e) | 1.31 | (e) | 2.64 | (e) | 24 | ||||||||||||||||||||||||||||||||
Year ended 12/31/12 | 9.63 | 0.32 | 0.72 | 1.04 | (0.28 | ) | 10.39 | 10.98 | 5,980 | 1.01 | 1.38 | 3.21 | 20 | |||||||||||||||||||||||||||||||||||
Year ended 12/31/11 | 9.65 | 0.31 | (0.05 | ) | 0.26 | (0.28 | ) | 9.63 | 2.77 | 6,592 | 1.03 | 1.40 | 3.25 | 11 | ||||||||||||||||||||||||||||||||||
Year ended 12/31/10 | 9.13 | 0.33 | 0.51 | 0.84 | (0.32 | ) | 9.65 | 9.31 | 6,811 | 1.03 | 1.42 | 3.47 | 16 | |||||||||||||||||||||||||||||||||||
Year ended 12/31/09 | 7.95 | 0.35 | 1.18 | 1.53 | (0.35 | ) | 9.13 | 19.74 | 6,573 | 1.03 | 1.49 | 4.19 | 20 | |||||||||||||||||||||||||||||||||||
Class C | ||||||||||||||||||||||||||||||||||||||||||||||||
Year ended 12/31/13 | 10.39 | 0.28 | 0.31 | 0.59 | (0.28 | ) | 10.70 | 5.73 | 38,400 | 1.00 | (e) | 1.31 | (e) | 2.64 | (e) | 24 | ||||||||||||||||||||||||||||||||
Year ended 12/31/12 | 9.63 | 0.32 | 0.72 | 1.04 | (0.28 | ) | 10.39 | 10.98 | 23,814 | 1.01 | 1.38 | 3.21 | 20 | |||||||||||||||||||||||||||||||||||
Year ended 12/31/11 | 9.65 | 0.31 | (0.05 | ) | 0.26 | (0.28 | ) | 9.63 | 2.77 | 20,669 | 1.03 | 1.40 | 3.25 | 11 | ||||||||||||||||||||||||||||||||||
Year ended 12/31/10 | 9.14 | 0.33 | 0.50 | 0.83 | (0.32 | ) | 9.65 | 9.18 | 19,802 | 1.03 | 1.42 | 3.47 | 16 | |||||||||||||||||||||||||||||||||||
Year ended 12/31/09 | 7.95 | 0.35 | 1.19 | 1.54 | (0.35 | ) | 9.14 | 19.87 | 20,859 | 1.03 | 1.49 | 4.19 | 20 | |||||||||||||||||||||||||||||||||||
Class R | ||||||||||||||||||||||||||||||||||||||||||||||||
Year ended 12/31/13 | 10.38 | 0.33 | 0.31 | 0.64 | (0.33 | ) | 10.69 | 6.27 | 2,046 | 0.50 | (e) | 0.81 | (e) | 3.14 | (e) | 24 | ||||||||||||||||||||||||||||||||
Year ended 12/31/12 | 9.62 | 0.38 | 0.72 | 1.10 | (0.34 | ) | 10.38 | 11.55 | 1,899 | 0.51 | 0.88 | 3.71 | 20 | |||||||||||||||||||||||||||||||||||
Year ended 12/31/11 | 9.65 | 0.36 | (0.06 | ) | 0.30 | (0.33 | ) | 9.62 | 3.18 | 1,173 | 0.53 | 0.90 | 3.75 | 11 | ||||||||||||||||||||||||||||||||||
Year ended 12/31/10 | 9.13 | 0.37 | 0.51 | 0.88 | (0.36 | ) | 9.65 | 9.86 | 1,078 | 0.53 | 0.92 | 3.97 | 16 | |||||||||||||||||||||||||||||||||||
Year ended 12/31/09 | 7.95 | 0.39 | 1.18 | 1.57 | (0.39 | ) | 9.13 | 20.34 | 721 | 0.53 | 0.99 | 4.69 | 20 | |||||||||||||||||||||||||||||||||||
Class Y | ||||||||||||||||||||||||||||||||||||||||||||||||
Year ended 12/31/13 | 10.38 | 0.38 | 0.31 | 0.69 | (0.38 | ) | 10.69 | 6.80 | 2,697 | 0.00 | (e) | 0.31 | (e) | 3.64 | (e) | 24 | ||||||||||||||||||||||||||||||||
Year ended 12/31/12 | 9.62 | 0.43 | 0.72 | 1.15 | (0.39 | ) | 10.38 | 12.12 | 2,302 | 0.01 | 0.38 | 4.21 | 20 | |||||||||||||||||||||||||||||||||||
Year ended 12/31/11 | 9.65 | 0.41 | (0.06 | ) | 0.35 | (0.38 | ) | 9.62 | 3.70 | 1,502 | 0.03 | 0.40 | 4.25 | 11 | ||||||||||||||||||||||||||||||||||
Year ended 12/31/10 | 9.13 | 0.42 | 0.51 | 0.93 | (0.41 | ) | 9.65 | 10.42 | 757 | 0.03 | 0.42 | 4.47 | 16 | |||||||||||||||||||||||||||||||||||
Year ended 12/31/09 | 7.94 | 0.44 | 1.18 | 1.62 | (0.43 | ) | 9.13 | 21.10 | 459 | 0.03 | 0.49 | 5.19 | 20 | |||||||||||||||||||||||||||||||||||
Class R5 | ||||||||||||||||||||||||||||||||||||||||||||||||
Year ended 12/31/13 | 10.38 | 0.38 | 0.31 | 0.69 | (0.38 | ) | 10.69 | 6.80 | 283 | 0.00 | (e) | 0.27 | (e) | 3.64 | (e) | 24 | ||||||||||||||||||||||||||||||||
Year ended 12/31/12 | 9.62 | 0.43 | 0.72 | 1.15 | (0.39 | ) | 10.38 | 12.12 | 227 | 0.01 | 0.30 | 4.21 | 20 | |||||||||||||||||||||||||||||||||||
Year ended 12/31/11 | 9.64 | 0.41 | (0.05 | ) | 0.36 | (0.38 | ) | 9.62 | 3.81 | 27 | 0.03 | 0.34 | 4.25 | 11 | ||||||||||||||||||||||||||||||||||
Year ended 12/31/10 | 9.13 | 0.42 | 0.50 | 0.92 | (0.41 | ) | 9.64 | 10.30 | 11 | 0.03 | 0.33 | 4.47 | 16 | |||||||||||||||||||||||||||||||||||
Year ended 12/31/09 | 7.94 | 0.43 | 1.19 | 1.62 | (0.43 | ) | 9.13 | 21.10 | 10 | 0.04 | 0.39 | 5.18 | 20 | |||||||||||||||||||||||||||||||||||
| (a) | Calculated using average shares outstanding. |
| (b) | Includes adjustments in accordance with accounting principles generally accepted in the United States of America and as such, the net asset value for financial reporting purposes and the returns based upon those net asset values may differ from the net asset value and returns for shareholder transactions. Does not include sales charges and is not annualized for periods less than one year, if applicable. |
| (c) | In addition to the fees and expenses which the Fund bears directly; the Fund indirectly bears a pro rata share of the fees and expenses of the underlying funds in which the Fund invests. Because the underlying funds have varied expenses and fee levels and the Fund may own different proportions at different times, the amount of fees and expenses incurred indirectly by the Fund will vary. Estimated underlying fund expenses are not expenses that are incurred directly by your Fund. They are expenses that are incurred directly by the underlying funds and are deducted from the value of the funds your Fund invests in. The effect of the estimated underlying fund expenses that you bear indirectly is included in your Fund’s total return. Estimated acquired fund fees from underlying funds were 0.60%, 0.65%, 0.65%, 0.60% and 0.62% for the years ended December 31, 2013, December 31, 2012, December 31, 2011, December 31, 2010 and December 31, 2009, respectively. |
| (d) | Portfolio turnover is calculated at the fund level and is not annualized for periods less than one year, if applicable. |
| (e) | Ratios are based on average daily net assets (000’s omitted) of $109,133, $5,599, $31,422, $1,976, $2,757 and $281 for Class A, Class B, Class C, Class R, Class Y, and Class R5 shares, respectively. |
20 Invesco Income Allocation Fund
Report of Independent Registered Public Accounting Firm
To the Board of Trustees of AIM Growth Series (Invesco Growth Series)
and Shareholders of Invesco Income Allocation Fund:
In our opinion, the accompanying statement of assets and liabilities, including the schedule of investments, and the related statements of operations and of changes in net assets and the financial highlights present fairly, in all material respects, the financial position of Invesco Income Allocation Fund (one of the funds constituting AIM Growth Series (Invesco Growth Series), hereafter referred to as the “Fund”) at December 31, 2013, the results of its operations for the year then ended, the changes in its net assets for each of the two years in the period then ended and the financial highlights for each of the five years in the period then ended, in conformity with accounting principles generally accepted in the United States of America. These financial statements and financial highlights (hereafter referred to as “financial statements”) are the responsibility of the Fund’s management; our responsibility is to express an opinion on these financial statements based on our audits. We conducted our audits of these financial statements in accordance with the standards of the Public Company Accounting Oversight Board (United States). Those standards require that we plan and perform the audit to obtain reasonable assurance about whether the financial statements are free of material misstatement. An audit includes examining, on a test basis, evidence supporting the amounts and disclosures in the financial statements, assessing the accounting principles used and significant estimates made by management, and evaluating the overall financial statement presentation. We believe that our audits, which included confirmation of securities at December 31, 2013 by correspondence with the custodian and transfer agent, provide a reasonable basis for our opinion.
PRICEWATERHOUSECOOPERS LLP
February 26, 2014
Houston, Texas
21 Invesco Income Allocation Fund
Calculating your ongoing Fund expenses
Example
As a shareholder of the Fund, you incur two types of costs: (1) transaction costs, which may include sales charges (loads) on purchase payments or contingent deferred sales charges on redemptions, if any; and (2) ongoing costs, including distribution and/or service (12b-1) fees, and other Fund expenses. This example is intended to help you understand your ongoing costs (in dollars) of investing in the Fund and to compare these costs with ongoing costs of investing in other mutual funds. The example is based on an investment of $1,000 invested at the beginning of the period and held for the entire period July 1, 2013, through December 31, 2013.
In addition to the fees and expenses which the Fund bears directly, the Fund indirectly bears a pro rata share of the fees and expenses of the underlying funds in which your Fund invests. The amount of fees and expenses incurred indirectly by your Fund will vary because the underlying funds have varied expenses and fee levels and the Fund may own different proportions of the underlying funds at different times. Estimated underlying fund expenses are not expenses that are incurred directly by your Fund. They are expenses that are incurred directly by the underlying funds and are deducted from the value of the underlying funds your Fund invests in. The effect of the estimated underlying fund expenses that you bear indirectly are included in your Fund’s total return.
Actual expenses
The table below provides information about actual account values and actual expenses. You may use the information in this table, together with the amount you invested, to estimate the expenses that you paid over the period. Simply divide your account value by $1,000 (for example, an $8,600 account value divided by $1,000 = 8.6), then multiply the result by the number in the table under the heading entitled “Actual Expenses Paid During Period” to estimate the expenses you paid on your account during this period.
Hypothetical example for comparison purposes
The table below also provides information about hypothetical account values and hypothetical expenses based on the Fund’s actual expense ratio and an assumed rate of return of 5% per year before expenses, which is not the Fund’s actual return.
The hypothetical account values and expenses may not be used to estimate the actual ending account balance or expenses you paid for the period. You may use this information to compare the ongoing costs of investing in the Fund and other funds. To do so, compare this 5% hypothetical example with the 5% hypothetical examples that appear in the shareholder reports of the other funds.
Please note that the expenses shown in the table are meant to highlight your ongoing costs only and do not reflect any transaction costs, such as sales charges (loads) on purchase payments or contingent deferred sales charges on redemptions, if any. Therefore, the hypothetical information is useful in comparing ongoing costs only, and will not help you determine the relative total costs of owning different funds. In addition, expenses shown in the table do not include the expenses of the underlying funds, which are borne indirectly by the Fund. If transaction costs and indirect expenses were included, your costs would have been higher.
| Class | Beginning Account Value (07/01/13) | ACTUAL | HYPOTHETICAL (5% annual return before | Annualized Expense Ratio | ||||||||||||||||||||
| Ending Account Value (12/31/13)1 | Expenses Paid During Period2 | Ending Account Value (12/31/13) | Expenses Paid During Period2 | |||||||||||||||||||||
| A | $ | 1,000.00 | $ | 1,047.80 | $ | 1.29 | $ | 1,023.95 | $ | 1.28 | 0.25 | % | ||||||||||||
| B | 1,000.00 | 1,043.90 | 5.15 | 1,020.16 | 5.09 | 1.00 | ||||||||||||||||||
| C | 1,000.00 | 1,042.90 | 5.15 | 1,020.16 | 5.09 | 1.00 | ||||||||||||||||||
| R | 1,000.00 | 1,045.50 | 2.58 | 1,022.68 | 2.55 | 0.50 | ||||||||||||||||||
| Y | 1,000.00 | 1,049.10 | 0.00 | 1,025.21 | 0.00 | 0.00 | ||||||||||||||||||
| R5 | 1,000.00 | 1,048.10 | 0.00 | 1,025.21 | 0.00 | 0.00 | ||||||||||||||||||
| 1 | The actual ending account value is based on the actual total return of the Fund for the period July 1, 2013 through December 31, 2013, after actual expenses and will differ from the hypothetical ending account value which is based on the Fund’s expense ratio and a hypothetical annual return of 5% before expenses. |
| 2 | Expenses are equal to the Fund’s annualized expense ratio as indicated above multiplied by the average account value over the period, multiplied by 184/365 to reflect the most recent fiscal half year. |
22 Invesco Income Allocation Fund
Tax Information
Form 1099-DIV, Form 1042-S and other year–end tax information provide shareholders with actual calendar year amounts that should be included in their tax returns. Shareholders should consult their tax advisors.
The following distribution information is being provided as required by the Internal Revenue Code or to meet a specific state’s requirement.
The Fund designates the following amounts or, if subsequently determined to be different, the maximum amount allowable for its fiscal year ended December 31, 2013:
Federal and State Income Tax | ||||
Qualified Dividend Income* | 35.00 | % | ||
Corporate Dividends Received Deduction* | 29.25 | % | ||
U.S. Treasury Obligations* | 1.66 | % | ||
| * | The above percentages are based on ordinary income dividends paid to shareholders during the Fund’s fiscal year. |
23 Invesco Income Allocation Fund
Trustees and Officers
The address of each trustee and officer is AIM Growth Series (Invesco Growth Series) (the “Trust”), 11 Greenway Plaza, Suite 1000, Houston, Texas 77046-1173. The trustees serve for the life of the Trust, subject to their earlier death, incapacitation, resignation, retirement or removal as more specifically provided in the Trust’s organizational documents. Each officer serves for a one year term or until their successors are elected and qualified. Column two below includes length of time served with predecessor entities, if any.
| Name, Year of Birth and Position(s) Held with the Trust | Trustee and/ or Officer Since | Principal Occupation(s) During Past 5 Years | Number of Funds in Fund Complex Overseen by Trustee | Other Directorship(s) Held by Trustee During Past 5 Years | ||||
| Interested Persons | ||||||||
| Martin L. Flanagan1 — 1960 Trustee | 2007 | Executive Director, Chief Executive Officer and President, Invesco Ltd. (ultimate parent of Invesco and a global investment management firm); Advisor to the Board, Invesco Advisers, Inc. (formerly known as Invesco Institutional (N.A.), Inc.); Trustee, The Invesco Funds; Vice Chair, Investment Company Institute; and Member of Executive Board, SMU Cox School of Business
Formerly: Chairman and Chief Executive Officer, Invesco Advisers, Inc. (registered investment adviser); Director, Chairman, Chief Executive Officer and President, IVZ Inc. (holding company), INVESCO Group Services, Inc. (service provider) and Invesco North American Holdings, Inc. (holding company); Director, Chief Executive Officer and President, Invesco Holding Company Limited (parent of Invesco and a global investment management firm); Director, Invesco Ltd.; Chairman, Investment Company Institute and President, Co-Chief Executive Officer, Co-President, Chief Operating Officer and Chief Financial Officer, Franklin Resources, Inc. (global investment management organization) | 123 | None | ||||
| Philip A. Taylor2 — 1954 Trustee, President and Principal Executive Officer | 2006 | Head of North American Retail and Senior Managing Director, Invesco Ltd.; Director, Co-Chairman, Co-President and Co-Chief Executive Officer, Invesco Advisers, Inc. (formerly known as Invesco Institutional (N.A.), Inc.) (registered investment adviser); Director, Chairman, Chief Executive Officer and President, Invesco Management Group, Inc. (formerly known as Invesco Aim Management Group, Inc.) (financial services holding company); Director and President, INVESCO Funds Group, Inc. (registered investment adviser and registered transfer agent); Director and Chairman, Invesco Investment Services, Inc. (formerly known as Invesco Aim Investment Services, Inc.) (registered transfer agent) and IVZ Distributors, Inc. (formerly known as INVESCO Distributors, Inc.) (registered broker dealer); Director, President and Chairman, Invesco Inc. (holding company) and Invesco Canada Holdings Inc. (holding company); Chief Executive Officer, Invesco Corporate Class Inc. (corporate mutual fund company) and Invesco Canada Fund Inc. (corporate mutual fund company); Director, Chairman and Chief Executive Officer, Invesco Canada Ltd. (formerly known as Invesco Trimark Ltd./Invesco Trimark Ltèe) (registered investment adviser and registered transfer agent); Trustee, President and Principal Executive Officer, The Invesco Funds (other than AIM Treasurer’s Series Trust (Invesco Treasurer’s Series Trust) and Short-Term Investments Trust); Trustee and Executive Vice President, The Invesco Funds (AIM Treasurer’s Series Trust (Invesco Treasurer’s Series Trust) and Short-Term Investments Trust only); Director, Invesco Investment Advisers LLC (formerly known as Van Kampen Asset Management); Director, Chief Executive Officer and President, Van Kampen Exchange Corp.
Formerly: Director and Chairman, Van Kampen Investor Services Inc.: Director, Chief Executive Officer and President, 1371 Preferred Inc. (holding company); and Van Kampen Investments Inc.; Director and President, AIM GP Canada Inc. (general partner for limited partnerships); and Van Kampen Advisors, Inc.; Director and Chief Executive Officer, Invesco Trimark Dealer Inc. (registered broker dealer); Director, Invesco Distributors, Inc. (formerly known as Invesco Aim Distributors, Inc.) (registered broker dealer); Manager, Invesco PowerShares Capital Management LLC; Director, Chief Executive Officer and President, Invesco Advisers, Inc.; Director, Chairman, Chief Executive Officer and President, Invesco Aim Capital Management, Inc.; President, Invesco Trimark Dealer Inc. and Invesco Trimark Ltd./Invesco Trimark Lt��e; Director and President, AIM Trimark Corporate Class Inc. and AIM Trimark Canada Fund Inc.; Senior Managing Director, Invesco Holding Company Limited; Trustee and Executive Vice President, Tax-Free Investments Trust; Director and Chairman, Fund Management Company (former registered broker dealer); President and Principal Executive Officer, The Invesco Funds (AIM Treasurer’s Series Trust (Invesco Treasurer’s Series Trust), Short-Term Investments Trust and Tax-Free Investments Trust only); President, AIM Trimark Global Fund Inc. and AIM Trimark Canada Fund Inc. | 123 | None | ||||
Wayne W. Whalen3 — 1939 Trustee | 2010 | Of Counsel, and prior to 2010, partner in the law firm of Skadden, Arps, Slate, Meagher & Flom LLP, legal counsel to certain funds in the Fund Complex | 136 | Director of the Mutual Fund Directors Forum, a nonprofit membership organization for investment directors; Chairman and Director of the Abraham Lincoln Presidential Library Foundation; and Director of the Stevenson Center for Democracy |
| 1 | Mr. Flanagan is considered an interested person of the Trust because he is an officer of the adviser to the Trust, and an officer and a director of Invesco Ltd., ultimate parent of the adviser to the Trust. |
| 2 | Mr. Taylor is considered an interested person of the Trust because he is an officer and a director of the adviser to, and a director of the principal underwriter of, the Trust. |
| 3 | Mr. Whalen is considered an “interested person” (within the meaning of Section 2(a)(19) of the 1940 Act) of certain Funds in the Invesco Fund Complex because he and his firm currently provide legal services as legal counsel to such Funds. |
T-1 Invesco Income Allocation Fund
Trustees and Officers—(continued)
| Name, Year of Birth and Position(s) Held with the Trust | Trustee and/ or Officer Since | Principal Occupation(s) During Past 5 Years | Number of Funds in Fund Complex Overseen by Trustee | Other Directorship(s) Held by Trustee During Past 5 Years | ||||
| Independent Trustees | ||||||||
Bruce L. Crockett — 1944 Trustee and Chair | 2001 | Chairman, Crockett Technologies Associates (technology consulting company)
Formerly: Director, Captaris (unified messaging provider); Director, President and Chief Executive Officer COMSAT Corporation; and Chairman, Board of Governors of INTELSAT (international communications company) | 123 | ACE Limited (insurance company); Investment Company Institute | ||||
David C. Arch — 1945 Trustee | 2010 | Chairman and Chief Executive Officer of Blistex Inc., (consumer health care products manufacturer)
Formerly: Member of the Heartland Alliance Advisory Board, a nonprofit organization serving human needs based in Chicago | 136 | Board member of the Illinois Manufacturers’ Association; Member of the Board of Visitors, Institute for the Humanities, University of Michigan | ||||
Frank S. Bayley — 1939 Trustee | 1985 | Retired
Formerly: Director, Badgley Funds, Inc. (registered investment company) (2 portfolios) and General Partner and Of Counsel, law firm of Baker & McKenzie, LLP | 123 | Director and Chairman, C.D. Stimson Company (a real estate investment company); Trustee and Overseer, The Curtis Institute of Music | ||||
James T. Bunch — 1942 Trustee | 2003 | Managing Member, Grumman Hill Group LLC (family office private equity management)
Formerly: Founder, Green, Manning & Bunch Ltd. (investment banking firm) (1988-2010); Executive Committee, United States Golf Association; and Director, Policy Studies, Inc. and Van Gilder Insurance Corporation | 123 | Chairman, Board of Governors, Western Golf Association; Chairman-elect, Evans Scholars Foundation; and Director, Denver Film Society | ||||
Rodney F. Dammeyer — 1940 Trustee | 2010 | Chairman of CAC, LLC, (private company offering capital investment and management advisory services)
Formerly: Prior to 2001, Managing Partner at Equity Group Corporate Investments; Prior to 1995, Chief Executive Officer of Itel Corporation (formerly Anixter International); Prior to 1985, experience includes Senior Vice President and Chief Financial Officer of Household International, Inc., Executive Vice President and Chief Financial Officer of Northwest Industries, Inc. and Partner of Arthur Andersen & Co.; From 1987 to 2010, Director/Trustee of investment companies in the Van Kampen Funds complex | 123 | Director of Quidel Corporation and Stericycle, Inc.; Prior to May 2008, Trustee of The Scripps Research Institute; Prior to February 2008, Director of Ventana Medical Systems, Inc. | ||||
Albert R. Dowden — 1941 Trustee | 2001 | Director of a number of public and private business corporations, including the Boss Group, Ltd. (private investment and management); and Reich & Tang Funds (5 portfolios) (registered investment company)
Formerly: Director, Homeowners of America Holding Corporation/Homeowners of America Insurance Company (property casualty company); Director, Continental Energy Services, LLC (oil and gas pipeline service); Director, CompuDyne Corporation (provider of product and services to the public security market) and Director, Annuity and Life Re (Holdings), Ltd. (reinsurance company); Director, President and Chief Executive Officer, Volvo Group North America, Inc.; Senior Vice President, AB Volvo; Director of various public and private corporations; Chairman, DHJ Media, Inc.; Director, Magellan Insurance Company; and Director, The Hertz Corporation, Genmar Corporation (boat manufacturer), National Media Corporation; Advisory Board of Rotary Power International (designer, manufacturer, and seller of rotary power engines); and Chairman, Cortland Trust, Inc. (registered investment company) | 123 | Director of Nature’s Sunshine Products, Inc. | ||||
Jack M. Fields — 1952 Trustee | 2001 | Chief Executive Officer, Twenty First Century Group, Inc. (government affairs company); Owner and Chief Executive Officer, Dos Angeles Ranch, L.P. (cattle, hunting, corporate entertainment); and Discovery Global Education Fund (non-profit)
Formerly: Chief Executive Officer, Texana Timber LP (sustainable forestry company); Director of Cross Timbers Quail Research Ranch (non-profit); and member of the U.S. House of Representatives | 123 | Insperity, Inc. (formerly known as Administaff) | ||||
Prema Mathai-Davis — 1950 Trustee | 2001 | Retired
Formerly: Chief Executive Officer, YWCA of the U.S.A. | 123 | None | ||||
Larry Soll — 1942 Trustee | 2003 | Retired
Formerly: Chairman, Chief Executive Officer and President, Synergen Corp. (a biotechnology company) | 123 | None | ||||
Hugo F. Sonnenschein — 1940 Trustee | 2010 | Distinguished Service Professor and President Emeritus of the University of Chicago and the Adam Smith Distinguished Service Professor in the Department of Economics at the University of Chicago
Formerly: President of the University of Chicago | 136 | Trustee of the University of Rochester and a member of its investment committee. Member of the National Academy of Sciences, the American Philosophical Society and a fellow of the American Academy of Arts and Sciences |
T-2 Invesco Income Allocation Fund
Trustees and Officers—(continued)
| Name, Year of Birth and Position(s) Held with the Trust | Trustee and/ or Officer Since | Principal Occupation(s) During Past 5 Years | Number of Funds in Fund Complex Overseen by Trustee | Other Directorship(s) Held by Trustee During Past 5 Years | ||||
| Independent Trustees—(continued) | ||||||||
Raymond Stickel, Jr. — 1944 Trustee | 2005 | Retired
Formerly: Director, Mainstay VP Series Funds, Inc. (25 portfolios) and Partner, Deloitte & Touche | 123 | None | ||||
| Other Officers | ||||||||
| Russell C. Burk — 1958 Senior Vice President and Senior Officer | 2005 | Senior Vice President and Senior Officer, The Invesco Funds | N/A | N/A | ||||
| John M. Zerr — 1962 Senior Vice President, Chief Legal Officer and Secretary | 2006 | Director, Senior Vice President, Secretary and General Counsel, Invesco Management Group, Inc. (formerly known as Invesco Aim Management Group, Inc.) and Van Kampen Exchange Corp.; Senior Vice President, Invesco Advisers, Inc. (formerly known as Invesco Institutional (N.A.), Inc.) (registered investment adviser); Senior Vice President and Secretary, Invesco Distributors, Inc. (formerly known as Invesco Aim Distributors, Inc.); Director, Vice President and Secretary, Invesco Investment Services, Inc. (formerly known as Invesco Aim Investment Services, Inc.) and IVZ Distributors, Inc. (formerly known as INVESCO Distributors, Inc.); Director and Vice President, INVESCO Funds Group, Inc.; Senior Vice President, Chief Legal Officer and Secretary, The Invesco Funds; Manager, Invesco PowerShares Capital Management LLC; Director, Secretary and General Counsel, Invesco Investment Advisers LLC (formerly known as Van Kampen Asset Management); Secretary and General Counsel, Invesco Capital Markets, Inc. (formerly known as Van Kampen Funds Inc.) and Chief Legal Officer, PowerShares Exchange-Traded Fund Trust, PowerShares Exchange-Traded Fund Trust II, PowerShares India Exchange-Traded Fund Trust and PowerShares Actively Managed Exchange-Traded Fund Trust
Formerly: Director and Vice President, Van Kampen Advisors Inc.; Director, Vice President, Secretary and General Counsel, Van Kampen Investor Services Inc.; Director, Invesco Distributors, Inc. (formerly known as Invesco Aim Distributors, Inc.); Director, Senior Vice President, General Counsel and Secretary, Invesco Aim Advisers, Inc. and Van Kampen Investments Inc.; Director, Vice President and Secretary, Fund Management Company; Director, Senior Vice President, Secretary, General Counsel and Vice President, Invesco Aim Capital Management, Inc.; Chief Operating Officer and General Counsel, Liberty Ridge Capital, Inc. (an investment adviser); Vice President and Secretary, PBHG Funds (an investment company) and PBHG Insurance Series Fund (an investment company); Chief Operating Officer, General Counsel and Secretary, Old Mutual Investment Partners (a broker-dealer); General Counsel and Secretary, Old Mutual Fund Services (an administrator) and Old Mutual Shareholder Services (a shareholder servicing center); Executive Vice President, General Counsel and Secretary, Old Mutual Capital, Inc. (an investment adviser); and Vice President and Secretary, Old Mutual Advisors Funds (an investment company) | N/A | N/A | ||||
| Karen Dunn Kelley — 1960 Vice President | 2004 | Senior Managing Director, Investments; Director, Co-President, Co-Chief Executive Officer, and Co-Chairman, Invesco Advisers, Inc. (formerly known as Invesco Institutional (N.A.), Inc.) (registered investment adviser); Chairman, Invesco Senior Secured Management, Inc.; Senior Vice President, Invesco Management Group, Inc. (formerly known as Invesco Aim Management Group, Inc.); Executive Vice President, Invesco Distributors, Inc. (formerly known as Invesco Aim Distributors, Inc.); Director, Invesco Mortgage Capital Inc., and Invesco Management Company Limited; Director and President, INVESCO Asset Management (Bermuda) Ltd., Vice President, The Invesco Funds (other than AIM Treasurer’s Series Trust (Invesco Treasurer’s Series Trust) and Short-Term Investments Trust); and President and Principal Executive Officer, The Invesco Funds (AIM Treasurer’s Series Trust (Invesco Treasurer’s Series Trust) and Short-Term Investments Trust only)
Formerly: Director, INVESCO Global Asset Management Limited and INVESCO Management S.A.; Senior Vice President, Van Kampen Investments Inc. and Invesco Advisers, Inc. (formerly known as Invesco Institutional (N.A.), Inc.) (registered investment adviser); Vice President, Invesco Advisers, Inc. (formerly known as Invesco Institutional (N.A.), Inc.); Director of Cash Management and Senior Vice President, Invesco Advisers, Inc. and Invesco Aim Capital Management, Inc.; President and Principal Executive Officer, Tax-Free Investments Trust; Director and President, Fund Management Company; Chief Cash Management Officer, Director of Cash Management, Senior Vice President, and Managing Director, Invesco Aim Capital Management, Inc.; Director of Cash Management, Senior Vice President, and Vice President, Invesco Advisers, Inc. and The Invesco Funds (AIM Treasurer’s Series Trust (Invesco Treasurer’s Series Trust), Short-Term Investments Trust and Tax-Free Investments Trust only) | N/A | N/A | ||||
T-3 Invesco Income Allocation Fund
Trustees and Officers—(continued)
| Name, Year of Birth and Position(s) Held with the Trust | Trustee and/ or Officer Since | Principal Occupation(s) During Past 5 Years | Number of Funds in Fund Complex Overseen by Trustee | Other Directorship(s) Held by Trustee During Past 5 Years | ||||
| Other Officers—(continued) | ||||||||
| Sheri Morris — 1964 Vice President, Treasurer and Principal Financial Officer | 1999 | Vice President, Treasurer and Principal Financial Officer, The Invesco Funds; Vice President, Invesco Advisers, Inc. (formerly known as Invesco Institutional (N.A.), Inc.) (registered investment adviser); and Vice President, PowerShares Exchange-Traded Fund Trust, PowerShares Exchange-Traded Fund Trust II, PowerShares India Exchange-Traded Fund Trust and PowerShares Actively Managed Exchange-Traded Fund Trust
Formerly: Vice President, Invesco Aim Advisers, Inc., Invesco Aim Capital Management, Inc. and Invesco Aim Private Asset Management, Inc.; Assistant Vice President and Assistant Treasurer, The Invesco Funds and Assistant Vice President, Invesco Advisers, Inc., Invesco Aim Capital Management, Inc. and Invesco Aim Private Asset Management, Inc.; and Treasurer, PowerShares Exchange-Traded Fund Trust, PowerShares Exchange-Traded Fund Trust II, PowerShares India Exchange-Traded Fund Trust and PowerShares Actively Managed Exchange-Traded Fund Trust | N/A | N/A | ||||
Crissie M. Wisdom — 1969 Anti-Money Laundering Compliance Officer | 2013 | Anti-Money Laundering Compliance Officer, Invesco Advisers, Inc. (formerly known as Invesco Institutional (N.A.), Inc.) (registered investment adviser), Invesco Capital Markets, Inc. (formerly known as Van Kampen Funds Inc.), Invesco Distributors, Inc., Invesco Investment Services, Inc., Invesco Management Group, Inc., Van Kampen Exchange Corp., The Invesco Funds, Invesco Funds (Chicago), and PowerShares Exchange-Traded Fund Trust, PowerShares Exchange-Traded Fund Trust II, PowerShares India Exchange-Traded Fund Trust, and PowerShares Actively Managed Exchange-Traded Fund Trust; and Fraud Prevention Manager and Controls and Risk Analysis Manager for Invesco Investment Services, Inc. | N/A | N/A | ||||
| Todd L. Spillane — 1958 Chief Compliance Officer | 2006 | Senior Vice President, Invesco Management Group, Inc. (formerly known as Invesco Aim Management Group, Inc.) and Van Kampen Exchange Corp.; Senior Vice President and Chief Compliance Officer, Invesco Advisers, Inc. (registered investment adviser) (formerly known as Invesco Institutional (N.A.), Inc.); Chief Compliance Officer, The Invesco Funds; Vice President, Invesco Distributors, Inc. (formerly known as Invesco Aim Distributors, Inc.) and Invesco Investment Services, Inc. (formerly known as Invesco Aim Investment Services, Inc.)
Formerly: Chief Compliance Officer, Invesco Funds (Chicago); Senior Vice President, Van Kampen Investments Inc.; Senior Vice President and Chief Compliance Officer, Invesco Aim Advisers, Inc. and Invesco Aim Capital Management, Inc.; Chief Compliance Officer, INVESCO Private Capital Investments, Inc. (holding company), Invesco Private Capital, Inc. (registered investment adviser), Invesco Global Asset Management (N.A.), Inc., Invesco Senior Secured Management, Inc. (registered investment adviser), Van Kampen Investor Services Inc., PowerShares Exchange-Traded Fund Trust, PowerShares Exchange-Traded Fund Trust II, PowerShares India Exchange-Traded Fund Trust and PowerShares Actively Managed Exchange-Traded Fund Trust; and Vice President, Invesco Aim Capital Management, Inc. and Fund Management Company | N/A | N/A |
The Statement of Additional Information of the Trust includes additional information about the Fund’s Trustees and is available upon request, without charge, by calling 1.800.959.4246. Please refer to the Fund’s prospectus for information on the Fund’s sub-advisers.
Office of the Fund 11 Greenway Plaza, Suite 1000 Houston, TX 77046-1173 | Investment Adviser Invesco Advisers, Inc. 1555 Peachtree Street, N.E. Atlanta, GA 30309 | Distributor Invesco Distributors, Inc. 11 Greenway Plaza, Suite 1000 Houston, TX 77046-1173 | Auditors PricewaterhouseCoopers LLP 1201 Louisiana Street, Suite 2900 Houston, TX 77002-5678 | |||
Counsel to the Fund Stradley Ronon Stevens & Young, LLP 2005 Market Street, Suite 2600 Philadelphia, PA 19103-7018 | Counsel to the Independent Trustees Goodwin Procter LLP 901 New York Avenue, N.W. Washington, D.C. 20001 | Transfer Agent Invesco Investment Services, Inc. 11 Greenway Plaza, Suite 1000 Houston, TX 77046-1173 | Custodian State Street Bank and Trust Company 225 Franklin Street Boston, MA 02110-2801 | |||
T-4 Invesco Income Allocation Fund

Invesco mailing information
Send general correspondence to Invesco Investment Services, Inc., P.O. Box 219078, Kansas City, MO 64121-9078.
Invesco privacy policy
You share personal and financial information with us that is necessary for your transactions and your account records. We take very seriously the obligation to keep that information confidential and private.
Invesco collects nonpublic personal information about you from account applications or other forms you complete and from your transactions with us or our affiliates. We do not disclose information about you or our former customers to service providers or other third parties except to the extent necessary to service your account and in other limited circumstances as permitted by law. For example, we use this information to facilitate the delivery of transaction confirmations, financial reports, prospectuses and tax forms.
Even within Invesco, only people involved in the servicing of your accounts and compliance monitoring have access to your information. To ensure the highest level of confidentiality and security, Invesco maintains physical, electronic and procedural safeguards that meet or exceed federal standards. Special measures, such as data encryption and authentication, apply to your communications with us on our website. More detail is available to you at invesco.com/privacy.
Important notice regarding delivery of security holder documents
To reduce Fund expenses, only one copy of most shareholder documents may be mailed to shareholders with multiple accounts at the same address (Householding). Mailing of your shareholder documents may be householded indefinitely unless you instruct us otherwise. If you do not want the mailing of these documents to be combined with those for other members of your household, please contact Invesco Investment Services, Inc. at 800 959 4246 or contact your financial institution. We will begin sending you individual copies for each account within 30 days after receiving your request.
Fund holdings and proxy voting information
The Fund provides a complete list of its holdings four times in each fiscal year, at the quarter ends. For the second and fourth quarters, the lists appear in the Fund’s semiannual and annual reports to shareholders. For the first and third quarters, the Fund files the lists with the Securities and Exchange Commission (SEC) on Form N-Q. The most recent list of portfolio holdings is available at invesco.com/completeqtrholdings. Shareholders can also look up the Fund’s Forms N-Q on the SEC website at sec.gov. Copies of the Fund’s Forms N-Q may be reviewed and copied at the SEC Public Reference Room in Washington, D.C. You can obtain information on the operation of the Public Reference Room, including information about duplicating fee charges, by calling 202 551 8090 or 800 732 0330, or by electronic request at the following email address: publicinfo@sec.gov. The SEC file numbers for the Fund are shown below.
A description of the policies and procedures that the Fund uses to determine how to vote proxies relating to portfolio securities is available without charge, upon request, from our Client Services department at 800 959 4246 or at invesco.com/proxyguidelines. The information is also available on the SEC website, sec.gov.
Information regarding how the Fund voted proxies related to its portfolio securities during the most recent 12-month period ended June 30 is available at invesco.com/proxysearch. The information is also available on the SEC website, sec.gov. Invesco Advisers, Inc. is an investment adviser; it provides investment advisory services to individual and institutional clients and does not sell securities. Invesco Distributors, Inc. is the US distributor for Invesco Ltd.’s retail mutual funds, exchange-traded funds and institutional money market funds. Both are wholly owned, indirect subsidiaries of Invesco Ltd. |  | |
| SEC file numbers: 811-02699 and 002-57526 INCAL-AR-1 Invesco Distributors, Inc. | ||
| ||||
|
Annual Report to Shareholders |
December 31, 2013 | ||
| ||||
| Invesco International Allocation Fund | ||||
| Nasdaq: | ||||
| A: AINAX n B: INABX n C: INACX n R: RINAX n Y: AINYX n R5: INAIX | ||||

Letters to Shareholders
Philip Taylor | Dear Shareholders: This annual report includes information about your Invesco Fund, including performance data and a complete list of its investments as of the close of the reporting period. Inside, your Fund’s portfolio managers discuss how they managed your Fund and the factors that affected its performance during the reporting period. I hope you find this report of interest. During the year covered by this report, major US and global equity market indexes hit multiyear or all-time highs1, the result of a strengthening US economy and relatively healthy corporate profits. Also helping equities was a return of individual investors to stocks – due in part to monetary policies that kept interest rates (and yields on fixed income securities) low. At the end of the reporting period, amid widespread signs of an improving economy, the US Federal Reserve announced that it would begin a long-anticipated reduction in its bond-buying program in January 2014; its decision was widely expected and investors reacted positively |

to the announcement. Despite some mid-summer volatility, overseas equity market indexes in developed and emerging nations generally rose during the year.
Extended periods of strong market performance such as we saw throughout 2013 can lull some investors into a false sense of security – just as extended periods of volatility or market weakness can discourage some investors from undertaking disciplined, long-term investment plans. That’s why Invesco believes it can often be helpful to work with a skilled and trusted financial adviser; he or she can emphasize the importance of adhering to an investment plan designed to achieve long-term goals like a first home, a college education for a child or a comfortable retirement. A financial adviser who is familiar with your individual financial situation, investment goals and risk tolerance can be an invaluable partner as you work toward your financial goals. He or she can provide insight and perspective when markets are volatile; encouragement and reassurance when times are uncertain; and advice and guidance when your financial situation or investment goals change.
Timely information when and where you want it
Invesco’s efforts to help investors achieve their financial objectives include providing individual investors and financial professionals with timely information about the markets, the economy and investing – whenever and wherever they want it.
Our website, invesco.com/us, offers a wide range of market insights and investment perspectives. On the website, you’ll find detailed information about our funds, including prices, performance, holdings and portfolio manager commentaries. You can access information about your individual Invesco account whenever it’s convenient for you; just complete a simple, secure online registration. Use the “Login” box on our home page to get started.
Using Invesco’s mobile app for iPad® (available free from the App StoreSM) allows you to obtain the same detailed information about your funds and the same investment insights from our investment leaders, market strategists, economists and retirement experts on the go. You also can watch portfolio manager videos and have instant access to Invesco news and updates wherever you may be.
In addition to the resources accessible on our website and through our mobile app, you can obtain timely updates to help you stay informed about the markets, the economy and investing by connecting with Invesco on Twitter, LinkedIn or Facebook. You can access our blog at blog.invesco.us.com or by visiting the “Intentional Investing Forum” on our home page. Our goal is to provide you the information you want, when and where you want it.
Have questions?
For questions about your account, feel free to contact an Invesco client services representative at 800 959 4246. For Invesco-related questions or comments, please email me directly at phil@invesco.com.
All of us at Invesco look forward to serving your investment management needs for many years to come. Thank you for investing with us.
Sincerely,

Philip Taylor
Senior Managing Director, Invesco Ltd.
1 Source: Reuters
iPad is a trademark of Apple Inc., registered in the US and other countries. App Store is a service mark of Apple Inc.
2 Invesco International Allocation Fund
Bruce Crockett | Dear Fellow Shareholders: Many investors enjoyed positive returns on their investments in 2013. While some sectors of the market struggled, many major equity market indexes in the US and around the globe rose last year. The performance of stocks, fixed income securities and alternative investments – and the performance of mutual funds that invest in them – is determined by many factors, including unforeseeable economic and geopolitical events. Your Board certainly can’t determine how well various asset classes in the market perform, but we work hard throughout the year on issues that affect you and your fellow shareholders and determine how your investments are managed. For example, the Invesco Funds Board works to ensure that we provide a lineup of funds that allow financial advisers to build portfolios that meet shareholders’ changing financial needs and |

goals. Your Board works with Invesco Advisers on a continuing basis to provide financial products that may help investors achieve their varied financial goals. We also carefully monitor how the management teams of all the Invesco funds are performing in light of ever-changing and often unpredictable economic and market conditions. Your Board carefully assesses their performance in a constantly changing and highly competitive marketplace.
Your Board also conducts an annual review of the funds’ advisory and sub-advisory contracts with Invesco Advisers and its affiliates. This annual review, which is required by the Investment Company Act of 1940, focuses on the nature and quality of the services Invesco provides as adviser to the Invesco Funds and the reasonableness of the fees that it charges for those services. Each year, we spend months reviewing detailed information that we request from Invesco that allows us to evaluate its services and fees. We also use information from many independent sources, including materials provided by the independent Senior Officer of the Invesco Funds, who reports directly to the independent Trustees on the Board. Additionally, we meet with independent legal counsel and review performance and fee data prepared by Lipper Inc., an independent, third-party firm widely recognized as a leader in its field.
Be assured that your Board will continue working on behalf of fund shareholders, keeping your needs and interests uppermost in our minds.
As always, please contact me at bruce@brucecrockett.com with any questions or concerns you may have. On behalf of the Board, we look forward to continuing to represent your interests and serving your needs.
Sincerely,

Bruce L. Crockett
Independent Chair
Invesco Funds Board of Trustees
3 Invesco International Allocation Fund
Management’s Discussion of Fund Performance
Performance summary
For the year ended December 31, 2013, Invesco International Allocation Fund, at net asset value (NAV), had double-digit returns but underperformed its broad market/style-specific benchmark, the MSCI All Country World ex-US Index.
Negative absolute performance during the reporting period was driven by the Fund’s emerging market equity exposure. The Fund’s developed market large-cap international equity exposure was the primary driver of the Fund’s positive absolute performance.
Your Fund’s long-term performance appears later in this report.
Fund vs. Indexes
Total returns, 12/31/12 to 12/31/13, at net asset value (NAV). Performance shown does not include applicable contingent deferred sales charges (CDSC) or front-end sales charges, which would have reduced performance.
| Class A Shares | 13.02 | % | |||
| Class B Shares | 12.09 | ||||
| Class C Shares | 12.09 | ||||
| Class R Shares | 12.74 | ||||
| Class Y Shares | 13.23 | ||||
| Class R5 Shares | 13.52 | ||||
| MSCI All Country World ex-US Index‚ (Broad Market/Style-Specific Index) | 15.29 | ||||
| Lipper International Multi-Cap Core Funds Index‚ (Peer Group Index) | 21.05 | ||||
Source(s): ‚Lipper Inc. |
How we invest
The Fund offers investors convenient entry into international markets through a single, broadly diversified portfolio that has the flexibility to invest across investment styles (growth, value and core), market capitalizations (small and large), sectors and countries (both emerging and developed).
The portfolio blends six unique, complementary underlying funds – Invesco International Core Equity Fund, Invesco International Growth Fund, Power Shares International Dividend AchieversTM Portfolio, Invesco International Small Company Fund, Invesco Developing Markets Fund and Invesco Emerging Markets Equity Fund – to create a versatile core holding that provides broad international diversification across both developed and emerging markets.
We determine target asset class weightings and underlying fund selections for the Fund and monitor the Fund on an ongoing basis. The underlying funds in the portfolio are actively managed by their respective management teams based on individual fund objectives, investment strategies and management techniques. While the weightings of various underlying funds in the portfolio may vary from their targets during the year due to market movements, we rebalance the portfolio annually to maintain the target asset class allocations.
Market conditions and your Fund
While US and global equity markets enjoyed generally strong returns for the year ended December 31, 2013, the US and global economies improved only slowly. Despite a contentious battle over extending the nation’s debt ceiling and a
two-week federal government shutdown, the US economy grew throughout 2013; economic data improved notably in the latter part of the year.
Improving macroeconomic data and reduced political uncertainty buoyed European equity markets during the reporting period. UK equities ended the reporting period strongly, spurred by improving housing and employment data. Continental European equity markets posted strong gains for the reporting period as well; indeed, the Eurozone officially exited recession in late summer.
Japanese equities rose sharply, based on investors’ hopes that the new government led by Prime Minister Shinzo Abe, along with new leadership at the Bank of Japan, would finally arrest deflation. However, the market consolidated in May amid a tug of war between optimism about Abe’s leadership and the potential of “Abenomics” and concern about political developments in China and economic prospects in the US and emerging markets.
Emerging economies had a difficult year, with slowing world trade and abrupt corrections to their equity, bond and currency markets after the US Federal Reserve (the Fed) indicated mid-year it might reduce its bond-buying program in 2013. The economies most seriously affected – including Brazil, India, Indonesia, Turkey and South Africa – had allowed money and credit growth to expand significantly in the preceding three years.
In this environment, the Fund posted positive double-digit returns but under-performed MSCI All Country World ex-US Index. Within the underlying funds, Invesco Developing Markets Fund and Invesco Emerging Markets Equity Fund detracted from absolute performance for the reporting period. Allocations to these two funds accounted for less than 10% of the overall portfolio.
Portfolio Composition
| ||||||||||||||||||||
| Target | % of Total Net Assets | |||||||||||||||||||
| Asset Class | Allocation | as of 12/31/13 | ||||||||||||||||||
| International/Global Growth | 32.50 | % | 32.81 | % | ||||||||||||||||
| International/Global Blend | 31.00 | 30.55 | ||||||||||||||||||
| International/Global Value | 27.50 | 27.87 | ||||||||||||||||||
| Emerging Markets | 9.00 | 8.64 | ||||||||||||||||||
| Cash Equivalents Plus | ||||||||||||||||||||
| Other Assets Less Liabilities | 0.00 | 0.13 | ||||||||||||||||||
Based on the composition of the underlying funds.
| Total Net Assets | $ | 190.8 million |
4 Invesco International Allocation Fund
Emerging markets faced several head-winds during the year. Some of the head-winds were the slowdown in the Chinese economy, the Fed indicating it would taper its bond buying program, the Philippines being hit by a typhoon and political turmoil in Turkey. Each of the underlying emerging market funds were negatively impacted by these events.
Conversely, large-cap international equities in developed markets contributed to the Fund’s absolute performance. Invesco International Growth Fund, Powershares International Dividend Achievers Portfolio and Invesco International Core Equity Fund were the positive drivers of the Fund’s absolute performance. Each underlying fund benefited from the recovery in European equities during the year. Invesco International Small Company Fund and Invesco International Core Equity Fund were positive contributors as well.
In closing, volatile markets can test an investor’s resolve, but it’s worth remembering that real investment opportunity can present itself when the markets are turbulent.
We welcome new investors who joined the Fund during the year, and we thank our shareholders for your continued investment in Invesco International Allocation Fund.
The views and opinions expressed in management’s discussion of Fund performance are those of Invesco Advisers, Inc. These views and opinions are subject to change at any time based on factors such as market and economic conditions. These views and opinions may not be relied upon as investment advice or recommendations, or as an offer for a particular security. The information is not a complete analysis of every aspect of any market, country, industry, security or the Fund. Statements of fact are from sources considered reliable, but Invesco Advisers, Inc. makes no representation or warranty as to their completeness or accuracy. Although historical performance is no guarantee of future results, these insights may help you understand our investment management philosophy.
See important Fund and, if applicable, index disclosures later in this report.
 | Gary Wendler Head of Product Development and Investment Performance/Risk, is manager of Invesco International Allocation |
Fund. He joined Invesco in 1995. Mr. Wendler earned a BBA in finance from Texas A&M University.
5 Invesco International Allocation Fund
Your Fund’s Long-Term Performance
Results of a $10,000 Investment – Oldest Share Class(es) since Inception
Fund and index data from 10/31/05
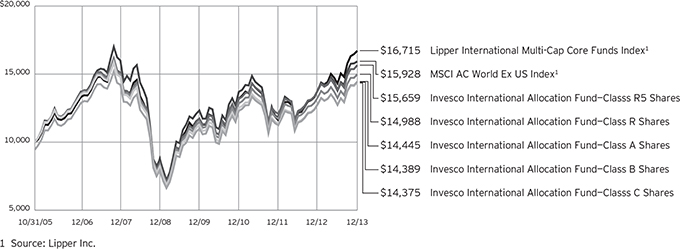
Past performance cannot guarantee comparable future results.
The data shown in the chart include reinvested distributions, applicable sales charges and Fund expenses including management fees. Results for Class B shares are calculated as if a hypothetical
shareholder had liquidated his entire investment in the Fund at the close of the reporting period and paid the contingent deferred sales charges, if applicable. Index results include reinvested dividends, but they do not reflect sales charges. Performance of the peer group,
if applicable, reflects fund expenses and management fees; performance of a market index does not. Performance shown in the chart and table(s) does not reflect deduction of taxes a shareholder would pay on Fund distributions or sale of Fund shares.
continued from page 9
Other information
| n | The returns shown in management’s discussion of Fund performance are based on net asset values calculated for shareholder transactions. Generally accepted accounting principles require adjustments to be made to the net assets of the Fund at period end for financial reporting purposes, and as such, the net asset values for shareholder transactions and the returns based on those net asset values may differ from the net asset values and returns reported in the Financial Highlights. |
6 Invesco International Allocation Fund
| Average Annual Total Returns | ||||
As of 12/31/13, including maximum applicable sales charges
|
| |||
| Class A Shares | ||||
| Inception (10/31/05) | 4.61 | % | ||
| 5 Years | 11.49 | |||
| 1 Year | 6.78 | |||
| Class B Shares | ||||
| Inception (10/31/05) | 4.56 | % | ||
| 5 Years | 11.67 | |||
| 1 Year | 7.09 | |||
| Class C Shares | ||||
| Inception (10/31/05) | 4.54 | % | ||
| 10 Years | 11.93 | |||
| 1 Year | 11.09 | |||
| Class R Shares | ||||
| Inception (10/31/05) | 5.08 | % | ||
| 5 Years | 12.52 | |||
| 1 Year | 12.74 | |||
| Class Y Shares | ||||
| Inception | 5.50 | % | ||
| 5 Years | 13.04 | |||
| 1 Year | 13.23 | |||
| Class R5 Shares | ||||
| Inception (10/31/05) | 5.64 | % | ||
| 5 Years | 13.13 | |||
| 1 Year | 13.52 | |||
Class Y shares incepted on October 3, 2008. Performance shown prior to that date is that of Class A shares and includes the 12b-1 fees applicable to Class A shares. Class A share performance reflects any applicable fee waivers or expense reimbursements.
The performance data quoted represent past performance and cannot guarantee comparable future results; current performance may be lower or higher. Please visit invesco.com/performance for the most recent month-end performance. Performance figures reflect reinvested distributions, changes in net asset value and the effect of the maximum sales charge unless otherwise stated. Investment return and principal value will fluctuate so that you may have a gain or loss when you sell shares.
The total annual Fund operating expense ratio set forth in the most recent Fund prospectus as of the date of this report for Class A, Class B, Class C, Class R, Class Y and Class R5 shares was 1.53%, 2.28%, 2.28%, 1.78%, 1.28% and 1.07%, respectively.1 The expense ratios presented above may vary from the expense
ratios presented in other sections of this report that are based on expenses incurred during the period covered by this report.
Class A share performance reflects the maximum 5.50% sales charge, and Class B and Class C share performance reflects the applicable contingent deferred sales charge (CDSC) for the period involved. The CDSC on Class B shares declines from 5% beginning at the time of purchase to 0% at the beginning of the seventh year. The CDSC on Class C shares is 1% for the first year after purchase. Class R, Class Y and Class R5 shares do not have a front-end sales charge or a CDSC; therefore, performance is at net asset value.
The performance of the Fund’s share classes will differ primarily due to different sales charge structures and class expenses.
Had the adviser not waived fees and/ or reimbursed expenses on the Fund’s Class A, Class B, Class C, Class R and Class Y shares in the past, performance would have been lower.
| 1 | The expense ratio includes acquired fund fees and expenses of the underlying funds in which the Fund invests of 0.85% for Invesco International Allocation Fund. |
7 Invesco International Allocation Fund
Invesco International Allocation Fund’s investment objective is long-term growth of capital.
| n | Unless otherwise stated, information presented in this report is as of December 31, 2013, and is based on total net assets. |
| n | Unless otherwise noted, all data provided by Invesco. |
| n | To access your Fund’s reports/prospectus, visit invesco.com/fundreports. |
About share classes
| n | Class B shares may not be purchased for new or additional investments. Please see the prospectus for more information. |
| n | Class R shares are generally available only to employer sponsored retirement and benefit plans. Please see the prospectus for more information. |
| n | Class Y shares are available only to certain investors. Please see the prospectus for more information. |
| n | Class R5 shares are primarily intended for employer sponsored retirement and benefit plans that meet certain standards and for institutional investors. Please see the prospectus for more information. |
Principal risks of investing in the Fund
| n | Concentration risk. To the extent an underlying fund invests a greater amount in any one sector or industry, an underlying fund’s performance will depend to a greater extent on the overall condition of the sector or industry, and there is increased risk to an underlying fund if conditions adversely affect that sector or industry. |
| n | Depository receipts risk. Depositary receipts involve many of the same risks as those associated with direct investment in foreign securities. In addition, the underlying issuers of certain depositary receipts, particularly unsponsored or unregistered depositary receipts, are under no obligation to distribute shareholder communications to the holders of such receipts or to pass through to them any voting rights with respect to the deposited securities. |
| n | Derivatives risk. The value of a derivative instrument depends largely on (and is derived from) the value of an underlying security, currency, commodity, interest rate, index or other asset (each referred to as an underlying asset). In addition to risks relating to the underlying assets, the use of derivatives may include other, possibly greater, risks, |
| including counterparty, leverage and liquidity risks. Counterparty risk is the risk that the counterparty to the derivative contract will default on its obligation to pay an underlying fund the amount owed or otherwise perform under the derivative contract. Derivatives create leverage risk because they do not require payment up front equal to the economic exposure created by owning the derivative. As a result, an adverse change in the value of the underlying asset could result in an underlying fund sustaining a loss that is substantially greater than the amount invested in the derivative, which may make an underlying fund’s returns more volatile and increase the risk of loss. Derivative instruments may also be less liquid than more traditional investments and an underlying fund may be unable to sell or close out its derivative positions at a desirable time or price. This risk may be more acute under adverse market conditions, during which an underlying fund may be most in need of liquidating its derivative positions. Derivatives may also be harder to value, less tax efficient and subject to changing government regulation that could impact an underlying fund’s ability to use certain derivatives or their cost. Also, derivatives used for hedging or to gain or limit exposure to a particular market segment may not provide the expected benefits, particularly during adverse market conditions. |
| n | Developing/emerging securities markets risk. The prices of securities issued by foreign companies and governments located in developing/ emerging markets countries may be affected more negatively by inflation, devaluation of their currencies, higher transaction costs, delays in settlement, adverse political developments, the introduction of capital controls, withholding taxes, nationalization of private assets, expropriation, social unrest, war or lack of timely information than those in developed countries. |
| n | Dividend paying security risk. Securities that pay high dividends as a group can fall out of favor with the market, causing such companies to underperform companies that do not pay high dividends. Also changes in the dividend policies of the companies in the Underlying Index and the capital resources available for such companies’ dividend payments may affect the Fund. |
| n | Exchange-traded funds risk. An investment by an underlying fund in exchange-traded funds generally presents the same primary risks as an investment in a mutual fund. In addition, an exchange-traded fund may be subject to the following: (1) a discount of the exchange-traded fund’s shares to its net asset value; (2) failure to develop an active trading market for the exchange-traded fund’s shares; (3) the listing exchange halting trading of the exchange-traded fund’s shares; (4) failure of the exchange-traded fund’s shares to track the referenced asset; and (5) holding troubled securities in the referenced index or basket of investments. Exchange-traded funds may involve duplication of management fees and certain other expenses, as the underlying fund indirectly bears its proportionate share of any expenses paid by the exchange-traded funds in which it invests. Further, certain of the exchange-traded funds in which the underlying fund may invest are leveraged. The more the underlying fund invests in such leveraged exchange-traded funds, the more this leverage will magnify any losses on those investments. |
| n | Financial services sector risk. The financial services sector is subject to extensive government regulation, which may change frequently. In addition, the profitability of businesses in the financial services sector depends on the availability and cost of money and may fluctuate significantly in response to changes in government regulation, interest rates and general |
This report must be accompanied or preceded by a currently effective Fund prospectus, which contains more complete information, including sales charges and expenses. Investors should read it carefully before investing.
NOT FDIC INSURED | MAY LOSE VALUE | NO BANK GUARANTEE
continued on next page
Fund Nasdaq Symbols
Class A Shares | AINAX | ||||
Class B Shares | INABX | ||||
Class C Shares | INACX | ||||
Class R Shares | RINAX | ||||
Class Y Shares | AINYX | ||||
Class R5 Shares | INAIX |
8 Invesco International Allocation Fund
economic conditions. Businesses in the financial sector often operate with substantial financial leverage.
| n | Foreign securities risk. An underlying fund’s foreign investments may be affected by changes in a foreign country’s exchange rates, political and social instability; changes in economic or taxation policies, difficulties when enforcing obligations, decreased liquidity, and increased volatility. Foreign companies may be subject to less regulation resulting in less publicly available information about the companies. |
| n | Fund of funds risk. The Fund’s performance depends on the underlying funds in which it invests, and it is subject to the risks of the underlying funds. Market fluctuations may change the target weightings in the underlying funds. The underlying funds may change their investment objectives, policies or practices and may not achieve their investment objectives, all of which may cause the Fund to withdraw its investments therein at a disadvantageous time. |
| n | Geographic focus risk. From time to time an underlying fund may invest a substantial amount of its assets in securities of issuers located in a single country or a limited number of countries. If an underlying fund focuses its investments in this manner, it assumes the risk that economic, political and social conditions in those countries will have a significant impact on its investment performance. An underlying fund’s investment performance may also be more volatile if it focuses its investments in certain countries, especially emerging market countries. |
| n | Growth investing risk. Growth stocks tend to be more expensive relative to their earnings or assets compared with other types of stock. As a result they tend to be more sensitive to changes in their earnings and can be more volatile. |
| n | Indexing risk. Unlike many investment companies, certain underlying exchange-traded funds do not utilize an investing strategy that seeks returns in excess of their benchmark indices. Such underlying exchange-traded funds would not necessarily buy or sell a security due to its general underperformance, unless that security is added to or removed from the applicable benchmark index. |
| n | Investing in the European Union risk. Many countries in the European Union are susceptible to high economic risks associated with high levels of debt, notably due to investments in sovereign |
debts of European countries such as Greece, Italy and Spain. One or more member states might exit the European Union, placing its currency and banking system in jeopardy. The European Union faces major issues involving its membership, structure, procedures and policies, including the adoption, abandonment or adjustment of the new constitutional treaty, the European Union’s enlargement to the south and east, and resolution of the European Union’s problematic fiscal and democratic accountability. Efforts of the member states to further unify their economic and monetary policies may increase the potential for the downward movement of one member state’s market to cause a similar effect on other member states’ markets. European countries that are part of the European Economic and Monetary Union may be significantly affected by the tight fiscal and monetary controls that the union seeks to impose on its members. |
| n | Issuer-specific changes risk. The value of an individual security or particular type of security can be more volatile than the market as a whole and can perform differently from the value of the market as a whole. |
| n | Management risk. The investment techniques and risk analysis used by the Fund’s and the underlying funds’ portfolio managers may not produce the desired results. |
| n | Market risk. The prices of and the income generated by an underlying fund’s securities may decline in response to, among other things, investor sentiment, general economic and market conditions, regional or global instability, and currency and interest rate fluctuations. |
| n | Market trading risk. Risk is inherent in all investing. An investment in an underlying fund involves risks similar to those of investing in any underlying fund of equity or fixed-income securities traded on exchanges. You should anticipate that the value of the shares will decline, more or less, in correlation with any decline in value of the underlying index of certain underlying exchange-traded funds. |
| n | Non-correlation risk. An underlying fund’s return may not match the return of the underlying index of certain underlying exchange-traded funds for a number of reasons. For example, the Fund incurs operating expenses not applicable to the underlying index, and incurs costs in buying and selling securities, especially when rebalancing an underlying fund’s securities holdings to reflect changes in the composition of an underlying index of certain underlying |
exchange-traded funds. In addition, the performance of an underlying fund and an underlying index of certain underlying exchange-traded funds may vary due to asset valuation differences and differences between an underlying fund’s portfolio and the underlying index of certain underlying exchange-traded funds resulting from legal restrictions, cost or liquidity constraints. |
| n | Non-diversification risk. Certain of the underlying funds are non-diversified and can invest a greater portion of their assets in a small number of issuers or a single issuer. A change in the value of the issuer could affect the value of an underlying fund more than if it was a diversified fund. |
| n | Small- and mid-capitalization risk. Stocks of small- and mid-sized companies tend to be more vulnerable to adverse developments and may have little or no operating history or track record of success, and limited product lines, markets, management and financial resources. The securities of small- and mid-sized companies may be more volatile due to less market interest and less publicly available information about the issuer. They also may be illiquid or restricted as to resale, or may trade less frequently and in smaller volumes, all of which may cause difficulty when establishing or closing a position at a desirable price. |
About indexes used in this report
| n | The MSCI All Country World ex-US Index is an index considered representative of developed and emerging market stock markets, excluding the US. The index is computed using the net return, which withholds applicable taxes for non-resident investors. |
| n | The Lipper International Multi-Cap Core Funds Index is an unmanaged index considered representative of international multicap core funds tracked by Lipper. |
| n | The Fund is not managed to track the performance of any particular index, including the index(es) described here, and consequently, the performance of the Fund may deviate significantly from the performance of the index(es). |
| n | A direct investment cannot be made in an index. Unless otherwise indicated, index results include reinvested dividends, and they do not reflect sales charges. Performance of the peer group, if applicable, reflects fund expenses; performance of a market index does not. |
continued on page 6
9 Invesco International Allocation Fund
Schedule of Investments
December 31, 2013
Invesco International Allocation Fund
Schedule of Investments in Affiliated Issuers–100.31%(a)
| % of Net Assets 12/31/13 | Value 12/31/12 | Purchases at Cost | Proceeds from Sales | Change in Unrealized Appreciation (Depreciation) | Realized Gain (Loss) | Dividend Income | Shares 12/31/13 | Value 12/31/13 | ||||||||||||||||||||||||||||
Foreign Equity Funds–99.87% |
| |||||||||||||||||||||||||||||||||||
Invesco Developing Markets Fund | 4.20 | % | $ | 7,829,370 | $ | 1,283,781 | $ | (781,660 | ) | $ | (306,645 | ) | $ | 4,671 | $ | 101,266 | 247,418 | $ | 8,006,446 | |||||||||||||||||
Invesco Emerging Market Equity Fund | 4.44 | % | 7,687,026 | 2,110,341 | (781,654 | ) | (454,952 | ) | (88,668 | ) | 81,721 | 1,149,538 | 8,472,093 | |||||||||||||||||||||||
Invesco International Core Equity Fund | 30.55 | % | 55,958,387 | 3,986,132 | (6,542,370 | ) | 7,468,944 | (2,568,384 | ) | 1,303,222 | 5,168,680 | 58,302,709 | ||||||||||||||||||||||||
Invesco International Growth Fund | 22.90 | % | 38,949,569 | 2,575,498 | (4,355,662 | ) | 6,907,437 | (376,639 | ) | 628,224 | 1,275,174 | 43,700,203 | ||||||||||||||||||||||||
Invesco International Small Company Fund | 9.91 | % | 18,041,867 | 2,114,385 | (1,737,125 | ) | 552,186 | 848,550 | 330,783 | 890,725 | 18,919,003 | |||||||||||||||||||||||||
PowerShares International Dividend Achievers Portfolio–ETF | 27.87 | % | 48,231,921 | 1,952,930 | (4,729,099 | ) | 7,831,342 | (98,592 | ) | 1,166,662 | 2,884,416 | 53,188,502 | ||||||||||||||||||||||||
Total Foreign Equity Funds | 176,698,140 | 14,023,067 | (18,927,570 | ) | 21,998,312 | (2,279,062 | ) | 3,611,878 | 190,588,956 | |||||||||||||||||||||||||||
Money Market Funds–0.44% |
| |||||||||||||||||||||||||||||||||||
Liquid Assets Portfolio–Institutional Class | 0.22 | % | 152,415 | 8,905,168 | (8,645,716 | ) | — | — | 161 | 411,867 | 411,867 | |||||||||||||||||||||||||
Premier Portfolio– | 0.22 | % | 152,415 | 8,905,168 | (8,645,716 | ) | — | — | 78 | 411,867 | 411,867 | |||||||||||||||||||||||||
Total Money Market Funds | 304,830 | 17,810,336 | (17,291,432 | ) | — | — | 239 | 823,734 | ||||||||||||||||||||||||||||
TOTAL INVESTMENTS IN AFFILIATED ISSUERS |
| |||||||||||||||||||||||||||||||||||
(Cost $174,243,745) | 100.31 | % | $ | 177,002,970 | $ | 31,833,403 | $ | (36,219,002 | ) | $ | 21,998,312 | $ | (2,279,062 | )(b) | $ | 3,612,117 | $ | 191,412,690 | ||||||||||||||||||
OTHER ASSETS LESS LIABILITIES | (0.31 | )% | (584,053 | ) | ||||||||||||||||||||||||||||||||
NET ASSETS | 100.00 | % | $ | 190,828,637 | ||||||||||||||||||||||||||||||||
Investment Abbreviations:
ETF – Exchange-Traded Fund
Notes to Schedule of Investments:
| (a) | Each underlying fund and the Fund are affiliated by either having the same investment adviser or an investment adviser under common control with the Fund’s investment adviser. The Fund invests in Class R6 shares of the mutual funds listed. The Fund invests in the fund shares of the exchanged-traded fund. |
| (b) | Includes $23,071 and $900,860 of capital gains from affiliated underlying funds for Invesco Developing Markets Fund and Invesco International Small Company Fund, respectively. |
See accompanying Notes to Financial Statements which are an integral part of the financial statements.
10 Invesco International Allocation Fund
Statement of Assets and Liabilities
December 31, 2013
Assets: |
| |||
Investments in affiliated underlying funds, at value (Cost $174,243,745) | $ | 191,412,690 | ||
Receivable for: | ||||
Investments sold — affiliated underlying funds | 1,053 | |||
Fund shares sold | 171,750 | |||
Dividends from affiliated underlying funds | 20 | |||
Investment for trustee deferred compensation and retirement plans | 52,136 | |||
Other assets | 34,646 | |||
Total assets | 191,672,295 | |||
Liabilities: |
| |||
Payable for: | ||||
Investments purchased — affiliated underlying funds | 325,514 | |||
Fund shares reacquired | 269,507 | |||
Accrued fees to affiliates | 151,193 | |||
Accrued trustees’ and officers’ fees and benefits | 830 | |||
Accrued other operating expenses | 37,756 | |||
Trustee deferred compensation and retirement plans | 58,858 | |||
Total liabilities | 843,658 | |||
Net assets applicable to shares outstanding | $ | 190,828,637 | ||
Net assets consist of: |
| |||
Shares of beneficial interest | $ | 271,507,168 | ||
Undistributed net investment income | (55,799 | ) | ||
Undistributed net realized gain (loss) | (97,791,677 | ) | ||
Net unrealized appreciation | 17,168,945 | |||
| $ | 190,828,637 | |||
Net Assets: |
| |||
Class A | $ | 136,054,737 | ||
Class B | $ | 8,974,300 | ||
Class C | $ | 30,240,517 | ||
Class R | $ | 6,412,112 | ||
Class Y | $ | 7,959,104 | ||
Class R5 | $ | 1,187,867 | ||
Shares outstanding, $0.01 par value per share, |
| |||
Class A | 12,294,849 | |||
Class B | 811,338 | |||
Class C | 2,734,593 | |||
Class R | 579,427 | |||
Class Y | 721,588 | |||
Class R5 | 107,326 | |||
Class A: | ||||
Net asset value per share | $ | 11.07 | ||
Maximum offering price per share | ||||
(Net asset value of $11.07 ¸ 94.50%) | $ | 11.71 | ||
Class B: | ||||
Net asset value and offering price per share | $ | 11.06 | ||
Class C: | ||||
Net asset value and offering price per share | $ | 11.06 | ||
Class R: | ||||
Net asset value and offering price per share | $ | 11.07 | ||
Class Y: | ||||
Net asset value and offering price per share | $ | 11.03 | ||
Class R5: | ||||
Net asset value and offering price per share | $ | 11.07 | ||
See accompanying Notes to Financial Statements which are an integral part of the financial statements.
11 Invesco International Allocation Fund
Statement of Operations
For the year ended December 31, 2013
Investment income: |
| |||
Dividends from affiliated underlying funds | $ | 3,612,117 | ||
Other Income | 1,323 | |||
Total investment income | 3,613,440 | |||
Expenses: | ||||
Administrative services fees | 50,000 | |||
Custodian fees | 10,198 | |||
Distribution fees: | ||||
Class A | 321,866 | |||
Class B | 97,251 | |||
Class C | 282,125 | |||
Class R | 30,640 | |||
Transfer agent fees — A, B, C, R and Y | 437,745 | |||
Transfer agent fees — R5 | 131 | |||
Trustees’ and officers’ fees and benefits | 31,492 | |||
Other | 173,240 | |||
Total expenses | 1,434,688 | |||
Less: Expense offset arrangement(s) | (1,154 | ) | ||
Net expenses | 1,433,534 | |||
Net investment income | 2,179,906 | |||
Realized and unrealized gain (loss) from: | ||||
Net realized gain (loss) on sales of affiliated underlying fund shares | (3,202,993 | ) | ||
Net realized gain from distributions of affiliated underlying fund shares | 923,931 | |||
| (2,279,062 | ) | |||
Change in net unrealized appreciation of affiliated underlying fund shares | 21,998,312 | |||
Net gain from affiliated underlying funds | 19,719,250 | |||
Net increase in net assets resulting from operations | $ | 21,899,156 | ||
See accompanying Notes to Financial Statements which are an integral part of the financial statements.
12 Invesco International Allocation Fund
Statement of Changes in Net Assets
For the years ended December 31, 2013 and 2012
| 2013 | 2012 | |||||||
Operations: |
| |||||||
Net investment income | $ | 2,179,906 | $ | 2,242,511 | ||||
Net realized gain (loss) | (2,279,062 | ) | (8,176,473 | ) | ||||
Change in net unrealized appreciation | 21,998,312 | 28,080,904 | ||||||
Net increase in net assets resulting from operations | 21,899,156 | 22,146,942 | ||||||
Distributions to shareholders from net investment income: | ||||||||
Class A | (1,919,174 | ) | (4,445,461 | ) | ||||
Class B | (64,632 | ) | (197,140 | ) | ||||
Class C | (214,028 | ) | (513,227 | ) | ||||
Class R | (75,910 | ) | (161,667 | ) | ||||
Class Y | (132,984 | ) | �� | (267,886 | ) | |||
Class R5 | (21,908 | ) | (11,642 | ) | ||||
Total distributions from net investment income | (2,428,636 | ) | (5,597,023 | ) | ||||
Share transactions–net: | ||||||||
Class A | (3,401,253 | ) | (9,641,038 | ) | ||||
Class B | (2,661,470 | ) | (2,960,807 | ) | ||||
Class C | (728,178 | ) | (4,664,222 | ) | ||||
Class R | 213,760 | 132,282 | ||||||
Class Y | 425,840 | 1,863,238 | ||||||
Class R5 | 849,993 | 82,039 | ||||||
Net increase (decrease) in net assets resulting from share transactions | (5,301,308 | ) | (15,188,508 | ) | ||||
Net increase in net assets | 14,169,212 | 1,361,411 | ||||||
Net assets: | ||||||||
Beginning of year | 176,659,425 | 175,298,014 | ||||||
End of year (includes undistributed net investment income of $(55,799) and $192,931, respectively) | $ | 190,828,637 | $ | 176,659,425 | ||||
Notes to Financial Statements
December 31, 2013
NOTE 1—Significant Accounting Policies
Invesco International Allocation Fund (the “Fund”) is a series portfolio of AIM Growth Series (Invesco Growth Series) (the “Trust”). The Trust is organized as a Delaware statutory trust and is registered under the Investment Company Act of 1940, as amended (the “1940 Act”), as an open-end series management investment company consisting of fifteen separate series portfolios, each authorized to issue an unlimited number of shares of beneficial interest. The assets, liabilities and operations of each portfolio are accounted for separately. Information presented in these financial statements pertains only to the Fund. Matters affecting each portfolio or class will be voted on exclusively by the shareholders of such portfolio or class.
The Fund’s investment objective is long-term growth of capital. The Fund is a “fund of funds,” in that it invests in other mutual funds (“underlying funds”) advised by Invesco Advisers, Inc. (“Invesco”) or exchange traded funds advised by Invesco Powershares Capital Management LLC (“PowerShares Capital”), an affiliate of Invesco. Invesco and PowerShares Capital are affiliates of each other as they are indirect wholly-owned subsidiaries of Invesco Ltd. Invesco may change the Fund’s asset class allocations, the underlying funds or target weightings in the underlying funds without shareholder approval. The underlying funds may engage in a number of investment techniques and practices, which involve certain risks. Each underlying fund’s accounting policies are outlined in the underlying fund’s financial statements and are publicly available.
The Fund currently consists of six different classes of shares: Class A, Class B, Class C, Class R, Class Y and Class R5. Class A shares are sold with a front-end sales charge unless certain waiver criteria are met and under certain circumstances load waived shares may be subject to contingent deferred sales charges (“CDSC”). Class C shares are sold with a CDSC. Class R, Class Y and Class R5 shares are sold at net asset value. Effective November 30, 2010, new or additional investments in Class B shares are no longer permitted. Existing shareholders of Class B shares may continue to reinvest dividends and capital gains distributions in Class B shares until they convert to Class A shares. Also, shareholders in Class B shares will be able to exchange those shares for Class B shares of other Invesco Funds offering such shares until they convert to Class A shares. Generally, Class B shares will automatically convert to Class A shares on or about the month-end, which is at least eight years after the date of purchase. Redemption of Class B shares prior to the conversion date will be subject to a CDSC.
13 Invesco International Allocation Fund
The following is a summary of the significant accounting policies followed by the Fund in the preparation of its financial statements.
| A. | Security Valuations — Securities of investment companies that trade on an exchange are valued at the last sales price or official closing price as of the close of the customary trading session on the exchange where the security is principally traded. Investments in shares of funds that are not traded on an exchange are valued at the end of day net asset value per share of such fund. Securities in the underlying funds, including restricted securities, are valued in accordance with the valuation policy of such fund. The policies of the underlying funds affiliated with the Fund as a result of having the same investment adviser are set forth below. |
A security listed or traded on an exchange (except convertible bonds) is valued at its last sales price or official closing price as of the close of the customary trading session on the exchange where the security is principally traded, or lacking any sales or official closing price on a particular day, the security may be valued at the closing bid price on that day. Securities traded in the over-the-counter market are valued based on prices furnished by independent pricing services or market makers. When such securities are valued by an independent pricing service they may be considered fair valued. Futures contracts are valued at the final settlement price set by an exchange on which they are principally traded. Listed options are valued at the mean between the last bid and ask prices from the exchange on which they are principally traded. Options not listed on an exchange are valued by an independent source at the mean between the last bid and ask prices. For purposes of determining net asset value per share, futures and option contracts generally are valued 15 minutes after the close of the customary trading session of the New York Stock Exchange (“NYSE”).
Investments in open-end and closed-end registered investment companies that do not trade on an exchange are valued at the end of day net asset value per share. Investments in open-end and closed-end registered investment companies that trade on an exchange are valued at the last sales price or official closing price as of the close of the customary trading session on the exchange where the security is principally traded.
Debt obligations (including convertible bonds) and unlisted equities are fair valued using an evaluated quote provided by an independent pricing service. Evaluated quotes provided by the pricing service may be determined without exclusive reliance on quoted prices, and may reflect appropriate factors such as institution-size trading in similar groups of securities, developments related to specific securities, dividend rate (for unlisted equities), yield (for debt obligations), quality, type of issue, coupon rate (for debt obligations), maturity (for debt obligations), individual trading characteristics and other market data. Debt obligations are subject to interest rate and credit risks. In addition, all debt obligations involve some risk of default with respect to interest and/or principal payments.
Foreign securities’ (including foreign exchange contracts) prices are converted into U.S. dollar amounts using the applicable exchange rates as of the close of the NYSE. If market quotations are available and reliable for foreign exchange-traded equity securities, the securities will be valued at the market quotations. Because trading hours for certain foreign securities end before the close of the NYSE, closing market quotations may become unreliable. If between the time trading ends on a particular security and the close of the customary trading session on the NYSE, events occur that the Adviser determines are significant and make the closing price unreliable, the Fund may fair value the security. If the event is likely to have affected the closing price of the security, the security will be valued at fair value in good faith using procedures approved by the Board of Trustees. Adjustments to closing prices to reflect fair value may also be based on a screening process of an independent pricing service to indicate the degree of certainty, based on historical data, that the closing price in the principal market where a foreign security trades is not the current value as of the close of the NYSE. Foreign securities’ prices meeting the approved degree of certainty that the price is not reflective of current value will be priced at the indication of fair value from the independent pricing service. Multiple factors may be considered by the independent pricing service in determining adjustments to reflect fair value and may include information relating to sector indices, American Depositary Receipts and domestic and foreign index futures. Foreign securities may have additional risks including exchange rate changes, potential for sharply devalued currencies and high inflation, political and economic upheaval, the relative lack of issuer information, relatively low market liquidity and the potential lack of strict financial and accounting controls and standards.
Securities for which market prices are not provided by any of the above methods may be valued based upon quotes furnished by independent sources. The last bid price may be used to value equity securities. The mean between the last bid and asked prices is used to value debt obligations, including corporate loans.
Securities for which market quotations are not readily available or became unreliable are valued at fair value as determined in good faith by or under the supervision of the Trust’s officers following procedures approved by the Board of Trustees. Issuer specific events, market trends, bid/ask quotes of brokers and information providers and other market data may be reviewed in the course of making a good faith determination of a security’s fair value.
Valuations change in response to many factors including the historical and prospective earnings of the issuer, the value of the issuer’s assets, general economic conditions, interest rates, investor perceptions and market liquidity. Because of the inherent uncertainties of valuation, the values reflected in the financial statements may materially differ from the value received upon actual sale of those investments.
| B. | Securities Transactions and Investment Income — Securities transactions are accounted for on a trade date basis. Realized gains or losses on sales are computed on the basis of specific identification of the securities sold. Distributions from ordinary income from underlying funds, if any, are recorded as dividend income on ex-dividend date. Distributions from gains from underlying funds, if any, are recorded as realized gains on the ex-dividend date. The following policies are followed by the underlying funds: Interest income is recorded on the accrual basis from settlement date. Bond premiums and discounts are amortized and/or accreted for financial reporting purposes. Paydown gains and losses on mortgage and asset-backed securities are recorded as adjustments to interest income. |
The Fund may periodically participate in litigation related to Fund investments. As such, the Fund may receive proceeds from litigation settlements. Any proceeds received are included in the Statement of Operations as realized gain (loss) for investments no longer held and as unrealized gain (loss) for investments still held.
The Fund allocates income and realized and unrealized capital gains and losses to a class based on the relative net assets of each class.
| C. | Distributions — Distributions from income and net realized capital gain, if any, are generally declared and paid annually and recorded on the ex-dividend date. The Fund may elect to treat a portion of the proceeds from redemptions as distributions for federal income tax purposes. |
| D. | Federal Income Taxes — The Fund intends to comply with the requirements of Subchapter M of the Internal Revenue Code of 1986, as amended (the “Internal Revenue Code”), necessary to qualify as a regulated investment company and to distribute substantially all of the Fund’s taxable earnings to shareholders. As such, the Fund will not be subject to federal income taxes on otherwise taxable income (including net realized capital gain) that is distributed to shareholders. Therefore, no provision for federal income taxes is recorded in the financial statements. |
The Fund files tax returns in the U.S. Federal jurisdiction and certain other jurisdictions. Generally, the Fund is subject to examinations by such taxing authorities for up to three years after the filing of the return for the tax period.
14 Invesco International Allocation Fund
| E. | Expenses — Expenses included in the accompanying financial statements reflect the expenses of the Fund and do not include any expenses of the underlying funds. The effects of the underlying funds expenses are included in the realized and unrealized gain/loss on the investments in the underlying funds. Estimated expenses of the underlying funds are discussed further within Note 10. |
Fees provided for under the Rule 12b-1 plan of a particular class of the Fund and which are directly attributable to that class are charged to the operations of such class. Transfer agency fees and expenses and other shareholder recordkeeping fees and expenses attributable to Class R5 are charged to such class. Transfer agency fees and expenses and other shareholder recordkeeping fees and expenses relating to all other classes are allocated among those classes based on relative net assets. All other expenses are allocated among the classes based on relative net assets.
| F. | Accounting Estimates — The preparation of financial statements in conformity with accounting principles generally accepted in the United States of America (“GAAP”) requires management to make estimates and assumptions that affect the reported amounts of assets and liabilities at the date of the financial statements and the reported amounts of revenues and expenses during the reporting period including estimates and assumptions related to taxation. Actual results could differ from those estimates by a significant amount. In addition, the Fund monitors for material events or transactions that may occur or become known after the period-end date and before the date the financial statements are released to print. |
| G. | Indemnifications — Under the Trust’s organizational documents, each Trustee, officer, employee or other agent of the Trust is indemnified against certain liabilities that may arise out of the performance of their duties to the Fund. Additionally, in the normal course of business, the Fund enters into contracts, including the Fund’s servicing agreements, that contain a variety of indemnification clauses. The Fund’s maximum exposure under these arrangements is unknown as this would involve future claims that may be made against the Fund that have not yet occurred. The risk of material loss as a result of such indemnification claims is considered remote. |
NOTE 2—Advisory Fees and Other Fees Paid to Affiliates
The Trust has entered into a master investment advisory agreement with Invesco. Under the terms of the investment advisory agreement, the Fund does not pay an advisory fee. However, the Fund pays advisory fees to Invesco indirectly as a shareholder of the underlying funds.
Under the terms of a master sub-advisory agreement between the Adviser and each of Invesco Asset Management Deutschland GmbH, Invesco Asset Management Limited, Invesco Asset Management (Japan) Limited, Invesco Australia Limited, Invesco Hong Kong Limited, Invesco Senior Secured Management, Inc. and Invesco Canada Ltd. (collectively, the “Affiliated Sub-Advisers”) the Adviser, not the Fund, may pay 40% of the fees paid to the Adviser to any such Affiliated Sub-Adviser(s) that provide(s) discretionary investment management services to the Fund based on the percentage of assets allocated to such Sub-Adviser(s).
The Adviser has contractually agreed, through at least June 30, 2014, to reimburse expenses of all shares to the extent necessary to limit total annual fund operating expenses after expene reimbursement (excluding certain items discussed below) of Class A, Class B, Class C, Class R, Class Y and Class R5 shares to 2.25%, 3.00%, 3.00%, 2.50%, 2.00% and 2.00%, respectively, of average daily net assets. In determining the Adviser’s obligation to reimburse expenses, the following expenses are not taken into account, and could cause the total annual fund operating expenses after expense reimbursement to exceed the numbers reflected above: (1) interest; (2) taxes; (3) dividend expense on short sales; (4) extraordinary or non-routine items, including litigation expenses; and (5) expenses that the Fund has incurred but did not actually pay because of an expense offset arrangement. The total annual fund operating expenses used in determining whether the Fund meets or exceeds the expense limitations described above do not include Acquired Fund Fees and Expenses. Acquired Fund Fees and Expenses are not operating expenses of a Fund directly, but are fees and expenses, including management fees of the investment companies in which a Fund invests. As a result, the total annual fund operating expenses after expense reimbursement may exceed the expense limits above. Unless Invesco continues the fee waiver agreement, it will terminate on June 30, 2014. The fee waiver agreement cannot be terminated during its term. The Adviser did not waive fees and/or reimburse expenses during the period under this expense limitation.
The Trust has entered into a master administrative services agreement with Invesco pursuant to which the Fund has agreed to pay Invesco for certain administrative costs incurred in providing accounting services to the Fund. For the year ended December 31, 2013, expenses incurred under the agreement are shown in the Statement of Operations as Administrative services fees.
The Trust has entered into a transfer agency and service agreement with Invesco Investment Services, Inc. (“IIS”) pursuant to which the Fund has agreed to pay IIS a fee for providing transfer agency and shareholder services to the Fund and reimburse IIS for certain expenses incurred by IIS in the course of providing such services. IIS may make payments to intermediaries that provide omnibus account services, sub-accounting services and/or networking services. All fees payable by IIS to intermediaries that provide omnibus account services or sub-accounting are charged back to the Fund, subject to certain limitations approved by the Trust’s Board of Trustees. For the year ended December 31, 2013, expenses incurred under the agreement are shown in the Statement of Operations as Transfer agent fees.
The Trust has entered into master distribution agreements with Invesco Distributors, Inc. (“IDI”) to serve as the distributor for the Class A, Class B, Class C, Class R, Class Y and Class R5 shares of the Fund. The Trust has adopted plans pursuant to Rule 12b-1 under the 1940 Act with respect to the Fund’s Class A, Class B, Class C and Class R shares (collectively, the “Plans”). The Fund, pursuant to the Plans, pays IDI compensation at the annual rate of 0.25% of the Fund’s average daily net assets of Class A shares, 1.00% of the average daily net assets of Class B and Class C shares and 0.50% of the average daily net assets of Class R shares. Of the Plan payments, up to 0.25% of the average daily net assets of each class of shares may be paid to furnish continuing personal shareholder services to customers who purchase and own shares of such classes. Any amounts not paid as a service fee under the Plans would constitute an asset-based sales charge. Rules of the Financial Industry Regulatory Authority (“FINRA”) impose a cap on the total sales charges, including asset-based sales charges, that may be paid by any class of shares of the Fund. For the year ended December 31, 2013, expenses incurred under the Plans are shown in the Statement of Operations as Distribution fees.
Front-end sales commissions and CDSC (collectively, the “sales charges”) are not recorded as expenses of the Fund. Front-end sales commissions are deducted from proceeds from the sales of Fund shares prior to investment in Class A shares of the Fund. CDSC are deducted from redemption proceeds prior to remittance to the shareholder. During the year ended December 31, 2013, IDI advised the Fund that IDI retained $49,037 in front-end sales commissions from the sale of Class A shares and $288, $8,608 and $1,646 from Class A, Class B and Class C shares, respectively, for CDSC imposed on redemptions by shareholders.
The underlying funds pay no distribution fees for Class R6 shares and the Fund pays no sales loads or other similar compensation to IDI for acquiring underlying fund shares.
Certain officers and trustees of the Trust are officers and directors of the Adviser, IIS and/or IDI.
15 Invesco International Allocation Fund
NOTE 3—Additional Valuation Information
GAAP defines fair value as the price that would be received to sell an asset or paid to transfer a liability in an orderly transaction between market participants at the measurement date, under current market conditions. GAAP establishes a hierarchy that prioritizes the inputs to valuation methods, giving the highest priority to readily available unadjusted quoted prices in an active market for identical assets (Level 1) and the lowest priority to significant unobservable inputs (Level 3), generally when market prices are not readily available or are unreliable. Based on the valuation inputs, the securities or other investments are tiered into one of three levels. Changes in valuation methods may result in transfers in or out of an investment’s assigned level:
| Level 1 — | Prices are determined using quoted prices in an active market for identical assets. |
| Level 2 — | Prices are determined using other significant observable inputs. Observable inputs are inputs that other market participants may use in pricing a security. These may include quoted prices for similar securities, interest rates, prepayment speeds, credit risk, yield curves, loss severities, default rates, discount rates, volatilities and others. |
| Level 3 — | Prices are determined using significant unobservable inputs. In situations where quoted prices or observable inputs are unavailable (for example, when there is little or no market activity for an investment at the end of the period), unobservable inputs may be used. Unobservable inputs reflect the Fund’s own assumptions about the factors market participants would use in determining fair value of the securities or instruments and would be based on the best available information. |
As of December 31, 2013, all of the securities in this Fund were valued based on Level 1 inputs (see the Schedule of Investments for security categories). The level assigned to the securities valuations may not be an indication of the risk or liquidity associated with investing in those securities.
NOTE 4—Expense Offset Arrangement(s)
The expense offset arrangement is comprised of transfer agency credits which result from balances in demand deposit accounts used by the transfer agent for clearing shareholder transactions. For the year ended December 31, 2013, the Fund received credits from this arrangement, which resulted in the reduction of the Fund’s total expenses of $1,154.
NOTE 5—Trustees’ and Officers’ Fees and Benefits
Trustees’ and Officers’ Fees and Benefits include amounts accrued by the Fund to pay remuneration to certain Trustees and Officers of the Fund. Trustees have the option to defer compensation payable by the Fund, and Trustees’ and Officers’ Fees and Benefits also include amounts accrued by the Fund to fund such deferred compensation amounts. Those Trustees who defer compensation have the option to select various Invesco Funds in which their deferral accounts shall be deemed to be invested. Finally, certain current Trustees were eligible to participate in a retirement plan that provided for benefits to be paid upon retirement to Trustees over a period of time based on the number of years of service. The Fund may have certain former Trustees who also participate in a retirement plan and receive benefits under such plan. Trustees’ and Officers’ Fees and Benefits include amounts accrued by the Fund to fund such retirement benefits. Obligations under the deferred compensation and retirement plans represent unsecured claims against the general assets of the Fund.
NOTE 6—Cash Balances
The Fund is permitted to temporarily carry a negative or overdrawn balance in its account with State Street Bank and Trust Company, the custodian bank. Such balances, if any at period end, are shown in the Statement of Assets and Liabilities under the payable caption Amount due custodian. To compensate the custodian bank for such overdrafts, the overdrawn Fund may either (1) leave funds as a compensating balance in the account so the custodian bank can be compensated by earning the additional interest; or (2) compensate by paying the custodian bank at a rate agreed upon by the custodian bank and Invesco, not to exceed the contractually agreed upon rate.
NOTE 7—Distributions to Shareholders and Tax Components of Net Assets
Tax Character of Distributions to Shareholders Paid During the Years Ended December 31, 2013 and 2012:
| 2013 | 2012 | |||||||
Ordinary income | $ | 2,428,636 | $ | 5,597,023 | ||||
Tax Components of Net Assets at Period-End:
| 2013 | ||||
Undistributed ordinary income | $ | (1,921 | ) | |
Net unrealized appreciation (depreciation) — investments | (7,692,343 | ) | ||
Temporary book/tax differences | (53,879 | ) | ||
Capital loss carryforward | (72,930,388 | ) | ||
Shares of beneficial interest | 271,507,168 | |||
Total net assets | $ | 190,828,637 | ||
The difference between book-basis and tax-basis unrealized appreciation (depreciation) is due to differences in the timing of recognition of gains and losses on investments for tax and book purposes. The Fund’s net unrealized appreciation (depreciation) difference is attributable primarily to wash sales.
The temporary book/tax differences are a result of timing differences between book and tax recognition of income and/or expenses. The Fund’s temporary book/tax differences are the result of the trustee deferral of compensation and retirement plan benefits.
16 Invesco International Allocation Fund
Capital loss carryforward is calculated and reported as of a specific date. Results of transactions and other activity after that date may affect the amount of capital loss carryforward actually available for the Fund to utilize. Capital losses generated in years beginning after December 22, 2010 can be carried forward for an unlimited period, whereas previous losses expire in 8 tax years. Capital losses with an expiration period may not be used to offset capital gains until all net capital losses without an expiration date have been utilized. Capital loss carryforwards with no expiration date will retain their character as either short-term or long-term capital losses instead of as short-term capital losses as under prior law. The ability to utilize capital loss carryforward in the future may be limited under the Internal Revenue Code and related regulations based on the results of future transactions.
The Fund has a capital loss carryforward as of December 31, 2013, which expires as follows:
| Capital Loss Carryforward* | ||||||||||||
| Expiration | Short-Term | Long-Term | Total | |||||||||
December 31, 2016 | $ | 27,122,541 | $ | — | $ | 27,122,541 | ||||||
December 31, 2017 | 23,283,288 | — | 23,283,288 | |||||||||
December 31, 2018 | 9,317,140 | — | 9,317,140 | |||||||||
Not subject to expiration | 142,373 | 13,065,046 | 13,207,419 | |||||||||
| $ | 59,865,342 | $ | 13,065,046 | $ | 72,930,388 | |||||||
| * | Capital loss carryforward as of the date listed above is reduced for limitations, if any, to the extent required by the Internal Revenue Code and may be further limited depending on a variety of factors, including the realization of net unrealized gains or losses as of the date of any reorganization. |
NOTE 8—Investment Securities
The aggregate amount of investment securities (other than short-term securities, U.S. Treasury obligations and money market funds, if any) purchased and sold by the Fund during the year ended December 31, 2013 was $14,023,067 and $18,927,570, respectively. Cost of investments on a tax basis includes the adjustments for financial reporting purposes as of the most recently completed federal income tax reporting period-end.
| Unrealized Appreciation (Depreciation) of Investment Securities on a Tax Basis | ||||
Aggregate unrealized appreciation of investment securities | $ | 18,941,419 | ||
Aggregate unrealized (depreciation) of investment securities | (26,633,762 | ) | ||
Net unrealized appreciation (depreciation) of investment securities | $ | (7,692,343 | ) | |
Cost of investments for tax purposes is $199,105,033.
17 Invesco International Allocation Fund
NOTE 9—Share Information
| Summary of Share Activity | ||||||||||||||||
| Years ended December 31, | ||||||||||||||||
| 2013(a) | 2012 | |||||||||||||||
| Shares | Amount | Shares | Amount | |||||||||||||
Sold: | ||||||||||||||||
Class A | 2,386,055 | $ | 24,928,583 | 2,284,884 | $ | 21,833,456 | ||||||||||
Class B | 47,633 | 493,815 | 37,252 | 351,034 | ||||||||||||
Class C | 483,201 | 5,072,727 | 426,239 | 3,998,824 | ||||||||||||
Class R | 206,214 | 2,125,929 | 198,291 | 1,880,950 | ||||||||||||
Class Y | 235,753 | 2,439,778 | 323,505 | 3,100,009 | ||||||||||||
Class R5 | 81,932 | 872,718 | 13,776 | 133,310 | ||||||||||||
Issued as reinvestment of dividends: | ||||||||||||||||
Class A | 163,169 | 1,752,423 | 409,091 | 4,009,097 | ||||||||||||
Class B | 5,622 | 60,328 | 18,674 | 183,011 | ||||||||||||
Class C | 18,500 | 198,509 | 48,281 | 473,149 | ||||||||||||
Class R | 7,056 | 75,786 | 16,468 | 161,385 | ||||||||||||
Class Y | 8,016 | 85,776 | 19,765 | 193,103 | ||||||||||||
Class R5 | 1,946 | 20,902 | 853 | 8,360 | ||||||||||||
Automatic conversion of Class B shares to Class A shares: | ||||||||||||||||
Class A | 94,120 | 983,537 | 118,050 | 1,133,960 | ||||||||||||
Class B | (94,452 | ) | (983,537 | ) | (120,484 | ) | (1,133,960 | ) | ||||||||
Reacquired: | ||||||||||||||||
Class A | (2,976,760 | ) | (31,065,796 | ) | (3,816,595 | ) | (36,617,551 | ) | ||||||||
Class B | (214,440 | ) | (2,232,076 | ) | (248,540 | ) | (2,360,892 | ) | ||||||||
Class C | (577,384 | ) | (5,999,414 | ) | (975,592 | ) | (9,136,195 | ) | ||||||||
Class R | (192,318 | ) | (1,987,955 | ) | (201,333 | ) | (1,910,053 | ) | ||||||||
Class Y | (201,475 | ) | (2,099,714 | ) | (148,752 | ) | (1,429,874 | ) | ||||||||
Class R5 | (4,094 | ) | (43,627 | ) | (6,506 | ) | (59,631 | ) | ||||||||
Net increase (decrease) in share activity | (521,706 | ) | $ | (5,301,308 | ) | (1,602,673 | ) | $ | (15,188,508 | ) | ||||||
| (a) | There are entities that are record owners of more than 5% of the outstanding shares of the Fund and in the aggregate own 37% of the outstanding shares of the Fund. IDI has an agreement with these entities to sell Fund shares. The Fund, Invesco and/or Invesco affiliates may make payments to these entities, which are considered to be related to the Fund, for providing services to the Fund, Invesco and/or Invesco affiliates including but not limited to services such as securities brokerage, distribution, third party record keeping and account servicing. The Fund has no knowledge as to whether all or any portion of the shares owned of record by these entities are also owned beneficially. |
18 Invesco International Allocation Fund
NOTE 10—Financial Highlights
The following schedule presents financial highlights for a share of the Fund outstanding throughout the periods indicated.
| Net asset value, beginning of period | Net investment income(a) | Net gains (losses) on securities (both realized and unrealized) | Total from investment operations | Dividends from net investment income | Net asset value, end of period(b) | Total return(c) | Net assets, end of period (000’s omitted) | Ratio of expenses to average net assets with fee waivers and/or expenses absorbed(d) | Ratio of expenses to average net assets without fee waivers and/or expenses absorbed | Ratio of net investment income to average net assets | Portfolio turnover(e) | |||||||||||||||||||||||||||||||||||||
Class A |
| |||||||||||||||||||||||||||||||||||||||||||||||
Year ended 12/31/13 | $ | 9.94 | $ | 0.14 | $ | 1.15 | $ | 1.29 | $ | (0.16 | ) | $ | 11.07 | 13.02 | % | $ | 136,055 | 0.64 | %(f) | 0.64 | %(f) | 1.36 | %(f) | 8 | % | |||||||||||||||||||||||
Year ended 12/31/12 | 9.07 | 0.14 | 1.09 | 1.23 | (0.36 | ) | 9.94 | 13.62 | 125,566 | 0.60 | 0.68 | 1.42 | 6 | |||||||||||||||||||||||||||||||||||
Year ended 12/31/11 | 10.10 | 0.20 | (1.07 | ) | (0.87 | ) | (0.16 | ) | 9.07 | (8.57 | ) | 123,677 | 0.43 | 0.66 | 1.97 | 11 | ||||||||||||||||||||||||||||||||
Year ended 12/31/10 | 9.20 | 0.14 | 0.96 | 1.10 | (0.20 | ) | 10.10 | 12.04 | 140,375 | 0.43 | 0.64 | 1.50 | 6 | |||||||||||||||||||||||||||||||||||
Year ended 12/31/09 | 6.79 | 0.17 | 2.45 | 2.62 | (0.21 | ) | 9.20 | 38.68 | 148,986 | 0.44 | 0.76 | 2.22 | 11 | |||||||||||||||||||||||||||||||||||
Class B |
| |||||||||||||||||||||||||||||||||||||||||||||||
Year ended 12/31/13 | 9.94 | 0.06 | 1.14 | 1.20 | (0.08 | ) | 11.06 | 12.09 | 8,974 | 1.39 | (f) | 1.39 | (f) | 0.61 | (f) | 8 | ||||||||||||||||||||||||||||||||
Year ended 12/31/12 | 8.98 | 0.06 | 1.08 | 1.14 | (0.18 | ) | 9.94 | 12.78 | 10,606 | 1.35 | 1.43 | 0.67 | 6 | |||||||||||||||||||||||||||||||||||
Year ended 12/31/11 | 9.97 | 0.12 | (1.04 | ) | (0.92 | ) | (0.07 | ) | 8.98 | (9.21 | ) | 12,392 | 1.18 | 1.41 | 1.22 | 11 | ||||||||||||||||||||||||||||||||
Year ended 12/31/10 | 9.09 | 0.07 | 0.94 | 1.01 | (0.13 | ) | 9.97 | 11.18 | 17,336 | 1.18 | 1.39 | 0.75 | 6 | |||||||||||||||||||||||||||||||||||
Year ended 12/31/09 | 6.68 | 0.11 | 2.40 | 2.51 | (0.10 | ) | 9.09 | 37.68 | 19,284 | 1.19 | 1.51 | 1.47 | 11 | |||||||||||||||||||||||||||||||||||
Class C |
| |||||||||||||||||||||||||||||||||||||||||||||||
Year ended 12/31/13 | 9.94 | 0.06 | 1.14 | 1.20 | (0.08 | ) | 11.06 | 12.09 | 30,241 | 1.39 | (f) | 1.39 | (f) | 0.61 | (f) | 8 | ||||||||||||||||||||||||||||||||
Year ended 12/31/12 | 8.98 | 0.06 | 1.08 | 1.14 | (0.18 | ) | 9.94 | 12.78 | 27,929 | 1.35 | 1.43 | 0.67 | 6 | |||||||||||||||||||||||||||||||||||
Year ended 12/31/11 | 9.97 | 0.12 | (1.04 | ) | (0.92 | ) | (0.07 | ) | 8.98 | (9.21 | ) | 29,727 | 1.18 | 1.41 | 1.22 | 11 | ||||||||||||||||||||||||||||||||
Year ended 12/31/10 | 9.09 | 0.07 | 0.94 | 1.01 | (0.13 | ) | 9.97 | 11.18 | 40,020 | 1.18 | 1.39 | 0.75 | 6 | |||||||||||||||||||||||||||||||||||
Year ended 12/31/09 | 6.68 | 0.11 | 2.40 | 2.51 | (0.10 | ) | 9.09 | 37.68 | 42,315 | 1.19 | 1.51 | 1.47 | 11 | |||||||||||||||||||||||||||||||||||
Class R |
| |||||||||||||||||||||||||||||||||||||||||||||||
Year ended 12/31/13 | 9.94 | 0.12 | 1.14 | 1.26 | (0.13 | ) | 11.07 | 12.74 | 6,412 | 0.89 | (f) | 0.89 | (f) | 1.11 | (f) | 8 | ||||||||||||||||||||||||||||||||
Year ended 12/31/12 | 9.04 | 0.11 | 1.09 | 1.20 | (0.30 | ) | 9.94 | 13.35 | 5,554 | 0.85 | 0.93 | 1.17 | 6 | |||||||||||||||||||||||||||||||||||
Year ended 12/31/11 | 10.06 | 0.17 | (1.06 | ) | (0.89 | ) | (0.13 | ) | 9.04 | (8.81 | ) | 4,929 | 0.68 | 0.91 | 1.72 | 11 | ||||||||||||||||||||||||||||||||
Year ended 12/31/10 | 9.16 | 0.12 | 0.96 | 1.08 | (0.18 | ) | 10.06 | 11.84 | 5,679 | 0.68 | 0.89 | 1.25 | 6 | |||||||||||||||||||||||||||||||||||
Year ended 12/31/09 | 6.75 | 0.15 | 2.43 | 2.58 | (0.17 | ) | 9.16 | 38.38 | 4,625 | 0.69 | 1.01 | 1.97 | 11 | |||||||||||||||||||||||||||||||||||
Class Y |
| |||||||||||||||||||||||||||||||||||||||||||||||
Year ended 12/31/13 | 9.91 | 0.17 | 1.13 | 1.30 | (0.18 | ) | 11.03 | 13.23 | 7,959 | 0.39 | (f) | 0.39 | (f) | 1.61 | (f) | 8 | ||||||||||||||||||||||||||||||||
Year ended 12/31/12 | 9.07 | 0.16 | 1.09 | 1.25 | (0.41 | ) | 9.91 | 13.90 | 6,732 | 0.35 | 0.43 | 1.67 | 6 | |||||||||||||||||||||||||||||||||||
Year ended 12/31/11 | 10.10 | 0.22 | (1.06 | ) | (0.84 | ) | (0.19 | ) | 9.07 | (8.30 | ) | 4,396 | 0.18 | 0.41 | 2.22 | 11 | ||||||||||||||||||||||||||||||||
Year ended 12/31/10 | 9.20 | 0.16 | 0.97 | 1.13 | (0.23 | ) | 10.10 | 12.29 | 4,965 | 0.18 | 0.39 | 1.75 | 6 | |||||||||||||||||||||||||||||||||||
Year ended 12/31/09 | 6.80 | 0.21 | 2.44 | 2.65 | (0.25 | ) | 9.20 | 38.99 | 4,033 | 0.19 | 0.51 | 2.47 | 11 | |||||||||||||||||||||||||||||||||||
Class R5 |
| |||||||||||||||||||||||||||||||||||||||||||||||
Year ended 12/31/13 | 9.94 | 0.19 | 1.15 | 1.34 | (0.21 | ) | 11.07 | 13.52 | 1,188 | 0.18 | (f) | 0.18 | (f) | 1.82 | (f) | 8 | ||||||||||||||||||||||||||||||||
Year ended 12/31/12 | 9.10 | 0.17 | 1.11 | 1.28 | (0.44 | ) | 9.94 | 14.09 | 274 | 0.21 | 0.22 | 1.81 | 6 | |||||||||||||||||||||||||||||||||||
Year ended 12/31/11 | 10.16 | 0.22 | (1.09 | ) | (0.87 | ) | (0.19 | ) | 9.10 | (8.52 | ) | 177 | 0.18 | 0.22 | 2.22 | 11 | ||||||||||||||||||||||||||||||||
Year ended 12/31/10 | 9.23 | 0.17 | 0.99 | 1.16 | (0.23 | ) | 10.16 | 12.59 | 89 | 0.16 | 0.16 | 1.77 | 6 | |||||||||||||||||||||||||||||||||||
Year ended 12/31/09 | 6.83 | 0.19 | 2.46 | 2.65 | (0.25 | ) | 9.23 | 38.90 | 66 | 0.18 | 0.23 | 2.48 | 11 | |||||||||||||||||||||||||||||||||||
| (a) | Calculated using average shares outstanding. |
| (b) | Includes redemption fees added to shares of beneficial interest which were less than $0.005 per share for the years ended December 31, 2011, December 31, 2010 and December 31, 2009, respectively. |
| (c) | Includes adjustments in accordance with accounting principles generally accepted in the United States of America and as such, the net asset value for financial reporting purposes and the returns based upon those net asset values may differ from the net asset value and returns for shareholder transactions. Does not include sales charges and is not annualized for periods less than one year, if applicable. |
| (d) | In addition to the fees and expenses which the Fund bears directly; the Fund indirectly bears a pro rata share of the fees and expenses of the underlying funds in which the Fund invests. Because the underlying funds have varied expenses and fee levels and the Fund may own different proportions at different times, the amount of fees and expenses incurred indirectly by the Fund will vary. Estimated underlying fund expenses are not expenses that are incurred directly by your Fund. They are expenses that are incurred directly by the underlying funds and are deducted from the value of the funds your Fund invests in. The effect of the estimated underlying fund expenses that you bear indirectly is included in your Fund’s total return. Estimated acquired fund fees from underlying funds were 0.88%, 0.88%, 0.88%, 0.88% and 0.90% for the years ended December 31, 2013, December 31, 2012, December 31, 2011, December 31, 2010 and December 31, 2009, respectively. |
| (e) | Portfolio turnover is calculated at the fund level and is not annualized for periods less than one year, if applicable. |
| (f) | Ratios are based on average daily net assets (000’s omitted) of $128,746, $9,725, $28,212, $6,128, $7,511 and $418, for Class A, Class B, Class C, Class R, Class Y and Class R5 shares, respectively. |
19 Invesco International Allocation Fund
Report of Independent Registered Public Accounting Firm
To the Board of Trustees of AIM Growth Series (Invesco Growth Series)
and Shareholders of Invesco International Allocation Fund:
In our opinion, the accompanying statement of assets and liabilities, including the schedule of investments, and the related statements of operations and of changes in net assets and the financial highlights present fairly, in all material respects, the financial position of Invesco International Allocation Fund (one of the funds constituting AIM Growth Series (Invesco Growth Series), hereafter referred to as the “Fund”) at December 31, 2013, the results of its operations for the year then ended, the changes in its net assets for each of the two years in the period then ended and the financial highlights for each of the five years in the period then ended, in conformity with accounting principles generally accepted in the United States of America. These financial statements and financial highlights (hereafter referred to as “financial statements”) are the responsibility of the Fund’s management; our responsibility is to express an opinion on these financial statements based on our audits. We conducted our audits of these financial statements in accordance with the standards of the Public Company Accounting Oversight Board (United States). Those standards require that we plan and perform the audit to obtain reasonable assurance about whether the financial statements are free of material misstatement. An audit includes examining, on a test basis, evidence supporting the amounts and disclosures in the financial statements, assessing the accounting principles used and significant estimates made by management, and evaluating the overall financial statement presentation. We believe that our audits, which included confirmation of securities at December 31, 2013 by correspondence with the custodian and transfer agent, provide a reasonable basis for our opinion.
PRICEWATERHOUSECOOPERS LLP
February 26, 2014
Houston, Texas
20 Invesco International Allocation Fund
Calculating your ongoing Fund expenses
Example
As a shareholder of the Fund, you incur two types of costs: (1) transaction costs, which may include sales charges (loads) on purchase payments or contingent deferred sales charges on redemptions, if any; and (2) ongoing costs, including distribution and/or service (12b-1) fees, and other Fund expenses. This example is intended to help you understand your ongoing costs (in dollars) of investing in the Fund and to compare these costs with ongoing costs of investing in other mutual funds. The example is based on an investment of $1,000 invested at the beginning of the period and held for the entire period July 1, 2013, through December 31, 2013.
In addition to the fees and expenses which the Fund bears directly, the Fund indirectly bears a pro rata share of the fees and expenses of the underlying funds in which your Fund invests. The amount of fees and expenses incurred indirectly by your Fund will vary because the underlying funds have varied expenses and fee levels and the Fund may own different proportions of the underlying funds at different times. Estimated underlying fund expenses are not expenses that are incurred directly by your Fund. They are expenses that are incurred directly by the underlying funds and are deducted from the value of the underlying funds your Fund invests in. The effect of the estimated underlying fund expenses that you bear indirectly are included in your Fund’s total return.
Actual expenses
The table below provides information about actual account values and actual expenses. You may use the information in this table, together with the amount you invested, to estimate the expenses that you paid over the period. Simply divide your account value by $1,000 (for example, an $8,600 account value divided by $1,000 = 8.6), then multiply the result by the number in the table under the heading entitled “Actual Expenses Paid During Period” to estimate the expenses you paid on your account during this period.
Hypothetical example for comparison purposes
The table below also provides information about hypothetical account values and hypothetical expenses based on the Fund’s actual expense ratio and an assumed rate of return of 5% per year before expenses, which is not the Fund’s actual return.
The hypothetical account values and expenses may not be used to estimate the actual ending account balance or expenses you paid for the period. You may use this information to compare the ongoing costs of investing in the Fund and other funds. To do so, compare this 5% hypothetical example with the 5% hypothetical examples that appear in the shareholder reports of the other funds.
Please note that the expenses shown in the table are meant to highlight your ongoing costs only and do not reflect any transaction costs, such as sales charges (loads) on purchase payments or contingent deferred sales charges on redemptions, if any. Therefore, the hypothetical information is useful in comparing ongoing costs only, and will not help you determine the relative total costs of owning different funds. In addition, expenses shown in the table do not include the expenses of the underlying funds, which are borne indirectly by the Fund. If transaction costs and indirect expenses were included, your costs would have been higher.
| Class | Beginning Account Value (07/01/13) | ACTUAL | HYPOTHETICAL (5% annual return before expenses) | Annualized Expense Ratio | ||||||||||||||||||||
| Ending Account Value (12/31/13)1 | Expenses Paid During Period2 | Ending Account Value (12/31/13) | Expenses Paid During Period2 | |||||||||||||||||||||
| A | $ | 1,000.00 | $ | 1,133.60 | $ | 3.39 | $ | 1,022.03 | $ | 3.21 | 0.63 | % | ||||||||||||
| B | 1,000.00 | 1,128.80 | 7.40 | 1,018.25 | 7.02 | 1.38 | ||||||||||||||||||
| C | 1,000.00 | 1,128.80 | 7.40 | 1,018.25 | 7.02 | 1.38 | ||||||||||||||||||
| R | 1,000.00 | 1,132.00 | 4.73 | 1,020.77 | 4.48 | 0.88 | ||||||||||||||||||
| Y | 1,000.00 | 1,134.50 | 2.04 | 1,023.29 | 1.94 | 0.38 | ||||||||||||||||||
| R5 | 1,000.00 | 1,136.40 | 0.92 | 1,024.35 | 0.87 | 0.17 | ||||||||||||||||||
| 1 | The actual ending account value is based on the actual total return of the Fund for the period July 1, 2013 through December 31, 2013, after actual expenses and will differ from the hypothetical ending account value which is based on the Fund’s expense ratio and a hypothetical annual return of 5% before expenses. |
| 2 | Expenses are equal to the Fund’s annualized expense ratio as indicated above multiplied by the average account value over the period, multiplied by 184/365 to reflect the most recent fiscal half year. |
21 Invesco International Allocation Fund
Tax Information
Form 1099-DIV, Form 1042-S and other year–end tax information provide shareholders with actual calendar year amounts that should be included in their tax returns. Shareholders should consult their tax advisors.
The following distribution information is being provided as required by the Internal Revenue Code or to meet a specific state’s requirement.
The Fund designates the following amounts or, if subsequently determined to be different, the maximum amount allowable for its fiscal year ended December 31, 2013:
Federal and State Income Tax | ||||
Qualified Dividend Income* | 100 | % | ||
| * | The above percentage is based on ordinary income dividends paid to shareholders during the Fund’s fiscal year. |
22 Invesco International Allocation Fund
Trustees and Officers
The address of each trustee and officer is AIM Growth Series (Invesco Growth Series) (the “Trust”), 11 Greenway Plaza, Suite 1000, Houston, Texas 77046-1173. The trustees serve for the life of the Trust, subject to their earlier death, incapacitation, resignation, retirement or removal as more specifically provided in the Trust’s organizational documents. Each officer serves for a one year term or until their successors are elected and qualified. Column two below includes length of time served with predecessor entities, if any.
| Name, Year of Birth and Position(s) Held with the Trust | Trustee and/ or Officer Since | Principal Occupation(s) During Past 5 Years | Number of Funds in Fund Complex Overseen by Trustee | Other Directorship(s) Held by Trustee During Past 5 Years | ||||
| Interested Persons | ||||||||
| Martin L. Flanagan1 — 1960 Trustee | 2007 | Executive Director, Chief Executive Officer and President, Invesco Ltd. (ultimate parent of Invesco and a global investment management firm); Advisor to the Board, Invesco Advisers, Inc. (formerly known as Invesco Institutional (N.A.), Inc.); Trustee, The Invesco Funds; Vice Chair, Investment Company Institute; and Member of Executive Board, SMU Cox School of Business
Formerly: Chairman and Chief Executive Officer, Invesco Advisers, Inc. (registered investment adviser); Director, Chairman, Chief Executive Officer and President, IVZ Inc. (holding company), INVESCO Group Services, Inc. (service provider) and Invesco North American Holdings, Inc. (holding company); Director, Chief Executive Officer and President, Invesco Holding Company Limited (parent of Invesco and a global investment management firm); Director, Invesco Ltd.; Chairman, Investment Company Institute and President, Co-Chief Executive Officer, Co-President, Chief Operating Officer and Chief Financial Officer, Franklin Resources, Inc. (global investment management organization) | 123 | None | ||||
| Philip A. Taylor2 — 1954 Trustee, President and Principal Executive Officer | 2006 | Head of North American Retail and Senior Managing Director, Invesco Ltd.; Director, Co-Chairman, Co-President and Co-Chief Executive Officer, Invesco Advisers, Inc. (formerly known as Invesco Institutional (N.A.), Inc.) (registered investment adviser); Director, Chairman, Chief Executive Officer and President, Invesco Management Group, Inc. (formerly known as Invesco Aim Management Group, Inc.) (financial services holding company); Director and President, INVESCO Funds Group, Inc. (registered investment adviser and registered transfer agent); Director and Chairman, Invesco Investment Services, Inc. (formerly known as Invesco Aim Investment Services, Inc.) (registered transfer agent) and IVZ Distributors, Inc. (formerly known as INVESCO Distributors, Inc.) (registered broker dealer); Director, President and Chairman, Invesco Inc. (holding company) and Invesco Canada Holdings Inc. (holding company); Chief Executive Officer, Invesco Corporate Class Inc. (corporate mutual fund company) and Invesco Canada Fund Inc. (corporate mutual fund company); Director, Chairman and Chief Executive Officer, Invesco Canada Ltd. (formerly known as Invesco Trimark Ltd./Invesco Trimark Ltèe) (registered investment adviser and registered transfer agent); Trustee, President and Principal Executive Officer, The Invesco Funds (other than AIM Treasurer’s Series Trust (Invesco Treasurer’s Series Trust) and Short-Term Investments Trust); Trustee and Executive Vice President, The Invesco Funds (AIM Treasurer’s Series Trust (Invesco Treasurer’s Series Trust) and Short-Term Investments Trust only); Director, Invesco Investment Advisers LLC (formerly known as Van Kampen Asset Management); Director, Chief Executive Officer and President, Van Kampen Exchange Corp.
Formerly: Director and Chairman, Van Kampen Investor Services Inc.: Director, Chief Executive Officer and President, 1371 Preferred Inc. (holding company); and Van Kampen Investments Inc.; Director and President, AIM GP Canada Inc. (general partner for limited partnerships); and Van Kampen Advisors, Inc.; Director and Chief Executive Officer, Invesco Trimark Dealer Inc. (registered broker dealer); Director, Invesco Distributors, Inc. (formerly known as Invesco Aim Distributors, Inc.) (registered broker dealer); Manager, Invesco PowerShares Capital Management LLC; Director, Chief Executive Officer and President, Invesco Advisers, Inc.; Director, Chairman, Chief Executive Officer and President, Invesco Aim Capital Management, Inc.; President, Invesco Trimark Dealer Inc. and Invesco Trimark Ltd./Invesco Trimark Ltèe; Director and President, AIM Trimark Corporate Class Inc. and AIM Trimark Canada Fund Inc.; Senior Managing Director, Invesco Holding Company Limited; Trustee and Executive Vice President, Tax-Free Investments Trust; Director and Chairman, Fund Management Company (former registered broker dealer); President and Principal Executive Officer, The Invesco Funds (AIM Treasurer’s Series Trust (Invesco Treasurer’s Series Trust), Short-Term Investments Trust and Tax-Free Investments Trust only); President, AIM Trimark Global Fund Inc. and AIM Trimark Canada Fund Inc. | 123 | None | ||||
Wayne W. Whalen3 — 1939 Trustee | 2010 | Of Counsel, and prior to 2010, partner in the law firm of Skadden, Arps, Slate, Meagher & Flom LLP, legal counsel to certain funds in the Fund Complex | 136 | Director of the Mutual Fund Directors Forum, a nonprofit membership organization for investment directors; Chairman and Director of the Abraham Lincoln Presidential Library Foundation; and Director of the Stevenson Center for Democracy |
| 1 | Mr. Flanagan is considered an interested person of the Trust because he is an officer of the adviser to the Trust, and an officer and a director of Invesco Ltd., ultimate parent of the adviser to the Trust. |
| 2 | Mr. Taylor is considered an interested person of the Trust because he is an officer and a director of the adviser to, and a director of the principal underwriter of, the Trust. |
| 3 | Mr. Whalen is considered an “interested person” (within the meaning of Section 2(a)(19) of the 1940 Act) of certain Funds in the Invesco Fund Complex because he and his firm currently provide legal services as legal counsel to such Funds. |
T-1 Invesco International Allocation Fund
Trustees and Officers—(continued)
| Name, Year of Birth and Position(s) Held with the Trust | Trustee and/ or Officer Since | Principal Occupation(s) During Past 5 Years | Number of Funds in Fund Complex Overseen by Trustee | Other Directorship(s) Held by Trustee During Past 5 Years | ||||
| Independent Trustees | ||||||||
Bruce L. Crockett — 1944 Trustee and Chair | 2001 | Chairman, Crockett Technologies Associates (technology consulting company)
Formerly: Director, Captaris (unified messaging provider); Director, President and Chief Executive Officer COMSAT Corporation; and Chairman, Board of Governors of INTELSAT (international communications company) | 123 | ACE Limited (insurance company); Investment Company Institute | ||||
David C. Arch — 1945 Trustee | 2010 | Chairman and Chief Executive Officer of Blistex Inc., (consumer health care products manufacturer)
Formerly: Member of the Heartland Alliance Advisory Board, a nonprofit organization serving human needs based in Chicago | 136 | Board member of the Illinois Manufacturers’ Association; Member of the Board of Visitors, Institute for the Humanities, University of Michigan | ||||
Frank S. Bayley — 1939 Trustee | 1985 | Retired
Formerly: Director, Badgley Funds, Inc. (registered investment company) (2 portfolios) and General Partner and Of Counsel, law firm of Baker & McKenzie, LLP | 123 | Director and Chairman, C.D. Stimson Company (a real estate investment company); Trustee and Overseer, The Curtis Institute of Music | ||||
James T. Bunch — 1942 Trustee | 2003 | Managing Member, Grumman Hill Group LLC (family office private equity management)
Formerly: Founder, Green, Manning & Bunch Ltd. (investment banking firm) (1988-2010); Executive Committee, United States Golf Association; and Director, Policy Studies, Inc. and Van Gilder Insurance Corporation | 123 | Chairman, Board of Governors, Western Golf Association; Chairman-elect, Evans Scholars Foundation; and Director, Denver Film Society | ||||
Rodney F. Dammeyer — 1940 Trustee | 2010 | Chairman of CAC, LLC, (private company offering capital investment and management advisory services)
Formerly: Prior to 2001, Managing Partner at Equity Group Corporate Investments; Prior to 1995, Chief Executive Officer of Itel Corporation (formerly Anixter International); Prior to 1985, experience includes Senior Vice President and Chief Financial Officer of Household International, Inc., Executive Vice President and Chief Financial Officer of Northwest Industries, Inc. and Partner of Arthur Andersen & Co.; From 1987 to 2010, Director/Trustee of investment companies in the Van Kampen Funds complex | 123 | Director of Quidel Corporation and Stericycle, Inc.; Prior to May 2008, Trustee of The Scripps Research Institute; Prior to February 2008, Director of Ventana Medical Systems, Inc. | ||||
Albert R. Dowden — 1941 Trustee | 2001 | Director of a number of public and private business corporations, including the Boss Group, Ltd. (private investment and management); and Reich & Tang Funds (5 portfolios) (registered investment company)
Formerly: Director, Homeowners of America Holding Corporation/Homeowners of America Insurance Company (property casualty company); Director, Continental Energy Services, LLC (oil and gas pipeline service); Director, CompuDyne Corporation (provider of product and services to the public security market) and Director, Annuity and Life Re (Holdings), Ltd. (reinsurance company); Director, President and Chief Executive Officer, Volvo Group North America, Inc.; Senior Vice President, AB Volvo; Director of various public and private corporations; Chairman, DHJ Media, Inc.; Director, Magellan Insurance Company; and Director, The Hertz Corporation, Genmar Corporation (boat manufacturer), National Media Corporation; Advisory Board of Rotary Power International (designer, manufacturer, and seller of rotary power engines); and Chairman, Cortland Trust, Inc. (registered investment company) | 123 | Director of Nature’s Sunshine Products, Inc. | ||||
Jack M. Fields — 1952 Trustee | 2001 | Chief Executive Officer, Twenty First Century Group, Inc. (government affairs company); Owner and Chief Executive Officer, Dos Angeles Ranch, L.P. (cattle, hunting, corporate entertainment); and Discovery Global Education Fund (non-profit)
Formerly: Chief Executive Officer, Texana Timber LP (sustainable forestry company); Director of Cross Timbers Quail Research Ranch (non-profit); and member of the U.S. House of Representatives | 123 | Insperity, Inc. (formerly known as Administaff) | ||||
Prema Mathai-Davis — 1950 Trustee | 2001 | Retired
Formerly: Chief Executive Officer, YWCA of the U.S.A. | 123 | None | ||||
Larry Soll — 1942 Trustee | 2003 | Retired
Formerly: Chairman, Chief Executive Officer and President, Synergen Corp. (a biotechnology company) | 123 | None | ||||
Hugo F. Sonnenschein — 1940 Trustee | 2010 | Distinguished Service Professor and President Emeritus of the University of Chicago and the Adam Smith Distinguished Service Professor in the Department of Economics at the University of Chicago
Formerly: President of the University of Chicago | 136 | Trustee of the University of Rochester and a member of its investment committee. Member of the National Academy of Sciences, the American Philosophical Society and a fellow of the American Academy of Arts and Sciences |
T-2 Invesco International Allocation Fund
Trustees and Officers—(continued)
| Name, Year of Birth and Position(s) Held with the Trust | Trustee and/ or Officer Since | Principal Occupation(s) During Past 5 Years | Number of Funds in Fund Complex Overseen by Trustee | Other Directorship(s) Held by Trustee During Past 5 Years | ||||
| Independent Trustees—(continued) | ||||||||
Raymond Stickel, Jr. — 1944 Trustee | 2005 | Retired
Formerly: Director, Mainstay VP Series Funds, Inc. (25 portfolios) and Partner, Deloitte & Touche | 123 | None | ||||
| Other Officers | ||||||||
| Russell C. Burk — 1958 Senior Vice President and Senior Officer | 2005 | Senior Vice President and Senior Officer, The Invesco Funds | N/A | N/A | ||||
| John M. Zerr — 1962 Senior Vice President, Chief Legal Officer and Secretary | 2006 | Director, Senior Vice President, Secretary and General Counsel, Invesco Management Group, Inc. (formerly known as Invesco Aim Management Group, Inc.) and Van Kampen Exchange Corp.; Senior Vice President, Invesco Advisers, Inc. (formerly known as Invesco Institutional (N.A.), Inc.) (registered investment adviser); Senior Vice President and Secretary, Invesco Distributors, Inc. (formerly known as Invesco Aim Distributors, Inc.); Director, Vice President and Secretary, Invesco Investment Services, Inc. (formerly known as Invesco Aim Investment Services, Inc.) and IVZ Distributors, Inc. (formerly known as INVESCO Distributors, Inc.); Director and Vice President, INVESCO Funds Group, Inc.; Senior Vice President, Chief Legal Officer and Secretary, The Invesco Funds; Manager, Invesco PowerShares Capital Management LLC; Director, Secretary and General Counsel, Invesco Investment Advisers LLC (formerly known as Van Kampen Asset Management); Secretary and General Counsel, Invesco Capital Markets, Inc. (formerly known as Van Kampen Funds Inc.) and Chief Legal Officer, PowerShares Exchange-Traded Fund Trust, PowerShares Exchange-Traded Fund Trust II, PowerShares India Exchange-Traded Fund Trust and PowerShares Actively Managed Exchange-Traded Fund Trust
Formerly: Director and Vice President, Van Kampen Advisors Inc.; Director, Vice President, Secretary and General Counsel, Van Kampen Investor Services Inc.; Director, Invesco Distributors, Inc. (formerly known as Invesco Aim Distributors, Inc.); Director, Senior Vice President, General Counsel and Secretary, Invesco Aim Advisers, Inc. and Van Kampen Investments Inc.; Director, Vice President and Secretary, Fund Management Company; Director, Senior Vice President, Secretary, General Counsel and Vice President, Invesco Aim Capital Management, Inc.; Chief Operating Officer and General Counsel, Liberty Ridge Capital, Inc. (an investment adviser); Vice President and Secretary, PBHG Funds (an investment company) and PBHG Insurance Series Fund (an investment company); Chief Operating Officer, General Counsel and Secretary, Old Mutual Investment Partners (a broker-dealer); General Counsel and Secretary, Old Mutual Fund Services (an administrator) and Old Mutual Shareholder Services (a shareholder servicing center); Executive Vice President, General Counsel and Secretary, Old Mutual Capital, Inc. (an investment adviser); and Vice President and Secretary, Old Mutual Advisors Funds (an investment company) | N/A | N/A | ||||
| Karen Dunn Kelley — 1960 Vice President | 2004 | Senior Managing Director, Investments; Director, Co-President, Co-Chief Executive Officer, and Co-Chairman, Invesco Advisers, Inc. (formerly known as Invesco Institutional (N.A.), Inc.) (registered investment adviser); Chairman, Invesco Senior Secured Management, Inc.; Senior Vice President, Invesco Management Group, Inc. (formerly known as Invesco Aim Management Group, Inc.); Executive Vice President, Invesco Distributors, Inc. (formerly known as Invesco Aim Distributors, Inc.); Director, Invesco Mortgage Capital Inc., and Invesco Management Company Limited; Director and President, INVESCO Asset Management (Bermuda) Ltd., Vice President, The Invesco Funds (other than AIM Treasurer’s Series Trust (Invesco Treasurer’s Series Trust) and Short-Term Investments Trust); and President and Principal Executive Officer, The Invesco Funds (AIM Treasurer’s Series Trust (Invesco Treasurer’s Series Trust) and Short-Term Investments Trust only)
Formerly: Director, INVESCO Global Asset Management Limited and INVESCO Management S.A.; Senior Vice President, Van Kampen Investments Inc. and Invesco Advisers, Inc. (formerly known as Invesco Institutional (N.A.), Inc.) (registered investment adviser); Vice President, Invesco Advisers, Inc. (formerly known as Invesco Institutional (N.A.), Inc.); Director of Cash Management and Senior Vice President, Invesco Advisers, Inc. and Invesco Aim Capital Management, Inc.; President and Principal Executive Officer, Tax-Free Investments Trust; Director and President, Fund Management Company; Chief Cash Management Officer, Director of Cash Management, Senior Vice President, and Managing Director, Invesco Aim Capital Management, Inc.; Director of Cash Management, Senior Vice President, and Vice President, Invesco Advisers, Inc. and The Invesco Funds (AIM Treasurer’s Series Trust (Invesco Treasurer’s Series Trust), Short-Term Investments Trust and Tax-Free Investments Trust only) | N/A | N/A | ||||
T-3 Invesco International Allocation Fund
Trustees and Officers—(continued)
| Name, Year of Birth and Position(s) Held with the Trust | Trustee and/ or Officer Since | Principal Occupation(s) During Past 5 Years | Number of Funds in Fund Complex Overseen by Trustee | Other Directorship(s) Held by Trustee During Past 5 Years | ||||
| Other Officers—(continued) | ||||||||
| Sheri Morris — 1964 Vice President, Treasurer and Principal Financial Officer | 1999 | Vice President, Treasurer and Principal Financial Officer, The Invesco Funds; Vice President, Invesco Advisers, Inc. (formerly known as Invesco Institutional (N.A.), Inc.) (registered investment adviser); and Vice President, PowerShares Exchange-Traded Fund Trust, PowerShares Exchange-Traded Fund Trust II, PowerShares India Exchange-Traded Fund Trust and PowerShares Actively Managed Exchange-Traded Fund Trust
Formerly: Vice President, Invesco Aim Advisers, Inc., Invesco Aim Capital Management, Inc. and Invesco Aim Private Asset Management, Inc.; Assistant Vice President and Assistant Treasurer, The Invesco Funds and Assistant Vice President, Invesco Advisers, Inc., Invesco Aim Capital Management, Inc. and Invesco Aim Private Asset Management, Inc.; and Treasurer, PowerShares Exchange-Traded Fund Trust, PowerShares Exchange-Traded Fund Trust II, PowerShares India Exchange-Traded Fund Trust and PowerShares Actively Managed Exchange-Traded Fund Trust | N/A | N/A | ||||
Crissie M. Wisdom — 1969 Anti-Money Laundering Compliance Officer | 2013 | Anti-Money Laundering Compliance Officer, Invesco Advisers, Inc. (formerly known as Invesco Institutional (N.A.), Inc.) (registered investment adviser), Invesco Capital Markets, Inc. (formerly known as Van Kampen Funds Inc.), Invesco Distributors, Inc., Invesco Investment Services, Inc., Invesco Management Group, Inc., Van Kampen Exchange Corp., The Invesco Funds, Invesco Funds (Chicago), and PowerShares Exchange-Traded Fund Trust, PowerShares Exchange-Traded Fund Trust II, PowerShares India Exchange-Traded Fund Trust, and PowerShares Actively Managed Exchange-Traded Fund Trust; and Fraud Prevention Manager and Controls and Risk Analysis Manager for Invesco Investment Services, Inc. | N/A | N/A | ||||
| Todd L. Spillane — 1958 Chief Compliance Officer | 2006 | Senior Vice President, Invesco Management Group, Inc. (formerly known as Invesco Aim Management Group, Inc.) and Van Kampen Exchange Corp.; Senior Vice President and Chief Compliance Officer, Invesco Advisers, Inc. (registered investment adviser) (formerly known as Invesco Institutional (N.A.), Inc.); Chief Compliance Officer, The Invesco Funds; Vice President, Invesco Distributors, Inc. (formerly known as Invesco Aim Distributors, Inc.) and Invesco Investment Services, Inc. (formerly known as Invesco Aim Investment Services, Inc.)
Formerly: Chief Compliance Officer, Invesco Funds (Chicago); Senior Vice President, Van Kampen Investments Inc.; Senior Vice President and Chief Compliance Officer, Invesco Aim Advisers, Inc. and Invesco Aim Capital Management, Inc.; Chief Compliance Officer, INVESCO Private Capital Investments, Inc. (holding company), Invesco Private Capital, Inc. (registered investment adviser), Invesco Global Asset Management (N.A.), Inc., Invesco Senior Secured Management, Inc. (registered investment adviser), Van Kampen Investor Services Inc., PowerShares Exchange-Traded Fund Trust, PowerShares Exchange-Traded Fund Trust II, PowerShares India Exchange-Traded Fund Trust and PowerShares Actively Managed Exchange-Traded Fund Trust; and Vice President, Invesco Aim Capital Management, Inc. and Fund Management Company | N/A | N/A |
The Statement of Additional Information of the Trust includes additional information about the Fund’s Trustees and is available upon request, without charge, by calling 1.800.959.4246. Please refer to the Fund’s prospectus for information on the Fund’s sub-advisers.
Office of the Fund 11 Greenway Plaza, Suite 1000 Houston, TX 77046-1173 | Investment Adviser Invesco Advisers, Inc. 1555 Peachtree Street, N.E. Atlanta, GA 30309 | Distributor Invesco Distributors, Inc. 11 Greenway Plaza, Suite 1000 Houston, TX 77046-1173 | Auditors PricewaterhouseCoopers LLP 1201 Louisiana Street, Suite 2900 Houston, TX 77002-5678 | |||
Counsel to the Fund Stradley Ronon Stevens & Young, LLP 2005 Market Street, Suite 2600 Philadelphia, PA 19103-7018 | Counsel to the Independent Trustees Goodwin Procter LLP 901 New York Avenue, N.W. Washington, D.C. 20001 | Transfer Agent Invesco Investment Services, Inc. 11 Greenway Plaza, Suite 1000 Houston, TX 77046-1173 | Custodian State Street Bank and Trust Company 225 Franklin Street Boston, MA 02110-2801 | |||
T-4 Invesco International Allocation Fund

Invesco mailing information
Send general correspondence to Invesco Investment Services, Inc., P.O. Box 219078, Kansas City, MO 64121-9078.
Invesco privacy policy
You share personal and financial information with us that is necessary for your transactions and your account records. We take very seriously the obligation to keep that information confidential and private.
Invesco collects nonpublic personal information about you from account applications or other forms you complete and from your transactions with us or our affiliates. We do not disclose information about you or our former customers to service providers or other third parties except to the extent necessary to service your account and in other limited circumstances as permitted by law. For example, we use this information to facilitate the delivery of transaction confirmations, financial reports, prospectuses and tax forms.
Even within Invesco, only people involved in the servicing of your accounts and compliance monitoring have access to your information. To ensure the highest level of confidentiality and security, Invesco maintains physical, electronic and procedural safeguards that meet or exceed federal standards. Special measures, such as data encryption and authentication, apply to your communications with us on our website. More detail is available to you at invesco.com/privacy.
Important notice regarding delivery of security holder documents
To reduce Fund expenses, only one copy of most shareholder documents may be mailed to shareholders with multiple accounts at the same address (Householding). Mailing of your shareholder documents may be householded indefinitely unless you instruct us otherwise. If you do not want the mailing of these documents to be combined with those for other members of your household, please contact Invesco Investment Services, Inc. at 800 959 4246 or contact your financial institution. We will begin sending you individual copies for each account within 30 days after receiving your request.
Fund holdings and proxy voting information
The Fund provides a complete list of its holdings four times in each fiscal year, at the quarter ends. For the second and fourth quarters, the lists appear in the Fund’s semiannual and annual reports to shareholders. For the first and third quarters, the Fund files the lists with the Securities and Exchange Commission (SEC) on Form N-Q. The most recent list of portfolio holdings is available at invesco.com/completeqtrholdings. Shareholders can also look up the Fund’s Forms N-Q on the SEC website at sec.gov. Copies of the Fund’s Forms N-Q may be reviewed and copied at the SEC Public Reference Room in Washington, D.C. You can obtain information on the operation of the Public Reference Room, including information about duplicating fee charges, by calling 202 551 8090 or 800 732 0330, or by electronic request at the following email address: publicinfo@sec.gov. The SEC file numbers for the Fund are shown below.
A description of the policies and procedures that the Fund uses to determine how to vote proxies relating to portfolio securities is available without charge, upon request, from our Client Services department at 800 959 4246 or at invesco.com/proxyguidelines. The information is also available on the SEC website, sec.gov.
Information regarding how the Fund voted proxies related to its portfolio securities during the most recent 12-month period ended June 30 is available at invesco.com/proxysearch. The information is also available on the SEC website, sec.gov.
| Invesco Advisers, Inc. is an investment adviser; it provides investment advisory services to individual and institutional clients and does not sell securities. Invesco Distributors, Inc. is the US distributor for Invesco Ltd.’s retail mutual funds, exchange-traded funds and institutional money market funds. Both are wholly owned, indirect subsidiaries of Invesco Ltd. |  | |
| SEC file numbers: : 811-02699 and 002-57526 INTAL-AR-1 Invesco Distributors, Inc. | ||
|
| |||||
Annual Report to Shareholders
| December 31, 2013
| |||||
Invesco Mid Cap Core Equity Fund | ||||||
Nasdaq: A: GTAGX § B: GTABX § C: GTACX § R: GTARX § Y: GTAYX § R5: GTAVX § R6: GTAFX | ||||||


Letters to Shareholders
Philip Taylor | Dear Shareholders: This annual report includes information about your Invesco Fund, including performance data and a complete list of its investments as of the close of the reporting period. Inside, your Fund’s portfolio managers discuss how they managed your Fund and the factors that affected its performance during the reporting period. I hope you find this report of interest. During the year covered by this report, major US and global equity market indexes hit multiyear or all-time highs1, the result of a strengthening US economy and relatively healthy corporate profits. Also helping equities was a return of individual investors to stocks – due in part to monetary policies that kept interest rates (and yields on fixed income securities) low. At the end of the reporting period, amid widespread signs of an improving economy, the US Federal Reserve announced that it would begin a long-anticipated reduction in its bond-buying program in January 2014; its decision was widely expected and investors reacted positively | ||||||||
| to the announcement. Despite some mid-summer volatility, overseas equity market indexes in developed and emerging nations generally rose during the year. | |||||||||

Extended periods of strong market performance such as we saw throughout 2013 can lull some investors into a false sense of security – just as extended periods of volatility or market weakness can discourage some investors from undertaking disciplined, long-term investment plans. That’s why Invesco believes it can often be helpful to work with a skilled and trusted financial adviser; he or she can emphasize the importance of adhering to an investment plan designed to achieve long-term goals like a first home, a college education for a child or a comfortable retirement. A financial adviser who is familiar with your individual financial situation, investment goals and risk tolerance can be an invaluable partner as you work toward your financial goals. He or she can provide insight and perspective when markets are volatile; encouragement and reassurance when times are uncertain; and advice and guidance when your financial situation or investment goals change.
Timely information when and where you want it
Invesco’s efforts to help investors achieve their financial objectives include providing individual investors and financial professionals with timely information about the markets, the economy and investing – whenever and wherever they want it.
Our website, invesco.com/us, offers a wide range of market insights and investment perspectives. On the website, you’ll find detailed information about our funds, including prices, performance, holdings and portfolio manager commentaries. You can access information about your individual Invesco account whenever it’s convenient for you; just complete a simple, secure online registration. Use the “Login” box on our home page to get started.
Using Invesco’s mobile app for iPad® (available free from the App StoreSM) allows you to obtain the same detailed information about your funds and the same investment insights from our investment leaders, market strategists, economists and retirement experts on the go. You also can watch portfolio manager videos and have instant access to Invesco news and updates wherever you may be.
In addition to the resources accessible on our website and through our mobile app, you can obtain timely updates to help you stay informed about the markets, the economy and investing by connecting with Invesco on Twitter, LinkedIn or Facebook. You can access our blog at blog.invesco.us.com or by visiting the “Intentional Investing Forum” on our home page. Our goal is to provide you the information you want, when and where you want it.
Have questions?
For questions about your account, feel free to contact an Invesco client services representative at 800 959 4246. For Invesco-related questions or comments, please email me directly at phil@invesco.com.
All of us at Invesco look forward to serving your investment management needs for many years to come. Thank you for investing with us.
Sincerely,

Philip Taylor
Senior Managing Director, Invesco Ltd.
1 Source: Reuters
iPad is a trademark of Apple Inc., registered in the US and other countries. App Store is a service mark of Apple Inc.
2 Invesco Mid Cap Core Equity Fund
Bruce Crockett | Dear Fellow Shareholders: Many investors enjoyed positive returns on their investments in 2013. While some sectors of the market struggled, many major equity market indexes in the US and around the globe rose last year. The performance of stocks, fixed income securities and alternative investments – and the performance of mutual funds that invest in them – is determined by many factors, including unforeseeable economic and geopolitical events. Your Board certainly can’t determine how well various asset classes in the market perform, but we work hard throughout the year on issues that affect you and your fellow shareholders and determine how your investments are managed. For example, the Invesco Funds Board works to ensure that we provide a lineup of funds that allow financial advisers to build portfolios that meet shareholders’ changing financial needs and goals. Your Board works with Invesco Advisers on a continuing basis to provide financial | ||||||||

products that may help investors achieve their varied financial goals. We also carefully monitor how the management teams of all the Invesco funds are performing in light of ever-changing and often unpredictable economic and market conditions. Your Board carefully assesses their performance in a constantly changing and highly competitive marketplace.
Your Board also conducts an annual review of the funds’ advisory and sub-advisory contracts with Invesco Advisers and its affiliates. This annual review, which is required by the Investment Company Act of 1940, focuses on the nature and quality of the services Invesco provides as adviser to the Invesco Funds and the reasonableness of the fees that it charges for those services. Each year, we spend months reviewing detailed information that we request from Invesco that allows us to evaluate its services and fees. We also use information from many independent sources, including materials provided by the independent Senior Officer of the Invesco Funds, who reports directly to the independent Trustees on the Board. Additionally, we meet with independent legal counsel and review performance and fee data prepared by Lipper Inc., an independent, third-party firm widely recognized as a leader in its field.
Be assured that your Board will continue working on behalf of fund shareholders, keeping your needs and interests uppermost in our minds.
As always, please contact me at bruce@brucecrockett.com with any questions or concerns you may have. On behalf of the Board, we look forward to continuing to represent your interests and serving your needs.
Sincerely,

Bruce L. Crockett
Independent Chair
Invesco Funds Board of Trustees
3 Invesco Mid Cap Core Equity Fund
Management’s Discussion of Fund Performance
Performance summary
The Invesco Mid Cap Core Equity Fund delivered positive, double-digit returns for year ended December 31, 2013, but trailed its broad market and its style-specific benchmarks, the S&P 500 Index and the Russell Midcap Index, respectively. The Fund’s absolute return benefited from holdings in the industrials, information technology (IT), financials and health care sectors; however, the Fund’s IT holdings lagged its style-specific index on a relative basis. Despite strong stock selection within the consumer discretionary sector, the Fund’s underweight allocation in the sector detracted from relative results. The Fund’s allocation to cash also tempered results for the reporting period.
Your Fund’s long-term performance appears later in this report.
Fund vs. Indexes
Total returns, 12/31/12 to 12/31/13, at net asset value (NAV). Performance shown does not include applicable contingent deferred sales charges (CDSC) or front-end sales charges, which would have reduced performance.
| Class A Shares | 29.19 | % | |||
| Class B Shares | 28.20 | ||||
| Class C Shares | 28.21 | ||||
| Class R Shares | 28.85 | ||||
| Class Y Shares | 29.53 | ||||
| Class R5 Shares | 29.68 | ||||
| Class R6 Shares | 29.75 | ||||
| S&P 500 Index‚ (Broad Market Index) | 32.39 | ||||
| Russell Midcap Index¡ (Style-Specific Index) | 34.76 | ||||
| Lipper Mid-Cap Core Funds Index¿ (Peer Group Index) | 35.04 |
Source(s): ‚Invesco, S&P-Dow Jones via FactSet Research Systems Inc.;
¡ Invesco, Russell via FactSet Research Systems Inc.; ¿Lipper Inc.
How we invest
We seek to manage your Fund with the goal of achieving long-term returns exceeding those of passive benchmarks across a full market cycle, which we define as market trough to market trough, or peak to peak. As Fund managers, we believe investors need a reason to stick with the Fund for long periods of time in order to realize these returns, and believe the best way we can encourage this behavior is by striving to deliver a smoother, less volatile investor experience. The portfolio we construct is intended to provide attractive participation during positive-trending equity markets, but with a greater emphasis on comparative downside protection potential during more turbulent, down-trending
equity markets. We position the Fund to act as a “conservative cornerstone” – a stable foundation for a well-diversified portfolio.
The Fund’s portfolio is comprised of what we call “core stocks.” A core stock encompasses elements of growth (revenues, profits, economic value) and value (both absolute and comparative measures). Along this growth-value continuum, we seek to identify and invest in areas of temporary disconnection between market perception and the view our research uncovers.
To build a portfolio of core stocks, we conduct thorough fundamental research of businesses to gain a deeper understanding of the companies’ prospects, growth potential and return on invested
capital (ROIC) characteristics. The analytical process we use to identify potential investments for the Fund includes three phases: financial, business and valuation.
Financial analysis provides insights into historical ROIC (a key indicator of business quality) and historical capital allocation (a key indicator of management quality). Business analysis evaluates the competitive landscape and any structural or cyclical business opportunities or threats and allows us to identify key revenue, profit and return drivers of the company. Both the financial and business analyses serve as a basis to construct valuation models that help us appraise a company’s intrinsic worth. Our valuation analysis employs three primary techniques: discounted cash flow, traditional valuation multiples and net asset value.
We consider selling a stock when it exceeds our target price, we have not seen a demonstrable improvement in fundamentals or a more compelling investments opportunity exists.
Market conditions and your Fund
The year ended December 31, 2013 was characterized by slow but steady improvement in the US economy and strong US equity market returns. As the year began, consumer confidence trended higher based on the recovery of the US housing market, despite uncertainty surrounding the outcome of tax and spending negotiations between the White House and Congress – and implementation of sequestration spending cuts – which consequently left many businesses hesitant to spend.
US equity markets rose for the first half of the year, but from late May through June, capital markets declined following US Federal Reserve (the Fed) Chairman Ben Bernanke’s comments suggesting that the time had come for the Fed to begin to reduce the size of its bond buying program, also known as quantitative easing (QE). This sell-off was brief but
Portfolio Composition By sector | |||||
| Information Technology | 14.1 | % | |||
| Industrials | 12.8 | ||||
| Financials | 12.4 | ||||
| Consumer Discretionary | 10.1 | ||||
| Energy | 9.1 | ||||
| Health Care | 8.4 | ||||
| Materials | 7.9 | ||||
| Consumer Staples | 4.5 | ||||
| Utilities | 0.8 | ||||
Money Market Funds Plus Other Assets Less Liabilities | 19.9 | ||||
| Top 10 Equity Holdings* | |||||
1. Progressive Corp. (The) | 2.3 | % | |||
2. Linear Technology Corp. | 2.2 | ||||
3. Northern Trust Corp. | 2.0 | ||||
4. Torchmark Corp. | 2.0 | ||||
5. Arch Capital Group Ltd. | 1.7 | ||||
6. Marsh & McLennan Cos., Inc. | 1.7 | ||||
7. NetApp, Inc. | 1.7 | ||||
8. Chicago Bridge & Iron Co. N.V. | 1.7 | ||||
9. Cameron International Corp. | 1.7 | ||||
10. Moody’s Corp. | 1.6 | ||||
Top Five Industries*
| |||||
1. Industrial Machinery | 5.6 | % | |||
2. Property & Casualty Insurance | 4.1 | ||||
3. Oil & Gas Equipment & Services | 4.0 | ||||
4. Semiconductors | 3.8 | ||||
5. Oil & Gas Exploration & Production | 3.2 | ||||
| Total Net Assets | $2.6 billion | ||||
| Total Number of Holdings* | 69 | ||||
The Fund’s holdings are subject to change, and there is no assurance that the Fund will continue to hold any particular security.
*Excluding money market fund holdings.
4 Invesco Mid Cap Core Equity Fund
broad, and few asset classes were immune. Markets stabilized in mid-summer, despite some volatility in August surrounding a potential US military reaction to instability in Syria. The fourth quarter began amid uncertainty created by a two-week federal government shutdown, yet equities shrugged off this news and rallied steadily throughout the last three months of the year. In December, as expected, the Fed officially announced that it would begin reducing the scope of QE in early 2014. Despite the Fed’s actions, equities continued to rise, as the announcement was widely anticipated and largely priced into stock valuations.
For the reporting period, major US equity market indexes delivered strong double-digit gains, and all 10 sectors of the S&P 500 Index had positive returns. The consumer discretionary sector had the highest return of any sector.
The Fund’s investments in the health care sector were among the largest contributors to returns. The top overall contributor was Endo Health Solutions, a specialty health care company focused on pain management. The company reported solid earnings in the fourth quarter, as cost-cutting efforts initiated earlier in the year started to show results. Shares of the company rose sharply following the November announcement of a merger between Endo and Paladin Labs (not a Fund holding), a specialty pharmaceutical firm based in Canada. The deal, which is scheduled to close in early 2014, was greeted favorably by investors, as it is expected to expand Endo’s product portfolio, provide tax savings and be accretive to earnings.
Holdings within the consumer discretionary sector also performed well, and among these was Gamestop, a video game retailer. During the reporting period, the company’s shares rose amid speculation that it would benefit from the fourth-quarter release of next generation gaming consoles ‘Xbox One’ and ‘PlayStation 4’ from Microsoft and Sony (not Fund holdings), respectively. Gamestop stood to benefit from the sale of the gaming consoles, as well as the fact that both consoles have the ability to play used games, the core of Gamestop’s business. We trimmed our exposure to the stock, but still maintained a position at the end of the reporting period.
The Fund’s largest detractor was Kinross Gold, a gold mining company. Nearly all mining stocks were hit hard by declining gold prices during the year, with many stocks in the industry touching multiyear lows. Predictably, Kinross’ revenues were negatively impacted, while operating costs trended higher. The
company also faced issues related to its mining project in Ecuador due to stalled negotiations with the government in that country.
Another detractor from Fund performance was F5 Networks, a company that provides products and services to manage Internet traffic. Macroeconomic softness and product transition have contributed to recent weakness in the stock, but we believe there is potential for reacceleration from a product refresh and competitive gains. Effectively and securely managing network traffic is an increasingly complex task. The firm’s products are very helpful in allowing users to simplify this task, while improving overall network efficiency and reducing expenditures on other equipment. We believe F5 Networks is well-positioned in the long term with good structural growth drivers, leading market share, good margins, good returns and execution over time.
During the reporting period, we trimmed our exposure to the consumer staples and IT sectors and increased our exposure to the energy, industrials and consumer discretionary sectors. At the end of the reporting period, our largest overweights relative to the Russell Midcap Index were in the energy and materials sectors, and the largest underweights were in the consumer discretionary and financials sectors.
Regardless of market conditions, our goal remains the same: to serve as a conservative cornerstone for your mid-cap investment allocation, seeking to provide upside participation with a measure of downside protection, so that over a full market cycle we may deliver strong investment results while managing risk relative to the the Fund’s style-specific benchmark.
As always, thank you for your continued investment in Invesco Mid Cap Core Equity Fund.
Diversification does not eliminate the risk of loss.
The views and opinions expressed in management’s discussion of Fund performance are those of Invesco Advisers, Inc. These views and opinions are subject to change at any time based on factors such as market and economic conditions. These views and opinions may not be relied upon as investment advice or recommendations, or as an offer for a particular security. The information is not a complete analysis of every aspect of any market, country, industry, security or the Fund. Statements of fact are from sources considered reliable, but Invesco Advisers, Inc. makes no representation or warranty as to their completeness or accuracy. Although historical performance is no guarantee of future results, these insights may help you understand our investment management philosophy.
See important Fund and, if applicable, index disclosures later in this report.
 | Ronald Sloan Chartered Financial Analyst, portfolio manager and chief investment officer of Invesco’s domestic | |
| core investments team, is lead manager of Invesco Mid Cap Core Equity Fund. He joined Invesco in 1998. Mr. Sloan earned a BS in business administration and an MBA from the University of Missouri. | ||
 | Douglas Asiello Chartered Financial Analyst, portfolio manager, is manager of Invesco Mid Cap Core Equity Fund. He joined | |
| Invesco in 2000. Mr. Asiello earned a BA in international relations and Spanish from Vanderbilt University. He also earned an MBA with a concentration in finance from the Wharton School and an MA in international management from the Joseph H. Lauder Institute of Management and International Studies, both of the University of Pennsylvania. | ||
 | Brian Nelson Chartered Financial Analyst, portfolio manager, is manager of Invesco Mid Cap Core Equity Fund. He joined | |
| Invesco in 2004. Mr. Nelson earned a BA from the University of California, Santa Barbara. | ||
5 Invesco Mid Cap Core Equity Fund
Your Fund’s Long-Term Performance
Results of a $10,000 Investment – Oldest Share Class(es)
Fund and index data from 12/31/03
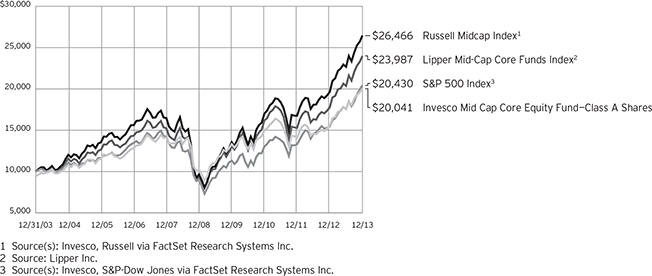
Past performance cannot guarantee comparable future results.
The data shown in the chart include reinvested distributions, applicable sales charges and Fund expenses including
management fees. Index results include reinvested dividends, but they do not reflect sales charges. Performance of the peer group, if applicable, reflects fund expenses and management fees;
performance of a market index does not. Performance shown in the chart and table(s) does not reflect deduction of taxes a shareholder would pay on Fund distributions or sale of Fund shares.
continued from page 8
Other information
| n | The returns shown in management’s discussion of Fund performance are based on net asset values calculated for shareholder transactions. Generally accepted accounting principles require adjustments to be made to the net assets of the Fund at period end for financial reporting purposes, and as such, the net asset values for shareholder transactions and the returns based on those net asset values may differ from the net asset values and returns reported in the Financial Highlights. |
| n | Industry classifications used in this report are generally according to the Global Industry Classification Standard, which was developed by and is the exclusive property and a service mark of MSCI Inc. and Standard & Poor’s. |
6 Invesco Mid Cap Core Equity Fund
| Average Annual Total Returns | |||||
| As of 12/31/13, including maximum applicable sales charges | |||||
| Class A Shares | |||||
| Inception (6/9/87) | 10.85 | % | |||
| 10 Years | 7.20 | ||||
| 5 Years | 13.10 | ||||
| 1 Year | 22.10 | ||||
| Class B Shares | |||||
| Inception (4/1/93) | 10.39 | % | |||
| 10 Years | 7.16 | ||||
| 5 Years | 13.29 | ||||
| 1 Year | 23.20 | ||||
| Class C Shares | |||||
| Inception (5/3/99) | 8.62 | % | |||
| 10 Years | 7.01 | ||||
| 5 Years | 13.54 | ||||
| 1 Year | 27.21 | ||||
| Class R Shares | |||||
| Inception (6/3/02) | 7.34 | % | |||
| 10 Years | 7.54 | ||||
| 5 Years | 14.10 | ||||
| 1 Year | 28.85 | ||||
| Class Y Shares | |||||
| 10 Years | 7.95 | % | |||
| 5 Years | 14.68 | ||||
| 1 Year | 29.53 | ||||
| Class R5 Shares | |||||
| Inception (3/15/02) | 7.74 | % | |||
| 10 Years | 8.26 | ||||
| 5 Years | 14.85 | ||||
| 1 Year | 29.68 | ||||
| Class R6 Shares | |||||
| 10 Years | 7.87 | % | |||
| 5 Years | 14.52 | ||||
| 1 Year | 29.75 | ||||
Class Y shares incepted on October 3, 2008. Performance shown prior to that date is that of Class A shares and includes the 12b-1 fees applicable to Class A shares. Class A share performance reflects any applicable fee waivers or expense reimbursements.
Class R6 shares incepted on September 24, 2012. Performance shown prior to that date is that of Class A shares and includes the 12b-1 fees applicable to Class A shares. Class A share performance reflects any applicable fee waivers or expense reimbursements.
The performance data quoted represent past performance and cannot guarantee comparable future results; current performance may be lower or higher. Please visit invesco.com/performance for the most
recent month-end performance. Performance figures reflect reinvested distributions, changes in net asset value and the effect of the maximum sales charge unless otherwise stated. Investment return and principal value will fluctuate so that you may have a gain or loss when you sell shares.
The total annual Fund operating expense ratio set forth in the most recent Fund prospectus as of the date of this report for Class A, Class B, Class C, Class R, Class Y, Class R5 and Class R6 shares was 1.20%, 1.95%, 1.95%, 1.45%, 0.95%, 0.83% and 0.74%, respectively. The expense ratios presented above may vary from the expense ratios presented in other sections of this report that are based on expenses incurred during the period covered by this report.
Class A share performance reflects the maximum 5.50% sales charge, and Class B and Class C share performance reflects the applicable contingent deferred sales charge (CDSC) for the period involved. The CDSC on Class B shares declines from 5% beginning at the time of purchase to 0% at the beginning of the seventh year. The CDSC on Class C shares is 1% for the first year after purchase. Class R, Class Y, Class R5 and Class R6 shares do not have a front-end sales charge or a CDSC; therefore, performance is at net asset value.
The performance of the Fund’s share classes will differ primarily due to different sales charge structures and class expenses.
7 Invesco Mid Cap Core Equity Fund
Invesco Mid Cap Core Equity Fund’s investment objective is long-term growth of capital.
| n | Unless otherwise stated, information presented in this report is as of December 31, 2013, and is based on total net assets. |
| n | Unless otherwise noted, all data provided by Invesco. |
| n | To access your Fund’s reports/prospectus, visit invesco.com/fundreports. |
About share classes
| n | Class B shares may not be purchased for new or additional investments. Please see the prospectus for more information. |
| n | Class R shares are generally available only to employer sponsored retirement and benefit plans. Please see the prospectus for more information. |
| n | Class Y shares are available only to certain investors. Please see the prospectus for more information. |
| n | Class R5 shares and Class R6 shares are primarily intended for employer sponsored retirement and benefit plans that meet certain standards and for institutional investors. Please see the prospectus for more information. |
Principal risks of investing in the Fund
| n | Cash/cash equivalents risk. Holding cash or cash equivalents may negatively affect performance. |
| n | Derivatives risk. The value of a derivative instrument depends largely on (and is derived from) the value of an underlying security, currency, commodity, interest rate, index or other asset (each referred to as an underlying asset). In addition to risks relating to the underlying assets, the use of derivatives may include other, possibly greater, risks, including counterparty, leverage and liquidity risks. Counterparty risk is the risk that the counterparty to the derivative contract will default on its obligation to pay the Fund the amount owed or otherwise perform under the derivative contract. Derivatives create leverage risk because they do not require payment up front equal to the economic exposure created by owning the derivative. As a result, an adverse change in the value of the underlying asset could result in the Fund sustaining a loss that is substantially greater than the amount invested in the derivative, which may make the Fund’s returns more volatile and |
increase the risk of loss. Derivative instruments may also be less liquid than more traditional investments and the Fund may be unable to sell or close out its derivative positions at a desirable time or price. This risk may be more acute under adverse market conditions, during which the Fund may be most in need of liquidating its derivative positions. Derivatives may also be harder to value, less tax efficient and subject to changing government regulation that could impact the Fund’s ability to use certain derivatives or their cost. Also, derivatives used for hedging or to gain or limit exposure to a particular market segment may not provide the expected benefits, particularly during adverse market conditions.
| n | Developing/emerging markets securities risk. The prices of securities issued by foreign companies and governments located in developing/emerging markets countries may be affected more negatively by inflation, devaluation of their currencies, higher transaction costs, delays in settlement, adverse political developments, the introduction of capital controls, withholding taxes, nationalization of private assets, expropriation, social unrest, war or lack of timely information than those in developed countries. |
| n | Foreign securities risk. The Fund’s foreign investments may be affected by changes in a foreign country’s exchange rates, political and social instability, changes in economic or taxation policies, difficulties when enforcing obligations, decreased liquidity, and increased volatility. Foreign companies may be subject to less regulation resulting in less publicly available information about the companies. |
| n | Management risk. The investment techniques and risk analysis used by the Fund’s portfolio managers may not produce the desired results. |
| n | Market risk. The prices of and the income generated by the Fund’s securities may decline in response to, among |
other things, investor sentiment, general economic and market conditions, regional or global instability, and currency and interest rate fluctuations.
| n | Small- and mid-capitalization risk. Stocks of small- and mid-sized companies tend to be more vulnerable to adverse developments and may have little or no operating history or track record of success, and limited product lines, markets, management and financial resources. The securities of small- and mid-sized companies may be more volatile due to less market interest and less publicly available information about the issuer. They also may be illiquid or restricted as to resale, or may trade less frequently and in smaller volumes, all of which may cause difficulty when establishing or closing a position at a desirable price. |
About indexes used in this report
| n | The S&P 500® Index is an unmanaged index considered representative of the US stock market. |
| n | The Russell Midcap® Index is an unmanaged index considered representative of mid-cap stocks. The Russell Midcap Index is a trademark/service mark of the Frank Russell Co. Russell® is a trademark of the Frank Russell Co. |
| n | The Lipper Mid-Cap Core Funds Index is an unmanaged index considered representative of mid-cap core funds tracked by Lipper. |
| n | The Fund is not managed to track the performance of any particular index, including the index(es) described here, and consequently, the performance of the Fund may deviate significantly from the performance of the index(es). |
| n | A direct investment cannot be made in an index. Unless otherwise indicated, index results include reinvested dividends, and they do not reflect sales charges. Performance of the peer group, if applicable, reflects fund expenses; performance of a market index does not. |
continued on page 6
This report must be accompanied or preceded by a currently effective Fund prospectus, which contains more complete information, including sales charges and expenses. Investors should read it carefully before investing.
NOT FDIC INSURED | MAY LOSE VALUE | NO BANK GUARANTEE
Fund Nasdaq Symbols
| |||||
Class A Shares | GTAGX | ||||
Class B Shares | GTABX | ||||
Class C Shares | GTACX | ||||
Class R Shares | GTARX | ||||
Class Y Shares | GTAYX | ||||
Class R5 Shares | GTAVX | ||||
Class R6 Shares | GTAFX | ||||
8 Invesco Mid Cap Core Equity Fund
Schedule of Investments(a)
December 31, 2013
| Shares | Value | |||||||
Common Stocks & Other Equity Interests–80.13% |
| |||||||
| Asset Management & Custody Banks–1.98% | ||||||||
Northern Trust Corp. | 836,145 | $ | 51,749,014 | |||||
| Auto Parts & Equipment–1.27% | ||||||||
Dana Holding Corp. | 1,701,006 | 33,373,738 | ||||||
| Brewers–1.63% | ||||||||
Molson Coors Brewing Co.–Class B | 760,653 | 42,710,666 | ||||||
| Communications Equipment–2.31% | ||||||||
F5 Networks, Inc.(b) | 404,962 | 36,794,847 | ||||||
Riverbed Technology, Inc.(b) | 1,315,047 | 23,776,050 | ||||||
| 60,570,897 | ||||||||
| Computer & Electronics Retail–1.19% | ||||||||
GameStop Corp.–Class A | 633,533 | 31,207,836 | ||||||
| Computer Storage & Peripherals–1.66% | ||||||||
NetApp, Inc. | 1,056,562 | 43,466,961 | ||||||
| Construction & Engineering–2.57% | ||||||||
Chicago Bridge & Iron Co. N.V. | 522,706 | 43,457,777 | ||||||
Foster Wheeler AG (Switzerland)(b) | 725,663 | 23,961,392 | ||||||
| 67,419,169 | ||||||||
| Construction & Farm Machinery & Heavy Trucks–1.98% | ||||||||
Joy Global Inc. | 436,284 | 25,518,251 | ||||||
Terex Corp. | 626,388 | 26,302,032 | ||||||
| 51,820,283 | ||||||||
| Construction Materials–1.50% | ||||||||
CRH PLC (Ireland) | 1,550,415 | 39,335,897 | ||||||
| Consumer Electronics–0.69% | ||||||||
Harman International Industries, Inc. | 219,131 | 17,935,872 | ||||||
| Department Stores–1.09% | ||||||||
Macy’s, Inc. | 534,992 | 28,568,573 | ||||||
| Education Services–0.39% | ||||||||
Houghton Mifflin Harcourt Co.(b) | 606,581 | 10,287,614 | ||||||
| Electrical Components & Equipment–0.73% | ||||||||
Regal-Beloit Corp. | 259,825 | 19,154,299 | ||||||
| Electronic Components–1.53% | ||||||||
Amphenol Corp.–Class A | 450,397 | 40,166,404 | ||||||
| Environmental & Facilities Services–2.10% | ||||||||
Clean Harbors, Inc.(b) | 415,783 | 24,930,349 | ||||||
Republic Services, Inc. | 901,504 | 29,929,933 | ||||||
| 54,860,282 | ||||||||
| Fertilizers & Agricultural Chemicals–1.11% | ||||||||
Mosaic Co. (The) | 612,794 | 28,966,772 | ||||||
| Shares | Value | |||||||
| Footwear–1.21% | ||||||||
Wolverine World Wide, Inc. | 930,377 | $ | 31,595,603 | |||||
| Gold–0.30% | ||||||||
Kinross Gold Corp. (Canada) | 1,810,614 | 7,930,489 | ||||||
| Health Care Distributors–2.17% | ||||||||
Cardinal Health, Inc. | 512,168 | 34,217,944 | ||||||
Patterson Cos. Inc. | 548,555 | 22,600,466 | ||||||
| 56,818,410 | ||||||||
| Health Care Facilities–2.31% | ||||||||
Community Health Systems Inc.(b) | 806,282 | 31,662,694 | ||||||
Tenet Healthcare Corp.(b) | 685,714 | 28,882,274 | ||||||
| 60,544,968 | ||||||||
| Homebuilding–0.82% | ||||||||
D.R. Horton, Inc.(b) | 956,929 | 21,358,655 | ||||||
| Hotels, Resorts & Cruise Lines–1.00% | ||||||||
Norwegian Cruise Line Holdings Ltd.(b) | 741,101 | 26,286,852 | ||||||
| Industrial Machinery–5.55% | ||||||||
ITT Corp. | 509,306 | 22,114,066 | ||||||
Kennametal Inc. | 685,091 | 35,672,688 | ||||||
Parker Hannifin Corp. | 220,500 | 28,365,120 | ||||||
SPX Corp. | 233,652 | 23,274,076 | ||||||
Stanley Black & Decker Inc. | 445,417 | 35,940,698 | ||||||
| 145,366,648 | ||||||||
| Insurance Brokers–1.70% | ||||||||
Marsh & McLennan Cos., Inc. | 918,373 | 44,412,518 | ||||||
| Internet Software & Services–0.47% | ||||||||
Equinix, Inc.(b) | 68,746 | 12,198,978 | ||||||
| Life & Health Insurance–1.96% | ||||||||
Torchmark Corp. | 656,131 | 51,276,638 | ||||||
| Life Sciences Tools & Services–1.31% | ||||||||
Agilent Technologies, Inc. | 600,080 | 34,318,575 | ||||||
| Marine–1.29% | ||||||||
Kirby Corp.(b) | 339,774 | 33,722,570 | ||||||
| Multi-Utilities–0.77% | ||||||||
CMS Energy Corp. | 754,608 | 20,200,856 | ||||||
| Oil & Gas Drilling–1.85% | ||||||||
Nabors Industries Ltd. | 1,487,429 | 25,271,419 | ||||||
Rowan Cos. PLC–Class A(b) | 656,728 | 23,221,902 | ||||||
| 48,493,321 | ||||||||
| Oil & Gas Equipment & Services–4.04% | ||||||||
Cameron International Corp.(b) | 727,270 | 43,294,383 | ||||||
Dresser-Rand Group, Inc.(b) | 371,000 | 22,122,730 | ||||||
See accompanying Notes to Financial Statements which are an integral part of the financial statements.
9 Invesco Mid Cap Core Equity Fund
| Shares | Value | |||||||
| Oil & Gas Equipment & Services–(continued) | ||||||||
Weatherford International Ltd.(b) | 2,603,034 | $ | 40,320,997 | |||||
| 105,738,110 | ||||||||
| Oil & Gas Exploration & Production–3.24% | ||||||||
Concho Resources Inc.(b) | 381,565 | 41,209,020 | ||||||
Rosetta Resources, Inc.(b) | 507,564 | 24,383,374 | ||||||
SM Energy Co. | 232,752 | 19,344,019 | ||||||
| 84,936,413 | ||||||||
| Packaged Foods & Meats–2.26% | ||||||||
Hain Celestial Group, Inc. (The)(b) | 290,021 | 26,328,107 | ||||||
JM Smucker Co. (The) | 315,876 | 32,731,071 | ||||||
| 59,059,178 | ||||||||
| Paper Packaging–1.38% | ||||||||
Packaging Corp. of America | 572,000 | 36,196,160 | ||||||
| Pharmaceuticals–2.63% | ||||||||
Endo Health Solutions Inc.(b) | 516,519 | 34,844,372 | ||||||
Shire PLC–ADR (Ireland) | 239,960 | 33,903,948 | ||||||
| 68,748,320 | ||||||||
| Property & Casualty Insurance–4.05% | ||||||||
Arch Capital Group Ltd.(b) | 754,000 | 45,006,260 | ||||||
Progressive Corp. (The) | 2,238,740 | 61,050,440 | ||||||
| 106,056,700 | ||||||||
| Regional Banks–1.08% | ||||||||
First Republic Bank | 537,915 | 28,159,850 | ||||||
| Restaurants–1.04% | ||||||||
Brinker International, Inc. | 585,065 | 27,111,912 | ||||||
| Semiconductor Equipment–2.93% | ||||||||
KLA-Tencor Corp. | 288,577 | 18,601,674 | ||||||
Lam Research Corp.(b) | 473,067 | 25,758,498 | ||||||
Teradyne, Inc.(b) | 1,830,000 | 32,244,600 | ||||||
| 76,604,772 | ||||||||
| Shares | Value | |||||||
| Semiconductors–3.81% | ||||||||
Hittite Microwave Corp.(b) | 41,954 | $ | 2,589,820 | |||||
Linear Technology Corp. | 1,266,715 | 57,698,868 | ||||||
Xilinx, Inc. | 860,307 | 39,505,298 | ||||||
| 99,793,986 | ||||||||
| Soft Drinks–0.60% | ||||||||
Dr Pepper Snapple Group, Inc. | 325,087 | 15,838,239 | ||||||
| Specialized Finance–1.64% | ||||||||
Moody’s Corp. | 546,201 | 42,860,392 | ||||||
| Specialty Chemicals–2.96% | ||||||||
Albemarle Corp. | 283,603 | 17,977,594 | ||||||
International Flavors & Fragrances Inc. | 330,162 | 28,387,329 | ||||||
Sigma-Aldrich Corp. | 331,983 | 31,209,722 | ||||||
| 77,574,645 | ||||||||
| Steel–0.67% | ||||||||
Allegheny Technologies, Inc. | 495,180 | 17,643,263 | ||||||
| Systems Software–1.36% | ||||||||
Symantec Corp. | 1,510,612 | 35,620,231 | ||||||
Total Common Stocks & Other Equity Interests |
| 2,098,061,529 | ||||||
Money Market Funds–20.25% |
| |||||||
Liquid Assets Portfolio–Institutional Class(c) | 265,180,534 | 265,180,534 | ||||||
Premier Portfolio–Institutional Class(c) | 265,180,535 | 265,180,535 | ||||||
Total Money Market Funds |
| 530,361,069 | ||||||
TOTAL INVESTMENTS–100.38% |
| 2,628,422,598 | ||||||
OTHER ASSETS LESS LIABILITIES–(0.38)% |
| (10,058,425 | ) | |||||
NET ASSETS–100.00% |
| $ | 2,618,364,173 | |||||
Investment Abbreviations:
| ADR | – American Depositary Receipt |
Notes to Schedule of Investments:
| (a) | Industry and/or sector classifications used in this report are generally according to the Global Industry Classification Standard, which was developed by and is the exclusive property and a service mark of MSCI Inc. and Standard & Poor’s. |
| (b) | Non-income producing security. |
| (c) | The money market fund and the Fund are affiliated by having the same investment adviser. |
See accompanying Notes to Financial Statements which are an integral part of the financial statements.
10 Invesco Mid Cap Core Equity Fund
Statement of Assets and Liabilities
December 31, 2013
Assets: |
| |||
Investments, at value (Cost $1,506,432,574) | $ | 2,098,061,529 | ||
Investments in affiliated money market funds, at value and cost | 530,361,069 | |||
Total investments, at value (Cost $2,036,793,643) | 2,628,422,598 | |||
Receivable for: | ||||
Fund shares sold | 5,947,466 | |||
Dividends | 1,801,591 | |||
Investment for trustee deferred compensation and retirement plans | 422,884 | |||
Other assets | 41,618 | |||
Total assets | 2,636,636,157 | |||
Liabilities: |
| |||
Payable for: | ||||
Fund shares reacquired | 15,734,294 | |||
Accrued fees to affiliates | 1,892,437 | |||
Accrued trustees’ and officers’ fees and benefits | 2,452 | |||
Accrued other operating expenses | 126,322 | |||
Trustee deferred compensation and retirement plans | 516,479 | |||
Total liabilities | 18,271,984 | |||
Net assets applicable to shares outstanding | $ | 2,618,364,173 | ||
Net assets consist of: |
| |||
Shares of beneficial interest | $ | 1,970,907,060 | ||
Undistributed net investment income (loss) | (509,971 | ) | ||
Undistributed net realized gain | 56,338,128 | |||
Net unrealized appreciation | 591,628,956 | |||
| $ | 2,618,364,173 | |||
Net Assets: |
| |||
Class A | $ | 1,378,888,309 | ||
Class B | $ | 33,794,968 | ||
Class C | $ | 202,918,755 | ||
Class R | $ | 124,621,572 | ||
Class Y | $ | 653,576,769 | ||
Class R5 | $ | 220,321,197 | ||
Class R6 | $ | 4,242,603 | ||
Shares outstanding, $0.01 par value per share, |
| |||
Class A | 54,708,557 | |||
Class B | 1,796,449 | |||
Class C | 10,816,383 | |||
Class R | 5,055,105 | |||
Class Y | 25,692,196 | |||
Class R5 | 8,241,100 | |||
Class R6 | 158,529 | |||
Class A: | ||||
Net asset value per share | $ | 25.20 | ||
Maximum offering price per share | ||||
(Net asset value of $25.20 ¸ 94.50%) | $ | 26.67 | ||
Class B: | ||||
Net asset value and offering price per share | $ | 18.81 | ||
Class C: | ||||
Net asset value and offering price per share | $ | 18.76 | ||
Class R: | ||||
Net asset value and offering price per share | $ | 24.65 | ||
Class Y: | ||||
Net asset value and offering price per share | $ | 25.44 | ||
Class R5: | ||||
Net asset value and offering price per share | $ | 26.73 | ||
Class R6: | ||||
Net asset value and offering price per share | $ | 26.76 | ||
See accompanying Notes to Financial Statements which are an integral part of the financial statements.
11 Invesco Mid Cap Core Equity Fund
Statement of Operations
For the year ended December 31, 2013
Investment income: |
| |||
Dividends (net of foreign withholding taxes of $37,409) | $ | 28,287,040 | ||
Dividends from affiliated money market funds | 293,719 | |||
Total investment income | 28,580,759 | |||
Expenses: | ||||
Advisory fees | 17,362,048 | |||
Administrative services fees | 512,241 | |||
Custodian fees | 67,763 | |||
Distribution fees: | ||||
Class A | 3,459,068 | |||
Class B | 358,140 | |||
Class C | 1,975,175 | |||
Class R | 642,872 | |||
Transfer agent fees — A, B, C, R and Y | 4,743,094 | |||
Transfer agent fees — R5 | 241,175 | |||
Transfer agent fees — R6 | 441 | |||
Trustees’ and officers’ fees and benefits | 143,187 | |||
Other | 583,418 | |||
Total expenses | 30,088,622 | |||
Less: Fees waived and expense offset arrangement(s) | (628,416 | ) | ||
Net expenses | 29,460,206 | |||
Net investment income (loss) | (879,447 | ) | ||
Realized and unrealized gain from: | ||||
Net realized gain from: | ||||
Investment securities | 269,811,726 | |||
Foreign currencies | 6,310 | |||
| 269,818,036 | ||||
Change in net unrealized appreciation of: | ||||
Investment securities | 383,299,502 | |||
Foreign currencies | 95 | |||
| 383,299,597 | ||||
Net realized and unrealized gain | 653,117,633 | |||
Net increase in net assets resulting from operations | $ | 652,238,186 | ||
See accompanying Notes to Financial Statements which are an integral part of the financial statements.
12 Invesco Mid Cap Core Equity Fund
Statement of Changes in Net Assets
For the years ended December 31, 2013 and 2012
| 2013 | 2012 | |||||||
Operations: |
| |||||||
Net investment income (loss) | $ | (879,447 | ) | $ | 14,035,734 | |||
Net realized gain | 269,818,036 | 176,298,893 | ||||||
Change in net unrealized appreciation | 383,299,597 | 71,005,631 | ||||||
Net increase in net assets resulting from operations | 652,238,186 | 261,340,258 | ||||||
Distributions to shareholders from net investment income: | ||||||||
Class A | — | (7,236,589 | ) | |||||
Class R | — | (279,265 | ) | |||||
Class Y | — | (3,690,126 | ) | |||||
Class R5 | — | (2,819,739 | ) | |||||
Class R6 | — | (94 | ) | |||||
Total distributions from net investment income | — | (14,025,813 | ) | |||||
Distributions to shareholders from net realized gains: | ||||||||
Class A | (117,282,912 | ) | (101,390,749 | ) | ||||
Class B | (3,796,540 | ) | (3,508,096 | ) | ||||
Class C | (22,409,467 | ) | (18,107,740 | ) | ||||
Class R | (10,813,336 | ) | (9,428,266 | ) | ||||
Class Y | (54,269,126 | ) | (33,865,767 | ) | ||||
Class R5 | (17,858,370 | ) | (21,529,628 | ) | ||||
Class R6 | (698,489 | ) | (701 | ) | ||||
Total distributions from net realized gains | (227,128,240 | ) | (187,830,947 | ) | ||||
Share transactions–net: | ||||||||
Class A | (210,837,562 | ) | (242,756,085 | ) | ||||
Class B | (8,146,662 | ) | (19,614,774 | ) | ||||
Class C | (13,943,597 | ) | (32,066,888 | ) | ||||
Class R | (22,609,882 | ) | (45,078,942 | ) | ||||
Class Y | 94,842,358 | 291,447,667 | ||||||
Class R5 | (79,069,622 | ) | (94,801,385 | ) | ||||
Class R6 | 4,228,034 | 10,000 | ||||||
Net increase (decrease) in net assets resulting from share transactions | (235,536,933 | ) | (142,860,407 | ) | ||||
Net increase (decrease) in net assets | 189,573,013 | (83,376,909 | ) | |||||
Net assets: | ||||||||
Beginning of year | 2,428,791,160 | 2,512,168,069 | ||||||
End of year (includes undistributed net investment income (loss) of $(509,971) and $(456,229), respectively) | $ | 2,618,364,173 | $ | 2,428,791,160 | ||||
Notes to Financial Statements
December 31, 2013
NOTE 1—Significant Accounting Policies
Invesco Mid Cap Core Equity Fund (the “Fund”) is a series portfolio of AIM Growth Series (Invesco Growth Series) (the “Trust”). The Trust is organized as a Delaware statutory trust and is registered under the Investment Company Act of 1940, as amended (the “1940 Act”), as an open-end series management investment company consisting of fifteen separate series portfolios, each authorized to issue an unlimited number of shares of beneficial interest. The assets, liabilities and operations of each portfolio are accounted for separately. Information presented in these financial statements pertains only to the Fund. Matters affecting each portfolio or class will be voted on exclusively by the shareholders of such portfolio or class.
The Fund’s investment objective is long-term growth of capital.
The Fund currently consists of seven different classes of shares: Class A, Class B, Class C, Class R, Class Y, Class R5 and Class R6. Class A shares are sold with a front-end sales charge unless certain waiver criteria are met and under certain circumstances load waived shares may be subject to contingent deferred sales charges (“CDSC”). Class C shares are sold with a CDSC. Class R, Class Y, Class R5 and Class R6 shares are sold at net asset value. Effective November 30, 2010, new or additional investments in Class B shares are no longer permitted. Existing shareholders of Class B shares
13 Invesco Mid Cap Core Equity Fund
may continue to reinvest dividends and capital gains distributions in Class B shares until they convert to Class A shares. Also, shareholders in Class B shares will be able to exchange those shares for Class B shares of other Invesco Funds offering such shares until they convert to Class A shares. Generally, Class B shares will automatically convert to Class A shares on or about the month-end, which is at least eight years after the date of purchase. Redemption of Class B shares prior to the conversion date will be subject to a CDSC.
The following is a summary of the significant accounting policies followed by the Fund in the preparation of its financial statements.
| A. | Security Valuations — Securities, including restricted securities, are valued according to the following policy. |
A security listed or traded on an exchange (except convertible bonds) is valued at its last sales price or official closing price as of the close of the customary trading session on the exchange where the security is principally traded, or lacking any sales or official closing price on a particular day, the security may be valued at the closing bid price on that day. Securities traded in the over-the-counter market are valued based on prices furnished by independent pricing services or market makers. When such securities are valued by an independent pricing service they may be considered fair valued. Futures contracts are valued at the final settlement price set by an exchange on which they are principally traded. Listed options are valued at the mean between the last bid and ask prices from the exchange on which they are principally traded. Options not listed on an exchange are valued by an independent source at the mean between the last bid and ask prices. For purposes of determining net asset value per share, futures and option contracts generally are valued 15 minutes after the close of the customary trading session of the New York Stock Exchange (“NYSE”).
Investments in open-end and closed-end registered investment companies that do not trade on an exchange are valued at the end of day net asset value per share. Investments in open-end and closed-end registered investment companies that trade on an exchange are valued at the last sales price or official closing price as of the close of the customary trading session on the exchange where the security is principally traded.
Debt obligations (including convertible bonds) and unlisted equities are fair valued using an evaluated quote provided by an independent pricing service. Evaluated quotes provided by the pricing service may be determined without exclusive reliance on quoted prices, and may reflect appropriate factors such as institution-size trading in similar groups of securities, developments related to specific securities, dividend rate (for unlisted equities), yield (for debt obligations), quality, type of issue, coupon rate (for debt obligations), maturity (for debt obligations), individual trading characteristics and other market data. Debt obligations are subject to interest rate and credit risks. In addition, all debt obligations involve some risk of default with respect to interest and/or principal payments.
Foreign securities’ (including foreign exchange contracts) prices are converted into U.S. dollar amounts using the applicable exchange rates as of the close of the NYSE. If market quotations are available and reliable for foreign exchange-traded equity securities, the securities will be valued at the market quotations. Because trading hours for certain foreign securities end before the close of the NYSE, closing market quotations may become unreliable. If between the time trading ends on a particular security and the close of the customary trading session on the NYSE, events occur that the Adviser determines are significant and make the closing price unreliable, the Fund may fair value the security. If the event is likely to have affected the closing price of the security, the security will be valued at fair value in good faith using procedures approved by the Board of Trustees. Adjustments to closing prices to reflect fair value may also be based on a screening process of an independent pricing service to indicate the degree of certainty, based on historical data, that the closing price in the principal market where a foreign security trades is not the current value as of the close of the NYSE. Foreign securities’ prices meeting the approved degree of certainty that the price is not reflective of current value will be priced at the indication of fair value from the independent pricing service. Multiple factors may be considered by the independent pricing service in determining adjustments to reflect fair value and may include information relating to sector indices, American Depositary Receipts and domestic and foreign index futures. Foreign securities may have additional risks including exchange rate changes, potential for sharply devalued currencies and high inflation, political and economic upheaval, the relative lack of issuer information, relatively low market liquidity and the potential lack of strict financial and accounting controls and standards.
Securities for which market prices are not provided by any of the above methods may be valued based upon quotes furnished by independent sources. The last bid price may be used to value equity securities. The mean between the last bid and asked prices is used to value debt obligations, including corporate loans.
Securities for which market quotations are not readily available or became unreliable are valued at fair value as determined in good faith by or under the supervision of the Trust’s officers following procedures approved by the Board of Trustees. Issuer specific events, market trends, bid/ask quotes of brokers and information providers and other market data may be reviewed in the course of making a good faith determination of a security’s fair value.
Valuations change in response to many factors including the historical and prospective earnings of the issuer, the value of the issuer’s assets, general economic conditions, interest rates, investor perceptions and market liquidity. Because of the inherent uncertainties of valuation, the values reflected in the financial statements may materially differ from the value received upon actual sale of those investments.
| B. | Securities Transactions and Investment Income — Securities transactions are accounted for on a trade date basis. Realized gains or losses on sales are computed on the basis of specific identification of the securities sold. Interest income is recorded on the accrual basis from settlement date. Dividend income (net of withholding tax, if any) is recorded on the ex-dividend date. |
The Fund may periodically participate in litigation related to Fund investments. As such, the Fund may receive proceeds from litigation settlements. Any proceeds received are included in the Statement of Operations as realized gain (loss) for investments no longer held and as unrealized gain (loss) for investments still held.
Brokerage commissions and mark ups are considered transaction costs and are recorded as an increase to the cost basis of securities purchased and/or a reduction of proceeds on a sale of securities. Such transaction costs are included in the determination of net realized and unrealized gain (loss) from investment securities reported in the Statement of Operations and the Statement of Changes in Net Assets and the net realized and unrealized gains (losses) on securities per share in the Financial Highlights. Transaction costs are included in the calculation of the Fund’s net asset value and, accordingly, they reduce the Fund’s total returns. These transaction costs are not considered operating expenses and are not reflected in net investment income reported in the Statement of Operations and Statement of Changes in Net Assets, or the net investment income per share and ratios of expenses and net investment income reported in the Financial Highlights, nor are they limited by any expense limitation arrangements between the Fund and the investment adviser.
The Fund allocates income and realized and unrealized capital gains and losses to a class based on the relative net assets of each class.
| C. | Country Determination — For the purposes of making investment selection decisions and presentation in the Schedule of Investments, the investment adviser may determine the country in which an issuer is located and/or credit risk exposure based on various factors. These factors |
14 Invesco Mid Cap Core Equity Fund
| include the laws of the country under which the issuer is organized, where the issuer maintains a principal office, the country in which the issuer derives 50% or more of its total revenues and the country that has the primary market for the issuer’s securities, as well as other criteria. Among the other criteria that may be evaluated for making this determination are the country in which the issuer maintains 50% or more of its assets, the type of security, financial guarantees and enhancements, the nature of the collateral and the sponsor organization. Country of issuer and/or credit risk exposure has been determined to be the United States of America, unless otherwise noted. |
| D. | Distributions — Distributions from income and net realized capital gain, if any, are generally declared and paid annually and recorded on the ex-dividend date. The Fund may elect to treat a portion of the proceeds from redemptions as distributions for federal income tax purposes. |
| E. | Federal Income Taxes — The Fund intends to comply with the requirements of Subchapter M of the Internal Revenue Code of 1986, as amended (the “Internal Revenue Code”), necessary to qualify as a regulated investment company and to distribute substantially all of the Fund’s taxable earnings to shareholders. As such, the Fund will not be subject to federal income taxes on otherwise taxable income (including net realized capital gain) that is distributed to shareholders. Therefore, no provision for federal income taxes is recorded in the financial statements. |
The Fund files tax returns in the U.S. Federal jurisdiction and certain other jurisdictions. Generally, the Fund is subject to examinations by such taxing authorities for up to three years after the filing of the return for the tax period.
| F. | Expenses — Fees provided for under the Rule 12b-1 plan of a particular class of the Fund are charged to the operations of such class. Transfer agency fees and expenses and other shareholder recordkeeping fees and expenses attributable to Class R5 and Class R6 are allocated to each share class based on relative net assets. Sub-accounting fees attributable to Class R5 are charged to the operations of the class. Transfer agency fees and expenses and other shareholder recordkeeping fees and expenses relating to all other classes are allocated among those classes based on relative net assets. All other expenses are allocated among the classes based on relative net assets. |
| G. | Accounting Estimates — The preparation of financial statements in conformity with accounting principles generally accepted in the United States of America (“GAAP”) requires management to make estimates and assumptions that affect the reported amounts of assets and liabilities at the date of the financial statements and the reported amounts of revenues and expenses during the reporting period including estimates and assumptions related to taxation. Actual results could differ from those estimates by a significant amount. In addition, the Fund monitors for material events or transactions that may occur or become known after the period-end date and before the date the financial statements are released to print. |
| H. | Indemnifications — Under the Trust’s organizational documents, each Trustee, officer, employee or other agent of the Trust is indemnified against certain liabilities that may arise out of the performance of their duties to the Fund. Additionally, in the normal course of business, the Fund enters into contracts, including the Fund’s servicing agreements, that contain a variety of indemnification clauses. The Fund’s maximum exposure under these arrangements is unknown as this would involve future claims that may be made against the Fund that have not yet occurred. The risk of material loss as a result of such indemnification claims is considered remote. |
| I. | Foreign Currency Translations — Foreign currency is valued at the close of the NYSE based on quotations posted by banks and major currency dealers. Portfolio securities and other assets and liabilities denominated in foreign currencies are translated into U.S. dollar amounts at date of valuation. Purchases and sales of portfolio securities (net of foreign taxes withheld on disposition) and income items denominated in foreign currencies are translated into U.S. dollar amounts on the respective dates of such transactions. The Fund does not separately account for the portion of the results of operations resulting from changes in foreign exchange rates on investments and the fluctuations arising from changes in market prices of securities held. The combined results of changes in foreign exchange rates and the fluctuation of market prices on investments (net of estimated foreign tax withholding) are included with the net realized and unrealized gain or loss from investments in the Statement of Operations. Reported net realized foreign currency gains or losses arise from (1) sales of foreign currencies, (2) currency gains or losses realized between the trade and settlement dates on securities transactions, and (3) the difference between the amounts of dividends, interest, and foreign withholding taxes recorded on the Fund’s books and the U.S. dollar equivalent of the amounts actually received or paid. Net unrealized foreign currency gains and losses arise from changes in the fair values of assets and liabilities, other than investments in securities at fiscal period end, resulting from changes in exchange rates. |
The Fund may invest in foreign securities which may be subject to foreign taxes on income, gains on investments or currency repatriation, a portion of which may be recoverable.
| J. | Forward Foreign Currency Contracts — The Fund may enter into forward foreign currency contracts to manage or minimize currency or exchange rate risk. The Fund may also enter into forward foreign currency contracts for the purchase or sale of a security denominated in a foreign currency in order to “lock in” the U.S. dollar price of that security. A forward foreign currency contract is an obligation to purchase or sell a specific currency for an agreed-upon price at a future date. The use of forward foreign currency contracts does not eliminate fluctuations in the price of the underlying securities the Fund owns or intends to acquire but establishes a rate of exchange in advance. Fluctuations in the value of these contracts are measured by the difference in the contract date and reporting date exchange rates and are recorded as unrealized appreciation (depreciation) until the contracts are closed. When the contracts are closed, realized gains (losses) are recorded. Realized and unrealized gains (losses) on the contracts are included in the Statement of Operations. The primary risks associated with forward foreign currency contracts include failure of the counterparty to meet the terms of the contract and the value of the foreign currency changing unfavorably. These risks may be in excess of the amounts reflected in the Statement of Assets and Liabilities. |
NOTE 2—Advisory Fees and Other Fees Paid to Affiliates
The Trust has entered into a master investment advisory agreement with Invesco Advisers, Inc. (the “Adviser” or “Invesco”). Under the terms of the investment advisory agreement, the Fund pays an advisory fee to the Adviser based on the annual rate of the Fund’s average daily net assets as follows:
| Average Daily Net Assets | Rate | |||||
First $500 million | 0 | .725% | ||||
Next $500 million | 0 | .70% | ||||
Next $500 million | 0 | .675% | ||||
Over $1.5 billion | 0 | .65% | ||||
15 Invesco Mid Cap Core Equity Fund
Under the terms of a master sub-advisory agreement between the Adviser and each of Invesco Asset Management Deutschland GmbH, Invesco Asset Management Limited, Invesco Asset Management (Japan) Limited, Invesco Australia Limited, Invesco Hong Kong Limited, Invesco Senior Secured Management, Inc. and Invesco Canada Ltd. (collectively, the “Affiliated Sub-Advisers”) the Adviser, not the Fund, may pay 40% of the fees paid to the Adviser to any such Affiliated Sub-Adviser(s) that provide(s) discretionary investment management services to the Fund based on the percentage of assets allocated to such Sub-Adviser(s).
The Adviser has contractually agreed, through at least June 30, 2014, to waive advisory fees and/or reimburse expenses of all shares to the extent necessary to limit total annual fund operating expenses after fee waiver and/or expense reimbursement (excluding certain items discussed below) of Class A, Class B, Class C, Class R, Class Y, Class R5 and Class R6 shares to 2.00%, 2.75%, 2.75%, 2.25%, 1.75%, 1.75% and 1.75%, respectively, of average daily net assets. In determining the Adviser’s obligation to waive advisory fees and/or reimburse expenses, the following expenses are not taken into account, and could cause the total annual fund operating expenses after fee waiver and/or expense reimbursement to exceed the numbers reflected above: (1) interest; (2) taxes; (3) dividend expense on short sales; (4) extraordinary or non-routine items, including litigation expenses; and (5) expenses that the Fund has incurred but did not actually pay because of an expense offset arrangement. Unless Invesco continues the fee waiver agreement, it will terminate on June 30, 2014. The fee waiver agreement cannot be terminated during its term. The Adviser did not waive fees and/or reimburse expenses during the period under this limitation.
Further, the Adviser has contractually agreed, through at least April 30, 2015, to waive the advisory fee payable by the Fund in an amount equal to 100% of the net advisory fees the Adviser receives from the affiliated money market funds on investments by the Fund of uninvested cash in such affiliated money market funds.
For the year ended December 31, 2013, the Adviser waived advisory fees of $623,588.
The Trust has entered into a master administrative services agreement with Invesco pursuant to which the Fund has agreed to pay Invesco for certain administrative costs incurred in providing accounting services to the Fund. For the year ended December 31, 2013, expenses incurred under the agreement are shown in the Statement of Operations as Administrative services fees.
The Trust has entered into a transfer agency and service agreement with Invesco Investment Services, Inc. (“IIS”) pursuant to which the Fund has agreed to pay IIS a fee for providing transfer agency and shareholder services to the Fund and reimburse IIS for certain expenses incurred by IIS in the course of providing such services. IIS may make payments to intermediaries that provide omnibus account services, sub-accounting services and/or networking services. All fees payable by IIS to intermediaries that provide omnibus account services or sub-accounting are charged back to the Fund, subject to certain limitations approved by the Trust’s Board of Trustees. For the year ended December 31, 2013, expenses incurred under the agreement are shown in the Statement of Operations as Transfer agent fees.
The Trust has entered into master distribution agreements with Invesco Distributors, Inc. (“IDI”) to serve as the distributor for the Class A, Class B, Class C, Class R, Class Y, Class R5 and Class R6 shares of the Fund. The Trust has adopted plans pursuant to Rule 12b-1 under the 1940 Act with respect to the Fund’s Class A, Class B, Class C and Class R shares (collectively, the “Plans”). The Fund, pursuant to the Plans, pays IDI compensation at the annual rate of 0.25% of the Fund’s average daily net assets of Class A shares, 1.00% of the average daily net assets of Class B and Class C shares and 0.50% of the average daily net assets of Class R shares. Of the Plan payments, up to 0.25% of the average daily net assets of each class of shares may be paid to furnish continuing personal shareholder services to customers who purchase and own shares of such classes. Any amounts not paid as a service fee under the Plans would constitute an asset-based sales charge. Rules of the Financial Industry Regulatory Authority (“FINRA”) impose a cap on the total sales charges, including asset-based sales charges, that may be paid by any class of shares of the Fund. For the year ended December 31, 2013, expenses incurred under the Plans are shown in the Statement of Operations as Distribution fees.
Front-end sales commissions and CDSC (collectively, the “sales charges”) are not recorded as expenses of the Fund. Front-end sales commissions are deducted from proceeds from the sales of Fund shares prior to investment in Class A shares of the Fund. CDSC are deducted from redemption proceeds prior to remittance to the shareholder. During the year ended December 31, 2013, IDI advised the Fund that IDI retained $228,326 in front-end sales commissions from the sale of Class A shares and $2,109, $31,421 and $7,966 from Class A, Class B and Class C shares, respectively, for CDSC imposed on redemptions by shareholders.
For the year ended December 31, 2013, the Fund incurred $27,197 in brokerage commissions with Invesco Capital Markets, Inc., an affiliate of the Adviser and IDI, for portfolio transactions executed on behalf of the Fund.
Certain officers and trustees of the Trust are officers and directors of the Adviser, IIS and/or IDI.
NOTE 3—Additional Valuation Information
GAAP defines fair value as the price that would be received to sell an asset or paid to transfer a liability in an orderly transaction between market participants at the measurement date, under current market conditions. GAAP establishes a hierarchy that prioritizes the inputs to valuation methods, giving the highest priority to readily available unadjusted quoted prices in an active market for identical assets (Level 1) and the lowest priority to significant unobservable inputs (Level 3), generally when market prices are not readily available or are unreliable. Based on the valuation inputs, the securities or other investments are tiered into one of three levels. Changes in valuation methods may result in transfers in or out of an investment’s assigned level:
| Level 1 — | Prices are determined using quoted prices in an active market for identical assets. |
| Level 2 — | Prices are determined using other significant observable inputs. Observable inputs are inputs that other market participants may use in pricing a security. These may include quoted prices for similar securities, interest rates, prepayment speeds, credit risk, yield curves, loss severities, default rates, discount rates, volatilities and others. |
| Level 3 — | Prices are determined using significant unobservable inputs. In situations where quoted prices or observable inputs are unavailable (for example, when there is little or no market activity for an investment at the end of the period), unobservable inputs may be used. Unobservable inputs reflect the Fund’s own assumptions about the factors market participants would use in determining fair value of the securities or instruments and would be based on the best available information. |
16 Invesco Mid Cap Core Equity Fund
The following is a summary of the tiered valuation input levels, as of December 31, 2013. The level assigned to the securities valuations may not be an indication of the risk or liquidity associated with investing in those securities. Because of the inherent uncertainties of valuation, the values reflected in the financial statements may materially differ from the value received upon actual sale of those investments.
| Level 1 | Level 2 | Level 3 | Total | |||||||||||||
Equity Securities | $ | 2,589,086,701 | $ | 39,335,897 | — | $ | 2,628,422,598 | |||||||||
NOTE 4—Expense Offset Arrangement(s)
The expense offset arrangement is comprised of transfer agency credits which result from balances in demand deposit accounts used by the transfer agent for clearing shareholder transactions. For the year ended December 31, 2013, the Fund received credits from this arrangement, which resulted in the reduction of the Fund’s total expenses of $4,828.
NOTE 5—Trustees’ and Officers’ Fees and Benefits
Trustees’ and Officers’ Fees and Benefits include amounts accrued by the Fund to pay remuneration to certain Trustees and Officers of the Fund. Trustees have the option to defer compensation payable by the Fund, and Trustees’ and Officers’ Fees and Benefits also include amounts accrued by the Fund to fund such deferred compensation amounts. Those Trustees who defer compensation have the option to select various Invesco Funds in which their deferral accounts shall be deemed to be invested. Finally, certain current Trustees were eligible to participate in a retirement plan that provided for benefits to be paid upon retirement to Trustees over a period of time based on the number of years of service. The Fund may have certain former Trustees who also participate in a retirement plan and receive benefits under such plan. Trustees’ and Officers’ Fees and Benefits include amounts accrued by the Fund to fund such retirement benefits. Obligations under the deferred compensation and retirement plans represent unsecured claims against the general assets of the Fund.
NOTE 6—Cash Balances
The Fund is permitted to temporarily carry a negative or overdrawn balance in its account with State Street Bank and Trust Company, the custodian bank. Such balances, if any at period end, are shown in the Statement of Assets and Liabilities under the payable caption Amount due custodian. To compensate the custodian bank for such overdrafts, the overdrawn Fund may either (1) leave funds as a compensating balance in the account so the custodian bank can be compensated by earning the additional interest; or (2) compensate by paying the custodian bank at a rate agreed upon by the custodian bank and Invesco, not to exceed the contractually agreed upon rate.
NOTE 7—Distributions to Shareholders and Tax Components of Net Assets
Tax Character of Distributions to Shareholders Paid During the Years Ended December 31, 2013 and 2012:
| 2013 | 2012 | |||||||
Ordinary income | $ | 84,961,123 | $ | 61,541,158 | ||||
Long-term capital gain | 142,167,117 | 140,315,602 | ||||||
Total distributions | $ | 227,128,240 | $ | 201,856,760 | ||||
Tax Components of Net Assets at Period-End:
| 2013 | ||||
Undistributed ordinary income | $ | 7,297,104 | ||
Undistributed long-term gain | 50,611,863 | |||
Net unrealized appreciation — investments | 590,058,116 | |||
Temporary book/tax differences | (499,327 | ) | ||
Late-Year ordinary loss deferral | (10,643 | ) | ||
Shares of beneficial interest | 1,970,907,060 | |||
Total net assets | $ | 2,618,364,173 | ||
The difference between book-basis and tax-basis unrealized appreciation (depreciation) is due to differences in the timing of recognition of gains and losses on investments for tax and book purposes. The Fund’s net unrealized appreciation difference is attributable primarily to wash sales.
The temporary book/tax differences are a result of timing differences between book and tax recognition of income and/or expenses. The Fund’s temporary book/tax differences are the result of the trustee deferral of compensation and retirement plan benefits.
Capital loss carryforward is calculated and reported as of a specific date. Results of transactions and other activity after that date may affect the amount of capital loss carryforward actually available for the Fund to utilize. Capital losses generated in years beginning after December 22, 2010 can be carried forward for an unlimited period, whereas previous losses expire in 8 tax years. Capital losses with an expiration period may not be used to offset capital gains until all net capital losses without an expiration date have been utilized. Capital loss carryforwards with no expiration date will retain their character as either short-term or long-term capital losses instead of as short-term capital losses as under prior law. The ability to utilize capital loss carryforward in the future may be limited under the Internal Revenue Code and related regulations based on the results of future transactions.
The Fund does not have a capital loss carryforward as of December 31, 2013.
17 Invesco Mid Cap Core Equity Fund
NOTE 8—Investment Securities
The aggregate amount of investment securities (other than short-term securities, U.S. Treasury obligations and money market funds, if any) purchased and sold by the Fund during the year ended December 31, 2013 was $693,925,679 and $1,305,901,995, respectively. Cost of investments on a tax basis includes the adjustments for financial reporting purposes as of the most recently completed federal income tax reporting period-end.
| Unrealized Appreciation (Depreciation) of Investment Securities on a Tax Basis | ||||
Aggregate unrealized appreciation of investment securities | $ | 620,190,117 | ||
Aggregate unrealized (depreciation) of investment securities | (30,132,001 | ) | ||
Net unrealized appreciation of investment securities | $ | 590,058,116 | ||
Cost of investments for tax purposes is $2,038,364,482.
NOTE 9—Reclassification of Permanent Differences
Primarily as a result of differing book/tax treatment of net operating losses, on December 31, 2013, undistributed net investment income (loss) was increased by $825,705 and undistributed net realized gain (loss) was decreased by $825,705. This reclassification had no effect on the net assets of the Fund.
NOTE 10—Share Information
| Summary of Share Activity | ||||||||||||||||
| Years ended December 31, | ||||||||||||||||
| 2013(a) | 2012 | |||||||||||||||
| Shares | Amount | Shares | Amount | |||||||||||||
Sold: | ||||||||||||||||
Class A | 7,267,039 | $ | 177,579,330 | 8,307,298 | $ | 185,841,734 | ||||||||||
Class B | 59,112 | 1,110,362 | 64,252 | 1,146,331 | ||||||||||||
Class C | 1,092,841 | 20,560,073 | 1,144,960 | 20,167,337 | ||||||||||||
Class R | 1,176,883 | 28,224,889 | 1,678,187 | 36,729,127 | ||||||||||||
Class Y | 8,447,839 | 208,775,864 | 17,877,137 | 390,716,357 | ||||||||||||
Class R5 | 1,691,520 | 42,897,037 | 3,100,223 | 72,403,278 | ||||||||||||
Class R6(b) | 323,138 | 8,533,446 | 416.6 | 10,000 | ||||||||||||
Issued as reinvestment of dividends: | ||||||||||||||||
Class A | 4,623,289 | 111,975,988 | 4,932,874 | 103,639,678 | ||||||||||||
Class B | 202,034 | 3,652,778 | 207,589 | 3,379,553 | ||||||||||||
Class C | 1,181,408 | 21,300,788 | 1,056,620 | 17,159,536 | ||||||||||||
Class R | 456,083 | 10,804,607 | 469,718 | 9,699,674 | ||||||||||||
Class Y | 2,140,785 | 52,320,789 | 1,659,573 | 35,066,759 | ||||||||||||
Class R5 | 684,061 | 17,566,682 | 1,076,494 | 23,779,752 | ||||||||||||
Class R6 | 27,131 | 697,525 | — | — | ||||||||||||
Automatic conversion of Class B shares to Class A shares: | ||||||||||||||||
Class A | 296,186 | 7,195,054 | 605,810 | 13,675,178 | ||||||||||||
Class B | (384,767 | ) | (7,195,054 | ) | (767,032 | ) | (13,675,178 | ) | ||||||||
Reacquired: | ||||||||||||||||
Class A | (20,786,497 | ) | (507,587,934 | ) | (24,520,470 | ) | (545,912,675 | ) | ||||||||
Class B | (303,806 | ) | (5,714,748 | ) | (592,392 | ) | (10,465,480 | ) | ||||||||
Class C | (2,987,325 | ) | (55,804,458 | ) | (3,953,453 | ) | (69,393,761 | ) | ||||||||
Class R | (2,554,243 | ) | (61,639,378 | ) | (4,196,156 | ) | (91,507,743 | ) | ||||||||
Class Y | (6,736,243 | ) | (166,254,295 | ) | (6,011,133 | ) | (134,335,449 | ) | ||||||||
Class R5 | (5,427,767 | ) | (139,533,341 | ) | (8,310,145 | ) | (190,984,415 | ) | ||||||||
Class R6 | (192,157 | ) | (5,002,937 | ) | — | — | ||||||||||
Net increase (decrease) in share activity | (9,703,456 | ) | $ | (235,536,933 | ) | (6,169,629.4 | ) | $ | (142,860,407 | ) | ||||||
| (a) | There are entities that are record owners of more than 5% of the outstanding shares of the Fund and in the aggregate own 23% of the outstanding shares of the Fund. IDI has an agreement with these entities to sell Fund shares. The Fund, Invesco and/or Invesco affiliates may make payments to these entities, which are considered to be related to the Fund, for providing services to the Fund, Invesco and/or Invesco affiliates including but not limited to services such as securities brokerage, distribution, third party record keeping and account servicing. The Fund has no knowledge as to whether all or any portion of the shares owned of record by these entities are also owned beneficially. |
| (b) | Commencement date of September 24, 2012. |
18 Invesco Mid Cap Core Equity Fund
NOTE 11—Financial Highlights
The following schedule presents financial highlights for a share of the Fund outstanding throughout the periods indicated.
| Net asset value, beginning of period | Net investment income (loss)(a) | Net gains (losses) on securities (both realized and unrealized) | Total from investment operations | Dividends from net investment income | Distributions from net realized gains | Total distributions | Net asset value, end of period | Total return(b) | Net assets, end of period (000’s omitted) | Ratio of expenses to average net assets with fee waivers and/or expenses absorbed | Ratio of expenses to average net assets without fee waivers and/or expenses absorbed | Ratio of net investment income (loss) to average net assets | Portfolio turnover(c) | |||||||||||||||||||||||||||||||||||||||||||
Class A | ||||||||||||||||||||||||||||||||||||||||||||||||||||||||
Year ended 12/31/13 | $ | 21.37 | $ | (0.01 | ) | $ | 6.15 | $ | 6.14 | $ | — | $ | (2.31 | ) | $ | (2.31 | ) | $ | 25.20 | 29.19 | % | $ | 1,378,888 | 1.16 | %(d) | 1.19 | %(d) | (0.04 | )%(d) | 33 | % | |||||||||||||||||||||||||
Year ended 12/31/12 | 21.02 | 0.12 | (e) | 2.03 | 2.15 | (0.12 | ) | (1.68 | ) | (1.80 | ) | 21.37 | 10.38 | 1,352,886 | 1.17 | 1.20 | 0.55 | (e) | 61 | |||||||||||||||||||||||||||||||||||||
Year ended 12/31/11 | 23.17 | (0.02 | ) | (1.42 | ) | (1.44 | ) | — | (0.71 | ) | (0.71 | ) | 21.02 | (6.24 | ) | 1,554,838 | 1.16 | 1.19 | (0.09 | ) | 57 | |||||||||||||||||||||||||||||||||||
Year ended 12/31/10 | 20.95 | 0.01 | 2.61 | 2.62 | (0.01 | ) | (0.39 | ) | (0.40 | ) | 23.17 | 12.52 | 1,838,719 | 1.18 | 1.21 | 0.06 | 61 | |||||||||||||||||||||||||||||||||||||||
Year ended 12/31/09 | 16.11 | 0.05 | 4.81 | 4.86 | (0.02 | ) | — | (0.02 | ) | 20.95 | 30.16 | 1,515,079 | 1.24 | 1.27 | 0.26 | 24 | ||||||||||||||||||||||||||||||||||||||||
Class B | ||||||||||||||||||||||||||||||||||||||||||||||||||||||||
Year ended 12/31/13 | 16.55 | (0.15 | ) | 4.72 | 4.57 | — | (2.31 | ) | (2.31 | ) | 18.81 | 28.20 | 33,795 | 1.91 | (d) | 1.94 | (d) | (0.79 | )(d) | 33 | ||||||||||||||||||||||||||||||||||||
Year ended 12/31/12 | 16.66 | (0.03 | )(e) | 1.60 | 1.57 | — | (1.68 | ) | (1.68 | ) | 16.55 | 9.60 | 36,795 | 1.92 | 1.95 | (0.20 | )(e) | 61 | ||||||||||||||||||||||||||||||||||||||
Year ended 12/31/11 | 18.66 | (0.16 | ) | (1.13 | ) | (1.29 | ) | — | (0.71 | ) | (0.71 | ) | 16.66 | (6.95 | ) | 55,166 | 1.91 | 1.94 | (0.84 | ) | 57 | |||||||||||||||||||||||||||||||||||
Year ended 12/31/10 | 17.06 | (0.12 | ) | 2.10 | 1.98 | — | (0.38 | ) | (0.38 | ) | 18.66 | 11.65 | 114,279 | 1.93 | 1.96 | (0.69 | ) | 61 | ||||||||||||||||||||||||||||||||||||||
Year ended 12/31/09 | 13.22 | (0.07 | ) | 3.93 | 3.86 | (0.02 | ) | — | (0.02 | ) | 17.06 | 29.19 | 183,219 | 1.99 | 2.02 | (0.49 | ) | 24 | ||||||||||||||||||||||||||||||||||||||
Class C | ||||||||||||||||||||||||||||||||||||||||||||||||||||||||
Year ended 12/31/13 | 16.51 | (0.15 | ) | 4.71 | 4.56 | — | (2.31 | ) | (2.31 | ) | 18.76 | 28.21 | 202,919 | 1.91 | (d) | 1.94 | (d) | (0.79 | )(d) | 33 | ||||||||||||||||||||||||||||||||||||
Year ended 12/31/12 | 16.62 | (0.03 | )(e) | 1.60 | 1.57 | — | (1.68 | ) | (1.68 | ) | 16.51 | 9.62 | 190,302 | 1.92 | 1.95 | (0.20 | )(e) | 61 | ||||||||||||||||||||||||||||||||||||||
Year ended 12/31/11 | 18.62 | (0.16 | ) | (1.13 | ) | (1.29 | ) | — | (0.71 | ) | (0.71 | ) | 16.62 | (6.97 | ) | 220,772 | 1.91 | 1.94 | (0.84 | ) | 57 | |||||||||||||||||||||||||||||||||||
Year ended 12/31/10 | 17.02 | (0.12 | ) | 2.10 | 1.98 | — | (0.38 | ) | (0.38 | ) | 18.62 | 11.68 | 249,883 | 1.93 | 1.96 | (0.69 | ) | 61 | ||||||||||||||||||||||||||||||||||||||
Year ended 12/31/09 | 13.19 | (0.07 | ) | 3.92 | 3.85 | (0.02 | ) | — | (0.02 | ) | 17.02 | 29.18 | 202,853 | 1.99 | 2.02 | (0.49 | ) | 24 | ||||||||||||||||||||||||||||||||||||||
Class R | ||||||||||||||||||||||||||||||||||||||||||||||||||||||||
Year ended 12/31/13 | 21.00 | (0.07 | ) | 6.03 | 5.96 | — | (2.31 | ) | (2.31 | ) | 24.65 | 28.85 | 124,622 | 1.41 | (d) | 1.44 | (d) | (0.29 | )(d) | 33 | ||||||||||||||||||||||||||||||||||||
Year ended 12/31/12 | 20.66 | 0.07 | (e) | 2.00 | 2.07 | (0.05 | ) | (1.68 | ) | (1.73 | ) | 21.00 | 10.17 | 125,474 | 1.42 | 1.45 | 0.30 | (e) | 61 | |||||||||||||||||||||||||||||||||||||
Year ended 12/31/11 | 22.85 | (0.08 | ) | (1.40 | ) | (1.48 | ) | — | (0.71 | ) | (0.71 | ) | 20.66 | (6.51 | ) | 165,812 | 1.41 | 1.44 | (0.34 | ) | 57 | |||||||||||||||||||||||||||||||||||
Year ended 12/31/10 | 20.71 | (0.04 | ) | 2.56 | 2.52 | — | (0.38 | ) | (0.38 | ) | 22.85 | 12.21 | 188,803 | 1.43 | 1.46 | (0.19 | ) | 61 | ||||||||||||||||||||||||||||||||||||||
Year ended 12/31/09 | 15.96 | — | 4.77 | 4.77 | (0.02 | ) | — | (0.02 | ) | 20.71 | 29.88 | 101,828 | 1.49 | 1.52 | 0.01 | 24 | ||||||||||||||||||||||||||||||||||||||||
Class Y | ||||||||||||||||||||||||||||||||||||||||||||||||||||||||
Year ended 12/31/13 | 21.50 | 0.05 | 6.20 | 6.25 | — | (2.31 | ) | (2.31 | ) | 25.44 | 29.53 | 653,577 | 0.91 | (d) | 0.94 | (d) | 0.21 | (d) | 33 | |||||||||||||||||||||||||||||||||||||
Year ended 12/31/12 | 21.14 | 0.18 | (e) | 2.04 | 2.22 | (0.18 | ) | (1.68 | ) | (1.86 | ) | 21.50 | 10.68 | 469,510 | 0.92 | 0.95 | 0.80 | (e) | 61 | |||||||||||||||||||||||||||||||||||||
Year ended 12/31/11 | 23.25 | 0.04 | (1.44 | ) | (1.40 | ) | — | (0.71 | ) | (0.71 | ) | 21.14 | (6.05 | ) | 175,773 | 0.91 | 0.94 | 0.16 | 57 | |||||||||||||||||||||||||||||||||||||
Year ended 12/31/10 | 20.97 | 0.07 | 2.60 | 2.67 | (0.01 | ) | (0.38 | ) | (0.39 | ) | 23.25 | 12.80 | 192,236 | 0.93 | 0.96 | 0.31 | 61 | |||||||||||||||||||||||||||||||||||||||
Year ended 12/31/09 | 16.10 | 0.10 | 4.82 | 4.92 | (0.05 | ) | — | (0.05 | ) | 20.97 | 30.59 | 86,803 | 0.99 | 1.02 | 0.51 | 24 | ||||||||||||||||||||||||||||||||||||||||
Class R5 | ||||||||||||||||||||||||||||||||||||||||||||||||||||||||
Year ended 12/31/13 | 22.47 | 0.08 | 6.49 | 6.57 | — | (2.31 | ) | (2.31 | ) | 26.73 | 29.68 | 220,321 | 0.81 | (d) | 0.83 | (d) | 0.31 | (d) | 33 | |||||||||||||||||||||||||||||||||||||
Year ended 12/31/12 | 22.03 | 0.22 | (e) | 2.12 | 2.34 | (0.22 | ) | (1.68 | ) | (1.90 | ) | 22.47 | 10.78 | 253,815 | 0.80 | 0.83 | 0.92 | (e) | 61 | |||||||||||||||||||||||||||||||||||||
Year ended 12/31/11 | 24.15 | 0.07 | (1.48 | ) | (1.41 | ) | — | (0.71 | ) | (0.71 | ) | 22.03 | (5.87 | ) | 339,807 | 0.79 | 0.82 | 0.28 | 57 | |||||||||||||||||||||||||||||||||||||
Year ended 12/31/10 | 21.74 | 0.11 | 2.70 | 2.81 | (0.01 | ) | (0.39 | ) | (0.40 | ) | 24.15 | 12.94 | 311,455 | 0.76 | 0.79 | 0.48 | 61 | |||||||||||||||||||||||||||||||||||||||
Year ended 12/31/09 | 16.67 | 0.13 | 5.01 | 5.14 | (0.07 | ) | — | (0.07 | ) | 21.74 | 30.84 | 200,303 | 0.80 | 0.83 | 0.70 | 24 | ||||||||||||||||||||||||||||||||||||||||
Class R6 | ||||||||||||||||||||||||||||||||||||||||||||||||||||||||
Year ended 12/31/13 | 22.48 | 0.11 | 6.48 | 6.59 | — | (2.31 | ) | (2.31 | ) | 26.76 | 29.75 | 4,243 | 0.72 | (d) | 0.74 | (d) | 0.40 | (d) | 33 | |||||||||||||||||||||||||||||||||||||
Year ended 12/31/12(f) | 24.00 | 0.07 | (e) | 0.31 | 0.38 | (0.22 | ) | (1.68 | ) | (1.90 | ) | 22.48 | 1.75 | 9 | 0.67 | (g) | 0.70 | (g) | 1.05 | (e)(g) | 61 | |||||||||||||||||||||||||||||||||||
| (a) | Calculated using average shares outstanding. |
| (b) | Includes adjustments in accordance with accounting principles generally accepted in the United States of America and as such, the net asset value for financial reporting purposes and the returns based upon those net asset values may differ from the net asset value and returns for shareholder transactions. Does not include sales charges and is not annualized for periods less than one year, if applicable. |
| (c) | Portfolio turnover is calculated at the fund level and is not annualized for periods less than one year, if applicable. For the period ended December 31, 2009, the portfolio turnover calculation excludes the value of securities purchased of $36,332,046 and sold of $40,409,014 in the effort to realign the Fund’s portfolio holdings after the reorganization of Atlantic Whitehall Mid Cap Growth Fund into the Fund. |
| (d) | Ratios are based on average daily net assets (000’s omitted) of $1,383,627, $35,814, $197,517, $128,574, $564,913, $241,313 and $3,941 for Class A, Class B, Class C, Class R, Class Y, Class R5 and Class R6 shares, respectively. |
| (e) | Net investment income (loss) per share and the ratio of net investment income (loss) to average net assets include a special cash dividend received of $1.00 per share owned of Tellabs Inc. on December 24, 2012. Net investment income (loss) per share and the ratio of net investment income (loss) to average net assets excluding the special dividend are $0.08 and 0.38%, $(0.07) and (0.37)%, $(0.07) and (0.37)%, $0.03 and 0.13%, $0.14 and 0.63%, $0.18 and 0.75% and $0.03 and 0.88% for Class A, Class B, Class C, Class R, Class Y, Class R5 and Class R6 shares, respectively. |
| (f) | Commencement date of September 24, 2012 for Class R6 shares. |
| (g) | Annualized. |
19 Invesco Mid Cap Core Equity Fund
Report of Independent Registered Public Accounting Firm
To the Board of Trustees of AIM Funds Group (Invesco Funds Group)
and Shareholders of Invesco Mid Cap Core Equity Fund:
In our opinion, the accompanying statement of assets and liabilities, including the schedule of investments, and the related statements of operations and of changes in net assets and the financial highlights present fairly, in all material respects, the financial position of Invesco Mid Cap Core Equity Fund (one of the funds constituting AIM Funds Group (Invesco Funds Group), hereafter referred to as the “Fund”) at December 31, 2013, the results of its operations for the year then ended, the changes in its net assets for each of the two years in the period then ended and the financial highlights for each of the five years in the period then ended, in conformity with accounting principles generally accepted in the United States of America. These financial statements and financial highlights (hereafter referred to as “financial statements”) are the responsibility of the Fund’s management; our responsibility is to express an opinion on these financial statements based on our audits. We conducted our audits of these financial statements in accordance with the standards of the Public Company Accounting Oversight Board (United States). Those standards require that we plan and perform the audit to obtain reasonable assurance about whether the financial statements are free of material misstatement. An audit includes examining, on a test basis, evidence supporting the amounts and disclosures in the financial statements, assessing the accounting principles used and significant estimates made by management, and evaluating the overall financial statement presentation. We believe that our audits, which included confirmation of securities at December 31, 2013 by correspondence with the custodian, provide a reasonable basis for our opinion.
PRICEWATERHOUSECOOPERS LLP
February 26, 2014
Houston, Texas
20 Invesco Mid Cap Core Equity Fund
Calculating your ongoing Fund expenses
Example
As a shareholder of the Fund, you incur two types of costs: (1) transaction costs, which may include sales charges (loads) on purchase payments or contingent deferred sales charges on redemptions, if any; and (2) ongoing costs, including management fees, distribution and/or service (12b-1) fees, and other Fund expenses. This example is intended to help you understand your ongoing costs (in dollars) of investing in the Fund and to compare these costs with ongoing costs of investing in other mutual funds. The example is based on an investment of $1,000 invested at the beginning of the period and held for the entire period July 1, 2013 through December 31, 2013.
Actual expenses
The table below provides information about actual account values and actual expenses. You may use the information in this table, together with the amount you invested, to estimate the expenses that you paid over the period. Simply divide your account value by $1,000 (for example, an $8,600 account value divided by $1,000 = 8.6), then multiply the result by the number in the table under the heading entitled “Actual Expenses Paid During Period” to estimate the expenses you paid on your account during this period.
Hypothetical example for comparison purposes
The table below also provides information about hypothetical account values and hypothetical expenses based on the Fund’s actual expense ratio and an assumed rate of return of 5% per year before expenses, which is not the Fund’s actual return.
The hypothetical account values and expenses may not be used to estimate the actual ending account balance or expenses you paid for the period. You may use this information to compare the ongoing costs of investing in the Fund and other funds. To do so, compare this 5% hypothetical example with the 5% hypothetical examples that appear in the shareholder reports of the other funds.
Please note that the expenses shown in the table are meant to highlight your ongoing costs only and do not reflect any transaction costs, such as sales charges (loads) on purchase payments or contingent deferred sales charges on redemptions, if any. Therefore, the hypothetical information is useful in comparing ongoing costs only, and will not help you determine the relative total costs of owning different funds. In addition, if these transaction costs were included, your costs would have been higher.
| Class | Beginning Account Value (07/01/13) | ACTUAL | HYPOTHETICAL (5% annual return before | Annualized Expense Ratio | ||||||||||||||||||||
| Ending Account Value (12/31/13)1 | Expenses Paid During Period2 | Ending Account Value (12/31/13) | Expenses Paid During Period2 | |||||||||||||||||||||
| A | $ | 1,000.00 | $ | 1,141.80 | $ | 6.24 | $ | 1,019.38 | $ | 5.88 | 1.16 | % | ||||||||||||
| B | 1,000.00 | 1,137.10 | 10.26 | 1,015.60 | 9.68 | 1.91 | ||||||||||||||||||
| C | 1,000.00 | 1,137.50 | 10.26 | 1,015.60 | 9.68 | 1.91 | ||||||||||||||||||
| R | 1,000.00 | 1,140.30 | 7.58 | 1,018.12 | 7.15 | 1.41 | ||||||||||||||||||
| Y | 1,000.00 | 1,143.20 | 4.89 | 1,020.64 | 4.61 | 0.91 | ||||||||||||||||||
| R5 | 1,000.00 | 1,143.60 | 4.35 | 1,021.15 | 4.10 | 0.81 | ||||||||||||||||||
| R6 | 1,000.00 | 1,144.30 | 3.86 | 1,021.60 | 3.64 | 0.72 | ||||||||||||||||||
| 1 | The actual ending account value is based on the actual total return of the Fund for the period July 1, 2013 through December 31, 2013, after actual expenses and will differ from the hypothetical ending account value which is based on the Fund’s expense ratio and a hypothetical annual return of 5% before expenses. |
| 2 | Expenses are equal to the Fund’s annualized expense ratio as indicated above multiplied by the average account value over the period, multiplied by 184/365 to reflect the most recent fiscal half year. |
21 Invesco Mid Cap Core Equity Fund
Tax Information
Form 1099-DIV, Form 1042-S and other year–end tax information provide shareholders with actual calendar year amounts that should be included in their tax returns. Shareholders should consult their tax advisors.
The following distribution information is being provided as required by the Internal Revenue Code or to meet a specific state’s requirement.
The Fund designates the following amounts or, if subsequently determined to be different, the maximum amount allowable for its fiscal year ended December 31, 2013:
Federal and State Income Tax | ||||
Long-Term Capital Gain Distributions | $ | 142,167,117 | ||
Qualified Dividend Income* | 36.78 | % | ||
Corporate Dividends Received Deduction* | 34.13 | % | ||
| * | The above percentages are based on ordinary income dividends paid to shareholders during the Fund’s fiscal year. |
Non-Resident Alien Shareholders | |||||
Qualified Short-Term Gains | $ | 84,961,123 | |||
22 Invesco Mid Cap Core Equity Fund
Trustees and Officers
The address of each trustee and officer is AIM Growth Series (Invesco Growth Series) (the “Trust”), 11 Greenway Plaza, Suite 1000, Houston, Texas 77046-1173. The trustees serve for the life of the Trust, subject to their earlier death, incapacitation, resignation, retirement or removal as more specifically provided in the Trust’s organizational documents. Each officer serves for a one year term or until their successors are elected and qualified. Column two below includes length of time served with predecessor entities, if any.
| Name, Year of Birth and Position(s) Held with the Trust | Trustee and/ or Officer Since | Principal Occupation(s) During Past 5 Years | Number of Funds in Fund Complex Overseen by Trustee | Other Directorship(s) Held by Trustee During Past 5 Years | ||||
| Interested Persons | ||||||||
| Martin L. Flanagan1 — 1960 Trustee | 2007 | Executive Director, Chief Executive Officer and President, Invesco Ltd. (ultimate parent of Invesco and a global investment management firm); Advisor to the Board, Invesco Advisers, Inc. (formerly known as Invesco Institutional (N.A.), Inc.); Trustee, The Invesco Funds; Vice Chair, Investment Company Institute; and Member of Executive Board, SMU Cox School of Business
Formerly: Chairman and Chief Executive Officer, Invesco Advisers, Inc. (registered investment adviser); Director, Chairman, Chief Executive Officer and President, IVZ Inc. (holding company), INVESCO Group Services, Inc. (service provider) and Invesco North American Holdings, Inc. (holding company); Director, Chief Executive Officer and President, Invesco Holding Company Limited (parent of Invesco and a global investment management firm); Director, Invesco Ltd.; Chairman, Investment Company Institute and President, Co-Chief Executive Officer, Co-President, Chief Operating Officer and Chief Financial Officer, Franklin Resources, Inc. (global investment management organization) | 123 | None | ||||
| Philip A. Taylor2 — 1954 Trustee, President and Principal Executive Officer | 2006 | Head of North American Retail and Senior Managing Director, Invesco Ltd.; Director, Co-Chairman, Co-President and Co-Chief Executive Officer, Invesco Advisers, Inc. (formerly known as Invesco Institutional (N.A.), Inc.) (registered investment adviser); Director, Chairman, Chief Executive Officer and President, Invesco Management Group, Inc. (formerly known as Invesco Aim Management Group, Inc.) (financial services holding company); Director and President, INVESCO Funds Group, Inc. (registered investment adviser and registered transfer agent); Director and Chairman, Invesco Investment Services, Inc. (formerly known as Invesco Aim Investment Services, Inc.) (registered transfer agent) and IVZ Distributors, Inc. (formerly known as INVESCO Distributors, Inc.) (registered broker dealer); Director, President and Chairman, Invesco Inc. (holding company) and Invesco Canada Holdings Inc. (holding company); Chief Executive Officer, Invesco Corporate Class Inc. (corporate mutual fund company) and Invesco Canada Fund Inc. (corporate mutual fund company); Director, Chairman and Chief Executive Officer, Invesco Canada Ltd. (formerly known as Invesco Trimark Ltd./Invesco Trimark Ltèe) (registered investment adviser and registered transfer agent); Trustee, President and Principal Executive Officer, The Invesco Funds (other than AIM Treasurer’s Series Trust (Invesco Treasurer’s Series Trust) and Short-Term Investments Trust); Trustee and Executive Vice President, The Invesco Funds (AIM Treasurer’s Series Trust (Invesco Treasurer’s Series Trust) and Short-Term Investments Trust only); Director, Invesco Investment Advisers LLC (formerly known as Van Kampen Asset Management); Director, Chief Executive Officer and President, Van Kampen Exchange Corp.
Formerly: Director and Chairman, Van Kampen Investor Services Inc.: Director, Chief Executive Officer and President, 1371 Preferred Inc. (holding company); and Van Kampen Investments Inc.; Director and President, AIM GP Canada Inc. (general partner for limited partnerships); and Van Kampen Advisors, Inc.; Director and Chief Executive Officer, Invesco Trimark Dealer Inc. (registered broker dealer); Director, Invesco Distributors, Inc. (formerly known as Invesco Aim Distributors, Inc.) (registered broker dealer); Manager, Invesco PowerShares Capital Management LLC; Director, Chief Executive Officer and President, Invesco Advisers, Inc.; Director, Chairman, Chief Executive Officer and President, Invesco Aim Capital Management, Inc.; President, Invesco Trimark Dealer Inc. and Invesco Trimark Ltd./Invesco Trimark Ltèe; Director and President, AIM Trimark Corporate Class Inc. and AIM Trimark Canada Fund Inc.; Senior Managing Director, Invesco Holding Company Limited; Trustee and Executive Vice President, Tax-Free Investments Trust; Director and Chairman, Fund Management Company (former registered broker dealer); President and Principal Executive Officer, The Invesco Funds (AIM Treasurer’s Series Trust (Invesco Treasurer’s Series Trust), Short-Term Investments Trust and Tax-Free Investments Trust only); President, AIM Trimark Global Fund Inc. and AIM Trimark Canada Fund Inc. | 123 | None | ||||
Wayne W. Whalen3 — 1939 Trustee | 2010 | Of Counsel, and prior to 2010, partner in the law firm of Skadden, Arps, Slate, Meagher & Flom LLP, legal counsel to certain funds in the Fund Complex | 136 | Director of the Mutual Fund Directors Forum, a nonprofit membership organization for investment directors; Chairman and Director of the Abraham Lincoln Presidential Library Foundation; and Director of the Stevenson Center for Democracy |
| 1 | Mr. Flanagan is considered an interested person of the Trust because he is an officer of the adviser to the Trust, and an officer and a director of Invesco Ltd., ultimate parent of the adviser to the Trust. |
| 2 | Mr. Taylor is considered an interested person of the Trust because he is an officer and a director of the adviser to, and a director of the principal underwriter of, the Trust. |
| 3 | Mr. Whalen is considered an “interested person” (within the meaning of Section 2(a)(19) of the 1940 Act) of certain Funds in the Invesco Fund Complex because he and his firm currently provide legal services as legal counsel to such Funds. |
T-1 Invesco Mid Cap Core Equity Fund
Trustees and Officers—(continued)
| Name, Year of Birth and Position(s) Held with the Trust | Trustee and/ or Officer Since | Principal Occupation(s) During Past 5 Years | Number of Funds in Fund Complex Overseen by Trustee | Other Directorship(s) Held by Trustee During Past 5 Years | ||||
| Independent Trustees | ||||||||
Bruce L. Crockett — 1944 Trustee and Chair | 2001 | Chairman, Crockett Technologies Associates (technology consulting company)
Formerly: Director, Captaris (unified messaging provider); Director, President and Chief Executive Officer COMSAT Corporation; and Chairman, Board of Governors of INTELSAT (international communications company) | 123 | ACE Limited (insurance company); Investment Company Institute | ||||
David C. Arch — 1945 Trustee | 2010 | Chairman and Chief Executive Officer of Blistex Inc., (consumer health care products manufacturer)
Formerly: Member of the Heartland Alliance Advisory Board, a nonprofit organization serving human needs based in Chicago | 136 | Board member of the Illinois Manufacturers’ Association; Member of the Board of Visitors, Institute for the Humanities, University of Michigan | ||||
Frank S. Bayley — 1939 Trustee | 1985 | Retired
Formerly: Director, Badgley Funds, Inc. (registered investment company) (2 portfolios) and General Partner and Of Counsel, law firm of Baker & McKenzie, LLP | 123 | Director and Chairman, C.D. Stimson Company (a real estate investment company); Trustee and Overseer, The Curtis Institute of Music | ||||
James T. Bunch — 1942 Trustee | 2003 | Managing Member, Grumman Hill Group LLC (family office private equity management)
Formerly: Founder, Green, Manning & Bunch Ltd. (investment banking firm) (1988-2010); Executive Committee, United States Golf Association; and Director, Policy Studies, Inc. and Van Gilder Insurance Corporation | 123 | Chairman, Board of Governors, Western Golf Association; Chairman-elect, Evans Scholars Foundation; and Director, Denver Film Society | ||||
Rodney F. Dammeyer — 1940 Trustee | 2010 | Chairman of CAC, LLC, (private company offering capital investment and management advisory services)
Formerly: Prior to 2001, Managing Partner at Equity Group Corporate Investments; Prior to 1995, Chief Executive Officer of Itel Corporation (formerly Anixter International); Prior to 1985, experience includes Senior Vice President and Chief Financial Officer of Household International, Inc., Executive Vice President and Chief Financial Officer of Northwest Industries, Inc. and Partner of Arthur Andersen & Co.; From 1987 to 2010, Director/Trustee of investment companies in the Van Kampen Funds complex | 123 | Director of Quidel Corporation and Stericycle, Inc.; Prior to May 2008, Trustee of The Scripps Research Institute; Prior to February 2008, Director of Ventana Medical Systems, Inc. | ||||
Albert R. Dowden — 1941 Trustee | 2001 | Director of a number of public and private business corporations, including the Boss Group, Ltd. (private investment and management); and Reich & Tang Funds (5 portfolios) (registered investment company)
Formerly: Director, Homeowners of America Holding Corporation/Homeowners of America Insurance Company (property casualty company); Director, Continental Energy Services, LLC (oil and gas pipeline service); Director, CompuDyne Corporation (provider of product and services to the public security market) and Director, Annuity and Life Re (Holdings), Ltd. (reinsurance company); Director, President and Chief Executive Officer, Volvo Group North America, Inc.; Senior Vice President, AB Volvo; Director of various public and private corporations; Chairman, DHJ Media, Inc.; Director, Magellan Insurance Company; and Director, The Hertz Corporation, Genmar Corporation (boat manufacturer), National Media Corporation; Advisory Board of Rotary Power International (designer, manufacturer, and seller of rotary power engines); and Chairman, Cortland Trust, Inc. (registered investment company) | 123 | Director of Nature’s Sunshine Products, Inc. | ||||
Jack M. Fields — 1952 Trustee | 2001 | Chief Executive Officer, Twenty First Century Group, Inc. (government affairs company); Owner and Chief Executive Officer, Dos Angeles Ranch, L.P. (cattle, hunting, corporate entertainment); and Discovery Global Education Fund (non-profit)
Formerly: Chief Executive Officer, Texana Timber LP (sustainable forestry company); Director of Cross Timbers Quail Research Ranch (non-profit); and member of the U.S. House of Representatives | 123 | Insperity, Inc. (formerly known as Administaff) | ||||
Prema Mathai-Davis — 1950 Trustee | 2001 | Retired
Formerly: Chief Executive Officer, YWCA of the U.S.A. | 123 | None | ||||
Larry Soll — 1942 Trustee | 2003 | Retired
Formerly: Chairman, Chief Executive Officer and President, Synergen Corp. (a biotechnology company) | 123 | None | ||||
Hugo F. Sonnenschein — 1940 Trustee | 2010 | Distinguished Service Professor and President Emeritus of the University of Chicago and the Adam Smith Distinguished Service Professor in the Department of Economics at the University of Chicago
Formerly: President of the University of Chicago | 136 | Trustee of the University of Rochester and a member of its investment committee. Member of the National Academy of Sciences, the American Philosophical Society and a fellow of the American Academy of Arts and Sciences |
T-2 Invesco Mid Cap Core Equity Fund
Trustees and Officers—(continued)
| Name, Year of Birth and Position(s) Held with the Trust | Trustee and/ or Officer Since | Principal Occupation(s) During Past 5 Years | Number of Funds in Fund Complex Overseen by Trustee | Other Directorship(s) Held by Trustee During Past 5 Years | ||||
| Independent Trustees—(continued) | ||||||||
Raymond Stickel, Jr. — 1944 Trustee | 2005 | Retired
Formerly: Director, Mainstay VP Series Funds, Inc. (25 portfolios) and Partner, Deloitte & Touche | 123 | None | ||||
| Other Officers | ||||||||
| Russell C. Burk — 1958 Senior Vice President and Senior Officer | 2005 | Senior Vice President and Senior Officer, The Invesco Funds | N/A | N/A | ||||
| John M. Zerr — 1962 Senior Vice President, Chief Legal Officer and Secretary | 2006 | Director, Senior Vice President, Secretary and General Counsel, Invesco Management Group, Inc. (formerly known as Invesco Aim Management Group, Inc.) and Van Kampen Exchange Corp.; Senior Vice President, Invesco Advisers, Inc. (formerly known as Invesco Institutional (N.A.), Inc.) (registered investment adviser); Senior Vice President and Secretary, Invesco Distributors, Inc. (formerly known as Invesco Aim Distributors, Inc.); Director, Vice President and Secretary, Invesco Investment Services, Inc. (formerly known as Invesco Aim Investment Services, Inc.) and IVZ Distributors, Inc. (formerly known as INVESCO Distributors, Inc.); Director and Vice President, INVESCO Funds Group, Inc.; Senior Vice President, Chief Legal Officer and Secretary, The Invesco Funds; Manager, Invesco PowerShares Capital Management LLC; Director, Secretary and General Counsel, Invesco Investment Advisers LLC (formerly known as Van Kampen Asset Management); Secretary and General Counsel, Invesco Capital Markets, Inc. (formerly known as Van Kampen Funds Inc.) and Chief Legal Officer, PowerShares Exchange-Traded Fund Trust, PowerShares Exchange-Traded Fund Trust II, PowerShares India Exchange-Traded Fund Trust and PowerShares Actively Managed Exchange-Traded Fund Trust
Formerly: Director and Vice President, Van Kampen Advisors Inc.; Director, Vice President, Secretary and General Counsel, Van Kampen Investor Services Inc.; Director, Invesco Distributors, Inc. (formerly known as Invesco Aim Distributors, Inc.); Director, Senior Vice President, General Counsel and Secretary, Invesco Aim Advisers, Inc. and Van Kampen Investments Inc.; Director, Vice President and Secretary, Fund Management Company; Director, Senior Vice President, Secretary, General Counsel and Vice President, Invesco Aim Capital Management, Inc.; Chief Operating Officer and General Counsel, Liberty Ridge Capital, Inc. (an investment adviser); Vice President and Secretary, PBHG Funds (an investment company) and PBHG Insurance Series Fund (an investment company); Chief Operating Officer, General Counsel and Secretary, Old Mutual Investment Partners (a broker-dealer); General Counsel and Secretary, Old Mutual Fund Services (an administrator) and Old Mutual Shareholder Services (a shareholder servicing center); Executive Vice President, General Counsel and Secretary, Old Mutual Capital, Inc. (an investment adviser); and Vice President and Secretary, Old Mutual Advisors Funds (an investment company) | N/A | N/A | ||||
| Karen Dunn Kelley — 1960 Vice President | 2004 | Senior Managing Director, Investments; Director, Co-President, Co-Chief Executive Officer, and Co-Chairman, Invesco Advisers, Inc. (formerly known as Invesco Institutional (N.A.), Inc.) (registered investment adviser); Chairman, Invesco Senior Secured Management, Inc.; Senior Vice President, Invesco Management Group, Inc. (formerly known as Invesco Aim Management Group, Inc.); Executive Vice President, Invesco Distributors, Inc. (formerly known as Invesco Aim Distributors, Inc.); Director, Invesco Mortgage Capital Inc., and Invesco Management Company Limited; Director and President, INVESCO Asset Management (Bermuda) Ltd., Vice President, The Invesco Funds (other than AIM Treasurer’s Series Trust (Invesco Treasurer’s Series Trust) and Short-Term Investments Trust); and President and Principal Executive Officer, The Invesco Funds (AIM Treasurer’s Series Trust (Invesco Treasurer’s Series Trust) and Short-Term Investments Trust only)
Formerly: Director, INVESCO Global Asset Management Limited and INVESCO Management S.A.; Senior Vice President, Van Kampen Investments Inc. and Invesco Advisers, Inc. (formerly known as Invesco Institutional (N.A.), Inc.) (registered investment adviser); Vice President, Invesco Advisers, Inc. (formerly known as Invesco Institutional (N.A.), Inc.); Director of Cash Management and Senior Vice President, Invesco Advisers, Inc. and Invesco Aim Capital Management, Inc.; President and Principal Executive Officer, Tax-Free Investments Trust; Director and President, Fund Management Company; Chief Cash Management Officer, Director of Cash Management, Senior Vice President, and Managing Director, Invesco Aim Capital Management, Inc.; Director of Cash Management, Senior Vice President, and Vice President, Invesco Advisers, Inc. and The Invesco Funds (AIM Treasurer’s Series Trust (Invesco Treasurer’s Series Trust), Short-Term Investments Trust and Tax-Free Investments Trust only) | N/A | N/A | ||||
T-3 Invesco Mid Cap Core Equity Fund
Trustees and Officers—(continued)
| Name, Year of Birth and Position(s) Held with the Trust | Trustee and/ or Officer Since | Principal Occupation(s) During Past 5 Years | Number of Funds in Fund Complex Overseen by Trustee | Other Directorship(s) Held by Trustee During Past 5 Years | ||||
| Other Officers—(continued) | ||||||||
| Sheri Morris — 1964 Vice President, Treasurer and Principal Financial Officer | 1999 | Vice President, Treasurer and Principal Financial Officer, The Invesco Funds; Vice President, Invesco Advisers, Inc. (formerly known as Invesco Institutional (N.A.), Inc.) (registered investment adviser); and Vice President, PowerShares Exchange-Traded Fund Trust, PowerShares Exchange-Traded Fund Trust II, PowerShares India Exchange-Traded Fund Trust and PowerShares Actively Managed Exchange-Traded Fund Trust
Formerly: Vice President, Invesco Aim Advisers, Inc., Invesco Aim Capital Management, Inc. and Invesco Aim Private Asset Management, Inc.; Assistant Vice President and Assistant Treasurer, The Invesco Funds and Assistant Vice President, Invesco Advisers, Inc., Invesco Aim Capital Management, Inc. and Invesco Aim Private Asset Management, Inc.; and Treasurer, PowerShares Exchange-Traded Fund Trust, PowerShares Exchange-Traded Fund Trust II, PowerShares India Exchange-Traded Fund Trust and PowerShares Actively Managed Exchange-Traded Fund Trust | N/A | N/A | ||||
Crissie M. Wisdom — 1969 Anti-Money Laundering Compliance Officer | 2013 | Anti-Money Laundering Compliance Officer, Invesco Advisers, Inc. (formerly known as Invesco Institutional (N.A.), Inc.) (registered investment adviser), Invesco Capital Markets, Inc. (formerly known as Van Kampen Funds Inc.), Invesco Distributors, Inc., Invesco Investment Services, Inc., Invesco Management Group, Inc., Van Kampen Exchange Corp., The Invesco Funds, Invesco Funds (Chicago), and PowerShares Exchange-Traded Fund Trust, PowerShares Exchange-Traded Fund Trust II, PowerShares India Exchange-Traded Fund Trust, and PowerShares Actively Managed Exchange-Traded Fund Trust; and Fraud Prevention Manager and Controls and Risk Analysis Manager for Invesco Investment Services, Inc. | N/A | N/A | ||||
| Todd L. Spillane — 1958 Chief Compliance Officer | 2006 | Senior Vice President, Invesco Management Group, Inc. (formerly known as Invesco Aim Management Group, Inc.) and Van Kampen Exchange Corp.; Senior Vice President and Chief Compliance Officer, Invesco Advisers, Inc. (registered investment adviser) (formerly known as Invesco Institutional (N.A.), Inc.); Chief Compliance Officer, The Invesco Funds; Vice President, Invesco Distributors, Inc. (formerly known as Invesco Aim Distributors, Inc.) and Invesco Investment Services, Inc. (formerly known as Invesco Aim Investment Services, Inc.)
Formerly: Chief Compliance Officer, Invesco Funds (Chicago); Senior Vice President, Van Kampen Investments Inc.; Senior Vice President and Chief Compliance Officer, Invesco Aim Advisers, Inc. and Invesco Aim Capital Management, Inc.; Chief Compliance Officer, INVESCO Private Capital Investments, Inc. (holding company), Invesco Private Capital, Inc. (registered investment adviser), Invesco Global Asset Management (N.A.), Inc., Invesco Senior Secured Management, Inc. (registered investment adviser), Van Kampen Investor Services Inc., PowerShares Exchange-Traded Fund Trust, PowerShares Exchange-Traded Fund Trust II, PowerShares India Exchange-Traded Fund Trust and PowerShares Actively Managed Exchange-Traded Fund Trust; and Vice President, Invesco Aim Capital Management, Inc. and Fund Management Company | N/A | N/A |
The Statement of Additional Information of the Trust includes additional information about the Fund’s Trustees and is available upon request, without charge, by calling 1.800.959.4246. Please refer to the Fund’s prospectus for information on the Fund’s sub-advisers.
Office of the Fund 11 Greenway Plaza, Suite 1000 Houston, TX 77046-1173 | Investment Adviser Invesco Advisers, Inc. 1555 Peachtree Street, N.E. Atlanta, GA 30309 | Distributor Invesco Distributors, Inc. 11 Greenway Plaza, Suite 1000 Houston, TX 77046-1173 | Auditors PricewaterhouseCoopers LLP 1201 Louisiana Street, Suite 2900 Houston, TX 77002-5678 | |||
Counsel to the Fund Stradley Ronon Stevens & Young, LLP 2005 Market Street, Suite 2600 Philadelphia, PA 19103-7018 | Counsel to the Independent Trustees Goodwin Procter LLP 901 New York Avenue, N.W. Washington, D.C. 20001 | Transfer Agent Invesco Investment Services, Inc. 11 Greenway Plaza, Suite 1000 Houston, TX 77046-1173 | Custodian State Street Bank and Trust Company 225 Franklin Street Boston, MA 02110-2801 | |||
T-4 Invesco Mid Cap Core Equity Fund

Invesco mailing information
Send general correspondence to Invesco Investment Services, Inc., P.O. Box 219078, Kansas City, MO 64121-9078.
Invesco privacy policy
You share personal and financial information with us that is necessary for your transactions and your account records. We take very seriously the obligation to keep that information confidential and private.
Invesco collects nonpublic personal information about you from account applications or other forms you complete and from your transactions with us or our affiliates. We do not disclose information about you or our former customers to service providers or other third parties except to the extent necessary to service your account and in other limited circumstances as permitted by law. For example, we use this information to facilitate the delivery of transaction confirmations, financial reports, prospectuses and tax forms.
Even within Invesco, only people involved in the servicing of your accounts and compliance monitoring have access to your information. To ensure the highest level of confidentiality and security, Invesco maintains physical, electronic and procedural safeguards that meet or exceed federal standards. Special measures, such as data encryption and authentication, apply to your communications with us on our website. More detail is available to you at invesco.com/privacy.
Important notice regarding delivery of security holder documents
To reduce Fund expenses, only one copy of most shareholder documents may be mailed to shareholders with multiple accounts at the same address (Householding). Mailing of your shareholder documents may be householded indefinitely unless you instruct us otherwise. If you do not want the mailing of these documents to be combined with those for other members of your household, please contact Invesco Investment Services, Inc. at 800 959 4246 or contact your financial institution. We will begin sending you individual copies for each account within 30 days after receiving your request.
Fund holdings and proxy voting information
The Fund provides a complete list of its holdings four times in each fiscal year, at the quarter ends. For the second and fourth quarters, the lists appear in the Fund’s semiannual and annual reports to shareholders. For the first and third quarters, the Fund files the lists with the Securities and Exchange Commission (SEC) on Form N-Q. The most recent list of portfolio holdings is available at invesco.com/completeqtrholdings. Shareholders can also look up the Fund’s Forms N-Q on the SEC website at sec.gov. Copies of the Fund’s Forms N-Q may be reviewed and copied at the SEC Public Reference Room in Washington, D.C. You can obtain information on the operation of the Public Reference Room, including information about duplicating fee charges, by calling 202 551 8090 or 800 732 0330, or by electronic request at the following email address: publicinfo@sec.gov. The SEC file numbers for the Fund are shown below.
A description of the policies and procedures that the Fund uses to determine how to vote proxies relating to portfolio securities is available without charge, upon request, from our Client Services department at 800 959 4246 or at invesco.com/proxyguidelines. The information is also available on the SEC website, sec.gov.
Information regarding how the Fund voted proxies related to its portfolio securities during the most recent 12-month period ended June 30 is available at invesco.com/proxysearch. The information is also available on the SEC website, sec.gov. Invesco Advisers, Inc. is an investment adviser; it provides investment advisory services to individual and institutional clients and does not sell securities. Invesco Distributors, Inc. is the US distributor for Invesco Ltd.’s retail mutual funds, exchange-traded funds and institutional money market funds. Both are wholly owned, indirect subsidiaries of Invesco Ltd. |  | |
| SEC file numbers: 811-02699 and 002-57526 MCCE-AR-1 Invesco Distributors, Inc. | ||
|
| |||||
Annual Report to Shareholders
| December 31, 2013
| |||||
Invesco Small Cap Growth Fund | ||||||
Nasdaq: A: GTSAX ¡ B: GTSBX ¡ C: GTSDX ¡ R: GTSRX ¡ Y: GTSYX ¡ Investor: GTSIX R5: GTSVX ¡ R6: GTSFX | ||||||


Letters to Shareholders
Philip Taylor | Dear Shareholders: This annual report includes information about your Invesco Fund, including performance data and a complete list of its investments as of the close of the reporting period. Inside, your Fund’s portfolio managers discuss how they managed your Fund and the factors that affected its performance during the reporting period. I hope you find this report of interest. During the year covered by this report, major US and global equity market indexes hit multiyear or all-time highs1, the result of a strengthening US economy and relatively healthy corporate profits. Also helping equities was a return of individual investors to stocks – due in part to monetary policies that kept interest rates (and yields on fixed income securities) low. At the end of the reporting period, amid widespread signs of an improving economy, the US Federal Reserve announced that it would begin a long-anticipated reduction in its bond-buying program in January 2014; its decision was widely expected and investors reacted positively | ||||||||
| to the announcement. Despite some mid-summer volatility, overseas equity market indexes in developed and emerging nations generally rose during the year. | |||||||||

Extended periods of strong market performance such as we saw throughout 2013 can lull some investors into a false sense of security – just as extended periods of volatility or market weakness can discourage some investors from undertaking disciplined, long-term investment plans. That’s why Invesco believes it can often be helpful to work with a skilled and trusted financial adviser; he or she can emphasize the importance of adhering to an investment plan designed to achieve long-term goals like a first home, a college education for a child or a comfortable retirement. A financial adviser who is familiar with your individual financial situation, investment goals and risk tolerance can be an invaluable partner as you work toward your financial goals. He or she can provide insight and perspective when markets are volatile; encouragement and reassurance when times are uncertain; and advice and guidance when your financial situation or investment goals change.
Timely information when and where you want it
Invesco’s efforts to help investors achieve their financial objectives include providing individual investors and financial professionals with timely information about the markets, the economy and investing – whenever and wherever they want it.
Our website, invesco.com/us, offers a wide range of market insights and investment perspectives. On the website, you’ll find detailed information about our funds, including prices, performance, holdings and portfolio manager commentaries. You can access information about your individual Invesco account whenever it’s convenient for you; just complete a simple, secure online registration. Use the “Login” box on our home page to get started.
Using Invesco’s mobile app for iPad® (available free from the App StoreSM) allows you to obtain the same detailed information about your funds and the same investment insights from our investment leaders, market strategists, economists and retirement experts on the go. You also can watch portfolio manager videos and have instant access to Invesco news and updates wherever you may be.
In addition to the resources accessible on our website and through our mobile app, you can obtain timely updates to help you stay informed about the markets, the economy and investing by connecting with Invesco on Twitter, LinkedIn or Facebook. You can access our blog at blog.invesco.us.com or by visiting the “Intentional Investing Forum” on our home page. Our goal is to provide you the information you want, when and where you want it.
Have questions?
For questions about your account, feel free to contact an Invesco client services representative at 800 959 4246. For Invesco-related questions or comments, please email me directly at phil@invesco.com.
All of us at Invesco look forward to serving your investment management needs for many years to come. Thank you for investing with us.
Sincerely,

Philip Taylor
Senior Managing Director, Invesco Ltd.
1 Source: Reuters
iPad is a trademark of Apple Inc., registered in the US and other countries. App Store is a service mark of Apple Inc.
2 Invesco Small Cap Growth Fund
Bruce Crockett | Dear Fellow Shareholders: Many investors enjoyed positive returns on their investments in 2013. While some sectors of the market struggled, many major equity market indexes in the US and around the globe rose last year. The performance of stocks, fixed income securities and alternative investments – and the performance of mutual funds that invest in them – is determined by many factors, including unforeseeable economic and geopolitical events. Your Board certainly can’t determine how well various asset classes in the market perform, but we work hard throughout the year on issues that affect you and your fellow shareholders and determine how your investments are managed. For example, the Invesco Funds Board works to ensure that we provide a lineup of funds that allow financial advisers to build portfolios that meet shareholders’ changing financial needs and goals. Your Board works with Invesco Advisers on a continuing basis to provide | ||||||||

financial products that may help investors achieve their varied financial goals. We also carefully monitor how the management teams of all the Invesco funds are performing in light of ever-changing and often unpredictable economic and market conditions. Your Board carefully assesses their performance in a constantly changing and highly competitive marketplace.
Your Board also conducts an annual review of the funds’ advisory and sub-advisory contracts with Invesco Advisers and its affiliates. This annual review, which is required by the Investment Company Act of 1940, focuses on the nature and quality of the services Invesco provides as adviser to the Invesco Funds and the reasonableness of the fees that it charges for those services. Each year, we spend months reviewing detailed information that we request from Invesco that allows us to evaluate its services and fees. We also use information from many independent sources, including materials provided by the independent Senior Officer of the Invesco Funds, who reports directly to the independent Trustees on the Board. Additionally, we meet with independent legal counsel and review performance and fee data prepared by Lipper Inc., an independent, third-party firm widely recognized as a leader in its field.
Be assured that your Board will continue working on behalf of fund shareholders, keeping your needs and interests uppermost in our minds.
As always, please contact me at bruce@brucecrockett.com with any questions or concerns you may have. On behalf of the Board, we look forward to continuing to represent your interests and serving your needs.
Sincerely,

Bruce L. Crockett
Independent Chair
Invesco Funds Board of Trustees
3 Invesco Small Cap Growth Fund
Management’s Discussion of Fund Performance
Performance summary
For the year ended December 31, 2013, Invesco Small Cap Growth Fund had strong positive returns, but trailed the Fund’s style-specific index, the Russell 2000 Growth Index.
Your Fund’s long-term performance appears later in this report.
Fund vs. Indexes
Total returns, 12/31/12 to 12/31/13, at net asset value (NAV). Performance shown does not include applicable contingent deferred sales charges (CDSC) or front-end sales charges, which would have reduced performance.
| Class A Shares | 39.90 | % | |||
| Class B Shares | 38.87 | ||||
| Class C Shares | 38.88 | ||||
| Class R Shares | 39.55 | ||||
| Class Y Shares | 40.24 | ||||
| Investor Class Shares | 39.92 | ||||
| Class R5 Shares | 40.46 | ||||
| Class R6 Shares | 40.53 | ||||
| S&P 500 Index‚ (Broad Market Index) | 32.39 | ||||
| Russell 2000 Growth Index¡ (Style-Specific Index) | 43.30 | ||||
| Lipper Small-Cap Growth Funds Index¿ (Peer Group Index) | 40.99 |
Source(s): ‚Invesco, S&P-Dow Jones via FactSet Research Systems Inc.;
¡Invesco, Russell via FactSet Research Systems Inc.; ¿Lipper Inc.
How we invest
We believe a growth investment strategy is an essential component of a diversified portfolio.
Our investment process seeks to identify attractively valued small-cap companies with high growth potential, demonstrated by consistent and accelerating revenue and earnings growth.
We begin with a quantitative model that ranks companies based on a set of growth, quality and timeliness factors. This proprietary model provides an objective approach to identifying new investment opportunities, as the highest-ranked stocks become the primary focus of our research efforts.
Our stock selection process is based on a rigorous three-step process that includes fundamental, valuation and timeliness analysis.
| n | Fundamental analysis. Building financial models and conducting in-depth interviews with company management. |
| n | Valuation analysis. Identifying attractively valued stocks given their growth potential over a one- to two-year horizon. |
| n | Timeliness analysis. Identifying the timeliness of a stock purchase. We review trading volume characteristics and trend analysis to make sure there are no signs of the stock deteriorating. This also serves as a risk management measure that helps us confirm our high-conviction candidates. |
Portfolio construction plays an important role in risk management. We align the Fund with the Russell 2000 Growth Index, the benchmark we believe represents the small-cap growth asset class. We seek to manage risk by keeping the Fund’s sector weightings in line with the benchmark and by staying fully
diversified in all those sectors. We also seek to manage stock-specific risk by typically investing in 130 to 140 holdings.
We consider selling a stock when it no longer meets our investment criteria, for the following reasons:
| n | Our original investment thesis is not valid because the fundamentals are no longer intact. |
| n | The price target set at purchase is exceeded. |
| n | The company’s timeliness profile deteriorates. |
Market conditions and your Fund
The year ended December 31, 2013, was characterized by slow but steady improvement in the US economy and strong US equity market returns. As the year began, consumer confidence trended higher based on the recovery of the US housing market, despite uncertainty surrounding the outcome of tax and spending negotiations between the White House and Congress – and implementation of sequestration spending cuts – which consequently left many businesses hesitant to spend.
US equity markets rose for the first half of the year, but from late May through June, capital markets declined following US Federal Reserve (the Fed) Chairman Ben Bernanke’s comments suggesting that the time had come for the Fed to begin to reduce the size of its bond buying program, also known as quantitative easing (QE). This sell-off was brief but broad, and few asset classes were immune. Markets stabilized in mid-summer, despite some volatility in August surrounding a potential US military reaction to instability in Syria. The fourth quarter began amid uncertainty created by a two-week federal government shutdown, yet equities shrugged off this news and rallied steadily throughout the last three months of the year. In December, as expected, the Fed officially announced
Portfolio Composition By sector
| |||||
| Information Technology | 23.2 | % | |||
| Industrials | 19.4 | ||||
| Health Care | 17.7 | ||||
| Consumer Discretionary | 14.8 | ||||
| Financials | 9.5 | ||||
| Energy | 5.0 | ||||
| Materials | 3.7 | ||||
| Consumer Staples | 1.6 | ||||
| Utilities | 1.5 | ||||
| Telecommunication Services | 1.2 | ||||
Money Market Funds Plus Other Assets Less Liabilities | 2.4 | ||||
| Top 10 Equity Holdings* | |||||
1. Manhattan Associates, Inc. | 1.9 | % | |||
2. CoStar Group Inc. | 1.6 | ||||
3. Incyte Corp. | 1.5 | ||||
4. Aspen Technology, Inc. | 1.5 | ||||
5. Jazz Pharmaceuticals PLC | 1.3 | ||||
6. United Therapeutics Corp. | 1.2 | ||||
7. SBA Communications Corp.- ClassA | 1.2 | ||||
8. Affiliated Managers Group, Inc. | 1.2 | ||||
9. Wabtec Corp. | 1.2 | ||||
10. A.O. Smith Corp. | 1.2 | ||||
| Top Five Industries* | |||||
1. Application Software | 9.1 | % | |||
2. Internet Software & Services | 5.0 | ||||
3. Biotechnology | 4.6 | ||||
4. Health Care Equipment | 4.0 | ||||
5. Regional Banks | 3.5 | ||||
| Total Net Assets | $2.3 billion | ||||
| Total Number of Holdings* | 122 | ||||
The Fund’s holdings are subject to change, and there is no assurance that the Fund will continue to hold any particular security.
*Excluding money market fund holdings.
4 Invesco Small Cap Growth Fund
that it would begin reducing the scope of QE in early 2014. Despite the Fed’s actions, equities continued to rise, as the announcement was widely anticipated and largely priced into stock valuations.
For the reporting period, major US equity market indexes delivered strong double-digit gains, and all 10 sectors of the S&P 500 Index had positive returns. The consumer discretionary sector had the highest return of any sector.
The Fund had solid positive returns but trailed its style-specific index, the Russell 2000 Growth Index. The Fund outperformed significantly in the financials sector. However, this was offset by the negative effect of stock selection in the information technology (IT) sector and the relative drag of our small cash position during a period of strong market performance. Fund positioning is based primarily on our bottom-up stock selection process, and our long-term investment horizon leads to relatively low turnover.
The Fund outperformed by the widest margin in the financials sector due primarily to stock selection. Asset management firm Affiliated Managers Group was a solid contributor during the year as its revenue prospects rose along with equity markets. The Fund’s investment in regional banks, especially those with niche clientele that are demonstrating loan growth while simultaneously cutting operating expenses, was beneficial to performance. SVB Financial, East West Bancorp and Prosperity Bancshares were three banks which contributed to relative performance.
The Fund also outperformed in the energy sector due to stock selection. A top contributor in this sector was Energen, an exploration and production company. The company is focusing on land-based drilling, especially in the Permian Basin, where it can grow by further developing its proven reserves. Oasis Petroleum was another solid performer for the Fund.
The IT sector was an area of under-performance during the year. Solar-Winds is a provider of powerful IT management software with an innovative web-based delivery model. We held the company throughout the reporting period even though business spending on software was weak. Additionally, the company had temporary missteps in its marketing spending as well as execution issues with its European sales team, which resulted in the replacement of European sales leadership. Netgear designs networking products for small
business and the home, and was another detractor during the year. The company reported disappointing earnings guidance early in the year which management blamed on the uneven nature of revenues from its European service provider business. However, the more detrimental event which caused us to sell the stock was the company’s announcement that it planned to acquire a large business which had lower margins, slowing growth and few synergies.
The Fund also underperformed in the materials sector. This was the poorest-performing sector of the index, and the Fund’s underweight allocation was beneficial to relative performance. However, several of the Fund’s materials stocks had poor performance which offset this benefit, including Allied Nevada and Intrepid Potash, which were both sold during the year.
We thank you for your commitment to Invesco Small Cap Growth Fund.
Asset allocation/diversification does not guarantee a profit or eliminate the risk of loss.
The views and opinions expressed in management’s discussion of Fund performance are those of Invesco Advisers, Inc. These views and opinions are subject to change at any time based on factors such as market and economic conditions. These views and opinions may not be relied upon as investment advice or recommendations, or as an offer for a particular security. The information is not a complete analysis of every aspect of any market, country, industry, security or the Fund. Statements of fact are from sources considered reliable, but Invesco Advisers, Inc. makes no representation or warranty as to their completeness or accuracy. Although historical performance is no guarantee of future results, these insights may help you understand our investment management philosophy.
See important Fund and, if applicable, index disclosures later in this report.
 | Juliet Ellis Chartered Financial Analyst, portfolio manager and chief investment officer of Invesco’s domestic | |
| growth investments team, is lead manager of Invesco Small Cap Growth Fund. She joined Invesco in 2004. Ms. Ellis earned a BA in economics and political science from Indiana University. | ||
 | Juan Hartsfield Chartered Financial Analyst, portfolio manager, is manager of Invesco Small Cap Growth Fund. He | |
| joined Invesco in 2004. Mr. Hartsfield earned a BS in petroleum engineering from The University of Texas at Austin and an MBA from the University of Michigan. | ||
 | Clay Manley Chartered Financial Analyst, portfolio manager, is manager of Invesco Small Cap Growth Fund. He | |
| joined Invesco in 2001. Mr. Manley earned a BA in history and geology from Vanderbilt University and an MBA with concentrations in finance and accounting from Emory University’s Goizueta Business School. | ||
5 Invesco Small Cap Growth Fund
Your Fund’s Long-Term Performance
Results of a $10,000 Investment – Oldest Share Class(es)
Fund and index data from 12/31/03
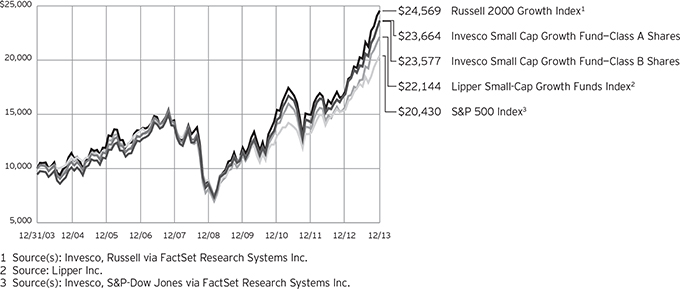
Past performance cannot guarantee comparable future results.
The data shown in the chart include reinvested distributions, applicable sales charges and Fund expenses including management fees. Results for Class B shares are calculated as if a hypothetical
shareholder had liquidated his entire investment in the Fund at the close of the reporting period and paid the contingent deferred sales charges, if applicable. Index results include reinvested dividends, but they do not reflect sales charges. Performance of the peer group,
if applicable, reflects fund expenses and management fees; performance of a market index does not. Performance shown in the chart and table(s) does not reflect deduction of taxes a shareholder would pay on Fund distributions or sale of Fund shares.
6 Invesco Small Cap Growth Fund
| Average Annual Total Returns | |||||
| As of 12/31/13, including maximum applicable sales charges | |||||
| Class A Shares | |||||
| Inception (10/18/95) | 10.83 | % | |||
| 10 Years | 9.00 | ||||
| 5 Years | 21.28 | ||||
| 1 Year | 32.19 | ||||
| Class B Shares | |||||
| Inception (10/18/95) | 10.83 | % | |||
| 10 Years | 8.96 | ||||
| 5 Years | 21.55 | ||||
| 1 Year | 33.87 | ||||
| Class C Shares | |||||
| Inception (5/3/99) | 8.25 | % | |||
| 10 Years | 8.79 | ||||
| 5 Years | 21.73 | ||||
| 1 Year | 37.88 | ||||
| Class R Shares | |||||
| Inception (6/3/02) | 9.17 | % | |||
| 10 Years | 9.33 | ||||
| 5 Years | 22.35 | ||||
| 1 Year | 39.55 | ||||
| Class Y Shares | |||||
| 10 Years | 9.75 | % | |||
| 5 Years | 22.96 | ||||
| 1 Year | 40.24 | ||||
| Investor Class Shares | |||||
| 10 Years | 9.61 | % | |||
| 5 Years | 22.66 | ||||
| 1 Year | 39.92 | ||||
| Class R5 Shares | |||||
| Inception (3/15/02) | 8.98 | % | |||
| 10 Years | 10.10 | ||||
| 5 Years | 23.18 | ||||
| 1 Year | 40.46 | ||||
| Class R6 Shares | |||||
| 10 Years | 9.68 | % | |||
| 5 Years | 22.81 | ||||
| 1 Year | 40.53 | ||||
Class Y shares incepted on October 3, 2008. Performance shown prior to that date is that of Class A shares and includes the 12b-1 fees applicable to Class A shares. Class A share performance reflects any applicable fee waivers or expense reimbursements.
Investor Class shares incepted on April 7, 2006. Performance shown prior to that date is that of Class A shares and includes the 12b-1 fees applicable to Class A shares. Class A share performance reflects any applicable fee waivers or expense reimbursements.
Class R6 shares incepted on September 24, 2012. Performance shown prior to that date is that of Class A shares and includes the 12b-1 fees applicable to Class A shares. Class A share performance reflects any applicable fee waivers or expense reimbursements.
The performance data quoted represent past performance and cannot guarantee comparable future results; current performance may be lower or higher. Please visit invesco.com/performance for the most recent month-end performance. Performance figures reflect reinvested distributions, changes in net asset value and the effect of the maximum sales charge unless otherwise stated. Investment return and principal value will fluctuate so that you may have a gain or loss when you sell shares.
The total annual Fund operating expense ratio set forth in the most recent Fund prospectus as of the date of this report for Class A, Class B, Class C, Class R, Class Y, Investor Class, Class R5 and Class R6 shares was 1.23%, 1.98%, 1.98%, 1.48%, 0.98%, 1.23%, 0.83% and 0.75%, respectively. The expense ratios presented above may vary from the expense ratios presented in other sections of this report that are based on expenses incurred during the period covered by this report.
Class A share performance reflects the maximum 5.50% sales charge, and Class B and Class C share performance reflects the applicable contingent deferred sales charge (CDSC) for the period involved. The CDSC on Class B shares declines from 5% beginning at the time of purchase to 0% at the beginning of the seventh year. The CDSC on Class C shares is 1% for the first year after purchase. Class R, Class Y, Investor Class, Class R5 and Class R6 shares do not have a front-end sales charge or a CDSC; therefore, performance is at net asset value.
The performance of the Fund’s share classes will differ primarily due to different sales charge structures and class expenses.
7 Invesco Small Cap Growth Fund
Invesco Small Cap Growth Fund’s investment objective is long-term growth of capital.
| n | Unless otherwise stated, information presented in this report is as of December 31, 2013, and is based on total net assets. |
| n | Unless otherwise noted, all data provided by Invesco. |
| n | To access your Fund’s reports/prospectus, visit invesco.com/fundreports. |
About share classes
| n | Class B shares may not be purchased for new or additional investments. Please see the prospectus for more information. |
| n | Class R shares are generally available only to employer sponsored retirement and benefit plans. Please see the prospectus for more information. |
| n | Class Y shares are available only to certain investors. Please see the prospectus for more information. |
| n | Investor Class shares are closed to new investors. Contact your financial adviser about purchasing our other share classes. Please see the prospectus for more information. |
| n | Class R5 shares and Class R6 shares are primarily intended for employer sponsored retirement and benefit plans that meet certain standards and for institutional investors. Please see the prospectus for more information. |
Principal risks of investing in the Fund
| n | Foreign securities risk. The Fund’s foreign investments may be affected by changes in a foreign country’s exchange rates, political and social instability, changes in economic or taxation policies, difficulties when enforcing obligations, decreased liquidity, and increased volatility. Foreign companies may be subject to less regulation resulting in less publicly available information about the companies. |
| n | Growth investing risk. Growth stocks tend to be more expensive relative to their earnings or assets compared with other types of stock. As a result they tend to be more sensitive to changes in their earnings and can be more volatile. |
| n | Initial public offerings (IPO) risk. The prices of IPO securities fluctuate more than prices of equity securities of companies with longer trading histories. In addition, companies offering securities in IPOs may have less |
experienced management or limited operating histories. There can be no assurance that the Fund will have favorable IPO investment opportunities. |
| n | Management risk. The investment techniques and risk analysis used by the Fund’s portfolio managers may not produce the desired results. |
| n | Market risk. The prices of and the income generated by the Fund’s securities may decline in response to, among other things, investor sentiment, general economic and market conditions, regional or global instability, and currency and interest rate fluctuations. |
| n | Small- and mid-capitalization risks. Stocks of small- and mid-sized companies tend to be more vulnerable to adverse developments and may have little or no operating history or track record of success, and limited product lines, markets, management and financial resources. The securities of small- and mid-sized companies may be more volatile due to less market interest and less publicly available information about the issuer. They also may be illiquid or restricted as to resale, or may trade less frequently and in smaller volumes, all of which may cause difficulty when establishing or closing a position at a desirable price. |
About indexes used in this report
| n | The S&P 500® Index is an unmanaged index considered representative of the US stock market. |
| n | The Russell 2000® Growth Index is an unmanaged index considered representative of small-cap growth stocks. The Russell 2000 Growth Index is a trademark/service mark of the Frank Russell Co. Russell® is a trademark of the Frank Russell Co. |
| n | The Lipper Small-Cap Growth Funds Index is an unmanaged index considered representative of small-cap growth funds tracked by Lipper. |
| n | The Fund is not managed to track the performance of any particular index, including the index(es) described here, and consequently, the performance of the Fund may deviate significantly from the performance of the index(es). |
| n | A direct investment cannot be made in an index. Unless otherwise indicated, index results include reinvested dividends, and they do not reflect sales charges. Performance of the peer group, if applicable, reflects fund expenses; performance of a market index does not. |
Other information
| n | The returns shown in management’s discussion of Fund performance are based on net asset values calculated for shareholder transactions. Generally accepted accounting principles require adjustments to be made to the net assets of the Fund at period end for financial reporting purposes, and as such, the net asset values for shareholder transactions and the returns based on those net asset values may differ from the net asset values and returns reported in the Financial Highlights. |
| n | Industry classifications used in this report are generally according to the Global Industry Classification Standard, which was developed by and is the exclusive property and a service mark of MSCI Inc. and Standard & Poor’s. |
This report must be accompanied or preceded by a currently effective Fund prospectus, which contains more complete information, including sales charges and expenses. Investors should read it carefully before investing.
NOT FDIC INSURED | MAY LOSE VALUE | NO BANK GUARANTEE
Fund Nasdaq Symbols
| |||||
| Class A Shares | GTSAX | ||||
| Class B Shares | GTSBX | ||||
| Class C Shares | GTSDX | ||||
| Class R Shares | GTSRX | ||||
| Class Y Shares | GTSYX | ||||
| Investor Class Shares | GTSIX | ||||
| Class R5 Shares | GTSVX | ||||
| Class R6 Shares | GTSFX | ||||
8 Invesco Small Cap Growth Fund
Schedule of Investments(a)
December 31, 2013
| Shares | Value | |||||||
Common Stocks & Other Equity Interests–97.57% |
| |||||||
| Aerospace & Defense–1.46% | ||||||||
Hexcel Corp.(b) | 412,428 | $ | 18,431,407 | |||||
TransDigm Group, Inc. | 97,589 | 15,713,781 | ||||||
| 34,145,188 | ||||||||
| Air Freight & Logistics–1.37% | ||||||||
Forward Air Corp. | 352,852 | 15,493,731 | ||||||
Hub Group, Inc.–Class A(b) | 415,415 | 16,566,750 | ||||||
| 32,060,481 | ||||||||
| Apparel Retail–0.92% | ||||||||
DSW Inc.–Class A | 503,233 | 21,503,146 | ||||||
| Application Software–9.07% | ||||||||
ANSYS, Inc.(b) | 223,918 | 19,525,650 | ||||||
Aspen Technology, Inc.(b) | 824,284 | 34,455,071 | ||||||
Cadence Design Systems, Inc.(b) | 1,050,349 | 14,725,893 | ||||||
Informatica Corp.(b) | 531,640 | 22,063,060 | ||||||
Interactive Intelligence Group, Inc.(b) | 324,203 | 21,838,314 | ||||||
Manhattan Associates, Inc.(b) | 374,888 | 44,041,842 | ||||||
Mentor Graphics Corp. | 793,942 | 19,110,184 | ||||||
MicroStrategy Inc.–Class A(b) | 97,961 | 12,170,675 | ||||||
Qlik Technologies Inc.(b) | 468,045 | 12,464,038 | ||||||
SolarWinds, Inc.(b) | 323,666 | 12,244,285 | ||||||
| 212,639,012 | ||||||||
| Asset Management & Custody Banks–2.04% | ||||||||
Affiliated Managers Group, Inc.(b) | 128,399 | 27,847,175 | ||||||
SEI Investments Co. | 572,229 | 19,873,513 | ||||||
| 47,720,688 | ||||||||
| Auto Parts & Equipment–1.84% | ||||||||
Tenneco Inc.(b) | 446,815 | 25,276,325 | ||||||
TRW Automotive Holdings Corp.(b) | 240,508 | 17,891,390 | ||||||
| 43,167,715 | ||||||||
| Automotive Retail–1.47% | ||||||||
Group 1 Automotive, Inc. | 237,739 | 16,884,224 | ||||||
Monro Muffler Brake, Inc.(c) | 313,391 | 17,662,717 | ||||||
| 34,546,941 | ||||||||
| Biotechnology–4.61% | ||||||||
Acorda Therapeutics Inc.(b) | 327,789 | 9,571,439 | ||||||
BioMarin Pharmaceutical Inc.(b) | 252,471 | 17,741,137 | ||||||
Incyte Corp.(b)(c) | 701,440 | 35,513,907 | ||||||
Seattle Genetics, Inc.(b)(c) | 405,624 | 16,180,342 | ||||||
United Therapeutics Corp.(b) | 257,379 | 29,104,417 | ||||||
| 108,111,242 | ||||||||
| Broadcasting–0.86% | ||||||||
Sinclair Broadcast Group, Inc.–Class A | 564,700 | 20,176,731 | ||||||
| Building Products–1.18% | ||||||||
A.O. Smith Corp. | 514,336 | 27,743,284 | ||||||
| Shares | Value | |||||||
| Casinos & Gaming–0.25% | ||||||||
Penn National Gaming, Inc.(b) | 401,980 | $ | 5,760,373 | |||||
| Communications Equipment–0.86% | ||||||||
ARRIS Group Inc.(b) | 827,384 | 20,159,211 | ||||||
| Computer Hardware–0.79% | ||||||||
Cray, Inc.(b) | 677,096 | 18,593,056 | ||||||
| Construction & Engineering–0.72% | ||||||||
MasTec Inc.(b) | 517,911 | 16,946,048 | ||||||
| Construction & Farm Machinery & Heavy Trucks–2.74% | ||||||||
Lindsay Corp.(c) | 196,306 | 16,244,321 | ||||||
WABCO Holdings Inc.(b) | 215,234 | 20,105,008 | ||||||
Wabtec Corp. | 374,362 | 27,803,866 | ||||||
| 64,153,195 | ||||||||
| Construction Materials–0.63% | ||||||||
Martin Marietta Materials, Inc. | 148,071 | 14,798,216 | ||||||
| Data Processing & Outsourced Services–0.99% | ||||||||
Alliance Data Systems Corp.(b) | 88,553 | 23,283,240 | ||||||
| Distributors–0.98% | ||||||||
Pool Corp. | 397,016 | 23,082,510 | ||||||
| Electric Utilities–0.75% | ||||||||
ITC Holdings Corp. | 183,035 | 17,538,414 | ||||||
| Electrical Components & Equipment–1.02% | ||||||||
Acuity Brands, Inc. | 217,652 | 23,793,717 | ||||||
| Electronic Components–0.94% | ||||||||
Littelfuse, Inc. | 237,862 | 22,104,516 | ||||||
| Electronic Equipment & Instruments–1.68% | ||||||||
Cognex Corp.(b) | 623,009 | 23,786,484 | ||||||
National Instruments Corp. | 484,099 | 15,500,850 | ||||||
| 39,287,334 | ||||||||
| Electronic Manufacturing Services–0.56% | ||||||||
IPG Photonics Corp.(b)(c) | 169,889 | 13,185,085 | ||||||
| Environmental & Facilities Services–0.69% | ||||||||
Tetra Tech, Inc.(b) | 575,902 | 16,113,738 | ||||||
| Footwear–0.71% | ||||||||
Steven Madden, Ltd.(b) | 453,684 | 16,600,298 | ||||||
| Health Care Equipment–3.97% | ||||||||
Insulet Corp.(b) | 436,375 | 16,189,513 | ||||||
Masimo Corp.(b) | 486,392 | 14,217,238 | ||||||
NuVasive, Inc.(b) | 503,692 | 16,284,362 | ||||||
Sirona Dental Systems, Inc.(b) | 193,910 | 13,612,482 | ||||||
STERIS Corp. | 395,385 | 18,998,249 | ||||||
Thoratec Corp.(b) | 375,618 | 13,747,619 | ||||||
| 93,049,463 | ||||||||
See accompanying Notes to Financial Statements which are an integral part of the financial statements.
9 Invesco Small Cap Growth Fund
| Shares | Value | |||||||
| Health Care Facilities–2.22% | ||||||||
Health Management Associates Inc.–Class A(b) | 1,164,768 | $ | 15,258,461 | |||||
HealthSouth Corp. | 514,550 | 17,144,806 | ||||||
VCA Antech, Inc.(b) | 623,557 | 19,554,747 | ||||||
| 51,958,014 | ||||||||
| Health Care Services–1.53% | ||||||||
Chemed Corp.(c) | 232,977 | 17,850,698 | ||||||
MEDNAX, Inc.(b) | 337,862 | 18,035,073 | ||||||
| 35,885,771 | ||||||||
| Health Care Supplies–0.44% | ||||||||
Meridian Bioscience, Inc.(c) | 385,978 | 10,239,996 | ||||||
| Health Care Technology–0.35% | ||||||||
HMS Holdings Corp.(b) | 364,613 | 8,287,653 | ||||||
| Home Furnishings–0.57% | ||||||||
Ethan Allen Interiors Inc. | 436,369 | 13,274,345 | ||||||
| Hotels, Resorts & Cruise Lines–0.57% | ||||||||
Choice Hotels International, Inc.(c) | 271,163 | 13,316,815 | ||||||
| Industrial Machinery–2.81% | ||||||||
Crane Co. | 273,676 | 18,404,711 | ||||||
ITT Corp. | 528,175 | 22,933,358 | ||||||
Lincoln Electric Holdings, Inc. | 343,140 | 24,479,608 | ||||||
| 65,817,677 | ||||||||
| Insurance Brokers–0.61% | ||||||||
Brown & Brown, Inc. | 452,363 | 14,199,675 | ||||||
| Internet Software & Services–4.98% | ||||||||
CoStar Group Inc.(b) | 199,090 | 36,748,032 | ||||||
Dealertrack Technologies Inc.(b) | 444,252 | 21,359,636 | ||||||
HomeAway Inc.(b) | 503,138 | 20,568,281 | ||||||
OpenTable, Inc.(b)(c) | 217,026 | 17,225,354 | ||||||
ValueClick, Inc.(b) | 889,330 | 20,783,642 | ||||||
| 116,684,945 | ||||||||
| Investment Banking & Brokerage–1.64% | ||||||||
Greenhill & Co., Inc. | 236,639 | 13,710,864 | ||||||
Stifel Financial Corp.(b) | 515,097 | 24,683,448 | ||||||
| 38,394,312 | ||||||||
| IT Consulting & Other Services–0.09% | ||||||||
EPAM Systems, Inc.(b) | 62,851 | 2,196,014 | ||||||
| Leisure Facilities–0.65% | ||||||||
Life Time Fitness, Inc.(b) | 324,348 | 15,244,356 | ||||||
| Leisure Products–0.75% | ||||||||
Brunswick Corp. | 383,308 | 17,655,166 | ||||||
| Life & Health Insurance–0.88% | ||||||||
American Equity Investment Life Holding Co. | 777,618 | 20,513,563 | ||||||
| Shares | Value | |||||||
| Life Sciences Tools & Services–2.21% | ||||||||
PAREXEL International Corp.(b) | 372,270 | $ | 16,819,158 | |||||
PerkinElmer, Inc. | 393,318 | 16,216,501 | ||||||
Techne Corp. | 199,410 | 18,878,145 | ||||||
| 51,913,804 | ||||||||
| Marine–0.87% | ||||||||
Kirby Corp.(b) | 205,256 | 20,371,658 | ||||||
| Metal & Glass Containers–0.75% | ||||||||
Berry Plastics Group Inc.(b) | 734,911 | 17,483,533 | ||||||
| Office Services & Supplies–1.66% | ||||||||
Pitney Bowes Inc.(c) | 933,741 | 21,756,165 | ||||||
Steelcase Inc.–Class A | 1,082,052 | 17,161,345 | ||||||
| 38,917,510 | ||||||||
| Oil & Gas Drilling–1.39% | ||||||||
Atwood Oceanics, Inc.(b) | 272,123 | 14,528,647 | ||||||
Patterson–UTI Energy, Inc. | 709,685 | 17,969,224 | ||||||
| 32,497,871 | ||||||||
| Oil & Gas Equipment & Services–1.60% | ||||||||
Dresser-Rand Group, Inc.(b) | 266,409 | 15,885,969 | ||||||
Dril-Quip, Inc.(b) | 196,015 | 21,547,929 | ||||||
| 37,433,898 | ||||||||
| Oil & Gas Exploration & Production–2.76% | ||||||||
Energen Corp. | 262,341 | 18,560,626 | ||||||
Oasis Petroleum Inc.(b) | 464,803 | 21,831,797 | ||||||
Resolute Energy Corp.(b) | 915,850 | 8,270,125 | ||||||
Ultra Petroleum Corp.(b)(c) | 742,594 | 16,077,160 | ||||||
| 64,739,708 | ||||||||
| Packaged Foods & Meats–1.55% | ||||||||
B&G Foods Inc. | 490,687 | 16,639,196 | ||||||
Lancaster Colony Corp. | 222,236 | 19,590,104 | ||||||
| 36,229,300 | ||||||||
| Pharmaceuticals–2.36% | ||||||||
Jazz Pharmaceuticals PLC(b) | 242,398 | 30,677,891 | ||||||
Salix Pharmaceuticals, Ltd.(b) | 273,277 | 24,578,533 | ||||||
| 55,256,424 | ||||||||
| Regional Banks–3.49% | ||||||||
East West Bancorp, Inc. | 575,257 | 20,116,737 | ||||||
Prosperity Bancshares, Inc. | 304,872 | 19,325,836 | ||||||
SVB Financial Group(b) | 217,849 | 22,843,646 | ||||||
UMB Financial Corp. | 302,038 | 19,415,003 | ||||||
| 81,701,222 | ||||||||
| Restaurants–2.83% | ||||||||
Cheesecake Factory Inc. (The) | 352,689 | 17,024,298 | ||||||
Domino’s Pizza, Inc. | 357,972 | 24,932,750 | ||||||
Jack in the Box Inc.(b) | 486,252 | 24,322,325 | ||||||
| 66,279,373 | ||||||||
See accompanying Notes to Financial Statements which are an integral part of the financial statements.
10 Invesco Small Cap Growth Fund
| Shares | Value | |||||||
| Semiconductor Equipment–1.13% | ||||||||
MKS Instruments, Inc. | 412,650 | $ | 12,354,741 | |||||
Teradyne, Inc.(b)(c) | 807,631 | 14,230,458 | ||||||
| 26,585,199 | ||||||||
| Semiconductors–1.98% | ||||||||
Power Integrations, Inc. | 367,590 | 20,518,874 | ||||||
Semtech Corp.(b) | 476,215 | 12,038,715 | ||||||
Silicon Laboratories Inc.(b) | 317,610 | 13,755,689 | ||||||
| 46,313,278 | ||||||||
| Specialized REIT’s–1.65% | ||||||||
Corrections Corp. of America | 572,075 | 18,346,445 | ||||||
Gaming and Leisure Properties, Inc.(b) | 401,976 | 20,424,401 | ||||||
| 38,770,846 | ||||||||
| Specialty Chemicals–1.62% | ||||||||
PolyOne Corp. | 596,731 | 21,094,441 | ||||||
Rockwood Holdings Inc. | 234,401 | 16,858,120 | ||||||
| 37,952,561 | ||||||||
| Specialty Stores–1.57% | ||||||||
Tractor Supply Co. | 320,553 | 24,868,502 | ||||||
Vitamin Shoppe, Inc.(b) | 227,290 | 11,821,353 | ||||||
| 36,689,855 | ||||||||
| Steel–0.70% | ||||||||
Carpenter Technology Corp. | 263,422 | 16,384,848 | ||||||
| Systems Software–1.54% | ||||||||
CommVault Systems, Inc.(b) | 221,822 | 16,610,032 | ||||||
FireEye Inc.(b)(c) | 43,490 | 1,896,599 | ||||||
MICROS Systems, Inc.(b) | 307,736 | 17,654,814 | ||||||
| 36,161,445 | ||||||||
| Technology Distributors–1.00% | ||||||||
SYNNEX Corp.(b) | 347,538 | 23,424,061 | ||||||
| Shares | Value | |||||||
| Trading Companies & Distributors–1.67% | ||||||||
Watsco, Inc. | 191,564 | $ | 18,401,638 | |||||
WESCO International, Inc.(b)(c) | 228,039 | 20,767,512 | ||||||
| 39,169,150 | ||||||||
| Trucking–0.83% | ||||||||
Swift Transportation Co.(b)(c) | 878,162 | 19,503,978 | ||||||
| Wireless Telecommunication Services–1.22% | ||||||||
SBA Communications Corp.–Class A(b) | 317,875 | 28,557,890 | ||||||
Total Common Stocks & Other Equity Interests |
| 2,286,268,556 | ||||||
Money Market Funds–2.70% |
| |||||||
Liquid Assets Portfolio–Institutional Class(d) | 31,643,079 | 31,643,079 | ||||||
Premier Portfolio–Institutional Class(d) | 31,643,078 | 31,643,078 | ||||||
Total Money Market Funds | 63,286,157 | |||||||
TOTAL INVESTMENTS (excluding investments purchased with cash collateral from securities on loan)–100.27% |
| 2,349,554,713 | ||||||
Investments Purchased with Cash |
| |||||||
Money Market Funds–6.46% |
| |||||||
Liquid Assets Portfolio–Institutional Class | 151,292,421 | 151,292,421 | ||||||
TOTAL INVESTMENTS–106.73% |
| 2,500,847,134 | ||||||
OTHER ASSETS LESS LIABILITIES–(6.73)% |
| (157,680,328 | ) | |||||
NET ASSETS–100.00% | $ | 2,343,166,806 | ||||||
Investment Abbreviations:
| REIT | – Real Estate Investment Trust |
Notes to Schedule of Investments:
| (a) | Industry and/or sector classifications used in this report are generally according to the Global Industry Classification Standard, which was developed by and is the exclusive property and a service mark of MSCI Inc. and Standard & Poor’s. |
| (b) | Non-income producing security. |
| (c) | All or a portion of this security was out on loan at December 31, 2013. |
| (d) | The money market fund and the Fund are affiliated by having the same investment adviser. |
| (e) | The security has been segregated to satisfy the commitment to return the cash collateral received in securities lending transactions upon the borrower’s return of the securities loaned. See Note 1I. The following table presents the Fund’s gross and net amount of assets available for offset by the Fund as of December 31, 2013. |
| Counterparty | Gross Amount of Securities on Loan at Value | Cash Collateral Received for Securities Loaned* | Net Amount | |||||||||
Brown Brothers Harriman | $ | 148,115,078 | $ | (148,115,078 | ) | $ | — | |||||
| * | Amount does not include excess collateral received. |
See accompanying Notes to Financial Statements which are an integral part of the financial statements.
11 Invesco Small Cap Growth Fund
Statement of Assets and Liabilities
December 31, 2013
Assets: | ||||
Investments, at value (Cost $1,291,345,857)* | $ | 2,286,268,556 | ||
Investments in affiliated money market funds, at value and cost | 214,578,578 | |||
Total investments, at value (Cost $1,505,924,435) | 2,500,847,134 | |||
Receivable for: | ||||
Fund shares sold | 2,361,095 | |||
Dividends | 1,118,857 | |||
Investment for trustee deferred compensation and retirement plans | 311,412 | |||
Other assets | 198,149 | |||
Total assets | 2,504,836,647 | |||
Liabilities: | ||||
Payable for: | ||||
Fund shares reacquired | 8,556,119 | |||
Collateral upon return of securities loaned | 151,292,421 | |||
Accrued fees to affiliates | 1,413,177 | |||
Accrued trustees’ and officers’ fees and benefits | 1,920 | |||
Accrued other operating expenses | 26,989 | |||
Trustee deferred compensation and retirement plans | 379,215 | |||
Total liabilities | 161,669,841 | |||
Net assets applicable to shares outstanding | $ | 2,343,166,806 | ||
Net assets consist of: | ||||
Shares of beneficial interest | $ | 1,331,684,599 | ||
Undistributed net investment income (loss) | (363,733 | ) | ||
Undistributed net realized gain | 16,923,241 | |||
Net unrealized appreciation | 994,922,699 | |||
| $ | 2,343,166,806 | |||
Net Assets: | ||||
Class A | $ | 957,432,241 | ||
Class B | $ | 5,359,945 | ||
Class C | $ | 21,793,871 | ||
Class R | $ | 106,983,183 | ||
Class Y | $ | 73,035,330 | ||
Investor Class | $ | 281,810,851 | ||
Class R5 | $ | 780,094,147 | ||
Class R6 | $ | 116,657,238 | ||
Shares outstanding, $0.01 par value per share, |
| |||
Class A | 24,128,273 | |||
Class B | 165,871 | |||
Class C | 675,385 | |||
Class R | 2,805,485 | |||
Class Y | 1,817,541 | |||
Investor Class | 6,877,940 | |||
Class R5 | 18,380,822 | |||
Class R6 | 2,747,251 | |||
Class A: | ||||
Net asset value per share | $ | 39.68 | ||
Maximum offering price per share | ||||
(Net asset value of $39.68 ¸ 94.50%) | $ | 41.99 | ||
Class B: | ||||
Net asset value and offering price per share | $ | 32.31 | ||
Class C: | ||||
Net asset value and offering price per share | $ | 32.27 | ||
Class R: | ||||
Net asset value and offering price per share | $ | 38.13 | ||
Class Y: | ||||
Net asset value and offering price per share | $ | 40.18 | ||
Investor Class: | ||||
Net asset value and offering price per share | $ | 40.97 | ||
Class R5: | ||||
Net asset value and offering price per share | $ | 42.44 | ||
Class R6: | ||||
Net asset value and offering price per share | $ | 42.46 | ||
| * | At December 31, 2013, securities with an aggregate value of $148,115,078 were on loan to brokers. |
See accompanying Notes to Financial Statements which are an integral part of the financial statements.
12 Invesco Small Cap Growth Fund
Statement of Operations
For the year ended December 31, 2013
Investment income: | ||||
Dividends | $ | 15,917,128 | ||
Dividends from affiliated money market funds (includes securities lending income of $343,578) | 364,738 | |||
Total investment income | 16,281,866 | |||
Expenses: | ||||
Advisory fees | 14,045,687 | |||
Administrative services fees | 450,914 | |||
Custodian fees | 50,173 | |||
Distribution fees: | ||||
Class A | 2,182,229 | |||
Class B | 55,328 | |||
Class C | 197,504 | |||
Class R | 467,776 | |||
Investor Class | 616,270 | |||
Transfer agent fees — A, B, C, R, Y and Investor | 2,951,717 | |||
Transfer agent fees — R5 | 653,836 | |||
Transfer agent fees — R6 | 2,913 | |||
Trustees’ and officers’ fees and benefits | 116,724 | |||
Other | 341,650 | |||
Total expenses | 22,132,721 | |||
Less: Fees waived and expense offset arrangement(s) | (45,432 | ) | ||
Net expenses | 22,087,289 | |||
Net investment income (loss) | (5,805,423 | ) | ||
Realized and unrealized gain (loss) from: | ||||
Net realized gain (loss) from: | ||||
Investment securities (includes net gains from securities sold to affiliates of $12,248,817) | 137,288,469 | |||
Foreign currencies | (3,270 | ) | ||
| 137,285,199 | ||||
Change in net unrealized appreciation of investment securities | 554,576,570 | |||
Net realized and unrealized gain | 691,861,769 | |||
Net increase in net assets resulting from operations | $ | 686,056,346 | ||
See accompanying Notes to Financial Statements which are an integral part of the financial statements.
13 Invesco Small Cap Growth Fund
Statement of Changes in Net Assets
For the years ended December 31, 2013 and 2012
| 2013 | 2012 | |||||||
Operations: |
| |||||||
Net investment income (loss) | $ | (5,805,423 | ) | $ | 2,722,159 | |||
Net realized gain | 137,285,199 | 151,286,501 | ||||||
Change in net unrealized appreciation | 554,576,570 | 138,780,461 | ||||||
Net increase in net assets resulting from operations | 686,056,346 | 292,789,121 | ||||||
Distributions to shareholders from net investment income: | ||||||||
Class A | (464,703 | ) | — | |||||
Class Y | (142,290 | ) | (5,023 | ) | ||||
Investor Class | (131,177 | ) | — | |||||
Class R5 | (2,107,894 | ) | (838,954 | ) | ||||
Class R6 | (263,149 | ) | (16 | ) | ||||
Total distributions from net investment income | (3,109,213 | ) | (843,993 | ) | ||||
Distributions to shareholders from net realized gains: | ||||||||
Class A | (50,373,771 | ) | (65,907,987 | ) | ||||
Class B | (346,313 | ) | (582,657 | ) | ||||
Class C | (1,383,920 | ) | (1,772,373 | ) | ||||
Class R | (5,761,621 | ) | (7,677,813 | ) | ||||
Class Y | (3,813,169 | ) | (1,225,442 | ) | ||||
Investor Class | (14,219,636 | ) | (18,277,155 | ) | ||||
Class R5 | (37,861,750 | ) | (49,507,374 | ) | ||||
Class R6 | (4,645,821 | ) | (801 | ) | ||||
Total distributions from net realized gains | (118,406,001 | ) | (144,951,602 | ) | ||||
Share transactions–net: | ||||||||
Class A | (49,449,943 | ) | (139,029,119 | ) | ||||
Class B | (1,833,964 | ) | (2,431,679 | ) | ||||
Class C | (930,726 | ) | (1,383,039 | ) | ||||
Class R | (6,262,529 | ) | 11,086,458 | |||||
Class Y | 24,780,307 | 25,613,386 | ||||||
Investor Class | 3,899,627 | (18,055,278 | ) | |||||
Class R5 | (38,219,296 | ) | 75,701,714 | |||||
Class R6 | 102,885,376 | 10,000 | ||||||
Net increase (decrease) in net assets resulting from share transactions | 34,868,852 | (48,487,557 | ) | |||||
Net increase in net assets | 599,409,984 | 98,505,969 | ||||||
Net assets: | ||||||||
Beginning of year | 1,743,756,822 | 1,645,250,853 | ||||||
End of year (includes undistributed net investment income (loss) of $(363,733) and $570,993, respectively) | $ | 2,343,166,806 | $ | 1,743,756,822 | ||||
Notes to Financial Statements
December 31, 2013
NOTE 1—Significant Accounting Policies
Invesco Small Cap Growth Fund (the “Fund”) is a series portfolio of AIM Growth Series (Invesco Growth Series) (the “Trust”). The Trust is organized as a Delaware statutory trust and is registered under the Investment Company Act of 1940, as amended (the “1940 Act”), as an open-end series management investment company consisting of fifteen separate series portfolios, each authorized to issue an unlimited number of shares of beneficial interest. The assets, liabilities and operations of each portfolio are accounted for separately. Information presented in these financial statements pertains only to the Fund. Matters affecting each portfolio or class will be voted on exclusively by the shareholders of such portfolio or class.
The Fund’s investment objective is long-term growth of capital.
The Fund currently consists of eight different classes of shares: Class A, Class B, Class C, Class R, Class Y, Investor Class, Class R5 and Class R6. Investor Class shares of the Fund are offered only to certain grandfathered investors. Class A shares are sold with a front-end sales charge unless
14 Invesco Small Cap Growth Fund
certain waiver criteria are met and under certain circumstances load waived shares may be subject to contingent deferred sales charges (“CDSC”). Class C shares are sold with a CDSC. Class R, Class Y, Investor Class, Class R5 and Class R6 shares are sold at net asset value. Effective November 30, 2010, new or additional investments in Class B shares are no longer permitted. Existing shareholders of Class B shares may continue to reinvest dividends and capital gains distributions in Class B shares until they convert to Class A shares. Also, shareholders in Class B shares will be able to exchange those shares for Class B shares of other Invesco Funds offering such shares until they convert to Class A shares. Generally, Class B shares will automatically convert to Class A shares on or about the month-end, which is at least eight years after the date of purchase. Redemption of Class B shares prior to the conversion date will be subject to a CDSC.
Effective as of the close of business on March 18, 2002, the Fund’s shares were offered on a limited basis to certain investors.
The following is a summary of the significant accounting policies followed by the Fund in the preparation of its financial statements.
| A. | Security Valuations — Securities, including restricted securities, are valued according to the following policy. |
A security listed or traded on an exchange (except convertible bonds) is valued at its last sales price or official closing price as of the close of the customary trading session on the exchange where the security is principally traded, or lacking any sales or official closing price on a particular day, the security may be valued at the closing bid price on that day. Securities traded in the over-the-counter market are valued based on prices furnished by independent pricing services or market makers. When such securities are valued by an independent pricing service they may be considered fair valued. Futures contracts are valued at the final settlement price set by an exchange on which they are principally traded. Listed options are valued at the mean between the last bid and ask prices from the exchange on which they are principally traded. Options not listed on an exchange are valued by an independent source at the mean between the last bid and ask prices. For purposes of determining net asset value per share, futures and option contracts generally are valued 15 minutes after the close of the customary trading session of the New York Stock Exchange (“NYSE”).
Investments in open-end and closed-end registered investment companies that do not trade on an exchange are valued at the end of day net asset value per share. Investments in open-end and closed-end registered investment companies that trade on an exchange are valued at the last sales price or official closing price as of the close of the customary trading session on the exchange where the security is principally traded.
Debt obligations (including convertible bonds) and unlisted equities are fair valued using an evaluated quote provided by an independent pricing service. Evaluated quotes provided by the pricing service may be determined without exclusive reliance on quoted prices, and may reflect appropriate factors such as institution-size trading in similar groups of securities, developments related to specific securities, dividend rate (for unlisted equities), yield (for debt obligations), quality, type of issue, coupon rate (for debt obligations), maturity (for debt obligations), individual trading characteristics and other market data. Debt obligations are subject to interest rate and credit risks. In addition, all debt obligations involve some risk of default with respect to interest and/or principal payments.
Foreign securities’ (including foreign exchange contracts) prices are converted into U.S. dollar amounts using the applicable exchange rates as of the close of the NYSE. If market quotations are available and reliable for foreign exchange-traded equity securities, the securities will be valued at the market quotations. Because trading hours for certain foreign securities end before the close of the NYSE, closing market quotations may become unreliable. If between the time trading ends on a particular security and the close of the customary trading session on the NYSE, events occur that the Adviser determines are significant and make the closing price unreliable, the Fund may fair value the security. If the event is likely to have affected the closing price of the security, the security will be valued at fair value in good faith using procedures approved by the Board of Trustees. Adjustments to closing prices to reflect fair value may also be based on a screening process of an independent pricing service to indicate the degree of certainty, based on historical data, that the closing price in the principal market where a foreign security trades is not the current value as of the close of the NYSE. Foreign securities’ prices meeting the approved degree of certainty that the price is not reflective of current value will be priced at the indication of fair value from the independent pricing service. Multiple factors may be considered by the independent pricing service in determining adjustments to reflect fair value and may include information relating to sector indices, American Depositary Receipts and domestic and foreign index futures. Foreign securities may have additional risks including exchange rate changes, potential for sharply devalued currencies and high inflation, political and economic upheaval, the relative lack of issuer information, relatively low market liquidity and the potential lack of strict financial and accounting controls and standards.
Securities for which market prices are not provided by any of the above methods may be valued based upon quotes furnished by independent sources. The last bid price may be used to value equity securities. The mean between the last bid and asked prices is used to value debt obligations, including corporate loans.
Securities for which market quotations are not readily available or became unreliable are valued at fair value as determined in good faith by or under the supervision of the Trust’s officers following procedures approved by the Board of Trustees. Issuer specific events, market trends, bid/ask quotes of brokers and information providers and other market data may be reviewed in the course of making a good faith determination of a security’s fair value.
Valuations change in response to many factors including the historical and prospective earnings of the issuer, the value of the issuer’s assets, general economic conditions, interest rates, investor perceptions and market liquidity. Because of the inherent uncertainties of valuation, the values reflected in the financial statements may materially differ from the value received upon actual sale of those investments.
| B. | Securities Transactions and Investment Income — Securities transactions are accounted for on a trade date basis. Realized gains or losses on sales are computed on the basis of specific identification of the securities sold. Interest income is recorded on the accrual basis from settlement date. Dividend income (net of withholding tax, if any) is recorded on the ex-dividend date. |
The Fund may periodically participate in litigation related to Fund investments. As such, the Fund may receive proceeds from litigation settlements. Any proceeds received are included in the Statement of Operations as realized gain (loss) for investments no longer held and as unrealized gain (loss) for investments still held.
Brokerage commissions and mark ups are considered transaction costs and are recorded as an increase to the cost basis of securities purchased and/or a reduction of proceeds on a sale of securities. Such transaction costs are included in the determination of net realized and unrealized gain (loss) from investment securities reported in the Statement of Operations and the Statement of Changes in Net Assets and the net realized and unrealized gains (losses) on securities per share in the Financial Highlights. Transaction costs are included in the calculation of the Fund’s net asset value and, accordingly, they reduce the Fund’s total returns. These transaction costs are not considered operating expenses and are not reflected in net investment income reported in the Statement of Operations and Statement of Changes in Net Assets, or the net investment
15 Invesco Small Cap Growth Fund
income per share and ratios of expenses and net investment income reported in the Financial Highlights, nor are they limited by any expense limitation arrangements between the Fund and the investment adviser.
The Fund allocates income and realized and unrealized capital gains and losses to a class based on the relative net assets of each class.
| C. | Country Determination — For the purposes of making investment selection decisions and presentation in the Schedule of Investments, the investment adviser may determine the country in which an issuer is located and/or credit risk exposure based on various factors. These factors include the laws of the country under which the issuer is organized, where the issuer maintains a principal office, the country in which the issuer derives 50% or more of its total revenues and the country that has the primary market for the issuer’s securities, as well as other criteria. Among the other criteria that may be evaluated for making this determination are the country in which the issuer maintains 50% or more of its assets, the type of security, financial guarantees and enhancements, the nature of the collateral and the sponsor organization. Country of issuer and/or credit risk exposure has been determined to be the United States of America, unless otherwise noted. |
| D. | Distributions — Distributions from income and net realized capital gain, if any, are generally declared and paid annually and recorded on the ex-dividend date. The Fund may elect to treat a portion of the proceeds from redemptions as distributions for federal income tax purposes. |
| E. | Federal Income Taxes — The Fund intends to comply with the requirements of Subchapter M of the Internal Revenue Code of 1986, as amended (the “Internal Revenue Code”), necessary to qualify as a regulated investment company and to distribute substantially all of the Fund’s taxable earnings to shareholders. As such, the Fund will not be subject to federal income taxes on otherwise taxable income (including net realized capital gain) that is distributed to shareholders. Therefore, no provision for federal income taxes is recorded in the financial statements. |
The Fund files tax returns in the U.S. Federal jurisdiction and certain other jurisdictions. Generally, the Fund is subject to examinations by such taxing authorities for up to three years after the filing of the return for the tax period.
| F. | Expenses — Fees provided for under the Rule 12b-1 plan of a particular class of the Fund are charged to the operations of such class. Transfer agency fees and expenses and other shareholder recordkeeping fees and expenses attributable to Class R5 and Class R6 are allocated to each share class based on relative net assets. Sub-accounting fees attributable to Class R5 are charged to the operations of the class. Transfer agency fees and expenses and other shareholder recordkeeping fees and expenses relating to all other classes are allocated among those classes based on relative net assets. All other expenses are allocated among the classes based on relative net assets. |
| G. | Accounting Estimates — The preparation of financial statements in conformity with accounting principles generally accepted in the United States of America (“GAAP”) requires management to make estimates and assumptions that affect the reported amounts of assets and liabilities at the date of the financial statements and the reported amounts of revenues and expenses during the reporting period including estimates and assumptions related to taxation. Actual results could differ from those estimates by a significant amount. In addition, the Fund monitors for material events or transactions that may occur or become known after the period-end date and before the date the financial statements are released to print. |
| H. | Indemnifications — Under the Trust’s organizational documents, each Trustee, officer, employee or other agent of the Trust is indemnified against certain liabilities that may arise out of the performance of their duties to the Fund. Additionally, in the normal course of business, the Fund enters into contracts, including the Fund’s servicing agreements, that contain a variety of indemnification clauses. The Fund’s maximum exposure under these arrangements is unknown as this would involve future claims that may be made against the Fund that have not yet occurred. The risk of material loss as a result of such indemnification claims is considered remote. |
| I. | Securities Lending — The Fund may lend portfolio securities having a market value up to one-third of the Fund’s total assets. Such loans are secured by collateral equal to no less than the market value of the loaned securities determined daily by the securities lending provider. Such collateral will be cash or debt securities issued or guaranteed by the U.S. Government or any of its sponsored agencies. Cash collateral received in connection with these loans is invested in short-term money market instruments or affiliated money market funds and is shown as such on the Schedule of Investments. It is the Fund’s policy to obtain additional collateral from or return excess collateral to the borrower by the end of the next business day, following the valuation date of the securities loaned. Therefore, the value of the collateral held may be temporarily less than the value of the securities on loan. Lending securities entails a risk of loss to the Fund if, and to the extent that, the market value of the securities loaned were to increase and the borrower did not increase the collateral accordingly, and the borrower failed to return the securities. Upon the failure of the borrower to return the securities, collateral may be liquidated and the securities may be purchased on the open market to replace the loaned securities. The Fund could experience delays and costs in gaining access to the collateral. The Fund bears the risk of any deficiency in the amount of the collateral available for return to the borrower due to any loss on the collateral invested. Dividends received on cash collateral investments for securities lending transactions, which are net of compensation to counterparties, is included in Dividends from affiliated money market funds on the Statement of Operations. The aggregate value of securities out on loan is shown as a footnote on the Statement of Assets and Liabilities, if any. |
| J. | Foreign Currency Translations — Foreign currency is valued at the close of the NYSE based on quotations posted by banks and major currency dealers. Portfolio securities and other assets and liabilities denominated in foreign currencies are translated into U.S. dollar amounts at date of valuation. Purchases and sales of portfolio securities (net of foreign taxes withheld on disposition) and income items denominated in foreign currencies are translated into U.S. dollar amounts on the respective dates of such transactions. The Fund does not separately account for the portion of the results of operations resulting from changes in foreign exchange rates on investments and the fluctuations arising from changes in market prices of securities held. The combined results of changes in foreign exchange rates and the fluctuation of market prices on investments (net of estimated foreign tax withholding) are included with the net realized and unrealized gain or loss from investments in the Statement of Operations. Reported net realized foreign currency gains or losses arise from (1) sales of foreign currencies, (2) currency gains or losses realized between the trade and settlement dates on securities transactions, and (3) the difference between the amounts of dividends, interest, and foreign withholding taxes recorded on the Fund’s books and the U.S. dollar equivalent of the amounts actually received or paid. Net unrealized foreign currency gains and losses arise from changes in the fair values of assets and liabilities, other than investments in securities at fiscal period end, resulting from changes in exchange rates. |
The Fund may invest in foreign securities which may be subject to foreign taxes on income, gains on investments or currency repatriation, a portion of which may be recoverable.
| K. | Forward Foreign Currency Contracts — The Fund may enter into forward foreign currency contracts to manage or minimize currency or exchange rate risk. The Fund may also enter into forward foreign currency contracts for the purchase or sale of a security denominated in a |
16 Invesco Small Cap Growth Fund
| foreign currency in order to “lock in” the U.S. dollar price of that security. A forward foreign currency contract is an obligation to purchase or sell a specific currency for an agreed-upon price at a future date. The use of forward foreign currency contracts does not eliminate fluctuations in the price of the underlying securities the Fund owns or intends to acquire but establishes a rate of exchange in advance. Fluctuations in the value of these contracts are measured by the difference in the contract date and reporting date exchange rates and are recorded as unrealized appreciation (depreciation) until the contracts are closed. When the contracts are closed, realized gains (losses) are recorded. Realized and unrealized gains (losses) on the contracts are included in the Statement of Operations. The primary risks associated with forward foreign currency contracts include failure of the counterparty to meet the terms of the contract and the value of the foreign currency changing unfavorably. These risks may be in excess of the amounts reflected in the Statement of Assets and Liabilities. |
NOTE 2—Advisory Fees and Other Fees Paid to Affiliates
The Trust has entered into a master investment advisory agreement with Invesco Advisers, Inc. (the “Adviser” or “Invesco”). Under the terms of the investment advisory agreement, the Fund pays an advisory fee to the Adviser based on the annual rate of the Fund’s average daily net assets as follows:
| Average Daily Net Assets | Rate | |||||
First $500 million | 0 | .725% | ||||
Next $500 million | 0 | .70% | ||||
Next $500 million | 0 | .675% | ||||
Over $1.5 billion | 0 | .65% | ||||
Under the terms of a master sub-advisory agreement between the Adviser and each of Invesco Asset Management Deutschland GmbH, Invesco Asset Management Limited, Invesco Asset Management (Japan) Limited, Invesco Australia Limited, Invesco Hong Kong Limited, Invesco Senior Secured Management, Inc. and Invesco Canada Ltd. (collectively, the “Affiliated Sub-Advisers”) the Adviser, not the Fund, may pay 40% of the fees paid to the Adviser to any such Affiliated Sub-Adviser(s) that provide(s) discretionary investment management services to the Fund based on the percentage of assets allocated to such Sub-Adviser(s).
The Adviser has contractually agreed, through at least June 30, 2014, to waive advisory fees and/or reimburse expenses of all shares to the extent necessary to limit total annual fund operating expenses after fee waiver and/or expense reimbursement (excluding certain items discussed below) of Class A, Class B, Class C, Class R, Class Y, Investor Class, Class R5 and Class R6 shares to 2.00%, 2.75%, 2.75%, 2.25%, 1.75%, 2.00%, 1.75% and 1.75%, respectively, of average daily net assets. In determining the Adviser’s obligation to waive advisory fees and/or reimburse expenses, the following expenses are not taken into account, and could cause the total annual fund operating expenses after fee waiver and/or expense reimbursement to exceed the numbers reflected above: (1) interest; (2) taxes; (3) dividend expense on short sales; (4) extraordinary or non-routine items, including litigation expenses; and (5) expenses that the Fund has incurred but did not actually pay because of an expense offset arrangement. Unless Invesco continues the fee waiver agreement, it will terminate on June 30, 2014. The fee waiver agreement cannot be terminated during its term. The Adviser did not waive fees and/or reimburse expenses during the period under this expense limitation.
Further, the Adviser has contractually agreed, through at least April 30, 2015, to waive the advisory fee payable by the Fund in an amount equal to 100% of the net advisory fees the Adviser receives from the affiliated money market funds on investments by the Fund of uninvested cash (excluding investments of cash collateral from securities lending) in such affiliated money market funds.
For the year ended December 31, 2013, the Adviser waived advisory fees of $43,302.
The Trust has entered into a master administrative services agreement with Invesco pursuant to which the Fund has agreed to pay Invesco for certain administrative costs incurred in providing accounting services to the Fund. For the year ended December 31, 2013, expenses incurred under the agreement are shown in the Statement of Operations as Administrative services fees.
The Trust has entered into a transfer agency and service agreement with Invesco Investment Services, Inc. (“IIS”) pursuant to which the Fund has agreed to pay IIS a fee for providing transfer agency and shareholder services to the Fund and reimburse IIS for certain expenses incurred by IIS in the course of providing such services. IIS may make payments to intermediaries that provide omnibus account services, sub-accounting services and/or networking services. All fees payable by IIS to intermediaries that provide omnibus account services or sub-accounting are charged back to the Fund, subject to certain limitations approved by the Trust’s Board of Trustees. For the year ended December 31, 2013, expenses incurred under the agreement are shown in the Statement of Operations as Transfer agent fees.
The Trust has entered into master distribution agreements with Invesco Distributors, Inc. (“IDI”) to serve as the distributor for the Class A, Class B, Class C, Class R, Class Y, Investor Class, Class R5 and Class R6 shares of the Fund. The Trust has adopted plans pursuant to Rule 12b-1 under the 1940 Act with respect to the Fund’s Class A, Class B, Class C, Class R and Investor Class shares (collectively, the “Plans”). The Fund, pursuant to the Plans, pays IDI compensation at the annual rate of 0.25% of the Fund’s average daily net assets of Class A shares, 1.00% of the average daily net assets of Class B and Class C shares and 0.50% of the average daily net assets of Class R shares. The Fund, pursuant to the Investor Class Plan, reimburses IDI for its allocated share of expenses incurred pursuant to the Investor Class Plan for the period, up to a maximum annual rate of 0.25% of the average daily net assets of Investor Class shares. Of the Plan payments, up to 0.25% of the average daily net assets of each class of shares may be paid to furnish continuing personal shareholder services to customers who purchase and own shares of such classes. Any amounts not paid as a service fee under the Plans would constitute an asset-based sales charge. Rules of the Financial Industry Regulatory Authority (“FINRA”) impose a cap on the total sales charges, including asset-based sales charges, that may be paid by any class of shares of the Fund. For the year ended December 31, 2013, expenses incurred under the Plans are shown in the Statement of Operations as Distribution fees.
Front-end sales commissions and CDSC (collectively, the “sales charges”) are not recorded as expenses of the Fund. Front-end sales commissions are deducted from proceeds from the sales of Fund shares prior to investment in Class A shares of the Fund. CDSC are deducted from redemption proceeds prior to remittance to the shareholder. During the year ended December 31, 2013, IDI advised the Fund that IDI retained $7,609 in front-end sales commissions from the sale of Class A shares and $19, $3,451 and $506 from Class A, Class B and Class C shares, respectively, for CDSC imposed on redemptions by shareholders.
Certain officers and trustees of the Trust are officers and directors of the Adviser, IIS and/or IDI.
17 Invesco Small Cap Growth Fund
NOTE 3—Additional Valuation Information
GAAP defines fair value as the price that would be received to sell an asset or paid to transfer a liability in an orderly transaction between market participants at the measurement date, under current market conditions. GAAP establishes a hierarchy that prioritizes the inputs to valuation methods, giving the highest priority to readily available unadjusted quoted prices in an active market for identical assets (Level 1) and the lowest priority to significant unobservable inputs (Level 3), generally when market prices are not readily available or are unreliable. Based on the valuation inputs, the securities or other investments are tiered into one of three levels. Changes in valuation methods may result in transfers in or out of an investment’s assigned level:
| Level 1 — | Prices are determined using quoted prices in an active market for identical assets. |
| Level 2 — | Prices are determined using other significant observable inputs. Observable inputs are inputs that other market participants may use in pricing a security. These may include quoted prices for similar securities, interest rates, prepayment speeds, credit risk, yield curves, loss severities, default rates, discount rates, volatilities and others. |
| Level 3 — | Prices are determined using significant unobservable inputs. In situations where quoted prices or observable inputs are unavailable (for example, when there is little or no market activity for an investment at the end of the period), unobservable inputs may be used. Unobservable inputs reflect the Fund’s own assumptions about the factors market participants would use in determining fair value of the securities or instruments and would be based on the best available information. |
As of December 31, 2013, all of the securities in this Fund were valued based on Level 1 inputs (see the Schedule of Investments for security categories). The level assigned to the securities valuations may not be an indication of the risk or liquidity associated with investing in those securities. Because of the inherent uncertainties of valuation, the values reflected in the financial statements may materially differ from the value received upon actual sale of those investments.
NOTE 4—Security Transactions with Affiliated Funds
The Fund is permitted to purchase or sell securities from or to certain other Invesco Funds under specified conditions outlined in procedures adopted by the Board of Trustees of the Trust. The procedures have been designed to ensure that any purchase or sale of securities by the Fund from or to another fund or portfolio that is or could be considered an affiliate by virtue of having a common investment adviser (or affiliated investment advisers), common Trustees and/or common officers complies with Rule 17a-7 of the 1940 Act. Further, as defined under the procedures, each transaction is effected at the current market price. Pursuant to these procedures, for the year ended December 31, 2013, the Fund engaged in securities purchases of $34,504,503 and securities sales of $52,810,113, which resulted in net realized gains of $12,248,817.
NOTE 5—Expense Offset Arrangement(s)
The expense offset arrangement is comprised of transfer agency credits which result from balances in demand deposit accounts used by the transfer agent for clearing shareholder transactions. For the year ended December 31, 2013, the Fund received credits from this arrangement, which resulted in the reduction of the Fund’s total expenses of $2,130.
NOTE 6—Trustees’ and Officers’ Fees and Benefits
Trustees’ and Officers’ Fees and Benefits include amounts accrued by the Fund to pay remuneration to certain Trustees and Officers of the Fund. Trustees have the option to defer compensation payable by the Fund, and Trustees’ and Officers’ Fees and Benefits also include amounts accrued by the Fund to fund such deferred compensation amounts. Those Trustees who defer compensation have the option to select various Invesco Funds in which their deferral accounts shall be deemed to be invested. Finally, certain current Trustees were eligible to participate in a retirement plan that provided for benefits to be paid upon retirement to Trustees over a period of time based on the number of years of service. The Fund may have certain former Trustees who also participate in a retirement plan and receive benefits under such plan. Trustees’ and Officers’ Fees and Benefits include amounts accrued by the Fund to fund such retirement benefits. Obligations under the deferred compensation and retirement plans represent unsecured claims against the general assets of the Fund.
NOTE 7—Cash Balances
The Fund is permitted to temporarily carry a negative or overdrawn balance in its account with State Street Bank and Trust Company, the custodian bank. Such balances, if any at period end, are shown in the Statement of Assets and Liabilities under the payable caption Amount due custodian. To compensate the custodian bank for such overdrafts, the overdrawn Fund may either (1) leave funds as a compensating balance in the account so the custodian bank can be compensated by earning the additional interest; or (2) compensate by paying the custodian bank at a rate agreed upon by the custodian bank and Invesco, not to exceed the contractually agreed upon rate.
18 Invesco Small Cap Growth Fund
NOTE 8—Distributions to Shareholders and Tax Components of Net Assets
Tax Character of Distributions to Shareholders Paid During the Years Ended December 31, 2013 and 2012:
| 2013 | 2012 | |||||||
Ordinary income | $ | 22,557,611 | $ | 19,847,599 | ||||
Long-term capital gain | 98,957,603 | 125,947,996 | ||||||
Total distributions | $ | 121,515,214 | $ | 145,795,595 | ||||
Tax Components of Net Assets at Period-End:
| 2013 | ||||
Undistributed ordinary income | $ | 56,241 | ||
Undistributed long-term gain | 17,270,214 | |||
Net unrealized appreciation — investments | 994,519,485 | |||
Temporary book/tax differences | (363,733 | ) | ||
Shares of beneficial interest | 1,331,684,599 | |||
Total net assets | $ | 2,343,166,806 | ||
The difference between book-basis and tax-basis unrealized appreciation (depreciation) is due to differences in the timing of recognition of gains and losses on investments for tax and book purposes. The Fund’s net unrealized appreciation difference is attributable primarily to wash sales.
The temporary book/tax differences are a result of timing differences between book and tax recognition of income and/or expenses. The Fund’s temporary book/tax differences are the result of the trustee deferral of compensation and retirement plan benefits.
Capital loss carryforward is calculated and reported as of a specific date. Results of transactions and other activity after that date may affect the amount of capital loss carryforward actually available for the Fund to utilize. Capital losses generated in years beginning after December 22, 2010 can be carried forward for an unlimited period, whereas previous losses expire in 8 tax years. Capital losses with an expiration period may not be used to offset capital gains until all net capital losses without an expiration date have been utilized. Capital loss carryforwards with no expiration date will retain their character as either short-term or long-term capital losses instead of as short-term capital losses as under prior law. The ability to utilize capital loss carryforward in the future may be limited under the Internal Revenue Code and related regulations based on the results of future transactions.
The Fund does not have a capital loss carryforward as of December 31, 2013.
NOTE 9—Investment Securities
The aggregate amount of investment securities (other than short-term securities, U.S. Treasury obligations and money market funds, if any) purchased and sold by the Fund during the year ended December 31, 2013 was $380,775,516 and $498,390,666, respectively. Cost of investments on a tax basis includes the adjustments for financial reporting purposes as of the most recently completed federal income tax reporting period-end.
| Unrealized Appreciation (Depreciation) of Investment Securities on a Tax Basis | ||||
Aggregate unrealized appreciation of investment securities | $ | 1,006,425,576 | ||
Aggregate unrealized (depreciation) of investment securities | (11,906,091 | ) | ||
Net unrealized appreciation of investment securities | $ | 994,519,485 | ||
Cost of investments for tax purposes is $1,506,327,649.
NOTE 10—Reclassification of Permanent Differences
Primarily as a result of differing book/tax treatment of passive foreign investment companies and net operating losses, on December 31, 2013, undistributed net investment income (loss) was increased by $7,979,910, undistributed net realized gain was decreased by $7,970,693 and shares of beneficial interest was decreased by $9,217. This reclassification had no effect on the net assets of the Fund.
19 Invesco Small Cap Growth Fund
NOTE 11—Share Information
| Summary of Share Activity | ||||||||||||||||
| Years ended December 31, | ||||||||||||||||
| 2013(a) | 2012 | |||||||||||||||
| Shares | Amount | Shares | Amount | |||||||||||||
Sold: | ||||||||||||||||
Class A | 4,961,797 | $ | 176,236,513 | 3,909,047 | $ | 119,656,929 | ||||||||||
Class B | 8,085 | 241,333 | 9,769 | 254,570 | ||||||||||||
Class C | 66,257 | 1,931,678 | 67,382 | 1,749,224 | ||||||||||||
Class R | 985,949 | 34,141,640 | 1,195,764 | 35,244,470 | ||||||||||||
Class Y | 872,999 | 31,874,733 | 892,483 | 26,947,342 | ||||||||||||
Investor Class | 1,133,772 | 41,267,610 | 906,168 | 28,664,060 | ||||||||||||
Class R5 | 4,792,353 | 178,660,210 | 6,710,902 | 219,364,877 | ||||||||||||
Class R6(b) | 2,860,247 | 107,479,821 | 293 | 10,000 | ||||||||||||
Issued as reinvestment of dividends: | ||||||||||||||||
Class A | 1,325,013 | 50,204,805 | 2,223,313 | 65,209,759 | ||||||||||||
Class B | 10,957 | 338,224 | 23,353 | 568,885 | ||||||||||||
Class C | 43,878 | 1,352,764 | 70,751 | 1,721,373 | ||||||||||||
Class R | 158,194 | 5,761,415 | 271,196 | 7,677,553 | ||||||||||||
Class Y | 95,473 | 3,663,312 | 35,219 | 1,044,246 | ||||||||||||
Investor Class | 357,615 | 13,993,469 | 588,161 | 17,780,113 | ||||||||||||
Class R5 | 949,647 | 38,479,691 | 1,547,474 | 48,281,192 | ||||||||||||
Class R6 | 121,073 | 4,908,298 | — | — | ||||||||||||
Automatic conversion of Class B shares to Class A shares: | ||||||||||||||||
Class A | 41,095 | 1,447,293 | 67,972 | 2,097,627 | ||||||||||||
Class B | (49,721 | ) | (1,447,293 | ) | (80,313 | ) | (2,097,627 | ) | ||||||||
Reacquired: | ||||||||||||||||
Class A | (7,759,244 | ) | (277,338,554 | ) | (10,579,510 | ) | (325,993,434 | ) | ||||||||
Class B | (33,031 | ) | (966,228 | ) | (44,311 | ) | (1,157,507 | ) | ||||||||
Class C | (144,668 | ) | (4,215,168 | ) | (186,106 | ) | (4,853,636 | ) | ||||||||
Class R | (1,364,659 | ) | (46,165,584 | ) | (1,071,663 | ) | (31,835,565 | ) | ||||||||
Class Y | (292,245 | ) | (10,757,738 | ) | (76,666 | ) | (2,378,202 | ) | ||||||||
Investor Class | (1,399,378 | ) | (51,361,452 | ) | (2,057,503 | ) | (64,499,451 | ) | ||||||||
Class R5 | (6,829,713 | ) | (255,359,197 | ) | (5,938,231 | ) | (191,944,355 | ) | ||||||||
Class R6 | (234,362 | ) | (9,502,743 | ) | — | — | ||||||||||
Net increase (decrease) in share activity | 677,383 | $ | 34,868,852 | (1,515,056 | ) | $ | (48,487,557 | ) | ||||||||
| (a) | There are entities that are record owners of more than 5% of the outstanding shares of the Fund and in the aggregate own 32% of the outstanding shares of the Fund. IDI has an agreement with these entities to sell Fund shares. The Fund, Invesco and/or Invesco affiliates may make payments to these entities, which are considered to be related to the Fund, for providing services to the Fund, Invesco and/or Invesco affiliates including but not limited to services such as securities brokerage, distribution, third party record keeping and account servicing. The Fund has no knowledge as to whether all or any portion of the shares owned of record by these entities are also owned beneficially. |
| (b) | Commencement date September 24, 2012. |
20 Invesco Small Cap Growth Fund
NOTE 12—Financial Highlights
The following schedule presents financial highlights for a share of the Fund outstanding throughout the periods indicated.
| Net asset value, beginning of period | Net (loss)(a) | Net gains (losses) on securities (both realized and unrealized) | Total from investment operations | Dividends from net investment income | Distributions from net realized gains | Total distributions | Net asset value, end of period | Total return(b) | Net assets, end of period (000’s omitted) | Ratio of expenses to average net assets with fee waivers and/or expenses absorbed | Ratio of expenses to average net assets without fee waivers and/or expenses absorbed | Ratio of net investment income (loss) to average net assets | Portfolio turnover(c) | |||||||||||||||||||||||||||||||||||||||||||
Class A |
| |||||||||||||||||||||||||||||||||||||||||||||||||||||||
Year ended 12/31/13 | $ | 30.00 | $ | (0.15 | ) | $ | 12.02 | $ | 11.87 | $ | (0.02 | ) | $ | (2.17 | ) | $ | (2.19 | ) | $ | 39.68 | 39.90 | % | $ | 957,432 | 1.21 | %(d) | 1.21 | %(d) | (0.41 | )%(d) | 19 | % | ||||||||||||||||||||||||
Year ended 12/31/12 | 27.71 | 0.01 | (e) | 5.01 | 5.02 | — | (2.73 | ) | (2.73 | ) | 30.00 | 18.35 | 766,787 | 1.23 | 1.23 | 0.04 | (e) | 24 | ||||||||||||||||||||||||||||||||||||||
Year ended 12/31/11 | 28.59 | (0.19 | ) | (0.17 | ) | (0.36 | ) | — | (0.52 | ) | (0.52 | ) | 27.71 | (1.27 | ) | 829,696 | 1.27 | 1.27 | (0.65 | ) | 38 | |||||||||||||||||||||||||||||||||||
Year ended 12/31/10 | 22.64 | (0.15 | ) | 6.10 | 5.95 | — | — | — | 28.59 | 26.28 | 933,268 | 1.25 | 1.25 | (0.62 | ) | 38 | ||||||||||||||||||||||||||||||||||||||||
Year ended 12/31/09 | 16.83 | (0.05 | ) | 5.86 | 5.81 | — | — | — | 22.64 | 34.52 | 777,780 | 1.31 | 1.31 | (0.25 | ) | 36 | ||||||||||||||||||||||||||||||||||||||||
Class B |
| |||||||||||||||||||||||||||||||||||||||||||||||||||||||
Year ended 12/31/13 | 24.90 | (0.34 | ) | 9.92 | 9.58 | — | (2.17 | ) | (2.17 | ) | 32.31 | 38.87 | 5,360 | 1.96 | (d) | 1.96 | (d) | (1.16 | )(d) | 19 | ||||||||||||||||||||||||||||||||||||
Year ended 12/31/12 | 23.58 | (0.18 | )(e) | 4.23 | 4.05 | — | (2.73 | ) | (2.73 | ) | 24.90 | 17.44 | 5,717 | 1.98 | 1.98 | (0.71 | )(e) | 24 | ||||||||||||||||||||||||||||||||||||||
Year ended 12/31/11 | 24.59 | (0.36 | ) | (0.13 | ) | (0.49 | ) | — | (0.52 | ) | (0.52 | ) | 23.58 | (2.01 | ) | 7,572 | 2.02 | 2.02 | (1.40 | ) | 38 | |||||||||||||||||||||||||||||||||||
Year ended 12/31/10 | 19.62 | (0.28 | ) | 5.25 | 4.97 | — | — | — | 24.59 | 25.33 | 12,195 | 2.00 | 2.00 | (1.37 | ) | 38 | ||||||||||||||||||||||||||||||||||||||||
Year ended 12/31/09 | 14.70 | (0.16 | ) | 5.08 | 4.92 | — | — | — | 19.62 | 33.47 | 21,853 | 2.06 | 2.06 | (1.00 | ) | 36 | ||||||||||||||||||||||||||||||||||||||||
Class C |
| |||||||||||||||||||||||||||||||||||||||||||||||||||||||
Year ended 12/31/13 | 24.87 | (0.34 | ) | 9.91 | 9.57 | — | (2.17 | ) | (2.17 | ) | 32.27 | 38.88 | 21,794 | 1.96 | (d) | 1.96 | (d) | (1.16 | )(d) | 19 | ||||||||||||||||||||||||||||||||||||
Year ended 12/31/12 | 23.55 | (0.18 | )(e) | 4.23 | 4.05 | — | (2.73 | ) | (2.73 | ) | 24.87 | 17.46 | 17,657 | 1.98 | 1.98 | (0.71 | )(e) | 24 | ||||||||||||||||||||||||||||||||||||||
Year ended 12/31/11 | 24.56 | (0.36 | ) | (0.13 | ) | (0.49 | ) | — | (0.52 | ) | (0.52 | ) | 23.55 | (2.01 | ) | 17,851 | 2.02 | 2.02 | (1.40 | ) | 38 | |||||||||||||||||||||||||||||||||||
Year ended 12/31/10 | 19.59 | (0.28 | ) | 5.25 | 4.97 | — | — | — | 24.56 | 25.37 | 21,201 | 2.00 | 2.00 | (1.37 | ) | 38 | ||||||||||||||||||||||||||||||||||||||||
Year ended 12/31/09 | 14.69 | (0.16 | ) | 5.06 | 4.90 | — | — | — | 19.59 | 33.36 | 18,541 | 2.06 | 2.06 | (1.00 | ) | 36 | ||||||||||||||||||||||||||||||||||||||||
Class R |
| |||||||||||||||||||||||||||||||||||||||||||||||||||||||
Year ended 12/31/13 | 28.95 | (0.23 | ) | 11.58 | 11.35 | — | (2.17 | ) | (2.17 | ) | 38.13 | 39.55 | 106,983 | 1.46 | (d) | 1.46 | (d) | (0.66 | )(d) | 19 | ||||||||||||||||||||||||||||||||||||
Year ended 12/31/12 | 26.89 | (0.06 | )(e) | 4.85 | 4.79 | — | (2.73 | ) | (2.73 | ) | 28.95 | 18.05 | 87,606 | 1.48 | 1.48 | (0.21 | )(e) | 24 | ||||||||||||||||||||||||||||||||||||||
Year ended 12/31/11 | 27.83 | (0.26 | ) | (0.16 | ) | (0.42 | ) | — | (0.52 | ) | (0.52 | ) | 26.89 | (1.52 | ) | 70,749 | 1.52 | 1.52 | (0.90 | ) | 38 | |||||||||||||||||||||||||||||||||||
Year ended 12/31/10 | 22.09 | (0.20 | ) | 5.94 | 5.74 | — | — | — | 27.83 | 25.98 | 67,464 | 1.50 | 1.50 | (0.87 | ) | 38 | ||||||||||||||||||||||||||||||||||||||||
Year ended 12/31/09 | 16.47 | (0.09 | ) | 5.71 | 5.62 | — | — | — | 22.09 | 34.12 | 43,786 | 1.56 | 1.56 | (0.50 | ) | 36 | ||||||||||||||||||||||||||||||||||||||||
Class Y |
| |||||||||||||||||||||||||||||||||||||||||||||||||||||||
Year ended 12/31/13 | 30.33 | (0.06 | ) | 12.16 | 12.10 | (0.08 | ) | (2.17 | ) | (2.25 | ) | 40.18 | 40.24 | 73,035 | 0.96 | (d) | 0.96 | (d) | (0.16 | )(d) | 19 | |||||||||||||||||||||||||||||||||||
Year ended 12/31/12 | 27.93 | 0.09 | (e) | 5.05 | 5.14 | (0.01 | ) | (2.73 | ) | (2.74 | ) | 30.33 | 18.64 | 34,616 | 0.98 | 0.98 | 0.29 | (e) | 24 | |||||||||||||||||||||||||||||||||||||
Year ended 12/31/11 | 28.73 | (0.12 | ) | (0.16 | ) | (0.28 | ) | — | (0.52 | ) | (0.52 | ) | 27.93 | (0.99 | ) | 8,108 | 1.02 | 1.02 | (0.40 | ) | 38 | |||||||||||||||||||||||||||||||||||
Year ended 12/31/10 | 22.70 | (0.09 | ) | 6.12 | 6.03 | — | — | — | 28.73 | 26.56 | 6,245 | 1.00 | 1.00 | (0.37 | ) | 38 | ||||||||||||||||||||||||||||||||||||||||
Year ended 12/31/09 | 16.84 | 0.00 | 5.86 | 5.86 | — | — | — | 22.70 | 34.80 | 4,744 | 1.06 | 1.06 | 0.00 | 36 | ||||||||||||||||||||||||||||||||||||||||||
Investor Class |
| |||||||||||||||||||||||||||||||||||||||||||||||||||||||
Year ended 12/31/13 | 30.92 | (0.15 | ) | 12.39 | 12.24 | (0.02 | ) | (2.17 | ) | (2.19 | ) | 40.97 | 39.92 | 281,811 | 1.21 | (d) | 1.21 | (d) | (0.41 | )(d) | 19 | |||||||||||||||||||||||||||||||||||
Year ended 12/31/12 | 28.49 | 0.01 | (e) | 5.15 | 5.16 | — | (2.73 | ) | (2.73 | ) | 30.92 | 18.34 | 209,842 | 1.23 | 1.23 | 0.04 | (e) | 24 | ||||||||||||||||||||||||||||||||||||||
Year ended 12/31/11 | 29.37 | (0.20 | ) | (0.16 | ) | (0.36 | ) | — | (0.52 | ) | (0.52 | ) | 28.49 | (1.24 | ) | 209,381 | 1.27 | 1.27 | (0.65 | ) | 38 | |||||||||||||||||||||||||||||||||||
Year ended 12/31/10 | 23.26 | (0.15 | ) | 6.26 | 6.11 | — | — | — | 29.37 | 26.27 | 230,909 | 1.25 | 1.25 | (0.62 | ) | 38 | ||||||||||||||||||||||||||||||||||||||||
Year ended 12/31/09 | 17.30 | (0.05 | ) | 6.01 | 5.96 | — | — | — | 23.26 | 34.45 | 175,672 | 1.31 | 1.31 | (0.25 | ) | 36 | ||||||||||||||||||||||||||||||||||||||||
Class R5 |
| |||||||||||||||||||||||||||||||||||||||||||||||||||||||
Year ended 12/31/13 | 31.92 | (0.01 | ) | 12.82 | 12.81 | (0.12 | ) | (2.17 | ) | (2.29 | ) | 42.44 | 40.46 | 780,094 | 0.83 | (d) | 0.83 | (d) | (0.03 | )(d) | 19 | |||||||||||||||||||||||||||||||||||
Year ended 12/31/12 | 29.27 | 0.14 | (e) | 5.29 | 5.43 | (0.05 | ) | (2.73 | ) | (2.78 | ) | 31.92 | 18.77 | 621,522 | 0.83 | 0.83 | 0.44 | (e) | 24 | |||||||||||||||||||||||||||||||||||||
Year ended 12/31/11 | 30.03 | (0.06 | ) | (0.18 | ) | (0.24 | ) | — | (0.52 | ) | (0.52 | ) | 29.27 | (0.81 | ) | 501,895 | 0.83 | 0.83 | (0.21 | ) | 38 | |||||||||||||||||||||||||||||||||||
Year ended 12/31/10 | 23.68 | (0.05 | ) | 6.40 | 6.35 | — | — | — | 30.03 | 26.82 | 427,893 | 0.82 | 0.82 | (0.19 | ) | 38 | ||||||||||||||||||||||||||||||||||||||||
Year ended 12/31/09 | 17.52 | 0.04 | 6.12 | 6.16 | — | — | — | 23.68 | 35.16 | 241,589 | 0.85 | 0.85 | 0.21 | 36 | ||||||||||||||||||||||||||||||||||||||||||
Class R6 |
| |||||||||||||||||||||||||||||||||||||||||||||||||||||||
Year ended 12/31/13 | 31.92 | 0.02 | 12.81 | 12.83 | (0.12 | ) | (2.17 | ) | (2.29 | ) | 42.46 | 40.53 | 116,657 | 0.74 | (d) | 0.74 | (d) | 0.06 | (d) | 19 | ||||||||||||||||||||||||||||||||||||
Year ended 12/31/12(f) | 34.10 | 0.05 | (e) | 0.56 | 0.61 | (0.06 | ) | (2.73 | ) | (2.79 | ) | 31.92 | 1.97 | 9 | 0.75 | (g) | 0.75 | (g) | 0.52 | (e)(g) | 24 | |||||||||||||||||||||||||||||||||||
| (a) | Calculated using average shares outstanding. |
| (b) | Includes adjustments in accordance with accounting principles generally accepted in the United States of America and as such, the net asset value for financial reporting purposes and the returns based upon those net asset values may differ from the net asset value and returns for shareholder transactions. Does not include sales charges and is not annualized for periods less than one year, if applicable. |
| (c) | Portfolio turnover is calculated at the fund level and is not annualized for periods less than one year, if applicable. |
| (d) | Ratios are based on average daily net assets (000’s) of $872,892, $5,533, $19,750, $93,555, $51,059, $246,508, $707,148 and $49,045 for Class A, Class B, Class C, Class R, Class Y, Investor Class, Class R5 and Class R6 shares, respectively. |
| (e) | Net investment income (loss) per share and the ratio of net investment income (loss) to average net assets includes significant dividends received during the period. Net investment income (loss) per share and the ratio of net investment income (loss) to average net assets excluding the significant dividends are $(0.12) and (0.39)%, $(0.29) and (1.14)%, $(0.29) and (1.14)%, $(0.19) and (0.64)%, $(0.04) and (0.14)%, $(0.12) and (0.39)%, $0.01 and 0.01% and $0.01 and 0.09% for Class A, Class B, Class C, Class R, Class Y, Investor Class, Class R5 and Class R6 shares, respectively. |
| (f) | Commencement date of September 24, 2012. |
| (g) | Annualized. |
21 Invesco Small Cap Growth Fund
Report of Independent Registered Public Accounting Firm
To the Board of Trustees of AIM Funds Group (Invesco Funds Group)
and Shareholders of Invesco Small Cap Growth Fund:
In our opinion, the accompanying statement of assets and liabilities, including the schedule of investments, and the related statements of operations and of changes in net assets and the financial highlights present fairly, in all material respects, the financial position of Invesco Small Cap Growth Fund (one of the funds constituting AIM Funds Group (Invesco Funds Group), hereafter referred to as the “Fund”) at December 31, 2013, the results of its operations for the year then ended, the changes in its net assets for each of the two years in the period then ended and the financial highlights for each of the five years in the period then ended, in conformity with accounting principles generally accepted in the United States of America. These financial statements and financial highlights (hereafter referred to as “financial statements”) are the responsibility of the Fund’s management; our responsibility is to express an opinion on these financial statements based on our audits. We conducted our audits of these financial statements in accordance with the standards of the Public Company Accounting Oversight Board (United States). Those standards require that we plan and perform the audit to obtain reasonable assurance about whether the financial statements are free of material misstatement. An audit includes examining, on a test basis, evidence supporting the amounts and disclosures in the financial statements, assessing the accounting principles used and significant estimates made by management, and evaluating the overall financial statement presentation. We believe that our audits, which included confirmation of securities at December 31, 2013 by correspondence with the custodian and brokers, provide a reasonable basis for our opinion.
PRICEWATERHOUSECOOPERS LLP
February 26, 2014
Houston, Texas
22 Invesco Small Cap Growth Fund
Calculating your ongoing Fund expenses
Example
As a shareholder of the Fund, you incur two types of costs: (1) transaction costs, which may include sales charges (loads) on purchase payments or contingent deferred sales charges on redemptions, if any; and (2) ongoing costs, including management fees, distribution and/or service (12b-1) fees, and other Fund expenses. This example is intended to help you understand your ongoing costs (in dollars) of investing in the Fund and to compare these costs with ongoing costs of investing in other mutual funds. The example is based on an investment of $1,000 invested at the beginning of the period and held for the entire period July 1, 2013 through December 31, 2013.
Actual expenses
The table below provides information about actual account values and actual expenses. You may use the information in this table, together with the amount you invested, to estimate the expenses that you paid over the period. Simply divide your account value by $1,000 (for example, an $8,600 account value divided by $1,000 = 8.6), then multiply the result by the number in the table under the heading entitled “Actual Expenses Paid During Period” to estimate the expenses you paid on your account during this period.
Hypothetical example for comparison purposes
The table below also provides information about hypothetical account values and hypothetical expenses based on the Fund’s actual expense ratio and an assumed rate of return of 5% per year before expenses, which is not the Fund’s actual return.
The hypothetical account values and expenses may not be used to estimate the actual ending account balance or expenses you paid for the period. You may use this information to compare the ongoing costs of investing in the Fund and other funds. To do so, compare this 5% hypothetical example with the 5% hypothetical examples that appear in the shareholder reports of the other funds.
Please note that the expenses shown in the table are meant to highlight your ongoing costs only and do not reflect any transaction costs, such as sales charges (loads) on purchase payments or contingent deferred sales charges on redemptions, if any. Therefore, the hypothetical information is useful in comparing ongoing costs only, and will not help you determine the relative total costs of owning different funds. In addition, if these transaction costs were included, your costs would have been higher.
| Class | Beginning Account Value (07/01/13) | ACTUAL | HYPOTHETICAL (5% annual return before | Annualized | ||||||||||||||||||||
| Ending Account Value (12/31/13)1 | Expenses Paid During Period2 | Ending Account Value (12/31/13) | Expenses Paid During Period2 | |||||||||||||||||||||
| A | $ | 1,000.00 | $ | 1,216.60 | $ | 6.70 | $ | 1,019.16 | $ | 6.11 | 1.20 | % | ||||||||||||
| B | 1,000.00 | 1,211.60 | 10.87 | 1,015.38 | 9.91 | 1.95 | ||||||||||||||||||
| C | 1,000.00 | 1,211.90 | 10.87 | 1,015.38 | 9.91 | 1.95 | ||||||||||||||||||
| R | 1,000.00 | 1,214.70 | 8.09 | 1,017.90 | 7.38 | 1.45 | ||||||||||||||||||
| Y | 1,000.00 | 1,218.10 | 5.31 | 1,020.42 | 4.84 | 0.95 | ||||||||||||||||||
| Investor | 1,000.00 | 1,216.20 | 6.70 | 1,019.16 | 6.11 | 1.20 | ||||||||||||||||||
| R5 | 1,000.00 | 1,218.70 | 4.59 | 1,021.07 | 4.18 | 0.82 | ||||||||||||||||||
| R6 | 1,000.00 | 1,219.30 | 4.08 | 1,021.53 | 3.72 | 0.73 | ||||||||||||||||||
| 1 | The actual ending account value is based on the actual total return of the Fund for the period July 1, 2013 through December 31, 2013, after actual expenses and will differ from the hypothetical ending account value which is based on the Fund’s expense ratio and a hypothetical annual return of 5% before expenses. |
| 2 | Expenses are equal to the Fund’s annualized expense ratio as indicated above multiplied by the average account value over the period, multiplied by 184/365 to reflect the most recent fiscal half year. |
23 Invesco Small Cap Growth Fund
Tax Information
Form 1099-DIV, Form 1042-S and other year–end tax information provide shareholders with actual calendar year amounts that should be included in their tax returns. Shareholders should consult their tax advisors.
The following distribution information is being provided as required by the Internal Revenue Code or to meet a specific state’s requirement.
The Fund designates the following amounts or, if subsequently determined to be different, the maximum amount allowable for its fiscal year ended December 31, 2013:
Federal and State Income Tax | ||||
Long-Term Capital Gain Distributions | $ | 98,957,603 | ||
Qualified Dividend Income* | 65.50 | % | ||
Corporate Dividends Received Deduction* | 65.50 | % | ||
| * | The above percentages are based on ordinary income dividends paid to shareholders during the Fund’s fiscal year. |
Non-Resident Alien Shareholders | ||||
Qualified Short-Term Capital Gains | $ | 19,465,563 | ||
24 Invesco Small Cap Growth Fund
Trustees and Officers
The address of each trustee and officer is AIM Growth Series (Invesco Growth Series) (the “Trust”), 11 Greenway Plaza, Suite 1000, Houston, Texas 77046-1173. The trustees serve for the life of the Trust, subject to their earlier death, incapacitation, resignation, retirement or removal as more specifically provided in the Trust’s organizational documents. Each officer serves for a one year term or until their successors are elected and qualified. Column two below includes length of time served with predecessor entities, if any.
| Name, Year of Birth and Position(s) Held with the Trust | Trustee and/ or Officer Since | Principal Occupation(s) During Past 5 Years | Number of Funds in Fund Complex Overseen by Trustee | Other Directorship(s) Held by Trustee During Past 5 Years | ||||
| Interested Persons | ||||||||
| Martin L. Flanagan1 — 1960 Trustee | 2007 | Executive Director, Chief Executive Officer and President, Invesco Ltd. (ultimate parent of Invesco and a global investment management firm); Advisor to the Board, Invesco Advisers, Inc. (formerly known as Invesco Institutional (N.A.), Inc.); Trustee, The Invesco Funds; Vice Chair, Investment Company Institute; and Member of Executive Board, SMU Cox School of Business
Formerly: Chairman and Chief Executive Officer, Invesco Advisers, Inc. (registered investment adviser); Director, Chairman, Chief Executive Officer and President, IVZ Inc. (holding company), INVESCO Group Services, Inc. (service provider) and Invesco North American Holdings, Inc. (holding company); Director, Chief Executive Officer and President, Invesco Holding Company Limited (parent of Invesco and a global investment management firm); Director, Invesco Ltd.; Chairman, Investment Company Institute and President, Co-Chief Executive Officer, Co-President, Chief Operating Officer and Chief Financial Officer, Franklin Resources, Inc. (global investment management organization) | 123 | None | ||||
| Philip A. Taylor2 — 1954 Trustee, President and Principal Executive Officer | 2006 | Head of North American Retail and Senior Managing Director, Invesco Ltd.; Director, Co-Chairman, Co-President and Co-Chief Executive Officer, Invesco Advisers, Inc. (formerly known as Invesco Institutional (N.A.), Inc.) (registered investment adviser); Director, Chairman, Chief Executive Officer and President, Invesco Management Group, Inc. (formerly known as Invesco Aim Management Group, Inc.) (financial services holding company); Director and President, INVESCO Funds Group, Inc. (registered investment adviser and registered transfer agent); Director and Chairman, Invesco Investment Services, Inc. (formerly known as Invesco Aim Investment Services, Inc.) (registered transfer agent) and IVZ Distributors, Inc. (formerly known as INVESCO Distributors, Inc.) (registered broker dealer); Director, President and Chairman, Invesco Inc. (holding company) and Invesco Canada Holdings Inc. (holding company); Chief Executive Officer, Invesco Corporate Class Inc. (corporate mutual fund company) and Invesco Canada Fund Inc. (corporate mutual fund company); Director, Chairman and Chief Executive Officer, Invesco Canada Ltd. (formerly known as Invesco Trimark Ltd./Invesco Trimark Ltèe) (registered investment adviser and registered transfer agent); Trustee, President and Principal Executive Officer, The Invesco Funds (other than AIM Treasurer’s Series Trust (Invesco Treasurer’s Series Trust) and Short-Term Investments Trust); Trustee and Executive Vice President, The Invesco Funds (AIM Treasurer’s Series Trust (Invesco Treasurer’s Series Trust) and Short-Term Investments Trust only); Director, Invesco Investment Advisers LLC (formerly known as Van Kampen Asset Management); Director, Chief Executive Officer and President, Van Kampen Exchange Corp.
Formerly: Director and Chairman, Van Kampen Investor Services Inc.: Director, Chief Executive Officer and President, 1371 Preferred Inc. (holding company); and Van Kampen Investments Inc.; Director and President, AIM GP Canada Inc. (general partner for limited partnerships); and Van Kampen Advisors, Inc.; Director and Chief Executive Officer, Invesco Trimark Dealer Inc. (registered broker dealer); Director, Invesco Distributors, Inc. (formerly known as Invesco Aim Distributors, Inc.) (registered broker dealer); Manager, Invesco PowerShares Capital Management LLC; Director, Chief Executive Officer and President, Invesco Advisers, Inc.; Director, Chairman, Chief Executive Officer and President, Invesco Aim Capital Management, Inc.; President, Invesco Trimark Dealer Inc. and Invesco Trimark Ltd./Invesco Trimark Ltèe; Director and President, AIM Trimark Corporate Class Inc. and AIM Trimark Canada Fund Inc.; Senior Managing Director, Invesco Holding Company Limited; Trustee and Executive Vice President, Tax-Free Investments Trust; Director and Chairman, Fund Management Company (former registered broker dealer); President and Principal Executive Officer, The Invesco Funds (AIM Treasurer’s Series Trust (Invesco Treasurer’s Series Trust), Short-Term Investments Trust and Tax-Free Investments Trust only); President, AIM Trimark Global Fund Inc. and AIM Trimark Canada Fund Inc. | 123 | None | ||||
Wayne W. Whalen3 — 1939 Trustee | 2010 | Of Counsel, and prior to 2010, partner in the law firm of Skadden, Arps, Slate, Meagher & Flom LLP, legal counsel to certain funds in the Fund Complex | 136 | Director of the Mutual Fund Directors Forum, a nonprofit membership organization for investment directors; Chairman and Director of the Abraham Lincoln Presidential Library Foundation; and Director of the Stevenson Center for Democracy |
| 1 | Mr. Flanagan is considered an interested person of the Trust because he is an officer of the adviser to the Trust, and an officer and a director of Invesco Ltd., ultimate parent of the adviser to the Trust. |
| 2 | Mr. Taylor is considered an interested person of the Trust because he is an officer and a director of the adviser to, and a director of the principal underwriter of, the Trust. |
| 3 | Mr. Whalen is considered an “interested person” (within the meaning of Section 2(a)(19) of the 1940 Act) of certain Funds in the Invesco Fund Complex because he and his firm currently provide legal services as legal counsel to such Funds. |
T-1 Invesco Small Cap Growth Fund
Trustees and Officers—(continued)
| Name, Year of Birth and Position(s) Held with the Trust | Trustee and/ or Officer Since | Principal Occupation(s) During Past 5 Years | Number of Funds in Fund Complex Overseen by Trustee | Other Directorship(s) Held by Trustee During Past 5 Years | ||||
| Independent Trustees | ||||||||
Bruce L. Crockett — 1944 Trustee and Chair | 2001 | Chairman, Crockett Technologies Associates (technology consulting company)
Formerly: Director, Captaris (unified messaging provider); Director, President and Chief Executive Officer COMSAT Corporation; and Chairman, Board of Governors of INTELSAT (international communications company) | 123 | ACE Limited (insurance company); Investment Company Institute | ||||
David C. Arch — 1945 Trustee | 2010 | Chairman and Chief Executive Officer of Blistex Inc., (consumer health care products manufacturer)
Formerly: Member of the Heartland Alliance Advisory Board, a nonprofit organization serving human needs based in Chicago | 136 | Board member of the Illinois Manufacturers’ Association; Member of the Board of Visitors, Institute for the Humanities, University of Michigan | ||||
Frank S. Bayley — 1939 Trustee | 1985 | Retired
Formerly: Director, Badgley Funds, Inc. (registered investment company) (2 portfolios) and General Partner and Of Counsel, law firm of Baker & McKenzie, LLP | 123 | Director and Chairman, C.D. Stimson Company (a real estate investment company); Trustee and Overseer, The Curtis Institute of Music | ||||
James T. Bunch — 1942 Trustee | 2003 | Managing Member, Grumman Hill Group LLC (family office private equity management)
Formerly: Founder, Green, Manning & Bunch Ltd. (investment banking firm) (1988-2010); Executive Committee, United States Golf Association; and Director, Policy Studies, Inc. and Van Gilder Insurance Corporation | 123 | Chairman, Board of Governors, Western Golf Association; Chairman-elect, Evans Scholars Foundation; and Director, Denver Film Society | ||||
Rodney F. Dammeyer — 1940 Trustee | 2010 | Chairman of CAC, LLC, (private company offering capital investment and management advisory services)
Formerly: Prior to 2001, Managing Partner at Equity Group Corporate Investments; Prior to 1995, Chief Executive Officer of Itel Corporation (formerly Anixter International); Prior to 1985, experience includes Senior Vice President and Chief Financial Officer of Household International, Inc., Executive Vice President and Chief Financial Officer of Northwest Industries, Inc. and Partner of Arthur Andersen & Co.; From 1987 to 2010, Director/Trustee of investment companies in the Van Kampen Funds complex | 123 | Director of Quidel Corporation and Stericycle, Inc.; Prior to May 2008, Trustee of The Scripps Research Institute; Prior to February 2008, Director of Ventana Medical Systems, Inc. | ||||
Albert R. Dowden — 1941 Trustee | 2001 | Director of a number of public and private business corporations, including the Boss Group, Ltd. (private investment and management); and Reich & Tang Funds (5 portfolios) (registered investment company)
Formerly: Director, Homeowners of America Holding Corporation/Homeowners of America Insurance Company (property casualty company); Director, Continental Energy Services, LLC (oil and gas pipeline service); Director, CompuDyne Corporation (provider of product and services to the public security market) and Director, Annuity and Life Re (Holdings), Ltd. (reinsurance company); Director, President and Chief Executive Officer, Volvo Group North America, Inc.; Senior Vice President, AB Volvo; Director of various public and private corporations; Chairman, DHJ Media, Inc.; Director, Magellan Insurance Company; and Director, The Hertz Corporation, Genmar Corporation (boat manufacturer), National Media Corporation; Advisory Board of Rotary Power International (designer, manufacturer, and seller of rotary power engines); and Chairman, Cortland Trust, Inc. (registered investment company) | 123 | Director of Nature’s Sunshine Products, Inc. | ||||
Jack M. Fields — 1952 Trustee | 2001 | Chief Executive Officer, Twenty First Century Group, Inc. (government affairs company); Owner and Chief Executive Officer, Dos Angeles Ranch, L.P. (cattle, hunting, corporate entertainment); and Discovery Global Education Fund (non-profit)
Formerly: Chief Executive Officer, Texana Timber LP (sustainable forestry company); Director of Cross Timbers Quail Research Ranch (non-profit); and member of the U.S. House of Representatives | 123 | Insperity, Inc. (formerly known as Administaff) | ||||
Prema Mathai-Davis — 1950 Trustee | 2001 | Retired
Formerly: Chief Executive Officer, YWCA of the U.S.A. | 123 | None | ||||
Larry Soll — 1942 Trustee | 2003 | Retired
Formerly: Chairman, Chief Executive Officer and President, Synergen Corp. (a biotechnology company) | 123 | None | ||||
Hugo F. Sonnenschein — 1940 Trustee | 2010 | Distinguished Service Professor and President Emeritus of the University of Chicago and the Adam Smith Distinguished Service Professor in the Department of Economics at the University of Chicago
Formerly: President of the University of Chicago | 136 | Trustee of the University of Rochester and a member of its investment committee. Member of the National Academy of Sciences, the American Philosophical Society and a fellow of the American Academy of Arts and Sciences |
T-2 Invesco Small Cap Growth Fund
Trustees and Officers—(continued)
| Name, Year of Birth and Position(s) Held with the Trust | Trustee and/ or Officer Since | Principal Occupation(s) During Past 5 Years | Number of Funds in Fund Complex Overseen by Trustee | Other Directorship(s) Held by Trustee During Past 5 Years | ||||
| Independent Trustees—(continued) | ||||||||
Raymond Stickel, Jr. — 1944 Trustee | 2005 | Retired
Formerly: Director, Mainstay VP Series Funds, Inc. (25 portfolios) and Partner, Deloitte & Touche | 123 | None | ||||
| Other Officers | ||||||||
| Russell C. Burk — 1958 Senior Vice President and Senior Officer | 2005 | Senior Vice President and Senior Officer, The Invesco Funds | N/A | N/A | ||||
| John M. Zerr — 1962 Senior Vice President, Chief Legal Officer and Secretary | 2006 | Director, Senior Vice President, Secretary and General Counsel, Invesco Management Group, Inc. (formerly known as Invesco Aim Management Group, Inc.) and Van Kampen Exchange Corp.; Senior Vice President, Invesco Advisers, Inc. (formerly known as Invesco Institutional (N.A.), Inc.) (registered investment adviser); Senior Vice President and Secretary, Invesco Distributors, Inc. (formerly known as Invesco Aim Distributors, Inc.); Director, Vice President and Secretary, Invesco Investment Services, Inc. (formerly known as Invesco Aim Investment Services, Inc.) and IVZ Distributors, Inc. (formerly known as INVESCO Distributors, Inc.); Director and Vice President, INVESCO Funds Group, Inc.; Senior Vice President, Chief Legal Officer and Secretary, The Invesco Funds; Manager, Invesco PowerShares Capital Management LLC; Director, Secretary and General Counsel, Invesco Investment Advisers LLC (formerly known as Van Kampen Asset Management); Secretary and General Counsel, Invesco Capital Markets, Inc. (formerly known as Van Kampen Funds Inc.) and Chief Legal Officer, PowerShares Exchange-Traded Fund Trust, PowerShares Exchange-Traded Fund Trust II, PowerShares India Exchange-Traded Fund Trust and PowerShares Actively Managed Exchange-Traded Fund Trust
Formerly: Director and Vice President, Van Kampen Advisors Inc.; Director, Vice President, Secretary and General Counsel, Van Kampen Investor Services Inc.; Director, Invesco Distributors, Inc. (formerly known as Invesco Aim Distributors, Inc.); Director, Senior Vice President, General Counsel and Secretary, Invesco Aim Advisers, Inc. and Van Kampen Investments Inc.; Director, Vice President and Secretary, Fund Management Company; Director, Senior Vice President, Secretary, General Counsel and Vice President, Invesco Aim Capital Management, Inc.; Chief Operating Officer and General Counsel, Liberty Ridge Capital, Inc. (an investment adviser); Vice President and Secretary, PBHG Funds (an investment company) and PBHG Insurance Series Fund (an investment company); Chief Operating Officer, General Counsel and Secretary, Old Mutual Investment Partners (a broker-dealer); General Counsel and Secretary, Old Mutual Fund Services (an administrator) and Old Mutual Shareholder Services (a shareholder servicing center); Executive Vice President, General Counsel and Secretary, Old Mutual Capital, Inc. (an investment adviser); and Vice President and Secretary, Old Mutual Advisors Funds (an investment company) | N/A | N/A | ||||
| Karen Dunn Kelley — 1960 Vice President | 2004 | Senior Managing Director, Investments; Director, Co-President, Co-Chief Executive Officer, and Co-Chairman, Invesco Advisers, Inc. (formerly known as Invesco Institutional (N.A.), Inc.) (registered investment adviser); Chairman, Invesco Senior Secured Management, Inc.; Senior Vice President, Invesco Management Group, Inc. (formerly known as Invesco Aim Management Group, Inc.); Executive Vice President, Invesco Distributors, Inc. (formerly known as Invesco Aim Distributors, Inc.); Director, Invesco Mortgage Capital Inc., and Invesco Management Company Limited; Director and President, INVESCO Asset Management (Bermuda) Ltd., Vice President, The Invesco Funds (other than AIM Treasurer’s Series Trust (Invesco Treasurer’s Series Trust) and Short-Term Investments Trust); and President and Principal Executive Officer, The Invesco Funds (AIM Treasurer’s Series Trust (Invesco Treasurer’s Series Trust) and Short-Term Investments Trust only)
Formerly: Director, INVESCO Global Asset Management Limited and INVESCO Management S.A.; Senior Vice President, Van Kampen Investments Inc. and Invesco Advisers, Inc. (formerly known as Invesco Institutional (N.A.), Inc.) (registered investment adviser); Vice President, Invesco Advisers, Inc. (formerly known as Invesco Institutional (N.A.), Inc.); Director of Cash Management and Senior Vice President, Invesco Advisers, Inc. and Invesco Aim Capital Management, Inc.; President and Principal Executive Officer, Tax-Free Investments Trust; Director and President, Fund Management Company; Chief Cash Management Officer, Director of Cash Management, Senior Vice President, and Managing Director, Invesco Aim Capital Management, Inc.; Director of Cash Management, Senior Vice President, and Vice President, Invesco Advisers, Inc. and The Invesco Funds (AIM Treasurer’s Series Trust (Invesco Treasurer’s Series Trust), Short-Term Investments Trust and Tax-Free Investments Trust only) | N/A | N/A | ||||
T-3 Invesco Small Cap Growth Fund
Trustees and Officers—(continued)
| Name, Year of Birth and Position(s) Held with the Trust | Trustee and/ or Officer Since | Principal Occupation(s) During Past 5 Years | Number of Funds in Fund Complex Overseen by Trustee | Other Directorship(s) Held by Trustee During Past 5 Years | ||||
| Other Officers—(continued) | ||||||||
| Sheri Morris — 1964 Vice President, Treasurer and Principal Financial Officer | 1999 | Vice President, Treasurer and Principal Financial Officer, The Invesco Funds; Vice President, Invesco Advisers, Inc. (formerly known as Invesco Institutional (N.A.), Inc.) (registered investment adviser); and Vice President, PowerShares Exchange-Traded Fund Trust, PowerShares Exchange-Traded Fund Trust II, PowerShares India Exchange-Traded Fund Trust and PowerShares Actively Managed Exchange-Traded Fund Trust
Formerly: Vice President, Invesco Aim Advisers, Inc., Invesco Aim Capital Management, Inc. and Invesco Aim Private Asset Management, Inc.; Assistant Vice President and Assistant Treasurer, The Invesco Funds and Assistant Vice President, Invesco Advisers, Inc., Invesco Aim Capital Management, Inc. and Invesco Aim Private Asset Management, Inc.; and Treasurer, PowerShares Exchange-Traded Fund Trust, PowerShares Exchange-Traded Fund Trust II, PowerShares India Exchange-Traded Fund Trust and PowerShares Actively Managed Exchange-Traded Fund Trust | N/A | N/A | ||||
Crissie M. Wisdom — 1969 Anti-Money Laundering Compliance Officer | 2013 | Anti-Money Laundering Compliance Officer, Invesco Advisers, Inc. (formerly known as Invesco Institutional (N.A.), Inc.) (registered investment adviser), Invesco Capital Markets, Inc. (formerly known as Van Kampen Funds Inc.), Invesco Distributors, Inc., Invesco Investment Services, Inc., Invesco Management Group, Inc., Van Kampen Exchange Corp., The Invesco Funds, Invesco Funds (Chicago), and PowerShares Exchange-Traded Fund Trust, PowerShares Exchange-Traded Fund Trust II, PowerShares India Exchange-Traded Fund Trust, and PowerShares Actively Managed Exchange-Traded Fund Trust; and Fraud Prevention Manager and Controls and Risk Analysis Manager for Invesco Investment Services, Inc. | N/A | N/A | ||||
| Todd L. Spillane — 1958 Chief Compliance Officer | 2006 | Senior Vice President, Invesco Management Group, Inc. (formerly known as Invesco Aim Management Group, Inc.) and Van Kampen Exchange Corp.; Senior Vice President and Chief Compliance Officer, Invesco Advisers, Inc. (registered investment adviser) (formerly known as Invesco Institutional (N.A.), Inc.); Chief Compliance Officer, The Invesco Funds; Vice President, Invesco Distributors, Inc. (formerly known as Invesco Aim Distributors, Inc.) and Invesco Investment Services, Inc. (formerly known as Invesco Aim Investment Services, Inc.)
Formerly: Chief Compliance Officer, Invesco Funds (Chicago); Senior Vice President, Van Kampen Investments Inc.; Senior Vice President and Chief Compliance Officer, Invesco Aim Advisers, Inc. and Invesco Aim Capital Management, Inc.; Chief Compliance Officer, INVESCO Private Capital Investments, Inc. (holding company), Invesco Private Capital, Inc. (registered investment adviser), Invesco Global Asset Management (N.A.), Inc., Invesco Senior Secured Management, Inc. (registered investment adviser), Van Kampen Investor Services Inc., PowerShares Exchange-Traded Fund Trust, PowerShares Exchange-Traded Fund Trust II, PowerShares India Exchange-Traded Fund Trust and PowerShares Actively Managed Exchange-Traded Fund Trust; and Vice President, Invesco Aim Capital Management, Inc. and Fund Management Company | N/A | N/A |
The Statement of Additional Information of the Trust includes additional information about the Fund’s Trustees and is available upon request, without charge, by calling 1.800.959.4246. Please refer to the Fund’s prospectus for information on the Fund’s sub-advisers.
Office of the Fund 11 Greenway Plaza, Suite 1000 Houston, TX 77046-1173 | Investment Adviser Invesco Advisers, Inc. 1555 Peachtree Street, N.E. Atlanta, GA 30309 | Distributor Invesco Distributors, Inc. 11 Greenway Plaza, Suite 1000 Houston, TX 77046-1173 | Auditors PricewaterhouseCoopers LLP 1201 Louisiana Street, Suite 2900 Houston, TX 77002-5678 | |||
Counsel to the Fund Stradley Ronon Stevens & Young, LLP 2005 Market Street, Suite 2600 Philadelphia, PA 19103-7018 | Counsel to the Independent Trustees Goodwin Procter LLP 901 New York Avenue, N.W. Washington, D.C. 20001 | Transfer Agent Invesco Investment Services, Inc. 11 Greenway Plaza, Suite 1000 Houston, TX 77046-1173 | Custodian State Street Bank and Trust Company 225 Franklin Street Boston, MA 02110-2801 | |||
T-4 Invesco Small Cap Growth Fund

Invesco mailing information
Send general correspondence to Invesco Investment Services, Inc., P.O. Box 219078, Kansas City, MO 64121-9078.
Invesco privacy policy
You share personal and financial information with us that is necessary for your transactions and your account records. We take very seriously the obligation to keep that information confidential and private.
Invesco collects nonpublic personal information about you from account applications or other forms you complete and from your transactions with us or our affiliates. We do not disclose information about you or our former customers to service providers or other third parties except to the extent necessary to service your account and in other limited circumstances as permitted by law. For example, we use this information to facilitate the delivery of transaction confirmations, financial reports, prospectuses and tax forms.
Even within Invesco, only people involved in the servicing of your accounts and compliance monitoring have access to your information. To ensure the highest level of confidentiality and security, Invesco maintains physical, electronic and procedural safeguards that meet or exceed federal standards. Special measures, such as data encryption and authentication, apply to your communications with us on our website. More detail is available to you at invesco.com/privacy.
Important notice regarding delivery of security holder documents
To reduce Fund expenses, only one copy of most shareholder documents may be mailed to shareholders with multiple accounts at the same address (Householding). Mailing of your shareholder documents may be householded indefinitely unless you instruct us otherwise. If you do not want the mailing of these documents to be combined with those for other members of your household, please contact Invesco Investment Services, Inc. at 800 959 4246 or contact your financial institution. We will begin sending you individual copies for each account within 30 days after receiving your request.
Fund holdings and proxy voting information
The Fund provides a complete list of its holdings four times in each fiscal year, at the quarter ends. For the second and fourth quarters, the lists appear in the Fund’s semiannual and annual reports to shareholders. For the first and third quarters, the Fund files the lists with the Securities and Exchange Commission (SEC) on Form N-Q. The most recent list of portfolio holdings is available at invesco.com/completeqtrholdings. Shareholders can also look up the Fund’s Forms N-Q on the SEC website at sec.gov. Copies of the Fund’s Forms N-Q may be reviewed and copied at the SEC Public Reference Room in Washington, D.C. You can obtain information on the operation of the Public Reference Room, including information about duplicating fee charges, by calling 202 551 8090 or 800 732 0330, or by electronic request at the following email address: publicinfo@sec.gov. The SEC file numbers for the Fund are shown below.
A description of the policies and procedures that the Fund uses to determine how to vote proxies relating to portfolio securities is available without charge, upon request, from our Client Services department at 800 959 4246 or at invesco.com/proxyguidelines. The information is also available on the SEC website, sec.gov.
Information regarding how the Fund voted proxies related to its portfolio securities during the most recent 12-month period ended June 30 is available at invesco.com/proxysearch. The information is also available on the SEC website, sec.gov. Invesco Advisers, Inc. is an investment adviser; it provides investment advisory services to individual and institutional clients and does not sell securities. Invesco Distributors, Inc. is the US distributor for Invesco Ltd.’s retail mutual funds, exchange-traded funds and institutional money market funds. Both are wholly owned, indirect subsidiaries of Invesco Ltd. |  | |||
| SEC file numbers: 811-02699 and 002-57526 SCG-AR-1 Invesco Distributors, Inc. | ||||
|
| |||||
Annual Report to Shareholders
| December 31, 2013
| |||||
Invesco U.S. Mortgage Fund | ||||||
Nasdaq: A: VKMGX n B: VUSBX n C: VUSCX n Y: VUSIX n R5: VUSJX | ||||||


Letters to Shareholders
Philip Taylor | Dear Shareholders: This annual report includes information about your Invesco Fund, including performance data and a complete list of its investments as of the close of the reporting period. Inside, your Fund’s portfolio managers discuss how they managed your Fund and the factors that affected its performance during the reporting period. I hope you find this report of interest. During the year covered by this report, major US and global equity market indexes hit multiyear or all-time highs1, the result of a strengthening US economy and relatively healthy corporate profits. Also helping equities was a return of individual investors to stocks – due in part to monetary policies that kept interest rates (and yields on fixed income securities) low. At the end of the reporting period, amid widespread signs of an improving economy, the US Federal Reserve announced that it would begin a long-anticipated reduction in its | ||||||||
| bond-buying program in January 2014; its decision was widely expected and investors reacted positively to the announcement. Despite some mid-summer volatility, overseas equity market indexes in developed and emerging nations generally rose during the year. | |||||||||

Extended periods of strong market performance such as we saw throughout 2013 can lull some investors into a false sense of security – just as extended periods of volatility or market weakness can discourage some investors from undertaking disciplined, long-term investment plans. That’s why Invesco believes it can often be helpful to work with a skilled and trusted financial adviser; he or she can emphasize the importance of adhering to an investment plan designed to achieve long-term goals like a first home, a college education for a child or a comfortable retirement. A financial adviser who is familiar with your individual financial situation, investment goals and risk tolerance can be an invaluable partner as you work toward your financial goals. He or she can provide insight and perspective when markets are volatile; encouragement and reassurance when times are uncertain; and advice and guidance when your financial situation or investment goals change.
Timely information when and where you want it
Invesco’s efforts to help investors achieve their financial objectives include providing individual investors and financial professionals with timely information about the markets, the economy and investing – whenever and wherever they want it.
Our website, invesco.com/us, offers a wide range of market insights and investment perspectives. On the website, you’ll find detailed information about our funds, including prices, performance, holdings and portfolio manager commentaries. You can access information about your individual Invesco account whenever it’s convenient for you; just complete a simple, secure online registration. Use the “Login” box on our home page to get started.
Using Invesco’s mobile app for iPad® (available free from the App StoreSM) allows you to obtain the same detailed information about your funds and the same investment insights from our investment leaders, market strategists, economists and retirement experts on the go. You also can watch portfolio manager videos and have instant access to Invesco news and updates wherever you may be.
In addition to the resources accessible on our website and through our mobile app, you can obtain timely updates to help you stay informed about the markets, the economy and investing by connecting with Invesco on Twitter, LinkedIn or Facebook. You can access our blog at blog.invesco.us.com or by visiting the “Intentional Investing Forum” on our home page. Our goal is to provide you the information you want, when and where you want it.
Have questions?
For questions about your account, feel free to contact an Invesco client services representative at 800 959 4246. For Invesco-related questions or comments, please email me directly at phil@invesco.com.
All of us at Invesco look forward to serving your investment management needs for many years to come. Thank you for investing with us.
Sincerely,

Philip Taylor
Senior Managing Director, Invesco Ltd.
1 Source: Reuters
iPad is a trademark of Apple Inc., registered in the US and other countries. App Store is a service mark of Apple Inc.
2 Invesco U.S. Mortgage Fund
Bruce Crockett | Dear Fellow Shareholders: Many investors enjoyed positive returns on their investments in 2013. While some sectors of the market struggled, many major equity market indexes in the US and around the globe rose last year. The performance of stocks, fixed income securities and alternative investments – and the performance of mutual funds that invest in them – is determined by many factors, including unforeseeable economic and geopolitical events. Your Board certainly can’t determine how well various asset classes in the market perform, but we work hard throughout the year on issues that affect you and your fellow shareholders and determine how your investments are managed. For example, the Invesco Funds Board works to ensure that we provide a lineup of funds that allow financial advisers to build portfolios that meet shareholders’ changing financial needs and goals. Your Board works with Invesco Advisers on a continuing basis to provide financial | ||||||||

products that may help investors achieve their varied financial goals. We also carefully monitor how the management teams of all the Invesco funds are performing in light of ever-changing and often unpredictable economic and market conditions. Your Board carefully assesses their performance in a constantly changing and highly competitive marketplace.
Your Board also conducts an annual review of the funds’ advisory and sub-advisory contracts with Invesco Advisers and its affiliates. This annual review, which is required by the Investment Company Act of 1940, focuses on the nature and quality of the services Invesco provides as adviser to the Invesco Funds and the reasonableness of the fees that it charges for those services. Each year, we spend months reviewing detailed information that we request from Invesco that allows us to evaluate its services and fees. We also use information from many independent sources, including materials provided by the independent Senior Officer of the Invesco Funds, who reports directly to the independent Trustees on the Board. Additionally, we meet with independent legal counsel and review performance and fee data prepared by Lipper Inc., an independent, third-party firm widely recognized as a leader in its field.
Be assured that your Board will continue working on behalf of fund shareholders, keeping your needs and interests uppermost in our minds.
As always, please contact me at bruce@brucecrockett.com with any questions or concerns you may have. On behalf of the Board, we look forward to continuing to represent your interests and serving your needs.
Sincerely,

Bruce L. Crockett
Independent Chair
Invesco Funds Board of Trustees
3 Invesco U.S. Mortgage Fund
Management’s Discussion of Fund Performance
Performance summary
For the year ended December 31, 2013, Invesco U.S. Mortgage Fund performed generally in line with its style-specific index, the Barclays U.S. Mortgage Backed Securities Index. Yield curve and duration positioning were the primary contributors to the Fund’s performance versus its style-specific benchmark for the year.
Your Fund’s long-term performance appears later in this report.
Fund vs. Indexes
Total returns, 12/31/12 to 12/31/13, at net asset value (NAV). Performance shown does not include applicable contingent deferred sales charges (CDSC) or front-end sales charges, which would have reduced performance.
| Class A Shares | -1.51 | % | |||
| Class B Shares | -2.28 | ||||
| Class C Shares | -2.29 | ||||
| Class Y Shares | -1.32 | ||||
| Class R5 Shares | -1.23 | ||||
| Bank of America Merrill Lynch 1-10 Year Treasury Index‚ (Broad Market Index) | -1.65 | ||||
| Barclays U.S. Mortgage Backed Securities Index‚ (Style-Specific Index) | -1.41 |
| Source | (s): ‚ Lipper Inc. |
How we invest
The Fund seeks high current income with liquidity and safety of principal. It does this by investing primarily in obligations issued or guaranteed by the US government or its agencies or instrumentalities, including mortgage-backed securities (MBS). Fund shares are neither insured nor guaranteed by the US government. The Fund invests from time to time in derivative instruments such as exchange-traded interest rate futures contracts. It can also engage in mortgage dollar roll transactions, a form of repurchase agreement in the to-be-announced (TBA) market for agency MBS. These strategies are implemented within the risk profile of the guidelines set forth in the Fund’s prospectus.
We believe dynamic and complex fixed income markets may create opportunities for investors that are best captured by independent specialist decision makers interconnected as a global team. We use this philosophy in an effort to generate a total return consisting of income.
and capital appreciation. Portfolio construction begins with a well-defined Fund design that establishes the target investment vehicles for generating the desired “alpha” (the extra return above a specific benchmark) as well as the risk parameters for the Fund. Investment vehicles are evaluated for liquidity and risk versus relative value. Our security selection is supported by a team of independent specialists. Team members conduct top-down macroeconomic as well as bottom-up analysis on individual securities. Recommendations are communicated to portfolio managers through proprietary technology that allows all investment professionals to communicate in a timely manner.
Sell decisions are based on:
| n | A conscious decision to alter the Fund’s macro-risk exposure (for example, duration, yield curve positioning or sector exposure). |
| n | The need to limit or reduce exposure to a particular sector or issuer. |
| n | Degradation of an issuer’s credit quality. |
| n | Realignment of a valuation target. |
| n | Presentation of a better relative value opportunity. |
| n | The general liquidity needs of the Fund. |
Market conditions and your Fund
The year ended December 31, 2013, was characterized by slow but steady improvement in the US economy, strong US equity market returns and generally negative US bond market returns. As the year began, consumer confidence trended higher based on the recovery of the US housing market, despite uncertainty surrounding the outcome of tax and spending negotiations between the White House and Congress – and implementation of sequestration spending cuts – which consequently left many businesses hesitant to spend.
US bond markets were unremarkable for much of the first half of the year, but from late May through June, bond and stock markets declined following US Federal Reserve (the Fed) Chairman Ben Bernanke’s comments suggesting that the time had come for the Fed to begin to reduce the size of its bond buying program, also known as quantitative easing (QE). This sell-off was brief but broad, and few asset classes were immune. Markets stabilized in mid-summer, despite some volatility in August surrounding a potential US military reaction to instability in Syria. The fourth quarter began amid uncertainty created by a two-week federal government shutdown, and bond yields rose in response to increased market volatility during the last three months of the year. In December, as expected, the Fed officially announced that it would begin reducing the scope of QE in January 2014. In contrast to a rallying stock market following the Fed’s announcement,
Portfolio Composition By security type, based on total investments
| |||||
U.S. Government Sponsored Mortgage-Backed Securities | 76.8 | % | |||
| Asset-Backed Securities | 21.8 | ||||
| U.S. Treasury Securities | 0.2 | ||||
Money Market Funds Plus Other Assets Less Liabilities | 1.2 | ||||
| Top 10 Fixed Income Issuers* | |||||
1. Federal National Mortgage Association | 55.9 | % | |||
2. Federal Home Loan Mortgage Corp. | 35.9 | ||||
3. La Hipotecaria Panamanian Mortgage Trust | 3.9 | ||||
4. Freddie Mac REMICS | 3.6 | ||||
5. Ginnie Mae REMICS | 3.5 | ||||
6. Bear Stearns | 3.2 | ||||
7. Government National Mortgage Association | 3.1 | ||||
8. Citigroup Mortgage Loan | 2.8 | ||||
9. Sequoia Mortgage Trust | 2.5 | ||||
10. JP Morgan Chase Commercial Mortgage Securities Trust | 2.1 | ||||
| Total Net Assets | $454.3 million | ||||
| Total Number of Holdings* | 944 | ||||
The Fund’s holdings are subject to change, and there is no assurance that the Fund will continue to hold any particular security.
*Excluding money market fund holdings.
4 Invesco U.S. Mortgage Fund
longer term bond yields rose, with the benchmark 10 year US Treasury yield breaking 3% by year end.1 For only the third time in 34 years, investment grade bonds produced negative returns for the year.1 For the reporting period, longer-term, high credit quality, rate sensitive segments of the US bond market generally lost ground; high yield bonds, bank loans and short-term bonds were some of the few bond market segments that delivered positive returns in 2013.
In this market environment, the Fund generated negative total returns and performed generally in line with its style-specific index, the Barclays U.S. Mortgage Backed Securities Index, mostly due to a less favorable price component of total return versus the style-specific benchmark. Our allocations to off-benchmark, high quality, short average life collateralized mortgage obligations (CMO) benefited the Fund’s return relative to the style-specific index, and contributed to a higher-than-index average portfolio yield-to-maturity for the reporting period.
We maintained the Fund’s allocation to non-agency residential MBS at between 10-15% of the portfolio’s total net assets; this helped the Fund’s relative performance due to a highly supportive supply-demand dynamic and fundamental improvements in the underlying mortgage loans that attracted investors. For the same reason, a sustained 10%-15% allocation to high quality commercial MBS also contributed to relative results. Our security selection decisions across the maturity, coupon, vintage and issuer strata of the residential MBS market also helped relative returns. Among agency MBS, an emphasis on 30-year, fixed rate MBS was advantageous for Fund returns; such securities were helped by the Fed’s continued QE asset purchases, with $40 billion of the $85 billion monthly bond-buying program targeted at MBS.2
The Fund also benefited from incremental income earned by engaging in dollar (mortgage) roll activity, a type of repurchase transaction in the highly liquid TBA market for agency MBS. A dollar roll involves the Fund selling an MBS to a financial institution, with an agreement to repurchase a substantially similar security at an agreed upon price and date. Excess portfolio cash resulting from the use of this strategy is subsequently invested in short-term instruments to generate additional return for the Fund.
The Fund used active duration and yield curve positioning for risk management and for generating alpha versus its style-specific benchmark. Duration measures a portfolio’s price sensitivity to interest rate changes, with a shorter duration portfolio tending to be less sensitive to these changes. During the reporting period, we maintained the portfolio’s duration slightly longer than that of the benchmark, on average, which worked against relative performance for the year and was the largest detractor from relative returns, especially during the second half of the year as interest rates rose. On a positive note, yield curve positioning within the portfolio emphasized short-term (six months to two years) interest rates, thus offsetting some of the negative relative performance generated by duration positioning. Buying and selling US Treasury futures contracts was an important tool we used for the management of interest rate risk and to maintain our targeted portfolio duration.
We thank you for your investment in Invesco U.S. Mortgage Fund.
1 Source: Barclays
2 Source: US Federal Reserve
The views and opinions expressed in management’s discussion of Fund performance are those of Invesco Advisers, Inc. These views and opinions are subject to change at any time based on factors such as market and economic conditions. These views and opinions may not be relied upon as investment advice or recommendations, or as an offer for a particular security. The information is not a complete analysis of every aspect of any market, country, industry, security or the Fund. Statements of fact are from sources considered reliable, but Invesco Advisers, Inc. makes no representation or warranty as to their completeness or accuracy. Although historical performance is no guarantee of future results, these insights may help you understand our investment management philosophy.
See important Fund and, if applicable, index disclosures later in this report.
 | Clint Dudley Chartered Financial Analyst, portfolio manager, is manager of Invesco U.S. Mortgage Fund. He joined Invesco in | |
| 1998. Mr. Dudley earned a BBA and an MBA from Baylor University. | ||
 | Jason Marshall Portfolio manager, is manager of Invesco U.S. Mortgage Fund. He joined Invesco in 2007. Mr. Marshall earned a BS in | |
| finance from Indiana University of Pennsylvania and an MBA from Duquesne University. | ||
 | Brian Norris Chartered Financial Analyst, portfolio manager, is manager of Invesco U.S. Mortgage Fund. | |
| He joined Invesco in 2001. Mr. Norris earned a BS in business administration from the University of Louisville. | ||
5 Invesco U.S. Mortgage Fund
Your Fund’s Long-Term Performance
Results of a $10,000 Investment – Oldest Share Class(es)
Fund and index data from 12/31/03
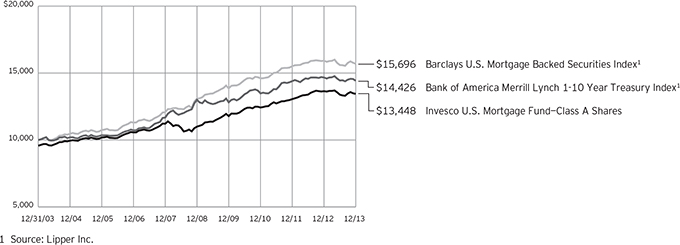
Past performance cannot guarantee comparable future results.
The data shown in the chart include reinvested distributions, applicable sales charges and Fund expenses including
management fees. Index results include reinvested dividends, but they do not reflect sales charges. Performance of the peer group, if applicable, reflects fund expenses and management fees;
performance of a market index does not. Performance shown in the chart and table(s) does not reflect deduction of taxes a shareholder would pay on Fund distributions or sale of Fund shares.
continued from page 8
nation date of a TBA transaction, the Fund will nonetheless be exposed to changes in the value of the underlying investments during the term of the agreement.
| n | US government obligations risk. The Fund may invest in obligations issued by US government agencies and instrumentalities that may receive varying levels of support from the government, which could affect the Fund’s ability to recover should they default. |
| n | When-issued and delayed delivery risk. When-issued and delayed delivery transactions are subject to market risk as the value or yield of a security at delivery may be more or less than the purchase price or the yield generally available on securities when delivery occurs. In addition, the Fund is subject to counterparty risk because it relies on the buyer or seller, as the case may be, to consummate the transaction, and failure by the other party to complete the transaction may result in the Fund missing the opportunity of obtaining a |
price or yield considered to be advantageous.
| n | Zero coupon or pay-in-kind securities risk. The value, interest rates, and liquidity of non-cash paying instruments, such as zero coupon and pay-in-kind securities, are subject to greater fluctuation than other types of securities. |
About indexes used in this report
| n | The Bank of America Merrill Lynch 1-10 Year Treasury Index tracks the performance of US Treasury securities with maturities of one to 9.99 years. |
| n | The Barclays U.S. Mortgage Backed Securities Index represents mortgage-backed pass-through securities of Ginnie Mae, Fannie Mae and Freddie Mac. |
| n | The Fund is not managed to track the performance of any particular index, including the index(es) described here, and consequently, the performance of the Fund may deviate significantly from the performance of the index(es). |
| n | A direct investment cannot be made in an index. Unless otherwise indicated, index results include reinvested dividends, and they do not reflect sales charges. Performance of the peer group, if applicable, reflects fund expenses; performance of a market index does not. |
Other information
| n | The returns shown in management’s discussion of Fund performance are based on net asset values calculated for shareholder transactions. Generally accepted accounting principles require adjustments to be made to the net assets of the Fund at period end for financial reporting purposes, and as such, the net asset values for shareholder transactions and the returns based on those net asset values may differ from the net asset values and returns reported in the Financial Highlights. |
6 Invesco U.S. Mortgage Fund
| Average Annual Total Returns | ||||
| As of 12/31/13, including maximum applicable sales charges | ||||
| Class A Shares | ||||
| Inception (5/31/84) | 6.62 | % | ||
| 10 Years | 3.01 | |||
| 5 Years | 3.20 | |||
| 1 Year | -5.71 | |||
| Class B Shares | ||||
| Inception (8/24/92) | 4.42 | % | ||
| 10 Years | 2.82 | |||
| 5 Years | 2.95 | |||
| 1 Year | -7.02 | |||
| Class C Shares | ||||
| Inception (8/13/93) | 3.71 | % | ||
| 10 Years | 2.66 | |||
| 5 Years | 3.30 | |||
| 1 Year | -3.24 | |||
| Class Y Shares | ||||
| Inception (9/25/06) | 3.79 | % | ||
| 5 Years | 4.34 | |||
| 1 Year | -1..32 | |||
| Class R5 Shares | ||||
| 10 Years | 3.55 | % | ||
| 5 Years | 4.29 | |||
| 1 Year | -1.23 | |||
Effective June 1, 2010, Class A, Class B, Class C and Class I shares of the predecessor fund, Van Kampen U.S. Mortgage Fund, advised by Van Kampen Asset Management were reorganized into Class A, Class B, Class C and Class Y shares, respectively, of Invesco Van Kampen U.S. Mortgage Fund (renamed Invesco U.S. Mortgage Fund). Returns shown above for Class A, Class B, Class C and Class Y shares are blended returns of the predecessor fund and Invesco U.S. Mortgage Fund. Share class returns will differ from the predecessor fund because of different expenses.
Class R5 shares incepted on June 1, 2010. Performance shown prior to that date is that of the predecessor fund’s Class A shares and includes the 12b-1 fees applicable to Class A shares. Class A share performance reflects any applicable fee waivers or expense reimbursements.
The performance data quoted represent past performance and cannot guarantee comparable future results; current performance may be lower or higher. Please visit invesco.com/performance for the most recent month-end performance. Performance figures reflect reinvested distributions, changes in net asset value and the effect of the maximum sales charge unless otherwise stated. Investment return and principal value will fluctuate so that you may have a gain or loss when you sell shares.
The total annual Fund operating expense ratio set forth in the most recent Fund prospectus as of the date of this report for Class A, Class B, Class C, Class Y and Class R5 shares was 0.93%, 1.69%, 1.69%, 0.69% and 0.65%, respectively. The expense ratios presented above may vary from the expense ratios presented in other sections of this report that are based on expenses incurred during the period covered by this report.
Class A share performance reflects the maximum 4.25% sales charge, and Class B and Class C share performance reflects the applicable contingent deferred sales charge (CDSC) for the period involved. For shares purchased prior to June 1, 2010, the CDSC on Class B shares declines from 4% at the time of purchase to 0% at the beginning of the seventh year. For shares purchased on or after June 1, 2010, the CDSC on Class B shares declines from 5% at the time of purchase to 0% at the beginning of the seventh year. The CDSC on Class C shares is 1% for the first year after purchase. Class Y and Class R5 shares do not have a front-end sales charge or a CDSC; therefore, performance is at net asset value.
The performance of the Fund’s share classes will differ primarily due to different sales charge structures and class expenses.
7 Invesco U.S. Mortgage Fund
Invesco U.S. Mortgage Fund’s investment objective is to provide a high level of current income, with liquidity and safety of principal.
| n | Unless otherwise stated, information presented in this report is as of December 31, 2013, and is based on total net assets. |
| n | Unless otherwise noted, all data provided by Invesco. |
| n | To access your Fund’s reports/prospectus, visit invesco.com/fundreports. |
About share classes
| n | Class B shares may not be purchased for new or additional investments. Please see the prospectus for more information. |
| n | Class Y shares are available only to certain investors. Please see the prospectus for more information. |
| n | Class R5 shares are primarily intended for employer sponsored retirement and benefit plans that meet certain standards and for institutional investors. Please see the prospectus for more information. |
Principal risks of investing in the Fund
| n | Active trading risk. The Fund engages in frequent trading of portfolio securities. Active trading results in added expenses and may result in a lower return and increased tax liability. |
| n | Credit risk. The issuer of instruments in which the Fund invests may be unable to meet interest and/or principal payments, thereby causing its instruments to decrease in value and lowering the issuer’s credit rating. |
| n | Derivatives risk. The value of a derivative instrument depends largely on (and is derived from) the value of an underlying security, currency, commodity, interest rate, index or other asset (each referred to as an underlying asset). In addition to risks relating to the underlying assets, the use of derivatives may include other, possibly greater, risks, including counterparty, leverage and liquidity risks. Counterparty risk is the risk that the counterparty to the derivative contract will default on its obligation to pay the Fund the amount owed or otherwise perform under the derivative contract. Derivatives create leverage risk because they do not require payment up front equal to the economic exposure created by owning the derivative. As a result, an adverse change in the value of the underlying asset could result in the Fund sustaining |
a loss that is substantially greater than the amount invested in the derivative, which may make the Fund’s returns more volatile and increase the risk of loss. Derivative instruments may also be less liquid than more traditional investments and the Fund may be unable to sell or close out its derivative positions at a desirable time or price. This risk may be more acute under adverse market conditions, during which the Fund may be most in need of liquidating its derivative positions. Derivatives may also be harder to value, less tax efficient and subject to changing government regulation that could impact the Fund’s ability to use certain derivatives or their cost. Also, derivatives used for hedging or to gain or limit exposure to a particular market segment may not provide the expected benefits, particularly during adverse market conditions. |
| n | Income risk. The income you receive from the Fund is based primarily on prevailing interest rates, which can vary widely over the short- and long-term. If interest rates drop, your income from the Fund may drop as well. |
| n | Leverage risk. Leverage exists when the Fund purchases or sells an instrument or enters into a transaction without investing cash in an amount equal to the full economic exposure of the asset or transaction and the Fund could lose more than it invested. Leverage created from borrowing or certain types of transactions or instruments may impair the Fund’s liquidity, cause it to liquidate positions at an unfavorable time, increase volatility or otherwise not achieve its intended objective. |
| n | Liquidity risk. The Fund may hold illiquid securities that it is unable to sell at the preferred time or price and could lose its entire investment in such securities. |
| n | Management risk. The investment techniques and risk analysis used by the Fund’s portfolio managers may not |
produce the desired results.
| n | Market risk. The prices of and the income generated by the Fund’s securities may decline in response to, among other things, investor sentiment, general economic and market conditions, regional or global instability, and currency and interest rate fluctuations. |
| n | Mortgage- and asset-backed securities risk. The Fund may invest in mortgage- and asset-backed securities that are subject to prepayment or call risk, which is the risk that the borrower’s payments may be received earlier or later than expected due to changes in prepayment rates on underlying loans. Faster prepayments often happen when interest rates are falling. As a result, the Fund may reinvest these early payments at lower interest rates, thereby reducing the Fund’s income. Conversely, when interest rates rise, prepayments may happen more slowly, causing the security to lengthen in duration. Longer duration securities tend to be more volatile. Securities may be prepaid at a price less than the original purchase value. An unexpectedly high rate of defaults on the mortgages held by a mortgage pool may adversely affect the value of mortgage-backed securities and could result in losses to the Fund. The risk of such defaults is generally higher in the case of mortgage pools that include subprime mortgages. Subprime mortgages refer to loans made to borrowers with weakened credit histories or with lower capacity to make timely payments on their mortgages. |
| n | TBA transactions risk. TBA transactions involve the risk that the securities received may be less favorable than what was anticipated by the Fund when entering into the TBA transaction. TBA transactions also involve the risk that a counterparty will fail to deliver the securities, exposing the Fund to further losses. Whether or not the Fund takes delivery of the securities at the termi- |
continued on page 6
This report must be accompanied or preceded by a currently effective Fund prospectus, which contains more complete information, including sales charges and expenses. Investors should read it carefully before investing.
NOT FDIC INSURED | MAY LOSE VALUE | NO BANK GUARANTEE
| Fund Nasdaq Symbols | |||||
Class A Shares | VKMGX | ||||
| Class B Shares | VUSBX | ||||
| Class C Shares | VUSCX | ||||
| Class Y Shares | VUSIX | ||||
| Class R5 Shares | VUSJX | ||||
8 Invesco U.S. Mortgage Fund
Schedule of Investments
December 31, 2013
| Principal Amount | Value | |||||||
U.S. Government Sponsored Mortgage-Backed Securities–106.52% |
| |||||||
| Collateralized Mortgage Obligations–11.69% | ||||||||
Fannie Mae ACES, 0.69%, 08/25/19(a) | $ | 4,320,293 | $ | 4,331,809 | ||||
Fannie Mae Grantor Trust, 7.50%, 01/19/39(a) | 575,716 | 645,013 | ||||||
Fannie Mae Interest STRIPS | ||||||||
6.50%, 10/01/24, IO | 409,439 | 71,517 | ||||||
8.00%, 05/01/30, IO | 1,416,373 | 259,303 | ||||||
7.50%, 01/25/32, IO | 499,895 | 93,452 | ||||||
Fannie Mae REMICs, | ||||||||
2.00%, 06/25/19 | 1,139,648 | 1,159,287 | ||||||
4.50%, 07/25/19 | 5,307 | 5,305 | ||||||
7.00%, 09/25/32 | 538,439 | 619,669 | ||||||
6.57%, 06/25/39(a) | 1,995,672 | 2,292,967 | ||||||
4.50%, 11/25/23, IO | 13,461,763 | 1,106,837 | ||||||
3.00%, 10/25/26, IO | 5,916,285 | 670,365 | ||||||
8.00%, 08/18/27 to 09/18/27, IO | 1,682,010 | 365,912 | ||||||
6.00%, 08/25/32 to 05/25/33, IO | 117,634 | 13,083 | ||||||
7.00%, 05/25/33, IO | 1,567,304 | 368,008 | ||||||
3.50%, 08/25/42, IO | 2,718,737 | 470,271 | ||||||
1.94%, 03/25/43, IO(a) | 27,817,472 | 2,091,229 | ||||||
Freddie Mac REMICs, | ||||||||
4.50%, 06/15/18 | 363,867 | 384,640 | ||||||
3.00%, 10/15/18 to 04/15/26 | 3,451,598 | 3,576,761 | ||||||
3.75%, 10/15/18 | 1,107,192 | 1,134,267 | ||||||
0.57%, 05/15/37(a) | 6,130,847 | 6,165,691 | ||||||
1.96%, 02/15/39, IO(a) | 15,852,135 | 1,027,448 | ||||||
3.00%, 09/15/25, IO | 10,434,968 | 924,266 | ||||||
2.50%, 09/15/27, IO | 5,649,324 | 651,179 | ||||||
1.92%, 04/15/38, IO(a) | 19,995,197 | 1,097,878 | ||||||
4.00%, 12/15/41, IO | 4,477,639 | 792,615 | ||||||
Freddie Mac STRIPS, 8.00%, 06/15/31, IO | 2,343,822 | 422,174 | ||||||
Freddie Mac Structured Pass Through Securities, | ||||||||
6.50%, 02/25/43 | 2,885,319 | 3,374,857 | ||||||
1.54%, 07/25/44(a) | 2,983,083 | 3,036,132 | ||||||
Ginnie Mae REMICs, | ||||||||
4.00%, 04/16/33 | 1,210,905 | 1,268,078 | ||||||
4.50%, 10/20/33 | 685,524 | 707,937 | ||||||
5.86%, 01/20/39(a) | 3,555,464 | 4,001,853 | ||||||
1.17%, 02/16/39(a) | 2,275,913 | 2,339,573 | ||||||
4.51%, 07/20/41(a) | 7,214,486 | 7,636,609 | ||||||
| 53,105,985 | ||||||||
| Federal Home Loan Mortgage Corp. (FHLMC)–35.86% | ||||||||
Pass Through Ctfs., | ||||||||
5.00%, 10/01/18 to 06/01/40 | 18,136,415 | 19,654,637 | ||||||
4.50%, 05/01/38 to 02/01/42 | 43,411,120 | 46,088,962 | ||||||
6.50%, 07/01/14 to 08/01/33 | 1,014,944 | 1,130,221 | ||||||
8.50%, 01/01/17 to 08/01/31 | 701,980 | 834,481 | ||||||
| Principal Amount | Value | |||||||
| Federal Home Loan Mortgage Corp. (FHLMC)–(continued) | ||||||||
7.50%, 01/01/20 to 05/01/35 | $ | 748,553 | $ | 862,015 | ||||
3.50%, 08/01/26 | 1,456,983 | 1,525,197 | ||||||
6.00%, 03/01/29 | 9,796 | 10,988 | ||||||
8.00%, 08/01/32 | 435,424 | 513,176 | ||||||
5.50%, 12/01/36 | 912,412 | 996,331 | ||||||
5.35%, 07/01/38 to 10/17/38 | 5,015,375 | 5,515,603 | ||||||
5.80%, 10/01/38 to 01/20/39 | 4,089,944 | 4,654,644 | ||||||
5.45%, 11/25/38 | 5,102,584 | 5,562,231 | ||||||
4.00%, 06/01/42 | 8,336,107 | 8,573,161 | ||||||
Pass Through Ctfs., ARM, | ||||||||
2.61%, 07/01/36(a) | 4,110,207 | 4,383,111 | ||||||
2.95%, 02/01/37(a) | 384,959 | 409,918 | ||||||
3.05%, 03/01/37(a) | 1,400,147 | 1,492,687 | ||||||
2.63%, 05/01/37(a) | 1,494,549 | 1,587,722 | ||||||
2.64%, 11/01/37(a) | 3,199,972 | 3,417,118 | ||||||
2.93%, 01/01/38(a) | 526,195 | 557,247 | ||||||
3.37%, 03/01/41(a) | 626,615 | 663,926 | ||||||
Pass Through Ctfs., TBA, | ||||||||
3.00%, 01/01/44(b) | 23,200,000 | 21,982,000 | ||||||
3.50%, 01/01/44(b) | 31,500,000 | 31,263,750 | ||||||
4.00%, 01/01/44(b) | 1,200,000 | 1,232,719 | ||||||
| 162,911,845 | ||||||||
| Federal National Mortgage Association (FNMA)–55.87% | ||||||||
Pass Through Ctfs., | ||||||||
6.00%, 02/01/14 to 05/01/40 | 7,261,778 | 8,082,807 | ||||||
8.50%, 08/01/14 to 10/01/32 | 883,750 | 1,059,502 | ||||||
7.50%, 04/01/15 to 08/01/37 | 1,188,005 | 1,388,631 | ||||||
13.00%, 06/01/15 | 10,194 | 10,335 | ||||||
7.00%, 02/01/18 to 12/01/33 | 554,114 | 601,124 | ||||||
4.50%, 05/01/19 to 10/01/41 | 24,063,053 | 25,782,932 | ||||||
8.00%, 07/01/20 to 04/01/33 | 1,031,015 | 1,206,915 | ||||||
6.50%, 06/01/22 to 11/01/38 | 7,664,082 | 8,554,622 | ||||||
5.50%, 11/01/22 to 04/01/38 | 21,863,060 | 24,133,221 | ||||||
4.00%, 06/01/24 to 02/01/42 | 12,865,806 | 13,319,858 | ||||||
5.00%, 06/01/27 to 01/01/41 | 13,871,554 | 15,102,838 | ||||||
9.50%, 04/01/30 | 163,504 | 195,235 | ||||||
5.45%, 01/01/38 | 973,906 | 1,096,501 | ||||||
5.63%, 03/01/41 | 876,821 | 1,014,948 | ||||||
3.50%, 11/01/42 | 2,840,171 | 2,828,705 | ||||||
3.00%, 04/01/43 | 3,950,055 | 3,755,525 | ||||||
Pass Through Ctfs., ARM, | ||||||||
2.95%, 03/01/36(a) | 9,608,923 | 10,318,376 | ||||||
2.50%, 03/01/38(a) | 530,155 | 561,024 | ||||||
2.01%, 02/01/39(a) | 6,263,522 | 6,611,130 | ||||||
3.03%, 08/01/42(a) | 1,823,773 | 1,843,614 | ||||||
2.27%, 07/01/43(a) | 4,837,334 | 4,717,595 | ||||||
2.69%, 09/01/43(a) | 2,485,219 | 2,466,772 | ||||||
See accompanying Notes to Financial Statements which are an integral part of the financial statements.
9 Invesco U.S. Mortgage Fund
| Principal Amount | Value | |||||||
| Federal National Mortgage Association (FNMA)–(continued) | ||||||||
Pass Through Ctfs., BAL, | ||||||||
3.84%, 04/01/18 | $ | 3,248,541 | $ | 3,505,856 | ||||
Pass Through Ctfs., TBA, | ||||||||
2.50%, 01/01/29(b) | 8,000,000 | 7,920,000 | ||||||
3.00%, 01/01/29 to 01/01/44(b) | 51,600,000 | 50,139,220 | ||||||
3.50%, 01/01/44(b) | 31,600,000 | 31,400,032 | ||||||
4.00%, 01/01/44(b) | 25,420,000 | 26,174,656 | ||||||
| 253,791,974 | ||||||||
| Government National Mortgage Association (GNMA)–3.10% | ||||||||
Pass Through Ctfs., | ||||||||
13.00%, 08/15/14 to 05/15/15 | 1,557 | 1,569 | ||||||
9.00%, 11/15/15 to 08/15/24 | 827,567 | 860,183 | ||||||
9.50%, 02/15/16 to 08/15/22 | 464,381 | 479,101 | ||||||
8.00%, 05/15/16 to 12/15/21 | 437,799 | 452,329 | ||||||
8.50%, 02/20/17 | 1,383 | 1,481 | ||||||
7.00%, 08/15/22 to 01/15/29 | 538,020 | 590,330 | ||||||
6.50%, 04/15/26 to 11/15/28 | 279,243 | 311,698 | ||||||
6.00%, 01/15/28 to 04/20/29 | 844,478 | 941,320 | ||||||
5.50%, 05/15/33 to 10/15/34 | 1,817,996 | 2,016,317 | ||||||
5.00%, 11/20/37 | 3,459,200 | 3,760,804 | ||||||
Pass Through Ctfs., TBA, 4.00%, 01/01/34(b) | 4,500,000 | 4,680,176 | ||||||
| 14,095,308 | ||||||||
Total U.S. Government Sponsored Mortgage-Backed Securities (Cost $483,022,277) |
| 483,905,112 | ||||||
Asset-Backed Securities–30.25% |
| |||||||
American Home Mortgage Investment Trust, Series 2005-1, Class 7A1, Floating Rate Pass Through Ctfs., 2.35%, 06/25/45(a) | 1,945,676 | 1,948,994 | ||||||
BAMLL-DB Trust, Series 2012-OSI, Class A2FX, Pass Through Ctfs., 3.35%, 04/13/29(c) | 4,997,674 | 5,156,780 | ||||||
Banc of America Merrill Lynch Commercial Mortgage Inc., Series 2005-1, Class A4, Variable Rate Pass Through Ctfs., 5.17%, 11/10/42(a) | 319,365 | 324,567 | ||||||
Bear Stearns Commercial Mortgage Securities Trust, | ||||||||
Series 2005-PWR7, Class AJ, Variable Rate Pass Through Ctfs., 5.17%, 02/11/41(a) | 3,050,000 | 3,135,710 | ||||||
Series 2005-PWR8, Class AJ, Pass Through Ctfs., 4.75%, 06/11/41 | 5,000,000 | 5,182,547 | ||||||
Series 2006-T22, Class AJ, Variable Rate Pass Through Ctfs., 5.58%, 04/12/38(a) | 4,055,000 | 4,371,602 | ||||||
Series 2006-T22, Class B, Variable Rate Pass Through Ctfs., 5.58%, 04/12/38 (a)(c) | 1,750,000 | 1,867,491 | ||||||
CHL Mortgage Pass Through Trust, Series 2004-29, Class 1A1, Floating Rate Pass Through Ctfs., 0.70%, 02/25/35(a) | 901,323 | 851,748 | ||||||
| Principal Amount | Value | |||||||
| Collateralized Mortgage Obligations–(continued) | ||||||||
Citigroup Mortgage Loan Trust, Inc., | ||||||||
Series 2004-HYB3, Class 2A, Floating Rate Pass Through Ctfs., 2.60%, 09/25/34(a) | $ | 4,143,958 | $ | 4,043,811 | ||||
Series 2004-UST1, Class A4, Floating Rate Pass Through Ctfs., 2.28%, 08/25/34(a) | 855,538 | 863,022 | ||||||
Series 2009-12, Class 5A1, Pass Through Ctfs., 5.50%, 07/25/37(c) | 3,884,220 | 4,078,431 | ||||||
Series 2012-6, Class 2A1, Floating Rate Pass Through Ctfs., 2.52%, 08/25/36(a)(c) | 3,488,215 | 3,574,752 | ||||||
COMM Mortgage Trust, Series 2013-FL3, Class B, Floating Rate Pass Through Ctfs., 2.32%, 10/13/28(a)(c) | 5,000,000 | 5,015,243 | ||||||
Credit Suisse Mortgage Trust, Series 2010-6R, Class 1A1, Pass Through Ctfs., 5.50%, 02/27/37 | 241,338 | 245,788 | ||||||
Fontainebleau Miami Beach Trust, Series 2012, Class A, Pass Through Ctfs., 2.89%, 05/05/27(c) | 5,000,000 | 5,058,655 | ||||||
GCCF Commercial Mortgage Trust, Series 2005-GG3, Class B, Variable Rate Pass Through Ctfs., 4.89%, 08/10/42(a) | 2,686,000 | 2,753,527 | ||||||
GE Capital Commercial Mortgage Corp., Series 2004-C2, Class A4, Pass Through Ctfs., 4.89%, 03/10/40 | 198,885 | 199,115 | ||||||
Hilton USA Trust, Series 2013-HLT, Class BFX, Pass Through Ctfs., 3.37%, 11/05/30(c) | 6,500,000 | 6,490,230 | ||||||
JP Morgan Chase Commercial Mortgage Securities Trust, | ||||||||
Series 2005-LDP3, Class AJ, Variable Rate Pass Through Ctfs., 4.99%, 08/15/42(a) | 5,000,000 | 5,220,632 | ||||||
Series 2006-CB14, Class A4, Variable Rate Pass Through Ctfs., 5.48%, 12/12/44(a) | 1,180,000 | 1,260,378 | ||||||
Series 2006-LDP9, Class A3, Pass Through Ctfs., 5.34%, 05/15/47 | 2,930,000 | 3,211,854 | ||||||
JP Morgan Mortgage Trust, | ||||||||
Series 2005-A3, Class 6A5, Floating Rate Pass Through Ctfs., 2.75%, 06/25/35(a) | 2,290,056 | 2,278,800 | ||||||
Series 2013-2, Class A2, Variable Rate Pass Through Ctfs., 3.50%, 05/25/43(a)(c) | 4,611,860 | 4,462,999 | ||||||
JP Morgan Resecuritization Trust, Series 2009-7, Class 5A1, Variable Rate Pass Through Ctfs., 6.00%, 02/27/37 (Acquired 08/23/11; Cost $1,326,731)(a)(c) | 1,300,716 | 1,335,069 | ||||||
La Hipotecaria Panamanian Mortgage Trust (El Salvador), Series 2010-1GA, Class A, Floating Rate Pass Through Ctfs., 2.75%, 09/08/39 (Acquired 11/05/10-06/25/12; Cost $10,612,811)(a)(c) | 10,257,886 | 10,698,657 | ||||||
10 Invesco U.S. Mortgage Fund
See accompanying Notes to Financial Statements which are an integral part of the financial statements.
| Principal Amount | Value | |||||||
| Collateralized Mortgage Obligations–(continued) | ||||||||
La Hipotecaria El Salvadorian Mortgage Trust (El Salvador), Series 2013-1A, Class A, Pass Through Ctfs., 3.50%, 10/25/41 (Acquired 04/22/13; Cost $6,761,529)(c) | $ | 6,532,878 | $ | 6,963,643 | ||||
LB-UBS Commercial Mortgage Trust, Series 2005-C7, Class AJ, Variable Rate Pass Through Ctfs., 5.32%, 11/15/40(a) | 5,100,000 | 5,400,061 | ||||||
Luminent Mortgage Trust, Series 2006-1, Class A1, Floating Rate Pass Through Ctfs., 0.40%, 04/25/36(a) | 117,523 | 80,218 | ||||||
Merrill Lynch Mortgage Investors Trust, | ||||||||
Series 2004-A, Class A2, Floating Rate Pass Through Ctfs., 0.87%, 04/25/29(a) | 360,844 | 349,610 | ||||||
Series 2005-A, Class A1, Floating Rate Pass Through Ctfs., 0.62%, 03/25/30(a) | 2,395,330 | 2,326,663 | ||||||
RALI Trust, Series 2006-QO2, Class A2, Floating Rate Pass Through Ctfs., 0.43%, 02/25/46(a) | 75,999 | 37,632 | ||||||
RBSSP Resecuritization Trust, Series 2010-1, Class 2A1, Floating Rate Pass Through Ctfs., 2.20%, 07/26/45 (Acquired 01/31/11; | 3,419,786 | 3,356,833 | ||||||
Sequoia Mortgage Trust, | ||||||||
Series 2013-4, Class A3, Variable Rate Pass Through Ctfs., 1.55%, 04/25/43(a) | 2,863,893 | 2,768,550 | ||||||
Series 2013-6, Class A2, Variable Rate Pass Through Ctfs., 3.00%, 05/25/43(a) | 4,381,357 | 4,061,623 | ||||||
Series 2013-7, Class A2, Variable Rate Pass Through Ctfs., 3.00%, 06/25/43(a) | 4,876,934 | 4,520,332 | ||||||
Shellpoint Asset Funding Trust, Series 2013-1, Class A3, Variable Rate Pass Through Ctfs., | 4,571,186 | 4,404,978 | ||||||
Structured Adjustable Rate Mortgage Loan Trust, | ||||||||
Series 2004-13, Class A2, Floating Rate Pass Through Ctfs., 0.46%, 09/25/34(a) | 926,084 | 808,882 | ||||||
Series 2004-6, Class 3A2, Floating Rate Pass Through Ctfs., 2.41%, 06/25/34(a) | 5,415,600 | 5,469,783 | ||||||
| Principal Amount | Value | |||||||
| Collateralized Mortgage Obligations–(continued) | ||||||||
Structured Asset Mortgage Investments, II Trust, Series 2005-AR2, Class 2A1, Floating Rate Pass Through Ctfs., 0.39%, 05/25/45(a) | $ | 2,089,307 | $ | 1,813,907 | ||||
Wachovia Bank Commercial Mortgage Trust, | ||||||||
Series 2005-C18, Class A3, Pass Through Ctfs., 4.79%, 04/15/42 | 2,148,944 | 2,150,892 | ||||||
Series 2005-C20, Class AJ, Variable Rate Pass Through Ctfs., 5.16%, 07/15/42(a) | 500,000 | 527,287 | ||||||
Series 2005-C21, Class AJ, Variable Rate Pass Through Ctfs., 5.24%, 10/15/44(a) | 1,254,000 | 1,319,858 | ||||||
Wells Fargo Mortgage Backed Securities Trust, Series 2004-K, Class 1A2, Floating Rate Pass Through Ctfs., 2.62%, 07/25/34(a) | 3,584,608 | 3,593,129 | ||||||
WFRBS Commercial Mortgage Trust, Series 2012-C7, Class C, Variable Rate Pass Through Ctfs., 4.85%, 06/15/45(a) | 3,850,000 | 3,855,513 | ||||||
Total Asset-Backed Securities (Cost $136,014,981) |
| 137,439,796 | ||||||
U.S. Treasury Notes–0.24% |
| |||||||
3.25%, 12/31/16(d) | 1,000,000 | 1,072,615 | ||||||
| Shares | ||||||||
Money Market Funds–1.73% |
| |||||||
Liquid Assets Portfolio–Institutional Class(e) | 3,926,740 | 3,926,740 | ||||||
Premier Portfolio–Institutional Class(e) | 3,926,740 | 3,926,740 | ||||||
Total Money Market Funds |
| 7,853,480 | ||||||
TOTAL INVESTMENTS–138.74% |
| 630,271,003 | ||||||
OTHER ASSETS LESS LIABILITIES–(38.74)% |
| (175,994,211 | ) | |||||
NET ASSETS–100.00% |
| $ | 454,276,792 | |||||
Investment Abbreviations:
| ACES | – Automatically Convertible Extendable Security | |
| ARM | – Adjustable Rate Mortgage | |
| BAL | – Balloon |
| Ctfs. | – Certificates | |
| IO | – Interest Only | |
| REMIC | – Real Estate Mortgage Investment Conduits |
| STRIPS | – Separately Traded Registered Interest and Principal Security | |
| TBA | – To Be Announced |
Notes to Schedule of Investments:
| (a) | Interest or dividend rate is redetermined periodically. Rate shown is the rate in effect on December 31, 2013. |
| (b) | Security purchased on a forward commitment basis. This security is subject to dollar roll transactions. See Note 1H. |
| (c) | Security purchased or received in a transaction exempt from registration under the Securities Act of 1933, as amended (the “1933 Act”). The security may be resold pursuant to an exemption from registration under the 1933 Act, typically to qualified institutional buyers. The aggregate value of these securities at December 31, 2013 was $62,709,549, which represented 13.80% of the Fund’s Net Assets. |
| (d) | All or a portion of the value was pledged as collateral to cover margin requirements for open futures contracts. See Note 1I and Note 4. |
| (e) | The money market fund and the Fund are affiliated by having the same investment adviser. |
See accompanying Notes to Financial Statements which are an integral part of the financial statements.
11 Invesco U.S. Mortgage Fund
Statement of Assets and Liabilities
December 31, 2013
Assets: |
| |||
Investments, at value (Cost $620,042,336) | $ | 622,417,523 | ||
Investments in affiliated money market funds, at value and cost | 7,853,480 | |||
Total investments, at value (Cost $627,895,816) | 630,271,003 | |||
Cash | 105,990 | |||
Receivable for: | ||||
Investments sold | 32,833,200 | |||
Variation margin | 52,094 | |||
Fund shares sold | 48,546 | |||
Dividends and interest | 1,967,032 | |||
Principal paydowns | 222,160 | |||
Investment for trustee deferred compensation and retirement plans | 62,328 | |||
Other assets | 64,322 | |||
Total assets | 665,626,675 | |||
Liabilities: |
| |||
Payable for: | ||||
Investments purchased | 209,600,996 | |||
Fund shares reacquired | 866,152 | |||
Dividends | 521,543 | |||
Accrued fees to affiliates | 205,858 | |||
Accrued trustees’ and officers’ fees and benefits | 964 | |||
Accrued other operating expenses | 80,699 | |||
Trustee deferred compensation and retirement plans | 73,671 | |||
Total liabilities | 211,349,883 | |||
Net assets applicable to shares outstanding | $ | 454,276,792 | ||
Net assets consist of: |
| |||
Shares of beneficial interest | $ | 588,215,558 | ||
Undistributed net investment income | 1,208,677 | |||
Undistributed net realized gain (loss) | (137,854,034 | ) | ||
Net unrealized appreciation | 2,706,591 | |||
| $ | 454,276,792 | |||
Net Assets: |
| |||
Class A | $ | 441,028,495 | ||
Class B | $ | 3,196,799 | ||
Class C | $ | 7,788,001 | ||
Class Y | $ | 2,253,886 | ||
Class R5 | $ | 9,611 | ||
Shares outstanding, $0.01 par value per share, |
| |||
Class A | 35,722,304 | |||
Class B | 260,260 | |||
Class C | 635,256 | |||
Class Y | 181,919 | |||
Class R5 | 776 | |||
Class A: | ||||
Net asset value per share | $ | 12.35 | ||
Maximum offering price per share | ||||
(Net asset value of $12.35 ¸ 95.75%) | $ | 12.90 | ||
Class B: | ||||
Net asset value and offering price per share | $ | 12.28 | ||
Class C: | ||||
Net asset value and offering price per share | $ | 12.26 | ||
Class Y: | ||||
Net asset value and offering price per share | $ | 12.39 | ||
Class R5: | ||||
Net asset value and offering price per share | $ | 12.39 | ||
See accompanying Notes to Financial Statements which are an integral part of the financial statements.
12 Invesco U.S. Mortgage Fund
Statement of Operations
For the year ended December 31, 2013
Investment income: |
| |||
Interest | $ | 12,916,541 | ||
Dividends from affiliated money market funds | 6,540 | |||
Total investment income | 12,923,081 | |||
Expenses: | ||||
Advisory fees | 2,366,657 | |||
Administrative services fees | 135,815 | |||
Custodian fees | 66,133 | |||
Distribution fees: | ||||
Class A | 1,172,497 | |||
Class B | 43,155 | |||
Class C | 103,093 | |||
Transfer agent fees — A, B, C, and Y | 573,510 | |||
Transfer agent fees — R5 | 7 | |||
Trustees’ and officers’ fees and benefits | 45,772 | |||
Other | 356,810 | |||
Total expenses | 4,863,449 | |||
Less: Fees waived and expense offset arrangement(s) | (15,332 | ) | ||
Net expenses | 4,848,117 | |||
Net investment income | 8,074,964 | |||
Realized and unrealized gain (loss) from: | ||||
Net realized gain (loss) from: | ||||
Investment securities | (8,079,366 | ) | ||
Futures contracts | 4,033,807 | |||
| (4,045,559 | ) | |||
Change in net unrealized appreciation (depreciation) of: | ||||
Investment securities | (12,086,137 | ) | ||
Futures contracts | (129,712 | ) | ||
| (12,215,849 | ) | |||
Net realized and unrealized gain (loss) | (16,261,408 | ) | ||
Net increase (decrease) in net assets resulting from operations | $ | (8,186,444 | ) | |
See accompanying Notes to Financial Statements which are an integral part of the financial statements.
13 Invesco U.S. Mortgage Fund
Statement of Changes in Net Assets
For the years ended December 31, 2013 and 2012
| 2013 | 2012 | |||||||
Operations: |
| |||||||
Net investment income | $ | 8,074,964 | $ | 10,689,277 | ||||
Net realized gain (loss) | (4,045,559 | ) | 15,537,398 | |||||
Change in net unrealized appreciation (depreciation) | (12,215,849 | ) | (813,477 | ) | ||||
Net increase (decrease) in net assets resulting from operations | (8,186,444 | ) | 25,413,198 | |||||
Distributions to shareholders from net investment income: |
| |||||||
Class A | (18,165,658 | ) | (23,364,120 | ) | ||||
Class B | (125,354 | ) | (244,453 | ) | ||||
Class C | (302,885 | ) | (359,589 | ) | ||||
Class Y | (125,279 | ) | (123,984 | ) | ||||
Class R5 | (397 | ) | (454 | ) | ||||
Total distributions from net investment income | (18,719,573 | ) | (24,092,600 | ) | ||||
Share transactions–net: |
| |||||||
Class A | (64,577,974 | ) | (34,601,710 | ) | ||||
Class B | (2,305,725 | ) | (2,476,459 | ) | ||||
Class C | (3,650,135 | ) | 2,676,551 | |||||
Class Y | (1,331,835 | ) | 2,034,214 | |||||
Net increase (decrease) in net assets resulting from share transactions | (71,865,669 | ) | (32,367,404 | ) | ||||
Net increase (decrease) in net assets | (98,771,686 | ) | (31,046,806 | ) | ||||
Net assets: | ||||||||
Beginning of year | 553,048,478 | 584,095,284 | ||||||
End of year (includes undistributed net investment income of $1,208,677 and $309,981, respectively) | $ | 454,276,792 | $ | 553,048,478 | ||||
Notes to Financial Statements
December 31, 2013
NOTE 1—Significant Accounting Policies
Invesco U.S. Mortgage Fund (the “Fund”) is a series portfolio of AIM Growth Series (Invesco Growth Series) (the “Trust”). The Trust is organized as a Delaware statutory trust and is registered under the Investment Company Act of 1940, as amended (the “1940 Act”), as an open-end series management investment company consisting of fifteen separate series portfolios, each authorized to issue an unlimited number of shares of beneficial interest. The assets, liabilities and operations of each portfolio are accounted for separately. Information presented in these financial statements pertains only to the Fund. Matters affecting each portfolio or class will be voted on exclusively by the shareholders of such portfolio or class.
The Fund’s investment objective is to provide a high level of current income, with liquidity and safety of principal.
The Fund currently consists of five different classes of shares: Class A, Class B, Class C, Class Y and Class R5. Class A shares are sold with a front-end sales charge unless certain waiver criteria are met and under certain circumstances load waived shares may be subject to contingent deferred sales charges (“CDSC”). Class C shares are sold with a CDSC. Class Y and Class R5 shares are sold at net asset value. Effective November 30, 2010, new or additional investments in Class B shares are no longer permitted. Existing shareholders of Class B shares may continue to reinvest dividends and capital gains distributions in Class B shares until they convert to Class A shares. Also, shareholders in Class B shares will be able to exchange those shares for Class B shares of other Invesco Funds offering such shares until they convert to Class A shares. Generally, Class B shares will automatically convert to Class A shares on or about the month-end, which is at least eight years after the date of purchase. Redemption of Class B shares prior to the conversion date will be subject to a CDSC.
The following is a summary of the significant accounting policies followed by the Fund in the preparation of its financial statements.
| A. | Security Valuations — Securities, including restricted securities, are valued according to the following policy. |
Debt obligations (including convertible bonds) and unlisted equities are fair valued using an evaluated quote provided by an independent pricing service. Evaluated quotes provided by the pricing service may be determined without exclusive reliance on quoted prices, and may reflect appropriate factors such as institution-size trading in similar groups of securities, developments related to specific securities, dividend rate (for unlisted equities), yield (for debt obligations), quality, type of issue, coupon rate (for debt obligations), maturity (for debt obligations), individual trading characteristics and other market data. Debt obligations are subject to interest rate and credit risks. In addition, all debt obligations involve some risk of default with respect to interest and/or principal payments.
A security listed or traded on an exchange (except convertible bonds) is valued at its last sales price or official closing price as of the close of the customary trading session on the exchange where the security is principally traded, or lacking any sales or official closing price on a particular
14 Invesco U.S. Mortgage Fund
day, the security may be valued at the closing bid price on that day. Securities traded in the over-the-counter market are valued based on prices furnished by independent pricing services or market makers. When such securities are valued by an independent pricing service they may be considered fair valued. Futures contracts are valued at the final settlement price set by an exchange on which they are principally traded. Listed options are valued at the mean between the last bid and ask prices from the exchange on which they are principally traded. Options not listed on an exchange are valued by an independent source at the mean between the last bid and ask prices. For purposes of determining net asset value per share, futures and option contracts generally are valued 15 minutes after the close of the customary trading session of the New York Stock Exchange (“NYSE”).
Investments in open-end and closed-end registered investment companies that do not trade on an exchange are valued at the end of day net asset value per share. Investments in open-end and closed-end registered investment companies that trade on an exchange are valued at the last sales price or official closing price as of the close of the customary trading session on the exchange where the security is principally traded.
Swap agreements are fair valued using an evaluated quote provided by an independent pricing service. Evaluated quotes provided by the pricing service are valued based on a model which may include end of day net present values, spreads, ratings, industry, and company performance.
Foreign securities’ (including foreign exchange contracts) prices are converted into U.S. dollar amounts using the applicable exchange rates as of the close of the NYSE. If market quotations are available and reliable for foreign exchange-traded equity securities, the securities will be valued at the market quotations. Because trading hours for certain foreign securities end before the close of the NYSE, closing market quotations may become unreliable. If between the time trading ends on a particular security and the close of the customary trading session on the NYSE, events occur that the Adviser determines are significant and make the closing price unreliable, the Fund may fair value the security. If the event is likely to have affected the closing price of the security, the security will be valued at fair value in good faith using procedures approved by the Board of Trustees. Adjustments to closing prices to reflect fair value may also be based on a screening process of an independent pricing service to indicate the degree of certainty, based on historical data, that the closing price in the principal market where a foreign security trades is not the current value as of the close of the NYSE. Foreign securities’ prices meeting the approved degree of certainty that the price is not reflective of current value will be priced at the indication of fair value from the independent pricing service. Multiple factors may be considered by the independent pricing service in determining adjustments to reflect fair value and may include information relating to sector indices, American Depositary Receipts and domestic and foreign index futures. Foreign securities may have additional risks including exchange rate changes, potential for sharply devalued currencies and high inflation, political and economic upheaval, the relative lack of issuer information, relatively low market liquidity and the potential lack of strict financial and accounting controls and standards.
Securities for which market prices are not provided by any of the above methods may be valued based upon quotes furnished by independent sources. The last bid price may be used to value equity securities. The mean between the last bid and asked prices is used to value debt obligations, including corporate loans.
Securities for which market quotations are not readily available or became unreliable are valued at fair value as determined in good faith by or under the supervision of the Trust’s officers following procedures approved by the Board of Trustees. Issuer specific events, market trends, bid/ask quotes of brokers and information providers and other market data may be reviewed in the course of making a good faith determination of a security’s fair value.
Valuations change in response to many factors including the historical and prospective earnings of the issuer, the value of the issuer’s assets, general economic conditions, interest rates, investor perceptions and market liquidity. Because of the inherent uncertainties of valuation, the values reflected in the financial statements may materially differ from the value received upon actual sale of those investments.
| B. | Securities Transactions and Investment Income — Securities transactions are accounted for on a trade date basis. Realized gains or losses on sales are computed on the basis of specific identification of the securities sold. Interest income is recorded on the accrual basis from settlement date. Paydown gains and losses on mortgage and asset-backed securities are recorded as adjustments to interest income. Dividend income (net of withholding tax, if any) is recorded on the ex-dividend date. Bond premiums and discounts are amortized and/or accreted for financial reporting purposes. |
The Fund may periodically participate in litigation related to Fund investments. As such, the Fund may receive proceeds from litigation settlements. Any proceeds received are included in the Statement of Operations as realized gain (loss) for investments no longer held and as unrealized gain (loss) for investments still held.
Brokerage commissions and mark ups are considered transaction costs and are recorded as an increase to the cost basis of securities purchased and/or a reduction of proceeds on a sale of securities. Such transaction costs are included in the determination of net realized and unrealized gain (loss) from investment securities reported in the Statement of Operations and the Statement of Changes in Net Assets and the net realized and unrealized gains (losses) on securities per share in the Financial Highlights. Transaction costs are included in the calculation of the Fund’s net asset value and, accordingly, they reduce the Fund’s total returns. These transaction costs are not considered operating expenses and are not reflected in net investment income reported in the Statement of Operations and Statement of Changes in Net Assets, or the net investment income per share and ratios of expenses and net investment income reported in the Financial Highlights, nor are they limited by any expense limitation arrangements between the Fund and the investment adviser.
The Fund allocates income and realized and unrealized capital gains and losses to a class based on the relative net assets of each class.
| C. | Distributions — Distributions from income are declared daily and paid monthly. Distributions from net realized capital gain, if any, are generally declared and paid annually and recorded on the ex-dividend date. |
| D. | Federal Income Taxes — The Fund intends to comply with the requirements of Subchapter M of the Internal Revenue Code of 1986, as amended (the “Internal Revenue Code”), necessary to qualify as a regulated investment company and to distribute substantially all of the Fund’s taxable earnings to shareholders. As such, the Fund will not be subject to federal income taxes on otherwise taxable income (including net realized capital gain) that is distributed to shareholders. Therefore, no provision for federal income taxes is recorded in the financial statements. |
Each Fund files tax returns in the U.S. Federal jurisdiction and certain other jurisdictions. Generally, each Fund is subject to examinations by such taxing authorities for up to three years after the filing of the return for the tax period.
| E. | Expenses — Fees provided for under the Rule 12b-1 plan of a particular class of the Fund are charged to the operations of such class. Transfer agency fees and expenses and other shareholder recordkeeping fees and expenses attributable to Class R5 are charged to such class. Transfer |
15 Invesco U.S. Mortgage Fund
| agency fees and expenses and other shareholder recordkeeping fees and expenses relating to all other classes are allocated among those classes based on relative net assets. All other expenses are allocated among the classes based on relative net assets. Prior to June 1, 2010, incremental transfer agency fees which were unique to each class of shares were charged to the operations of such class. |
| F. | Accounting Estimates – The preparation of financial statements in conformity with accounting principles generally accepted in the United States of America (“GAAP”) requires management to make estimates and assumptions that affect the reported amounts of assets and liabilities at the date of the financial statements and the reported amounts of revenues and expenses during the reporting period including estimates and assumptions related to taxation. Actual results could differ from those estimates by a significant amount. In addition, the Fund monitors for material events or transactions that may occur or become known after the period-end date and before the date the financial statements are released to print. |
| G. | Indemnifications — Under the Trust’s organizational documents, each Trustee, officer, employee or other agent of the Trust is indemnified against certain liabilities that may arise out of the performance of their duties to the Fund. Additionally, in the normal course of business, the Fund enters into contracts, including the Fund’s servicing agreements, that contain a variety of indemnification clauses. The Fund’s maximum exposure under these arrangements is unknown as this would involve future claims that may be made against the Fund that have not yet occurred. The risk of material loss as a result of such indemnification claims is considered remote. |
| H. | Dollar Rolls and Forward Commitment Transactions — The Fund may enter into dollar roll transactions to enhance the Fund’s performance. The Fund executes its dollar roll transactions in the to be announced (“TBA”) market whereby the Fund makes a forward commitment to purchase a security and, instead of accepting delivery, the position is offset by the sale of the security with a simultaneous agreement to repurchase at a future date. |
The Fund accounts for dollar roll transactions as purchases and sales and realizes gains and losses on these transactions. These transactions increase the Fund’s portfolio turnover rate. The Fund will segregate liquid assets in an amount equal to its dollar roll commitments. Dollar roll transactions are considered borrowings under the 1940 Act.
Dollar roll transactions involve the risk that a counter-party to the transaction may fail to complete the transaction. If this occurs, the Fund may lose the opportunity to purchase or sell the security at the agreed upon price. Dollar rolls transactions also involve the risk that the value of the securities retained by the Fund may decline below the price of the securities that the Fund has sold but is obligated to purchase under the agreement.
| I. | Futures Contracts — The Fund may enter into futures contracts to manage exposure to interest rate, equity and market price movements and/or currency risks. A futures contract is an agreement between two parties to purchase or sell a specified underlying security, currency or commodity (or delivery of a cash settlement price, in the case of an index future) for a fixed price at a future date. The Fund currently invests only in exchange-traded futures and they are standardized as to maturity date and underlying financial instrument. Initial margin deposits required upon entering into futures contracts are satisfied by the segregation of specific securities or cash as collateral at the futures commission merchant (broker). During the period the futures contracts are open, changes in the value of the contracts are recognized as unrealized gains or losses by recalculating the value of the contracts on a daily basis. Subsequent or variation margin payments are received or made depending upon whether unrealized gains or losses are incurred. These amounts are reflected as receivables or payables on the Statement of Assets and Liabilities. When the contracts are closed or expire, the Fund recognizes a realized gain or loss equal to the difference between the proceeds from, or cost of, the closing transaction and the Fund’s basis in the contract. The net realized gain (loss) and the change in unrealized gain (loss) on futures contracts held during the period is included on the Statement of Operations. The primary risks associated with futures contracts are market risk and the absence of a liquid secondary market. If the Fund were unable to liquidate a futures contract and/or enter into an offsetting closing transaction, the Fund would continue to be subject to market risk with respect to the value of the contracts and continue to be required to maintain the margin deposits on the futures contracts. Futures contracts have minimal counterparty risk since the exchange’s clearinghouse, as counterparty to all exchange-traded futures, guarantees the futures against default. Risks may exceed amounts recognized in the Statement of Assets and Liabilities. |
| J. | Other Risks — The Funds may invest in obligations issued by agencies and instrumentalities of the U.S. Government that may vary in the level of support they receive from the government. The government may choose not to provide financial support to government sponsored agencies or instrumentalities if it is not legally obligated to do so. In this case, if the issuer defaulted, the Fund may not be able to recover its investment in such issuer from the U.S. Government. Many securities purchased by the Fund are not guaranteed by the U.S. Government. |
| K. | Collateral — To the extent the Fund has designated or segregated a security as collateral and that security is subsequently sold, it is the Fund’s practice to replace such collateral no later than the next business day. |
NOTE 2—Advisory Fees and Other Fees Paid to Affiliates
The Trust has entered into a master investment advisory agreement with Invesco Advisers, Inc. (the “Adviser” or “Invesco”). Under the terms of the investment advisory agreement, the Fund pays an advisory fee to the Adviser based on the annual rate of the Fund’s average daily net assets as follows:
| Average Daily Net Assets | Rate | |||||
First $1 billion | 0 | .47% | ||||
Next $500 million | 0 | .445% | ||||
Next $500 million | 0 | .42% | ||||
Next $500 million | 0 | .395% | ||||
Next $2.5 billion | 0 | .37% | ||||
Next $2.5 billion | 0 | .345% | ||||
Next $2.5 billion | 0 | .32% | ||||
Next $2.5 billion | 0 | .295% | ||||
Over $12.5 billion | 0 | .27% | ||||
16 Invesco U.S. Mortgage Fund
Under the terms of a master sub-advisory agreement between the Adviser and each of Invesco Asset Management Deutschland GmbH, Invesco Asset Management Limited, Invesco Asset Management (Japan) Limited, Invesco Australia Limited, Invesco Hong Kong Limited, Invesco Senior Secured Management, Inc. and Invesco Canada Ltd. (collectively, the “Affiliated Sub-Advisers”) the Adviser, not the Fund, may pay 40% of the fees paid to the Adviser to any such Affiliated Sub-Adviser(s) that provide(s) discretionary investment management services to the Fund based on the percentage of assets allocated to such Sub-Adviser(s).
The Adviser has contractually agreed, through at least June 30, 2014, to waive advisory fees and/or reimburse expenses of all shares to the extent necessary to limit total annual fund operating expenses after fee waiver and/or expense reimbursement (excluding certain items discussed below) of Class A, Class B, Class C, Class Y and Class R5 shares to 1.50%, 2.25%, 2.25%, 1.25% and 1.25%, respectively, of average daily net assets. In determining the Adviser’s obligation to waive advisory fees and/or reimburse expenses, the following expenses are not taken into account, and could cause the total annual fund operating expenses after fee waiver and/or expense reimbursement to exceed the numbers reflected above: (1) interest; (2) taxes; (3) dividend expense on short sales; (4) extraordinary or non-routine items, including litigation expenses; and (5) expenses that the Fund has incurred but did not actually pay because of an expense offset arrangement. Unless Invesco continues the fee waiver agreement, it will terminate on June 30, 2014. The fee waiver agreement cannot be terminated during its term. The Adviser did not waive fees and/or reimburse expenses during the period under the expense limitation.
Further, the Adviser has contractually agreed, through at least April 30, 2015, to waive the advisory fee payable by the Fund in an amount equal to 100% of the net advisory fees the Adviser receives from the affiliated money market funds on investments by the Fund of uninvested cash in such affiliated money market funds.
For the year ended December 31, 2013, the Adviser waived advisory fees of $13,533.
The Trust has entered into a master administrative services agreement with Invesco pursuant to which the Fund has agreed to pay Invesco for certain administrative costs incurred in providing accounting services to the Fund. For the year ended December 31, 2013, expenses incurred under the agreement are shown in the Statement of Operations as Administrative services fees.
The Trust has entered into a transfer agency and service agreement with Invesco Investment Services, Inc. (“IIS”) pursuant to which the Fund has agreed to pay IIS a fee for providing transfer agency and shareholder services to the Fund and reimburse IIS for certain expenses incurred by IIS in the course of providing such services. IIS may make payments to intermediaries that provide omnibus account services, sub-accounting services and/or networking services. All fees payable by IIS to intermediaries that provide omnibus account services or sub-accounting are charged back to the Fund, subject to certain limitations approved by the Trust’s Board of Trustees. For the year ended December 31, 2013, expenses incurred under the agreement are shown in the Statement of Operations as Transfer agent fees.
Shares of the Fund are distributed by Invesco Distributors, Inc. (“IDI”). The Fund has adopted a distribution plan pursuant to Rule 12b-1 under the 1940 Act, and a service plan (collectively, the “Plans”) for Class A shares, Class B shares and Class C shares to compensate IDI for the sale, distribution, shareholder servicing and maintenance of shareholder accounts for these shares. Under the Plans, the Fund will incur annual fees of up to 0.25% of Class A average daily net assets and up to 1.00% each of Class B and Class C average daily net assets.
With respect to Class B and Class C shares, the Fund is authorized to reimburse in future years any distribution related expenses that exceed the maximum annual reimbursement rate for such class, so long as such reimbursement does not cause the Fund to exceed the Class B and Class C maximum annual reimbursement rate, respectively. With respect to Class A shares, distribution related expenses that exceed the maximum annual reimbursement rate for such class are not carried forward to future years and the Fund will not reimburse IDI for any such expenses.
For the year ended December 31, 2013, expenses incurred under these agreements are shown in the Statement of Operations as Distribution fees.
Front-end sales commissions and CDSC (collectively, the “sales charges”) are not recorded as expenses of the Fund. Front-end sales commissions are deducted from proceeds from the sales of Fund shares prior to investment in Class A shares of the Fund. CDSC are deducted from redemption proceeds prior to remittance to the shareholder. During the year ended December 31, 2013, IDI advised the Fund that IDI retained $9,920 in front-end sales commissions from the sale of Class A shares and $41, $5,041 and $2,865 from Class A, Class B and Class C shares, respectively, for CDSC imposed on redemptions by shareholders.
Certain officers and trustees of the Trust are officers and directors of the Adviser, IIS and/or IDI.
NOTE 3—Additional Valuation Information
GAAP defines fair value as the price that would be received to sell an asset or paid to transfer a liability in an orderly transaction between market participants at the measurement date, under current market conditions. GAAP establishes a hierarchy that prioritizes the inputs to valuation methods, giving the highest priority to readily available unadjusted quoted prices in an active market for identical assets (Level 1) and the lowest priority to significant unobservable inputs (Level 3), generally when market prices are not readily available or are unreliable. Based on the valuation inputs, the securities or other investments are tiered into one of three levels. Changes in valuation methods may result in transfers in or out of an investment’s assigned level:
| Level 1 — | Prices are determined using quoted prices in an active market for identical assets. |
| Level 2 — | Prices are determined using other significant observable inputs. Observable inputs are inputs that other market participants may use in pricing a security. These may include quoted prices for similar securities, interest rates, prepayment speeds, credit risk, yield curves, loss severities, default rates, discount rates, volatilities and others. |
| Level 3 — | Prices are determined using significant unobservable inputs. In situations where quoted prices or observable inputs are unavailable (for example, when there is little or no market activity for an investment at the end of the period), unobservable inputs may be used. Unobservable inputs reflect the Fund’s own assumptions about the factors market participants would use in determining fair value of the securities or instruments and would be based on the best available information. |
17 Invesco U.S. Mortgage Fund
The following is a summary of the tiered valuation input levels, as of December 31, 2013. The level assigned to the securities valuations may not be an indication of the risk or liquidity associated with investing in those securities. Because of the inherent uncertainties of valuation, the values reflected in the financial statements may materially differ from the value received upon actual sale of those investments.
| Level 1 | Level 2 | Level 3 | Total | |||||||||||||
Equity Securities | $ | 7,853,480 | $ | — | $ | — | $ | 7,853,480 | ||||||||
U.S. Treasury Securities | — | 1,072,615 | — | 1,072,615 | ||||||||||||
U.S. Government Sponsored Securities | — | 483,905,112 | — | 483,905,112 | ||||||||||||
Asset-Backed Securities | — | 137,439,796 | — | 137,439,796 | ||||||||||||
| $ | 7,853,480 | $ | 622,417,523 | $ | — | $ | 630,271,003 | |||||||||
Futures* | 331,404 | — | — | 331,404 | ||||||||||||
Total Investments | $ | 8,184,884 | $ | 622,417,523 | $ | — | $ | 630,602,407 | ||||||||
| * | Unrealized appreciation. |
NOTE 4—Derivative Investments
Value of Derivative Investments at Period-End
The table below summarizes the value of the Fund’s derivative investments, detailed by primary risk exposure, held as of December 31, 2013:
| Value | ||||||||
| Risk Exposure/Derivative Type | Assets | Liabilities | ||||||
Interest rate risk | ||||||||
Futures contracts(a) | $ | 476,246 | $ | (144,842 | ) | |||
| (a) | Includes cumulative appreciation (depreciation) of futures contracts. Only current day’s variation margin receivable is reported within the Statement of Assets and Liabilities. |
Effect of Derivative Investments for the year ended December 31, 2013
The table below summarizes the gains (losses) on derivative investments, detailed by primary risk exposure, recognized in earnings during the period:
| Location of Gain (Loss) on Statement of Operations | ||||
| Futures* | ||||
Realized Gain | ||||
Interest rate risk | $ | 4,033,807 | ||
Change in Unrealized Appreciation (Depreciation) | ||||
Interest rate risk | $ | (129,712 | ) | |
Total | $ | 3,904,095 | ||
| * | The average notional value of futures contracts outstanding during the period was $96,393,958. |
Offsetting Assets and Liabilities
Effective with the beginning of the Fund’s fiscal year, the Fund has adopted Accounting Standards Update (“ASU”) No. 2011-11, Disclosures about Offsetting Assets and Liabilities, which was subsequently clarified in Financial Accounting Standards Board ASU 2013-01 “Clarifying the Scope of Disclosures about Offsetting Assets and Liabilities”. This update is intended to enhance disclosures about financial instruments and derivative instruments that are subject to offsetting on the Statement of Assets and Liabilities and to enable investors to better understand the effect of those arrangements on its financial position. In order for an arrangement to be eligible for netting, the Fund must have a basis to conclude that such netting arrangements are legally enforceable. The Fund enters into netting agreements and collateral agreements in an attempt to reduce the Fund’s counterparty credit risk by providing for a single net settlement with a counterparty of all financial transactions covered by the agreement in an event of default as defined under such agreement.
There were no derivative instruments subject to a netting agreement for which the Fund is not currently netting. The following tables present derivative instruments that are either subject to an enforceable netting agreement or offset by collateral arrangements as of December 31, 2013.
| Assets: | ||||||||||||||||||||||||
| Gross amounts presented in Statement of Assets & Liabilities* | Gross amounts offset in Statement of Assets & Liabilities | Net amounts of assets presented in the Statement of Assets and Liabilities | Collateral Received | |||||||||||||||||||||
| Counterparty | Financial Instruments | Cash | Net Amount | |||||||||||||||||||||
Goldman Sachs & Co. | $ | 476,246 | $ | (144,842 | ) | $ | 331,404 | $ | — | $ | — | $ | 331,404 | |||||||||||
| Liabilities: | ||||||||||||||||||||||||
| Gross amounts presented in Statement of Assets & Liabilities* | Gross amounts offset in Statement of Assets & Liabilities | Net amounts of liabilities presented in the Statement of Assets and Liabilities | Collateral Pledged | |||||||||||||||||||||
| Counterparty | Financial Instruments | Cash | Net Amount | |||||||||||||||||||||
Goldman Sachs & Co. | $ | 144,842 | $ | (144,842 | ) | $ | — | $ | — | $ | — | $ | — | |||||||||||
| * | Includes cumulative appreciation (depreciation) of futures contracts. |
18 Invesco U.S. Mortgage Fund
| Open Futures Contracts at Period-End | ||||||||||||||||||
| Futures Contracts | Type of Contract | Number of Contracts | Expiration Month | Notional Value | Unrealized Appreciation (Depreciation) | |||||||||||||
U.S. Treasury 2 Year Notes | Short | 160 | March-2014 | $ | (35,170,000 | ) | $ | 62,164 | ||||||||||
U.S. Treasury 5 Year Notes | Short | 146 | March-2014 | (17,419,625 | ) | 219,834 | ||||||||||||
U.S. Treasury 10 Year Notes | Long | 104 | March-2014 | 12,796,875 | (144,842 | ) | ||||||||||||
U.S. Treasury 30 Year Bonds | Short | 49 | March-2014 | (6,287,313 | ) | 107,850 | ||||||||||||
Ultra U.S. Treasury Bonds | Short | 41 | March-2014 | (5,586,250 | ) | 86,398 | ||||||||||||
Total Interest Rate Risk | $ | 331,404 | ||||||||||||||||
NOTE 5—Expense Offset Arrangement(s)
The expense offset arrangements are comprised of (1) transfer agency credits which result from balances in demand deposit accounts used by the transfer agent for clearing shareholder transactions and (2) custodian credits which result from periodic overnight cash balances at the custodian. For the year ended December 31, 2013, the Fund received credits from these arrangements, which resulted in the reduction of the Fund’s total expenses of $1,799.
NOTE 6—Trustees’ and Officers’ Fees and Benefits
Trustees’ and Officers’ Fees and Benefits include amounts accrued by the Fund to pay remuneration to certain Trustees and Officers of the Fund. Trustees have the option to defer compensation payable by the Fund, and Trustees’ and Officers’ Fees and Benefits also include amounts accrued by the Fund to fund such deferred compensation amounts. Those Trustees who defer compensation have the option to select various Invesco Funds in which their deferral accounts shall be deemed to be invested. Finally, certain current Trustees were eligible to participate in a retirement plan that provided for benefits to be paid upon retirement to Trustees over a period of time based on the number of years of service. The Fund may have certain former Trustees who also participate in a retirement plan and receive benefits under such plan. Trustees’ and Officers’ Fees and Benefits include amounts accrued by the Fund to fund such retirement benefits. Obligations under the deferred compensation and retirement plans represent unsecured claims against the general assets of the Fund.
NOTE 7—Cash Balances
The Fund may borrow for leveraging in an amount up to 5% of the Fund’s total assets (excluding the amount borrowed) at the time the borrowing is made. In doing so, the Fund is permitted to temporarily carry a negative or overdrawn balance in its account with State Street Bank and Trust Company, the custodian bank. Such balances, if any at period end, are shown in the Statement of Assets and Liabilities under the payable caption Amount due custodian. To compensate the custodian bank for such overdrafts, the overdrawn Fund may either (1) leave funds as a compensating balance in the account so the custodian bank can be compensated by earning the additional interest; or (2) compensate by paying the custodian bank at a rate agreed upon by the custodian bank and Invesco, not to exceed the contractually agreed upon rate. A Fund may not purchase additional securities when any borrowings from banks exceeds 5% of the Fund’s total assets.
NOTE 8—Distributions to Shareholders and Tax Components of Net Assets
Tax Character of Distributions to Shareholders Paid During the Years Ended December 31, 2013 and 2012:
| 2013 | 2012 | |||||||
Ordinary income | $ | 18,719,573 | $ | 24,092,600 | ||||
Tax Components of Net Assets at Period-End:
| 2013 | ||||
Undistributed ordinary income | $ | 1,281,113 | ||
Net unrealized appreciation — investments | 2,350,541 | |||
Temporary book/tax differences | (69,686 | ) | ||
Capital loss carryforward | (137,500,734 | ) | ||
Shares of beneficial interest | 588,215,558 | |||
Total net assets | $ | 454,276,792 | ||
The difference between book-basis and tax-basis unrealized appreciation (depreciation) is due to differences in the timing of recognition of gains and losses on investments for tax and book purposes. The Fund’s net unrealized appreciation difference is attributable primarily to wash sales and amortization differences.
The temporary book/tax differences are a result of timing differences between book and tax recognition of income and/or expenses. The Fund’s temporary book/tax differences are the result of the trustee deferral of compensation and retirement plan benefits.
Capital loss carryforward is calculated and reported as of a specific date. Results of transactions and other activity after that date may affect the amount of capital loss carryforward actually available for the Fund to utilize. Capital losses generated in years beginning after December 22, 2010 can be carried forward for an unlimited period, whereas previous losses expire in 8 tax years. Capital losses with an expiration period may not be used to offset capital gains until all net capital losses without an expiration date have been utilized. Capital loss carryforwards with no expiration date will retain their character as either short-term or long-term capital losses instead of as short-term capital losses as under prior law. The ability to utilize capital loss carryforward in the future may be limited under the Internal Revenue Code and related regulations based on the results of future transactions.
19 Invesco U.S. Mortgage Fund
The Fund has a capital loss carryforward as of December 31, 2013, which expires as follows:
| Capital Loss Carryforward* | ||||||||||||
| Expiration | Short-Term | Long-Term | Total | |||||||||
December 31, 2014 | $ | 12,228,940 | $ | — | $ | 12,228,940 | ||||||
December 31, 2015 | 18,400,921 | — | 18,400,921 | |||||||||
December 31, 2016 | 91,151,310 | — | 91,151,310 | |||||||||
Not subject to expiration | 14,449,403 | 1,270,160 | 15,719,563 | |||||||||
| $ | 136,230,574 | $ | 1,270,160 | $ | 137,500,734 | |||||||
| * | Capital loss carryforward as of the date listed above is reduced for limitations, if any, to the extent required by the Internal Revenue Code and may be further limited depending upon a variety of factors, including the realization of net unrealized gains or losses as of the date of any reorganization. |
NOTE 9—Investment Securities
The aggregate amount of investment securities (other than short-term securities, U.S. Treasury obligations and money market funds, if any) purchased and sold by the Fund during the year ended December 31, 2013 was $3,489,323,737 and $3,639,165,927, respectively. During the same period, purchases and sales of U.S. Treasury obligations were $4,993,945 and $9,862,109, respectively. Cost of investments on a tax basis includes the adjustments for financial reporting purposes as of the most recently completed federal income tax reporting period-end.
| Unrealized Appreciation (Depreciation) of Investment Securities on a Tax Basis | ||||
Aggregate unrealized appreciation of investment securities | $ | 8,806,088 | ||
Aggregate unrealized (depreciation) of investment securities | (6,455,547 | ) | ||
Net unrealized appreciation of investment securities | $ | 2,350,541 | ||
Cost of investments for tax purposes is $627,920,462.
NOTE 10—Reclassification of Permanent Differences
Primarily as a result of differing book/tax treatment of paydowns and dollar rolls, on December 31, 2013, undistributed net investment income was increased by $11,543,305 and undistributed net realized gain (loss), was decreased by $11,543,305. This reclassification had no effect on the net assets of the Fund.
NOTE 11—Share Information
| Summary of Share Activity | ||||||||||||||||
| Years ended December 31, | ||||||||||||||||
| 2013(a) | 2012 | |||||||||||||||
| Shares | Amount | Shares | Amount | |||||||||||||
Sold: | ||||||||||||||||
Class A | 1,139,557 | $ | 14,539,629 | 2,288,136 | $ | 29,823,594 | ||||||||||
Class B | 45,634 | 577,025 | 44,841 | 581,248 | ||||||||||||
Class C | 169,393 | 2,151,995 | 379,590 | 4,912,241 | ||||||||||||
Class Y | 90,497 | 1,165,042 | 257,700 | 3,370,333 | ||||||||||||
Issued as reinvestment of dividends: | ||||||||||||||||
Class A | 1,034,477 | 13,061,779 | 1,271,561 | 16,572,786 | ||||||||||||
Class B | 8,196 | 103,128 | 15,214 | 197,177 | ||||||||||||
Class C | 16,384 | 205,278 | 19,971 | 258,428 | ||||||||||||
Class Y | 8,172 | 103,843 | 7,390 | 96,732 | ||||||||||||
Automatic conversion of Class B shares to Class A shares: | ||||||||||||||||
Class A | 92,276 | 1,171,812 | 117,616 | 1,532,967 | ||||||||||||
Class B | (92,742 | ) | (1,171,812 | ) | (118,193 | ) | (1,532,967 | ) | ||||||||
Reacquired: | ||||||||||||||||
Class A | (7,369,656 | ) | (93,351,194 | ) | (6,333,019 | ) | (82,531,057 | ) | ||||||||
Class B | (143,117 | ) | (1,814,066 | ) | (132,927 | ) | (1,721,917 | ) | ||||||||
Class C | (478,952 | ) | (6,007,408 | ) | (192,677 | ) | (2,494,118 | ) | ||||||||
Class Y | (204,462 | ) | (2,600,720 | ) | (109,360 | ) | (1,432,851 | ) | ||||||||
Net increase (decrease) in share activity | (5,684,343 | ) | $ | (71,865,669 | ) | (2,484,157 | ) | $ | (32,367,404 | ) | ||||||
| (a) | There are entities that are record owners of more than 5% of the outstanding shares of the Fund and in the aggregate own 19% of the outstanding shares of the Fund. IDI has an agreement with these entities to sell Fund shares. The Fund, Invesco and/or Invesco affiliates may make payments to these entities, which are considered to be related to the Fund, for providing services to the Fund, Invesco and/or Invesco affiliates including but not limited to services such as securities brokerage, distribution, third party record keeping and account servicing. The Fund has no knowledge as to whether all or any portion of the shares owned of record by these entities are also owned beneficially. |
20 Invesco U.S. Mortgage Fund
NOTE 12—Financial Highlights
The following schedule presents financial highlights for a share of the Fund outstanding throughout the periods indicated.
| Net asset value, beginning of period | Net investment income(a) | Net gains (losses) on securities (both realized and unrealized) | Total from investment operations | Dividends from net investment income | Net asset value, end of period | Total return | Net assets, end of period (000’s omitted) | Ratio of expenses to average net assets with fee waivers and/or expenses absorbed | Ratio of expenses to average net assets without fee waivers and/or expenses absorbed | Ratio of net investment income to average net assets | Portfolio turnover(b) | |||||||||||||||||||||||||||||||||||||
Class A |
| |||||||||||||||||||||||||||||||||||||||||||||||
Year ended 12/31/13 | $ | 13.02 | $ | 0.21 | $ | (0.40 | ) | $ | (0.19 | ) | $ | (0.48 | ) | $ | 12.35 | (1.51 | )%(c)(l) | $ | 441,028 | 0.94 | %(d)(l) | 0.94 | %(d)(l) | 1.63 | %(d)(l) | 475 | % | |||||||||||||||||||||
Year ended 12/31/12 | 12.99 | 0.25 | 0.33 | 0.58 | (0.55 | ) | 13.02 | 4.54 | (c) | 531,547 | 0.94 | 0.94 | 1.88 | 451 | ||||||||||||||||||||||||||||||||||
Year ended 12/31/11 | 13.00 | 0.39 | 0.26 | 0.65 | (0.66 | ) | 12.99 | 5.06 | (c) | 564,871 | 0.90 | 0.90 | 2.99 | 395 | ||||||||||||||||||||||||||||||||||
Year ended 12/31/10 | 12.75 | 0.40 | 0.28 | 0.68 | (0.43 | ) | 13.00 | 5.41 | (c) | 610,214 | 0.91 | 0.91 | 3.07 | 370 | ||||||||||||||||||||||||||||||||||
Year ended 12/31/09 | 12.22 | 0.38 | 0.49 | 0.87 | (0.34 | ) | 12.75 | 7.19 | (e) | 687,365 | 0.96 | 0.96 | 3.03 | 589 | ||||||||||||||||||||||||||||||||||
Class B |
| |||||||||||||||||||||||||||||||||||||||||||||||
Year ended 12/31/13 | 12.95 | 0.11 | (0.40 | ) | (0.29 | ) | (0.38 | ) | 12.28 | (2.28 | )(c) | 3,197 | 1.70 | (d) | 1.70 | (d) | 0.87 | (d) | 475 | |||||||||||||||||||||||||||||
Year ended 12/31/12 | 12.93 | 0.15 | 0.32 | 0.47 | (0.45 | ) | 12.95 | 3.67 | (c) | 5,729 | 1.69 | 1.69 | 1.13 | 451 | ||||||||||||||||||||||||||||||||||
Year ended 12/31/11 | 12.92 | 0.29 | 0.27 | 0.56 | (0.55 | ) | 12.93 | 4.43 | (c) | 8,186 | 1.66 | 1.66 | 2.23 | 395 | ||||||||||||||||||||||||||||||||||
Year ended 12/31/10 | 12.67 | 0.31 | 0.27 | 0.58 | (0.33 | ) | 12.92 | 4.64 | (c) | 13,574 | 1.67 | 1.67 | 2.37 | 370 | ||||||||||||||||||||||||||||||||||
Year ended 12/31/09 | 12.15 | 0.28 | 0.49 | 0.77 | (0.25 | ) | 12.67 | 6.35 | (f) | 22,787 | 1.71 | 1.71 | 2.24 | 589 | ||||||||||||||||||||||||||||||||||
Class C |
| |||||||||||||||||||||||||||||||||||||||||||||||
Year ended 12/31/13 | 12.93 | 0.11 | (0.40 | ) | (0.29 | ) | (0.38 | ) | 12.26 | (2.29 | )(c) | 7,788 | 1.70 | (d) | 1.70 | (d) | 0.87 | (d) | 475 | |||||||||||||||||||||||||||||
Year ended 12/31/12 | 12.90 | 0.15 | 0.33 | 0.48 | (0.45 | ) | 12.93 | 3.75 | (c) | 12,003 | 1.69 | 1.69 | 1.13 | 451 | ||||||||||||||||||||||||||||||||||
Year ended 12/31/11 | 12.91 | 0.29 | 0.25 | 0.54 | (0.55 | ) | 12.90 | 4.27 | (c) | 9,308 | 1.66 | 1.66 | 2.23 | 395 | ||||||||||||||||||||||||||||||||||
Year ended 12/31/10 | 12.66 | 0.30 | 0.28 | 0.58 | (0.33 | ) | 12.91 | 4.64 | (c) | 9,559 | 1.67 | 1.67 | 2.33 | 370 | ||||||||||||||||||||||||||||||||||
Year ended 12/31/09 | 12.14 | 0.28 | 0.49 | 0.77 | (0.25 | ) | 12.66 | 6.36 | (g) | 12,159 | 1.71 | 1.71 | 2.26 | 589 | ||||||||||||||||||||||||||||||||||
Class Y(h) |
| |||||||||||||||||||||||||||||||||||||||||||||||
Year ended 12/31/13 | 13.07 | 0.24 | (0.41 | ) | (0.17 | ) | (0.51 | ) | 12.39 | (1.32 | )(c) | 2,254 | 0.70 | (d) | 0.70 | (d) | 1.87 | (d) | 475 | |||||||||||||||||||||||||||||
Year ended 12/31/12 | 13.04 | 0.28 | 0.33 | 0.61 | (0.58 | ) | 13.07 | 4.79 | (c) | 3,759 | 0.69 | 0.69 | 2.13 | 451 | ||||||||||||||||||||||||||||||||||
Year ended 12/31/11 | 13.04 | 0.42 | 0.27 | 0.69 | (0.69 | ) | 13.04 | 5.40 | (c) | 1,721 | 0.66 | 0.66 | 3.23 | 395 | ||||||||||||||||||||||||||||||||||
Year ended 12/31/10 | 12.79 | 0.42 | 0.30 | 0.72 | (0.47 | ) | 13.04 | 5.65 | (c) | 2,353 | 0.67 | 0.67 | 3.26 | 370 | ||||||||||||||||||||||||||||||||||
Year ended 12/31/09 | 12.26 | 0.42 | 0.48 | 0.90 | (0.37 | ) | 12.79 | 7.42 | (i) | 23,905 | 0.71 | 0.71 | 3.35 | 589 | ||||||||||||||||||||||||||||||||||
Class R5 |
| |||||||||||||||||||||||||||||||||||||||||||||||
Year ended 12/31/13 | 13.06 | 0.25 | (0.41 | ) | (0.16 | ) | (0.51 | ) | 12.39 | (1.23 | )(c) | 10 | 0.66 | (d) | 0.66 | (d) | 1.91 | (d) | 475 | |||||||||||||||||||||||||||||
Year ended 12/31/12 | 13.03 | 0.28 | 0.33 | 0.61 | (0.58 | ) | 13.06 | 4.80 | (c) | 10 | 0.65 | 0.65 | 2.17 | 451 | ||||||||||||||||||||||||||||||||||
Year ended 12/31/11 | 13.04 | 0.43 | 0.26 | 0.69 | (0.70 | ) | 13.03 | 5.38 | (c) | 10 | 0.63 | 0.63 | 3.26 | 395 | ||||||||||||||||||||||||||||||||||
Year ended 12/31/10(j) | 13.06 | 0.35 | (0.09 | ) | 0.26 | (0.28 | ) | 13.04 | 2.00 | (c) | 10 | 0.59 | (k) | 0.59 | (k) | 4.51 | (k) | 370 | ||||||||||||||||||||||||||||||
| (a) | Calculated using average shares outstanding. |
| (b) | Portfolio turnover is calculated at the fund level and is not annualized for periods less than one year, if applicable. |
| (c) | Includes adjustments in accordance with accounting principles generally accepted in the United States of America and as such, the net asset value for financial reporting purposes and the returns based upon those net asset values may differ from the net asset value and returns for shareholder transactions. Does not include sales charges and is not annualized for periods less than one year, if applicable. |
| (d) | Ratios are based on average daily net assets (000’s omitted) of $485,707, $4,315, $10,309, $3,202 and $10 for Class A, Class B, Class C, Class Y and Class R5 shares, respectively. |
| (e) | Assumes reinvestment of all distributions for the period and does not include payment of the maximum sales charge of 4.75% or contingent deferred sales charge (CDSC). On purchases of $1 million or more, a CDSC of 1% may be imposed on certain redemptions made within eighteen months of purchase. If the sales charges were included, total returns would be lower. These returns include combined Rule 12b-1 fees and service fees of up to 0.25% and do not reflect the deduction of taxes that a shareholder would pay on Fund distributions or the redemption of Fund shares. |
| (f) | Assumes reinvestment of all distributions for the period and does not include payment of the maximum CDSC of 4%, charged on certain redemptions made within one year of purchase and declining to 0% after the fifth year. If the sales charge was included, total returns would be lower. These returns include combined Rule 12b-1 fees and service fees of up to 1% and do not reflect the deduction of taxes that a shareholder would pay on Fund distributions or the redemption of Fund shares. |
| (g) | Assumes reinvestment of all distributions for the period and does not include payment of the maximum CDSC of 1%, charged on certain redemptions made within one year of purchase. If the sales charge was included, total returns would be lower. These returns include combined Rule 12b-1 fees and service fees of up to 1% and do not reflect the deduction of taxes that a shareholder would pay on Fund distributions or the redemption of Fund shares. |
| (h) | On June 1, 2010, the Fund’s former Class I shares of Invesco Van Kampen U.S. Mortgage Fund were reorganized into Class Y shares of the Fund. |
| (i) | Assumes reinvestment of all distributions for the period. These returns do not reflect the deduction of taxes that a shareholder would pay on Fund distributions or the redemption on Fund shares. |
| (j) | Commencement date of June 1, 2010. |
| (k) | Annualized. |
| (l) | The total return, ratio of expenses to average net assets and ratio of net investment income to average net assets reflect actual 12b-1 fees of 0.24% for the year ended December 31, 2013. |
21 Invesco U.S. Mortgage Fund
Report of Independent Registered Public Accounting Firm
To the Board of Trustees of AIM Growth Series (Invesco Growth Series)
and Shareholders of Invesco U.S. Mortgage Fund:
In our opinion, the accompanying statement of assets and liabilities, including the schedule of investments, and the related statements of operations and of changes in net assets and the financial highlights present fairly, in all material respects, the financial position of Invesco U.S. Mortgage Fund (one of the funds constituting AIM Growth Series (Invesco Growth Series), hereafter referred to as the “Fund”) at December 31, 2013, the results of its operations for the year then ended, the changes in its net assets for each of the two years in the period then ended and the financial highlights for each of the four years in the period then ended, in conformity with accounting principles generally accepted in the United States of America. These financial statements and financial highlights (hereafter referred to as “financial statements”) are the responsibility of the Fund’s management; our responsibility is to express an opinion on these financial statements based on our audits. We conducted our audits of these financial statements in accordance with the standards of the Public Company Accounting Oversight Board (United States). Those standards require that we plan and perform the audit to obtain reasonable assurance about whether the financial statements are free of material misstatement. An audit includes examining, on a test basis, evidence supporting the amounts and disclosures in the financial statements, assessing the accounting principles used and significant estimates made by management, and evaluating the overall financial statement presentation. We believe that our audits, which included confirmation of securities at December 31, 2013 by correspondence with the custodian and brokers, provide a reasonable basis for our opinion. The financial highlights of the Fund for the period ended December 31, 2009 were audited by another independent registered public accounting firm whose report dated February 19, 2010 expressed an unqualified opinion on such financial statement.
PRICEWATERHOUSECOOPERS LLP
February 26, 2014
Houston, Texas
22 Invesco U.S. Mortgage Fund
Calculating your ongoing Fund expenses
Example
As a shareholder of the Fund, you incur two types of costs: (1) transaction costs, which may include sales charges (loads) on purchase payments or contingent deferred sales charges on redemptions, if any; and (2) ongoing costs, including management fees, distribution and/or service (12b-1) fees, and other Fund expenses. This example is intended to help you understand your ongoing costs (in dollars) of investing in the Fund and to compare these costs with ongoing costs of investing in other mutual funds. The example is based on an investment of $1,000 invested at the beginning of the period and held for the entire period July 1, 2013 through December 31, 2013.
Actual expenses
The table below provides information about actual account values and actual expenses. You may use the information in this table, together with the amount you invested, to estimate the expenses that you paid over the period. Simply divide your account value by $1,000 (for example, an $8,600 account value divided by $1,000 = 8.6), then multiply the result by the number in the table under the heading entitled “Actual Expenses Paid During Period” to estimate the expenses you paid on your account during this period.
Hypothetical example for comparison purposes
The table below also provides information about hypothetical account values and hypothetical expenses based on the Fund’s actual expense ratio and an assumed rate of return of 5% per year before expenses, which is not the Fund’s actual return.
The hypothetical account values and expenses may not be used to estimate the actual ending account balance or expenses you paid for the period. You may use this information to compare the ongoing costs of investing in the Fund and other funds. To do so, compare this 5% hypothetical example with the 5% hypothetical examples that appear in the shareholder reports of the other funds.
Please note that the expenses shown in the table are meant to highlight your ongoing costs only and do not reflect any transaction costs, such as sales charges (loads) on purchase payments or contingent deferred sales charges on redemptions, if any. Therefore, the hypothetical information is useful in comparing ongoing costs only, and will not help you determine the relative total costs of owning different funds. In addition, if these transaction costs were included, your costs would have been higher.
| Class | Beginning Account Value (07/01/13) | ACTUAL | HYPOTHETICAL (5% annual return before expenses) | Annualized Expense Ratio | ||||||||||||||||||||
| Ending Account Value (12/31/13)1 | Expenses Paid During Period2 | Ending Account Value (12/31/13) | Expenses Paid During Period2 | |||||||||||||||||||||
| A | $ | 1,000.00 | $ | 1,004.10 | $ | 4.75 | $ | 1,020.47 | $ | 4.79 | 0.94 | % | ||||||||||||
| B | 1,000.00 | 1,000.20 | 8.57 | 1,016.64 | 8.64 | 1.70 | ||||||||||||||||||
| C | 1,000.00 | 1,000.20 | 8.57 | 1,016.64 | 8.64 | 1.70 | ||||||||||||||||||
| Y | 1,000.00 | 1,005.40 | 3.54 | 1,021.68 | 3.57 | 0.70 | ||||||||||||||||||
| R5 | 1,000.00 | 1,005.50 | 3.24 | 1,021.98 | 3.26 | 0.64 | ||||||||||||||||||
| 1 | The actual ending account value is based on the actual total return of the Fund for the period July 1, 2013 through December 31, 2013, after actual expenses and will differ from the hypothetical ending account value which is based on the Fund’s expense ratio and a hypothetical annual return of 5% before expenses. |
| 2 | Expenses are equal to the Fund’s annualized expense ratio as indicated above multiplied by the average account value over the period, multiplied by 184/365 to reflect the most recent fiscal half year. |
23 Invesco U.S. Mortgage Fund
Tax Information
Form 1099-DIV, Form 1042-S and other year–end tax information provide shareholders with actual calendar year amounts that should be included in their tax returns. Shareholders should consult their tax advisors.
The following distribution information is being provided as required by the Internal Revenue Code or to meet a specific state’s requirement.
The Fund designates the following amounts or, if subsequently determined to be different, the maximum amount allowable for its fiscal year ended December 31, 2013:
Federal and State Income Tax | ||||
Qualified Dividend Income* | 0 | % | ||
Corporate Dividends Received Deduction* | 0 | % | ||
U.S. Treasury Obligations* | 0.24 | % | ||
| * | The above percentages are based on ordinary income dividends paid to shareholders during the Fund’s fiscal year. |
Distribution Notice
Form 1099-DIV for 2013 report distributions for federal income tax purposes. The Fund’s annual report to shareholders will include information regarding the tax character of Fund distributions for the fiscal year. This Notice is sent to comply with certain Securities and Exchange Commission requirements.
Shareholders were sent a notice from the Fund that set forth an estimate on a per share basis of the source or sources from which the distribution was paid in November 2013. Subsequently, certain of these estimates have been corrected. Listed below is a written statement of the sources of this distribution, as corrected, on a generally accepted accounting principles (“GAAP”) basis and as noted above are not being provided for tax reporting purposes.
During the month of November 2013, the Fund declared a monthly distribution, which was payable to shareholders on November 29, 2013. This distribution, determined in accordance with generally accepted accounting principles, is estimated to be from the following sources: (1) $0.0290 (Class A), $0.0209 (Class B), $0.0208 (Class C), $0.0317 (Class Y), and $0.0319 (Class R5) per share from net investment income; and (2) $0.0232 (Class A), $0.0232 (Class B), $0.0232 (Class C), $0.0232 (Class Y), and $0.0232 (Class R5) per share from return of principal.
24 Invesco U.S. Mortgage Fund
Trustees and Officers
The address of each trustee and officer is AIM Growth Series (Invesco Growth Series) (the “Trust”), 11 Greenway Plaza, Suite 1000, Houston, Texas 77046-1173. The trustees serve for the life of the Trust, subject to their earlier death, incapacitation, resignation, retirement or removal as more specifically provided in the Trust’s organizational documents. Each officer serves for a one year term or until their successors are elected and qualified. Column two below includes length of time served with predecessor entities, if any.
| Name, Year of Birth and Position(s) Held with the Trust | Trustee and/ or Officer Since | Principal Occupation(s) During Past 5 Years | Number of Funds in Fund Complex Overseen by Trustee | Other Directorship(s) Held by Trustee During Past 5 Years | ||||
| Interested Persons | ||||||||
| Martin L. Flanagan1 — 1960 Trustee | 2007 | Executive Director, Chief Executive Officer and President, Invesco Ltd. (ultimate parent of Invesco and a global investment management firm); Advisor to the Board, Invesco Advisers, Inc. (formerly known as Invesco Institutional (N.A.), Inc.); Trustee, The Invesco Funds; Vice Chair, Investment Company Institute; and Member of Executive Board, SMU Cox School of Business
Formerly: Chairman and Chief Executive Officer, Invesco Advisers, Inc. (registered investment adviser); Director, Chairman, Chief Executive Officer and President, IVZ Inc. (holding company), INVESCO Group Services, Inc. (service provider) and Invesco North American Holdings, Inc. (holding company); Director, Chief Executive Officer and President, Invesco Holding Company Limited (parent of Invesco and a global investment management firm); Director, Invesco Ltd.; Chairman, Investment Company Institute and President, Co-Chief Executive Officer, Co-President, Chief Operating Officer and Chief Financial Officer, Franklin Resources, Inc. (global investment management organization) | 123 | None | ||||
| Philip A. Taylor2 — 1954 Trustee, President and Principal Executive Officer | 2006 | Head of North American Retail and Senior Managing Director, Invesco Ltd.; Director, Co-Chairman, Co-President and Co-Chief Executive Officer, Invesco Advisers, Inc. (formerly known as Invesco Institutional (N.A.), Inc.) (registered investment adviser); Director, Chairman, Chief Executive Officer and President, Invesco Management Group, Inc. (formerly known as Invesco Aim Management Group, Inc.) (financial services holding company); Director and President, INVESCO Funds Group, Inc. (registered investment adviser and registered transfer agent); Director and Chairman, Invesco Investment Services, Inc. (formerly known as Invesco Aim Investment Services, Inc.) (registered transfer agent) and IVZ Distributors, Inc. (formerly known as INVESCO Distributors, Inc.) (registered broker dealer); Director, President and Chairman, Invesco Inc. (holding company) and Invesco Canada Holdings Inc. (holding company); Chief Executive Officer, Invesco Corporate Class Inc. (corporate mutual fund company) and Invesco Canada Fund Inc. (corporate mutual fund company); Director, Chairman and Chief Executive Officer, Invesco Canada Ltd. (formerly known as Invesco Trimark Ltd./Invesco Trimark Ltèe) (registered investment adviser and registered transfer agent); Trustee, President and Principal Executive Officer, The Invesco Funds (other than AIM Treasurer’s Series Trust (Invesco Treasurer’s Series Trust) and Short-Term Investments Trust); Trustee and Executive Vice President, The Invesco Funds (AIM Treasurer’s Series Trust (Invesco Treasurer’s Series Trust) and Short-Term Investments Trust only); Director, Invesco Investment Advisers LLC (formerly known as Van Kampen Asset Management); Director, Chief Executive Officer and President, Van Kampen Exchange Corp.
Formerly: Director and Chairman, Van Kampen Investor Services Inc.: Director, Chief Executive Officer and President, 1371 Preferred Inc. (holding company); and Van Kampen Investments Inc.; Director and President, AIM GP Canada Inc. (general partner for limited partnerships); and Van Kampen Advisors, Inc.; Director and Chief Executive Officer, Invesco Trimark Dealer Inc. (registered broker dealer); Director, Invesco Distributors, Inc. (formerly known as Invesco Aim Distributors, Inc.) (registered broker dealer); Manager, Invesco PowerShares Capital Management LLC; Director, Chief Executive Officer and President, Invesco Advisers, Inc.; Director, Chairman, Chief Executive Officer and President, Invesco Aim Capital Management, Inc.; President, Invesco Trimark Dealer Inc. and Invesco Trimark Ltd./Invesco Trimark Ltèe; Director and President, AIM Trimark Corporate Class Inc. and AIM Trimark Canada Fund Inc.; Senior Managing Director, Invesco Holding Company Limited; Trustee and Executive Vice President, Tax-Free Investments Trust; Director and Chairman, Fund Management Company (former registered broker dealer); President and Principal Executive Officer, The Invesco Funds (AIM Treasurer’s Series Trust (Invesco Treasurer’s Series Trust), Short-Term Investments Trust and Tax-Free Investments Trust only); President, AIM Trimark Global Fund Inc. and AIM Trimark Canada Fund Inc. | 123 | None | ||||
Wayne W. Whalen3 — 1939 Trustee | 2010 | Of Counsel, and prior to 2010, partner in the law firm of Skadden, Arps, Slate, Meagher & Flom LLP, legal counsel to certain funds in the Fund Complex | 136 | Director of the Mutual Fund Directors Forum, a nonprofit membership organization for investment directors; Chairman and Director of the Abraham Lincoln Presidential Library Foundation; and Director of the Stevenson Center for Democracy |
| 1 | Mr. Flanagan is considered an interested person of the Trust because he is an officer of the adviser to the Trust, and an officer and a director of Invesco Ltd., ultimate parent of the adviser to the Trust. |
| 2 | Mr. Taylor is considered an interested person of the Trust because he is an officer and a director of the adviser to, and a director of the principal underwriter of, the Trust. |
| 3 | Mr. Whalen is considered an “interested person” (within the meaning of Section 2(a)(19) of the 1940 Act) of certain Funds in the Invesco Fund Complex because he and his firm currently provide legal services as legal counsel to such Funds. |
T-1 Invesco U.S. Mortgage Fund
Trustees and Officers—(continued)
| Name, Year of Birth and Position(s) Held with the Trust | Trustee and/ or Officer Since | Principal Occupation(s) During Past 5 Years | Number of Funds in Fund Complex Overseen by Trustee | Other Directorship(s) Held by Trustee During Past 5 Years | ||||
| Independent Trustees | ||||||||
Bruce L. Crockett — 1944 Trustee and Chair | 2001 | Chairman, Crockett Technologies Associates (technology consulting company)
Formerly: Director, Captaris (unified messaging provider); Director, President and Chief Executive Officer COMSAT Corporation; and Chairman, Board of Governors of INTELSAT (international communications company) | 123 | ACE Limited (insurance company); Investment Company Institute | ||||
David C. Arch — 1945 Trustee | 2010 | Chairman and Chief Executive Officer of Blistex Inc., (consumer health care products manufacturer)
Formerly: Member of the Heartland Alliance Advisory Board, a nonprofit organization serving human needs based in Chicago | 136 | Board member of the Illinois Manufacturers’ Association; Member of the Board of Visitors, Institute for the Humanities, University of Michigan | ||||
Frank S. Bayley — 1939 Trustee | 1985 | Retired
Formerly: Director, Badgley Funds, Inc. (registered investment company) (2 portfolios) and General Partner and Of Counsel, law firm of Baker & McKenzie, LLP | 123 | Director and Chairman, C.D. Stimson Company (a real estate investment company); Trustee and Overseer, The Curtis Institute of Music | ||||
James T. Bunch — 1942 Trustee | 2003 | Managing Member, Grumman Hill Group LLC (family office private equity management)
Formerly: Founder, Green, Manning & Bunch Ltd. (investment banking firm) (1988-2010); Executive Committee, United States Golf Association; and Director, Policy Studies, Inc. and Van Gilder Insurance Corporation | 123 | Chairman, Board of Governors, Western Golf Association; Chairman-elect, Evans Scholars Foundation; and Director, Denver Film Society | ||||
Rodney F. Dammeyer — 1940 Trustee | 2010 | Chairman of CAC, LLC, (private company offering capital investment and management advisory services)
Formerly: Prior to 2001, Managing Partner at Equity Group Corporate Investments; Prior to 1995, Chief Executive Officer of Itel Corporation (formerly Anixter International); Prior to 1985, experience includes Senior Vice President and Chief Financial Officer of Household International, Inc., Executive Vice President and Chief Financial Officer of Northwest Industries, Inc. and Partner of Arthur Andersen & Co.; From 1987 to 2010, Director/Trustee of investment companies in the Van Kampen Funds complex | 123 | Director of Quidel Corporation and Stericycle, Inc.; Prior to May 2008, Trustee of The Scripps Research Institute; Prior to February 2008, Director of Ventana Medical Systems, Inc. | ||||
Albert R. Dowden — 1941 Trustee | 2001 | Director of a number of public and private business corporations, including the Boss Group, Ltd. (private investment and management); and Reich & Tang Funds (5 portfolios) (registered investment company)
Formerly: Director, Homeowners of America Holding Corporation/Homeowners of America Insurance Company (property casualty company); Director, Continental Energy Services, LLC (oil and gas pipeline service); Director, CompuDyne Corporation (provider of product and services to the public security market) and Director, Annuity and Life Re (Holdings), Ltd. (reinsurance company); Director, President and Chief Executive Officer, Volvo Group North America, Inc.; Senior Vice President, AB Volvo; Director of various public and private corporations; Chairman, DHJ Media, Inc.; Director, Magellan Insurance Company; and Director, The Hertz Corporation, Genmar Corporation (boat manufacturer), National Media Corporation; Advisory Board of Rotary Power International (designer, manufacturer, and seller of rotary power engines); and Chairman, Cortland Trust, Inc. (registered investment company) | 123 | Director of Nature’s Sunshine Products, Inc. | ||||
Jack M. Fields — 1952 Trustee | 2001 | Chief Executive Officer, Twenty First Century Group, Inc. (government affairs company); Owner and Chief Executive Officer, Dos Angeles Ranch, L.P. (cattle, hunting, corporate entertainment); and Discovery Global Education Fund (non-profit)
Formerly: Chief Executive Officer, Texana Timber LP (sustainable forestry company); Director of Cross Timbers Quail Research Ranch (non-profit); and member of the U.S. House of Representatives | 123 | Insperity, Inc. (formerly known as Administaff) | ||||
Prema Mathai-Davis — 1950 Trustee | 2001 | Retired
Formerly: Chief Executive Officer, YWCA of the U.S.A. | 123 | None | ||||
Larry Soll — 1942 Trustee | 2003 | Retired
Formerly: Chairman, Chief Executive Officer and President, Synergen Corp. (a biotechnology company) | 123 | None | ||||
Hugo F. Sonnenschein — 1940 Trustee | 2010 | Distinguished Service Professor and President Emeritus of the University of Chicago and the Adam Smith Distinguished Service Professor in the Department of Economics at the University of Chicago
Formerly: President of the University of Chicago | 136 | Trustee of the University of Rochester and a member of its investment committee. Member of the National Academy of Sciences, the American Philosophical Society and a fellow of the American Academy of Arts and Sciences |
T-2 Invesco U.S. Mortgage Fund
Trustees and Officers—(continued)
| Name, Year of Birth and Position(s) Held with the Trust | Trustee and/ or Officer Since | Principal Occupation(s) During Past 5 Years | Number of Funds in Fund Complex Overseen by Trustee | Other Directorship(s) Held by Trustee During Past 5 Years | ||||
| Independent Trustees—(continued) | ||||||||
Raymond Stickel, Jr. — 1944 Trustee | 2005 | Retired
Formerly: Director, Mainstay VP Series Funds, Inc. (25 portfolios) and Partner, Deloitte & Touche | 123 | None | ||||
| Other Officers | ||||||||
| Russell C. Burk — 1958 Senior Vice President and Senior Officer | 2005 | Senior Vice President and Senior Officer, The Invesco Funds | N/A | N/A | ||||
| John M. Zerr — 1962 Senior Vice President, Chief Legal Officer and Secretary | 2006 | Director, Senior Vice President, Secretary and General Counsel, Invesco Management Group, Inc. (formerly known as Invesco Aim Management Group, Inc.) and Van Kampen Exchange Corp.; Senior Vice President, Invesco Advisers, Inc. (formerly known as Invesco Institutional (N.A.), Inc.) (registered investment adviser); Senior Vice President and Secretary, Invesco Distributors, Inc. (formerly known as Invesco Aim Distributors, Inc.); Director, Vice President and Secretary, Invesco Investment Services, Inc. (formerly known as Invesco Aim Investment Services, Inc.) and IVZ Distributors, Inc. (formerly known as INVESCO Distributors, Inc.); Director and Vice President, INVESCO Funds Group, Inc.; Senior Vice President, Chief Legal Officer and Secretary, The Invesco Funds; Manager, Invesco PowerShares Capital Management LLC; Director, Secretary and General Counsel, Invesco Investment Advisers LLC (formerly known as Van Kampen Asset Management); Secretary and General Counsel, Invesco Capital Markets, Inc. (formerly known as Van Kampen Funds Inc.) and Chief Legal Officer, PowerShares Exchange-Traded Fund Trust, PowerShares Exchange-Traded Fund Trust II, PowerShares India Exchange-Traded Fund Trust and PowerShares Actively Managed Exchange-Traded Fund Trust
Formerly: Director and Vice President, Van Kampen Advisors Inc.; Director, Vice President, Secretary and General Counsel, Van Kampen Investor Services Inc.; Director, Invesco Distributors, Inc. (formerly known as Invesco Aim Distributors, Inc.); Director, Senior Vice President, General Counsel and Secretary, Invesco Aim Advisers, Inc. and Van Kampen Investments Inc.; Director, Vice President and Secretary, Fund Management Company; Director, Senior Vice President, Secretary, General Counsel and Vice President, Invesco Aim Capital Management, Inc.; Chief Operating Officer and General Counsel, Liberty Ridge Capital, Inc. (an investment adviser); Vice President and Secretary, PBHG Funds (an investment company) and PBHG Insurance Series Fund (an investment company); Chief Operating Officer, General Counsel and Secretary, Old Mutual Investment Partners (a broker-dealer); General Counsel and Secretary, Old Mutual Fund Services (an administrator) and Old Mutual Shareholder Services (a shareholder servicing center); Executive Vice President, General Counsel and Secretary, Old Mutual Capital, Inc. (an investment adviser); and Vice President and Secretary, Old Mutual Advisors Funds (an investment company) | N/A | N/A | ||||
| Karen Dunn Kelley — 1960 Vice President | 2004 | Senior Managing Director, Investments; Director, Co-President, Co-Chief Executive Officer, and Co-Chairman, Invesco Advisers, Inc. (formerly known as Invesco Institutional (N.A.), Inc.) (registered investment adviser); Chairman, Invesco Senior Secured Management, Inc.; Senior Vice President, Invesco Management Group, Inc. (formerly known as Invesco Aim Management Group, Inc.); Executive Vice President, Invesco Distributors, Inc. (formerly known as Invesco Aim Distributors, Inc.); Director, Invesco Mortgage Capital Inc., and Invesco Management Company Limited; Director and President, INVESCO Asset Management (Bermuda) Ltd., Vice President, The Invesco Funds (other than AIM Treasurer’s Series Trust (Invesco Treasurer’s Series Trust) and Short-Term Investments Trust); and President and Principal Executive Officer, The Invesco Funds (AIM Treasurer’s Series Trust (Invesco Treasurer’s Series Trust) and Short-Term Investments Trust only)
Formerly: Director, INVESCO Global Asset Management Limited and INVESCO Management S.A.; Senior Vice President, Van Kampen Investments Inc. and Invesco Advisers, Inc. (formerly known as Invesco Institutional (N.A.), Inc.) (registered investment adviser); Vice President, Invesco Advisers, Inc. (formerly known as Invesco Institutional (N.A.), Inc.); Director of Cash Management and Senior Vice President, Invesco Advisers, Inc. and Invesco Aim Capital Management, Inc.; President and Principal Executive Officer, Tax-Free Investments Trust; Director and President, Fund Management Company; Chief Cash Management Officer, Director of Cash Management, Senior Vice President, and Managing Director, Invesco Aim Capital Management, Inc.; Director of Cash Management, Senior Vice President, and Vice President, Invesco Advisers, Inc. and The Invesco Funds (AIM Treasurer’s Series Trust (Invesco Treasurer’s Series Trust), Short-Term Investments Trust and Tax-Free Investments Trust only) | N/A | N/A | ||||
T-3 Invesco U.S. Mortgage Fund
Trustees and Officers—(continued)
| Name, Year of Birth and Position(s) Held with the Trust | Trustee and/ or Officer Since | Principal Occupation(s) During Past 5 Years | Number of Funds in Fund Complex Overseen by Trustee | Other Directorship(s) Held by Trustee During Past 5 Years | ||||
| Other Officers—(continued) | ||||||||
| Sheri Morris — 1964 Vice President, Treasurer and Principal Financial Officer | 1999 | Vice President, Treasurer and Principal Financial Officer, The Invesco Funds; Vice President, Invesco Advisers, Inc. (formerly known as Invesco Institutional (N.A.), Inc.) (registered investment adviser); and Vice President, PowerShares Exchange-Traded Fund Trust, PowerShares Exchange-Traded Fund Trust II, PowerShares India Exchange-Traded Fund Trust and PowerShares Actively Managed Exchange-Traded Fund Trust
Formerly: Vice President, Invesco Aim Advisers, Inc., Invesco Aim Capital Management, Inc. and Invesco Aim Private Asset Management, Inc.; Assistant Vice President and Assistant Treasurer, The Invesco Funds and Assistant Vice President, Invesco Advisers, Inc., Invesco Aim Capital Management, Inc. and Invesco Aim Private Asset Management, Inc.; and Treasurer, PowerShares Exchange-Traded Fund Trust, PowerShares Exchange-Traded Fund Trust II, PowerShares India Exchange-Traded Fund Trust and PowerShares Actively Managed Exchange-Traded Fund Trust | N/A | N/A | ||||
Crissie M. Wisdom — 1969 Anti-Money Laundering Compliance Officer | 2013 | Anti-Money Laundering Compliance Officer, Invesco Advisers, Inc. (formerly known as Invesco Institutional (N.A.), Inc.) (registered investment adviser), Invesco Capital Markets, Inc. (formerly known as Van Kampen Funds Inc.), Invesco Distributors, Inc., Invesco Investment Services, Inc., Invesco Management Group, Inc., Van Kampen Exchange Corp., The Invesco Funds, Invesco Funds (Chicago), and PowerShares Exchange-Traded Fund Trust, PowerShares Exchange-Traded Fund Trust II, PowerShares India Exchange-Traded Fund Trust, and PowerShares Actively Managed Exchange-Traded Fund Trust; and Fraud Prevention Manager and Controls and Risk Analysis Manager for Invesco Investment Services, Inc. | N/A | N/A | ||||
| Todd L. Spillane — 1958 Chief Compliance Officer | 2006 | Senior Vice President, Invesco Management Group, Inc. (formerly known as Invesco Aim Management Group, Inc.) and Van Kampen Exchange Corp.; Senior Vice President and Chief Compliance Officer, Invesco Advisers, Inc. (registered investment adviser) (formerly known as Invesco Institutional (N.A.), Inc.); Chief Compliance Officer, The Invesco Funds; Vice President, Invesco Distributors, Inc. (formerly known as Invesco Aim Distributors, Inc.) and Invesco Investment Services, Inc. (formerly known as Invesco Aim Investment Services, Inc.)
Formerly: Chief Compliance Officer, Invesco Funds (Chicago); Senior Vice President, Van Kampen Investments Inc.; Senior Vice President and Chief Compliance Officer, Invesco Aim Advisers, Inc. and Invesco Aim Capital Management, Inc.; Chief Compliance Officer, INVESCO Private Capital Investments, Inc. (holding company), Invesco Private Capital, Inc. (registered investment adviser), Invesco Global Asset Management (N.A.), Inc., Invesco Senior Secured Management, Inc. (registered investment adviser), Van Kampen Investor Services Inc., PowerShares Exchange-Traded Fund Trust, PowerShares Exchange-Traded Fund Trust II, PowerShares India Exchange-Traded Fund Trust and PowerShares Actively Managed Exchange-Traded Fund Trust; and Vice President, Invesco Aim Capital Management, Inc. and Fund Management Company | N/A | N/A |
The Statement of Additional Information of the Trust includes additional information about the Fund’s Trustees and is available upon request, without charge, by calling 1.800.959.4246. Please refer to the Fund’s prospectus for information on the Fund’s sub-advisers.
Office of the Fund 11 Greenway Plaza, Suite 1000 Houston, TX 77046-1173 | Investment Adviser Invesco Advisers, Inc. 1555 Peachtree Street, N.E. Atlanta, GA 30309 | Distributor Invesco Distributors, Inc. 11 Greenway Plaza, Suite 1000 Houston, TX 77046-1173 | Auditors PricewaterhouseCoopers LLP 1201 Louisiana Street, Suite 2900 Houston, TX 77002-5678 | |||
Counsel to the Fund Stradley Ronon Stevens & Young, LLP 2005 Market Street, Suite 2600 Philadelphia, PA 19103-7018 | Counsel to the Independent Trustees Goodwin Procter LLP 901 New York Avenue, N.W. Washington, D.C. 20001 | Transfer Agent Invesco Investment Services, Inc. 11 Greenway Plaza, Suite 1000 Houston, TX 77046-1173 | Custodian State Street Bank and Trust Company 225 Franklin Street Boston, MA 02110-2801 | |||
T-4 Invesco U.S. Mortgage Fund

Invesco mailing information
Send general correspondence to Invesco Investment Services, Inc., P.O. Box 219078, Kansas City, MO 64121-9078.
Invesco privacy policy
You share personal and financial information with us that is necessary for your transactions and your account records. We take very seriously the obligation to keep that information confidential and private.
Invesco collects nonpublic personal information about you from account applications or other forms you complete and from your transactions with us or our affiliates. We do not disclose information about you or our former customers to service providers or other third parties except to the extent necessary to service your account and in other limited circumstances as permitted by law. For example, we use this information to facilitate the delivery of transaction confirmations, financial reports, prospectuses and tax forms.
Even within Invesco, only people involved in the servicing of your accounts and compliance monitoring have access to your information. To ensure the highest level of confidentiality and security, Invesco maintains physical, electronic and procedural safeguards that meet or exceed federal standards. Special measures, such as data encryption and authentication, apply to your communications with us on our website. More detail is available to you at invesco.com/privacy.
Important notice regarding delivery of security holder documents
To reduce Fund expenses, only one copy of most shareholder documents may be mailed to shareholders with multiple accounts at the same address (Householding). Mailing of your shareholder documents may be householded indefinitely unless you instruct us otherwise. If you do not want the mailing of these documents to be combined with those for other members of your household, please contact Invesco Investment Services, Inc. at 800 959 4246 or contact your financial institution. We will begin sending you individual copies for each account within 30 days after receiving your request.
Fund holdings and proxy voting information
The Fund provides a complete list of its holdings four times in each fiscal year, at the quarter ends. For the second and fourth quarters, the lists appear in the Fund’s semiannual and annual reports to shareholders. For the first and third quarters, the Fund files the lists with the Securities and Exchange Commission (SEC) on Form N-Q. The most recent list of portfolio holdings is available at invesco.com/completeqtrholdings. Shareholders can also look up the Fund’s Forms N-Q on the SEC website at sec.gov. Copies of the Fund’s Forms N-Q may be reviewed and copied at the SEC Public Reference Room in Washington, D.C. You can obtain information on the operation of the Public Reference Room, including information about duplicating fee charges, by calling 202 551 8090 or 800 732 0330, or by electronic request at the following email address: publicinfo@sec.gov. The SEC file numbers for the Fund are shown below.
A description of the policies and procedures that the Fund uses to determine how to vote proxies relating to portfolio securities is available without charge, upon request, from our Client Services department at 800 959 4246 or at invesco.com/proxyguidelines. The information is also available on the SEC website, sec.gov.
Information regarding how the Fund voted proxies related to its portfolio securities during the most recent 12-month period ended June 30 is available at invesco.com/proxysearch. The information is also available on the SEC website, sec.gov. Invesco Advisers, Inc. is an investment adviser; it provides investment advisory services to individual and institutional clients and does not sell securities. Invesco Distributors, Inc. is the US distributor for Invesco Ltd.’s retail mutual funds, exchange-traded funds and institutional money market funds. Both are wholly owned, indirect subsidiaries of Invesco Ltd. |  | |
| SEC file numbers: 811-02699 and 002-57526 VK-USM-AR-1 Invesco Distributors, Inc. | ||
| ITEM 2. | CODE OF ETHICS. |
As of the end of the period covered by this report, the Registrant had adopted a code of ethics (the “Code”) that applies to the Registrant’s principal executive officer (“PEO”) and principal financial officer (“PFO”). There were no amendments to the Code during the period covered by the report. The Registrant did not grant any waivers, including implicit waivers, from any provisions of the Code to the PEO or PFO during the period covered by this report.
| ITEM 3. | AUDIT COMMITTEE FINANCIAL EXPERT. |
The Board of Trustees has determined that the Registrant has at least one audit committee financial expert serving on its Audit Committee. The Audit Committee financial expert is Raymond Stickel, Jr. Mr. Stickel is “independent” within the meaning of that term as used in Form N-CSR.
| ITEM 4. | PRINCIPAL ACCOUNTANT FEES AND SERVICES. |
(a) to (d)
Fees Billed by PWC Related to the Registrant
PWC billed the Registrant aggregate fees for services rendered to the Registrant for the last two fiscal years as follows:
Fees Billed for Services Rendered to the Registrant for fiscal year end 2013 | (e)(2) Percentage of Fees Billed Applicable to Non-Audit Services Provided for fiscal year end 2013 Pursuant to Waiver of Pre-Approval | Fees Billed for Services Rendered to the Registrant for fiscal year end 2012 | (e)(2) Percentage of Fees Billed Applicable to Non-Audit Services Provided for fiscal year end 2012 Pursuant to Waiver of Pre-Approval Requirement(1) | ||||||||||||||||||
Audit Fees | $ | 298,000 | N/A | $ | 437,252 | N/A | |||||||||||||||
Audit-Related Fees(2) | $ | 32,308 | 0% | $ | 0 | 0% | |||||||||||||||
Tax Fees(3) | $ | 160,120 | 0% | $ | 107,100 | 0% | |||||||||||||||
All Other Fees | $ | 0 | 0% | $ | 0 | 0% | |||||||||||||||
|
|
|
| ||||||||||||||||||
Total Fees | $ | 490,428 | 0% | $ | 544,352 | 0% | |||||||||||||||
(g) PWC billed the Registrant aggregate non-audit fees of $192,428 for the fiscal year ended 2013, and $107,100 for the fiscal year ended 2012, for non-audit services rendered to the Registrant.
| (1) | With respect to the provision of non-audit services, the pre-approval requirement is waived pursuant to a de minimis exception if (i) such services were not recognized as non-audit services by the Registrant at the time of engagement, (ii) the aggregate amount of all such services provided is no more than 5% of the aggregate audit and non-audit fees paid by the Registrant to PWC during a fiscal year; and (iii) such services are promptly brought to the attention of the Registrant’s Audit Committee and approved by the Registrant’s Audit Committee prior to the completion of the audit. |
| (2) | Audit-Related fees for the fiscal year end December 31, 2013 includes fees billed for agreed upon procedures related to fund mergers and regulatory filings. |
| (3) | Tax fees for the fiscal year end December 31, 2013 includes fees billed for reviewing tax returns and consultation services. Tax fees for fiscal year end December 31, 2012 includes fees billed for reviewing tax returns. |
Fees Billed by PWC Related to Invesco and Invesco Affiliates
PWC billed Invesco Advisers, Inc. (“Invesco”), the Registrant’s adviser, and any entity controlling, controlled by or under common control with Invesco that provides ongoing services to the Registrant (“Invesco Affiliates”) aggregate fees for pre-approved non-audit services rendered to Invesco and Invesco Affiliates for the last two fiscal years as follows:
Fees Billed for Non- Audit Services Rendered to Invesco and Invesco Affiliates for fiscal year end 2013 That Were Required to be Pre-Approved by the Registrant’s Audit Committee | (e)(2) Percentage of Fees Billed Applicable to Non-Audit Services Provided for fiscal year end 2013 Pursuant to Waiver of Pre -Approval Requirement(1) | Fees Billed for Non- Audit Services Rendered to Invesco and Invesco Affiliates for fiscal year end 2012 That Were Required to be Pre-Approved by the Registrant’s Audit Committee | (e)(2) Percentage of Fees Billed Applicable to Non-Audit Services Provided for fiscal year end 2012 Pursuant to Waiver of Pre- Approval | |||||||||||||||||
Audit-Related Fees | $ | 574,000 | 0 | % | $ | 0 | 0 | % | ||||||||||||
Tax Fees | $ | 0 | 0 | % | $ | 0 | 0 | % | ||||||||||||
All Other Fees | $ | 0 | 0 | % | $ | 0 | 0 | % | ||||||||||||
|
|
|
| |||||||||||||||||
Total Fees(2) | $ | 574,000 | 0 | % | $ | 0 | 0 | % | ||||||||||||
| (1) | With respect to the provision of non-audit services, the pre-approval requirement is waived pursuant to a de minimis exception if (i) such services were not recognized as non-audit services by the Registrant at the time of engagement, (ii) the aggregate amount of all such services provided is no more than 5% of the aggregate audit and non-audit fees paid by the Registrant, Invesco and Invesco Affiliates to PWC during a fiscal year; and (iii) such services are promptly brought to the attention of the Registrant’s Audit Committee and approved by the Registrant’s Audit Committee prior to the completion of the audit. |
| (2) | Audit-Related fees for the year end 2013 include fees billed related to reviewing controls at a service organization. |
(g) Including the fees for services not required to be pre-approved by the registrant’s audit committee, PWC billed Invesco and Invesco Affiliates aggregate non-audit fees of $1,645,309 for the fiscal year ended 2013, and $0 for the fiscal year ended 2012, for non-audit services rendered to Invesco and Invesco Affiliates.
(h) The Audit Committee also has considered whether the provision of non-audit services that were rendered to Invesco and Invesco Affiliates that were not required to be pre-approved pursuant to SEC regulations, if any, is compatible with maintaining PWC’s independence.
(f) Not applicable.
(e)(1)
PRE-APPROVAL OF AUDIT AND NON-AUDIT SERVICES
POLICIES AND PROCEDURES
As adopted by the Audit Committees of
the Invesco Funds (the “Funds”)
Last Amended May 4, 2010
Statement of Principles
Under the Sarbanes-Oxley Act of 2002 and rules adopted by the Securities and Exchange Commission (“SEC”) (“Rules”), the Audit Committees of the Funds’ (the “Audit Committees”) Board of Trustees (the “Board”) are responsible for the appointment, compensation and oversight of the work of independent accountants (an “Auditor”). As part of this responsibility and to assure that the Auditor’s independence is not impaired, the Audit Committees pre-approve the audit and non-audit services provided to the Funds by each Auditor, as well as all non-audit services provided by the Auditor to the Funds’ investment adviser and to affiliates of the adviser that provide ongoing services to the Funds (“Service Affiliates”) if the services directly impact the Funds’ operations or financial reporting. The SEC Rules also specify the types of services that an Auditor may not provide to its audit client. The following policies and procedures comply with the requirements for pre-approval and provide a mechanism by which management of the Funds may request and secure pre-approval of audit and non-audit services in an orderly manner with minimal disruption to normal business operations.
Proposed services either may be pre-approved without consideration of specific case-by-case services by the Audit Committees (“general pre-approval”) or require the specific pre-approval of the Audit Committees (“specific pre-approval”). As set forth in these policies and procedures, unless a type of service has received general pre-approval, it will require specific pre-approval by the Audit Committees. Additionally, any fees exceeding 110% of estimated pre-approved fee levels provided at the time the service was pre-approved will also require specific approval by the Audit Committees before payment is made. The Audit Committees will also consider the impact of additional fees on the Auditor’s independence when determining whether to approve any additional fees for previously pre-approved services.
The Audit Committees will annually review and generally pre-approve the services that may be provided by each Auditor without obtaining specific pre-approval from the Audit Committee generally on an annual basis. The term of any general pre-approval runs from the date of such pre-approval through September 30th of the following year, unless the Audit Committees consider a different period and state otherwise. The Audit Committees will add to or subtract from the list of general pre-approved services from time to time, based on subsequent determinations.
The purpose of these policies and procedures is to set forth the guidelines to assist the Audit Committees in fulfilling their responsibilities.
Delegation
The Audit Committees may from time to time delegate pre-approval authority to one or more of its members who are Independent Trustees. All decisions to pre-approve a service by a delegated member shall be reported to the Audit Committees at the next quarterly meeting.
Audit Services
The annual audit services engagement terms will be subject to specific pre-approval of the Audit Committees. Audit services include the annual financial statement audit and other procedures such as tax provision work that is required to be performed by the independent auditor to be able to form an opinion on the Funds’ financial statements. The Audit Committees will obtain, review and consider sufficient information concerning the proposed Auditor to make a reasonable evaluation of the Auditor’s qualifications and independence.
In addition to the annual Audit services engagement, the Audit Committees may grant either general or specific pre-approval of other audit services, which are those services that only the independent auditor reasonably can provide. Other Audit services may include services such as issuing consents for the inclusion of audited financial statements with SEC registration statements, periodic reports and other documents filed with the SEC or other documents issued in connection with securities offerings.
Non-Audit Services
The Audit Committees may provide either general or specific pre-approval of any non-audit services to the Funds and its Service Affiliates if the Audit Committees believe that the provision of the service will not impair the independence of the Auditor, is consistent with the SEC’s Rules on auditor independence, and otherwise conforms to the Audit Committees’ general principles and policies as set forth herein.
Audit-Related Services
“Audit-related services” are assurance and related services that are reasonably related to the performance of the audit or review of the Fund’s financial statements or that are traditionally performed by the independent auditor. Audit-related services include, among others, accounting consultations related to accounting, financial reporting or disclosure matters not classified as “Audit services”; assistance with understanding and implementing new accounting and financial reporting guidance from rulemaking authorities; and agreed-upon procedures related to mergers, compliance with ratings agency requirements and interfund lending activities.
Tax Services
“Tax services” include, but are not limited to, the review and signing of the Funds’ federal tax returns, the review of required distributions by the Funds and consultations regarding tax matters such as the tax treatment of new investments or the impact of new regulations. The Audit Committees will scrutinize carefully the retention of the Auditor in connection with a transaction initially recommended by the Auditor, the major business purpose of which may be tax avoidance or the tax treatment of which may not be supported in the Internal Revenue Code and related regulations. The Audit Committees will consult with the Funds’ Treasurer (or his or her designee) and may consult with outside counsel or advisors as necessary to ensure the consistency of Tax services rendered by the Auditor with the foregoing policy.
No Auditor shall represent any Fund or any Service Affiliate before a tax court, district court or federal court of claims.
Under rules adopted by the Public Company Accounting Oversight Board and approved by the SEC, in connection with seeking Audit Committees’ pre-approval of permissible Tax services, the Auditor shall:
| 1. | Describe in writing to the Audit Committees, which writing may be in the form of the proposed engagement letter: |
| a. | The scope of the service, the fee structure for the engagement, and any side letter or amendment to the engagement letter, or any other agreement between the Auditor and the Fund, relating to the service; and |
| b. | Any compensation arrangement or other agreement, such as a referral agreement, a referral fee or fee-sharing arrangement, between the Auditor and any person (other than the Fund) with respect to the promoting, marketing, or recommending of a transaction covered by the service; |
| 2. | Discuss with the Audit Committees the potential effects of the services on the independence of the Auditor; and |
| 3. | Document the substance of its discussion with the Audit Committees. |
All Other Auditor Services
The Audit Committees may pre-approve non-audit services classified as “All other services” that are not categorically prohibited by the SEC, as listed in Exhibit 1 to this policy.
Pre-Approval Fee Levels or Established Amounts
Pre-approval of estimated fees or established amounts for services to be provided by the Auditor under general or specific pre-approval policies will be set periodically by the Audit Committees. Any proposed fees exceeding 110% of the maximum estimated pre-approved fees or established amounts for pre-approved audit and non-audit services will be reported to the Audit Committees at the quarterly Audit Committees meeting and will require specific approval by the Audit Committees before payment is made. The Audit Committees will always factor in the overall relationship of fees for audit and non-audit services in determining whether to pre-approve any such services and in determining whether to approve any additional fees exceeding 110% of the maximum pre-approved fees or established amounts for previously pre-approved services.
Procedures
Generally on an annual basis, Invesco Advisers, Inc. (“Invesco”) will submit to the Audit Committees for general pre-approval, a list of non-audit services that the Funds or Service Affiliates of the Funds may request from the Auditor. The list will describe the non-audit services in reasonable detail and will include an estimated range of fees and such other information as the Audit Committee may request.
Each request for services to be provided by the Auditor under the general pre-approval of the Audit Committees will be submitted to the Funds’ Treasurer (or his or her designee) and must include a detailed description of the services to be rendered. The Treasurer or his or her designee will ensure that such services are included within the list of services that have received the general pre-approval of the Audit Committees. The Audit Committees will be informed at the next quarterly scheduled Audit Committees meeting of any such services for which the Auditor rendered an invoice and whether such services and fees had been pre-approved and if so, by what means.
Each request to provide services that require specific approval by the Audit Committees shall be submitted to the Audit Committees jointly by the Fund’s Treasurer or his or her designee and the Auditor, and must include a joint statement that, in their view, such request is consistent with the policies and procedures and the SEC Rules.
Each request to provide tax services under either the general or specific pre-approval of the Audit Committees will describe in writing: (i) the scope of the service, the fee structure for the engagement, and any side letter or amendment to the engagement letter, or any other agreement between the Auditor and the audit client, relating to the service; and (ii) any compensation arrangement or other agreement between the Auditor and any person (other than the audit client) with respect to the promoting, marketing, or recommending of a transaction covered by the service. The Auditor will discuss with the Audit Committees the potential effects of the services on the Auditor’s independence and will document the substance of the discussion.
Non-audit services pursuant to the de minimis exception provided by the SEC Rules will be promptly brought to the attention of the Audit Committees for approval, including documentation that each of the conditions for this exception, as set forth in the SEC Rules, has been satisfied.
On at least an annual basis, the Auditor will prepare a summary of all the services provided to any entity in the investment company complex as defined in section 2-01(f)(14) of Regulation S-X in sufficient detail as to the nature of the engagement and the fees associated with those services.
The Audit Committees have designated the Funds’ Treasurer to monitor the performance of all services provided by the Auditor and to ensure such services are in compliance with these policies and procedures. The Funds’ Treasurer will report to the Audit Committees on a periodic basis as to the results of such monitoring. Both the Funds’ Treasurer and management of Invesco will immediately report to the chairman of the Audit Committees any breach of these policies and procedures that comes to the attention of the Funds’ Treasurer or senior management of Invesco.
Exhibit 1 to Pre-Approval of Audit and Non-Audit Services Policies and Procedures
Conditionally Prohibited Non-Audit Services (not prohibited if the Fund can reasonably conclude that the results of the service would not be subject to audit procedures in connection with the audit of the Fund’s financial statements)
| — | Bookkeeping or other services related to the accounting records or financial statements of the audit client |
| — | Financial information systems design and implementation |
| — | Appraisal or valuation services, fairness opinions, or contribution-in-kind reports |
| — | Actuarial services |
| — | Internal audit outsourcing services |
Categorically Prohibited Non-Audit Services
| — | Management functions |
| — | Human resources |
| — | Broker-dealer, investment adviser, or investment banking services |
| — | Legal services |
| — | Expert services unrelated to the audit |
| — | Any service or product provided for a contingent fee or a commission |
| — | Services related to marketing, planning, or opining in favor of the tax treatment of confidential transactions or aggressive tax position transactions, a significant purpose of which is tax avoidance |
| — | Tax services for persons in financial reporting oversight roles at the Fund |
| — | Any other service that the Public Company Oversight Board determines by regulation is impermissible. |
| ITEM 5. | AUDIT COMMITTEE OF LISTED REGISTRANTS. |
Not applicable.
| ITEM 6. | SCHEDULE OF INVESTMENTS. |
Investments in securities of unaffiliated issuers is included as part of the reports to stockholders filed under Item 1 of this Form.
| ITEM 7. | DISCLOSURE OF PROXY VOTING POLICIES AND PROCEDURES FOR CLOSED-END MANAGEMENT |
| INVESTMENT COMPANIES. |
Not applicable.
| ITEM 8. | PORTFOLIO MANAGERS OF CLOSED-END MANAGEMENT COMPANIES. |
Not applicable.
| ITEM 9. | PURCHASES OF EQUITY SECURITIES BY CLOSED-END MANAGEMENT INVESTMENT COMPANY AND |
| AFFILIATED PURCHASERS. |
Not applicable.
| ITEM 10. | SUBMISSION OF MATTERS TO A VOTE OF SECURITY HOLDERS. |
None
| ITEM 11. | CONTROLS AND PROCEDURES. |
| (a) | As of February 12, 2014, an evaluation was performed under the supervision and with the participation of the officers of the Registrant, including the PEO and PFO, to assess the |
effectiveness of the Registrant’s disclosure controls and procedures, as that term is defined in Rule 30a-3(c) under the Investment Company Act of 1940 (the “Act”), as amended. Based on that evaluation, the Registrant’s officers, including the PEO and PFO, concluded that, as of February 12, 2014, the Registrant’s disclosure controls and procedures were reasonably designed to ensure: (1) that information required to be disclosed by the Registrant on Form N-CSR is recorded, processed, summarized and reported within the time periods specified by the rules and forms of the Securities and Exchange Commission; and (2) that material information relating to the Registrant is made known to the PEO and PFO as appropriate to allow timely decisions regarding required disclosure. |
| (b) | There have been no changes in the Registrant’s internal control over financial reporting (as defined in Rule 30a-3(d) under the Act) that occurred during the second fiscal quarter of the period covered by this report that have materially affected, or are reasonably likely to materially affect, the Registrant’s internal control over financial reporting. |
| ITEM 12. | EXHIBITS. |
| 12(a) (1) | Code of Ethics. |
| 12(a) (2) | Certifications of principal executive officer and principal financial officer as required by Rule 30a-2(a) under the Investment Company Act of 1940. |
| 12(a) (3) | Not applicable. |
| 12(b) | Certifications of principal executive officer and principal financial officer as required by Rule 30a-2(b) under the Investment Company Act of 1940. |
SIGNATURES
Pursuant to the requirements of the Securities Exchange Act of 1934 and the Investment Company Act of 1940, the Registrant has duly caused this report to be signed on its behalf by the undersigned, thereunto duly authorized.
Registrant: AIM Growth Series (Invesco Growth Series)
| By: | /s/ Philip A. Taylor | |
| Philip A. Taylor | ||
| Principal Executive Officer | ||
| Date: | March 10, 2014 | |
Pursuant to the requirements of the Securities and Exchange Act of 1934 and the Investment Company Act of 1940, this report has been signed below by the following persons on behalf of the Registrant and in the capacities and on the dates indicated.
| By: | /s/ Philip A. Taylor | |
| Philip A. Taylor | ||
| Principal Executive Officer | ||
| Date: | March 10, 2014 | |
| By: | /s/ Sheri Morris | |
| Sheri Morris | ||
| Principal Financial Officer | ||
| Date: | March 10, 2014 | |
EXHIBIT INDEX
| 12(a) (1) | Code of Ethics. | |
| 12(a) (2) | Certifications of principal executive officer and principal financial officer as required by Rule 30a-2(a) under the Investment Company Act of 1940. | |
| 12(a) (3) | Not applicable. | |
| 12(b) | Certifications of principal executive officer and principal financial officer as required by Rule 30a-2(b) under the Investment Company Act of 1940. | |